apdo. postal 6-641, 06600 mexico, d.f., … · apdo. postal 6-641, 06600 mexico, d.f., mexico . 33...
TRANSCRIPT

ISSN: 1405-7735
Apdo. Postal 6-641, 06600 Mexico, D.F., Mexicowww.cimmyt.org

33
Impact of No-Till
Technologies in Ghana
Javier Ekboir1, Kofi Boa2 and A.A. Dankyi2
1 Javier Ekboir is an Economist with the Economics Program of the International Maize and WheatImprovement Center (CIMMYT), Apartado 6-641, 06600 Mexico, Mexico, D.F, Mexico.
2 Kofi Boa is an Agronomist and A.A. Dankyi is an Economist at the Crops Research Institute, Kumasi, Ghana.
E C O N O M I C S P R O G R A M P A P E R 0 2 - 0 1

CIMMYT® (www.cimmyt.org) is an internationally funded, nonprofit, scientific research and training organization.Headquartered in Mexico, CIMMYT works with agricultural research institutions worldwide to improve theproductivity, profitability, and sustainability of maize and wheat systems for poor farmers in developing countries. Itis one of 16 food and environmental organizations known as the Future Harvest Centers. Located around the world,the Future Harvest Centers conduct research in partnership with farmers, scientists, and policymakers to helpalleviate poverty and increase food security while protecting natural resources. The centers are supported by theConsultative Group on International Agricultural Research (CGIAR) (www.cgiar.org), whose members include nearly60 countries, private foundations, and regional and international organizations. Financial support for CIMMYT’sresearch agenda also comes from many other sources, including foundations, development banks, and public andprivate agencies.
Future Harvest® builds awareness and support for food and environmental research for a world withless poverty, a healthier human family, well-nourished children, and a better environment. It supports
research, promotes partnerships, and sponsors projects that bring the results of research to rural communities,farmers, and families in Africa, Asia, and Latin America (www.futureharvest.org).
International Maize and Wheat Improvement Center (CIMMYT) 2002. All rights reserved. The opinions expressedin this publication are the sole responsibility of the authors. The designations employed in the presentation ofmaterials in this publication do not imply the expression of any opinion whatsoever on the part of CIMMYT or itscontributory organizations concerning the legal status of any country, territory, city, or area, or of its authorities, orconcerning the delimitation of its frontiers or boundaries. CIMMYT encourages fair use of this material. Propercitation is requested.
Correct citation: Ekboir, J., K. Boa, and A.A. Dankyi. 2002. Impacts of No-Till Technologies in Ghana. MexicoD.F.:CIMMYT
Abstract: In the 1990s, no-till with mulch, a sustainable agricultural alternative, was introduced to Ghanaian farmersthrough a joint program between the Crops Research Institute in Kusami, Ghana, Sasakawa Global 2000, and theMonsanto Company. The package was disseminated to farmers in the Forest, Transition, and Guinea SavannahZones, and rapidly adopted. In 2000, it was estimated that 100,000 small-scale farmers practiced no-till on 45,000hectares of land. This study examines the impact of no-till on farmers who adopted the technology in the three zones,and to a lesser extent, the reasons for non-adoption. The impact of no-till among agrochemical dealers was alsoevaluated. The report found that no-till brought important changes to farmers using the technology and expandedthe market for agrochemicals. It calls for more research on machinery for the technology, crop rotations, and thedynamics of diseases and weed and pest populations. More research on the organization and performance ofagrochemical markets is also needed to identify bottlenecks that hamper the dissemination of no-till.
ISSN: 1405-7735AGROVOC Descriptors: Crop management; Technological changes; Innovation adoption; Food production; Weed
control; Disease control; Pest control; Soil fertility; Small farms; Farming systems;Cropping systems; Ghana
Additional Keywords: CIMMYTAGRIS category codes: F01 Crop Husbandry
E16 Production EconomicsDewey decimal classification: 631.51
Printed in Mexico.

Contents
Contents ........................................................................................................................................................ iiiTables ............................................................................................................................................................. ivFigures ............................................................................................................................................................ vAcronyms ....................................................................................................................................................... vAcknowledgements ..................................................................................................................................... viExecutive Summary ................................................................................................................................... vii
Introduction .................................................................................................................................................. 1Agriculture in Ghana .................................................................................................................................. 2The Study Area ............................................................................................................................................ 3
Forest Zone ......................................................................................................................................... 3Transition Zone .................................................................................................................................. 3Guinea Savannah Zone ..................................................................................................................... 3Common agricultural practices in study zones ............................................................................. 3
No-Till in Ghana .......................................................................................................................................... 4Early developments ........................................................................................................................... 4Dissemination of no-till ..................................................................................................................... 5The no-till package in Ghana ........................................................................................................... 7
Methodology and Data Collection ........................................................................................................... 8Characteristics of Sample Farmers ........................................................................................................... 9
Differences among sample farmers by ecological zones .............................................................. 9Gender issues ..................................................................................................................................... 11Attitude towards innovation ........................................................................................................... 11Income sources ................................................................................................................................. 12Input use, input sources, and extension services ........................................................................ 12Management of most important maize field ............................................................................... 14
No-Till Among Survey Farmers .............................................................................................................. 15Knowledge/perception ................................................................................................................... 15Diffusion of no-till in study area .................................................................................................... 15Learning about no-till ...................................................................................................................... 16Farmers who used no-till ................................................................................................................ 17Farmers who used and abandoned no-till ................................................................................... 20Farmers who never used no-till ..................................................................................................... 20
Agrochemical Markets .............................................................................................................................. 21Characteristics of Formal Dealers .......................................................................................................... 22
Business characteristics ................................................................................................................... 22Business facilities ............................................................................................................................. 22Training ............................................................................................................................................. 22
Dealers’ Perception of No-Till Use Among Farmers .......................................................................... 23Impacts of No-Till on Farmers ................................................................................................................ 23
Labor savings .................................................................................................................................... 24Impact on agricultural practices .................................................................................................... 24Impact on families ............................................................................................................................ 25
No-Till Impact on Agrochemical Market .............................................................................................. 26Growth and sale of agricultural inputs ......................................................................................... 26Sale of herbicide types ..................................................................................................................... 27
Conclusion .................................................................................................................................................. 28References ................................................................................................................................................... 29

Tables
Table 1. Area under maize, cassava, sorghum, and rice cultivation, 1992-2000, Ghana (‘000 ha) ................................................................................................... 2Table 2. Number of farmers trained, Forest, Transition, and Guinea Savannah Zones, Ghana ............................................................................................................. 6Table 3. Number of no-till demonstration plots, Forest, Transition, and Guinea Savannah Zones, Ghana .............................................................................................. 6Table 4. Number of field days, Forest, Transition, and Guinea Savannah Zones, Ghana ..................................................................................................................... 6Table 5. Number of fact sheets and production guides distributed, Forest, Transition, and Guinea Savannah Zones, Ghana ..................................................................... 7Table 6. Cost of land preparation and weed control with slash and burn and no-till for a 1 ha plot in production, Forest, Transition,
and Guinea Savannah Zones, Ghana ............................................................................................................................................................................ 7Table 7. Sampling procedures, Forest, Transition, and Guinea Savannah Zones, Ghana (no.) ............................................................................................................ 9Table 8. Characteristics of sample farmers, Forest, Transition, and Guinea Savannah Zones, Ghana .................................................................................................. 10Table 9. Characteristics of farmers, Forest, Transition, and Guinea Savannah Zones, Ghana ............................................................................................................. 10Table 10. Gender differences in selected variables, Forest, Transition, and Guinea Savannah Zones, Ghana ......................................................................................... 11Table 11. Decision-making on largest no-till field among male and female farmers, Forest, Transition, and Guinea Savannah Zones, Ghana (%) ....................................... 11Table 12. Changes in area planted among NT users, those who abandoned NT, and those who never used NT, Forest, Transition, and
Guinea Savannah Zones, Ghana (% farmers) ............................................................................................................................................................... 12Table 13. Income sources, Forest, Transition, and Guinea Savannah Zones, Ghana (% farmers) ........................................................................................................ 12Table 14. Source of inputs among NT users, those who used and abandoned NT, and those who never used NT, Forest, Transition, and
Guinea Savannah Zones, Ghana (% farmers) ............................................................................................................................................................... 13Table 15. Characteristics of most important maize field among NT users, those who abandoned NT, and those who never used NT,
Forest, Transition, and Guinea Savannah Zones, Ghana (%) ........................................................................................................................................... 14Table 16. Perception of no-till among NT users, those who abandoned NT, and those who never used NT, Forest, Transition, and
Guinea Savannah Zones, Ghana (% farmers) ............................................................................................................................................................... 16Table 17. Diffusion of no-till among farmers in the Forest, Transition, and Guinea Savannah Zones, Ghana (no.) ................................................................................. 16Table 18. Results of first no-till experience among NT users and those who abandoned NT, Forest, Transition, and Guinea Savannah Zones, Ghana (%) ............................. 17Table 19. Number of seasons it took NT users to notice benefits of no-till, Forest, Transition, and Guinea Savannah Zones, Ghana (%) ................................................... 18Table 20. Opinion of NT users on problems with no-till, Forest, Transition, and Guinea Savannah Zones, Ghana (%) ............................................................................. 18Table 21. Number of years NT users stay on the same plot, Forest, Transition, and Guinea Savannah Zones, Ghana ............................................................................. 18Table 22. Pre- and post-planting weed control methods of NT users, Forest, Transition, and Guinea Savannah Zones, Ghana (%) ............................................................ 19Table 23. Glyphosate dose used by NT users for pre-planting, Forest, Transition, and Guinea Savannah Zones, Ghana ........................................................................... 19Table 24 Other no-till recommended practices adopted by NT users, Forest, Transition, and Guinea Savannah Zones, Ghana (%) ........................................................... 19Table 25. Pest pressure observed by NT users, Forest, Transition, and Guinea Savannah Zones, Ghana (%) ......................................................................................... 19Table 26. Fertilizer application in no-till fields, Forest, Transition, and Guinea Savannah Zones, Ghana (%) ......................................................................................... 20Table 27. Number of farmers who used no-till before abandoning the practice, Forest, Transition, and Guineas Savannah Zones, Ghana .................................................. 20Table 28. Information sources about no-till among farmers who never used NT, Forest, Transition, and Guinea Savannah Zones, Ghana .................................................. 20Table 29. Reasons for not using no-till among farmers who never used no-till, Forest, Transition, and Guinea Savannah Zones, Ghana (% farmers) ................................... 21Table 30. Characteristics of formal dealers, Forest, Transition, and Guinea Savannah Zones, Ghana .................................................................................................... 22Table 31. Agrochemical dealership size and years in business, Forest, Transition, and Guinea Savannah Zones, Ghana .......................................................................... 22Table 32. Business facilities of agrochemical dealers, Forest, Transition, and Guinea Savannah Zones, Ghana (%) ................................................................................ 22Table 33. Training sources among agrochemical dealers, Forest, Transition, and Guinea Savannah Zones, Ghana (%) ........................................................................... 22Table 34. Sources of business management training among agrochemical dealers, Forest, Transition, and Guinea Savannah Zones, Ghana (%) ........................................ 22Table 35. Agrochemical dealers’ perception of number of farmers using no-till, Forest, Transition, and Guinea Savannah Zones, Ghana .................................................... 23Table 36. Farmers who own, rent or contract spraying according to agrochemical dealers, Forest, Transition, and Guinea Savannah Zones, Ghana .................................... 23Table 37. Expected response of demand for herbicides to price changes, Forest, Transition, and Guinea Savannah Zones, Ghana ............................................................ 23Table 38. Average number of family members who work in no-till fields, Forest, Transition, and Guinea Savannah Zones, Ghana ........................................................... 24Table 39. Average man-days/ha required for selected farming activities before and after adopting no-till, Forest, Transition, and
Guinea Savannah Zones, Ghana ................................................................................................................................................................................. 24Table 40. Most important changes that no-till brought to farming activities, Forest, Transition, and Guinea Savannah Zones, Ghana (%) ................................................. 25Table 41. NT users’ responses about benefits of no-till, Forest, Transition, and Guinea Savannah Zones, Ghana (% farmers) .................................................................. 25Table 42. Impact of no-till on families, Forest, Transition, and Guinea Savannah Zones, Ghana (%) ................................................................................................... 25Table 43. New activities resulting from the use of no-till, Forest, Transition, and Guinea Savannah Zones, Ghana (% farmers) ............................................................... 25Table 44. Change in herbicide sales compared with three years ago, Forest, Transition, and Guinea Savannah Zones, Ghana ................................................................. 26Table 45. Changes in the range of inputs sold, Forest, Transition, and Guinea Savannah Zones, Ghana ............................................................................................... 27Table 46. Product lines sold by formal dealers, Forest, Transition, and Guinea Savannah Zones, Ghana, 2000 ..................................................................................... 27Table 47. Dealers’ suppliers of agricultural inputs, Forest, Transition, and Guinea Savannah Zones, Ghana .......................................................................................... 27Table 48. Herbicides sold by dealers, Forest, Transition, and Guinea Savannah Zones, Ghana ............................................................................................................ 27
iv

Figures
Figure 1. Regional and district boundaries, Ghana ............................................................................................................................................................................. 2Figure 2. Agroecological zones, Ghana ............................................................................................................................................................................................ 3Figure 3. Years in input market, Forest, Transition, and Guinea Savannah Zones, Ghana. ...................................................................................................................... 26Figure 4. Years in the herbicide market, Forest, Transition, and Guinea Savannah Zones, Ghana. ........................................................................................................... 26
Acronyms
CIDA Canadian International Development AgencyCIMMYT The International Maize and Wheat Improvement CenterCRI Crops Research InstituteGGDP Ghana Grain Development ProjectGTZ Deutsche Gesellschaft für Technische ZusammenarbeitIITA International Institute for Tropical AgricultureMOFA Ministry of Food and AgricultureSG 2000 Sasakawa Global 2000
v

Acknowledgements
vi
This report would not have been written without the help andsupport of several individuals and organizations.
Christopher Dowswell from Sasakawa Africa Association, whoreviewed several versions of this report, was instrumental inorganizing the project and provided invaluable supportthrough the Sasakawa Global 2000 office in Ghana. Jim Findlayfrom Agricultural Resource Consultants, Parklands, SouthAfrica, also played a pivotal role in project organization andprovided useful comments to the manuscript.
Numerous staff from the Crop Research Institute in Ghanaassisted in the design, conduct of the survey, data entry andfollow up. Benedicta Appiah-Asante of Sasakawa Global 2000provided administrative support.
Many thanks go to Patrick Wall, Wayne Haag, and SteveCollins who reviewed this report. The maps were prepared byCIMMYT’s graphic designers and the top cover photo wasprovided by Kofi Boa. We are grateful to Satwant Kaur forediting this report and to Eliot Sánchez Pineda for the design,production and printing of this report.
Finally, we would like to acknowledge the financial supportprovided by Sasakawa Global 2000 and the MonsantoCompany.

Executive Summary
In the 1990s, no-till with mulch, a sustainableagricultural alternative, was introduced to Ghanaianfarmers through a joint program between the CropsResearch Institute in Kumasi, Ghana, Sasakawa Global2000, and the Monsanto Company. The package wasdisseminated to farmers in the Forest, Transition, andGuinea Savannah Zones and rapidly adopted. It isestimated that in 2000, no till was used by 100,000 small-scale farmers in 45,000 hectares of land. This studyexamines the impact of this technology on farmers whoadopted the technology, and to a lesser extent, thereasons for non-adoption. The impact of no-till onagrochemical dealers was also evaluated. In theremainder of this summary, no till refers to no-till withmulch.
In contrast to other countries, the no-till package inGhana responded to the needs of small-scale farmers.Adoption was facilitated by low-input agriculturalpractices prevalent in the study areas – the Forest,Transition and Guinea Savannah Zones - and the factthat few farmers have animals (other than somechickens). There was no need to develop no-till planters,which were major obstacles in other countries where no-till was introduced, because planting is traditionallydone with a stick or cutlass (machete). This, however,was a limitation to widespread adoption among large-scale and mechanized farmers who need adequatemachinery to adopt the technology.
Two surveys were carried out, a farmer survey and anagrochemical dealer survey. Three types of farmers wereincluded in the farmer sample: farmers who arecurrently using no-till (NT users), farmers who used andlater abandoned the technology (abandoned NT), andfarmers who have never used the package (never usedNT). A total of 146 farmers were interviewed: 97 farmerswho used the technology, 18 farmers who used andabandoned the technology, and 37 farmers who neverused no-till. The last two categories were included toobtain information on reasons for non-adoption. Thenumber of farmers who abandoned no-till was smallbecause no other farmers in this category could beidentified in surveyed villages. A total of 28agrochemical dealers in both survey villages and districtcapitals were interviewed.
In general, it was found that there were no differencesbetween male and female farmers in wealth indicators(availability of water and electricity, ownership of abicycle, car, tractor or different types of livestock), accessto technical advice, and agricultural practices. However,on average, women farm about half the area as men andobtained lower maize yields. Only 21% reported tryingnew things in their fields against 43% of men. Thesedifferences can be explained by differences in
nonagricultural employment. Women generally havenonagricultural occupations (work at home or tradeactivities); they tend to be part-time farmers and go tothe field later in the day. This affects the efficiency ofsome agricultural practices (like spraying) that should bedone early in the morning.
Farmers who used no-till applied the packagerecommended by research/extension agents. Most usersof no-till (78%) did not change crops they planted afterno-till adoption. This may reflect lack of marketopportunities, inadequate technologies for currentproduction patterns or inadequate information channelsthat permit farmers to learn about new crops. Adequateresearch and extension programs can solve some of theseproblems and increase the impact of no-till.
While there were active markets for agricultural servicesin the study areas, the performance of these markets canbe enhanced by training contractors. Forty-eight percentof farmers contract planting and rent a knapsack, while18% contract spraying. Economic considerations seem tobe a restriction for 25% of no-till users and 51% offarmers who never used the technology. Difficulties infinding adequately trained contractors for planting orspraying were mentioned by 24% of no-till users, 56% offarmers who abandoned no-till, and 30% of farmers whonever used the technology. Understanding the packagewas a problem for 23% of farmers who abandoned no-tilland 30% of farmers who never used it.
Impacts of No-TillFarmers in all three categories reported that the use ofno-till is prevalent in their villages and that the numberof users is increasing, although the perception is loweramong those who abandoned no-till. Farmers in allgroups said no-till users were of average wealth— inother words, no-till is not perceived as a technology forrich farmers. Also, farmers in all groups felt that incomeand food availability in households that use no-till wasincreasing.
In normal years, no-till farmers obtained maize yieldsthat were 16% higher than farmers who abandoned no-till and 45% higher than farmers who never used thistechnology. But in a dry year such as 2000, the yieldadvantages of no-till were 38% and 48%, respectively.No-till improved moisture conservation and reduced therisk of crop failure in dry years, a particularly importantfeature in much of sub-Saharan Africa.
Male family labor was reduced by 31% after adoption;reductions in female and child family labor were notstatistically significant. The overall family labor savingwas 27%. The reason for the difference in male and otherlabor savings is that no-till simplified tasks that are
vii

usually reserved for men: land preparation (includingslashing and burning), planting, and chemical weedcontrol.
No-till reduced labor requirements for land preparationand planting by 22%. Labor for weed control fell by51%, from an average of 8.8 man-days/ha to 4.3 man-days/ha. There was, however, a slight increase in laborfor harvest from 7.6 man-days/ha to 8.6 man-days/ha.This was largely a consequence of higher yieldsobtained. Ninety-nine percent of no-till users reportedthat no-till was less physically demanding than thetraditional technology and that labor requirements incritical moments were reduced, thus simplifying labormanagement.
When farmers were asked to identify the three mostimportant changes that no-till brought to farmingactivities, a majority mentioned reduced investments incash and labor and higher yields. Other importantimpacts were easier weed control and saved time forfarmers. Less frequently mentioned changes wereexpansion of area farmed and improved soil fertility.
Three risk factors were also reduced with no-till: the soilcover increased water availability in dry years, thereduced turnaround time permitted planting of thesecond crop closer to the optimal date, and the presenceof a larger number of beneficial insects facilitated pestcontrol. When asked if they still get something in badyears, 84% of users responded affirmatively. Reductionof the downside risk is especially important for small-scale farmers who have little savings to weather a badharvest.
Among the most important changes that no-till broughtto their families, adopters mentioned increased foodavailability, more time for other activities, and reducedlabor and effort. Nineteen percent of farmers mentionedthe ability to promptly pay school fees, thus securingtheir children’s education. Eighty-three percent startedother income-generating farming or trading activities.
The dealers’ survey showed that the market foragricultural inputs, especially herbicides, has expanded.There are currently two complementary marketingchannels: formal dealers, located mostly in districtcapitals, and research/extension agents1 who havecloser contact with farmers in villages. As most farmersuse small volumes of agrochemicals, it is notworthwhile for them to travel to cities to purchase them.Research/extension agents reduce the cost to farmers bybringing these inputs to villages.
The interaction between formal dealers and research/extension agents was only discovered in the analysis offarmer surveys and was not analyzed further. Formal
dealers were also surveyed to assess the impact of no-tillon their businesses. Almost half (43%) opened theirbusinesses after 1996. Between 1998 and 2001, herbicidesales doubled for 57% of dealers, tripled for 7% andincreased by only 50% for 14% of them. Finally, duringthe same period, 82% of dealers expanded the range ofproducts they offered.
Markets for inputs are not well integrated. Only 29% ofdealers know herbicide prices in Accra, and 57% knowherbicide prices in other villages. This share issubstantially smaller than that of no-till farmers whoknow prices in neighboring villages. Sixty-four percentof dealers said herbicides are easily available whenneeded. Only 11% receive credit from commercial banksand 21% from suppliers. On the other hand, 57% ofdealers give credit to selected farmers.
The report concludes with some recommendations toensure that no-till remains sustainable in Ghana. Theseinclude the introduction of machinery for both small-and large-scale mechanized farmers, such as the knife-roller for slashing, planters for manual, draft, andmechanized planting, and multi-line sprayers. Croprotations (including cover crops) can help improve soilcover at flowering, increase fertility, ease weed control,and reduce potential buildup of aggressive weeds andpests. Research on diseases and weed and pestpopulations will also help to identify potential threatsand develop remedies before they become a limitingconstraint.
The development of a no-till package for crops thatpresently can only be planted with conventional tillwould also broaden the universe of potential adopters.Many of these needs have already been solved in othercountries; Brazil and Paraguay in particular have manytechnologies for small-scale farmers that could betransferred into Ghana with minor adaptations.Establishing strong links with researchers andinstitutions in other countries is an efficient and cheapway to fill knowledge gaps.
While the survey showed that research and extensionservices worked efficiently, there were indications thatthe extension effort may be weakening and someactivities have been scaled down. New institutionalarrangements should be sought to compensate for thesechanges.
Finally, research on the organization and performance ofresearch/extension agents and formal dealers and theinteraction between them may help identify bottlenecksthat hamper the dissemination of no-till. Programs tohelp dealers improve business management and betterinfrastructure can also reduce transaction costs and helpexpand no-till practice.
1 A formal dealer is someone who has an established shop and whose primary activity is selling agricultural inputs. Research/extension agents, on the other hand, provide mostly research and extension services and trade in herbicides on the side.
viii

1
Introduction
No-till has been practiced in Ghana for centuries.The practice is very much associated with shiftingcultivation, in which vegetation is slashed andburned (known as bare no-till, essentially no-tillwithout mulch or other soil cover) and crops areplanted with minimal disturbance to the soil. Plotsare farmed for 2-3 years and left to fallow for 5-10years. However, growing population pressure hasled to intensification of agricultural production andshortening of the fallow period. In recent decades,mechanization has also become a common feature inthe Transition and Guinea Savannah Zones. Bothbare no-till and mechanized agriculture are havingnegative economic and environmental consequencesin Ghana, where farming is characterized by soilerosion, low soil fertility, high labor demand(especially for land preparation and weed control),low yields, and low income.
In the 1990’s, the Crops Research Institute (CRI) inKumasi, Ghana, teamed up with Sasakawa Global2000 (SG 2000) and the Monsanto Company todevelop a sustainable agricultural package—no-tillwith mulch—for farmers in the Forest, Transition,and Guinea Savannah Zones. This study examinesthe impact of this technology on small-scale farmerswho adopted the technology in these three zones,and to a lesser degree, the reasons for non-adoptionof the technology. The impact on agrochemicaldealers was also evaluated.
No-till with mulch (henceforth referred to as no-till)is a sustainable technology that improves thephysical and chemical characteristics of the soil andfacilitates weed and pest control. These benefits arisein part from more active biological activity in thefield. However, since the environment is a dynamicsystem that evolves in response to agriculturalpractices, the sustainability of the no-till packagemay be threatened by increased incidence of newweeds, pests or diseases. A sustained research effortmust be maintained to provide early solutions tonew threats that may arise.
In Ghana, the CRI-Sasakawa-Monsanto no-tillpackage was presented to farmers in the Forest,Transition, and Guinea Savannah Zones and rapidlyadopted. It is estimated that in 2000, no-till was usedby 100,000 small-scale farmers on 45,000 ha.
Unlike other countries, the no-till package in Ghanaresponded to the needs of small-scale farmers, as apackage for large commercial and mechanizedfarmers was not developed. Adoption was facilitatedby the low external input agricultural practicesprevalent in the three zones and because there waslittle competition from livestock production (farmersgenerally have only a few chickens). For example,because planting is traditionally done with a stick orcutlass (machete), there was no need to develop orintroduce no-till planters, which requiredconsiderable experimentation and adjustment beforeadoption could proceed in other countries where no-till was introduced. Admittedly, the focus on small-scale farmers was a limitation to widespreadadoption of no-till by large-scale and mechanizedfarmers, who need adequate machinery to adopt thetechnology.
Three types of farmers were surveyed: farmers whoare currently using no-till (NT users), farmers whoused and later abandoned no-till (abandoned NT),and farmers who never used the package (neverused NT). The last two categories were included toobtain information on reasons for non-adoption. Anagrochemical dealers’ survey that included dealersin both survey villages and district capitals was alsocarried out.
In the absence of a reliable baseline data, it was notpossible to calculate precise quantitative measures ofthe impact of no-till. Based on farmers’ qualitativeestimates, we obtained an estimate of some of thebenefits of no-till, such as reductions in laborrequirements for different agricultural tasks.
The next section of this report looks at generalcharacteristics of agriculture in Ghana and the studyarea. This is followed by a discussion on thedevelopment and dissemination of no-till in Ghana.
Impact of No-Till Technologies in Ghana
Javier Ekboir, Kofi Boa, and A.A. Dankyi

2
Figure 1. Regional and district boundaries, Ghana.
Data collection procedures are then explained.Analyses of farmers and dealers surveys are thenpresented in subsequent sections. The report endswith a discussion of the impacts of no-till on farmersand agrochemical markets and the conclusion. (Forinformation on the development of no-tillinternationally and features of the technology, pleaserefer to Ekboir, 20021).
Agriculture in Ghana
Ghana has a total land area of about 24 millionhectares, of which agricultural land area constitutesabout 14 million hectares. Ghana is basically anagricultural country with over 50% of its populationworking in agriculture. Small-scale farmerspredominate. The principal agricultural produce arecocoa, oil palm, coconut, cotton, coffee, and tobacco;starchy staples include cassava, cocoyam, plantain,yam, maize, rice, millet, and sorghum; fruits andvegetables are pineapple, citrus, banana, and cashew.Of lesser importance are papaw, mangoes, andtomatoes. Maize is the most important cereal cropgrown by a majority of farmers in all parts of thecountry except the Sudan Savannah in the far north.
In 2000, the area under cultivation was 5.8 millionhectares (MOFA 2001). The area planted with themost important crops increased steadily in the 1990s,with the exception of sorghum (Table 1). The meanannual growth rate of the area under cultivation overthe 1992 to 2000 period is 1.4% for maize, 3.9% forcassava, 1.06% for sorghum, and 3.98% for rice.
Table 1. Area under maize, cassava, sorghum, and ricecultivation, 1992-2000, Ghana (‘000 ha).
Year Maize Cassava Sorghum Rice
1992 607 552 307 801993 637 532 310 771994 629 520 299 811995 669 551 335 1001996 665 591 314 1051997 652 589 324 1181998 696 630 332 1301999 697 640 312 1052000 695 660 289 115
Source: MOFA (2001).
In the land use pattern, bush fallow and other usescover about 60,000 km2 and savannah woodlandcover 71,000 km2. These together form about 55% ofGhana’s total land use area. Annual crops cover12,000 km2 or 5% of the total land area in Ghana. Treecrops cover 17,000 km 2 (7%) of total land area.
In the Northern Region, most households (81%) havemore than 1.2 ha of land, whereas in the Ashanti andBrong Ahafo Regions, most households haveholdings of less than 1.2 ha.2
Population density is 131 persons/km2 in the AshantiRegion, 46 person/km2 in Brong Ahafo, and 26persons/km2 in the Guinea Savannah (GhanaStatistical Service 2001). Apart from the AshantiRegion, population density is generally low; howeverbecause of poor soils, particularly in the NorthernRegion, pressure on natural resources is strong.
A particular characteristic of Ghanaian agriculture isthat women frequently manage their ownagricultural plots, contribute an importantproportion of overall labor, and exercise completediscretion over the disposal of harvest and the cashobtained from it (Morris et al. 1999).
1 This report is also available at http://www.cimmyt.org/Research/Economics/map/facts_trends/wheat00-01.html.2 A small-scale farmer in any region of Ghana has less than 5 ha.
BURKINA FASO
CÔTE
D’ I
VOIR
E
TOGO
Central Region
Greater Accra Region
Western Region
Eastern Region
Ashanti Region
Volta RegionBrong-Ahafo Region
Northern Region
Upper West Region
Upper East Region

3
The Study Area
Ghana has four major ecological zones: CoastalSavannah, Forest, Transition, and Guinea Savannah.This section describes the Forest, Transition, andGuinea Savannah Zones where this study wasconducted.
Soils in the three zones are mostly acidic low inorganic matter. Consequently, soil nutrient status isvery low. Traditional slash and burn practices andthe yearly indiscriminate bush burning furthercompound the problem of soil fertility. Soilimprovement practices common in other countrieswith similar acid soil problems (such as liming) arenot used in Ghana.
Forest ZoneThis zone covers much of the Western, Ashanti,Brong Ahafo, and Eastern Regions of Ghana. It liesinland immediately after the Coastal Savannah Zone.Rainforest covers the southwestern part of theregion, and elsewhere a semideciduous forest isprevalent. Soils in this zone are generally more fertilethan other ecological zones and consist of well-drained forest ochrosols or forest oxysols that mayleach because of high rainfall, particularly in the
southwestern part of the zone. The annual rainfall isabout 1,500 mm and has a bimodal distribution,which define a major and a minor agriculturalseason. Important weeds are Chromolaena spp.,Penissetum purperum (elephant grass) and Euphobia sp.Cocoa and palm oil are cultivated for cash. Maize isgrown in scattered plots and usually intercroppedwith cassava, plantain, and/or cocoyam. Maize andcowpea are the most important crops in the minorseason.
Transition ZoneThere is no clear boundary between the Forest andthe Transition Zones, which stretches across thecenter of the country from east to west andimmediately north of the Forest Zone. Soils are deepand friable but well drained, and there is less denseforest cover. Trees are shorter with thick bark andinterspersed with grasses. Important weeds arePanicum maximum (Guinea grass) and Imperatacylindrica (spear grass). Rainfall is bimodal andaverages about 1,300 mm per year. Because of thefavorable climate and less dense vegetation, theTransition Zone is extensively cultivated and an areaof commercial farming, especially for grainproduction. Plowing with tractors is relativelycommon. Maize is planted in both the major andminor seasons, usually as a monocrop or with yamand/or cassava.
Guinea Savannah ZoneThe Guinea Savannah Zone is the largest ecologicalzone in Ghana. It occupies more than half thecountry, covering 149,800 km2. The Guinea Savannahhas savannah ochrosols and groundwater laterites(poorly drained loams). Rainfall is unimodal, startingin April or May and ending about October. The meanannual rainfall is 1,100 mm. Vegetation is largelygrassland with sparsely distributed short trees;dawadawa, acacia, baobab, and shea trees arepredominant. Farming is the main occupation.Dominant crops are sorghum, millet, cowpea,groundnut, rice, and maize. Cotton is also grown insome areas. Tractor services are available althoughmost farmers plant with a cutlass or a stick.
Common Agricultural Practices in StudyZonesAs mentioned earlier, no-till without residue coverhas been practiced by most farmers in the Forest andTransitional Zones for centuries. The practice is verymuch associated with shifting cultivation, especiallythe slash and burn system, in which farmers slashexisting vegetation with a cutlass, leave residues to
Figure 2. Agroecological zones, Ghana.
BURKINA FASO
CÔTE
D’ I
VOIR
E
TOGO

4
dry for a few days, and then burn them. Often theslashed vegetation is not burned completely, andfarmers spend a substantial amount of time andlabor gathering unburnt debris to burn again for aclean field. This activity is labor intensive and comesat a time when labor is scarce. Planting is done with adibbling stick or cutlass for seeds and cutlass and hoeor earth chisel for propagated crops. The land iscultivated for 2-3 years and allowed to fallow for 5-10years. Fallowing depends on the productive capacityof the land. Fertilizer use (organic and inorganic) hasbeen minimal or absent. Fertility restoration dependson the length of fallow, natural vegetation, and therate at which soil nutrients are taken up by fallowvegetation from the subsoil. According toAkonbundu (1987), slash and burn is a tradition thatwas handed down as a practice that is beneficial tocrop production. According to most farmers, burninggets rid of excess vegetation that hampers plantingand seedling emergence.
Slash-mulch (popularly called “proka” in the localAkan language) is also a no-till land preparationmethod, practiced mostly by tree crop farmers. Inslash-mulch, the forest is cleared of undergrowth andunwanted trees are felled and chopped withoutburning. Seeds or seedlings are planted through themulch. To ease planting, some farmers prepare theland one year ahead of planting to allowdecomposition. No herbicides are used. Slash-mulchdeclined when farmers realized that they needed toburn slashed vegetation to plant vegetables andother food crops alongside tree crops.
Demand for arable land in many parts of the countryhas increased in recent years in response toincreasing human population. This situation isgradually moving the emphasis from resting fallowto continuous and intensive cropping.
A recent study found that in the Transition Zone, 68%of farmers used modern maize varieties and 29%used fertilizers; in the Guinea Savannah Zone, 66%used modern maize varieties and 36% usedfertilizers; and in the Forest Zone, 38% used modernmaize varieties and 9% used fertilizer (Morris et al.1999). Less fertilizer is used in the Forest Zonebecause of the higher fertility of soils there. The no-till with mulch package developed for Ghanaianfarmers is becoming popular with farmers in theForest and Transition Zones as an effective means of
reducing production costs and conserving soil andwater in more intensive agricultural systems. Thistechnology is described below.
Animal densities are low (relative to feedavailability) in all three zones. Livestock productionis more important in the Guinea Savannah than theForest Zone. In the Guinea Savannah, animals grazefreely, while in the Southern Regions grazing iscontrolled. In spite of a lack of fencing, animals areclosely watched during cropping seasons. Animalsare allowed to graze freely in the stubble betweencrop cycles. Animals trespassing into no-till fieldshave not been a problem for surveyed farmers, butfurther research is needed about the interactionbetween livestock and no-till, especially in the north.
Markets for agricultural inputs are used extensivelyin all three zones, especially for agricultural laborand special services. A large proportion of farmerscontract labor or contractors for planting andweeding.
Some farmers prepare land for planting either withtractors or animal-pulled implements. This is morecommon in the Guinea Savannah. Animal-pulledplanters are rare. The most common practice for landpreparation is still slash and burn, a technique usedby both small- and large-scale farmers.
No-Till in Ghana
Early DevelopmentsResearch on no-till in Ghana started almostsimultaneously with early developments in Europeand the United States. In Ghana, however, theseefforts were conducted by local individualresearchers with little interaction with agrochemicalcompanies or foreign researchers. The earliestresearch on no-till started in the late 1960s (Ofori1973) and was boosted by Mensah-Bonsu and Obeng(1979) who reported the beneficial effects of no-till onsoil and water conservation. These first researcherscontrolled weeds with paraquat.
In the 1990s, the no-till research effort wasconcentrated in CRI and the Ghana GrainsDevelopment Project (GGDP). 3 Roberto Soza, anagronomist from the International Maize and WheatImprovement Center (CIMMYT) working with the
3 The Ghana Grains Development Project was a collaborative effort that involved the Crop Research Institute, the Grainsand Legumes Development Board, the Ministry of Food and Agriculture, CIMMYT and the International Institute forTropical Agriculture (IITA), with funding from the Government of Ghana and CIDA.

5
GGDP, organized no-till research from 1990 until1996. Originally, funding came from the CanadianInternational Development Agency (CIDA). In 1991,the GGDP adopted the no-till system for plantingmaize and grain legumes on five research stations.The system was also tested extensively in farmers’fields across the country.
In 1993, SG 2000, Monsanto, the GGDP at CRI inKumasi, and the extension service from the Ministryof Food and Agriculture (MOFA) teamed up topromote no-till in the Transition and Forest Zones.The program received strong political support fromthe government (Findlay and Hutchinson 1999).
From 1993, Monsanto assisted the CRI to evaluate theefficacy of herbicide glyphosate in the powder formfor no-till on farmers’ fields with maize and beans.4
Trial protocols and guidelines were established byMonsanto and discussed with CRI researchers, whoimplemented the trials with financial support fromSG 2000.
The results showed that powder glyphosate was veryeffective for controlling weeds before planting, andsince 1995, it has been the driving force behindincreased adoption of no-till among small-scalefarmers. Later, liquid glyphosate was introduced.5
The main advantage of glyphosate over paraquat isgreater efficiency in weed control.
After the first experiences, several experimentalthemes were developed around tillage— herbicideuse, cover crops, and mulches—but the main thrustwas weed control. The emphasis on weed controlwas different from other countries where substantialefforts were made to develop adequate machinery(i.e., planters and mechanized sprayers) (Ekboir2002). This was the consequence of the weakness ofthe research effort in Ghana and the fact that mostfarmers in the Forest Zone do not use planters.
The experiment results were used to train extensionservice field officers who carried out their owndemonstrations in farmers’ plots. Initially thedemonstrations were concentrated in the highrainfall areas of Ashanti and Brong Ahafo, but laterexpanded to the northern Guinea Savannah, wherethe program is administered by the University ofDevelopment Studies at Tamale, and implementedby extension services supported by SG 2000 and
Dizengoff Ghana Ltd., a local distributor of fertilizersand pesticides (Findlay and Hutchinson 1999).
From an institutional point of view, the researcheffort, measured by the number of researchers andpublic resources committed, was weak. Since most ofthe research was conducted by a CRI agriculturalengineer pursuing a Ph.D. (with support fromextension agents), efforts were concentrated on weedcontrol. Attempts were made to strengthen thenetwork by enlisting the collaboration of otherprofessionals (e.g. adapting a Brazilian jab planter toGhana) but were not successful. Even today, publicresearch institutions do not have formal researchprograms in conservation tillage. Despite thislimitation, a few motivated and innovativeresearchers have recently joined the developmenteffort.
Today, MOFA extension agents and CRI researcherswork closely, following a participatory approach, tothe point that farmers cannot distinguish betweenresearch and extension staff. Some rural banks anddistrict assemblies have also joined in the promotionof no-till farming by providing credit to selectedfarmers.
Current no-till research at research institutes,universities, and projects like the Sedentary FarmingSystems Project of the Deutsche Gesellschaft fürTechnische Zusammenarbeit (GTZ) centers onresidue management, planting equipment, pest anddisease control, cover crops, and rotations. The GTZprogram is active in the Forest and Transition areasof Brong Ahafo.
The major challenges for no-till research in Ghananow hinge on the development of plantingmechanisms, crop rotations adapted to farmers’objectives and resources, integration of cover crops inthe no-till system, and introduction of slash practicesthat reduce labor requirements.
Dissemination of No-TillDemonstration plots that were large enough to showthe advantages of no-till under farmers’ conditionswere established. For direct comparison,demonstration plots were at least 1,000 m2, both forfarmers’ “standard practice” plot and the no-till plot.The size was also convenient for the calibration of the
4 A water-dispersible granule presentation containing 420 g of glyphosate per kilogram.5 A liquid presentation containing 360 g of glyphosate per liter.
6
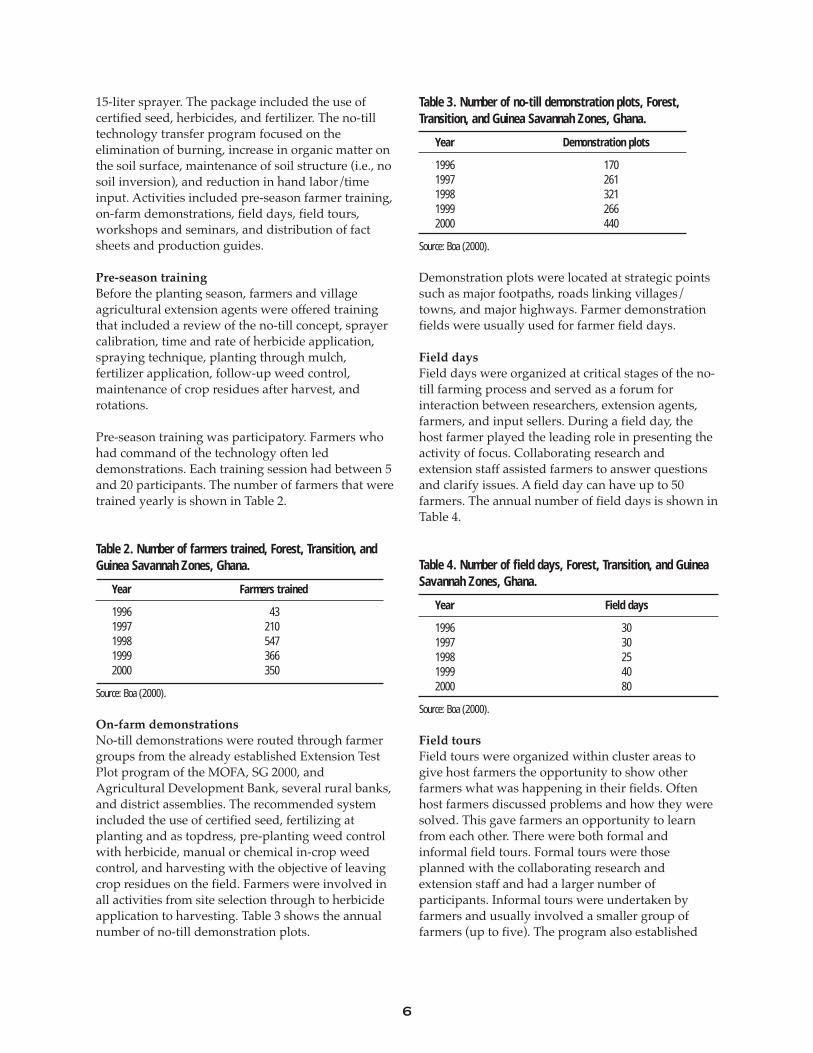
15-liter sprayer. The package included the use ofcertified seed, herbicides, and fertilizer. The no-tilltechnology transfer program focused on theelimination of burning, increase in organic matter onthe soil surface, maintenance of soil structure (i.e., nosoil inversion), and reduction in hand labor/timeinput. Activities included pre-season farmer training,on-farm demonstrations, field days, field tours,workshops and seminars, and distribution of factsheets and production guides.
Pre-season trainingBefore the planting season, farmers and villageagricultural extension agents were offered trainingthat included a review of the no-till concept, sprayercalibration, time and rate of herbicide application,spraying technique, planting through mulch,fertilizer application, follow-up weed control,maintenance of crop residues after harvest, androtations.
Pre-season training was participatory. Farmers whohad command of the technology often leddemonstrations. Each training session had between 5and 20 participants. The number of farmers that weretrained yearly is shown in Table 2.
Table 2. Number of farmers trained, Forest, Transition, andGuinea Savannah Zones, Ghana.
Year Farmers trained
1996 431997 2101998 5471999 3662000 350
Source: Boa (2000).
On-farm demonstrationsNo-till demonstrations were routed through farmergroups from the already established Extension TestPlot program of the MOFA, SG 2000, andAgricultural Development Bank, several rural banks,and district assemblies. The recommended systemincluded the use of certified seed, fertilizing atplanting and as topdress, pre-planting weed controlwith herbicide, manual or chemical in-crop weedcontrol, and harvesting with the objective of leavingcrop residues on the field. Farmers were involved inall activities from site selection through to herbicideapplication to harvesting. Table 3 shows the annualnumber of no-till demonstration plots.
Table 3. Number of no-till demonstration plots, Forest,Transition, and Guinea Savannah Zones, Ghana.
Year Demonstration plots
1996 1701997 2611998 3211999 2662000 440
Source: Boa (2000).
Demonstration plots were located at strategic pointssuch as major footpaths, roads linking villages/towns, and major highways. Farmer demonstrationfields were usually used for farmer field days.
Field daysField days were organized at critical stages of the no-till farming process and served as a forum forinteraction between researchers, extension agents,farmers, and input sellers. During a field day, thehost farmer played the leading role in presenting theactivity of focus. Collaborating research andextension staff assisted farmers to answer questionsand clarify issues. A field day can have up to 50farmers. The annual number of field days is shown inTable 4.
Table 4. Number of field days, Forest, Transition, and GuineaSavannah Zones, Ghana.
Year Field days
1996 301997 301998 251999 402000 80
Source: Boa (2000).
Field toursField tours were organized within cluster areas togive host farmers the opportunity to show otherfarmers what was happening in their fields. Oftenhost farmers discussed problems and how they weresolved. This gave farmers an opportunity to learnfrom each other. There were both formal andinformal field tours. Formal tours were thoseplanned with the collaborating research andextension staff and had a larger number ofparticipants. Informal tours were undertaken byfarmers and usually involved a smaller group offarmers (up to five). The program also established

7
links with the Sasakawa Center at the University ofCape Coast in Ghana, where final year agriculturalstudents were conducted around farmers’ no-tillfields at the end of their soil conservation course.
Workshops and seminarsWorkshops and seminars were organizedoccasionally for all stakeholders (farmers, researchand extension staff) and input dealers to exchangeideas on no-till farming. Workshops and seminars arethe only activities held outside the farm.
Distribution of fact sheets and production guidesFact sheets highlighting the key components of thetechnology were distributed to extension agents andfarmers. Production guides were also prepared withsome detail to guide the extension staff involved inthe program. The number of no-till fact sheets andproduction guides distributed is shown in Table 5.
Table 5. Number of fact sheets and production guidesdistributed, Forest, Transition, and Guinea Savannah Zones,Ghana.
Item Copies
Fact sheet 2,500Production guides 150
Source: Boa (2000).
The No-Till Package in GhanaInitially, the farmer slashes the vegetation with acutlass. This operation is very demanding in terms oftime and effort. The labor required depends onwhether clearing is done in a plot that was left fallowor already under cultivation. A plot that was leftfallow will have a secondary forest and consequentlyrequires more labor and effort to clear. A cultivatedplot usually has only grasses and broadleaf weeds,and clearing is easier. In the traditional system, thefarmer can farm a recently fallowed plot for aboutthree years before it loses its fertility and the soildeteriorates. At this point, the farmer has to clear anew plot. Since fertility and most soil characteristicsare maintained in the no-till system, the farmer canplant the same plot indefinitely.6
In the traditional system, farmers burn slashedvegetation. In the no-till system, weeds are allowedto grow to between 30 and 40 cm and then controlled
with glyphosate; the recommended dose is 3 l/ha,but if more aggressive weeds like Imperata cylindricaare present, higher doses are required. On the otherhand, farmers have found that efficient control can beachieved with lower doses of herbicides, especially inplots that have been cultivated with no-till for severalyears.
Table 6 compares the costs of land preparation andweed control for slash and burn and no-till. Theclearing of forest is common to both technologies inthe first year. Subsequently, it has to be done everythree years in slash and burn. In the twointermediate years weeds are slashed in both slashand burn and no-till. In the former, the farmer stillhas to burn residues, while in the latter, the farmerapplies herbicide. Slashing becomes easier with thenumber of years a plot remains under no-till.
In two out of three years, the cost advantage of landpreparation under no-till compared with slash andburn is US$ 12.21/ha. In the third year, when a newplot has to be cleared, the cost advantage increases toUS$ 49.71/ha.
Table 6. Cost of land preparation and weed control with slashand burn and no-till for a 1 ha plot in production, Forest,Transition, and Guinea Savannah Zones, Ghana.
Cost (US$/ha)Operation Quantity/ha Slash and burn No-till
Clearing 15 man-days 15Felling and chopping 10 man-days 10Burning 2.5 man-days 2.5Gathering 10 man-days 10Total of forest clearing(every 3 years) 37.5Slashing weeds 10 man-days 10Slashing weeds 7 man-days 7Pre-plant herbicide spray† 0.5 man-days 0.5Herbicide 3 liters 19.29Hauling water 1 man-day 1In-crop weeding† 40 man-days 40In-crop weeding† 10 man-days 10Total cost every year 50 37.79Cost difference 12.21Total cost every 3 years 87.5 37.79Cost difference 49.71
Note: US$ 1 = 7,000 cedis; cost of labor = US$ 1/man-day.†From Findlay and Hutchinson (1999).
6 However, intensification of agriculture would require the use of fertilizers to compensate for the higher rate of nutrientextraction.

8
Herbicide is applied with a knapsack sprayer with a15-liter capacity. Initially, spraying was done with ahigh volume technique, which required 300 liters ofwater per ha. In recent years, a low volume/lowpressure spraying technique, which required only150 liters of water per ha, was introduced. Inaddition to increasing herbicide efficiency, the lowvolume technique saved substantial amount of laborused for carrying water from the source to the plot.To switch to the new spraying technique, a lowvolume nozzle is substituted for a high volumenozzle. Using this technique, a farmer has to walk 6.7km when applying herbicide to one hectare.7 On theother hand, a farmer has to walk 10 km and bend tohand weed one hectare with a hoe.
Since the herbicide cannot be seen on plantsimmediately after application, farmers were advisedto use visual devices (e.g., ropes or a sighting pole) tokeep track of where they needed to spray. However,most farmers still do not use these devices. Thissystem of application may leave patches of untreatedareas, so farmers were advised to delay planting forat least one week after applying glyphosate toidentify untreated spots. Dead weeds are left on theground and not incorporated into the soil.
Planting is done with a cutlass or dibbling stickdirectly through the mulch. Even though planters formechanized and nonmechanized small-scale farmershave been developed in other countries (e.g., Brazil),these technologies have not been introduced inGhana.8 The cutlass and stick are also used whenmulch is not used. For this reason, no specialtechniques for applying fertilizer with mulch areneeded. After planting, weeds are usually controlledby hand. In some cases, farmers use pre-emergenceherbicides, like alachlor + atrazine9 or atrazine alone.Harvesting techniques are not affected by no-till.
The no-till package in Ghana includes improvedseeds and fertilizers. Farmers were told that the fullbenefits of no-till could be obtained only with thewhole package. These two practices were alsopromoted for conventional tillage under the GGDP.
Even though it would be possible to isolate theimpact of no-till from the impact of using improvedseed and fertilizer, it was decided not to do sobecause no-till is not just a weed managementpractice but a new farm management system. Theadoption of improved seed and fertilizer gave betterresults with no-till (as will be seen later).
Methodology and Data Collection
This study focused largely on the impact of no-tilltechnology on farmers who adopted the technology;the reasons for nonadoption were studied in lessdetail. The impact of no-till on formal herbicidedealers10 was also evaluated. Farmers’ level ofadoption was not estimated because of budgetconstraints. Two surveys were conducted, one withfarmers and the other with input dealers (namelyformal herbicide dealers). The farmer sampleincluded three categories of farmers – those whowere using the technology (NT users), those whoused and abandoned it (abandoned NT), and thosewho never used the technology (never used NT). Thedealer sample included input dealers in both villagesand district capitals.
Data collectionFor the farmer survey, a two-week planning sessionwas held from 10-25 October 2000 with scientistsfrom CIMMYT, CRI, and MOFA at CRI headquartersin Kumasi. During the session, questionnaires weredeveloped and pre-tested, and enumerators weretrained in the use of questionnaires. Six teams, eachmade up of two enumerators were organized. Allenumerators were CRI technical staff with auniversity diploma. Training included discussion ofsurvey objectives, review of survey questionnaire,and role-playing.
The field survey was conducted in November andDecember 2000. One enumerator conducted theinterview while the other recorded responses. Eachinterview lasted an hour for NT users and half anhour for those who abandoned NT and never usedNT. The input dealers survey was conducted on Julyand early August 2001. Each interview lasted abouthalf an hour.
7 Older nozzles have a 1 m swath. Presently most farmers use a nozzle with a swath of 1.5 m and some 2 m. Ourcalculation is based on a 1.5 m swath.
8 Small-scale farmers in Brazil can be large-scale farmers in Ghana. A farmer is small in Brazil if he farms less than 50 ha.9 Alachlor + atrazine is known by its commercial name, Lasso-atrazine.10 A formal dealer is someone who has an established location and whose primary activity is selling agricultural inputs.
Research/extension agents, on the other hand, provide mostly research and extension services and trade in herbicideson the side

9
Sampling procedureThe farmer survey was conducted in the Ashanti,Brong Ahafo, and parts of the Northern Region,where no-till technology was demonstrated. A two-stage sampling procedure was used. Thirty villageswere randomly chosen. These consisted of 25 villagesin the Ashanti and Brong Ahafo Regions that had no-till demonstrations; to get information on peri-urbanagriculture, two villages near Kumasi were alsoincluded. Only three villages in the Northern Regionwere selected because of lack of time and resources.
In each selected village, a list of farmers using no-tillwas collected from extension agents. From this list,and depending on the number of no-till users, 3-4farmers were randomly chosen from each village. Intotal, 91 farmers were interviewed. It was notpossible to prepare a similar list of farmers who usedand abandoned no-till because almost all farmerswho tried it never returned to conventional tillage.Consequently, in all villages, extension agents andfarmers were asked to identify farmers who fell intothis category. Only 18 cases were identified.
Since it was not possible to compile a list of farmerswho never used no-till, one or two houses(depending on the size of the village) in each villagewere selected randomly, and farmers who fell intothis category were interviewed; 37 farmers whonever used no-till were interviewed.
The total sample size was 146. A summary of thesampling procedure is presented in Table 7. Thelocation of the sampled villages and districts is givenin Appendix 1.
Table 7. Sampling procedures, Forest, Transition, and GuineaSavannah Zones, Ghana (no.).
Category Sample Expected Actualof user Villages unit sample size sample size
NT users 30 3-4 91 91 (62.3%)Abandoned NT 30 1 30 18 (12.3%)Never used NT 30 1-2 30 37 (25.3%)Total 30 5 150 146 (100%)
The dealer survey was carried out in the samevillages as the farmer survey. In villages where therewere no dealers, a nearby village where dealers wereavailable was sought. As most input dealers arefound in district capitals, both input dealers invillagers and district capitals were interviewed.
In total, 28 smallholder input dealers wereinterviewed—15 in Ashanti, 8 in Brong Ahafo, and 5in the Northern Region. Twenty-two dealers werelocated in district capitals and 6 were located in non-district capitals. The sample included 8 districtcapitals and 5 towns that had no administrativefunctions. The list of cities and villages included inthe survey and the number of dealers in eachlocation is given in Appendix 2.
Characteristics of Sample Farmers
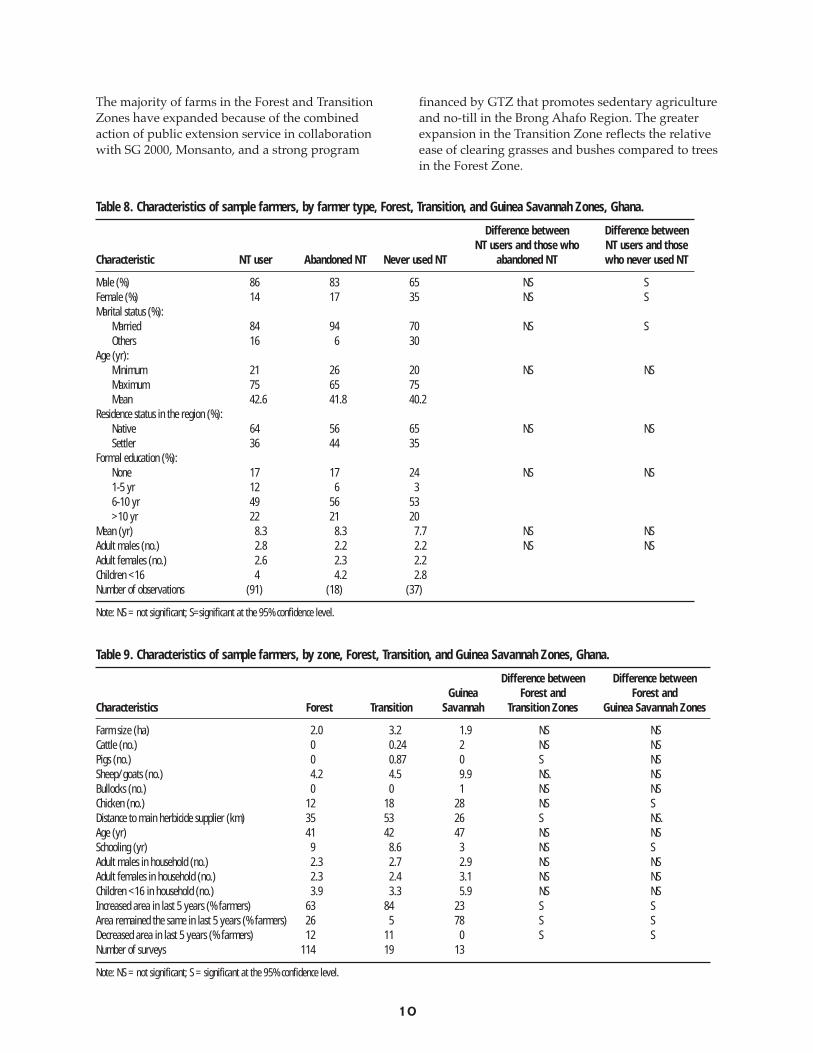
Characteristics of sample farmers are shown in Table8. There was little difference among the variouscategories of farmers for the majority of variables inthe table. Most farmers were married; however,unmarried farmers (both male and female)constituted a larger percentage of farmers who neverused NT. Two-thirds of NT users and those whonever used NT, and half of those who abandoned NTare natives of the region. There were more illiteratepeople among farmers who never used NT.
Household sizes were also not significantly differentfor all categories. On average, each family had 2.6adult males, 2.5 adult females and 3.7 children under16. Wealth indicators (availability of water andelectricity, ownership of bicycle, car, tractor ordifferent types of livestock) were also similar for allgroups.
Differences Among Sample Farmers byEcological ZonesTable 9 shows descriptive statistics for the aggregateof the three groups of farmers in each of the threezones. The small sample size in some ecologicalzones prevented the analysis of fully disaggregateddata, i.e., the analysis of nine separate groups (threefarmer types in three zones). Thus the analyses werebased only on the three categories of farmers alreadydefined (NT users, abandoned NT, and never usedNT). Even though some information is lost in thisaggregation, the effects are relatively minor.
Differences between farms in the three zones werenot statistically significant. We found no explanationfor differences in the number of pigs and distance toan agrochemical dealer between farmers in the Forestand Transition Zones, or the difference in years ofschooling between farmers in the Forest and GuineaSavannah Zones.
10
Table 8. Characteristics of sample farmers, by farmer type, Forest, Transition, and Guinea Savannah Zones, Ghana.
Difference between Difference betweenNT users and those who NT users and those
Characteristic NT user Abandoned NT Never used NT abandoned NT who never used NT
Male (%) 86 83 65 NS SFemale (%) 14 17 35 NS SMarital status (%):
Married 84 94 70 NS SOthers 16 6 30
Age (yr):Minimum 21 26 20 NS NSMaximum 75 65 75Mean 42.6 41.8 40.2
Residence status in the region (%):Native 64 56 65 NS NSSettler 36 44 35
Formal education (%):None 17 17 24 NS NS1-5 yr 12 6 36-10 yr 49 56 53>10 yr 22 21 20
Mean (yr) 8.3 8.3 7.7 NS NSAdult males (no.) 2.8 2.2 2.2 NS NSAdult females (no.) 2.6 2.3 2.2Children <16 4 4.2 2.8Number of observations (91) (18) (37)
Note: NS = not significant; S=significant at the 95% confidence level.
Table 9. Characteristics of sample farmers, by zone, Forest, Transition, and Guinea Savannah Zones, Ghana.
Difference between Difference betweenGuinea Forest and Forest and
Characteristics Forest Transition Savannah Transition Zones Guinea Savannah Zones
Farm size (ha) 2.0 3.2 1.9 NS NSCattle (no.) 0 0.24 2 NS NSPigs (no.) 0 0.87 0 S NSSheep/goats (no.) 4.2 4.5 9.9 NS. NSBullocks (no.) 0 0 1 NS NSChicken (no.) 12 18 28 NS SDistance to main herbicide supplier (km) 35 53 26 S NS.Age (yr) 41 42 47 NS NSSchooling (yr) 9 8.6 3 NS SAdult males in household (no.) 2.3 2.7 2.9 NS NSAdult females in household (no.) 2.3 2.4 3.1 NS NSChildren <16 in household (no.) 3.9 3.3 5.9 NS NSIncreased area in last 5 years (% farmers) 63 84 23 S SArea remained the same in last 5 years (% farmers) 26 5 78 S SDecreased area in last 5 years (% farmers) 12 11 0 S SNumber of surveys 114 19 13
Note: NS = not significant; S = significant at the 95% confidence level.
The majority of farms in the Forest and TransitionZones have expanded because of the combinedaction of public extension service in collaborationwith SG 2000, Monsanto, and a strong program
financed by GTZ that promotes sedentary agricultureand no-till in the Brong Ahafo Region. The greaterexpansion in the Transition Zone reflects the relativeease of clearing grasses and bushes compared to treesin the Forest Zone.

11
Gender IssuesAs pointed out earlier, male farmers predominate inall three groups. However the proportion of womenis larger among those who never used no-till (Table10). Other studies of Ghanaian agriculture havefound that the proportion of female farmers is about30%, similar to that of female farmers who neverused no-till (Morris et al. 1999).
On average, women farm about half the area as menand seem to be less innovative. Only 21% of womenreported trying new things in their fields against 43%of men. Maize yields obtained by female farmerswere also lower. These differences can be explainedby the fact that more women have nonagriculturaloccupations. While they are not formally employed,women work at home and/or are traders. Hence,they tend to be part-time farmers who go to the fieldlater in the day. This affects the efficiency of someagricultural practices such as spraying, which shouldbe done early in the morning.
Other indicators showed no significant differencebetween male and female farmers. Both groups hadsimilar patterns of interaction with research/extension agents, grew the same crop combinations,had the same years of schooling, and tried tosimplify soil preparation. There were also nodifferences in wealth.
Table 10. Gender differences in selected variables, Forest,Transition, and Guinea Savannah Zones, Ghana.
Variables Male Female Difference
Maize yield in 2000 (t/ha) 1.4 0.8 SNormal maize yield (t/ha) 1.6 1.1 SYears of schooling (mean) 9.0 7.0 NSTried new things in field (%) 43.0 21.0 STried to simplify soil preparation (%) 35.0 24.0 NSTotal land farmed (ha) 3.0 1.6 SEmployed off-farm (%) 8.0 0 SEmployed in nonagricultural job (%) 6.0 0 SRemittances (%) 1.0 7.0 SSale of animals (%) 7.0 3.0 SPoultry sales (%) 9.0 0 STrading (%) 13.0 28.0 SSale of prepared food (%) 0 7.0 S
Note: NS = not significant; S = significant at the 95% confidence level.
Most farmers made their own decisions irrespectiveof gender and thus have equal rights to decision-making (Table 11). A particular characteristic of
Ghanaian agriculture is that women frequentlymanage their own fields, contribute an importantproportion of overall labor, and exercise completediscretion over farming activities, such as thedisposal of harvest and cash (Morris et al. 1999).
Table 11. Decision-making on largest no-till field among maleand female farmers, Forest, Transition, and Guinea SavannahZones, Ghana (%).
Decision-makingPractice Male Female Difference
Selecting crop 90 92 NSPlanting 97 92 NSFertilizer 71 54 NSWeeding method 96 92 NSPesticide use 82 85 NSResidue management 90 85 NSSelling grain 90 92 NSUse of cash from sale 86 77 NS
Note: NS = not significant.
Both women and men farmers who used herbicideswere aware of agrochemical prices in other villages.In other words, both groups have the information toparticipate equally in the market. However, a largershare of female farmers do not use herbicides.
Attitude Towards InnovationCompared to five years ago, 69% of NT users and72% of those who abandoned NT increased theirfarming area, whereas only 30% of those who neverused NT increased their farming area (Table 12). Thereason for the expansion is that no-till users andfarmers who abandoned NT are more innovativethan farmers who never used no-till. A largerpercentage of NT users and those who abandonedNT reported trying new things in their fields, tryingto simplify land preparation, and talking to anextension agent at least once a month.
No-till users and those who abandoned NT havemore farming experience than those who never usedNT. On average, NT users have been making theirown decisions about farming for 14 years, those whoabandoned NT for 13 years, and those who neverused NT for 9 years. Furthermore, NT users haveworked continuously on the same land for 6 years,those who abandoned NT for 7 years, and those whonever used NT for 4 years.

12
Income SourcesAgriculture was the main source of income for allsample farmers (Table 13).
Table 13. Income sources, Forest, Transition, and GuineaSavannah Zones, Ghana (% farmers).
Income source NT users Abandoned NT Never used NT
Agriculture 92 94 95Nonagriculture 8 6 5
The most important cash crops, in order ofimportance, are maize, vegetables, and yam for NTusers; maize, cassava, plantain, and vegetables forthose who abandoned NT; and maize, plantain,vegetables, cassava, and rice for farmers who neverused NT. Seven crops were mentioned by NT users,two by farmers who abandoned NT and five byfarmers who never used NT, as important cash crops.The information indicates that those who abandonedNT are more specialized than the other two groups.
Maize is the most important crop for all threecategories of farmers; 83% of NT users, 94% of thosewho abandoned NT and 65% of those who neverused NT mentioned maize as a major crop, followedby cowpea and cassava. Plantain comes far below asthe second crop and is only mentioned by farmerswho abandoned NT. Farmers who abandoned NTand those who never used NT also mentionedvegetables. Adoption seems to be linked to cropsgrown, since no-till technologies for plantain andvegetables have not yet been developed in Ghana.
Input Use, Input Sources, and ExtensionServicesMarkets for agrochemicals are developing fast inresponse to the expansion of no-till. There arecurrently two parallel channels for distribution of
agrochemicals: formal dealers and research/extension agents (see below). Both channels seem towork well in the surveyed zones and different typesof farmers appear to prefer each of these channels.Seventy-four percent of NT users know herbicideand fertilizer prices outside their village compared to45% of farmers who abandoned NT and 5% offarmers who never used NT. This finding reinforcesthe picture that users and those who abandoned NTare more resourceful and innovative than those whonever used no-till, because they not only are betterfarmers but also use markets better.
The mean distance from a farmer’s home to the mainagrochemical purchase point was 22 km. Differencesin mean distances for all three groups were notstatistically significant. Sixty-six percent of NT usersand 67% of those who abandoned NT were able toget agrochemicals when needed. On the other hand,30% of users and 11% of those who abandoned NThad difficulties in timely access to agrochemicals.Ninety-five percent of those who never used NT didnot use agrochemicals, and only 5% were able to getfertilizers on time.
No-till users have closer contact with extension/research agents than farmers in other groups. Eventhough NT users and those who abandoned NT seeextension/research agents as often, NT usersinteracted more closely with them. No-till users getmore seed and herbicide through research/extensionthan the open market (Table 14). Forty-two percentbuy certified seed of improved maize varietiesthrough research/extension agents or cooperativescompared to 17% of those who abandoned NT and14% of those who never used NT. Also, 33% of NTusers get agrochemicals through research/extensionagents who also provide technical advice. Only 12farmers in the whole sample mentioned herbicidedealers as a secondary or tertiary source of
Table 12. Changes in area planted among NT users, those who abandoned NT, and those who never used NT, Forest,Transition, and Guinea Savannah Zones, Ghana (% farmers).
Difference between Difference betweenAbandoned Never NT users and those NT users and those
Changes NT users NT used NT who abandoned NT who never used NT
Increased land 69 72 30 NS SLand remained same 23 22 49 NS SDecreased land 8 6 22 NS STried new things in field 47 39 16 NS STried to simplify soil preparation 36 44 18 NS STalked to an extension agent at least once a month 63 56 40 NS S
Note: NS = not significant; S = significant at the 95% confidence level.
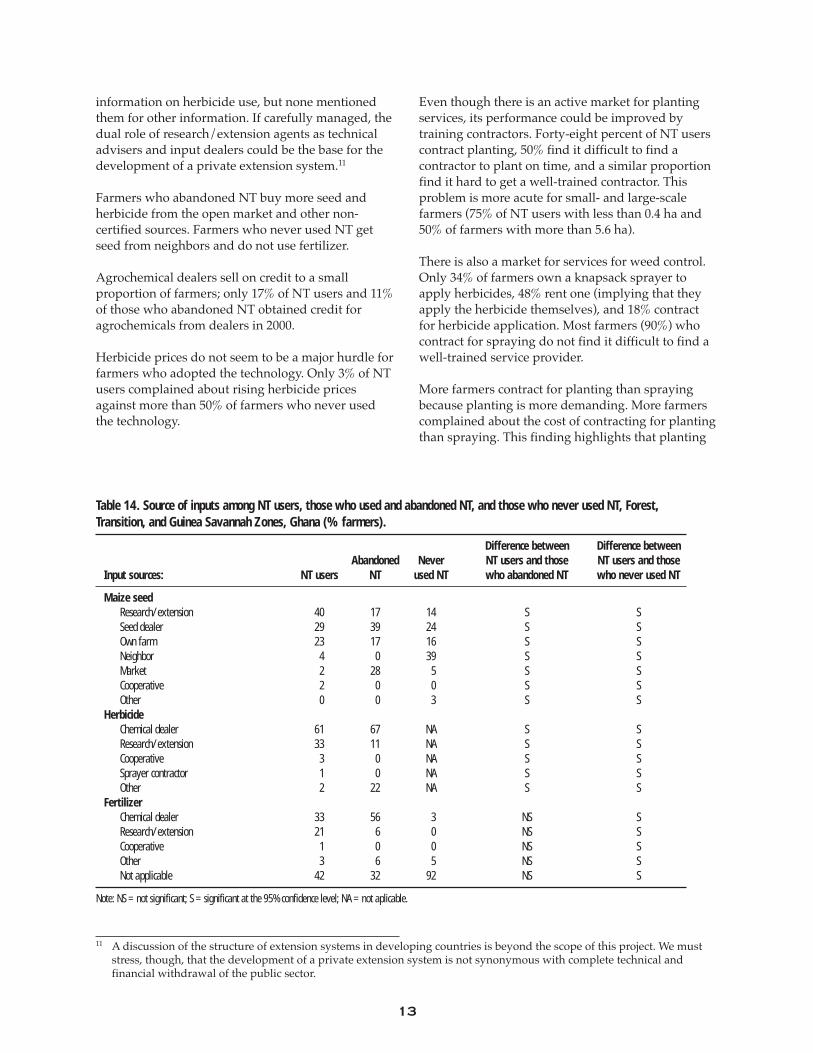
13
information on herbicide use, but none mentionedthem for other information. If carefully managed, thedual role of research/extension agents as technicaladvisers and input dealers could be the base for thedevelopment of a private extension system.11
Farmers who abandoned NT buy more seed andherbicide from the open market and other non-certified sources. Farmers who never used NT getseed from neighbors and do not use fertilizer.
Agrochemical dealers sell on credit to a smallproportion of farmers; only 17% of NT users and 11%of those who abandoned NT obtained credit foragrochemicals from dealers in 2000.
Herbicide prices do not seem to be a major hurdle forfarmers who adopted the technology. Only 3% of NTusers complained about rising herbicide pricesagainst more than 50% of farmers who never usedthe technology.
Even though there is an active market for plantingservices, its performance could be improved bytraining contractors. Forty-eight percent of NT userscontract planting, 50% find it difficult to find acontractor to plant on time, and a similar proportionfind it hard to get a well-trained contractor. Thisproblem is more acute for small- and large-scalefarmers (75% of NT users with less than 0.4 ha and50% of farmers with more than 5.6 ha).
There is also a market for services for weed control.Only 34% of farmers own a knapsack sprayer toapply herbicides, 48% rent one (implying that theyapply the herbicide themselves), and 18% contractfor herbicide application. Most farmers (90%) whocontract for spraying do not find it difficult to find awell-trained service provider.
More farmers contract for planting than sprayingbecause planting is more demanding. More farmerscomplained about the cost of contracting for plantingthan spraying. This finding highlights that planting
11 A discussion of the structure of extension systems in developing countries is beyond the scope of this project. We muststress, though, that the development of a private extension system is not synonymous with complete technical andfinancial withdrawal of the public sector.
Table 14. Source of inputs among NT users, those who used and abandoned NT, and those who never used NT, Forest,Transition, and Guinea Savannah Zones, Ghana (% farmers).
Difference between Difference betweenAbandoned Never NT users and those NT users and those
Input sources: NT users NT used NT who abandoned NT who never used NT
Maize seedResearch/extension 40 17 14 S SSeed dealer 29 39 24 S SOwn farm 23 17 16 S SNeighbor 4 0 39 S SMarket 2 28 5 S SCooperative 2 0 0 S SOther 0 0 3 S S
HerbicideChemical dealer 61 67 NA S SResearch/extension 33 11 NA S SCooperative 3 0 NA S SSprayer contractor 1 0 NA S SOther 2 22 NA S S
FertilizerChemical dealer 33 56 3 NS SResearch/extension 21 6 0 NS SCooperative 1 0 0 NS SOther 3 6 5 NS SNot applicable 42 32 92 NS S
Note: NS = not significant; S = significant at the 95% confidence level; NA = not aplicable.
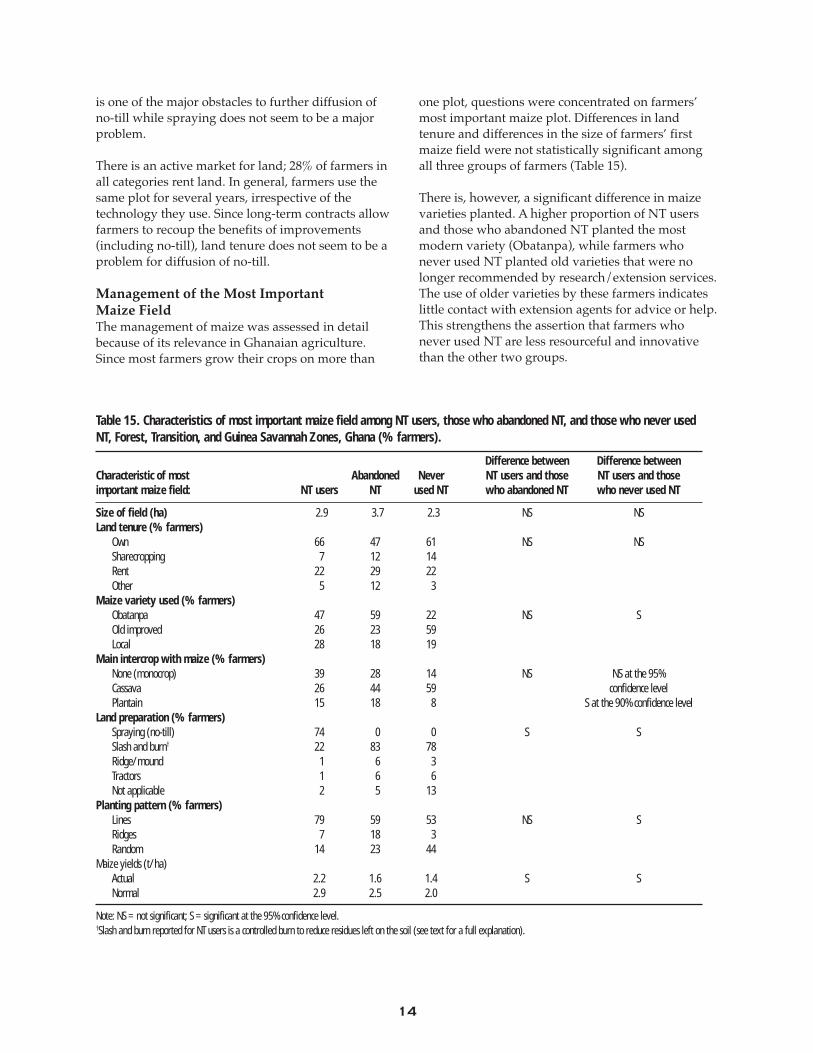
14
is one of the major obstacles to further diffusion ofno-till while spraying does not seem to be a majorproblem.
There is an active market for land; 28% of farmers inall categories rent land. In general, farmers use thesame plot for several years, irrespective of thetechnology they use. Since long-term contracts allowfarmers to recoup the benefits of improvements(including no-till), land tenure does not seem to be aproblem for diffusion of no-till.
Management of the Most ImportantMaize FieldThe management of maize was assessed in detailbecause of its relevance in Ghanaian agriculture.Since most farmers grow their crops on more than
Table 15. Characteristics of most important maize field among NT users, those who abandoned NT, and those who never usedNT, Forest, Transition, and Guinea Savannah Zones, Ghana (% farmers).
Difference between Difference betweenCharacteristic of most Abandoned Never NT users and those NT users and thoseimportant maize field: NT users NT used NT who abandoned NT who never used NT
Size of field (ha) 2.9 3.7 2.3 NS NSLand tenure (% farmers)
Own 66 47 61 NS NSSharecropping 7 12 14Rent 22 29 22Other 5 12 3
Maize variety used (% farmers)Obatanpa 47 59 22 NS SOld improved 26 23 59Local 28 18 19
Main intercrop with maize (% farmers)None (monocrop) 39 28 14 NS NS at the 95%Cassava 26 44 59 confidence levelPlantain 15 18 8 S at the 90% confidence level
Land preparation (% farmers)Spraying (no-till) 74 0 0 S SSlash and burn† 22 83 78Ridge/mound 1 6 3Tractors 1 6 6Not applicable 2 5 13
Planting pattern (% farmers)Lines 79 59 53 NS SRidges 7 18 3Random 14 23 44
Maize yields (t/ha)Actual 2.2 1.6 1.4 S SNormal 2.9 2.5 2.0
Note: NS = not significant; S = significant at the 95% confidence level.†Slash and burn reported for NT users is a controlled burn to reduce residues left on the soil (see text for a full explanation).
one plot, questions were concentrated on farmers’most important maize plot. Differences in landtenure and differences in the size of farmers’ firstmaize field were not statistically significant amongall three groups of farmers (Table 15).
There is, however, a significant difference in maizevarieties planted. A higher proportion of NT usersand those who abandoned NT planted the mostmodern variety (Obatanpa), while farmers whonever used NT planted old varieties that were nolonger recommended by research/extension services.The use of older varieties by these farmers indicateslittle contact with extension agents for advice or help.This strengthens the assertion that farmers whonever used NT are less resourceful and innovativethan the other two groups.

15
The difference in the use of intercrops between NTusers and those who abandoned NT on the onehand, and those who never used NT on the other, ismarginally significant. Researchers recommendincreasing the density of maize plants which reducethe possibility of intercropping. Again, farmers whonever used NT used traditional farming practices.Crops most commonly intercropped with maizewere cassava and plantain.
Differences in land preparation methods betweenthe groups were statistically significant. Some NTusers (22%) practice partial burning, a form of slashand burn that reduces the volume of mulch afterslashing to facilitate planting. Plant residues areburned a few days after a heavy rain. Since only thetop cover is dry, the fire does not damage residues atthe bottom. Residues left on the ground are enoughto keep the soil properly covered. Weeds are thenallowed to grow and are controlled with herbicide.
The percentage of farmers in the sample who usedtractors for land preparation is lower than in thegeneral population, reflecting a biased sample.Mechanized no-till is not feasible without adequateplanters, but planters are not available in Ghana. Asthe survey focused on farmers who used no-till,most farmers who used tractors would not havetried it and were less likely to be interviewed.
The traditional planting method is random, whilethe practice recommended by research and extensionis to plant in lines or on ridges. There was littlestatistical difference in planting methods betweenNT users and those who abandoned NT, while thedifference between NT users and those who neverused NT was statistically significant. This is againanother indication that farmers who never used NTare less innovative than farmers who used NT.
Yields were below normal in 2000 because the majorseason was dry. When asked about yields in the 2000crop season and in a normal year, NT users reportedhigher yields in both compared to the other twocategories of farmers. Since no-till improvesmoisture conservation, higher yields in users’ fieldswere expected. Yield reductions due to drought waslower for NT users (24%) than for those whoabandoned NT (36%) and never used NT (30%). Inshort, no-till increased yields and reduced the risk ofbad crops in dry years, a particularly importantfeature in Africa.
No-Till Among Survey Farmers
Knowledge/perceptionFarmers in all three categories felt that most orseveral farmers in the village used no-till (Table 16).Similarly, all three groups (NT users, 88%;abandoned NT, 61%; never used NT, 70%) think thatthe number of NT users is increasing although theperception is lower among those who abandonedNT. The majority of farmers in all groups thought NTusers were of average wealth. In other words, no-tillis not perceived as a technology for rich farmers.Also, farmers in all categories thought that incomeand food availability in households that use no-till isincreasing. This perception is highest among NTusers and lowest among those who never used NT.The difference in perception may arise from differentpersonal experiences with no-till. As will be seenlater, NT users actually mentioned that their incomeincreased after adopting no-till.
A greater share of NT users and their families have agood opinion about no-till than the other two groups.A large majority of those who abandoned NT andtheir families also considered no-till a goodtechnology. The large share of those who never usedNT who had no opinion reflects lack of knowledgeabout the technology. Extension programs targeted tothis group could accelerate adoption.
Diffusion of No-Till in Study AreaA pattern of dissemination of no-till was constructedfrom farmers’ responses about the year in which theyfirst used no-till. Farmers were also asked if theygave land for demonstration plots, and if the answerwas affirmative, the year in which the demonstrationoccurred.
Table 17 shows the rate of diffusion of no-till in thethree zones studied. Diffusion was slow duringinitial years, accelerated in the early 1990s, andstabilized in the late 1990s; demonstration plots showa similar pattern. The last three years show no cleartrend. In the period of expansion, extension servicesreceived support from the National AgriculturalExtension Project.
This diffusion pattern could have two alternativeexplanations over which the sample can shed nolight: adoption has reached saturation as mostpotential adopters are already using the technologyor, alternatively, extension efforts were reduced in thelate 1990s, exposing less farmers to the technology.

16
The number of potential adopters is a function of thetechnology available. As was discussed before, theavailability of planters could make the technologysuitable for mechanized farmers. Further research isneeded to clarify this point.
Learning About No-TillThe first experience with no-till determines theprobability of using or abandoning the technology.Most farmers (NT users as well as those whoabandoned NT) received help during the first trial(about 40% from research and 20% from a neighbor).Seventy-two percent of NT users first learned aboutno-till from a research or extension agent, while 21%learned from another farmer. For those whoabandoned NT, only 36% learned from a research orextension agent while 56% learned from anotherfarmer.
Table 17. Diffusion of no-till among farmers in the Forest,Transition, and Guinea Savannah Zones, Ghana (no.).
Farmers who triedYear no-till for the first time Demonstration plots
1980 1 11981 1 01982 1 01988 1 01990 1 01991 1 01992 3 11993 3 11994 7 21995 15 21996 20 41997 9 61998 15 31999 11 5
Table 16. Perception of no-till among NT users, those who abandoned NT, and those who never used NT, Forest, Transition,and Guinea Savannah Zones, Ghana (% farmers).
Difference between Difference betweenAbandoned Never NT users and those NT users and those
NT users NT used NT who abandoned NT who never used NT
How many farmers in village use no-till?Most 37 39 27 NS NSSeveral 42 39 35Few 20 17 35Not applicable 1 5 -
How wealthy are farmers who use no-till?Rich 18 11 14 NS NSAverage 74 83 76Poor 8 0 0Not applicable 0 6 10
Do farmers who adopt no-till have more income than before adopting?Yes 98 72 65 S SNo 0 6 0Cannot tell 2 22 35
What is your spouse’s opinion about no-till?Good 87 78 30 S SNo good 1 17 5No opinion 12 5 65
What is your relatives’ opinion about no-till?Good 97 83 43 S SNo good 2 11 11No opinion 1 6 46
How is no-till viewed in your village?Good 99 89 65 S SNo good 1 6 3No opinion 0 5 32
Note: NS = not significant; S = significant at the 95% confidence level.

17
The proportion of farmers who used both herbicidesand manual weed control in the first trial is higheramong those who abandoned NT (Table 18). Thesestatistically significant differences may indicate thatthose who abandoned NT did not receive propertraining in no-till or herbicide use. Most NT users(98%) and those who abandoned NT (88%) leftresidues on the ground after harvest during the firsttrial.
About 60% of NT users and those who abandonedNT planted their first trial with a cutlass and did notuse animals or machinery. Most NT users hadexcellent result with the first trial, and 2% had a goodfirst trial. In contrast, only 39% of those whoabandoned NT reported an excellent first trial; 16%had a good first experience and 16% a fair one.
The opinion of neighbors on the appearance of no-tillfields relative to the clean slash and burn fields wasnot a problem for 83% of farmers in the sample. Theopinion of neighbors was a major obstacle for farmersin other countries (Ekboir 2000). Currently, researchand extension services continue to be the mostimportant source of information on no-till as 79% ofNT users and 83% of those who abandoned NTobtained information from them. Only 11% of NTusers and 17% of those who abandoned NTmentioned other farmers as their main source ofinformation. Twenty-seven percent of NT users gaveland for no-till demonstrations. Of these, 20 plots(83%) were used for maize.
Seventy percent of NT users and 56% of those whoabandoned NT received some training from researchand/or extension agents, a statistically significantdifference. More than 70% of NT users were trained
in herbicide use, weed management, and planting;31% were trained in residue management, and 35%in fertilizer use. The proportion of NT users trainedin soil management, rotation planning, certified seeduse, and organic matter use is very low (less than10% for each category). These categories reflect theemphasis of past research efforts. Based oninternational experience with no-till, it seemsreasonable to conclude that increasing thesustainability of the no-till package will requirebroadening the research and training portfolio.
Only 48% of NT users belong to a no-till discussiongroup. Seventy-two percent of those who abandonedNT do not belong to any discussion group and mayfind it hard to get advice on the use of thetechnology. In South America, stable discussiongroups have been very effective in helping farmerssolve problems with no-till (Ekboir, 2000).
Farmers Who Used No-TillThe vast majority of NT users (84%) practicecontinuous no-till, which is recommended to reaplong-term economic and environmental benefits. Thelongest period of uninterrupted use of no-till was 10years. Most farmers used no-till uninterruptedly for 3to 6 years. Seventy-five percent practiced no-tillduring both major and minor seasons, and 9% ofusers practiced no-till during one cropping season(because the rainfall pattern allows only one season).Only 16% of farmers used no-till once in two seasons.
The number of farmers who do not use no-tillcontinuously because they are learning is very low(4%), indicating that they do not have majorproblems finding information and advice on no-till.However, 30% of NT users reported that they haveproblems controlling weeds and occasionally revertto slash and burn.
Forty-three percent of NT users do not use no-till onall their land. Of these, 11% mentioned that no-till isnot good for some crops, indicating that research onno-till has concentrated on a few crops such as maizeand cowpea. To expand the use of continuous no-tillthere is a need to broaden research to other crops.Twenty-two percent of farmers also mentionedfinancial restrictions to expansion of no-till.
Compared to other countries, in Ghana, the no-tillpackage represented a less dramatic change fromconventional agricultural practices. This explainswhy 65% of NT users reported that it was not
Table 18. Results of first no-till experience among NT usersand those who abandoned NT, Forest, Transition, and GuineaSavannah Zones, Ghana (% farmers).
First no-tillexperience NT users Abandoned NT DifferenceWeed management
Herbicide 43 21 SManually 47 50Herbicide and manually 10 29
What was the result of the first trial?Excellent 74 39 SVery good 23 28Good 3 17Fair 0 16Bad 0 0
Note: NS = not significant; S = significant at the 95% confidence level.

18
difficult to gain command of the package; 77%realized benefits in the first season and 94% withintwo seasons (Table 19).
Table 19. Number of seasons it took NT users to noticebenefits of no-till, Forest, Transition, and Guinea SavannahZones, Ghana (% farmers).
Seasons NT users Cumulative
One 77 77Two 17 94Three 2 96More than three 4 100
No-till users were also asked about problemsassociated with no-till (Table 20). Learning somethingtotally different from what they used to do wasmentioned by 88% of farmers; however, only 31%found learning the package difficult. This differenceindicates a divergence between the a-prioriperception of the difficulty of the package and theactual degree of complexity, which can be reducedwith information programs.
It is usually claimed that small-scale farmers spendmore money on commercial inputs with no-till thanconventional tillage. However, only 33% of NT usersmentioned this as a problem. As will be seen later, alarge proportion of farmers contract several tasks andno-till greatly reduces labor requirements for manyof these operations. In other words, for most NTusers in Ghana, no-till changes the inputs that haveto be purchased (substitutes herbicides for labor) andresults in lower expenses per unit of land.
No-till users’ responses to problems they faced withno-till confirm earlier findings. The biggestagricultural problems are planting (28%) and plantsurvival (24%). These problems could be greatlyreduced with the introduction of planters.
Table 20. Opinions of NT users on problems with no-till,Forest, Transition, and Guinea Savannah Zones, Ghana (%farmers).
Problem Strongly agree
Different from what we used to do 88Difficult to learn the package 31I have to buy more inputs 33No-till works in other fields but not mine 10Planting is difficult 28Difficult to keep soil covered 11Difficult to manage herbicides 20Fewer plants survive 24
In general, innovative abilities are found in only aminority of individuals, and Ghanaian farmers areno exception; only 10% of NT users admittedmodifying the recommended package. All tried toreduce the dosage of herbicide. The fact that thesefarmers only tried alternative dosages for herbicidesreflects two facts; first, that herbicides are a majorexpense and farmers are trying to save on this, andsecond, even though there are other tasks wherefarmers could save labor (e.g., slashing) or improveyields (e.g., planting), they have not been exposed tosolutions developed in other countries.
Farmers tend to stay on the same plot for severalyears (Table 21), thus allowing for the attainment oflong-term no-till benefits. Eighty-three percent of NTusers who rent land did not have problems renewingtheir lease after adopting no-till.
Table 21. Number of years NT users stay on the same plot,Forest, Transition, and Guinea Savannah Zones, Ghana.
Years on the Length ofsame plot contract
Years (frequency) Percentage (frequency) Percentage
1 5 15 5 192 6 18 3 113 9 25 5 194 4 12 2 85 3 9 5 196 0 0 1 47 1 3 0 09 1 3 0 0
10 3 9 2 815 0 0 1 420 1 3 2 830 1 3 0 0
Agricultural practicesMore than 80% of NT users follow the recommendedno-till package. Seventy-five percent controlledweeds with glyphosate before planting, while 5%controlled weeds by hand; 16% usedalachlor+atrazine, indicating a lack of knowledgeabout herbicide use (Table 22). After planting, 44% offarmers controlled weeds by hand, while 39% usedatrazine or alachlor-atrazine. The proportion NTusers using only atrazine is slightly higher thanalachlor-atrazine. If weeds are sparse, farmers cancontrol weeds with only one application usingglyphosate or glyphosate + alachlor-atrazine oratrazine immediately after planting; this practice wasused by 12% of NT users.

19
Table 22. Pre- and post-planting weed control methods of NTusers, Forest, Transition, and Guinea Savannah Zones, Ghana(% farmers).
FarmersMethod Pre-planting Post-planting
Glyphosate 75 9Alachlor-atrazine 16 18Manual 5 44Slash/burn 3 0Mechanically with tractor 1 1Atrazine 0 21Paraquat 0 4Glyphosate + alachlor-atrazine 0 3
Most farmers (70%) used less glyphosate thanrecommended by researchers (3 l/ha); a largeproportion used 1.8 l/ha and 2.5 l/ha (Table 23). Thisis because farmers use a milk tin of 180 ml perknapsack of 15-liter capacity (150 liters spray volumeper ha) as a unit of measurement. One milk tinresults in using 1.8 liters of herbicide per hectare, and1.5 tins result in 2.5 liters per hectare. Most farmersuse less herbicide than the recommended dosebecause weed control becomes easier the longer no-till is used. Thus, the dose actually needed byfarmers who have been using no-till for a few yearsmay be lower than the recommended one. Furtherresearch on this topic is needed.
Table 23. Glyphosate dose used by NT users for pre-planting,Forest, Transition, and Guinea Savannah Zones, Ghan.
Glyphosate dose (l/ha) Farmers applying dose (%)
<1.8 161.8 23>1.8, but <2.5 72.5 243 (recommended) 4>3 7
The most prevalent weeds are grasses, which 86% offarmers reported controlling. Even though broad-leafweeds are present, they are not a major problem.Only 14% of farmers reported that they had tocontrol them.
Farmers also followed other recommended no-tillpractices. For example, 87% of farmers sprayed at therecommended weed height of about 40 cm and useda clean water source (Table 24).
Table 24. Other no-till recommended practices adopted by NTusers, Forest, Transition, and Guinea Savannah Zones, Ghana(% farmers).
Recommended practice Farmers adopting
Weed height 87Water quality 87Spraying technique 80
Eighty percent of farmers keep the soil adequatelycovered at planting but 37% do not have adequatecover at flowering because residues decompose toofast. Many farmers (45%) add some organic matter.Problems caused by the rapid decomposition ofresidues could be solved by adequate research toidentify acceptable rotations or new plant varietiesthat decompose less rapidly.
Low animal density and lack of draft animals aidedthe dissemination of no-till in Ghana. There were nocomplaints about animals eating stubble because,unlike other countries, demand for plant residues forlivestock in Ghana is small. Finally, burning byneighbors also was not a problem for the vastmajority of NT users in the sample.
Sixty-seven percent of NT users reported seeing achange in weed species after a few years of using no-till; weed control was actually easier for 70% of NTusers. They reported no increase in pest pressure interms of quantities and/or species (Table 25).Actually, 57% of users found pest control easierunder no-till.
Table 25. Pest pressure observed by NT users, Forest,Transition, and Guinea Savannah Zones, Ghana (% farmers).
Pest pressure: Farmers
Sees more pests of the same type as before adopting 16Sees different pests today 20
Most NT users in the Peri-urban (100%), Transition(69%) and Guinea Savanna (100%) used fertilizer.Only 30% used it in the Forest area because of greaterfertility in the area. The Peri-urban area has similarecology to the Forest area but the land is used moreintensively and replenishment of nutrients is needed(Table 26).

20
Table 26. Fertilizer application in no-till fields, Forest,Transition, and Guinea Savannah Zones, Ghana (% farmers).
Ecology Farmers using fertilizer
Forest 30Peri-urban 100Transition 69Guinea Savannah 100All ecological zones 49
Most NT users (78%) did not change the crops theyplanted with adoption of no-till. Only 30% usedrotations. The most common rotations are maize-cowpea (20%) and maize-cassava (9%). Only onefarmer (1%) used maize-tomato. These practicesreflect lack of market opportunities, lack of adequatetechnologies that fit into current production patterns,or lack of information channels that permit farmersto learn about new crops. Adequate research andextension programs can solve some of theseproblems and increase the impact of no-till.
Farmers Who Used and Abandoned No-TillWhen a farmer switches to no-till, the dynamics ofthe agricultural system adjust to the newmanagement practices. In particular, weedpopulations and soil, flora, and fauna changedramatically. It generally takes three years for thesechanges to occur before a major response is requiredby the farmer. If the farmer succeeds in adjusting theno-till practices to the new environment, he or shewill be able to continue using it. Some farmers,however, never succeed in finding the appropriatepractices and revert to conventional tillage.
Farmers in the sample who tried no-till and thenabandoned it used it for a mean of 3.1 years. One-third of them used the technology for four yearsbefore abandoning it, while only 17% abandoned it inthe first year (Table 27).
Table 27. Number of farmers who used no-till beforeabandoning the practice, Forest, Transition, and GuineasSavannah Zones, Ghana.
Years farmers practiced Percentage of farmersno-till before abandoning it who abandoned NT
1 172 283 114 335 67 5Mean (yr) 3.1
Poor access to adequate contract planting (notavailable on time or too expensive) was the mainreason for reverting to slash and burn for 56% offarmers in this group; 6% mentioned that the soil wastoo compact; and 23% had problems understandingthe package (could not control weeds, receivedinadequate advice, or required additional work). Onefarmer (6%) mentioned that no-till did not work onhis soil. These reasons reinforce a previous findingthat planting is the major technical problem faced byGhanaian farmers who wish to use no-till.
When asked what they required to use no-till again,78% mentioned financial support and 22% cheaperherbicides. However, when asked why they used no-till occasionally, only 5 out of 18 farmers (28%)mentioned lack of cash as a problem. The restmentioned technical problems. As seen earlier,financing seems to be a problem for about 25% offarmers.
Access to technical advice is not a problem for 83% ofthese farmers. Seventy-seven percent had access toresearchers or extension agents and 11% to otherfarmers.
Farmers Who Never Used No-TillMore than half (56%) of farmers who never used no-till knew about the technology. Some (41%) heardabout the technology from other farmers. Only 8%heard about it from a researcher or extension agent(Table 28).
Table 28. Information sources about no-till among farmerswho never used NT, Forest, Transition, and Guinea SavannahZones, Ghana.
Information source Frequency Percentage
Neighbor 7 18.9Relative 3 8.1Another farmer 5 13.5Herbicide seller 1 2.7Research/extension 3 8.1Field day 1 2.7Not applicable 17 45.9
Most farmers who never tried no-till learned aboutthe technology in the same year that the number ofdemonstration plots was highest. However, only onefarmer mentioned going to a field day. Thecorrelation between the number of demonstrationplots and the year in which farmers learned about

21
the technology shows that extension efforts had amultiplier effect. In other words, farmers who neverused NT heard about it from neighbors whoprobably visited a demonstration plot.
The main reasons mentioned by these farmers for notusing no-till were economic - either that herbicidewas too expensive or more cash was requiredcompared with current practices (Table 29). About30% mentioned difficulties in contracting planting orspraying. This reason was also important for farmerswho had abandoned NT. The complexity of thetechnology and lack of access to technical advicewere important for about one-third of respondents inthis category. This strengthens the idea that thesefarmers are less innovative than the other groups.The fact that technical issues are not ranked as veryimportant reflects lack of practice with thetechnology.
Seventy-six percent of farmers who never used no-tillvisited farmers who used no-till and 73% had accessto technical advice. Exposure to the technology istherefore not a problem. Also, concerns aboutneighbors’ opinion of the appearance of no-till fieldsrelative to clean fields was not an issue for 84% ofthese farmers.
Agrochemicals Markets
One of the key findings of this research was theidentification of two complementary groups ofsuppliers (extension/research agents and formaldealers). This report only examines the impact of no-
till on formal dealers, because the importance ofextension/research agents was only discovered fromthe analysis of farmers’ responses.
As mentioned earlier, markets for inputs are not wellintegrated. Only 29% of dealers knew prices ofherbicides in Accra and 57% knew the prices in othervillages, a share substantially smaller than that of no-till farmers. Knowledge of local markets is highlycorrelated with the size of business; dealers withmore than three employees were more aware ofprices in neighboring villages than dealers with lessthan four employees. However, there is no clearassociation between knowledge of prices in Accraand the number of employees. This pattern ofinformation dissemination indicates high transactioncosts.
Most dealers are close to a distributor; 61% travel 30km or less and 68% travel less than 100 km to pick upsupplies. There is no correlation between distance tosuppliers, the size of business or agroecological zone.In other words, dealers buy from the same suppliersirrespective of size or location.
Only 64% of dealers said herbicides are easilyavailable when needed, a proportion similar tofarmers. A similar percentage has supplies deliveredto them. Other inputs that are easily available areseeds and fertilizers: 75% of the dealers indicatedthat seeds and fertilizers are available when needed.
Only 11% of dealers receive credit from commercialbanks and 21% from suppliers. On the other hand,57% provide credit to selected farmers.
Table 29. Reasons for not using no-till among farmers who never used NT, Forest, Transition, and Guinea Savannah Zones,Ghana (% farmers).
Reason: Very important Important Not important Not applicable
Cannot control weeds 16 3 35 46The herbicide is too expensive 49 2 3 46Do not have access to timely contract planting or it is too expensive 27 3 24 46Cannot maintain the soil covered 16 5 32 47Knapsack sprayer not available 22 5 27 46Cannot manage residues properly 13 8 30 49Cannot control pests 19 3 32 46Soil is too compact 14 6 30 50Too difficult 19 11 24 46Cannot get adequate advice 19 14 19 48Requires additional work 14 5 32 49Does not work on soil 8 8 32 52Not good for the crops I grow 14 8 30 48Requires more cash than I normally invest 32 5 14 49
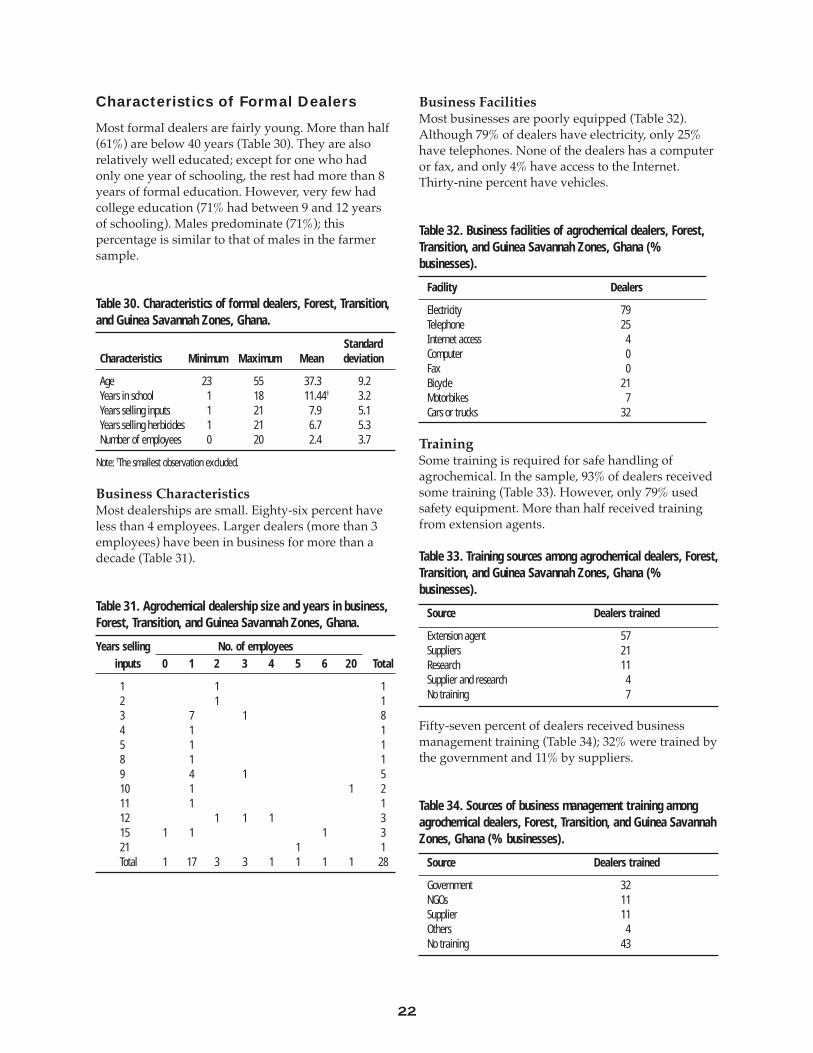
22
Characteristics of Formal Dealers
Most formal dealers are fairly young. More than half(61%) are below 40 years (Table 30). They are alsorelatively well educated; except for one who hadonly one year of schooling, the rest had more than 8years of formal education. However, very few hadcollege education (71% had between 9 and 12 yearsof schooling). Males predominate (71%); thispercentage is similar to that of males in the farmersample.
Table 30. Characteristics of formal dealers, Forest, Transition,and Guinea Savannah Zones, Ghana.
StandardCharacteristics Minimum Maximum Mean deviation
Age 23 55 37.3 9.2Years in school 1 18 11.44† 3.2Years selling inputs 1 21 7.9 5.1Years selling herbicides 1 21 6.7 5.3Number of employees 0 20 2.4 3.7
Note: †The smallest observation excluded.
Business CharacteristicsMost dealerships are small. Eighty-six percent haveless than 4 employees. Larger dealers (more than 3employees) have been in business for more than adecade (Table 31).
Table 31. Agrochemical dealership size and years in business,Forest, Transition, and Guinea Savannah Zones, Ghana.
Years selling No. of employeesinputs 0 1 2 3 4 5 6 20 Total
1 1 12 1 13 7 1 84 1 15 1 18 1 19 4 1 510 1 1 211 1 112 1 1 1 315 1 1 1 321 1 1Total 1 17 3 3 1 1 1 1 28
Business FacilitiesMost businesses are poorly equipped (Table 32).Although 79% of dealers have electricity, only 25%have telephones. None of the dealers has a computeror fax, and only 4% have access to the Internet.Thirty-nine percent have vehicles.
Table 32. Business facilities of agrochemical dealers, Forest,Transition, and Guinea Savannah Zones, Ghana (%businesses).
Facility Dealers
Electricity 79Telephone 25Internet access 4Computer 0Fax 0Bicycle 21Motorbikes 7Cars or trucks 32
TrainingSome training is required for safe handling ofagrochemical. In the sample, 93% of dealers receivedsome training (Table 33). However, only 79% usedsafety equipment. More than half received trainingfrom extension agents.
Table 33. Training sources among agrochemical dealers, Forest,Transition, and Guinea Savannah Zones, Ghana (%businesses).
Source Dealers trained
Extension agent 57Suppliers 21Research 11Supplier and research 4No training 7
Fifty-seven percent of dealers received businessmanagement training (Table 34); 32% were trained bythe government and 11% by suppliers.
Table 34. Sources of business management training amongagrochemical dealers, Forest, Transition, and Guinea SavannahZones, Ghana (% businesses).
Source Dealers trained
Government 32NGOs 11Supplier 11Others 4No training 43

23
Even though all dealers offered some training to theircustomers, only 43% organized field days todemonstrate the use and effect of herbicides.
Dealers’ Perception of No-Till UseAmong Farmers
When dealers were asked about the number offarmers using no-till in the village, 89% sawincreases, 7% could not tell and 4% said it wasdecreasing (Table 35).
Table 35. Agrochemical dealers’ perception of number offarmers using no-till, Forest, Transition, and Guinea SavannahZones, Ghana.
Dealers response: % indicating
Most 39Several 50Few 4None 4Cannot tell 3
The majority of dealers said that few farmers own aknapsack; most farmers either rent sprayers orcontract herbicide application (Table 36).
Table 36. Farmers’ who own, rent or contract sprayingaccording to agrochemical dealers, Forest, Transition, andGuinea Savannah Zones, Ghana (% businesses).
Dealers’ Own sprayers Rent Contractresponse and spray sprayers spraying
Most 7 32 14Several 32 36 39Few 47 21 25None/ Don’t know 14 11 22
Sixty-four percent of dealers mentioned that farmerswho spray have average wealth, while 14% thinkthese farmers are rich, 7% believe they are poor, and14% cannot tell.
Seventy-nine percent of dealers think that farmerswho spray have increased their income, 18% cannottell, and 4% said farmers did not have larger income.Also, 86% of dealers said that farmers who adoptedno-till have more food than before.
Maize was the most frequently mentioned cropunder no till by dealers (68%); vegetables (14%) andrice (11%) were other crops mentioned.
As indicated in Table 37, most dealers think that thedemand for herbicides is moderately responsive toprices.
Table 37. Expected response of demand for herbicides to pricechanges, Forest, Transition, and Guinea Savannah Zones,Ghana.
Percentage Percentage decrease in salesprice increase (Mean) (Minimum) (Maximum)
10 8 0 5025 23 0 7050 41 0 90
Impacts of No-Till on Farmers
As stated earlier, it was not possible to estimate theextent of adoption because of limited resources. Forthis reason, the sample was directed specifically tousers of no-till. Additionally, since there is no priorinformation on distribution of several importantvariables (e.g., wealth or land tenure) among farmersin the survey zones, it was not possible to assesswhether the sample is representative and,consequently, to make inferences about populationparameters. When no-till was introduced in Ghana,no baseline survey was conducted to collect data onthe target population. Without such benchmarkinformation, it is impossible to make a quantitativeestimate of the technology’s impact. However, it waspossible to obtain qualitative assessments for mostimpacts and a quantitative estimate on labor savings.This estimate, though, should be considered a roughapproximation of the true impact of no-till andcannot be used to make inferences about its impacton all Ghanaian farmers using the technology.Despite these limitations, the survey enabledidentification of important impacts of no-till onseveral aspects of adopters’ lives: quality of life,income, maize yields, input markets, occupationpatterns, and use of labor.
The most important impact of no-till on small-scalefarmers is the reduction in the amount of labor perunit of agricultural output. Farmers used this extratime to undertake other activities while stillproducing the same amount of food as they didbefore adopting no-till. These activities resulted inhigher income and higher standards of living.

24
Labor SavingsThe reduction in male family labor after adopting no-till was 31%; reductions in female and child familylabor were not statistically significant (Table 38). Theoverall family labor savings is 27%. The reason forthe difference in male and female and child laborsavings is that no-till simplified tasks usuallyreserved for men, such as land preparation(including slashing and burning), planting, andchemical weed control.
Table 38. Average number of family members who work inno-till fields, Forest, Transition, and Guinea Savannah Zones,Ghana.
Activity Adult males Adult females Children Total
Before adopting no-till 3.6 1.8 1.9 7.3After adopting no-till 2.5 1.6 1.6 5.3Difference (%) 31 11 16 27Significance Significant Not significant Not significant
No-till reduced labor requirements for landpreparation and planting by 22% and laborrequirements for weed control by 51%, from anaverage of 8.8 man-days/ha to 4.3 man-days/ha(Table 39). There was a slight increase in laborrequirements for harvest from 7.6 man-days /ha to8.6 man-days /ha as a consequence of higher yieldsunder no-till.
Work should not be measured only in hours but inthe effort required to complete a particular task. Forexample, with traditional techniques, farmers have towalk bent over 10 km to weed one hectare of land. Toweed with no-till, they only walk 6.7 km in anupright position. Less physical effort increasesfarmers’ ability to start new activities and results in ahigher quality of life. Ninety-nine percent of NTusers reported that with no-till agricultural work wasless physically demanding; the same percentage saidthat it reduced labor requirements in criticalmoments, thus simplifying labor management.
In short, no-till reduced the labor and effort requiredto perform the same tasks and simplified labormanagement. The introduction of simple technolo-gies used in other countries (e.g., knife-roller or jabplanter) could increase these impacts substantially.
Impact on Agricultural PracticesFarmers were asked an open-ended question on thethree most important changes that no-till brought tofarming activities (Table 40). A majority of farmersmentioned reduced cash and labor investment andhigher yields; other important impacts were easierweed control and saving in time. Less frequentlymentioned were farm expansion and improved soilfertility.
Farmers were also asked whether they agreed ordisagreed with a list of statements about the benefitsof no-till (Table 41). A majority of farmers indicatedthat no-till increased production, reduced costs,reduced risk in bad years, and facilitated agriculturalproduction. In particular, 67% of NT users reported achange in weed and pest species after adoption, and70% found controlling new weeds easier. Pest controlwas also reported to be easier for 57% of NT users.
Normal maize yields were 16% higher for NT userscompared to farmers who abandoned NT and 45%higher than farmers who never used NT. The yielddifferences in 2000, a dry season, were 38% and 48%,respectively. This means that the yield reductioncaused by drought was 24% for NT users, 36% forthose who abandoned NT, and 30% for farmers whonever used NT. In other words, no-till reduced thewater stress of maize plants.
Three risk factors are reduced with no-till: soilcovered with mulch has greater water availability indry years; the reduced turnaround time betweenharvesting one crop and planting another permitsplanting the second crop closer to the optimal date;and the presence of a larger number of beneficial
Table 39. Average man-days/ha required for selected farming activities before and after adopting no-till,Forest, Transition, and Guinea Savannah Zones, Ghana.
Farming activities (man-days/ha)Activity Land preparation and planting In-crop weeding Harvesting Total
Before adopting no-till 9.4 8.8 7.6 25.8After adopting no-till 7.3 4.3 8.6 20.2Difference (%) 22 51 -13 22Significance S S S S
Note: S = significant

25
insects facilitates pest control. When asked if theystill get something in bad years, 84% of NT usersresponded affirmatively. Reduction of the downsiderisk is especially important for small-scale farmerswith little savings to weather a bad harvest.
Sixty-nine percent of farmers who used NT and 72%of farmers who abandoned NT expanded theirfarming area compared to 30% of farmers who neverused NT. Even though most farmers indicated thatno-till allows work on more land, in this case theexpansion seems to be linked to the fact that NTusers and those who abandoned NT are moreinnovative than farmers who never used NT. Moreresearch is needed to understand this phenomenon.
Impact on FamiliesAs in the previous section, farmers were asked aboutthe three most important changes that no-till broughtto their families (Table 42).
Table 42. Impact of no-till on families, Forest, Transition, andGuinea Savannah Zones, Ghana.
Change Percentage of farmers affected†
Increased income 87More time for other activities 48Increased food availability 51Reduced labor and effort 43Reduced child labor 5Financially independent 8Farm expansion 7Built house/ acquired building plot 6Prompt payment of school fees 19Purchase home appliances 10Purchase milling machine 3Improved health 3
Note: †Percentages do not add to 100% because of multiple answers.
A majority of farmers (87%) reported higher incomes.Other important changes were increased foodavailability, more time for other activities, andreduced labor and effort. Nineteen percent of farmersmentioned the ability to promptly pay school fees,thus securing their children’s education.
No-till users who reported new activities wererequested to mention them (Table 43). Eighty- threepercent of respondents started other income-generating activities, mostly other farm activities ortrading.
Table 43. New activities resulting from the use of no-till,Forest, Transition, and Guinea Savannah Zones, Ghana (%farmers).
Activity Farmers
Trading 35Other farm activities 38Leisure/rest 8Livestock/poultry 4Time to preach 6Transport 2Oil/gari processing 4Household chores 2
Table 40. Most important changes that no-till brought tofarming activities, Forest, Transition, and Guinea SavannahZones, Ghana.
Percentage of farmers whoChange mentioned this effect†
Good crop growth 15Less cash and labor investment 69Easier weed control 41Time saving 32More income 19Higher yields 62More crops grown 7New or expanded farm 18Increased soil fertility 18New knowledge 4Stopped burning farm 6Increased interest in farming 5Now plant in lines 5
Note: †Total percentage is more than 100% because of multiple answers.
Table 41. NT users’ responses about benefits of no-till, Forest,Transition, and Guinea Savannah Zones, Ghana (% farmers).
Benefits of no-till: Agree
Makes it possible to expand planted area 94In bad years, I still get something 84Reduces soil erosion 87Improves soil water availability for the plant 99Reduces need to use fertilizer 87Improves soil structure 89Reduces time between harvest and planting next crop 80Facilitates weed control 96Facilitates pests control 97Yields are less affected by late or early planting 80Increases yields 99Reduces production costs 97

26
No-Till Impact on AgrochemicalMarket
The data gathered indicates that formal dealers andresearch/extension agents provide different services.Formal dealers are generally located in larger cities(especially district capitals) and are often beyond thereach of many small-scale farmers who do not havethe means or do not find it worthwhile to travel longdistances to buy small volumes of herbicides.Farmers’ lack of credit and atomized demand alsomake it unprofitable for formal dealers to openbranches in villages.
On the other hand, research/extension agents are incontact with both farmers and formal dealers.Anecdotal evidence indicates that in the early years ofno-till development some farmers gave money toextension agents to buy herbicide for them.Eventually, some extension agents started to trade inherbicides on their own. In short, extension/researchagents occupy a market niche created by the atomizeddemand and relatively high transportation costs.
Unlike formal dealers, extension/research agents alsooffer technical advice and training. On the other hand,formal dealers offer a larger range of products,especially safety equipment. Understanding theinteractions between these two marketing channels iscrucial to increase the efficiency of input markets. Thecrucial issues that should be analyzed further are:What is the profitability of each segment? What is theefficiency of each segment? What type of relationshipsthese segments establish with their suppliers, inparticular, wholesalers and financial institutions?How can transaction costs in the herbicide market bereduced?
Growth and Sale of Agricultural InputsFigures 3 and 4 show that the market for commercialagricultural inputs has grown in the last five years. Inthat period, 12 dealers (43%) started operations; 8dealers opened for business 3 years ago. Theexpansion of the herbicide trade is even morestriking; 61% of dealers started selling herbicidesafter 1996. In other words, a number of input dealerswith many years in the business started to sellherbicides only recently.
Even though no data on the profitability of sales ofagricultural inputs and herbicides are available, thehigh increase in the number of dealers indicates anexpanding market.
The expansion of the herbicide market is illustratedby sales performance. Compared to three years ago,57% of dealers doubled the amount of herbicidesthey sold each year, 7% tripled it and 14% increasedit by 50% (Table 44).
Table 44. Change in herbicide sales compared with three yearsago, Forest, Transition, and Guinea Savannah Zones, Ghana.
Change Percentage
Same 11Increased 50% 14Doubled 57Tripled or more 7Decreased 11
Figure 3. Years in input market, Forest, Transition, andGuinea Savannah Zones, Ghana.
Figure 4. Years in the herbicide market, Forest, Transition,and Guinea Savannah Zones, Ghana.
Years selling inputs20.017.515.012.510.07.55.02.50.0
No. o
f dea
lers
10
8
6
4
2
0
Std. Dev = 5.08Mean = 7.9N = 28.00
Std. Dev = 5.27Mean = 6.7N = 28.00
Years selling herbicides20.017.515.012.510.07.55.02.50.0
No. o
f dea
lers
10
12
8
6
4
2
0

27
The expansion of the input market is not confined toherbicides. Most dealers (82%) reported that theyexpanded the range of inputs sold (Table 45).
Table 45. Changes in the range of inputs sold, Forest,Transition, and Guinea Savannah Zones, Ghana.
Change Percentage
Now sell more 82Same 7Sell less 11
In 2000, herbicides were the first or second line ofproduct sold by 96% of dealers (Table 46). Seeds,pesticides, and fertilizers were less important.Veterinary products and tools were less common.
Table 46. Product lines sold by formal dealers, Forest,Transition, and Guinea Savannah Zones, Ghana, 2000.
Dealers selling (%)Product 1st line 2nd line 3rd line 4th line 5th line 6th line
Herbicides 46 50 0 0 0 0Seeds 43 21 11 7 4 0Pesticides 4 11 43 29 7 0Fertilizers 7 14 18 39 14 11Knapsacks 0 4 21 4 7 0Veterinary products 0 0 0 0 7 0Tools 0 0 0 0 7 7Other products 0 0 0 0 4 0Not applicable 0 0 7 14 54 79
Dealers who have been longer in the business sell amore diversified range of products. Less than half ofthe dealers sell protective materials; 75% of thoseselling protective materials have been in the businessfor more than 8 years. More than half of the dealers
who sell knapsacks (55%) mentioned that sales ofthese implements are increasing.
The major wholesalers of agricultural inputs areKumasi (Kajetia) Input Dealers, Dizengof, and Sefa &Jane Agro Company. The wholesale trade is veryconcentrated. Seventy-five percent of dealers buyfrom these three firms (Table 47).
Sale of Herbicide TypesIn the beginning of no-till dissemination efforts,farmers were advised to buy Roundup in sachetsbecause they contained the exact amount required fora knapsack, even though it was more expensive thanother presentations. As farmers became morefamiliar with no-till, they switched from sachets tothe cheaper liquid presentation. At the time of thesurvey, 71% of dealers mentioned that thepresentation they sold most was the 1-liter form; only29% mentioned the sachet. The proportions in 1997were 61% for the 1-liter and 36% for the sachet.
This pattern of starting with a sachet and thenswitching to liquid presentations seems to continuetoday. Dealers in the Guinea Savannah (the lastregion where no-till was introduced) reported thatsachets are still the most sold presentation, while inregions where farmers have been practicing no-tilllonger the 1-liter form is most sold. In addition tochanging the presentation they prefer, individualfarmers are buying more herbicides, as reported by79% of dealers.
Roundup is the most important herbicide for 71% ofdealers, reflecting its key role in the no-till package(Table 48).
Table 48. Herbicides sold by dealers, Forest, Transition, andGuinea Savannah Zones, Ghana (% dealers).
DealersHerbicide 1st 2nd 3rd
Roundup 71 14 0Atrazine 11 46 18Rilof 11 4 4Calliherbe 4 4 7Propanil 4 4 0Gramoxone 0 11 25Lasso + Atrazine 0 7 7Stomp 0 7 0Cottonex 0 0 7Chemocide 0 0 7Satunil 0 0 11Not applicable 0 4 14
Table 47. Dealers’ suppliers of agricultural inputs, Forest,Transition, and Guinea Savannah Zones, Ghana.
Supplier Dealers (%)
Kumasi (Kajetia) Input Dealers 43Dizengof 18Sefa & Jane 11Chemico 7Kusiwaa Agro-chemicals 4Wienco 4Techiman market 4Ministry of Agriculture (MOFA) 4Ivory Coast 4Togo 4

28
Conclusion
Adoption of no-till (estimated in 2000 at 100,000small-scale farmers on 45,000 ha) was facilitated bythe low-input agricultural practices prevalent in thethree study zones in Ghana, and the fact that fewfarmers have animals (other than a few chickens).Limited livestock production has prevented thecreation of a market for crop residues, allowingfarmers to maintain proper soil cover at planting. Inaddition, there was no need for no-till planters, anissue that was a major obstacle in other countrieswhere no-till was introduced, because planting istraditionally done with a stick or cutlass. The lack ofplanters, however, prevented most large-scalecommercial farmers from switching fromconventional till to no-till. This feature of theGhanaian experience is unique, because in othercountries, large-scale farmers were the first todevelop and adopt the technology.
In general, no differences were found between maleand female farmers in wealth, access to technicaladvice, and agricultural practices. However, onaverage, women farmed about half the area as men,obtained lower maize yields, and were less inclinedto try new things on their fields. These differencescan be explained by the fact that more women havenonagricultural occupations and tend to be part-timefarmers. They go to the fields later in the day and thisaffects the efficiency of some agricultural practices(like spraying) that should be done early in themorning.
Farmers who used no-till applied the packagerecommended by research/extension agents and didnot change the crops they grew after no-till. This mayreflect lack of market opportunities, lack of adequatetechnologies that fit into current production patterns,or inadequate information channels that permitfarmers to learn about new crops. Adequate researchand extension programs can solve some of theseproblems and increase the impact of no-till.
There were active markets for agricultural services.Almost half of all farmers contracted planting orrented a knapsack sprayer. More than half of farmerswho never used no-till and a quarter of no-till userssaid economic considerations were a restriction tousing agricultural services. Difficulties in findingwell-trained contractors for planting or spraying aswell as understanding the package were alsomentioned. Training contractors in no-till canimprove the performance of these markets.
No-till had many important impacts on the lives ofadopters. These impacts can be categorized into twogroups: agricultural practices and quality of life.
Impacts on agricultural practicesAmong the important changes that no-till brought tofarming activities, farmers mentioned reducedinvestment in cash and labor, higher yields, easierweed and pest control, and saved time for farmers.Less frequently mentioned changes were farmexpansion and improved soil fertility.
Overall family labor was reduced by one third.Reductions in female and child family labor,however, were not significant because no-tillsimplified tasks usually reserved for men: landpreparation, planting, and chemical weed control.
A majority of no-till users also reported that lesseffort was required for agricultural tasks. No-till alsoreduced labor requirements in critical times,simplifying labor management. The reduction inlabor requirements more than compensated the costof herbicide, resulting in reduced production cost.Cost reduction combined with higher yieldsincreased the profitability of grain production.
In both normal years and dry years, as was the casein 2000, maize yields obtained by no-till farmers werehigher than those obtained by farmers whoabandoned no-till, and by farmers who never usedthe technology. No-till also reduced agricultural risk:most no-till farmers said they still received somethingin bad years. The reasons for the better resultsobtained with no till are: soils covered with mulchconserve more water in dry years, the reducedturnaround time permits planting the second cropcloser to the optimal date, and the presence of alarger number of beneficial insects facilitates pestcontrol. Reduction of downside risk is especiallyimportant for small-scale farmers with little savingsto weather a bad harvest.
Although most users of no-till used it continuously,almost half did not use it on all their land. Among thereasons mentioned for this were cash restrictions andthat no-till is not good for some crops. The latterindicates that research on no-till has concentrated ona small number of crops.
Most users reported a change in weed species andeasier weed control. There was no increase in pestpressure in terms of population and species. Actually,more than half found pest control easier under no-till.

29
Impacts on quality of lifeNo-till users reported higher incomes, increased foodavailability, and more time for other activities becauseof the technology. Many started other incomegenerating farm activities or trading. Some farmersalso mentioned the ability to promptly pay schoolfees, thus securing their children’s education.
The increase in the purchase of commercial inputswas not a problem for most users. A large proportionof farmers contracted several tasks and no-tillreduced labor requirements for these operations. Inother words, for most users, no-till changed theinputs that had to be purchased (substitutedherbicides for labor) and resulted in lower expenseper unit of land.
A characteristic of no-till is that the agriculturalsystem has a higher level of biological activity. Thismore dynamic system facilitates weed and pestcontrol as beneficial insects and plants are allowed toproliferate. Inadequate management, however, mayalso facilitate the appearance of new weeds and pests.
Further development of the no-till package in Ghanaand its sustainability will depend on further research,particularly in three areas:
1) adequate machinery, to reduce labor requirementsfor small-scale farmers (increasing the profitabilityof the system) and make the system adequate forlarge-scale mechanized farmers; major savings canbe made in slashing (probably with theintroduction of the knife-roller), planting(including planters for manual, draft power, andmechanized planting) and spraying (with theintroduction of multiline sprayers);
2) crop rotations (including cover crops) to improve soilcover at flowering, increase fertility, ease weedcontrol, and reduce the potential for the buildupof aggressive weeds and pests; and
3) dynamics of diseases and weed and pest populations toidentify potential threats and develop remediesbefore they become a limiting constraint.
Development of a no-till package for crops thatcurrently can be planted only with conventionaltillage would also broaden the universe of potentialadopters. Many of these needs have already beensolved in other countries; Brazil and Paraguay inparticular have many technologies for small-scalefarmers that could be transferred into Ghana with
minor adaptations. Establishing strong links withresearchers and institutions in other countries is anefficient and cheap way to fill knowledge gaps.
Lastly, the survey showed that while research andextension services have worked efficiently until now,there were indications that the extension effort maybe weakening and that some activities have beenscaled down. New institutional arrangements shouldbe sought to compensate for these changes.
Impacts on agrochemical dealersThere are two complementary marketing channelsfor agrochemicals: research/extension agents andformal dealers. No-till has expanded the market forboth. These two marketing channels offer differentservices but their interactions are not wellunderstood. Further research on the organization andperformance of these markets should be conductedto identify bottlenecks that hamper furtherdissemination of no-till.
The survey of formal dealers showed that more thanhalf are young and relatively well educated. Abouthalf (43%) started operations after 1996; in addition,61% started to sell herbicide after that year. Mostdealers are small operations and have difficulties inobtaining credit and following markets outside theirvillages. Programs to help dealers improve businessmanagement and better infrastructure can reducetransaction costs and help the dissemination of no-till.
References
Akonbundu, I.O. 1987. Weed Science in the Tropics.Principles and Practices. John Wiley and Sons: UK,Chichester.
Boa-Amponsem, F., P. Osei-Bonsu, J. Manu-Aduening, S. Ahiable, M. Descous, T. Asare-Barfour, and B. Appiah-Asante.1998. ConservationTillage in Ghana: The Dissemination of No-TillTechnology Among Small Farmers; Progress toDate and Future Prospects. In: Proceedings of theInternational Workshop on Conservation Tillage forSustainable Agriculture, Harare, Zimbabwe, 22-27June 1998.
Boa-Amponsem, F. 2000. No-till Annual Report.Mimeo. Kumasi, Ghana: CRI
Derpsch, R.1999. Expansión Mundial de la SiembraDirecta y Avances Tecnológicos. Proceeding of the7th National Congress of AAPRESID, Argentina.

30
Ekboir, J.M. 2000. Innovation Systems andTechnology Policy: Zero Tillage in MERCOSUR.Paper presented at the XXIV meeting of theInternational Association of AgriculturalEconomics, Berlin, August 19 – 24, 2000.
Ekboir, J.M. and G. Parellada. 2000. ContinuousComplex Innovation Systems, Public-PrivateInteractions and Technology Policy. Paperpresented at the XXIV meeting of the InternationalAssociation of Agricultural Economics, Berlin,August 19 – 24, 2000.
Findaly, J.B.R. and N.C. Hutchinson.1999.Development of Conservation Tillage in AfricanCountries: A Partnership Approach. In: Breth, S.(ed.). Partnerships for Rural Development in Sub-Saharan Africa. Centre for Applied Studies inInternational Negotiations: Geneva, Switzerland.
GTZ. 1998. Conserving Natural Resources andEnhancing Food Security by Adopting No-tillage.An Assessment of the Potential for Soil-conservingProduction Systems. In: Various Agro-ecologicalZones of Africa. Eschborn, Tropical Ecology SupportProgram, TÖB publication number: TÖB F-5/e:GTZ.
Lal, R. 1985. Tillage systems in the Tropics:Management options and sustainabilityimplications. FAO Soil Bulletin No. 71. FAO: Rome,Italy.
Mensah-Bonsu and H.G. Obeng. 1979. Effects ofcultural practices on soil erosion and maizeproduction in the semi-deciduous rainforest-Savannah transitional zone of Ghana. In GreenlandD.J and Lal R. (eds.). Soil and crop production in theHumid Tropics. John Wiley: Chischester, UK. Pp.509-519.
Morris, M.L., R. Tripp, and A.A. Dankyi. 1999.Adoption and Impacts of Improved Maize ProductionTechnology: A Case Study of the Ghana GrainsDevelopment Project. Economics Program Paper 99-01. Mexico, D.F.: CIMMYT.
Ofori. C.S. 1973. The effects of ploughing andfertilizer application on yield of cassava (Manihotesculenta Grantz). Ghana J. Agric. Sci. 6: 21-24.
Sayre, K.D. 1998. Ensuring the Use of SustainableCrop Management Strategies by Small WheatFarmers in the 21st Century. Wheat Special ReportNo. 48. Mexico, D.F.: CIMMYT.
Wall, P.C. 1998. Pequeñas propiedades y la CeroLabranza, Una Visión General de Avances yLimitaciones. Paper presented at the InternationalCourse on Zero Tillage for Small Farmers, INIA/PROCISUR, Chillan, Chile. 4-8 May.

31
Appendix 1. Location of survey districts and villages, Ghana.
Region Village District Ecological zone
Ashanti Afari Atwima ForestToaseNkaakomAmanchiaAsuoyeboa Kumasi Peri-urbanQuarters Metropolitan
Assembly (KMA) ForestAbrankese-Swedru Bosomtwe-Atwima- ForestBeposo Kwanwoma (BAK)Nkyensedaho Ahafo Ano-SouthNyameadom
Brong Ahafo Goaso zongo Asunafo ForestNkaseim Asutifi ForestDormaaAta –ne-Ata Tano ForestAfrisipakromTanosoSususansoYamfo Wenchi TransitionWenchiAketeOfuman Techiman TransitionNyasuakaBrahoho Nkoranza TransitionNsuatreEsereso Sunyani ForestFiapreDumasua
Northern Gbun Salaga Guinea SavannaBihinayili Savelugu-NantonLanga

32
Appendix 2. Location of dealers’ survey districts and villages, Ghana.
Villages/Towns Dealers interviewed (No.) District District capital
Toase 1 Atwima Nwabiagya Nkawie 2 Atwima Nwabiagya Nkawie Kumasi 8 Kumasi Metropolitan Assembly Kumasi Mankranso 1 Ahafo Ano South Mankranso Biemso I 1 Ahafo Ano North Ampabame 1 Atwima Kwanwoma Asaman 1 Agona Bechem 2 Tano Bechem Tanoso 2 Tano Awisa 1 Wenchi Wenchi Techiman 2 Techiman Techiman Nkoranza 1 Nkoranza Nkoranza Tamale 5 Tamale Municipal Assembly Tamale

ISSN: 1405-7735
Apdo. Postal 6-641, 06600 Mexico, D.F., Mexicowww.cimmyt.org