apache jmeter user manual i
TRANSCRIPT

I
Section List
[Part I]
1. Introduction o 1.1 History o 1.2 The Future
2. Getting Started o 2.1 Requirements
2.1.1 Java Version 2.1.2 Operating Systems
o 2.2 Optional 2.2.1 Java Compiler 2.2.2 SAX XML Parser 2.2.3 Email Support 2.2.4 SSL Encryption 2.2.5 JDBC Driver 2.2.6 Apache SOAP 2.2.7 BeanShell 2.2.8 Libraries for ActiveMQ 3.0
o 2.3 Installation 2.3.1 Downloading the Latest Release 2.3.2 Downloading Nightly Builds
o 2.4 Running JMeter 2.4.1 JMeter's Classpath 2.4.2 Using a Proxy Server 2.4.3 Non-GUI Mode 2.4.4 Distributed Mode 2.4.5 Overriding Properties Via The Command Line 2.4.6 Logging and Error Messages 2.4.7 Full list of command-line options
o 2.5 Configuring JMeter 3. Building a Test Plan
o 3.1 Adding and Removing Elements o 3.2 Loading and Saving Elements o 3.3 Configuring Tree Elements o 3.4 Saving the Test Plan o 3.5 Running a Test Plan o 3.6 Error reporting
4. Elements of a Test Plan o 4.1 Thread Group o 4.2 Controllers
4.2.1 Samplers 4.2.2 Logic Controllers
o 4.3 Listeners

o 4.4 Timers o 4.5 Assertions o 4.6 Configuration Elements o 4.7 Pre-Processor Elements o 4.8 Post-Processor Elements o 4.9 Execution order o 4.10 Scoping Rules o 4.11 Properties and Variables o 4.12 Using Variables to parameterise tests
5. Building a Web Test Plan o 5.1 Adding Users o 5.2 Adding Default HTTP Request Properties o 5.3 Adding Cookie Support o 5.4 Adding HTTP Requests o 5.5 Adding a Listener to View/Store the Test Results o 5.6 Logging in to a web-site
6. Building an Advanced Web Test Plan o 6.1 Handling User Sessions With URL Rewriting o 6.2 Using a Header Manager
7. Building a Database Test Plan o 7.1 Adding Users o 7.2 Adding JDBC Requests o 7.3 Adding a Listener to View/Store the Test Results
8. Building an FTP Test Plan o 8.1 Adding Users o 8.2 Adding Default FTP Request Properties o 8.3 Adding FTP Requests o 8.4 Adding a Listener to View/Store the Test Results
9a. Building an LDAP Test Plan o 9a.1 Adding Users o 9a.2 Adding Login Config Element o 9a.3 Adding LDAP Request Defaults o 9a.4 Adding LDAP Requests o 9a.5 Adding a Listener to View/Store the Test Results
9b. Building an Extended LDAP Test Plan o 9b.1 Adding Users o 9b.2 Adding LDAP Extended Request Defaults o 9b.3 Adding LDAP Requests o 9b.4 Adding a Listener to View/Store the Test Results
10. Building a Webservice Test Plan 11. Building a JMS Point to point Test Plan 12. Building a JMS topic Test Plan 13. Building a Monitor Test Plan 14. Listeners 15. Remote Testing 16. Best Practices
o 16.1 Limit the Number of Threads o 16.2 Where to Put the Cookie Manager

o 16.3 Where to Put the Authorization Manager o 16.4 Using the Proxy Server to record test scripts o 16.5 User variables o 16.6 Reducing resource requirements o 16.7 BeanShell server o 16.8 BeanShell scripting o 16.9 Developing script functions in BeanShell, Javascript or Jexl etc. o 16.10 Parameterising tests
17. Help! My boss wants me to load test our web app!
[Part II]
18. Component Reference 19. Functions 20. Regular Expressions 21. Hints and Tips 22. Glossary
1. Introduction
Apache JMeter is a 100% pure Java desktop application designed to load test client/server
software (such as a web application ). It may be used to test performance both on static and
dynamic resources such as static files, Java Servlets, CGI scripts, Java objects, databases , FTP
servers , and more. JMeter can be used to simulate a heavy load on a server, network or object to
test its strength or to analyze overall performance under different load types.
Additionally, JMeter can help you regression test your application by letting you create test
scripts with assertions to validate that your application is returning the results you expect. For
maximum flexibility, JMeter lets you create these assertions using regular expressions.
But please note that JMeter is not a browser.
1.1 History
Stefano Mazzocchi of the Apache Software Foundation was the original developer of JMeter. He
wrote it primarily to test the performance of Apache JServ (a project that has since been replaced
by the Apache Tomcat project). We redesigned JMeter to enhance the GUI and to add
functional-testing capabilities.
1.2 The Future
We hope to see JMeter's capabilities rapidly expand as developers take advantage of its
pluggable architecture. The primary goal of further development is to make JMeter the most
useful regression testing tool as possible, without compromising JMeter's load-testing
capabilities.

2.0 Getting Started
The easiest way to begin using JMeter is to first download the latest production release and
install it. The release contains all of the files you need to build and run most types of tests, e.g.
Web (HTTP/HTTPS), FTP, JDBC, LDAP, Java, and JUnit.
If you want to perform JDBC testing, then you will, of course, need the appropriate JDBC driver
from your vendor. JMeter does not come with any JDBC drivers.
JMeter includes the JMS API jar, but does not include a JMS client implementation. If you want
to run JMS tests, you will need to download the appropriate jars from the JMS provider.
See the JMeter Classpath section for details on
installing additional jars.
Next, start JMeter and go through the Building a Test Plan section of the User Guide to
familiarize yourself with JMeter basics (for example, adding and removing elements).
Finally, go through the appropriate section on how to build a specific type of Test Plan. For
example, if you are interested in testing a Web application, then see the section Building a Web
Test Plan . The other specific Test Plan sections are:
Advanced Web Test Plan
JDBC
FTP
JMS Point-to-Point
JMS Topic
LDAP
LDAP Extended
WebServices (SOAP)
Once you are comfortable with building and running JMeter Test Plans, you can look into the
various configuration elements (timers, listeners, assertions, and others) which give you more
control over your Test Plans.
2.1 Requirements
JMeter requires your computing environment meets some minimum requirements.
2.1.1 Java Version
JMeter requires a fully compliant JVM 1.5 or
higher.
Because JMeter uses only standard Java APIs, please do not file bug reports if your JRE fails to
run JMeter because of JRE implementation issues.

2.1.2 Operating Systems
JMeter is a 100% Java application and should run correctly on any system that has a compliant
Java implementation.
JMeter has been tested and works under:
Unix (Solaris, Linux, etc)
Windows (98, NT, XP, etc)
OpenVMS Alpha 7.3+
2.2 Optional
If you plan on doing JMeter development, then you will need one or more optional packages
listed below.
2.2.1 Java Compiler
If you want to build the JMeter source or develop JMeter plugins, then you will need a fully
compliant JDK 1.5 or higher.
2.2.2 SAX XML Parser
JMeter comes with Apache's Xerces XML parser . You have the option of telling JMeter to use
a different XML parser. To do so, include the classes for the third-party parser in JMeter's
classpath , and update the jmeter.properties file with the full classname of the parser
implementation.
2.2.3 Email Support
JMeter has extensive Email capabilities. It can send email based on test results, and has a
POP3(S)/IMAP(S) sampler. It also has an SMTP sampler.
2.2.4 SSL Encryption
To test a web server using SSL encryption (HTTPS), JMeter requires that an implementation of
SSL be provided, as is the case with Sun Java 1.4 and above. If your version of Java does not
include SSL support, then it is possible to add an external implementation. Include the necessary
encryption packages in JMeter's classpath . Also, update system.properties to register the SSL
Provider.
JMeter HTTP defaults to protocol level TLS. This can be changed by editting the JMeter
property "https.default.protocol" in jmeter.properties or user.properties.
The JMeter HTTP samplers are configured to accept all certificates, whether trusted or
not, regardless of validity periods etc. This is to allow the maximum flexibility in testing
servers.
If the server requires a client certificate, this can be provided.

There is also the SSL Manager , for greater control of certificates.
The JMeter proxy server (see below) supports
recording HTTPS (SSL) in versions after 2.3.4
The SMTP sampler can optionally use a local trust store or trust all certificates.
2.2.5 JDBC Driver
You will need to add your database vendor's JDBC driver to the classpath if you want to do
JDBC testing. Make sure the file is a jar file, not a zip.
2.2.6 JMS client
JMeter now includes the JMS API from Apache Geronimo, so you just need to add the
appropriate JMS Client implementation jar(s) from the JMS provider. Please refer to their
documentation for details. There may also be some information on the JMeter Wiki .
2.2.7 Libraries for ActiveMQ JMS
At the time of writing, the current version of ActiveMQ is 5.3.2. You will need to add the jar
activemq-all-5.3.2.jar to your classpath, e.g. by storing it in the lib/ directory.
Alternatively, add the jar activemq-core-5.3.2.jar to the classpath; this requires the
javax/management/j2ee classes which can be found in the Apache Geronimo jar geronimo-j2ee-
management_1.0_spec-1.0.jar. The other required jars (such as commons-logging) are already
included with JMeter.
See http://activemq.apache.org/initial-configuration.html for details.
See the JMeter Classpath section for more
details on installing additional jars.
2.3 Installation
We recommend that most users run the latest release .
To install a release build, simply unzip the zip/tar file into the directory where you want JMeter
to be installed. Provided that you have a JRE/JDK correctly installed and the JAVA_HOME
environment variable set, there is nothing more for you to do.
Note: there can be problems (especially with client-server mode) if the directory path contains
any spaces.
The installation directory structure should look something like this (for version 2.3.1):
jakarta-jmeter-2.3.1
jakarta-jmeter-2.3.1/bin
jakarta-jmeter-2.3.1/docs
jakarta-jmeter-2.3.1/extras
jakarta-jmeter-2.3.1/lib/

jakarta-jmeter-2.3.1/lib/ext
jakarta-jmeter-2.3.1/lib/junit
jakarta-jmeter-2.3.1/printable_docs
You can rename the parent directory (i.e. jakarta-jmeter-2.3.1) if you want, but do not change
any of the sub-directory names.
2.4 Running JMeter
To run JMeter, run the jmeter.bat (for Windows) or jmeter (for Unix) file. These files are found
in the bin directory. After a short pause, the JMeter GUI should appear.
There are some additional scripts in the bin directory that you may find useful. Windows script
files (the .CMD files require Win2K or later):
jmeter.bat - run JMeter (in GUI mode by default)
jmeter-n.cmd - drop a JMX file on this to run a non-GUI test
jmeter-n-r.cmd - drop a JMX file on this to run a non-GUI test remotely
jmeter-t.cmd - drop a JMX file on this to load it in GUI mode
jmeter-server.bat - start JMeter in server mode
mirror-server.cmd - runs the JMeter Mirror Server in non-GUI mode
shutdown.cmd - Run the Shutdown client to stop a non-GUI instance gracefully
stoptest.cmd - Run the Shutdown client to stop a non-GUI instance abruptly
Note: the special name LAST can be used with jmeter-n.cmd, jmeter-t.cmd and jmeter-n-r.cmd
and means the last test plan that was run interactively.
The environment variable JVM_ARGS can be used to override JVM settings in the jmeter.bat
script. For example:
set JVM_ARGS="-Xms1024m -Xmx1024m -Dpropname=propvalue"
jmeter -t test.jmx ...
Un*x script files; should work on most Linux/Unix systems:
jmeter - run JMeter (in GUI mode by default). Defines some JVM settings which
may not work for all JVMs.
jmeter-server - start JMeter in server mode (calls jmeter script with appropriate
parameters)
jmeter.sh - very basic JMeter script with no JVM options specified.
mirror-server.sh - runs the JMeter Mirror Server in non-GUI mode
shutdown.sh - Run the Shutdown client to stop a non-GUI instance gracefully
stoptest.sh - Run the Shutdown client to stop a non-GUI instance abruptly
It may be necessary to edit the jmeter shell script if some of the JVM options are not supported

by the JVM you are using. The JVM_ARGS environment variable can be used to override or set
additional JVM options, for example:
JVM_ARGS="-Xms1024m -Xmx1024m" jmeter -t test.jmx [etc.]
will override the HEAP settings in the script.
2.4.1 JMeter's Classpath
JMeter automatically finds classes from jars in the following directories:
JMETER_HOME/lib - used for utility jars
JMETER_HOME/lib/ext - used for JMeter components and add-ons
If you have developed new JMeter components, then you should jar them and copy the jar into
JMeter's lib/ext directory. JMeter will automatically find JMeter components in any jars found
here.
Support jars (libraries etc) should be placed in the lib directory.
If you don't want to put JMeter extension jars in the lib/ext directory, then define the property
search_paths in jmeter.properties. Do not use lib/ext for utility jars; it is only intended for
JMeter components.
Other jars (such as JDBC, JMS implementations and any other support libaries needed by the
JMeter code) should be placed in the lib directory - not the lib/ext directory
Note: JMeter will only find .jar files, not .zip.
You can also install utility Jar files in $JAVA_HOME/jre/lib/ext, or (since 2.1.1) you can set the
property user.classpath in jmeter.properties
Note that setting the CLASSPATH environment variable will have no effect. This is because
JMeter is started with "java -jar", and the java command silently ignores the CLASSPATH
variable, and the -classpath/-cp options when -jar is used. [This occurs with all Java programs,
not just JMeter.]
2.4.2 Using a Proxy Server
If you are testing from behind a firewall/proxy server, you may need to provide JMeter with the
firewall/proxy server hostname and port number. To do so, run the jmeter.bat/jmeter file from a
command line with the following parameters:
-H [proxy server hostname or ip address]
-P [proxy server port]
-N [nonproxy hosts] (e.g. *.apache.org|localhost)

-u [username for proxy authentication - if required]
-a [password for proxy authentication - if required]
Example : jmeter -H my.proxy.server -P 8000 -u username -a password -N localhost
Alternatively, you can use --proxyHost, --proxyPort, --username, and --password
JMeter also has its own in-built HTTP Proxy
Server , which can be used for recording HTTP
or HTTPS browser sessions. This is not to be
confused with the proxy settings described
above, which are used when JMeter makes
HTTP or HTTPS requests itself.
2.4.3 Non-GUI Mode (Command Line mode)
For non-interactive testing, you may choose to run JMeter without the GUI. To do so, use the
following command options
-n This specifies JMeter is to run in non-gui mode
-t [name of JMX file that contains the Test Plan].
-l [name of JTL file to log sample results to].
-j [name of JMeter run log file].
-r Run the test in the servers specified by the JMeter property "remote_hosts"
-R [list of remote servers] Run the test in the specified remote servers
The script also lets you specify the optional firewall/proxy server information:
-H [proxy server hostname or ip address]
-P [proxy server port]
Example : jmeter -n -t my_test.jmx -l log.jtl -H my.proxy.server -P 8000
2.4.4 Server Mode
For distributed testing , run JMeter in server mode on the remote node(s), and then control the
server(s) from the GUI. You can also use non-GUI mode to run remote tests. To start the
server(s), run jmeter-server/jmeter-server.bat on each server host.

The script also lets you specify the optional firewall/proxy server information:
-H [proxy server hostname or ip address]
-P [proxy server port]
Example : jmeter-server -H my.proxy.server -P 8000
If you want the server to exit after a single test has been run, then define the JMeter property
server.exitaftertest=true.
To run the test from the client in non-GUI mode, use the following command:
jmeter -n -t testplan.jmx -r [-Gprop=val] [-Gglobal.properties] [-Z]
where:
-G is used to define JMeter properties to be set in the servers
-X means exit the servers at the end of the test
-Rserver1,server2 - can be used instead of -r to provide a list of servers to
start
Overrides remote_hosts, but does not define the property.
2.4.5 Overriding Properties Via The Command Line
Java system properties, JMeter properties, and logging properties can be overriden directly on
the command line (instead of modifying jmeter.properties). To do so, use the following options:
-D[prop_name]=[value] - defines a java system property value.
-J[prop name]=[value] - defines a local JMeter property.
-G[prop name]=[value] - defines a JMeter property to be sent to all remote servers.
-G[propertyfile] - defines a file containing JMeter properties to be sent to all remote servers.
-L[category]=[priority] - overrides a logging setting, setting a particular category to the given
priority level.
The -L flag can also be used without the category name to set the root logging level.
Examples :
jmeter -Duser.dir=/home/mstover/jmeter_stuff \
-Jremote_hosts=127.0.0.1 -Ljmeter.engine=DEBUG
jmeter -LDEBUG

N.B.
The command line properties are processed early in startup, but after the logging system
has been set up. Attempts to use the -J flag to update log_level or log_file properties will
have no effect.
2.4.6 Logging and error messages
JMeter does not generally use pop-up dialog
boxes for errors, as these would interfere with
running tests. Nor does it report any error for a
mis-spelt variable or function; instead the
reference is just used as is. See Functions and
Variables for more information .
If JMeter detects an error during a test, a message will be written to the log file. The log file
name is defined in the jmeter.properties file (or using the -j option, see below). It defaults to
jmeter.log , and will be found in the directory from which JMeter was launched.
JMeter versions after 2.2 added a new command-line option, -j jmeterlogfile. This is processed
after the initial properties file is read, and before any further properties are processed. It
therefore allows the default of jmeter.log to be overridden. The jmeter scripts that take a test
plan name as a parameter (e.g. jmeter-n.cmd) have been updated to define the log file using the
test plan name, e.g. for the test plan Test27.jmx the log file is set to Test27.log.
When running on Windows, the file may appear as just jmeter unless you have set Windows to
show file extensions. [Which you should do anyway, to make it easier to detect viruses and
other nasties that pretend to be text files...]
As well as recording errors, the jmeter.log file records some information about the test run. For
example:
Contents No table of contents entries found.
10/17/2003 12:19:20 PM INFO - jmeter.JMeter: Version 1.9.20031002
10/17/2003 12:19:45 PM INFO - jmeter.gui.action.Load: Loading file:
c:\mytestfiles\BSH.jmx
10/17/2003 12:19:52 PM INFO - jmeter.engine.StandardJMeterEngine: Running
the test!
10/17/2003 12:19:52 PM INFO - jmeter.engine.StandardJMeterEngine: Starting 1
threads for group BSH. Ramp up = 1.
10/17/2003 12:19:52 PM INFO - jmeter.engine.StandardJMeterEngine: Continue
on error
10/17/2003 12:19:52 PM INFO - jmeter.threads.JMeterThread: Thread BSH1-1

started
10/17/2003 12:19:52 PM INFO - jmeter.threads.JMeterThread: Thread BSH1-1 is
done
10/17/2003 12:19:52 PM INFO - jmeter.engine.StandardJMeterEngine: Test has
ended
The log file can be helpful in determining the cause of an error, as JMeter does not interrupt a
test to display an error dialogue.
2.4.7 Full list of command-line options
Invoking JMeter as "jmeter -?" will print a list of all the command-line options. These are shown
below.
-h, --help
print usage information and exit
-v, --version
print the version information and exit
-p, --propfile {argument}
the jmeter property file to use
-q, --addprop {argument}
additional property file(s)
-t, --testfile {argument}
the jmeter test(.jmx) file to run
-j, --jmeterlogfile {argument}
the jmeter log file
-l, --logfile {argument}
the file to log samples to
-n, --nongui
run JMeter in nongui mode
-s, --server
run the JMeter server
-H, --proxyHost {argument}
Set a proxy server for JMeter to use
-P, --proxyPort {argument}
Set proxy server port for JMeter to use
-u, --username {argument}
Set username for proxy server that JMeter is to use
-a, --password {argument}
Set password for proxy server that JMeter is to use
-J, --jmeterproperty {argument}={value}
Define additional JMeter properties
-G, --globalproperty (argument)[=(value)]
Define Global properties (sent to servers)
e.g. -Gport=123
or -Gglobal.properties
-D, --systemproperty {argument}={value}
Define additional System properties
-S, --systemPropertyFile {filename}
a property file to be added as System properties
-L, --loglevel {argument}={value}
Define loglevel: [category=]level
e.g. jorphan=INFO or jmeter.util=DEBUG
-r, --runremote (non-GUI only)

Start remote servers (as defined by the jmeter property
remote_hosts)
-R, --remotestart server1,... (non-GUI only)
Start these remote servers (overrides remote_hosts)
-d, --homedir {argument}
the jmeter home directory to use
-X, --remoteexit
Exit the remote servers at end of test (non-GUI)
Note: the JMeter log file name is formatted as a SimpleDateFormat (applied to the current date)
if it contains paired single-quotes, .e.g. 'jmeter_'yyyyMMddHHmmss'.log'
If the special name LAST is used for the -t, -j or -l flags, then JMeter takes that to mean the last
test plan that was run in interactive mode.
2.5 Configuring JMeter
If you wish to modify the properties with which JMeter runs you need to either modify the
jmeter.properties in the /bin directory or create your own copy of the jmeter.properties and
specify it in the command line.
Note: since 2.2, you can define additional
JMeter properties in the file defined by the
JMeter property user.properties which has the
default value user.properties . The file will be
automatically loaded if it is found in the
current directory or if it is found in the JMeter
bin directory. Similarly, system.properties is
used to update system properties.
Parameters
Attribute Description Required
ssl.provider You can specify the class for your SSL implementation if you
don't want to use the built-in Java implementation. No
xml.parser You can specify an implementation as your XML parser. The
default value is: org.apache.xerces.parsers.SAXParser No
remote_hosts
Comma-delimited list of remote JMeter hosts (or host:port if
required). If you are running JMeter in a distributed environment,
list the machines where you have JMeter remote servers running.
This will allow you to control those servers from this machine's
GUI
No
not_in_menu
A list of components you do not want to see in JMeter's menus. As
JMeter has more and more components added, you may wish to
customize your JMeter to show only those components you are
interested in. You may list their classname or their class label (the
No

string that appears in JMeter's UI) here, and they will no longer
appear in the menus.
search_paths
List of paths (separated by ;) that JMeter will search for JMeter
add-on classes; for example additional samplers. This is in
addition to any jars found in the lib/ext directory.
No
user.classpath List of paths that JMeter will search for utility classes. This is in
addition to any jars found in the lib directory. No
user.properties
Name of file containing additional JMeter properties. These are
added after the initial property file, but before the -q and -J options
are processed.
No
system.properties Name of file containing additional system properties. These are
added before the -S and -D options are processed. No
The command line options and properties files are processed in the following order:
-p propfile
jmeter.properties (or the file from the -p option) is then loaded
-j logfile
Logging is initialised
user.properties is loaded
system.properties is loaded
all other command-line options are processed
See also the comments in the jmeter.properties, user.properties and system.properties files
for further information on other settings you can change.
3. Building a Test Plan
A test plan describes a series of steps JMeter will execute when run. A complete test plan will
consist of one or more Thread Groups, logic conrollers, sample generating controllers, listeners,
timers, assertions, and configuration elements.
3.1 Adding and Removing Elements
Adding elements to a test plan can be done by right-clicking on an element in the tree, and
choosing a new element from the "add" list. Alternatively, elements can be loaded from file and
added by choosing the "merge" or "open" option.
To remove an element, make sure the element is selected, right-click on the element, and choose
the "remove" option.
3.2 Loading and Saving Elements

To load an element from file, right click on the existing tree element to which you want to add
the loaded element, and select the "merge" option. Choose the file where your elements are
saved. JMeter will merge the elements into the tree.
To save tree elements, right click on an element and choose the "Save Selection As ..." option.
JMeter will save the element selected, plus all child elements beneath it. In this way, you can
save test tree fragments and individual elements for later use.
The workbench is not automatically saved with the
test plan, but it can be saved separately as above.
3.3 Configuring Tree Elements
Any element in the test tree will present controls in JMeter's right-hand frame. These controls
allow you to configure the behavior of that particular test element. What can be configured for
an element depends on what type of element it is.
The Test Tree itself can be manipulated by
dragging and dropping components around the
test tree.
3.4 Saving the Test Plan
Although it is not required, we recommend that you save the Test Plan to a file before running
it. To save the Test Plan, select "Save" or "Save Test Plan As ..." from the File menu (with the
latest release, it is no longer necessary to select the Test Plan element first).
JMeter allows you to save the entire Test Plan tree
or only a portion of it. To save only the elements
located in a particular "branch" of the Test Plan
tree, select the Test Plan element in the tree from
which to start the "branch", and then click your
right mouse button to access the "Save Selection
As ..." menu item. Alternatively, select the
appropriate Test Plan element and then select
"Save Selection As ..." from the Edit menu.
3.5 Running a Test Plan
To run your test plan, choose "Start" (Control + r) from the "Run" menu item. When JMeter is
running, it shows a small green box at the right hand end of the section just under the menu bar.
You can also check the "Run" menu. If "Start" is disabled, and "Stop" is enabled, then JMeter is
running your test plan (or, at least, it thinks it is).
The numbers to the left of the green box are the number of active threads / total number of
threads. These only apply to a locally run test; they do not include any threads started on remote
systems when using client-server mode.
3.6 Stopping a Test
There are two types of stop command available from the menu:
Stop (Control + '.') - stops the threads immediately if possible. In Versions of JMeter after 2.3.2, many samplers are now Interruptible which means that active samples can be terminated early. The stop command will check that all threads have stopped within the default timeout, which is 5000 ms = 5 seconds. [This can be changed using the JMeter propertyjmeterengine.threadstop.wait ] If the threads have not stopped, then a message is displayed. The Stop command can be retried, but if it fails, then it is necessary to exit JMeter to clean up.
Shutdown (Control + ',')- requests the threads to stop at the end of any current work. Will not interrupt any active samples. The modal shutdown dialog box will remain active until all threads have stopped.
Versions of JMeter after 2.3.2 allow a Stop to be initiated if Shutdown is taking too long. Close the
Shutdown dialog box and select Run/Stop, or just press Control + '.'.
When running JMeter in non-GUI mode, there is no Menu, and JMeter does not react to
keystrokes such as Control + '.'. So in versions after 2.3.2, JMeter non-GUI mode will listen for
commands on a specific port (default 4445, see the JMeter
propertyjmeterengine.nongui.port ). The commands currently supported are:
Shutdown - graceful shutdown StopTestNow - immediate shutdown
These commands can be sent by using the shutdown[.cmd|.sh] or stoptest[.cmd|.sh] script
respectively. The scripts are to be found in the JMeter bin directory.
3.7 Error reporting
JMeter reports warnings and errors to the jmeter.log file, as well as some information on the test
run itself. Just occasionally there may be some errors that JMeter is unable to trap and log; these
will appear on the command console. If a test is not behaving as you expect, please check the
log file in case any errors have been reported (e.g. perhaps a syntax error in a function call).
Sampling errors (e.g. HTTP 404 - file not found) are not normally reported in the log file.
Instead these are stored as attributes of the sample result. The status of a sample result can be
seen in the various different Listeners.

4. Elements of a Test Plan
The Test Plan object has a checkbox called "Functional Testing". If selected, it will cause JMeter
to record the data returned from the server for each sample. If you have selected a file in your
test listeners, this data will be written to file. This can be useful if you are doing a small run to
ensure that JMeter is configured correctly, and that your server is returning the expected results.
The consequence is that the file will grow huge quickly, and JMeter's performance will suffer.
This option should be off if you are doing stress-testing (it is off by default).
If you are not recording the data to file, this option makes no difference.
You can also use the Configuration button on a listener to decide what fields to save.
4.1 ThreadGroup
Thread group elements are the beginning points of any test plan. All controllers and samplers
must be under a thread group. Other elements, e.g. Listeners, may be placed directly under the
test plan, in which case they will apply to all the thread groups. As the name implies, the thread
group element controls the number of threads JMeter will use to execute your test. The controls
for a thread group allow you to:
Set the number of threads Set the ramp-up period Set the number of times to execute the test
Each thread will execute the test plan in its entirety and completely independently of other test
threads. Multiple threads are used to simulate concurrent connections to your server application.
The ramp-up period tells JMeter how long to take to "ramp-up" to the full number of threads
chosen. If 10 threads are used, and the ramp-up period is 100 seconds, then JMeter will take 100
seconds to get all 10 threads up and running. Each thread will start 10 (100/10) seconds after the
previous thread was begun. If there are 30 threads and a ramp-up period of 120 seconds, then
each successive thread will be delayed by 4 seconds.
Ramp-up needs to be long enough to avoid too large a work-load at the start of a test, and short
enough that the last threads start running before the first ones finish (unless one wants that to
happen).
Start with Ramp-up = number of threads and adjust up or down as needed.
By default, the thread group is configured to loop once through its elements.
Version 1.9 introduces a test run scheduler . Click the checkbox at the bottom of the Thread
Group panel to reveal extra fields in which you can enter the start and end times of the run.

When the test is started, JMeter will wait if necessary until the start-time has been reached. At
the end of each cycle, JMeter checks if the end-time has been reached, and if so, the run is
stopped, otherwise the test is allowed to continue until the iteration limit is reached.
Alternatively, one can use the relative delay and duration fields. Note that delay overrides start-
time, and duration over-rides end-time.
4.2 Controllers
JMeter has two types of Controllers: Samplers and Logical Controllers. These drive the
processing of a test.
Samplers tell JMeter to send requests to a server. For example, add an HTTP Request Sampler if
you want JMeter to send an HTTP request. You can also customize a request by adding one or
more Configuration Elements to a Sampler. For more information, seeSamplers .
Logical Controllers let you customize the logic that JMeter uses to decide when to send
requests. For example, you can add an Interleave Logic Controller to alternate between two
HTTP Request Samplers. For more information, see Logical Controllers .
4.2.1 Samplers
Samplers tell JMeter to send requests to a server and wait for a response. They are processed in
the order they appear in the tree. Controllers can be used to modify the number of repetitions of
a sampler.
JMeter samplers include:
FTP Request HTTP Request JDBC Request Java object request LDAP Request SOAP/XML-RPC Request WebService (SOAP) Request
Each sampler has several properties you can set. You can further customize a sampler by adding one or
more Configuration Elements to the Test Plan.
If you are going to send multiple requests of the same type (for example, HTTP Request) to the
same server, consider using a Defaults Configuration Element. Each controller has one or more
Defaults elements (see below).
Remember to add a Listener to your test plan to view and/or store the results of your requests to
disk.
If you are interested in having JMeter perform basic validation on the response of your request,

add an Assertion to the sampler. For example, in stress testing a web application, the server may
return a successful "HTTP Response" code, but the page may have errors on it or may be
missing sections. You could add assertions to check for certain HTML tags, common error
strings, and so on. JMeter lets you create these assertions using regular expressions.
JMeter's built-in samplers
4.2.2 Logic Controllers
Logic Controllers let you customize the logic that JMeter uses to decide when to send requests.
Logic Controllers can change the order of requests coming from their child elements. They can
modify the requests themselves, cause JMeter to repeat requests, etc.
To understand the effect of Logic Controllers on a test plan, consider the following test tree:
Test Plan o Thread Group
Once Only Controller Login Request (an HTTP Request )
Load Search Page (HTTP Sampler) Interleave Controller
Search "A" (HTTP Sampler) Search "B" (HTTP Sampler) HTTP default request (Configuration Element)
HTTP default request (Configuration Element) Cookie Manager (Configuration Element)
The first thing about this test is that the login request will be executed only the first time
through. Subsequent iterations will skip it. This is due to the effects of the Once Only
Controller .
After the login, the next Sampler loads the search page (imagine a web application where the
user logs in, and then goes to a search page to do a search). This is just a simple request, not
filtered through any Logic Controller.
After loading the search page, we want to do a search. Actually, we want to do two different
searches. However, we want to re-load the search page itself between each search. We could do
this by having 4 simple HTTP request elements (load search, search "A", load search, search
"B"). Instead, we use the Interleave Controller which passes on one child request each time
through the test. It keeps the ordering (ie - it doesn't pass one on at random, but "remembers" its
place) of its child elements. Interleaving 2 child requests may be overkill, but there could easily
have been 8, or 20 child requests.
Note the HTTP Request Defaults that belongs to the Interleave Controller. Imagine that "Search
A" and "Search B" share the same PATH info (an HTTP request specification includes domain,
port, method, protocol, path, and arguments, plus other optional items). This makes sense - both
are search requests, hitting the same back-end search engine (a servlet or cgi-script, let's say).

Rather than configure both HTTP Samplers with the same information in their PATH field, we
can abstract that information out to a single Configuration Element. When the Interleave
Controller "passes on" requests from "Search A" or "Search B", it will fill in the blanks with
values from the HTTP default request Configuration Element. So, we leave the PATH field
blank for those requests, and put that information into the Configuration Element. In this case,
this is a minor benefit at best, but it demonstrates the feature.
The next element in the tree is another HTTP default request, this time added to the Thread
Group itself. The Thread Group has a built-in Logic Controller, and thus, it uses this
Configuration Element exactly as described above. It fills in the blanks of any Request that
passes through. It is extremely useful in web testing to leave the DOMAIN field blank in all
your HTTP Sampler elements, and instead, put that information into an HTTP default request
element, added to the Thread Group. By doing so, you can test your application on a different
server simply by changing one field in your Test Plan. Otherwise, you'd have to edit each and
every Sampler.
The last element is a HTTP Cookie Manager . A Cookie Manager should be added to all web
tests - otherwise JMeter will ignore cookies. By adding it at the Thread Group level, we ensure
that all HTTP requests will share the same cookies.
Logic Controllers can be combined to achieve various results. See the list of built-in Logic
Controllers .
4.3 Listeners
Listeners provide access to the information JMeter gathers about the test cases while JMeter
runs. The Graph Results listener plots the response times on a graph. The "View Results Tree"
Listener shows details of sampler requests and responses, and can display basic HTML and
XML representations of the response. Other listeners provide summary or aggregation
information.
Additionally, listeners can direct the data to a file for later use. Every listener in JMeter provides
a field to indicate the file to store data to. There is also a Configuration button which can be
used to choose which fields to save, and whether to use CSV or XML format.Note that all
Listeners save the same data; the only difference is in the way the data is presented on the
screen.
Listeners can be added anywhere in the test, including directly under the test plan. They will
collect data only from elements at or below their level.
There are several listeners that come with JMeter.
4.4 Timers
By default, a JMeter thread sends requests without pausing between each request. We
recommend that you specify a delay by adding one of the available timers to your Thread
Group. If you do not add a delay, JMeter could overwhelm your server by making too many

requests in a very short amount of time.
The timer will cause JMeter to delay a certain amount of time before each sampler which is in
its scope .
If you choose to add more than one timer to a Thread Group, JMeter takes the sum of the timers
and pauses for that amount of time before executing the samplers to which the timers apply.
Timers can be added as children of samplers or controllers in order to restrict the samplers to
which they are applied.
To provide a pause at a single place in a test plan, one can use the Test Action Sampler.
4.5 Assertions
Assertions allow you to assert facts about responses received from the server being tested. Using
an assertion, you can essentially "test" that your application is returning the results you expect it
to.
For instance, you can assert that the response to a query will contain some particular text. The
text you specify can be a Perl-style regular expression, and you can indicate that the response is
to contain the text, or that it should match the whole response.
You can add an assertion to any Sampler. For example, you can add an assertion to a HTTP
Request that checks for the text, "</HTML>". JMeter will then check that the text is present in
the HTTP response. If JMeter cannot find the text, then it will mark this as a failed request.
Note that assertions apply to all samplers which are in its scope . To restrict the assertion to a
single sampler, add the assertion as a child of the sampler.
To view the assertion results, add an Assertion Listener to the Thread Group. Failed Assertions
will also show up in the Tree View and Table Listeners, and will count towards the error %age
for example in the Aggregate and Summary reports.
4.6 Configuration Elements
A configuration element works closely with a Sampler. Although it does not send requests
(except for HTTP Proxy Server ), it can add to or modify requests.
A configuration element is accessible from only inside the tree branch where you place the
element. For example, if you place an HTTP Cookie Manager inside a Simple Logic Controller,
the Cookie Manager will only be accessible to HTTP Request Controllers you place inside the
Simple Logic Controller (see figure 1). The Cookie Manager is accessible to the HTTP requests
"Web Page 1" and "Web Page 2", but not "Web Page 3".
Also, a configuration element inside a tree branch has higher precedence than the same element
in a "parent" branch. For example, we defined two HTTP Request Defaults elements, "Web
Defaults 1" and "Web Defaults 2". Since we placed "Web Defaults 1" inside a Loop Controller,

only "Web Page 2" can access it. The other HTTP requests will use "Web Defaults 2", since we
placed it in the Thread Group (the "parent" of all other branches).
Figure 1 - Test Plan Showing Accessability of Configuration Elements
The User Defined Variables Configuration element
is different. It is processed at the start of a test, no
matter where it is placed. For simplicity, it is
suggested that the element is placed only at the
start of a Thread Group.
4.7 Pre-Processor Elements
A Pre-Processor executes some action prior to a Sampler Request being made. If a Pre-
Processor is attached to a Sampler element, then it will execute just prior to that sampler element
running. A Pre-Processor is most often used to modify the settings of a Sample Request just
before it runs, or to update variables that aren't extracted from response text. See the scoping
rules for more details on when Pre-Processors are executed.
4.8 Post-Processor Elements
A Post-Processor executes some action after a Sampler Request has been made. If a Post-
Processor is attached to a Sampler element, then it will execute just after that sampler element
runs. A Post-Processor is most often used to process the response data, often to extract values
from it. See the scoping rules for more details on when Post-Processors are executed.
4.9 Execution order
1. Configuration elements 2. Pre-Processors 3. Timers 4. Sampler 5. Post-Processors (unless SampleResult is null) 6. Assertions (unless SampleResult is null)

7. Listeners (unless SampleResult is null)
Please note that Timers, Assertions, Pre- and Post-
Processors are only processed if there is a sampler
to which they apply. Logic Controllers and
Samplers are processed in the order in which they
appear in the tree. Other test elements are
processed according to the scope in which they
are found, and the type of test element. [Within a
type, elements are processed in the order in which
they appear in the tree].
For example, in the following test plan:
Controller o Post-Processor 1 o Sampler 1 o Sampler 2 o Timer 1 o Assertion 1 o Pre-Processor 1 o Timer 2 o Post-Processor 2
The order of execution would be:
Pre-Processor 1
Timer 1
Timer 2
Sampler 1
Post-Processor 1
Post-Processor 2
Assertion 1
Pre-Processor 1
Timer 1
Timer 2
Sampler 2
Post-Processor 1
Post-Processor 2
Assertion 1
4.10 Scoping Rules
The JMeter test tree contains elements that are both hierarchical and ordered. Some elements in
the test trees are strictly hierarchical (Listeners, Config Elements, Post-Procesors, Pre-

Processors, Assertions, Timers), and some are primarily ordered (controllers, samplers). When
you create your test plan, you will create an ordered list of sample request (via Samplers) that
represent a set of steps to be executed. These requests are often organized within controllers that
are also ordered. Given the following test tree:
Example test tree
The order of requests will be, One, Two, Three, Four.
Some controllers affect the order of their subelements, and you can read about these specific
controllers in the component reference .
Other elements are hierarchical. An Assertion, for instance, is hierarchical in the test tree. If its
parent is a request, then it is applied to that request. If its parent is a Controller, then it affects all
requests that are descendants of that Controller. In the following test tree:
Hierarchy example
Assertion #1 is applied only to Request One, while Assertion #2 is applied to Requests Two and
Three.
Another example, this time using Timers:

complex example
In this example, the requests are named to reflect the order in which they will be executed.
Timer #1 will apply to Requests Two, Three, and Four (notice how order is irrelevant for
hierarchical elements). Assertion #1 will apply only to Request Three. Timer #2 will affect all
the requests.
Hopefully these examples make it clear how configuration (hierarchical) elements are applied. If
you imagine each Request being passed up the tree branches, to its parent, then to its parent's
parent, etc, and each time collecting all the configuration elements of that parent, then you will
see how it works.
The Configuration elements Header Manager, Cookie Manager and Authorization manager are
treated differently from the Configuration Default elements. The settings from the Configuration
Default elements are merged into a set of values that the Sampler has access to. However, the
settings from the Managers are not merged. If more than one Manager is in the scope of a Sampler,
only one Manager is used, but there is currently no way to specify which is used.
4.11 Properties and Variables
JMeter properties are defined in jmeter.properties (see Gettting Started - Configuring
JMeter for more details).
Properties are global to jmeter, and are mostly used to define some of the defaults JMeter uses.
For example the property remote_hosts defines the servers that JMeter will try to run remotely.
Properties can be referenced in test plans - see Functions - read a property - but cannot be used
for thread-specific values.
JMeter variables are local to each thread. The values may be the same for each thread, or they
may be different.
If a variable is updated by a thread, only the thread copy of the variable is changed. For example

the Regular Expression ExtractorPost-Processor will set its variables according to the sample
that its thread has read, and these can be used later by the same thread. For details of how to
reference variables and functions, see Functions and Variables
Note that the values defined by the Test Plan and the User Defined Variables configuration
element are made available to the whole test plan at startup. If the same variable is defined by
multiple UDV elements, then the last one takes effect. Once a thread has started, the initial set of
variables is copied to each thread. Other elements such as the User Parameters Pre-Processor
or Regular Expression Extractor Post-Processor may be used to redefine the same variables (or
create new ones). These redefinitions only apply to the current thread.
The setProperty function can be used to define a JMeter property. These are global to the test
plan, so can be used to pass information between threads - should that be needed.
Both variables and properties are case-sensitive.
4.12 Using Variables to parameterise tests
Variables don't have to vary - they can be defined once, and if left alone, will not change value.
So you can use them as short-hand for expressions that appear frequently in a test plan. Or for
items which are constant during a run, but which may vary between runs. For example, the name
of a host, or the number of threads in a thread group.
When deciding how to structure a Test Plan, make a note of which items are constant for the
run, but which may change between runs. Decide on some variable names for these - perhaps
use a naming convention such as prefixing them with C_ or K_ or using uppercase only to
distinguish them from variables that need to change during the test. Also consider which items
need to be local to a thread - for example counters or values extracted with the Regular
Expression Post-Processor. You may wish to use a different naming convention for these.
For example, you might define the following on the Test Plan:
HOST www.example.com
THREADS 10
LOOPS 20
You can refer to these in the test plan as ${HOST} ${THREADS} etc. If you later want to change the host,
just change the value of the HOST variable. This works fine for small numbers of tests, but becomes
tedious when testing lots of different combinations. One solution is to use a property to define the
value of the variables, for example:
HOST ${__P(host,www.example.com)}
THREADS ${__P(threads,10)}
LOOPS ${__P(loops,20)}

You can then change some or all of the values on the command-line as follows:
jmeter ... -Jhost=www3.example.org -Jloops=13
5. Building a Web Test Plan
In this section, you will learn how to create a basic Test Plan to test a Web site. You will create
five users that send requests to two pages on the Jakarta Web site. Also, you will tell the users to
run their tests twice. So, the total number of requests is (5 users) x (2 requests) x (repeat 2 times)
= 20 HTTP requests. To construct the Test Plan, you will use the following elements: Thread
Group , HTTP Request , HTTP Request Defaults , andGraph Results .
For a more advanced Test Plan, see Building an Advanced Web Test Plan .
5.1 Adding Users
The first step you want to do with every JMeter Test Plan is to add a Thread Group element. The
Thread Group tells JMeter the number of users you want to simulate, how often the users should
send requests, and the how many requests they should send.
Go ahead and add the ThreadGroup element by first selecting the Test Plan, clicking your right
mouse button to get the Add menu, and then select Add --> ThreadGroup.
You should now see the Thread Group element under Test Plan. If you do not see the element,
then "expand" the Test Plan tree by clicking on the Test Plan element.
Next, you need to modify the default properties. Select the Thread Group element in the tree, if
you have not already selected it. You should now see the Thread Group Control Panel in the
right section of the JMeter window (see Figure 5.1 below)

Figure 5.1. Thread Group with Default Values
Start by providing a more descriptive name for our Thread Group. In the name field, enter
Jakarta Users.
Next, increase the number of users (called threads) to 5.
In the next field, the Ramp-Up Period, leave the the default value of 1 seconds. This property
tells JMeter how long to delay between starting each user. For example, if you enter a Ramp-Up
Period of 5 seconds, JMeter will finish starting all of your users by the end of the 5 seconds. So,
if we have 5 users and a 5 second Ramp-Up Period, then the delay between starting users would
be 1 second (5 users / 5 seconds = 1 user per second). If you set the value to 0, then JMeter will
immediately start all of your users.
Finally enter a value of 2 in the Loop Count field. This property tells JMeter how many times to
repeat your test. If you enter a loop count value of 1, then JMeter will run your test only once. To
have JMeter repeatedly run your Test Plan, select the Forever checkbox.
In most applications, you have to manually accept
changes you make in a Control Panel. However, in
JMeter, the Control Panel automatically accepts
your changes as you make them. If you change the
name of an element, the tree will be updated with
the new text after you leave the Control Panel (for
example, when selecting another tree element).
See Figure 5.2 for the completed Jakarta Users Thread Group.

Figure 5.2. Jakarta Users Thread Group
5.2 Adding Default HTTP Request Properties
Now that we have defined our users, it is time to define the tasks that they will be performing. In
this section, you will specify the default settings for your HTTP requests. And then, in section
5.3, you will add HTTP Request elements which use some of the default settings you specified
here.
Begin by selecting the Jakarta Users (Thread Group) element. Click your right mouse button to
get the Add menu, and then select Add --> Config Element --> HTTP Request Defaults. Then,
select this new element to view its Control Panel (see Figure 5.3).

Figure 5.3. HTTP Request Defaults
Like most JMeter elements, the HTTP Request Defaults Control Panel has a name field that you
can modify. In this example, leave this field with the default value.
Skip to the next field, which is the Web Server's Server Name/IP. For the Test Plan that you are
building, all HTTP requests will be sent to the same Web server, jakarta.apache.org. Enter this
domain name into the field. This is the only field that we will specify a default, so leave the
remaining fields with their default values.
The HTTP Request Defaults element does not tell
JMeter to send an HTTP request. It simply defines
the default values that the HTTP Request elements
use.
See Figure 5.4 for the completed HTTP Request Defaults element

Figure 5.4. HTTP Defaults for our Test Plan
5.3 Adding Cookie Support
Nearly all web testing should use cookie support, unless your application specifically doesn't use
cookies. To add cookie support, simply add anHTTP Cookie Manager to each Thread Group in
your test plan. This will ensure that each thread gets its own cookies, but shared across all HTTP
Request objects.
To add the HTTP Cookie Manager , simply select the Thread Group , and choose Add -->
Config Element --> HTTP Cookie Manager, either from the Edit Menu, or from the right-click
pop-up menu.
5.4 Adding HTTP Requests
In our Test Plan, we need to make two HTTP requests. The first one is for the Jakarta home page
(http://jakarta.apache.org/), and the second one is for the Project Guidelines page
(http://jakarta.apache.org/site/guidelines.html).
JMeter sends requests in the order that they
appear in the tree.
Start by adding the first HTTP Request to the Jakarta Users element (Add --> Sampler --> HTTP
Request). Then, select the HTTP Request element in the tree and edit the following properties
(see Figure 5.5):

1. Change the Name field to "Home Page". 2. Set the Path field to "/". Remember that you do not have to set the Server Name field because
you already specified this value in the HTTP Request Defaults element.
Figure 5.5. HTTP Request for Jakarta Home Page
Next, add the second HTTP Request and edit the following properties (see Figure 5.6:
1. Change the Name field to "Project Guidelines". 2. Set the Path field to "/site/guidelines.html".

Figure 5.6. HTTP Request for Jakarta Project Guidelines Page
5.5 Adding a Listener to View Store the Test Results
The final element you need to add to your Test Plan is a Listener . This element is responsible for
storing all of the results of your HTTP requests in a file and presenting a visual model of the
data.
Select the Jakarta Users element and add a Graph Results listener (Add --> Listener --> Graph
Results). Next, you need to specify a directory and filename of the output file. You can either
type it into the filename field, or select the Browse button and browse to a directory and then
enter a filename.

Figure 5.7. Graph Results Listener
5.6 Logging in to a web-site
It's not the case here, but some web-sites require you to login before permitting you to perform
certain actions. In a web-browser, the login will be shown as a form for the user name and
password, and a button to submit the form. The button generates a POST request, passing the
values of the form items as parameters.
To do this in JMeter, add an HTTP Request, and set the method to POST. You'll need to know
the names of the fields used by the form, and the target page. These can be found out by
inspecting the code of the login page. [If this is difficult to do, you can use the JMeter Proxy
Recorder to record the login sequence.] Set the path to the target of the submit button. Click the
Add button twice and enter the username and password details. Sometimes the login form
contains additional hidden fields. These will need to be added as well.
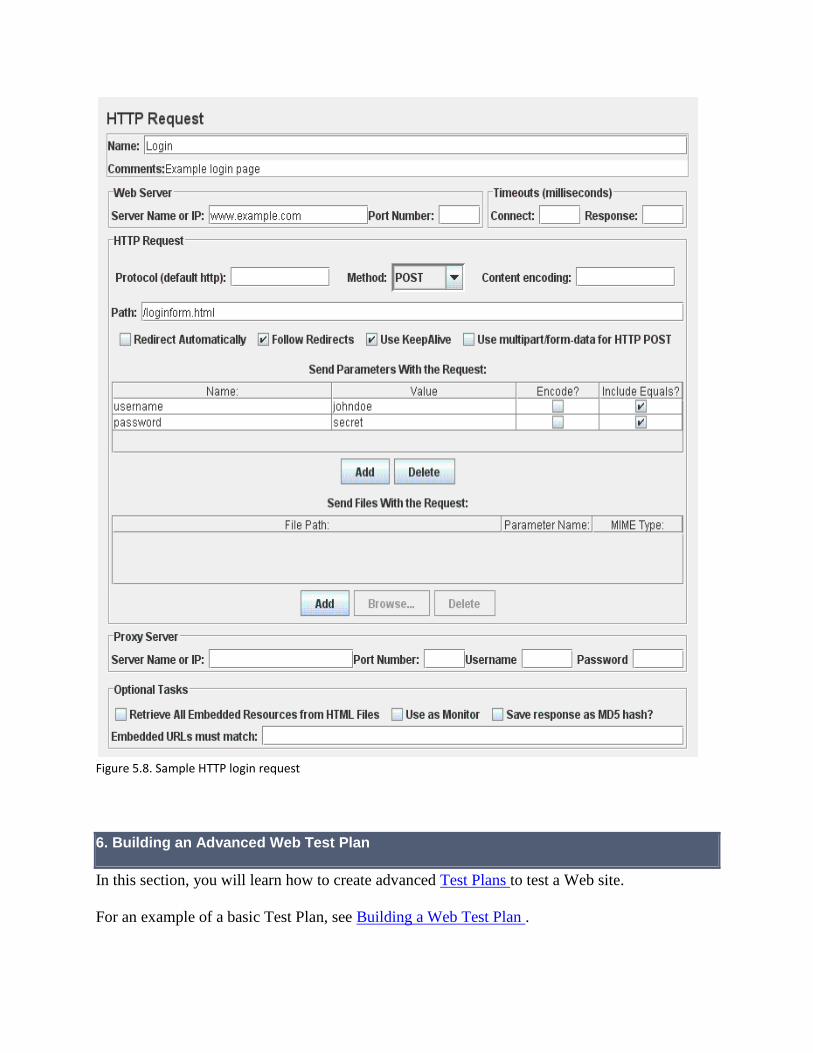
Figure 5.8. Sample HTTP login request
6. Building an Advanced Web Test Plan
In this section, you will learn how to create advanced Test Plans to test a Web site.
For an example of a basic Test Plan, see Building a Web Test Plan .

6.1 Handling User Sessions With URL Rewriting
If your web application uses URL rewriting rather than cookies to save session information, then
you'll need to do a bit of extra work to test your site.
To respond correctly to URL rewriting, JMeter needs to parse the HTML received from the
server and retrieve the unique session ID. Use the appropriate HTTP URL Re-writing
Modifier to accomplish this. Simply enter the name of your session ID parameter into the
modifier, and it will find it and add it to each request. If the request already has a value, it will be
replaced. If "Cache Session Id?" is checked, then the last found session id will be saved, and will
be used if the previous HTTP sample does not contain a session id.
URL Rewriting Example
Download this example . In Figure 1 is shown a test plan using URL rewriting. Note that the
URL Re-writing modifier is added to the SimpleController, thus assuring that it will only affect
requests under that SimpleController.
Figure 1 - Test Tree
In Figure 2, we see the URL Re-writing modifier GUI, which just has a field for the user to
specify the name of the session ID parameter. There is also a checkbox for indicating that the
session ID should be part of the path (separated by a ";"), rather than a request parameter

Figure 2 - Request parameters
6.2 Using a Header Manager
The HTTP Header Manager lets you customize what information JMeter sends in the HTTP
request header. This header includes properties like "User-Agent", "Pragma", "Referer", etc.
The HTTP Header Manager , like the HTTP Cookie Manager , should probably be added at the
Thread Group level, unless for some reason you wish to specify different headers for the
different HTTP Request objects in your test.
7. Building a Database Test Plan
In this section, you will learn how to create a basic Test Plan to test a database server. You will
create ten users that send five SQL requests to the database server. Also, you will tell the users to
run their tests three times. So, the total number of requests is (10 users) x (2 requests) x (repeat 3
times) = 60 JDBC requests. To construct the Test Plan, you will use the following
elements: Thread Group , JDBC Request , Graph Results .
This example uses the MySQL database driver. To
use this driver, its containing .jar file must be
copied to the JMeter lib directory (seeJMeter's
Classpath for more details).
7.1 Adding Users
The first step you want to do with every JMeter Test Plan is to add a Thread Group element. The

Thread Group tells JMeter the number of users you want to simulate, how often the users should
send requests, and the how many requests they should send.
Go ahead and add the ThreadGroup element by first selecting the Test Plan, clicking your right
mouse button to get the Add menu, and then select Add --> ThreadGroup.
You should now see the Thread Group element under Test Plan. If you do not see the element,
then "expand" the Test Plan tree by clicking on the Test Plan element.
Next, you need to modify the default properties. Select the Thread Group element in the tree, if
you have not already selected it. You should now see the Thread Group Control Panel in the
right section of the JMeter window (see Figure 7.1 below)
Figure 7.1. Thread Group with Default Values
Start by providing a more descriptive name for our Thread Group. In the name field, enter JDBC
Users.
You will need a valid database, database table, and
user-level access to that table. In the example
shown here, the database is 'mydb' and the table
name is 'Stocks'.
Next, increase the number of users to 10.
In the next field, the Ramp-Up Period, leave the the default value of 0 seconds. This property
tells JMeter how long to delay between starting each user. For example, if you enter a Ramp-Up

Period of 5 seconds, JMeter will finish starting all of your users by the end of the 5 seconds. So,
if we have 5 users and a 5 second Ramp-Up Period, then the delay between starting users would
be 1 second (5 users / 5 seconds = 1 user per second). If you set the value to 0, then JMeter will
immediately start all of your users.
Finally, enter a value of 3 in the Loop Count field. This property tells JMeter how many times to
repeat your test. To have JMeter repeatedly run your Test Plan, select the Forever checkbox.
In most applications, you have to manually accept
changes you make in a Control Panel. However, in
JMeter, the Control Panel automatically accepts
your changes as you make them. If you change the
name of an element, the tree will be updated with
the new text after you leave the Control Panel (for
example, when selecting another tree element).
See Figure 7.2 for the completed JDBC Users Thread Group.
Figure 7.2. JDBC Users Thread Group
7.2 Adding JDBC Requests
Now that we have defined our users, it is time to define the tasks that they will be performing. In
this section, you will specify the JDBC requests to perform.
Begin by selecting the JDBC Users element. Click your right mouse button to get the Add menu,
and then select Add --> Config Element --> JDBC Connection Configuration. Then, select this

new element to view its Control Panel (see Figure 7.3).
Set up the following fields (these assume we will be using a local MySQL database called test):
Variable name bound to pool. This needs to uniquely identify the configuration. It is used by the JDBC Sampler to identify the configuration to be used.
Database URL: jdbc:mysql://localhost:3306/test JDBC Driver class: com.mysql.jdbc.Driver Username: guest Password: password for guest
The other fields on the screen can be left as the defaults.
JMeter creates a database connection pool with the configuration settings as specified in the
Control Panel. The pool is referred to in JDBC Requests in the 'Variable Name' field. Several
different JDBC Configuration elements can be used, but they must have unique names. Every
JDBC Request must refer to a JDBC Configuration pool. More than one JDBC Request can refer
to the same pool.
Figure 7.3. JDBC Configuration
Selecting the JDBC Users element again. Click your right mouse button to get the Add menu,

and then select Add --> Sampler --> JDBC Request. Then, select this new element to view its
Control Panel (see Figure 7.4).
Figure 7.4. JDBC Request
In our Test Plan, we will make two JDBC requests. The first one is for Eastman Kodak stock,
and the second is Pfizer stock (obviously you should change these to examples appropriate for
your particular database). These are illustrated below.
JMeter sends requests in the order that you add
them to the tree.
Start by editing the following properties (see Figure 7.5):
Change the Name to "Kodak". Enter the Pool Name: MySQL (same as in the configuration element) Enter the SQL Query String field.

Figure 7.5. JDBC Request for Eastman Kodak stock
Next, add the second JDBC Request and edit the following properties (see Figure 7.6):
Change the Name to "Pfizer". Enter the SQL Query String field.
Figure 7.6. JDBC Request for Pfizer stock
7.3 Adding a Listener to View/Store the Test Results
The final element you need to add to your Test Plan is a Listener . This element is responsible for

storing all of the results of your JDBC requests in a file and presenting a visual model of the
data.
Select the JDBC Users element and add a Graph Results listener (Add --> Listener --> Graph
Results).
Figure 7.7. Graph results Listener
8. Building an FTP Test Plan
In this section, you will learn how to create a basic Test Plan to test an FTP site. You will create
four users that send requests for two files on the O'Reilly FTP site. Also, you will tell the users to
run their tests twice. So, the total number of requests is (4 users) x (2 requests) x (repeat 2 times)
= 16 FTP requests. To construct the Test Plan, you will use the following elements: Thread
Group , FTP Request , FTP Request Defaults , and Spline Visualizer .
This example uses the O'Reilly FTP site,
www.oro.com. Please be considerate when
running this example, and (if possible) consider

running against another FTP site.
8.1 Adding Users
The first step you want to do with every JMeter Test Plan is to add a Thread Group element. The
Thread Group tells JMeter the number of users you want to simulate, how often the users should
send requests, and the how many requests they should send.
Go ahead and add the ThreadGroup element by first selecting the Test Plan, clicking your right
mouse button to get the Add menu, and then select Add --> ThreadGroup.
You should now see the Thread Group element under Test Plan. If you do not see the element,
then "expand" the Test Plan tree by clicking on the Test Plan element.
Next, you need to modify the default properties. Select the Thread Group element in the tree, if
you have not already selected it. You should now see the Thread Group Control Panel in the
right section of the JMeter window (see Figure 8.1 below)
Figure 8.1. Thread Group with Default Values
Start by providing a more descriptive name for our Thread Group. In the name field, enter
O'Reilly Users.
Next, increase the number of users to 4.
In the next field, the Ramp-Up Period, leave the the default value of 0 seconds. This property
tells JMeter how long to delay between starting each user. For example, if you enter a Ramp-Up
Period of 5 seconds, JMeter will finish starting all of your users by the end of the 5 seconds. So,
if we have 5 users and a 5 second Ramp-Up Period, then the delay between starting users would

be 1 second (5 users / 5 seconds = 1 user per second). If you set the value to 0, then JMeter will
immediately start all of your users.
Finally, enter a value of 2 in the Loop Count field. This property tells JMeter how many times to
repeat your test. To have JMeter repeatedly run your Test Plan, select the Forever checkbox.
In most applications, you have to manually accept
changes you make in a Control Panel. However, in
JMeter, the Control Panel automatically accepts
your changes as you make them. If you change the
name of an element, the tree will be updated with
the new text after you leave the Control Panel (for
example, when selecting another tree element).
See Figure 8.2 for the completed O'Reilly Users Thread Group.
Figure 8.2. O'Reilly Users Thread Group
8.2 Adding Default FTP Request Properties
Now that we have defined our users, it is time define the tasks that they will be performing. In
this section, you will specify the default settings for your FTP requests. And then, in section 8.3,
you will add FTP Request elements which use some of the default settings you specified here.

Begin by selecting the O'Reilly Users element. Click your right mouse button to get the Add
menu, and then select Add --> Config Element --> FTP Request Defaults. Then, select this new
element to view its Control Panel (see Figure 8.3).
Figure 8.3. FTP Request Defaults
Like most JMeter elements, the FTP Request Defaults Control Panel has a name field that you
can modify. In this example, leave this field with the default value.
Skip to the next field, which is the FTP Server's Server Name/IP. For the Test Plan that you are
building, all FTP requests will be sent to the same FTP server, ftp.oro.com. Enter this domain
name into the field. This is the only field that we will specify a default, so leave the remaining
fields with their default values.
The FTP Request Defaults element does not tell
JMeter to send an FTP request. It simply defines
the default values that the FTP Request elements
use.
See Figure 8.4 for the completed FTP Request Defaults element

Figure 8.4. FTP Defaults for our Test Plan
8.3 Adding FTP Requests
In our Test Plan, we need to make two FTP requests. The first one is for the O'Reilly mSQL Java
README file (ftp://ftp.oro.com/pub/msql/java/README), and the second is for the tutorial file
(ftp://ftp.oro.com/pub/msql/java/tutorial.txt).
JMeter sends requests in the order that they
appear in the tree.
Start by adding the first FTP Request to the O'Reilly Users element (Add --> Sampler --> FTP
Request). Then, select the FTP Request element in the tree and edit the following properties (see
Figure 8.5):
1. Change the Name to "README". 2. Change the File to Retrieve From Server field to "pub/msql/java/README". 3. Change the Username field to "anonymous". 4. Change the Password field to "anonymous".

You do not have to set the Server Name field
because you already specified this value in the FTP
Request Defaults element.
Figure 8.5. FTP Request for O'Reilly mSQL Java README file
Next, add the second FTP Request and edit the following properties (see Figure 8.6:
1. Change the Name to "tutorial". 2. Change the File to Retrieve From Server field to "pub/msql/java/tutorial.txt". 3. Change the Username field to "anonymous". 4. Change the Password field to "anonymous".

Figure 8.6. FTP Request for O'Reilly mSQL Java tutorial file
8.4 Adding a Listener to View/Store the Test Results
The final element you need to add to your Test Plan is a Listener . This element is responsible for
storing all of the results of your FTP requests in a file and presenting a visual model of the data.
Select the O'Reilly Users element and add a Spline Visualizer listener (Add --> Listener -->
Spline Visualizer).

Figure 8.7. Spline Visualizer Listener
9a. Building an LDAP Test Plan
In this section, you will learn how to create a basic Test Plan to test an LDAP server. You will
create four users that send requests for four tests on the LDAP server.Also, you will tell the users
to run their tests twice. So, the total number of requests is (4 users) x (4 requests) x repeat 2
times) = 32 LDAP requests. To construct the Test Plan, you will use the following
elements: Thread Group , LDAP Request , LDAP Request Defaults , and View Results in Table .
This example assumes that the LDAP Server is installed in your Local machine.
9a.1 Adding Users
The first step you want to do with every JMeter Test Plan is to add a Thread Group element. The
Thread Group tells JMeter the number of users you want to simulate, how often the users should
send requests, and the how many requests they should send.
Go ahead and add the ThreadGroup element by first selecting the Test Plan, clicking your right
mouse button to get the Add menu, and then select Add-->ThreadGroup. You should now see the
Thread Group element under Test Plan. If you do not see the element, then "expand" the Test
Plan tree by clicking on the Test Plan element.
Figure 9a.1. Thread Group with Default Values
9a.2 Adding Login Config Element

Begin by selecting the Siptech Users element. Click your right mouse button to get the Add
menu, and then select Add --> Config Element --> Login Config Element. Then, select this new
element to view its Control Panel.
Like most JMeter elements, the Login Config Element Control Panel has a name field that you
can modify. In this example, leave this field with the default value.
Figure 9a.2 Login Config Element for our Test Plan
Enter Username field to "your Server
Username",
The password field to "your Server Passowrd"
These values are default for the LDAP
Requests.
9a.3 Adding LDAP Request Defaults
Begin by selecting the Siptech Users element. Click your right mouse button to get the Add
menu, and then select Add --> Config Element -->LDAP Request Defaults. Then, select this new
element to view its Control Panel.
Like most JMeter elements, the LDAP Request Defaults Control Panel has a name field that you
can modify. In this example, leave this field with the default value.

Figure 9a.3 LDAP Defaults for our Test Plan
Enter DN field to "your Server Root Dn".
Enter LDAP Server's Servername field to
"localhost".
The port to 389.
These values are default for the LDAP Requests.
9a.4 Adding LDAP Requests
In our Test Plan, we need to make four LDAP requests.
1. Inbuilt Add Test 2. Inbuilt Modify Test 3. Inbuilt Delete Test 4. Inbuilt Search Test
JMeter sends requests in the order that you add them to the tree. Start by adding the first LDAP
Request to the Siptech Users element (Add --> Sampler --> LDAP Request). Then, select the
LDAP Request element in the tree and edit the following properties
1. Change the Name to "Inbuilt-Add Test". 2. Select the Add test Radio button

Figure 9a.4.1 LDAP Request for Inbuilt Add test
You do not have to set the Server Name field, port field, Username, Password and DN because
you already specified this value in the Login Config Element and LDAP Request Defaults.
Next, add the second LDAP Request and edit the following properties
1. Change the Name to "Inbuilt-Modify Test". 2. Select the Modify test Radio button
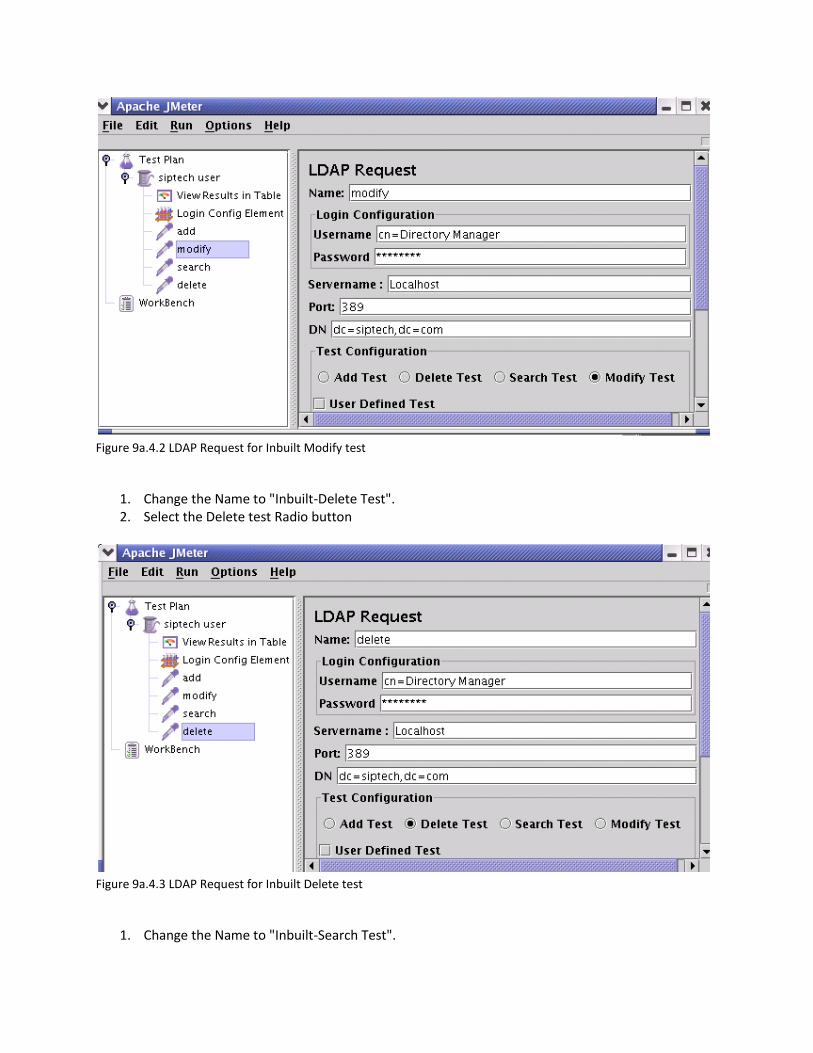
Figure 9a.4.2 LDAP Request for Inbuilt Modify test
1. Change the Name to "Inbuilt-Delete Test". 2. Select the Delete test Radio button
Figure 9a.4.3 LDAP Request for Inbuilt Delete test
1. Change the Name to "Inbuilt-Search Test".

2. Select the Search test Radio button
Figure 9a.4.4 LDAP Request for Inbuilt Search test
9a.5 Adding a Listener to View/Store the Test Results
The final element you need to add to your Test Plan is a Listener. This element is responsible for
storing all of the results of your LDAP requests in a file and presenting a visual model of the
data.Select the Siptech Users element and add a View Results in Table (Add --> Listener --
>View Results in Table)

Figure 9a.5 View result in Table Listener
9b. Building an Extended LDAP Test Plan
In this section, you will learn how to create a basic Test Plan to test an LDAP server.
As the Extended LDAP Sampler is highly configurable, this also means that it takes some time to
build a correct testplan. You can however tune it exactly up to your needs.
You will create four users that send requests for four tests on the LDAP server.Also, you will tell
the users to run their tests twice. So, the total number of requests is (4 users) x (4 requests) x
repeat 2 times) = 32 LDAP requests. To construct the Test Plan, you will use the following
elements:
Thread Group ,
Adding LDAP Extended Request Defaults ,
Adding LDAP Requests , and
Adding a Listener to View/Store the Test Results
This example assumes that the LDAP Server is installed in your Local machine.
For the less experienced LDAP users, I build a small LDAP tutorial which shortly explains the
several LDAP operations that can be used in building a complex testplan.
Take care when using LDAP special characters in the distinghuished name, in that case (eg, you
want to use a + sign in a distinghuished name) you need to escape the character by adding an "\"
sign before that character. extra exeption: if you want to add a \ character in a distinguished name
(in an add or rename operation), you need to use 4 backslashes. examples: cn=dolf\+smits to
add/search an entry with the name like cn=dolf+smits cn=dolf \\ smits to search an entry with the
name cn=dolf \ smits cn=c:\\\\log.txt to add an entry with a name like cn=c:\log.txt
9b.1 Adding Users
The first step you want to do with every JMeter Test Plan is to add a Thread Group element. The
Thread Group tells JMeter the number of users you want to simulate, how often the users should
send requests, and the how many requests they should send.
Go ahead and add the ThreadGroup element by first selecting the Test Plan, clicking your right
mouse button to get the Add menu, and then select Add-->ThreadGroup. You should now see
the Thread Group element under Test Plan. If you do not see the element, then "expand" the

Test Plan tree by clicking on the Test Plan element.
Figure 9b.1. Thread Group with Default Values
9b.2 Adding LDAP Extended Request Defaults
Begin by selecting the Thread Group element. Click your right mouse button to get the Add
menu, and then select Add --> Config Element -->LDAP Extended Request Defaults. Then,
select this new element to view its Control Panel.
Like most JMeter elements, the LDAP Extended Request Defaults Control Panel has a name
field that you can modify. In this example, leave this field with the default value.

Figure 9b.2 LDAP Defaults for our Test Plan
For each of the different operations, some default values can be filled in. In All cases, when a
default is filled in, this is used for the LDAP extended requests. For each requst, you can
override the defaults by filling in the values in the LDAP extended request sampler. When no
valueis entered which is necesarry for a test, the test will fail in an unpredictable way!
9b.3 Adding LDAP Requests
In our Test Plan, we want to use all 8 LDAP requests.
1. Thread bind 2. Search Test 3. Compare Test 4. Single bind/unbind Test 5. Add Test 6. Modify Test 7. Delete Test 8. Rename entry (moddn) 9. Thread unbind
JMeter sends requests in the order that you add them to the tree.
Adding a requests always start by:
Adding the LDAP Extended Request to the Thread Group element (Add --> Sampler --> LDAP
Ext Request). Then, select the LDAP Ext Request element in the tree and edit the following
properties.
9b.3.1 Adding a Thread bind Request
1. Select the "Thread bind" button. 2. enter the hostname value from the LDAP server in the Servername field 3. Enter the portnumber from the LDAP server (389) in the port field 4. (optional) enter the baseDN in the DN field, this baseDN will be used as thestarting point for
searches, add, deletes etc. take care that this must be the uppermost shared level for all your request, eg When all information is stored under ou=people, dc=siemens, dc=com, you can use this value in the basedn. You cannot search or rename anymore in the subtree ou=users,dc=siemens,dc=com! If you need to search or rename objects in both subtrees, use the common denominator

(dc=siemens,dc=com) as the baseDN. 5. (Optional) enter the distinghuised name from the user you want to use for authentication.
When this field is kept empty, an anonymous bind will be established. 6. (optional) Enter the password for the user you want to authenticate with, an empty password
will also lead to an anonymous bind.
Figure 9b.3.1. Thread Bind example
9b.3.2 Adding a search Request
1. Select the "Search Test" button. 2. (Optional) enter the searchbase under which you want to perform the search, relative to the
basedn, used in the thread bind request. When left empty, the basedn is used as a search base, this files is important if you want to use a "base-entry" or "one-level" search (see below)
3. Enter the searchfilter, any decent LDAP serach filter will do, but for now, use something simple, like cn=john doe
4. (optional) enter the scope in the scope field, it has three options: 1. Base level, Enter the value 0
only the given searchbase is used, only for checking attributes or existence.
2. One level, Enter the value 1 Only search in one level below given searchbase is used
3. Subtree, Enter the value 2 Searches for object at any point below the given basedn

5. (Optional) Sizelimit, specifies the maximun number of returned entries, 6. (optional) Timelimit, psecifies the maximum number of miliseconds, the SERVER can use for
performing the search. it is NOT the maximun time the application will wait! When a very large returnset is returned, from a very fast server, over a very slow line, you may have to wait for ages for the completion of the search request, but this parameter will not influence this.
7. (Optional) Attributes you want in the search answer. This can be used to limit the size of the answer, especially when an onject has very large attributes (like jpegPhoto). There are three possibilities:
1. Leave empty (the default setting must also be empty) This will return all attributes. 2. Put in one empty value (""), it will request a non-existent attributes, so in reality it
returns no attributes 3. Put in the attributes, seperated by a semi-colon. It will return only the requested
attributes 8. (Optional) Return object, possible values are "true" and "false". True will return all java-object
attributes, it will add these to the requested attributes, as specified above. false will mean no java-object attributes will be returned.
9. (Optional) Dereference aliases. possible values "true" and "false". True will mean it will follow references, false says it will not.
Figure 9b.3.2. search request example

9b.3.3 Adding a Compare Request
1. Select the "Compare" button. 2. enter the entryname form the object on which you want the compare operation to work,
relative to the basedn, eg "cn=john doe,ou=people" 3. Enter the compare filter, this must be in the form "attribute=value", eg
Figure 9b.3.3. Compare example
9b.3.4 Adding a Single bind/unbind
1. Select the "Single bind/unbind" button. 2. Enter the FULL distinghuised name from the user you want to use for authentication.
eg. cn=john doe,ou=people,dc=siemens,dc=com When this field is kept empty, an anonymous bind will be established.
3. Enter the password for the user you want to authenticate with, an empty password will also lead to an anonymous bind.
4. Take care: This single bind/unbind is in reality two seperate operations but cannot easily be split!

Figure 9b.3.4. Single bind/unbind example
9b.3.5 Adding an Add Request
1. Select the "Add" button. 2. Enter the distinghuised name for the object to add, relative to the basedn. 3. Add a line in the "add test" table, fill in the attribute and value.
When you need the same attribute more than once, just add a new line, add the attribute again, and a different value. All necessary attributes and values must be specified to pass the test, see picture! (sometimes the server adds the attribute "objectClass=top", this might give a problem.

Figure 9b.3.5. Add request example
9b.3.6 Adding a Modify Request
1. Select the "Modify test" button. 2. Enter the distinghuised name for the object to modify, relative to the basedn. 3. Add a line in the "modify test" table, with the "add" button. 4. You need to enter the attribute you want to modify, (optional) a value, and the opcode. The
meaning of this opcode: 1. add
this will mean that the attribute value (not optional in this case) willbe added to the attribute. When the attribute is not existing, it will be created and the value added When it is existing, and defined multi-valued, the new value is added. when it is existing, but single valued, it will fail.
2. replace This will overwrite the attribute with the given new value (not optional here) When the attribute is not existing, it will be created and the value added

When it is existing, old values are removed, the new value is added.
3. delete When no value is given, all values will be removed When a value is given, only that value will be removed when the given value is not existing, the test will fail
5. (Optional) Add more modifications in the "modify test" table. All modifications which are specified must succeed, to let the modification test pass. When one modification fails, NO modifications at all will be made and the entry will remain unchanged.
Figure 9b.3.6. Modify example
9b.3.7 Adding a Delete Request
1. Select the "Delete" button. 2. enter the name of the entry, relative to the baseDN, in the Delete-Field.
that is, if you want to remove "cn=john doe,ou=people,dc=siemens,dc=com", and you set the baseDN to "dc=siemens,dc=com", you need to enter "cn=john doe,ou=people" in the Delete-

field.
Figure 9b.3.7. Delete example
9b.3.8 Adding a Rename Request (moddn)
1. Select the "Rename Entry" button. 2. enter the name of the entry, relative to the baseDN, in the "old entry name-Field".
that is, if you want to rename "cn=john doe,ou=people,dc=siemens,dc=com", and you set the baseDN to "dc=siemens,dc=com", you need to enter "cn=john doe,ou=people" in the old entry name-field.
3. enter the new name of the entry, relative to the baseDN, in the "new distinghuised name-Field". whne you only change the RDN, it will simply rename the entry when you also add a differten subtree, eg you change from cn=john doe,ou=people to cn=john doe,ou=users, it will move the entry. You can also move a complete subtree (If your LDAP server supports this!!!!), eg ou=people,ou=retired, to ou=oldusers,ou=users, this will move the complete subtee, plus all retired people in the subtree to the new place in the tree.

Figure 9b.3.8. Rename example
9b.3.9 Adding an unbind Request
1. Select the "Thread unbind" button. This will be enough as it just closes the current connection. The information which is needed is already known by the system
Figure 9b.3.9. Unbind example

9b.4 Adding a Listener to View/Store the Test Results
The final element you need to add to your Test Plan is a Listener. This element is responsible for
storing all of the results of your LDAP requests in a file and presenting a visual model of the
data.Select the Thread group element and add a View Results Tree (Add --> Listener -->View
Results Tree)
Figure 9b.4. View result Tree Listener
In this listener you have three tabs to view, the sampler result, the request and the response data.
1. The sampler result just contains the response time, the returncode and return message 2. The request gives a short description of the request that was made, in practice no relevant
information is contained here.
3. The response data contains the full details of the sent request, as well the full details of the received answer, this is given in a (self defined) xml-style. The full description can be found

here.
10. Building a WebService Test Plan
In this section, you will learn how to create a Test Plan to test a WebService. You will create five
users that send requests to One page. Also, you will tell the users to run their tests twice. So, the
total number of requests is (5 users) x (1 requests) x (repeat 2 times) = 10 HTTP requests. To
construct the Test Plan, you will use the following elements: Thread Group , WebService(SOAP)
Request (Beta Code) , and Graph Results .
General notes on the webservices sampler. The current implementation uses Apache SOAP
driver, which requires activation.jar and mail.jar from SUN. Due to license restrictions, JMeter
does not include the jar files in the binary distribution.
If the sampler appears to be getting an error from the webservice, double check the SOAP
message and make sure the format is correct. In particular, make sure the xmlns attributes are
exactly the same as the WSDL. If the xml namespace is different, the webservice will likely
return an error.Xmethods contains a list of public webservice for those who want to test their test
plan.
10.1 Adding Users
The first step you want to do with every JMeter Test Plan is to add a Thread Group element. The
Thread Group tells JMeter the number of users you want to simulate, how often the users should
send requests, and the how many requests they should send.
Go ahead and add the ThreadGroup element by first selecting the Test Plan, clicking your right
mouse button to get the Add menu, and then select Add --> ThreadGroup.
You should now see the Thread Group element under Test Plan. If you do not see the element,
then "expand" the Test Plan tree by clicking on the Test Plan element.
Next, you need to modify the default properties. Select the Thread Group element in the tree, if
you have not already selected it. You should now see the Thread Group Control Panel in the
right section of the JMeter window (see Figure 10.1 below)

Figure 10.1. Thread Group with Default Values
Start by providing a more descriptive name for our Thread Group. In the name field, enter
Jakarta Users.
Next, increase the number of users (called threads) to 10.
In the next field, the Ramp-Up Period, leave the the default value of 0 seconds. This property
tells JMeter how long to delay between starting each user. For example, if you enter a Ramp-Up
Period of 5 seconds, JMeter will finish starting all of your users by the end of the 5 seconds. So,
if we have 5 users and a 5 second Ramp-Up Period, then the delay between starting users would
be 1 second (5 users / 5 seconds = 1 user per second). If you set the value to 0, then JMeter will
immediately start all of your users.
Finally, clear the checkbox labeled "Forever", and enter a value of 2 in the Loop Count field.
This property tells JMeter how many times to repeat your test. If you enter a loop count value of
0, then JMeter will run your test only once. To have JMeter repeatedly run your Test Plan, select
the Forever checkbox.
In most applications, you have to manually accept
changes you make in a Control Panel. However, in
JMeter, the Control Panel automatically accepts
your changes as you make them. If you change the
name of an element, the tree will be updated with
the new text after you leave the Control Panel (for
example, when selecting another tree element).

See Figure 10.2 for the completed Jakarta Users Thread Group.
Figure 10.2. Jakarta Users Thread Group
10.2 Adding WebService Requests
In our Test Plan, we will use a .NET webservice. Since you're using the webservice sampler, we
won't go into the details of writing a webservice. If you don't know how to write a webservice,
google for webservice and familiarize yourself with writing webservices for Java and .NET. It
should be noted there is a significant difference between how .NET and Java implement
webservices. The topic is too broad to cover in the user manual. Please refer to other sources to
get a better idea of the differences.
JMeter sends requests in the order that they
appear in the tree.
Start by adding the sampler WebService(SOAP) Request (Beta Code) to the Jakarta Users
element (Add --> Sampler --> WebService(SOAP) Request (Beta Code) ). Then, select the
webservice Request element in the tree and edit the following properties (see Figure 10.5):
1. Change the Name field to "WebService(SOAP) Request (Beta Code)". 2. Enter the WSDL URL and click "Load WSDL".

Figure 10.3. Webservice Request

10.3 Adding a Listener to View Store the Test Results
The final element you need to add to your Test Plan is a Listener . This element is responsible for
storing all of the results of your HTTP requests in a file and presenting a visual model of the
data.
Select the Jakarta Users element and add a Graph Results listener (Add --> Listener --> Graph
Results). Next, you need to specify a directory and filename of the output file. You can either
type it into the filename field, or select the Browse button and browse to a directory and then
enter a filename.
Figure 10.7. Graph Results Listener
11. Building a JMS Point-to-Point Test Plan
Make sure the required jar files are in JMeter's lib
directory. If they are not, shutdown JMeter, copy
the jar files over and restart JMeter. See Getting
Started for details.

In this section, you will learn how to create a Test Plan to test a JMS Point-to-Point messaging
solution. The setup of the test is 1 threadgroup with 5 threads sending 4 messages each through a
request queue. A fixed reply queue will be used for monitoring the reply messages. To construct
the Test Plan, you will use the following elements:Thread Group , JMS Point-to-Point ,
and Graph Results .
General notes on JMS: There are currently two JMS samplers. One uses JMS topics and the
other uses queues. Topic messages are commonly known as pub/sub messaging. Topic
messaging is generally used in cases where a message is published by a producer and consumed
by multiple subscribers. A JMS sampler needs the JMS implementation jar files; for example,
from Apache ActiveMQ. See here for the list of jars provided by ActiveMQ 3.0.
11.1 Adding a Thread Group
The first step you want to do with every JMeter Test Plan is to add a Thread Group element. The
Thread Group tells JMeter the number of users you want to simulate, how often the users should
send requests, and the how many requests they should send.
Go ahead and add the ThreadGroup element by first selecting the Test Plan, clicking your right
mouse button to get the Add menu, and then select Add --> ThreadGroup.
You should now see the Thread Group element under Test Plan. If you do not see the element,
then "expand" the Test Plan tree by clicking on the Test Plan element.
Next, you need to modify the default properties. Select the Thread Group element in the tree, if
you have not already selected it. You should now see the Thread Group Control Panel in the
right section of the JMeter window (see Figure 11.1 below)
Figure 11.1. Thread Group with Default Values

Start by providing a more descriptive name for our Thread Group. In the name field, enter Point-
to-Point.
Next, increase the number of users (called threads) to 5.
In the next field, the Ramp-Up Period, leave set the value to 0 seconds. This property tells
JMeter how long to delay between starting each user. For example, if you enter a Ramp-Up
Period of 5 seconds, JMeter will finish starting all of your users by the end of the 5 seconds. So,
if we have 5 users and a 5 second Ramp-Up Period, then the delay between starting users would
be 1 second (5 users / 5 seconds = 1 user per second). If you set the value to 0, then JMeter will
immediately start all of your users.
Clear the checkbox labeled "Forever", and enter a value of 4 in the Loop Count field. This
property tells JMeter how many times to repeat your test. If you enter a loop count value of 0,
then JMeter will run your test only once. To have JMeter repeatedly run your Test Plan, select
the Forever checkbox.
In most applications, you have to manually accept
changes you make in a Control Panel. However, in
JMeter, the Control Panel automatically accepts
your changes as you make them. If you change the
name of an element, the tree will be updated with
the new text after you leave the Control Panel (for
example, when selecting another tree element).
11.2 Adding JMS Point-to-Point Sampler
Start by adding the sampler JMS Point-to-Point to the Point-to-Point element (Add --> Sampler -
-> JMS Point-to-Point). Then, select the JMS Point-to-Point sampler element in the tree. In
building the example a configuration will be provided that works with ActiveMQ 3.0.
Name Value Description
JMS Resources
QueueuConnectionFactory ConnectionFactory This is the default JNDI
entry for the connection
factory within active mq.
JNDI Name Request
Queue Q.REQ This is equal to the JNDI
name defined in the JNDI
properties.

JNDI Name Reply Queue Q.RPL This is equal to the JNDI
name defined in the JNDI
properties.
Message Properties
Communication Style Request Response This means that you need
at least a service that
responds to the requests.
Content test This is just the content of
the message.
JMS Properties Nothing needed for active
mq.
JNDI Properties
InitialContextFactory org.activemq.jndi.ActiveMQInitialContextFactory The standard
InitialContextFactory for
Active MQ
Properties
providerURL tcp://localhost:61616 This defines the URL of the
active mq messaging
system.
queue.Q.REQ example.A This defines a JNDI name
Q.REQ for the request
queue that points to the
queue example.A
queue.Q.RPL example.B This defines a JNDI name
Q.RPL for the reply queue
that points to the queue
example.B
11.3 Adding a Listener to View Store the Test Results
The final element you need to add to your Test Plan is a Listener . This element is responsible for
storing all of the results of your JMS requests in a file and presenting a visual model of the data.
Select the Thread Group element and add a Graph Results listener (Add --> Listener --> Graph
Results). Next, you need to specify a directory and filename of the output file. You can either
type it into the filename field, or select the Browse button and browse to a directory and then

enter a filename.
Figure 11.2. Graph Results Listener
12. Building a JMS Topic Test Plan
JMS requires some optional jars to be
downloaded. Please refer to Getting Started for
full details.
In this section, you will learn how to create a Test Plan to test JMS Providers. You will create
five subscribers and one publisher. You will create 2 thread groups and set each one to 10
iterations. The total messages is (6 threads) x (1 message) x (repeat 10 times) = 60 messages. To
construct the Test Plan, you will use the following elements: Thread Group , JMS
Publisher , JMS Subscriber , and Graph Results .
General notes on JMS: There are currently two JMS samplers. One uses JMS topics and the

other uses queues. Topic messages are commonly known as pub/sub messaging. Topic
messaging is generally used in cases where a message is published by a producer and consumed
by multiple subscribers. Queue messaging is generally used for transactions where the sender
expects a response. Messaging systems are quite different from normal HTTP requests. In HTTP,
a single user sends a request and gets a response. Messaging system can work in sychronous and
asynchronous mode. A JMS sampler needs the JMS implementation jar files; for example, from
Apache ActiveMQ. See here for the list of jars provided by ActiveMQ 3.0.
12.1 Adding Users
The first step is add a Thread Group element. The Thread Group tells JMeter the number of users
you want to simulate, how often the users should send requests, and how many requests they
should send.
Go ahead and add the ThreadGroup element by first selecting the Test Plan, clicking your right
mouse button to get the Add menu, and then select Add --> ThreadGroup.
You should now see the Thread Group element under Test Plan. If you do not see the element,
then "expand" the Test Plan tree by clicking on the Test Plan element.
Next, you need to modify the default properties. Select the Thread Group element in the tree, if
you have not already selected it. You should now see the Thread Group Control Panel in the
right section of the JMeter window (see Figure 12.1 below)
Figure 12.1. Thread Group with Default Values
Start by providing a more descriptive name for our Thread Group. In the name field, enter
Subscribers.

Next, increase the number of users (called threads) to 5.
In the next field, the Ramp-Up Period, set the value to 0 seconds. This property tells JMeter how
long to delay between starting each user. For example, if you enter a Ramp-Up Period of 5
seconds, JMeter will finish starting all of your users by the end of the 5 seconds. So, if we have 5
users and a 5 second Ramp-Up Period, then the delay between starting users would be 1 second
(5 users / 5 seconds = 1 user per second). If you set the value to 0, JMeter will immediately start
all users.
Clear the checkbox labeled "Forever", and enter a value of 10 in the Loop Count field. This
property tells JMeter how many times to repeat your test. If you enter a loop count value of 0,
then JMeter will run your test only once. To have JMeter repeatedly run your Test Plan, select
the Forever checkbox.
Repeat the process and add another thread group. For the second thread group, enter "Publisher"
in the name field, set the number of threads to 1, and set the iteration to 10.
In most applications, you have to manually accept
changes you make in a Control Panel. However, in
JMeter, the Control Panel automatically accepts
your changes as you make them. If you change the
name of an element, the tree will be updated with
the new text after you leave the Control Panel (for
example, when selecting another tree element).
12.2 Adding JMS Subscriber and Publisher
Make sure the required jar files are in JMeter's lib directory. If they are not, shutdown JMeter,
copy the jar files over and restart JMeter.
Start by adding the sampler JMS Subscriber to the Subscribers element (Add --> Sampler -->
JMS Subscriber). Then, select the JMS Subscriber element in the tree and edit the following
properties:
1. Change the Name field to "sample subscriber" 2. If the JMS provider uses the jndi.properties file, check the box 3. Enter the name of the InitialContextFactory class 4. Enter the provider URL. This is the URL for the JNDI server, if there is one 5. Enter the name of the connection factory. Please refer to the documentation of the JMS
provider for the information 6. Enter the name of the message topic 7. If the JMS provider requires authentication, check "required" and enter the username and
password. For example, Orion JMS requires authentication, while ActiveMQ and MQSeries does not
8. Enter 10 in "Number of samples to aggregate". For performance reasons, the sampler will

aggregate messages, since small messages will arrive very quickly. If the sampler didn't aggregate the messages, JMeter wouldn't be able to keep up.
9. If you want to read the response, check the box 10. There are two client implementations for subscribers. If the JMS provider exhibits zombie
threads with one client, try the other.
Figure 12.2. JMS Subscriber
Next add the sampler JMS Publisher to the Publisher element (Add --> Sampler --> JMS
Subscriber). Then, select the JMS Publisher element in the tree and edit the following properties:
1. Change the Name field to "sample publisher". 2. If the JMS provider uses the jndi.properties file, check the box 3. Enter the name of the InitialContextFactory class. 4. Enter the provider URL. This is the URL for the JNDI server, if there is one 5. Enter the name of the connection factory. Please refer to the documentation of the JMS
provider for the information 6. Enter the name of the message topic 7. If the JMS provider requires authentication, check "required" and enter the username and
password. For example, Orion JMS requires authentication, while ActiveMQ and MQSeries does not
8. Enter 10 in "Number of samples to aggregate". For performance reasons, the sampler will aggregate messages, since small messages will arrive very quickly. If the sampler didn't

aggregate the messages, JMeter wouldn't be able to keep up. 9. Select the appropriate configuration for getting the message to publish. If you want the sampler
to randomly select the message, place the messages in a directory and select the directory using browse.
10. Select the message type. If the message is in object format, make sure the message is generated correctly.

Figure 12.3. JMS Publisher
12.3 Adding a Listener to View Store the Test Results
The final element you need to add to your Test Plan is a Listener . This element is responsible for
storing all of the results of your HTTP requests in a file and presenting a visual model of the

data.
Select the Test Plan element and add a Graph Results listener (Add --> Listener --> Graph
Results). Next, you need to specify a directory and filename of the output file. You can either
type it into the filename field, or select the Browse button and browse to a directory and then
enter a filename.
Figure 12.4. Graph Results Listener
13. Building a Monitor Test Plan
In this section, you will learn how to create a Test Plan to monitor webservers. Monitors are
useful for a stress testing and system management. Used with stress testing, the monitor provides
additional information about server performance. It also makes it easier to see the relationship
between server performance and response time on the client side. As a system administration
tool, the monitor provides an easy way to monitor multiple servers from one console. The
monitor was designed to work with the status servlet in Tomcat 5. In theory, any servlet
container that supports JMX (Java Management Extension) can port the status servlet to provide

the same information.
For those who want to use the monitor with other servlet or EJB containers, Tomcat's status
servlet should work with other containers for the memory statistics without any modifications.
To get thread information, you will need to change the MBeanServer lookup to retrieve the
correct MBeans.
13.1 Adding A Server
The first step is to add a Thread Group element. The Thread Group tells JMeter the number of
threads you want. Always use 1, since we are using JMeter as a monitor. This is very important
for those not familiar with server monitors. As a general rule, using multiple threads for a single
server is bad and can create significant stress.
Go ahead and add the ThreadGroup element by first selecting the Test Plan, clicking your right
mouse button to get the Add menu, and then select Add --> ThreadGroup.
You should now see the Thread Group element under Test Plan. If you do not see the element,
"expand" the Test Plan tree by clicking on the Test Plan element.
Figure 13.1. Thread Group with Default Values
Change the loop count to forever (or some large number) so that enough samples are generated.
13.2 HTTP Auth Manager
Add the HTTP Authorization Manager to the Thread Group element (Add --> Config element --
> HTTP Authorization Manager). Enter the username and password for your webserver.
Important note: the monitor only works with Tomcat5 build 5.0.19 and newer. For instructions

on how to setup Tomcat, please refer to tomcat 5 documentation.
1. leave the base URL blank 2. enter the username
3. enter the password
13.3 Adding HTTP Request
Add the HTTP Request to the Thread Group element (Add --> Sampler --> HTTP Request).
Then, select the HTTP Request element in the tree and edit the following properties):
1. Change the Name field to "Server Status". 2. Enter the IP address or Hostname 3. Enter the port number 4. Set the Path field to "/manager/status" if you're using Tomcat. 5. Add a request parameter named "XML" in uppercase. Give it a value of "true" in lowercase.
6. Check "Use as Monitor" at the bottom of the sampler
13.4 Adding Constant Timer
Add a timer to this thread group (Add --> Timer --> Constant Timer). Enter 5000 milliseconds in
the "Thread Delay" box. In general, using intervals shorter than 5 seconds will add stress to your
server. Find out what is an acceptable interval before you deploy the monitor in your production
environment.
13.5 Adding a Listener to Store the Results
If you want to save the raw results from the server, add a simple data Listener . If you want to
save the calculated statistics, enter a filename in the listener. If you want to save both the raw
data and statistics, make sure you use different filenames.
Select the thread group element and add a Simple Data Writer listener (Add --> Listener -->
Simple Data Writer). Next, you need to specify a directory and filename of the output file. You
can either type it into the filename field, or select the Browse button and browse to a directory
and then enter a filename.
13.6 Adding Monitor Results
Add the Listener by selecting the test plan element (Add --> Listener -- > Monitor Results).
By default, the Listener will select the results from the first connector in the sample response.
The Connector prefix field can be used to select a different connector. If specified, the Listener
will choose the first connector which matches the prefix. If no match is found, then the first
connector is selected.
There are two tabs in the monitor results listener. The first is the "Health", which displays the
status of the last sample the monitor received. The second tab is "Performance", which shows a

historical view of the server's performance.
A quick note about how health is calculated. Typically, a server will crash if it runs out of
memory, or reached the maximum number of threads. In the case of Tomcat 5, once the threads
are maxed out, requests are placed in a queue until a thread is available. The relative importance
of threads vary between containers, so the current implementation uses 50/50 to be conservative.
A container that is more efficient with thread management might not see any performance
degradation, but the used memory definitely will show an impact.

The performance graph shows for different lines. The free memory line shows how much free
memory is left in the current allocated block. Tomcat 5 returns the maximum memory, but it is
not graphed. In a well tuned environment, the server should never reach the maximum memory.
Note the graph has captions on both sides of the graph. On the left is percent and the right is
dead/healthy. If the memory line spikes up and down rapidly, it could indicate memory
thrashing. In those situations, it is a good idea to profile the application with Borland OptimizeIt
or JProbe. What you want to see is a regular pattern for load, memory and threads. Any erratic
behavior usually indicates poor performance or a bug of some sort.

14. Introduction to listeners
A listener is a component that shows the results of the samples. The results can be shown in a
tree, tables, graphs or simply written to a log file. To view the contents of a response from any
given sampler, add either of the Listeners "View Results Tree" or "View Results in table" to a
test plan. To view the response time graphically, add graph results, spline results or distribution
graph. The listeners section of the components page has full descriptions of all the listeners.
Different listeners display the response
information in different ways. However, they all
write the same raw data to the output file - if one
is specified.
The "Configure" button can be used to specify which fields to write to the file, and whether to
write it as CSV or XML. CSV files are much smaller than XML files, so use CSV if you are
generating lots of samples.
If you only wish to record certain samples, add the Listener as a child of the sampler. Or you can
use a Simple Controller to group a set of samplers, and add the Listener to that. The same
filename can be used by multiple samplers - but make sure they all use the same configuration!
14.1 Default Configuration
The default items to be saved can be defined in the jmeter.properties (or user.properties) file. The
properties are used as the initial settings for the Listener Config pop-up, and are also used for the
log file specified by the -l command-line flag (commonly used for non-GUI test runs).
To change the default format, find the following line in jmeter.properties:
jmeter.save.saveservice.output_format=
The information to be saved is configurable. For maximum information, choose "xml" as the
format and specify "Functional Test Mode" on the Test Plan element. If this box is not checked,
the default saved data includes a time stamp (the number of milliseconds since midnight, January
1, 1970 UTC), the data type, the thread name, the label, the response time, message, and code,
and a success indicator. If checked, all information, including the full response data will be
logged.
The following example indicates how to set properties to get a vertical bar ("|") delimited format
that will output results like:.
timeStamp|time|label|responseCode|threadName|dataType|success|failureMessage
02/06/03 08:21:42|1187|Home|200|Thread Group-1|text|true|

02/06/03 08:21:42|47|Login|200|Thread Group-1|text|false|Test Failed:
expected to contain: password etc.
The corresponding jmeter.properties that need to be set are shown below. One oddity in this
example is that the output_format is set to csv, which typically indicates comma-separated
values. However, the default_delimiter was set to be a vertical bar instead of a comma, so the csv
tag is a misnomer in this case. (Think of CSV as meaning character separated values)
jmeter.save.saveservice.output_format=csv
jmeter.save.saveservice.assertion_results_failure_message=true
jmeter.save.saveservice.default_delimiter=|
The full set of properties that affect result file output is shown below.
#---------------------------------------------------------------------------
# Results file configuration
#---------------------------------------------------------------------------
# This section helps determine how result data will be saved.
# The commented out values are the defaults.
# legitimate values: xml, csv, db. Only xml and csv are currently supported.
#jmeter.save.saveservice.output_format=xml
# true when field should be saved; false otherwise
# assertion_results_failure_message only affects CSV output
#jmeter.save.saveservice.assertion_results_failure_message=false
#
#jmeter.save.saveservice.data_type=true
#jmeter.save.saveservice.label=true
#jmeter.save.saveservice.response_code=true
# response_data is not currently supported for CSV output
#jmeter.save.saveservice.response_data=false
# Save ResponseData for failed samples
#jmeter.save.saveservice.response_data.on_error=false
#jmeter.save.saveservice.response_message=true
#jmeter.save.saveservice.successful=true
#jmeter.save.saveservice.thread_name=true
#jmeter.save.saveservice.time=true
#jmeter.save.saveservice.subresults=true
#jmeter.save.saveservice.assertions=true
#jmeter.save.saveservice.latency=true
#jmeter.save.saveservice.samplerData=false
#jmeter.save.saveservice.responseHeaders=false
#jmeter.save.saveservice.requestHeaders=false
#jmeter.save.saveservice.encoding=false
#jmeter.save.saveservice.bytes=true
#jmeter.save.saveservice.url=false

#jmeter.save.saveservice.filename=false
#jmeter.save.saveservice.hostname=false
#jmeter.save.saveservice.thread_counts=false
#jmeter.save.saveservice.sample_count=false
#jmeter.save.saveservice.idle_time=false
# Timestamp format
# legitimate values: none, ms, or a format suitable for SimpleDateFormat
#jmeter.save.saveservice.timestamp_format=ms
#jmeter.save.saveservice.timestamp_format=MM/dd/yy HH:mm:ss
# Put the start time stamp in logs instead of the end
sampleresult.timestamp.start=true
# legitimate values: none, first, all
#jmeter.save.saveservice.assertion_results=none
# For use with Comma-separated value (CSV) files or other formats
# where the fields' values are separated by specified delimiters.
# Default:
#jmeter.save.saveservice.default_delimiter=,
# For TAB, since JMeter 2.3 one can use:
#jmeter.save.saveservice.default_delimiter=\t
#jmeter.save.saveservice.print_field_names=false
# Optional list of JMeter variable names whose values are to be saved in the
result data files.
# Use commas to separate the names. For example:
#sample_variables=SESSION_ID,REFERENCE
# N.B. The current implementation saves the values in XML as attributes,
# so the names must be valid XML names.
# Versions of JMeter after 2.3.2 send the variable to all servers
# to ensure that the correct data is available at the client.
# Optional xml processing instruction for line 2 of the file:
#jmeter.save.saveservice.xml_pi=<?xml-stylesheet type="text/xsl"
href="sample.xsl"?>
The date format to be used for the timestamp_format is described in SimpleDateFormat . Bear
in mind that choosing a date format other than "ms" is likely to make it impossible for JMeter to
interpret the value when it is read in later for viewing purposes.
14.1.1 Sample Variables
Versions of JMeter after 2.3.1 allow one to use the sample_variables property to define a list of
additional JMeter variables which are to be saved with each sample in the JTL files. The values
are written to CSV files as additional columns, and as additional attributes in XML files. See
above for an example.
14.1.2 Sample Result Save Configuration

Listeners can be configured to save different items to the result log files (JTL) by using the
Config popup as shown below. The defaults are defined as described in the Listener Default
Configuration section above. Items with (CSV) after the name only apply to the CSV format;
items with (XML) only apply to XML format. CSV format cannot currently be used to save any
items that include line-breaks.
Configuration dialogue
Note that cookies, method and the query string are saved as part of the "Sampler Data" option.
14.2 non-GUI (batch) test runs
When running in non-GUI mode, the -l flag can be used to create a top-level listener for the test
run. This is in addition to any Listeners defined in the test plan. The configuration of this listener
is controlled by entries in the file jmeter.properties as described in the previous section.
This feature can be used to specify different data and log files for each test run, for example:
jmeter -n -t testplan.jmx -l testplan_01.jtl -j testplan_01.log
jmeter -n -t testplan.jmx -l testplan_02.jtl -j testplan_02.log
Note that JMeter logging messages are written to the file jmeter.log by default. This file is
recreated each time, so if you want to keep the log files for each run, you will need to rename it
using the -j option as above. The -j option was added in version 2.3.

Versions of JMeter after 2.3.1 support variables in the log file name. If the filename contains
paired single-quotes, then the name is processed as a SimpleDateFormat format applied to the
current date, for example: log_file='jmeter_'yyyyMMddHHmmss'.tmp' . This can be used to
generate a unique name for each test run.
14.3 Resource usage
Listeners can use a lot of memory if there are a lot of samples. Most of the listeners currently
keep a copy of every sample they display, apart from:
Simple Data Writer BeanShell/BSF Listener Mailer Visualizer Monitor Results Summary Report
The following Listeners no longer need to keep copies of every single sample. Instead, samples
with the same elapsed time are aggregated. Less memory is now needed, especially if most
samples only take a second or two at most.
Aggregate Report Aggregate Graph Distribution Graph
To minimise the amount of memory needed, use the Simple Data Writer, and use the CSV
format.
14.4 CSV Log format
The CSV log format depends on which data items are selected in the configuration. Only the
specified data items are recorded in the file. The order of appearance of columns is fixed, and is
as follows:
timeStamp - in milliseconds since 1/1/1970 elapsed - in milliseconds label - sampler label responseCode - e.g. 200, 404 responseMessage - e.g. OK threadName dataType - e.g. text success - true or false failureMessage - if any bytes - number of bytes in the sample grpThreads - number of active threads in this thread group allThreads - total number of active threads in all groups URL Filename - if Save Response to File was used latency - time to first response

encoding SampleCount - number of samples (1, unless multiple samples are aggregated) ErrorCount - number of errors (0 or 1, unless multiple samples are aggregated) Hostname where the sample was generated IdleTime - number of milliseconds of 'Idle' time (normally 0) Variables, if specified
14.5 XML Log format 2.1
The format of the updated XML (2.1) is as follows (line breaks will be different):
<?xml version="1.0" encoding="UTF-8"?>
<testResults version="1.2">
-- HTTP Sample, with nested samples
<httpSample t="1392" lt="351" ts="1144371014619" s="true"
lb="HTTP Request" rc="200" rm="OK"
tn="Listen 1-1" dt="text" de="iso-8859-1" by="12407">
<httpSample t="170" lt="170" ts="1144371015471" s="true"
lb="http://www.apache.org/style/style.css" rc="200" rm="OK"
tn="Listen 1-1" dt="text" de="ISO-8859-1" by="1002">
<responseHeader class="java.lang.String">HTTP/1.1 200 OK
Date: Fri, 07 Apr 2006 00:50:14 GMT
...
Content-Type: text/css
</responseHeader>
<requestHeader class="java.lang.String">MyHeader: MyValue</requestHeader>
<responseData class="java.lang.String">body, td, th {
font-size: 95%;
font-family: Arial, Geneva, Helvetica, sans-serif;
color: black;
background-color: white;
}
...
</responseData>
<cookies class="java.lang.String"></cookies>
<method class="java.lang.String">GET</method>
<queryString class="java.lang.String"></queryString>
<url>http://www.apache.org/style/style.css</url>
</httpSample>
<httpSample t="200" lt="180" ts="1144371015641" s="true"
lb="http://www.apache.org/images/asf_logo_wide.gif"
rc="200" rm="OK" tn="Listen 1-1" dt="bin" de="ISO-8859-1" by="5866">
<responseHeader class="java.lang.String">HTTP/1.1 200 OK
Date: Fri, 07 Apr 2006 00:50:14 GMT
...
Content-Type: image/gif
</responseHeader>
<requestHeader class="java.lang.String">MyHeader: MyValue</requestHeader>
<responseData
class="java.lang.String">http://www.apache.org/asf.gif</responseData>
<responseFile class="java.lang.String">Mixed1.html</responseFile>

<cookies class="java.lang.String"></cookies>
<method class="java.lang.String">GET</method>
<queryString class="java.lang.String"></queryString>
<url>http://www.apache.org/asf.gif</url>
</httpSample>
<responseHeader class="java.lang.String">HTTP/1.1 200 OK
Date: Fri, 07 Apr 2006 00:50:13 GMT
...
Content-Type: text/html; charset=ISO-8859-1
</responseHeader>
<requestHeader class="java.lang.String">MyHeader: MyValue</requestHeader>
<responseData class="java.lang.String">
...
<html>
<head>
...
</head>
<body>
...
</body>
</html>
</responseData>
<cookies class="java.lang.String"></cookies>
<method class="java.lang.String">GET</method>
<queryString class="java.lang.String"></queryString>
<url>http://www.apache.org/</url>
</httpSample>
-- nonHTTPP Sample
<sample t="0" lt="0" ts="1144372616082" s="true" lb="Example Sampler"
rc="200" rm="OK" tn="Listen 1-1" dt="text" de="ISO-8859-1" by="10">
<responseHeader class="java.lang.String"></responseHeader>
<requestHeader class="java.lang.String"></requestHeader>
<responseData class="java.lang.String">Listen 1-1</responseData>
<responseFile class="java.lang.String">Mixed2.unknown</responseFile>
<samplerData class="java.lang.String">ssssss</samplerData>
</sample>
</testResults>
Note that the sample node name may be either "sample" or "httpSample".
14.6 XML Log format 2.2
The format of the JTL files is identical for 2.2 and 2.1. Format 2.2 only affects JMX files.
14.7 Sample Attributes
The sample attributes have the following meaning:
Attribute Content

by Bytes
de Data encoding
dt Data type
ec Error count (0 or 1, unless multiple samples are aggregated)
hn Hostname where the sample was generated
it Idle Time = time not spent sampling (milliseconds) (generally 0)
lb Label
lt Latency = time to initial response (milliseconds) - not all samplers support this
na Number of active threads for all thread groups
ng Number of active threads in this group
rc Response Code (e.g. 200)
rm Response Message (e.g. OK)
s Success flag (true/false)
sc Sample count (1, unless multiple samples are aggregated)
t Elapsed time (milliseconds)
tn Thread Name
ts timeStamp (milliseconds since midnight Jan 1, 1970 UTC)
varname Value of the named variable (versions of JMeter after 2.3.1)
Versions 2.1 and 2.1.1 of JMeter saved the Response Code as "rs", but read it back expecting to
find "rc". This has been corrected so that it is always saved as "rc"; either "rc" or "rs" can be
read.
Versions of JMeter after 2.3.1 allow additional
variables to be saved with the test plan. Currently,
the variables are saved as additional attributes.
The testplan variable name is used as the attribute
name. See Sample variables (above) for more

information.
14.8 Saving response data
As shown above, the response data can be saved in the XML log file if required. However, this
can make the file rather large, and the text has to be encoded so that it is still valid XML. Also,
images cannot be included.
Another solution is to use the Post-Processor Save_Responses_to_a_file . This generates a new
file for each sample, and saves the file name with the sample. The file name can then be included
in the sample log output. The data will be retrieved from the file if necessary when the sample
log file is reloaded.
14.9 Loading (reading) response data
To view an existing results file, you can use the File "Browse..." button to select a file. If
necessary, just create a dummy testplan with the appropriate Listener in it.
Results can be read from XML or CSV format files. When reading from CSV results files, the
header (if present) is used to determine which fields were saved. In order to interpret a
header-less CSV file correctly, the appropriate JMeter properties must be set.
Versions of JMeter up to 2.3.2 used to clear any
current data before loading the new file. This is no
longer done, thus allowing files to be merged. If
the previous behaviour is required, use the menu
item Run/Clear (Ctrl+Shift+E) or Run/Clear All
(Ctrl+E) before loading the file.
14.10 Saving Listener GUI data
JMeter is capable of saving any listener as a PNG file. To do so, select the listener in the left
panel. Click edit -> Save As Image. A file dialog will appear. Enter the desired name and save
the listener.
The Listeners which generate output as tables can also be saved using Copy/Paste. Select the
desired cells in the table, and use the OS Copy short-cut (normally Control+C). The data will be
saved to the clipboard, from where it can be pasted into another application, e.g. a spreadsheet or
text editor.

Figure 1 - Edit -> Save As Image
15. Remote Testing
In the event that your JMeter client machine is unable, performance-wise, to simulate enough
users to stress your server, an option exists to control multiple, remote JMeter engines from a
single JMeter GUI client. By running JMeter remotely, you can replicate a test across many low-
end computers and thus simulate a larger load on the server. One instance of the JMeter GUI
client can control any number of remote JMeter instances, and collect all the data from them.
This offers the following features:
Saving of test samples to the local machine Managment of multiple JMeterEngines from a single machine No need to copy the test plan to each server - the client sends it to all the servers
Note: The same test plan is run by all the servers.
JMeter does not distribute the load between
servers, each runs the full test plan.
However, remote mode does use more resources than running the same number of non-GUI tests
independently. If many server instances are used, the client JMeter can become overloaded, as
can the client network connection.

Note that while you can execute the JMeterEngine on your application server, you need to be
mindful of the fact that this will be adding processing overhead on the application server and
thus your testing results will be somewhat tainted. The recommended approach is to have one or
more machines on the same Ethernet segment as your application server that you configure to
run the JMeter Engine. This will minimize the impact of the network on the test results without
impacting the performance of the application serer itself.
Step 0: Configure the nodes
Make sure that all the nodes (client and servers) are running exactly the same version of JMeter.
As far as possible, also use the same version of Java on all systems. Using different versions of
Java may work - but is best avoided.
If the test uses any data files, note that these are not sent across by the client so make sure that
these are available in the appropriate directory on each server. If necessary you can define
different values for properties by editting the user.properties or system.properties files on each
server. These properties will be picked up when the server is started and may be used in the test
plan to affect its behaviour (e.g. connecting to a different remote server). Alternatively use
different content in any datafiles used by the test (e.g. if each server must use unique ids, divide
these between the data files)
Step 1: Start the servers
To run JMeter in remote node, start the JMeter server component on all machines you wish to
run on by running the JMETER_HOME/bin/jmeter-server (unix)
orJMETER_HOME/bin/jmeter-server.bat (windows) script.
Note that there can only be one JMeter server on each node unless different RMI ports are used.
Since JMeter 2.3.1, the JMeter server application starts the RMI registry itself; there is no need
to start RMI registry separately. To revert to the previous behaviour, define the JMeter property
server.rmi.create=false on the server host systems.
By default, RMI uses a dynamic port for the JMeter server engine. This can cause problems for
firewalls, so versions of JMeter after 2.3.2 will check for the JMeter
propertyserver.rmi.localport . If this is non-zero, it will be used as the local port number for the
server engine.
Step 2: Add the server IP to your client's Properties File
Edit the properties file on the controlling JMeter machine . In /bin/jmeter.properties, find the
property named, "remote_hosts", and add the value of your running JMeter server's IP address.
Multiple such servers can be added, comma-delimited.
Note that you can use the -R command line option instead to specify the remote host(s) to use.
This has the same effect as using -r and -Jremote_hosts={serverlist}. E.g. jmeter -

Rhost1,127.0.0.1,host2
If you define the JMeter property server.exitaftertest=true, then the server will exit after it runs a
single test. See also the -X flag (described below)
Step 3a: Start the JMeter Client from a GUI client
Now you are ready to start the controlling JMeter client. For MS-Windows, start the client with
the script "bin/jmeter.bat". For UNIX, use the script "bin/jmeter". You will notice that the Run
menu contains two new sub-menus: "Remote Start" and "Remote Stop" (see figure 1). These
menus contain the client that you set in the properties file. Use the remote start and stop instead
of the normal JMeter start and stop menu items.
Figure 1 - Run Menu
Step 3b: Start the JMeter from a non-GUI Client
As an alternative, you can start the remote server(s) from a non-GUI (command-line) client. The
command to do this is:
jmeter -n -t script.jmx -r
or
jmeter -n -t script.jmx -R server1,server2...
Other flags that may be useful:
-Gproperty=value - define a property in all the servers (may appear more than
once)
-Z - Exit remote servers at the end of the test.
The first example will start whatever servers are defined in the JMeter property remote_hosts; the
second example will define remote_hosts from the list of servers and then run the remote servers.
The command-line client will exit when all the remote servers have stopped.
15.1 Doing it Manually
In some cases, the jmeter-server script may not work for you (if you are using an OS platform

not anticipated by the JMeter developers). Here is how to start the JMeter servers (step 1 above)
with a more manual process:
Step 1a: Start the RMI Registry
Since JMeter 2.3.1, the RMI registry is started by the JMeter server, so this section does not
apply in the normal case. To revert to the previous behaviour, define the JMeter property
server.rmi.create=false on the server host systems and follow the instructions below.
JMeter uses Remote Method Invocation (RMI) as the remote communication mechanism.
Therefore, you need to run the RMI Registry application (which is named, "rmiregistry") that
comes with the JDK and is located in the "bin" directory. Before running rmiregistry, make sure
that the following jars are in your system claspath:
JMETER_HOME/lib/ext/ApacheJMeter_core.jar JMETER_HOME/lib/jorphan.jar JMETER_HOME/lib/logkit-1.2.jar
The rmiregistry application needs access to certain JMeter classes. Run rmiregistry with no parameters.
By default the application listens to port 1099.
Step 1b: Start the JMeter Server
Once the RMI Registry application is running, start the JMeter Server. Use the "-s" option with
the jmeter startup script ("jmeter -s").
Steps 2 and 3 remain the same.
15.2 Tips
JMeter/RMI requires a connection from the client to the server. This will use the port you chose,
default 1099. JMeter/RMI also requires a reverse connection in order to return sample results
from the server to the client. This will use a high-numbered port. If there are any firewalls or
other network filters between JMeter client and server, you will need to make sure that they are
set up to allow the connections through. If necessary, use monitoring software to show what
traffic is being generated.
If you're running Suse Linux, these tips may help. The default installation may enable the
firewall. In that case, remote testing will not work properly. The following tips were contributed
by Sergey Ten.
If you see connections refused, turn on debugging by passing the following options.
Since JMeter 2.3.1, the RMI registry is started by the server; however the options can still be
passed in from the JMeter command line. For example: "jmeter -s -
Dsun.rmi.loader.logLevel=verbose" (i.e. omit the -J prefixes). Alternatively the properties can

be defined in the system.properties file.
The solution to the problem is to remove the loopbacks 127.0.0.1 and 127.0.0.2 from etc/hosts.
What happens is jmeter-server can't connect to rmiregistry if 127.0.0.2 loopback is not available.
Use the following settings to fix the problem.
Replace
`dirname $0`/jmeter -s "$@"
With
HOST="-Djava.rmi.server.hostname=[computer_name][computer_domain] -Djava.security.policy=`dirname $0`/[policy_file]" `dirname $0`/jmeter $HOST -s "$@"
Also create a policy file and add [computer_name][computer_domain] line to /etc/hosts.
15.3 Using a different port
By default, JMeter uses the standard RMI port 1099. It is possible to change this. For this to
work successfully, all the following need to agree:
On the server, start rmiregistry using the new port number On the server, start JMeter with the property server_port defined On the client, update the remote_hosts property to include the new remote host:port settings
Since Jmeter 2.1.1, the jmeter-server scripts provide support for changing the port. For example,
assume you want to use port 1664 (perhaps 1099 is already used).
On Windows (in a DOS box)
C:\JMETER> SET SERVER_PORT=1664
C:\JMETER> JMETER-SERVER [other options]
On Unix:
$ SERVER_PORT=1664 jmeter-server [other options]
[N.B. use upper case for the environment variable]
In both cases, the script starts rmiregistry on the specified port, and then starts JMeter in server
mode, having defined the "server_port" property.
The chosen port will be logged in the server jmeter.log file (rmiregistry does not create a log
file).
15.4 Using sample batching
Listeners in the test plan send their results back to the client JMeter which writes the results to

the specified files By default, samples are sent back as they are generated. This can place a large
load on the network and the JMeter client. There are some JMeter properties that can be set to
alter this behaviour.
mode - sample sending mode - default is Standard o Standard - send samples as soon as they are generated o Hold - hold samples in an array until the end of a run. This may use a lot of memory on
the server. o Batch - send saved samples when either the count or time exceeds a threshold o Statistical - send a summary sample when either the count or time exceeds a threshold.
The samples are summarised by thread group name and sample label. The following fields are accumulated:
elapsed time latency bytes sample count error count
Other fields that vary between samples are lost.
o Stripped - remove responseData from succesful samples o StrippedBatch - remove responseData from succesful samples, and send as batches o Custom implementation : set the mode parameter to your custom sample sender class
name. This must implement the interface SampleSender and have a constructor which takes a single parameter of type RemoteSampleListener.
The following properties apply to the Batch and Statistical modes:
num_sample_threshold - number of samples in a batch (default 100) time_threshold - number of milliseconds to wait (default 60 seconds)
16. Best Practices
16.1 Limit the Number of Threads
Your hardware's capabilities will limit the number of threads you can effectively run with
JMeter. It will also depend on how fast your server is (a faster server gives makes JMeter work
harder since it returns request quicker). The more JMeter works, the less accurate its timing
information will be. The more work JMeter does, the more each thread has to wait to get access
to the CPU, the more inflated the timing information gets. If you need large-scale load testing,
consider running multiple non-GUI JMeter instances on multiple machines.
16.2 Where to Put the Cookie Manager

See Building a Web Test for information.
16.3 Where to Put the Authorization Manager
See Building an Advanced Web Test for information.
16.4 Using the Proxy Server
Refer to HTTP Proxy Server for details on setting up the proxy server. The most important thing
to do is filter out all requests you aren't interested in. For instance, there's no point in recording
image requests (JMeter can be instructed to download all images on a page - see HTTP
Request ). These will just clutter your test plan. Most likely, there is an extension all your files
share, such as .jsp, .asp, .php, .html or the like. These you should "include" by entering ".*\.jsp"
as an "Include Pattern".
Alternatively, you can exclude images by entering ".*\.gif" as an "Exclude Pattern". Depending
on your application, this may or may not be a better way to go. You may also have to exclude
stylesheets, javascript files, and other included files. Test out your settings to verify you are
recording what you want, and then erase and start fresh.
The Proxy Server expects to find a ThreadGroup element with a Recording Controller under it
where it will record HTTP Requests to. This conveniently packages all your samples under one
controller, which can be given a name that describes the test case.
Now, go through the steps of a Test Case. If you have no pre-defined test cases, use JMeter to
record your actions to define your test cases. Once you have finished a definite series of steps,
save the entire test case in an appropriately named file. Then, wipe clean and start a new test
case. By doing this, you can quickly record a large number of test case "rough drafts".
One of the most useful features of the Proxy Server is that you can abstract out certain common
elements from the recorded samples. By defining some user-defined variablesat the Test Plan
level or in User Defined Variables elements, you can have JMeter automatically replace values
in you recorded samples. For instance, if you are testing an app on server "xxx.example.com",
then you can define a variable called "server" with the value of "xxx.example.com", and
anyplace that value is found in your recorded samples will be replaced with "${server}".
Please note that matching is case-sensitive.
If JMeter does not record any samples, check that the brower really is using the proxy. If the
browser works OK even if JMeter is not running, then the browser cannot be using the proxy.
Some browsers ignore proxy settings for localhost or 127.0.0.1; try using the local hostname or
IP instead.
The error "unknown_ca" probably means that you are trying to record HTTPS, and the browser
has not accepted the JMeter Proxy server certificate.

16.5 User variables
Some test plans need to use different values for different users/threads. For example, you might
want to test a sequence that requires a unique login for each user. This is easy to achieve with the
facilities provided by JMeter.
For example:
Create a text file containing the user names and passwords, separated by commas. Put this in the same directory as your test plan.
Add a CSV DataSet configuration element to the test plan. Name the variables USER and PASS. Replace the login name with ${USER} and the password with ${PASS} on the appropriate
samplers
The CSV Data Set element will read a new line for each thread.
16.6 Reducing resource requirements
Some suggestions on reducing resource usage.
Use non-GUI mode: jmeter -n -t test.jmx -l test.jtl Use as few Listeners as possible; if using the -l flag as above they can all be deleted or disabled. Rather than using lots of similar samplers, use the same sampler in a loop, and use variables
(CSV Data Set) to vary the sample. Or perhaps use the Access Log Sampler. [The Include Controller does not help here, as it adds all the test elements in the file to the test plan.]
Don't use functional mode Use CSV output rather than XML Only save the data that you need Use as few Assertions as possible
If your test needs large amounts of data - particularly if it needs to be randomised - create the test
data in a file that can be read with CSV Dataset. This avoids wasting resources at run-time.
16.7 BeanShell server
The BeanShell interpreter has a very useful feature - it can act as a server, which is accessible by
telnet or http.
There is no security. Anyone who can connect to
the port can issue any BeanShell commands. These
can provide unrestricted access to the JMeter
application and the host. Do not enable the server
unless the ports are protected against access, e.g.
by a firewall.

If you do wish to use the server, define the following in jmeter.properties:
beanshell.server.port=9000
beanshell.server.file=../extras/startup.bsh
In the above example, the server will be started, and will listen on ports 9000 and 9001. Port
9000 will be used for http access. Port 9001 will be used for telnet access. The startup.bsh file
will be processed by the server, and can be used to define various functions and set up variables.
The startup file defines methods for setting and printing JMeter and system properties. This is
what you should see in the JMeter console:
Startup script running
Startup script completed
Httpd started on port: 9000
Sessiond started on port: 9001
As a practical example, assume you have a long-running JMeter test running in non-GUI mode,
and you want to vary the throughput at various times during the test. The test-plan includes a
Constant Throughput Timer which is defined in terms of a property, e.g. ${__P(throughput)}.
The following BeanShell commands could be used to change the test:
printprop("throughput");
curr=Integer.decode(args[0]); // Start value
inc=Integer.decode(args[1]); // Increment
end=Integer.decode(args[2]); // Final value
secs=Integer.decode(args[3]); // Wait between changes
while(curr <= end){
setprop("throughput",curr.toString()); // Needs to be a string here
Thread.sleep(secs*1000);
curr += inc;
}
printprop("throughput");
The script can be stored in a file (throughput.bsh, say), and sent to the server using bshclient.jar.
For example:
java -jar ../lib/bshclient.jar localhost 9000 throughput.bsh 70 5 100 60
16.8 BeanShell scripting
16.8.1 Overview

Each BeanShell test element has its own copy of the interpreter (for each thread). If the test
element is repeatedly called, e.g. within a loop, then the interpreter is retained between
invocations unless the "Reset bsh.Interpreter before each call" option is selected.
Some long-running tests may cause the interpreter to use lots of memory; if this is the case try
using the reset option.
You can test BeanShell scripts outside JMeter by using the command-line interpreter:
$ java -cp bsh-xxx.jar[;other jars as needed] bsh.Interperter file.bsh
[parameters]
or
$ java -cp bsh-xxx.jar bsh.Interperter
bsh% source("file.bsh");
bsh% exit(); // or use EOF key (e.g. ^Z or ^D)
16.8.2 Sharing Variables
Variables can be defined in startup (initialisation) scripts. These will be retained across
invocations of the test element, unless the reset option is used.\
Scripts can also access JMeter variables using the get() and put() methods of the "vars" variable,
for example: vars.get("HOST"); vars.put("MSG","Successful"); . The get() and put()
methods only support variables with String values, but there are also getObject() and
putObject() methods which can be used for arbitrary objects. JMeter variables are local to a
thread, but can be used by all test elements (not just Beanshell).
If you need to share variables between threads, then JMeter properties can be used:
import org.apache.jmeter.util.JMeterUtils;
String value=JMeterUtils.getPropDefault("name","");
JMeterUtils.setProperty("name", "value");
The sample .bshrc files contain sample definitions of getprop() and setprop() methods.
Another possible method of sharing variables is to use the "bsh.shared" shared namespace. For
example:
if (bsh.shared.myObj == void){
// not yet defined, so create it:
myObj=new AnyObject();
}
bsh.shared.myObj.process();
Rather than creating the object in the test element, it can be created in the startup file defined by the

JMeter property "beanshell.init.file". This is only processed once.
16.9 Developing script functions in BeanShell, Javascript or Jexl etc.
It's quite hard to write and test scripts as functions. However, JMeter has the BSF (and
BeanShell) samplers which can be used instead.
Create a simple Test Plan containing the BSF Sampler and Tree View Listener. Code the script
in the sampler script pane, and test it by running the test. If there are any errors, these will show
up in the Tree View. Also the result of running the script will show up as the response.
Once the script is working properly, it can be stored as a variable on the Test Plan. The script
variable can then be used to create the function call. For example, suppose a BeanShell script is
stored in the variable RANDOM_NAME. The function call can then be coded
as ${__BeanShell(${RANDOM_NAME})} . There is no need to escape any commas in the script,
because the function call is parsed before the variable's value is interpolated.
16.10 Parameterising tests
Often it is useful to be able to re-run the same test with different settings. For example, changing
the number of threads or loops, or changing a hostname.
One way to do this is to define a set of variables on the Test Plan, and then use those variables in
the test elements. For example, one could define the variable LOOPS=10, and refer to that in the
Thread Group as ${LOOPS}. To run the test with 20 loops, just change the value of the LOOPS
variable on the Test Plan.
This quickly becomes tedious if you want to run lots of tests in non-GUI mode. One solution to
this is to define the Test Plan variable in terms of a property, for
exampleLOOPS=${__P(loops,10))} . This uses the value of the property "loops", defaulting to
10 if the property is not found. The "loops" property can then be defined on the JMeter
command-line: jmeter ... -Jloops=12 ... . If there are a lot of properties that need to be
changed together, then one way to achieve this is to use a set of property files. The appropriate
property file can be passed in to JMeter using the -q command-line option.
17. Help! My boss wants me to load test our web app!
This is a fairly open-ended proposition. There are a number of questions to be asked first, and
additionally a number of resources that will be needed. You will need some hardware to run the
benchmarks/load-tests from. A number of tools will prove useful. There are a number of
products to consider. And finally, why is Java a good choice to implement a load-
testing/Benchmarking product.
17.1 Questions to ask

What is our anticipated average number of users (normal load) ?
What is our anticipated peak number of users ?
When is a good time to load-test our application (i.e. off-hours or week-ends), bearing in mind
that this may very well crash one or more of our servers ?
Does our application have state ? If so, how does our application manage it (cookies, session-
rewriting, or some other method) ?
What is the testing intended to achieve?
17.2 Resources
The following resources will prove very helpful. Bear in mind that if you cannot locate these
resources, you will become these resources. As you already have your work cut out for you, it is
worth knowing who the following people are, so that you can ask them for help if you need it.
17.2.1 Network
Who knows our network topology ? If you run into any firewall or proxy issues, this will
become very important. As well, a private testing network (which will therefore have very low
network latency) would be a very nice thing. Knowing who can set one up for you (if you feel
that this is necessary) will be very useful. If the application doesn't scale as expected, who can
add additional hardware ?
17.2.2 Application
Who knows how our application functions ? The normal sequence is
test (low-volume - can we benchmark our application?)
benchmark (the average number of users)
load-test (the maximum number of users)
test destructively (what is our hard limit?)
The test process may progress from black-box testing to white-box testing (the difference is
that the first requires no knowledge of the application [it is treated as a "black box"] while the
second requires some knowledge of the application). It is not uncommon to discover problems
with the application during this process, so be prepared to defend your work.
17.3 What platform should I use to run the benchmarks/load-tests ?
This should be a widely-used piece of hardware, with a standard (i.e. vanilla) software
installation. Remember, if you publish your results, the first thing your clients will do is hire a
graduate student to verify them. You might as well make it as easy for this person as you
possibly can.
For Windows, Windows XP Professional should be a minimum (the others do not multi-thread
past 50-60 connections, and you probably anticipate more users than that).

Good free platforms include the linuxes, the BSDs, and Solaris Intel. If you have a little more
money, there are commercial linuxes. If you can justify it, a commercial Unix (Solaris, etc) is
probably the best choice.
For non-Windows platforms, investigate "ulimit -n unlimited" with a view to including it in your
user account startup scripts (.bashrc or .cshrc scripts for the testing account).
As you progress to larger-scale benchmarks/load-tests, this platform will become the limiting
factor. So it's worth using the best hardware and software that you have available. Remember to
include the hardware/software configuration in your published benchmarks.
Don't forget JMeter batch mode. This can be useful if you have a powerful server that supports
Java but perhaps does not have a fast graphics implementation, or where you need to login
remotely. Batch (non-GUI) mode can reduce the network traffic compared with using a remote
display or client-server mode. The batch log file can then be loaded into JMeter on a workstation
for analysis, or you can use CSV output and import the data into a spreadsheet.
17.4 Tools
The following tools will all prove useful. It is definitely worthwhile to become familiar with
them. This should include trying them out, and reading the appropriate documentation (man-
pages, info-files, application --help messages, and any supplied documentation).
17.4.1 ping
This can be used to establish whether or not you can reach your target site. Options can be
specified so that 'ping' provides the same type of route reporting as 'traceroute'.
17.4.2 nslookup/dig
While the user will normally use a human-readable internet address, you may wish to avoid the
overhead of DNS lookups when performing benchmarking/load-testing. These can be used to
determine the unique address (dotted quad) of your target site.
17.4.3 traceroute
If you cannot "ping" your target site, this may be used to determine the problem (possibly a
firewall or a proxy). It can also be used to estimate the overall network latency (running locally
should give the lowest possible network latency - remember that your users will be running
over a possibly busy internet). Generally, the fewer hops the better.
17.5 What other products are there ?
There are a number of commercial products, which generally have fairly hefty pricetags. If you
can justify it, these are probably the way to go. If, however, these products do not do exactly
what you want, or you are on a limited budget, the following are worth a look. In fact, you
should probably start by trying the Apache ab tool, as it may very well do the job if your
requirements are not particularly complicated.
17.5.1 Apache 'ab' tool
You should definitely start with this one. It handles HTTP 'get' requests very well, and can be

made to handle HTTP 'post' requests with a little effort. Written in 'C', it performs very well,
and offers good (if basic) performance reporting.
17.5.2 HttpUnit
This is worth a look. It is a library (and therefore of more interest to developers) that can be
used to perform HTTP tests/benchmarks. It is intended to be used instead of a web browser
(therefore no GUI) in conjunction with JUnit .
17.5.3 Microsoft WAS
This is definitely worth a look. It has an excellent user interface but it may not do exactly what
you want. If this is the case, be aware that the functionality of this product is not likely to
change.
17.5.4 JMeter
If you have non-standard requirements, then this solution offers an open-source community to
provide them (of course, if you are reading this , you are probably already committed to this
one). This product is free to evolve along with your requirements.
17.6 Why Java ?
Why not Perl or C ?
Well, Perl might be a very good choice except that the Benchmark package seems to give fairly
fuzzy results. Also, simulating multiple users with Perl is a tricky proposition (multiple
connections can be simulated by forking many processes from a shell script, but these will not
be threads, they will be processes). However, the Perl community is very large. If you find that
someone has already written something that seems useful, this could be a very good solution.
C, of course, is a very good choice (check out the Apache ab tool). But be prepared to write all
of the custom networking, threading, and state management code that you will need to
benchmark your application.
Java gives you (for free) the custom networking, threading, and state management code that you
will need to benchmark your application. Java is aware of HTTP, FTP, and HTTPS - as well as
RMI, IIOP, and JDBC (not to mention cookies, URL-encoding, and URL-rewriting). In addition
Java gives you automatic garbage-collection, and byte-code level security.
And once Microsoft moves to a CLR (common language run-time) a Windows Java solution
will not be any slower than any other type of solution on the Windows platform.