ap42 chapter 1 reference - us epa · ap-42 section number: 1.1 1 reference number: 2 title:...
TRANSCRIPT
AP-42 Section Number: 1.1 1
Reference Number: 2
Title: Environmental Characterization of Disposal of Waste Oils in Small Combustors
EPA 60012-84-1 50
US EPA
September 1984

h ' I
i "
, . $! . , --
.
213 Burlington Road GCA Bedlord, Mass. 01730
PROJECT SUMMARY:
ENVIRONMENTAL CHARAC'TERIZA'l'ION OF DISPOSAL OF WASTE O I L S BY
COMBUSTION I N SMALL COMMERCIAL BOILERS
Prepared by
Paul Fennelly Joanna Hall Mark McCabe
GCA CORPORATION GCA/TEC"OLOGY D I V I S I O N
Bedford. Massachusetts 01730
Contract No. 68-02-3168 Task Nos. 68 and 88
EPA Project Managers
Harry Freeman Indus t r ia l Environmental Research Laboratory
Cincinnati, OH and
Michael Petruska Office of Sol id Waste
Washington, D.C.
Prepared for:
U.S. ENVIRONMENTAL PROTECTION AGENCY Office of Solid Waste and
Office of Research and Development

PROJECT SUMMAKY
PURPOSE AND SCOPE OF THE PROJECT
In recent years the environmental impact of the disposal of used oils has
been an area of growing concern.
Federal agencies have documented the presence of contaminants such as
polynuclear aromatics (€"As), chlorinated hydrocarbons and heavy metals in
samples of used motor oils. One of the more common and widespread practices
for disposing of used oils is burning as a supplemental fuel.
waste oil is burned directly; in others, it is blended with other fuel
feedstocks.
Numerous studies conducted by state and
In some cases,
The disposal of waste materials in boilers is of particular interest
because to date, there has been little documentation of the extent to which
chemical contaminants In waste o i l are destroyed during the combustion process.
In this project, tests were conducted on boilers in the size range of 0.4
6 to 25 x 10 Btu/hr. These are commonly classified as commercial sources, as
opposed to industrial or electric utility sources.
particular interest with regard to waste oil disposal for several reasons.
These units generally would use untreated or poorly characterized waste
fuels. They could be expected to provide less efficient combustion because of
the generally intermittent mode of operation. In addition, their widespread
distribution and their low stack heights makes their emissions more proximate
to the general population.
Commercial boilers are of
Seven boilers were designated for testing in the program. The units were
selected so as to provide a representative cross-section of the commercial
boiler population. A 4000 gallon l o t of used automotive oil was obtained in
1

order to maintain a consistent supply of waste fuel for the program.
shows the composition of the base stock waste oil used throughout the
program.
of selected organic compounds which are typically found in waste oil and in
some cases are considered hazardous waste materials.
were as follows:
Table 1
Portions of the base stock oil was spiked with predetermined amounts
The selected compounds
chloroform 0 trichlorobenzene
1,l.l-trichloroethane 1-chloronaphthalene
trichloroethylene 2,4,5-trichlorophenol
tetrachloroethylene chlorotoluene
In Table 2 are shown data comparing a typical spiked waste oil feed in
1 this project with data from a cross-section of representative waste oils.
Measurements were conducted at each of the sites to determine the
atmospheric emissions of particulate, inorganic compounds (principally lead
and HCl), and volatile organic and semivolatile organic material.
destruction and removal efficiencies (DRE) for each of the spiked components
were also determined.
conducted at each site are presented in Table 3 .
TEST RESULTS
Destruction and Removal Efficiencies
The
A listing of the boilers and a summary of the tests
The principal atmospheric emissions for each of the test sites are
presented in Table 4. In general, the data indicate that the emission I tes
of the principal inorganic components, lead and HC1, were substantially higher
than the organic emissions from the s i x boilers tested. The average
2

TABLE 1. COMPARISON OF THE PROJECT'S BASE STOCK WASTE OIL WITH A N0.4 FUEL OIL
-nT1_=.=_ _____:- .-. _-._.=__==_-21_71__ _?___-=_-=_
Concentration ( P g l g ) ________________________________________------ Typical
Component Base stock waste oil No. 4 fuel oil
Pesticides ND ( < l o ) Nu ( < l o )
- PCBs ( ~ 6 ) ND (<6)
Sulfur 0.41% 0.62%
Chlorine 0.16% 0.02%
Metal Content
Aluminum 10.2 3 . 3 Antimony 0.5 t0.5 Arsenic 14.0 c0.8 Barium 59.5 0.2 Beryllium 0.05 < 0.01 Boron 0.3 1.2 Cadmium 2.18 t 0.03 Calctum 7 60 4.7 Chromium 7.13 t0.08 Cobalt 0.16 0.4 Copper 45.8 c0.05 Iron 163 4.6 Lead 1520 0.8 Magnesium 201 3.5 Manganese 7.53 0.03 Molybdenum 3.79 0.05 Nickel 2.1 12.1 Selenium c0.5 t0.5 Silicon 68.5 1540 Silver C0.03 C0.03 Sodium 133 23.4 Strontium 1.08 0.09 Thal 1 i um <1 C l Tin 9.1 1.1 Titanium 1.29 0.15 Vanadium 2.2 18.1 Zinc 743 0.83
3
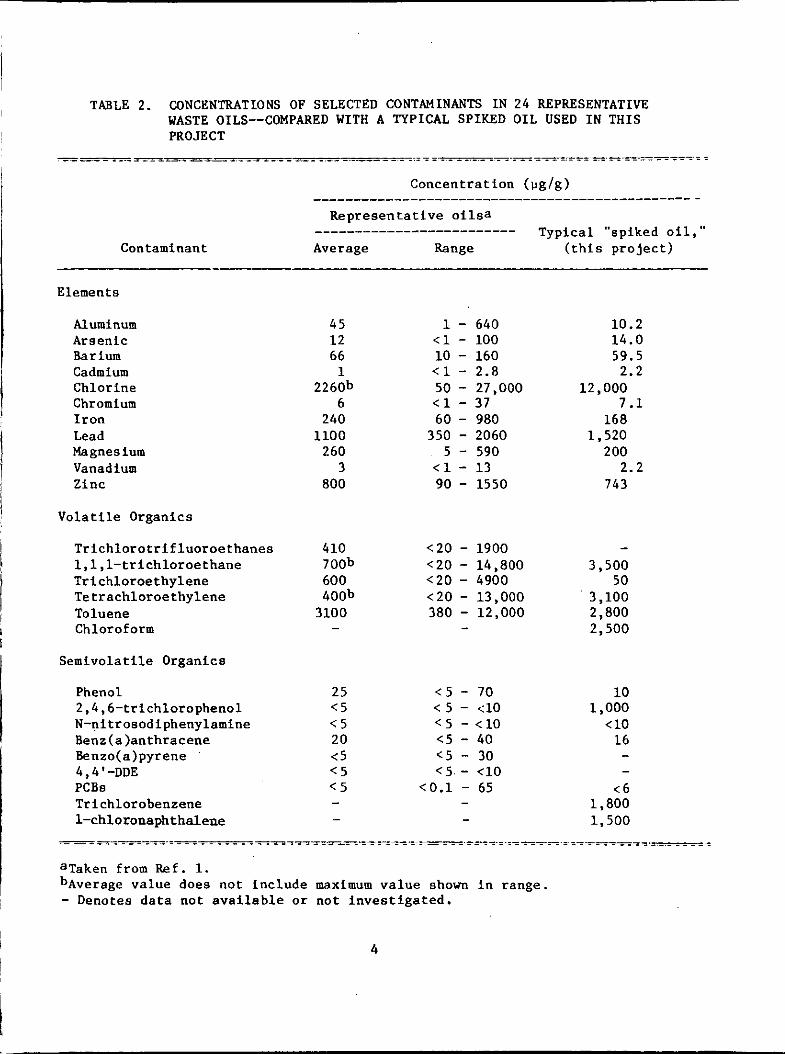
TABLE 2. CONCENTRATIONS OF SELECTED CONTAMINANTS IN 24 REPRESENTATIVE WASTE OILS--COMPARED WITH A TYPICAL SPIKED OIL USED IN THIS PROJECT
- ~ ~ = ~ ~ = = . __._ - ____- - - - - - - - _ _ - - - _ _ - - _.
Concentration ( v g l g ) ________________________________________------- - Representative oilsa
____________------------- Typical "spiked o i l , " Contaminant Average Range (this project)
Elements
Aluminum Arsenic Barium Cadmium Chlorine Chromium Iron Lead Magnesium Vanadium Zinc
Volatile Organics
Trichlorotrifluoroethanes l,l,l-trichloroethane Trichloroethylene Tetrachloroethylene Toluene Chloroform
Semivolatile Organics
Phenol 2,4,6-trichlorophenol N-nitrosodiphenylamine Benz(a)anthracene Benzo(a)pyrene
PCBs Trichlorobenzene 1-chloronaphthalene
4,4'-DDE
45 12 66 1
2260b 6
240 1100 260
3 800
410 700b 600 400b 3100
-
1 - 640 <1 - 100 10 - 160 < 1 - 2.8 50 - 27,000 < 1 - 31 60 - 980 350 - 2060 5 - 590
< 1 - 13 90 - 1550
<20 - 1900 <20 - 14,800 <20 - 4900 <20 - 13,000 380 - 12,000 -
25 <5 - 70 < 5 < 5 - < l o < 5 < 5 -<lo 20 < 5 - 40 <5 <5 - 30 <5 c5.- <lo < 5 <0.1 - 65
10.2 14.0 59.5 2.2
7.1 12,000
168 1,520 2 00
743 2.2
- 3,500
50 3,100
2,500 2,800
10 ,000 < 10 16 - -
t 6
1,500 1,800
-__---_ =- -. - - - - ___1nTr_Y=_==1- _--=_ i i__T_ I =1 ?___ll_____s_
aTaken from R e f . 1. bAverage value does not include maximum value shown in range. - Denotes data not available O K not investigated.
4

' u r n o c 4 m u 2 u m O D U
E4 .a m a m C U
c 0
.r( U
ala U .rl .* $4 m u m
a, U
m a x &I
c 0 .* U
m a U .rl .rl t4 m u
m m
. .
..I 1 P 01 0 .d Ud w 0
C 0 N .rl
U m * V
v)
0
4
x 0)
P E 0 0
4
2 .rl m n
a 1 0
c 3 m U
fn 01 m a N
m 9 a U m N .* w
5 u 0 0 m
0
4
m m
m
0 0 0
m
m m 1 0 s c m a, t4
W
a 1 0
x $4 m
5 m 3
G N 1 U m I4
4 m U C
n u
2 .rl $4 0 a2
.3
N
U
2 3 .rl
.d a D
a, 0 .rl W w 0
N .rl 4 .
m m la a m m D U m $4 .rl W
a
5 U 0 u m
R
N
n
m m 3 0 s c m
0 E
a ZJ 0
x $4 m
m fn m a
a, D 5 U
E .d w s 0 U 0 0 cn
it
m
w
5
0 0 0 0 00
m 0' . I "
m fn m n m m D a U
E .rl 'u
s 0 u 0 0 m
N
-3
0 0 00 00
m o .... 4
t4 .rl 4
m 10 m a it
m D 1 U m
' $ 4 .* w
5 U 0 0 v1
L n
N 4
c1
h
D
m rn m
4
E
$4 m c $4 1 D
2
5 u
.* 3
0 U
m 1 U
a N M 0 $4 a m
e
5 C .* 2 * U m m w

~-
Sitea Ab C Db E F G
Particulate
Inorganic Components
HC1
Lead
zinc
Organic Components
Volatile
Chloroform
Trichloroethane
Trichloroethylene
Tetrachloroethylene
Semivolatile
Trichlorobenzene
1-chloronaphthalene
Trichlorophenol
Chlorotoluene
32 544
150 550
3.7 112
2.0 52
0.04 0.2
0.03 0.1
0.06 0.1
0.06 0.3
0.02 0.03
0.01 0.02
0.003 0.01
NA NA
277 312 367 508
337 1050 600 1510
9.8 48 69 85
5.7 29 37 45
0.06 0.07 0.13 0.1
0.03 1.2 0.6 0.2
0.10 0.1 0.05 0.3
0.3 0.5 0.3 0.1
0.10 0.13 0.07 0.2
0.03 0.05 0.06 0.2
NA 0.04 0.01 NA
0.02 NA NA 0.3
I aWaste oil feed rates used throughout the program generally ranged from 3-30 gallhr, depending on the size of the facility.
baste oil diluted 50:50 with No. 2 oil to improve combustion for test purposes.
NA - Not analyzed, compound not spiked into fuel.
6
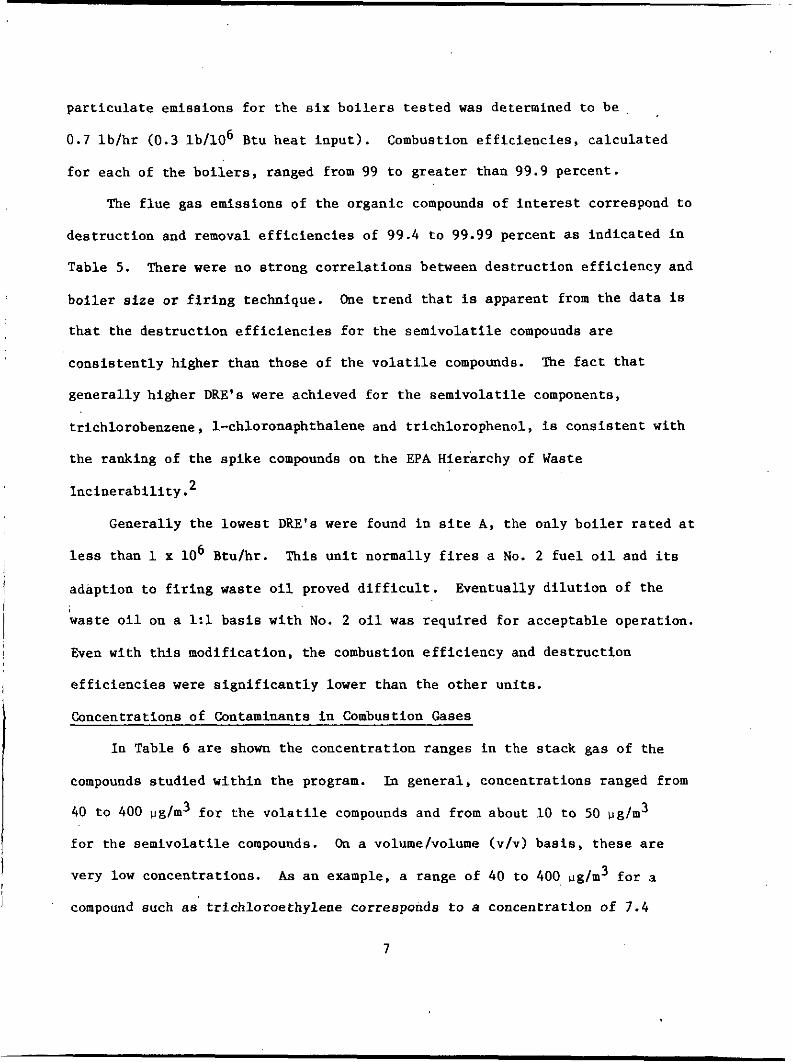
particulate emissions for the s i x boilers tested was determined to be
0.7 lb/hr (0.3 lb/106 Btu heat input).
for each of the boilers, ranged from 99 to greater than 99.9 percent.
Combustion efficiencies, calculated
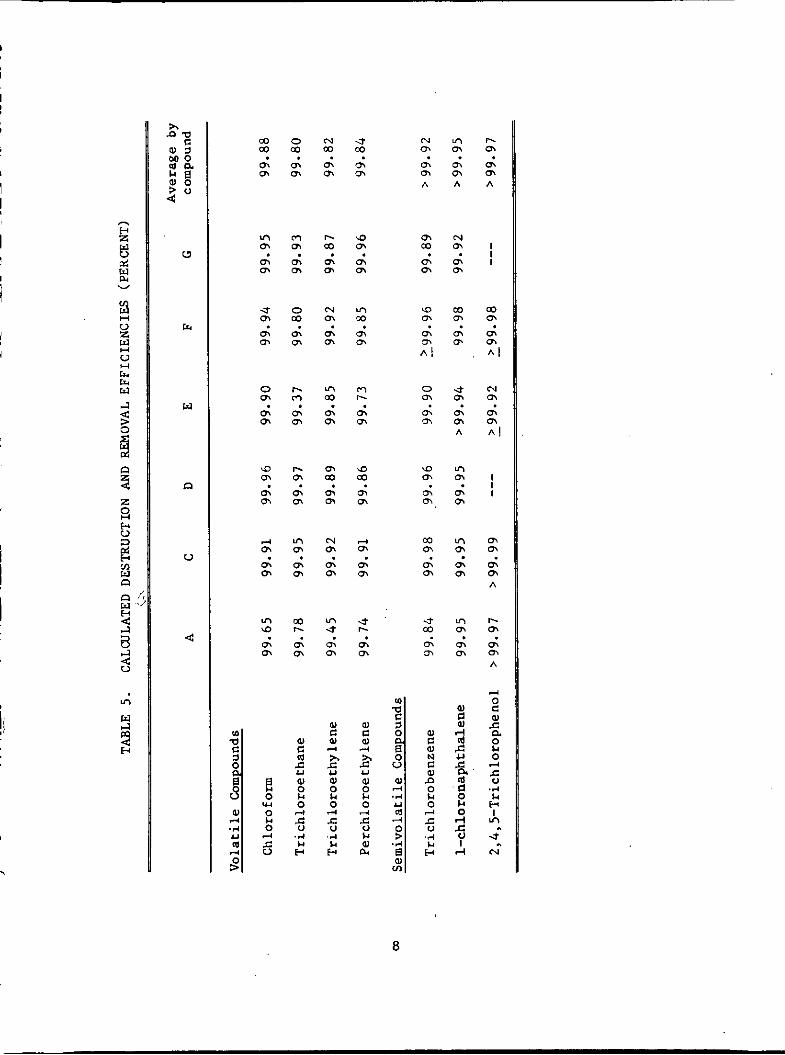
The flue gas emissions of the organic compounds of interest correspond to
destruction and removal efficiencies of 99.4 to 99.99 percent as indicated in
Table 5 .
boiler size o r firing technique.
that the destruction efficiencies for the semivolatile compounds are
consistently higher than those of the volatile compounds.
generally higher DRE's were achieved for the semivolatile components,
trichlorobenzene, 1-chloronaphthalene and trichlorophenol, is consistent with
the ranking of the spike compounds on the EPA Hierarchy of Waste
There were no strong correlations between destruction efficiency and
One trend that is apparent from the data is
The fact that
Incinerability. 2
Generally the lowest DRE's were found in site A, the only boiler rated at
less than 1 x lo6 Btu/hr.
adaption to firing waste oil proved difficult.
waste oil on a 1:l basis with No. 2 oil was required for acceptable operation.
Even with this modification, the combustion efficiency and destruction
efficiencies were significantly lower than the other units.
Concentrations of Contaminants in Combustion Gases
In Table 6 are shown the concentration ranges in the stack gas of the
This unit normally fires a No. 2 fuel oil and its
Eventually dilution of the
compounds studied within the program. In general, concentrations ranged from
40 to 400 ug/m3 for the volatile compounds and from about 10 to 50 pg/m 3
for the semivolatile compounds. On a volume/volume (v/v) basis, these are
very low concentrations.
compound such as trichloroethylene corresponds t o a concentration of 7.4
A s an example, a range of 40 to 400 ug/m3 for a
7
m
m m
m
m m m m
if m m m
0 m m m
Q m m m
4 m m m
m \D
m m
€!
:: 0
Lu
0
i: V
4
0 m m m
m m m m
0 m m m
r. CI m m
r. m m m
m m m m
m h
m m
0)
s U 0)
0
$
:: 5 .-I
.d l4 U
N m m m
h m m m
N m m m
m a3 m m
m
m m
m
N m m m
L n
if
m m
2
5
W
x
W 0 l4 0 4 c: 0
.?I l4 €4
4
-3 a,
m m
.n m m m
m m m m
CI r.
m m
m m m
4 m m m
.j r.
m m
W c W 4 x
al 0 l4 0
.e 0 l4 W D4
5
4
N m m m A
m
m m
m
Q m m m A I
0 m m m
Q m m m
m m m m
-3 m m m
W e 0)
W
0 l4 0 4 i: 0
,?I l4 U
2 n
m m m m A
N m m m
m m m 01
.j m m m A
m m m m
m m m m
m m m m
W
rl ld
z 5 & ld
l4 0 rl
I rl
-5
r. m m m A
I I I
m m m m A I
N m m m A !
I I I
m m m m A
r- m m m A
4 0 C W
0 $4 0 4 i: 0 .rl l4
€4 I Y)
.j
hl
ca
.. L
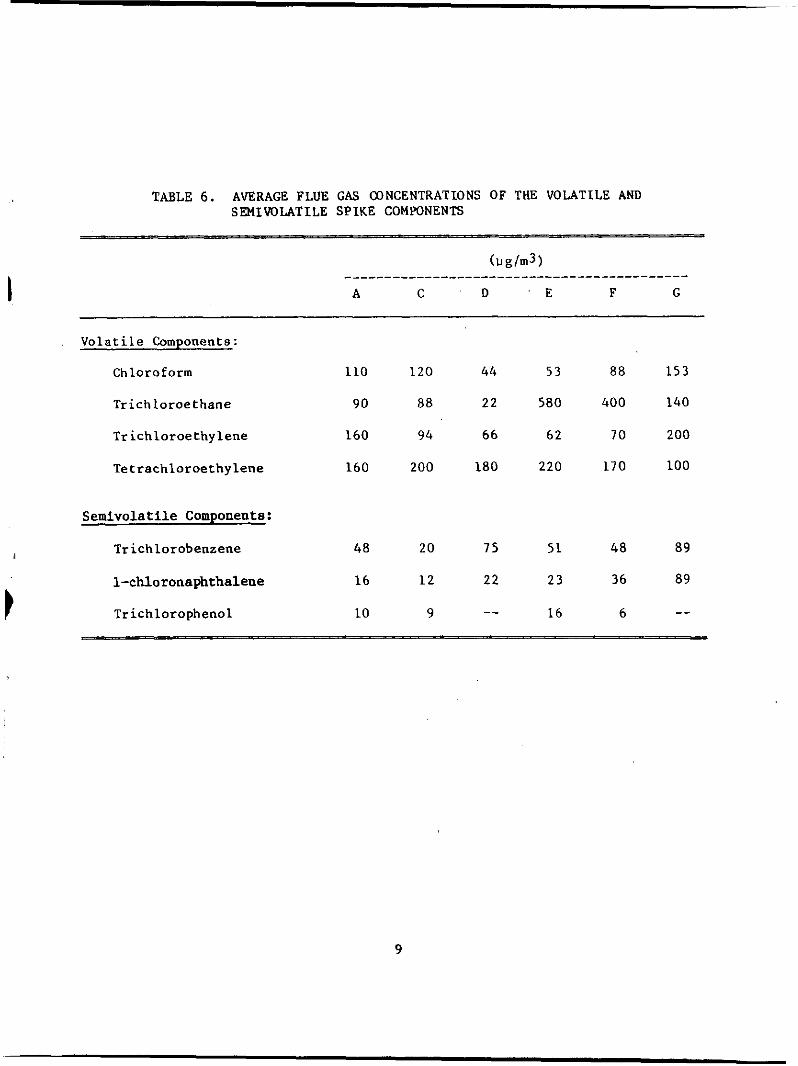
TABLE 6. AVERAGE FLUE GAS CONCENTRATIONS OF THE VOLATILE AND SEMIMLATILE SPIKE COMPONENTS
( u g l m 3 ) ____________________-------_--------------- A C 0 E F G I
Volatile Components:
Chloroform 110 120 44 53 88 1 5 3
Trichloroethane 90 8 8 22 580 400 140
Trichloroethylene 160 9 4 6 6 62 70 200
Tetrachloroethylene 160 200 180 220 170 100
Semivolatile Components:
Trichlorobenzene 48 20 75 51 4 8 89 ,I
1-chloronaphthalene 16 1 2 22 2 3 36 89
-- Tr ichlorophenol 10 9 16 6 --
9
to 74 parts per billion (ppb) on a volume/volume basis. Conducting emisston
tests at these low concentrations required extensive reftnement of avatlable
emission source testing techniques.
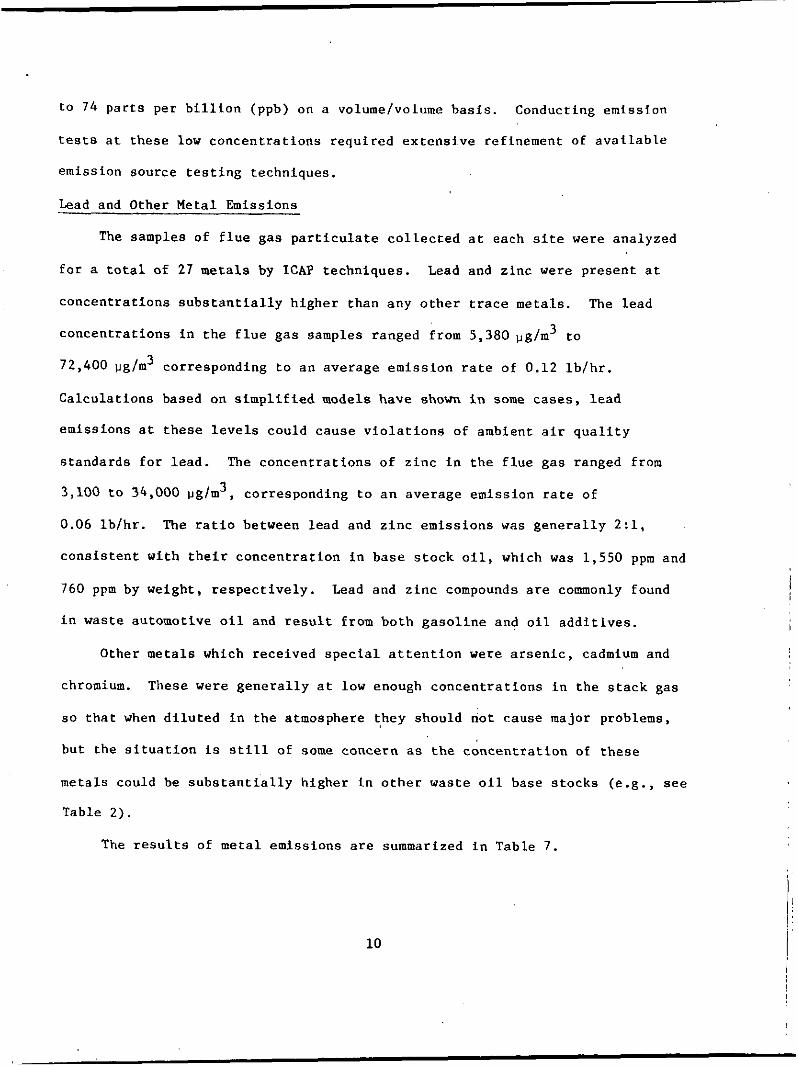
Lead and Other Metal Emissions
The samples of flue gas particulate collected at each site were analyzed
for a total of 27 metals by ICAP techniques.
concentrations substantially higher than any other trace metals. The lead
concentrations in the flue gas samples ranged from 5,380 ,,g/m3 to
72,400 pgfm
Calculations based on simplified models have shown in some cases, lead
emissions at these levels could cause violations of ambient air quality
standards for lead. The concentrations of zinc in the flue gas ranged from
Lead and zinc were present at
3 corresponding to an average emission rate of 0.12 lblhr.
3,100 to 34,000 pg/m 3 , corresponding to an average emission rate of
0.06 lb/hr.
consistent with their concentration in base stock o i l , which was 1,550 ppm and
760 ppm by weight, respectively. Lead and zinc compounds are commonly found
in waste automotive oil and result from both gasoline and oil additives.
The ratio between lead and zinc emissions was generally 2:1,
Other metals which received special attention were arsenic, cadmium and
chromium.
so that when diluted in the atmosphere they should not rause major problems,
but the situation is still of some concern as the concentration of these
metals could be substantially higher in other waste o i l base stocks (e.g., see
Table 2 ) .
These were generally at low enough concentrations in the stack gas
The results of metal emissions are summarized in Table 7.
10
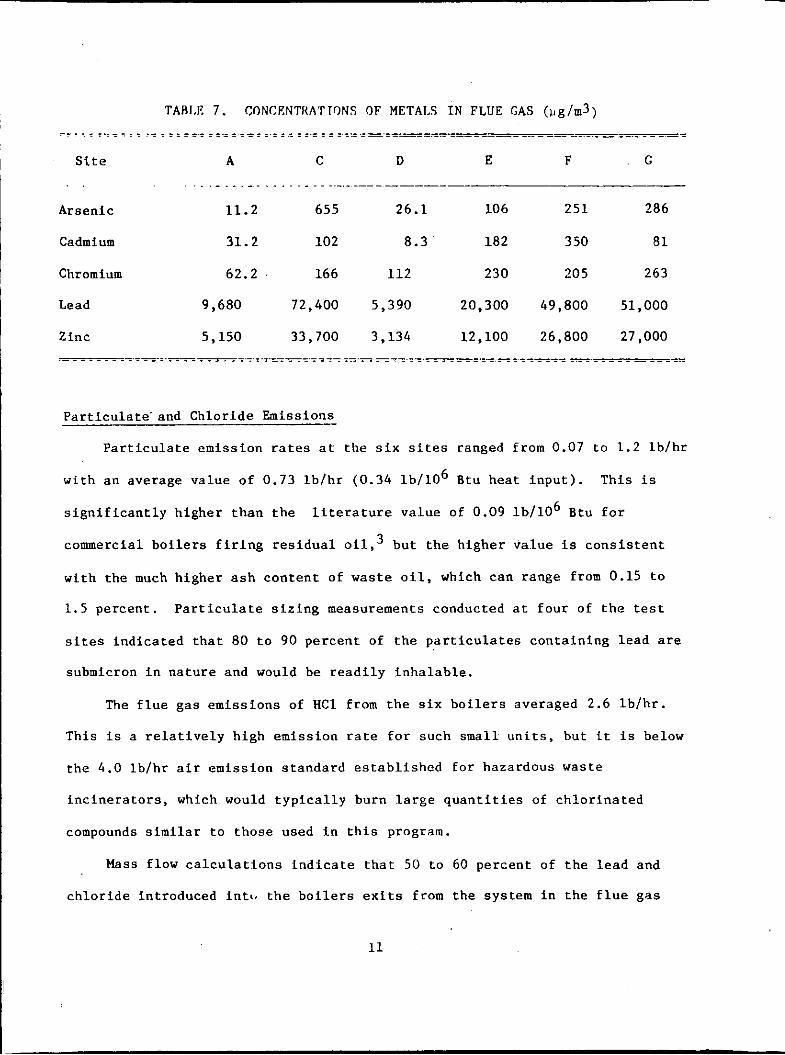
TABIJ? 7. CONCENTRATTONS OF METALS IN FLUE GAS (ug/m3) - 7- - . - - . . --: T i : 1 : 1 i._ i = i r i I 5 =.== : i.i : i = _5 :~= :1_ _---=._ -.- - ___ __ . - -
S i t e A C D E F G
. . . . . . - . - . - . . . . . . - . . - - _- A r s e n i c 11.2 655 26.1 106 251 286
Cadmium 31.2 102 8.3 182 350 8 1
Chromium 62.2 166 112 230 205 263
Lead 9,680 72,400 5,390 20,300 49,800 51,000
Zinc 5,150 33,700 3.134 12,100 26,800 27,000 ___ - . . - - . . . . -. . . . . . - - - - . . - _. -. . - -. . _ _ -. - ._1_-__.-_2____ - - - _ _ __
P a r t i c u l a t e ' a n d C h l o r i d e Emiss ions
P a r t i c u l a t e e m i s s i o n ra tes a t t h e s i x s i t e s ranged from 0.07 t o 1.2 l b / h r
6 w i t h a n ave rage v a l u e of 0.73 l b / h r (0.34 l b / 1 0 Btu heat i n p u t ) . T h i s i s
s i g n i f i c a n t l y h i g h e r t h a n t h e
commercial b o i l e r s f i r i n g r e s i d u a l b u t the h i g h e r v a l u e i s c o n s i s t e n t
w i t h t h e much h i g h e r ash c o n t e n t of waste o i l . which c a n r ange from 0.15 t o
1 . 5 p e r c e n t . P a r t i c u l a t e s i z i n g measurements conducted a t f o u r of t h e t e s t
s i t e s i n d i c a t e d tha t 80 t o 90 p e r c e n t of t h e p a r t i c u l a t e s c o n t a i n i n g l e a d are
submicron i n n a t u r e and would be r e a d i l y i n h a l a b l e .
6 l i t e r a t u r e v a l u e of 0.09 l b / 1 0 Btu f o r
The f l u e g a s e m i s s i o n s of H C 1 from t h e s i x b o i l e r s averaged 2.6 l b / h r .
T h i s is a r e l a t i v e l y h i g h e m i s s i o n r a t e f o r such small u n i t s , b u t i t i s below
t h e 4.0 l b / h r a i r e m i s s i o n s t a n d a r d e s t a b l i s h e d €o r haza rdous was te
i n c i n e r a t o r s , which would t y p i c a l l y bu rn l a r g e q u a n t i t i e s of c h l o r i n a t e d
compounds s i m i l a r t o t h o s e used i n t h i s program.
Mass f low c a l c u l a t i o n s i n d i c a t e t h a t 50 t o 60 p e r c e n t of the l e a d and
c h l o r i d e i n t r o d u c e d i n t , , t h e b o i l e r s e x i t s from t h e sys t em i n t h e f l u e g a s
11
I
I I i i !
i
i
1 I I 1 I
I
!
I
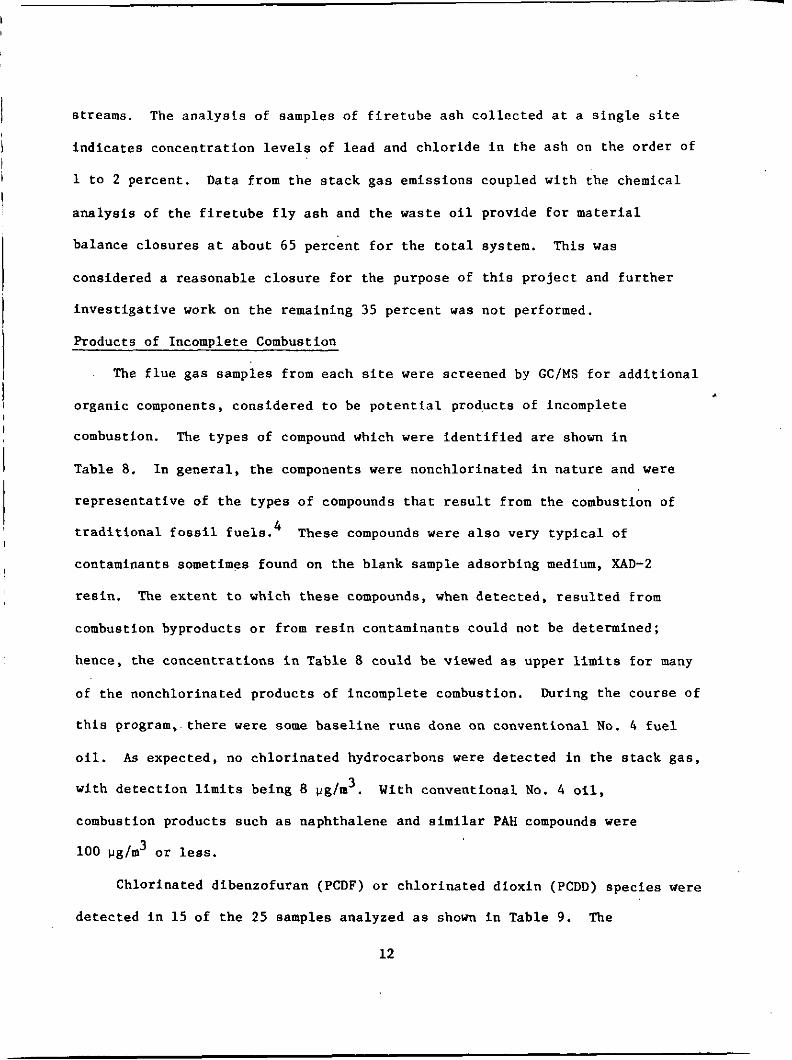
streams. The analysis of samples of firetube ash collected at a single site
indicates concentration levels of lead and chloride in the ash on the order of
1 to ‘2 percent.
analysis of the firetube fly ash and the waste oil provide for material
balance closures at about 65 percent for the total system.
considered a reasonable closure for the purpose of this project and further
investigative work on the remaining 35 percent was not performed.
Products of Incomplete Combustion
Data from the stack gas emissions coupled with the chemical
This was
The flue gas samples from each site were screened by GC/MS for additional
organic components, considered to be potential products of incomplete
combustion. The types of compound which were identified are shown in
Table 8. In general, the components were nonchlorinated in nature and were
representative of the types of compounds that result from the combustion of
traditional fossil fuels.4
contaminants sometimes found on the blank sample adsorbing medium, XAD-2
resin. The extent to which these compounds, when detected, resulted from
combustion byproducts or from resin contaminants could not be determined;
hence, the concentrations in Table 8 could be viewed as upper limits for many
of the nonchlorinated products of incomplete combustion. During the course of
this program, there were some baseline runs done on conventional No. 4 fuel
oil. As expected, no chlorinated hydrocarbons were detected in the stack gas,
3 with detection limits being 8 u g h . combustion products such as naphthalene and similar PAH compounds were
3 100 ug/m or less.
These compounds were also very typical of
With conventional No. 4 oil,
Chlorinated dibenzofuran (PCDF) or chlorinated dioxin (PCDD) species were
detected in 15 of the 25 samples analyzed as shown in Table 9. The
12
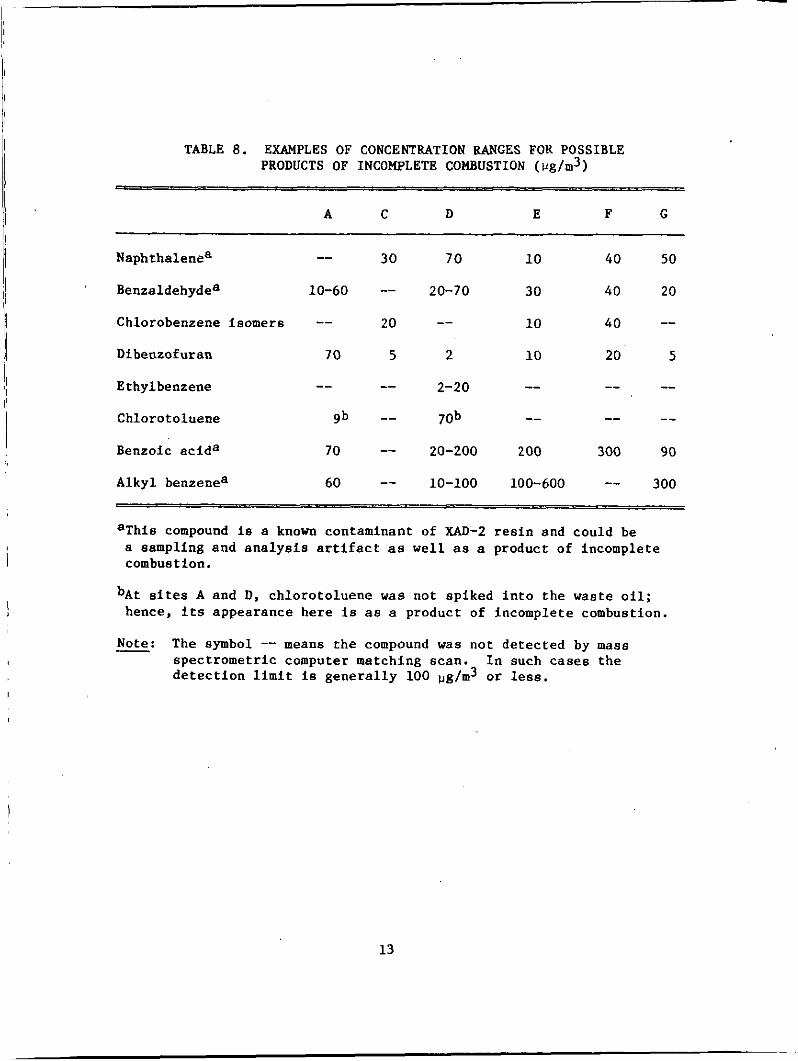
TABLE 8 . EXAMPLES OF CONCENTRATION RANGES FOR POSSIBLE PRODUCTS OF INCOMPLETE COMBUSTION (~g/m3)
A C D E F G
30 70 10 40 50 Naphthalenea -- Benzaldehydea 10-60 -- 20-70 30 40 20
_- Chlorobenzene isomers -- 20 10 40
Dibenzofuran 70 5 2 10 20 5
E thylbenzene --
Chlorotoluene gb _- 70b
Benzoic acida 70 -- 20-200 200 300 90
300 Alkyl benzenea 60 -- 10-100 100-600 --
_-
-- -- -- -- 2-20
-- -- --
aThis compound is a known contaminant of XAD-2 resin and could be a sampling and analysis artifact as well as a product of incomplete combustion.
bAt sites A and D. chlorotoluene was not spiked into the waste oil; hence, its appearance here is as a product of incomplete combustion.
Note: The symbol -- means the compound was not detected by mass spectrometric computer matching .scan. In such cases the detection limit is generally 100 ug/m3 or less.
-
13
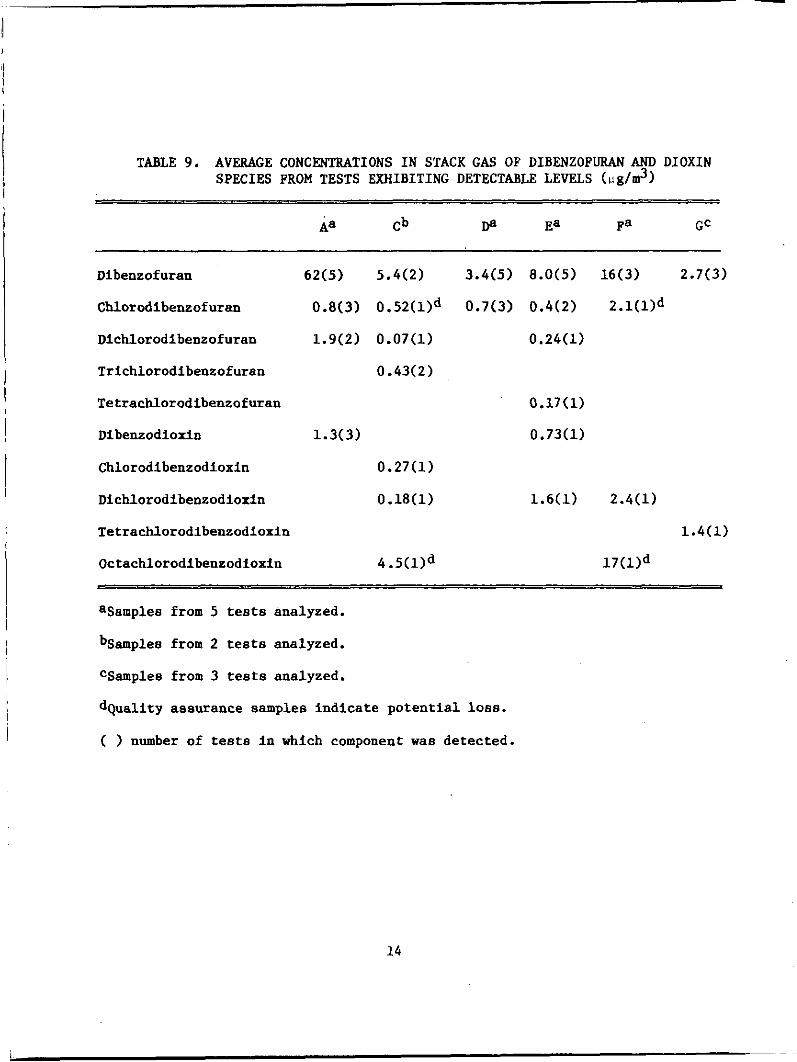
TABLE 9. AVERAGE CONCENTRATIONS IN STACK GAS OF DIBENZOFURAN AND DIOXIN SPECIES FROM TESTS EXHIBITING DETECTABLE LEVELS (~ig/rn~)
Dibenzofuran
Chlorodibenzofuran
Dichlorodibenzofuran
Trichlorodibenzofuran
Tetrachlorodibenzofuran
Dibenzodioxin
Chlorodibenzodioxin
Dichlorodibenzodioxin
Tetrachlorodibenzodioxin
Octachlorodibenzodioxin
62(5) 5.4(2)
0.8(3) 0.52(l)d
1.9(2) 0.07(1)
0.43(2)
4 . 5 m d
0.17(1)
0.73(1)
aSamples from 5 tests analyzed.
bSamples from 2 tests analyzed.
CSamples from 3 tests analyzed.
dQuality assurance samples Indicate potential loss.
( number of tests in which component was detected.
14

I I
1 1
I I
I I
I I
I i I
I
I
concentration of these compounds ranged from 0.07 to 17 IIg/m 3 . On a
volume/volume basis, this corresponds to a range of 7 to 470 parts per
trillion (ppt).
Bulk samples of firetube ash collected at one of the sites contained
parts per billion levels of 11 PCDF and PCDD isomers on a weight by weight
basis. This is summarized in Table 10. Because chlorinated dioxins and
chlorinated dibenzofurans were found in the flue gas, tests were also conducted
on the waste oil base stock, both spiked and unspiked to determine the extent
to which these types of compounds might be present in the oil. No chlorinated
dioxins or chlorinated dibenzofurans were found in either the spiked or
unspiked oil; detection limits for the various isomers are shown in Table 11.
TEST METHODS
Waste O i l Analysis
Waste feed samples were analyzed for chloride, metals and the organic
spike components. The chloride content of the fuel was determined by Parr
Oxygen Bomb Combustion followed by Ion Chromatography (IC) analyses. Metals
concentrations were determined by means of Inductively Coupled Argon Plasma
Emissions Spectroscopy (ICAP). The samples were prepared for ICAP analysis
by a controlled dry ashing procedure utilizing IR lamps.
The volatile organic analysis of the waste fuel was accomplished by
extraction followed by purge and trap GC/MS techniques in accordance with EPA
Method 624 procedures.
Method A101B5, with the substitution of tetraglyme for the polyethylene glycol
normally specified. Tetraglyme (tetraethylene glycol dimethylether) is
similar in nature to polyethylene glycol, but was found to contain fewer
potentially interfering contaminants.
Sample preparation followed procedures as given in
15

TABLE IO. ANALYSlS FOK CHWKINATEU DLBENZOFURANS AND DlBENZODIOXINS, SITE D - FLY ASH (:lg/kg)
F i r s t Second Third Cleaning pass pass pass t r ap Det. l i m i t
Component sample sample sample sample (NDI)
Dibenzofuran
Chlorodibenzofuran
Dichlorodibenzofurans
Trichlorodibenzofurans
Tetrachlorodibenzofurans
Pentachlorodibenzofurans
Hexachlorodibenzofurans
Heptachlorodibenzofurans
Octachlorodibenzofurans
Dibenzodioxin
Chlorodibenzodioxins
Dichlorodibenzodioxins
Trichlorodibenzodioxins
Tetrachlorodibenzodioxins
Pentachlorodibenzodioxins
Hexschlorodibenzodioxins
Heptachlorodibenzodioxins
Oc tach lorod i benzod iox in s
250
ND
ND
ND
350
1000
230
5ao
40
ND
ND
N D
ND
N U
120
2 00
230
33
170 24
24 ND
ND ND
N U ND
170 11
660 60
310 ND
340 ND
26 N D
N D ND
ND ND
ND ' ND
ND ND
ND ND
5a ND
90 ND
130 ND
150 ND
-
230 0.5
ND 0.5
ND 0.5
ND 0.5
160 0.5
35 2
250 2
160 5 ND 10
ND 0.5
ND 0.5
ND 0.5
ND 0.5
N D 0.5
ND 2
ND 2
N D 5
70 10
16

5 z 0 H E n
3 1 3 rl: d 3 2 I a v o I h I u w lo rn
d Y W l v 1 1 a 1 u I O U h a w I m I c F m l N o
~ 31 3 I I I I
3 3 I d U I 3 0 0 1 - 3 1 u I m v ) w w I o m U W I N I w w l N z s: i
i I I I I 3 m 1 - 1
r( I o m d I o m o I ~m
I N 1 1 3
n H al rl a
v) 2
u c o o o o o o o - 3 o D 0 0 ~ 0 0 0
9 ? 1 1 " ? - . 9 9 9 ? 1 " . - . ? ? ? O O O O O O O O N O O O O O O O O N
W c m I, 1 'u 0
C N e z w $ 5 z : o v
a l o e 4 U S v u
2 2 1 'u 0 N c W D d Q 0 h 0 3 co d I, U
w c m u 1 'u 0 N c W D d V 0 I, 0 3
m Ld u W u
."o
2
z m I, 1 'u 0
W D d V 0 Id 0 4
m U c W a
fl
W c m Ld zl 'y 0 N c W D 1 V 0 bl 0 3
m x 0) &
5
2 m h 1 'u 0 N c W D 1 V 0 u 0 3 c: U m U a W c
w c m I, 1 'u 0 N c W
V 0 h 0 rl &
U U 0
5
x
2 1 x 0 d V 0 N
D
V 0 h 0 3 c U
fl d
2 2
s
1
1 V 0
al D d V 0 h 0 rl c U d V
W c 1 x -0 d V 0 N c W e d V 0 u 0 3 c U d Ld U
2 1 x 0 .rl V 0 N E W D d V 0 I, 0 3 c I, 4J W u
x
2 g
v i
1 V 0 N c W 0 1 V 0 I, 0 rl E U a U c W a
z g d
d V 0 N c al D d V 0 h 0 rl
m x W c
CO
c X 0 U V 0 N c al D 1 V 0 I, 0 3
m U
W c
d
."o a
w W ID 0 a I, 1 a W
al h W Y( W h
h 0 'u
a al V d
2
rd E 17

The analysis of the waste oil For the semivolatile components of interest
was performed using a gas chromatograph equipped with an electron capture
detector (GC/ECD).
chromatographic cleanup and GC/MS techniques was determined to be
inappropriate due to the unacceptable sample recoveries for trichlorobenzene
and trichlorophenol.
Combustion Gas Sampling and Analysts
Initial analysis of the waste oil employing silica gel
The determination of volatile organic concentrations in the flue gas was
carried out using a gas chromatograph equipped with an electron capture
detector (GC/ECD). Duplicate, integrated samples of flue gas were collected
in nonreactive Tedlar bags and injected into the instrument using a heated gas
sampling loop. Each of the samples were analyzed in duplicate, with
replication sample values to within +10 - percent as the criterion for
acceptance. The accuracy of the calibration standards developed for the
analysis were verified by comparison of NBS traceable standards.
A modified Method 5 train equipped with an XAD-2 resin trap was used to
collect particulate, semivolatile organic compounds, metals and HC1 components
from the flue gas of the boilers. The particulate, XAD-2 resin and flue gas
condensate samples from the train were combined and solvent extracted;
analysis of solvent extracts was conducted using capillary gas chromatography/
mass spectrometry (GC/MS). Aliquots of these sample aliquots were further
concentrated for subsequent analysis for polychlorinated dibenzofuran and
polychlorinated dibenzodioxin species. The analysis was conducted using a
quadrupole Hewlett Packard 5985 GC/MS system fitted with a fused silica
capillary column.
18

A single set of Method 5 samples from each site was subjected to inorganic
analysis for chloride and particulate metal determinations.
collected gas condensate were analyzed for chloride by direct injection on a
Ion Chromatograph.
determinations by a hot nitric acid leach followed by ICAP analysis.
Samples of the
Particulate samples from the train were prepared for metal
6
Additional samples of particulate were collected at four sites using an
Andersen High Capacity Sampling System (HCSS) for particle size
determinations. The size fractionated particulate (10 pm, 10-3 pm, 3-1 pm and
1 pm) were extracted using 3M nitric acid’ and analyzed fo r lead using
atomic absorption spectrophotometry.
Samples of firetube ash were collected for chloride, metals and
semivolatile organic analysis.
determinations are as described above. Aliquots of the samples were subjected
to a hot aqueous leach to extract soluble chloride species followed by IC
analysis.
the procedures outlined in $260.20 and $260.21.
Quality Assurance Procedures
The methods for the trace metal and organic
Additional samples were analyzed by EP Toxicity in accordance with
Quality control checks were performed to ensure the collection of
representative samples and the generation of valid analytical results.
samples including field biased blanks and method blanks, were used to assess
the possible contamination of the samples. Duplicate and spiked samples were
routinely employed during the program to verify the precision and accuracy of
the analysis.
Blank
EPA quality control concentrates and NBS Standard Reference MRterials
were used where appropriate to assess the analytical work. A comprehensive
19
sys tems audi t was conducted during the program t o ensure that the project
goals and requirements s e t fo r th in the Quality Assurance Plan were met.
CONCLUSIONS
Although a sample population of s i x bo i l e r s is very l imi ted , there do
seem to be several general conclusions which can be reached regarding the
combustion of waste automotive f u e l s in b o i l e r s i n t h i s s i z e range.
1. It is possible t o achieve combustion e f f ic ienc ies grea te r than 99.9 percent fo r small commercial bo i l e r s f i r i n g waste oils.
2. Destruction and removal e f f i c i e n c i e s of greater than 99.9 percent can be obtained fo r chlorinated organic contaminants typ ica l ly present i n waste oils. For the v o l a t i l e compounds studied (chloroform, t r ichloroethylene, tr ichloroethane and perchloroethylene). des t ruc t ion and removal e f f i c i enc ie s were ou the order of 99.9 percent. (trichlorobenzene, 1-chloronaphthalene, tr ichlorophenol), destruct ion and removal e f f i c i e n c i e s were on the order of 99.95 percent.
For bo i l e r s above 1 x 10⁶ Btu/hr input , there were no apparent cor re la t ions between boi le r s i z e or f i r i n g method and destruct ion eff ic iency of organic contaminants.
Inorganic components, as opposed t o organic components of waste o i l , have subs tan t ia l ly grea te r mass emission r a t e s t o the atmosphere a s a r e s u l t of the combustion of automotive waste oils. The principal inorganic components of concern a r e lead , hydrochloric acid and t o t a l pa r t i cu la t e . Also of po ten t i a l concern a r e a rsen ic , cadmium and chromium. The p a r t i c u l a t e lead emissions from a source may, during the peak heating season, a f f e c t the compliance with the primary ambient a i r standard f o r lead. the pa r t i cu la t e lead emissions is submicron in nature and would be readi ly inhalable.
Detectable l eve l s of emissions of polychlorinated dibenzofurans and polychlorinated dibenzodloxina compounds were found in some of the bo i l e r s tes ted . l eve l s l e s s than 5 pg/m3, which is l e s s than 0.5 par t per b i l l i o n by volume i n the stack gas. The extent t o which these compounds pose a hazard a t these low l e v e l s is undetermined.
Tests were done on the base stock waste oil, w i t h and without the spiked contaminants, t o determine the extent t o which the o i l may have contained t race l eve l s of dioxin. No dioxin o r dibenzofuran compounds were detected i n any of the oil samples; detect ion l i m i t s were 200 ppb by weight for TCDD and TCDP. If dioxin compounds were
For the semivolati le compounds,
3.
4.
A s ign i f i can t percentage of
5.
These compounds, when present, were usually a t
20
present at or below their detection limits, such a quantity would not be large enough to account for the observed levels in the stack gas even with zero percent destruction. The conclusion is that dioxin and dibenzofuran found in the stack gas most prohably was formed during the combustion process.
6 . The fly ash deposited in the firetubes of the boilers may contain percent levels of lead and parts per billion levels of chlorinated dibenzofuran and dioxin compounds. The ash has the potential for being classified as hazardous on this basis, and may be subject t o hazardous waste regulations for disposal.
I
21
REFERENCES
1.
2.
3.
4 .
5.
6.
7.
Surprenant, N. F., W. H. Battye, P. F. Fennelly, "The Fate of Hazardous and Nonhazardous Wastes i n Used Oil Disposal and Recycling," report prepared by GCA Corporation, Bedford, MA for U.S. Dept. of Energy, U.S. DOE Report No. DOE/BC/10375-6. Oct. 1983.
EPA Hierarchy of Waste Incinerability--Organic Hazardous Constituents Under Incineration Rules," released June 21, 1982, Environmental Reporter, June 25, 1983.
Surprenant, N. F., et al. Emissions Assessment of Conventional Stationary Combustion Systems: Volume IV: Commercial/Institutional Combustion Sources. EPA-600/7-79-029e, U.S. Environmental Protection Agency, Industrial Environmental Protection Agency, Research Triangle Park, NC, October 1980.
Hansen, R. L., et al. Chemical Characterization of Polynuclear Aromatic Hydrocarbons in Airborne Effluents from an Experimental Fluidized Combustor, Presented at the Fourth International Symposium on Polynuclear Aromatic Hydrocarbons, Battelle Columbus Laboratories, October 1975.
"Sampling and Analysis Methods for Hazardous Waste Incineration" prepared by Arthur D. Little Inc., Cambridge, MA for U.S. Environmental Protection Agency, Industrial Environmental Research Laboratory, Research Triangle Park, NC, (Contract No. 68-02-3111).
American Society for Testing and Materials, Philadelphia, PA, "Annual Book of ASTM Standards," Methods D-2361-66 (1978); D-808-63 (1976).
Federal Register, 36, 22384, Appendix G, as corrected in Federal Register, - 44, 3791r June 29, 1979.
22