ap human geography - albertovazquez.comalbertovazquez.com/aphg/aphg_unit6_rubenstein... · mdc’s...
TRANSCRIPT
AP Human Geography
Development
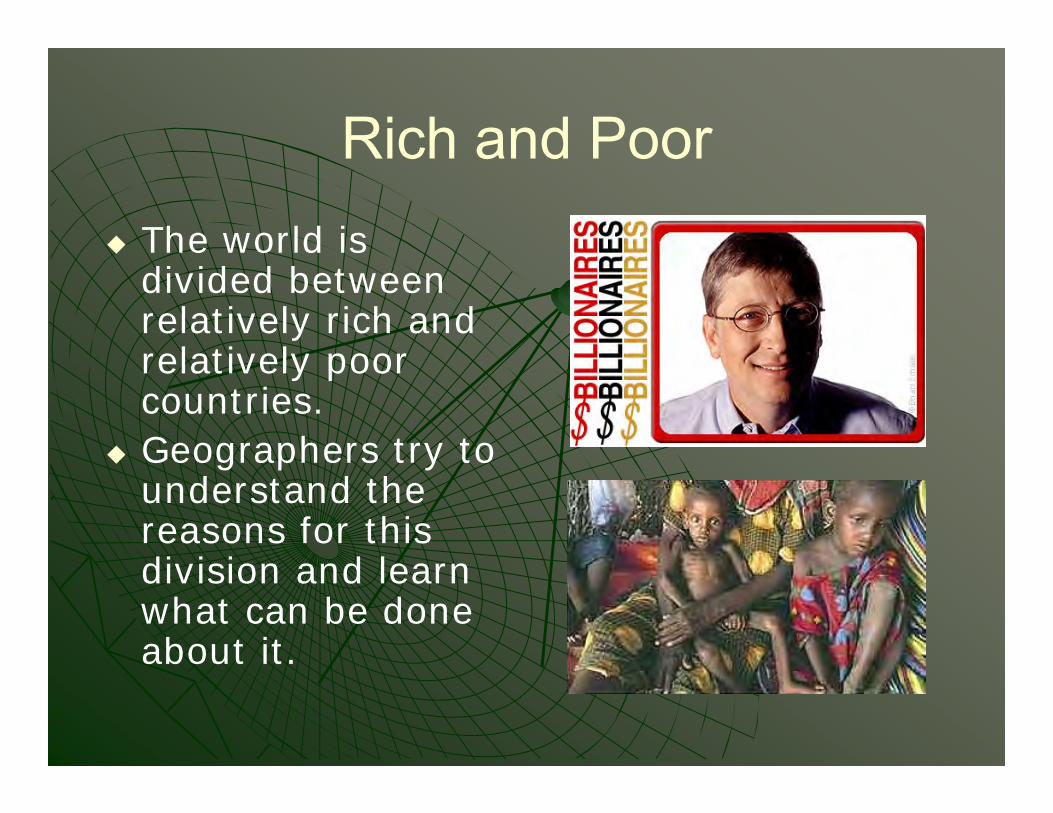
Rich and Poor The world is
divided between relatively rich and relatively poor countries.
Geographers try to understand the reasons for this division and learn what can be done about it.
Development The Key Issues are:
1. Why does development vary among countries?
2. Where are more and less developed countries distributed?
3. Where does level of development vary by gender?
4. Why do less developed countries face obstacles to development?
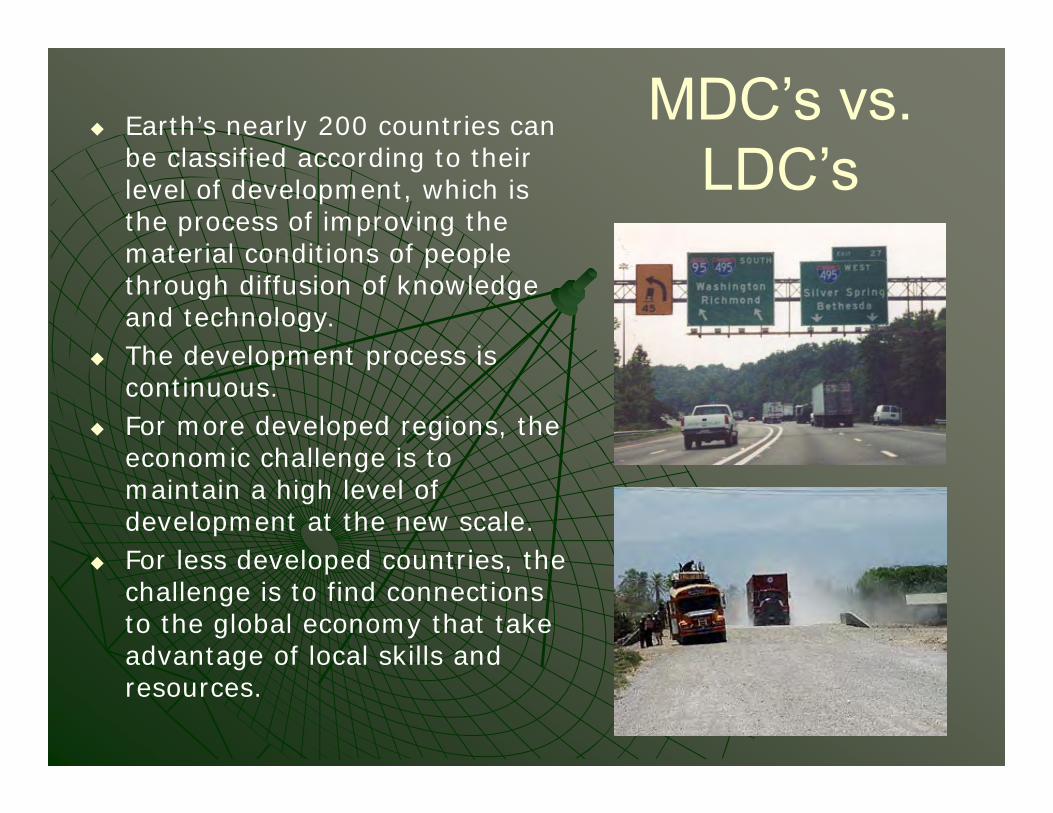
MDC’s vs. LDC’s
Earth’s nearly 200 countries can be classified according to their level of development, which is the process of improving the material conditions of people through diffusion of knowledge and technology.
The development process is continuous.
For more developed regions, the economic challenge is to maintain a high level of development at the new scale.
For less developed countries, the challenge is to find connections to the global economy that take advantage of local skills and resources.

Key Issue 1: Indicators of Development Economic indicators of development
• Gross domestic product per capita• Types of jobs• Raw materials• Consumer goods
Social indicators of development• Education and literacy• Health and welfare
Demographic indicators of development• Life expectancy• Infant mortality rate• Natural increase rate• Crude birth rate

Human Development Index
Fig. 9-1: Developed by the United Nations, the HDI combines several measures of development: life expectancy at birth, adjusted GDP per capita, and knowledge (schooling and literacy).
Economic Indicators of Development The United Nation’s HDI
includes one economic indicator of development: gross domestic product per capita.
Four other economic indicators distinguish more developed from less developed countries:• economic structure• worker productivity• access to raw materials• and availability of
consumer goods.

Gross Domestic Product Per Capita
The typical worker receives $10 to $15 per hour in more developed countries, compared to less than $0.50 per hour in less developed ones.
Per capita income is a difficult figure to obtain
Geographers substitute per capita gross domestic product, a more readily available indicator, dividing the GDP by total population.
The gross domestic product (GDP) is the value of the total output of goods and services produced in a country, normally during a year.
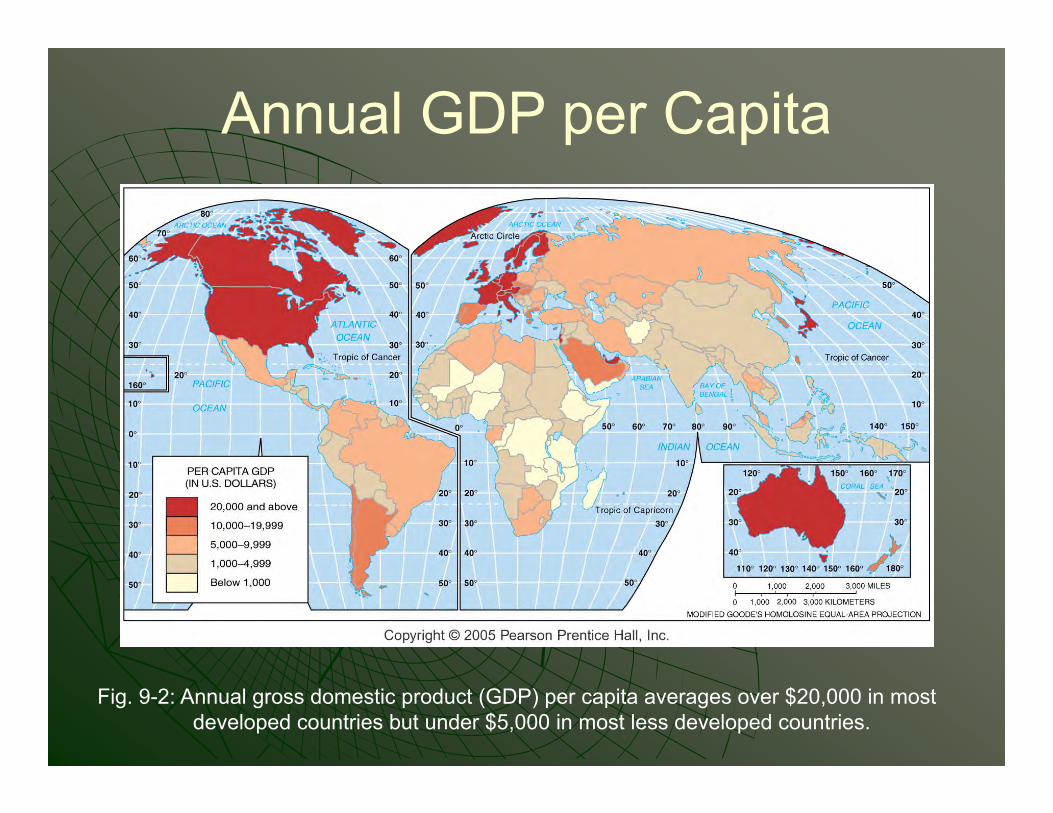
Annual GDP per Capita
Fig. 9-2: Annual gross domestic product (GDP) per capita averages over $20,000 in most developed countries but under $5,000 in most less developed countries.
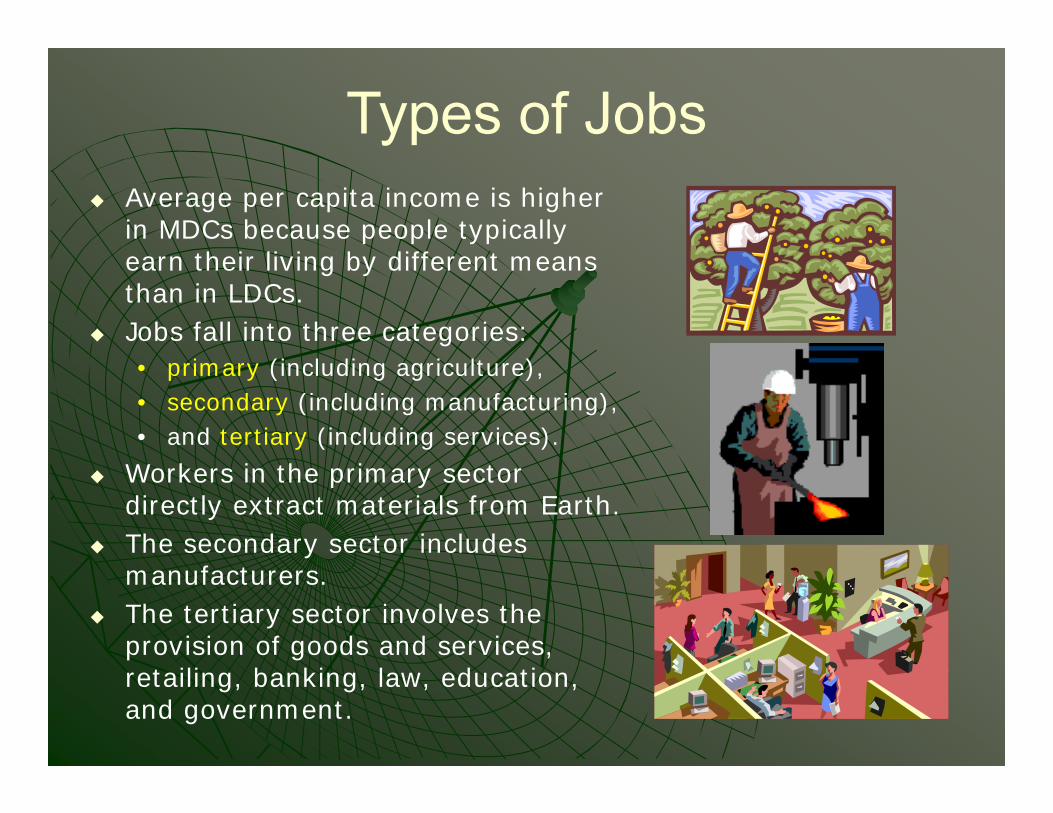
Types of Jobs Average per capita income is higher
in MDCs because people typically earn their living by different means than in LDCs.
Jobs fall into three categories: • primary (including agriculture), • secondary (including manufacturing), • and tertiary (including services).
Workers in the primary sector directly extract materials from Earth.
The secondary sector includes manufacturers.
The tertiary sector involves the provision of goods and services, retailing, banking, law, education, and government.
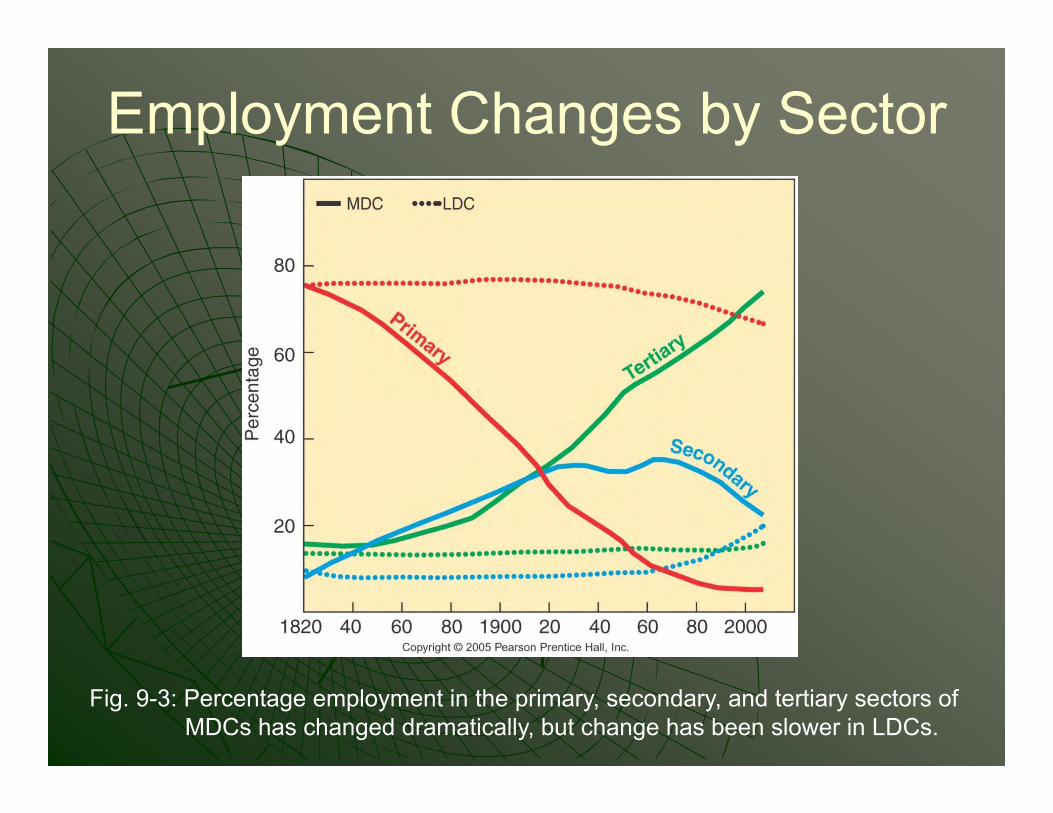
Employment Changes by Sector
Fig. 9-3: Percentage employment in the primary, secondary, and tertiary sectors of MDCs has changed dramatically, but change has been slower in LDCs.
Productivity Productivity is the value of a
particular product compared to the amount of labor needed to make it.
Workers in more developed countries produce more with less effort because they have access to more machines, tools, and equipment to perform much of the work.
Productivity can be measured by the value added per worker, the gross value of the product minus the costs of raw materials and energy.
Raw Materials
Development requires access to raw materials, such as minerals and trees, which can be fashioned into useful products.
It also requires energy to operate the factories. The United Kingdom, the first country to develop in the
eighteenth century, had abundant supplies of coal and iron ore, used to make steel for tools.
European countries took advantage of domestic coal and iron ore to promote industrial development during the nineteenth century.
As they ran short of many raw materials, European countries began to import them.
The international flow of raw materials sustained development in Europe but retarded it in Africa and Asia.

Raw Materials Most former colonies still export raw materials and import
finished goods and services. The LDCs that possess energy resources, especially
petroleum, have been able to use revenues to finance development.
Prices for other raw materials, such as cotton and copper, have fallen because of excessive global supply and declining industrial demand.
A country with abundant resources has a better chance of developing.
Yet some countries that lack resources - such as Japan, Singapore, South Korea, and Switzerland - have developed through world trade.
Consumer Goods Part of the wealth generated in
more developed countries goes for essential goods and services (food, clothing, and shelter).
But the rest is available for consumer goods and services.
The wealth used to buy “nonessentials” promotes expansion.
Among the thousands of things that consumers buy, three are particularly good indicators of a society’s development: • motor vehicles, • telephones, • and televisions.
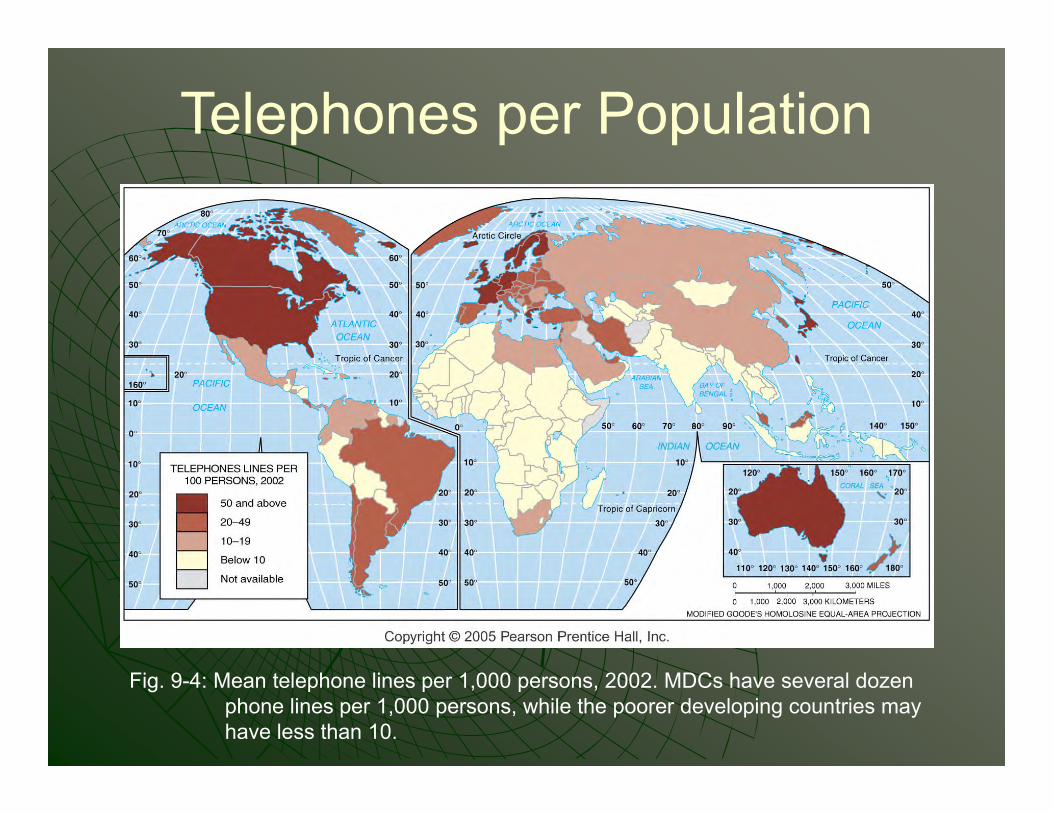
Telephones per Population
Fig. 9-4: Mean telephone lines per 1,000 persons, 2002. MDCs have several dozen phone lines per 1,000 persons, while the poorer developing countries may have less than 10.
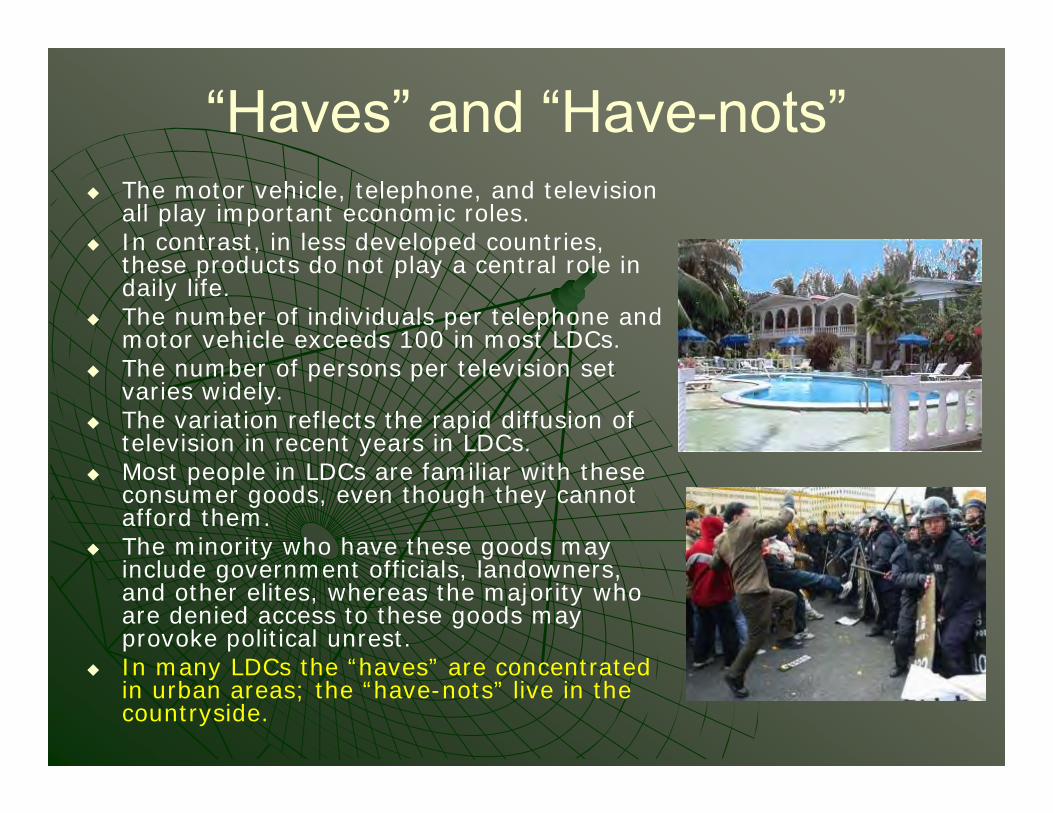
“Haves” and “Have-nots” The motor vehicle, telephone, and television
all play important economic roles. In contrast, in less developed countries,
these products do not play a central role in daily life.
The number of individuals per telephone and motor vehicle exceeds 100 in most LDCs.
The number of persons per television set varies widely.
The variation reflects the rapid diffusion of television in recent years in LDCs.
Most people in LDCs are familiar with these consumer goods, even though they cannot afford them.
The minority who have these goods may include government officials, landowners, and other elites, whereas the majority who are denied access to these goods may provoke political unrest.
In many LDCs the “haves” are concentrated in urban areas; the “have-nots” live in the countryside.
Social Indicators of Development
More developed countries use part of their greater wealth to provide schools, hospitals, and welfare services.
In turn, this well-educated, healthy, and secure population can be more economically productive.
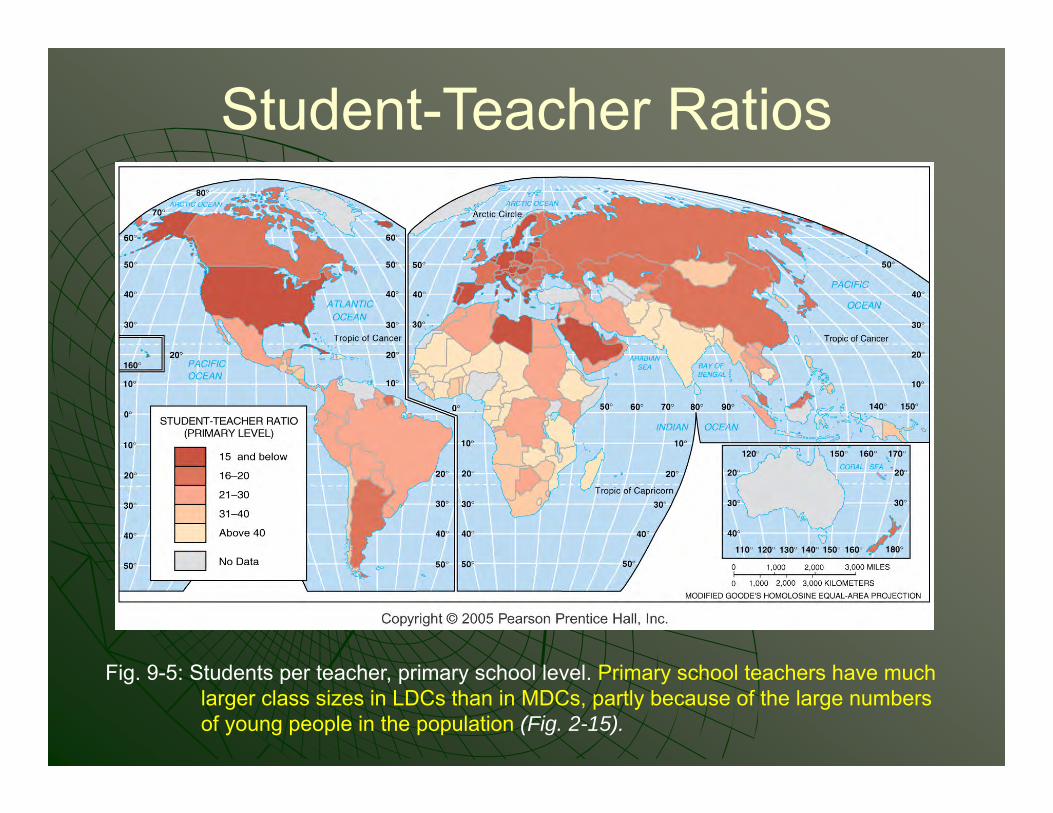
Student-Teacher Ratios
Fig. 9-5: Students per teacher, primary school level. Primary school teachers have much larger class sizes in LDCs than in MDCs, partly because of the large numbers of young people in the population (Fig. 2-15).
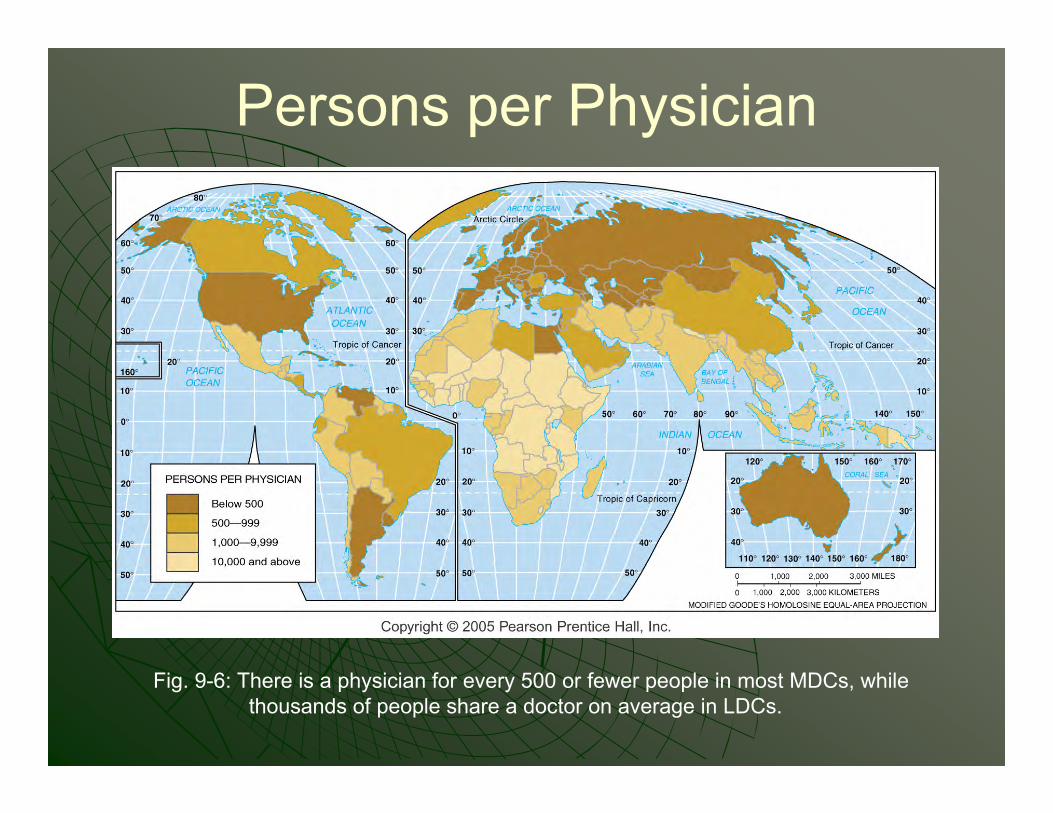
Persons per Physician
Fig. 9-6: There is a physician for every 500 or fewer people in most MDCs, while thousands of people share a doctor on average in LDCs.
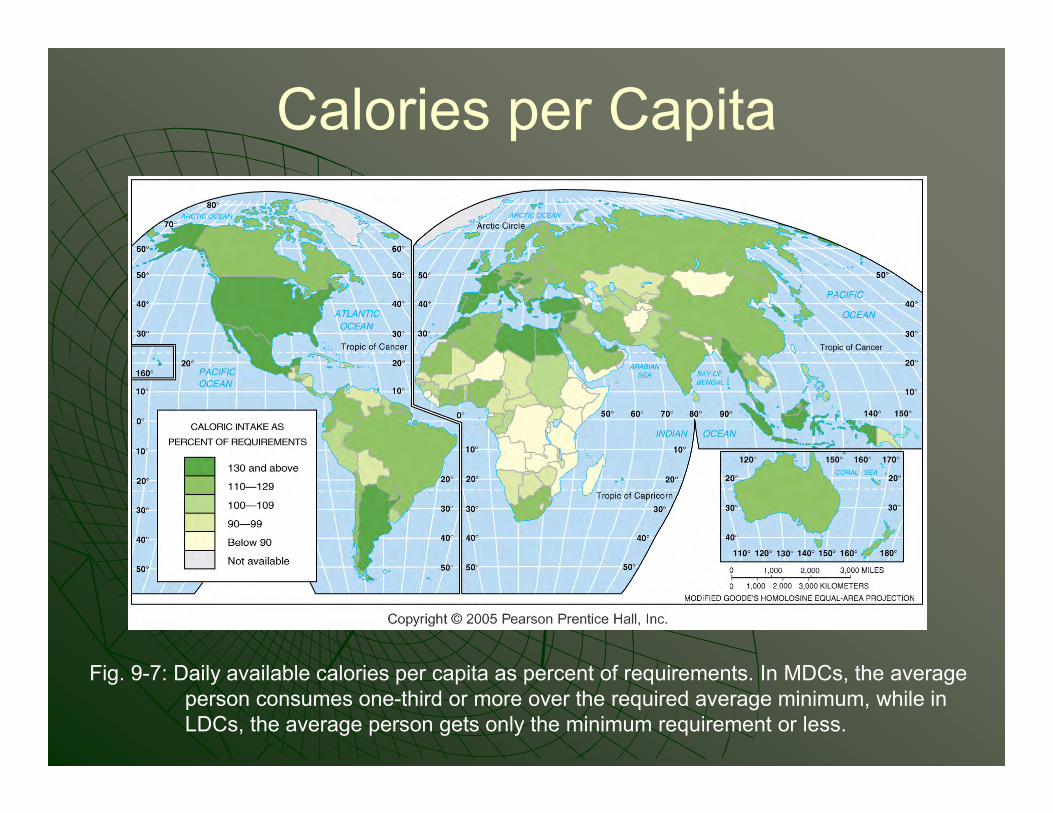
Calories per Capita
Fig. 9-7: Daily available calories per capita as percent of requirements. In MDCs, the average person consumes one-third or more over the required average minimum, while in LDCs, the average person gets only the minimum requirement or less.
Demographic Indicators of Development - Life Expectancy
The U.N. HDI utilizes life expectancy as a measure of development.
Other demographic characteristics that distinguish more and less developed countries include infant mortality, natural increase, and crude birth rates.
Babies born today can expect to live into their early forties in less developed countries compared to their mid-seventies in more developed countries.
The gap in life expectancy between LDCs and MDCs is greater for females than for males.
With longer life expectancies, MDCs have a higher percentage of elderly people who have retired and receive public support.

Infant Mortality Rate About 90 percent of infants survive. . . in less
developed countries, whereas in MDCs more than 99 percent survive.
The infant mortality rate is greater in the LDCs for several reasons: malnutrition or lack of medicine (or) poor medical practices.

Natural Increase Rate The natural increase rate averages more than 2
percent annually in less developed countries and less than 1 percent in more developed ones.
Greater natural increase strains a country’s ability to provide services that can make its people healthier and more productive.
Crude Birth Rate Less developed countries have higher natural increase rates
because they have higher crude birth rates. The annual crude birth rate exceeds 40 per 1,000 in many
LDCs, compared to less than 15 per 1,000 in MDCs. More developed and less developed countries both have
annual crude death rates of about 10 per 1,000. Two reasons account for the lack of difference. First, diffusion of medical technology. has eliminated or
sharply reduced the incidence of several diseases in less developed countries.
Second, MDCs have higher percentages of older people. The mortality rate for women in childbirth is significantly
higher in LDCs.
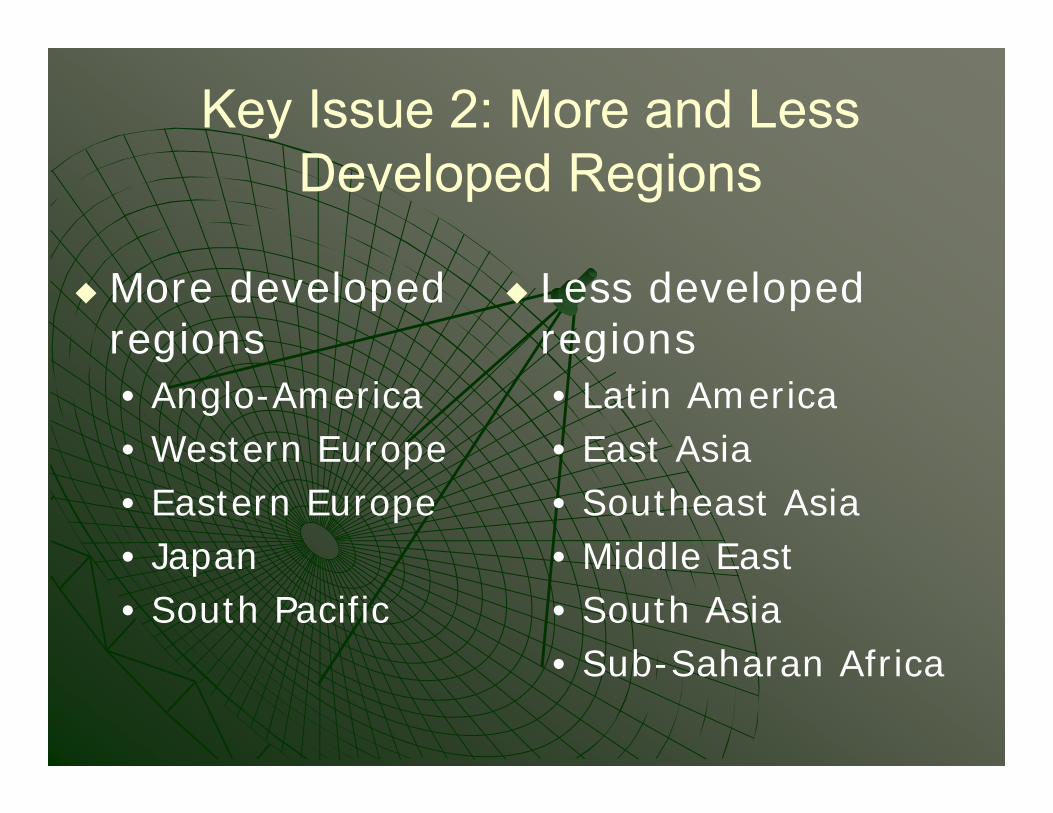
Key Issue 2: More and Less Developed Regions
More developed regions• Anglo-America• Western Europe• Eastern Europe• Japan• South Pacific
Less developed regions• Latin America • East Asia• Southeast Asia • Middle East• South Asia • Sub-Saharan Africa

More and Less Developed Regions
Fig. 9-8: The less developed regions include Latin America, Sub-Saharan Africa, Middle East, South Asia, East Asia, and Southeast Asia.

Anglo-America
Language and religious patterns are less diverse in Anglo-America than in other world regions.
Cultural diversity generates some tensions in the region.
Anglo-America was once the world’s major producer but in the past quarter century Japan, Western Europe, and less developed countries have eroded the region’s dominance.
Americans remain the leading consumers.
The region has adapted relatively successfully to the global economy, in part because it is the leading provider of high-tech services and services that promote use of leisure time.
Western Europe On a global scale, Western Europe displays cultural unity. However, the diversity of individual languages and religious
practices has been a longtime source of conflict especially when strong national identities were forged.
In the past competition among Western European nationalities caused many wars.
Since the end of World War II Western Europe has become much more unified.
Offsetting the increased cultural unity is migration of Muslims and Hindus in search of jobs.
Immigrants are responsible for much of the region’s population growth, and they have become scapegoats for the region’s economic problems.
Within Western Europe the level of development is the world’s highest in a core area.
Western Europe - continued Because the region’s peripheral areas - southern Italy, Portugal,
Spain, and Greece - lag somewhat in development, Western Europe as a whole has a slightly lower development level than Anglo-America.
To maintain its high level of development, Western Europe must import food, energy, and minerals.
Colonies on every continent supplied many resources needed to foster European economic development.
Colonization also diffused Western European languages, religions, and social customs worldwide.
Now that most colonies have been granted independence, Western Europeans must buy raw materials from other countries.
To pay for their imports, Western Europeans produce high-value goods and services.
The elimination of most economic barriers within the European Union makes Western Europe potentially the world’s largest and richest market.
Most governments have been willing to sacrifice some economic growth in exchange for protection of existing jobs and social services.

Eastern Europe
Eastern Europe has the dubious distinction of being the only region where the HDI has declined significantly since the United Nations created the index in 1990.
In 1990 Eastern Europe had an HDI only slightly behind those of Western Europe and Anglo-America.
Eastern Europe’s rapidly declining HDI is a legacy of the region’s history of Communist rule.
Communist parties achieved rapid development, especially during the 1950s and 1960s.
Early Communist theorists believed that communism would triumph in more developed countries.
Because few (Eastern European) states had modern industries the Communists had to apply their theories to poor, agricultural societies.
The Communists promoted development during the 1950s and 1960s through economies directed by government officials rather than private entrepreneurs.
In the Soviet Union, for example, a national planning commission called Gosplan developed five-year plans to guide economic development.
Eastern Europe - continued

Eastern Europe - continued
The five-year plans featured three main development policies.
First - emphasize heavy industry - mining, electric power, and transportation.
Second - disperse production facilities. (Russia had been frequently invaded from the west.) • They wanted to reduce the vulnerability of
their vital industries to attack, and to promote equal development throughout the country.
Third - locate manufacturing facilities near sources of raw materials rather than near markets. • Soviet planners gave lower priority to
producing consumer goods.
Eastern Europe - continued
Eastern European countries in the 1990s dismantled the economic structure inherited from the Communists.
Aside from the desire for freedom, the principal reason that Eastern Europeans rejected communism was that central planning proved to be disastrous at running national economies.
For many Eastern Europeans, the most fundamental problem was that by concentrating on basic industry, the Communists neglected consumer products.
Although restricted from visiting Western countries, many Eastern Europeans could see on television the much higher level of comfort on the other side of the Iron Curtain.

Air Pollution in Eastern Europe
Fig. 9-1-1: Sulfate emissions in the Czech Republic and Slovakia. GIS was used to map previously secret data on air pollution after the fall of the communist regime. Extremely high levels were found in some of the main industrial areas.

Japan Anglo-America and Western Europe share many
cultural characteristics. Anglo-America was colonized by European
immigrants, so the regions share language, religion, and other political, economic, and cultural traditions.
Japan, the third major center of development, has a different cultural tradition.
Japan’s development is especially remarkable because it has an extremely unfavorable ratio of population to resources.
Japan has one of the highest physiological densities.
Although Japan is one of the world’s leading steel producers, it must import virtually all the coal and iron ore needed for steel production.
At first, the Japanese economy developed by taking advantage of the country’s one asset, an abundant supply of people willing to work hard for low wages.
Having gained a foothold in the global economy by selling low-cost products, Japan then began to specialize in high-quality, high-value products.
Japan’s dominance was achieved in part by concentrating resources in rigorous educational systems and training programs to create a skilled labor force.
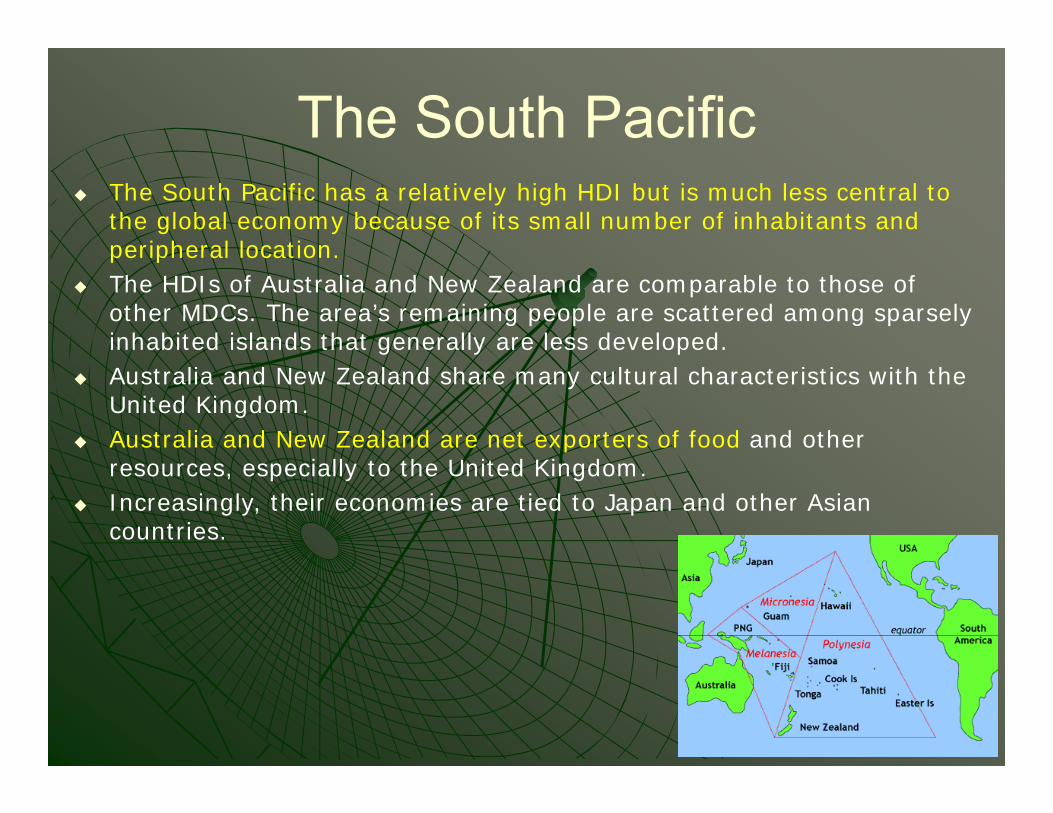
The South Pacific The South Pacific has a relatively high HDI but is much less central to
the global economy because of its small number of inhabitants and peripheral location.
The HDIs of Australia and New Zealand are comparable to those of other MDCs. The area’s remaining people are scattered among sparsely inhabited islands that generally are less developed.
Australia and New Zealand share many cultural characteristics with the United Kingdom.
Australia and New Zealand are net exporters of food and other resources, especially to the United Kingdom.
Increasingly, their economies are tied to Japan and other Asian countries.
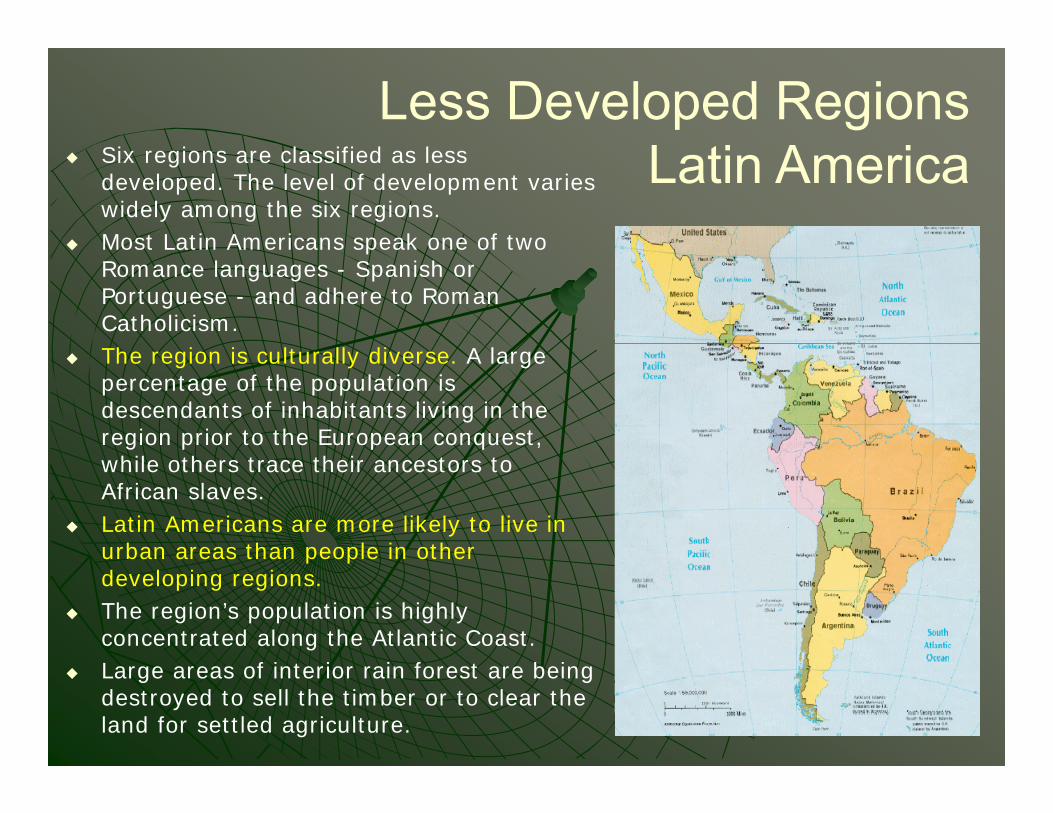
Less Developed RegionsLatin America Six regions are classified as less
developed. The level of development varies widely among the six regions.
Most Latin Americans speak one of two Romance languages - Spanish or Portuguese - and adhere to Roman Catholicism.
The region is culturally diverse. A large percentage of the population is descendants of inhabitants living in the region prior to the European conquest, while others trace their ancestors to African slaves.
Latin Americans are more likely to live in urban areas than people in other developing regions.
The region’s population is highly concentrated along the Atlantic Coast.
Large areas of interior rain forest are being destroyed to sell the timber or to clear the land for settled agriculture.
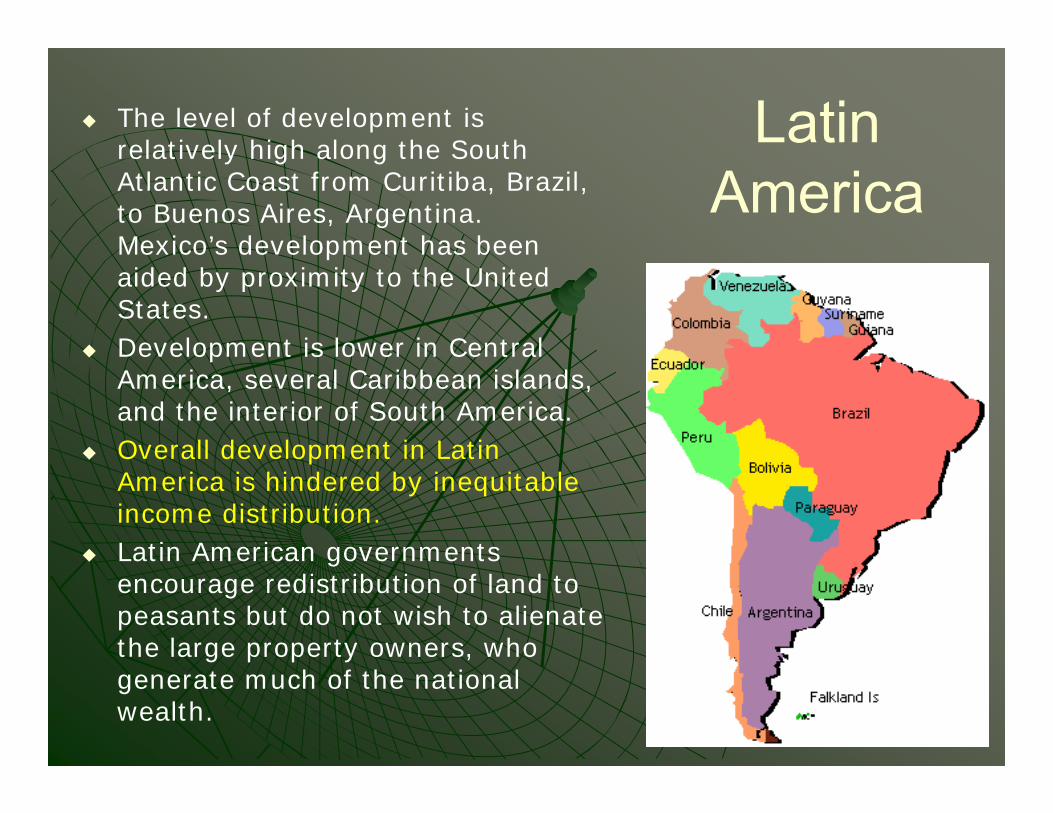
Latin America
The level of development is relatively high along the South Atlantic Coast from Curitiba, Brazil, to Buenos Aires, Argentina. Mexico’s development has been aided by proximity to the United States.
Development is lower in Central America, several Caribbean islands, and the interior of South America.
Overall development in Latin America is hindered by inequitable income distribution.
Latin American governments encourage redistribution of land to peasants but do not wish to alienate the large property owners, who generate much of the national wealth.

China China, the largest country in East
Asia, used to ranks among the world’s poorest.
Within a few years China is projected to exceed the United States as the world’s largest economy, although the U.S. economy will still be much larger on a per capita basis.
Traditionally, most Chinese farmers were forced to pay high rents and turn over a percentage of their crops to a property owner.
Exploitation of the country’s resources by Europe and Japan further retarded China’s development.
China’s watershed year was 1949, when the Communist party won a civil war and created the People’s Republic of China.
China as a Power
To ensure the production and distribution of enough food, the Communist government took control of most agricultural land.
In recent years such strict control have been loosened.
Individuals again are able to own land and control their own production. Agricultural land must be worked intensively to produce enough food for China’s large population.
The Chinese government controls the daily lives of the citizenry more than in other countries, and the people have difficulty obtaining some goods.
Because of government controls, China has a much lower natural increase rate than other LDCs.

Southeast Asia
Southeast Asia’s most populous country, Indonesia, includes 13,667 islands.
Nearly two-thirds of the population lives on the island of Java. Other than Indonesia, Southeast Asia’s most populous countries are Vietnam, Thailand, and the Philippines.
The region has suffered from a half century of nearly continuous warfare.
Japan, the Netherlands, France, and the United Kingdom were all forced to withdraw from colonies.
The region’s tropical climate limits intensive cultivation of most grains.
Economic development is also limited in Southeast Asia by several mountain ranges, active volcanoes, and frequent typhoons.
This inhospitable environment traditionally kept population growth low.
But the injection of Western medicine and technology resulted in one of the most rapid rates of increase.
Rice is exported in large quantities from some countries, such as Thailand and Vietnam, but imported to other countries such as Malaysia and the Philippines.
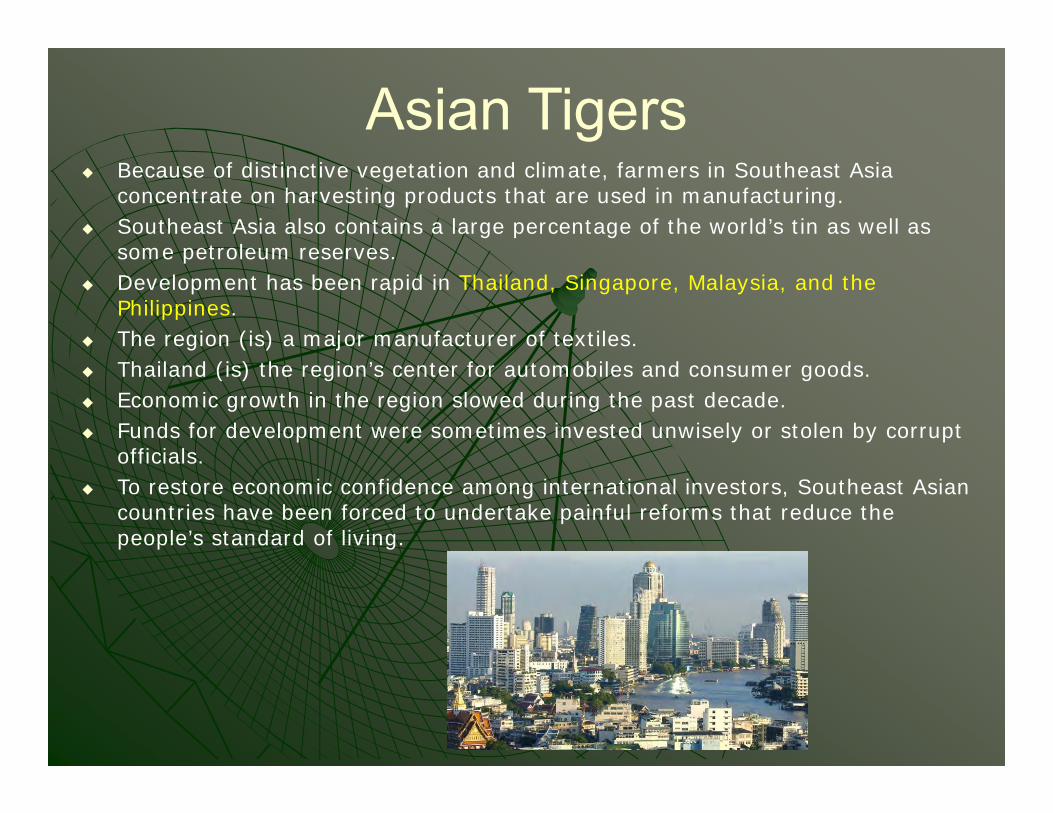
Asian Tigers Because of distinctive vegetation and climate, farmers in Southeast Asia
concentrate on harvesting products that are used in manufacturing. Southeast Asia also contains a large percentage of the world’s tin as well as
some petroleum reserves. Development has been rapid in Thailand, Singapore, Malaysia, and the
Philippines. The region (is) a major manufacturer of textiles. Thailand (is) the region’s center for automobiles and consumer goods. Economic growth in the region slowed during the past decade. Funds for development were sometimes invested unwisely or stolen by corrupt
officials. To restore economic confidence among international investors, Southeast Asian
countries have been forced to undertake painful reforms that reduce the people’s standard of living.
The Middle East
Much of the Middle East is desert that can sustain only sparse concentrations of plant and animal life.
Most products must be imported. Because of petroleum exports, the Middle East is the only one of the nine major world regions that enjoys a trade surplus.
Government officials in Middle Eastern states, such as Saudi Arabia and the United Arab Emirates, have used the billions of dollars generated from petroleum sales to finance economic development.
Many governments in the region have access to more money than they can use to finance development.
However, not every country in the region has abundant petroleum reserves.
Development possibilities are limited in countries that lack significant petroleum.
The large gap in per capita income between the petroleum-rich countries and those that lack resources causes great tension in the Middle East. People in poorer states held little sympathy for wealthy Kuwait when Iraq invaded it in 1990.
The challenge for many Middle Eastern states is to promote development without abandoning the traditional cultural values of Islam.
Many Middle Eastern countries prevent diffusion of financial practices that are considered incompatible with Islamic principles.
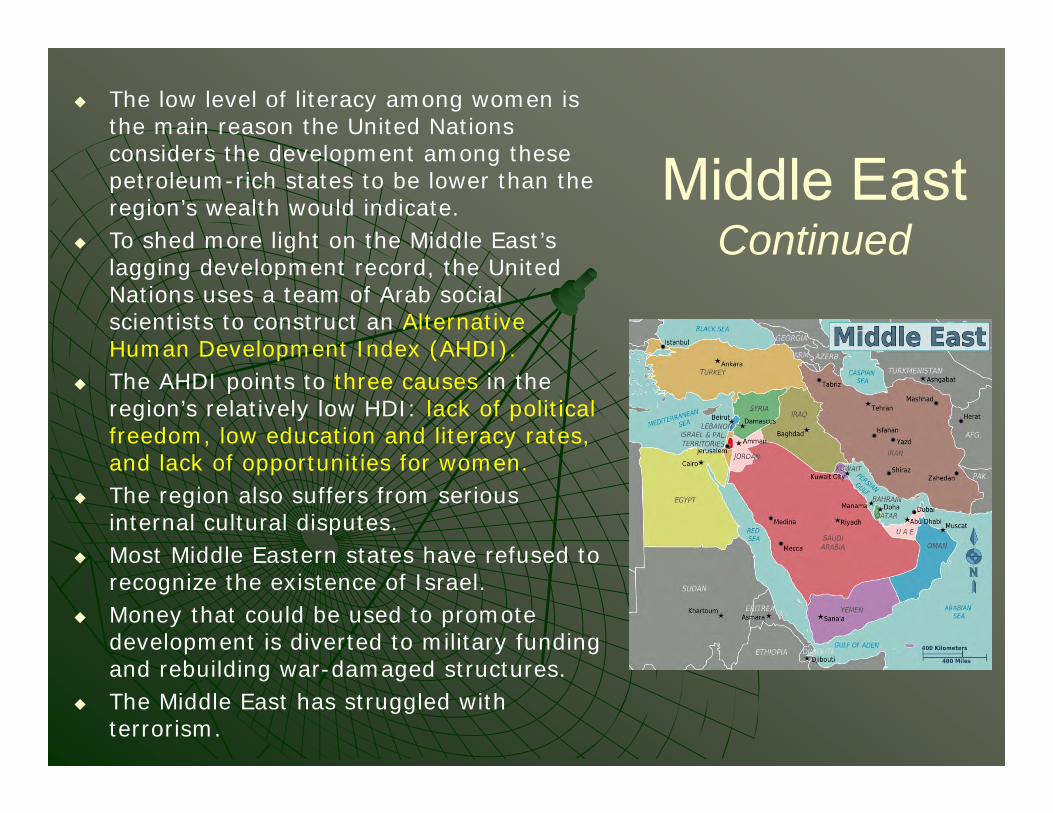
Middle East Continued
The low level of literacy among women is the main reason the United Nations considers the development among these petroleum-rich states to be lower than the region’s wealth would indicate.
To shed more light on the Middle East’s lagging development record, the United Nations uses a team of Arab social scientists to construct an Alternative Human Development Index (AHDI).
The AHDI points to three causes in the region’s relatively low HDI: lack of political freedom, low education and literacy rates, and lack of opportunities for women.
The region also suffers from serious internal cultural disputes.
Most Middle Eastern states have refused to recognize the existence of Israel.
Money that could be used to promote development is diverted to military funding and rebuilding war-damaged structures.
The Middle East has struggled with terrorism.
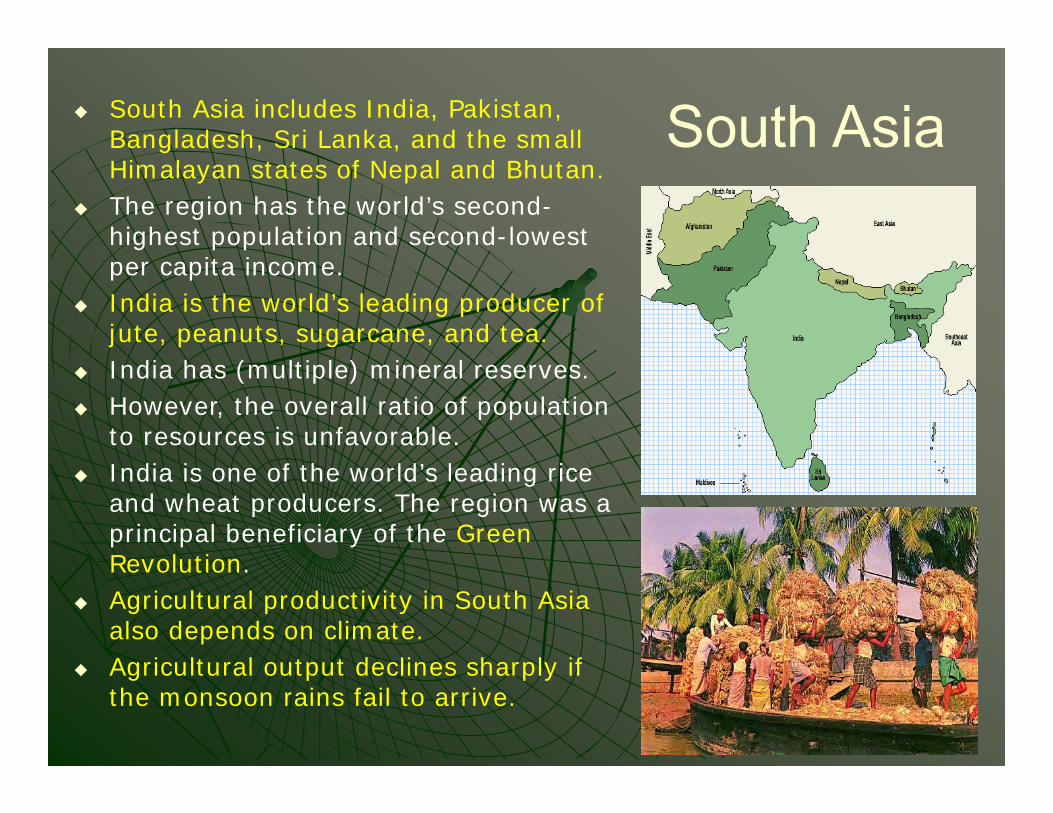
South Asia South Asia includes India, Pakistan, Bangladesh, Sri Lanka, and the small Himalayan states of Nepal and Bhutan.
The region has the world’s second-highest population and second-lowest per capita income.
India is the world’s leading producer of jute, peanuts, sugarcane, and tea.
India has (multiple) mineral reserves. However, the overall ratio of population
to resources is unfavorable. India is one of the world’s leading rice
and wheat producers. The region was a principal beneficiary of the Green Revolution.
Agricultural productivity in South Asia also depends on climate.
Agricultural output declines sharply if the monsoon rains fail to arrive.
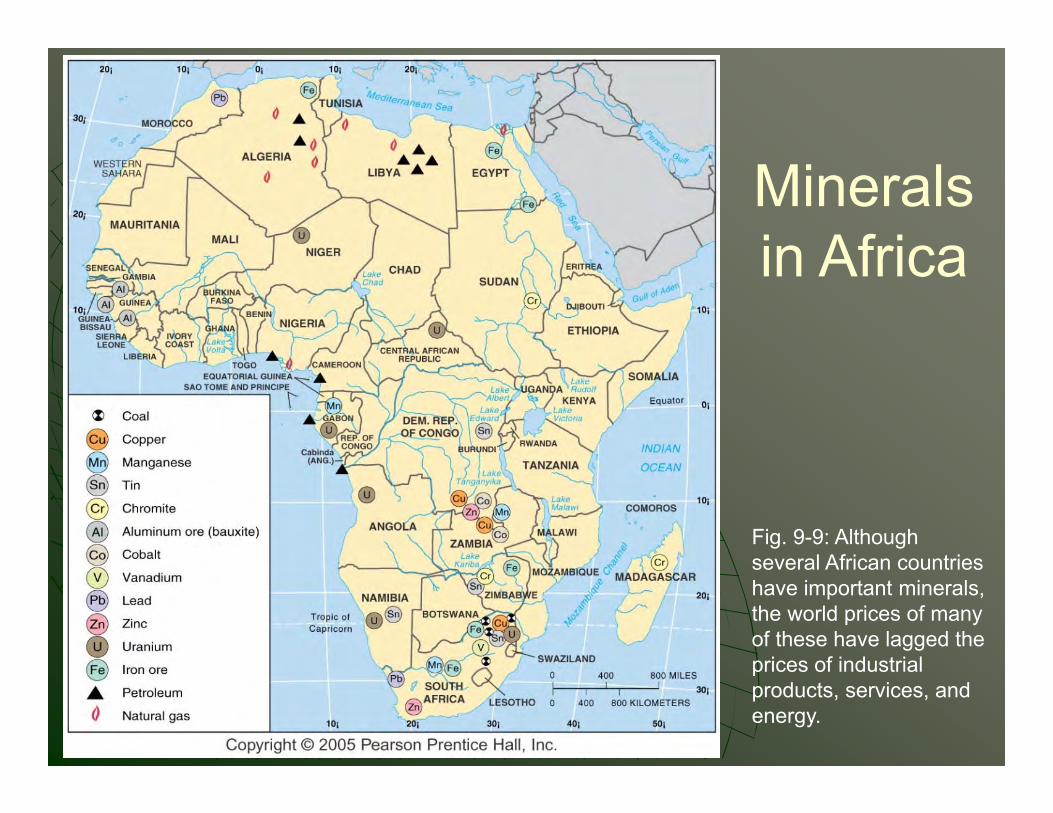
Minerals in Africa
Fig. 9-9: Although several African countries have important minerals, the world prices of many of these have lagged the prices of industrial products, services, and energy.
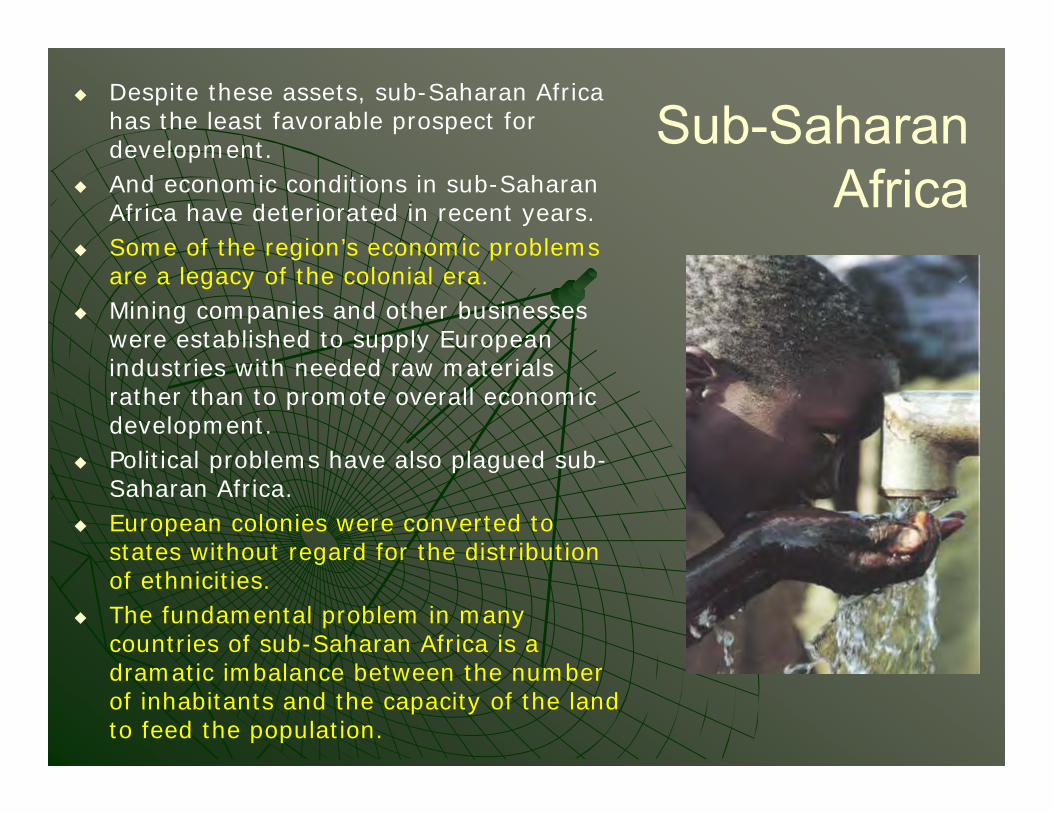
Sub-Saharan Africa
Despite these assets, sub-Saharan Africa has the least favorable prospect for development.
And economic conditions in sub-Saharan Africa have deteriorated in recent years.
Some of the region’s economic problems are a legacy of the colonial era.
Mining companies and other businesses were established to supply European industries with needed raw materials rather than to promote overall economic development.
Political problems have also plagued sub-Saharan Africa.
European colonies were converted to states without regard for the distribution of ethnicities.
The fundamental problem in many countries of sub-Saharan Africa is a dramatic imbalance between the number of inhabitants and the capacity of the land to feed the population.
Key Issue 3: Development and Gender
Gender-related development index• Economic indicator of gender
differences• Social indicators of gender differences• Demographic indicator of gender
differences
Gender empowerment• Economic indicators of empowerment• Political indicators of empowerment
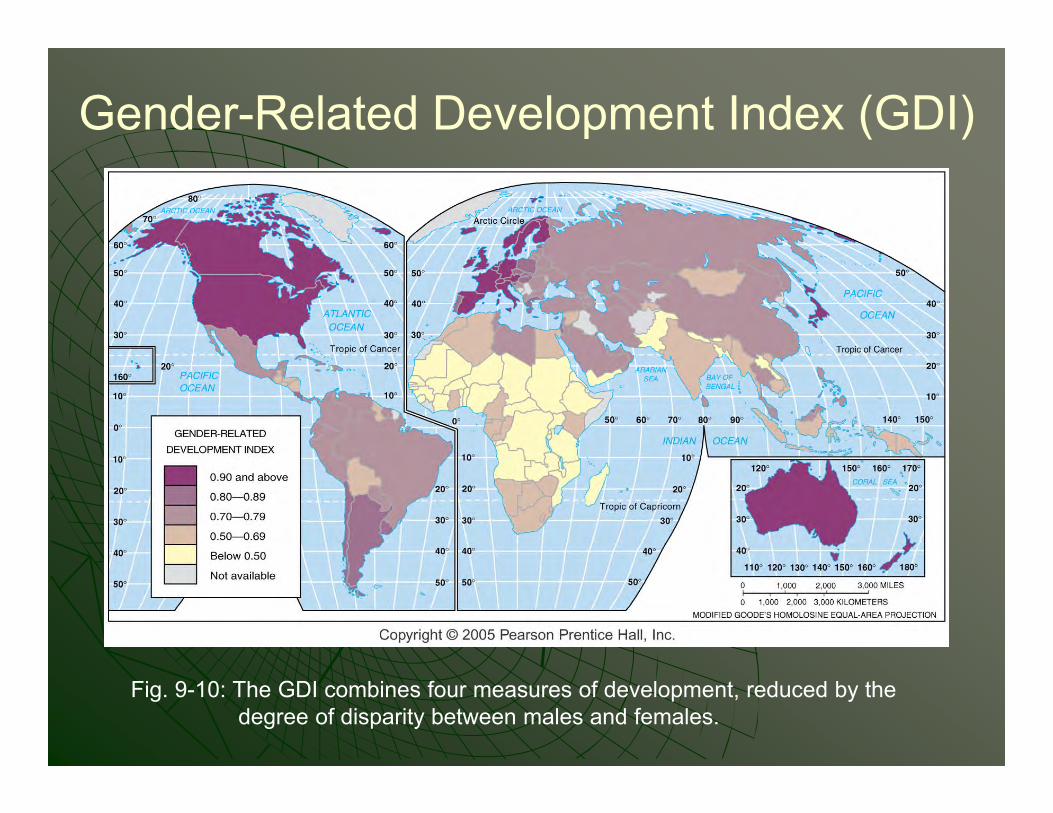
Gender-Related Development Index (GDI)
Fig. 9-10: The GDI combines four measures of development, reduced by the degree of disparity between males and females.

Economic Indicator of Gender Differences
Fig. 9-11: Women’s income is lower than men’s in all countries, but the gender gap is especially high in parts of the Middle East, South Asia, and Latin America.
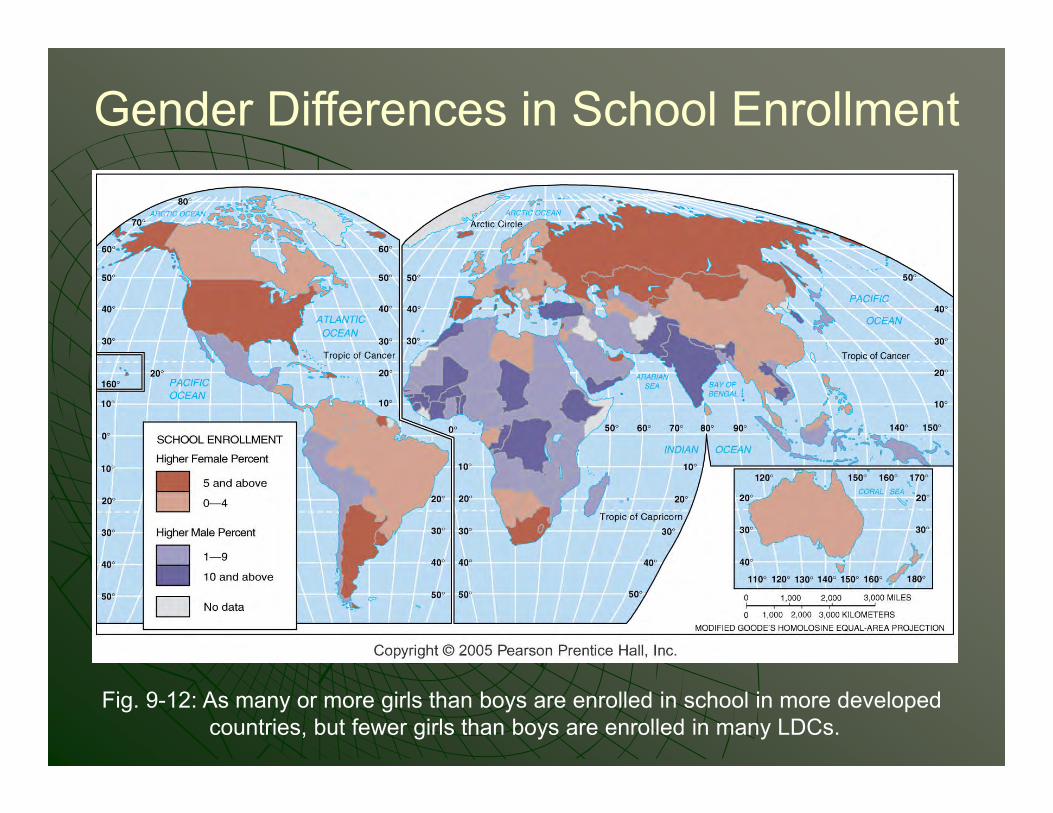
Gender Differences in School Enrollment
Fig. 9-12: As many or more girls than boys are enrolled in school in more developed countries, but fewer girls than boys are enrolled in many LDCs.
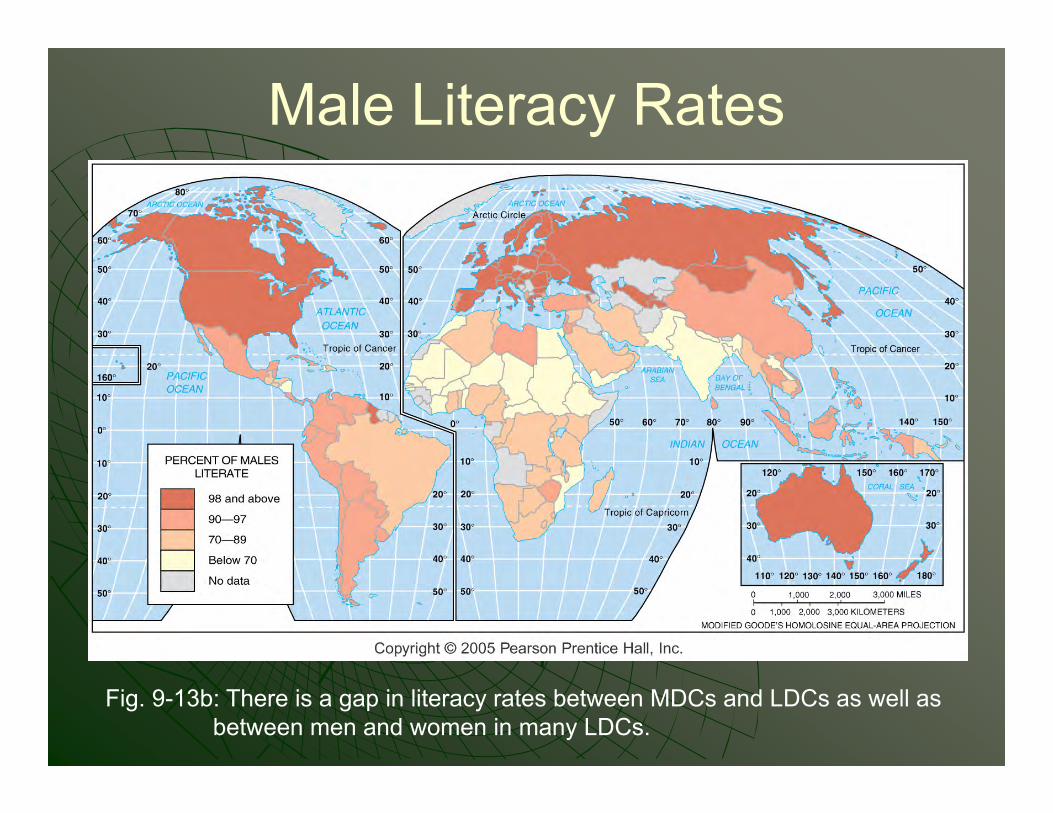
Male Literacy Rates
Fig. 9-13b: There is a gap in literacy rates between MDCs and LDCs as well as between men and women in many LDCs.
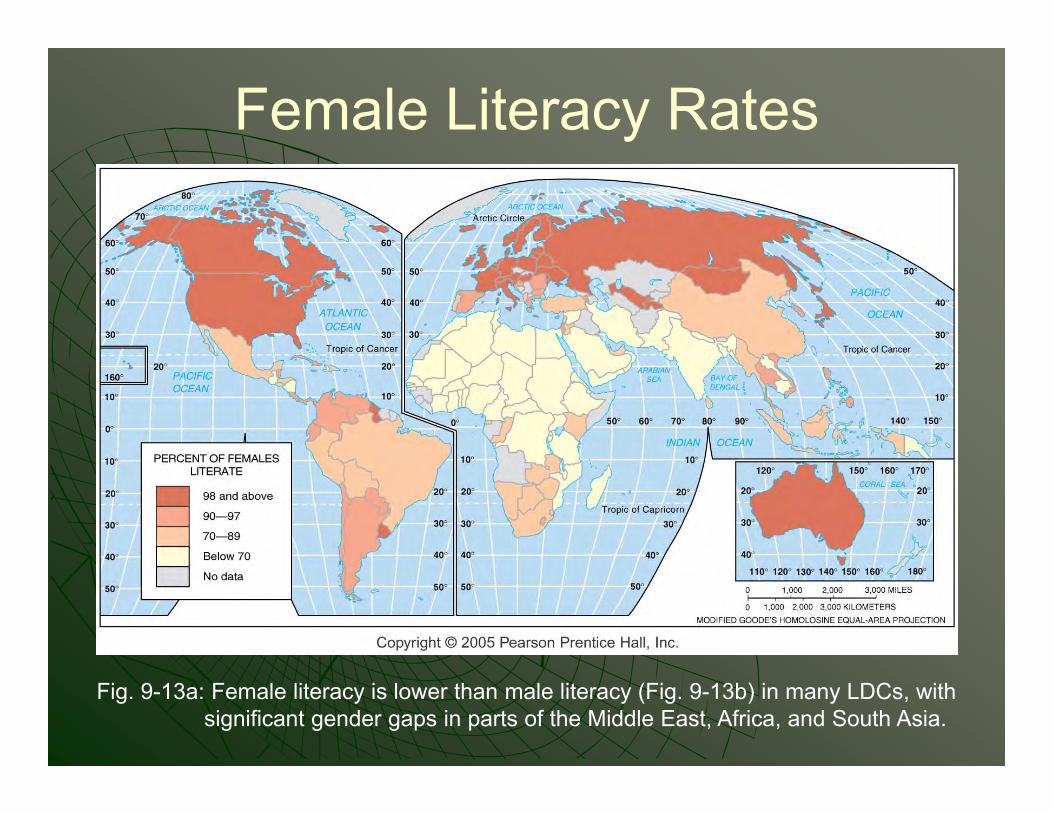
Female Literacy Rates
Fig. 9-13a: Female literacy is lower than male literacy (Fig. 9-13b) in many LDCs, with significant gender gaps in parts of the Middle East, Africa, and South Asia.
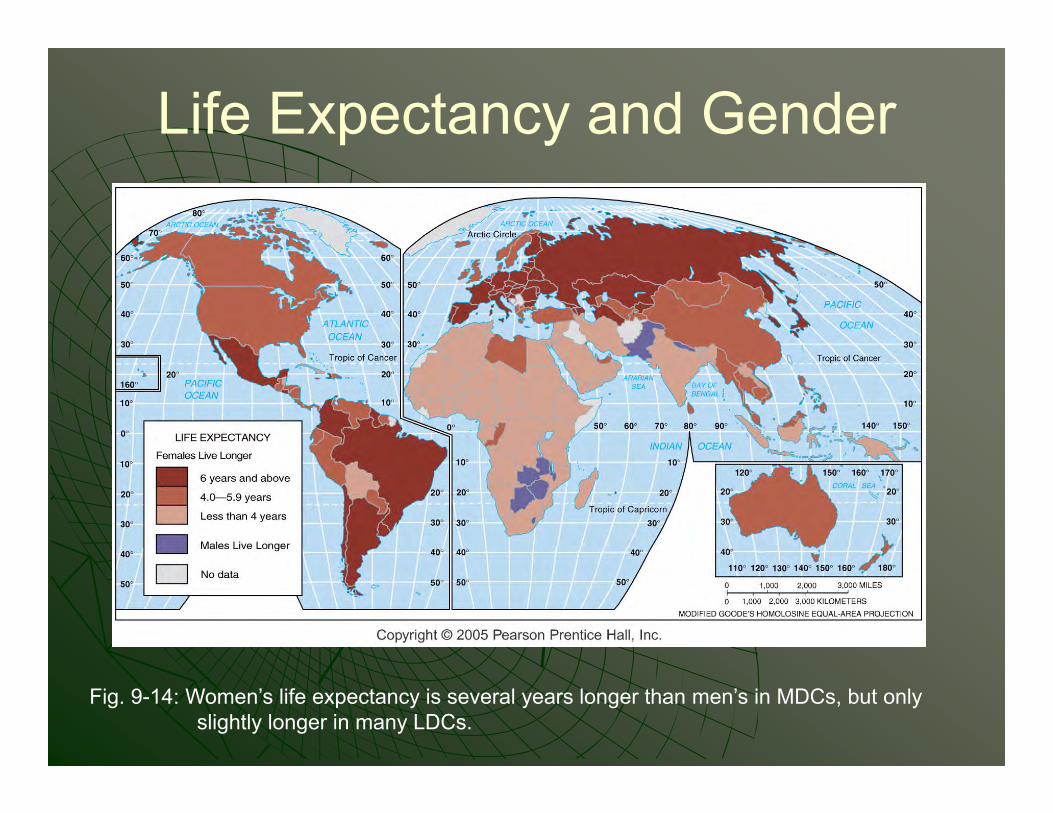
Life Expectancy and Gender
Fig. 9-14: Women’s life expectancy is several years longer than men’s in MDCs, but only slightly longer in many LDCs.
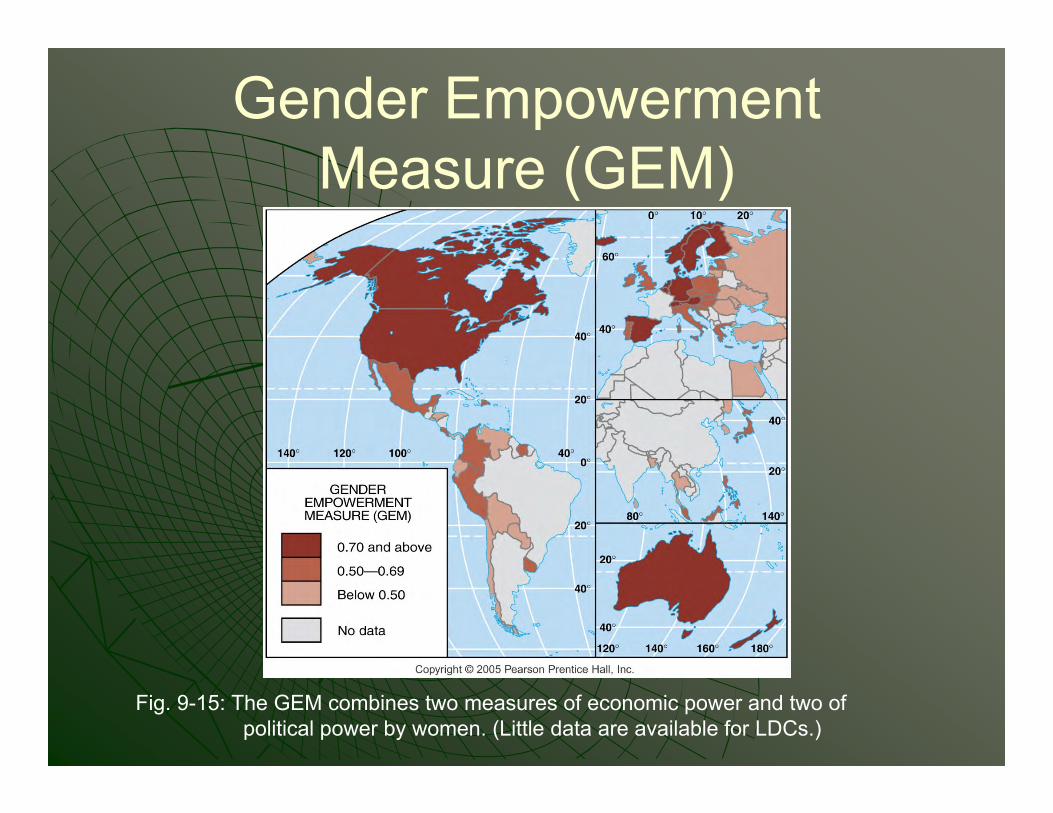
Gender Empowerment Measure (GEM)
Fig. 9-15: The GEM combines two measures of economic power and two of political power by women. (Little data are available for LDCs.)
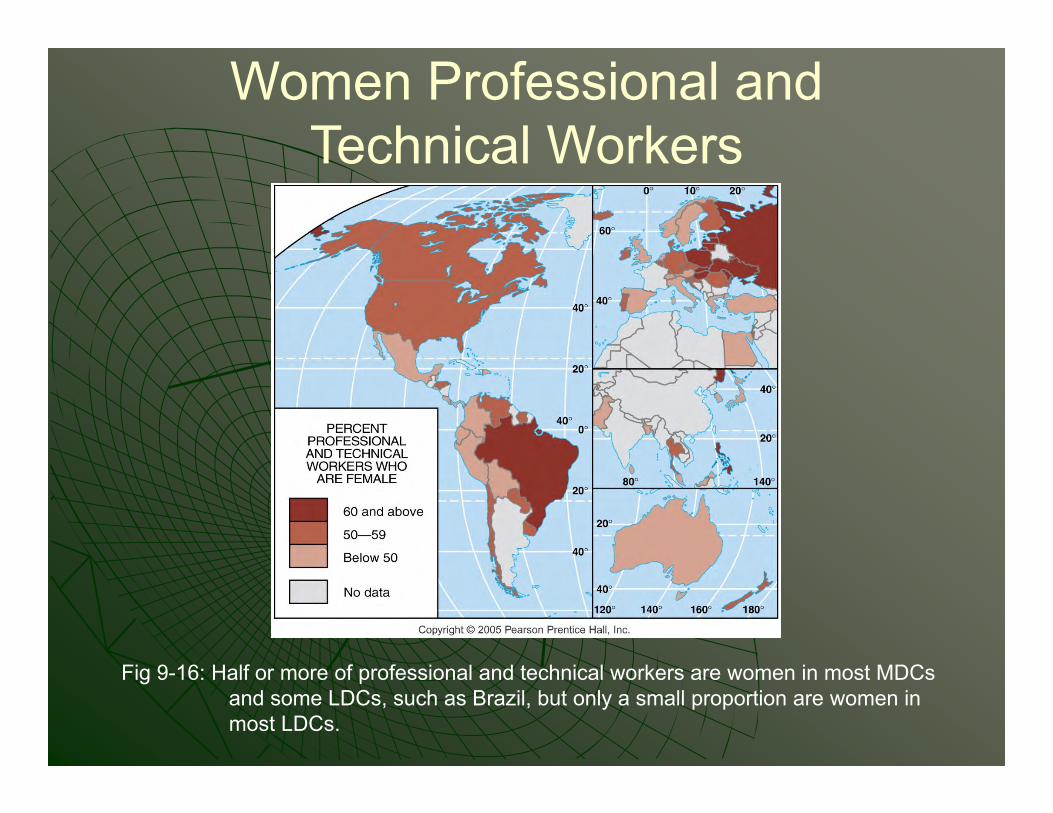
Women Professional and Technical Workers
Fig 9-16: Half or more of professional and technical workers are women in most MDCs and some LDCs, such as Brazil, but only a small proportion are women in most LDCs.
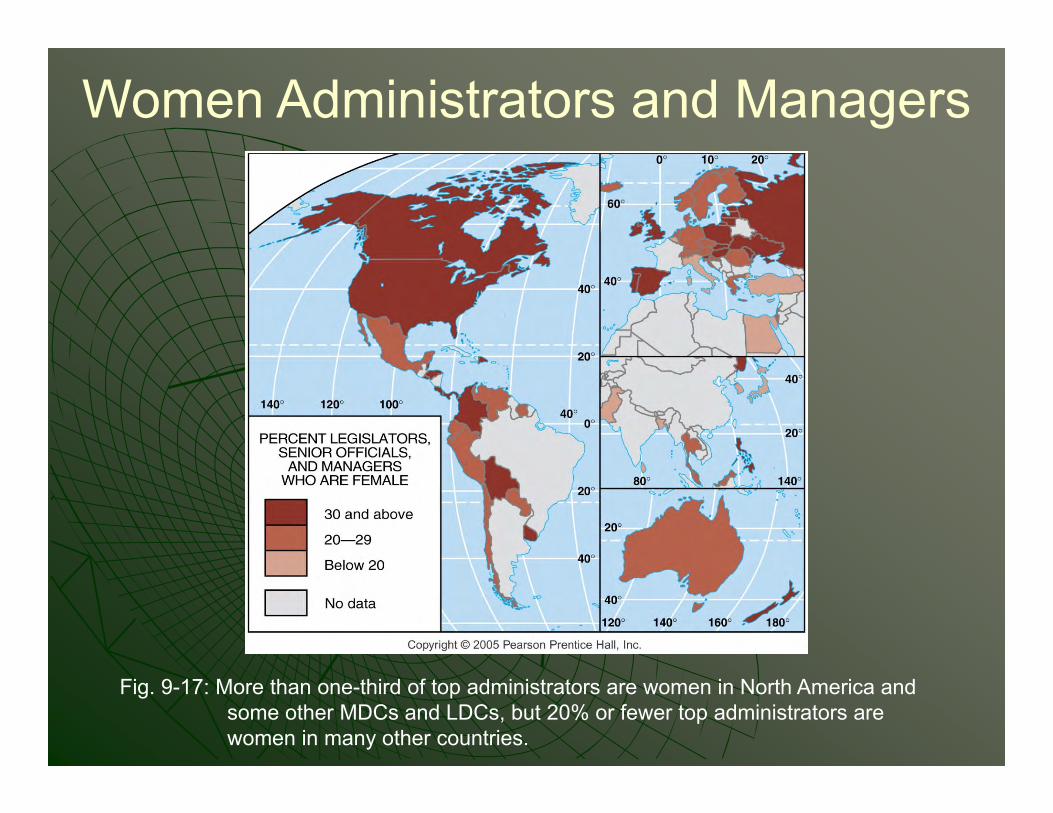
Women Administrators and Managers
Fig. 9-17: More than one-third of top administrators are women in North America and some other MDCs and LDCs, but 20% or fewer top administrators are women in many other countries.
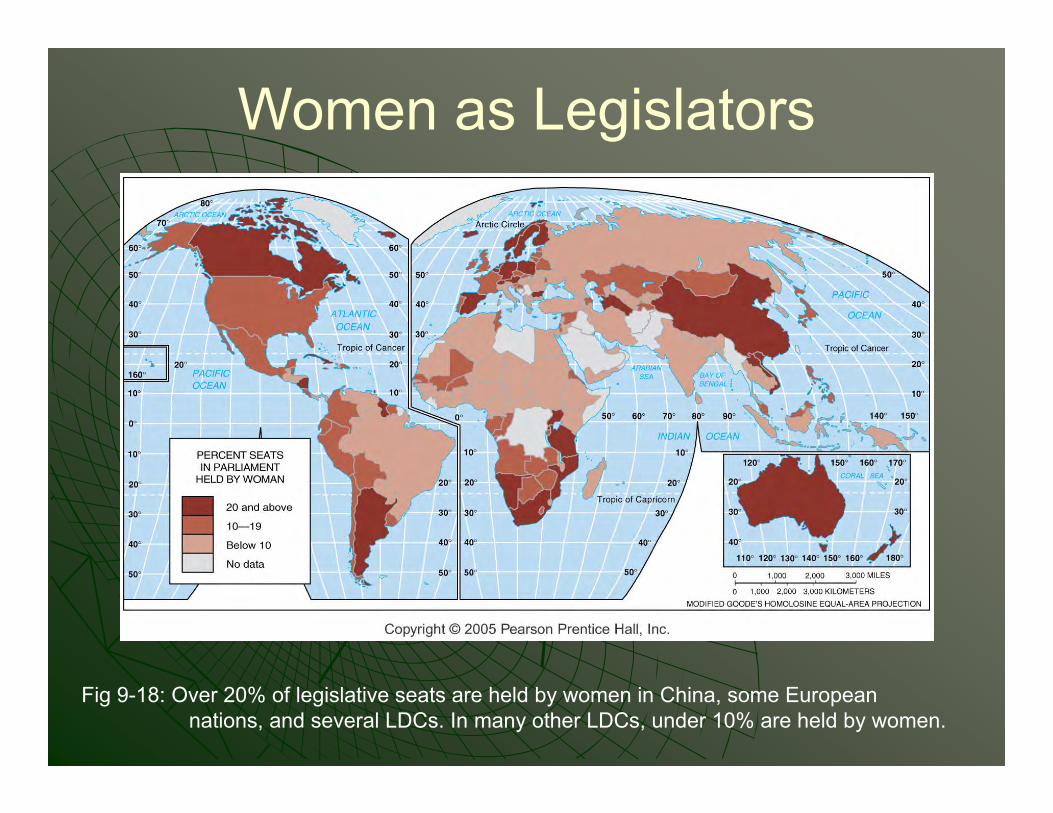
Women as Legislators
Fig 9-18: Over 20% of legislative seats are held by women in China, some European nations, and several LDCs. In many other LDCs, under 10% are held by women.

Key Issue 4: Development Strategies
Development through self-sufficiency• Elements of self-sufficiency approach• Problems with self-sufficiency
Development through international trade• Rostow’s development model• Examples of international trade approach• Problems with international trade
Financing development
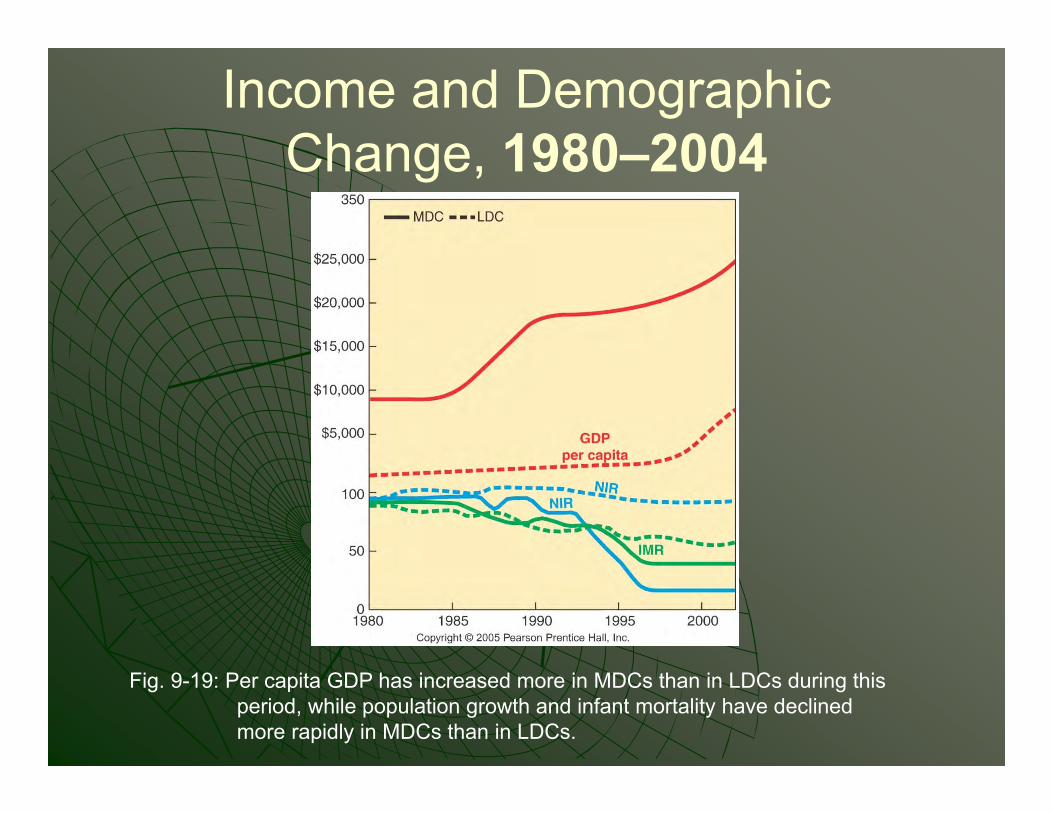
Income and Demographic Change, 1980–2004
Fig. 9-19: Per capita GDP has increased more in MDCs than in LDCs during this period, while population growth and infant mortality have declined more rapidly in MDCs than in LDCs.
Development through Self-Sufficiency
For most of the twentieth century, self-sufficiency, or balanced growth, was the more popular of the development alternatives.
The world’s two most populous countries, China and India, adopted this strategy, as did most African and Eastern European countries.
Elements of Self-Sufficiency Approach
According to the balanced growth approach, a country should spread investment as equally as possible across all sectors of its economy, and in all regions.
Reducing poverty takes precedence over encouraging a few people to become wealthy consumers.
The approach nurses fledgling businesses by isolating them from competition of large international corporations.
Countries promote self-sufficiency by setting barriers that limit the import of goods from other places.
The approach also restricts local businesses from exporting to other countries.
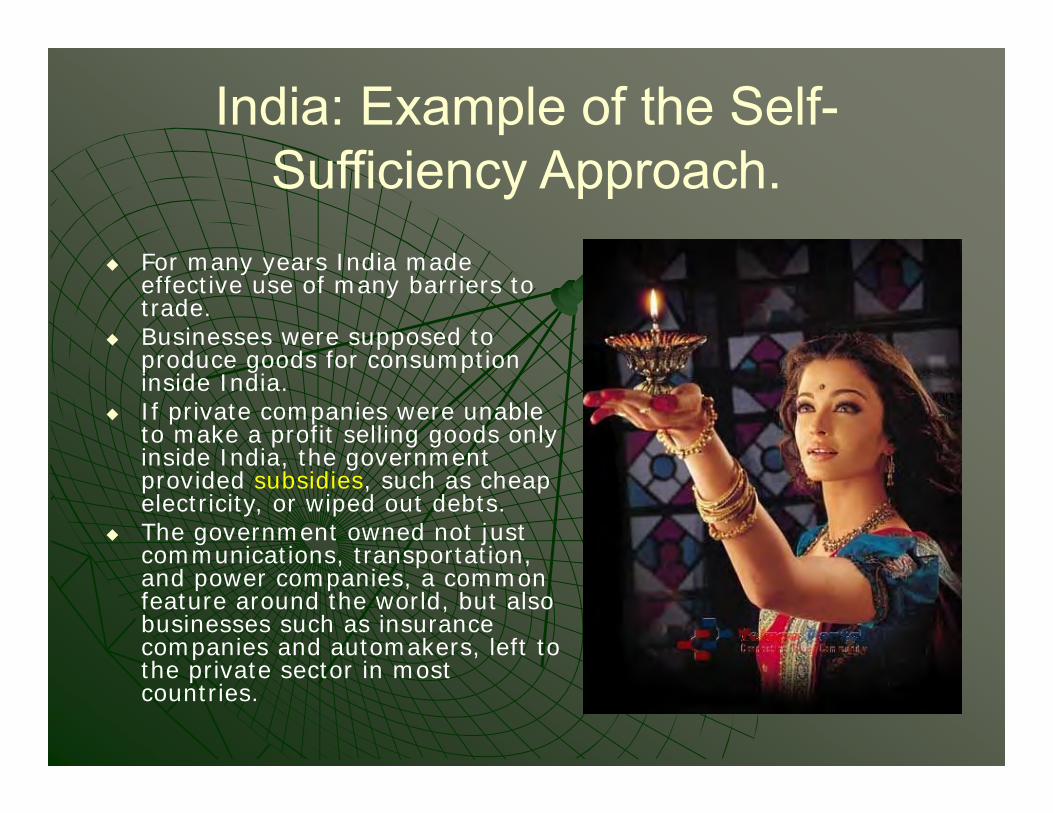
India: Example of the Self-Sufficiency Approach.
For many years India made effective use of many barriers to trade.
Businesses were supposed to produce goods for consumption inside India.
If private companies were unable to make a profit selling goods only inside India, the government provided subsidies, such as cheap electricity, or wiped out debts.
The government owned not just communications, transportation, and power companies, a common feature around the world, but also businesses such as insurance companies and automakers, left to the private sector in most countries.
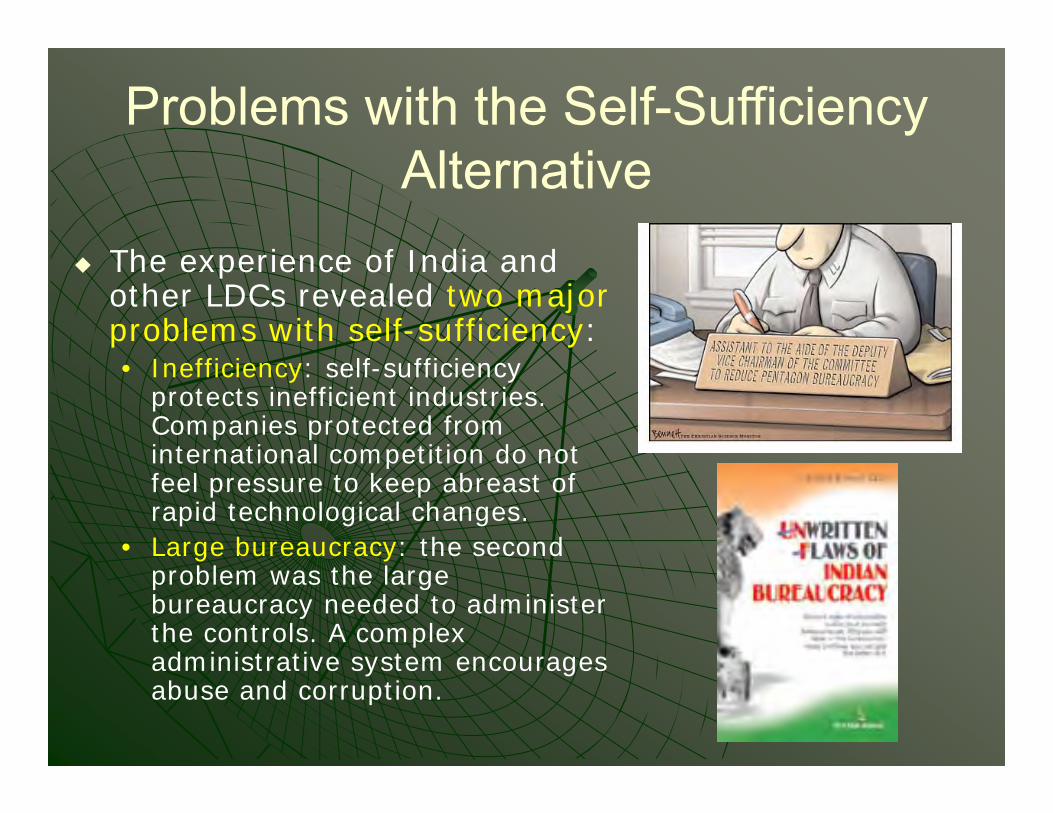
Problems with the Self-Sufficiency Alternative
The experience of India and other LDCs revealed two major problems with self-sufficiency: • Inefficiency: self-sufficiency
protects inefficient industries. Companies protected from international competition do not feel pressure to keep abreast of rapid technological changes.
• Large bureaucracy: the second problem was the large bureaucracy needed to administer the controls. A complex administrative system encourages abuse and corruption.
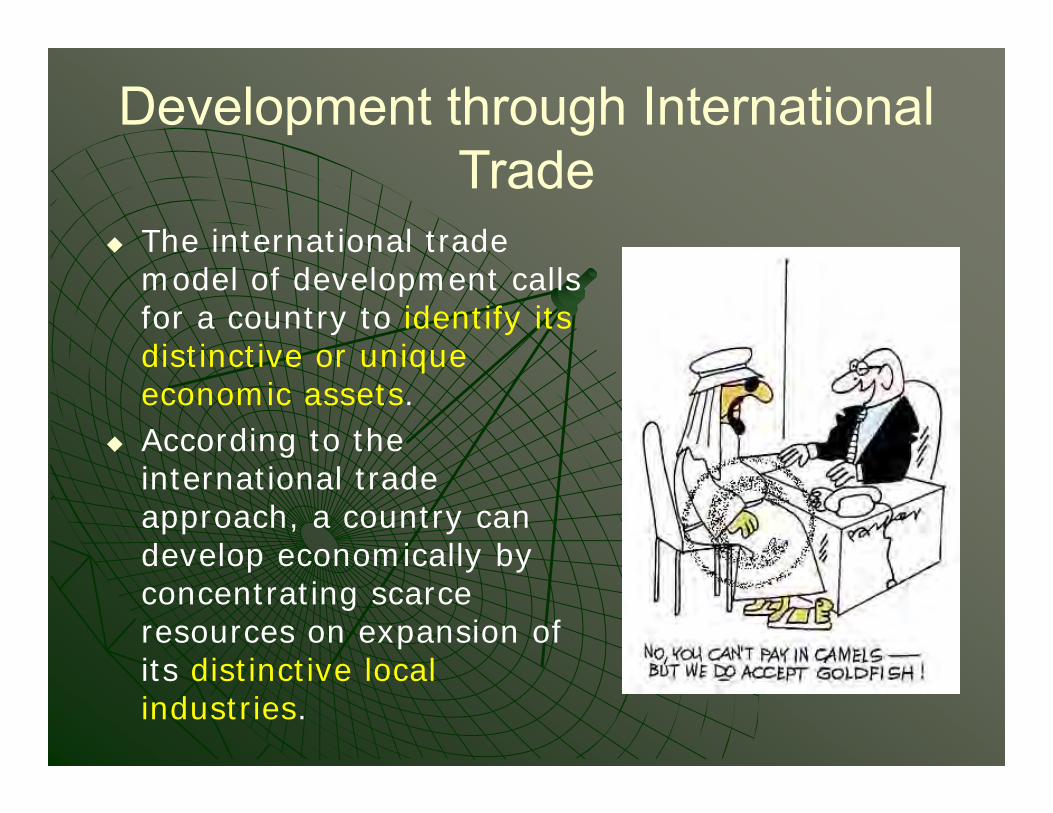
Development through International Trade
The international trade model of development calls for a country to identify its distinctive or unique economic assets.
According to the international trade approach, a country can develop economically by concentrating scarce resources on expansion of its distinctive local industries.
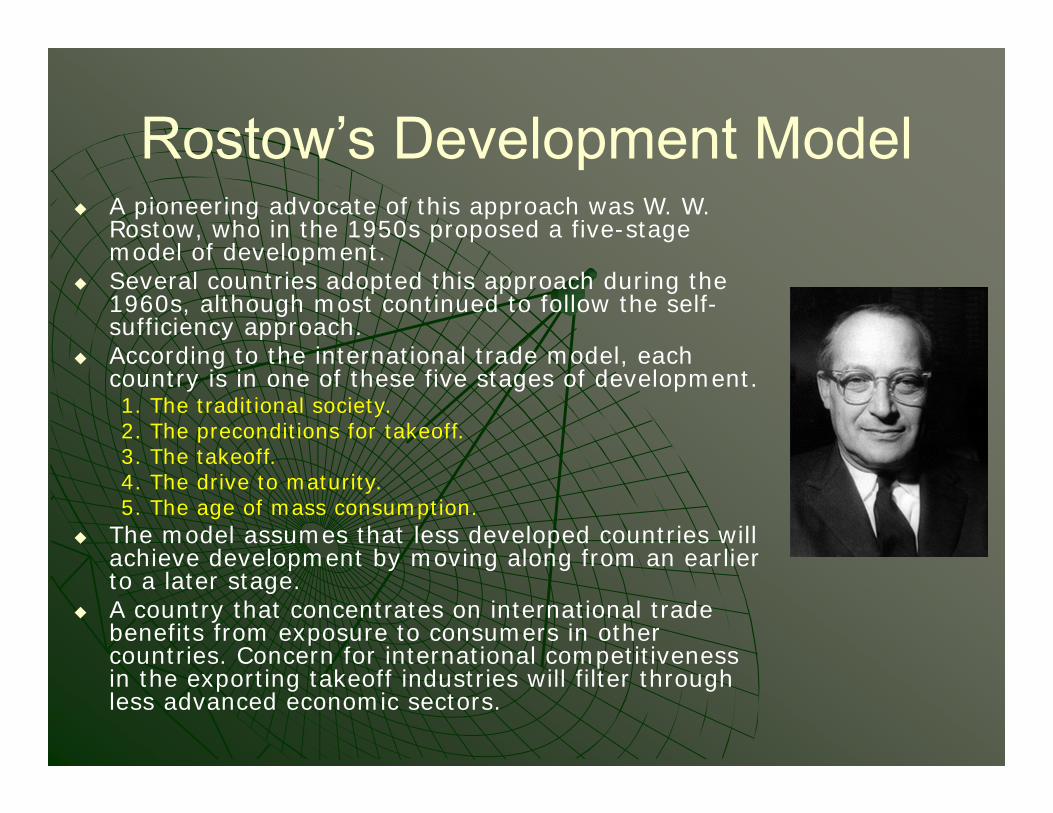
Rostow’s Development Model A pioneering advocate of this approach was W. W.
Rostow, who in the 1950s proposed a five-stage model of development.
Several countries adopted this approach during the 1960s, although most continued to follow the self-sufficiency approach.
According to the international trade model, each country is in one of these five stages of development. 1. The traditional society.2. The preconditions for takeoff.3. The takeoff.4. The drive to maturity.5. The age of mass consumption.
The model assumes that less developed countries will achieve development by moving along from an earlier to a later stage.
A country that concentrates on international trade benefits from exposure to consumers in other countries. Concern for international competitiveness in the exporting takeoff industries will filter through less advanced economic sectors.
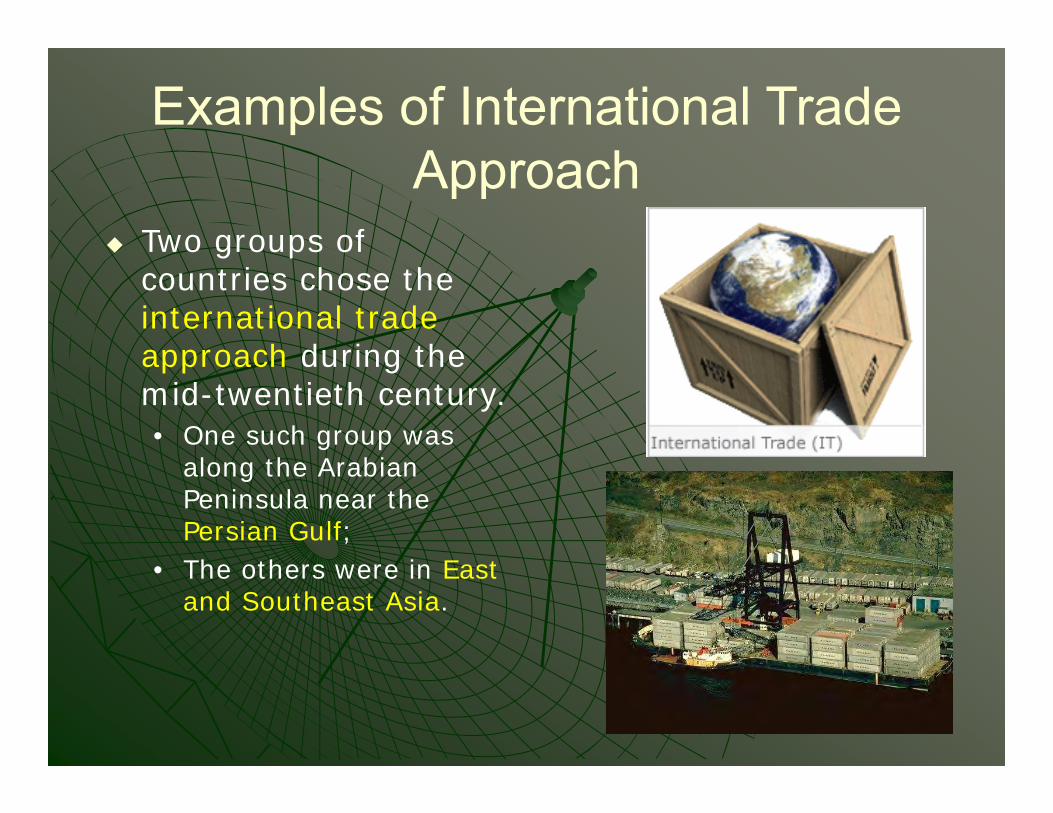
Examples of International Trade Approach
Two groups of countries chose the international trade approach during the mid-twentieth century. • One such group was
along the Arabian Peninsula near the Persian Gulf;
• The others were in East and Southeast Asia.

Petroleum-Rich Persian Gulf States
This region was one of the world’s least developed until the 1970s, when escalation of petroleum prices transformed these countries overnight into some of the wealthiest per capita.
Persian Gulf countries have used petroleum revenues to finance large-scale projects.
The landscape has been further changed by the diffusion of consumer goods.
Some Islamic religious principles, which dominate the culture of the Middle East, conflict with business practices in more developed countries.
Women are excluded from holding most jobs and visiting public places.
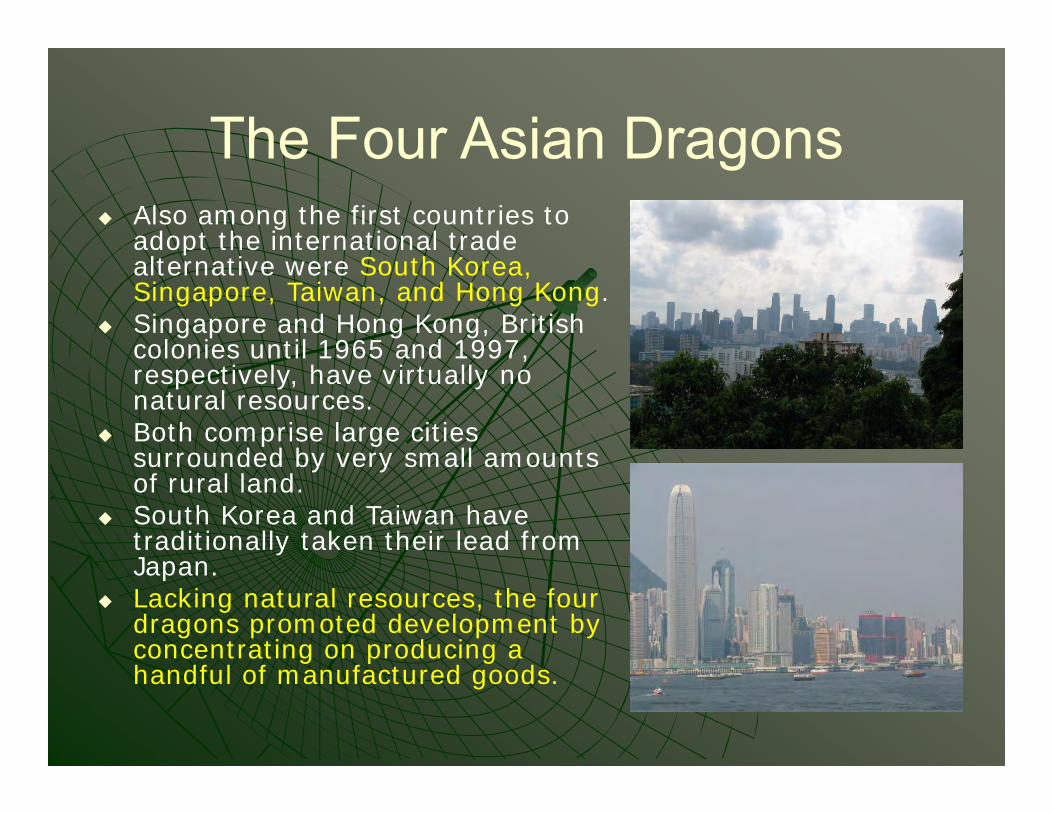
The Four Asian Dragons Also among the first countries to
adopt the international trade alternative were South Korea, Singapore, Taiwan, and Hong Kong.
Singapore and Hong Kong, British colonies until 1965 and 1997, respectively, have virtually no natural resources.
Both comprise large cities surrounded by very small amounts of rural land.
South Korea and Taiwan have traditionally taken their lead from Japan.
Lacking natural resources, the four dragons promoted development by concentrating on producing a handful of manufactured goods.
Problems with the International Trade Alternative
Three problems have hindered countries outside the Persian Gulf and the four Asian dragons from developing through the international trade approach:
1. Uneven resource distribution
2. Market stagnation3. Increased dependence on
MDCs
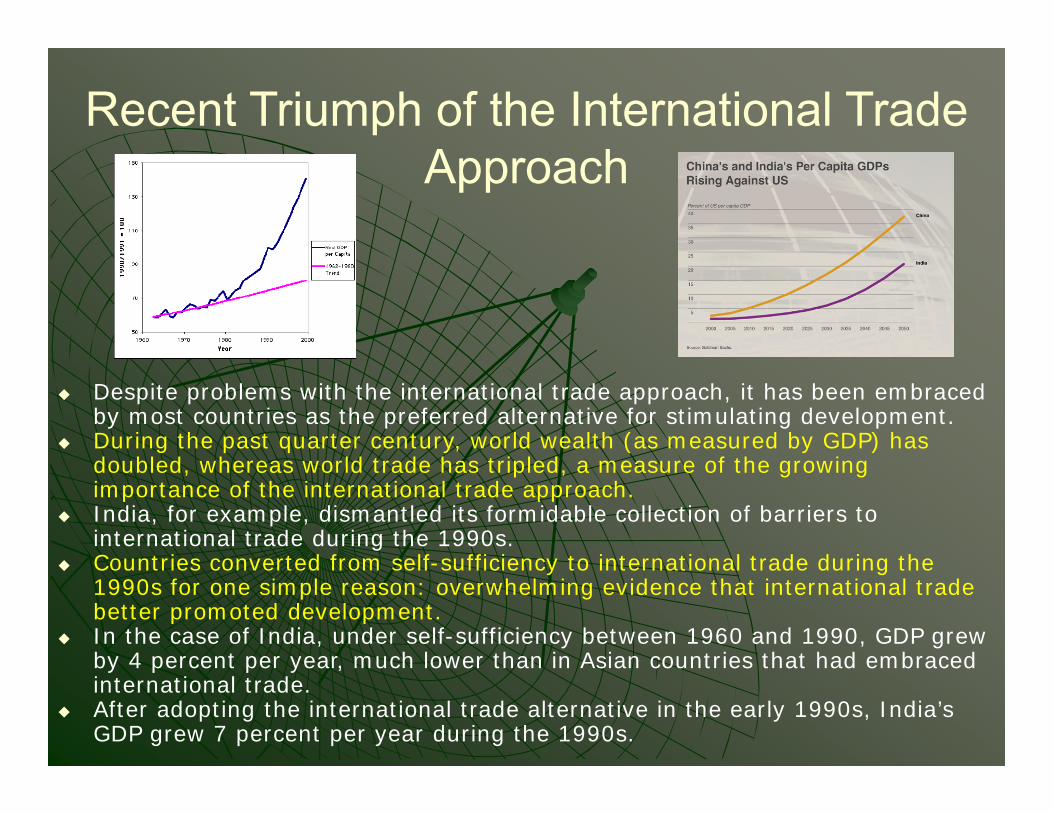
Recent Triumph of the International Trade Approach
Despite problems with the international trade approach, it has been embraced by most countries as the preferred alternative for stimulating development.
During the past quarter century, world wealth (as measured by GDP) has doubled, whereas world trade has tripled, a measure of the growing importance of the international trade approach.
India, for example, dismantled its formidable collection of barriers to international trade during the 1990s.
Countries converted from self-sufficiency to international trade during the 1990s for one simple reason: overwhelming evidence that international trade better promoted development.
In the case of India, under self-sufficiency between 1960 and 1990, GDP grew by 4 percent per year, much lower than in Asian countries that had embraced international trade.
After adopting the international trade alternative in the early 1990s, India’s GDP grew 7 percent per year during the 1990s.
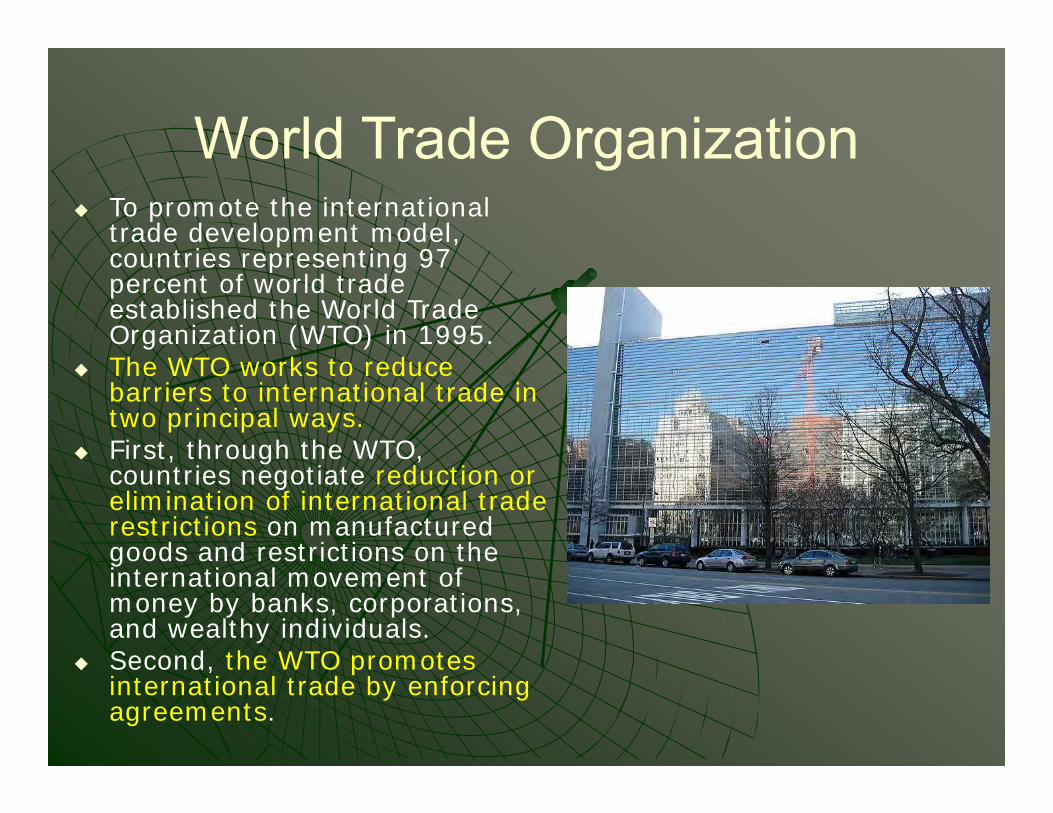
World Trade Organization To promote the international
trade development model, countries representing 97 percent of world trade established the World Trade Organization (WTO) in 1995.
The WTO works to reduce barriers to international trade in two principal ways.
First, through the WTO, countries negotiate reduction or elimination of international trade restrictions on manufactured goods and restrictions on the international movement of money by banks, corporations, and wealthy individuals.
Second, the WTO promotes international trade by enforcing agreements.

WTO Opponents The WTO has been sharply
attacked by liberal and conservative critics.
Liberal critics charge that the WTO is antidemocratic, because decisions made behind closed doors promote the interest of large corporations rather than the poor.
Conservatives charge that the WTO compromises the power and sovereignty of individual countries because it can order changes in taxes and laws that it considers unfair trading practices.
Protesters routinely gather in the streets outside high-level meetings of the WTO.

Financing Development Regardless of whether self-sufficiency
or international trade is preferred, less developed countries lack the money needed to finance development.
LDCs borrow money to build new infrastructure.
The two major lenders are international lending organizations controlled by the MDC governments—the World Bank and the International Monetary Fund.
Money is also lent by commercial banks in more developed countries.
The theory behind borrowing money to build infrastructure is that new or expanded businesses attracted to an area will contribute additional taxes that the LDC uses in part to repay the loans and in part to improve its citizens’ living conditions.
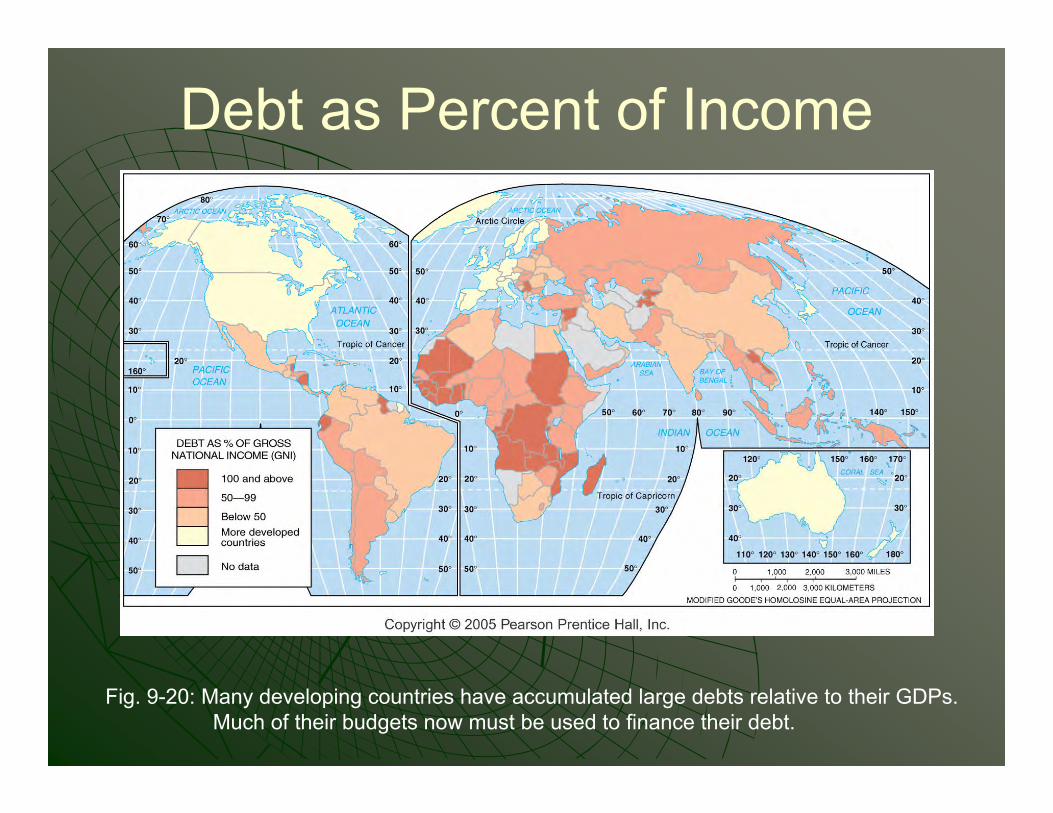
Debt as Percent of Income
Fig. 9-20: Many developing countries have accumulated large debts relative to their GDPs. Much of their budgets now must be used to finance their debt.
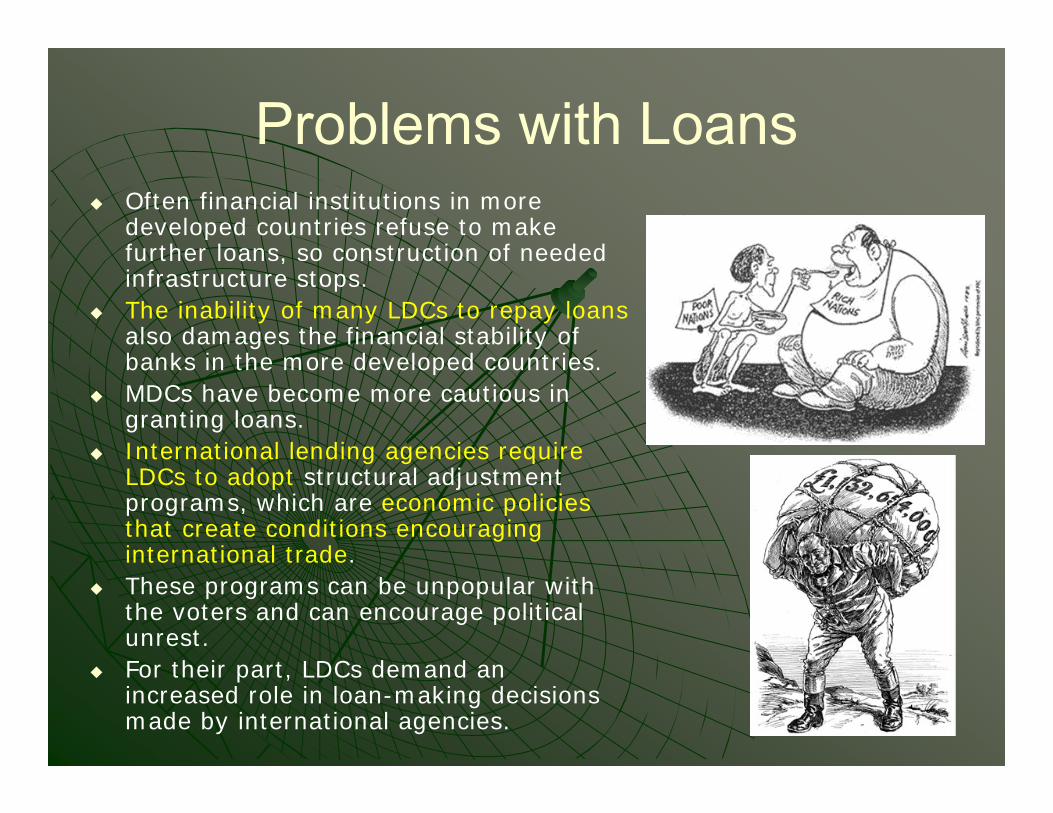
Problems with Loans Often financial institutions in more
developed countries refuse to make further loans, so construction of needed infrastructure stops.
The inability of many LDCs to repay loans also damages the financial stability of banks in the more developed countries.
MDCs have become more cautious in granting loans.
International lending agencies require LDCs to adopt structural adjustment programs, which are economic policies that create conditions encouraging international trade.
These programs can be unpopular with the voters and can encourage political unrest.
For their part, LDCs demand an increased role in loan-making decisions made by international agencies.

Transnational Corporations A transnational corporation
operates in countries other than the one in which its headquarters are located.
The net flow of investment from MDCs to LDCs made by private corporations grew nearly tenfold during the 1990s.
About one-half of the investment involved transfers within transnational corporations.
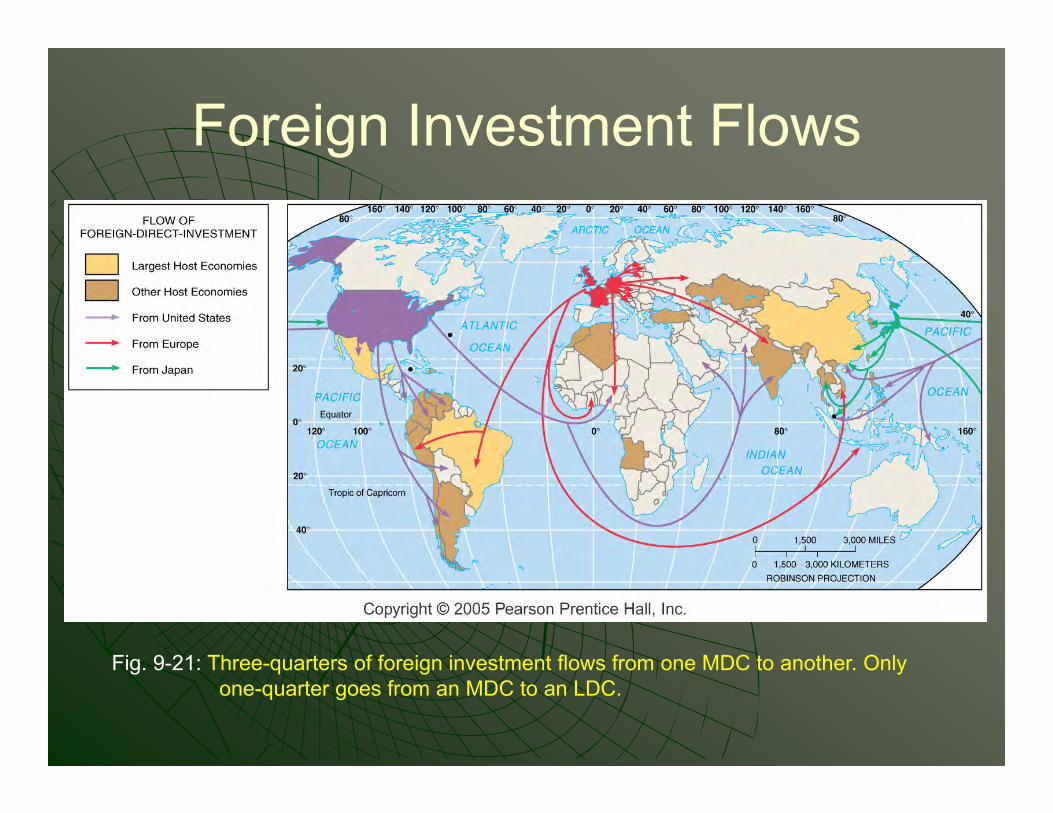
Foreign Investment Flows
Fig. 9-21: Three-quarters of foreign investment flows from one MDC to another. Only one-quarter goes from an MDC to an LDC.
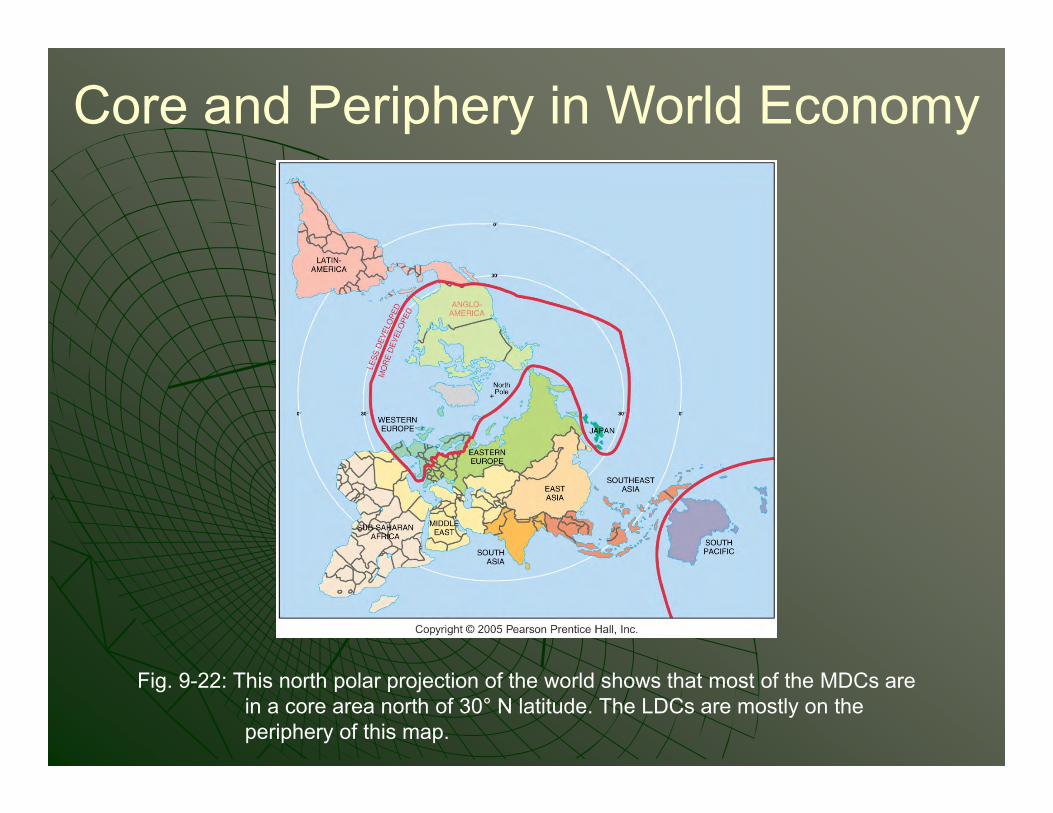
Core and Periphery in World Economy
Fig. 9-22: This north polar projection of the world shows that most of the MDCs are in a core area north of 30° N latitude. The LDCs are mostly on the periphery of this map.