ap-42 12.12 final background document for secondary … · 2 2.0 industry description 2.1 general...
TRANSCRIPT

i
BACKGROUND REPORT
AP-42 SECTION 12.12
SECONDARY MAGNESIUM SMELTING
Prepared for
U.S. Environmental Protection AgencyOAQPS/TSD/EIB
Research Triangle Park, NC 27711
1-103
Pacific Environmental Services, Inc.P.O. Box 12077
Research Triangle Park, NC 27709
ii
919/941-0333
1-103
AP-42 Background Report
TECHNICAL SUPPORT DIVISION

iii
U.S. ENVIRONMENTAL PROTECTION AGENCYOffice of Air Quality Planning and Standards
Research Triangle Park, NC 27711This report has been reviewed by the Technical Support Division of the Office of Air QualityPlanning and Standards, EPA. Mention of trade names or commercial products is not intended toconstitute endorsement or recommendation for use. Copies of this report are available through theLibrary Services Office (MD-35), U.S. Environmental Protection Agency, Research Triangle Park,NC 27711.
iv
TABLE OF CONTENTS
1.0 INTRODUCTION . . . . . . . . . . . . . . . . . . . . . . . . . . . . . . . . . . . . . . . . . . . . . . . . . . . . . 1
2.0 INDUSTRY DESCRIPTION . . . . . . . . . . . . . . . . . . . . . . . . . . . . . . . . . . . . . . . . . . . . 22.1 GENERAL . . . . . . . . . . . . . . . . . . . . . . . . . . . . . . . . . . . . . . . . . . . . . . . . . . . 22.2 PROCESS DESCRIPTION . . . . . . . . . . . . . . . . . . . . . . . . . . . . . . . . . . . . . . 22.3 EMISSIONS AND CONTROLS . . . . . . . . . . . . . . . . . . . . . . . . . . . . . . . . . . 32.4 REVIEW OF REFERENCES FOR CHAPTER 2 . . . . . . . . . . . . . . . . . . . . . . 42.5 REFERENCES FOR CHAPTER 2 . . . . . . . . . . . . . . . . . . . . . . . . . . . . . . . . 5
3.0 GENERAL EMISSION DATA REVIEW AND ANALYSIS PROCEDURES . . . . . . . . 63.1 LITERATURE SEARCH AND SCREENING . . . . . . . . . . . . . . . . . . . . . . . . 63.2 EMISSION DATA QUALITY RATING SYSTEM . . . . . . . . . . . . . . . . . . . . 73.3 EMISSION FACTOR QUALITY RATING SYSTEM . . . . . . . . . . . . . . . . . . 93.4 REFERENCES FOR CHAPTER 3 . . . . . . . . . . . . . . . . . . . . . . . . . . . . . . . 11
4.0 POLLUTANT EMISSION FACTOR DEVELOPMENT . . . . . . . . . . . . . . . . . . . . . . . 124.1 CRITERIA POLLUTANT EMISSIONS DATA . . . . . . . . . . . . . . . . . . . . . . 124.2 NONCRITERIA POLLUTANT EMISSIONS DATA . . . . . . . . . . . . . . . . . 204.3 REVIEW OF SPECIFIC DATA SETS . . . . . . . . . . . . . . . . . . . . . . . . . . . . . 224.4 DATA GAP ANALYSIS . . . . . . . . . . . . . . . . . . . . . . . . . . . . . . . . . . . . . . . 234.5 REFERENCES FOR CHAPTER 4 . . . . . . . . . . . . . . . . . . . . . . . . . . . . . . . 23
v
LIST OF TABLES
TABLE 4.1-1 (METRIC): VOLATILE ORGANIC COMPOUNDS . . . . . . . . . . . . . . . . . . . 13TABLE 4.1-1 (ENGLISH): VOLATILE ORGANIC COMPOUNDS . . . . . . . . . . . . . . . . . . 13TABLE 4.1-2 (METRIC): NITROGEN OXIDES . . . . . . . . . . . . . . . . . . . . . . . . . . . . . . . . . 15TABLE 4.1-2 (ENGLISH): NITROGEN OXIDES . . . . . . . . . . . . . . . . . . . . . . . . . . . . . . . . 15TABLE 4.1-3 (METRIC): CARBON MONOXIDE . . . . . . . . . . . . . . . . . . . . . . . . . . . . . . . . 17TABLE 4.1-3 (ENGLISH): CARBON MONOXIDE . . . . . . . . . . . . . . . . . . . . . . . . . . . . . . . 17TABLE 4.1-4 (METRIC): TOTAL SUSPENDED PARTICULATE AND PM10 . . . . . . . . . . 19TABLE 4.1-4 (ENGLISH): TOTAL SUSPENDED PARTICULATE AND PM10 . . . . . . . . . 19TABLE 4.2-1 (METRIC): HAZARDOUS AIR POLLUTANTS:
HYDROGEN CHLORIDE . . . . . . . . . . . . . . . . . . . . . . . . . . . . . . . 21TABLE 4.2-1 (ENGLISH): HAZARDOUS AIR POLLUTANTS:
HYDROGEN CHLORIDE . . . . . . . . . . . . . . . . . . . . . . . . . . . . . . . 21TABLE 4.5-1: LIST OF CONVERSION FACTORS . . . . . . . . . . . . . . . . . . . . . . . . . . . . . . 24
1
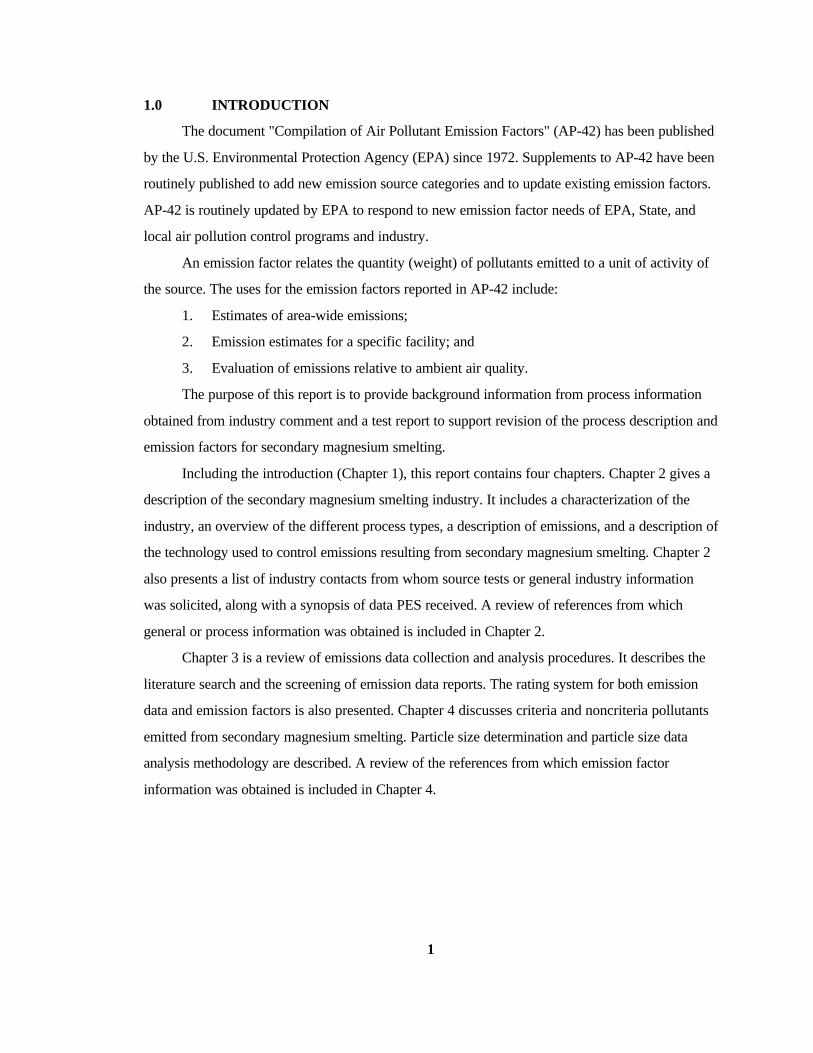
1.0 INTRODUCTION
The document "Compilation of Air Pollutant Emission Factors" (AP-42) has been published
by the U.S. Environmental Protection Agency (EPA) since 1972. Supplements to AP-42 have been
routinely published to add new emission source categories and to update existing emission factors.
AP-42 is routinely updated by EPA to respond to new emission factor needs of EPA, State, and
local air pollution control programs and industry.
An emission factor relates the quantity (weight) of pollutants emitted to a unit of activity of
the source. The uses for the emission factors reported in AP-42 include:
1. Estimates of area-wide emissions;
2. Emission estimates for a specific facility; and
3. Evaluation of emissions relative to ambient air quality.
The purpose of this report is to provide background information from process information
obtained from industry comment and a test report to support revision of the process description and
emission factors for secondary magnesium smelting.
Including the introduction (Chapter 1), this report contains four chapters. Chapter 2 gives a
description of the secondary magnesium smelting industry. It includes a characterization of the
industry, an overview of the different process types, a description of emissions, and a description of
the technology used to control emissions resulting from secondary magnesium smelting. Chapter 2
also presents a list of industry contacts from whom source tests or general industry information
was solicited, along with a synopsis of data PES received. A review of references from which
general or process information was obtained is included in Chapter 2.
Chapter 3 is a review of emissions data collection and analysis procedures. It describes the
literature search and the screening of emission data reports. The rating system for both emission
data and emission factors is also presented. Chapter 4 discusses criteria and noncriteria pollutants
emitted from secondary magnesium smelting. Particle size determination and particle size data
analysis methodology are described. A review of the references from which emission factor
information was obtained is included in Chapter 4.

2
2.0 INDUSTRY DESCRIPTION
2.1 GENERAL1,2
Secondary metal recovery (SCC code 3-04-999-99) involves melting scrap metals to recover
a pure form of the sought metal. The main sources for magnesium scrap recycling are automotive
components (primarily Volkswagen crankcase and transmission housings), etched photoengraving
sheets, chainsaw housings, scrap from wrought product manufacture and fabrication, general die-
cast scrap, magnesium turnings, and sludges from various magnesium-melting operations. If the
magnesium content is less than 15 to 20 percent, recovery is not economical.
In 1983, only 13 percent of the U.S. magnesium supply came from secondary production; in
1991, this number increased to 30 percent. This increase is partially a result of increased in
recycling of used beverage cans fabricated from aluminum-magnesium alloys.
Secondary magnesium production requires less energy than primary production.
Approximately 6.7 MJ/kg (2,865 Btu/lb) is needed to melt and cast recycled magnesium, as
compared to 267 MJ/kg (115,000 Btu/lb) to produce primary magnesium.
There are three secondary magnesium smelters in the U.S.: Garfield Alloys in Ohio, Inco
Recycling in Oklahoma, and Halaco Engineering in California. Approximately 27,000 megagrams
(30,000 tons) of magnesium were recovered from secondary sources in 1991.
2.2 PROCESS DESCRIPTION3,4
The secondary magnesium recovery steps include: scrap sorting and melting, the addition of
flux layer and additives; melt transfer and molding. These steps are discussed below.
Scrap is sorted according to the desired composition of the finished metal. The sorted piles
are charged into a fabricated steel crucible heated to 675EC (1247EF) by natural gas. The charge
temperature must be carefully maintained to avoid the following problems: 1) oxidation, which
reduces metal recovery, 2) increased danger of "spit back," 3) reduced alloying efficiency, 4)
burning of the metal, and 5) the crucible itself may oxidize and flake off into the melt.
The lower castings begin to burn within 30 minutes of charging. This must be controlled
with flux or inhibitive gas. As the castings melt, the pile of metal lowers, allowing more castings to
be added. Keeping the bottom molten and the top solid prevents "shooting," a reaction any metal
has when cold solids are placed into hot liquids.
While castings continue to be added to the melt, care must be taken to control any burning
3
with the use of flux. Flux usually contains chloride salts of potassium, magnesium, barium and
magnesium and calcium chloride. The flux is floated on top of the molten metal in the open pots or
crucibles to prevent contact with air. Magnesium chloride is a basic constituent of the fluxes used
with the open pot crucible. Slight magnesium oxide and hydrochloric acid (HCl) are formed when
magnesium chloride is in contact with moisture from the air.
Magnesium and barium-free flux have nearly the same specific gravity, making the process
of separating flux from liquid metal the most difficult part of any melt. An experienced furnace
operator is able to clean the metal until impurities settle at the bottom of the crucible.
When the charge is entirely melted, a crusting flux must be added to inhibit surface burning.
Adjustments to the final composition can be made by adding pure magnesium or alloying elements
such as aluminum, zinc, or manganese. These additions can only be done after careful preheating.
When the melt reaches the required specifications, it can be transferred to ingot molds. The
molds must be preheated, because any moisture in the molds will turn to steam and "shoot" molten
metal. Melt transfer can be accomplished by pumping, tilt pouring, and manual ladling. Pumping
provides the greatest production capacity, but is time-intensive due to high maintenance
requirements. Tilt pouring sacrifices some metal recovery as it sinks to the bottom of the melt, but
works well for large ingots that will undergo further refining. Hand ladling is slower than
mechanical methods but results in less downtime.
2.3 EMISSIONS AND CONTROLS3,4
Magnesium chloride is a basic constituent of the flux used to inhibit oxidation. Slight
hydrochloric acid (HCl) has been found in the air. Hydrochloric acid is emitted when magnesium
chloride vapor is in contact with the moisture from the air during the fluxing process. Particulate
magnesium, in the form of oxidized magnesium (MgO), is emitted during the melting process.
Nitrogen oxide emissions result from the fixation of atmospheric nitrogen, which occurs at normal
furnace operation temperatures. Carbon monoxide and nonmethane hydrocarbons emissions have
also been detected.
Typical control devices for a secondary magnesium smelter include a baghouse to control
particulate matter. Particulate occurs in the form of oxidized magnesium, which comes from the
melt and from the magnesium chloride flux used to control metal oxidation. No information about
control devices for hydrochloric acid or nitrogen oxide was found.

4
2.4 REVIEW OF REFERENCES FOR CHAPTER 2
Pacific Environmental Services (PES) contacted the following sources to obtain the most up-
to-date information on process descriptions and emissions for this industry:
1) Alabama Air Division, Montgomery, AL.
2) Florida Department of Environmental Regulation, Tallahassee, FL.
3) Garfield Alloys, Cleveland, OH.
4) Georgia Department of Natural Resources, Division of Environmental Quality,Atlanta, GA.
5) Halaco Engineering, Oxnard, CA.
6) Inco Recycling, Sapulpa, OK.
7) Kansas Department of Health and Environment, Topeka, KS.
8) Michigan Department of Natural Resources, Lansing, MI.
9) Missouri Department of Natural Resources, Division of Environmental Quality,Jefferson City, MO.
10) Pennsylvania Department of Environmental Resources, Harrisburg, PA.
11) Ventura County Air Pollution Control District, Ventura, CA.
The Ventura County Air Pollution Control District (APCD), Source number 11, was the
only source that responded, sending a summary of an emission source test conducted at Halaco
Engineering, located in Oxnard, California. No responses were received from the remaining
sources.
The test summary received from Ventura County APCD reports the emission factors for
volatile organic compounds, nitrogen oxide, carbon monoxide, hydrogen chloride and particulate
(the only emission factor currently reported in AP-42). There are only three secondary magnesium
plants in the U.S. Therefore, Halaco Engineering represents 33 percent of the secondary
magnesium smelters. However, the source test summary alone is not sufficient to revise or add to
the current emission factors since it does not have any information concerning how the test was
performed. Therefore, the source test summary is given an "E" rating. Pacific Environmental
5
Services used this test summary as background information only (discussed further in Chapter 4).
Pacific Environmental Services made an attempt to obtain the complete test report directly from
Halaco Engineering, however, no response was received.
The previous secondary magnesium section in AP-42 had not been updated since 1972.
Furthermore, the process was not described in detail in the existing chapter. Therefore, PES used
Reference 1, a 1992 journal paper, to incorporate an in-depth, current process description into this
revision of the AP-42 section.
A 1981 chemical encyclopedia (Reference 2) was used to gather current statistics on
secondary production of magnesium.
2.5 REFERENCES FOR CHAPTER 2
1. Kirk-Othmer Encyclopedia of Chemical Technology, 3rd ed., vol. 14, John Wiley and Sons,Canada, 1981.
2. Mineral Commodity Summaries 1992, Bureau of Mines.
3. "Recycling: The Catchword of the '90s," Light Metal Age, vol. 50, Nos. 1,2, Feb. 1992.
4. National Emission Inventory of Sources and emissions of Magnesium, EPA-450/3-74-010,U.S. Environmental Protection Agency, Research Triangle Park, NC, May 1973.

6
3.0 GENERAL EMISSION DATA REVIEW AND ANALYSIS PROCEDURES
3.1 LITERATURE SEARCH AND SCREENING
The first step of this investigation involved a search of available literature relating to criteria
and noncriteria pollutant emissions associated with secondary magnesium production. This search
included, but was not limited to, the following reference:
1) AP-42 background files maintained by the Emission Factor and Methodologies Section.
2) Files maintained by the Emission Standards Division.
3) "Locating and Estimating" reports (as applicable) published by the Emission Factor
and Methodologies Section.
4) PM10 "gap filling" documents as listed below (if applicable).
5) "PM10 Emission Factor Listing Developed by Technology Transfer" (EPA-450/4-89-
022).
6) "Gap Filling PM10 Emission Factors for Selected Open Area Dust Sources" (EPA-
450/88-003).
7) "Generalized Particle Size Distributions for Use in Preparing Size Specific Particulate
Emission Inventories" (EPA-450/4-86-013).
8) Background Information Documents for NSPS and NESHAPS.
9) Publications generated by and available through the EPA Control Technology Center
(CTC).
10) Reports and project summaries from the EPA Office of Research and Development
Standards Division.
11) Information in the Air Facility Subsystems (AFS) of the EPA Aerometric Information
Retrieval System (AIRS).
12) References in the National Technical Information Service (NTIS).
13) Handbook of Emission Factors, Parts I and II, Ministry of Health and Environmental
Protection, The Netherlands, 1980/1983.
14) The EPA Clearinghouse for Inventories and Emission Factors (CHIEF) and National
Air Toxics Information Clearinghouse (NATICH).
15) The EPA databases, including but not limited to the VOC/Particulate Matter (PM)
Speciation Database Management System (SPECIATE), the Crosswalk/Air Toxic
7
Emission Factor Data Base Management System (XATEF), and the Emission
Measurement Technical Information Center's Test Methods Storage and Retrieval
System (TSAR).
To reduce the amount of literature collected to a final group of references pertinent to this
report, the following general criteria were used:
1. Emissions data must be from a primary reference, i.e. the document must constitute the
original source of test data.
2. The referenced study must contain test results based on more than one test run.
3. The report must contain sufficient data to evaluate the testing procedures and source
operating conditions (e.g., one-page reports were generally rejected).
If no primary data was found and the previous update utilized secondary data, this
secondary data was still used and the Emission Factor Rating lowered, if needed. A final set of
reference materials was compiled after a thorough review of the pertinent reports, documents, and
information according to these criteria. The final set of reference materials is given in Chapter 4.
3.2 EMISSION DATA QUALITY RATING SYSTEM
As part of Pacific Environmental Services' analysis of the emission data, the quantity and
quality of the information contained in the final set of reference documents were evaluated. The
following data were always excluded from consideration:
1. Test series averages reported in units that cannot be converted to the selected reporting
units;
2. Test series representing incompatible test methods (i.e., comparison of EPA Method 5
front-half with EPA Method 5 front- and back-half);
3. Test series of controlled emissions for which the control device is not specified;
4. Test series in which the source process is not clearly identified and described; and
5. Test series in which it is not clear whether the emissions were measured before or after
8
the control device.
Data sets that were not excluded were assigned a quality rating. The rating system used was
that specified by the OAQPS for the preparation of AP-42 sections. The data were rated as
follows:
A
Multiple tests performed on the same source using sound methodology and reported in
enough detail for adequate validation. These tests do not necessarily conform to the
methodology specified in either the inhalable particulate (IP) protocol documents or the EPA
reference test methods, although these documents and methods were certainly used as a
guide for the methodology actually used.
B
Tests that were performed by a generally sound methodology but lack enough detail for
adequate validation.
C
Tests that were based on an untested or new methodology or that lacked a significant
amount of background data.
D
Tests that were based on a generally unacceptable method but may provide an order-of-
magnitude value for the source.
The following criteria were used to evaluate source test reports for sound methodology and
adequate detail:
1. Source operation. The manner in which the source was operated is well documented in
the report. The source was operating within typical parameters during the test.
2. Sampling procedures. The sampling procedures conformed to a generally acceptable

9
methodology. If actual procedures deviated from accepted methods, the deviations are
well documented. When this occurred, an evaluation was made of the extent such
alternative procedures could influence the test results.
3. Sampling and process data. Adequate sampling and process data are documented in the
report. Many variations can occur unnoticed and without warning during testing. Such
variations can induce wide deviations in sampling results. If a large spread between test
results cannot be explained by information contained in the test report, the data are
suspect and were given a lower rating.
4. Analysis and calculations. The test reports contain original raw data sheets. The
nomenclature and equations used were compared to those (if any) specified by EPA to
establish equivalency. The depth of review of the calculations was dictated by the
reviewer's confidence in the ability and conscientiousness of the tester, which in turn
was based on factors such as consistency of results and completeness of other areas of
the test report.
3.3 EMISSION FACTOR QUALITY RATING SYSTEM
The quality of the emission factors developed from analysis of the test data was rated
utilizing the following general criteria:
A (Excellent)
Developed only from A-rated test data taken from many randomly chosen facilities in the
industry population. The source category is specific enough so that variability within the
source category population may be minimized.
10
B (Above average)
Developed only from A-rated test data from a reasonable number of facilities. Although no
specific bias is evident, it is not clear if the facilities tested represent a random sample of the
industries. As in the A-rating, the source category is specific enough so that variability
within the source category population may be minimized.
C (Average)
Developed only from A- and B-rated test data from a reasonable number of facilities.
Although no specific bias is evident, it is not clear if the facilities tested represent a random
sample of the industry. As in the A-rating, the source category is specific enough so that
variability within the source category population may be minimized.
D (Below average)
The emission factor was developed only from A- and B-rated test data from a small number
of facilities, and there is reason to suspect that these facilities do not represent a random
sample of the industry. There also may be evidence of variability within the source category
population. Limitations on the use of the emission factor are noted in the emission factor
table.
E (Poor)
The emission factor was developed from C- and D-rated test data, and there is reason to
suspect that the facilities tested do not represent a random sample of the industry. There also
may be evidence of variability within the source category population. Limitations on the use
of these factors are always noted.
The use of these criteria is somewhat subjective and depends to an extent on the individual
reviewer. Details of the rating of each candidate emission factor are provided in Chapter 4 of
this report.
11
3.4 REFERENCES FOR CHAPTER 3
1. Technical Procedures for Developing AP-42 Emission Factors and Preparing AP-42Sections. U.S. Environmental Protection Agency, Emission Inventory Branch, Office of AirQuality Planning and Standards, Research Triangle Park, NC, 27711, April 1992. [Note:this document is currently being revised at the time of this printing.]
2. Compilation of Air Pollutant Emission Factors, Volume I: Stationary Sources, SupplementA, Appendix C.2, "Generalized Particle Size Distributions." U.S. Environmental ProtectionAgency, Office of Air Quality Planning and Standards, Research Triangle Park, NC,October 1986.
12
4.0 POLLUTANT EMISSION FACTOR DEVELOPMENT
4.1 CRITERIA POLLUTANT EMISSIONS DATA
Volatile organic compounds.
Nonmethane volatile organic compounds are emitted during secondary magnesium smelting.
A source test summary from the Ventura County Air Pollution Control District for Halaco
Engineering Company (Reference 3) cannot be used to revise the existing emission factors.
Therefore, this summary test data is used for background information only. No data was available
to develop emission factors for uncontrolled nonmethane VOCs. The test data was given in pounds
of pollutant per hour. Therefore, the test data was divided by the production rate expressed in
pounds of product per hour. This result was multiplied by 2000 to obtain an emission factor in
pounds of pollutant per ton of product. For example, given an average for VOC emissions of 0.54
pound (0.25 kg) per hour and a production rate of 6300 pounds (2858 kg) per hour, the
calculations yield:
(0.25/2858) x 1000 = 0.09 kg/Mg (Metric units)
(0.54/6300) x 2000 = 0.17 lb/ton (English units)
A summary of VOC emission factors from Reference 3 is shown in Table 4.1-1. Due to lack
of complete source test information, the test data is rated E. Thus, the emission factors derived
from this data are given an "E" rating.
Lead
No data on emissions of lead were found for the secondary magnesium smelting process.
Sulfur dioxide
No data on emissions of lead were found for the secondary magnesium smelting
process.
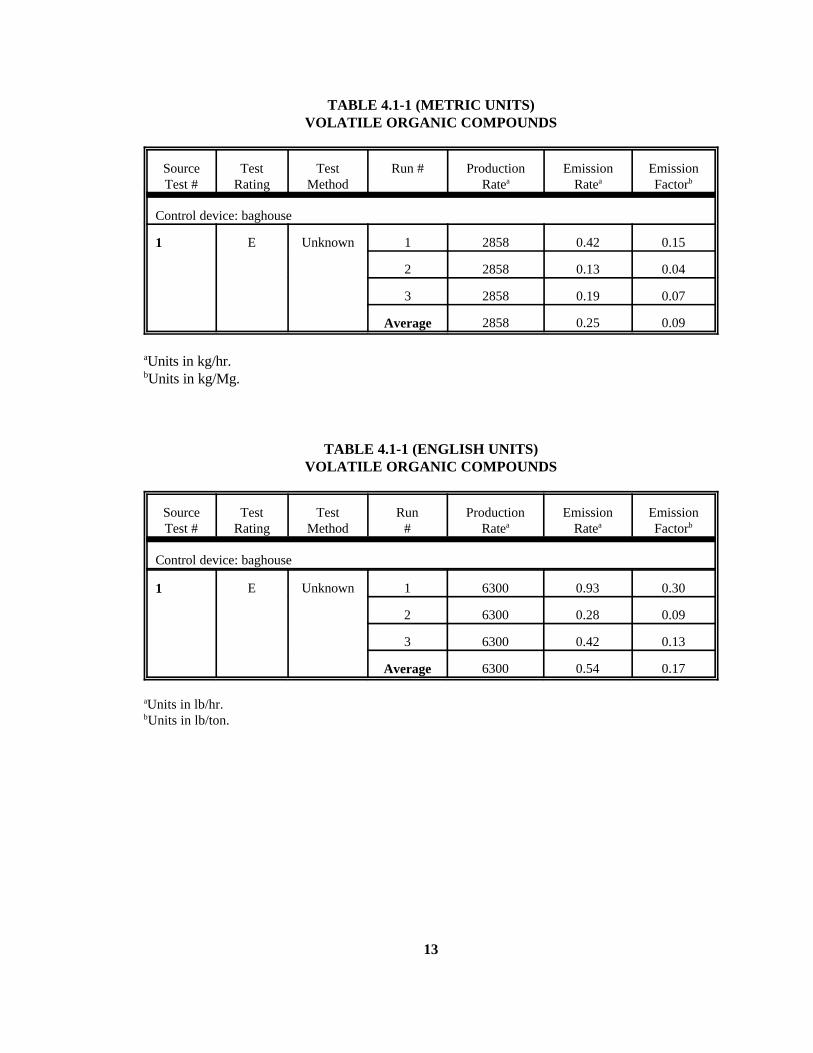
13
TABLE 4.1-1 (METRIC UNITS)VOLATILE ORGANIC COMPOUNDS
SourceTest #
TestRating
TestMethod
Run # ProductionRatea
EmissionRatea
EmissionFactorb
Control device: baghouse
1 E Unknown 1 2858 0.42 0.15
2 2858 0.13 0.04
3 2858 0.19 0.07
Average 2858 0.25 0.09
aUnits in kg/hr.bUnits in kg/Mg.
TABLE 4.1-1 (ENGLISH UNITS)VOLATILE ORGANIC COMPOUNDS
SourceTest #
TestRating
TestMethod
Run #
ProductionRatea
EmissionRatea
EmissionFactorb
Control device: baghouse
1 E Unknown 1 6300 0.93 0.30
2 6300 0.28 0.09
3 6300 0.42 0.13
Average 6300 0.54 0.17
aUnits in lb/hr.bUnits in lb/ton.
14
Nitrogen oxides.
Controlled emission factor for NOx was derived from the Ventura County Air Pollution
Control District's source test for Halaco Engineering Company (Reference 3). This factor is not
used to revise the existing emission factor. Therefore, this test data is used for background
information only. The test data was given in pounds of pollutant per hour. Therefore, the test data
was divided by the production rate expressed in pounds of product per hour. This result was
divided by 2000 to obtain an emission factor in pounds of pollutant per ton of product. For
example, given an average for NOx emissions of 1.16 pound (0.53 kg) per hour and a production
rate of 6300 pounds (2858 kg) per hour, the calculations yield:
(0.53/2858) x 1000 = 0.19 kg/Mg (Metric units)
(1.17/6300) x 2000 = 0.37 lb/ton (English units)
Data for uncontrolled emission factors were unavailable. Table 4.1-2 presents a summary of
emission factors for these pollutants. Due to lack of complete source test information, the test data
is rated E. Thus, the emission factors derived from this data are given an "E" rating.

15
TABLE 4.1-2 (METRIC UNITS)NITROGEN OXIDES
SourceTest #
TestRating
TestMethod
Run #
ProductionRatea
EmissionRatea
EmissionFactorb
Control device: baghouse
1 E Unknown 1 2858 0.35 0.12
2 2858 0.70 0.25
Average 2858 0.53 0.19
aUnits in kg/hr.bUnits in kg/Mg.
TABLE 4.1-2 (ENGLISH UNITS)NITROGEN OXIDES
SourceTest #
TestRating
TestMethod
Run#
ProductionRatea
EmissionRatea
EmissionFactorb
Control device: baghouse
1 E Unknown 1 6300 0.78 0.25
2 6300 1.55 0.49
Average 6300 1.17 0.37
aUnits in lb/hr.bUnits in lb/ton.
16
Carbon monoxide.
Uncontrolled emission factor for CO was derived from Halaco Engineering's source test
(Reference 3). This factor is not used to revise the existing emission factor. The test data is used
for background information only. The test data was given in pounds of pollutant per hour.
Therefore, the test data was divided by the production rate expressed in pounds of product per
hour. This result was multiplied by 2000 to obtain an emission factor in pounds of pollutant per
ton of product. For example, given an average for CO emissions of 4.41 pound (2.00 kg) per hour
and a production rate of 6300 pounds (2858 kg) per hour, the calculations yield:
(2.00/2858) x 1000 = 0.70 kg/Mg (Metric units)
(4.41/6300) x 2000 = 1.40 lb/ton (English units)
Factors are presented in Table 4.1-3. Due to lack of complete source test information, the
test data is rated E. Thus, the emission factors derived from this data are given an "E" rating.

17
TABLE 4.1-3 (METRIC UNITS)CARBON MONOXIDE
SourceTest #
TestRating
TestMethod
Run#
ProductionRatea
EmissionRatea
EmissionFactorb
Control device: none
1 E Unknown 1 2858 2.50 0.87
2 2858 1.50 0.53
Average 2858 2.00 0.70
aUnits in kg/hr.bUnits in kg/Mg.
TABLE 4.1-3 (ENGLISH UNITS)CARBON MONOXIDE
SourceTest #
TestRating
TestMethod
Run#
ProductionRatea
EmissionRatea
EmissionFactorb
Control device: none
1 E Unknown 1 6300 5.51 1.75
2 6300 3.31 1.05
Average 6300 4.41 1.40
aUnits in lb/hr.bUnits in lb/ton.
18
Total Suspended Particulate & PM10.
PM10 is a subset of Total Suspended Particulate (TSP). There is no single method which is
universally accepted for the determination of particle size. A number of different techniques can be
used which measure the size of particles according to their basic physical properties. Since there is
no "standard" method for particle size analysis, a certain degree of subjective evaluation was used
to determine if a test series was performed using a sound methodology for particle sizing.
For pollution studies, the most common types of particle sizing instruments are cyclones,
rotoclones, and cascade impactors. Traditionally, cyclones and rotoclones have been used as a
preseparator ahead of a cascade impactor to remove the larger particles. These devices are of the
standard reverse-flow design whereby the flue gas enters the cyclone through a tangential inlet and
forms a vortex flow pattern. Particles move outward toward the cyclone wall with a velocity that is
determined by the geometry and flow rate in the device and by their size. Large particles reach the
wall and are collected. A series of cyclones with progressively decreasing cut-points can be used to
obtain particle size distributions.
Controlled and uncontrolled particulate emission factors in the existing AP-42 were taken
from References 4 and 5. A detailed derivation of the emission factors is presented in Section 4.3.
Controlled particulate matter emission factor from Halaco Engineering test summary (Reference 3)
is not used to revise the existing emission factor. The test data is used for background information
only. No data for uncontrolled emission factors have been found at this time. The test data was
given in pounds of pollutant per hour. Therefore, the test data was divided by the production rate
expressed in pounds of product per hour. This result was multiplied by 2000 to obtain an emission
factor in pounds of pollutant per ton of product. For example, given an average for particulate
emissions of 1.56 pound (0.71 kg) per hour and a production rate of 6300 pounds (2858 kg) per
hour, the calculations yield:
(0.71/2858) x 1000 = 0.25 kg/Mg (Metric units)
(1.56/6300) x 2000 = 0.50 lb/ton (English units)
No tests were found for uncontrolled emission factor data. These factors are given in Table
4.1-4. Due to lack of complete source test information, the test data is rated E. Thus, the emission
factors derived from this data are given an "E" rating.

19
TABLE 4.1-4 (METRIC UNITS)TOTAL SUSPENDED PARTICULATE AND PM10
SourceTest #
TestRating
TestMethod
Run#
ProductionRatea
EmissionRatea
EmissionFactorb
Control device: baghouse
1 E Unknown 1 2858 0.64 0.22
2 2858 0.61 0.21
3 2858 0.88 0.31
Average 2858 0.71 0.25
aUnits in kg/hr.bUnits in kg/Mg.
TABLE 4.1-4 (ENGLISH UNITS)TOTAL SUSPENDED PARTICULATE AND PM10
SourceTest #
TestRating
TestMethod
Run#
ProductionRatea
EmissionRatea
EmissionFactorb
Control device: baghouse
1 E Unknown 1 6300 1.40 0.44
2 6300 1.34 0.43
3 6300 1.94 0.62
Average 6300 1.56 0.50
aUnits in lb/hr.bUnits in lb/ton.
20
4.2 NONCRITERIA POLLUTANT EMISSIONS DATA
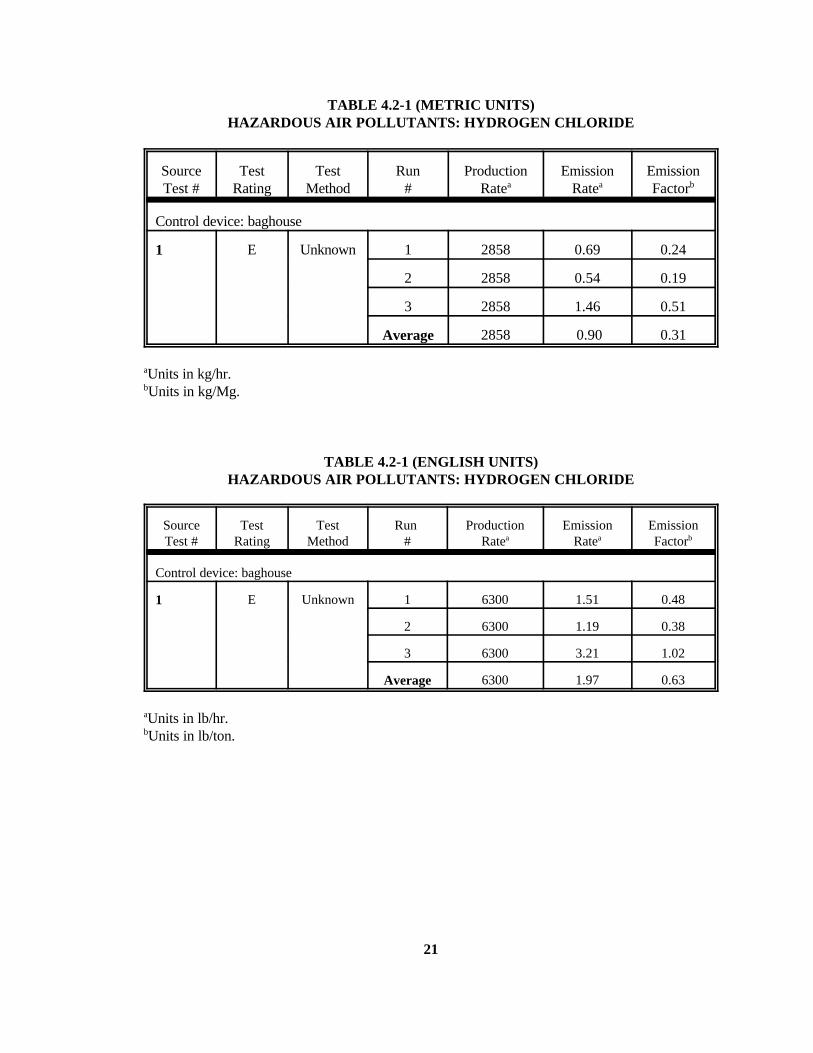
Hazardous Air Pollutants.
Hazardous Air Pollutants (HAPs) are defined in the 1990 Clean Air Act Amendments. The
available source test (Reference 3) shows hydrochloric acid (HCl), a HAP, to be present in the
secondary magnesium smelting process. This test data is not used to revise the existing emission
factors; it is used for background information only. A controlled emission factor for HCl is given in
Table 4.2-1. The test data was given in pounds of pollutant per hour. Therefore, the test data was
divided by the production rate expressed in pounds of product per hour. This result was multiplied
by 2000 to obtain an emission factor in pounds of pollutant per ton of product. For example, given
an average for hydrogen chloride emissions of 1.97 pound (0.90 kg) per hour and a production rate
of 6300 pounds (2858 kg) per hour, the calculations yield:
(0.90/2858) x 1000 = 0.31 kg/Mg (Metric units)
(1.97/6300) x 2000 = 0.63 lb/ton (English units)
No tests for uncontrolled HCl emissions have been found. Computed controlled emission
factors are given in Table 4.2-1. Due to lack of complete source test information, the test data is
rated E. Thus, the emission factors derived from this data are given an "E" rating.
Global Warming Gases.
Pollutants such as methane, carbon dioxide, and nitrous oxide have been found to contribute
to overall global warming. No data on emissions of these pollutants were found for the secondary
magnesium smelting process.
Ozone Depletion Gases.
Chlorofluorocarbons and nitric oxide have been found to contribute to depletion of the ozone
layer. No data on emissions of these pollutants were found for the secondary magnesium smelting
process.
21
TABLE 4.2-1 (METRIC UNITS)HAZARDOUS AIR POLLUTANTS: HYDROGEN CHLORIDE
SourceTest #
TestRating
TestMethod
Run#
ProductionRatea
EmissionRatea
EmissionFactorb
Control device: baghouse
1 E Unknown 1 2858 0.69 0.24
2 2858 0.54 0.19
3 2858 1.46 0.51
Average 2858 0.90 0.31
aUnits in kg/hr.bUnits in kg/Mg.
TABLE 4.2-1 (ENGLISH UNITS)HAZARDOUS AIR POLLUTANTS: HYDROGEN CHLORIDE
SourceTest #
TestRating
TestMethod
Run #
ProductionRatea
EmissionRatea
EmissionFactorb
Control device: baghouse
1 E Unknown 1 6300 1.51 0.48
2 6300 1.19 0.38
3 6300 3.21 1.02
Average 6300 1.97 0.63
aUnits in lb/hr.bUnits in lb/ton.

22
4.3 REVIEW OF SPECIFIC DATA SETS
The emission factors in the existing AP-42 chapter were derived from data dating from 1966
and 1970. Thus, a revision was necessary, as any changes in processes or controls can make
emission factor data obsolete. A single source test report was received from Pacific Environmental
Service's industry contact. The report contains the summary of the source test only and is not
sufficient to revise current emission factors. Therefore, the current emission factors in the AP-42
will remain unchanged until a complete source test report is received and further determinations are
made. A discussion of specific references used in the current emission factors in the updated AP-42
is presented below.
Reference #4: Control of Metallurgical and Mineral Dusts and Fumes in Los Angeles County
Table 1 in this document contains controlled emission summaries from pot furnaces during
the magnesium smelting process. The document does not provide any description of the test
method. The summary shows that the test was performed at a temperature of 1,425EF for 36
minutes. The existing controlled particulate emission factor was calculated by averaging the
emission factor for magnesium smelting and averaged emission factor for light metals alloys.
The upper limit of the emission factor was calculated from magnesium smelting test. The
throughput of the test is 217 lb/hr, and the particulate emission is 0.05 lb/hr. The emission factor
was calculated by dividing the emission rate by the throughput rate:
(0.05/217) x 2000 = 0.46 lb/ton
The lower limit of the emission factor was calculated from light metal alloys smelting test.
The emission factor for this alloys is 0.38 lb/ton. The controlled particulate emission factor in the
existing AP-42 is thus
(0.46 + 0.38)/2 = 0.42 lb/ton
Reference #5: Data on Non-Ferrous Metallurgical Operations. Los Angeles County Air Pollution
Control District
Uncontrolled particulate emission factors were referenced from this document. Pacific
Environmental Service was unable to find this document from AP-42 files. Therefore, PES was
unable to determine how the uncontrolled emission factor was derived from.

23
4.4 DATA GAP ANALYSIS
Since there are only three magnesium smelters in operation in the U.S., the one source test
summary that PES received represents one-third of the magnesium smelting facilities. The source
test summary received shows that there are VOC, NO, CO, and hydrogen chloride (HCl) emitted
during secondary magnesium smelting process. However, the test summary does not describe how
the test was performed. Pacific Environmental Services gave an "E" rating to this test summary
until the complete report is received and further determinations are made. The remaining two
smelters PES contacted gave no indication as to whether source tests have been done at their
facilities. Pacific Environmental Services recommends that further testing be strongly encouraged
for secondary magnesium smelters.
4.5 REFERENCES FOR CHAPTER 4
1. Kirk-Othmer Encyclopedia of Chemical Technology, 3rd ed., vol. 14, John Wiley and Sons,Canada, 1981.
2. "Recycling: The Catchword of the '90s," Light Metal Age, vol. 50, Nos., 1,2, Feb. 1992.
3. Summary of stack test results: Halaco Engineering Company, Oxnard, california, January1990. Provided by Ventura County Air Pollution Control District.
4. Allen, G.L. et al. Control of Metallurgical and Mineral Dusts and Fumes in Los AngelesCounty. Department of the Interior, Bureau of Mines. Washington, D.C. InformationCircular Number 7627. April 1952.
5. Hammond, W.F. Data on Non-Ferrous Metallurgical Operations. Los Angeles County AirPollution Control District. November 196

24
TABLE 4.5-1
LIST OF CONVERSION FACTORS
Multiply: by: To obtain:
mg/dscm 4.37 x 10⁻⁴ gr/dscf
m2 10.764 ft2
acm/min 35.31 acfm
m/s 3.281 ft/s
kg/hr 2.205 lb/hr
kPa 1.45 x 10⁻¹ psia
kg/Mg 2.0 lb/ton
Mg 1.1023 ton
Temperature conversion equations:
Fahrenheit to Celsius:
EC '(EF&32)
1.8
Celsius to Fahrenheit:
EF ' 1.8(EC) % 32