a~om~lies, artifacts and common errors in...
TRANSCRIPT

A~om~lies, Artifacts and Common Errors in UsingVIbratIonal Spectroscopy Techniques
Mid-infrared Spectroscopy: Anomalies, Artifacts andCommon Errors
John M. ChalmersUniversity of Nottingham, Nottingham, UK
1 INTRODUC~ION occurrences, but will hopefully instil precaution and caution". . . . in experimentalists and researchers new to the technique.
Anomaly (rnegulanty, dev1ation from rule"),l arti-fact/artefact ("a thing made by human workmanship"),land error ("deviation from the right way, blunder, mistake, 2 ATMOSPHERIC INTRUSION~rong-doing"): 1 three nouns (and their dictionary defini-ti?ns) . that when applied to an infrared (IR) (or indeed any Perhaps the most readily recognized imperfections inv1brational) spectrum or spectral feature immediately imply any IR spectrum, whether, for example, it is athat the data are imperfect. that the data were derived in transmission, emission, or photoacoustic measurement,an imperfect way, or that the data are impure. There are are those absorption bands arising from the presence ofmany sources that give rise to such observations and com- atmospheric molecules in the path of the IR beam betweenment. Many are derived from poor experimental practice the source and the detector. (This, of course, excludes(e.g. poor grinding of the analyte in an a1kali-halid~ disk circumstances where they are required for detection orpreparation), some from inappropriate sampling, some from calibration.) A ro-vibrational mid-infrared transmissioncontamination (e.g. silicone grease from vacuum appara- spectrum depicting these features is shown in Figure 1.tus), others from instrumental limitations (e.g. too Iowan It comprises absorption bands due to both water vaporangle of incidence in an attenuated total reflection (ATR) ~d c.arbon. dioxide. Their spectral contrast. and relativemeasurement), some from the environment (e.g. intrusion Intens1ty will depend on the spectral resolution of theof absorptions due to atmospheric water vapor and carbon measurement, the relative concentration of the two gases,dioxide), while others classified similarly merely reflect the and, in some experiments, perhaps their partial pressure andfact that th~ measurement was made at an extreme (e.g.' te.m~rature. (~cluding this imperfection may seem overlyphotoacoustic saturation). Some may merely be a nuisance trIV1al to ~xpenenced spectroscopists; however, I have seenand not detract from the measurement purpose, while others changes In the relative intensity of the CO2 bands nearare disastrous and can lead to erroneous conclusions. 2350 cm-l reported in a conference proceedings abstract
?nderstanding, appreciating and recognizing anomalies, as being indicati:e of a change in the level of cure in aartifacts and common errors is vital if data are to be polymer compos1te!) These bands due to water vapor andinterpreted and quantified correctly. The intention in this carbon dioxide when seen in a Fourier transform infraredarticle is to present examples of common imperfections (FT-IR) .spe~trum .may be observed as either with positiveobserved in mid-infrared spectra and to discuss concisely or ~egative Intens1ty, depending on the relative extents totheir .ori~in, u~lizing, wherever possible, example spectra ~hich they were present in the sample and backgroundto highl1ght 1ssues. It cannot hope to cover all such sIng!e-beam s~ctra of an Fr-IR spectrum measurement.
SInce, there 1S no change of dipole moment associatedwith the stretching frequencies of homonuclear diatomics,then neither nitrogen nor oxygen give rise to IR absorption
I

2328 Anomalies, Artifacts and Common Errors in Using Vibrational Spectroscopy Techniques-
~';"fCommon nomenclatures for such a spectral feature are -:;;i
100 interference fringes, channel fringes/fringing, and channel Y(
§ 80 spectra (see Glossary to the Handbook): The name used ;,~:~ often reflects the favorite of a particular community. For ,I!;; 60 example, the term "interference fringes" is most commo 4}
a 40 used to describe the effect when observed in thin film po
~ 20 mer spectra, where they originate as a consequence of~ H2O sample being thin, non-scattering and of uniform thickn
0 1500 0 "Channel spectra" is the frequently used descriptor for4000 3500 3000 2500 2000 . .W b / -1 appearance in high-resolutIon gas-phase spectra, whereavenum er cm .. fr all 1. .thiare instrument related, ansmg om par e Ism WI n
Figure 1. ~ transmission. spectrum showing abs°fP.tio~ bands interferometer beam-splitter/compensator assembly.characteristic of atmosphenc water vapor and carbon dioXIde. The . . .4 cm-l resolution spectrum was generated by ratioing Fr -IR open ever their source, they anse ~om. an mterference pattsingle-beam spectra recorded with the sample compartment of the generated between the recombmation of two coherentspectrometer unpurged against that with the compartment purged beams that have travelled a different pathlength.with dry nitrogen. The effect is perhaps most easily illustrated in
. .. practice of determining the pathlength of an emptybands. Their presence, ~ong with other e~v~onmenta1 transmission cell, as shown in Figure 2. When the optiphenomena, such .as COSmiC rays ?r !amp emiSSiOnS, may path difference between the two beams equals A./2however be sometimes detected within Raman spectra (see destructive interference will occur, where A. representsAnomalies and Artifacts in Raman Spectroscopy).- wavelength. At optical path differences equal to inte
multiples of a wavelength, then the two beams will3 SUPERIMPOSITION OF A in phase and constructive interference will occur, i.e.
intensities will be additive. The fringe separation, frequeSINUSOillAL WAVEFORM of the waveform, for two differing pathlengths Is
. . . shown in Figure 2. Figure 3 illustrates the waveformThe appearance o~ a smusoldal waveform overl~ymg might be observed from a slightly wedged source.an IR ~pectrum .IS yet another commo~ cause ~f the interference pattern. Figure 4 shows two examplesImperfection that IS generally well recogmzed, and IS fringing observed in IR transmission spectra recorded frusually most noticeable in paseline regions, where there thin polymer films.are no absorption bands. The frequency and amplitudeof the sinusoidal wave will depend on its origin, and itsintrusiveness may depend also on the spectral resolution. 4 STRAY LIGHTUnder some circumstances, the amplitude may changewith wavenumber most likely increasing with decreasing For stray light, the Glossary to this Handbook containswavenumber (increasing wavelength). two definitions following: "Radiation that does not foIl
r100
80c0
"00.!!l 60 1E ~ I cm- (/) . a I R
VVl AAAAf\M .. 40I- .~ ~...
20 Empty cell
04000 3500 3000 2500 2000 1500 1000 500
Wavenumber/cm-1
2. Overlaid 4cm-l resolution, transmission IR spectra recorded from empty (air gap) transmission IR liquid cells. The ps of the air gaps were: 12.5~, low-frequency sinusoidal wave; lOO~, high-frequency sinusoidal wave. A schematic of
process producing interference fringes in the IR spectrum recorded from a thin, empty transmission liquid cell is shown in the ins
~~I~\; I ct.

"
Mid-infrared Spectroscopy: Anomalies, Artifacts and Common Errors 2329-~ J . - -
100 from the likes of a bubble in a liquid in a cell or a polymerfilm in a transmission measurement.
§ 80 IR radiation that has travelled the conventional path:~ 60 and reached the detector without having passed throughffi the sample will adversely affect the spectral contrast of~ 40 any measurement. It will probably have serious deleterious~ consequences on any quantitative determinations made'" 20 from the spectrum. It causes loss of spectral contrast, and
0 can affect bands of differing absorptivities to different ,~' 4000 3500 3000 2500 2000 1500 1000 500 extents, Unhindered stray light, that is radiation that J;
1 '.
Wavenumber I cm- bypasses the sample and effectively passes straight from iiFigure 3. Tr~smission spectrum r~co~ded from an, empty the source to the detector, will shift the zero position of the !:
wedged nolDlnal 50 I1In pathlength liquid cell. Loosemng the transmission scale on the measured spectrum.retaining screws at one end of the cell assembly produced thenon-parallelism of the cavity. 100
100 §'wU)
c 80 'E0,- U)U) c
.!!! 60 ~E I-U) so~ 40 ~
~ 0~ 20 } . 4000 3500 3000 2500 2000 1500 1000 500
O. (a) Wavenumber/cm-1
4000 3500 3000 2500 2000 1500 1000 500(a) 88,56
c100 ,2
U)U)
c 80 'E0 U)
,- cU) (\I,!!! 60 ~ffi ~c 40~I- 4.75~ 20 4000 3500 3000 2500 2000 1500 1000 500
(b) Wavenumber/cm-104000 3500 3000 2500 2000 1500 1000 500'
(b) Wavenumber Icm-1 100cFigure 4. Transmission IR spectra, 4 cm-l resolution, showing / ,~80
iilterference fringes recorded from polymer filIIis: (a) 20 I1In '~ 60thickness polypropylene; (b) 2.5111n thickness poly(ethylene ~terephthalate) (PET). ~ 40
I-~the usual path through a spectrometer and consequently 20
appears in a spectrum at a wavenumber different from 0its true wavenumber. The term is also used to refer to 4000 3500 3000 2500 2000 1500 1000 500
radiation that passes around the sample instead of through (c) Wave~umber/cm-1
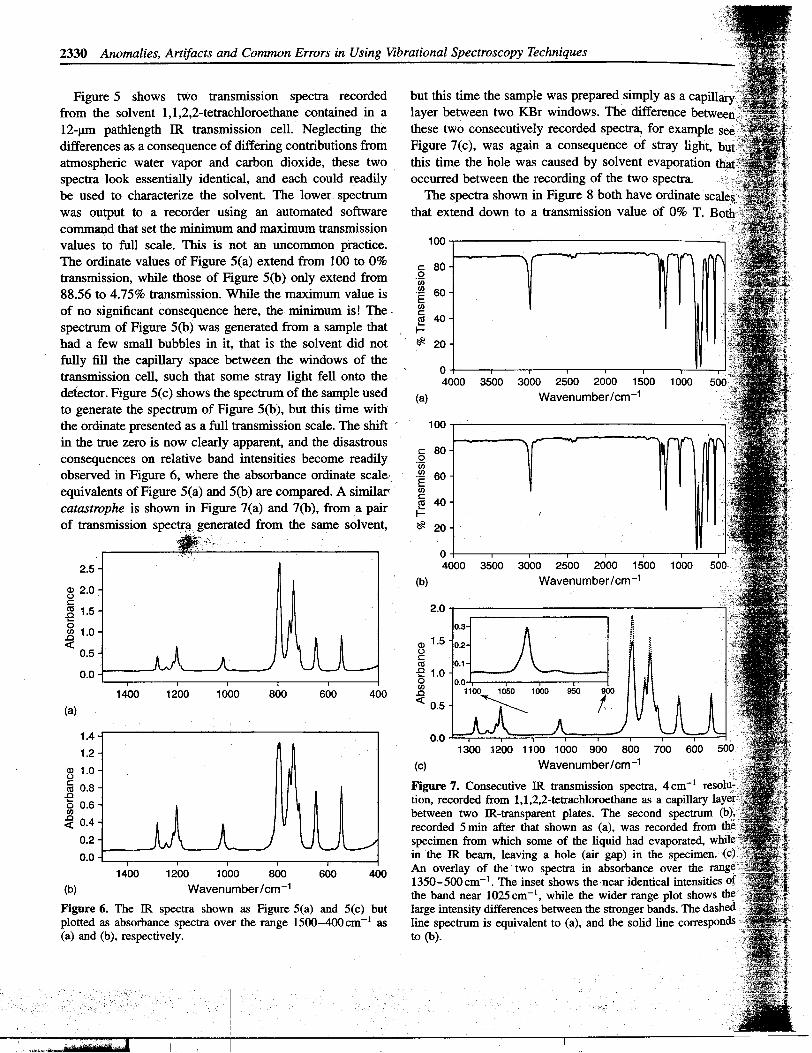
it, and consequently is not modified by the sample and Figure 5. IR transmission spectra, 4 cm-l resolution, recordedseriously affects absolute and relative intensities." In this from I, I ,2,2-tetracWoroethane in a 12111n pathlength liquid cell,section we will be considering the second classification The spectrum plotted as full ordinate scale expansion shown as
, . (b) was recorded from a specimen that had a few small bubbles infor the measurement error. It will be broadened, however, ' th li ' d I 1 fill d th 11 ' ty h th trum. , . . ., it; e qw comp ete y e e ce caVl w en e spec
to mclude a discussion of examples where the radiation shown as (a) was recorded. The spectrum shown as (c) is fromhas passed through the sample, but the sample was not the same recording as for (b) but plotted on an ordinate scale ofcontinuous. The straylight phenomenon in this case arises 100-0% transmission,
~-~"
2330 Anomalies, Artifacts and Common Errors in Using Vibrationa
Figure 5 shows tWo transmission spectra recorded but thifrom the solvent 1,1,2,2-tetrachloroethane contained in a layer12-11In pathlength IR transmission cell. Neglecting the thesedifferences as a consequence of differing contributions from Figureatmospheric water vapor and carbon dioxide, these two this.spectra look essentially identical, and each could readily occurrbe used to characterize the solvent. The lower spectrum Thewas output to a recorder using an automated software that ecommaQd that set the minimum and maximum transmissionvalues to full scale. This is not an uncommon practice. 100
The ordinate values of Figure 5(a) extend from 100 to 0% c: 80transmission, while those of Figure 5(b) only extend from .,9;
88.56 to 4.75% transmission. While the maximum value is .~ 60of no significant consequence here.. the minimum is! The" § 40spectrum of Figure 5(b) was generated from a sample that ~had a few small bubbles in it, that is the solvent did not ~ 20fully fill the capillary space between the windows of thetransmission cell, such that some stray light fell onto the ~ooodetector. Figure 5( c) shows the spectrum of the sample used (a)to generate the spectrum of Figure 5(b), but this time withthe ordinate presented as a full transmission scale. The shift ,. 100
in the true zero is now clearly apparent, and the disastrous"1 . b d . .. bec d.l c: 80
consequences on re ative an IntensIties orne rea I y .9:II)
observed in Figure 6, where the absorbance ordinate scale; ,.~ 60equivalents of Figure 5(a) and 5(b) are compared. A similar( ~catastrophe is shown in Figure 7(a) and 7(b), from a pair ~ 40
of transmission spectr,.~generated from the s~e solvent, ~ 20;,::;;'~ .. 0
2.5 4000 1000
aJ 2.0 (b)uc:~ 1.5 2.0 .
g 1.0 0.3[:::~::J ~ .c .' ~ aJ 1.5 0.2 :: ~0.5 g ::
(Ij 0.10.0 -e 1.0
0 00II) .1400 1200 1000 800 600 400 ~ 950 /900
(a) 0.5,
1.4 0.0
1.2
~ 1.0 (c)
~ 0.8 Figure.c .(; 0.6 non, r:fJ betwee~ 0.4 record
0.2 specim0.0 in the
1400 1200 1000 800 600 400 ~5~~(b) Wavenumber/cm-1 the b
Figure 6. The IR spectra shown as Figure 5(a) and 5(c) but large iplotted as absorbance spectra over the range 1500-400cm-l as line s(a) and (b), respectively. to (b).
,-,._-

Mid-infrared Spectroscopy: Anomalies, Artifacts and Common Errors 2331"
60 a few small bubbles that were generated by molding thefilm sample at too high a temperature. The sample used for
§ 50 Figure 8(a) prepared under optimal molding conditions was
°i?; 40 continuous and contained no visual bubbles. The deleteriouso~ 30 consequence for quantitative measurements from such affi non-continuous sample is illustrated in the comparison of~ 20 the two spectra made in Figure 9. While undoubtedly some~ 10 of the differences in relative band intensities between the
0 spectra occur as a result of the differing thermal histories4000 3500 3000 2500 2000 1500 1000 500 of the two specimens, the bubbles in the film sample are
(a) Wavenumber/cm-1 also responsible for some of the variation.
605 CONTAMINATION
To many readers, contamination may seem too obvious aform of spectrum impurity to include as a section in thisarticle, but sources that are obvious to many are still novelto some, and indeed have been overlooked in researchpublications by experts (although no references will be
0 quoted for these!). In the context here, "contamination"4000 3000 2500 2000 1500 1000 500 refers to materials that give rise to absorption bands
(b) Wavenumber/cm-1 that may be misinterpreted as being attributable to theFigure 8. IR transmission spectra, 4cm-l resolution, recorded sample in its expected form. The examples here cannotfrom two compression molded film samples of polypropylene. be exhaustive; they will vary widely among differentSpectrum (a) was recorded from a .specimen ,;,,~thout bubbles, application areas. The three selected as illustrations arewhereas (b) was recorded from ~ specllllen containIng a few small from my experience and encounters. They will hopefullybubbles. See text for more detalls. h 1 . ill di . tin f I kin . .ti.all .
the p ms a SCIp eo 00 g at a spectrum mI y WI
,. some lateral interrogation as opposed to solely focusingon the problem in hand or anticipated/predicted result (as
! clearly happened with the publications alluded to above).
Residual solvent in a sample cast from solution is"an obvious source of spectral impurity, and attributedabsorption bands are usually readily observable. However,some samples may deposit in a form that contains thesolvent as "solvent of crystallization". For more on thisand similar spectral manifestations, the reader is referred tothe article on polymorphism in Volume 5 of this handbook(Polymorpbs, Solvates and Hydrates).01050 950 900 850 800 700 c . ..
W b / -1 Mer a few preparatIons, most expenmentalists haveavenum er cm d th . b bili. f akigrown accustome to e lffipro a ty 0 ever m ng a
Figure 9. Overlaid absorbance spectra over . ~e range KEr disk preparation that is entirely free from absorbed1050- 700cm-l generated from the two tranSmiSSIOn spectra. .shown in Figure 8. The dashed line is for the continuous film, water and observmg the consequent broad absorptionand the solid line is for the film that contained bubbleso vOH at ca. 3400cm-l and maybe the 8HOH band near
1640cm-l. However, to the unknowing there is potentiallywere recorded from samples of a polypropylene film, a nastier danger lurking in commercial supplies of the alkalieach of a thickness of about 0.15 mm, and both serve as halide.. This lies in contamination by the nitrate ion, NO3-.excellent fingelprint spectra of the material. The spectrum Unless one purchases "spectroscopic grade" KEr, one isof Figure 8(b) extends to 0% T, since the thickness of very likely to find the material contaminated with low levelspolypropylene through which the IR radiation passed was of KNO3. NO3- gives rise to a narrow band with verysuch that it provided extinction for bands with high high absorptivity near l380cm-l; it may be confused, forabsorptivities. However, while no IR radiation bypassed instance, with the deformation mode of a -CH3 group thatthe sample, it was recorded from a sample that contained might be present in the analyte of a KEr disk preparation.

2332 Anomalies, Artifacts and Common Errors in Using Vibrational Spectroscopy Techniques-
100c:0c: 80 .-
.2 ~ 90w .-w E.E 60 \ ~ w tISc: '-
tIS 40 I-~ ~~ 20 NO3- 80
0 4000
4000 3500 3000 2500 2000 1500 1000 500 (a)
Wavenumber/cm-1
Figure 10. JR transmission spectrum of a KBr disk preparationmade using "non-spectroscopic grade" KBr; the absorbance § 80peak near 1380cm-1 due to nitrate is clearly evident. The .~background spectrum for this FT - JR measurement was made using .E 60spectroscopic-grade KBr. (Some interference fringes from the - ~disk are evident to?, more strongly to.wards ~ower wavenum~er. ~ 40
Other weak absorption bands are assocIated WIth theanalyte beIng ~ 20examined. )
0, l1le specbruun shovvn in Figure 10 vvas generated recently 4000 3500 3000 2500 2000 1500 1000 500
(vvhile this handbook vvas in preparation) as a consequence (b) Wavenumber/cm-1
of an attempt by a laboratory technician in an academic Figure 12. JR, 4cm-1 resolution, transmission spectra recordedinstitution to find an alternative supply of KBr in a teaching from: (a) a deposit on a KBr plate generated by touching one-laboratory. surface .of the plate v:ith a finger while wearing PVC gloves that
S.li .1 d .1. . th l' f were slightly wet WIth chloroform; (b) a reference sample of a1 cone 01 an Sllcone grease rn e lorm 0 phthalate plasticizer. .'
poly(dimethyl siloxane) (PDMS) are potentially majorsources of contamination, and anyone not involved invasive contamination from poly(vinyl chloride) (PVC)directly in characterizing silicone materials should be very products, such as PVC piping and protective PVC glovessuspicious of any spectrum that has a sharp band at (see Figure 12(a)). An example of a phthalate plasticizer1260cm-l. It is a distinctive feature of PDMS, and its spectrum is shovvn in Figure 12(b), the vC=O at aboutpresence or otherwise may be ascertained by reference to its. 1725 cm-l and accompanying vveak sharp doublet nearother characteristic absorption features shovvn in Figure 11. 1600 cm- f are usually the give-avvay features.
PDMS is potentially a common source of contaminationfor those using vacuum apparatus and desiccators. I hav~seen _bands of PDMS assigned to other species in both a 6 ANOMALOUS DISPERSIONPill thesis and a research publication in a highly respectedspectroscopic journal. In a similar context, "phthalate A key intrinsic property of a sample to mid-infrared mea-plasticizer" (a di-alkyl phthalate) is a common source of surements, particularly those made by a reflection tech-
nique, is its refractive index. l1le refractive index, n,100 absorption index, k, are interrelated through the Fresnel
laws of reflection and the Kramers-Kronig (K-K) relation-.§ 80 s~p; see, for example, External Reflection Spectroscopy.13 60 by Claybourn in this handbook. As one scans through an~ absorption band, then the refractive index of the samplec:~ 40 changes from the average value at positions either'; of the band, vvhere the sample does not absorb IR radia"'
20 - tion. For organic materials, this change is usually0 as a lovvering of the sample refractive index to the4000 3500 3000 2500 2000 1500 1000 500 vvavenumber side of the absorption band maximum, return-
Wavenumber/cm-1 ing to the average value at the absorption band center,Figure 11. JR, 4 cm-1 resolution, transmission spectrum recorded increasing to the lovver-vvavenumber side, before returningfrom a capillary layer of silicone vacuum grease. The spectrum is again to the average value. This is knovvn as anomalous dis.that of PDMS. persion and is illustrated in Figure 13. This dispersion in a
Mid-infrared Spectroscopy: Anomalies, Artifacts and Common Errors 2333/
18Eas~
- c:
as 0() "- 12
"in Q
.c ~c.. (!). a:
~
6Wavenumber /cm-1
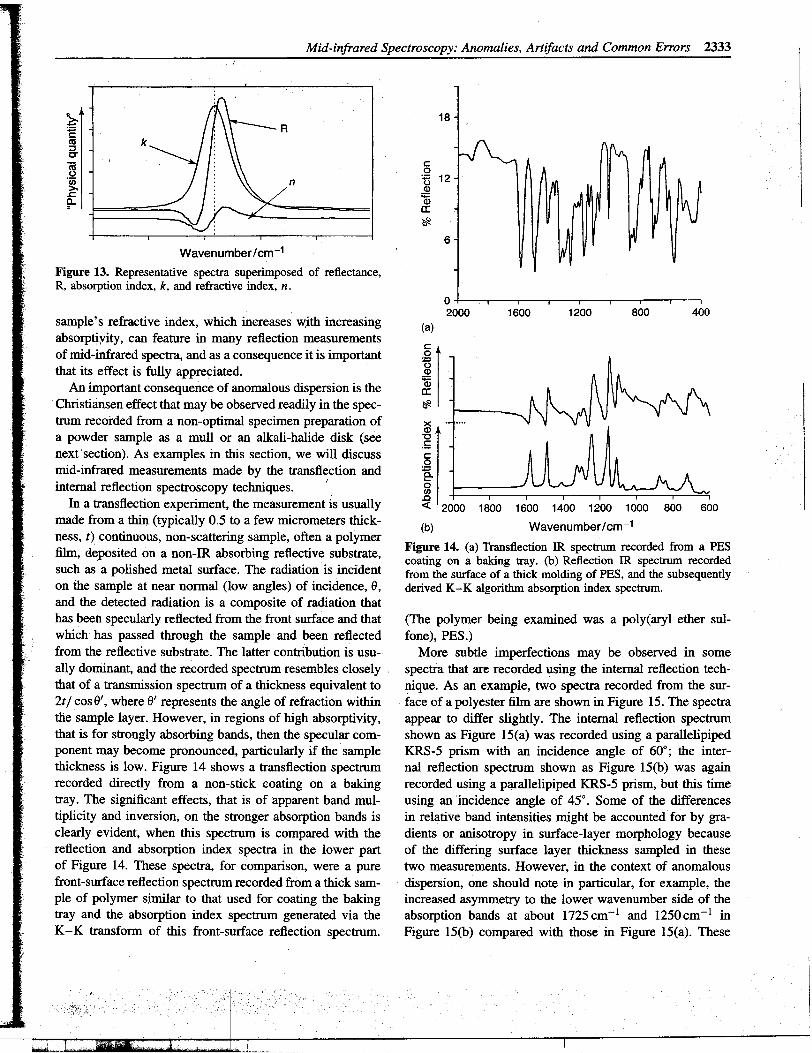
Figure 13. Representative spectra superimposed of reflectanc~,
R, absorption index, k, and refractive index, n.
0, .. .. ... 2000 1600 1200 800 400
sample s refractive mdex, which mcreases w;1th mcreasmg (a)
absorp~yity, can feature in many reflection measurements c:
of ~d-infrare~ spectra, and ~s a consequence it is important ~1that Its effect IS fully apprecIated. ~
An important consequence of anomalous dispersion is the £Christiansen effect that may be observed readily in the spec- ~trum recorded from a non-optimal specimen preparation of x"
a powder sample as a mull or an alkali-halide disk (see .gInext section). As examples in this section, we will discuss "~
mid-infrared measurements made by the transflection and :§.internal reflection spectroscopy techniques. I ~
In a transflection experiment, the measurement is usually ~ 2000 1800 1600 1400 1200 1000 800 600
made from ~ thin (typically 0.5!o a few micrometers thick- (b) Wavenumber/cm-1ness, t) continuous, non-scattermg sample, often a polymerfilm d ' . d .. Figure 14. (a) Transflection IR spectrunl recorded from a PES
, epOSIte on a non-IR absorbmg reflective substrate, . bakin tr (b) R fl n" IR tru d d. .. coatIng on a gay. e ec on spec m recor e
such as a polished metal surface. The radIation IS mcident from the surface of a thick molding of PES, and the subsequentlyon the sample at near nornlal (low angles) of incidence, e, derived K-K algorithm absorption index spectrum.and the detected radiation is a composite of radiation thathas been specularly reflected from the front surface and that (The polymer being examined was a poly(aryl ether sul-which has passed through the sample and been reflected fone), PES.)from the reflective substrate. The latter contribution is usu- More subtle imperfections may be observed in someally dominant, and the recorded spectrum resembles closely spectra that are recorded using the internal reflection tech-that of a transmission spectrum of a thickness equivalent to nique. As an example, two spectra recorded from the sur-2t / cos e', where e' represents the angle of refraction within face of a polyester film are shown in Figure 15. The spectradie sample layer. However, in regions of high absorptivity, appear to differ slightly. The internal reflection spectrumthat is for strongly absorbing bands, then the specular com- shown as Figure 15(a) was recorded using a parallelipipedponent may become pronounced, particularly if the sample KRS-5 prism with an incidence angle of 60°; the inter-thickness is low. Figure 14 shows a transflection spectrum nal reflection spectrum shown as Figure 15(b) was againrecorded directly from a non-stick coating on a baking recorded using a parallelipiped KRS-5 prism, but this timetray. The significant effects, that is of apparent band mul- using an 'incidence angle of 45°. Some of the differencestiplicity and inversion, on the stronger absorption bands is in relative band intensities might be accounted for by gra-clearly evident, when this spectrum is compared with the dients or anisotropy in surface-layer morphology becausereflection and absorption index spectra in the lower part of the differing surface layer thickness sampled in theseof Figure 14. These spectra, for comparison, were a pure two measurements. However, in the context of anomalousfront-surface reflection spectrum recorded from a thick sam- dispersion, one should note in particular, for example, thepIe of polymer similar to that used for coating the baking increased asymmetry to the lower wavenumber side of thetray and the absorption index spectrum generated via the absorption bands at about 1725 cm -1 and 1250 cm -1 in
K-K transfornl of this front-surface reflection spectrum. Figure 15(b) compared with those in Figure 15(a). These

r;"2334 Anomalies, Artifacts and Common Errors in Using Vibrational Spectroscopy Techniques!
- - - ~ ,
,2.0
Q)uc: Q)co u
-e c:0 cocn .c.c '-
~ g.c~
O.1600 1400 1200 1000
(a) Wavenumber/cm-10
18003.3 (a)
~ 1.200c:co
.c
0cn.c Q)~ u
c:co
.c
0.0 ~1600 1400 1200 1000 ~
(b) Wavenumber/cm-1
Figure 15. IR internal reflection spectra, 4cm-l resolution, plotas absorbance spectra recorded using KRS-5 parallelepiped reflec-tion elements with both sides covered with PET film. The multiple 0internal reflection elements were: (a) a 50mm x 3 mm elementwith an incidence angle of 60°; (b) a 30 mm x 3 mm element withan incidence angle of 45°.
are artifacts, which might be misinterpreted; for instance,one might have assigned the perceived shoulder at about1700crn-l in Figure I5(b) to' potentially indicate a highlevel of surface carboxylate end groups, since the film beingexamined was PET. (However, intuitively, if this were truethen the concentration would be greater in the spectrumof Figure 15a, where a shallower surface layer is probed.)These artifacts arise from the fact that around the positionsof the maxima of these bands with high absorptivities, thenthe condition for ATR becomes violated. That is, since theangle of incidence at these positions is no longer greaterthan the critical angle, then external rather than total internalreflection occurs at the internal reflection element/sample
boundary. (The critical angle, fJc, is given by sinfJc = n2/nl,where nl is the refractive index of the internal reflectionelement, in this case KRS-5 with n 1 = 2.37, and n2 is therefractive index of the sample. If we assume n2 = 1.5 forthe sample in regions where it does not absorb, then fJc ~39°. If n2 rises to ca. 1.705, then fJc becomes about 46°, thatis, it is now above the angle of incidence used to record thespectrum shown as Figure I5b.) For a similar comparisonon a sample with bands of generally lower absorptivities,that is a polypropylene film, then no such gross distortions
I Jc~
Mid-infrared Spectroscopy: Anomalies, Artifacts and Common Errors 2335
1.41.2
Q)g 1.0~ 0.8~ 0.6.c< 0.4
0.20.0
1800~ (a)
.2 Acncn
'Ecn~CI1
.=
~
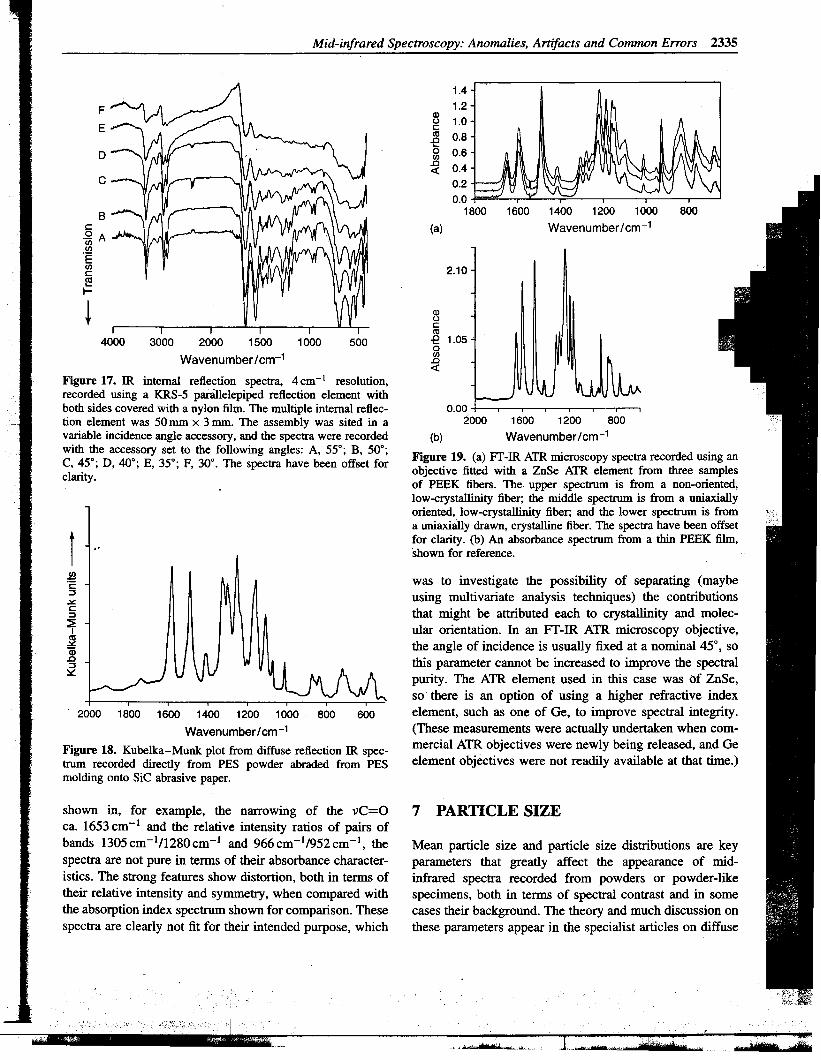
Figure 17. IR internal reflection spectra, 4cm-l resolution,recorded using a KRS-5 par3llelepiped reflection element withboth sides covered with a nylon film. The multiple internal reflec-tion element was 50 mm x 3 mm. The assembly was sited in avariable incidence angle accessory, and the spectra were recorded (b)with the accessory set to the following angles: A, 55°; B, 50°; . . .C 45°. D 40°. E 35°. F 30° Th tr h bee ffi t & Figure 19. (a) Fr-IR ATR IDIcroscopy spectra recorded usmg an
, " " " . e spec a ave nose lor b" fi ed .th Zns A'TR I fr thr II 'ty 0 ~ect.ve tt WI a e n e ement om ee samp es
can. of PEEK fibers. The upper spectrum is from a non-oriented,
low-crystallinity fiber; the middle spectrum is from a uniaxiallyoriented, low-crystallinity fiber; and the lower spectrum is froma uniaxially drawn, crystalline fiber. The spectra have been offsetfor clarity. (b) An absorbance spectrum from a thin PEEK film,shown for reference.
was to investigate the possibility of separati..g (maybeusing multivariate analysis techniques) the contributionsthat might be attributed each to crystallinity and molec-ular orientation. In an FT-IR ATR microscopy objective,the angle of incidence is usually fixed at a nominal 45°, sothis parameter cannot be increased to improve the spectralpurity. The ATR element used in this case was of ZnSe,so there is an option of using a higher refractive index
. 2000 1600 1400 1200 1000 element, such as one of Ge, to improve spectral integrity.
Wavenumber/cm-1 (These measurements were actually undertaken when com-Figure 18. Kubelka-Munk plot from diffuse reflection IR spec- mercial A~ o~jectives were ne~ly bei~g released, an.d Getrum recorded directly from PES powder abraded from PES element objectIves were not readily available at that tIme.)molding onto SiC abrasive paper.
shown in, for example, the narrowing of the vC=O 7ca. 1653 cm-l and the relative intensity ratios of pairs ofbands 1305cm-l/1280cm-l and 966cm-l/952cm-l, the Mean particle size and particle size distributions are keyspectra are not pure in terms of their absorbance character- parameters that greatly affect the appearance of mid-istics. The strong features show distortion, both in terms of infrared spectra recorded from powders or powder-liketheir relative intensity and symmetry, when compared with specimens, both in terms of spectral contrast and in somethe absorption index spectrum shown for comparison. These cases their background. The theory and much discussion onspectra are clearly not fit for their intended purpose, which these parameters appear in the specialist articles on diffuse

t. ~t
1:
,
2336 Anomalies, Artifacts and Common Errors in Using VibrationarSpectroscopy Techniques t:;
r
,.
reflection in this handbook. The discussion here will be 60 \,
merely concerned essentially with some illustrations of the 50 teffects, many extremes, with particle size and packing may o§ jhave on mid-infrared spectra. O~ 40 ~
E cc~
In any mid-infrared measurement from a powder for (I) 30 c1c: 'c ,
which th~ purpose is to obtain a high-quality, good spectral ~20 ,~
f- "c !
contrast, fingerprint absorption spectrum of a sample, with ~ '.:c~. . al 1 f ;/:.1 1 && th . 10 c ~
mInIm over ay 0 art!lactJanoma ous ellects, en Its ;1
mean particle size should be below that of the wavelengths 0 C
I. . . 4000 3500 3000 2500 2000 1500 1000 500 ~:
used to mterrogate the sample. That IS, the largest SIze 1 ;j;~,7'
. (a) Wavenumber/cm- ,;c;
of any particle should be less than 10~, and P!eferably ):[~;c;
b 1 2 ,;",cOc",ce ow ~. 1 00 c'c:;)c"
~In transmission measurements made using, for example, cc';~'};~:
anorganic powder dispersed in a mulling oil or aKBr disk, § :'~,~:t
~en two deleterious effects c~ be observed if. the pow~er :~ 6 "c,~i~~~~
IS not finely ground. The first IS that of a slopmg baseline ~ cc,i~c,,;
that decreases towards longer wavelength (lower wavenum- ~ 4 cc""'1iW~,,J
ber). The second is that referred to as the Christiansen effect, : ""cc~~I~'1 :
which is imposed as a consequence of asymmetrical scatter- ~ 2 c";#'~J:~~
ing loss arising from the dispersion in the refractive index of ;~f~~ '
~e sample in the ~c~nity.of its absorption ~ands. This man- 4000 3500 3000 2500 2000 2500 1000 500 ,I~:I ~
ifests as a tranSmISSIOn mcrease on the high-wavenumber (b) Wavenumber/cm 1 "il1'c
side of an absorption band, and a concomitant decrease to Figure 21. IR transmission spectra from a diphenyl sulfone ~Il~the lower-wavenumber side. Both effects can be seen clearly (DPS) sample prepared as disper~ions in ~ KBr ~sk. The D.PS ::7\'.1in the mull dispersion spectrum that is shown in Figure 20(a), was poo~ly ground and not well dispersed m the disk preparation c;,\;1.;'~as can the improvements gained with better grinding of the fromll di~hiCh sP
d e.ctru th m di(~) k was reed orded, bd ut was tru finel (by ) grOUnd and ;*;;~{,!~y,;; we sperse m e s use to recor spec m .
"
"
100 1 . th h . F. 20(b) Th && csamp erne spectrum s own m 19ure . e ellects ~"'~~d;§ are seen more dramatically in the comparison of the KBr "~4.~[t:~ disk spectra o~ Figure 2~. Poor ~spersion o~ a coar.se pow- i"_1~' J.:i ~ dered analyte m the matrix matenal adds a third detriment to ;~ the recorded spectrum. That is an effect of stray light, since:: some of the IR radiation may pass through the KBr disk;; ;,~ without interacting with the analyte. This effect may wen :i: "
~ooo 3500 3000 2500 2000 1500 1000 500 a~count for the so~e of the ve~ po~r spectral c~ntrast in : ';
(a) Wavenumber/cm-1 FIgure 21(a) - notice how (as WIth diffuse reflection spec- ,tra recorded from some neat powders) the intensity of the ; ~
100 weaker bands is apparently comparatively enhanced). The " ~§ 80 ~ffects may ~ecome very pronounced f~r some ?ands in .sim- c ~i"
.~ lIar preparation spectra recorded from morgaDlc oxyan10ns, " i;
.~ 60 because of their very high absorptivities (see, for exampJe, c: cI
a 40 Figure 22). Notice, however, that in these particular spectra ~'- " If- 20 the asylrimetty in band profile is reversed. i~,
The spectra plotted on an absorbance scale shown as ,
0 Figure 23 are included as an illustration of extreme cases.i: '"4000 3500 3000 2500 2000 1500 1000 500 . . " ~
( ) W b I -1 They were recorded as tranSmISSIOn spectra from 1% W!W; I': b avenum er cm ... ... .. @ concentratiop of essentially monodisperse slhca spheres: ;
Figure. 20. ~ ~ansIDlssion spectra from ~ Irg~ox . 10~0,.a prepar~ as KBr disks? There is much similarity between ii" .phenolic an~oXldant, sample prepared as dispersions m hqwd these spectra and those of Figure 24 which were recorded" ;fparaffin (NuJollI». The analyte powder sample, Irganoxll> 1010, .. '.. i
was poorly ground in the mull from which the spectrum in (a) as diffuse reflection spectra from 5% w/w dilutions of the ')c
was recorded, but finely ground in the sample used to record the silica spheres in ball-milled KBr? In these two figures, theiiic"
spectrum in (b). progression is self-evident from domination of the spectrum ,
" \,
"c
. .
, ,"y",-

'","
Mid-infrared Spectroscopy: Anomalies, Artifacts and Common Errors 2337
70(/)
c: 60 .0=:
0 c:.00 50 ~
f(/) ~ .- c: E 40 ~
(/) ~~ 30 j t
~ 20 ~10 ~0 (a)
4000 3500 3000 2500 2000 1500 1000 500(a) Wavenumber/cm-1
(/)-80 .2
~I~ c: c: ~
:i 60 ~ t
E4Q ""Q)(/) ..c~ ~t= . ~ (b)
~ 20(/)-
0 '§14000 3500 3000 2500 2000 1500 1000 500 ~
t(b) Wavenumber/cm-1 ~Figure 22. IR transmission spectra recorded from sodium carbon- ~ate powder prepared as dispersions in a KBr disk. The Na2CO3 ~ (c)
was not ground in the disk preparation from which spectrum (a) ~was recorded, but was finely ground in the KBr disk used to record (/)
spectI;"Um (b). .2~
1~Ic: ~ ~ .. E ~ ~ I ~ cO
Q) ~) N - g .~ .g (d)
as U ~~ ~ 4000 3200 2400 1600 800~ C- Wavenumber/cm-1«
! Figure 24. A series of IR diffuse reflection spectra recorded from
5% w/w concentrations of monodisperse silica spheres dispersed
in ball-milled KBr powder. The particle sizes of the silica spheres2000 1800 1600 1400 1200 1000 ~100 600 400 were (a) 2, (b) 8, (c) 15 and (d) 321:11D.Thedouble-headedvertical
Wavenumber/cm arrows indicate 2 Kubelka-Munk units. The dashed plots on
Figure 23. A series of IR absorbance spectra recorded from 1% (a) are for the other particle sizes plotted ~n the s~~ ordinate
w/w concentrations of monodisperse silica spheres prepared as scale. [Repcoa.uced from Ibbett (1988)2 by kind perlnlSSlOn of the
KBr disks. The particle sizes of the siliqa spheres were 2, 8, 15 author.]
and 32~. [Reproduced from Ibbett (1988)2 by kind permission
of the author.] practical comparison is given in Figure 26. This compares, '
the spectra of DPS, as: (a) an absorbance plot from a
by absorption characteristics of the analyte at low particle transmission spectrUm recorded from a 1% w/w KBr
size, through external reflection processes, to, at the highest disk preparation; (b) a Kubelka-Munk plot from a diffuse
particle size, radiation mostly bypassing the analyte. reflection spectrum of pure ball-milled DPS; and (c) aFigure 25 shows as a more realistic comparison of the Kubelka - Munk plot from a diffuse reflection spectrum
potential effects of particle size on diffuse reflection spectra from a 1% w/w well-dispersed mixture of ball-milled DPSof a neat organic material. The loss of spectral contrast diluted into ball-milled KBr. The influence of Fresneland increasing interference from specular components with reflection components on the most intense bands is clearlyincreasing mean particle size is clear. An even more evident in Figure 26(b).

;~c2338 Anomalies, Artifacts and Common Errors in Using Vibrational Spectroscopy Techniques . ..~~
;~;::. I'
t fi,': ~,
~(Q) ~',c: 1
.~ b t~.~\fu~~\~'\!1 ' j ;1 ! !
~ ( ) 2000 1800 1600 1400 1200 1000 800 600 400 -cj~; (
§ 1 ~ii~ (a) Wavenumber/crrJ- i~~'"I "",,-:~ill\
tU J(JJ;J~~J= \:--1~'\1 ~' ~
~ (c) t:;, In
~ .~c::;,
~c::;,
1500 1000 =f
(d) Wavenumber/cm-1 ~Q)
Figure 25. A series of diffuse reflection spectra recorded from -§neat azobenzene versus a KCI powder reference. Mean diame- ~ter, d, of the_particles: (a) d > 90~; (b) 75~ < d < 9O1!m; 2000 1800 16(c) 10 ~ < d < 75~; (d) d < 10~. [Reproduced from 'Dif-fuse Reflectance Measurements by Infrared Fourier Transfolm (b)Spectrometry', Fuller M.P. and Griffiths P.R., Anal. Chern., 1978,50, 13, 1906, by kind pennission of the American Chemical "Soci- tety, @ 1978.] !!l
'c:;,
In addition to particle size, packing density and com- ~c:
paction pressure are two more important factors that ~can have significant effects on diffuse reflection spectra. th
Figure 27 compares two diffuse reflection spectra recorded ~from a powder sample of 1% w/w ball-milled KNO3 mixed ~with ball-milled KBr at two compaction pressures? Alsoh . diffu fl . d d fr 2000 1800 16s own IS a se re echon spectrum reCOf e om a
neat sample of the ball-milled KNO3 at one of the com- (c)
paction pressures; note the "missing" band of KNO3 at ca. Figure 26. IR spectra of1380cm-lin this spectrum due to the influence of front transmission measuremensurface reflection. (b) a Kube~-Munk plo
pure ball-mIlled DPS; (c)reflection spectrum from
8 SATURATION IN PHOTOACOUSnC ball-milled DPS diluted.Ibbett (1988)2 by kind pe
MEASUREMENTSPAlFT-IR spectrum. F
The prime first-order relationship that defines the relative is increasing potentialintensities of bands within a magnitude photoacoustic increasing absorptivityFourier transform infrared (PAlFT -IR) measurement is the a deviation from lineratio of the optical decay length (optical absorption depth) absorptivity until at hito the thermal wave decay length (or thermal diffusion sample thickness) full sdepth). The optical absorption depth is the reciprocal of increase in signal is obsthe linear absorption coefficient of a band, while the or absorptivity. For anthermal diffusion depth is proportional to the thermal the effects of saturatiodiffusivity. The relative magnitude of these two parameters modulation frequency,governs the observed relative band intensities within a investigated becomes
..r
j..
'" --~._~
Mid-infrared Spectroscopy: Anomalies, Artifacts and Common Errors 2339
t t t aperture of such a dimension. The higher values r~presentIn situations where a mid-infrared spectrum essentially free... In In.2 "~ "~ of diffraction-induced artifacts may surely be recorded.:J :J :J~ ::£ ::£ (For a low-divergence, high-brightness IR source, such~ I:: I::
~ Ll ~ as that emanating from a synchrotron, the lateral spatial~ ~ ~ res~lu.tion is often perceived as better, since most of theQ) -a; -a; radiation may be focused to a spot of diameter about.0 .0 .0~ I ~ ~ 101Jffi. Synchrotron-sourced IR FT-IR microscopy spectra- - -' I A I - have been reported recorded through a 31Jffi x 31Jffi square
4000 400 4000 400 4000 400 aperture.) The key for the spectrum interrogator is howWavenumber/cm-1 pure is the recorded spectrum, is it really only from
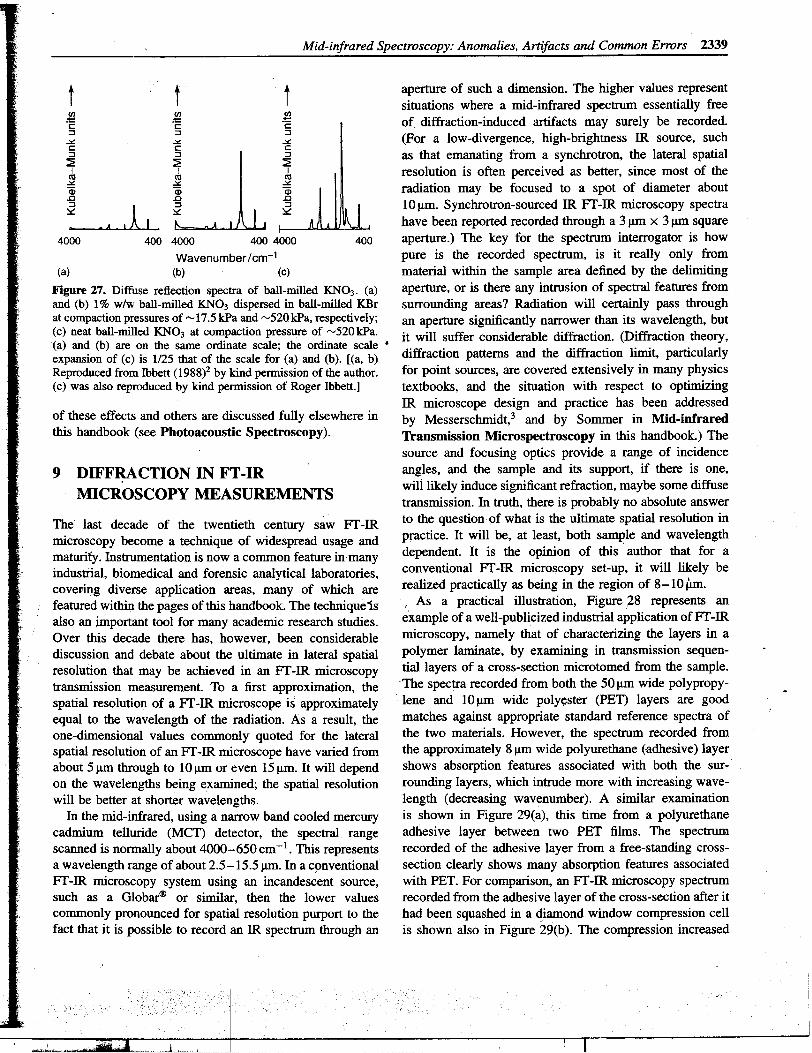
(a) (b) (c) material within the sample area defined by the delimitingFigure 27. Diffuse reflection spectra of ball-milled KNO3. (a) aperture, or is there any intrusion of spectral features fromand (b) 10J,0 w/w ball-milled KNO3 dispersed in ball-milled KBr surrounding areas? Radiation will certainly pass throughat compaction pressures of ~ 17.5 kPa and ~520 kPa, respectively; an aperture significantly narrower than its wavelength but(c) neat ball-milled KNO3 at compaction pressure of ~520kPa. . . . .' . . '(a) and (b) are on the same ordinate scale; the ordinate scale' It. will suffer consIderable dIffraction. (DIffraCtion theory,expansion of (c) is 1/25 that of the scale for (a) and (b). [(a, b) diffraction patterns and the diffraction limit, particularlyReproduced from lbbett (1988f by kind permission of the author. for point sources, are covered extensively in many physics(c} was also reproduced by kind permission of Roger lbbett.] textbooks, and the situation with respect to optimizing
. . IR microscope design and practice has been addressedof. these- effects and others are discussed fully elsewhere m by Messerschmidt,3 and by Sommer in Mid-infraredthis handbook (see Photoacoustic Spectroscopy). Transmission Microspectroscopy in this handbook.) The
source and focusing optics provide a range of incidence9 DIFFRACTION IN FT -IR angles, and the sample and its support, if there is one,
MICROSCOPY MEASUREMENTS will likely induce significant refraction, maybe some diffusetransmission. In truth, there is probably no absolute answer
The last decade of the twentieth century saw FT -IR to the question pf what is the ultimate spatial resolution inmicroscopy become a technique of widespread usage and practice. It will be, at least, both sam~le and wavelengthmaturity. Instrumentation is now a common feature in many dependent. It is the opinion of this author that for aindustrial, biomedical and forensic analytical laboratories, conventional Ff -IR microscopy set-up, it will likely becove~g diverse application areas, many of which are realized practically as being in the region of 8-10 Iim.
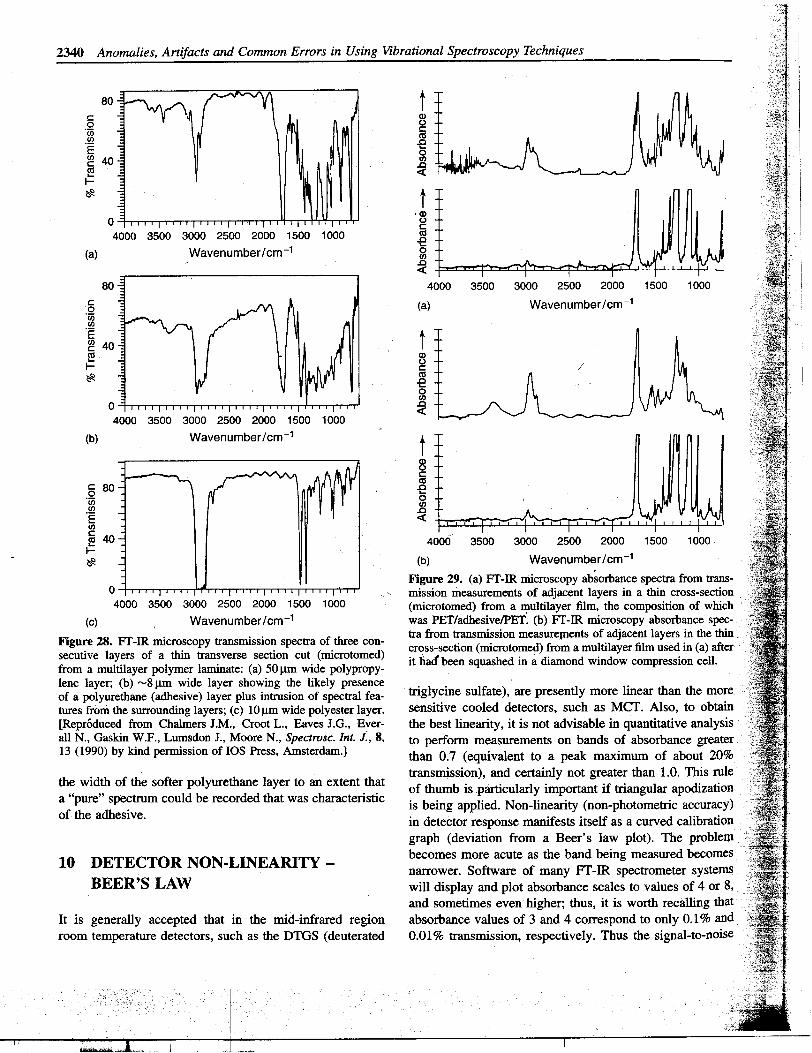
! featured within the pages of this handbook. The technique "is ,As a practical illustration, Figure:28 represents analso an jrnportant tool for many academic research studies. example of a well-publicized industrial application of FT - IROver this decade there has, however, been considerable microscopy, namely that of characterizing the layers in adiscussion and debate about the ultimate in lateral spatial polymer laminate, by examining in transmission sequen-resolution that may be achieved in an FT -IR microscopy tiallayers of a cross-section microtomed from the sample.transmission measurement. To a first approximation, the "The spectra recorded from both the SO 11m wide polypropy-spatial resolution of a FT-IR microscope is approximately lene and 101Jffi wide poly~ster (PET) layers are good ~
equal to the wavelength of the radiation. As a result, the matches against appropriate standard reference spectra ofone-dimensional values commonly quoted for the lateral the two materials. However, the spectrum recorded fromspatial resolution of an FT -IR microscope have varied from the approximately 81Jffi wide polyurethane ~adhesive) layerabout SlJffithrough to 10 IJffi or even lSIJffi. It will depend shows absorption features associated with both the sur-on the wavelengths being examined; the spatial resolution rounding layers, which intrude more with increasing wave-will be better at shorter wavelengths. length (decreasing wavenumber). A similar examination
In the mid-infrared, using a narrow band cooled mercw;y is shown in Figure 29(a), this time from a polyurethanecadmium telluride (MCT) detector, the spectral range adhesive layer between two PET films. The spectrumscanned is normally about 4000-6S0cm-l. This represents recorded of the adhesive layer from a free-standing cross-a wavelength range of about 2.S-1S.SIJffi.1n a c~nventional section clearly shows many absorption features associatedFf-IR microscopy system using an incandescent source, with PET. For comparison, an Ff-IR microscopy spectrumsuch as a Globar<R> or similar, then the lower values recorded from the adhesive layer of the cross-section after itcommonly pronounced for spatial resolution purport to the had been squashed in a diamond window compression cellfact that it is possible to record an IR spectrum through an is shown also in Figure 29(b). The compression increased
~
I
2340 Anomalies, Artifacts and Common Errors in Using Vibrational Spectroscopy Techniques
80 tc 0)0 (.).- cU) ItS
.!!2 -eE 0
~ 40 .'8~ «I-
~ t'0)
0 (.)
c
4000 3500 3000 2500 2000 1500 1000 J5
(a) Wavenumber/cm-1 g.!:J
«80 4
§ (a)'00
U)
.~ 40 tItS 0)
~ g /
~ J5...
0
U)
0 .!:J
«4000 3500 3000 2500 2000 1500 1000
(b) Wavenumber/cm-1 t0)(.)c
ItSc 80 .!:J0 ....- 0U) U)
.!!2 .!:JE «U)
c~ 40 4 3000 2500 2000l-. ~ (b) Wavenumber/cm-1
Figure 29. (a) Fr-IR nricroscopy ab~orbance spectra from trans-0 mission measurements of adjacent layers in a thin cross-section4000 3500 3000 2500 2000 1500 1000 (nricrotomed) from a multilayer film, the composition of which
(c) Wavenumber/cm-1 wasPET/adhesive/PET~ (b) Fr-IR nricroscopy absorbanceF. 28 1::"T' IR . . . f thr tra from transnrission measureJIlents of adjacent layers in the thin
19ure . r 1. - mIcroscopy tranSmISSIOn spectra 0 ee con- n. ( . t ed)fr In' I film d . ( ). . .. cross-sec on mIcro om om a mu ayer use m asecunve layers of a thin transverse section cut (mlcrotomed) .t h' - -" b h d . di d . d . 11fr I .
1 1 I . ( ) 50 'd I 1 au een squas e m a amon wm ow compressIon ce .om a mu n ayer po ymer ammate: a ~m WI e po ypropy-
lene layer; (b) ~8 ~m wide layer showing the likely presence. . .of a polyurethane (adhesive) layer plus intrusion of spectral fea- trigl~~me sulfate), are presently more linear than the mo~tures from the surrounding layers; (c) 10 ~m wide polyester layer. sensItIve cooled detectors, such as MCT. Also, to obtaIn[ReprOduced from Chalmers I.M., Croot L., Eaves I.G., Ever- the best linearity, it is not advisable in quantitative analysisall N., Gaskin ~.F., Lw:ns~on I., Moore N., Spectrosc. Int. J:, 8, to perfonn measurements on bands of absorbance greater13 (1990) by kind permISSIOn of IOS Press, Amsterdam.] than 0.7 (equivalent to a peak maximum of about 20%
. transmission), and certainly not greater than 1.0. This rulethe wIdth of the softer polyurethane layer to an extent that f th b . arti. I 1 . rtant .f trio 1 00. atI.on.. 0 urn ISp cuarYImpo 1 anguarap IZ
a "pure" spectrum could be recorded that was charactenstIc . b . l ' ed N li .ty ( h t trio uracy). IS emg app 1 . on- nean non-p 0 orne c accof the adhesIve. . d .f; . If d al.b .: m etector response maDl ests rtse as a curve c 1 rauon
graph (deviation from a Beer's law plot). The problem10 DETECTOR NON-LINEARITY - becomes more acute as the band being measured becomes
narrower. Software of many FT - IR spectrometerBEER'S LAW will display and plot absorbance scales to values of4 or 8,
and sometimes even higher; thus, it is worth recalling thatIt is generally accepted that in the mid-infrared region absorbance values of 3 and 4 correspond to only 0.1 % androom temperature detectors, such as the DTGS (deuterated 0.01 % transmission, respectively. Thus the signal-to-noise
I

Mid-infrared Spectroscopy: Anomalies, Artifacts and Common Errors 2341
ratio may be very low near the center of strong absorption 3550cm-l. The presence of the band at higher wavenum-bands and the photometric accuracy of many contemporary ber implied entrapment of isolated (non-hydrogen-bonded)Fr -IR spectrometers is only :f:O.l % T. More detailed water molecules within the polymer matrix.discussion on the effects of photometric accuracy on Beer' s Th~ second example from Spectra -Structure Corre-law plots can be found in Beer's Law by Griffiths in this lations: Polymer Spectra covers changes between thehandbook. common polymorphic forms of polybutene. A polybutene
For very weak bands, the quantitative accuracy is given film prepared from the melt will likely exist in the type nby a number of parameters, including the noise level on crystalline modification, but with time it reverts to thethe spectral baseline, the baseline flatness, the level of higher-density type I form. This change, which may takeimpurities in the sample, and how well atmospheric H2O place over a several days, is accompanied by steady butand CO2 have been compensated. si~ficant changes in the absorption pattern in the fin-
gerprint region of the spectrum (see Figure 30) (also, seeFigure 18 of Spectra-Structure Correlations: Polymer
11 POLYMORPmC AND Spectra).The third example selected shows how different ther-
MORPHOLOGICAL CHANGES, mal histories may affect the state of a dispersed material.
METASTABLE AND Figure 31 shows IR spectra over the range l700-1400cm-lENVIRONMENTffIME DEPENDENT recorded from calcium stearate (CaSt) in three differentSTATES sampling pres~n~tions.4 The absorbance spectra ~enera~ed
from a tranSmISSIOn measurement of caSt as a dispersIonin a KCl disk and the Kubleka-Munk plot of powdered
Many solid materials exhibit polymorphism, and some formchanges are accompanied by very significant differences 1.4between their associated vibrational spectra. Some states 1.2may also ~e me~stable, revertin~ in time to a mor~ stable \ g 1.0form, agaIn leading to changes 10 the IR specfi"um of the ~material. Other equilibrium states may be altered by the g 0.8
method of sample presentation, containment or preparation. ~ 0.6 .Clearly, many such changes may be invoked deliberately or 0.4
) anticipated through variations in experimental parameters, 0.2such as temperature or pressure, but the few ex~ples 0.0 1300 1200 1100 1000 900 800 700 600 500 400
, mentioned in this section all occurred at room temperature (a) Wavenumber/cm-1using conventional methods of sample analysis. It-is hopedthat they serve to illustrate some, perhaps unanticipated, 1.4
consequences of analysing a sample by IR spectroscopy. In 1.2all cases the IR spectrum changed with time. ~ 1:0
Polymorphism and its effects on vibrational spectra, par- ~ticularly compounds of interest to the pharmaceutical indus- "§ 0.8
try, are discussed in detail in Polymorphs, Solvates and ~ 0.6
Hydrates in Volume 5 of this handbook. Also, examples 0.4
of spectral changes resulting from different crystal formsof organic polymers may be found in the Volume 3 article 0.2950 900 850 800 750SPectra-Structure Correlations: Polymer Spectra. Two (b) Wavenumbericm-1examples relevant to this part of our discussion may be. .. 1.., d . S t St tu C I ti P I S Figure 30. (a) Nme overlaid JR, 4cm- resolutIon, spectraJ.oun m pec ra- ruc re orre a ons: 0 ymer pec- .. .. recorded from a polybutene film over a penod of about 3 days,tra as FIgures 12 and 18 and theIr assocIated texts. The first during which time it reverted from a type II to a type I crystallineconcerns desorption of water from a polymer film while it form. (b) Scale-expanded plot over the range 950- 750cm-l ofis mounted in the IR beam in the sample compartment of the plots shown in (a), showing the increase with time of absorp-an IR spectrometer (see Figure 12 of. Spectra-Structure ti<:>ns ~t 923cm-l, 848cm('- and 8l6cm-l, ~ a~sorption d~rease
. . . . WIth time at 9O3cm-l, and an apparent shift m band maxImumCorrelations: Polymer Spectra). The peculianty here IS with time from 763 cm-l to 758 cm-l. The time intervals betweenthat the wat~r that was in equilibrium with the polymer when a spectrum was recorded after the initial spectrum was takenfilm gave rise to vOH stretching bands at 3650cm-l and were 11,20,62, 135,345,512,2660 and 4196 min.
~-"'~~~ .~~ "~- ~

I2342 Anomalies, Artifacts and Common Errors in Using Vibrational Spectroscopy Techniques
I metastable fonn of caSt, since in time the CaSt reverted~ slowly to the more stable crystalline fonn, with a conse-[t, quent shift of the bands to 1577cm-1 and 1540cm-l.~ The final example in this section shows morphological
changes induced into a sample of PEEK while containedI ~ under pressure in a diamond window compression cell. The
.; analysis concerned examining by FT -m microscopy a vis-§ ible small defect area in a PEEK molding. The defect was~ \ isolated from the ~olding and compressed between the win-
~ dows of a diamond compression cell to facilitate analysis by.g FT-m microscopy. The resultant spectrum showed readily~
that the defect area had, a different morphology to the bulkmaterial of the molding, in that it was amorphous. How-ever, over about 2 days the contained sample underwentpressure-induced crystallization, as evidenced by changesin its spectrum (Figure 32). Its s~ctrum then looked verysimilar to that recorded from the crystalline bulk material,such that the spectrally observed physical difference infor-
~1 mation between the defect and thIe bulk material was lost!. ~ M~y materials may undergo morphological or state
g changes, such as pressure-, temperature- or solvent-induced~ (c) crystallization, with time or as a consequence of differing
1700 ' 1600 ' 1500 . 1400 histbries or containment environments. Most of these phys-
Wavenumber/cm-1 ical changes will be reflected by changes in the materials'F. 31 ( Diffu fl . f caS di ed IR spectrum that may be considerable. The few examples
19ure . a) se re ectlon spectrum 0 t spers .in powdered KCI; (b) absorbance spectrum of caSt stabilized here emphasIze the f~ct that an m s~~ of ~ samplePVC film; (c) absorbance spectrum of caSt in a KCI disk represents the fingerpnnt of. that sample m Its phYSICal statepreparation. [Reproduced by permission from J.M. Chalmers, and environment the time th~ spectrum was recorded, andM.W. Mackenzie and H.A. Willis, Appl. Spectrosc., 38, 763 not just its perceived chemical structure.(1984).]
PVC containing CaSt. as a ,stabilizer, d~spersed in pow- 12 INVERTED BANDS IN EMISSIONdered KCI generated from a diffuse reflection measurement.both exhibit CaSt bands with maxima at 1577cm-1 and SPECTRA1540cm-l. However, these bands appear at 1601 cm-land 1562cm-1 in a transmission measurement record~ Mid-infrared emission studies are mostly limited tofrom a sample of the stabilized PVC powder prepar~ examining thin specimens or a thin layer/film on a weaklyas compression molded (hot pressed) film from the melt. absorbing substrate. Typical of these might be an adsorbedThe bands at 1601 cm-l and 1562 cm-l are attributed to a species on a catalyst surface or a coating on a beverage
t I.II~~
, I , , , " , , , , " , , , , I1400 1200 1000 1400 1200 1000 1400 1200 1000
Wavenumber/cm-1 Wavenumber/cm-1 Wavenumber/cm-1
-2 days in diamond window compression cell
Figure 32. IR absorbance spectra recorded from an Ff -IR microscopy transmission measurement of a defect isolated from a PEEKmolding. The defect was flattened and contained under pressure in a diamond window compression cell.
~~--""'- ~~~,

Mid-infrared Spectroscopy: Anomalies, Artifacts and Common Errors 2343- -
can, that is regimes where it is possible to generate ~spectrum that is characteristic of the fingerprint pattern +
associated with th~ analyte. Although the use of IR emission .§" (/)
spectroscopy as an analytical tool has become sparser .!Q
with the arrival of Fr -IR sampling techniques such as ~PA and diffuse reflection, in an article such as this, it isworth noting a few oddities. The theory, sample handling 2000 1800 1600 1400 1200 1000 800 600 400
and applications of IR emission spectroscopy together (a) Wavenumber/cm-1
including some discussion of spectral distortions may befound in Infrared Emission Spectroscopy by Mink in this +
handbook. I::
In optically opaque samples it is possible to observe 'ffi
apparently inverted bands in their emission spectra. These 'Edistortions arise from re-absorption by a colder surface layer W
of radiation originating from within the bulk of a sample. 2000 1800 1600 1400 1200 1000 800 600 400Mink (see Infrared Emission Spectro~copy) has discussed (b) Wavenumber/cm-1and illustrated (see Figures 7 and 8 in Infrared EmissionSpectroscopy) some characteristics of self-absorption. Also +
discussed for organic materials were the so-called "reduced I::
emission" phenom~na (see, for example, Sheppard5), at .~wavenumbers where significant front surface reflectibn .~occurs. W
The wavenumber dependent absorptance (a) of a sample ",...,. .. . 2000 1800 1600 1400 1200 1000 800 600 400IS given as: (c) Wavenumber/cm-1
a = 1 - (t + r) (1). . ..Figure 33. IR, 4cm-l resoluuon, ellllSSIon spectra recorded at
where t and r represent the transmittance and reflectance 348 K from a s.eries of PET films: (a) 2.5 ~ thick; (b) 9 ~ thick;of the sample respectivel (c) l00~m thick. [Reproduced from J.M. Chalmers and M.W.
. ' y: . . Mackenzie, 'Solid Sampling Techniques', in M.W. MackenzieThe eqUIvalent expressIon for elDlSSIon spectrometry, (ed.), "Advances in Applied Fourier Transform Infrared Spec-
'through Kirchhoff's law, in temlS of a sample's emissivity troscopy", J. WIley & Sons, Chichester, 105-188 (1988). Copy-(6) is: right 1988. @John Wiley & Sons Limited. Reproduced with
6 = 1 - (t + r) (2) permission.]
Remembering that there is dispersion. in the refractive instance not as a consequence of selective reflection. Inindex as one traverses an absorption band (see preceding these cases, filler material may act as a relatively efficientsection), then there is therefore an equivalence in the case blackbody emitter, that is, as a conventional source for theof emittance. Fig~e 33 shows an ~xample of "reduced surrounding polymer matrix, which being cooler absorbsemission" observed in the emission spectra of a series at its characteristic frequencies. Examples of such an effectof PET films of differing thickness.5 B'arid splitting is may be seen in the spectra of Figure 34. The features withinclearly observed on the vC=O band at ca. 1725 cm -; I the emission spectrum recorded will depend not only on
in Figure 33(a). Loss of spectral contrast is clearly seen the sample temperature, but also on the filler level and itsin the emission spectrum of Figure 33(b), as the more dispersion, the)film thickness, the thennal balance betweenintense bands approach saturation (see Infrared Emission the filler and the polymer, and the wavelength dependenceSpectroscopy). The minima observed at 1725 cm-l and of the Planck function. (More detailed discussion of this1265 cm-lin Figure 33(c), may be explained by the effect and further examples may be found in Chalmers andof "reduced emission", while the minima in the vicinity Mackenzie.6)of 1900cm-I and 600cm-I are genuine regions of low
emissivity.6 ,In the case of organic polymers, °.ptical opacity may be 13 EXTERNAL REFLECTION -the consequence of a high level of a filler material, such as MIXED-MODE SPECTRAcarbon black, rather than a~ a result of absorption becauseof an excessiye sample thickness. Spectra recorded from In recent years, increased analytical use has been madesuch samples may also show inverted spectra, but in this of external reflection as a convenient sampling technique,
!

[I2344 Anomalies, Artifacts and Common Errors in Using Vibrational Spectroscopy Techniques
1 "", ,,---~)""! 1
~""r,-f"\~~Jh#j\a )u ,c::
t i :.-.~ ~-~.. fu~§ (c) ~, "'"' v: , ,W~f'ij '"u
:~ 3500 3000 2500 2000 1500 1000
~ Wavenumber/cm-1
Figure 35. FT -IR microscopy, external reflection spectra recor-ded from a series of PEEK samples: (a) 3 mrn thick; (b) 125 ~mthick; (c) 10 IJ.In thick.
t sample (a 10!lID thick film) is dominated by absorp~onc:: features and resembles that recorded from a transflectIon.~ -. measurement, but on which is superimposed an interference
'E fringe pattern. This is because the dominant features ariseW from radiation that has been transmitted through the sample
, and then been reflected back from ~e films' lower sur-1600 1400 1200 ~1000 face, but attenuated by the characteristic. absorption bands
Wavenumber/cm of the sample. At high wavenumber (short wavelength),
Figure 34. IR, 4cm-1 resolution, emission spectra recorded at the middle spectrum, from a film of 125 ~m thickness, has3"48 K from a. series of 20% c,arbon-black-filled. PET films: similar character to the spectrum recorded from the thinnest(a) 150~m thick; (b) 1~1J.In thick; (c) 51J.In thick. Spectra film but with a different fringe frequency. However, at lowhave been offset for clanty. [Repr.oduced from J.M. Chalmers ' ,-and M.W. Mackenzie, 'Solid Sampling Techniques', in M.W. wavenumber the spectrum more resembles a true: ~ont-Mackenzie (ed.), "Advances in Applied Fourier Transform surface reflection spectrum, particularly in the viclmty ofInfrared Spectroscopy", J. Wiley & Sons, Chichester, 105-188 bands with high absorptivities. Clearly, neither of the spec-(1988). Copyright 1988. @John Wiley & Sons Limited. tra recorded from the two thinner samples is in a formReproduced with permission.] appropriate to a K-K transform approach.
particularly in combinatio~ with FT -IR microscopy mea-suretnents. The benefit has been derived from the ready 14 SCALE EXPANSION: DIGITIZATIONapplication of the K-K transformation of Fresnel reflection STEPS AND PLOT SOFTWAREspectra to the optical constants of the sample, and thereby CHARACTERISTICSextracting the analytically useful absorption index spec-trum. Successful application of this approach depends on The number of data points in a mid-infrared recordedthe purity of the front-surface reflection spectrum. The sam- interferogram relates to the resolution at which the desiredpIe must be optically flat, homogeneous, and optically thick. spectrum is to be analyzed. The point density in theIf the sample form does not meet these requirements, then transformed spectrum may possibly be increased by ana "mixed-mode" spectrum may be recorded that is useless integer multiplication of the number of recorded datafor such a treatment. As an example, Figure 35 shows IR points, depecnding on the level of zero-filling chosen. Whenspectra recorded from three samples of the same polymer, the spectrum is plotted with high abscissa expansion, theeach of a different thickness, from a front-surface reflec- spectrum may appear disjointed, being composed as ation experimental arrangement. Neglecting the features due series of points connected by straight lines. Some plotto atmospheric water vapor and CO2, the spectrum from the software algorithms further increase the point density (notthickest sample (3 mm thickness) is what is expected from the spectral resolution though) through interpolation, by,a front-surface reflectiorfmeasurement and appropriate for for example, fitting polynomials through successive blocksK-K treatment. The spectrum recorded from the thinnest of data points. Like zero-filling, spline interpolation serves
mi;;::
~:i;;:t.,
,

primarily as an aesthetic function implemented to improve aperture card sample mount. In Figure 36(a), the single-band contour; the spectral resolution is implicit and defined beam background, used was that of the open beam. Theby thenon-zero-filled interferogram. mismatch in beam dimensions between the two ratioed
single-beam spectra, produced the sloping background and.. overall reduced transmission scale for the sample spectrum.15, SINGLE-BEAM BACKGROUND To compensate for the .vignetting caused by the sample
CHOICE card mount, the single-beam background spectrum forFigure 36(b) was recorded through an empty aperture
The choice of single-beam background for measuring sample mount located as near as possible in the samea sample's FT -IR spectrum should be that which most position, in the sample compartment at the beam focus, asclosely represents the conditions under which the sample's for that used to record the sample single-beam spectrum.single-beam spectrum is recorded. For example, if an The improvement in spectral integrity is self-evident.
accessory such as an internal reflection unit is used, thenthe background spectrum should be taken through the sameunit in the same alignment in the sample compartment fitted 16 DATA MANIPULATION AND
with the internal reflection element to be used, but without TREATMENTthe sample. This consideration; of matching as closely aspossible the throughput and light paths under which the two Many artifacts or distortions may be introduced into spec-single-beam spectra are recorded, will minimize artifacts tra as a consequence of data treatment o~ manipulation byand distortions in the sample's spectrum. software algorithms. Some, s~ch as phase correction con-
As a trivial example of minimizing such distortions, the siderations in high-resolution spectra, are beyond the scopespectra of Figure 36 may be compared. The pair of spectra of this article. Others, such as decreasing signal-to-noisewere 'recorded from a polysulfone film of about 10 ~ ratio with increasing levels of deivatization, loss of spectralthickness. The film was mounted in a 25 mm x 11 mm contrast and detail with smoothing, or introduction of side
lobes in Fourier self-deconvolution, have been discussed in50 the appropriate articles within this handbook.
Spectral subtraction (difference spectroscopY),is a manip-..~ 40 ulation that is both extremely valuable and seriously open.~ 30 to abuse in the interpretation of its results. It should always~ be undertaken between two absorbance or two absorbance-~ 20 equivalent spectra, e.g. Kubelka-Munk, absorption index~ 10 or photoacoustic intensIty plots. It is not uncommon to
observe within an appropriately factored difference spec--0 trum features that may indicate a band shift, a band nar-'4000 3500 3000 2500 2000 ~;oo 1000 500 rowing, a b~d increase orlan increase or decrease in band
(a) Wavenumber/cm intensity. ~t high ordinate scale expansions, similar effects l~
80 can sometimes arise as artifacts, and not be associated withreal changes. For instance, assuming there are no time- '.
§ 60 dependent changes, then such artifacts can appear in a dif-.~ ference spectrum generated by subtracting two absorbance.- .~ 40 spectra generated from consecutively recorded spectra from~ the same sample, but where the sample was merely removed~ 20 from and then replaced into the sample compartment beam~ between the recordings.
04000 3500 3000 2500 2000 1500 1000 500 17(b) Wavenumber/cm-1 INSTRUMENT -
Figure 36. IR, 4cm-l resolution, transmission srectra recorded Up to this point, the discussion in this article has concen-from a polysulfone film. The film was mounted In the 25 mm x ... .11 mm aperture of a sample card mount. The single-beam back- trated mostly on ~omalles, artIfac~s and errors arISl~g outground spectrum used for (a) was the unrestricted spectrometer of sample preparation and presentation and spectral display.open beam, while that for (b) was an open beam but with an This has been deliberate, since in mid~infrared measure-empty card mount sited in the sampling position. ments, these are the most common sources of malpractice
,. -
\. I
-'~-": ,,",,~i_-"~'~~::4"

,
2346 Anomalies, Artifacts and Common Errors in Using Vibrational Spectroscopy Techniques '- ,
~ssociated with measurements made on condensed phases have been shared will hope~lly make newcomers to theat spectral resolutions of 1 cm-l or lower. Instrumental arti- field more aware' of the pot~ntial hazards associated withfacts, such as vignetting and aliasing, leading to wavenum- poor experimental practice, short-cutting well-establishedber shifts and spectral folding respectively, are mentioned methodologies or attempting to circumvent (violate!) thein ano.ther article (see Anomalies and Artifacts in Raman laws of optical physics. The empha~is in this article hasSpectroscopy) in considerations of anomalies appropriate been deliberately biased towards sample presentation tech-to Fourier transform (Fr)-Raman spectra.. These and other niques, since in general practice, this is the area most proneperformance and design criteria, such as mirror alignments, to misconception, misunderstanding, misuse and error. Thisand roll, tilt, yaw and shear elimination or compensation is perhaps in contrast to the article on anomalies andduring interferometer mirror travel, become much more artifacts in Raman spectroscopy (see Anomalies and Am-
- pertinent to more speci3!ized applications, such as high- facts in Raman Spectroscopy), for which the tendencyresolution spectroscopy, and will not be discussed here. out of necessity is more towards the instrumentation and itsFor most commercial Ff spectro~eters designed today for parameters. However, I would recommend that anyone newoperating in the mid-infrared region, they are of no appar- to the field of vibrational spectrosc~py read both these arti-ent consequence to the user, except for all but the most c1es, and also the article covering ariomalies in near-infraredsensitive measurements, and of no real concern for appli- spectroscopy (see Anom.alies in Near-infrared Spec-cations by conventional sampling methods undertaken at troscopy). Each contains differing insights to the problemslow or moderat~ spectral resolutions. faced in recording high-quality ~pe:ctra free from artifacts
A classified list of 50 categories of potential ordinate and distortions, and collectively iliey should-provide a gooderror in Ff spectroscopy has been published with com- base for developing successful approaches to both qualita-ments by Birch and Clarke: The classifications are: non- tive and quantitative vibrational spectroscopy practice.ideal spectrophotometer properties, interaction of non-ideal .
instrument and sample properties, effects of non-ideal prop-erties of the sample, and deficiencies. of, the measurement ABBREVIATIONS AND ACRONYMSprocedures. More recently, these authors have publisheda prelimifiary appraisal of the interreflection errors in F.f CaSt Calcium Stearatespectroscopy.8 Discussions on component specifications DPS' Dipheny1 Sulfoneand design and performance requirements for Ff-IR spec- K-K Kramers-Kronigtrometers may be found in many other publications.9-11 PA/Fr-IR Photoacoustic Fourier Transform InfraredSome such as the Zachor-Aaronson disto_rtion, related to PDMS Po1y(dimethy1 ~i10xane)non-constant mirror scan velocity, become more needy of PEEl( Po1y(ary1 ether eilier ketone)consideration in problematic environments, such as process PES' Po1y(ary1 ether sulfone)installations}2 PET Po1y(ethy1ene terephthalate)
A detailed early look at" the problems involved in PVC Po1y(viny1 chloride)quantitative Ff -IR by Tomas Hirschfeld was published in "
1979.13 In mid-infrared dispersive spectrometry, the inher-. ent polarization in 'gratings was an important consideration. REFERENCES
However, the effect is significantly weaker in Ff-IR spec- ,trometers (see Mid-infrared Spectroscopy of the Con- 1. B.A. Macdonald (ed.), 'Chambers Twentieth Century Dictio-densed Phase and Griffithset al.ll and Hirschfe1d13). And, nary', W & R Chambers Ltd., Edinburgh (1979).while the reflectance and transmittance of b~am-sp1itters 2. R.N. Ibbett, PhD thesis, University of East Ang1ia, Norwichmay be 'quite different for the two (horizontal and ver- (1988).tical) polarizations, the efficiency is usually quite close 3; R.O. Messerschnridt, 'Minimizing Optical Nonlinearities into unity Infrared Microspeotroscopy', in "Practical Guide to Infrared
. Microspectroscopy", ed. H.J. Humecki, Marcel Dekker, Inc.,. New York, 3-39 (1995).
is CLOSING REMARKS 4. J.M.. Chalmers, M.W. Mackenzie and H.A. Willis, Appl.Spectrosc., 38(6), 763 (1984).
As one progresses through composin an article like thi 5. N. Sheppard, 'The .use of F°u.ne~ Transform ~ethods for. the
g s, Measurem~nt of Infrared EmISSIOn Spectra', In "AnalytIcal
?ne tends to recall (~nfortunate1y!) exampies of many Applications of FTlRto ,Molecular and Biological Systems"..m~tances one has expenenced or observed where nuisances ed. J.R. Durig, D. Reidel, Dordrecht, 125-140 (1980).and. nuances ha:e oc~urre~ ~at resulted in spectral dis- 6. J.M. Chalmers and M.W. Mackenzie, 'Solid Sampling Tech-tortions and artifacts m mId-infrared spectra. Those that niques', in "Advances in Applied Fourier Transform Infrared
.
. . .' ,

c . .Mid-infrared.Spectroscopy: Anomalies, Artifacts and Common Errors 2347
- -
Spectroscopy", ed. M.W. Mackenzie, I. Wiley & Sons, 11. P.R. Griffiths and I.A. de Hasetli, 'Fourier Transform Spec-11 Chich~ster, 105-188 ~1988). trometry',~. Wile~ ~ Sons, Inc., New Yor~ (1986)..
y 7. I.R. BIrch and F.I.I. Clarke, Spectrosc. Hur., 7(4),16 (1995). 12. D.W. Vidrine, 'Mid-infrared Spectroscopy m,Chelnlcal Pro-so 8 I . . cess Analysis', in "Spectroscopy in Process Analysis", ed." . .R. BIrch and F.I.I. Clarke, Anal. Chlm. Acta, 380, 369 I M Chalm Sh ffi Id A d . Pr Sh ffi Id 96- 138" (1999). .. ers, e e ca elnlc ess, e e ,
: (2000)., 9. R. Geick, Top. Curren(Chem., 58, 75 (1975). 13. T. Hirschfeld,- 'Quantitative FT-IR: A Detailed Look at the
10; S.F. Iohnston, 'Fourier Transform Infrared Spectrometry. A Problems Involved', in "Fourier T~sform Infrared Spec-Constantly Evolving Technology', Ellis Horwood, Chichester troscopy", eds I.R. Ferraro and L.J.. Basile, Academic Press,(1991). New York, 193-242, Vol. ff (1979).
~
\ /
\
(t! .t~')
,
:t,i
\
," i
\
,