“the story of wine” · glassblowing became more common during this era. in 1769, franciscan...
TRANSCRIPT


The earliest scientific evidence of grapes comes from 60 million year old fossil vines. The first written accountof winemaking comes from a much more recent source, the Bible, which tells us that Noah planted a vineyardafter exiting the Ark. An ancient Persian fable credits a lady of the court with the discovery of wine. A Princesswho had lost favor with the King attempted to poison herself by eating some table grapes that had spoiled in ajar. She became intoxicated and giddy and fell asleep. When she awoke, she found the stresses that had madeher life intolerable had dispersed. Returning to the source of her relief, her subsequent conduct changed soremarkably that she regained the King’s favor. He shared his daughter’s discovery with his court and the restis history!
Scientists have detected wine in a jar from as far back as 5400 B.C., found at the site of Hajji FiruzTepe in the northern Zagros Mountains of present-day Iran. But the earliest knowledge about wine cultivationcomes from ancient Egypt, where the winemaking process was represented on tomb walls dating to 2600B.C.
Wine came to Europe with the spread of the Greek civilization around 1600 BC. Homer’s Odysseyand Iliad both contain excellent and detailed descriptions of wine. Wine was an important article of Greekcommerce and Greek doctors, including Hippocrates, were among the first to prescribe it. The Greeks alsolearned to add herbs and spices to mask spoilage. Starting about 1000 BC, the Romans made major contributionsin classifying grape varieties and colors, observing and charting ripening characteristics, identifying diseasesand recognizing soil-type preferences. They became skilled at pruning and increasing yields through irrigationand fertilization techniques. The Romans also developed wooden cooperage, a great advance for wine storagewhich had previously been done in skins or jars. They may also have been the first to use glass bottles, asglassblowing became more common during this era.
In 1769, Franciscan missionary Father Junipero Serra planted the first California vineyard at MissionSan Diego. Father Serra continued to establish eight more missions and vineyards until his death in 1784; andhas since been called the “Father of California Wine”. In 1833, a French winemaker, Jean-Louis Vignesbrought the first European vines from his native Bordeaux to Los Angeles. Vignes planted these vines, built awinery and by the late 1800’s Los Angeles was considered California’s premiere appellation for grape growingand winemaking. In the 1850s and ’60s, the colorful Agoston Harazsthy, a Hungarian soldier, merchant andpromoter, made several trips to import cuttings from 165 of the greatest European vineyards to California.Some of his endeavors were funded through the State, while others were at his own expense. Overall, heintroduced about 300 different grape varieties, although some were lost prior to testing, due to difficulties inpreserving and handling.
In 2005, California’s wine grape industry has had an economic impact of $51.3 billion in the state andhas generated approximately 207,750 jobs. Wine grapes are grown in 46 of California’s 58 counties coveringclose to 500,000 acres and are ranked third in the State’s top agricultural commodities. California is the fourthlargest wine producer in the world after France, Italy and Spain.
In 1941, Kings County’s first “Crop Report” shows that the total wine grape acreage was 9,245acres. In 2006, our report shows 3,358 acres. Several factors have changed Kings County as a wine grapegrowing area. The agricultural market place and farming trends have contributed to the decrease in the numberof wine grape acres. Increasing popularity of the central coast as a wine making region, and the trends in winevarieties that consumers enjoy may have led to this trend. Higher value crops such as nuts and tree fruit havealso taken the place of wine grapes. However, the wine industry is ever changing, and as new varieties thrivein Kings County, this area will continue its tradition of wine grape growing.
“The Story of Wine”

Department of Agriculture / Measurement Standards
TIM NISWANDERAgricultural Commissioner
Sealer of Weights and Measures
680 N. Campus Drive, Suite B / Hanford, California 93230 / (559) 582-3211, Ext. 2830FAX (559) 582-5251 / e-mail: [email protected] / website: countyofkings.com
Secretary A. G. KawamuraCalifornia Department of Food and Agriculture AndThe Honorable Board of SupervisorsCounty of Kings, California
It is my privilege to submit to you, the 2006 Annual Agricultural Crop Report for the County of Kings. This reportcontains statistical information on the acreage, yield, and gross values in accordance with Sections 2272 and 2279of the California Food and Agricultural Code. The numbers in this report are only gross values and do notrepresent net income or loss to producers.
The gross value of all agricultural crops and products produced during 2006 in Kings County is $1,289,186,000.This represents a decrease of $118,033,000 (8.4%) from the 2005 value.
While the overall gross value decreased in 2006, three crop and product categories experienced increases. Fruitand Nut Crops increased $6,982,000 (2.8%) as a result of acreage and price increases; Apiary Products increasedby $2,421,000 (80.9%) due to production and value; and Seed Crops increased by $4,622,000 (55.4%) due toincreased acreage.
The following categories contributed to the overall decrease: Livestock & Poultry which was down $40,737,000(-20.1%) as a result of fewer animals on-hand; Vegetable Crops declined by $28,515,000 (-27.6%) mostly fromless acreage; Livestock & Poultry Products decreased $45,123,000 (-9.7%) reflecting the effects of a pricereceived for the County’s leading product, Milk; and Field Crops were down $17,683,000 (-4.6%) due to lessacreage.
My thanks and appreciation are extended to the many producers and organizations who contributed informationfor this report. This report is produced from the hard work of Joan Vernon, Ag & Standards Inspector III, RobbieCoelho, Ag & Standards Inspector I, Brandi Martin, Ag & Standards Inspector I, Janet Eckles, Agricultural andStandards Aide, Roberta Spomer, Agricultural and Standards Aide and Ruben Arroyo, Deputy Ag Commissioner/Sealer.
Respectfully yours,
Tim Niswander
April 17, 2007

Summary Letter............................................................................... 1
Table of Contents............................................................................ 2
County Administration/Ag Commissioner -Sealer Personnel.......... 3
Field Crops...................................................................................... 4
Fruit and Nut Crops ........................................................................ 6
Vegetable & Seed Crops................................................................. 8
Livestock and Poultry...................................................................... 9
Livestock and Poultry Products...................................................... 10
Apiary Products.............................................................................. 11
5 Year Comparison of Acreage and Crop Value.............................. 12
Kings County’s Ten Leading Commodities .................................... 13
Sustainable Agriculture Report ..................................................... 14
Export Commodities ....................................................................... 16
Kings County’s Export Partners .................................................... 17
Certified Farmer’s Market ............................................................ 18
Land Use ........................................................................................ 19
Wine Tasting and Wine Pairings .................................................... 20
Kings County General Information ............................................... 22
Kings County Rainfall .................................................................... 23
Visit Our Web Site @ http://www.countyofkings.com
2
Table of Contents

Kings County Board of Supervisors
County Administrative Officer
Agricultural Commissioner/Sealer of Weights and MeasuresTim Niswander
Deputy Agricultural Commissioners/Sealers Ruben J. Arroyo Steve Schweizer Les Wright
Agricultural and Standards Inspectors
Agricultural Computer Systems Coordinator
Lynda Schrumpf
Agricultural and Standards Aides
Janet Eckles Roberta Spomer
Clerical
Diane O’Daniel
Tom Chambers Mario Gutierrez Stevie McNeill
Robbie Coelho Monty Hopper Rafael Perla
Bill DeRaad Daryl Jue Alfredo Prieto
Ron Evans Michael Leoni Robert Torrez
Vince Evans Brandi Martin Joan Vernon
Joe A. Neves .......... District I Jon N. Rachford .......... District II
Tony T. Oliveira ........ District III Tony Barba ................. District IV
Alene L. Taylor .......... District V
Larry Spikes
3
County AdministrationAg Commissioner - Sealer Personnel
Lynda Gabbard Amber Rambonga Linda Lavars
Carey Smith

Harvested Production ValueCrop Year Acreage Per Acre Total Unit Per Unit Total
4
Field CropsBeans, Dry a/ 2006 2,671 0.76 2,030 TON $598.00 $1,214,000
2005 2,267 1.58 3,582 TON $616.00 $2,207,000
Corn Silage 2006 66,875 26.04 1,741,425 TON $24.00 $41,794,000
2005 65,502 25.30 1,657,201 TON $27.30 $45,242,000
Cotton Acala-Lint b/ 2006 48,935 2.84 138,975 495 lbs $341.00 $47,390,000
2005 107,229 2.64 283,085 495 lbs $367.00 $103,892,000
Acala- Seed 2006 60,204 TON $189.00 $11,379,000
2005 122,553 TON $175.00 $21,447,000
Cotton Upland 2006 18,799 2.66 50,005 495 lbs $341.00 $17,052,000Non-Approved-Lint
2005 16,730 2.72 45,506 495 lbs $361.00 $16,428,000
Cotton Upland 2006 51,562 TON $189.00 $9,745,000Non-Approved-Seed
2005 46,904 TON $175.00 $8,208,000
Cotton Pima- Lint 2006 95,880 2.25 215,730 495 lbs $519.00 $111,964,000
2005 92,250 1.46 134,685 495 lbs. $591.00 $79,599,000
Pima- Seed 2006 93,258 TON $180.00 $16,786,000
2005 58,454 TON $140.00 $8,184,000
Cotton Pima 2006 1,906 2.32 4,422 495 lbs. $519.00 $2,295,000Non-Approved-Lint
2005 7,645 2.01 15,366 495 lbs. $615.00 $9,450,000
Cotton Pima 2006 4,556 TON $180.00 $820,000Non-Approved-Seed
2005 15,833 TON $140.00 $2,217,000
Hay Alfalfa 2006 69,806 6.72 469,096 TON $128.00 $60,044,000
2005 54,887 7.20 395,186 TON $137.00 $54,140,000
Hay, Oat b/ 2006 2,378 4.05 9,631 TON $80.00 $770,000
2005 6,695 2.58 17,273 TON $88.40 $1,527,000

Pasture Irrigated 2006 11,000 $135.00 $1,485,000
2005 11,000 $135.00 $1,485,000
Pasture Range 2006 189,237 $10.00 $1,892,000
2005 189,237 $10.00 $1,892,000
Alfalfa Stubble 2006 34,902 $20.00 $698,000
2005 35,420 $20.00 $708,000
Sorghum Silage 2006 3,901 14.20 55,394 TON $23.00 $1,274,000
2005 783 15.33 12,003 TON $21.10 $253,000
Sugar Beets 2006 1,654 32.65 54,003 TON $36.00 $1,944,000
2005 1,538 30.92 47,555 TON $35.00 $1,664,000
Wheat Grain 2006 56,527 2.00 113,054 TON $145.00 $16,393,000
2005 42,909 1.63 69,942 TON $128.00 $8,953,000
Wheat Silage 2006 38,318 14.72 564,041 TON $23.00 $12,973,000
2005 40,675 13.92 566,196 TON $22.30 $12,626,000
Others c/ 2006 52,700 $6,194,000
2005 35,564 $1,667,000
TOTAL 2006 695,489 $364,106,000
2005 710,331 $381,789,000
a/ all Dry Beans.b/ 495 lbs. = 1 balec/ Barley Grain, Barley Silage, Corn Grain, Forage, Safflower, Screenings, Sudan Hay, Sudan Silage, & WheatStraw.
Harvested Production ValueCrop Year Acreage Per Acre Total Unit Per Unit Total
5
“If people did not prefer reaping to sowing, there would not be a hungry person in the land”Author Unknown
Field Crops
6
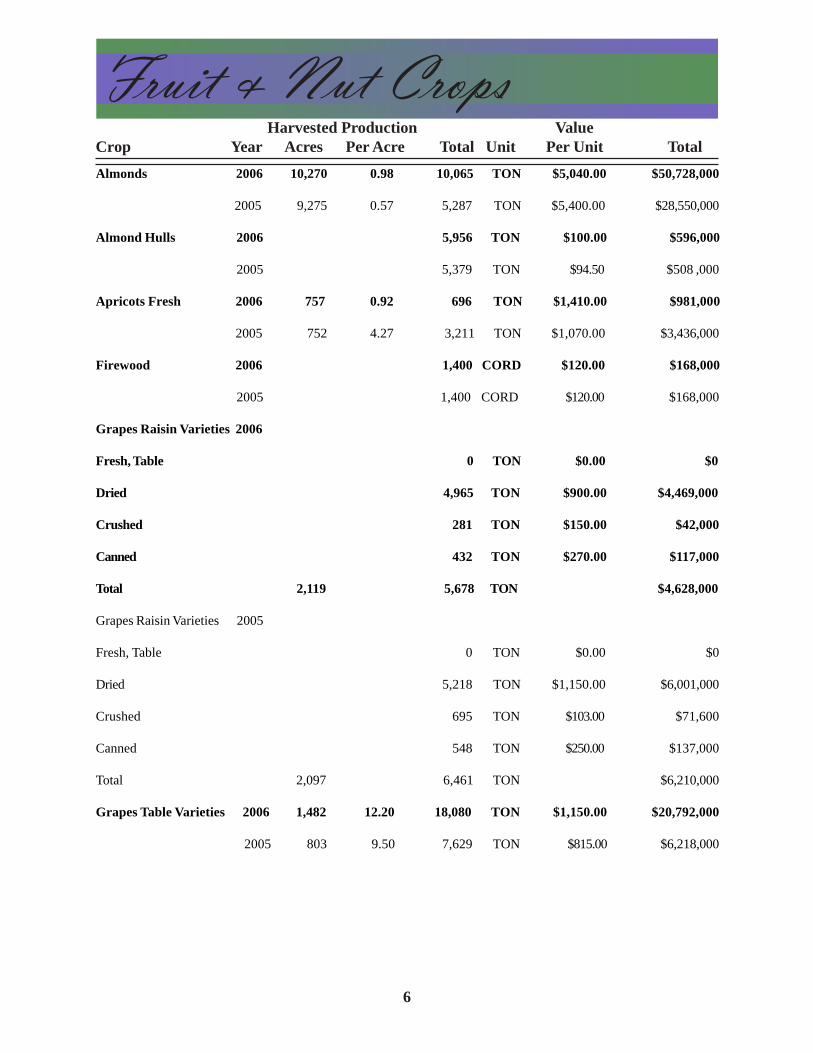
Harvested Production Value Crop Year Acres Per Acre Total Unit Per Unit Total
Fruit & Nut CropsAlmonds 2006 10,270 0.98 10,065 TON $5,040.00 $50,728,000
2005 9,275 0.57 5,287 TON $5,400.00 $28,550,000
Almond Hulls 2006 5,956 TON $100.00 $596,000
2005 5,379 TON $94.50 $508 ,000
Apricots Fresh 2006 757 0.92 696 TON $1,410.00 $981,000
2005 752 4.27 3,211 TON $1,070.00 $3,436,000
Firewood 2006 1,400 CORD $120.00 $168,000
2005 1,400 CORD $120.00 $168,000
Grapes Raisin Varieties 2006
Fresh, Table 0 TON $0.00 $0
Dried 4,965 TON $900.00 $4,469,000
Crushed 281 TON $150.00 $42,000
Canned 432 TON $270.00 $117,000
Total 2,119 5,678 TON $4,628,000
Grapes Raisin Varieties 2005
Fresh, Table 0 TON $0.00 $0
Dried 5,218 TON $1,150.00 $6,001,000
Crushed 695 TON $103.00 $71,600
Canned 548 TON $250.00 $137,000
Total 2,097 6,461 TON $6,210,000
Grapes Table Varieties 2006 1,482 12.20 18,080 TON $1,150.00 $20,792,000
2005 803 9.50 7,629 TON $815.00 $6,218,000

7
Harvested Production ValueCrop Year Acres Per Acre Total Unit Per Unit TotalWine Varieties Total 2006 3,358 11.64 39,087 TON $260.00 $10,163,000
2005 3,314 13.81 45,766 TON $241.00 $11,030,000
Grapes Total 2006 6,959 $35,583,000
2005 6,214 $23,458,000
Nectarine 2006 2,583 7.48 19,321 TON $910.00 $17,582,000
2005 2,518 8.34 21,000 TON $944.00 $19,824,000
Peaches Cling 2006 1,493 18.27 27,277 TON $270.00 $7,365,000
2005 1,600 15.44 24,704 TON $247.00 $6,102,000
Peaches Freestone 2006 3,863 9.28 35,849 TON $900.00 $32,264,000
2005 4,014 7.49 30,065 TON $918.00 $27,600,000
Peaches Freezer 2006 515 23.75 12,231 TON $240.00 $2,935,000
2005 536 18.86 10,109 TON $232.00 $2,345,000
Peaches Total 2006 5,871 $42,564,000
2005 6,150 $36,047,000
Pistachios 2006 10,013 0.99 9,913 TON $4,080.00 $40,445,000
2005 9,690 1.86 18,023 TON $4,680.00 $84,348,000
Plums 2006 2,022 7.49 15,145 TON $920.00 $13,933,000
2005 1,918 5.79 11,105 TON $917.00 $10,183,000
Walnuts 2006 8,741 1.93 16,870 TON $1,700.00 $28,679,000
2005 8,776 1.92 16,850 TON $1,600.00 $26,960,000
Others a/ 2006 6,222 $21,088,000
2005 3,908 $11,883,000
TOTAL 2006 53,438 $252,347,000 2005 49,201 $245,365,000
a/ Includes almond shells, apples, cherries, cherries brine, clemantines,kiwifruit, oranges, pecans, persimmons,pluots,pomegranates, quince, strawberries and tangerine.
Fruit & Nut Crops

Others a/ 2006 21,907 $12,962,000
2005 9,164 $8,340,000
TOTAL 2006 21,907 $12,962,000
2005 9,164 $8,340,000
a/ Alfalfa Certified, Aspargus,Cotton Certified, Endive, Leaf Lettuce, Head Lettuce, Onion, & Wheat Non-Certified.
Harvested Crop Year Acreage Total
8
Harvested Production Value Crop Year Acreage Per Acre Total Unit Per Unit Total
Seed Crops
Vegetable CropsGarlic Processed 2006 1,323 8.74 11563 TON 127.00 $ 1,469,000
2005 3,418 8.45 28882 TON 135.00 $ 3,899,000
Melons, All a/ 2006 672 13.35 8971 TON 250.00 $ 2,243,000
2005 935 13.41 12538 TON 337.00 $ 4,225,000
Tomatoes Processed 2006 21,064 29.47 620,756 TON 56.00 $ 34,762,000
2005 21,889 45.20 989,383 TON 50.00 $ 49,469,000
Other b/ 2006 6,616 $ 36,391,000
2005 5,352* $ 45,787,000
TOTAL 2006 29,675 $ 74,865,000
2005 31,594* $ 103,380,000
a/ Includes Cantaloupes and Specialty Melons b/ Asparagus, Broccoli, Broccoli Organic, Carrots, Cauliflower, Fresh Tomatoes, Peppers, Onions Processsed.* Revised

Cattle and Calves* 2006 212,505 1,593,830 Cwt. $89.49 $142,632,000
2005 207,056 1,552,961 Cwt. $114.81 $178,295,000
Sheep and Lambs 2006 10,003 11,160 Cwt. $101.68 $1,138,000
2005 10,196 11,994 Cwt. $110.42 $1,324,000
Turkeys 2006 1,893,510 45,519,980 lb. $0.38 $17,389,000
2005 2,570,806 62,889,373 lb. $0.35 $21,752,000
Others b/ 2006 $338,000
2005 $863,000
TOTAL 2006 $161,497,000
2005 $202,234,000
Livestock & Poultry
9
Inventories of January 1, 2006 January 1, 2005Item Number of Head Number of Head
Livestock & Poultry
Cattle and Calves
All 280,000 285,000Dairy Cows 2 Years and Over 166,000 156,000Cattle and Calves on Feed 6,000 8,000Other 142,000 147,000
Sheep and Lambs 10,003 10,196Goats 5,967 5,750Hogs and Pigs 1,357 1,845Turkeys 586,582 515,487Duck n/a 1,700
Number Total Value Item Year Of Head Liveweight Unit Per Unit Total
*Includes Breeding Stock Value in Total.a/ Includes chickens, goats, hogs and pigs.
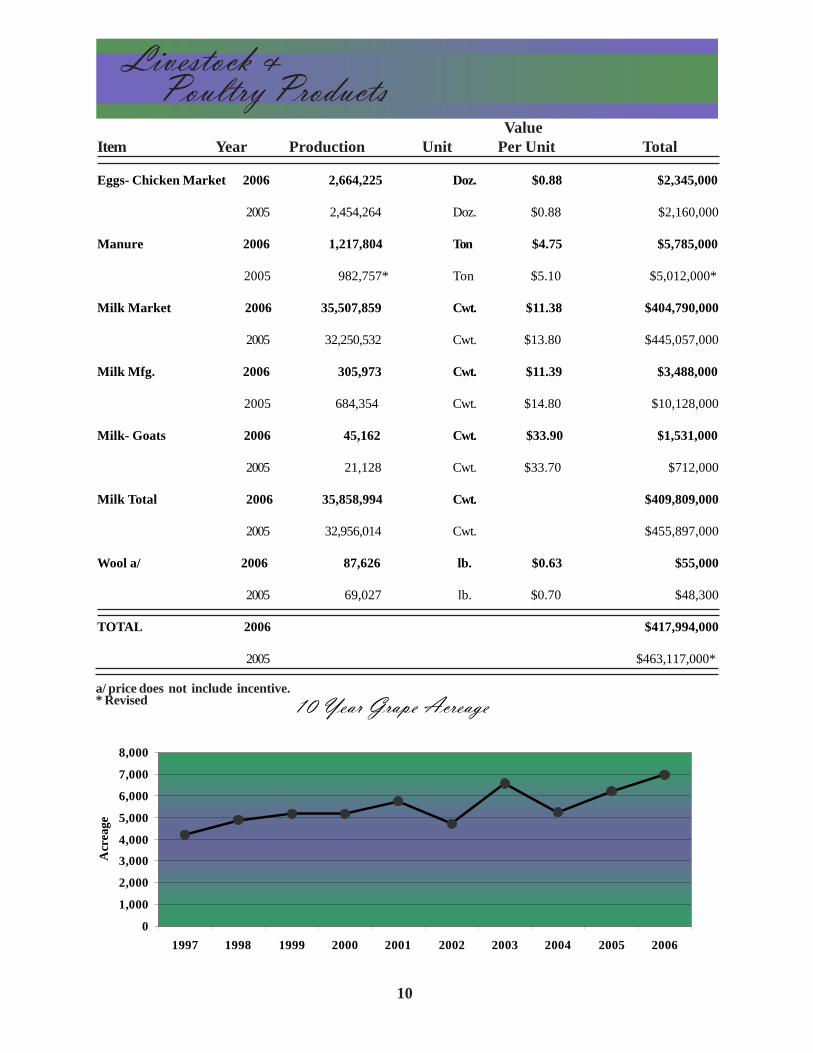
10 Year Grape Acreage
0
1,000
2,000
3,000
4,000
5,000
6,000
7,000
8,000
1997 1998 1999 2000 2001 2002 2003 2004 2005 2006
Acr
eage
Eggs- Chicken Market 2006 2,664,225 Doz. $0.88 $2,345,000
2005 2,454,264 Doz. $0.88 $2,160,000
Manure 2006 1,217,804 Ton $4.75 $5,785,000
2005 982,757* Ton $5.10 $5,012,000*
Milk Market 2006 35,507,859 Cwt. $11.38 $404,790,000
2005 32,250,532 Cwt. $13.80 $445,057,000
Milk Mfg. 2006 305,973 Cwt. $11.39 $3,488,000
2005 684,354 Cwt. $14.80 $10,128,000
Milk- Goats 2006 45,162 Cwt. $33.90 $1,531,000
2005 21,128 Cwt. $33.70 $712,000
Milk Total 2006 35,858,994 Cwt. $409,809,000
2005 32,956,014 Cwt. $455,897,000
Wool a/ 2006 87,626 lb. $0.63 $55,000
2005 69,027 lb. $0.70 $48,300
TOTAL 2006 $417,994,000
2005 $463,117,000*
10
Livestock &Poultry Products
Value Item Year Production Unit Per Unit Total
a/ price does not include incentive.* Revised

Honey 2006 908,503 lb. $0.83 $754,000
2005 502,690 lb. $0.71 $357,000
Beeswax 2006 14,797 lb. $1.95 $29,000
2005 36,830 lb. $1.12 $41,200
Seed Alfalfa 2006 16,743 Colonies $38.00 $636,000
2005 17,952 Colonies $35.30 $634,000
Tree Fruit a/ 2006 28,736 Colonies $137.00 $3,937,000
2005 26,353 Colonies $73.40 $1,934,000
Melons 2006 1,008 Colonies $55.00 $55,000
2005 935 Colonies $26.50 $24,800
Vegetable Seed 2006 155 Colonies $26.00 $4,000
2005 58 Colonies $45.00 $2,610
TOTAL 2006 $5,415,000
2005 $2,994,000
11
Apiary Products ValueItem Year Production Unit Per Unit Total
AgriculturalQuick Facts
Kings County is ranked 9th among California counties in agricultural production in. (2005)
Kings County is ranked 1st among California counties in the production of Cotton Seed. (2005)
Kings County is ranked 4th among California counties in the production of all field and seedproducts in 2005.
Kings County produces 8.5% of all Milk and Cream in the State. (2005)
The most prolific milk producing cow the world has ever known, No. 289, lived in this county for 19years and gave 54,070 gallons of milk - enough to fill more than eight 60-foot tanker trucks.
Total
a/ almonds, apricot, cherries, and plums.

$0$50
$100$150$200$250$300$350$400$450$500
Mill
ions
ApiaryProducts
SeedCrops
VegetableCrops
Fruit &Nut
Crops
Livestock& Poultry
FieldCrops
Livestock& PoultryProducts
2006
2005
12
2006 2005 2004 2003 2002
Apiary Products $5,415,000 $2,994,000 $2,518,000 $3,026,000 $2,531,000
Field Crops $364,106,000 $381,789,000 $379,551,000 $313,559,000 $326,741,000Acreage 695,489 710,331 699,129 722,423 687,894
Fruit and Nut Crop $252,347,000 $245,365,000 $172,792,000 $152,269, 000 $145,624,000Acreage 53,438 49,201 48,575 *44,094 42,970
Livestock and $161,497,000 $202,234,000 $173,532,000 $163,217,000 $104,201,000Poultry
Livestock and $417,994,000 * $463,117,000 $459,386,000 $331,393,000 $309,252,000Poultry Products
Seed Crops $12,962,000 $8,340,000 $7,112,000 $2,581,000 $5,617,000Acreage 21,907 9,164 6,694 5,213 6,572
Vegetable Crops $74,865,000 $103,380,000 $97,199,000 $170,921,000 $129,841,000Acreage 29,675 31,597 32,224 31,187 *24,296
TOTAL $1,289,186,000 *$1,407,219,000 $1,292,090,000 $1,136,966,000 $ 714,555,000
* Revised
5 Year Comparison OfAcreage & Crop Values
2006 and 2005Production Value Comparisons

Corn Silage4%
Peaches, Total4%
Almonds5%
Alfalfa6%
Cattle & Calves13%
Cotton, Total20%
Milk, Total38%
Grapes3%
Pistachios3%Tomatoes, Process
4%
13
2006 2005 2004Crop Rank Dollar Value Rank Rank
Milk, Total 1 $409,809,000 1 1Cotton, Total 2 $217,431,000 2 2Cattle and Calves 3 $142,632,000 3 3Alfalfa 4 $60,044,000 5 4Almonds, Total 5 $51,324,000 9 9Peaches, Total 6 $42,564,000 8 8Corn Silage 7 $41,794,000 7 6Pistachios 8 $40,445,000 4 7Grapes, Total 9 $35,583,000 11 11Tomatoes, Processed 10 $34,762,000 6 5
Kings County’s 10Leading Commodities
“Most Americans are two to four generations removed from the farm. The generalpublic has very little idea of what agriculture is about. Food is cheap and plentiful.Everyone takes it for granted.” Shawn S. Stevenson (local citrus grower)
Total $1,076,388,000
Top 10 Commodities

14
County Biological ControlPest Agent/Mechanism Scope of Program
Puncture Vine Stem Mining Weevil Tribulus terrestris Microlarinus lypriformi Generally Distributed
Seed Head Weevil Microlarinus lareynil Generally Distributed
Yellow Starthistle Seed Head Weevil Centaurea solstitialis Bangasternus orientalis 2 Sites Gall Fly Urophora sirunaseva 1 Sites
Hairy Weevil Eustenopus villosus 3 Sites
Ash Whitefly Parasitic Wasp Siphoninus phillyreae Encarsia parenorea Generally Distributed
Red Gum Lerp Psyllid Parasitic Wasp Glycaspis brimblecombei Psyllaephagus bliteus 1 Site
Silverleaf Whitefly Parasitic Wasp Bemisia argentifolii Eretmocerus sp.(M95104) 6 Sites Eretmocerus sp.(M95012) 6 Sites Eretmocerus mundus 6 SitesCounty Pest ExclusionPest Agent/Mechanism Scope of Program
European Corn Borer Railroad Corn Ostrinia nubilalis Shipments 80 Inspections
Gypsy Moth Household Goods 555 Inspections Lymantria dispar Shipments
Various Pests Truck Shipments 50,699 Inspections
Crops Activity Scope of Program
Export Commodities Origin Certification 1,178 issued
Export Seed Field Inspections 150 sites / 6,205 acres
Kings County SustainableAgricultural Report

County Pest EradicationPest Agent/Mechanism Scope of Program
Pink Bollworm Mechanical/Host 171,200 AcresPectinophora gossypiella Free Period
Alligatorweed Visual InspectionAlternanthera philoxeriodes Mechanical/Chemical 6 Sites Treated
County Pest Detection
Pest Number of Traps Type of Traps
Mediterranean Fruit Fly 263 Jackson TrapsMexican Fruit Fly 101 McPhail TrapsAll Pupose Fruit Fly 116 Champ TrapsOriental Fruit Fly 80 Jackson TrapsMelon Fly 80 Jackson TrapsGypsy Moth 80 Delta TrapsJapanese Beetle 80 Japanese Beetle TrapsEuropean Corn Borer 14 Pherocon 1 c TrapsEuropean Pine Shoot Moth 6 Pherocon II TrapsKhapra Beetle 229 Trogo TrapsApple Maggot 4 Adult Monitoring Traps
Total Traps 1,053
Jackson Trap
McPhail Trap
Japanese Beetle Trap
15
Kings County SustainableAgricultural Report

Commodities
Commodities Exported From Kings County
Export Trade Partnersof Kings County in 2006
To Learn More About Kings County Exports, Visit Our Web Site@ http://www.countyofkings.com
16
Alfalfa SeedAlmondsApplesAsparagus SeedBlueberriesCalcium SaltsCherriesCotton Lint
Cotton SeedGarlicGarlic SeedKiwifruitLettuceNectarinesOnionsOnion Seed
PeachesPistachiosPlumsPomegranatesTomatoesTomato PowderWatermelon
ArgentinaAustraliaBelgiumCanadaChileChinaColombiaCosta RicaDominican RepublicEcuadorEl SalvadorEnglandFiji
FranceGermanyGreeceGuatamalaHondurasHong KongItalyJapanKoreaLuxembourgMexicoMoroccoNetherlandsNew Zealand
PanamaPeoples’s Rep. of ChinaPeruPhilippinesPortugalRep. of KoreaSaipanSpainTaiwanUnited Arab EmiratesUnited KingdomVenezuelaVietnam
Export

“Up Up and Away!”at the
Kings Fair
801 S. 10th Ave. Hanford, CA 93230Phone (559) 584-3318
17
Expositions
Partners
Fairs &
United Kingdom5%
Rep. Of Korea4%
Australia4%
Spain5%
Mexico8%
Netherlands9%
Canada10%
Taiwan14%
People's Rep. Of China
3%
Japan38%
Top Ten Export Countries 2006
Export

Hanford Certified Farmer’s Market116 W. Seventh Street
Hanford, CA 93230Thursdays 5:30 P.M. to 8:30 P.M.May thru October - Irwin Street
18
Certified Farmer’s Market
AlmondsApplesApricotsApriumArtichokesAsian PearsAsparagusBasilBell PeppersBlackberriesBlueberriesCamelliasCantaloupesCherriesChestnutsCornCucumbersEggplantFigsFresh cut FlowersGarlic
GrapefruitGrapesHerbsHoneyIrisKiwifruitLemonsLimesMandarinMistletoeMixed MelonsMushroomsNectarinesOlivesOrangesOreganoLimesPeachesPeanutsPearsPecans
PeppersPersimmonsPistachiosPlumsPluotsPomegranatesPommelosQuinceRadishesRasberriesSatsumasSquashStrawberriesSweet CornTangerinesTayberrieTomatoesTsatzumasWalnutsWatermelon
Certified
“Millions have lived without love, none has lived without water” Turkish businessman 1988
Farmer’s Market

Prime Farmland
Farmland of Statewide Importance
Unique Farmland
Farmland of Local Importance
Grazing Land
Urban and Built-Up Land
Other Land
Water Area
Surrounding 2005 2005 Total County Top 2005 Acres orCounties Rank Gross Value* Area Acres Commodity Value No. of Head
Fresno 1 $4,640,166,000 3,840,000 Grapes $554,551,000 202,240
Tulare 2 $4,360,854,000 3,112,320 Milk $1,476,011,000 597,000
Kern 3 $3,546,925,000 5,166,720 Almonds $594,378,000 114,600
Monterey 4 $3,273,000,000 2,127,359 Lettuce $912,621,000 216,171
Kings 9 $1,407,091,000 890,545 Milk $455,897,000 285,000
19
Land Use
Kings CountyLand Use Summary
Total Acres
Land Use Category Acres Percent Acres Percent Change2002 2004 Acre
140,875
431,336
28,314
7,556
236,582
29,796
16,247
66
16
48
3
1
27
3
2
0
16
48
3
1
26
3
2
0
140,582
429,768
28,524
8,283
233,493
30,768
19,298
66
-293
-1,568
210
717
-3,089
972
3,051
0
890,782 890,782
From the California Department of Conservation
* Gross Value Does not include timber.
20
Wine TastingWINE TASTING TIPS
Wine tasting is not the same as drinking it. To experience the true flavor of a wine requires that you payattention to your senses of sight, smell, touch, as well as taste.
Sight: Look at the wine — in daylight if possible. The best way is to tilt the wine in the glass and look atit against a white background. What do you see? Is the wine clear or cloudy? The color will vary accord-ing to what wine it is. Red wines vary greatly in color — a Merlot, for example will usually be an intenseruby red while a Cabernet Sauvignon will be a darker, deeper red. As a red wine ages, you will see hintsof reddish-brown around the edges. White wines become more golden as they age.
Smell: Through our sense of smell, wine reveals its pleasures to us. To determine the aroma, swirl thewine vigorously in the glass. As the wine coats the sides of the glass, it releases its bouquet. The aromascan be quite different depending on how far into the glass your nose goes. At the top of the glass, theyare more floral and fruity; deeper in the glass, they are richer. Try to detect the full range of scents fromberry to floral to spicy to woody ... and so on. Consider intensity and appeal.
Touch: This does not mean you dip your finger into your wine glass! When tasting wines, the touch is thefeel of the wine on your tongue. Is it soft or brisk? Does it have a refreshing zing around the edges ofyour tongue? Or is it flat and flabby? Tannins (used in red wines to keep them from spoiling) will feel sortof prickly on your tongue. Younger red wines are usually more tannic. The ideal touch is a mellow soft-ness — a velvety feeling in your mouth.
Taste: This is the final step and should be taken only after you’ve used your other senses. When tasting awine, take a small amount in your mouth, swirl it around lightly so all your tastebuds are exposed, thenkeep it there for a brief period. Does the wine taste the same as its aroma? Is it sweet, acidic, crisp? Is itlight or full-bodied? At this point you can either spit it out (especially if you are tasting several wines) orsimply drink it, but be sure to experience the aftertaste (the finish). What is the memory of the wine onyour palate?
Courtesy of atime4wine.com

21
Wine Pairings
Thank You
Special thanks to the California Association of Winegrape Growersfor their photographs, information and cooperation.
1. Select light-bodied wines to pair with lighter food, and fuller-bodied wines to go withheartier, more flavorful dishes. Using salmon as an example the Pinot Noir works beautifully with thefish because you are matching light to light. Otherwise a full-bodied, heavier wine will overpower a light,delicate dish, and similarly, a lighter style wine will not even register on your personal flavor meter if yousip it with a hearty roast. You may as well drink water.
2. Consider how the food is prepared. Is it grilled, roasted, or fried, for instance, and what type ofsauce or spice is used? For example, chicken with a lemon butter sauce will call for a different moredelicate wine to play off the sauce than chicken cacciatore with all of the tomato and Italian spices, or agrilled chicken breast.
3. For every food action, there is a wine reaction. When you drink wine by itself it tastes one way,but when you take a bite of food, the wine tastes different. This is because wine is like a spice. Elementsin the wine interact with the food to provide a different taste sensation like these basic reactions:
Sweet Foods like Italian tomato sauce, Japanese teriyaki, and honey-mustard glazes make your wineseem drier than it really is so try an off-dry (slightly sweet) wine to balance the flavor (Chenin Blanc,White Zinfandel, Riesling).
High Acid Foods like salads with balsamic vinaigrette dressing, soy sauce, or fish served with asqueeze of lemon go well with wines higher in acid (Sauvignon Blanc, Pinot Grigio, Pinot Noir). WhiteZinfandel, although not as high in acid, can provide a nice contrast to high acid foods.
Bitter and Astringent Foods like a mixed green salad of bitter greens, Greek kalamata olives andcharbroiled meats accentuate a wine’s bitterness so complement it with a full-flavored forward fruitywine (Chardonnay, Cabernet Sauvignon, Merlot). Big tannic red wines (like many red Zinfandels, andShiraz or Syrah wines) will go best with your classic grilled steak or lamb chops, as the fat in the meatwill tone down the tannin (bitterness) in the wine.
Courtesy of wineanswers.com
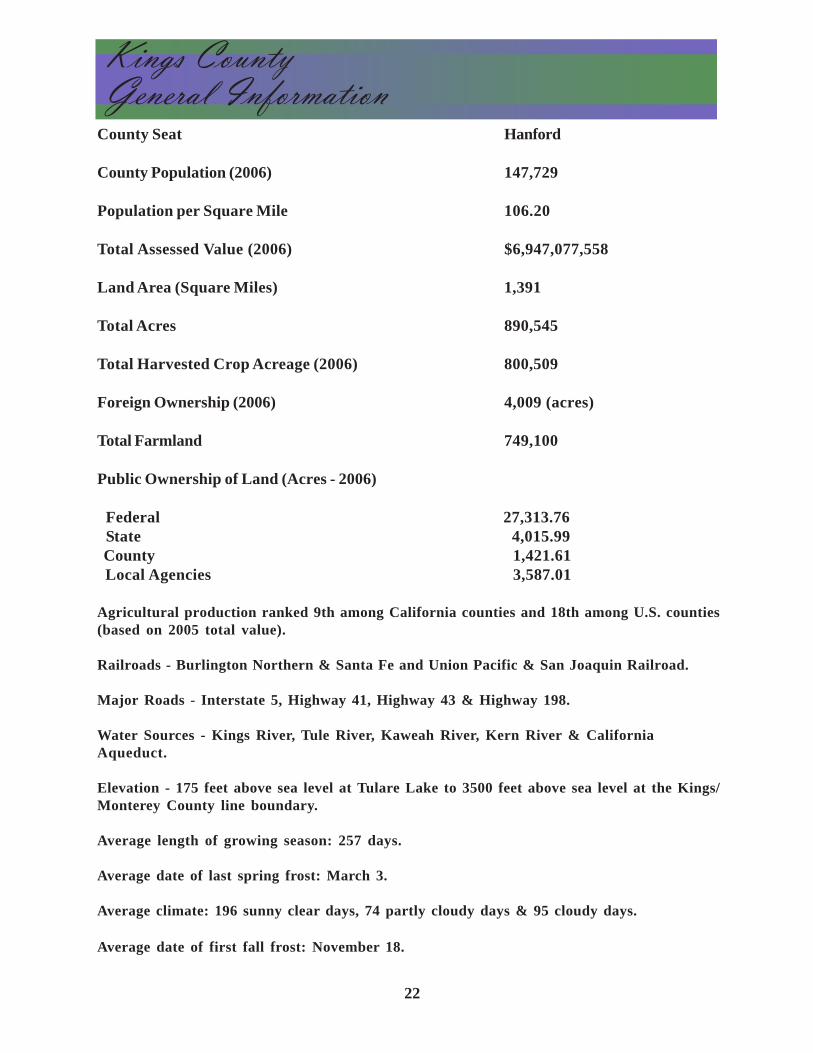
County Seat Hanford
County Population (2006) 147,729
Population per Square Mile 106.20
Total Assessed Value (2006) $6,947,077,558
Land Area (Square Miles) 1,391
Total Acres 890,545
Total Harvested Crop Acreage (2006) 800,509
Foreign Ownership (2006) 4,009 (acres)
Total Farmland 749,100
Public Ownership of Land (Acres - 2006)
Federal 27,313.76 State 4,015.99 County 1,421.61 Local Agencies 3,587.01
Agricultural production ranked 9th among California counties and 18th among U.S. counties(based on 2005 total value).
Railroads - Burlington Northern & Santa Fe and Union Pacific & San Joaquin Railroad.
Major Roads - Interstate 5, Highway 41, Highway 43 & Highway 198.
Water Sources - Kings River, Tule River, Kaweah River, Kern River & CaliforniaAqueduct.
Elevation - 175 feet above sea level at Tulare Lake to 3500 feet above sea level at the Kings/Monterey County line boundary.
Average length of growing season: 257 days.
Average date of last spring frost: March 3.
Average climate: 196 sunny clear days, 74 partly cloudy days & 95 cloudy days.
Average date of first fall frost: November 18.
22
Kings CountyGeneral Information

YEAR JUNE JULY AUG. SEPT. OCT. NOV. DEC. JAN. FEB. MAR. APR. MAY TOTAL 1957-58 0.00 0.00 0.00 0.00 0.20 1.19 1.41 1.85 2.30 3.93 2.38 0.24 13.50 1958-59 0.00 0.00 0.11 0.11 0.00 0.23 0.16 1.35 1.90 0.11 0.52 0.00 4.49 1959-60 0.00 0.00 0.00 0.11 0.00 0.00 0.17 0.80 1.71 0.61 0.57 0.00 3.97 1960-61 0.00 0.02 0.00 0.53 0.00 2.61 0.03 1.34 0.22 0.67 0.22 0.37 6.01 1961-62 0.00 0.00 0.00 0.00 0.00 1.11 1.28 0.71 4.88 1.06 0.00 0.11 9.15 1962-63 0.00 0.00 0.00 0.01 0.10 0.00 0.19 1.19 1.68 1.37 2.88 0.56 7.98 1963-64 0.17 0.00 0.00 0.33 0.75 1.23 0.31 0.61 0.02 0.94 0.64 0.20 5.20 1964-65 0.00 0.00 0.34 0.00 0.95 1.31 1.44 1.18 0.33 0.33 1.57 0.00 7.45 1965-66 0.00 0.00 0.05 0.07 0.05 2.15 1.97 0.63 0.71 0.10 0.00 0.07 5.80 1966-67 0.06 0.04 0.00 0.29 0.09 1.28 2.57 1.41 0.05 2.42 2.95 0.07 11.23 1967-68 0.23 0.00 0.00 0.31 0.00 1.99 0.50 0.62 0.64 1.00 0.50 0.08 5.87 1968-69 0.00 0.00 0.00 0.00 1.33 0.98 1.64 6.69 4.54 0.79 0.85 0.32 17.14 1969-70 0.21 0.07 0.00 0.15 0.05 0.51 0.70 1.60 1.33 1.42 0.14 0.00 6.18 1970-71 0.00 0.00 0.00 0.00 0.00 2.40 1.23 0.35 0.19 0.23 0.40 1.44 6.24 1971-72 0.00 0.00 0.00 0.04 0.06 0.41 1.87 0.04 0.35 0.00 0.23 0.00 3.00 1972-73 0.00 0.00 0.00 0.24 0.21 2.90 0.65 2.44 2.29 2.20 0.12 0.00 11.05 1973-74 0.00 0.00 0.00 0.00 0.76 0.46 0.94 2.97 0.13 1.75 0.03 0.00 7.04 1974-75 0.00 0.00 0.00 0.00 0.65 0.24 1.40 0.09 2.26 1.24 0.49 0.00 6.37 1975-76 0.00 0.00 0.00 0.98 0.76 0.05 0.22 0.00 2.94 0.19 1.47 0.03 6.64 1976-77 0.01 0.00 0.22 1.47 0.00 1.15 0.96 0.96 0.03 0.43 0.00 0.01 5.24 1977-78 0.07 0.00 0.00 0.00 0.05 0.06 2.85 2.22 5.05 4.12 1.71 0.00 16.13 1978-79 0.00 0.00 0.00 1.10 0.00 0.79 0.50 1.84 1.61 1.16 0.03 0.00 7.03 1979-80 0.00 0.04 0.00 0.08 0.41 0.62 0.41 2.90 2.71 1.28 0.05 0.04 8.54 1980-81 0.00 0.00 0.00 0.00 0.09 0.00 0.21 1.80 0.86 2.10 0.68 0.17 5.91 1981-82 0.00 0.00 0.00 0.00 0.76 1.08 0.29 0.84 0.33 3.52 1.75 0.00 8.57 1982-83 0.45 0.18 0.00 0.64 1.03 2.15 0.71 3.74 2.59 3.39 1.63 0.04 16.55 1983-84 0.00 0.00 0.05 0.82 0.43 1.66 1.22 0.01 0.42 0.27 0.18 0.00 5.06 1984-85 0.00 0.00 0.00 0.01 0.52 1.41 1.66 0.59 0.61 0.68 0.12 0.01 5.61 1985-86 0.00 0.05 0.00 0.00 0.54 2.11 0.56 1.46 2.60 3.40 0.45 0.00 11.17 1986-87 0.00 0.00 0.00 0.15 0.00 0.21 0.77 1.77 2.04 2.02 0.06 0.13 7.15 1987-88 0.05 0.00 0.00 0.00 0.86 0.72 1.74 1.37 0.40 0.93 2.65 0.07 8.79 1988-89 0.06 0.00 0.00 0.00 0.00 1.33 2.29 1.02 2.03 0.85 0.02 0.39 7.99 1989-90 0.00 0.00 0.00 0.67 0.32 0.20 0.53 1.79 1.02 0.30 0.97 0.87 6.67 1990-91 0.00 0.00 0.66 0.00 0.01 0.22 0.09 0.37 1.32 6.67 0.19 0.66 10.19 1991-92 0.36 0.00 0.00 0.11 0.38 0.14 1.32 1.40 3.32 0.85 0.10 0.00 7.98 1992-93 0.00 0.01 0.00 0.00 0.58 0.00 2.62 3.88 2.48 2.16 0.07 0.08 11.88 1993-94 0.26 0.00 0.00 0.24 0.24 0.68 0.66 1.45 1.02 0.70 0.69 0.00 5.94 1994-95 0.00 0.00 0.00 1.06 0.35 1.54 0.33 4.70 0.51 4.77 0.65 0.87 14.78 1995-96 0.00 0.00 0.00 0.00 0.00 0.00 1.59 1.79 2.55 2.15 0.89 0.16 9.13 1996-97 0.04 0.00 0.00 0.00 1.65 0.87 3.03 3.02 0.12 0.21 0.00 0.00 8.94 1997-98 0.00 0.00 0.00 0.06 0.09 1.96 1.80 2.00 4.05 2.60 1.68 1.31 15.55 1998-99 0.44 0.00 0.00 0.00 0.68 0.63 0.64 3.01 0.56 0.43 1.37 0.00 7.76 1999-00 0.00 0.00 0.00 0.00 0.15 0.00 0.00 1.08 3.28 1.59 0.97 0.48 7.55 2000-01 0.35 0.00 0.00 0.03 1.31 0.00 0.03 1.98 1.48 1.24 1.12 0.00 7.54 2001-02 0.00 0.09 0.00 0.00 0.18 1.84 1.99 0.87 0.31 1.04 0.03 0.01 6.36 2002-03 0.82 0.00 0.00 0.00 0.00 1.42 1.14 0.25 1.13 1.05 1.67 0.67 8.15 2003-04 0.00 0.00 0.00 0.00 0.07 0.47 2.05 0.97 2.32 0.25 0.01 0.02 6.16 2004-05 0.00 0.00 0.00 0.00 2.09 0.44 2.13 2.55 1.69 2.02 0.70 0.84 12.46 2005-06 0.00 0.00 0.00 0.02 0.01 0.21 1.15 3.07 0.48 2.60 2.98 0.54 11.06 2006-07 0.00 0.00 0.00 0.00 0.09 0.16 0.90
AVERAGE 0.07 0.01 0.03 0.19 0.38 0.90 1.10 1.61 1.55 1.50 0.79 0.22 8.32
Rainfall - Hanford, CA
23 50 YEAR AVERAGE RAINFALL