“the herzliya indices” יירות... · israel data updated for 200 8 countries` data updated...
TRANSCRIPT

Prof .Rafi Melnick - IDC HerzliyaFebruary 2010 1
Herzliya Conference 2010
“The Herzliya Indices”
National Security BalanceThe Civilian Quantitative
Dimension

Prof .Rafi Melnick - IDC HerzliyaFebruary 2010 2
Team MembersMs. Leah Achdut – The Ruppin Academic Center; Van Leer
Jerusalem Institute
Dr. Michel Strawczynski – Bank of Israel
Mr. Tommy Steiner – IDC Herzliya
Dr. Zalman Shiffer – Economic Advisor
Team LeaderProf. Rafi Melnick - IDC Herzliya
With thanks to Gila Weinberger (Bank of Israel), and Gilad Skutelsky (IDC Herzliya) for their assistance with research.
Herzliya Indices Team

Prof .Rafi Melnick - IDC HerzliyaFebruary 2010 3
45
47
49
51
53
55
57
1990
1991
1992
1993
1994
1995
1996
1997
1998
1999
2000
2001
2002
2003
2004
2005
2006
2007
2008
2009
Development of theEconomic Dimension in Israel
1990- 2009

Prof .Rafi Melnick - IDC HerzliyaFebruary 2010 4
94
95
96
1990
1991
1992
1993
1994
1995
1996
1997
1998
1999
2000
2001
2002
2003
2004
2005
2006
2007
2008
Development of theSocial Dimension in Israel
1990- 2008

Prof .Rafi Melnick - IDC HerzliyaFebruary 2010 5
65
70
75
1996
1997
1998
1999
2000
2001
2002
2003
2004
2005
2006
2007
2008
Development of theGovernmental/ Political Dimension
in Israel 1996- 2008

Prof .Rafi Melnick - IDC HerzliyaFebruary 2010 6
Dimensions of National Security
National Security
CivilianDimension
MilitaryDimension
SocialEconomic Governmental/Political

Prof .Rafi Melnick - IDC HerzliyaFebruary 2010 7
Multiple Indicators Approach
National SecurityUnobservable Latent Variable
Indicator N Observable
Indicator II Observable
Indicator I Observable
...
• N indicators are measurable; they affect and are affected by national security, which is an unobservable latent variable.• The presence of multiple indicators allows (under defined assumptions) one to quantify national security.• A rise in each indicator means improvement in national security, in the corresponding dimension.

Prof .Rafi Melnick - IDC HerzliyaFebruary 2010 8
Components of theEconomic Indicator(relative weight in parenthesis)
1. GDP Per Capita, PPP (16%)
2. GDP, PPP (15%)
3. Unemployment (15%)
4. High-Technology Exports – % of Manufactured Exports ( 11%)
5. General Government Gross Financial Liabilities (11%)
6. Inflation Rate (11%)
7. Current Account Balance (11%)
8. Foreign Currency Reserves (10%)

Prof .Rafi Melnick - IDC HerzliyaFebruary 2010 9
1. Poverty Incidence (14%) *
2. Gini Inequality Coefficient (12%) **
3. Human Development Index – Education (11%)
4. Chronic Unemployment (10%)
5. Human Development Index – Life Expectancy (10%)
6. Rate of Participation in Labor Force – Men (10%)
7. Rate of Participation in Labor Force – Women (10%)
8. Human Development Index – GDP (9%)
9. Population Aged 65+ (7%)
10. Population Aged 15- (7%)
Components of theSocial Indicator(relative weight in parenthesis)

Prof .Rafi Melnick - IDC HerzliyaFebruary 2010 10
Components of theSocial Indicator(notes)
* Gini data :Israel data updated for 200 8
Countries` data updated for mid 2000’s except: Austr ia, Belgium, Egypt, Greece, France, Hungary, Ireland, Italy, Poland , Portugal, Spain, Switzerland (updated for early 2000’s) ; Czech Republic (updated for mid 1990’s) ;
Syria- No data.
** Poverty data :Israel data updated for 200 8
Countries` data updated for mid 2000’s except: Austri a, Greece, Hungary, Iran, Ireland, Jordan, Netherlands (updated fo r early 2000’s); Czech Republic (updated for mid 1990’s)

Prof .Rafi Melnick - IDC HerzliyaFebruary 2010 11
1. Political Stability and the Absence of Violence ( 11%)
2. Rule of Law (11%)
3. Democracy (10%)
4. Political Rights (9%)
5. Civil Liberties (9%)
6. Control of Corruption (8%)
7. Quality of Regulation (8%)
8. Efficiency of Government (8%)
9. Voice and Accountability (8%)
10. Alliances (6%)
11. Membership in International Organizations (6%)
12. Hosted Embassies (6%)
Components of the Governmental/ Political Indicator(relative weight in parenthesis)

Prof .Rafi Melnick - IDC HerzliyaFebruary 2010 12
The Model
• Construction of a panel data set of 31 countries
• The model includes:– Israel
– 26 OECD countries– 4 regional countries: Egypt, Iran, Jordan, and
Syria
• Data ranges from 1990 through 2008• Economic data is through 2009

Prof .Rafi Melnick - IDC HerzliyaFebruary 2010 13
Economic Data SourcesPrimary Sources• World Bank• IMF – World Economic Outlook• OECD Economic Outlook• Israel’s Central Bureau of Statistics
Secondary Sources• IFS – International Financial Statistics (IMF)• Economist Intelligence Unit-Iran• Bank of Israel and various central banks• Other sources

Prof .Rafi Melnick - IDC HerzliyaFebruary 2010 14
Social Data Sources
Primary Sources• OECD • Luxembourg Income Study• ILO – Key Indicators of the Labour Market• Israel’s Central Bureau of Statistics • UN Human Development ReportsSecondary Sources• OECD, Labor Market Statistics Data LFS by sex• CIA• National Tobacco Information Online System• Statistical, Economic and Social Research and Training Center
for Islamic Countries• World Bank• Eurostat Data, Indicators of the 20 New Cronos

Prof .Rafi Melnick - IDC HerzliyaFebruary 2010 15
Primary Sources• World Bank• Freedom House • Polity IV Project• A.T. Kearny - Foreign Policy Magazine • Europe World online• Treaties and Alliances of the World
Governmental/Political Data Sources

Prof .Rafi Melnick - IDC HerzliyaFebruary 2010 16
Methodology
• A preliminary base is calibrated for each dimension• Each variable is measured in percentage change or
percentage difference in the case that its basic measurement is in percents
• An annual weighted average is calculated using the weights obtained from a panel of experts
• The indices are formed, over time, by cumulating annual weighted averages
Prof .Rafi Melnick - IDC HerzliyaFebruary 2010 17
Herzliya Indices 2010Results

Prof .Rafi Melnick - IDC HerzliyaFebruary 2010 18
0
20
40
60
80
100
120Jo
rdan
Syr
ia
Iran
Pol
and
Tur
key
Cze
ch R
ep
Egy
pt
Hun
gary
Gre
ece
Isra
el
Por
tuga
l
lrela
nd
Kor
ea,
Rep
New
Zea
land
Spa
in
Sw
eden
Aus
tralia
Fin
land
Den
mar
k
Bel
gium
Aus
tria
Net
herla
nds
Can
ada
ltaly
Nor
way U
K
Sw
itzer
land
Fra
nce
Ger
man
y
Japa
n
US
A
Economic Base | 1990

Prof .Rafi Melnick - IDC HerzliyaFebruary 2010 19
0
20
40
60
80
100
120S
yria
Jord
an Iran
Cze
ch R
ep
Pol
and
Tur
key
Hun
gary
Egy
pt
Por
tuga
l
Gre
ece
Isra
el
New
Zea
land
lrela
nd
Spa
in
Sw
eden
Fin
land
Kor
ea,
Rep
Den
mar
k
Bel
gium
Aus
tria
Aus
tralia ltaly
Can
ada
Net
herla
nds UK
Fra
nce
Nor
way
Sw
itzer
land
Ger
man
y
Japa
n
US
A
Economic Base | 2009

Prof .Rafi Melnick - IDC HerzliyaFebruary 2010 20
Development of the Economic Dimension Israel and the Developed Countries
45
50
55
60
65
70
75
80
1990
1991
1992
1993
1994
1995
1996
1997
1998
1999
2000
2001
2002
2003
2004
2005
2006
2007
2008
2009
Israel G7 Euroland OECD

Economic Dimension GapIsrael and the Developed Countries
-25
-20
-15
-10
-5
0
1990
1991
1992
1993
1994
1995
1996
1997
1998
1999
2000
2001
2002
2003
2004
2005
2006
2007
2008
2009
G7-Israel Euroland-Israel OECD-Israel
February 2010 Prof .Rafi Melnick - IDC Herzliya21

Prof .Rafi Melnick - IDC HerzliyaFebruary 2010 22
25
30
35
40
45
50
55
60
1990
1991
1992
1993
1994
1995
1996
1997
1998
1999
2000
2001
2002
2003
2004
2005
2006
2007
2008
2009
Israel Iran Jordan Egypt Syria
Development of the Economic Dimension
Israel and Regional Countries

0
5
10
15
20
25
30
1990
1991
1992
1993
1994
1995
1996
1997
1998
1999
2000
2001
2002
2003
2004
2005
2006
2007
2008
2009
2009
Israel-Iran Israel-Jordan Israel-Egypt Israel-Syria
Economic Dimension GapIsrael and Regional Countries
February 2010 Prof .Rafi Melnick - IDC Herzliya23

Prof .Rafi Melnick - IDC HerzliyaFebruary 2010 24
-5
-4
-3
-2
-1
0
1
2lre
land
Japa
n
Spa
in UK
Can
ada
Den
mar
k
US
A
Net
herla
nds
ltaly
Sw
eden
Fra
nce
Hun
gary
Fin
land
Ger
man
y
Por
tuga
l
New
Zea
land
Bel
gium
Tur
key
Aus
tria
Kor
ea,
Rep
Nor
way
Cze
ch R
ep
Gre
ece
Sw
itzer
land
Aus
tralia
Syr
ia
Pol
and
Egy
pt
Jord
an
Isra
el
Iran
Economic Change (percent) | 2007-2009

Prof .Rafi Melnick - IDC HerzliyaFebruary 2010 25
Economic Index 200917
18
19
20
21
22
23
24
25
26
27
28
29
30
31
1
2
3
4
5
6
7
8
9
10
11
12
13
14
15
16
USA 102.9
Japan 72.0
Germany 68.8
Switzerland 65.3
Norway 65.0
France 64.2
UK 63.6
Netherlands 63.3
Canada 63.2
ltaly 61.7
Australia 61.1
Austria 60.6
Belgium 60.5
Denmark 60.1
Korea, Rep 58.9
Finland 58.7
Sweden 58.7
Spain 57.4
lreland 56.5
New Zealand 56.5
Israel 56.0
Greece 51.7
Portugal 50.6
Egypt 48.1
Hungary 47.6
Turkey 44.2
Poland 43.3
Czech Rep 41.7
Iran 38.2
Jordan 31.1
Syria 30.3

Prof .Rafi Melnick - IDC HerzliyaFebruary 2010 26
0
20
40
60
80
100
120S
yria
Iran
Egy
pt
Jord
an
Turk
ey
Gre
ece
Kor
ea, R
ep
lrel
and
Spa
in
Por
tuga
l
ltaly
Isra
el
Pol
and
New
Zea
land
Bel
gium U
K
Japa
n
Fran
ce
Hun
gary
Net
herl
ands
US
A
Ger
man
y
Aus
tral
ia
Aus
tria
Cze
ch R
ep
Sw
itzer
land
Can
ada
Nor
way
Den
mar
k
Sw
eden
Finl
and
Social Base | 1990

Prof .Rafi Melnick - IDC HerzliyaFebruary 2010 27
0
20
40
60
80
100
120S
yria
Egy
pt
Iran
Jord
an
Tur
key
Gre
ece
Kor
ea,
Rep ltaly
Por
tuga
l
Isra
el
Pol
and
Spa
in
lrela
nd
Bel
gium
New
Zea
land
Japa
n UK
Hun
gary
Ger
man
y
Cze
ch R
ep
US
A
Fra
nce
Aus
tria
Aus
tralia
Sw
itzer
land
Net
herla
nds
Fin
land
Can
ada
Sw
eden
Nor
way
Den
mar
k
Social Base | 2008

Prof .Rafi Melnick - IDC HerzliyaFebruary 2010 28
90
92
94
96
98
100
102
1990
1991
1992
1993
1994
1995
1996
1997
1998
1999
2000
2001
2002
2003
2004
2005
2006
2007
2008
Israel G7 Euroland OECD
Development of the Social Dimension
Israel and the Developed Countries

Prof .Rafi Melnick - IDC HerzliyaFebruary 2010 29
65
70
75
80
85
90
95
100
1990
1991
1992
1993
1994
1995
1996
1997
1998
1999
2000
2001
2002
2003
2004
2005
2006
2007
2008
Israel Egypt Iran Jordan Syria
Development of the Social Dimension
Israel and Regional Countries

Prof .Rafi Melnick - IDC HerzliyaFebruary 2010 30
-0.2
0
0.2
0.4
0.6
0.8
1
1.2
1.4
US
A
Japa
n
Iran
ltaly
Finl
and
UK
Den
mar
k
Por
tuga
l
Can
ada
Hun
gary
Egy
pt
Sw
itzer
land
Fran
ce
Turk
ey
Cze
ch R
ep
Bel
gium
Gre
ece
Kor
ea, R
ep
Aus
tral
ia
Net
herl
ands
Sw
eden
Nor
way
New
Zea
land
Ger
man
y
lrel
and
Aus
tria
Isra
el
Jord
an
Spa
in
Pol
and
Syr
ia
Social Change | 2004-2008

Prof .Rafi Melnick - IDC HerzliyaFebruary 2010 31
Social Index 2008
17
18
19
20
21
22
23
24
25
26
27
28
29
30
31
1
2
3
4
5
6
7
8
9
10
11
12
13
14
15
16
Denmark 106.2
Norway 104.9
Sweden 104.7
Canada 103.4
Finland 103.3
Netherlands 102.3
Switzerland 102.1
Australia 101.8
Austria 101.6
France 100.5
USA 99.8
Czech Rep 99.8
Germany 99.7
Hungary 99.4
UK 98.9
Japan 98.6
New Zealand 97.8
Belgium 97.6
lreland 97.0
Spain 96.0
Poland 95.7
Israel 95.7
Portugal 95.2
ltaly 94.8
Korea, Rep 93.8
Greece 93.4
Turkey 85.2
Jordan 79.8
Iran 75.7
Egypt 75.1
Syria 73.8
Prof .Rafi Melnick - IDC HerzliyaFebruary 2010 32
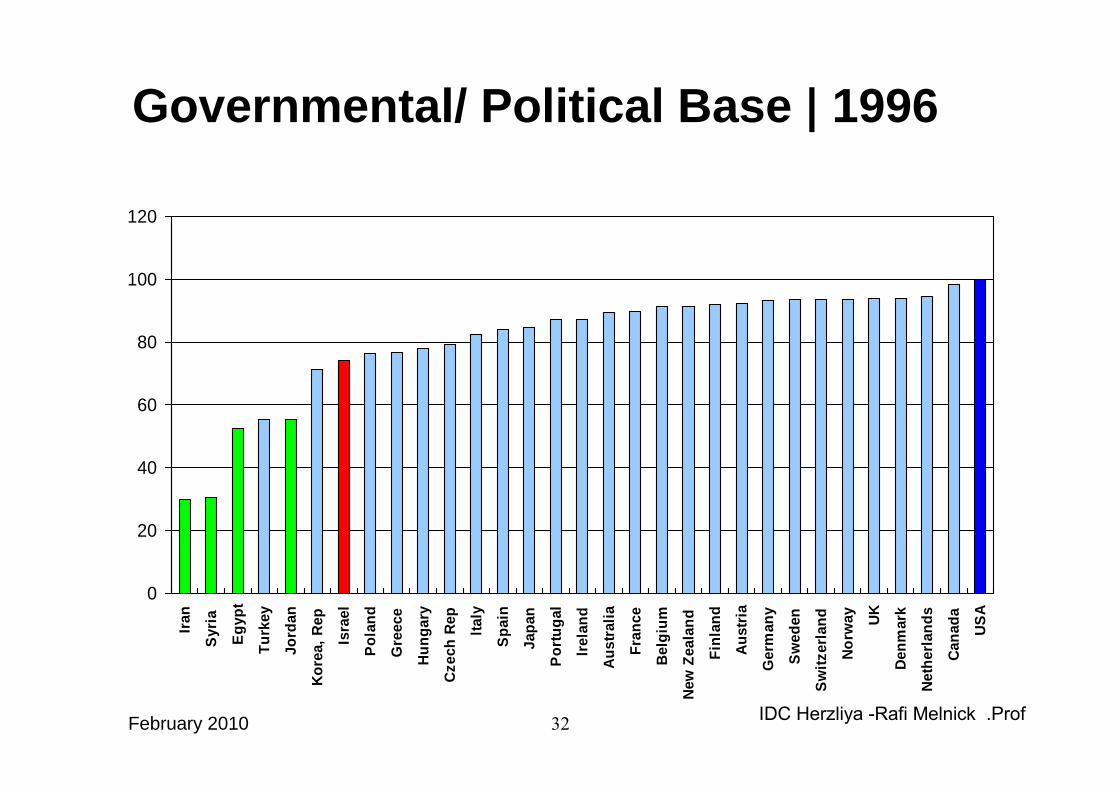
0
20
40
60
80
100
120
Iran
Syr
ia
Egy
pt
Tur
key
Jord
an
Kor
ea,
Rep
Isra
el
Pol
and
Gre
ece
Hun
gary
Cze
ch R
ep
ltaly
Spa
in
Japa
n
Por
tuga
l
lrela
nd
Aus
tralia
Fra
nce
Bel
gium
New
Zea
land
Fin
land
Aus
tria
Ger
man
y
Sw
eden
Sw
itzer
land
Nor
way U
K
Den
mar
k
Net
herla
nds
Can
ada
US
A
Governmental/ Political Base | 1996

Prof .Rafi Melnick - IDC HerzliyaFebruary 2010 33
0
20
40
60
80
100
120
Syr
ia
Iran
Egy
pt
Jord
an
Tur
key
Isra
el
Kor
ea,
Rep
Gre
ece
Pol
and
Hun
gary
ltaly
Cze
ch R
ep
Spa
in
Japa
n
Por
tuga
l
lrela
nd
New
Zea
land
Fra
nce
Bel
gium
Aus
tralia
Fin
land
Aus
tria
Sw
itzer
land
Sw
eden U
K
Nor
way
Ger
man
y
Den
mar
k
Net
herla
nds
US
A
Can
ada
Governmental/ Political Base | 2008

Prof .Rafi Melnick - IDC HerzliyaFebruary 2010 34
65
70
75
80
85
90
95
1996
1997
1998
1999
2000
2001
2002
2003
2004
2005
2006
2007
2008
Israel G7 Euroland OECD
Development of theGovernmental/ Political Dimension
Israel and the Developed Countries

Prof .Rafi Melnick - IDC HerzliyaFebruary 2010 35
25
35
45
55
65
75
85
1996
1997
1998
1999
2000
2001
2002
2003
2004
2005
2006
2007
2008
Israel Egypt Iran Jordan Syria
Development of theGovernmental/ Political Dimension
Israel and Regional Countries

Prof .Rafi Melnick - IDC HerzliyaFebruary 2010 36
-1
-0.5
0
0.5
1
1.5
2
Fin
land
Bel
gium
Kor
ea,
Rep
New
Zea
land
Sw
itzer
land
Sw
eden
Jord
an
Den
mar
k
ltaly
Gre
ece UK
Nor
way
Aus
tria
Ger
man
y
Egy
pt
Net
herla
nds
lrela
nd
Syr
ia
Can
ada
Iran
Tur
key
Japa
n
Isra
el
Spa
in
Hun
gary
Aus
tralia
Cze
ch R
ep
Fra
nce
Por
tuga
l
US
A
Pol
and
Political Change | Marginal 2008

Prof .Rafi Melnick - IDC HerzliyaFebruary 2010 37
Governmental/ Political Index 20081
2
3
4
5
6
7
8
9
10
11
12
13
14
15
16
17
18
19
20
21
22
23
24
25
26
27
28
29
30
31
Canada 101.0
USA 99.8
Netherlands 96.3
Denmark 96.0
Germany 95.5
Norway 94.7
UK 94.6
Sweden 94.4
Switzerland 93.8
Austria 93.7
Finland 93.0
Australia 92.2
Belgium 91.8
France 91.7
New Zealand 90.7
lreland 89.8
Portugal 88.1
Japan 87.1
Spain 85.6
Czech Rep 82.1
ltaly 82.0
Hungary 81.7
Poland 80.1
Greece 78.2
Korea, Rep 74.9
Israel 72.8
Turkey 60.6
Jordan 55.4
Egypt 51.2
Iran 30.7
Syria 30.5

Prof .Rafi Melnick - IDC HerzliyaFebruary 2010 38
SummaryIsrael During the World Financial Crisis
0
1
2
3
2007-2008 2007-2009
The Herzliya Indices: Period of World Financial Crisis
Economic Social Political
• The Herzliya Indices provide a quantification of the relative positive development of the national security indices, in all the dimensions, during the world financial crisis.
• The rise of the Economic Dimension in 2008 and 2009, in the background of a general decline in the developed world, is due to a combination of a healthy period of growth, that preceded the world crisis, and appropriate macroeconomic policies implemented during the crisis. Israel succeeded in closing the gap with the developed countries.

Prof .Rafi Melnick - IDC HerzliyaFebruary 2010 39
SummaryIsrael During the World Financial Crisis
0
1
2
3
2007-2008 2007-2009
The Herzliya Indices: Period of World Financial Crisis
Economic Social Political
• After a prolonged period of deterioration and stagnation in the Social Dimension of national security in 2008 we report a marginal improvement. This is due to a significant rise in the labor force participation of woman and men and in the decline in the rate of the chronic unemployed. In the most important components, the incidence of poverty and the income inequality, there was no improvement and Israel continues to lag behind the developed world.
• Also the Governmental/Political Dimension of national security shows a marginal improvement but the problem here is the low level of the index. This indicates that a major reform is needed to pull Israel out of its position in the lower part of the distribution. In this dimension Israel is only higher than the countries in the region including Turkey and lower than all other countries.
February 2010 39