“listening in” to find unmet customer needs and solutionshauser/papers/li010303.pdf ·...
TRANSCRIPT
“Listening In” to Find Unmet Customer Needs and Solutions
Glen L. Urban
and
John R. Hauser
January 3, 2003
Glen L. Urban is the David Austin Professor of Marketing, Sloan School of Management, Mas-sachusetts Institute of Technology, E56-305, 38 Memorial Drive, Cambridge, MA 02142, (617) 258-0679, fax (617) 253-7597, [email protected]. John R. Hauser is the Kirin Professor of Marketing, Sloan School of Management, Massachu-setts Institute of Technology, E56-314, 38 Memorial Drive, Cambridge, MA 02142, (617) 253-2929, fax (617) 253-7597, [email protected]. This research was supported by the Sloan School of Management, the eBusiness Center, the Cen-ter for Innovation in Product Development at M.I.T., and the General Motors Corporation. We gratefully acknowledge the contributions of our industrial collaborators, research assistants, and faculty colleagues: Vince Barabba, Iakov Bart, Ahmed Benabadji, Rupa Bhagwat, Brian Bower, Brian Chan, Hann-Ching Chao, Mitul Chatterjee, Shyn-Ren Chen, Thomas Cheng, Stanley Cheung, Frank Days, Ken Dabrowski, Benson Fu, Salman Khan, Christopher Mann, Rami Musa, Joseph Kim, Ken Lynch, Bill Qualls, James Ryan, Bilal Shirazi, Jonathon Shoemaker, Fareena Sultan, Andy Tian, Xingheng Wang, and Irene Wilson. This paper has benefited from presenta-tions at the Marketing Science Conferences in Wiesbaden Germany and in Edmonton, the MIT Marketing Workshop, the New England Marketing Conference, and the Stanford Marketing Workshop. An Adobe Acrobat version of this paper is available at mitsloan.mit.edu/vc.
“Listening In” to Find Unmet Customer Needs and Solutions
Abstract
In many industries, such as the automotive, travel, and health industries, customers rou-
tinely use the Internet to gather information on product features and to refine their choice sets.
As a result, many websites (e.g., Kelley’s Blue Book) now provide virtual advisors to help cus-
tomers narrow their searches. Customer preference data from these virtual advisors are available
at little incremental cost and provide a natural source of ideas for new product platforms.
In this paper, we explore a practical marketing research methodology to identify new
high-potential unmet-need segments for product development by “listening in” to these ongoing
dialogues between customers and web-based virtual advisors. The methodology is designed to
be practical when there are large numbers of options (e.g., as many as 150 trucks when studying
the automotive market) and many potential customer needs. Calibration is based on activities,
interests, and opinions data (AIO) that are collected routinely by many firms. For example,
automotive firms collect AIO data periodically for a variety of purposes. Calibration can evolve
with incremental data collection as new products enter the market and as new customer needs are
identified. The methodology, designed to complement extant methods, uses five modules – a
Bayesian virtual advisor, a listening-in trigger, a virtual engineer, a design palette, and a mecha-
nism to identify the underlying unmet-need segments. We also provide an “opportunity-sizing”
method which takes product costs into account and provides a rough estimate of the size of the
opportunity using available data. The modules are flexible; most can be used with other extant
methods.
We describe the methodology and examine its properties through formal analysis and
Monte Carlo simulation. We demonstrate feasibility by applying the methodology to the pickup-
truck category (over 1,000 web-based respondents). The methodology identified two ideas for
new truck platforms worth approximately $2.4-3.2 billion and $1-2 billion, respectively.

“Listening In” to find Unmet Customer Needs and Solutions
Identifying new platform opportunities is one of the most important roles of market intelligence.
Monitoring [web-based advisors] provides a rich source of observed in-market customer behavior that
complements our current inquiry tools which, by their nature, are forced to ask customers either to state
their intentions before they are actually in the market or to remember after the purchase what they did
(and why) when shopping for a vehicle. No form of inquiry is perfect, however, whatever its limitations,
the currency [of web-based advisors] presents a valuable source of market understanding that is already
streaming by and is of great value when used appropriately.
– Vince Barabba, General Motors General Manager of Corporate Strategy and Knowledge Development (responsible for overseeing GM’s New Business Development Network)
Unmet Customer Needs Represent New Opportunities Identifying unmet-need opportunities is an important marketing problem in a variety of
industries. For example, in the US truck market, a single share point is worth $800 million in
annual revenues. One of the top priorities of strategic marketing is to identify promising new
segments of the market with unmet needs that can be fulfilled with a new truck platform. If such
opportunities are confirmed, these segments justify investments of $1-to-2 billion in product de-
sign and engineering. Even a one- or two-percent segment is worth further investigation if the
needs of the segment can be fulfilled with a minor redesign (typical cost of $300 million).
With so much at stake, automotive manufacturers have been innovators in marketing re-
search and market evaluation methods. General Motors (GM) alone spends tens of millions of
dollars annually to understand the voice of the customer and to design products to meet customer
needs (private communication – exact numbers confidential). Methods such as focus groups,
ethnographic methods, means-ends chains, “clinics,” prelaunch forecasting methods, information
acceleration, and conjoint analysis are used frequently. One GM supplier alone reported to us
that they used conjoint analysis methods to gather data on feature levels from over 10,000 cus-
tomers in the previous year. Automotive manufacturers invest heavily in such studies when new
segment(s) are identified, especially if potential product features relevant to that segment are
known. These marketing research methods are based on a wealth of experience. For example,
conjoint-analysis-like studies have been used routinely by General Motors since the 1930s (Time
1938). For other examples see Crawford 1991; Dolan 1993; Green and Srinivasan 1990; Griffin
and Hauser 1993; Gutman 1982; Kolpasky 2002; Lehmann and Winer 1994; Narasimhan and
Sen 1983; Shocker and Srinivasan 1979; Urban and Hauser 1993; Urban, Hauser, and Roberts
1
“Listening In” to find Unmet Customer Needs and Solutions
1990; Urban, Weinberg, and Hauser 1996; Wind 1982; and Zaltman 1997. To complement ex-
perience in researching identified opportunities, senior automotive managers seek improved
methods to identify new opportunities.
In this paper, we explore new marketing research methods to uncover, understand, and
evaluate promising opportunities for new automotive products. In the parlance of the industry,
we seek new “fishing grounds” based on unmet customer needs. This managerial problem is not
new, nor is it limited to the automotive industry. Product development teams have faced this
marketing problem for many years and continually explore new methods (Barabba 2003;
Barabba and Zaltman 1991). We do not seek to replace extant market research methods, but
rather complement them by analyzing data that are collected for other goals. Specifically, we
exploit new data that are obtained by “listening in” to ongoing “dialogues” created when cus-
tomers use the Internet to search for information and advice about automotive purchases.
These data are attractive for identifying new needs-based segments. First, the data col-
lection is incentive compatible – customers are seeking advice and, thus, have an incentive to
reveal their needs. Second, the data are available at little incremental cost – we need only moni-
tor these dialogues electronically as they occur. Third, virtual advisors are updated often to in-
clude new vehicles and new customer needs, providing evolving data with which to identify new
unmet needs as soon as customers express those needs. Fourth, data from virtual advisors have
the scale necessary for opportunity identification in the automotive industry. There are approxi-
mately 150 pickup truck sub-brands on the market; each major manufacturer offers over 20,000
brand-feature combinations. (A typical segmentation study might analyze questionnaire re-
sponses from 100,000 customers and identify almost fifty segments.) Virtual-advisor data match
this scale. For example, one virtual advisor, sponsored by GM, J. D. Power, and Kelley’s Blue
Book, has approximately 350,000 annual visitors.
However, we must overcome challenges if the methodology is to be practical. Virtual
advisors are based on needs and features that are known – we must develop a method that looks
into the gaps. With the large number of vehicles, segments, and customer needs, the method
must scale well to handle large problems and evolve as new needs and new vehicles are added to
the virtual advisors. We must be able to estimate underlying parameters (calibrate the model)
based on data that are now collected routinely by automotive manufacturers. If this alone were
not a challenge, we must gather this information without compromising the primary function of
2
“Listening In” to find Unmet Customer Needs and Solutions
the virtual advisors – the method must not be overly intrusive. Questions should be directed,
brief, and seen as relevant by the customers. Finally, because of the large scale and continuous
nature of the data, the method should be automated. The method we propose attempts to address
each of these implementation issues.
We begin by defining the marketing research problem. We then describe a representative
virtual advisor that uses Bayesian methods to focus quickly on key customer needs. (Listening-
in methods can also work with other advisory systems.) Next we identify a “listening-in” trigger
mechanism which senses unmet needs and invites a virtual engineer to join the dialogue with
customers whose needs are not met with existing vehicles. The virtual engineer engages the cus-
tomer by asking directed questions to explore the potential unmet need. The customer also ex-
presses his or her needs by using a design palette to create virtual products that are not now on
the market. These automated methods gather data from each customer as that customer visits the
virtual advisor. Periodically, the strategic marketing group reviews the data to summarize oppor-
tunities. Cluster analysis provides a rough estimate of the size of any identified opportunity – an
estimate that will be clarified later with seed investments and extant marketing methods.
After introducing the listening-in method we use Monte Carlo simulation to demonstrate
the method, explore sensitivity to various trigger levels, and explore sensitivity to response er-
rors. We then illustrate the listening-in methods with an application based on over 1,000 respon-
dents. The application identified promising new truck concepts for a major automotive manufac-
turer. Although we focus on the automotive industry, we expect that other industries share many
of the same characteristics that make “listening in” valuable. For example, the fraction of cus-
tomers who seek information and advice from the Internet is 70% in travel services and 56% in
health services. Both industries have the scale necessary to make “listening in” feasible.
Marketing’s Role in Finding New Opportunities for Product Development Marketing and marketing research interact with product-development teams at many
stages in the phase-review, stage-gate, or waterfall processes of opportunity identification, con-
cept creation, design and engineering, testing, and launch. For example, voice-of-the-customer
methods, focus groups, and ethnographic approaches all explore opportunities once they are
identified and provide a lens on the needs of a customer segment (e.g., Burchill 1992). During
the “design and engineering” phase conjoint analysis clarifies and prioritizes feature levels. Dur-
ing the “testing” phase of product development, information acceleration methods test virtual
3

“Listening In” to find Unmet Customer Needs and Solutions
concepts and clinics test new physical prototypes. Once needs-based segments are defined, the
process is effective and efficient. But marketing’s role is not limited to existing market segments.
As consumer tastes evolve and new technologies make new features feasible, promising
unmet-need segments emerge. If the segment is large and the needs are truly unmet, such oppor-
tunities can revolutionize the industry. These opportunities are extremely profitable for the inno-
vating firm. For example, in the mid-1960s Ford identified the trend of teenagers and young
adults to customize inexpensive vintage Fords with V8 engines. To meet this opportunity they
launched the 1964½ Mustang, which captured the hearts of a new generation of baby boomers
just reaching driving age (Figure 1a). This small, inexpensive sports car with a powerful V8 en-
gine sold 420,000 units in the first year ($10 billion at today’s prices) and went on to launch the
lucrative “pony” segment (classicponycars.com/history.html). In 1983 Chrysler introduced the
Dodge Caravan and Plymouth Voyager minivans – downsized vans for now-growing families,
built on a car-like K platform with comfort features such as power windows, locks, seats, and
quality sound systems (Figure 1b). This new vehicle could carry a 4’x 8’ sheet of plywood but,
unlike existing vans, could fit easily in customers’ garages, drove like a passenger car, had a side
door for small children, and had a sedan-like liftgate for shopping. Minivans fulfilled these
needs by exploiting front-wheel drive to avoid high floors and to avoid an engine that tunneled
into the cabin. Chrysler sold 210,000 units in the first year and dominated this new segment for
years to come (allpar.com/model/m/ history.html).
Figure 1 Examples of Significant New Automotive Platform Opportunities
(a) 1964½ Ford Mustang (b) 1983 Dodge Caravan
With so much as stake, the strategic marketing and marketing research groups invest
heavily in identifying new opportunities. They speak to leading edge users, maintain and moni-
tor user groups, sponsor special racing events, monitor chat rooms and user groups, and use a
4

“Listening In” to find Unmet Customer Needs and Solutions
variety of qualitative methods (Barabba 2003). However, given the scale and scope of the auto-
motive industry, marketing specialists at automotive manufacturers continually explore new data
sources and new methods to identify potential unmet-need segments.
The marketing task is often integrated with a design-and-engineering team. With the
marketing data in hand, the team develops a “platform” to exploit economies of scale in both en-
gineering and manufacturing. The platform may span several brand names providing a balance
between differentiated “positionings” and a common technological base. A typical automotive
platform, say a light-pickup-truck platform, requires well over one billion dollars in investment
for new capital (tools and assembly), expendable materials (hand-built prototypes), and engineer-
ing time. Because a typical platform redesign requires as many as 1,200 person-years of engi-
neering effort, marketing bears substantial responsibility for assuring that the new platform op-
portunity has sufficient revenue potential.1
With such responsibility, marketing professionals at automotive manufacturers undertake
many parallel analyses to find (and confirm) new opportunities. Such methods reinforce one an-
other. For example, ethnographic methods might identify a set of features to be added to the vir-
tual advisor, the analysis of which, in turn, identifies a new opportunity. The opportunity is then
clarified with still other analyses.
Tapping Data from Virtual Advisors (Web-based Searches) The data obtained by monitoring web-based customer searches are extensive and provide
the scale necessary to explore complex categories such as trucks. However, such data are rela-
tively underutilized as a source of unmet-need opportunities. Websites such as Kelley Blue
Book (kbb.com), Microsoft Autos (autos.msn.com), Edmund’s (edmunds.com), Auto-by-tel
(autobytel .com), Autoweb (autoweb.com), NADA (nadaguides.com), and Vehix (vehix.com)
have changed the way that customers search for information on cars and trucks. Sixty-two per-
cent (62%) of all new-vehicle buyers search on-line before buying a vehicle (J. D. Power 2001).
This search rate has increased from 54% in 2000 and 40% in 1999. According to J. D. Power,
“the average automotive Internet user visits 6.8 automotive sites before purchase – 80% visit at
least one independent site and 71% visit at least one manufacturer Web site.” The most-
important and most-accessed Internet content was information about vehicle options and fea-
tures. Interestingly, while customers prefer independent sites for pricing and general evaluation,
5

“Listening In” to find Unmet Customer Needs and Solutions
they prefer manufacturers’ sites, by more than a two-to-one margin, for feature and option in-
formation (J. D. Power 2001, p. E16). Such searches benefit consumers. Scott Morton, Zettel-
meyer, and Silva-Risso (2001) report that Auto-by-tel customers pay approximately $450 less for
their car when controlling for dealer choice and trade-ins.
While the data from web-based searches are a natural source of information, the informa-
tion flow is extensive. To use these data we need a system to filter systematically the informa-
tion about unmet needs that is embedded in the data. Thus, we examine first those web-based
searches that are most likely to contain embedded data on unmet needs – searches directed by a
virtual advisor. Virtual advisors seek to provide unbiased information on vehicle features and
options and, in doing so, help customers find the vehicle or option that is right for them (Urban,
Sultan and Qualls 2000). Some virtual advisors are independent (e.g., AOL’s New Car Guide at
aolsvc.carguides.aol.com/cars/car_guide.jsp or ActiveBuyersGuide.com) while others are spon-
sored by manufacturers (e.g., General Motors’ autochoiceadvisor.com and Michelin-Uniroyal-
BFGoodrich’s tireadvisor.com).
If the website is successful in building trust, then customers articulate needs accurately.
Usually, the virtual advisor can recommend a product to fulfill a customer’s needs, but not al-
ways. When the advisor cannot recommend an existing product a promising opportunity might
exist. In this paper we derive a trigger to identify automatically when virtual advisors cannot
recommend existing products because such products do not fulfill consumers’ needs.
Virtual advisors come in many varieties and are used on the web in categories such as
travel, health, autos, computers, home entertainment, and financial services. One approach is
represented by “comparators” that array choice alternatives by features (ePinions.com). Another
approach is feature-specification which asks the consumer for preferred levels of features and
searches the data base for products that meet the feature specifications (Kelly Blue Books’ rec-
ommendation tool – kbb.com). Configurators develop detailed specifications and costs for the
chosen set of detailed product features (configurator.carprices.com/autoadvisors/). Other systems
use collaborative filtering to recommend products based on correlations of past and future pur-
chases for similar customers (amazon.com) and some advisors use real people accessed by e-
mail (mayohealth.org). Others use live chat rooms to exchange information (nordstom.com).
Virtual advisors are evolving, especially in the automotive industry. GMBuypower.com uses an
1 Private communications on issues and data with automotive executives at various manufacturers.
6

“Listening In” to find Unmet Customer Needs and Solutions
algorithm to weigh features and preferences to identify a maximum-utility alternative. Active-
BuyersGuide.com uses an underlying conjoint-analysis-like procedure to determine preferences
and calculate utility values for real products based on questions about tradeoffs between profiles
of features. Other advisors mix questions about features and characteristics with questions about
how the vehicle will be used (the Bayesian advisor described below).
Adaptations of the listening-in methodology should work with many of these (trusted)
virtual advisors, but not all. To work with the listening-in methodology, an advisor must have
two key characteristics. The virtual advisor should be adaptive in the sense of being capable of
providing recommendations to the customer at any point in the questioning sequence.2 In addi-
tion, it must be feasible to link the customer’s responses to descriptions of vehicles – although
this linkage can be indirect. We illustrate the listening-in methodology for a Bayesian virtual
advisor, but the basic ideas are readily adaptable to feature-specification advisors and utility-
maximization advisors, including conjoint-analysis-based advisors. In theory, we could monitor
the click-streams in configurators to identify unexpected feature combinations, but, at present,
configurators do not have any companion predictive systems for a Bayesian trigger. Because the
human interface would need to be addressed for the real-people and chat-room advisors – such
advisors might be best monitored by traditional, rather than automated, means. The listening-in
methodology is unlikely to be applicable to collaborative filtering until a method can be devel-
oped to link filtering to product characteristics.
A Bayesian Virtual Advisor We now illustrate the listening-in methodology with a virtual advisor for truck purchases
that was developed as a prototype for a major automotive manufacturer. (A commercial system
based, in part, on key concepts from this advisor is now in place on the web.) The virtual advisor
combines two methods to recommend a set of four vehicles to customers – a segmentation
“gearbox” and a Bayesian advisor. The segmentation gearbox divides people into segments
based on grouping and assignment rules.3 In this case the grouping is based on a cluster analysis
of a 114-item AIO (Activities, Interests, and Opinions) questionnaire sent to 100,000 respon-
dents (76 personal viewpoints and 38 preferred vehicle characteristics – including styling and
2 Many advisors require a baseline set of questions before entering an adaptive phase. Most virtual advisors are adaptive because web-based customers have proven to be impatient with lengthy questions on features or needs. 3 The colorful industry term, gearbox, is an analogy. Just as the gearbox in a car matches engine speed to wheel speed, the segmentation questions match the manufacturer’s vehicles to the customer.
7

“Listening In” to find Unmet Customer Needs and Solutions
design). See Plummer (1974) for a general description of AIO questionnaires. The original
study by the automotive manufacturer identified forty-eight segments of which twenty-five were
relevant to pickup trucks. Customers were assigned to segments based on answers to the virtual
advisor’s questions – answers about the customer’s desire for features and options such as com-
fort, passenger capacity, and prestige as well as about the customer’s anticipated use of the truck.
The answers to these questions assign respondents to a group of similar people. In the virtual
advisor one of the four recommended vehicles is the vehicle bought most often by the segment to
which the customer is assigned. Like collaborative filtering, the segmentation gearbox provides
reasonable recommendations based on preferences of similar customers. It is based on extant
marketing research methods, but it does not identify new opportunities.4 Instead, we focus on
the Bayesian advisor which is used to recommend three of the four vehicles.
Bayesian Advisor
The basic concept behind the Bayesian advisor is (1) to select sets of questions, known as
question banks, such that the answers provide the most information about which vehicle to rec-
ommend and (2) after each question bank to update the probabilities that describe the likelihoods
that each vehicle will be most preferred by the customer.5 Figure 2a illustrates the opening
screen of the virtual advisor (a neighbor who has bought many trucks over the years) and Figure
2b illustrates one of the question banks asked of customers. We describe first the Bayesian up-
dating mechanism and then describe how this mechanism can be used to select the maximum-
information question bank. We later indicate how the conditional probabilities and prior prob-
abilities are obtained.
The Bayesian advisor shares some characteristics with tailored interviewing (Balasubra-
manian and Kamakura 1989 [BK]; Singh, Howell, and Rhoads 1990 [SHR]; Kamakura and
Wedel 1995 [KW]). As in the Bayesian advisor, questions in tailored interviewing are selected
to maximize an information measure and thus reduce the number of questions that need be asked.
4 Gearboxes can be made more efficient with tailored interviewing techniques (Balasubramanian and Kamakura 1989; Singh, Howell, and Rhoades 1990; Kamakura and Wedel 1995). For example, Kamakura and Wedel demon-strate that a tailored procedure based on latent-class models can classify customers to segments with two-thirds the number of questions that were necessary with a clustering-based gearbox. Because the gearbox is not the focus of this paper we leave such improvements to future research. 5 The global set of question banks, from which the algorithm selects, is drawn from cluster analyses of the ongoing AIO surveys, supplemented with managerial judgment. The set of question banks evolves based on ongoing market intelligence. The methods to identify the set of question banks are state-of-the-art, but standard, marketing research practice. They are not the focus of this paper.
8

“Listening In” to find Unmet Customer Needs and Solutions
In both methods data for key parameters are obtained from prior questionnaires. However, the
goals and scope differ. Tailored interviewing seeks to select questions from a larger bank either
to uncover an unidimensional latent trait (from dichotomous scales in Balasubramanian and Ka-
makura 1989 or Likert-type data in Singh, Howell and Rhoads 1990) or to assign customers to
segments based on the bank of questions (seven segments in Kamakura and Wedel 1995). The
Bayesian advisor focuses on recommending vehicles and, because of the scale in the truck mar-
ket (148 vehicles in our application), the advisor must bootstrap these recommendations with
Bayesian updating. Nonetheless, it is theoretically possible to develop an advisor based on tai-
lored interviewing and such an advisor would be compatible with the listening-in methods.
We begin with the notation. Let Q be a set of question banks indexed from q = 1 to N.
For each question bank, q, let rq index the potential responses to that question bank where rq is a
nominal variable with values from 1 to nq. If there is more than one question in a question bank,
then nq represents the number of possible combinations of answers. If one of the questions in-
cludes a continuous sliding scale, it is discretized to a finite number of categories.
Figure 2 Example Question Banks Asked by a Virtual Advisor
(a) Introductory Screen (b) Example Question bank
For each customer the order of the question banks is chosen adaptively. For a given cus-
tomer, let Rq-1 be the set of question banks up to, but not including, question bank q. Let vj indi-
cate vehicles from 1 to V. We are interested, at any point in the advisor’s questioning sequence,
in the likelihood that the customer will prefer vehicle j after having been asked question bank q.
We indicate this likelihood by P(vj | Rq-1, rq).
9

“Listening In” to find Unmet Customer Needs and Solutions
Suppose that we have available from earlier surveys, the conditional probabilities of how
customers, who prefer each vehicle, will answer the question banks. Then, we can use Bayes
Theorem to update recommendations.6
(1) ∑
=−−
−−− = V
jqjqjq
qjqjqqqj
RvPRvrP
RvPRvrPrRvP
111
111
)|(),|(
)|(),|(),|(
where P(vj | Rq-1) was the virtual advisor’s recommendation probability to the customer for vehi-
cle vj prior to asking the qth question bank.
However, even with data from full-scale surveys such as an AIO questionnaire with
100,000 responses, using Equation 1 is not feasible because the number of potential combina-
tions of responses grows exponentially with the number of question banks. For example, in our
study the dimensionality of RN, the number of unique paths through the advisor’s questions, is
1.4 x 10¹⁵. Fortunately we can make Equation 1 feasible based on the property of “local inde-
pendence.” This property appears reasonable for our data and has proven robust in simulations
and applications in the tailored-interviewing literature (e.g., SHR Equation 8; KW Equation 11).
As SHR explain, local independence recognizes that there will be non-zero correlations across
vehicles in the answers to the question banks – those customers who prefer a full-sized truck may
also be likely to prefer a diesel engine. Indeed, it is this combination of preferences upon which
the advisor bases its recommendations. However, if we limit ourselves to customers who prefer
a Ford F350 Supercab, then, for those customers, responses to the “size” question bank are ap-
proximately statistically independent of the responses to the “engine type” question bank. This
enables us to write P(rq, Rq-1| vj) ≅ P(rq | vj) P(rq-1 | vj)… P(r1 | vj) which implies that P(rq | vj) ≅
P(rq | vj, Rq) by the laws of conditional probability. Using this property, we rewrite Equation 1 as
follows where P(vj | Rq-1) is obtained recursively:
(1’) ∑
=
≅ V
jqjjq
qjjqqqj
RvPvrP
RvPvrPrRvP
1
)|()|(
)|()|(),|(
Figure 3 gives a simplified example for one customer of the evolution of the recommen-
dation probability. The current recommendation is given on the left and the probability that the
customer will purchase that recommended vehicle is given on the right. Also listed on the left
6 In all equations, we suppress the individual customer subscript, i, for simplicity
10

“Listening In” to find Unmet Customer Needs and Solutions
are the question bank and the answer. For example, after the second question bank on engine
size, the customer answers “4 cylinders.” If the customer were to stop answering question banks
and request a recommendation, the advisor would recommend the Mazda B2300 and forecast a
0.0735 probability that the customer would purchase the Mazda B2300. In Figure 3 the p
ability of purchase increases for the most preferred truck after each question bank is answ
Note that the recommended vehicle changes after the fifth question bank and again after the
eighth question bank.
rob-
ered.
Figure 3 Evolution of Updated Recommendation Probabilities After Question Banks
0.1467
0.1467
0.1458
0.1440
0.1440
0.1376
0.1328
0.1243
0.1200
0.1123
0.1105
0.0861
0.0735
0.0533
0.00 0.04 0.08 0.12 0.16
GMC Sierra 1500, Price (20-22K)
GMC Sierra 1500, Styling (Sporty)
GMC Sierra 1500, Big, Quiet (Not Important)
GMC Sierra 1500, Maneuverability (Important)
GMC Sierra 1500, Passengers (2)
GMC Sierra 1500, Tallest Person (6'-6.5')
Toyota Tacoma, Bed Length (Short)
Toyota Tacoma, Brand (All)
Toyota Tacoma, Construction Plowing (no)
Mazda B2300, Towing/Hauling (no)
Mazda B2300, Size (Compact)
Mazda B2300, Transmission (Auto, 2WD)
Mazda B2300, Engine Size (4 cyl)
Mazda B2300, Prior (Points *)
Rec
omm
enda
tion/
Que
stio
n B
anks
Maximum Probability
Question Bank Selection
To select the next question bank the virtual advisor attempts to gain as much information
as possible from the customer. For example, if, after reviewing the responses, the advisor de-
cides that a question bank on towing capacity is likely to make one truck more highly probable
and all other trucks less probable, then that question bank might be a good candidate to ask next.
To do this formally, we turn to formal theory in which information is defined as the logarithm of
the relative odds (e.g., Gallagher 1968). That is, the information, I(vj | rq, Rq-1), provided by the
response to question bank q, equals log [P(vj | Rq-1, rq)/ P(vj | Rq-1)]. This definition has a number
of nice theoretical properties including that (1) under an equal proportional loss rule, information
always increases when the probability of the maximum-choice truck increases, (2) the expected
11

“Listening In” to find Unmet Customer Needs and Solutions
information is maximized for the true probabilities, and (3) the information measure rewards sys-
tems that provide more finely-grained estimates (Kullback 1954; Savage 1971).
In order to compute the expected information, we need to take the expectation over all
possible responses to question bank q and over all possible vehicles. Thus, the information that
we expect from question bank q is given by Equation 2.7
(2) )|(
),|(log),|()|()|(
1
1
11
111
−
−
=−
=−− ∑∑=
qj
qqjn
rqjq
V
jqjq RvP
RrvPRvrPRvPRqEI
q
q
In a myopic world, the virtual advisor would simply choose the question bank for which Equa-
tion 2 is maximized.
We can improve upon Equation 2 with an m-step look ahead. To date, the computational
demands of Equations 1 and 2, coupled with the large number of responses for each question
bank has limited the look-ahead algorithm to two steps. Basically, for each potential question
bank and response on Step 1, the advisor computes the best second question bank and the ex-
pected information for that question bank. It then selects the Step-1 question bank with the high-
est contingent expected information.
Initial Calibration
Two estimates are necessary for the virtual advisor to begin: prior probabilities, P(vj), and
the conditional response probabilities, P(rq | vj ). The virtual advisor obtains the prior probabili-
ties for each individual from a logit model based on five truck characteristics: price, fuel econ-
omy, performance, reliability, and safety. Each customer is asked initial constant-sum, self-
explicated importance weights for these characteristics. (These prior weights are obtained from
questions that are asked prior to the question banks illustrated in Figure 3.) The prior probabili-
ties are estimated with Equation 3 where the wc is the importance for the cth characteristic for
each individual obtained from a constant-sum allocation of 100 importance points across the five
scales, xjc is the value of characteristic c for vehicle vj, and β is a scaling parameter.
7 This reward function is related to the entropy function minimized by KW. However, the Bayesian advisor looks two steps ahead rather than simply maximizing Equation 2 (minimizing entropy in KW). For earlier applications in marketing of information-theory-based reward functions see Hauser (1978) and Herniter (1973). For recent applica-tions in psychology, see Prelec (2001).
12

“Listening In” to find Unmet Customer Needs and Solutions
(3)
∑=
∑
∑
=
=
=V
j
xw
xw
j
cjcc
cjcc
e
evP
1
5
1
5
1
)(β
β
The characteristic values for each existing vehicle and the scaling parameters are obtained from
archival data and judgments by managers and engineers. For example, prior surveys to owners
help establish that the Toyota Tacoma 4x4 (regular cab) has a rating of 1.087 on fuel economy
and a rating of 1.241 on performance. For the GMC Sonoma 2WD Regular Cab the correspond-
ing ratings are 2.116 and 0.525 respectively. (Data disguised slightly.) The actual data were syn-
thesized from “an ongoing global effort” by the manufacturer “to understand consumers’ needs
and wants related to motor vehicles.” (Quotes from a proprietary study.) Part of this ongoing
global effort included data collected with the AIO questionnaire described earlier (76 “personal
viewpoints” and 38 “vehicle characteristics”). When new vehicles become available, managers
and engineers provide temporary estimates of the xjc’s.
The conditional response probabilities are also based on these ongoing AIO surveys, sup-
plemented when necessary by experienced managers and engineers. For example, the survey
data suggest that customers who prefer the Toyota Tacoma 4x4 (regular cab) are likely to answer
that they prefer a four-wheel drive vehicle 84% of the time. They are likely to answer that they
prefer two-wheel drive only 16% of the time. Table 1 illustrates the type of data upon which the
conditional probabilities are based. These data are disguised slightly.
Table 1 Example Conditional Probabilities from AIO Survey, Supplemented with Judgment
Conditional Probability, P(rq | vj ) – data disguised
Number of passengers
Chevy Ava-lanche 2WD
Chevy Silver-ado 2500 2WD
GMC Sonoma 4WD Crew Cab
… (148 vehicles)
Dodge Ram Club 4WD
1 passenger 5% 25% 15% … 10%
2 passengers 15% 25% 5% … 15%
3 passengers 25% 25% 15% … 25%
4 passengers 25% 15% 25% … 25%
5-6 passengers 30% 10% 25% … 25%
13

“Listening In” to find Unmet Customer Needs and Solutions
Evolving Question Banks
Virtual advisors and the listening-in methods are not one-shot studies. Markets evolve as
customer needs change and technology improves. Each year brings changing characteristics and
new brands. To be effective in advising customers (virtual advisor) and identifying new oppor-
tunities (listening in), the virtual advisor must be relatively simple to update. For example, sup-
pose that four-wheel steering becomes a feature that is important to customers (and a feature that
helps the advisor recommend a truck). Suppose further that some truck brands start offering this
feature for the 2003 model year. We can readily add a question bank on steering to the set of
available trucks. Because of the local independence property, we need only obtain incremental
data for the new question banks. We need to know how owners of each truck brand will rate
their vehicles on the new question bank. For new truck brands we need to know how owners of
the new brands will rate their vehicles on the characteristic values (xjc’s) and how they will an-
swer each question bank. These data are obtained from the periodic AIO surveys – surveys that
are a normal part of business and used for many purposes. In essence, the virtual advisor and
listening in “free ride” on surveys undertaken by the manufacturer for other purposes.
Trigger Mechanism to Identify New Opportunities Equation 2 enables the virtual advisor to select a question-bank order that leads to rapid
convergence toward recommendations. For many customers an existing vehicle will fulfill their
needs and the updated recommendation probabilities will evolve smoothly as in Figure 3. For
these customers we do not identify opportunities by listening in – they are satisfied and are not a
high-potential source of new ideas for product platforms. However, for some customers, their
answers to question banks reveal inconsistencies. For example, suppose that (1) the customer
has already answered constant-sum importance question banks that indicate reliability and low
price are most important (price 30 points, performance 10 points, fuel economy 20 points, reli-
ability 30 points, and safety 10 points) and (2) the customer’s subsequent answers suggest an in-
terest in a small truck with a 4-cylinder engine, two-wheel drive, and automatic transmission.
The Mazda B2300 fits these preferences best (see Figure 4 – Question banks 1 to 4). Given
these answers the virtual advisor decides that further information on towing and hauling will
clarify recommendations. The advisor expects that the customer will want to haul relatively light
loads such as small-garden equipment or tow a jet ski. Knowing the exact towing and hauling
needs will help the advisor decide among a number of otherwise comparable light-duty trucks.
14

“Listening In” to find Unmet Customer Needs and Solutions
However, suppose the customer says that he or she plans to use the truck to haul heavy
materials and tow a large motor boat (weighing 6,500 pounds). No existing light-duty truck can
tow such heavy loads effectively and safely. On the other hand, no truck that can tow such
heavy loads can fill the customer’s requirements as expressed in earlier question banks. This
may be an opportunity worth investigating – a light-duty truck that can occasionally haul heavy
materials or tow heavy loads.
The intuition in this example is that the question bank on towing and hauling revealed
something about the customer’s underlying needs. Based on this new information the customer
is probably not going to be satisfied with existing trucks and the virtual advisor will have to re-
vise its best-truck recommendation probability downward. This drop in the maximum recom-
mendation probability becomes a trigger for further investigation. We illustrate this trigger
mechanism by an arrow in the dialogue in Figure 4. Question Bank 5, which included questions
about towing and hauling, causes the most preferred vehicle to change from the Mazda to a Ford
Ranger (a slightly larger and more-powerful compact truck). The utility drops because this more
powerful compact truck cannot fully meet the towing and hauling requirements and because it
cannot meet the requirements expressed in Question banks 1-4. (It has a 6-cylinder engine and is
more expensive.) A full-sized truck, such as the Chevrolet Silverado 1500, could fulfill the tow-
ing and hauling requirements, but the advisor does not recommend the Silverado because it does
poorly on the other desired features. After further question banks the recommendation probabili-
ties in Figure 4 increase because the Ford Ranger fulfills the additional requirements.
15

“Listening In” to find Unmet Customer Needs and Solutions
Figure 4 Example Use of the Trigger Mechanism
0.1498
0.1478
0.1459
0.1428
0.1401
0.1356
0.1328
0.1243
0.1200
0.1056
0.1105
0.0861
0.0735
0.0533
0.00 0.04 0.08 0.12 0.16
Ford Ranger, Price (20-22K)
Ford Ranger, Styling (Conventional)
Ford Ranger, Big, Quiet (Neutral)
Ford Ranger, Maneuverability (Important)
Ford Ranger, Passengers (2)
Ford Ranger, Tallest Person (< 6')
Ford Ranger, Bed Length (Short)
Ford Ranger, Brand (All)
Ford Ranger, Construction Plowing (No)
Ford Ranger, Towing/Hauling (Yes)
Mazda B2300, Size (Compact)
Mazda B2300, Transmission (Auto, 2WD)
Mazda B2300, Engine Size (4 cyl)
Mazda B2300, Prior (Points *)R
ecom
men
datio
n/Q
uest
ion
Ban
ks
Maximum Probability
The intuitive idea in Figure 4 has appeal, but before we incorporate the trigger mecha-
nism we must investigate it further. For example, the posterior probability might drop because
there is error in the customer’s response. If the trigger mechanism is too sensitive, it might iden-
tify many false conflicts and the true conflicts might be lost in the noise. On the other hand, if it
is not sensitive enough, the trigger mechanism might miss opportunities. We show later in this
paper, through simulation, how to select a sensitivity level for the trigger mechanism such that
unmet-need segments are likely to be recovered. In these simulations we begin with real data for
the conditional probabilities and create known unmet-needs segments. We then add error and
examine how various sensitivity levels balance “false positives” and “false negatives.” The
simulations demonstrate that calibration is feasible and that the performance of the listening-in
mechanism is reasonably robust in the face of response errors. It is also reasonably robust with
respect to the sensitivity levels chosen for the trigger mechanism.
The other issue it theoretical. The intuition assumes that a drop in posterior probability
identifies a conflict in the underlying utility of the vehicle. If a question bank affected only the
vehicle that was recommended prior to the qth question bank and if that same vehicle were rec-
ommended after the qth question bank, then most random utility models would suggest that a
probability drop is an indicator of an underlying utility drop. For example, both the logit and the
16

“Listening In” to find Unmet Customer Needs and Solutions
probit models have this property. However, each question bank can affect the probabilities of all
148 vehicles and change the identity of the recommended vehicle based on the qth question bank.
We demonstrate formally in the Appendix that the intuition still holds. If the qth question bank
does not change the identity of the recommended vehicle, then a drop in posterior probability
indicates that the recommended vehicle has characteristics in conflict with the customer’s prefer-
ences. If the qth question bank changes the identity of the recommended vehicle, then a drop in
the posterior probability indicates that a truck with mixed characteristics would have higher util-
ity than either the truck recommended before the qth question bank or the truck recommended
after the qth question bank. Both cases, if sustained across many customers, suggest opportuni-
ties for new products that satisfy unmet needs.
Identifying Potential Root Causes of the Utility Drops
When the trigger mechanism identifies a potential conflict, we need further information
to determine whether or not it is a true opportunity. We first identify which truck characteristics
are in conflict and then gather clarifying information from the customer.
As the Appendix establishes, conflicts exist when no existing truck simultaneously satis-
fies all of the customer’s needs. To diagnose such conflicts it is tempting to rely on “product ar-
cheology” to examine the correlations among the characteristics of trucks that are now on the
market (Ulrich and Pearson 1998). However, such “ecological” correlations represent more than
customer preferences; they represent the efficient frontier of the equilibrium responses by com-
peting truck manufacturers. We prefer a mechanism that is less sensitive to supply-side and
equilibrium considerations. One such mechanism is the correlations in the underlying customer
preferences that drive the responses to the virtual advisor’s question bank. We obtain indicators
of these correlations by combining the virtual-advisor dialogue and the AIO data.
Let pqrrρ be the correlation across vehicles of the conditional probabilities of a customer
answering rq to question bank q and answering rp to question bank p.8 Let Ρ be the matrix of
these correlations. For example, an element in this matrix might be the correlation across vehi-
cles of the probabilities of a customer indicating that he or she (1) will use the truck for trailering
heavy loads and (2) prefers a rugged body style for that vehicle. Based on existing truck seg-
8 Such correlations across vehicles are consistent with local independence. The latter only assumes response inde-pendence conditioned on a given vehicle. Even with local independence we expect customers to be heterogeneous and, hence, expect non-zero correlations across vehicles in customers’ answers to the question banks.
17

“Listening In” to find Unmet Customer Needs and Solutions
ments we expect these example characteristics to be positively correlated. On the other hand, a
priori, we expect a customer’s need to pull a large trailer or boat to be negatively correlated with
a preference for a compact truck. That is, we do not expect that customers who prefer compact
trucks will also value hauling and towing heavy loads. We expect their towing needs to be lim-
ited to lighter loads. (If the example motivating the drop in utility in Equation 3 occurs often in
the data, “listening in” will cause us to re-examine this a priori belief.) Thus, whenever the trig-
ger mechanism suggests a potential opportunity, the listening-in algorithm examines all correla-
tions corresponding to the customer’s answers to the first q question banks ( ). It flags
those which are highly negative (less than –0.30 in our application). (The level of this flagging
mechanism is can also be set with simulation.) Such negative correlations trigger the virtual en-
gineer.
qq rR U1−
A Virtual Engineer Clarifies the Opportunity Customers who use a virtual advisor do so to make a better truck-purchasing decision;
they do not see themselves as respondents to a questionnaire. Thus, we must be careful to
choose our questions carefully. The listening-in trigger mechanism targets relatively-precisely
those customers who have unmet needs and the Ρ-triggering mechanism targets their unmet
needs. We now introduce a mechanism by which the listening-in methodology can concentrate
its questions to obtain relevant, more-detailed information about those unmet needs. We call this
mechanism a virtual engineer (VE). It asks relatively few questions of each targeted customer,
but, across many customers, its questions span the needs-space. The VE is also flexible; its
questions can be updated continuously without re-commissioning a large-scale AIO survey.
The concept of a VE is simple; its implementation difficult. To be useful to the product-
development team, the VE must ask the customer those questions that inform the engineering
design decisions that would be necessary should a promising opportunity be identified. To be
credible to the customer, the VE must ask questions in a non-technical manner that relates to
how the customer uses the truck. Naturally, the VE evolves through application, but we describe
here the process by which the initial VE questions are created.
For each potential conflict (negativepqrrρ ), an engineering design team from a major
automotive manufacturer considered the basic engineering problem imposed by the conflicting
needs. The team then generated the questions that the team would need answered in order to de-
18

“Listening In” to find Unmet Customer Needs and Solutions
cide among basic solutions to that conflict. The engineering team formulated the questions that
they would ask the customer if they were participating in the dialogue between the advisor and
customer. For example, if the customer wants a compact truck that can tow a large boat, then the
engineering team would ask about the type of boat (e.g., modest sailboat, large motor boat, or
multiple jet skis) and the weight of the boat(s) that the customer plans to tow. The engineering
team would also ask the customer why he or she wants a compact truck (e.g., low price, tight
parking, high maneuverability, fuel economy, etc.). All engineering questions are then rephrased
into customer language.
Figure 5 Virtual Engineer
(a) Introductory Screen (b) Example Dialogue
(c) Specific Questions to Elaborate (d) Open-ended Questions
In addition to the questions identified by the engineering team, the VE includes open-
ended dialogues which enable the customer to elaborate further the reasons underlying the previ-
19
“Listening In” to find Unmet Customer Needs and Solutions
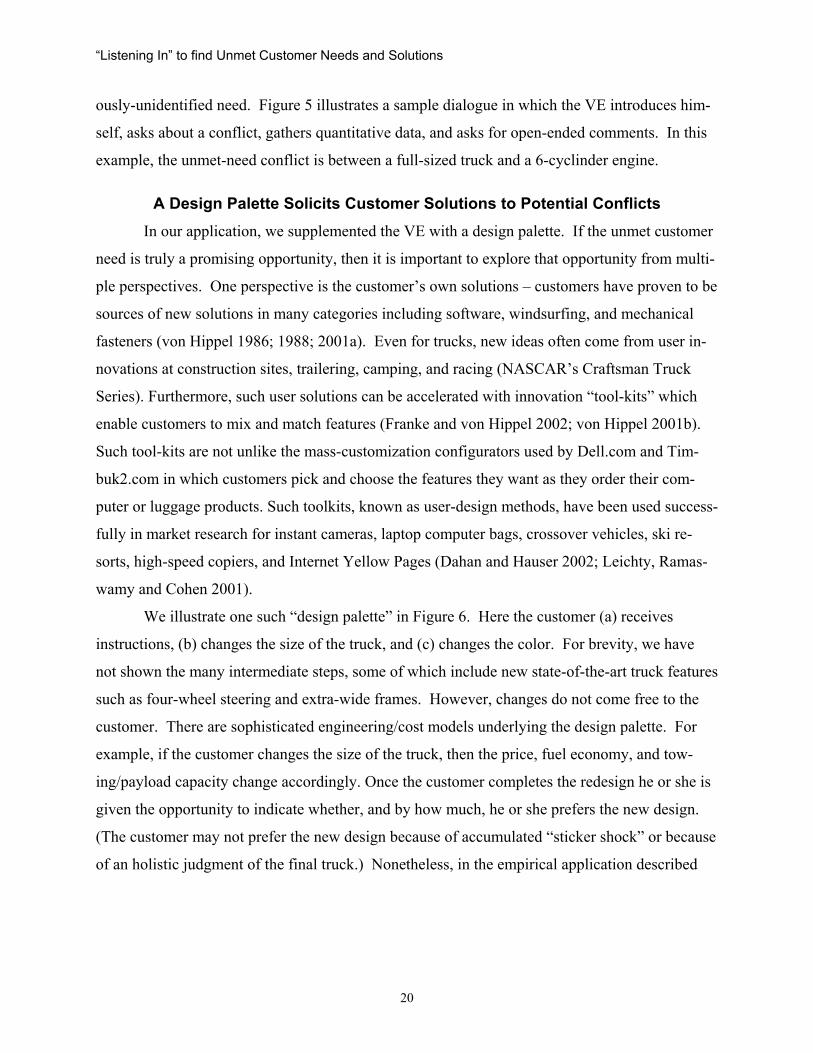
ously-unidentified need. Figure 5 illustrates a sample dialogue in which the VE introduces him-
self, asks about a conflict, gathers quantitative data, and asks for open-ended comments. In this
example, the unmet-need conflict is between a full-sized truck and a 6-cyclinder engine.
A Design Palette Solicits Customer Solutions to Potential Conflicts In our application, we supplemented the VE with a design palette. If the unmet customer
need is truly a promising opportunity, then it is important to explore that opportunity from multi-
ple perspectives. One perspective is the customer’s own solutions – customers have proven to be
sources of new solutions in many categories including software, windsurfing, and mechanical
fasteners (von Hippel 1986; 1988; 2001a). Even for trucks, new ideas often come from user in-
novations at construction sites, trailering, camping, and racing (NASCAR’s Craftsman Truck
Series). Furthermore, such user solutions can be accelerated with innovation “tool-kits” which
enable customers to mix and match features (Franke and von Hippel 2002; von Hippel 2001b).
Such tool-kits are not unlike the mass-customization configurators used by Dell.com and Tim-
buk2.com in which customers pick and choose the features they want as they order their com-
puter or luggage products. Such toolkits, known as user-design methods, have been used success-
fully in market research for instant cameras, laptop computer bags, crossover vehicles, ski re-
sorts, high-speed copiers, and Internet Yellow Pages (Dahan and Hauser 2002; Leichty, Ramas-
wamy and Cohen 2001).
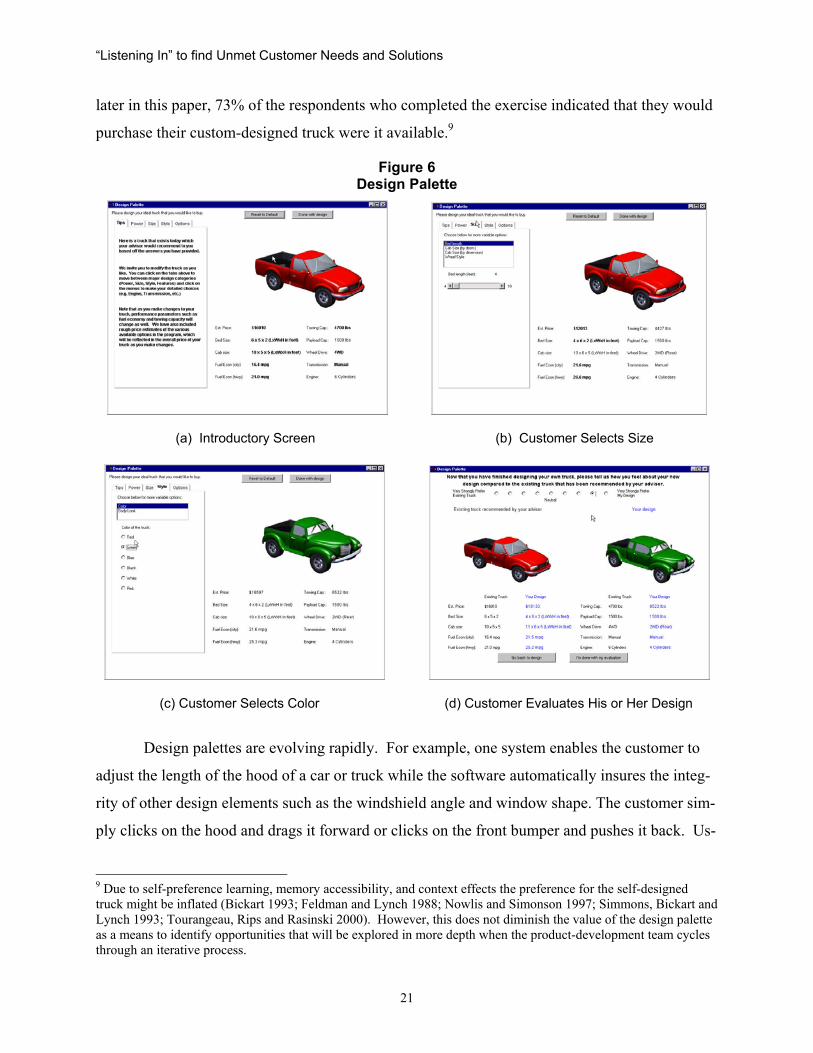
We illustrate one such “design palette” in Figure 6. Here the customer (a) receives
instructions, (b) changes the size of the truck, and (c) changes the color. For brevity, we have
not shown the many intermediate steps, some of which include new state-of-the-art truck featur
such as four-wheel steering and extra-wide frames. However, changes do not come free to the
customer. There are sophisticated engineering/cost models underlying the design palette. For
example, if the customer changes the size of the truck, then the price, fuel economy, and tow-
ing/payload capacity change accordingly. Once the customer completes the redesign he or she is
given the opportunity to indicate whether, and by how much, he or she prefers the new design.
(The customer may not prefer the new design because of accumulated “sticker shock” or because
of an holistic judgment of the final truck.) Nonetheless, in the empirical application described
es
20
“Listening In” to find Unmet Customer Needs and Solutions
later in this paper, 73% of the respondents who completed the exercise indicated that they would
purchase their custom-designed truck were it available.9
Figure 6 Design Palette
(a) Introductory Screen (b) Customer Selects Size
(c) Customer Selects Color (d) Customer Evaluates His or Her Design
Design palettes are evolving rapidly. For example, one system enables the customer to
adjust the length of the hood of a car or truck while the software automatically insures the integ-
rity of other design elements such as the windshield angle and window shape. The customer sim-
ply clicks on the hood and drags it forward or clicks on the front bumper and pushes it back. Us-
9 Due to self-preference learning, memory accessibility, and context effects the preference for the self-designed truck might be inflated (Bickart 1993; Feldman and Lynch 1988; Nowlis and Simonson 1997; Simmons, Bickart and Lynch 1993; Tourangeau, Rips and Rasinski 2000). However, this does not diminish the value of the design palette as a means to identify opportunities that will be explored in more depth when the product-development team cycles through an iterative process.
21

“Listening In” to find Unmet Customer Needs and Solutions
ing this advanced design palette, the customer could create easily a Euro sports design (short
front overhang, high truck deck, low overall height) that is pleasing to the eye and incorporates
many “design” heuristics. Alternatively, by lengthening the front overhang and the hood the cus-
tomer could create a classic look with a long sloping back to the truck. The software is suffi-
ciently advanced that the customer could then rotate the model in all directions to get a full 3D
view.
Initial Sizing of the Opportunity The virtual engineer and the design palette are triggered automatically whenever a prob-
ability drop is detected that is larger than a preset threshold. The virtual engineer is triggered for
(at most) six of the flagged conflict pairs to keep the respondent’s task relatively short. The limi-
tation to six conflict pairs implies that no more than six input screens, such as Figure 5c, are pre-
sented to the customer. This limitation assures that the virtual engineer is not perceived as intru-
sive. The limitation was set based on pretests with customers.
While “listening in” can, in theory, identify all unmet-need combinations, not all such
combinations will justify further investigation. To make the decision on further investigation, a
truck manufacturer requires an initial estimate of the size of the opportunity. This estimate of po-
tential can be a rough indicator because “listening in” is part of the fuzzy front end of an iterative
product development process. The manufacturer will evaluate any opportunities further before
any sizable investment. Fortunately, the listening-in methodology provides a method for initial
sizing that appears to be sufficient to distinguish the few big winners.
Subject to the caveats of self-selected customers and the approximations in Equations 1-
3, we can identify patterns of unmet needs within the population. Each customer answers a cus-
tom-designed set of question banks. These question banks and the corresponding answers iden-
tify the customer’s needs. Let Ai represent customer i’s answers. Then Ai corresponds to a sub-
set, Ρi, of the correlation matrix, Ρ. These data enable us to cluster respondents on Ρi to identify
groups of customers with similar needs. If the size of the unmet-need cluster is large, as a frac-
tion of the initial sample, then this unmet-need segment is likely to be worth further investiga-
tion.10
10 “Listening in” is based on dialogues with virtual advisors. Because customers choose to initiate these dialogues, there is self-selection. However, given the large fraction of truck customers who search for information on the web
22

“Listening In” to find Unmet Customer Needs and Solutions
Suppose we have identified an unmet-need segment. To simulate a truck “design” for
that segment we define a concept truck by the needs it fulfills. To estimate market share for the
concept truck we include the concept truck in the set of existing trucks available to the virtual
advisor. By using the Bayesian model in Equation 1, we calculate revised posterior probabilities
for all trucks, including the new truck concept. Averaging the revised posterior probabilities
over all respondents provides a rough estimate of market share for the new concept truck.
Monte Carlo Simulations: Sensitivity to Error and the Trigger Mechanism We undertake Monte Carlo simulations to address three issues. The first set of simula-
tions examines whether the listening-in methodology can recover unmet-need segments from
data provided by respondents who make errors in both the initial preference judgments (wc’s )
and the responses to the Bayesian advisor’s questions (rq’s ). The second set of simulations ex-
plores the sensitivity of the trigger mechanism and suggest that, over a reasonable range, this
trigger mechanism is robust with respect to the choice of trigger level. The third set of simula-
tions vary the errors in the preference judgments and the question-bank responses to explore how
such errors affect performance. Together these simulations explore the internal validity of the
listening-in methodology and establish that it can identify promising opportunities in the pres-
ence of response error.
Simulation Methodology
We generated nine customer segments of 500 respondents each – a total of 4,500 simu-
lated respondents. For six of the generated customer segments, respondents have preferences for
which no existing trucks satisfy their needs. If there were no error, customers in those segments
would answer the virtual advisor’s question banks according to their needs and the listening-in
methodology should correctly identify their unmet needs. For example in one segment we might
define an answer profile consistent with customers who want a compact truck that tows large
loads. If there were no response errors, customers in this segment would answer “yes” to “com-
pact truck” and “yes” to the large-load question in the appropriate question bank. If no existing
truck meets both needs simultaneously, these answers would trigger a drop in the posterior prob-
ability and indicate unmet needs. In the simulations, we created segments to represent customers
who want (1) compact trucks that can haul and tow large loads, (2) sporty full-sized trucks with
and given the growth in virtual advisors, we expect the self-selection issues to diminish. At minimum, a large frac-tion of even the self-selected customers might still be an important opportunity for a new truck.
23

“Listening In” to find Unmet Customer Needs and Solutions
short beds, (3) compact trucks with diesel engines, (4) full-sized trucks with an extra-short bed
and 4-cylinder engines, (5) compact trucks with 10-cylinder engines, and (6) full-sized trucks
with high maneuverability. In each of these segments there were a number of true conflicts. For
example, simulated respondents in the first segment want a compact truck with a small engine
that can tow and haul large loads. At the “needs” level, this segment produces four conflict pairs
– compact truck/tow large loads, compact truck/haul large loads, 4-cylinder engine/tow large
loads, and a 4-cyclinder engine/haul large loads. For segments seven through nine, we created
profiles where existing trucks satisfy well the customers’ needs (e.g., full-sized trucks that can
tow and haul large loads). These three segments enable us to test whether or not the methodol-
ogy identifies false opportunities.
For each respondent in the nine segment profiles we generated consistent responses, rq’s,
for each question bank and consistent self-explicated importances, wc’s. We then added errors to
the customer’s responses. There are two classes of question banks – question banks with nominal
categories and the question bank of constant-sum self-explicated importance questions. Because
the rq’s are nominal variables we assume that E% are answered incorrectly and that the incorrect
answers are uniformly distributed among the remaining categories. For example if the respon-
dent truly wants a compact truck we simulate the a 10-percent error by having 10 percent of the
respondents answer that they want a large truck. Because the wc’s are interval-scaled variables
estimated by allocating 100 points across the five truck characteristics, we simulate response er-
ror in the these answers by adding a zero-mean, normally-distributed response error such that the
standard deviation of the error equals a specified number of points (e). For simplicity we trun-
cate negative self-explicated importances which, fortunately, occur with low probability. We
then apply the listening-in equations to each of the 4,500 simulated respondents.
Whenever a probably drop occurs that is larger than the trigger level, we record the nega-
tive conditional-probability correlations, pqrrρ , corresponding to all need-conflicts (unmet needs)
that are identified in the complete dialogue with that simulated respondent. If multiple trigger
points are identified, unmet needs for all triggers are recorded. Thus, each simulated respondent
who experiences one or more probability drops (above the trigger), is represented by a vector
which has negativepqrrρ values for every pair of identified need conflicts. After simulating all
respondents, we cluster this conflict matrix to identify the unmet-need customer segments.
24

“Listening In” to find Unmet Customer Needs and Solutions
We use a k-means non-tree clustering algorithm based on the Euclidean norm defined on
the matrix of triggered correlations (respondents by potential conflict pairs). We use the stan-
dard “scree” rule to identify the number of clusters, n, but abstract n, n+1, and n+2 clusters. We
then examine their size and interpret their profiles. If the n+1st cluster is still large, we abstract
more clusters and continue until we do not find a large cluster. As a rule of thumb, to be sure
that no large unmet-need cluster is missed, we abstract additional clusters until the last two clus-
ters are small and do not reflect interesting need patterns. This simulates the manner is which the
listening-in methodology is applied to actual data.
Initial Simulations to Uncover Unmet Needs
We begin with moderate error in both the self-explicated importances and the responses
to the question banks (E = 10% and e = 5 points). The VE is triggered and the conflict correla-
tions are recorded whenever - ≤ t where t = 0.00005. This is a rela-
tively sensitive trigger. We show later that this trigger is within the robust range.
),|( 11 −qq RrvP )|( 11 −qRvP
Table 2 summarizes the results of the initial simulation for this trigger level. The entries
in this table indicate the number of respondents from a true segment that were assigned to a clus-
ter. The largest number in each row is displayed in bold text. In total, 82.7% of the respondents
were correctly classified. Most of the misclassifications were respondents who had true unmet
needs (e.g., compact truck that tows large loads), but were classified to the null segment because
of errors in their responses. For example, a respondent might have had a true preference for a
compact truck that could tow large loads, but, due to errors, stated that he or she wanted a large
truck that could tow large loads. That respondent was assigned to the null segment because there
are many large trucks that can tow heavy loads. Such errors occur ten percent of the time in this
simulation. One perspective is the micro level and another is the macro level. First, at the micro
level, the simulation identified 21,096 conflict pairs when there were only 16,500 true conflict
pairs. (Recall that there are multiple conflict pairs for each of the 4,500 respondents.) This im-
plies that 14% of the identified conflict pairs were false negatives and 36% were false positives.
Thus, at the micro level, the response errors imply significant errors in recovery. However, these
numbers do not tell the entire story. For managerial relevance we must look at the macro level.
25
“Listening In” to find Unmet Customer Needs and Solutions
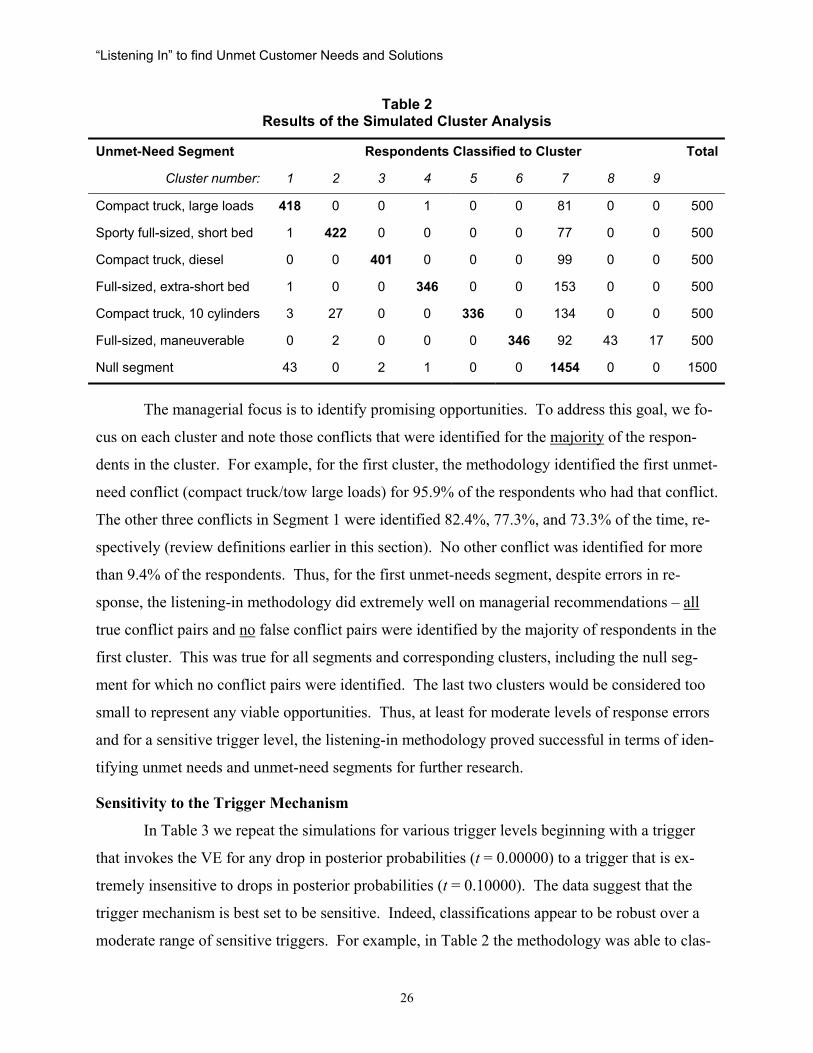
Table 2 Results of the Simulated Cluster Analysis
Unmet-Need Segment Respondents Classified to Cluster Total
Cluster number: 1 2 3 4 5 6 7 8 9
Compact truck, large loads 418 0 0 1 0 0 81 0 0 500
Sporty full-sized, short bed 1 422 0 0 0 0 77 0 0 500
Compact truck, diesel 0 0 401 0 0 0 99 0 0 500
Full-sized, extra-short bed 1 0 0 346 0 0 153 0 0 500
Compact truck, 10 cylinders 3 27 0 0 336 0 134 0 0 500
Full-sized, maneuverable 0 2 0 0 0 346 92 43 17 500
Null segment 43 0 2 1 0 0 1454 0 0 1500
The managerial focus is to identify promising opportunities. To address this goal, we fo-
cus on each cluster and note those conflicts that were identified for the majority of the respon-
dents in the cluster. For example, for the first cluster, the methodology identified the first unmet-
need conflict (compact truck/tow large loads) for 95.9% of the respondents who had that conflict.
The other three conflicts in Segment 1 were identified 82.4%, 77.3%, and 73.3% of the time, re-
spectively (review definitions earlier in this section). No other conflict was identified for more
than 9.4% of the respondents. Thus, for the first unmet-needs segment, despite errors in re-
sponse, the listening-in methodology did extremely well on managerial recommendations – all
true conflict pairs and no false conflict pairs were identified by the majority of respondents in the
first cluster. This was true for all segments and corresponding clusters, including the null seg-
ment for which no conflict pairs were identified. The last two clusters would be considered too
small to represent any viable opportunities. Thus, at least for moderate levels of response errors
and for a sensitive trigger level, the listening-in methodology proved successful in terms of iden-
tifying unmet needs and unmet-need segments for further research.
Sensitivity to the Trigger Mechanism
In Table 3 we repeat the simulations for various trigger levels beginning with a trigger
that invokes the VE for any drop in posterior probabilities (t = 0.00000) to a trigger that is ex-
tremely insensitive to drops in posterior probabilities (t = 0.10000). The data suggest that the
trigger mechanism is best set to be sensitive. Indeed, classifications appear to be robust over a
moderate range of sensitive triggers. For example, in Table 2 the methodology was able to clas-
26
“Listening In” to find Unmet Customer Needs and Solutions
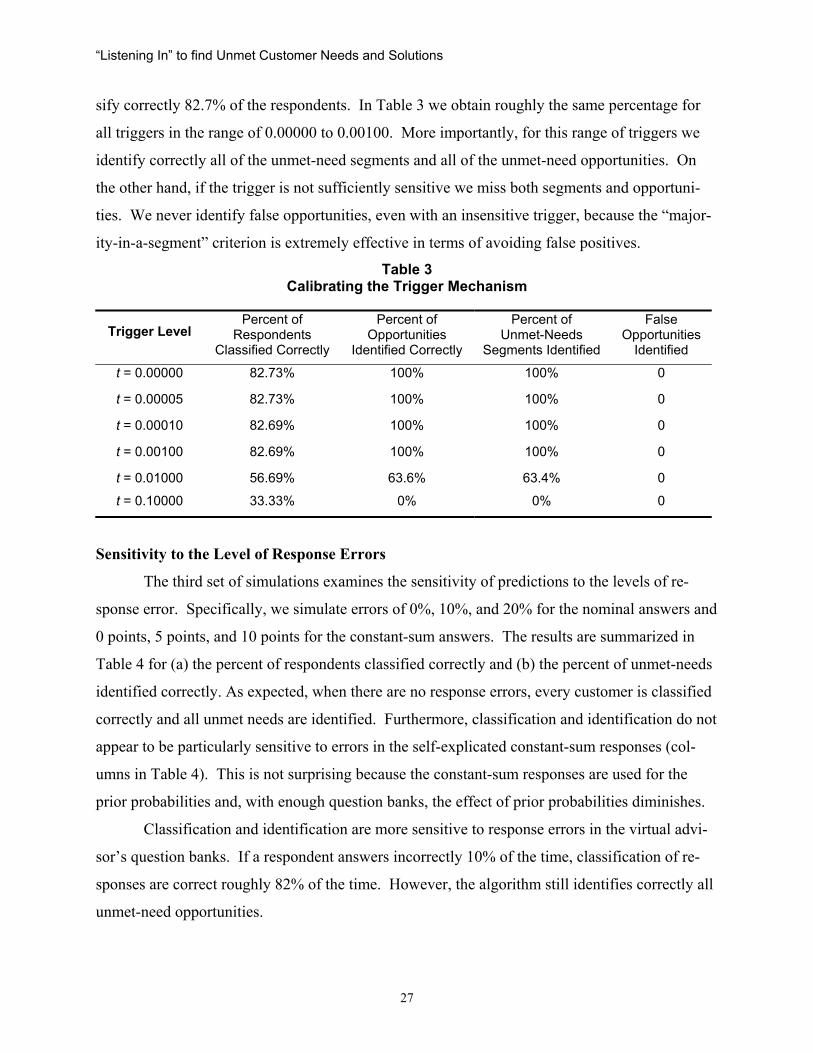
sify correctly 82.7% of the respondents. In Table 3 we obtain roughly the same percentage for
all triggers in the range of 0.00000 to 0.00100. More importantly, for this range of triggers we
identify correctly all of the unmet-need segments and all of the unmet-need opportunities. On
the other hand, if the trigger is not sufficiently sensitive we miss both segments and opportuni-
ties. We never identify false opportunities, even with an insensitive trigger, because the “major-
ity-in-a-segment” criterion is extremely effective in terms of avoiding false positives.
Table 3 Calibrating the Trigger Mechanism
Trigger Level
Percent of Respondents
Classified Correctly
Percent of Opportunities
Identified Correctly
Percent of Unmet-Needs
Segments Identified
False Opportunities
Identified t = 0.00000 82.73% 100% 100% 0
t = 0.00005 82.73% 100% 100% 0
t = 0.00010 82.69% 100% 100% 0
t = 0.00100 82.69% 100% 100% 0
t = 0.01000 56.69% 63.6% 63.4% 0
t = 0.10000 33.33% 0% 0% 0
Sensitivity to the Level of Response Errors
The third set of simulations examines the sensitivity of predictions to the levels of re-
sponse error. Specifically, we simulate errors of 0%, 10%, and 20% for the nominal answers and
0 points, 5 points, and 10 points for the constant-sum answers. The results are summarized in
Table 4 for (a) the percent of respondents classified correctly and (b) the percent of unmet-needs
identified correctly. As expected, when there are no response errors, every customer is classified
correctly and all unmet needs are identified. Furthermore, classification and identification do not
appear to be particularly sensitive to errors in the self-explicated constant-sum responses (col-
umns in Table 4). This is not surprising because the constant-sum responses are used for the
prior probabilities and, with enough question banks, the effect of prior probabilities diminishes.
Classification and identification are more sensitive to response errors in the virtual advi-
sor’s question banks. If a respondent answers incorrectly 10% of the time, classification of re-
sponses are correct roughly 82% of the time. However, the algorithm still identifies correctly all
unmet-need opportunities.
27

“Listening In” to find Unmet Customer Needs and Solutions
The most severe condition in Table 4 is E=20%. In this condition respondents, on aver-
age, answer 1 in 5 questions incorrectly. Based on our observations and discussions with con-
sumers, this error rate is much higher than we expect among real consumers who are actively
seeking information on which vehicle to purchase. For this error rate the classification rate drops
to 55-62%, but the methodology still identifies 75-94% of the unmet needs correctly.11
Table 4 Sensitivity to Response Errors
Errors in the Self-Explicated Importances (Priors) Response Errors
(updating) e = 0 points e = 5 points e = 10 points
E = 0% 100% 99.9% 99.9%
E = 10% 82.9% 82.7% 81.8%
E = 20% 61.6% 55.0% 56.8%
(a) Percent of respondents classified correctly
Errors in the Self-Explicated Importances (Priors) Response Errors (updating) e = 0 points e = 5 points e = 10 points
E = 0% 100% 100% 100%
E = 10% 100% 100% 100%
E = 20% 93.9% 75.8% 81.8%
(b) Percent of needs correctly identified
Summary
Together Tables 2, 3, and 4 suggest a reasonable level of internal validity. In the pres-
ence of errors in both the prior preferences and the responses to the question banks, the listening-
in algorithm appears to be able to identify promising opportunities for new truck platforms.
While the classification of respondents to segments is affected by these errors, unmet-need con-
flicts are still identified successfully. While recovery degrades for high levels of error in the
nominal responses, this level of recovery should be sufficient for the fuzzy front end of product
development. Because “listening-in” complements extant methods, final decisions on whether or
not to introduce new truck platforms can be tested with more extensive data collected later in the 11 There appears to be a slight anomaly in the last rows of Tables 4a and 4b. For E=20%, classification and identifi-cation appear to increase slightly with errors in the self-explicated importances. This happens because the combina-tion of errors pushes more respondents to the “no-conflict” clusters. As a result, a few more “no-conflict” respon-
28

“Listening In” to find Unmet Customer Needs and Solutions
product-development process. The accuracy in Tables 2, 3, and 4 should be sufficient to focus
this complementary data collection on promising new “fishing grounds.”
Application to Identify New Opportunities for Pickup Truck Platforms The initial application of “listening in” occurred in August of 2001 when 1092 customers
were recruited from the Harris Interactive Panel.12 The customers had purchased a pickup truck
in the past four years (1997-2000) and were given a $20 incentive for this initial test. Pickup
truck customers are a prime target for virtual advisors. For example, Scott Morton, Zettelmeyer,
and Silva-Risso (2001) report that the typical pickup buyer saves 2.9% of the purchase price with
an on-line service compared to an average of 1.5% for all vehicles.
On average each customer spent 45 minutes with the virtual advisor, design palette, and
virtual engineer (when triggered). Most customers found the experience worthwhile. Customers
trusted the virtual advisor by an 8-to-1 margin over dealers and would be more likely to purchase
a vehicle recommended by the virtual advisor by a 4-to-1 margin over a vehicle recommended
by a dealer. For the design palette, 78% found it an enjoyable experience and 82% felt it was a
serious exercise. When the virtual engineer was triggered, 88% found the questions easy to an-
swer and 77% felt that the virtual engineer related well to their needs. Interestingly, 56% of the
customers reported that they would pay for the advise provided by the virtual advisor if it were
included in the price of the pickup truck that they purchased as a result of using the advisor.
In this initial application we set the trigger mechanism to be very sensitive to any utility
drop as suggested by Table 3. The most common pairwise conflicts were a maneuverable full-
sized truck (38%), a compact truck which could tow and haul heavy materials (14%), and a full-
sized truck with a six-cylinder engine (7%). Clustering pairwise conflict profiles, Ρi, identified a
segment of customers with unmet needs for large and maneuverable trucks. Of these respon-
dents, ten percent wanted a top-of-the-line truck and sixteen percent wanted a standard full-sized
pickup. Another segment, thirteen percent of the respondents, had unmet needs for a compact
truck that could tow and haul heavy loads. Given the current engineering frontier, meeting these
needs would raise the price of the truck, thus not every respondent in the unmet-need segment
would purchase a new concept truck. We provide market share estimates below.
dents classified correctly. Two more unmet-needs are identified correctly because it is easier to achieve a “majority” in the remaining clusters. Neither difference is significant at the 0.05 level with a two-tailed t-test. 12 This initial test was based on a stratified random sample of the panel. For this test, all customers were given the opportunity to use the design palette.
29
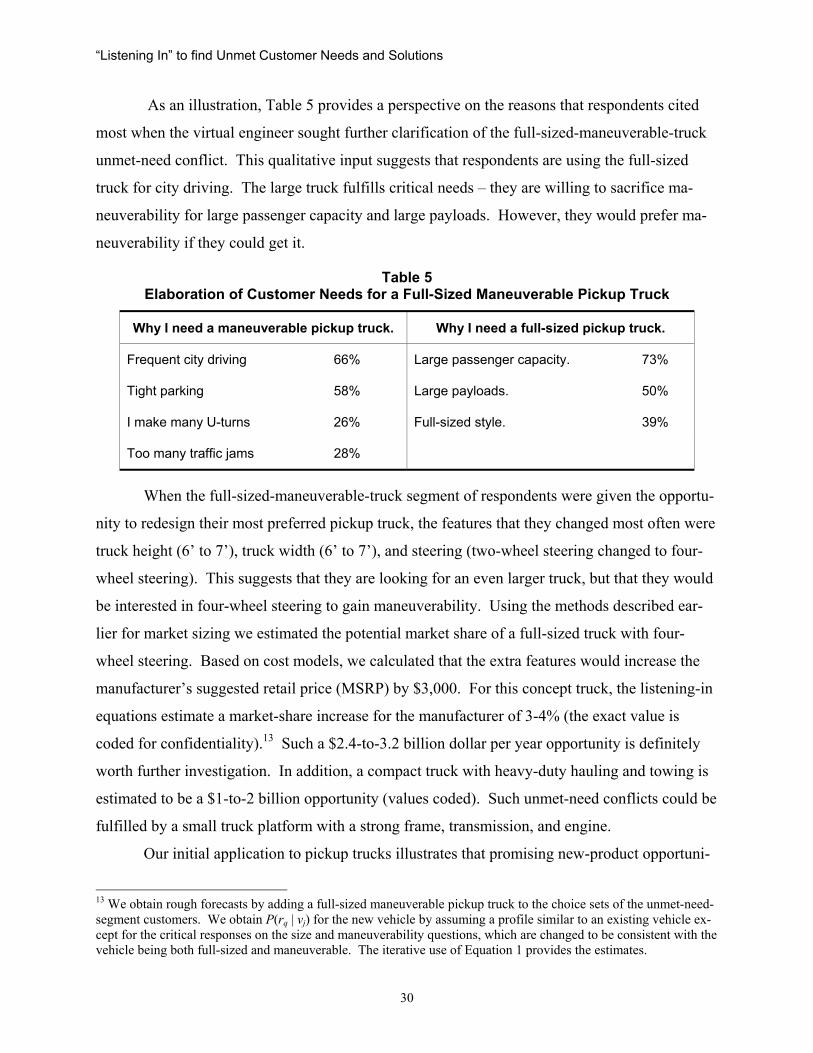
“Listening In” to find Unmet Customer Needs and Solutions
As an illustration, Table 5 provides a perspective on the reasons that respondents cited
most when the virtual engineer sought further clarification of the full-sized-maneuverable-truck
unmet-need conflict. This qualitative input suggests that respondents are using the full-sized
truck for city driving. The large truck fulfills critical needs – they are willing to sacrifice ma-
neuverability for large passenger capacity and large payloads. However, they would prefer ma-
neuverability if they could get it.
Table 5 Elaboration of Customer Needs for a Full-Sized Maneuverable Pickup Truck
Why I need a maneuverable pickup truck. Why I need a full-sized pickup truck.
Frequent city driving 66% Large passenger capacity. 73%
Tight parking 58% Large payloads. 50%
I make many U-turns 26% Full-sized style. 39%
Too many traffic jams 28%
When the full-sized-maneuverable-truck segment of respondents were given the opportu-
nity to redesign their most preferred pickup truck, the features that they changed most often were
truck height (6’ to 7’), truck width (6’ to 7’), and steering (two-wheel steering changed to four-
wheel steering). This suggests that they are looking for an even larger truck, but that they would
be interested in four-wheel steering to gain maneuverability. Using the methods described ear-
lier for market sizing we estimated the potential market share of a full-sized truck with four-
wheel steering. Based on cost models, we calculated that the extra features would increase the
manufacturer’s suggested retail price (MSRP) by $3,000. For this concept truck, the listening-in
equations estimate a market-share increase for the manufacturer of 3-4% (the exact value is
coded for confidentiality).13 Such a $2.4-to-3.2 billion dollar per year opportunity is definitely
worth further investigation. In addition, a compact truck with heavy-duty hauling and towing is
estimated to be a $1-to-2 billion opportunity (values coded). Such unmet-need conflicts could be
fulfilled by a small truck platform with a strong frame, transmission, and engine.
Our initial application to pickup trucks illustrates that promising new-product opportuni-
13 We obtain rough forecasts by adding a full-sized maneuverable pickup truck to the choice sets of the unmet-need-segment customers. We obtain P(rq | vj) for the new vehicle by assuming a profile similar to an existing vehicle ex-cept for the critical responses on the size and maneuverability questions, which are changed to be consistent with the vehicle being both full-sized and maneuverable. The iterative use of Equation 1 provides the estimates.
30

“Listening In” to find Unmet Customer Needs and Solutions
ties can be identified. After our study was complete we learned (previously unknown to us) that
the automotive manufacturer was in the process of introducing four-wheel steering in order to
improve maneuverability of its top-of-the-line pickup truck (the 2002 GMC Denali). This truck
is selling well. We plan to monitor the sales of this truck and, perhaps a basic full-sized truck
with four-wheel steering, to determine whether its sales are in the rough range predicted by the
market-sizing equations.
Summary, Discussion, and Future Research In this paper we explore a methodology in which a virtual engineer “listens in” to a cus-
tomer’s Internet dialogue with a trusted, virtual advisor. The use of such advisors is growing as
they become more effective, as the Internet itself gains further penetration, and as the value of
such advisors becomes recognized by customers. The fraction of people using the Internet for
information and advice is large (62% in autos, 70% in travel, and 56% in health) and advisors are
becoming more common. “Listening in” provides a means to capture the information in these
dialogues – data that are readily available with little incremental cost to the researcher. It is
likely that the listening-in methodology can be applied successfully for these and other complex
customer decisions.
There are five modules to the listening-in methodology – the Bayesian advisor, the listen-
ing-in trigger, the virtual engineer, the design palette, and clustering of identified unmet-need
conflicts. This combination of methods, tested in Monte Carlo simulations and applied in a
“proof-of-concept” demonstration, appears useful for automotive applications. In other applica-
tions some modules can be replaced. For example, the Bayesian advisor might be replaced with
conjoint-analysis-based advisors. Alternatively, sub-matrix clustering of the unmet-need con-
flicts might be replaced with latent-segment analyses.
Like all methodologies, “listening in” will benefit from continuous improvement. The
initial application builds on existing methods that are used in new ways. Each component can be
improved – better methods to identify priors, more efficient look-ahead algorithms, improved
calibration of the trigger mechanism, and better indicators of conflicting needs could all benefit
from further research. The dialogues, the user interfaces, and the presentation of stimuli are all
areas of potential improvement. For example, work is now underway to put more “stretch” into
the design palette and to give the virtual advisors and the virtual engineers personalities based on
“talking heads.”
31

“Listening In” to find Unmet Customer Needs and Solutions, References
References
Balasubramanian, Siva K. and Wagner A. Kamakura (1989), “Measuring Consumer Attitudes Toward the
Marketplace with Tailored Interviews,” Journal of Marketing Research, 26, (August), 311-326.
Barabba, Vincent P. (2003), Anticipate and Lead: The Sustained Competitive Advantage of Knowledge-
Based Adaptive Enterprise, forthcoming.
---- and Gerald Zaltman (1991), Hearing the Voice of the Market: Competitive Advantage Through Crea-
tive Use of Information, (Boston MA: Harvard Business School Press).
Bickart, Barbara A. (1993), “Carryover and Backfire Effects in Marketing Research,” Journal of Market-
ing Research, 30, 1, (February), 52-62.
Blackorby, C., D. Primont, and R. R. Russell (1975), “Budgeting, Decentralization, and Aggregation,”
Annals of Economic Social Measurement, 4, 1, 23-24.
Burchill, Gary W. (1992), Concept Engineering: The Key to Operationally Defining Your Customers’
Requirements. (Cambridge, MA: Center for Quality Management).
Crawford, C. Merle (1991), New Products Management, Third Edition, (Homewood, IL: Richard D. Ir-
win, Inc.), 123-129.
Dahan, Ely and John R. Hauser (2002), “The Virtual Customer,” Journal of Product Innovation Manage-
ment, 19, 5, (September), 332-353.
Dolan, Robert J. (1993), Managing the New Product Development Process, (Reading, MA: Addison-
Wesley Publishing Co.).
Feldman, Jack M. and John G. Lynch, Jr. (1988), “Self-generated Validity: Effects of Measurement on
Belief, Attitude, Intention, and Behavior,” Journal of Applied Psychology, 73, (August), 421-435.
Franke, Nikolaus and Eric von Hippel (2002), “Satisfying Heterogeneous User Needs via Innovation
Toolkits: The Case of Apache Security Software,” MIT Sloan School of Management Working
Paper #4341-02, Cambridge, MA 02421.
Gallagher, Robert (1968), Information Theory and Reliable Communication, (New York, NY: John Wiley
& Sons).
Green, Paul E. and V. Srinivasan (1990), “Conjoint Analysis in Marketing: New Developments With Im-
plications for Research and Practice,” Journal of Marketing, pp. 3-19.
Griffin, Abbie J. and John R. Hauser (1993), “The Voice of the Customer,” Marketing Science, Winter,
pp. 1-27.
Gutman, Jonathan (1982), “A Means-End Chain Model Based on Customer Categorization Processes.”
Journal of Marketing, 46, (Spring), 60-72.
Hauser, John R. (1978), "Testing the Accuracy, Usefulness and Significance of Probabilistic Models: An
Information Theoretic Approach," Operations Research, Vol. 26, No. 3, (May-June), 406-421.
R1

“Listening In” to find Unmet Customer Needs and Solutions, References
______ and Glen L. Urban (1986), "Value Priority Hypotheses for Consumer Budget Plans," Journal of
Consumer Research, Vol. 12, No. 4, (March), 446-462.
Herniter, Jerry (1973), “An Entropy Model of Brand Purchase Behavior,” Journal of Marketing Research,
10, 361-375.
J. D. Power and Associates (2001), “New Autoshopper.com Study,” (Agoura Hills, CA: J. D. Power and
Associates).
Kamakura, Wagner A. and Michel Wedel (1995), “Life-Style Segmentation with Tailored Interviewing,”
Journal of Marketing Research, 32, (August), 308-317.
Kolpasky, Kevin (2002), “NPD Practices: Bringing Ideas to the Development Stage at General Motors,”
PDMA Visions, 26, 1, (January), 13-15.
Kullback, S. (1954). Information Theory and Statistics, (New York: John Wiley & Sons).
Lehmann, Donald R. and Russell S. Winer (1994), Product Management, (Boston, MA: Richard D. Ir-
win, Inc.).
Liechty, John, Venkatram Ramaswamy, Steven Cohen (2001), “Choice-Menus for Mass Customization:
An Experimental Approach for Analyzing Customer Demand With an Application to a Web-
based Information Service,” Journal of Marketing Research, 38, 2, (May).
McFadden, Daniel (1974), “Conditional Logit Analysis of Qualitative Choice Behavior,” Frontiers in
Econometrics, P. Zarembka, ed., (New York: Academic Press), 105-142.
Narasimhan, Chakravarthi and Subrata K. Sen (1983), “New Product Models for Test Market Data,”
Journal of Marketing47, 1, (Winter), 11-24.
Nowlis, Stephen M. and Itamar Simonson (1997), “Attribute-Task Compatibility as a Determinant of
Consumer Preference Reversals,” Journal of Marketing Research, 36, (May), 205-218.
Plummer, Joseph T. (1974), “The Concept and Application of Life Style Segmentation,” Journal of Mar-
keting, 38, (January), 33-37.
Prelec, Drazen (2001), “A Two-person Scoring Rule for Subjective Reports,” Working Paper (Cam-
bridge, MA: MIT Sloan School).
Savage, L. J. (1971). “Elicitation of Personal Probabilities and Expectations,” Journal of the American
Statistical Association, 66, 783-801.
Scott Morton, Fiona, Florian Zettelmeyer, and Jorge Silva-Risso (2001), “Internet Car Retailing,” Journal
of Industrial Economics, 49, 4, 501-519.
Shocker, Allan D. and V. Srinivasan (1979), “Multiattribute Approaches to Product Concept Evaluation
and Generation: A Critical Review,” Journal of Marketing Research, 16, (May), 159-180.
Simmons, Carolyn J., Barbara A. Bickart, and John G. Lynch, Jr. (1993), “Capturing and Creating Public
Opinion in Survey Research,” Journal of Consumer Research, 30, (September), 316-329.
R2

“Listening In” to find Unmet Customer Needs and Solutions, References
Singh, Jagdip, Roy D. Howell, and Gary K. Rhoads (1990), “Adaptive Designs for Likert-Type Data: An
Approach for Implementing Marketing Surveys,” Journal of Marketing Research, 27, (August)
304-321.
Srinivasan, V. (1982), “Comments on the Role of Price in Individual Utility Judgments,” in Choice Mod-
els for Buyer Behavior, Leigh McAlister, ed., (Greenwich, CT: JAI Press, Inc.), 81-90.
Time (1938), "Henry Grady Weaver - 2,000,000 Opinions Make a Fact", Time Magazine, 32, 20, (Nov. 14)
Tourangeau, Roger, Lance J. Rips, and Kenneth A. Rasinski (2000), The Psychology of Survey Response,
(New York, NY: Cambridge University Press).
Ulrich, Karl T. and Scott Pearson (1998), “Assessing the Importance of Design Through Product Archae-
ology,” Management Science, 44,3, (March),352-369.
Urban, Glen L. and John R. Hauser, Design and Marketing of New Products, 2E, (Englewood Cliffs, NJ:
Prentice Hall, Inc.).
______, ______, and John. H. Roberts (1990), "Prelaunch Forecasting of New Automobiles: Models and
Implementation," Management Science, Vol. 36, No. 4, (April), 401-421.
______, Fareena Sultan, and William J. Qualls (2000), “Placing Trust at the Center of Your Internet
Strategy,” Sloan Management Review, 42, 1, (Fall), 39-48.
______, Bruce Weinberg, and John R. Hauser (1996), "Premarket Forecasting of Really-New Products,"
Journal of Marketing, 60,1, (January), 47-60. Abstracted in the Journal of Financial Abstracts, 2,
23A, (June) 1995.
von Hippel, Eric (1986), “Lead Users: A Source of Novel Product Concepts,” Management Science, 32,
791-805.
______ (1988), The Sources of Innovation, (New York, NY: Oxford University Press).
______ (2001a), “Innovation by User Communities: Learning from Open-Source Software,” MIT Sloan
Management Review, 42, 4, (Summer), 82-86.
______ (2001b), “Perspective: User Toolkits for Innovation,” Journal of Product Innovation Manage-
ment, 18, 247-257.
Wind, Jerry (1982), Product Policy, (Reading, MA: Addison-Wesley, Inc.).
Zaltman, Gerald (1997), “Rethinking Market Research: Putting People Back In,” Journal of Marketing
Research, 23 (November), 424-437.
R3
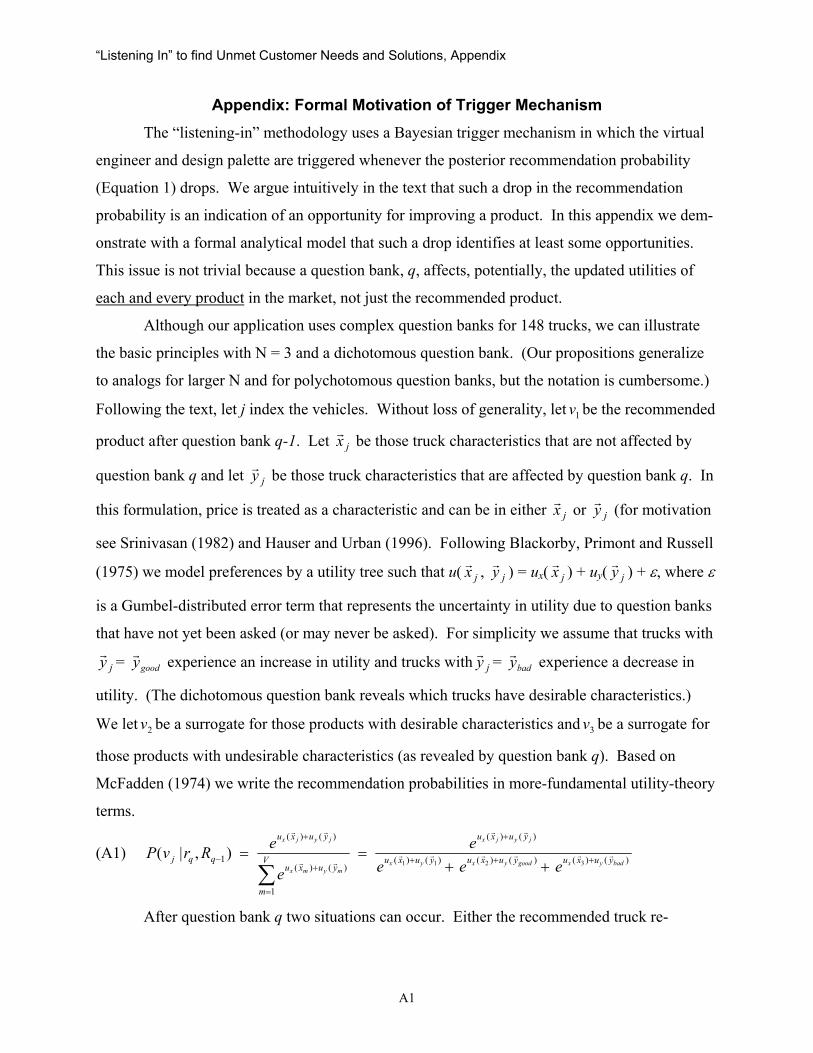
“Listening In” to find Unmet Customer Needs and Solutions, Appendix
Appendix: Formal Motivation of Trigger Mechanism The “listening-in” methodology uses a Bayesian trigger mechanism in which the virtual
engineer and design palette are triggered whenever the posterior recommendation probability
(Equation 1) drops. We argue intuitively in the text that such a drop in the recommendation
probability is an indication of an opportunity for improving a product. In this appendix we dem-
onstrate with a formal analytical model that such a drop identifies at least some opportunities.
This issue is not trivial because a question bank, q, affects, potentially, the updated utilities of
each and every product in the market, not just the recommended product.
Although our application uses complex question banks for 148 trucks, we can illustrate
the basic principles with N = 3 and a dichotomous question bank. (Our propositions generalize
to analogs for larger N and for polychotomous question banks, but the notation is cumbersome.)
Following the text, let j index the vehicles. Without loss of generality, let be the recommended
product after question bank q-1. Let
1v
jxr be those truck characteristics that are not affected by
question bank q and let jyr be those truck characteristics that are affected by question bank q. In
this formulation, price is treated as a characteristic and can be in either jxr or jyr (for motivation
see Srinivasan (1982) and Hauser and Urban (1996). Following Blackorby, Primont and Russell
(1975) we model preferences by a utility tree such that u( jxr , jyr ) = ux( jxr ) + uy( jyr ) + ε, where ε
is a Gumbel-distributed error term that represents the uncertainty in utility due to question banks
that have not yet been asked (or may never be asked). For simplicity we assume that trucks with
jyr = goodyr experience an increase in utility and trucks with jyr = badyr experience a decrease in
utility. (The dichotomous question bank reveals which trucks have desirable characteristics.)
We let be a surrogate for those products with desirable characteristics and v be a surrogate for
those products with undesirable characteristics (as revealed by question bank q). Based on
McFadden (1974) we write the recommendation probabilities in more-fundamental utility-theory
terms.
2v 3
(A1) )()()()()()(
)()(
1
)()(
)()(
1 3211),|(
badyxgoodyxyx
jyjx
mymx
jyjx
yuxuyuxuyuxu
yuxu
V
m
yuxu
yuxu
qqj eeee
e
eRrvP rrrrrr
rr
rr
rr
+++
+
=
+
+
− ++==
∑
After question bank q two situations can occur. Either the recommended truck re-
A1

“Listening In” to find Unmet Customer Needs and Solutions, Appendix
mains or the recommended truck becomes . It cannot become because, even if = 1v 2v 3v 1yr badyr ,
would still be preferred to . 1v 3v
Proposition 1. If the recommended truck after question bank q is the same truck as that recommended after question bank q-1, then v has undesirable characteristics (1 1yr =
) if and only if decreases. badyr ),|( 11 −qq RrvP
Proposition 2. If the recommended truck after question bank q is different than the truck recommended after question bank q-1 and if the recommendation probability de-creases, then (1) v has undesirable characteristics (1 1yr = badyr ) and (2) a truck with mixed characteristics, and , would have higher utility than the both the recommended truck after q-1 question banks and the recommended truck after q question banks.
1xr 2yr
Proofs. Straightforward algebra establishes that - is proportional to ),|( 11 −qq RrvP )|( 11 −qRvP
0)()()()()()( 3131 ≥− ++++ badyxxgoodyxx yuxuxuyuxuxu eerrrrrr
if 1yr = goodyr and )()( 2 badyx yux)( 1x xue u rrr++ - )()()( 21 goodyxx yuxuxue
rrr++ ≤
0 if = . Algebra also establishes that the proportionality (denominator) is positive. This
establishes Proposition 1. If the recommended truck changes after question bank q, then
< and because the recommendation probability decreases we have
< . Thus < and, by Proposition 1, we have
that = . This establishes the first result in Proposition 2. Because was recommended
before question bank q, we have u
1yr badyr
),|( 11 −qq RrvP ),|( 12 −qq RrvP
),|( 12 −qq RrvP )|( 11 −qRvP |( 1vP
1yr badyr
)( 1xx
)
)
, qR
(ux
1−qr
2x
)|( 11 −qRvP
1vrr
> and by supposition we have -)( goody yu r ( bady yu )r
> 0, thus a product with the features, 1xr and 2yr , will have higher utility than either or . This
establishes the second result in Proposition 2.
1v 2v
Generalizations. If there are n2 trucks like v2 and n3 trucks like v3, then the analogs to
Propositions 1 and 2 are readily proven. The numbers n2 and n3 enter the equations for
- , but the basic proofs remain intact. If there are many trucks
with or , but with different
),|( 11 −qq RrvP
goodyr)|( 11 −qRvP
badyr jxr , the expressions for - in-
clude more terms, but each can be proven to have the correct sign – increases if
and decreases if . With these changes, the remaining portions of the proofs
follow as above.
),|( 11 −qq RrvP )|( 11 −qRvP
goodyr badyr
A2