“earthquake history of north carolina” mineral and land resources/geolog… · ground shaking...
TRANSCRIPT
Earthquake Education Workshops September 2014
Charlotte, Candler, and Winston-Salem, NC
“Earthquake History of North Carolina”
presented by
Dr. Kenneth B. Taylor
State Geologist Of North Carolina
N.C. Geological Survey Division of Land Resources
(919) 707-9211

Magnitude 5.8 VIRGINIA Tuesday, August 23, 2011 at 13:51:04 EDT
Police tape is seen in front of the National Cathedral in
the Washington after a piece of the left spire fell off
during earthquake shaking in the Washington area. The
magnitude 5.8 earthquake centered in Virginia forced
evacuations of all the monuments on the National Mall in
Washington and rattled nerves from Georgia to
Massachusetts.
(AP Photo/Pablo Martinez Monsivais)
Largest earthquake to shake the
eastern U.S. since 1944 and the
2nd largest in Virginia history.
Shaking was felt from Georgia to
Canada, caused light damage
and panicked hundreds of
thousands of people to evacuate
buildings in New York,
Washington and other cities.
There were no reported deaths,
and scattered reports of minor
injuries.
Image courtesy of the US Geological Survey

Modified Mercalli Intensity
Perceived
Shaking
Extreme
Violent
Severe
Very Strong
Strong
Moderate
Light
Weak
Not Felt
USGS Estimated shaking Intensity from M 5.8 Earthquake
Intensity scales were developed to
standardize the measurements and
ease comparison of different
earthquakes. The Modified-
Mercalli Intensity scale documents
the perceived level of shaking from
I (lowest) to XII (highest – total
destruction).
Image courtesy of the US Geological Survey
Magnitude 5.8 VIRGINIA Tuesday, August 23, 2011 at 13:51:04 EDT


Impacts and Damages
• Private Property Damage (Destroyed – 33; Major Damage
– 180; Minor Damage – 510) Losses = $15 million.
• Power outages (3 ¾ hrs)
• Cell phone blockages (30 min)
• Disruption of east coast air traffic (two hrs) and Metrorail
(16 hrs).
• North Anna Nuclear Station Unit 1 and Unit 2 (off-line until
September 17th – 25 days).
• Disaster declaration for Individual Assistance requested
September 20th. [Hurricane Irene impacted Virginia on
August 27th]

Challenges in planning for earthquakes
• Motivating people for a low probability but high
consequence event. [Show them scenarios of
what could happen].
• NO WARNING. [Preplanning of the event].
• Information Gap -- communication disruption and
need for wide-area intelligence collection. [Use
modeling to predict impact].
• Aftershocks -- disaster has not yet ended. [Public
education and information].
• Access to impacted area. [Use pre-event
assessment].


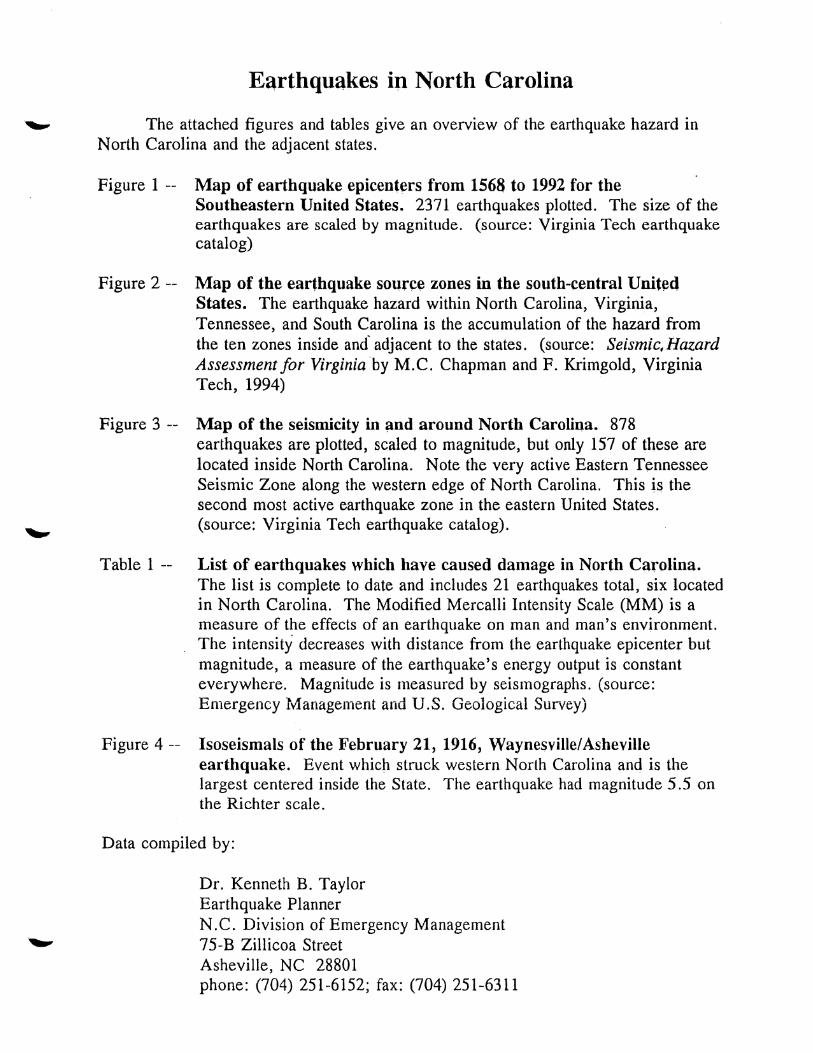
Map of earthquake
epicenters from
1568 to 1992 for the
Southeastern United
States.
2371 earthquakes
plotted. The size of
the earthquakes are
scaled by
magnitude. (source:
Virginia Tech
earthquake catalog)


Earthquakes in North Carolina
• 22 times from 1735 to present earthquakes
have caused damage in N.C.
• Greatest damage from the 1861 Wilkesboro,
NC; 1886 Charleston, SC; 1916 Asheville,
NC; and 1926 Mitchell Co., NC.
• Last damaging event – 1981 Henderson Co,
NC.
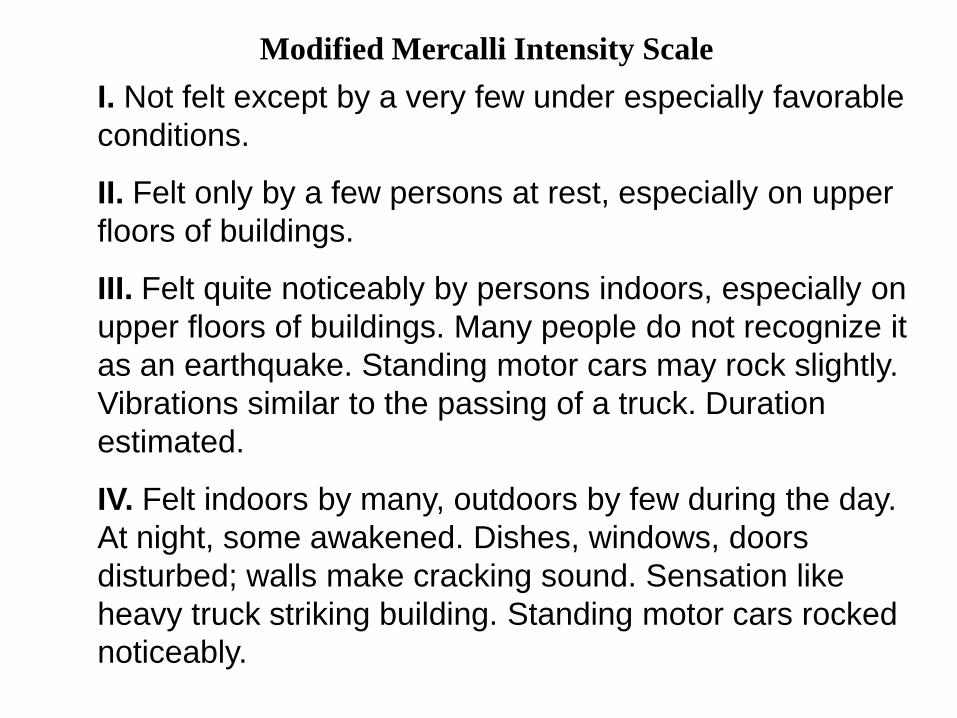
I. Not felt except by a very few under especially favorable
conditions.
II. Felt only by a few persons at rest, especially on upper
floors of buildings.
III. Felt quite noticeably by persons indoors, especially on
upper floors of buildings. Many people do not recognize it
as an earthquake. Standing motor cars may rock slightly.
Vibrations similar to the passing of a truck. Duration
estimated.
IV. Felt indoors by many, outdoors by few during the day.
At night, some awakened. Dishes, windows, doors
disturbed; walls make cracking sound. Sensation like
heavy truck striking building. Standing motor cars rocked
noticeably.
Modified Mercalli Intensity Scale

V. Felt by nearly everyone; many awakened. Some dishes,
windows broken. Unstable objects overturned. Pendulum
clocks may stop.
VI. Felt by all, many frightened. Some heavy furniture
moved; a few instances of fallen plaster. Damage slight.
VII. Damage negligible in buildings of good design and
construction; slight to moderate in well-built ordinary
structures; considerable damage in poorly built or badly
designed structures; some chimneys broken.
VIII. Damage slight in specially designed structures;
considerable damage in ordinary substantial buildings with
partial collapse. Damage great in poorly built structures.
Fall of chimneys, factory stacks, columns, monuments,
walls. Heavy furniture overturned.
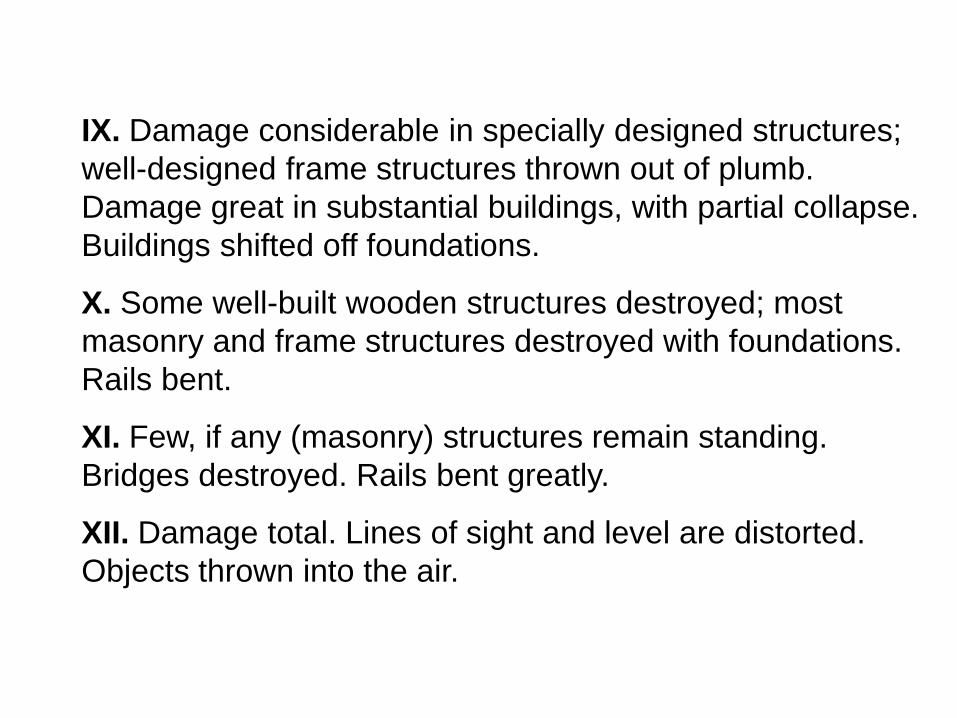
IX. Damage considerable in specially designed structures;
well-designed frame structures thrown out of plumb.
Damage great in substantial buildings, with partial collapse.
Buildings shifted off foundations.
X. Some well-built wooden structures destroyed; most
masonry and frame structures destroyed with foundations.
Rails bent.
XI. Few, if any (masonry) structures remain standing.
Bridges destroyed. Rails bent greatly.
XII. Damage total. Lines of sight and level are distorted.
Objects thrown into the air.

December 16, 1811
New Madrid
Earthquake

Charleston, South
Carolina earthquake
of August 31, 1886.
Magnitude of 7.3
estimated from
intensity and felt area.

Isoseismal map for
the Giles County,
Virginia earthquake
of May 31, 1897 --
the largest to occur
in that State.
Earthquake
magnitude of 5.8
estimated from
intensity and felt
area. This is the 3rd
largest eastern US
quake in the last
200 years and was
felt in twelve states.
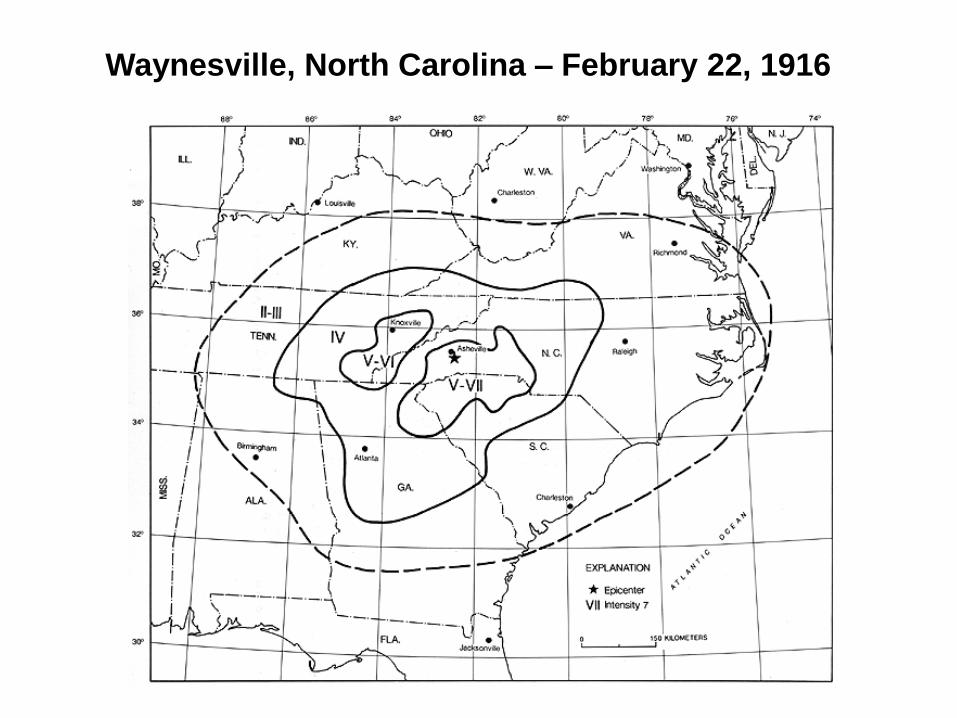
Waynesville, North Carolina – February 22, 1916


Two-percent probability of exceedance in 50 years map of peak ground acceleration


Appendix 10 Annex B NCEOP
April 2009
B -10-1
APPENDIX 10 TO ANNEX B NORTH CAROLINA EMERGENCY OPERATIONS PLAN
EARTHQUAKE OPERATIONS PLAN
1. PURPOSE. This operations plan supports the NCEOP and outlines actions and coordination procedures the State Emergency Operations Center (EOC) and the State Emergency Response Team (SERT) take and follow when an earthquake has affected North Carolina.
2. SITUATION.
In the 274 years since 1735, 22 earthquakes have caused damage in North Carolina. Of these events, only seven were located within the state. In terms of the intensity of ground motion, four earthquakes have caused structural damage as measured on the Modified Mercalli Intensity at level VII [level 7]) -- August 31, 1861 Wilkesboro, N.C. (magnitude 5.1); August 31, 1886 Charleston, S.C. (magnitude 7.3); February 21, 1916 Asheville, NC (magnitude 5.5) and July 8, 1926 Mitchell County (magnitude 5.2). The last damaging earthquake struck Henderson County in 1981.
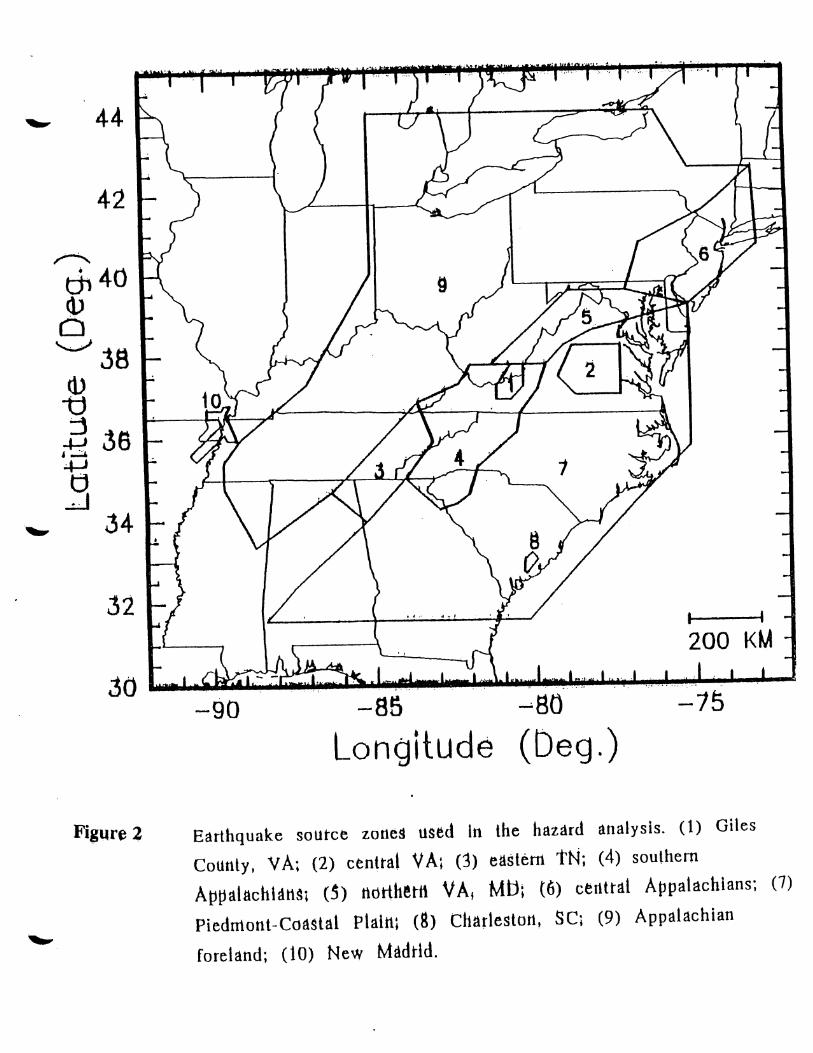
Seismologists have delineated four (4) earthquake source zones, which could generate ground motion of sufficient strength to cause structural damage in North Carolina. These are: Eastern Tennessee Seismic Zone; Southern Appalachian Seismic Zone; Charleston, S.C. Seismic Zone and the Giles County, Virginia Seismic Zone.
Figure 1
31 March 2009

Appendix 10 Annex B NCEOPApril 2009
B -10-2 31 March 2009
To determine the earthquake hazard nationwide, the U.S. Geological Survey has produced two principal earthquake hazard maps are “Peak Acceleration (%g) with 10% Probability of Exceedance in 50 Years” [Figure 2] and “Peak Acceleration (%g) with 2% Probability of Exceedance in 50 Years” [Figure 3]. These maps show the predicted level of acceleration in percent of g (the pull of gravity, “g” = 9.8 meters/sec/sec or 32 feet/sec/sec) with a 10% and 2% probability of exceedance during a 50-year interval. The 10% map represents the level of shaking for a 425-year return period. The 2% map represents the level over a 2,500-year return period.
Figure 2

Appendix 10 Annex B NCEOP
April 2009
B -10-3
Figure 3
For a 10% exceedance (or 90% non-exceedance), the map [Figure 2] shows that peak accelerations in North Carolina range from three percent g (3%g) in the Coastal Plain to eight percent g (8%g) along the Blue Ridge Mountains. The table below shows that there is a 90% chance that ground shaking over the next 50 years would be between the threshold of architectural damage with cracks in walls and chimneys to the threshold of architectural failure with chimneys falling. The relationship between levels of acceleration the levels of damage are:
3% to 6% g – threshold of architectural damage (walls and chimneys crack). 6% to 12% g – threshold of architectural failure (chimneys, unsecured items fall).
12% to 24% g – threshold of structural damage (load bearing walls crack). 24% to 48% g – threshold of structural failure (buildings fall).
For the 2% exceedance (or 98% non-exceedance), the map [Figure 3] shows at least 3% g (threshold of architectural damage) everywhere in North Carolina and architectural damage in all counties west of the Inner Coastal Plain. The upper
31 March 2009

Appendix 10 Annex B NCEOPApril 2009
B -10-4 31 March 2009
bound of ground shaking is 30% g in Swain and Graham counties with structural failure in all or parts of Cherokee, Graham, Swain, Polk, Macon, Jackson, Haywood and Madison counties. Also note that structural damage could occur along the border with South Carolina from a large Charleston, S.C. event.Structural damage would also be expected in all counties east of Buncombe and west of Iredell.
To fully understand the expected level of shaking, there is a 90% chance that ground shaking in North Carolina would not exceed architectural damage over most of western North Carolina. There is a 98% chance shaking up to a level to cause structural damage i.e. Modified Mercalli Intensity VII could occur anywhere in North Carolina west of Iredell County or in counties along the border with South Carolina.
Essential Elements of Information (EEI). This information is necessary to determine required response actions and resources (Agencies must be tasked to answer these EEI).
a. Define the disaster area. What area, (counties, cities, and infrastructure) is affected and what is the damage?
(1) Number of casualties and displaced personnel? (2) Extent of damage to buildings and structures? (3) Extent of damage to roads and bridges:
(a) Which highways are closed and where are they closed? (b) What routes are open into the effected area for use by operational
and logistics response units?
(4) What areas are without power? (5) What is the damage to water/sewer systems in the disaster area? (6) What is the damage to medical infrastructure? (7) Aerial and ground reconnaissance information.
Before this information can be collected, the State EOC must fully use the DHS/FEMA loss estimation software – HAZUS. This GIS application can provide modeling results which have been show to rapidly estimate the extent of expected damage and the level of that damage.

Aftershocks -- There is not just one event, but there may be a series of aftershocks. If for example, the
main shock has a magnitude of say 6.0 on the Richter Scale, aftershocks of up to ½ Richter unit smaller
can occur afterwards. The number of aftershocks per unit of time will decrease in a power law
relationship.
For example, if three (3) aftershocks occur between the main shock and one hour, then one could expect 3 aftershocks between one hour and 10 hours (~ ½ day), 3 between 10 hours and 100 hours (~5 days), 3 between 100 hours and 1000 hours (~ 50 days). For a larger number of aftershocks, the same rule applies. If 20 aftershocks occur within the first hour following the main shock, then one should expect 20 between one and ten hours, 20 between 10 hours and 100 hours, and 20 between 100 hours and 1000 hours. U.S. Geological Survey – National Earthquake Information Center (USGS-NEIC) Earthquake Notification System (ENS) Automatic detection and location of seismic events by computer monitoring seismic networks across the U.S. as well as worldwide can locate and determine the magnitude of earthquakes in 5 to 15 minutes. The time delay is not due to the computer processing, rather it is due to the speed earthquake waves travel. Even at 6 km/sec, primary waves from the other side of the world take 30 to 45 minutes to register in the United States. For small events, ones with magnitude less than 3.0, seismologists must identify the time segment and tag the signals for location and determination.
In 1977 when the National Earthquake Hazard Reduction Program (NEHRP) was enacted, the U.S.
Geological Survey (USGS) was tasked with generating a series of nationwide ground motion estimations.
These maps have been revised every six years since the 1980s and can be found on the USGS
Earthquake Hazards Program website: http://earthquake.usgs.gov/research/hazmaps/. The two
principal maps hazard maps are “Peak Acceleration (%g) with 10% Probability of Exceedance in 50
Years” and “Peak Acceleration (%g) with 2% Probability of Exceedance in 50 Years.” The maps show the
predicted level of acceleration in percent of g (the pull of gravity, “g” = 9.8 meters/sec/sec or 32
feet/sec/sec) with a 10% and 2% probability of exceedance during a 50-year interval. The 10% map
represents the level of shaking for a 425-year return period. The 2% map represents the level over a
2,500-year return period.
The maps, which are referenced in building code design manuals, show that peak accelerations in North
Carolina range from three percent g (3%g) to eight percent g (8%g) with a 90% chance of non-
exceedance and six percent g (6%g) to thirty percent g (30%g) with a 98% chance of non-exceedance in
50 years. The relationship between levels of acceleration the levels of damage are:
3% to 6% g – threshold of architectural damage (cracks in walls and chimneys).
6% to 12% g – threshold of architectural failure (fall of chimneys and unsecured items).
12% to 24% g – threshold of structural damage (load bearing walls with cracks).
24% to 48% g – threshold of structural failure (buildings falling or are too weaken).
To summarize, the earthquake risk in North Carolina is moderate, not high or very-high like in California,
but also not low like North Dakota.