anzltr 26th report- 31.12.14 pdf · brisbane, melbourne, perth, sydney) and new zealand (auckland)....
TRANSCRIPT
INSIDE BACK COVERCD Included
SLIDESReport PowerPoint
Fr om the C om bine d R e g is t r i e s
o f the A us t r a l i a n a nd N e w Ze a la nd
L iv e r Tr a ns p la n t C e n t r e s
D A T A T O 3 1 - 1 2 - 2 0 1 4
Brisbane
Sydney
Melbourne
dn
ala
eZ
w
eN
Perth
Auckland
26TH
R E P O R T
Adelaide
AUSTRALIA & NEW ZEALANDAUSTRALIA & NEW ZEALAND
© copyright ANZLTR Data to 31.12.2014
CL
ICK
HE
RE
to
go
to
p
ag
eC
on
ten
ts
© copyright ANZLTR Data to 31.12.2014
COORDINATING CENTRE
ANZLT Registry www.anzltr.orgPrincess Alexandra HospitalIpswich RdWOOLLOONGABBA, QLD, 4102
Professor Stephen Lynch EditorMs Glenda Balderson Editor/Liaison OfficerMs Debra Cormack Graphics
Phone (61-7) 3176 2385 G.Balderson Fax (61-7) 3176 2999 G.Balderson
Email [email protected]
MANAGEMENT COMMITTEE
Professor L. DelreviereSir Charles Gairdner Hospital, WA
Professor R.M. JonesAustin Hospital, VIC
Professor S.V. LynchPrincess Alexandra Hospital, QLD
Professor G.W. McCaughanRoyal Prince Alfred Hospital, NSW
Professor S. MunnAuckland Hospital, NEW ZEALAND
Dr. R. PadburyFlinders Medical Centre, SA
Ms G.A. BaldersonPrincess Alexandra Hospital, QLD
FUNDING
ANZLTR is funded by the Australian Organ and Tissue Authority.
CITATION
The suggested citation for this report is as follows: ANZLT Registry Report 2014 Australia and New Zealand Liver Transplant Registry Brisbane, QLD, AUSTRALIA Editors: S.V. Lynch, G.A. Balderson
STATISTICAL METHODS
Kaplan-Meier survival curves have been produced using IBM SPSS® for Windows™ Release 22.0.
ACKNOWLEDGMENT
The Cancer Registry is maintained at Transplantation Services, Royal Prince Alfred Hospital, Sydney. Report prepared by Pamela Dilworth, Marie Mulhearn and Dr Deborah Verran.
Director: Professor G.W McCaughanAll queries to: Dr Deborah Verran Email [email protected]
CL
ICK
HE
RE
to
go
to
p
ag
eC
on
ten
ts

ContentsContentsPreface
Summary
Section 1
Summary Statistics
Number of New Patients
Age of Recipients
Number of Transplants and Type of Graft by Year
Section 2
Primary Diseases of Recipients
Primary Diagnosis by Era
Chronic Viral Hepatitis - Adults Recipients
Section 3
Patient Survival
Patient Survival by Age at Primary Transplant and Era of Transplant
Patient Survival by Type of Primary Graft
Patient Survival by Weight at Transplant - Children
Patient Survival by Primary Disease
Section 4
Graft Survival
Indication for Retransplantation
Section 5
Causes of Patient Death
Section 6
Deceased Donors by Year
Donor Age and Graft Outcome
Section 7
Living Donor Transplantation
Section 8
Waiting List Activity and Outcome
Waiting Time by Blood Group and Outcome
Section 9
Summary and Type of Cancer
Liver Malignancy as Primary or Secondary Diagnosis
- Type, Incidence, Survival & Mortality
De Novo Non - Skin Cancers
Skin Cancers Post Transplant
Cumulative Rate of Cancer Development
Appendix I - Transplant Units Australia and New Zealand
Appendix II - Metabolic Disorders
Appendix III - Other Diseases
Appendix IV - Fulminant Hepatic Failure
Appendix V - Causes of Patient Death
1
2-4
Demographic Data
5
6
7
8-9
Primary Diagnosis
10-11
12-13
14-15
Patient Survival
16
17-19
20
21
22-24
Graft Outcome
25-27
28-29
Causes of Death
30-33
Deceased Donor Information
34
35
Living Donor Transplantation
36
Waiting List
37-38
39
Liver Transplantation and Cancer
40
41-46
46-51
51-52
52
53
54
55
56
57
CONTENTS
26TH
ANZLT REGISTRY
R E P O R T
DATA TO 31/12/2014 © copyright ANZLTR Data to 31.12.2014
PrefacePreface
1.
PREFACE
We are pleased to present the 26th Report of the Australia and New Zealand Liver
Transplant Registry (ANZLTR). This report contains data to the 31st December 2014
and analyses the cumulative data since the establishment of the first liver
transplantation unit in Australia or New Zealand in 1985.
The Australia and New Zealand Liver Transplant Registry (ANZLTR) is a
collaborative effort of the liver transplantation centres in Australia (Adelaide,
Brisbane, Melbourne, Perth, Sydney) and New Zealand (Auckland). The Registry is
supervised by the Management Committee which is involved in the ongoing
supervision of the development of the Registry. The members of the Management
Committee are listed on the front page.
Donor data have been supplied by the Australia and New Zealand Organ Donor
Registry and we thank them for their collaboration.
The Editors would also like to thank the staff of all the Liver Transplant Units who
contribute their data by direct entry into the ANZLTR database. A full list of the Units
and their contact information can be found in Appendix I. In particular we are grateful
to the efforts of Pamela Dilworth, Program Manager and Marie Mulhearn for their
continuing contribution to the maintenance of the Cancer Registry which is based at
the Royal Prince Alfred Hospital, Sydney and who, together with Dr Deborah Verran,
prepare the Cancer Report.
We are grateful to the Australian Government, through the Australian Organ and
Tissue Authority, for their ongoing financial support.
Comments are always welcome and should be forwarded to the Coordinating
Centre at the contact information listed on the front page as should requests for
further copies of this Report. The report is now also available on the ANZLTR public
web site www.anzltr.org from where the report can be downloaded. Slides are
available on request from the Coordinating Centre.
Stephen Lynch
Glenda Balderson
26TH
ANZLT REGISTRY
R E P O R T
DATA TO 31/12/2014 © copyright ANZLTR Data to 31.12.2014
CL
ICK
HE
RE
to
go
to
p
ag
eC
on
ten
ts

SummarySummary
2.
SUMMARY
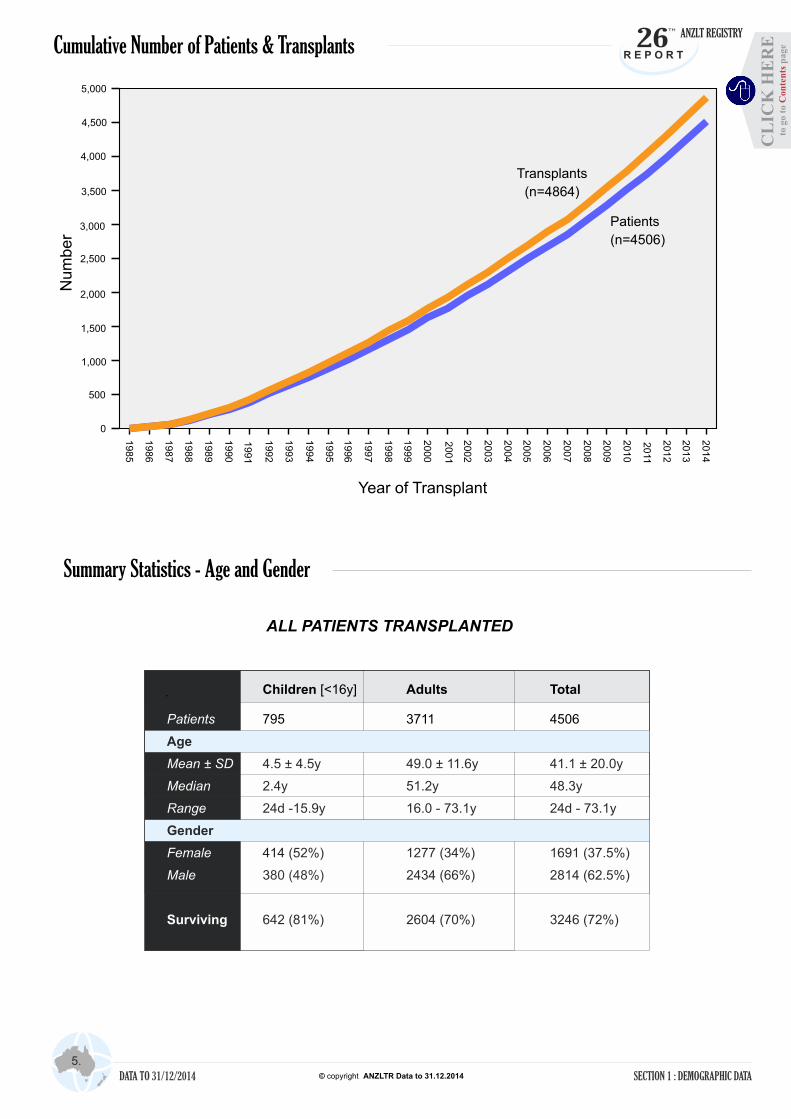
5. Between January 1985 and 31st December 2014, 4864 orthotopic liver transplants (OLT) were performed in Australia and New Zealand on 4506 patients, 3711 adult patients [82%] and 795 children ( < 16 years) [18%]. The median age of all recipients was 48.3 years. The ages ranged from 24 days to 73.1 years. There is a significant difference in gender distribution between children (M=48%) and adults (M=66%).
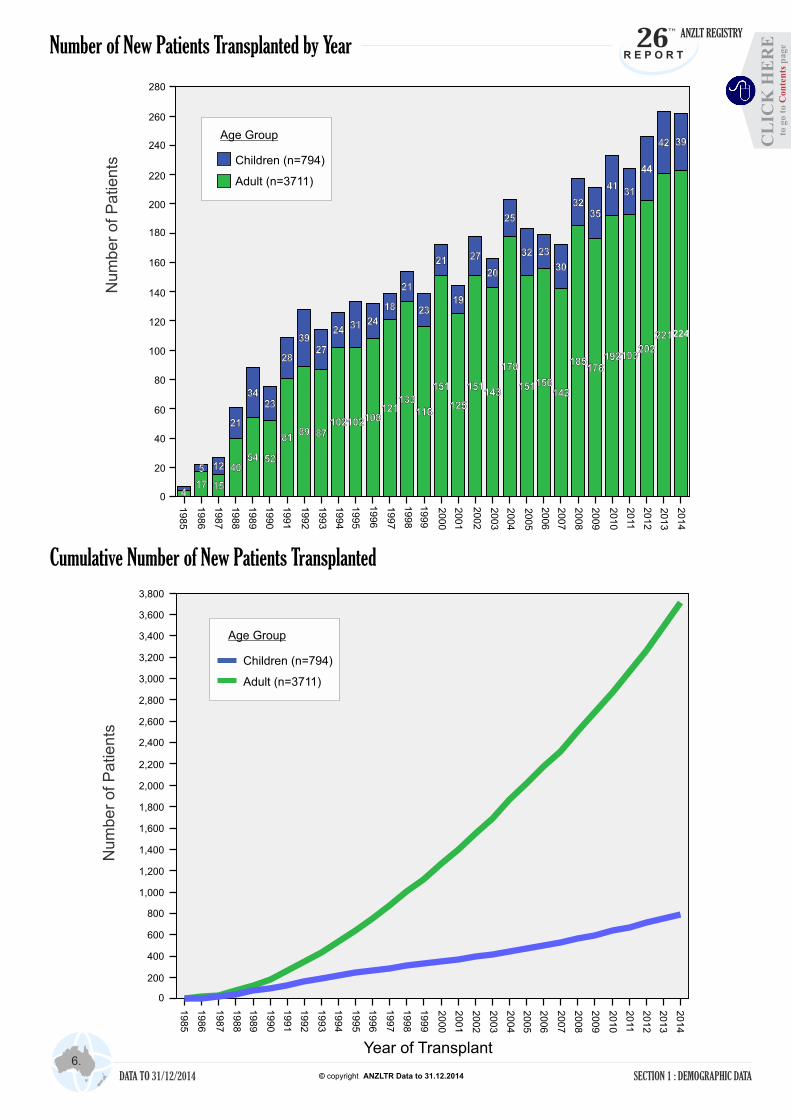
6. Two hundred and sixty-three new patients were transplanted in 2014 compared with 264 in 2013.
7. The trend to increasing age of adult recipients in recent years continued and the overall adult median age is now 51.2 years. The median age of new adult recipients in 2010-14 was 54.3 years.
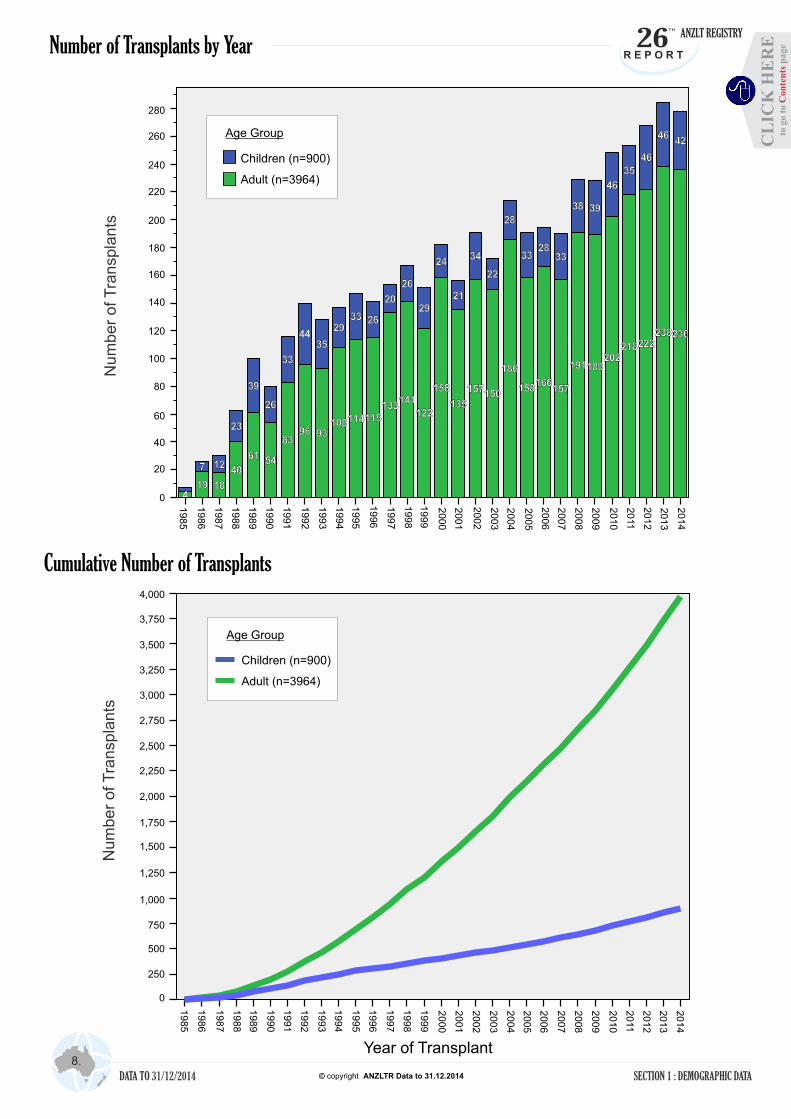
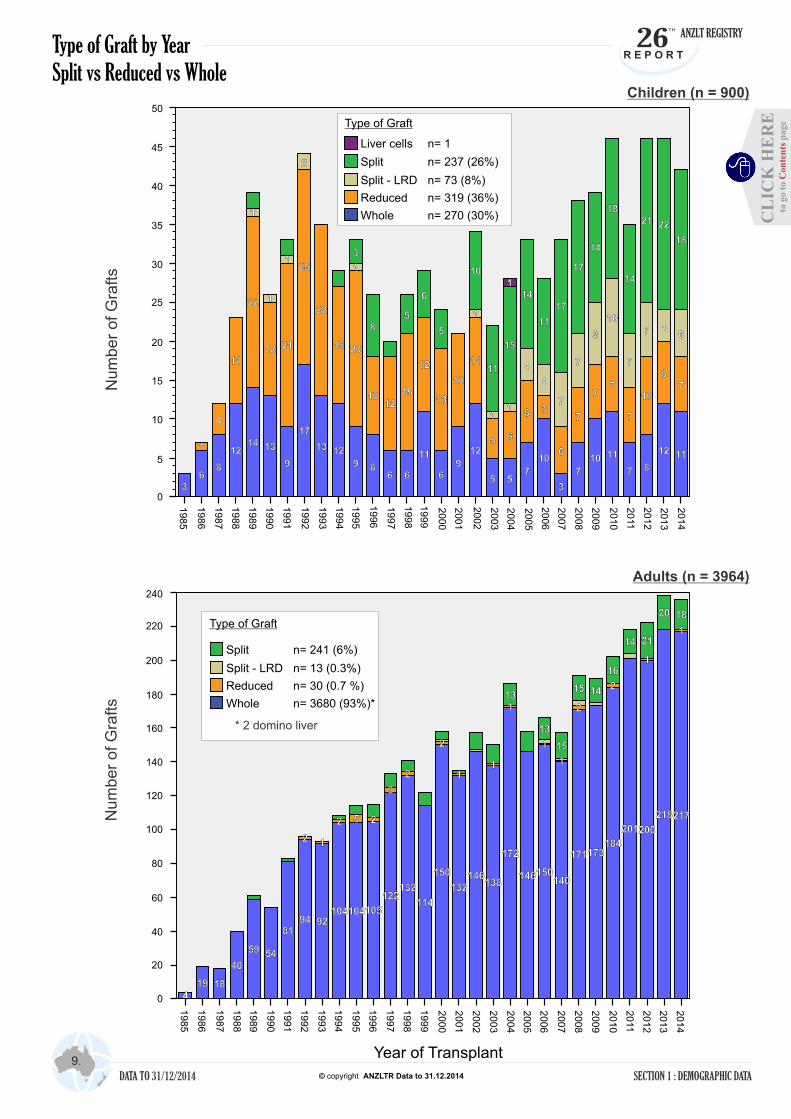
8-9. In 2014, 6 fewer transplants were performed than in 2013 [278 vs 284]. Split grafts continue to make a significant contribution to the total number of paediatric transplants performed providing 18 of 42 [43%] grafts in 2014 and 237 of 900 [26%] overall. In children, other reduced size grafts have been used in 392 [44%] cases including 73 living donor grafts. One child has been treated with liver cell implantation. Of adult patients, 284 have received reduced size grafts - 241 split liver grafts (including 1 as auxiliary graft), 30 other reduced size grafts (1 as auxiliary graft) and 13 living donor grafts. Two domino transplants of a whole liver have been performed.
10-11. Overall, chronic viral hepatitis (CVH) is the most common primary indication for liver transplantation. In children biliary atresia (BA) is the most common primary disease. In adults chronic hepatitis C [CVH : HCV] is the primary disease in 22.9% of recipients and chronic hepatitis B [CVH : HBV] in 6.0 %. Full details of specific diagnoses categories by age group are listed in the Appendices for - Metabolic disorders (Appendix II), Other diseases (Appendix III) and Fulminant Hepatic Failure (Appendix IV).
12-15. The number of patients transplanted with non alcoholic fatty liver disease [ NAFLD/NASH] as the primary diagnosis continued to increase with 16 new patients transplanted in 2014 bringing the total to 111. While the proportion of adult patients transplanted with a primary diagnosis of chronic viral Hepatitis B, C or B/C/D has fallen slightly in era 2010-14 compared with the previous eras, the number of patients with a primary diagnosis of hepatocellular carcinoma [HCC] is increasing each year and now account for 14% in 2010-14. The majority of these patients have a secondary diagnosis of CVH. When patients with either primary or secondary diagnosis of Hepatitis B,C or both are included, the overall incidence of CVH in new adult patients in 2014 was 47%.
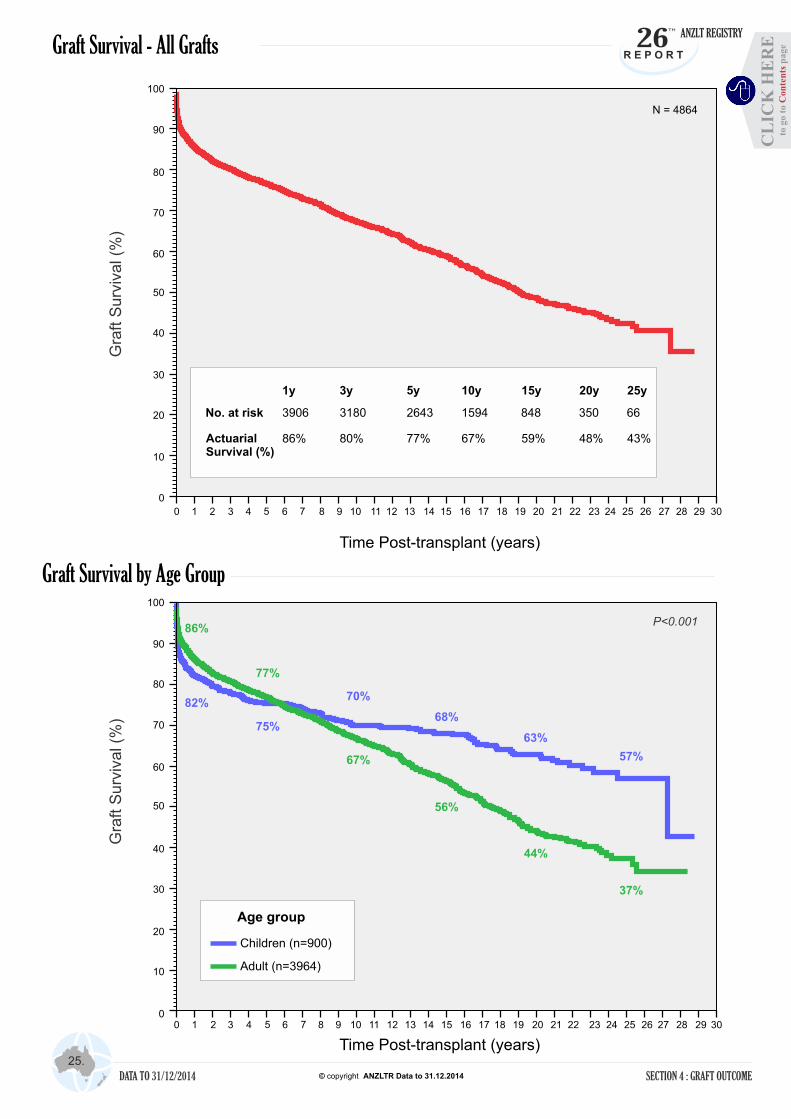
16. Overall 1 year patient survival of all patients is 89.5% at 1 year, 82% at 5 years and 73.5% at 10 years. Children have a significantly better survival rate than adults with an actuarial survival of 72% at 25 years post-transplant.
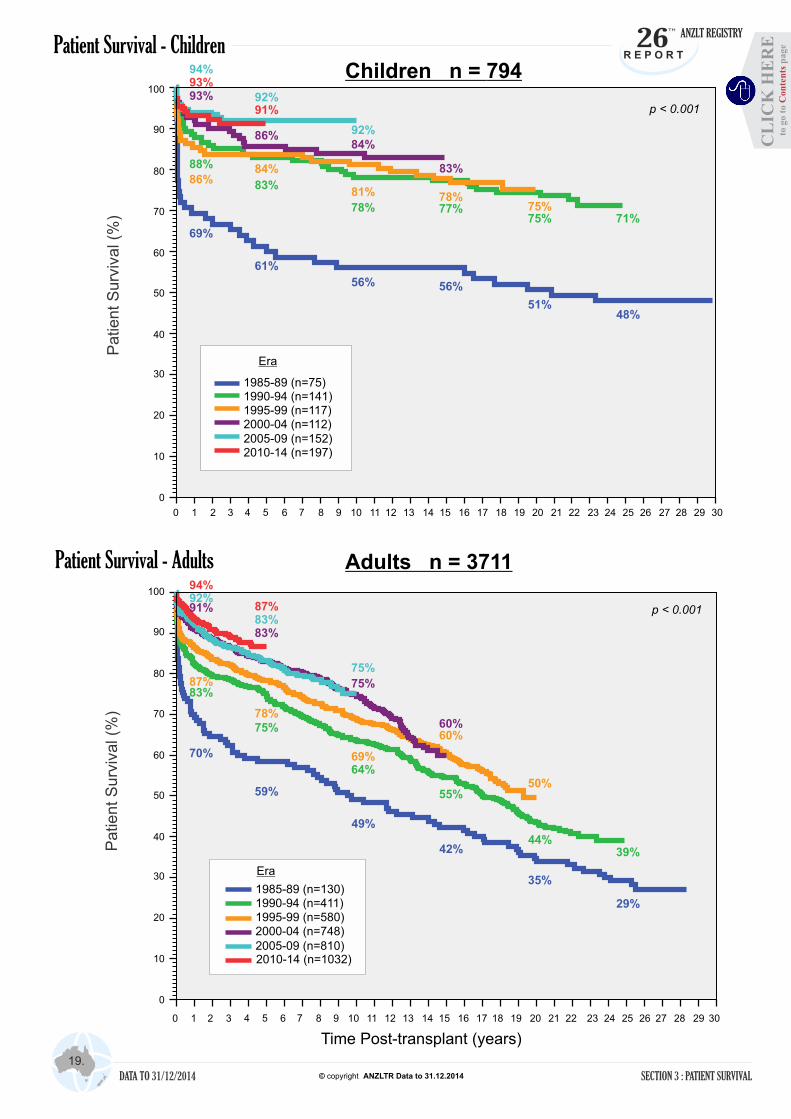
17. Whilst older children had superior early survival than infants and babies, long term survival is similar. Older adult recipients had poorer longer term outcomes. 18-19. Patient survival in later cohorts show continued improvement in outcome for the first 10 years compared with earlier cohorts. This is seen in both children and adults. One year patient survival in 2010-14 cohort was 93% for all patients [93% for children, 94% for adults].
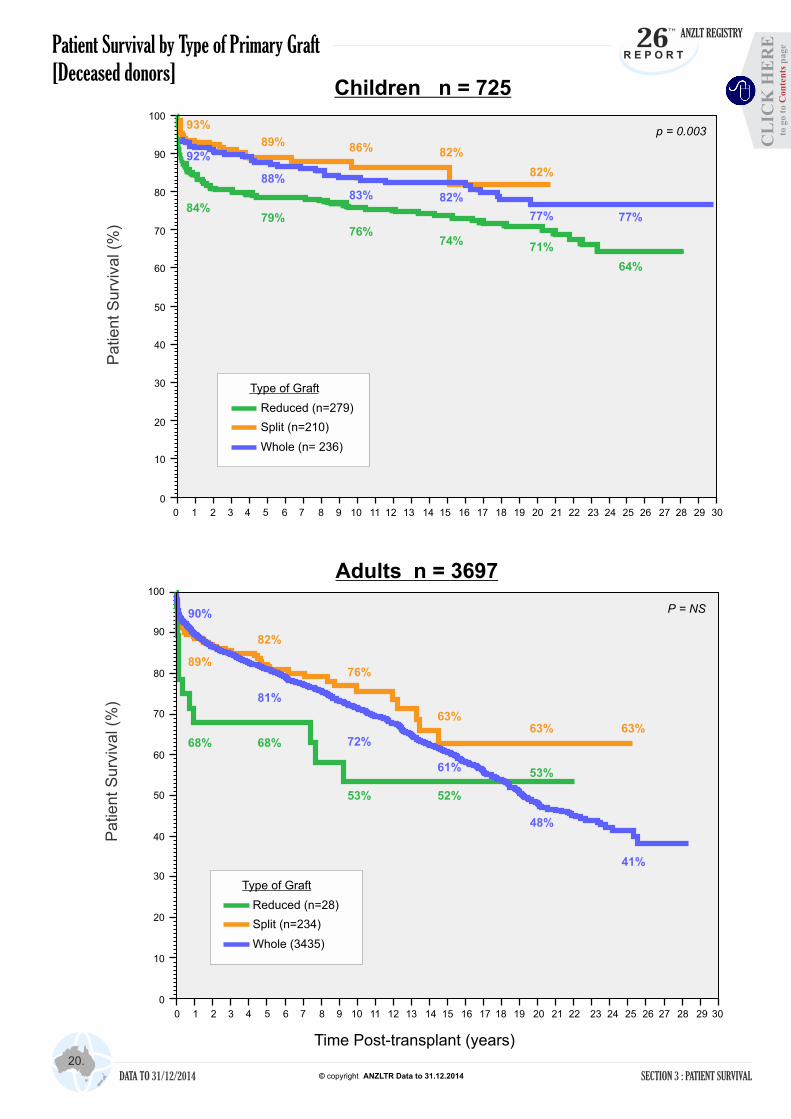
20. In both children and adults, there are worse early outcomes in patients receiving a deceased donor reduced size graft as their primary graft compared with split liver graft or whole liver grafts. Split liver grafts and whole livers have similar early outcomes in both children and adults.
26TH
ANZLT REGISTRY
R E P O R T
Page
DATA TO 31/12/2014 © copyright ANZLTR Data to 31.12.2014
CL
ICK
HE
RE
to
go
to
p
ag
eC
on
ten
ts

3.
SummarySummary
SUMMARY
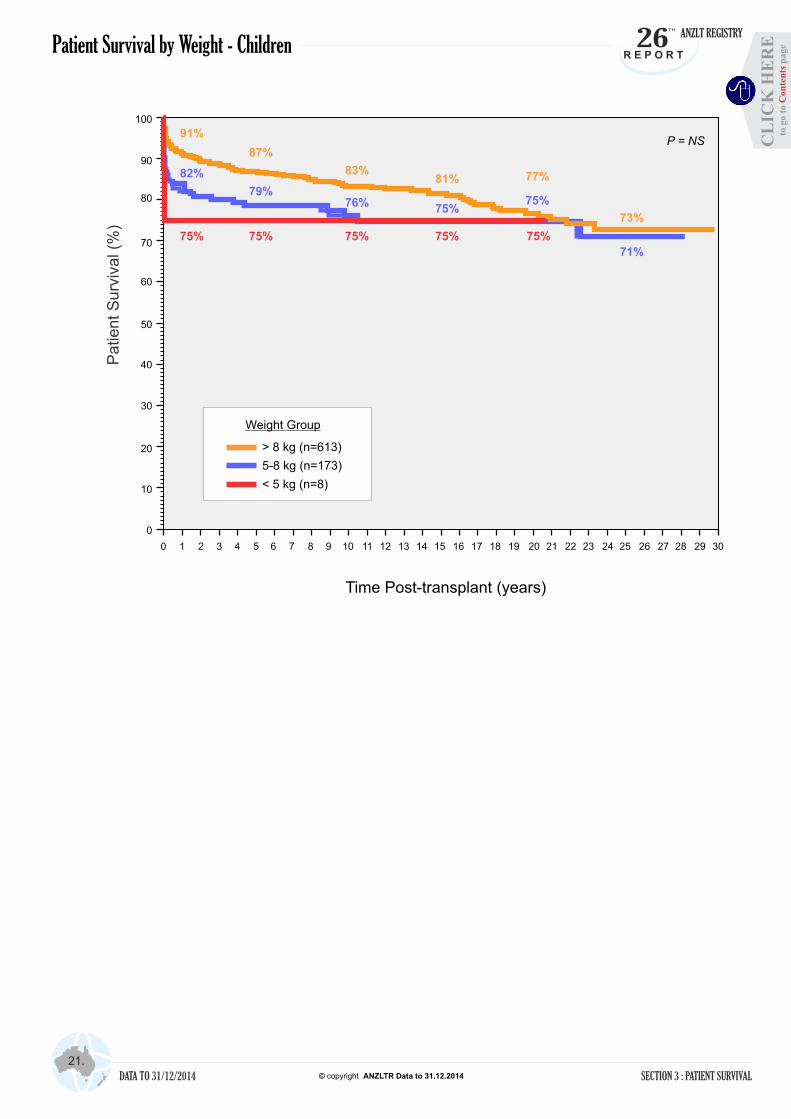
21. Smaller children and babies weighing < 8 kg at the time of transplant had inferior early survival compared to heavier children but similar long term results.
22. Adult patients transplanted for biliary atresia or hepatitis virus co-infections had the best longer term survival while those whose primary disease was malignancy or Hepatitis C have significantly lower survival rates.
23. In children, patient survival was similar for all disease groups though lower in patients whose primary disease was malignancy. There were no differences in survival between adults and children transplanted for fulminant hepatic failure [acute and sub-acute] with overall 5 year survival of 78%.
24. Recent cohorts of adult patients with a primary diagnosis of hepatitis B continue to show a significantly improved survival which is not seen in adult patients with hepatitis C as primary disease. Patients transplanted for malignancy continue to have a poor outcome but some improvement in longer term outcome is seen in patients transplanted since 2000.
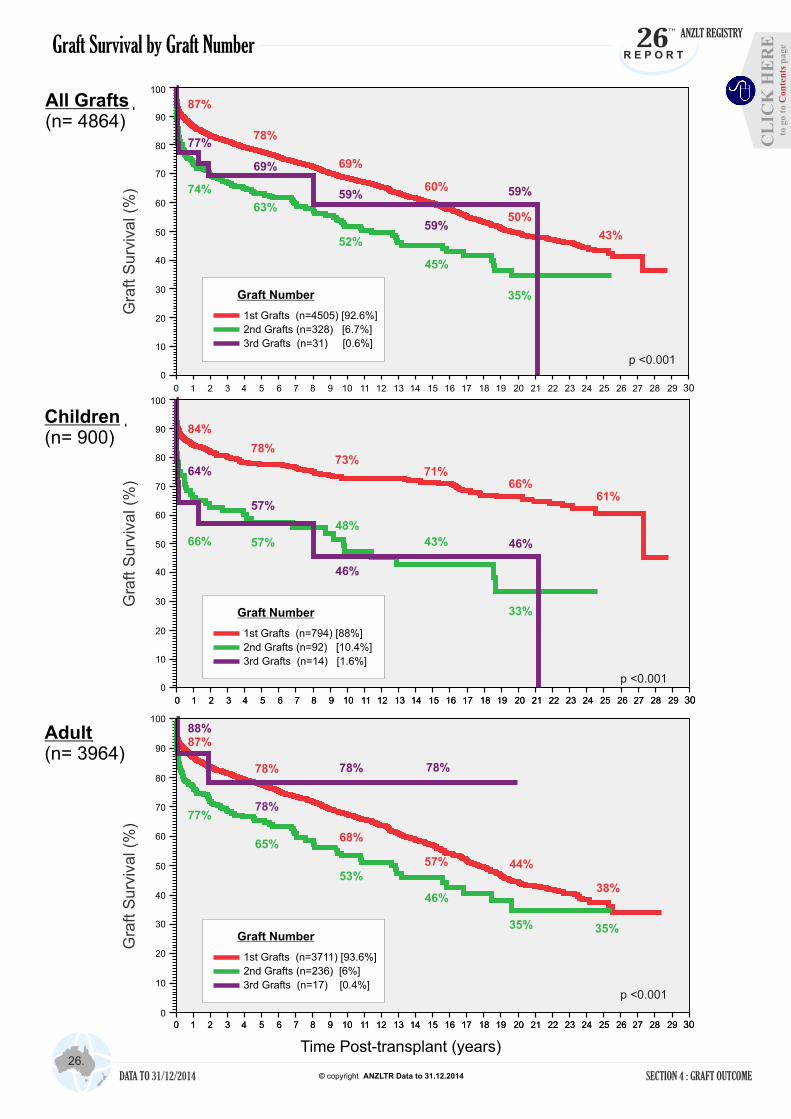
25-26. Overall graft survival was 77% at 5 years with significantly better graft survival longer term in children. Survival was significantly worse in second grafts in both children and adults. Third grafts in adults have better outcomes than in children.
27. Overall split liver grafts have similar graft survival to whole liver grafts. Reduced grafts have lower graft survival in the early post-transplant years in both children and adults.
28-29. Vascular complications and rejection were the commonest indications for re-transplantation. Twelve percent of retransplants were due to poor early graft function. Re-transplantation for recurrent disease was most prevalent in adults [10% PSC, PBC, AIH and 8% HBV, HCV].
30-33. Sepsis is the most frequent cause of death in both adults and children. Full details of Miscellaneous and Other Graft Failure deaths are listed in Appendix V. Thirty percent of all deaths occurred within 6 months of transplant. Deaths from early graft failure were due to poor or no early graft function. By 1 year malignancy and graft failure from recurrent disease or chronic rejection cause most deaths. Deaths due to de novo malignancy and chronic rejection are increasing with longer survival time particularly in children surviving 15 years or longer.
34. There was a slight fall in the number of cadaveric donors in 2014 with 272 grafts transplanted from deceased donors. The number of livers split to produce two transplantable grafts was 18 in 2014. Fifteen liver grafts donated after cardiac death were transplanted. The number of people on the waiting list at 31 December 2014 was higher than the number on the waiting list at 31 December 2013.
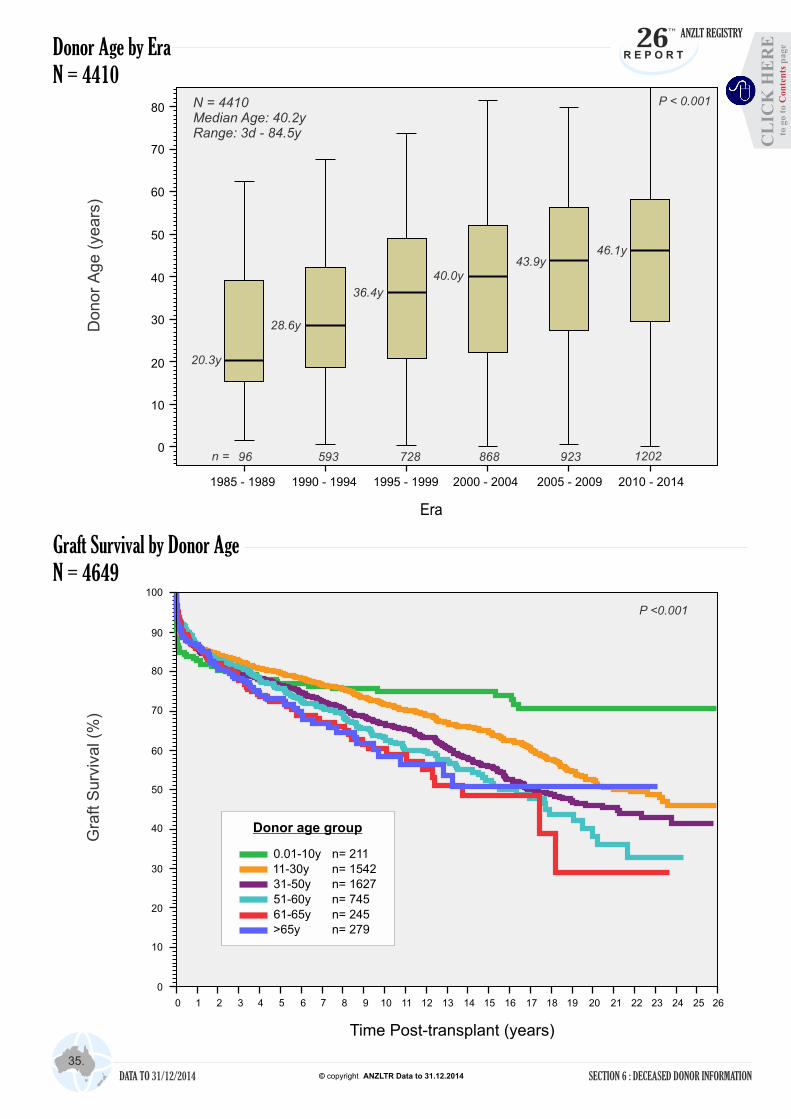
35. Donor age has increased significantly in recent years. Long term graft survival trends lower in several older donor age groups.
36. Eighty-eight patients [73 children, 15 adults] have now received a living donor graft with 6 performed in 2014. In 82 patients the living donor graft was a primary graft, in 5 as a second and 1 as a third graft. The median age of the donors was 34.0 years with a range of 19.0 to 54.5 years. Two adult grafts were domino whole liver graft.
26TH
ANZLT REGISTRY
R E P O R T
Page
DATA TO 31/12/2014 © copyright ANZLTR Data to 31.12.2014
CL
ICK
HE
RE
to
go
to
p
ag
eC
on
ten
ts
4.
SummarySummary
SUMMARY
37. Waiting list activity for 2014 shows the number of patients listed for transplantation continued to increase with 204 remaining on the waiting list at 31 December 2014. Patient delistings due to death, becoming too ill or tumour [HCC] progression accounted for 8% of all delistings while 278 [49%] were transplanted. Thirty patients were listed as urgent in 2014 [8 with initial listing as Category 1 and 22 Category 2]. Seven [88%] of Category 1 and 21 [95%] of Category 2 patients had a positive outcome.
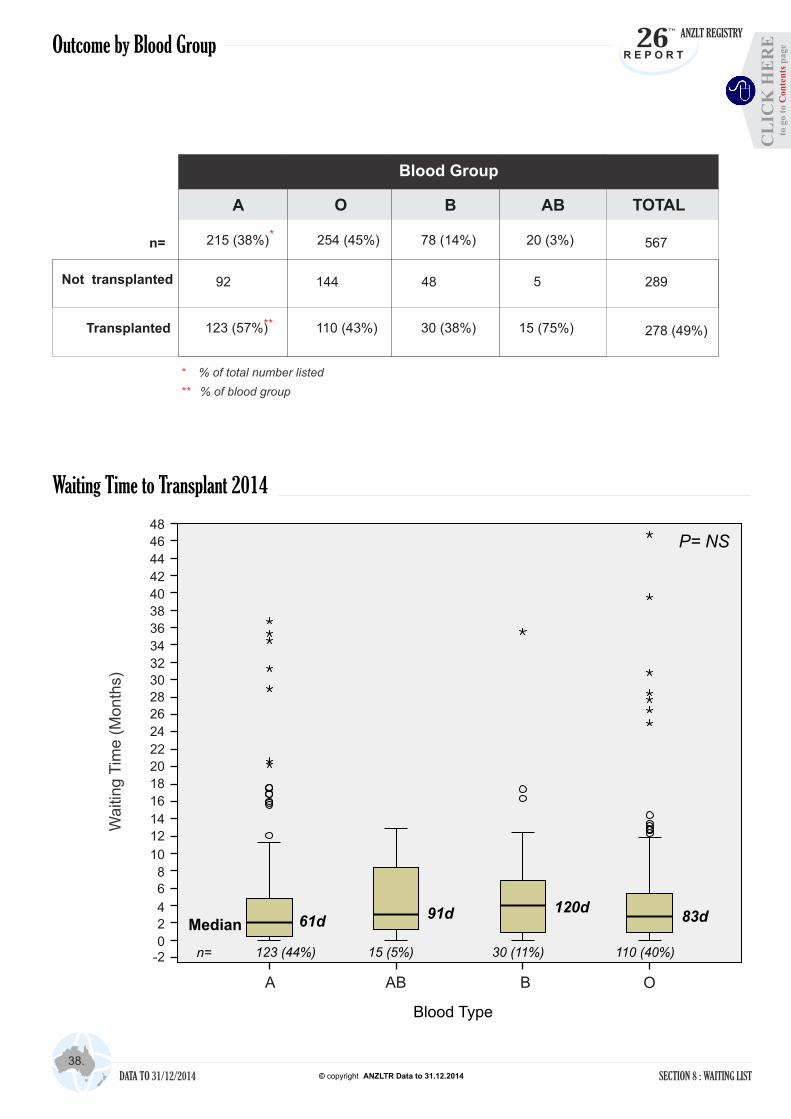
38-39. Median waiting times tended to be higher in 2014 in some blood groups. Blood group B patients had the longest waiting times.
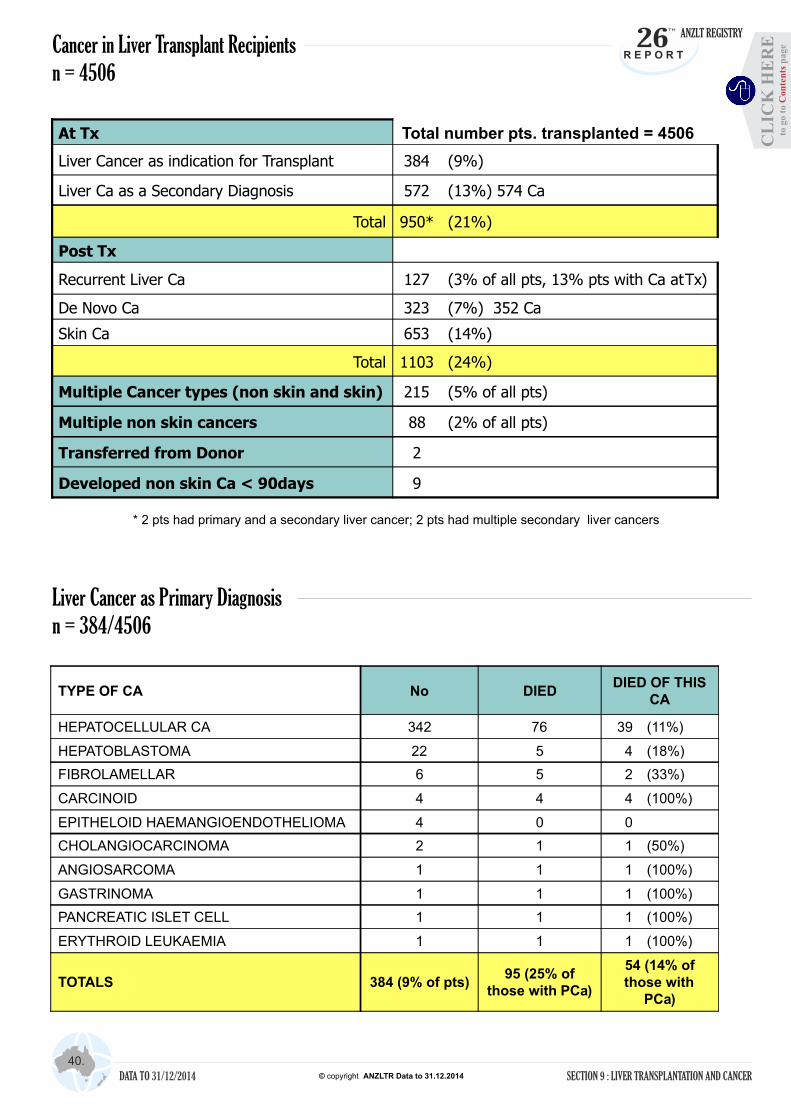
40- 42. Cancer in liver transplant recipients was analysed from two perspectives. Firstly, those who had a liver cancer diagnosis at the time of transplantation (as primary, secondary or incidental) and secondly those who developed a cancer post transplantation (de novo skin and de novo non - skin cancer). Overall 950 (21%) patients were transplanted who had a liver malignancy – 384 (9%) as a primary diagnosis and 572 (13%) as a secondary diagnosis or incidental tumour, with Hepatocellular Carcinoma being the most common. Post transplant 127 (13%) of these patients developed a recurrent cancer whilst in 113 (12%) of these patients' death was related to their initial cancer.
42. There continues to be an increase in the number of patients being transplanted for primary malignancy.
43-46. Patient survival was significantly worse in the 857 (20%) patients with pre-transplant liver malignancy compared with patients with other forms of liver disease with the exception of those with a diagnosis of Hepatocellular Carcinoma and Hepatoblastoma whose survival rates are close to those with other liver diseases. Of these 106 (12%) died from their malignancy. Those with Cholangiocarinoma had significantly poorer survival. The number of patients transplanted with liver cancer present at transplant has increased significantly in the last decade from 247 (1995-2005) to 643 (2005 -14).
46-51. Three hundred and fifty-two de novo non-skin types of cancer developed in 323 (7%) recipients. Twenty seven patients developed more than one de novo cancer. The three most common categories of de novo non-skin cancer were – cancers of the Alimentary Tract (125), Lymphoma (91) and Genitourinary (47) The incidence of de novo non-skin cancers appears to be related to the type of pre-transplant underlying disease. Most notable is the significant incidence of de novo non-skin malignancy in patients with underlying Primary Sclerosing Cholangitis, alcoholic cirrhosis and HCV (p<0.0001).
51-52. Six hundred and fifty-four patients (15%) developed skin cancers with a peak 1 - 3years after transplantation for appearance of first cancer. Multiple skin cancers developed in 316 patients. Thirty-two patients developed Melanoma.
The cumulative risk of diagnosis of any cancer post transplant is approaching 40% by 20 years.
26TH
ANZLT REGISTRY
R E P O R T
Page
DATA TO 31/12/2014 © copyright ANZLTR Data to 31.12.2014
CL
ICK
HE
RE
to
go
to
p
ag
eC
on
ten
ts
Section 1D e m o g r a p h i c D a t a
Section 1
SECTION 1 : DEMOGRAPHIC DATA
26TH
ANZLT REGISTRY
R E P O R T
DATA TO 31/12/2014 © copyright ANZLTR Data to 31.12.2014
CL
ICK
HE
RE
to
go
to
p
ag
eC
on
ten
ts
Year of Transplant
Summary Statistics - Age and Gender
ALL PATIENTS TRANSPLANTED
Cumulative Number of Patients & Transplants
Children [<16y] Adults Total
Patients 795 3711 4506
Age
Mean ± SD 4.5 ± 4.5y 49.0 ± 11.6y 41.1 ± 20.0y
Median 2.4y 51.2y 48.3y
Range 24d -15.9y 16.0 - 73.1y 24d - 73.1y
Gender
Female 414 (52%) 1277 (34%) 1691 (37.5%)
Male 380 (48%) 2434 (66%) 2814 (62.5%)
Surviving 642 (81%) 2604 (70%) 3246 (72%)
5.
SECTION 1 : DEMOGRAPHIC DATA
Num
ber
Transplants
(n=4864)
Patients
(n=4506)
2,000
1,500
1,000
500
0
1985
2,500
3,000
3,500
4,000
1986
1987
1988
1989
1990
1991
1992
1993
1994
1995
1996
1997
1998
1999
2000
2001
2002
2003
2004
2005
2006
2007
2008
2009
2010
2011
2012
4,500
26TH
ANZLT REGISTRY
R E P O R T
DATA TO 31/12/2014 © copyright ANZLTR Data to 31.12.2014
5,000
2013
2014
CL
ICK
HE
RE
to
go
to
p
ag
eC
on
ten
ts
Number of New Patients Transplanted by Year
Year of Transplant6.
SECTION 1 : DEMOGRAPHIC DATA
Cumulative Number of New Patients Transplanted
Num
ber
of P
atie
nts
Num
ber
of P
atie
nts
120
100
80
20
140
160
180
200
40
60
220
240
1,200
1,000
800
200
0
400
600
1,600
1,400
2,000
1,800
2,400
2,200
2,600
3,000
2,800
3,200
0
1985
1986
1987
1988
1989
1990
1991
1992
1993
1994
1995
1996
1997
1998
1999
2000
2001
2002
2003
2004
2005
2006
2007
2008
2009
2010
2011
2012
3,400 Age Group
Adult (n=3711)
Children (n=794)
26TH
ANZLT REGISTRY
R E P O R T
DATA TO 31/12/2014 © copyright ANZLTR Data to 31.12.2014
3,600
2013
Age Group
Adult (n=3711)
Children (n=794)
1985
1986
1987
1988
1989
1990
1991
1992
1993
1994
1995
1996
1997
1998
1999
2000
2001
2002
2003
2004
2005
2006
2007
2008
2009
2010
2011
2012
2013
260
280
2014
3,800
2014
224
CL
ICK
HE
RE
to
go
to
p
ag
eC
on
ten
ts

7.
SECTION 1 : DEMOGRAPHIC DATA
Number of Recipients By Age at Primary TransplantN=4506
Age Strata
Age at Primary Transplant by Era
Count
600
500
400
300
200
100
0
700
800
900
1,000
1,100
< 1y 1 - 2y 3 - 9y 40 - 49y16 - 39y10 - 15y 50 - 59y 60 - 64y >=65y
Median = 48.3yRange 24d - 73.1y
1,200
1,300
26TH
ANZLT REGISTRY
R E P O R T
Ag
e a
t tr
an
spla
nt
Era
40
20
0
60
80
1985 - 89 1990 - 94 1995 - 99 2000 - 04 2005 - 09 2010 - 14
DATA TO 31/12/2014 © copyright ANZLTR Data to 31.12.2014
2.5y 2.9y 2.5y 2.5y 2.2y
P=0.045
43.9y45.9y
48.1y50.2y
52.2y
P<0.001
54.3y
1.9y
Adult (n=3711) Median = 51.2y [16.0 - 73.1y]
Children (n=794) Median = 2.4y [24d - 15.9y]
Age Group
1,400
184261 229
120
695
1,004
1,443
433
136
70
50
30
10
CL
ICK
HE
RE
to
go
to
p
ag
eC
on
ten
ts
8.
SECTION 1 : DEMOGRAPHIC DATA
Number of Transplants by Year
Cumulative Number of Transplants
Num
ber
of T
ransp
lants
Num
ber
of T
ransp
lants
Year of Transplant
1,250
1,000
750
250
500
1,750
1,500
2,250
2,000
2,750
2,500
3,000
3,500
3,250
100
80
20
120
140
160
40
60
180
200
220
0
26TH
ANZLT REGISTRY
R E P O R T
DATA TO 31/12/2014 © copyright ANZLTR Data to 31.12.2014
240
260
280
3,750
4,0001985
1986
1987
1988
1989
1990
1991
1992
1993
1994
1995
1996
1997
1998
1999
2000
2001
2002
2003
2004
2005
2006
2007
2008
2009
2010
2011
2012
2013
2014
Age Group
Adult (n=3964)
Children (n=900)
1985
1986
1987
1988
1989
1990
1991
1992
1993
1994
1995
1996
1997
1998
1999
2000
2001
2002
2003
2004
2005
2006
2007
2008
2009
2010
2011
2012
2013
2014
Adult (n=3964)
Children (n=900)
Age Group
0
CL
ICK
HE
RE
to
go
to
p
ag
eC
on
ten
ts
9.
SECTION 1 : DEMOGRAPHIC DATA
Type of Graft by YearSplit vs Reduced vs Whole
Adults (n = 3964)
Children (n = 900)N
um
ber
of G
rafts
Num
ber
of G
rafts
Year of Transplant
25
20
5
0
30
35
40
10
15
45
50
100
80
60
0
40
140
120
180
160
200
220
20
26TH
ANZLT REGISTRY
R E P O R T
DATA TO 31/12/2014 © copyright ANZLTR Data to 31.12.2014
1985
1986
1987
1988
1989
1990
1991
1992
1993
1994
1995
1996
1997
1998
1999
2000
2001
2002
2003
2004
2005
2006
2007
2008
2009
2010
2011
2012
2013
2014
Liver cells
Split
Reduced
Whole
Type of Graft
Split - LRD
n= 1
n= 237 (26%)
n= 319 (36%)
n= 270 (30%)
n= 73 (8%)
1985
1986
1987
1988
1989
1990
1991
1992
1993
1994
1995
1996
1997
1998
1999
2000
2001
2002
2003
2004
2005
2006
2007
2008
2009
2010
2011
2012
2013
2014
240
Split
Reduced
Whole
Type of Graft
Split - LRD
* 2 domino liver
n= 241 (6%)
n= 30 (0.7 %)
n= 3680 (93%)*
n= 13 (0.3%)
CL
ICK
HE
RE
to
go
to
p
ag
eC
on
ten
ts

Section 2P r i m a r y D i a g n o s i s
Section 2
SECTION 2 : PRIMARY DIAGNOSIS
26TH
ANZLT REGISTRY
R E P O R T
DATA TO 31/12/2014 © copyright ANZLTR Data to 31.12.2014
CL
ICK
HE
RE
to
go
to
p
ag
eC
on
ten
ts

BA
MET
ALD
CC
PBC
PSC
MAL
FHF
OTH
CAH : AI
CVH : HBV
CVH : HCV
CVH : B/C/D
Primary Diseases of All Recipients
SECTION 2 : PRIMARY DIAGNOSIS
10.
Diagnosis Group
- Biliary atresia
- Metabolic diseases
- Alcoholic cirrhosis
- Cryptogenic cirrhosis
- Primary biliary cirrhosis
- Primary sclerosing cholangitis
- Malignancy
- Fulminant hepatic failure
- Other diseases
- Chronic active hepatitis [autoimmune]
- Chronic viral hepatitis B
- Chronic viral hepatitis C
- Chronic viral hepatitis B / C / D
BA10.5%
MET6.3%
ALD10.2%
CC4.2%
PBC4.8%
CVH : HCV18.9%
CVH : HBV4.9%
OTH8.7%
FHF9.6%
MAL8.4%
PSC8.9%
*
**
See Appendices for details *
CAH : AI3.4%
CVH : B/C/D1.1%
26TH
ANZLT REGISTRY
R E P O R T
DATA TO 31/12/2014 © copyright ANZLTR Data to 31.12.2014
CL
ICK
HE
RE
to
go
to
p
ag
eC
on
ten
ts

Primary Diseases of Adult Recipientsn = 3711
SECTION 2 : PRIMARY DIAGNOSIS
11.
Primary Diseases of Childrenn =794
OTH12%
FHF11.1%
MAL
PSC
MET14.6%
CAH:AI
BA55%
BA
MET4.5%
ALD12.4%
CC4.7%
PBC5.9%
0.9%
CVH : HCV22.9%
CAH:AI3.9%
OTH8.1%
FHF9.3%
MAL9.6%
PSC10.5%
CC2.1%
1%
3.1%
1%
CVH : HBV6.0%
CVH : B/C/D 1.3%
MAL
FHF
OTH
CAH : AI
CVH : HBV
CVH : HCV
CVH : B/C/D
- Malignancy
- Fulminant hepatic failure
- Other diseases
- Chronic active hepatitis [autoimmune]
- Chronic viral hepatitis B
- Chronic viral hepatitis C
- Chronic viral hepatitis B / C / D
BA
MET
ALD
CC
PBC
PSC
- Biliary atresia
- Metabolic diseases
- Alcoholic cirrhosis
- Cryptogenic cirrhosis
- Primary biliary cirrhosis
- Primary sclerosing cholangitis
Diagnosis Group
26TH
ANZLT REGISTRY
R E P O R T
DATA TO 31/12/2014 © copyright ANZLTR Data to 31.12.2014
CL
ICK
HE
RE
to
go
to
p
ag
eC
on
ten
ts
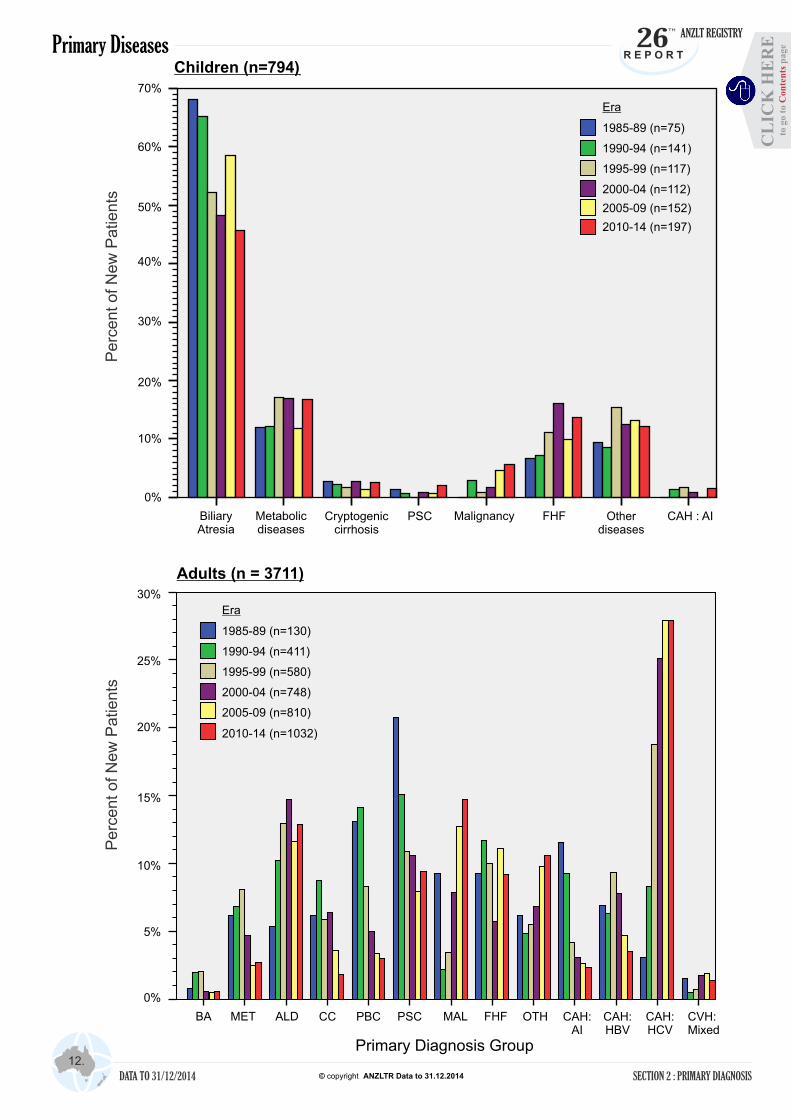
Primary Diseases
SECTION 2 : PRIMARY DIAGNOSIS
12.Primary Diagnosis Group
Perc
ent of N
ew
Patie
nts
Perc
ent of
New
Patie
nts
Adults (n = 3711)
Children (n=794)
BiliaryAtresia
Metabolic diseases
Cryptogeniccirrhosis
PSC Malignancy FHF Other diseases
CAH : AI
CAH:AI
OTHFHFPSCPBCCCMETBA ALD CVH:Mixed
CAH:HBV
CAH:HCV
30%
10%
0%
40%
50%
60%
20%
70%
10%
5%
0%
15%
20%
25%
30%
MAL
26TH
ANZLT REGISTRY
R E P O R T
DATA TO 31/12/2014 © copyright ANZLTR Data to 31.12.2014
2005-09 (n=152)
2000-04 (n=112)
1995-99 (n=117)
1990-94 (n=141)
1985-89 (n=75)
Era
2010-14 (n=197)
2005-09 (n=810)
2000-04 (n=748)
1995-99 (n=580)
1990-94 (n=411)
1985-89 (n=130)
Era
2010-14 (n=1032)
CL
ICK
HE
RE
to
go
to
p
ag
eC
on
ten
ts

Adult Primary Diagnosis by Era
SECTION 2 : PRIMARY DIAGNOSIS
13.
Adult Diagnosis
Hep B/C/D
ALD
Other diseases
Hep C
HCC
Hep B
1985 - 89 (n=130)
1990 - 94 (n-411)
1995 - 99 (n=580)
2000 - 04(n=748)
2005 - 09(n=810)
2010 - 14(n=1032)
7%
3%
8%
8%
1%
12%
5%
5%
14%
3%
6%
NAFLD/NASH
Era
6%
2%
2%
2%
2%
1%
15%
13%
10%
74%
55%
42% 25%
28%38%
12%
34% 28%
13%
19%
9%
8%
3%
7%
5%
76%
26TH
ANZLT REGISTRY
R E P O R T
DATA TO 31/12/2014 © copyright ANZLTR Data to 31.12.2014
CL
ICK
HE
RE
to
go
to
p
ag
eC
on
ten
ts

Adult Primary Diagnosis by Year
SECTION 2 : PRIMARY DIAGNOSIS
14.
Year of Transplant
Count
80
40
0
120
200
160
180
140
100
60
20
26TH
ANZLT REGISTRY
R E P O R T
DATA TO 31/12/2014 © copyright ANZLTR Data to 31.12.2014
220
1985
1986
1987
1988
1989
1990
1991
1992
1993
1994
1995
1996
1997
1998
1999
2000
2001
2002
2003
2004
2005
2006
2007
2008
2009
2010
2011
2012
2013
2014
Hep B/C/D
Hep B
Hep C
HCC
ALD
NAFLD/NASH
Primary Diagnosis
Other diseases
CL
ICK
HE
RE
to
go
to
p
ag
eC
on
ten
ts

SECTION 2 : PRIMARY DIAGNOSIS
15.
Hepatitis C 849 7 252 5 226
Hepatitis B 220 3 83 1 6
Hepatitis 51 9 7
BD/BC/BCD
HCC + cirrhosis 328 167 88 7 13 69
ALD 461 22 3 59 9
NAFLD 111 2 24 5
Other 1691 18 8 55 3 22
Pri
mar
y D
iagn
osis
Type of Chronic Viral Hepatitis in Adult Patients
Chronic Viral Hepatitis as Primary or Secondary Diagnosis in Adult Patients
1990-94[n=71]
1995-99[n=190]
2000-04[n=321]
2005-09[n=363]
Era
37%
59%
4%
33%
65%
2%
26%
68%
6%
20%
74%
6%
Year of Transplant
Hepatitis diagnosis
Count
2000 2001 2002 2003 2004 2005 2006 2007 2008
80
40
0
2009
n = Hepatitis C Hepatitis BHepatitis
B,C HCC NAFLD ALD
TOTAL 3711
Secondary / Tertiary diagnosis
13%
83%
4%
2010-14[n=466]
2010 2011
Hepatitis Negative
Mixed B/C/D
Hepatitis C
Hepatitis B
Chronic viral hepatitis
2012
26TH
ANZLT REGISTRY
R E P O R T
DATA TO 31/12/2014 © copyright ANZLTR Data to 31.12.2014
20
60
120
100
160
140
200
180
220
2013 2014
CL
ICK
HE
RE
to
go
to
p
ag
eC
on
ten
ts
Section 3P a t i e n t S u r v i v a l
Section 3
SECTION 3 : PATIENT SURVIVAL
26TH
ANZLT REGISTRY
R E P O R T
DATA TO 31/12/2014 © copyright ANZLTR Data to 31.12.2014
CL
ICK
HE
RE
to
go
to
p
ag
eC
on
ten
ts

16.
Patie
nt S
urv
ival (
%)
Patie
nt S
urv
ival (
%)
Time Post-transplant (years)
SECTION 3 : PATIENT SURVIVAL
Patient Survival Post Transplant
100
90
80
70
60
50
40
30
20
10
10 2 3 4 5 76 8 9 10 11 1312 14 15 16 17 1918 20 21 22 23 24 25
0
27
90%
89%87%
85%
85%
81%
82%
72%
80%76%
61%
49%
Adult (n=3711)
Children (n=794)
Age group
P<0.001
100
90
80
70
60
50
40
30
20
0
72%
26
10
42%
28
26TH
ANZLT REGISTRY
R E P O R T
DATA TO 31/12/2014 © copyright ANZLTR Data to 31.12.2014
29
1y 3y 5y 10y 15y 25y
No. at risk 3784 3134 2631 1626 873 74
Actuarial Survival (%)
89.5% 85% 82% 73.5% 64% 49%
N = 4505Median = 6.6y
Range (0-29.8y)
20y
368
55%
30
10 2 3 4 5 76 8 9 10 11 1312 14 15 16 17 1918 20 21 22 23 24 25 2726 28 29 30
Median 6.4y (0-28.4y)
Median 8.1y (0-29.8y)
CL
ICK
HE
RE
to
go
to
p
ag
eC
on
ten
ts
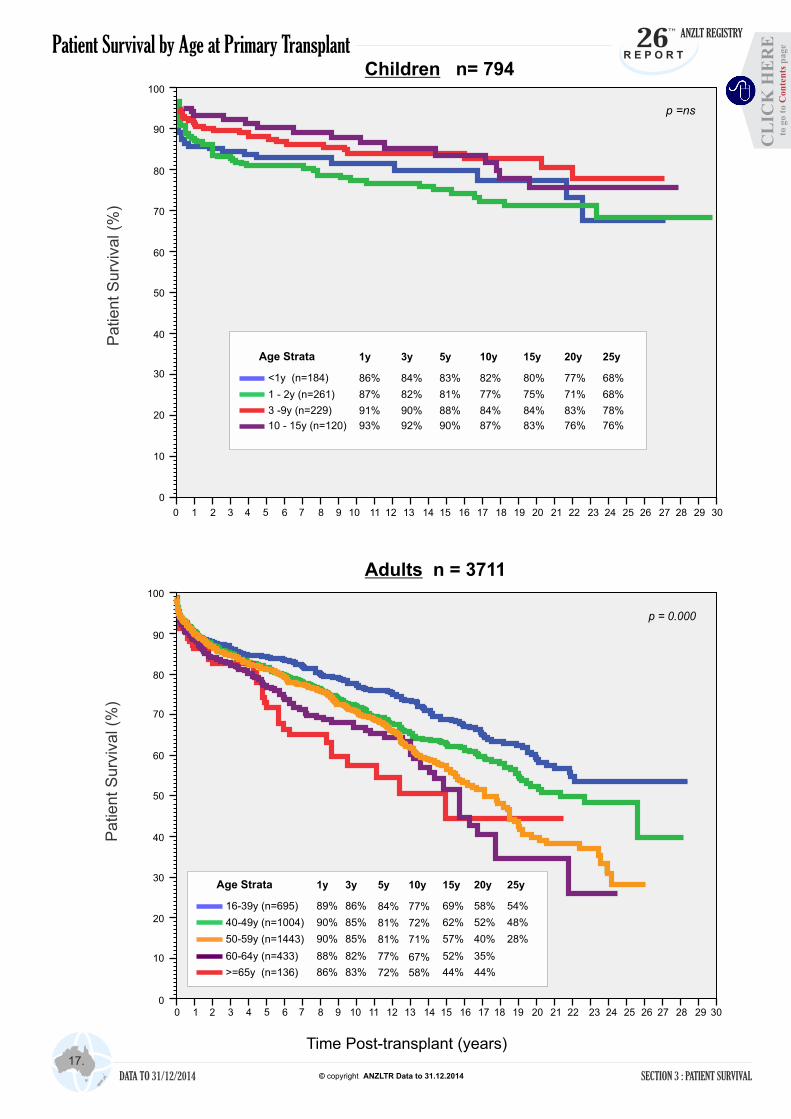
Patient Survival by Age at Primary Transplant
17.
Time Post-transplant (years)
Patie
nt S
urv
ival (
%)
SECTION 3 : PATIENT SURVIVAL
Children n= 794
Adults n = 3711
Patie
nt S
urv
ival (
%)
100
90
80
70
60
50
40
30
20
10
0
p =ns
Age Strata
<1y (n=184)
1 - 2y (n=261)
3 -9y (n=229)
1y 5y 10y 15y
86% 83% 82% 80%
87% 81% 77% 75%
91% 88% 84% 84%
20y
77%
71%
83%
10 - 15y (n=120) 93% 90% 87% 83% 76%
3y
84%
82%
90%
92%
100
90
80
70
60
50
40
30
20
10
0
p = 0.000
Age Strata
16-39y (n=695)
40-49y (n=1004)
50-59y (n=1443)
60-64y (n=433)
>=65y (n=136)
1y 5y 10y 15y
89% 84% 77% 69%
90% 81% 72% 62%
90% 81% 71% 57%
88% 77% 67%
86% 72% 58%
52%
20y
58%
52%
44%
40%
35%
26TH
ANZLT REGISTRY
R E P O R T
DATA TO 31/12/2014 © copyright ANZLTR Data to 31.12.2014
25y
68%
68%
78%
76%
3y
86%
85%
85%
82%
83% 44%
10 2 3 4 5 76 8 9 10 11 1312 14 15 16 17 1918 20 21 22 23 24 25 2726 28 29 30
10 2 3 4 5 76 8 9 10 11 1312 14 15 16 17 1918 20 21 22 23 24 25 2726 28 29 30
25y
54%
48%
28%
CL
ICK
HE
RE
to
go
to
p
ag
eC
on
ten
ts

All Patient Survival by Year of Transplant
18.
SECTION 3 : PATIENT SURVIVAL
Time Post-transplant (years)
Patie
nt S
urv
ival (
%)
100
90
80
70
60
50
40
30
20
10
0
p < 0.00191%
70%
86%84%
93%
60%
79%77%
83%85%
52%
76%
67%
51%
41%
36%
78%
54%
Era
1985-89 (n=205)
1990-94 (n=552)
1995-99 (n=697)
2000-04 (n=860)
2005-09 (n=962)2010-14 (n=1229)
93%
48%
26TH
ANZLT REGISTRY
R E P O R T
DATA TO 31/12/2014 © copyright ANZLTR Data to 31.12.2014
35%
10 2 3 4 5 76 8 9 10 11 1312 14 15 16 17 1918 20 21 22 23 24 25 2726 28 29 30
71%
47%
63%
60%
63%
87% CL
ICK
HE
RE
to
go
to
p
ag
eC
on
ten
ts
Patient Survival - Adults
19.
Patient Survival - Children
SECTION 3 : PATIENT SURVIVAL
Time Post-transplant (years)
Children n = 794
Patie
nt S
urv
ival (
%)
Patie
nt S
urv
ival (
%)
Adults n = 3711
100
90
80
70
60
50
40
30
20
10
0
93%
88%
83%
77%
69%
61%
56% 56%
86%
p < 0.001
51%
78%78%
86%
92%
1985-89 (n=75)1990-94 (n=141)1995-99 (n=117)2000-04 (n=112)
Era
2005-09 (n=152)
84%
81%
94%
2010-14 (n=197)
93%
84%
75%
Era
1985-89 (n=130)1990-94 (n=411)1995-99 (n=580)2000-04 (n=748)2005-09 (n=810)
91%
83%
70%
87%
83%
75%
59%
78%
64%
49%
69%
55%
42%
92%
29%
83%
75%
60%
44%
p < 0.001
100
90
80
70
60
50
40
30
20
10
0
2010-14 (n=1032)
94%
48%
35%
26TH
ANZLT REGISTRY
R E P O R T
DATA TO 31/12/2014 © copyright ANZLTR Data to 31.12.2014
10 2 3 4 5 76 8 9 10 11 1312 14 15 16 17 1918 20 21 22 23 24 25 2726 28 29 30
91%
92%
71%
87%
10 2 3 4 5 76 8 9 10 11 1312 14 15 16 17 1918 20 21 22 23 24 25 2726 28 29 30
75%
60%
39%
50%
75%
83%
CL
ICK
HE
RE
to
go
to
p
ag
eC
on
ten
ts
20.
Patient Survival by Type of Primary Graft[Deceased donors]
Adults n = 3697
Children n = 725
SECTION 3 : PATIENT SURVIVAL
Patie
nt S
urv
ival (
%)
Patie
nt S
urv
ival (
%)
Time Post-transplant (years)
100
90
80
70
60
50
40
30
20
10
p = 0.003
Type of Graft
Reduced (n=279)
Split (n=210)
Whole (n= 236)
92%
93%
84%
88%
89%
79%
82%83%
76%
77%
74%
86%
71%
82%
100
90
80
70
60
50
40
30
20
10
0
Type of Graft
Reduced (n=28)
Split (n=234)
Whole (3435)
P = NS90%
89%
68%
81%
82%
68%
61%
76%
53%
48%
52%
72%
63%63%
77%
41%
0
64%
26TH
ANZLT REGISTRY
R E P O R T
DATA TO 31/12/2014 © copyright ANZLTR Data to 31.12.2014
10 2 3 4 5 76 8 9 10 11 1312 14 15 16 17 1918 20 21 22 23 24 25 2726 28 29 30
82%
10 2 3 4 5 76 8 9 10 11 1312 14 15 16 17 1918 20 21 22 23 24 25 2726 28 29 30
53%
63%
CL
ICK
HE
RE
to
go
to
p
ag
eC
on
ten
ts
21.
Patient Survival by Weight - Children
SECTION 3 : PATIENT SURVIVAL
Patie
nt S
urv
ival (
%)
Time Post-transplant (years)
100
90
80
70
60
50
40
30
20
10
0
Weight Group
5-8 kg (n=173)
> 8 kg (n=613)
< 5 kg (n=8)
P = NS91%
82%
75%
87%
79%
75%
81%83%
76%
77%
75%
75%
75%
75%
71%
73%
26TH
ANZLT REGISTRY
R E P O R T
DATA TO 31/12/2014 © copyright ANZLTR Data to 31.12.2014
10 2 3 4 5 76 8 9 10 11 1312 14 15 16 17 1918 20 21 22 23 24 25 2726 28 29 30
75%
CL
ICK
HE
RE
to
go
to
p
ag
eC
on
ten
ts

Time Post-transplant (years)22.
Patient Survival by Primary Disease
(1) Adults [excluding FHF] n = 1280
SECTION 3 : PATIENT SURVIVAL
(2) Adults [excluding FHF] n = 2085
Patie
nt S
urv
ival (
%)
Patie
nt S
urv
ival (
%)
39%
CVH : B,C,D
n = 5y
9 100%
Diagnosis Group
CVH : Hep B 221 81%
CVH : Hep C 849 79%
Malignancy 355 74%
PBC 218 86%
PSC 392 83%
CVH : B,C 16 94%
CVH : B,D 25 86%
10y 15y
100% 100%
78%
66% 53%
64%
76% 66%
75% 63%
66%
62%
94%
20y
53%
48%
84%
86%
60%
p = 0.003
100%
48%
26TH
ANZLT REGISTRY
R E P O R T
DATA TO 31/12/2014 © copyright ANZLTR Data to 31.12.2014
Biliary atresia
n = 5y 10y 15y
35 85% 81% 76%
Diagnosis Group
CAH: AI 145 81% 72%
Metabolic diseases 166 83% 75% 63%
Alcholic cirrhosis 461 84% 72%
Cryptogenic cirrhosis 174 81% 70% 56%
Other 299 83% 73% 68%
58%
57%
20y
50%
46%
56%
54%
35%
p = NS
81%
100
90
80
70
60
50
40
30
20
10
010 2 3 4 5 76 8 9 10 11 1312 14 15 16 17 1918 20 21 22 23 24 25 2726 28 29 30
76%
25y
45%
46%
51%
36%
30%
35%
25y
45%
40%
60%
100
90
80
70
60
50
40
30
20
10
0
10 2 3 4 5 76 8 9 10 11 1312 14 15 16 17 1918 20 21 22 23 24 25 2726 28 29 30
84%
CL
ICK
HE
RE
to
go
to
p
ag
eC
on
ten
ts

Time Post-transplant (years)
(3) Paediatric recipients [excluding FHF] n = 707
(4) Fulminant hepatic failure n = 433
Patie
nt S
urv
ival (
%)
Patie
nt S
urv
ival (
%)
23.
Patient Survival by Primary Disease
SECTION 3 : PATIENT SURVIVAL
Patie
nt S
urv
ival (
%)
p = NS
Age group
Adult (n=346)
Child (n=87)
All Patients (n=433)
p = NS82%
68%
66%
75%
78%
78%
76%79%
73%
73%
75%
59%
81%
65%
57%
100
90
80
70
60
50
40
30
20
10
0
Biliary atresia
n = 5y 10y 15y
437 85% 82% 81%
Diagnosis Group
Autoimmune hepatitis 9
Cryptogenic cirrhosis 17 87% 78% 78%
Malignancy 25 71% 53%
Metabolic diseases 116 88% 84% 84%
Other 95 88% 86% 84%
20y
76%
81%
84%
36%
62%
PSC 8 88%
36%
88%
26TH
ANZLT REGISTRY
R E P O R T
DATA TO 31/12/2014 © copyright ANZLTR Data to 31.12.2014
100
90
80
70
60
50
40
30
20
10
0
88% 88%
10 2 3 4 5 76 8 9 10 11 1312 14 15 16 17 1918 20 21 22 23 24 25 2726 28 29 30
52%
65%
49%
10 2 3 4 5 76 8 9 10 11 1312 14 15 16 17 1918 20 21 22 23 24 25 2726 28 29 30
100% 100% 75%
25y
74%
69%
84%
62%
CL
ICK
HE
RE
to
go
to
p
ag
eC
on
ten
ts

Adults CVH: Hepatitis C n = 849
Adults CVH: Hepatitis B n = 221
Malignancy Adults and Childrenn=380
Adults (n = 355)Children (n=25)
Time Post-transplant (years)24.
Patient Survival by Primary Disease
SECTION 3 : PATIENT SURVIVAL
Patie
nt S
urv
ival (
%)
Patie
nt S
urv
ival (
%)
Patie
nt S
urv
ival (
%)
Era
1985-89
1990-94
1995-99
2000-04
n = 5y 10y 15y
4 75% 50% 50%
34 82% 59%
109 72%
188
38%
56%
82%
2005-09 226
48%
P = NS
2010-14 288
72%
100
90
80
70
60
50
40
30
20
10
0
p < 0.001
1985-89 (n=12)
1990-94 (n=13)
1995-99 (n=21)
2000-04 (n=61)
Era
2010-14 (n=163)
2005-09 (n=110)
100
90
80
70
60
50
40
30
20
10
0
p <0.001
1985-89 (n=9)1990-94 (n= 26)
1995-99 (n= 54)2000-04 (n= 58)
Era
2010-14 (n= 36)
84%
81%
62%80%62%
54%
22%
11% 11%
79%
2005-09 (n= 38)
92%
77%
67%
97%
10 2 3 4 5 76 8 9 10 11 1312 14 15 16 17 1918 20 21 22 24
26TH
ANZLT REGISTRY
R E P O R T
DATA TO 31/12/2014 © copyright ANZLTR Data to 31.12.2014
10 2 3 4 5 76 8 9 10 11 1312 14 15 16 17 1918 20 21 22 23 24 25 26
100
90
80
70
60
50
40
30
20
10
0
23
10 2 3 4 5 76 8 9 10 11 1312 14 15 16 17 1918 20 21 22 23 24 25 26
70%
83%67%
57%
25
CL
ICK
HE
RE
to
go
to
p
ag
eC
on
ten
ts

Section 4G r a f t O u t c o m e
Section 4
SECTION 4 : GRAFT OUTCOME
26TH
ANZLT REGISTRY
R E P O R T
DATA TO 31/12/2014 © copyright ANZLTR Data to 31.12.2014
CL
ICK
HE
RE
to
go
to
p
ag
eC
on
ten
ts
25.
Graft Survival - All Grafts
SECTION 4 : GRAFT OUTCOME
Gra
ft S
urv
ival (
%)
Gra
ft S
urv
ival (
%)
1y 3y 5y 10y 15y 25y
No. at risk 3906 3180 2643 1594 848 66
Actuarial Survival (%)
86% 80% 77% 67% 59% 43%
N = 4864
100
90
80
70
60
50
40
30
20
10
0
Time Post-transplant (years)
100
90
80
70
60
50
40
30
20
10
0
Graft Survival by Age Group
82%
86%
77%
75%
70%
67%
68%
56%
63%
57%
37%
Adult (n=3964)
Children (n=900)
Age group
P<0.001
44%
20y
350
48%
Time Post-transplant (years)
26TH
ANZLT REGISTRY
R E P O R T
DATA TO 31/12/2014 © copyright ANZLTR Data to 31.12.2014
10 2 3 4 5 76 8 9 10 11 1312 14 15 16 17 1918 20 21 22 23 24 25 2726 28 29 30
10 2 3 4 5 76 8 9 10 11 1312 14 15 16 17 1918 20 21 22 23 24 25 2726 28 29 30
CL
ICK
HE
RE
to
go
to
p
ag
eC
on
ten
ts
26.
Graft Survival by Graft Number
SECTION 4 : GRAFT OUTCOME
Time Post-transplant (years)
Gra
ft S
urv
ival (
%)
Gra
ft S
urv
ival (
%)
Gra
ft S
urv
ival (
%)
100
90
80
70
60
50
40
30
20
10
87%
77%
74%
78%
69%
63%
69%
59%
52%
60%
59%
45%
50%
35%
43%
p <0.001
Graft Number
1st Grafts (n=4505) [92.6%]
2nd Grafts (n=328) [6.7%]
3rd Grafts (n=31) [0.6%]
All Grafts (n= 4864)
84%
64%
66%
78%
57%
57%
73%
46%
48%
71%66%
p <0.001
Graft Number
1st Grafts (n=794) [88%]
2nd Grafts (n=92) [10.4%]
3rd Grafts (n=14) [1.6%]
Children (n= 900)
100
90
80
70
60
50
40
30
20
10
0
87%88%
77%
78%
65%
78%
68%
78%
53%57%
78%
p <0.001
Graft Number
1st Grafts (n=3711) [93.6%]
2nd Grafts (n=236) [6%]
3rd Grafts (n=17) [0.4%]
100
90
80
70
60
50
40
30
20
10
46%
44%
Adult(n= 3964)
35%
38%
61%
43%
33%
0
0
26TH
ANZLT REGISTRY
R E P O R T
DATA TO 31/12/2014 © copyright ANZLTR Data to 31.12.2014
10 2 3 4 5 76 8 9 10 11 1312 14 15 16 17 1918 20 21 22 23 24 25 2726 28 29 30
10 2 3 4 5 76 8 9 10 11 1312 14 15 16 17 1918 20 21 22 23 24 25 2726 28 29 3010 2 3 4 5 76 8 9 10 11 1312 14 15 16 17 1918 20 21 22 23 24 25 2726 28 29 30
10 2 3 4 5 76 8 9 10 11 1312 14 15 16 17 1918 20 21 22 23 24 25 2726 28 29 3010 2 3 4 5 76 8 9 10 11 1312 14 15 16 17 1918 20 21 22 23 24 25 2726 28 29 30
46%
35%
59%
CL
ICK
HE
RE
to
go
to
p
ag
eC
on
ten
ts

100
90
80
70
60
50
40
30
20
10
0
10 2 3 4 5 76 8 9 10 11 1312 14 15 16 17 1918 20 21 22 23 24 25 2726 28 29 3010 2 3 4 5 76 8 9 10 11 1312 14 15 16 17 1918 20 21 22 23 24 25 2726 28 29 30
P = NS
Type of Graft
Split (n=241)
Reduced (n=30)
Whole (n=3678)
100
90
80
70
60
50
40
30
20
10
0
83%
63%
87%
77%
60%
76%
65%
47%
67%
55%
47%
57%
37%
55%
44%
47%
10 2 3 4 5 76 8 9 10 11 1312 14 15 16 17 1918 20 21 22 23 24 25 2726 28 29 30
27.
Graft Survival by Type of Graft [Deceased Donors]
SECTION 4 : GRAFT OUTCOME
Time Post-transplant (years)
All Grafts (n= 4775)
Children (n= 826)
Adult(n= 3949)
Gra
ft S
urv
ival (
%)
Gra
ft S
urv
ival (
%)
Gra
ft S
urv
ival (
%)
P = NS
Type of Graft
Split (n=478)
Reduced (n=349)
Whole (n=3948)
85%
73%
87%
77%
66%
77%
67%
60%
68%59%59%
58%
40%
59%
46%49%
P= 0.001
Type of Graft
Split (n=237)
Reduced (n=319)
Whole (n=270)
86%
74%
88%
79%
67%
81%
69%
61%
78%
60%
63%
76%
63%
69%
56%
55%
50%
100
90
80
70
60
50
40
30
20
10
0
26TH
ANZLT REGISTRY
R E P O R T
DATA TO 31/12/2014 © copyright ANZLTR Data to 31.12.2014
59%
10 2 3 4 5 76 8 9 10 11 1312 14 15 16 17 1918 20 21 22 23 24 25 2726 28 29 3010 2 3 4 5 76 8 9 10 11 1312 14 15 16 17 1918 20 21 22 23 24 25 2726 28 29 30
63%
CL
ICK
HE
RE
to
go
to
p
ag
eC
on
ten
ts

28.
SECTION 4 : GRAFT OUTCOME
Biliary
PNF/poor graft function
Vascular
Rejection
Recurrent HBV /HCV
Recurrent PBC/PSC/CAH:AI
Other
Age Group
Adults(n= 236)
Children(n= 122)
12%
10%
3%
30%
8%
37%
13%
7%
10%
8%
1 %613%
33%
26TH
ANZLT REGISTRY
R E P O R TIndication for Retransplantation n = 358 (327 2nd grafts, 31 3rd grafts)
20%
6%8%8%
13%
11%
34%
DATA TO 31/12/2014 © copyright ANZLTR Data to 31.12.2014
CL
ICK
HE
RE
to
go
to
p
ag
eC
on
ten
ts

29.
SECTION 4 : GRAFT OUTCOME
Num
ber
of G
rafts
46 (13%) 52 (15%) 60 (17%) 33 (9%) 88 (22%) 52 (14%)N = 35 (10%)
Biliary
PNF/poor graft function
Vascular
Rejection
Recurrent HBV /HCV
Recurrent PBC/PSC/CAH:AI Other
0
0-7d 8d- 1m 1m- 6m 6m -1y 1y- 5y 5y-10y >10y
5
10
15
20
25
30
35
40
45
50
55
60
Indication for Retransplantation n = 358 (327 2nd grafts, 31 3rd grafts)
30(13%)
35 (15%)
45(19%)
23(10%)
48(20%)
34(14%)
N = 21(9%)
0-7d 8d- 1m 1m - 6m 6m -1y 1y - 5y 5y - 10y >10y
0
5
10
15
20
25
30
40
Children (n=122) Adults (n=236)
16 (13%)
17 (14%)
15 (12%)
10(8%)
32(26%)
18(15%)
N = 14(12%)
0-7d 8d- 1m 1m - 6m 6m -1y 1y - 5y 5y - 10y >10y
0
5
10
15
20
25 35
30
65
26TH
ANZLT REGISTRY
R E P O R T
DATA TO 31/12/2014 © copyright ANZLTR Data to 31.12.2014
75
70
35 50
80
45
CL
ICK
HE
RE
to
go
to
p
ag
eC
on
ten
ts

Section 5Cause of Patient Death
Section 5
SECTION 5 : CAUSE OF PATIENT DEATH
26TH
ANZLT REGISTRY
R E P O R T
DATA TO 31/12/2014 © copyright ANZLTR Data to 31.12.2014
CL
ICK
HE
RE
to
go
to
p
ag
eC
on
ten
ts

Causes of Death
30.
SECTION 5 : CAUSE OF PATIENT DEATH
All Patients n = 1259
Operative
Respiratory
Cerebrovascular
Cardiovascular
Sepsis
Malignancy - recurrent
Malignancy - de novo
Recurrent HBV / HCV
Rejection
Other
Miscellaneous
Gastrointestinal
Graft failure
*
*
See Appendix V for details *
26TH
ANZLT REGISTRY
R E P O R T
DATA TO 31/12/2014 © copyright ANZLTR Data to 31.12.2014
9%
15%3%
6%
7%
8%
2%
15%
10%
11%
8%
6%
CL
ICK
HE
RE
to
go
to
p
ag
eC
on
ten
ts

Causes of Death in Adultn = 1107
31.
Operative
Respiratory
Cerebrovascular
Cardiovascular
Sepsis
Malignancy - recurrent
Malignancy - de novo
Recurrent HBV / HCV
Rejection
Other
Miscellaneous
Gastrointestinal Graft failure
*
*
See Appendix V for details *
Causes of Death in Childrenn =152
SECTION 5 : CAUSE OF PATIENT DEATH
26TH
ANZLT REGISTRY
R E P O R T
DATA TO 31/12/2014 © copyright ANZLTR Data to 31.12.2014
4%
20%
9% 2% 5%
14%
8%
4%
19%7%
9%
8%
16% 6%
6%
8%
2%
14%
11%12%
9%
5%
3%
CL
ICK
HE
RE
to
go
to
p
ag
eC
on
ten
ts

0%
10%
20%
30%
40%
50%
60%
70%
80%
90%
100%
0-7 8 30 1m-6m 6m - 1y 1y-5y 5y-10y 10y - 15y >15y
32.
SECTION 5 : CAUSE OF PATIENT DEATH
Cause of Death by Time Post Transplant
Operative
Respiratory
Cerebrovascular
Cardiovascular
Sepsis
Malignancy - de novo
Malignancy - recurrent
Gastrointestinal
N = 126 (10%) 290 (23%)108 (9%) 140 (11%) 92 (7%) 223 (18%)
Recurrent HBV / HCV
Rejection
Other [graft failure]
Miscellaneous
159 (13%) 121 (10%)
*
*
See Appendix V for details *
1y - 5y 5y - 10y 10y - 15y >15y0 - 7d 8d - 1m 1m - 6m 6m - 1y
0%
20%
40%
60%
80%
100%
26TH
ANZLT REGISTRY
R E P O R T
DATA TO 31/12/2014 © copyright ANZLTR Data to 31.12.2014
CL
ICK
HE
RE
to
go
to
p
ag
eC
on
ten
ts

0%
10%
20%
30%
40%
50%
60%
70%
80%
90%
100%
0-7 8 30 1m-6m 6m - 1y 1y-5y >5y-10y 10y - 15y >15y
0%
10%
20%
30%
40%
50%
60%
70%
80%
90%
100%
0-7 8 30 1m -6m 6m - 1y 1y-5y >5y-10y 10y - 15y >15y
33.
SECTION 5 : CAUSE OF PATIENT DEATH
N = 25 (16%) 28 (19%)26 (17%) 28 (18%) 8 (5%) 16 (11%) 6 (4%) 15 (10%)
Cause of Death by Time Post Transplant Children (n=152)
Operative
Respiratory
Cerebrovascular
Cardiovascular
Sepsis
Malignancy - de novo
Malignancy - recurrent
Gastrointestinal Recurrent HBV / HCV
Rejection
Other [graft failure]
Miscellaneous
N = 101 (9%) 262 (24%)82 (7%) 112 (10%) 84 (8%) 207 (19%) 153 (14%) 106 (10%)
1y - 5y 5y - 10y 10y - 15y >15y0 - 7d 8d - 1m 1m - 6m 6m - 1y
Cause of Death by Time Post Transplant Adult (n=1107)
1y - 5y 5y - 10y 10y - 15y >15y0 - 7d 8d - 1m 1m - 6m 6m - 1y
0%
20%
40%
60%
80%
100%
0%
20%
40%
60%
80%
100%
26TH
ANZLT REGISTRY
R E P O R T
DATA TO 31/12/2014 © copyright ANZLTR Data to 31.12.2014
CL
ICK
HE
RE
to
go
to
p
ag
eC
on
ten
ts

Section 6Deceased Donor Information
Section 6
SECTION 6 : DECEASED DONOR INFORMATION
26TH
ANZLT REGISTRY
R E P O R T
DATA TO 31/12/2014 © copyright ANZLTR Data to 31.12.2014
CL
ICK
HE
RE
to
go
to
p
ag
eC
on
ten
ts

Grafts from deceased donors
34.
Deceased Donation by Year
Cadaveric donors Grafts transplanted
Num
ber
Year
Waiting list - 31 Dec
SECTION 6 : DECEASED DONOR INFORMATION
DCD donors*
QLD NSW/ACT VIC/TAS SA/NT WA NZ TOTAL 2005 24 36/8 38/2 17/3 25 21 174
2006 28 34/3 39/6 25 17 24 176
2007 25 36/1 36 19/2 15 32 166
2008 33 40/3 41/5 31/1 25 23 203
2009 35 46/4 36/5 28/2 15 33 204
2010 30 55/8 53/6 18/2 17 32 221
2011 44 52/7 49/3 22/2 20 30 229
2012 46 50/7 52/10 21/6 20 28 240
2013 40 66/5 54/7 23/5 33 25 258
2014 44 45/7 62/8 27/4 25 32 254
4 1613* 5 14 15
26TH
ANZLT REGISTRY
R E P O R T
DATA TO 31/12/2014 © copyright ANZLTR Data to 31.12.2014
31 11
CL
ICK
HE
RE
to
go
to
p
ag
eC
on
ten
ts
35.
Time Post-transplant (years)
Gra
ft S
urv
ival (
%)
Donor
Age (
years
)
Era
SECTION 6 : DECEASED DONOR INFORMATION
1985 - 1989
80
70
60
50
40
30
20
10
0
1990 - 1994 1995 - 1999 2000 - 2004 2005 - 2009
Graft Survival by Donor AgeN = 4649
2010 - 2014
100
90
80
70
60
50
40
30
20
10
0
10 2 3 4 5 76 8 9 10 11 1312 14 15 16 17 1918 20 21 22 24
P <0.001
Donor age group
>65y
0.01-10y11-30y31-50y51-60y61-65y
n= 279
n= 211n= 1542n= 1627n= 745n= 245
Donor Age by EraN = 4410
n = 96 593 728 868 923
28.6y
36.4y
40.0y43.9y
46.1y
N = 4410Median Age: 40.2yRange: 3d - 84.5y
P < 0.001
1202
20.3y
23 25
26TH
ANZLT REGISTRY
R E P O R T
DATA TO 31/12/2014 © copyright ANZLTR Data to 31.12.2014
26
CL
ICK
HE
RE
to
go
to
p
ag
eC
on
ten
ts

Section 7L i v i n g D o n o r T r a n s p l a n t a t i o n
Section 7
SECTION 7 : LIVING DONOR TRANSPLANTATION
26TH
ANZLT REGISTRY
R E P O R T
DATA TO 31/12/2014 © copyright ANZLTR Data to 31.12.2014
CL
ICK
HE
RE
to
go
to
p
ag
eC
on
ten
ts

36.
Living Donor TransplantationN = 88
SECTION 7 : LIVING DONOR TRANSPLANTATION
Donor age
Median
Range
Mother
Father
Son
Daughter
Grandmother
Grandfather
Sister
Brother
Aunt
Uncle
Family friend
Cousin
Spouse
Donor gender
Male
Female
Child [n=73] Adult [n=15]
-
35.3y
19.9 - 54.5y
-
18
35
-
-
1
1
-
2
6
1
5
4
-
-
30.4y
22.8 - 54.3y
-
-
-
4
1
-
-
3
3
-
-
1
-
1
-
43
30
-
9
6
All [n=88]
-
34y
19 - 54.5y
-
18
35
4
1
1
1
3
5
6
1
6
4
1
-
52
36
Recipient Age Group
*
* 2 x whole liver domino transplant
Donor relationship
26TH
ANZLT REGISTRY
R E P O R T
DATA TO 31/12/2014 © copyright ANZLTR Data to 31.12.2014
Surv
ival (
%)
Time Post-transplant (years)
90
80
70
60
50
40
30
20
10
0
100
(82 patients received LD graft as first graft)
All Patients (n= 82)
All Grafts (n= 88)o nd rd[82 x 1 , 5 x 2 , 1 x, 3 ]
10 2 3 4 5 76 8 9 10 11 1312 14 15 16 17 1918 20 21 22 23 24 25 26
Paediatric Patient Survival (n= 68)
Adult Patient Survival (n= 14)
CL
ICK
HE
RE
to
go
to
p
ag
eC
on
ten
ts

Section 8W a i t i n g L i s t
Section 8
SECTION 8 : WAITING LIST
26TH
ANZLT REGISTRY
R E P O R T
DATA TO 31/12/2014 © copyright ANZLTR Data to 31.12.2014
CL
ICK
HE
RE
to
go
to
p
ag
eC
on
ten
ts

Waiting List Activity[ Data 1/1/10 - 31/12/14]
37.
SECTION 8 : WAITING LIST
Outcome of Initial Urgent Listing
[* Patient declined, malignancy, drug use, infection, further investigations, medical]
TRANSPLANTED
IMPROVED
DIED / TOO SICK
OTHER TREATMENT
2010
(n=19)
13
1
5
-
OUTCOME
}74%
2011
(n=15)
12
-
3
-
}80%6
1
1
-
}88%
Listed at 1 January
New listings
Transplant
Activity
Still listed at 31 Dec
OUTCOME
TOTAL
Died on list
Too sick
Tumour progression
Improved
Other
TOTAL 2014
565
Delisted
Adult
235 [47%]
187
500
15
10
15
16
22
Paediatric
43 [66%]
17
65
3
-
-
2
-
2014
78 5
[ %]278 49
204 [36%]
83
}[ ]8%18
22
1015
18*
4
1
1
-
OUTCOME
175
335
248 [49%]
194 [38%]
510
12
12
12
16
12
2010
}8%
68 [13%]
*
2
-
-
-
1 active
31/12/11
26TH
ANZLT REGISTRY
R E P O R T
194
336
253 [49%]
192 [36%]
530
17
17
20
12
19
2011
}8%
85 [13%]
*
164
-
88
51
164
8
3
4
5
5
-
401
190
153
401
10
7
11
13
17
25 58
}8%}5%
DATA TO 31/12/2014 © copyright ANZLTR Data to 31.12.2014
2014
CATEGORY 1
N=8 Adultn=6
Paediatricn=2
TRANSPLANTED
IMPROVED
DIED / TOO SICK
OTHER TREATMENT
2010
(n=30)
23
5
1 / 1
-
OUTCOME
}93%
2011
(n=28)
22
2
3
}86%18
3
-
}95%12
2
-
6
1
-
2014
CATEGORY 2
N=22 Adultn=14
Paediatricn=8
1 active
31/12/14
192
351
268 [50%]
186 [34%]
543
29
16
10
17
17
2012
}8%
89[13%]
*
2012
(n=16)
11
2
3
-
}
1 active
31/12/12
2012
(n=19)
14
3
1
}
81%
89%
[*1 temporary listing chronic patient; later transplanted]
1 active
31/12/14
2013
(n=19)
11
3
5
-
}
1 active
31/12/13
2013
(n=29)
22
4
2
}
74%
89%
*
-
186
360
284 [52%]
164 [34%]
546
26
11
16
24
21
2013
}10%
98[18%]
*
CL
ICK
HE
RE
to
go
to
p
ag
eC
on
ten
ts
Outcome by Blood Group
Waiting Time to Transplant 2014
A O B AB TOTAL
n=
Not transplanted
Transplanted
215 (38%) 254 (45%) 78 (14%) 20 (3%) 567
Blood Group
92 144 48 5 289
123 (57%) 110 (43%) 30 (38%) 15 (75%) 278 (49%)
*
**
* % of total number listed
** % of blood group
38.
SECTION 8 : WAITING LIST
Blood Type
OBABA
Waiti
ng T
ime (
Month
s)
6
4
2
0
16
14
12
8
10
26
24
22
18
20
36
34
32
28
30
38
-2
26TH
ANZLT REGISTRY
R E P O R T
DATA TO 31/12/2014 © copyright ANZLTR Data to 31.12.2014
P= NS
40
42
91d 120d83d61dMedian
n= 123 (44%) 110 (40%)30 (11%) 15 (5%)
44
46
48
CL
ICK
HE
RE
to
go
to
p
ag
eC
on
ten
ts

Waiting Time by Outcome
39.
SECTION 8 : WAITING LIST
Waiti
ng T
ime (
Month
s)
Patient Outcome
Waiting Time by Outcome & Blood Group
Waiti
ng T
ime (
Month
s)
Blood Type
Listed 2014Waiting
Listed 2014TransplantListed 2014
DelistedListed pre '14
Waiting
Listed pre '14
TransplantListed pre '14
Delisted
8
4
0
20
12
16
32
24
28
44
40
36
52
48
6
4
20
1614
12
810
26
2422
18
20
36
34
32
2830
38
56
-2
60
48
46
44
40
42
AB B OA
50
52
54
5658
60
26TH
ANZLT REGISTRY
R E P O R T
DATA TO 31/12/2014 © copyright ANZLTR Data to 31.12.2014
Median waiting time to transplant= 82d (0-46m)
Median waiting time listed patients 31/12/14
= 161d (1d-90m)
Median= 81d 70d 134d 117d
Median 297d 291d
38d 56d108d
547d
Transplanted
Not transplanted
Patient Outcome
CL
ICK
HE
RE
to
go
to
p
ag
eC
on
ten
ts

Section 9L i v e r T r a n s p l a n t a t i o n a n d C a n c e r
Section 9
SECTION 9 : LIVER TRANSPLANTATION AND CANCER
26TH
ANZLT REGISTRY
R E P O R T
DATA TO 31/12/2014 © copyright ANZLTR Data to 31.12.2014
CL
ICK
HE
RE
to
go
to
p
ag
eC
on
ten
ts
Cancer in Liver Transplant Recipientsn = 4506
40.
SECTION 9 : LIVER TRANSPLANTATION AND CANCER
Liver Cancer as Primary Diagnosisn = 384/4506
26TH
ANZLT REGISTRY
R E P O R T
DATA TO 31/12/2014 © copyright ANZLTR Data to 31.12.2014
At Tx
Liver Cancer as indication for Transplant 384 (9%)
Liver Ca as a Secondary Diagnosis 572 (13%) 574 Ca
Total 950* (21%)
Post Tx
Recurrent Liver Ca 127 (3% of all pts, 13% pts with Ca at Tx)
De Novo Ca 323 (7%) 352 Ca
Skin Ca 653 (14%)
Total 1103 (24%)
Multiple Cancer types (non skin and skin) 215 (5% of all pts)
Multiple non skin cancers 88 (2% of all pts)
Transferred from Donor 2
Developed non skin Ca < 90days 9
Total number pts. transplanted = 4506
* 2 pts had primary and a secondary liver cancer; 2 pts had multiple secondary liver cancers
TYPE OF CA No DIEDDIED OF THIS
CA
HEPATOCELLULAR CA 342 76 39 (11%)
HEPATOBLASTOMA 22 5 4 (18%)
FIBROLAMELLAR 6 5 2 (33%)
CARCINOID 4 4 4 (100%)
EPITHELOID HAEMANGIOENDOTHELIOMA 4 0 0
CHOLANGIOCARCINOMA 2 1 1 (50%)
ANGIOSARCOMA 1 1 1 (100%)
GASTRINOMA 1 1 1 (100%)
PANCREATIC ISLET CELL 1 1 1 (100%)
ERYTHROID LEUKAEMIA 1 1 1 (100%)
TOTALS 384 (9% of pts)95 (25% of
those with PCa)
54 (14% of those with
PCa)
CL
ICK
HE
RE
to
go
to
p
ag
eC
on
ten
ts

Overall SurvivalPrimary Liver Cancern =384/4506 (9% of pts transplanted)
41.
SECTION 9 : LIVER TRANSPLANTATION AND CANCER
Overall SurvivalPrimary Liver Cancern= 384/4506 (9%)
26TH
ANZLT REGISTRY
R E P O R T
DATA TO 31/12/2014 © copyright ANZLTR Data to 31.12.2014
% S
urv
ivin
g
0
20
40
60
80
100
0 5 10 15 20
Years Post Tx
n =384/4506 (9% of pts transplanted)
5y 10y 15y 20y
No. at risk 136 45 15 4
Actuarial Survival % 74 62 56 45
% S
urv
ivin
g
0
20
40
60
80
100
0 5 10 15 20
Years Post Tx
HCC (n=342)
Hepatoblastoma (n=22)
Fibrolamellar (n=6)
CC (n=2)
Other (n=12)
p< 0.05
CL
ICK
HE
RE
to
go
to
p
ag
eC
on
ten
ts
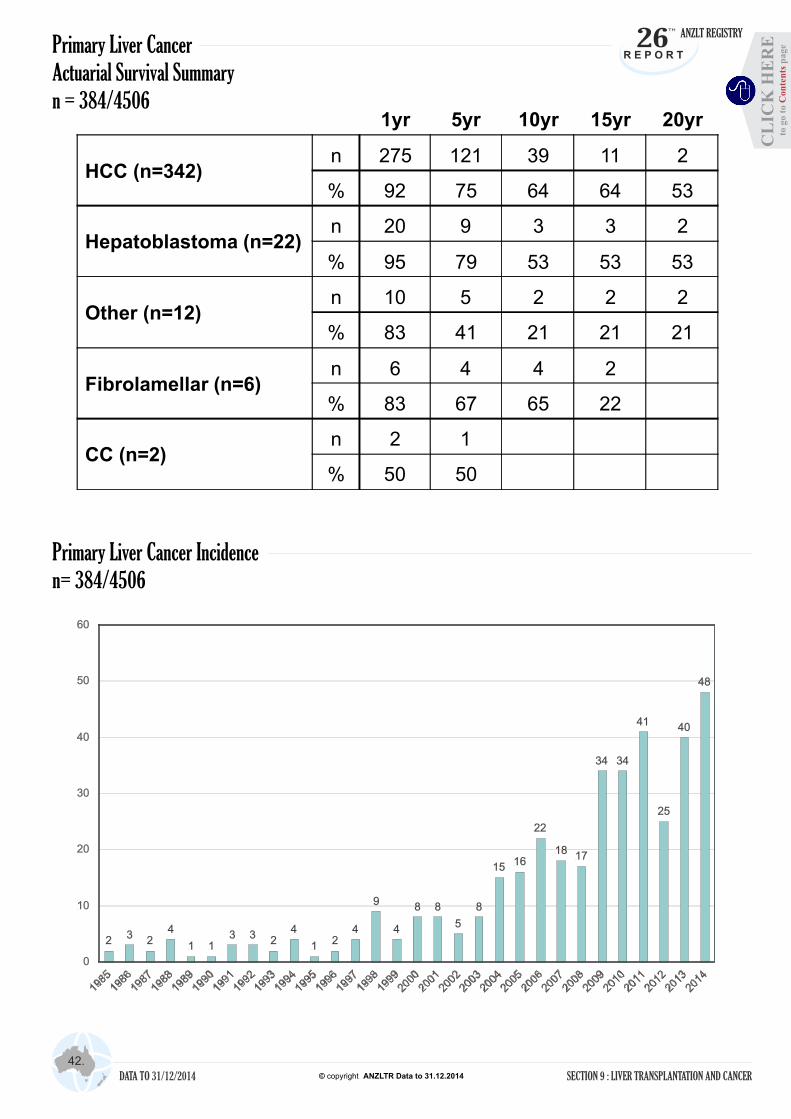
Primary Liver Cancer Actuarial Survival Summaryn = 384/4506
42.
SECTION 9 : LIVER TRANSPLANTATION AND CANCER
Primary Liver Cancer Incidence n= 384/4506
26TH
ANZLT REGISTRY
R E P O R T
DATA TO 31/12/2014 © copyright ANZLTR Data to 31.12.2014
1yr 5yr 10yr 15yr 20yr
HCC (n=342)n 275 121 39 11 2
% 92 75 64 64 53
Hepatoblastoma (n=22)n 20 9 3 3 2
% 95 79 53 53 53
Other (n=12)n 10 5 2 2 2
% 83 41 21 21 21
Fibrolamellar (n=6)n 6 4 4 2
% 83 67 65 22
CC (n=2)n 2 1
% 50 50
23
24
1 13 3
24
12
4
9
4
8 8
5
8
1516
22
1817
34 34
41
25
40
48
0
10
20
30
40
50
60
CL
ICK
HE
RE
to
go
to
p
ag
eC
on
ten
ts
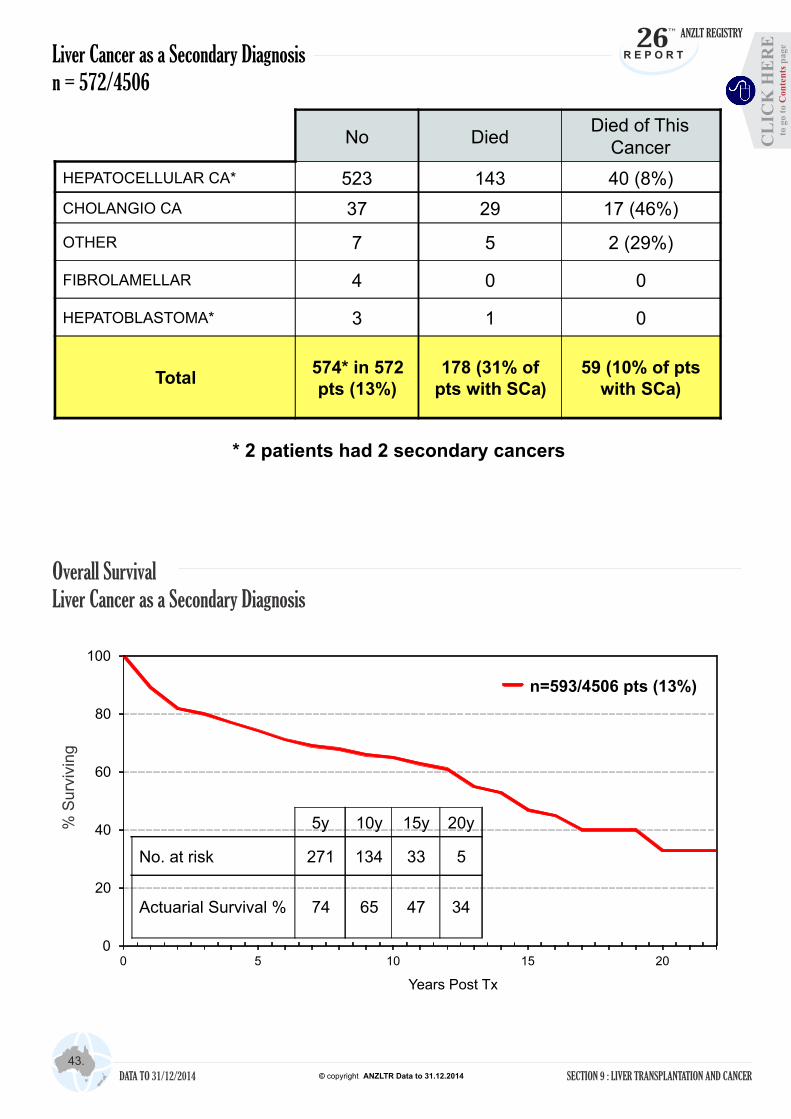
Overall SurvivalLiver Cancer as a Secondary Diagnosis
43.
SECTION 9 : LIVER TRANSPLANTATION AND CANCER
Liver Cancer as a Secondary Diagnosisn = 572/4506
26TH
ANZLT REGISTRY
R E P O R T
DATA TO 31/12/2014 © copyright ANZLTR Data to 31.12.2014
* 2 patients had 2 secondary cancers
% S
urv
ivin
g
No DiedDied of This
Cancer
HEPATOCELLULAR CA* 523 143 40 (8%)
CHOLANGIO CA 37 29 17 (46%)
OTHER 7 5 2 (29%)
FIBROLAMELLAR 4 0 0
HEPATOBLASTOMA* 3 1 0
Total574* in 572 pts (13%)
178 (31% of pts with SCa)
59 (10% of pts with SCa)
0
20
40
60
80
100
0 5 10 15 20
Years Post Tx
n=593/4506 pts (13%)
5y 10y 15y 20y
No. at risk 271 134 33 5
Actuarial Survival % 74 65 47 34
CL
ICK
HE
RE
to
go
to
p
ag
eC
on
ten
ts

Liver Cancer as a Secondary Diagnosisn =593/ 4506 (13%)
44.
SECTION 9 : LIVER TRANSPLANTATION AND CANCER
Secondary Liver Cancer Actuarial Survival Summaryn =572/ 4506 (13%)
26TH
ANZLT REGISTRY
R E P O R T
DATA TO 31/12/2014 © copyright ANZLTR Data to 31.12.2014
% S
urv
ivin
g
0
20
40
60
80
100
0 5 10 15 20
Years Post Tx
Fibrolamellar (n=4)
Hepatoblastoma (n=3)
HCC (n=544)
Other (n=7)
CC (n=37)
p<0.0001
1yr 5yr 10yr 15yr
HCC (n=523)n 420 251 124 30
% 89 77 69 51
CC (n=37)n 31 13 8 2
% 81 38 27 6
Other (n=7)n 7 4 2
% 86 57 19
Fibrolamellar (n=4)n 4 4 4 4
% 100 100 100 100
Hepatoblastoma (n=3)n 3 3 2 2
% 67 67 67 67
CL
ICK
HE
RE
to
go
to
p
ag
eC
on
ten
ts

45.
SECTION 9 : LIVER TRANSPLANTATION AND CANCER
Liver Cancer (Primary or Secondary Diagnosis) n = 953/4506
Patient Actuarial SurvivalBenign Disease vs Pre Transplant Liver Malignancyn = 4506
26TH
ANZLT REGISTRY
R E P O R T
DATA TO 31/12/2014 © copyright ANZLTR Data to 31.12.2014
* 2 patients had 2 secondary cancers; 2 patients had a primary and secondary liver malignancy
TYPE OF CA No. DIED DIED OF THIS CA
HEPATOCELLULAR CA* 864 219 79 (9%)
CHOLANGIOCARCINOMA* 39 30 18 (46%)
HEPATOBLASTOMA* 25 6 4 (16%)
FIBROLAMELLAR 10 5 2 (20%)
CARCINOID 4 4 4 (100%)
ADENOCARCINOMA 5 4 1 (20%)
EPITHELOID HAEMANGIOENDOTHELIOMA 4 0 0
ANGIOSARCOMA 2 2 2 (100%)
GASTRINOMA 1 1 1 (100%)
PANCREATIC ISLET CELL 1 1 1 (100%)
ERYTHROID LEUKAEMIA 1 1 1 (100%)
TOTALS958* Ca in 953
pts (21% of pts)
273 (29%of those with
Ca)113 (12% of those with Ca
at Tx)
0
20
40
60
80
100
0 5 10 15 20
% Surviving
Years Post Tx
Benign disease (n=3553)
Malignant disease (n=953)
p=0.000
5y 10y 15y 20y 25y
Benign Disease
n2226 1451 828 364 75
% Surviving83 75 67 57 51
Malignant Disease
n406 178 47 8
% Surviving74 64 49 37
p<0.0001C
LIC
K H
ER
E t
o g
o t
o
pa
ge
Co
nte
nts

Liver Cancer at Transplantationn = 954/4506 (21%)
46.
SECTION 9 : LIVER TRANSPLANTATION AND CANCER
De Novo Non - Skin Cancern = 323/4506
26TH
ANZLT REGISTRY
R E P O R T
DATA TO 31/12/2014 © copyright ANZLTR Data to 31.12.2014
* 2 patients had 2 secondary cancers; 2 patients had a primary and secondary liver malignancy
28 23 4026
234
603
1985 -1994 1995 - 2004 2005 - 2014
Other (n=91*)
HCC (n=863)
* 27 patients had more than 1 de novo cancer
m = median
No Male Female Age of pts (yrs)Time to diagnosis
(mths)Died of This
Cancer
Alimentary* 125 95 30 12.6 – 83 (m 59) 3 – 281 (m 54) 59 (45%)
Lymphoma* 91 54 37 1– 70 (m 48) 1 – 217 (m 5) 32 (37%)
Genitourinary* 47 31 16 21 – 75 (m 61) 2 – 348 (m 20) 4 (10%)
Breast 25 - 25 30 – 74 (m 55) 11 – 241 (m 79) 10 (36%)
Respiratory 33 27 6 29 – 75(m 60) 7 – 212 (m 39) 25 (76%)
Endocrine 9 4 5 35 – 70 (m 56) 35 – 213 (m 64) 3 (33%)
CNS 7 5 2 16 – 75 (m 57) 14– 211 (m 99) 6 (86%)
Kaposi’s 5 4 1 32 – 65 (m 51) 2 – 48 (m 16) 0
Leukaemia 4 2 2 3 – 66 (m 43) 16 – 155 (m 37) 0
Miscellaneous 4 2 2 62 – 73 (m 68) 60– 234 (m 87) 1(25%)
Total*352 ca in
323 pts 225 127 1 – 83 (m 56) 1 – 348 (m 53)140 (43% of pts with Ca)
CL
ICK
HE
RE
to
go
to
p
ag
eC
on
ten
ts

47.
SECTION 9 : LIVER TRANSPLANTATION AND CANCER
Time to De Novo Non - Skin Cancern = 4506352 cancers in 323 pts (7% of all pts)
De Novo Non - Skin Cancer vs All Patientsn = 4506
26TH
ANZLT REGISTRY
R E P O R T
DATA TO 31/12/2014 © copyright ANZLTR Data to 31.12.2014
0
5
10
15
20
25
30
35
40
0-3m 3-12m 1-3yr 3-5yr 5-10y >10y
Alimentary Tract
Breast
CNS
Endocrine
Genitourinary
Kaposi's sarcoma
Leukaemia
Lymphoma
Miscellaneous
Respiratory
0
20
40
60
80
100
0 5 10 15 20 25
% Surviving
Years Post Tx
Other Pts (n=4183)De Novo (n=323)
p<0.0001
5y 10y 15y 20y
All Ptsn 1529 793 318 42
% Surviving 80 73 66 58
De Novo
n 78 55 34 15
% Surviving 77 66 46 25
CL
ICK
HE
RE
to
go
to
p
ag
eC
on
ten
ts
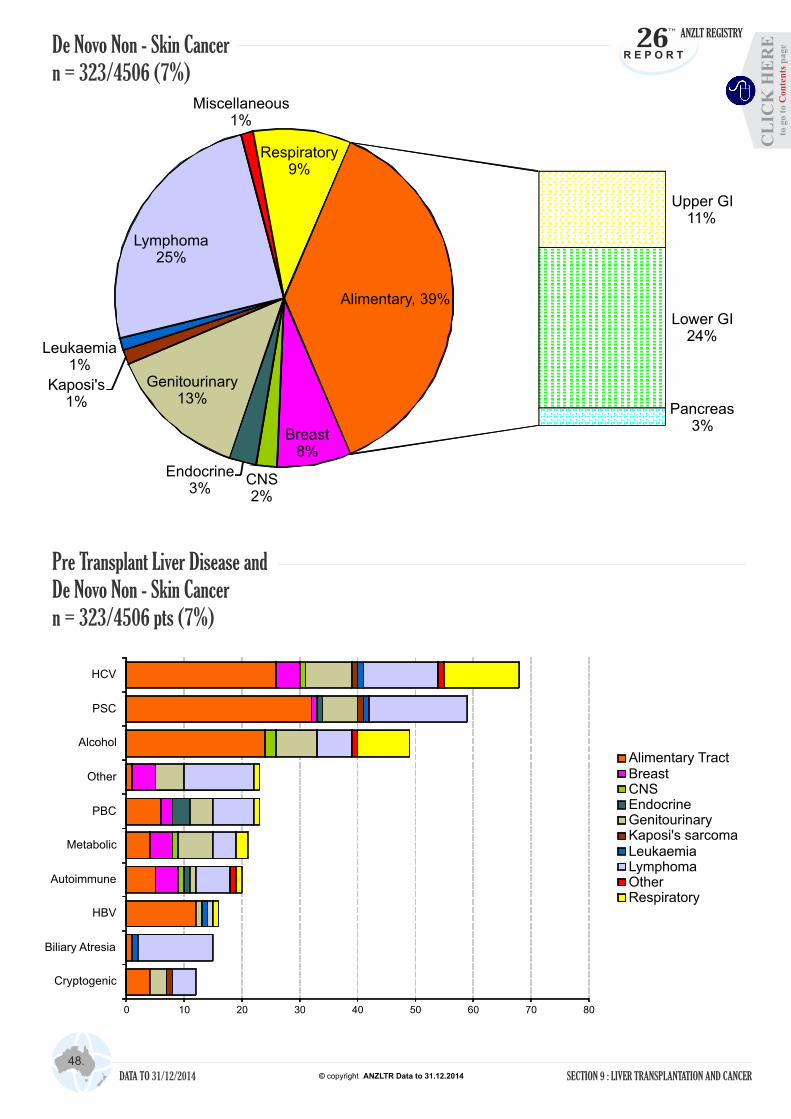
48.
SECTION 9 : LIVER TRANSPLANTATION AND CANCER
De Novo Non - Skin Cancern = 323/4506 (7%)
26TH
ANZLT REGISTRY
R E P O R T
DATA TO 31/12/2014 © copyright ANZLTR Data to 31.12.2014
Breast8%
CNS2%
Endocrine3%
Genitourinary13%
Kaposi's1%
Leukaemia1%
Lymphoma25%
Miscellaneous1%
Respiratory9%
Upper GI11%
Lower GI24%
Pancreas3%
Alimentary, 39%
Pre Transplant Liver Disease andDe Novo Non - Skin Cancern = 323/4506 pts (7%)
0 10 20 30 40 50 60 70 80
Cryptogenic
Biliary Atresia
HBV
Autoimmune
Metabolic
PBC
Other
Alcohol
PSC
HCV
Alimentary TractBreastCNSEndocrineGenitourinaryKaposi's sarcomaLeukaemiaLymphomaOtherRespiratory
CL
ICK
HE
RE
to
go
to
p
ag
eC
on
ten
ts
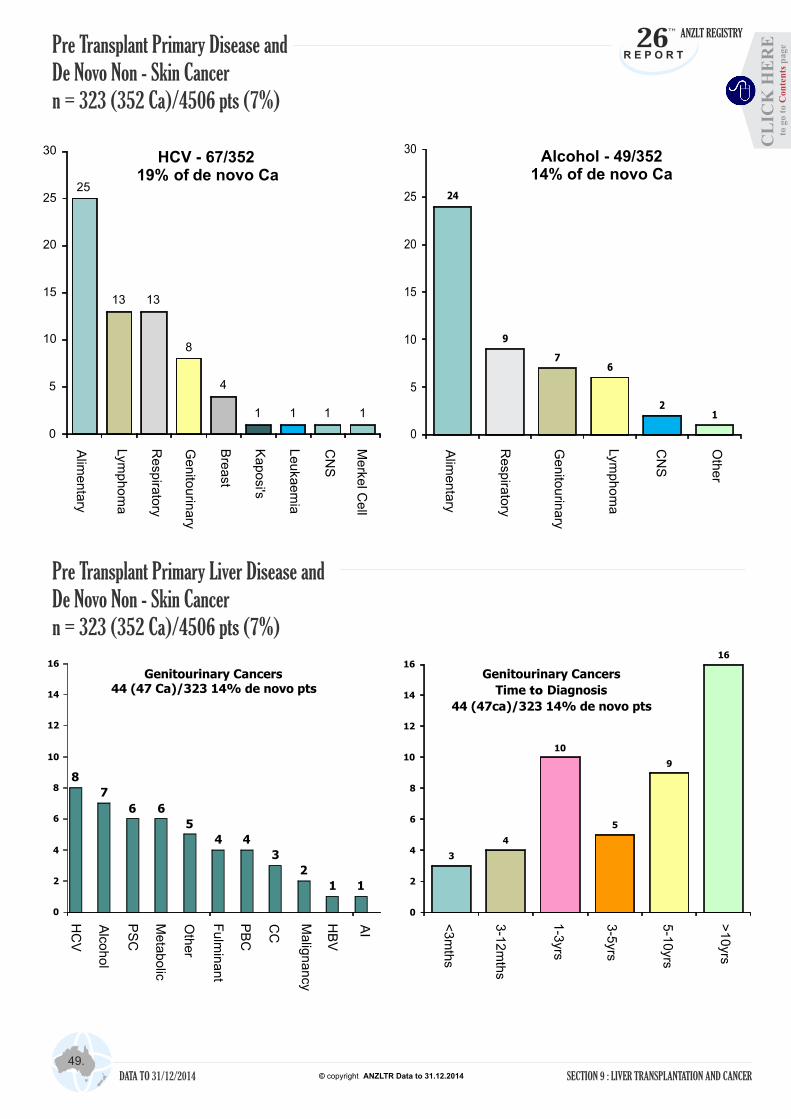
49.
SECTION 9 : LIVER TRANSPLANTATION AND CANCER
Pre Transplant Primary Liver Disease andDe Novo Non - Skin Cancer n = 323 (352 Ca)/4506 pts (7%)
Pre Transplant Primary Disease andDe Novo Non - Skin Cancer n = 323 (352 Ca)/4506 pts (7%)
26TH
ANZLT REGISTRY
R E P O R T
DATA TO 31/12/2014 © copyright ANZLTR Data to 31.12.2014
Bre
ast
Alim
enta
ry
Lym
phom
a
Resp
irato
ry
Genito
urin
ary
Kaposi's
Leuka
em
ia
CN
S
Alim
enta
ry
Resp
irato
ry
Lym
phom
a
Genito
urin
ary
CN
S
Oth
er
25
13 13
8
4
1 1 1 1
0
5
10
15
20
25
30HCV - 67/352
19% of de novo Ca24
9
76
21
0
5
10
15
20
25
30Alcohol - 49/352
14% of de novo Ca
Merke
l Cell
8
7
6 6
5
4 4
3
2
1 1
0
2
4
6
8
10
12
14
16
Genitourinary Cancers44 (47 Ca)/323 14% de novo pts
3
4
10
5
9
16
0
2
4
6
8
10
12
14
16Genitourinary Cancers
Time to Diagnosis
44 (47ca)/323 14% de novo pts
PS
C
HC
V
Meta
bolic
Alco
hol
Fulm
inan
t
PB
C
Oth
er
CC
Malig
nancy
HB
V
AI
<3m
ths
3-1
2m
ths
1-3
yrs
3-5
yrs
5-1
0yrs
>10yrs
CL
ICK
HE
RE
to
go
to
p
ag
eC
on
ten
ts
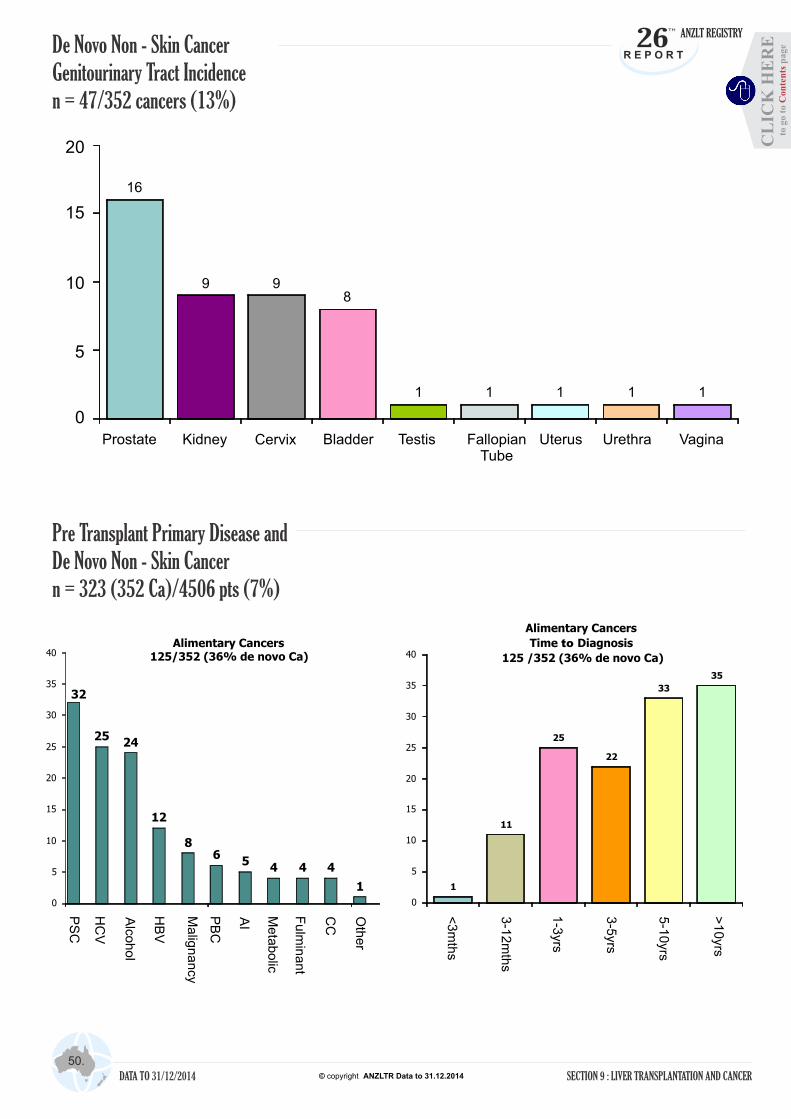
50.
SECTION 9 : LIVER TRANSPLANTATION AND CANCER
De Novo Non - Skin CancerGenitourinary Tract Incidencen = 47/352 cancers (13%)
26TH
ANZLT REGISTRY
R E P O R T
DATA TO 31/12/2014 © copyright ANZLTR Data to 31.12.2014
Prostate Cervix Testis UterusKidney Bladder FallopianTube
Urethra
16
9 98
1 1 1 1 1
Vagina
0
5
10
15
20
Pre Transplant Primary Disease andDe Novo Non - Skin Cancer n = 323 (352 Ca)/4506 pts (7%)
PS
C
HC
V
Meta
bolic
Alco
hol
Fu
lmin
ant
PB
C
Oth
er
CC
Malig
nan
cy
HB
V
AI
<3
mth
s
3-1
2m
ths
1-3
yrs
3-5
yrs
5-1
0yrs
>1
0yrs
32
2524
12
86
54 4 4
1
0
5
10
15
20
25
30
35
40Alimentary Cancers
125/352 (36% de novo Ca)
1
11
25
22
33
35
0
5
10
15
20
25
30
35
40
Alimentary Cancers
Time to Diagnosis
125 /352 (36% de novo Ca)
CL
ICK
HE
RE
to
go
to
p
ag
eC
on
ten
ts
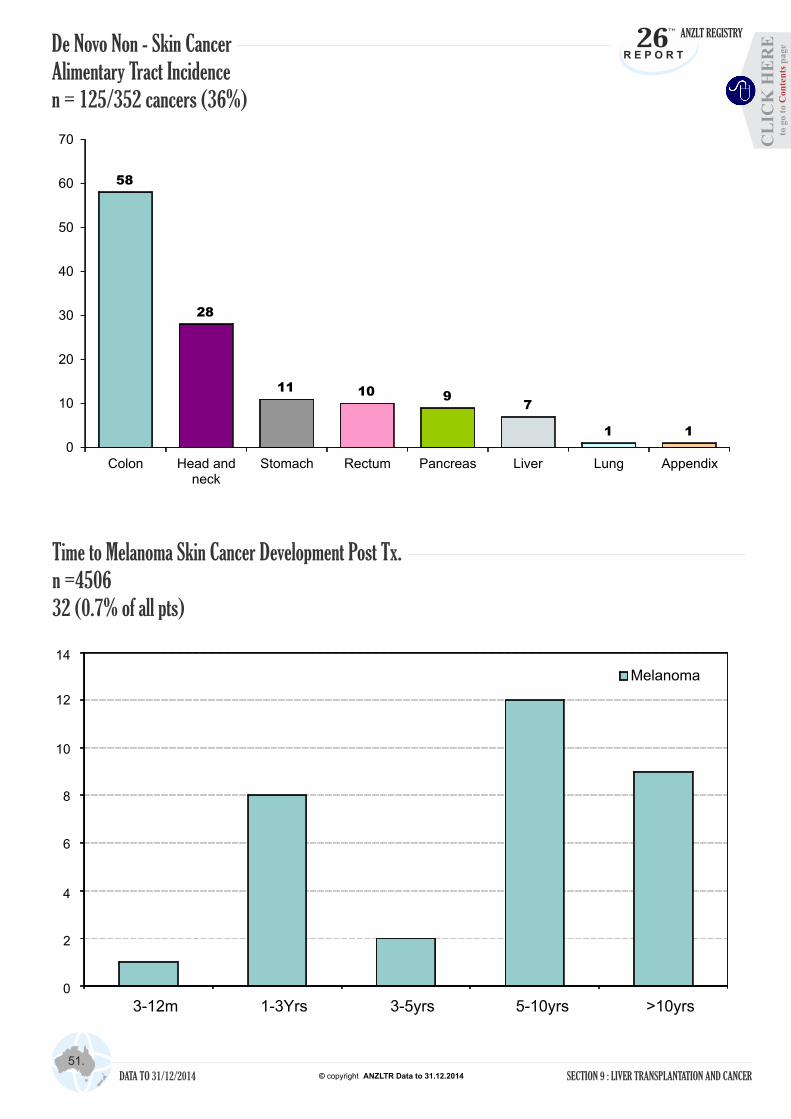
51.
SECTION 9 : LIVER TRANSPLANTATION AND CANCER
26TH
ANZLT REGISTRY
R E P O R T
DATA TO 31/12/2014 © copyright ANZLTR Data to 31.12.2014
Time to Melanoma Skin Cancer Development Post Tx.n =450632 (0.7% of all pts)
De Novo Non - Skin CancerAlimentary Tract Incidencen = 125/352 cancers (36%)
58
28
11 10 97
1 1
0
10
20
30
40
50
60
70
Colon Head andneck
Stomach Rectum Pancreas Liver Lung Appendix
0
2
4
6
8
10
12
14
3-12m 1-3Yrs 3-5yrs 5-10yrs >10yrs
Melanoma
CL
ICK
HE
RE
to
go
to
p
ag
eC
on
ten
ts
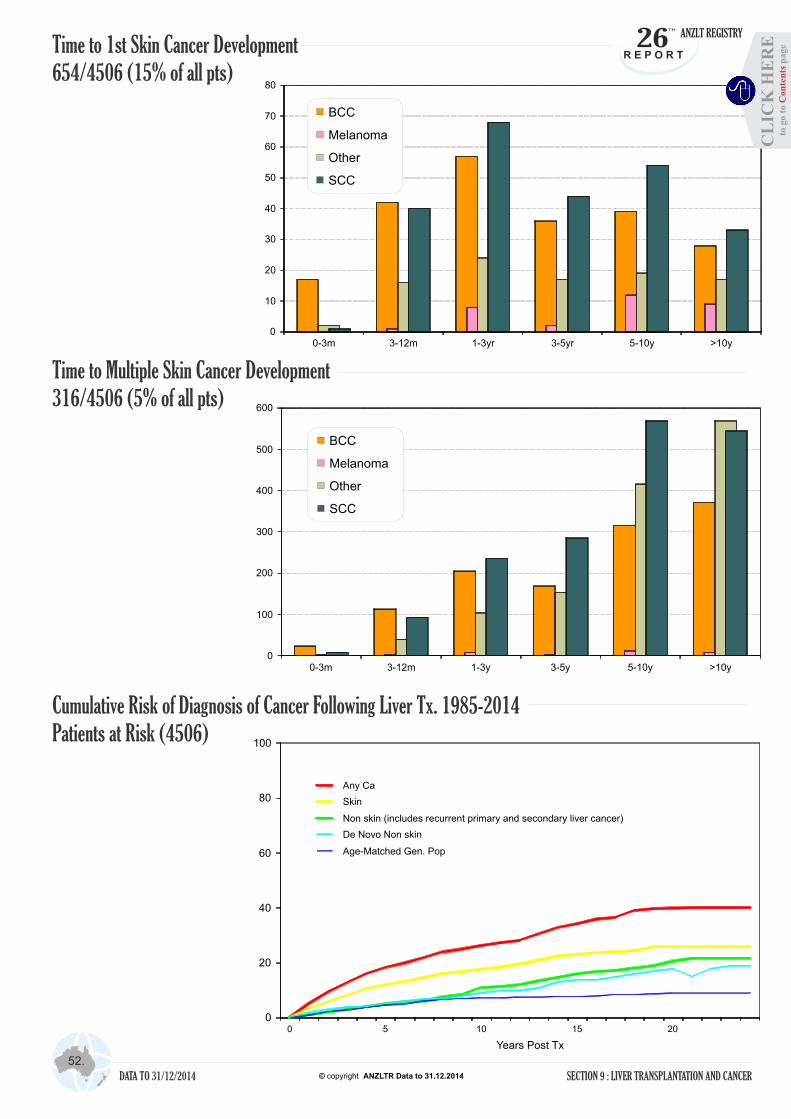
52.
SECTION 9 : LIVER TRANSPLANTATION AND CANCER
Time to 1st Skin Cancer Development654/4506 (15% of all pts)
26TH
ANZLT REGISTRY
R E P O R T
DATA TO 31/12/2014 © copyright ANZLTR Data to 31.12.2014
Time to Multiple Skin Cancer Development316/4506 (5% of all pts)
Cumulative Risk of Diagnosis of Cancer Following Liver Tx. 1985-2014Patients at Risk (4506)
0
10
20
30
40
50
60
70
80
0-3m 3-12m 1-3yr 3-5yr 5-10y >10y
0
100
200
300
400
500
600
0-3m 3-12m 1-3y 3-5y 5-10y >10y
0
20
40
60
80
100
0 5 10 15 20
Years Post Tx
Any Ca
Skin
Non skin (includes recurrent primary and secondary liver cancer)
De Novo Non skin
Age-Matched Gen. Pop
BCC
Melanoma
Other
SCC
BCC
Melanoma
Other
SCC
CL
ICK
HE
RE
to
go
to
p
ag
eC
on
ten
ts
Appendix IAppendix I
APPENDIX
Liver Transplant Units of Australia and New Zealand
South Australian Liver Transplant Unit
Flinders Medical Centre
Flinders Drive
BEDFORD PARK SA 5042
http://www.flinders.sa.gov.au/surgical/pages/livertrans/6984/
WA Liver Transplantation Service
Sir Charles Gairdner Hospital
Verdun Street
NEDLANDS WA 6009
New Zealand Liver Transplant Unit
Auckland City Hospital
Park Road
Auckland
New Zealand
http://www.nzliver.org/
The Children's Hospital at Westmead
Hawkesbury Road
WESTMEAD NSW 2145
The Royal Children's Hospital
Flemington Road
PARKVILLE VIC 3052
The Lady Cilento Children's Hospital
Stanley Street
SOUTH BRISBANE QLD 4101
Starship Children’s Hospital
Park Road
AUCKLAND
New Zealand
Australian National Liver Transplant Unit
Royal Prince Alfred Hospital
Missenden Road
CAMPERDOWN NSW 2050
Email: [email protected]
http://www.anltu.com.au/
Victorian Liver Transplantation Unit
The Austin Hospital
Studley Road
HEIDELBERG VIC 3084
http://www.austin.org.au/page/209
Queensland Liver Transplant Service
Princess Alexandra Hospital
Ipswich Road
WOOLLOONGABBA QLD 4102
and
and
and
53.
26TH
ANZLT REGISTRY
R E P O R T
DATA TO 31/12/2014 © copyright ANZLTR Data to 31.12.2014
and
CL
ICK
HE
RE
to
go
to
p
ag
eC
on
ten
ts

Appendix IIAppendix II
APPENDIX
54.
ANZLTR PRIMARY Diagnosis Metabolic disorders by Age Group
-1 Antitrypsin deficiency
Crigler-Najjar
Familial amyloid polyneuropathy
Glycogen storage disease
Haemochromatosis
Homozygous Hypercholesterolemia
Idiopathic copper toxicosis
Indian childhood cirrhosis Other
Primary hyperoxaluria
Tyrosinemia Urea cycle disorders Wilsons disease
Total
Maple syrup urine disease 4Amyloidosis 2Bile acid Transport disorder 2Protein C deficiency 2Propionic acidemia 2Methylmalonic acidemiaFamilial immunodeficiencyMitochondrial diseasePorphyria
38
10
0
4
3
6
1
1
13
9
4
20
8
117
49
1
35
6
29
2
0
0
6
6
0
4
28
166
Age group
Primary Diagnosis
87
11
35
10
32
8
1
1
19
15
4
24
36
283
*
**
OTC deficiency 13Citrullinemia 4Argininosuccinic aciduria 4Carbamyl phosphate synthetase deficiency 3
* **
Child Adult
Total
26TH
ANZLT REGISTRY
R E P O R T
DATA TO 31/12/2014 © copyright ANZLTR Data to 31.12.2014
CL
ICK
HE
RE
to
go
to
p
ag
eC
on
ten
ts
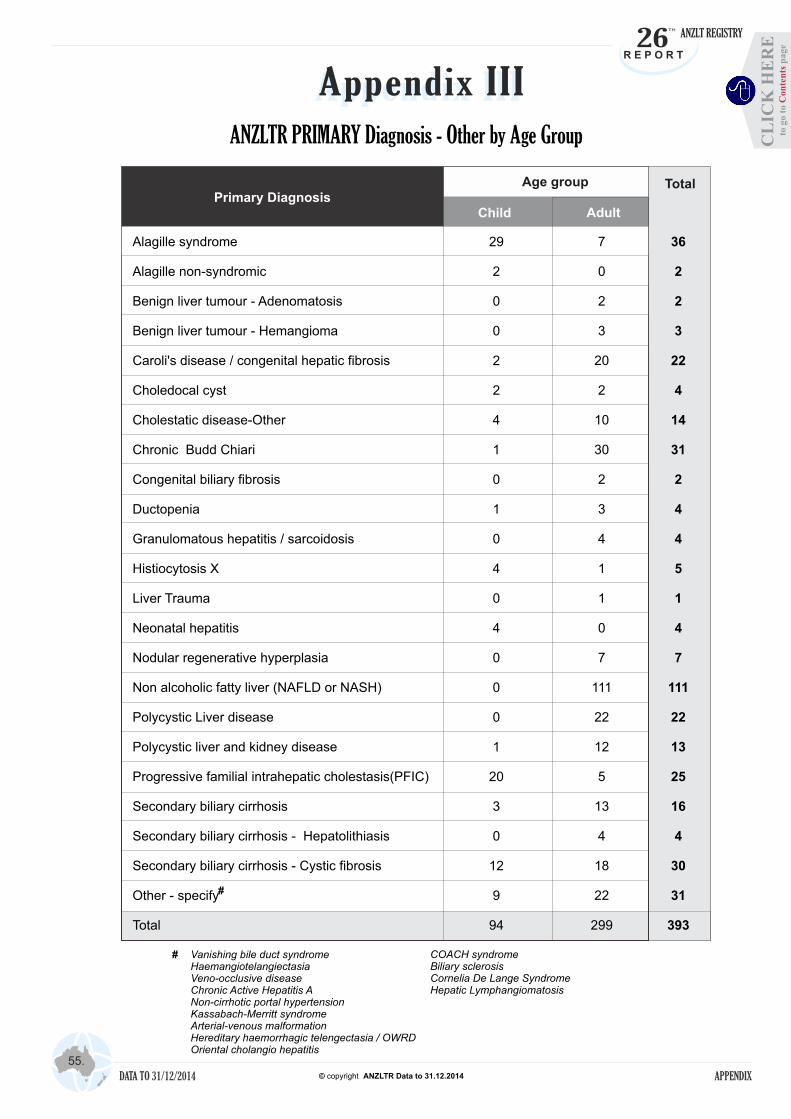
Appendix IIIAppendix III
APPENDIX
55.
ANZLTR PRIMARY Diagnosis - Other by Age Group
COACH syndromeBiliary sclerosisCornelia De Lange SyndromeHepatic Lymphangiomatosis
Alagille syndrome
Alagille non-syndromic
Benign liver tumour - Adenomatosis
Benign liver tumour - Hemangioma
Caroli's disease / congenital hepatic fibrosis
Choledocal cyst
Cholestatic disease-Other
Chronic Budd Chiari
Congenital biliary fibrosis
Ductopenia
Granulomatous hepatitis / sarcoidosis
Histiocytosis X
Liver Trauma
Neonatal hepatitis
Nodular regenerative hyperplasia
Non alcoholic fatty liver (NAFLD or NASH)
Polycystic Liver disease
Polycystic liver and kidney disease
Progressive familial intrahepatic cholestasis(PFIC)
Secondary biliary cirrhosis
Secondary biliary cirrhosis - Hepatolithiasis
Secondary biliary cirrhosis - Cystic fibrosis
Other - specify
Total
29
2
0
0
2
2
4
1
0
1
0
4
0
4
0
0
0
1
20
3
0
12
9
94
7
0
2
3
20
2
10
30
2
3
4
1
1
0
7
111
22
12
5
13
4
18
22
299
36
2
2
3
22
4
14
31
2
4
4
5
1
4
7
111
22
13
25
16
4
30
31
393
Primary DiagnosisAge group
#
Child Adult
Total
# Vanishing bile duct syndrome Haemangiotelangiectasia Veno-occlusive disease Chronic Active Hepatitis A Non-cirrhotic portal hypertension Kassabach-Merritt syndrome Arterial-venous malformation Hereditary haemorrhagic telengectasia / OWRD Oriental cholangio hepatitis
26TH
ANZLT REGISTRY
R E P O R T
DATA TO 31/12/2014 © copyright ANZLTR Data to 31.12.2014
CL
ICK
HE
RE
to
go
to
p
ag
eC
on
ten
ts

Appendix IVAppendix IV
APPENDIX
56.
ANZLTR PRIMARY Diagnosis Fulminant Hepatic Failure by Age Group
Acute - Budd Chiari
Acute - Wilson's
Acute - -1 -AAT
Acute Autoimmune hepatitis
Acute Unknown / unspecified
Acute - Paracetamol
Acute - Other drugs
Acute Herbs / mushrooms
Acute - Hepatitis A
Acute - Hepatitis B
Acute - Non A-G
Acute - Hepatitis E
Acute - Post liver resection/trauma
Subacute - Budd Chiari
Subacute - Wilson's
Subacute Autoimmune hepatitis
Subacute - Drug / Herbs
Subacute - Unknown / unspecified
Subacute - Hepatitis A
Subacute - Hepatitis B
Subacute - Non A-G
Total
0
8
2
0
44
4
3
1
1
0
13
0
1
1
2
1
1
5
0
0
0
87
2
16
0
6
94
15
25
8
3
60
20
1
3
2
4
17
15
30
2
19
4
346
2
24
2
6
138
19
28
9
4
60
33
1
4
3
6
18
16
35
2
19
4
433
Primary Diagnosis
Children Adult
TotalAge group
26TH
ANZLT REGISTRY
R E P O R T
DATA TO 31/12/2014 © copyright ANZLTR Data to 31.12.2014
CL
ICK
HE
RE
to
go
to
p
ag
eC
on
ten
ts
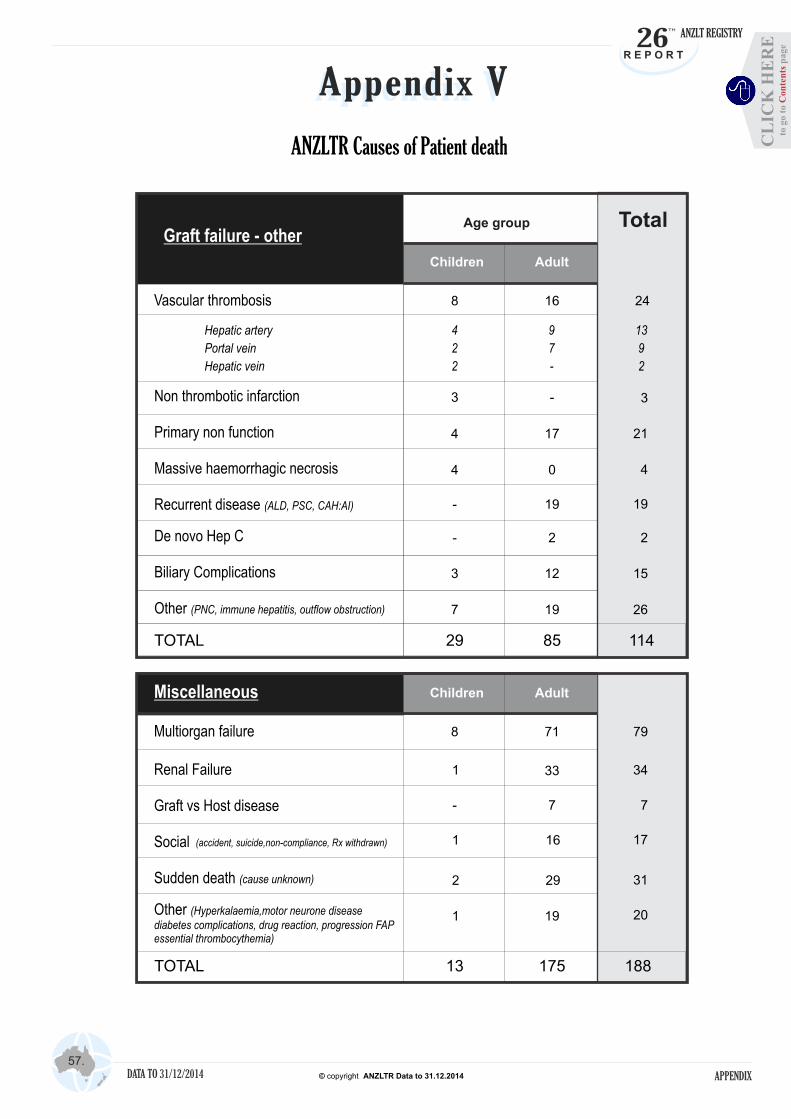
Appendix VAppendix V
APPENDIX
57.
ANZLTR Causes of Patient death
Non thrombotic infarction
Primary non function
Massive haemorrhagic necrosis
Recurrent disease (ALD, PSC, CAH:AI)
De novo Hep C
Biliary Complications
Other (PNC, immune hepatitis, outflow obstruction)
8
16
24
Graft failure - other
Children Adult
TotalAge group
Hepatic artery
Portal vein
Hepatic vein
Vascular thrombosis
4
2
2
9
7
-
13
9
2
19
Renal Failure
Graft vs Host disease
Social
Sudden death (cause unknown)
Other (Hyperkalaemia,motor neurone disease diabetes complications, drug reaction, progression FAPessential thrombocythemia)
8
71
79
Miscellaneous Children Adult
Multiorgan failure
(accident, suicide,non-compliance, Rx withdrawn)
1 33
34
-
7
7
1
16
17
2
29
31
1
19
20
-
2
3
12
7
19
2
15
26
29
85
114
TOTAL
13
175
188
TOTAL
-
17
0
19
3
4
4
-
3
21
4
26TH
ANZLT REGISTRY
R E P O R T
DATA TO 31/12/2014 © copyright ANZLTR Data to 31.12.2014
CL
ICK
HE
RE
to
go
to
p
ag
eC
on
ten
ts