antitrust analysis for the internet upstream...
TRANSCRIPT
ANTITRUST ANALYSIS FOR THE INTERNET
UPSTREAM MARKET: A BORDER GATEWAY
PROTOCOL APPROACH
Alessio D’Ignazio� & Emanuele Giovannetti ��
ABSTRACT
We study concentration in the European Internet upstream access market. The
possibility of measuring market concentration depends on a correct definition
of the market itself; however, this is not always possible, because very often
in the Internet industry antitrust authorities lack reliable pricing and traffic
data. We present an alternative approach based on the inference of the
Internet operators’ interconnection policies using micro-data from their
Border Gateway Protocol (BGP) tables. We assess market concentration follow-
ing a two-step process: first, we propose a price-independent algorithm for
defining both the vertical and geographical relevant market boundaries; then
we calculate market concentration indexes using two novel metrics. These
assess, for each undertaking, its role both in terms of essential network facility
and of wholesale market dominance. The results, applied to four leading
Internet exchange points in London, Amsterdam, Frankfurt, and Milan,
show that some vertical segments of these markets are highly concentrated,
while others are extremely competitive. According to the Merger Guidelines,
some of the estimated market concentration values would immediately fall
within the special attention category.
I. INTRODUCTION
Market power is usually associated with the ability of a firm to raise
prices above marginal costs, or above their competitive level, without loss
of profits. Competition authorities are interested in market power because
� Faculty of Economics, University of Cambridge. E-mail: [email protected].�� Faculty of Economics, University of Cambridge, School of Economics, University of Cape
Town and Department of Public Economics, University of Rome “La Sapienza.” E-mail:
[email protected]. We would like to thank Joerge Lepler, Tim Griffin, Randy
Bush, John Souter (LINX), Chris Fletcher (LINX), Valeria Rossi (MIX) and the partici-
pants at the 7th Euro-IX Forum in Prague, September 2005, and an anonymous Referee
for their help, useful comments and data. The usual disclaimer applies. The authors
would also like to acknowledge EU financing through the 6th Framework Project IST-
2004-2012 and from the Isaac Newton Trust, Trinity College, University of Cambridge.
Alessio D0Ignazio would also like to acknowledge the Bank of Italy’s “Bonaldo Stringher”
Scholarship.
Journal of Competition Law and Economics, 1–27doi:10.1093/joclec/nhl003
# The Author (2006). Published by Oxford University Press. All rights reserved.
For Permissions, please email: [email protected]
of its potential effect in reducing welfare, at least from a static point of
view.1
In this paper we attempt to measure the extent of market power character-
izing the Internet upstream access in Europe. The structure of the Internet is
indeed highly hierarchical, with a relatively small number of upstream provi-
ders (the Internet backbones, IBPs) that face the interconnection demand
arising from amuch larger number of downstream operators of smaller dimen-
sions (Internet service providers, ISPs). Our attempt is also related to the
ongoing debate on the possibility of introducing some form of regulation in
the Internet upstream access market, whose mechanisms are blamed in
many countries for the persistence of the digital divide.2
It is clear that the possibility of correctly measuring market power depends
on a correct definition of the market itself; however, this is not always possible,
since very often the antitrust authorities lack reliable data. This is indeed
what seems to happen for proposed mergers between Internet backbones.
After the early antitrust cases (1998, MCI and WorldCom merger; 2000,
MCI-WorldCom and Sprint), new guidelines were introduced in July 2002.
Their applicability is, however, still very problematic for the assessment of
the Internet upstream connectivity market, where both interconnection agree-
ments and traffic flows are sealed under confidentiality agreements.
This difficulty is the motivation for our paper. We present an alternative
approach to define the relevant market and assess market concentration in
upstream Internet access using publicly available data.3 In particular, our
analysis is based on the inference of interconnection policies, expressing
the real bargaining power of each ISP: These can be essentially grouped
into (1) paid transit, a contractual relation characterized by nonlinear
pricing, a typical discrimination practice, and (2) peering, a bilateral free
interconnection decision based on a reciprocal agreement, again an open
form of discrimination formally expressed in the peering policy of every pro-
vider. The inference is obtained from the Border Gateway Protocol (BGP)
output data (the BGP is a set of instructions that rules the transmission of
traffic packets over the Internet). We use two different metrics as proxies
for each ISP’s traffic flows: One of these measures infers the number of
the ISP’s downstream customers, and the other its centrality or degree of
unavoidability.
1 However its impact on the dynamic and productive efficiency is controversial, because of the role
of market power as an incentive to innovate.2 For a review of this debate see Emanuele Giovannetti and Cristiano Andrea Ristuccia,
“Estimating Market Power in the Internet backbone using the I.P. transit Band-X database,”
29 Telecommunications Policy 269 (2005).3 Many traditional markets are characterized by the fact that, while market shares and character-
istics of the firms involved in an antitrust investigation can be obtained, their potential rivals’ data
is normally concealed and hard to reach. We show that, when dealing with the Internet, there are
ways to overcome these difficulties that may not exist for traditional markets.
Page 2 of 27 Journal of Competition Law and Economics
We assess market concentration in the European upstream Internet market
following a two-step process: firstly we determine the relevant market applying
the vertical and geographical relevant market definition algorithms and criteria;
then we calculate market concentration indexes, for the Internet upstream
routing taking place in Europe, via four leading Internet exchange points
(IXPs):4 the London Internet Exchange Point (LINX), the Deutsche
Commercial Internet Exchange Point (DECIX), the Amsterdam Internet
Exchange Point (AMSIX) and the Milan Internet Exchange Point (MIX).
Interestingly, our measures prove to be very close to that calculated with
actual traffic data,5 indicating a potential application of this approach to the
antitrust and regulation authorities guidelines. The results show that some
vertical segments of these markets are highly concentrated, while others
are extremely competitive. According to the Merger Guidelines,6 some of
the estimated market concentration values would immediately fall within the
special attention category.
The rest of the paper is organized as follows: Section II describes some of
the early antitrust inquiries for the Internet backbone in the EU and the
U.S. Section III discusses the new regulatory framework for the market of elec-
tronic communication issued in 2002 by the Commission and Section IV
revises some early related studies. Section V describes more recent studies
on which we base our classification algorithms, while Section VI provides
the actual classification, discusses how to use these algorithms to evaluate
market concentration across the European IXPs, and suggests how to define
the relevant vertical market boundaries. Section VII applies the vertical and
geographical relevant market definition to calculate market concentration in
various European Internet upstream markets. Finally Section VIII concludes
the paper.
II. EARLY ANTITRUST ANALYSIS FOR THE BACKBONE MARKET
The Internet backbone market witnessed an extremely rapid transformation in
the last ten years, also because of a large wave of mergers and acquisitions.
This process led to growing concerns relating to possible abuse of market
power, one expression of which has been identified in the different inter-
connection charges levied to small and larger providers, a process started in
1997 by UUNET’s decision of setting minimum traffic requirements for free
peering with smaller ISP’s. An early analysis was provided by Cave (1999),
4 IXPs are independent organizations composed by Internet service providers, where they can
route their traffic in a cost-effective and technically efficient way.5 These data were obtained for research purposes from the London Internet exchange point under
confidentiality and a non-disclosure agreement.6 U.S. Department of Justice, “The Horizontal Merger Guideline,” issued 2 April 1992 and
revised 8 April 1997; originally issued as part of U.S. Department of Justice Merger
Guidelines, 14 June 1984.
Antitrust Analysis for the Internet Upstream Market Page 3 of 27
who analysed the possible problems and/or desirability of having some degree
of market power and a hierarchical structure in the Internet backbone.7
The two most relevant antitrust cases discussed in the industry have been
the merger between MCI and WorldCom in 1998 and the rejected proposed
merger betweenMCI-WorldCom and Sprint in 2000. In both cases the identi-
fication of the relevant market posed difficult but interesting questions due to
the lack of reliable data.
During the 1998 MCI WorldCom merger analysis the European
Commission8 included in the backbone market all the providers that were
able to obtain global connectivity through either private or public peering,
needing no transit contracts. This definition was subsequently modified:
Only the providers reaching global connectivity exclusively via private
peering were included in the backbone market.9
The three relevant markets affected by the proposed merger were ident-
ified as being: (1) the provision of host to point of presence connectivity, (2)
the provision of Internet access services, and (3) the provision of top-level or
universal connectivity. The investigation concentrated in this last product
market. One of the main issues at stake, and a major source of disagree-
ment between the Commission and the two defendant companies, con-
cerned the hierarchical nature of the Internet. The Commission stressed
that a hierarchical structure was clearly exposed by the evidence that top-
level providers achieve their connectivity entirely by settlement-free
peering mainly at private peering points, whereas smaller providers need
to purchase transit from top-tier networks to achieve global connectivity.10
7 Martin Cave, “Interconnection and the Internet: Competition and Regulation Issues at Local
Access and Backbone Levels,” OECD, Working Party on Telecommunication and Information
Services (1999). For a more recent analysis see Nicholas Economides, “The Economics of the
Internet Backbone,” in S. Majumdar, I. Vogelsang and M. Cave (eds), Handbook of
Telecommunications Economics, Volume 2. Amsterdam, North Holland, 2006.8 On 11 January 2000, the European Commission received a notification that MCI-WorldCom
would merge with Sprint by an exchange of shares. After an extensive investigation into the
merger proposal, on 28 June 2000 the Commission adopted the decision that “The notified
concentration consisting of the merger betweenMCI-WorldCom and Sprint is declared incom-
patible with the common market and the functioning of the EEA Agreement.” See Official
Journal Of the European Commission (2000), Regulation (EEC) N 4046/89, Merger
Procedure, Bruxelles, European Commission, DGXIII.9 Paolo Buccirossi, Laura Ferrari Bravo, and Paolo Siciliani, “Competition in the Internet
Backbone Market,” 28(2) World Competition 235 (2005).10 The dominant position of WorldCom had been attained through a very active acquisition
policy. In the Civil Action brought by Department of Justice of the United States against the
acquisition of Intermedia Communications by WorldCom are described some of the more
than 60 acquisitions operated by this company: In 1995 WorldCom acquired the network
service operations of Williams Telecommunications; in 1996, through the acquisition of
MFS Communications Company, WorldCom obtained the control of UUNET, the world’s
largest Internet backbone provider. In 1998 WorldCom acquired Compuserve a leading
Internet provider and ANS, AOL’s primary Internet backbone network. Other acquired back-
bones were GridNet, Unicom-Pipex, InNet, NL Net and Metrix Interlink. As a result of the
Page 4 of 27 Journal of Competition Law and Economics
The Commission defined the relevant market as that composed of the
providers equipped with a set of peering agreements with 100 percent settle-
ment-free connectivity across the Internet and found that only five top-level
networks (MCI WorldCom, Sprint, AT&T, Cable & Wireless and GTE)
satisfied these criteria. Consequently the antitrust authorities defined the
market participants as those who peer both with MCI and Sprint and, by
adding networks accessible directly rather than through a third party, a
total of seventeen players were considered for the analysis of the market
for top-level Internet connectivity. Any other Internet provider left outside
this market definition would have to purchase transit from at least one of
the top five providers to achieve global connectivity.
The proposed new merged entity would have had a market share between
37 and 51% in terms of traffic flows, against the next competitor’s share no
larger than 15%. The Commission concluded that the proposed merger
would have led to the emergence of a top-level network provider, able to act
almost independently of its competitors and customers and to determine its
own, and its competitors’, prices and the technical developments in the indus-
try. Another relevant issue, decisive in appraising the competitive effects of the
merger, was its effects on potential entry to the industry. Since the peering
rules require an entrant to be of considerable size, the Commission found
that the merger would have generated a formidable barrier for potential
entrants in the top tier backbone market.
Following these considerations, in July 2000, the proposed merger between
MCI-WorldCom and Sprint was abandoned after the block imposed not only
in the EU but also by the U.S. Department of Justice (DoJ). The Federal
Trade Commission considers Market concentration as the fundamental
parameter when assessing the competitive impact of a proposed merger.
Indeed, following the U.S. Horizontal Merger Guidelines, “A merger is
unlikely to create or enhance market power or to facilitate its exercise unless
it significantly increases concentration and results in a concentrated market,
properly defined and measured. Mergers that either do not significantly
increase concentration or do not result in a concentrated market ordinarily
require no further analysis.”11 The results of the DoJ merger analysis
found that:
leadership position reached in these years, the WorldCom acquisition of MCI in September
1998 has been accompanied by the imposition, by the U.S. Department of Justice and the
EU Commission, that MCI divest its Internet assets to Cable & Wireless. See U.S.
Department of Justice, Civil Action no. 00-CV-2789 against WorldCom and Intermedia,
www.usdoj.gov/atr/cases/f7000/7042.pdf, 2000.11 In detail, the FTC uses the Hirschman–Herfindahl Index (HHI) of market concentration. The
HHI is calculated by summing the squares of the individual market shares of all the participants
andmultiplying by ten thousand. The guidelines focus on two figures: pre-merger HHI concen-
tration index level, and post-merger HHI concentration increments. When the post-merger
Antitrust Analysis for the Internet Upstream Market Page 5 of 27
The proposed merger of WorldCom and Sprint will cause significant harm to competition
in many of the nation’s most important telecommunications markets. By combining two of
the largest telecommunications firms in these markets, the proposed acquisition would
substantially lessen competition in violation of Section 7 of the Clayton Act . . . For
millions of residential and business consumers throughout the nation, the merger will
lead to higher prices, lower service quality, and less innovation than would be the case
absent its consummation. The United States therefore seeks an order permanently
enjoining the merger.
This motivation was based on the role of backbone market concentration as
expressed by the HHI, calculated on the traffic shares, which was approxi-
mately 1850 before the merger, and would have risen by approximately
1150 points to ca. 3000.12
III. NEW REGULATORY FRAMEWORK AND THE COMMISSION’S
GUIDELINES
The regulatory interest in the backbone market remained high and, after a
public consultation on the Review of the Electronic Communications
Sector, the Commission proposed in July 2000 a package of measures introdu-
cing a new regulatory framework for electronic communication networks and
services. This was intended to provide a lighter regulatory touch where
markets have become more competitive while supporting sustainable and
affordable prices and protecting basic consumer rights.13 The application of
the Regulatory framework was then essentially described, with its relevant
operational aspects, in the “Guidelines on market analysis and assessment of
significant market power under the Community regulatory framework for
electronic communications networks and services” published on 11 July 2002.
The Commission’s guidelines focus only on issues related to (i) market defi-
nition and (ii) the assessment of significant market power (SMP) within the
meaning of Article 14 of the framework Directive, that specified SMP when
a firm “enjoys a position of economic strength affording it the power to
behave to an appreciable extent independently of its competitors, customers
and ultimately consumers.”
HHI is below 1000, the guidelines consider the market as being non-concentrated, and no
further analysis is required. When the post-merger HHI ranges between 1000 and 1800 the
guidelines consider these markets as moderately concentrated. In this case further scrutiny is
required only if the merger would increase the HHI by more than 100 points. Finally, when
post-merger HHI is above 1800, the markets are considered highly concentrated. In this case
an increase in the HHI of more than 50 points will start raising concern, while an increase of
more than 100 points is considered as potentially dangerous due to the increase in market
power it entails.12 See U.S. Department of Justice Civil Action no. 01-CV-04080 against WorldCom and Sprint,
www.usdoj.gov/atr/cases/f5000/5051.pdf, 2000.13 The final test was published on 4 of February 2002 (seeOfficial Journal 2002 (http://europa.eu.int/
information_society/topics/telecoms/regulatory/new_rf/documents/03672en1.pdf).
Page 6 of 27 Journal of Competition Law and Economics

A. Market Definition: Assessing Vertical Market Boundaries
The concept of relevant market is a key issue for antitrust analysis, since it is
central to the assessment of market power. Indeed, Article 81 in the Treaty
of Rome states that the limitation of competition is to be assessed on the
relevant market, while Article 82 defines market dominance in relation to
market shares, and the merger control is based on the dominant position in
relation to market shares.
Among different market definitions, two have received most attention from
the literature. One approach focussed on the economic markets, the market for
goods resembling each other where the law of one price was supposed to
operate. However Werden and Froeb (1994) and Scheffman and Spiller
(1987) argued that this concept of economic market was inadequate for anti-
trust analysis.14 The aim of the second approach was to define the relevant
market as instrumental to its applications in the antitrust analysis. The
leading definition of a relevant market, adopted by the European
Commission, hence, is based on the characteristics of substitutability among
products, expressed by the cross-price elasticities: The relevant market is the
set of products and geographic regions which in some way constrain the
pricing behaviour of the firms providing the product under scrutiny; this
means that the relevant market is the set of commodities which are, in
respect to consumers’ preferences, good substitutes for each other, so that a
price change in one of them will provoke a demand change in the other.
Whenever assessing whether or not a given set of products or services in a
given geographical area constitutes a relevant market, for competition policy
purposes, one has to assess the existence, and strength, of competitive
constraints on the price-setting behaviour of the producers of this set of com-
modities. A relevant market is then composed of the set including all of the
commodities for which, if taken as a whole, the excluded ones do not have
competitive effects. These competitive constraints can either arise from the
demand-side of the market through demand substitution of the commodities
under analysis or from the supply-side substitution, either through existing
or potential competitors.15 Supply-side substitutability indicates whether
suppliers other than those offering the commodity in question start offering
the relevant commodities themselves, or whether they react to the initial
price increase by changing the price of their related commodities.
The usual, empirical way of assessing demand and supply-side substitution
is to apply the hypothetical monopolist test. This test asks what would happen if
14 G.J. Werden and L.M. Froeb, “The Effects of Mergers in Differentiated Products Industries:
Logit Demand and Merger” (1994); David T. Scheffman and Pablo T. Spiller, “Geographic
Market Definition under the U.S. Department of Justice Merger Guidelines,” 30(1) Journal
of Law & Economics, 123 (1987).15 Clearly substitution of a potential competitor will take longer than that of an existing
competitors.
Antitrust Analysis for the Internet Upstream Market Page 7 of 27
there were a small but significant, lasting increase in the price of a given
product or service, assuming that the prices of all other products or services
remained constant. This test is also known as SSNIP (small but significant
non-transitory increase in price) and its importance lies primarily in its use
as a conceptual tool for assessing evidence of competition, based on substitut-
ability, between different products or services.
The nature of the SSNIP test is recursive. It starts by considering an initial
set of products that are thought to define the market and simulates an increase
in their price; in practice, the Commission’s guidelines suggest that the
National Regulatory Authorities should normally consider reactions to a
permanent price increase of between 5 and 10 percent. Suppose that the
price increase is unprofitable, since consumers are substituting other products
for the one whose price has increased: In this case the test has to be re-run,
with reference to the set of commodities composed of the initial one and all
the other commodities found to be relevant substitutes in its previous rounds.
The SSNIP test should be repeated considering an increasing set of pro-
ducts up to the point where a relative price increase within the geographic
and product markets defined will not lead consumers to switch to readily
available substitutes or to suppliers located in other areas.
However, the SSNIP approach has some limitations. In particular, one of
the identified problems is that the test outcome depends on the initial price
level considered. Indeed, apart from the special case of a constant price elas-
ticity demand function, the size of the demand reaction to a price increase will
necessarily depend on the existing price level. If this starting price level is
already at the monopoly level (the optimal price in terms of profit maximi-
zation), then any further price increase will lead to a profit loss. In these
circumstances, where a firm has already exercised market power, a situation
known as the “cellophane fallacy,” the SSNIP test would lead to a larger
market extension than in the case where initial prices were set at a
competitive level.
One further problem in applying the SSNIP test arises when there are
forms of discrimination, which generates separate markets for the same
commodity, depending on the customer’s characteristics. Discrimination
is, however, an essential feature characterizing Internet interdomain
routing, our object of study. Indeed, as we argued before, interconnection
agreements usually take the form of transit or peering. While transit is a con-
tractual relation rife with discrimination practices, starting from its typical
non-linear pricing structure, peering is a bilateral interconnection decision
based exclusively on discrimination and formally expressed in the peering
policy of every provider.
Finally another major limitation lies in the data unavailability to perform the
SSNIP test. Again, this is particularly true in the upstream Internet routing,
and is further motivation in the construction of price-independent market
structure indicators.
Page 8 of 27 Journal of Competition Law and Economics
B. Supplying Universal Connectivity
Final users express a demand for Internet Connectivity, and the ISPs’s role is
to supply it. This implies generating both incoming traffic, by demanding con-
tents stored at a given off-net location, and outgoing traffic exporting contents
stored in its own routes. To supply this service, ISPs will need to be able to
cover the total set of IP addresses. Universal connectivity is indeed the ISPs’
production output. The inputs required to produce this output will be
three-fold: (1) ISP’s own routes, and off-net routes accessed; (2) peering
agreements; and (3) transit agreements via an upstream provider. In this
setting the problem of market definition should be assessed in terms of
demand elasticities for the input factor, i.e., the traditional role played by
consumer’s preferences and their cross-elasticities of substitution is now
played by ISPs and their input demand function cross-elasticities.
In this setting, a change in relative input prices, for example a reduction in
transit prices, will modify the initial input demand to a different ratio between
transit and peering.16 However, this traditional microeconomic approach is
now inapplicable since the technological decision is constrained by the
number, and identity, of willingly peering partners. This implies that, while
a small but significant non- transitory increase in price for transit might induce
an ISP to substitute some of its existing transit routes with new peering
ones, this switch may be constrained by the unwillingness of the other ISPs
to peer with it. These difficulties led us to introduce a market segmentation
algorithm (developed in Section V), based on a classification of ISPs that
reflects the existence of bilateral peering refusals.
C. Market Definition: Assessing Geographic Market Boundaries
Traditionally, the process of defining the boundaries of the geographic market
proceeds along the same lines as those discussed above in relation to the assess-
ment of the demand and supply-side substitution in response to a relative price
increase. In the electronic communications sector, the European Commission
guidelines indicate two main criteria to determine the geographical scope of
the relevant market: (a) the area covered by a network; and (b) the existence
of legal and other regulatory instruments. On the basis of these criteria,
geographic markets can be considered to be local, regional, national, or cover-
ing territories of two or more countries. For the specific Internet upstream
market access in particular, linguistic differences should play a minor role in
segmenting the geography of Interconnection. The European Commission
16 In economics, it is usually assumed that the exact combination of inputs, in our case peering
and transit agreements, is derived by a cost-minimizing choice conditional on a given level of
output. This depends, of course, upon the functional form of the production function describ-
ing the technology, which uses these inputs (transit and peering agreements) to produce the ISP
output: universal connectivity.
Antitrust Analysis for the Internet Upstream Market Page 9 of 27

guidelines also state that the relevant geographic market comprises an area in
which the undertakings concerned are involved in the supply of and demand
for the relevant products or services, and the conditions of competition are
similar or sufficiently homogeneous; moreover the area must be distinguished
from neighbouring areas in which the prevailing conditions of competition are
appreciably different.
Once again, the application of these criteria to the Internet upstreammarket
seems at least problematic. Hence, in this paper we follow a different approach
to define the geographical borders of the Internet upstream market. We first
start by looking at the features characterizing the European IXPs in terms of
the distribution of their members within the different hierarchies of the
Internet. Universal connectivity in the Internet is achieved through the inter-
connection between all the hierarchies in the Internet, from the very bottom
(end users and internet access providers, or IAP) to the very top (tier-1 provi-
ders), through the middle hierarchies. An ISP in the middle of the Internet
hierarchy needs to be connected to at least one tier-1 to provide universal con-
nectivity. Hence, two different IXPs will not be considered as geographically
separate markets if one IXP is characterized, for example, by the presence of
tier-1 providers while the other IXP does not have tier-1 among its
members. Indeed, in this case the two IXPs could complement each other,
and therefore the market is not geographically separated. In particular, we
will consider as independent locations the area having an IXP, which can
provide universal connectivity through the presence of at least one tier-1
member. In conclusion, contrary to the guideline suggestions, similarity in
competition implies duplication of access modalities at different locations,
indicating therefore geographically separated markets, while structural differ-
ences amongst IXPs will indicate, through access complementarities, a single
geographical market.
D. Significant Market Power
Once the market definition problem has been addressed, the next step is to
assess the existence of significant market power. According to Article 14 of
the framework Directive,17 an ISP is “deemed to have significant market
power if, either individually or jointly with others, it enjoys a position equival-
ent to dominance, that is to say a position of economic strength affording it
the power to behave to an appreciable extent independently of competitors
customers and ultimately consumers.”
Often, the lack of evidence or of records of past behaviour or conduct will
mean that the market analysis will have to be based mainly on a prospective
assessment. In these cases, a dominant position is found by reference to a
17 This is the definition that the Court of Justice case-law ascribes to the concept of dominant
position in Article 82 of the Treaty of Rome.
Page 10 of 27 Journal of Competition Law and Economics
number of criteria and its assessment is usually based on existing market
conditions; in particular, market shares are often used as a proxy for market
power. Although a high market share alone is not sufficient to establish the
possession of significant market power (dominance), it is unlikely that a firm
without a significant share of the relevant market would be in a dominant pos-
ition. Thus, the guidelines stress that firms with market shares of no more than
25 percent are not likely to enjoy a (single) dominant position on the market
concerned. In the Commission’s decision-making practice, single dominance
concerns normally arise in the case of firms with market shares of over 40
percent, although the Commission may, in some cases, have concerns about
dominance with lower market shares.18 Concerning the methods used for
measuring market size and market shares, the Commission’s guidelines state
that both volume sales and value sales provide useful information for market
measurement.19 These data are, however, usually unavailable for the upstream
Internet connectivity market.
IV. EXPLORING THE BACKBONE THROUGH CYBER-GEOGRAPHY:
EARLY STUDIES
In the analysis of the Internet upstream routing, understanding its boundaries,
traffic flows, prices, market shares and revenues is particularly challenging,
both because of the lack of satisfactory statistical data and because of the
elusiveness, owing to the non-dedicated connection modes of the Internet
protocols, of the traffic exchanged among operators.
However, the public nature of the Internet and the routing protocols on
which it is based often allow the analysis of the paths followed by information
packets from origin to destination through the Internet. An entire branch of
research, cybergeography, is devoted to the mapping of this physical-virtual
world. The Cooperative Association for Internet Data Analysis (CAIDA) con-
structed a global Internet topology focussing on measuring the performance of
specific paths through the Internet. Claffy et al. (1999), using samples covering
20,588 end destinations, determined the frequency with which an individual
backbone provider (identified by an autonomous system number, AS)
appeared in a path and the relative depth of those appearances, both
in terms of number of backbones and the number of hops crossed from
the source.20 In their findings, CerfNet/AT&T, Cable & Wireless (which
purchased Internet MCI’s backbone in 1998), Sprint, and UUNET played
18 According to established case-law, very large market shares—in excess of 50 percent—are in
themselves evidence of the existence of a dominant position.19 In particular, in the case of bulk products, preference is given to volume, whereas in the case of
differentiated products (i.e. branded products), sales in value and their associated market share
will often be considered to reflect better the relative position and strength of each provider.20 Kimberly Claffy, Tracie, E. Monk, and Daniel McRobb, “Internet Tomography,” Nature,
7 January 1999.
Antitrust Analysis for the Internet Upstream Market Page 11 of 27
a major role in transporting packets across the Internet. Cossa (2000)
considered a dataset from Boardwatch magazine Internet Service Providers
Directory, 1999 edition, showing the breakdown of 8950 backbone
connections from 5078 Internet service providers per major backbone.21
With these data she evaluated the impact of the MCI WorlCom–Sprint
merger in terms of market concentration. Cossa also calculated the HHI
based on the number of upstream backbone connections and showed that
the pre-merger HHI increased from 1450 to 2090 as a result of a merger
between the two companies. In the next sections we describe more recent
algorithms and concepts, and use them to construct market concentration
indicators for the European Internet upstream routing market.
V. RECENT STUDIES ON HOW TO INFER THE ECONOMIC
RELATIONSHIP BETWEEN TWO ISPs
A growing body of literature in the networking community works on defining
the economic position of an ISP by evaluating the types of relationships it has
with other ISPs. Since the business part of this relationship is decided at a
bilateral level and kept private, one has to infer the type of relationship from
the network connectivity structure resulting from the available data on inter-
ISP interconnections or upstream routing. In this section we briefly describe
datasets and algorithms used to explore this inter-ISPs connectivity structures,
which we will then utilize to assess market concentration.
A. Actual Internet Routing
The main part of the actual Internet traffic exchanges (routing) happens at IP
routers. These have a table, whose role is to match an IP address contained in
the header of a data packet to the link leaving the router in the right direction.
Through these tables each autonomous system, or AS (ASs are Internet oper-
ators consisting of either a single network or a group of networks controlled by
a common network administrator), announces, via the BGP, to a neighbouring
AS a list of paths made of more AS nodes, leading to a final destination AS.
The implementation of the routing policy determines which BGP information
in an ISP is generated and passed on, to which of the connected neighbours,
and which path is presented.
The interplay of all the ASs individual routing policies results in the global
connectivity map for data transmissions across the Internet. This paper is
motivated by the belief that no reliable empirical alternative exists to this micro-
routing analysis for the study of the upstream Internet market structure, and for
its antitrust analysis.
21 Beatrice Cossa, “Economic and policy analysis of mergers among Internet backbone providers”
(MSc Thesis, MIT, http://itel.mit.edu/itel/publications.html, 2000).
Page 12 of 27 Journal of Competition Law and Economics
B. Business Relationships
There are three22 basic types of business relationships that shape ISPs
upstream routing policies: customer–provider, provider–customer and peer–
peer. It is widely assumed in the current literature that these three types of
business relationships sufficiently capture various contracts and agreements
arising in the Internet. Although this is an oversimplification, the basic
business relationships provide a relatively close approximation in practice.
These basic types of business relationships are explained as follows.
In customer–provider/provider–customer relationships, both parties assume
asymmetric roles; the provider sells the reachability of IP addresses and the
ability to transit all traffic to any destination, while the customer pays for
this connectivity.
In peer–peer, both parties usually exchange traffic with their customers
only—routes to their providers and other peers are not revealed to each
other. This is because peer–peer connectivity is usually not paid, and there
is no incentive to share one’s other paid connectivity.
C. Type of Relationship Inference from BGP Graphs
In this paper we suggest that the most useful way to learn about the economic
type of relationship between two ASs is by examining the BGP dataset. Some
ASs publish their BGP path tables, and from this collection of paths it is pos-
sible to derive a network graph of the Internet that describes the connectivity at
the AS level. In the analysis of the BGP path tables, one central assumption,
first formulated by Gao,23 is made to infer relationship types. This assumption
states that all paths are free of relationship valleys. Intuitively speaking, one can
imagine a particular path to describe the trail of ISPs that an IP data packet has
to traverse to reach its destination network. This path of ASs will start at an
ISP who is a customer of the next upstream provider of IP connectivity, who
in turn is a customer of the next provider. Following this chain of customers,
at some point we will reach the peak in the hierarchy of ASs that participate in
this path, and from there on we expect the IP data packet to descend a chain of
provider-to-customer relationships between ISPs until it reaches the ultimate
destination. The important observation in this description is that in any path
there is only one consecutive chain of upstream and one consecutive chain of
downstream ISPs present. Figuratively speaking, we assume that there are no
valleys in these hills of upstream/downstream chains. Figure 1 shows a set of
valid paths and an invalid valley.
22 The computer science literature also considers a fourth type of relation, among siblings,
where both ASs belong to the same ISP. The ISP partitions its network to ease the technical
management by hiding internal information for each AS.23 Lixin Gao, “On Inferring Autonomous SystemRelationships in the Internet,” 9(6) IEEE/ACM
Trans. Netw. 681 (2001).
Antitrust Analysis for the Internet Upstream Market Page 13 of 27
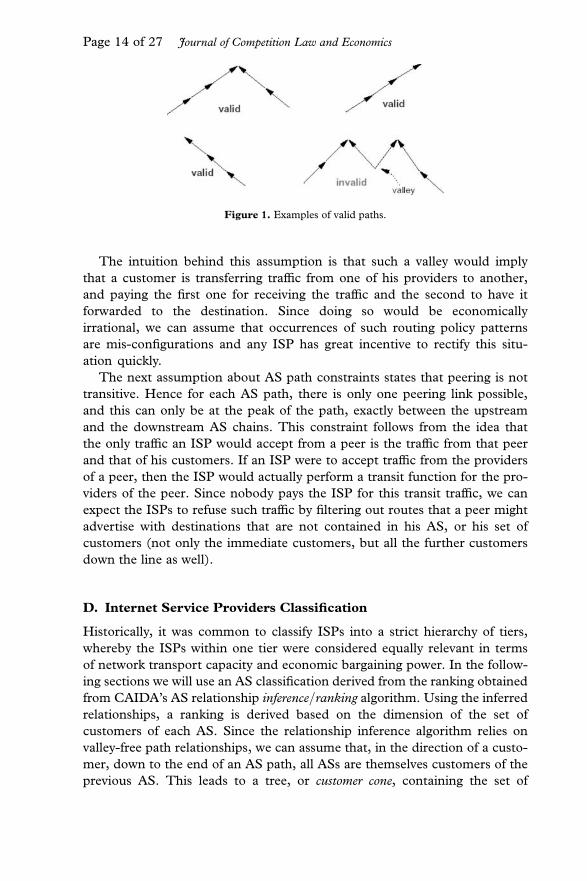
The intuition behind this assumption is that such a valley would imply
that a customer is transferring traffic from one of his providers to another,
and paying the first one for receiving the traffic and the second to have it
forwarded to the destination. Since doing so would be economically
irrational, we can assume that occurrences of such routing policy patterns
are mis-configurations and any ISP has great incentive to rectify this situ-
ation quickly.
The next assumption about AS path constraints states that peering is not
transitive. Hence for each AS path, there is only one peering link possible,
and this can only be at the peak of the path, exactly between the upstream
and the downstream AS chains. This constraint follows from the idea that
the only traffic an ISP would accept from a peer is the traffic from that peer
and that of his customers. If an ISP were to accept traffic from the providers
of a peer, then the ISP would actually perform a transit function for the pro-
viders of the peer. Since nobody pays the ISP for this transit traffic, we can
expect the ISPs to refuse such traffic by filtering out routes that a peer might
advertise with destinations that are not contained in his AS, or his set of
customers (not only the immediate customers, but all the further customers
down the line as well).
D. Internet Service Providers Classification
Historically, it was common to classify ISPs into a strict hierarchy of tiers,
whereby the ISPs within one tier were considered equally relevant in terms
of network transport capacity and economic bargaining power. In the follow-
ing sections we will use an AS classification derived from the ranking obtained
from CAIDA’s AS relationship inference/ranking algorithm. Using the inferred
relationships, a ranking is derived based on the dimension of the set of
customers of each AS. Since the relationship inference algorithm relies on
valley-free path relationships, we can assume that, in the direction of a custo-
mer, down to the end of an AS path, all ASs are themselves customers of the
previous AS. This leads to a tree, or customer cone, containing the set of
Figure 1. Examples of valid paths.
Page 14 of 27 Journal of Competition Law and Economics
customers, including all the customers of these.24 The ASs25 are then ranked,
based on the dimension of this customer cone.
VI. VERTICAL BOUNDARIES AND MARKET CONCENTRATION WITHIN
THE EURO-IX MEMBERS
A. Data Description
IXPs26 are independent organizations composed by ISPs, where they can
route their upstream traffic in a cost-effective and technically efficient way.
The data used for the empirical analysis were collected in subsequent steps.
Firstly we obtained the lists of ISP members for each Internet Exchange Point
participating at the Trade Association Euro-IX.27 Then, for each IXP, and for
each IXP’s member, we obtained two sets of measures useful to assess its
position within the Internet: The first metric, provided by CAIDA, associates
a rank with each AS by looking at their location in the Internet hierarchy. The
rank is derived from the AS customer cone, defined as the AS itself plus its
customers, plus its customers’ customers, and so on.28 We then used the
algorithm devised by Huber et al. (2004) to infer the relationships between
pair of ASs (provider-to-customer, customer-to-provider, peering, sibling,
no relationship) within each IXP.29
24 Xenofontas Dimitropoulos, Dmitri Krioukov, Bradley Huffaker, Kimberly C. Claffy and
George Riley, “Inferring AS Relationships: Dead End or Lively Beginning?” www.caida.org/
outreach/papers/2005/asrelationships/as_relationships.pdf, access date: July 2005.25 For technical reasons, large ISPs operate using multiple ASs (e.g. UUNET uses 13), and it
would be a misrepresentation to rank each of these ASs separately, since they belong to the
same company. The CAIDA ranking aggregates ASs with company names that are similar in
the ARIN database (two names are considered similar if they are identical except for the last
several characters). We rely on this grouping to consider rankings of ISPs, instead of rank-
ings of ASs only, since it improves the representation of the ranking, despite some
shortcomings.26 IXPs play a crucial role in Internet traffic routing. As an example, it is sufficient to think that
more than 90 percent of the Internet UK traffic is routed through the LINX-IX in London.27 AIX, AMS-IX, BCIX, BIX, BNIX, CATNIX, CIXP, DE-CIX, Equinix�þ, ESPANIX, FICIX,
GIGAPIX, GN-IX, INEX, JPNAP�þ, LINX, LIPEX, LIX, LoNAP,MaNAP,MIX,MSK-IX,
NaMeX, NDIX, Netnod�, NIX, NIX.CZ, NOTAþ, PARIX, RoNIX, SIX, TIX, TOPIX,
VIX, and XchangePoint�, where � indicates IXPs with multiple unconnected locations and
þ indicates IXPs located outside Europe.28 The customer cone can be defined using three different precision levels: the AS cone, the AS
prefix customer cone, and the AS/24 prefix customer cone. The AS cone indicates the size
of the customer cone in terms of number of ASs; this is a rough measure, since individual
AS sizes can be very different. Since each AS advertises a different number of prefixes, and
the smallest bit of a prefix is the /24, the other two measures provide greater accuracy in assess-
ing the size of the customer cone. For full details see the CAIDA web page at www.caida.org/
analysis/topology/rank_as/index.xml, access date: May 2005.29 Beatrice Huber, Simon Leinen, Regina O’Dell and Roger Wattenhofer “Inferring AS
Relationships Beyond Counting Edges,” 446 D-INFK Tech. Report, ftp://ftp.inf.ethz.ch/pub/publications/tech-reports/4xx/446.pdf, access date: June 2005.
Antitrust Analysis for the Internet Upstream Market Page 15 of 27
The second metric is derived from the BGP tables displayed by Oregon
Routeviews Project.30 Following Shimbel (1953),31 we calculated a measure
of betweenness (centrality) for each AS v (see Brandes, 2001 for a survey on
the algorithms used to compute betweenness32). In particular, the between-
ness for AS v is given by the number of BGP paths, between any pair of
ASs, that traverse v. Formally,
BsðvÞ ¼X
s=v=t[V
sstðvÞ ð1Þ
where sst(v ) ¼ sts(v ) is the number of shortest paths from the AS s to the AS t
on which the AS v lies on. High betweenness indicates both that an AS node can
reach other ASs on relatively short paths, and that this AS has a certain degree
of market power over the others, since it may be costly to avoid the central ASs
and follow other paths in order to deliver packets over the Internet. This para-
meter clearly captures and measures the economic concept of partial essential
facility for central ASs. We calculated the betweenness, for every AS, with
respect to the population of other ASs of the IXP it is a member of. This
means that the betweenness we calculate is defined only by looking at the
paths involving ISP members for each IXP; hence, it provides additional
useful information on the partial bottlenecks and centrality of given
members within an IXP and not within the Internet as a whole.
B. Market Power and Market Concentration
The most widely used measure of market power enjoyed by a certain firm i
operating in the market M is provided by the Lerner index Li ¼ mi/1, where
mi is the market share of firm i and 1 is the market elasticity of demand. The
index of overall market power is then given by
L ¼X
i
miLi ¼X
i
m2i
1¼
HHI
1ð2Þ
where HHI ¼P
i mi2 is the Herfindahl–Hirschman index of concentration.
From equation (2) it is clear that the HHI, and hence the pattern of market
shares, will provide useful insights to assess the degree of market power. Our
unit of analysis is again the Internet exchange point, where a large share of
30 For the full details, see the University of Oregon routeviews project webpage at www.routeviews.
org/, access date: May 2005.31 A. Shimbel, “Structural parameters of communication networks,” 15 Bulletin of Mathematical
Biophysics, 501 (1953).32 Ulrik Brandes, “A Faster Algorithm for Betweenness Centrality,” 25 Journal of Mathematical
Sociology 163 (2001).
Page 16 of 27 Journal of Competition Law and Economics
upstream Internet routing is exchanged. We devised two different proxies33 for
the market share mi:
. The first measure is directly obtained from the customer cone metrics: the
market share for each AS is obtained as the ratio of its customer cone and
the sum of all the customer cones of the IXP members.
. The second measure is derived from the betweenness of an AS. In particu-
lar, the proxy for firm i’s market share is obtained by comparing its rela-
tive betweenness, or degree of unavoidability, within the IXP. This is
computed by dividing the betweenness value for the AS i by the sum of
the betweenness values for all the ASs considered. Formally,
RelBsðvÞ ¼BsðvÞPv BsðvÞ
ð3Þ
where Bs(v ) is defined in equation (1).
This last measure focuses on the presence of essential facilities, often the root
cause of the presence of market power. In particular, the Internet is ambivalent
about the presence of essential facilities: Its nature, the protocols which define
the routing procedures, are indeed meant to avoid predefined paths, therefore
making it easier to avoid essential facilities or bottlenecks. However, successful
traffic routing avoiding bottlenecks depends essentially on the design of the
interconnections among ISPs, and on its hierarchical structure. Usually under-
standing the presence of an essential facility requires an assessment of how
easy it is to duplicate a given input. In the specific context of the Internet,
this means an assessment of how easy is it to bypass a given route, or a
node, managed by an AS that refuses peering and requires a transit charge,
a paid input. The betweenness parameter expressly captures the presence of
partially essential facilities in Internet routing by focussing on how avoidable
or non-avoidable certain nodes are.
A first question that needs to be addressed is the following: Are these
proxies a reasonable approximation of the effective market share within the
IXP? In order to address this question, we obtained confidential traffic data
at LINX for the period October 2004 to November 2004. We then calculated
the market share for each LINX member using both inbound traffic and out-
bound traffic; hence we computed the HHI index, finding a very strong corre-
spondence with the HHI index calculated using the CAIDA customer cone
metrics.34
33 Ideally, market shares within the IXP are derived by looking at the traffic flows. Since these data
are confidential we use the metrics introduced in the previous sections.34 The effective HHI is 0.021, while the indexes calculated with the CAIDA customer cone and
betweenness are 0.024 and 0.05 respectively. Moreover, the market share squares calculated
Antitrust Analysis for the Internet Upstream Market Page 17 of 27
There is no immediate sensible comparison between the market share
calculated by the CAIDA rank and the one calculated using the betweenness
data. Indeed, while the first is targetted to capture the market share in terms
of the established market position and, more explicitly, the pattern of traffic
flows, the second is meant to capture the relevance within the IXP from
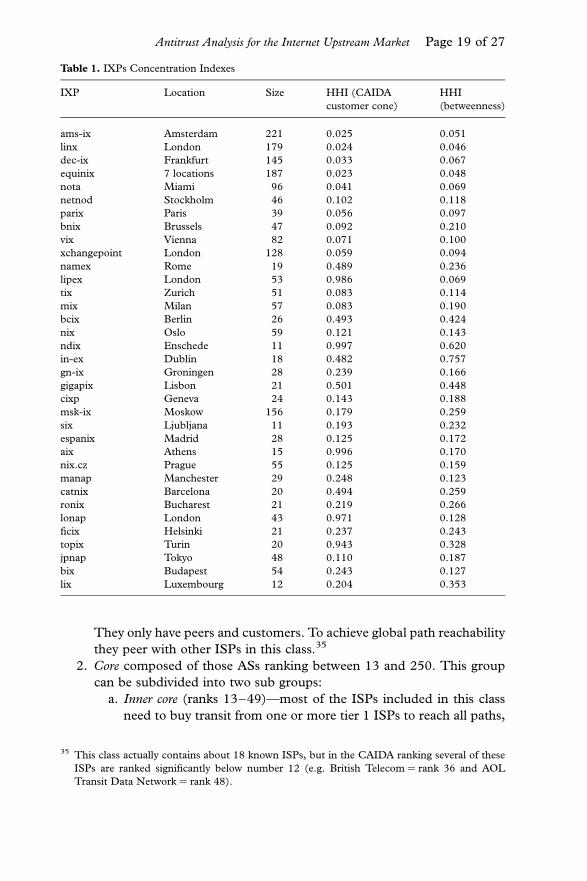
an essential facility point of view. Table 1 shows the calculations for the two
concentration measures for all IXPs under analysis. We ranked the different
IXPs according to their CAIDA customer cone metrics-related HHI.
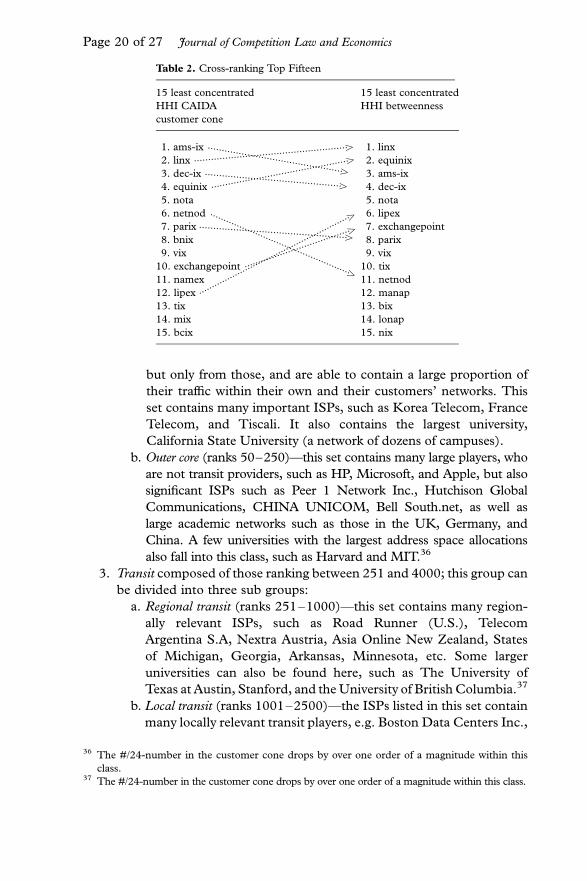
According to HHI index using the CAIDA rank-based proxy market shares,
the fifteen least concentrated IXPs are AMS-IX, LINX, DE-CIX, EQUINIX,
NOTA, NETNOD, PARIX, BNIX, VIX, EXCHANGEPOINT, NAMEX,
LIPEX, TIX, MIX and BCIX. This order, as we can see from Table 2, is
not reflected when the HHI concentration index is calculated according to
the betweenness.
These ranking asymmetries are important in showing the different aspects
of concentration captured by the two complementary proposed indexes.
This is natural for the antitrust analysis of complex network industries
where concentration can only be captured along different dimensions, in this
case customer base and network centrality.
In this first step of the analysis we considered the entire memberships of the
IXP as if they were part of the same market and calculated the newly proposed
concentration indexes accordingly. This is clearly not the case given the differ-
ence in ranking amongst the AS members of any given IXP. In the next section
we address this problem by introducing the vertical market boundaries within
these memberships.
C. Vertical Boundaries
In this section we use the CAIDA rank measure to derive distribution of the
ASs over a set of vertically separated classes, by looking at jumps in their cus-
tomer cones values. In particular, we group all ASs into four major groups
according to their CAIDA ranking reported below:
1. Tier 1 (ranks 1–12)—this set contains the ISPs that are located at the top
of the Internet hierarchy. Most of the providers in this class are the
Internet backbones of tier 1. Tier 1 providers distinguish themselves
from any other ISP by not paying for transit traffic to any other ISP.
with the CAIDA customer cone showed the highest correlation (0.74) with the squares of effec-
tives market shares (the correlation is instead 0.33 for the betweenness-based proxies). This is a
positive result, indicating that it is sensible to calculate the HHI index using the CAIDA rank-
based proxy market shares, and also that these proxies are probably a good approximation of the
effective market shares.
Page 18 of 27 Journal of Competition Law and Economics
They only have peers and customers. To achieve global path reachability
they peer with other ISPs in this class.35
2. Core composed of those ASs ranking between 13 and 250. This group
can be subdivided into two sub groups:
a. Inner core (ranks 13–49)—most of the ISPs included in this class
need to buy transit from one or more tier 1 ISPs to reach all paths,
Table 1. IXPs Concentration Indexes
IXP Location Size HHI (CAIDA
customer cone)
HHI
(betweenness)
ams-ix Amsterdam 221 0.025 0.051
linx London 179 0.024 0.046
dec-ix Frankfurt 145 0.033 0.067
equinix 7 locations 187 0.023 0.048
nota Miami 96 0.041 0.069
netnod Stockholm 46 0.102 0.118
parix Paris 39 0.056 0.097
bnix Brussels 47 0.092 0.210
vix Vienna 82 0.071 0.100
xchangepoint London 128 0.059 0.094
namex Rome 19 0.489 0.236
lipex London 53 0.986 0.069
tix Zurich 51 0.083 0.114
mix Milan 57 0.083 0.190
bcix Berlin 26 0.493 0.424
nix Oslo 59 0.121 0.143
ndix Enschede 11 0.997 0.620
in-ex Dublin 18 0.482 0.757
gn-ix Groningen 28 0.239 0.166
gigapix Lisbon 21 0.501 0.448
cixp Geneva 24 0.143 0.188
msk-ix Moskow 156 0.179 0.259
six Ljubljana 11 0.193 0.232
espanix Madrid 28 0.125 0.172
aix Athens 15 0.996 0.170
nix.cz Prague 55 0.125 0.159
manap Manchester 29 0.248 0.123
catnix Barcelona 20 0.494 0.259
ronix Bucharest 21 0.219 0.266
lonap London 43 0.971 0.128
ficix Helsinki 21 0.237 0.243
topix Turin 20 0.943 0.328
jpnap Tokyo 48 0.110 0.187
bix Budapest 54 0.243 0.127
lix Luxembourg 12 0.204 0.353
35 This class actually contains about 18 known ISPs, but in the CAIDA ranking several of these
ISPs are ranked significantly below number 12 (e.g. British Telecom ¼ rank 36 and AOL
Transit Data Network ¼ rank 48).
Antitrust Analysis for the Internet Upstream Market Page 19 of 27
but only from those, and are able to contain a large proportion of
their traffic within their own and their customers’ networks. This
set contains many important ISPs, such as Korea Telecom, France
Telecom, and Tiscali. It also contains the largest university,
California State University (a network of dozens of campuses).
b. Outer core (ranks 50–250)—this set contains many large players, who
are not transit providers, such as HP, Microsoft, and Apple, but also
significant ISPs such as Peer 1 Network Inc., Hutchison Global
Communications, CHINA UNICOM, Bell South.net, as well as
large academic networks such as those in the UK, Germany, and
China. A few universities with the largest address space allocations
also fall into this class, such as Harvard and MIT.36
3. Transit composed of those ranking between 251 and 4000; this group can
be divided into three sub groups:
a. Regional transit (ranks 251–1000)—this set contains many region-
ally relevant ISPs, such as Road Runner (U.S.), Telecom
Argentina S.A, Nextra Austria, Asia Online New Zealand, States
of Michigan, Georgia, Arkansas, Minnesota, etc. Some larger
universities can also be found here, such as The University of
Texas at Austin, Stanford, and theUniversity of BritishColumbia.37
b. Local transit (ranks 1001–2500)—the ISPs listed in this set contain
many locally relevant transit players, e.g. Boston Data Centers Inc.,
Table 2. Cross-ranking Top Fifteen
15 least concentrated
HHI CAIDA
customer cone
15 least concentrated
HHI betweenness
1. ams-ix ������������������������������������������������.
1. linx
2. linx ������������������������������������
������������������.
2. equinix
3. dec-ix ������������������������������������������������.
3. ams-ix
4. equinix ������������������
������������������
�������������.
4. dec-ix
5. nota 5. nota
6. netnod �����������������������������������������������������.
6. lipex
7. parix ����������������������������������������������������.7. exchangepoint
8. bnix 8. parix
9. vix 9. vix
10. exchangepoint ����������
����������
����������
���������.
10. tix
11. namex 11. netnod
12. lipex �����������������������������������������������������������.
12. manap
13. tix 13. bix
14. mix 14. lonap
15. bcix 15. nix
36 The #/24-number in the customer cone drops by over one order of a magnitude within this
class.37 The #/24-number in the customer cone drops by over one order of a magnitude within this class.
Page 20 of 27 Journal of Competition Law and Economics
OmanTel, Tiscali Belgium, Portland-Metro Area Network (P-
MAN), ARBINET-THEXCHANGE, Inc., Danish Network for
Research and Education, and many universities, such as Yale,
Emory, University of Virginia, and the University of New
Mexico. The #/24-number in the customer cone drops by 72
percent within this class.
c. Campus level (ranks 2501–4000)—this class contains many corpor-
ate campus level networks (e.g. Cray Inc., Wachovia Operational
Services Corporation, Morgan Stanley Dean Witter, BASF
Corporation, Oracle Corporation Datacenter, Wal-Mart Stores,
Inc.) as well as many university campus networks (e.g. Mount
Sinai School of Medicine, Bradley University, Brigham Young
University, Bates College, Georgia State University, and
University of Salzburg), and a few smaller ISPs with local reach
(e.g. China Information Broadcast Network Ltd, China
Enterprise Communications Ltd, ADC Telecommunications Inc.,
and Skyrr ISP Network).38
4. Finally we have the ISP customers (rank below 4000). Most of these ISPs
do not have any further customers, and are leaves in the hierarchy. Some
of these ISPs do have customers, sometimes up to a dozen but more
often between one and five. The networks grouped in this list are
many small customer ISPs (e.g. BusinessOnline AG–German ISP,
Wave2Wave Communications, Inc., FreiNet GmbH, Pacific
Information Exchange, Inc., Kabel Deutschland Breitband Service
GmbH, Belize Telecommunications Limited, Startec Global
Communications, TSI Telecommunication Services, Northeast
Telecom Inc.), a few companies (e.g. DuPont, First Citizens Bank,
Hotels.com, Deloitte Consulting), and some universities, schools, and
public institutions (e.g. University of the Aegean, Innsbrucker
Kommunalbetriebe AG, National Dong Hwa University, The Open
University of Hong Kong, University of Tehran).
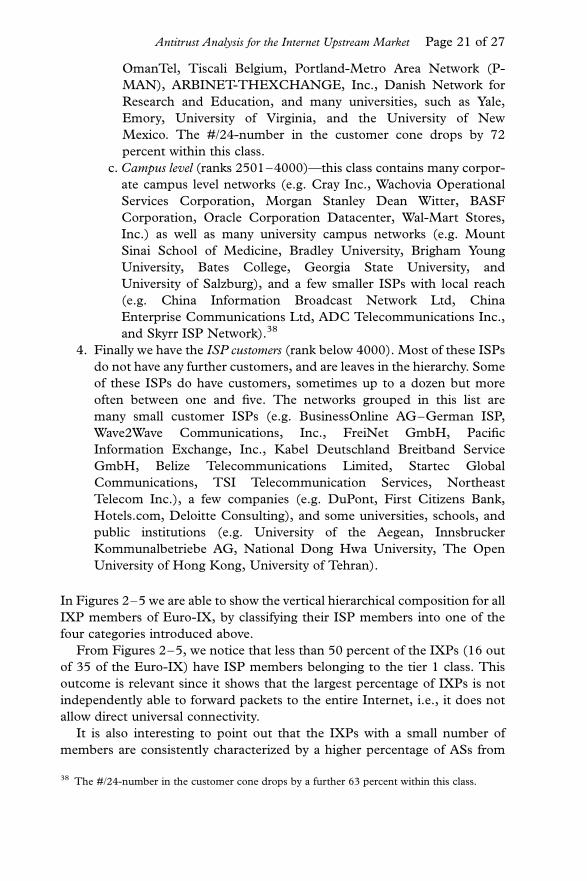
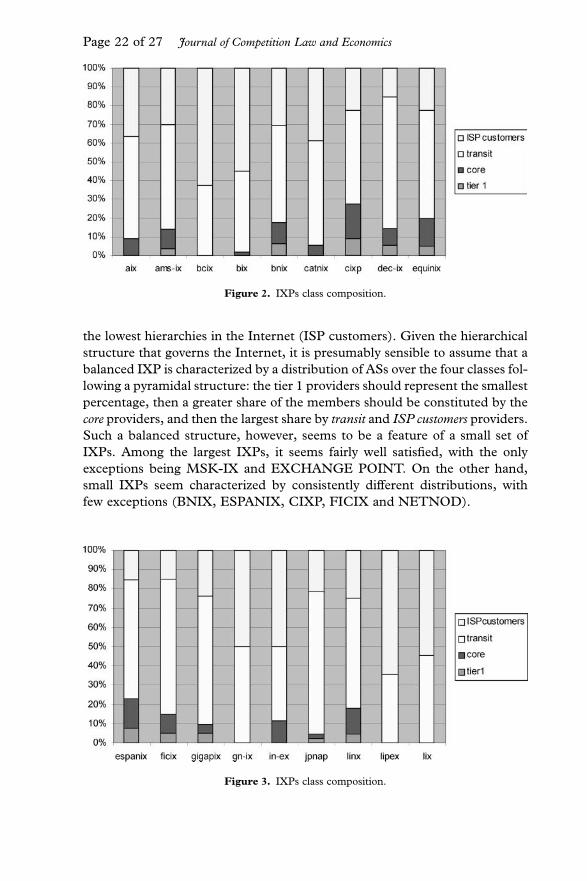
In Figures 2–5 we are able to show the vertical hierarchical composition for all
IXP members of Euro-IX, by classifying their ISP members into one of the
four categories introduced above.
From Figures 2–5, we notice that less than 50 percent of the IXPs (16 out
of 35 of the Euro-IX) have ISP members belonging to the tier 1 class. This
outcome is relevant since it shows that the largest percentage of IXPs is not
independently able to forward packets to the entire Internet, i.e., it does not
allow direct universal connectivity.
It is also interesting to point out that the IXPs with a small number of
members are consistently characterized by a higher percentage of ASs from
38 The #/24-number in the customer cone drops by a further 63 percent within this class.
Antitrust Analysis for the Internet Upstream Market Page 21 of 27
the lowest hierarchies in the Internet (ISP customers). Given the hierarchical
structure that governs the Internet, it is presumably sensible to assume that a
balanced IXP is characterized by a distribution of ASs over the four classes fol-
lowing a pyramidal structure: the tier 1 providers should represent the smallest
percentage, then a greater share of the members should be constituted by the
core providers, and then the largest share by transit and ISP customers providers.
Such a balanced structure, however, seems to be a feature of a small set of
IXPs. Among the largest IXPs, it seems fairly well satisfied, with the only
exceptions being MSK-IX and EXCHANGE POINT. On the other hand,
small IXPs seem characterized by consistently different distributions, with
few exceptions (BNIX, ESPANIX, CIXP, FICIX and NETNOD).
Figure 2. IXPs class composition.
Figure 3. IXPs class composition.
Page 22 of 27 Journal of Competition Law and Economics
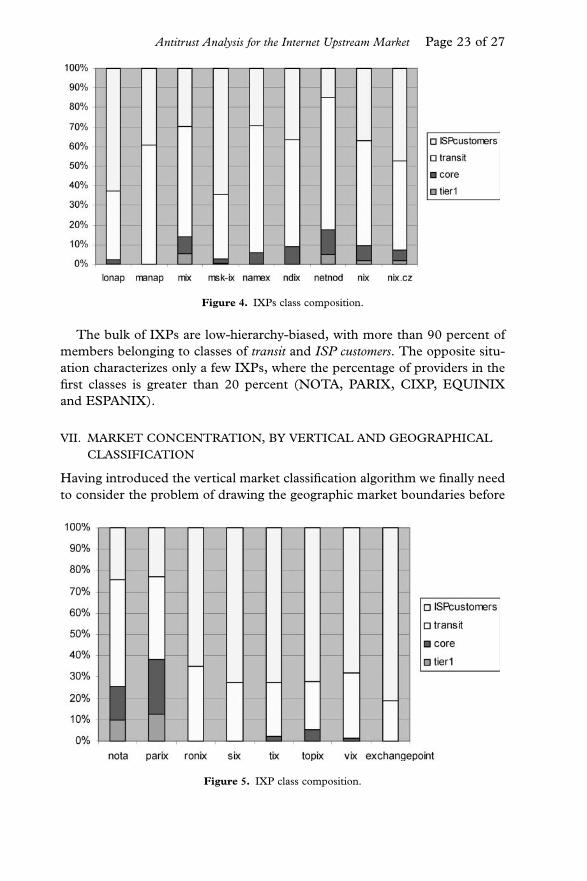
The bulk of IXPs are low-hierarchy-biased, with more than 90 percent of
members belonging to classes of transit and ISP customers. The opposite situ-
ation characterizes only a few IXPs, where the percentage of providers in the
first classes is greater than 20 percent (NOTA, PARIX, CIXP, EQUINIX
and ESPANIX).
VII. MARKET CONCENTRATION, BY VERTICAL AND GEOGRAPHICAL
CLASSIFICATION
Having introduced the vertical market classification algorithm we finally need
to consider the problem of drawing the geographic market boundaries before
Figure 4. IXPs class composition.
Figure 5. IXP class composition.
Antitrust Analysis for the Internet Upstream Market Page 23 of 27
being able to perform our empirical analysis of the upstream Internet routing
Europeanmarket. Should we demarcatemarkets following the national bound-
aries or is this concept not appropriate for Internet upstream connections?
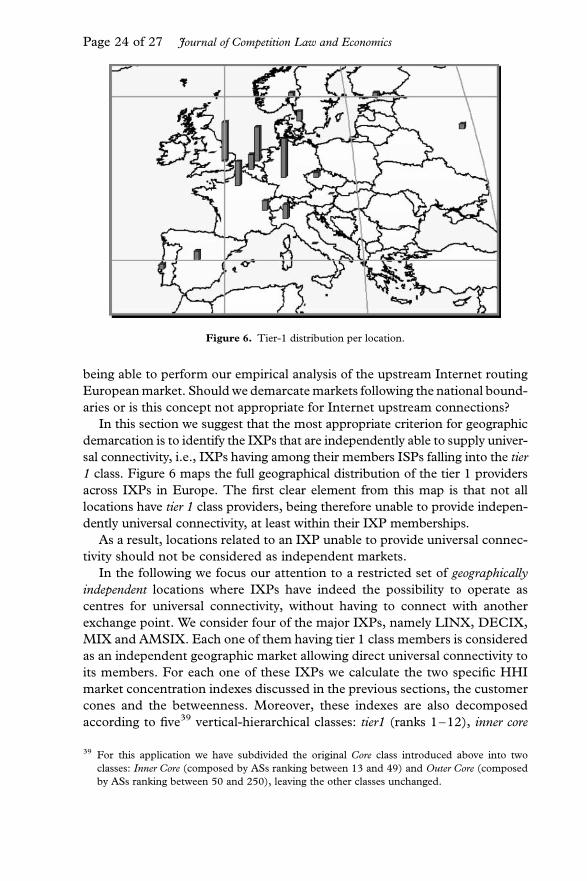
In this section we suggest that the most appropriate criterion for geographic
demarcation is to identify the IXPs that are independently able to supply univer-
sal connectivity, i.e., IXPs having among their members ISPs falling into the tier
1 class. Figure 6 maps the full geographical distribution of the tier 1 providers
across IXPs in Europe. The first clear element from this map is that not all
locations have tier 1 class providers, being therefore unable to provide indepen-
dently universal connectivity, at least within their IXP memberships.
As a result, locations related to an IXP unable to provide universal connec-
tivity should not be considered as independent markets.
In the following we focus our attention to a restricted set of geographically
independent locations where IXPs have indeed the possibility to operate as
centres for universal connectivity, without having to connect with another
exchange point. We consider four of the major IXPs, namely LINX, DECIX,
MIX and AMSIX. Each one of them having tier 1 class members is considered
as an independent geographic market allowing direct universal connectivity to
its members. For each one of these IXPs we calculate the two specific HHI
market concentration indexes discussed in the previous sections, the customer
cones and the betweenness. Moreover, these indexes are also decomposed
according to five39 vertical-hierarchical classes: tier1 (ranks 1–12), inner core
Figure 6. Tier-1 distribution per location.
39 For this application we have subdivided the original Core class introduced above into two
classes: Inner Core (composed by ASs ranking between 13 and 49) and Outer Core (composed
by ASs ranking between 50 and 250), leaving the other classes unchanged.
Page 24 of 27 Journal of Competition Law and Economics
(ranks 13–49), outer core (ranks 50–250), transit (ranks 251–4000), and ISP
customers (ranks 4001þ). As a result we obtain location- and layer-specific con-
centration indexes or, in other words, concentration indexes for the relevant
market. The results we obtain, shown in Tables 3–6, are significantly different
from the aggregate ones and we believe they provide a step forward towards the
application of the Commission’s guidelines in assessing location- and class-
specific market concentration for Internet upstream routing at European
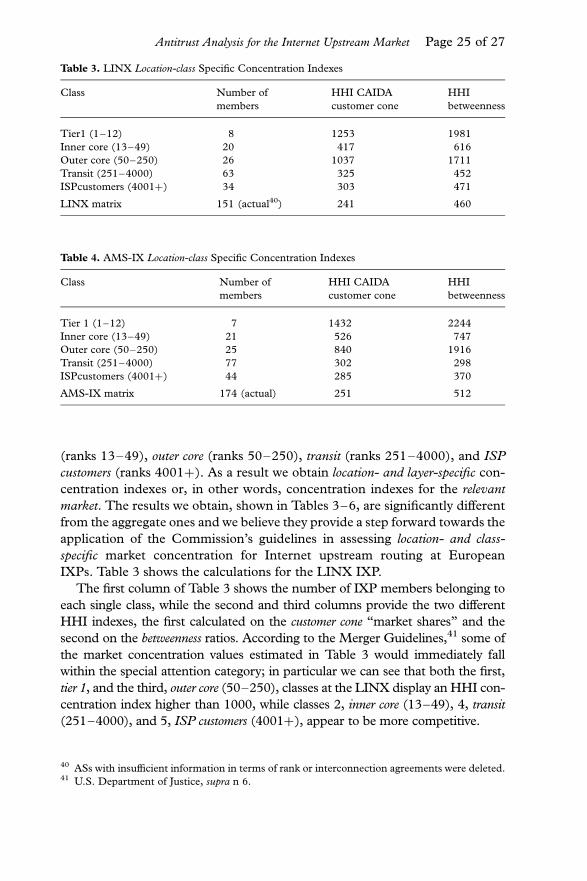
IXPs. Table 3 shows the calculations for the LINX IXP.
The first column of Table 3 shows the number of IXP members belonging to
each single class, while the second and third columns provide the two different
HHI indexes, the first calculated on the customer cone “market shares” and the
second on the betweenness ratios. According to the Merger Guidelines,41 some of
the market concentration values estimated in Table 3 would immediately fall
within the special attention category; in particular we can see that both the first,
tier 1, and the third, outer core (50–250), classes at the LINX display an HHI con-
centration index higher than 1000, while classes 2, inner core (13–49), 4, transit
(251–4000), and 5, ISP customers (4001þ), appear to be more competitive.
Table 3. LINX Location-class Specific Concentration Indexes
Class Number of
members
HHI CAIDA
customer cone
HHI
betweenness
Tier1 (1–12) 8 1253 1981
Inner core (13–49) 20 417 616
Outer core (50–250) 26 1037 1711
Transit (251–4000) 63 325 452
ISPcustomers (4001þ) 34 303 471
LINX matrix 151 (actual40) 241 460
Table 4. AMS-IX Location-class Specific Concentration Indexes
Class Number of
members
HHI CAIDA
customer cone
HHI
betweenness
Tier 1 (1–12) 7 1432 2244
Inner core (13–49) 21 526 747
Outer core (50–250) 25 840 1916
Transit (251–4000) 77 302 298
ISPcustomers (4001þ) 44 285 370
AMS-IX matrix 174 (actual) 251 512
40 ASs with insufficient information in terms of rank or interconnection agreements were deleted.41 U.S. Department of Justice, supra n 6.
Antitrust Analysis for the Internet Upstream Market Page 25 of 27
Moving to AMSIX in the Netherlands, Table 4 shows that again the first
class is the most concentrated, however class 3 is very concentrated in terms
of betweenness. The difference between HHI based on customer cones and
betweenness needs further scrutiny in future research. Surely the betweenness
expresses the presence of partially essential facilities, and concentration in it
could express the pivotal role of some ISPs that, while not having a particularly
large customer base, still represent an almost non-avoidable essential facility in
upstream Internet routing.
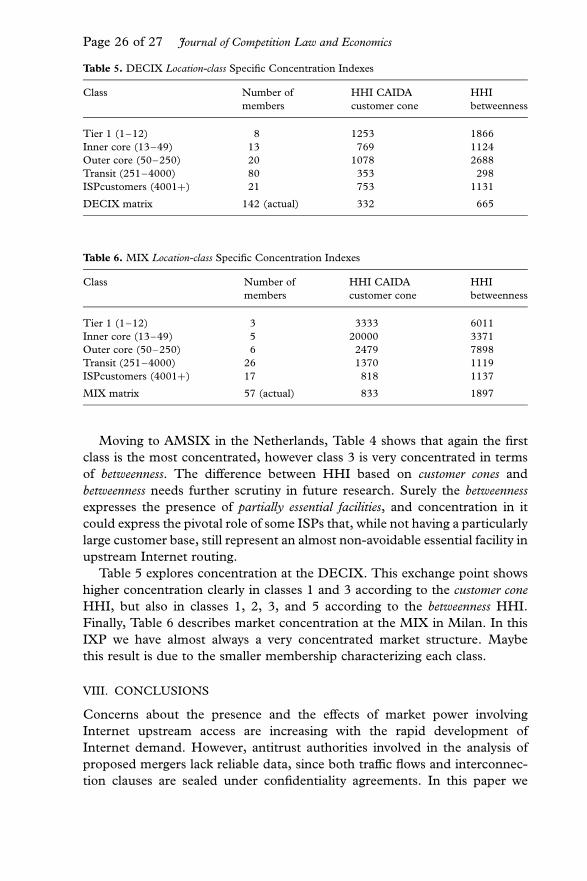
Table 5 explores concentration at the DECIX. This exchange point shows
higher concentration clearly in classes 1 and 3 according to the customer cone
HHI, but also in classes 1, 2, 3, and 5 according to the betweenness HHI.
Finally, Table 6 describes market concentration at the MIX in Milan. In this
IXP we have almost always a very concentrated market structure. Maybe
this result is due to the smaller membership characterizing each class.
VIII. CONCLUSIONS
Concerns about the presence and the effects of market power involving
Internet upstream access are increasing with the rapid development of
Internet demand. However, antitrust authorities involved in the analysis of
proposed mergers lack reliable data, since both traffic flows and interconnec-
tion clauses are sealed under confidentiality agreements. In this paper we
Table 5. DECIX Location-class Specific Concentration Indexes
Class Number of
members
HHI CAIDA
customer cone
HHI
betweenness
Tier 1 (1–12) 8 1253 1866
Inner core (13–49) 13 769 1124
Outer core (50–250) 20 1078 2688
Transit (251–4000) 80 353 298
ISPcustomers (4001þ) 21 753 1131
DECIX matrix 142 (actual) 332 665
Table 6. MIX Location-class Specific Concentration Indexes
Class Number of
members
HHI CAIDA
customer cone
HHI
betweenness
Tier 1 (1–12) 3 3333 6011
Inner core (13–49) 5 20000 3371
Outer core (50–250) 6 2479 7898
Transit (251–4000) 26 1370 1119
ISPcustomers (4001þ) 17 818 1137
MIX matrix 57 (actual) 833 1897
Page 26 of 27 Journal of Competition Law and Economics
suggest a possible solution to this problem, centred on the use of innovative
metrics to assess concentration in the upstream Internet market. In particular,
our approach is based on the retrieval of implicit interconnection policies, the
discrimination blueprints expressing the real bargaining power of each ISP,
from publicly available BGP data. Indeed, given the confidentiality of explicit
peering and interconnection pricing policies for this market, we believe that the
only possible way to learn about the economic type of relationship between two
undertakings is by examining data contained in the BGP tables.
We focussed on the European upstream Internet market. In order to assess
concentration we considered four leading European Internet exchange points:
LINX, DECIX, AMSIX, and MIX.
We followed a two-step process: firstly we introduced a price-independent
algorithm to define both the vertical and geographical relevant market bound-
aries, then we calculated market concentration indexes using two novel
metrics. These assess, for each undertaking, both its role as an essential
network facility, thorough the measurement of its relative betweenness, and its
wholesale market share, via the ranking of its customer cone.
The results show that some vertical segments of these markets are highly
concentrated and would hence fall within the special attention category
according to the Merger Guidelines (U.S. Department of Justice, 1997).42
The measures of market concentration obtained using our two different
metrics tend to move closely together, although with different concentration
indexes. This result reinforces the rationale to look at both these dimensions
of market concentration. This is expected in the framework of network
industries, where a relevant notion of market concentration needs to be cap-
tured along more than one single dimension. In our case the two dimensions
considered are wholesale customer base, and network centrality.
Finally, market power can be a transient phenomenon, and market
concentration may change rapidly in highly innovative sectors, such as the
Internet. This clearly implies that the tasks of identifying the relevant
market and assessing its concentration need to be re-evaluated regularly.
Our proposed indicators can be of particular use for repeated antitrust analysis
since they are not based on ad hoc information gathering but on existing algor-
ithms applied to regularly updated databases.43 As a result, we think that no
reliable empirical alternative exists to the analysis of the micro-routing
decisions, based on the retrieval of BGP policies, for the study of the upstream
Internet, routing, and market structure, and for its antitrust analysis.
42 See U.S. Department of Justice, supra n 6.43 There is a clear tendency showing an improvement in the reliability of both the Internet routing
databases and the inference techniques, reducing the possibility of errors associated with the
proposed method. See, for example, the source of BGP data at University of Oregon Route
Views Project (www.routeviews.org/).
Antitrust Analysis for the Internet Upstream Market Page 27 of 27