anti-skimming technology and emv for the atm
TRANSCRIPT
Energy supply concepts for zero energy residential buildings in humid and dry
climate
S. Deng1, A. Dalibard2, M. Martin2, Y.J. Dai1 *, U. Eicker2, R.Z. Wang1
1Institute of Refrigeration and Cryogenics, Shanghai Jiao Tong University, Shanghai,
200240 P R China, [email protected]
2Research Centre zafh.net, University of Applied Sciences, Stuttgart, D-70714,
Germany
Abstract
Energy supply concepts for zero energy residential building (ZERB) in Shanghai
(humid) and Madrid (dry) are discussed in this paper. Simulation is employed as the
main research method. Two typical housing models are designed according to the real
occupancy condition, the life schedule, the thermostats settings, etc., for the two cities.
An energy analysis considering the annual balance of input from the grid and output
from renewable power systems is made. Indoor comfortable comparisons between the
two models are presented to show optimal design strategies for HVAC under different
weather conditions. Also performed is the analysis on the primary energy payback
time and the CO2 equivalent saving in order to evaluate the performance of novel
energy systems to verify the feasibility.
Keywords: net zero energy building, solar energy, simulation, building evaluation,
CO2 emission reduction
∗ Correspondence to: Prof. Y.J. Dai, Tel: (86-21) 34204358, E-mail: [email protected]

Nomenclature
Qhouse total fossil primary energy needed for house construction, J
QPV annual PV electricity production, J
Qcons annual electricity consumption, J
NPE primary energy payback time, year
NLT house life time, year
FCO2 CO2 conversion factor, kg/kWh
PEF Primary energy factor, kWh/kWh
Mtotal Total CO2 equivalent savings, ton
Fac facade
Win window
1. Introduction
Nowadays, net zero energy building (NZEB) has already been recognized not only
as an effective technical method to deal with energy shortage and environmental
pollution all around the world, but also as an innovatory trend of design concepts in
related research fields spanning building construction, HVAC, refrigeration and
environment. P. Norton and C. Christensen [1] introduced their design concepts about
an affordable zero energy home which was built in cold climates. Four kinds of
heating systems, including: ground-coupled heat pump, ERV and natural gas furnace,
etc, are considered during design process for heating system. In order to reach the
“affordable” purpose, PV cost should be reduced. So the design result is trend to use
furnace and electricity resistance for heating. J. Steinbock, et al [3], also chose a

ground source heat pump (GSHP) in energy concept for one net zero energy building.
Besides GSHP, energy recovery ventilator and 135.3 m2 PV are applied to achieve the
“net zero” purpose. The real test data in 2005 showed that building produced 2573
kWh more than it used. Reference [2, 4-5] all applied TRNSYS as the main
simulation soft to evaluate the feasibility for net zero energy purpose. The sameness
of these three simulation works are that they all chose GSHP as main device in energy
supply system so that the energy consumption of building can be limited to a low
level and “net zero energy” aim can be easier to realize. Y. Higuchi, et al [6],
calculated primary energy consumption for a 106m2 net zero energy house under
Japan weather condition and life style. Unit air conditioner is chosen as main HVAC
system and 34 m2 PV are utilized. Most of the NZEB designs have some
shortcomings and limitations. First is that there are less innovations in energy supply
system. Actually energy supply system, especially HVAC and domestic hot water
(DHW) system, takes a high proportion in the whole energy consumption of building.
Significant energy saving can be achieved with much deliberate design. Second, the
comparisons in energy technologies and design experience are lack. The design
experience can not be easily shared because of local characteristic, such as climate or
life style. Third, most of the demonstration project paid more focus on the feasibility
in net zero energy, not on the economical analysis.
In this paper, two innovative energy supply systems are introduced based on the
zero energy residential building (ZERB) design experience in Shanghai and Madrid.
Two cities have their own special weather condition, the annual humidity level of
Shanghai is higher but in Madrid, dry weather dominates. Some comparison results
from simulation are given so that the energy system design schemes and primary
energy payback time can be summarized under typical humidity/dry climate.
2. Description of two ZERB cases and energy system concepts
The first case of ZERB is an apartment which will be built on the third floor of a
green building in the campus of Shanghai Jiao Tong University [7]. Its indoor
function was designed according to China typical apartment for a family with one
couple and 1kid. The second ZERB case was planned and built by the Stuttgart
University of Applied Sciences for the 1st edition of the Solar Decathlon Europe
(SDE) that took place in June 2010 in Madrid (Spain) [8,9]. The rendering design
picture and passive design factors of two buildings can be seen in Fig.1, Fig.2 and
Table 1.
For shanghai building, an 8 kW air-cooled hybrid heat pump (HP) which uses solar
thermal energy to assist electricity driven vapour compression (VC) air conditioning
device is developed. The main parts of this device are a small solar assisted hybrid
Libr absorption chiller and a CO2 heat pump. Use of solar thermal driven Libr
absorption cooling can dramatically improve the performance of the hybrid heat pump
system. It also means that electricity consumption of this device can be reduced to a
low level by solar energy input. In summer, the solar thermal energy is collected by
heat pipe evacuated tube solar water collectors for 30m2. Then the hot water is
transferred from the collect tank (500L) into the storage tank (300L) to promote the
performance of HP and supply thermal to DHW. Hybrid heat pump supplies cooling
energy to the fan coil unit. In winter, the solar thermal energy can be directly supplied
to the radiation floor (70m2). If water temperature of collector tank is not high
enough, the heat pump is operated to provide heating to storage tank. Then the
thermal energy can be transferred to the indoor HVAC terminal units. In cloudy or
rainy days, the hybrid heat pump works in independent operation mode. One 127 W
heat recovery ventilator (HRV) is used for recovering the both latent and sensible heat

from the exhaust air. The heating radiant floor and fan coil unit is used as terminal
indoor unit. 64m2 PV was designed for this apartment and it is located on the slope
surface of overhead holder above the roof. The layout of system is shown in fig.3.
For Madrid building, the basic idea of the design is to use the traditional means for
dealing with the hot and arid climate and to combine them with new technologies.
Thermal mass (PCM), sun shadings and evaporative cooling will help to achieve a
comfortable indoor climate with passive means. The ventilation tower supplies
passively part of the ventilation and cooling needs by evaporative cooling using the
wind as driving force. Mechanical ventilation (AHU) with heat recovery and indirect
evaporative cooling systems is used to reduce heat losses in winter and provide
additional cooling in summer. Active cooling and heating is supplied through a
radiant floor (30 m²) by a reversible heat pump (2.4 kW cooling) powered by
photovoltaic (12.5 kWp). In summer, a night radiant cooling system using hybrid PVT
collectors (38 m²) regenerates the PCM ceiling (18 m²) and takes up the heat rejected
from the reversible heat pump by cooling down the “heat sink tank”. If possible, “free
cooling” is used by pumping directly the cold water of the heat sink tank to the radiant
floor. Dehumidification of the supply air can be done with the reversible heat pump
through a fan coil by cooling the air below the dew point. Domestic hot water (DHW)
needs are covered by vacuum tubes collectors (6.6 m²) which feed a 300 litre solar
tank with electrical heater back-up. In winter, when necessary, the solar thermal
system provides heat to the heat sink tank in order to increase the heat pump
efficiency, as fig. 4 shown. The PV system consists of around 66 m² of polycrystalline
surface on both east/west facades and the roof and 33 m² of monocrystalline cells for
the PVT modules.
3. Weather data and building internal gain

Both hot/dry and hot/humid climates from Madrid and Shanghai are considered in
the simulation studies. The weather data used for the simulation studies are taken
from Meteonorm[10]. Fig.5 shows that the mean ambient temperature of Shanghai is
higher than that of Madrid in summer and there is a contrary trend in winter. The most
obvious difference in weather between two cities is humid for whole year. The mean
relative humidity in summer of Shanghai is above 80% and keeps at a high level for
whole year. On the contrary, the lowest value of mean relative humidity in Madrid is
less than 40% in July. The dry climate dominates the summer of Madrid. Fig.6 shows
global horizontal irradiation of two cities for a whole year. The average level of
Madrid is better than that of Shanghai, especially in summer.
One weekly user profile is designed for the two cases, as shown in Fig.7 and Fig.8.
The thermal indoor load profile of shanghai building is based on the life custom of
typical household (two adults and one kid). Daily DHW consumption is 80 L/person.
The thermal and humidity gain profile of Madrid building is based on the building
occupancy (2 people) and the electrical appliances of the house. Daily DHW demand
corresponds to 50 L/person with a 45°C set point temperature.
4. Simulation results and discussion
Two detailed models about the house and their equipments have been implemented
in TRNSYS [11] and the yearly simulations have been performed using the time step
for 6 min. The simulation of the PV system for the building 2 has been done
separately with INSEL [12]. For comparison, weather data files of two cities are input
in the models. The main results are shown in Table 2.
Fig.9-12 show the psychrometric diagrams of the simulated temperatures and
humidity for both climate conditions as well as the defined comfort zone (20-26°C
and 40-65% relative humidity). There are result points for 8760 hours in every figure

based on the whole year hourly simulation. One parameter, namely comfortable zone
fraction (CZF), which stands for how many result points are inside the comfortable
zone are defined and calculated. By CZF, affect from HVAC system to comfortable
level of indoor environment can be evaluated. Similarly, comfortable temperature
fraction (CTF) is defined to show how many points are inside the comfortable
temperature range (20-26°C). The simulation results for these two parameters are both
shown in the Table 2.
Compared to building 1, the energy consumption of building 2 is smaller, not only
because the better passive design, but also because of novel active cooling technology,
such as, radiant floor “free cooling”. The passive design features, such as, PCM
ceiling and good thermal insulation, etc., make the hourly distribution of simulation
results in building 2 more concentrated in the comfortable zone than that of building 1.
The electricity balance is positive for both climates in both cases, although it is less
favourable in Shanghai since the electricity consumption is higher and the PV
generation is lower, as shown in Table 2. Humidity is the main factor for comfortable
level in comparison of all four results. The CTF and CZF in Table 2 show that indoor
environment of four cases have better temperature level than humidity level. That is
because two HVAC systems both apply temperature control as main control strategy.
So the main control aim for four cases is met based on the CZF results. Additional
dehumidification devices would be necessary in building 2 for Shanghai climate, as
Fig.11 shows. The similar situation also happened in building 1 for Madrid, the
HVAC is not enough to maintain the humidity at a reasonable level, as shown in
Fig.10. So some small scale humidification devices for bedroom would be necessary
in building 1 for Madrid.

For building 1, because electricity-driven CO2 heat pump is the core of the whole
system, the influence of weather conditions on indoor environment is lower than that
for the independent solar thermal-driven air conditioning. It means the feasibility of
HVAC system to different climates is good. Fig.9, Fig.10 and Table 3 show that CTFs
for Shanghai and Madrid are 96.8% and 92.7%, respectively. But dependence on
electricity for building 1 is bigger than that for building 2. And use of HRV (heat
recovery ventilator) can reduce the humidity level of supply fresh air in Shanghai. But
it has less helpfulness in Madrid.
For building 2, since the house is specially designed for Madrid, the cooling
concept operates more efficiently in Madrid. As expected, in the humid climate of
Shanghai, the indirect evaporative cooling is less efficient and the ventilation tower
cannot be operated. Night sky temperatures are higher in Shanghai (overcast sky).
Therefore the radiant cooling system is much less efficient than in Madrid. The PCM
ceiling cannot always be regenerated during the night and the heat rejected from the
chiller is not dissipated efficiently. Due to high temperatures in the heat sink tank,
“free cooling” cannot be used as much as in Madrid and the chiller COP is lower. The
cooling coil of the AHU has to be used in Shanghai in order to provide additional
cooling and dehumidify the supply air. CZF for Madrid is 46.7%, which is the highest
one among four simulation cases.
5. Evaluation
A life cycle analysis of the house has been done for the building 2 in order to
calculate the primary energy payback time of the house for both climates. The total
fossil primary energy necessary for materials and system technology (PV, solar
thermal, HVAC…) has been estimated to 890 GJ. At the end of life, those materials
can be either recycled or incinerated (thermally used) or put in landfills. The effective

total primary energy needed for the house construction is then 610 GJ which gives
3026 kWh/m², as shown in Fig.13
Based on this calculation result and the simulated energy demand during operation,
the primary energy payback time (NPE) can be calculated. Primary energy factors
(PEF) for the conversion from to electricity to fossil primary energy are needed for
this calculation. The conversion factors of GEMIS [13] have been used to consider the
electricity mix generation of Spain and China. GEMIS is a life-cycle analysis program
and database for energy, material, and transport systems. The calculation equation can
be seen in Eqs(1). The calculation result can be found in Table 3. The primary energy
payback times of building 2 for Madrid and Shanghai climates are 10.1 and 17.9 years,
respectively.
PEFQQ
QN
consPV
housePE ×−
=)(
⑴
Once the primary energy needed for the house has been recovered, the CO2
equivalent emissions savings during the rest of the house lifetime can be estimated, as
Eqs(2) shown. The conversion factors of GEMIS for Spain and China electricity mix
have been used. The other conversion factor from one China research result [14] is
also used as a reference. A house lifetime of 40, 50, 60 and 70 years have been used
for the calculations. The results in the Table 4 show that total CO2 equivalent savings
of Madrid building is 74.4 ton during the 50 years. For shanghai building, the total
CO2 equivalent savings is more than 100 ton.
)(2 PELTconsCOtotal NNQFM −××= ⑵
For Madrid, NPE can be accepted, but for shanghai, it is beyond the reasonable
range. The reason is that the energy concept designed for building 2 under dry

weather doesn’t have a good adaptability to humid weather although building 2 has a
good passive energy-saving design. The electricity consumption of building 2 under
shanghai weather is 9.8 % higher than that under Madrid weather, but the electricity
production under shanghai is 25.4% lower than that under Madrid weather. So NPE for
shanghai is 77.2% longer than that for Madrid. From the Eqs(2), Table 3 and 4, it can
be seen that the difference between electricity consumption and production of
building 2 for Madrid is 43.2% higher than that for Shanghai, although total CO2
equivalent savings of building 2 for Madrid is lower than that for Shanghai.
Increasing the PV capacity to increase Qpv is one solution to reduce NPE and to
increase the total CO2 equivalent savings for Shanghai. If NPE of building 2 under
Shanghai weather is limited to 10 years, 120 m2 PV is needed at least based on the
simulation result. At the same time, cost and envelopment area of building need to be
considered according to real application. Besides, improvement on HVAC system and
building passive design is the other method to increase the difference between Qpv and
Qcons. Considered that the building 2 already has a good thermal insulation
performance, some improvements on the dehumidification system can be thought as a
useful method, like using some renewable energy driven dehumidifies systems.
Humidity load is met by small-scale independent dehumidification system can
increase indoor comfortable level and reduce the electricity consumption of existed
HVAC system. The added initial cost can be offset by decrease on HVAC capacity
and operation fee.
6. Conclusion
The energy balance simulation result shows that the electricity generation of PV
can meet the demands of two ZERB models in Shanghai and Madrid. Indoor
comfortable results show that the temperature comfort can be met for two models

under Shanghai and Madrid’s weather. But humidity comfort demand need more
customized energy concept’s design schemes for different weather, such as,
dehumidification device for Shanghai or humidification device for Madrid.
Calculation results shows that primary energy payback time of ZERB in Madrid is
10.1 years and CO2 equivalent saving is 74.4 ton during 50 years building lifetime.
Acknowledgment:
The authors would like to express their gratitude to the National Key Technologies
R&D Program (Project No. 2008BAF12B01), the Science and Technology
Commission of Shanghai Municipality (Project No.09160702300) for their financial
support and the Robert Bosch Foundation for their financial support within the
German-Chinese research cooperation. The work would not have been possible
without the very engaged project leadership of architectural faculty headed by Prof.
Jan Cremers and Sebastian Fiedler.
References
[1] P. Norton, C. Christensen. A cold-climate case study for affordable zero energy
homes. In: Proceedings of Solar Energy, 2006. p. 585-590.
[2] A. Biaou, M.Bernier, F.Yan. Simulation of zero net energy homes. <http://
perso.univ-lr.fr/fcherqui/IBPSAmars2006/12_MBernier.pdf> (Last access:
21/06/2010).
[3] J. Steinbock, D. Eijadi, T. McDougall, Net zero energy building case study:
science house, ASHRAE Transitions 2006; 113, 26-35.
[4] O. Siddiqui, A. Fung, H. Tse, D.H. Zhang, Modelling of the net zero energy town
house in Toronto using TRNSYS, and an analysis of the impact using thermal
mass. In: Proceedings of Energy Sustainability, 2008. p. 297-304.
[5] L.P. Wang, J. Gwilliam, P. Jones, Case study of zero energy house design in UK.
Energy and buildings 2009, l 41(11), 1215-1222.
[6] Y. Higuchi, M. Udagawa, M. Sato, Design and performance prediction of a zero
energy house. In: Conference of Renewable Energy, 2010. No. O-AT-2-5.
[7] S. Deng, R.Z. Wang, Y.J. Dai, X.Q.Zhai, J.R.Shen, Green Energy Building inside
the Campus of Shanghai Jiao Tong University. In: The 6th International
Symposium on Heating, Ventilating and Air Conditioning, 2009. p. 50-57.
[8] Website of the Stuttgart University of Applied Sciences contribution for the Solar
Decathlon Europe competition. <http://www.sdeurope.de> (Last access:
21/06/2010).
[9] Official website of the Solar Decathlon Europe competition. < http://
www.sdeurope.org> (Last access: 21/06/2010).
[10] Meteotest. Meteonorm. Version 6.0. < http://www.meteotest.ch>. (Last access:
21/06/2010).
[11] TRNSYS. A Transient System Simulation Program. Version 16. <
http://www.trnsys.com>. (Last access: 21/06/2010).
[12] J. Schumacher. Digitale Simulation regenerativer elektrischer
Energieversorgungssysteme, Dissertation, Universität Oldenburg, 1991.
[13] GEMIS, Global Emission Model for Integrated Systems. Version 5.5.
<http://www.gemis.de/en/index.htm>. (Last access: 21/06/2010).
[14] G. Wang, X, Feng. CO2 emission reduction through energy integration (in
Chinese), Chemical industry and engineering progress, China (Beijing), 2006.


Figures:
Fig.1 Concept design of building 1
Fig.2 Computer rendering of building 2
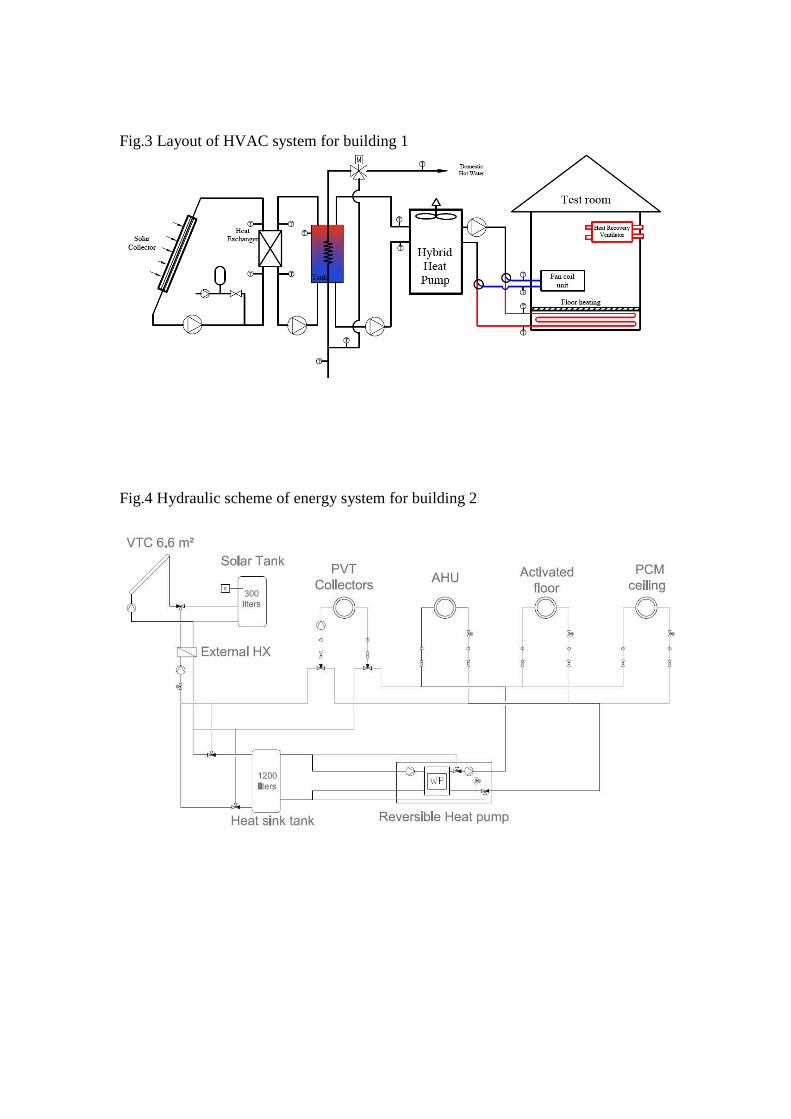
Fig.3 Layout of HVAC system for building 1
Fig.4 Hydraulic scheme of energy system for building 2

Fig.5 Mean ambient temperature and relative humidity comparison between Madrid and Shanghai
Fig.6 Global horizontal irradiation comparison between Madrid and Shanghai
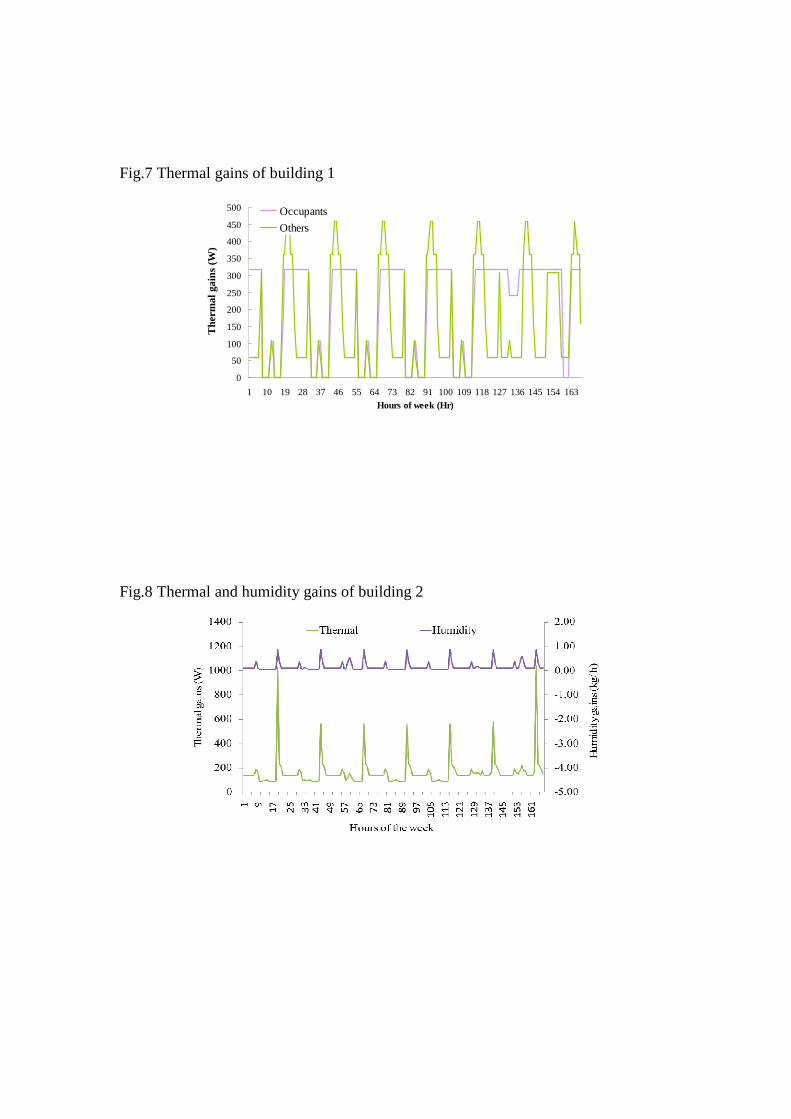
Fig.7 Thermal gains of building 1
0
50
100
150
200
250
300
350
400
450
500
1 10 19 28 37 46 55 64 73 82 91 100 109 118 127 136 145 154 163
Hours of week (Hr)
The
rmal
gai
ns (
W)
Occupants
Others
Fig.8 Thermal and humidity gains of building 2

Fig.9 Building 1 result (Shanghai)
Fig.10 Building 1 result (Madrid)

Fig.11 Building 2 result (Shanghai)
Fig.12 Building 2 result (Madrid)

Fig.13 Primary energy demand of building 2

Tables: Table 1: Passive design of two buildings
Building 1 (designed for Shanghai) Building 2 (designed for Madrid) Surface
[m²] U value [W/(m²K)]
G value [-]
Surface [m²]
U value [W/(m²K)]
G value [-]
Floor 93 0.30 - 56 0.1 - Fac. S 45.9 0.31 - 16.6 0.13 - Fac. N 45.9 0.31 - 16.6 0.13 - Fac. E 32.6 0.31 - 22.8 0.16 - Fac. W 32.6 0.31 - 22.8 0.16 - Roof 93 0.21 - 56 0.11 - Win. S 7.92 2.5 0.62 12.7 0.52 0.58 Win. N 10.32 2.5 0.62 12.7 0.4 0.4 Win. E 6.96 2.5 0.62 4.4 0.52 0.58 Win. W - - - 4.4 0.52 0.58 Win. R - - - 6.8 0.52 0.58 Feature two skins facade, slope overhead
PV roof, nature ventilation in interlayer and overhead space
module design, passive cooling, solar chimney, natural ventilation, night radiative cooling with PVT modules,
Table 2: Simulation results Building 1 Building 2 Shanghai Madrid Madrid Shanghai Heating load (kWh/m2a) 16.8 12.6 4.9 8.9 Cooling load (kWh/m2a) 53.0 42.3 38.9 41.9 DHW load (kWh/m2a) 41.0 43.1 30.3 29.8 Electricity consumption (kWh/m2a) 89.5 85.7 68.4 75.1 Electricity production (kWh/m2a) 94.1 119.6 203.8 152.0 Comfortable temperature fraction (%) 96.84 92.76 99.37 99.07 Comfortable zone fraction (%) 45.58 38.62 46.76 40.27

Table 3: Primary energy payback time for building 2 Location Madrid Shanghai PEF elec. mix (kWhpe/kWhend) 2.19 2.20 NPE (year) 10.1 17.9
Table 4: CO2 emissions equivalent savings for building 2
Location Madrid Shanghai GEMIS MOST
CO2 factor (kg/kWhel) 0.478 0.813 0.921
Total CO2eq emissions saving for different life time (kg)
40 years 54745 75563 78838 50 years 74430 109755 124335 60 years 93084 143946 163068 70 years 111738 178138 201802