anthropogenic and biogenic emissions, and their … · anthropogenic and biogenic emissions, and...
TRANSCRIPT
Anthropogenic and Biogenic Emissions, and their
Contributions to Summertime Haze in the Southeast U.S.:
Results from the NOAA SENEX Study in 2013
Joost de Gouw, Carsten Warneke, Michael Trainer,
and the SENEX Science Team
NOAA Earth System Research Laboratory &
CIRES, Univ. of Colorado at Boulder
• The NOAA SENEX mission in summer 2013
• Lessons learned so far about the interactions between
anthropogenic and biogenic emissions to form secondary
pollutants
• Other results: biomass burning, emissions from oil and gas
production, ethanol refining

Atmospheric Chemistry in the Southeast U.S.
• The Southeast has the highest biogenic VOC emissions in the U.S.,
and also high pollutant emissions, photochemistry and cloudiness
• How do anthropogenic and man-made emissions combine to form
secondary pollutants?
Smoky Mountains National Park
“Blue haze” [Went, Nature 1960]
Organic Carbon
IMPROVE V, 2011
OMI HCHO
Millet, JGR 2008
To what extent is haze in the
Southeast natural vs. caused by man-
made emissions?

SOA Formation from Natural and Man-Made Emissions
Nighttime oxidation of biogenic VOCs
(high NOx) e.g. Pye [ACP 2010]
Particle water as a reactive medium
controlled by sulfate e.g. Carlton [ACP
2013]
Isoprene organosulfates (low NOx,
acidic aerosol) e.g. Froyd [PNAS
2010]
High-NOx oxidation of isoprene to
form SOA e.g. Lin [PNAS 2013]
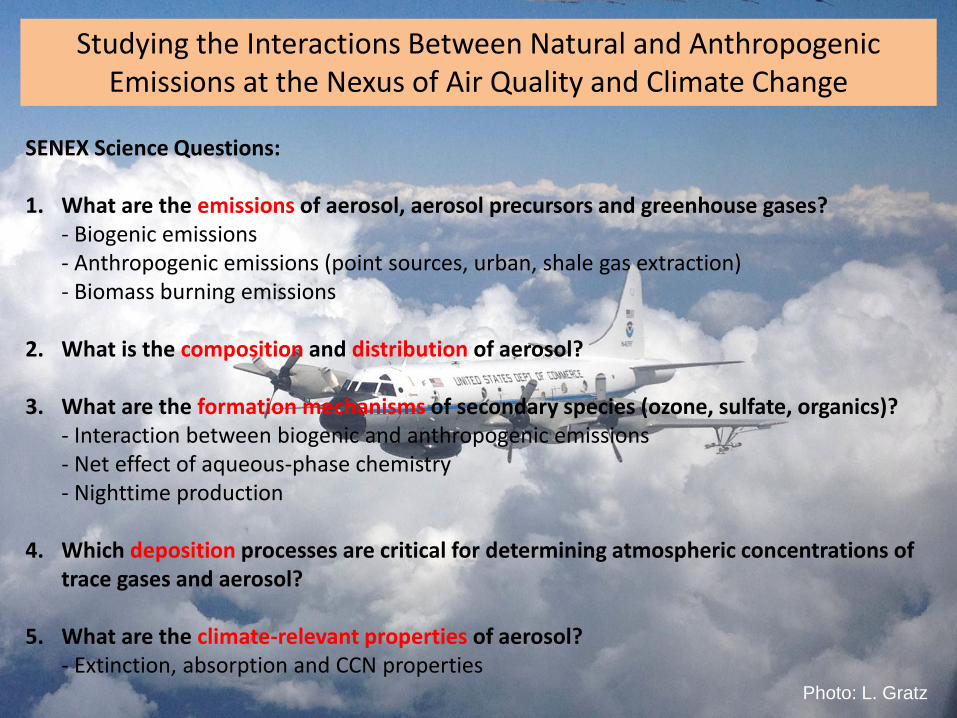
Studying the Interactions Between Natural and Anthropogenic Emissions at the Nexus of Air Quality and Climate Change
SENEX Science Questions:
1. What are the emissions of aerosol, aerosol precursors and greenhouse gases?- Biogenic emissions- Anthropogenic emissions (point sources, urban, shale gas extraction)- Biomass burning emissions
2. What is the composition and distribution of aerosol?
3. What are the formation mechanisms of secondary species (ozone, sulfate, organics)?- Interaction between biogenic and anthropogenic emissions- Net effect of aqueous-phase chemistry- Nighttime production
4. Which deposition processes are critical for determining atmospheric concentrations of trace gases and aerosol?
5. What are the climate-relevant properties of aerosol?- Extinction, absorption and CCN properties
Photo: L. Gratz
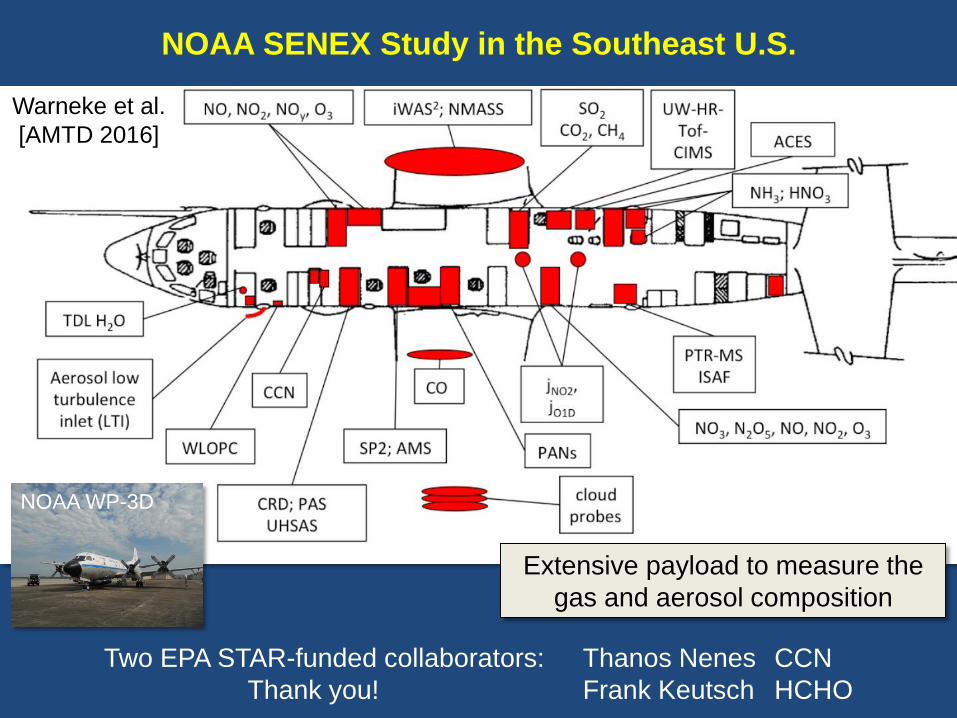
Extensive payload to measure the
gas and aerosol composition
NOAA SENEX Study in the Southeast U.S.
Warneke et al.
[AMTD 2016]
Two EPA STAR-funded collaborators: Thanos Nenes CCN
Thank you! Frank Keutsch HCHO
NOAA WP-3D
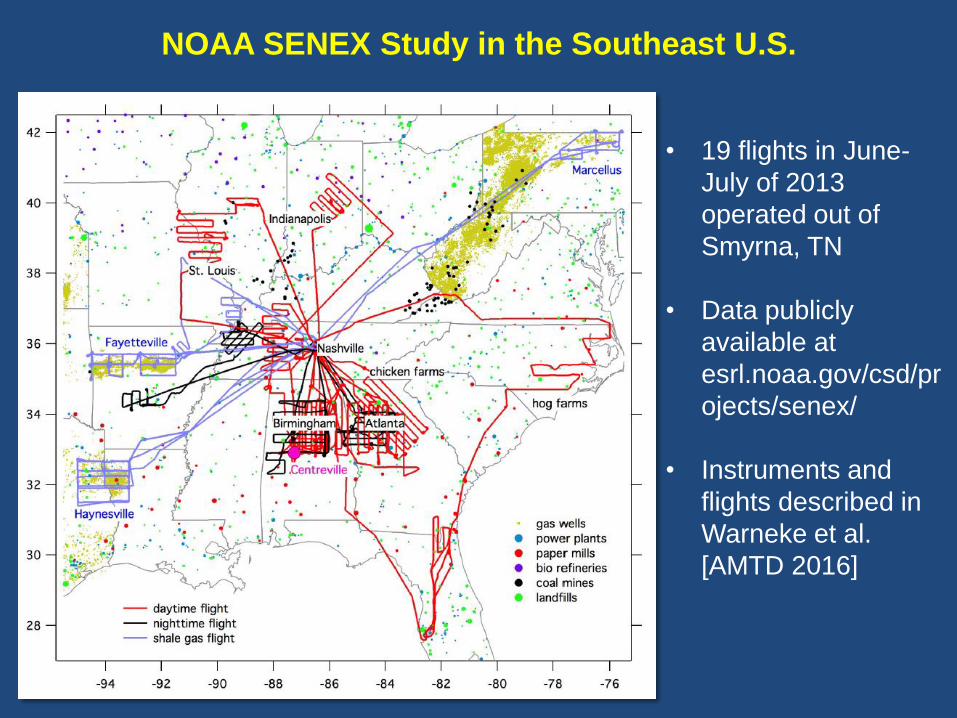
• 19 flights in June-
July of 2013
operated out of
Smyrna, TN
• Data publicly
available at
esrl.noaa.gov/csd/pr
ojects/senex/
• Instruments and
flights described in
Warneke et al.
[AMTD 2016]
NOAA SENEX Study in the Southeast U.S.
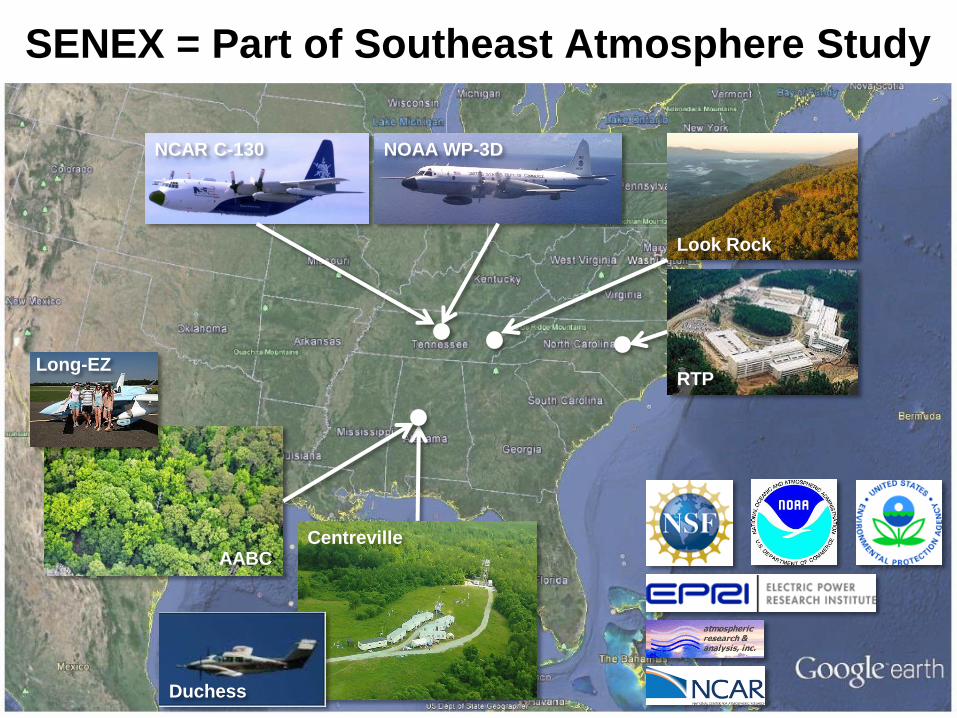
SENEX = Part of Southeast Atmosphere Study
NCAR C-130 NOAA WP-3D
AABCCentreville
RTP
Look Rock
Duchess
Long-EZ
Anthropogenic Influences on
Organic Aerosol Formation and
Regional Climate Implications
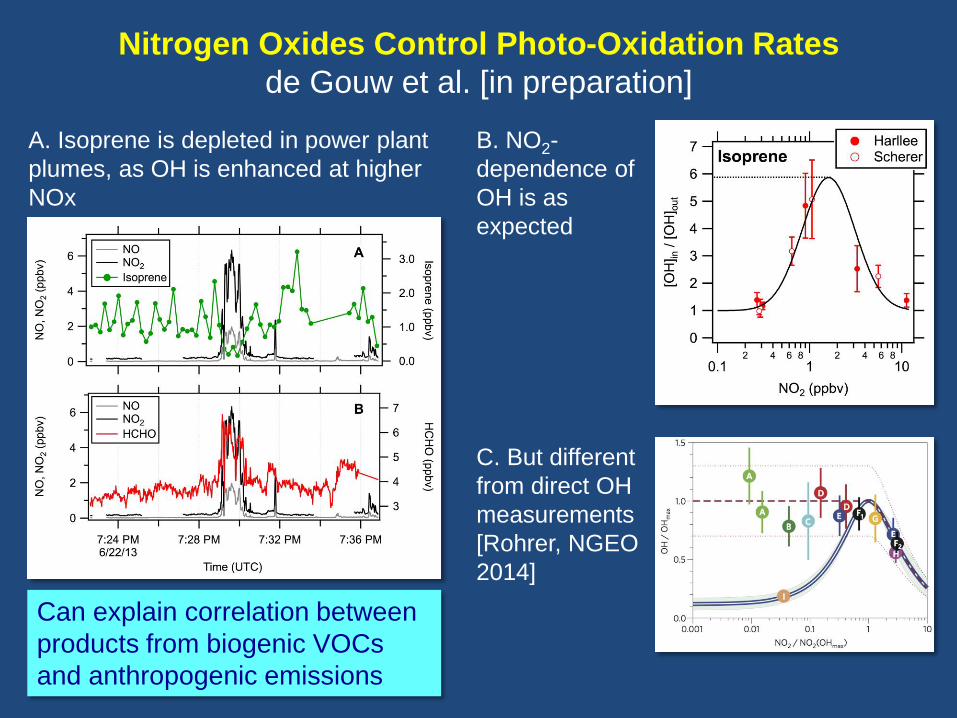
Nitrogen Oxides Control Photo-Oxidation Rates
de Gouw et al. [in preparation]
A. Isoprene is depleted in power plant
plumes, as OH is enhanced at higher
NOx
B. NO2-
dependence of
OH is as
expected
C. But different
from direct OH
measurements
[Rohrer, NGEO
2014]
Can explain correlation between
products from biogenic VOCs
and anthropogenic emissions
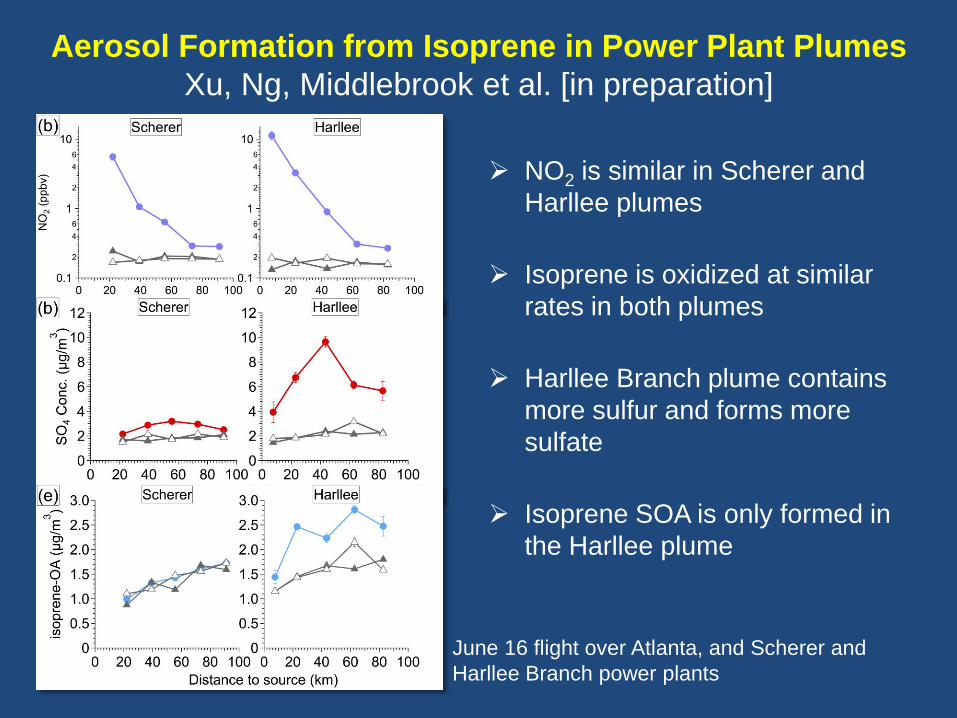
Aerosol Formation from Isoprene in Power Plant Plumes
Xu, Ng, Middlebrook et al. [in preparation]
NO2 is similar in Scherer and
Harllee plumes
Isoprene is oxidized at similar
rates in both plumes
Harllee Branch plume contains
more sulfur and forms more
sulfate
Isoprene SOA is only formed in
the Harllee plume
June 16 flight over Atlanta, and Scherer and
Harllee Branch power plants

Effects of Aqueous-Phase Chemistry
Wagner et al. [ACP 2015]
Particulate OA
• Total sulfur and other inert trace species (e.g. BC) in the transition layer
can be explained by mixing between mixed layer and free tropospheric air
• Sulfate is enhanced in the transition layer possibly due to cloud chemistry
• Enhancement of OA in the transition layer is not statistically significant
Norm
aliz
ed
Altitu
de
# P
rofile
s
SO2Sulfate Total sulfur
Free
Troposphere
Transition
Layer
Mixed
Layer
Norm
aliz
ed
Altitu
de
Free
Troposphere
Transition
Layer
Mixed
Layer

Biogenic VOC – Nitrate Chemistry
Edwards, Fry, Brown et al.
Three night flights to sample power plants,
urban plumes & biomass burning
Arkansas
July 3, 2013
Alabama
July 2, 2013
Atlanta
June 19, 2013
• NO3 mixing ratios were modest due to
presence of large biogenic VOC mixing
ratios in the nighttime residual layer
• Nighttime BVOC oxidation dominated
by NO3 rather than O3. Can we
distinguish the products?
Isoprene is high
when NO3 is low
and vice versa
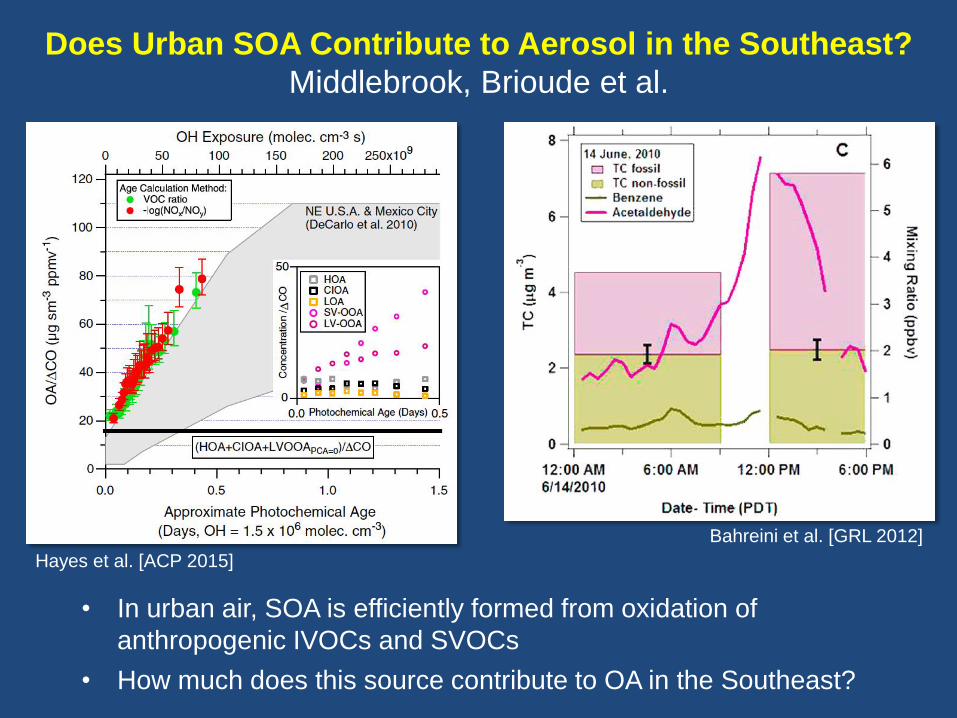
Does Urban SOA Contribute to Aerosol in the Southeast?
Middlebrook, Brioude et al.
Hayes et al. [ACP 2015]
• In urban air, SOA is efficiently formed from oxidation of
anthropogenic IVOCs and SVOCs
• How much does this source contribute to OA in the Southeast?
Bahreini et al. [GRL 2012]
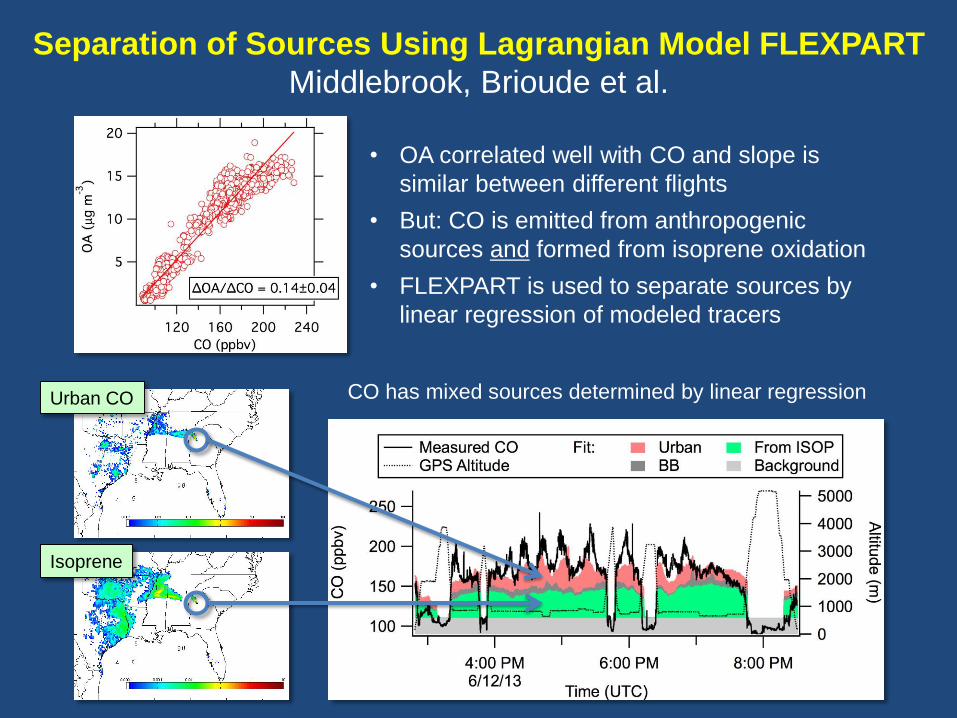
Separation of Sources Using Lagrangian Model FLEXPART
Middlebrook, Brioude et al.
Urban CO
Isoprene
CO has mixed sources determined by linear regression
• OA correlated well with CO and slope is
similar between different flights
• But: CO is emitted from anthropogenic
sources and formed from isoprene oxidation
• FLEXPART is used to separate sources by
linear regression of modeled tracers

Separation of Sources Using Lagrangian Model FLEXPART
Middlebrook, Brioude et al.
Urban CO
Isoprene
OA has mixed sources determined by linear regression
• OA correlated well with CO and slope is
similar between different flights
• But: CO is emitted from anthropogenic
sources and formed from isoprene oxidation
• FLEXPART is used to separate sources by
linear regression of modeled tracers

Other Results
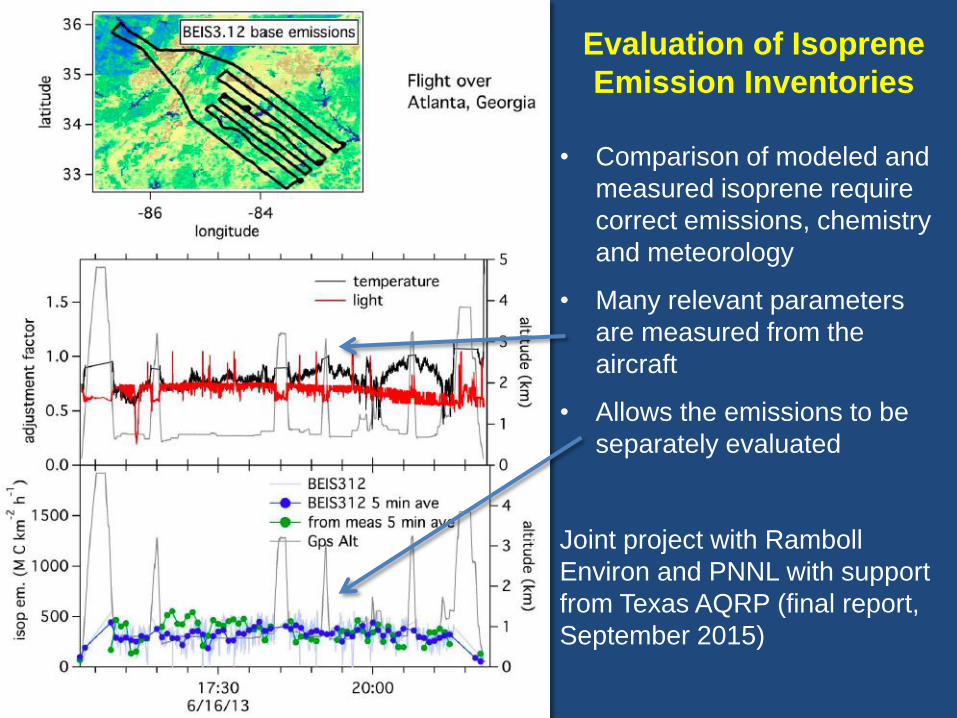
Evaluation of Isoprene
Emission Inventories
• Comparison of modeled and
measured isoprene require
correct emissions, chemistry
and meteorology
• Many relevant parameters
are measured from the
aircraft
• Allows the emissions to be
separately evaluated
Joint project with Ramboll
Environ and PNNL with support
from Texas AQRP (final report,
September 2015)
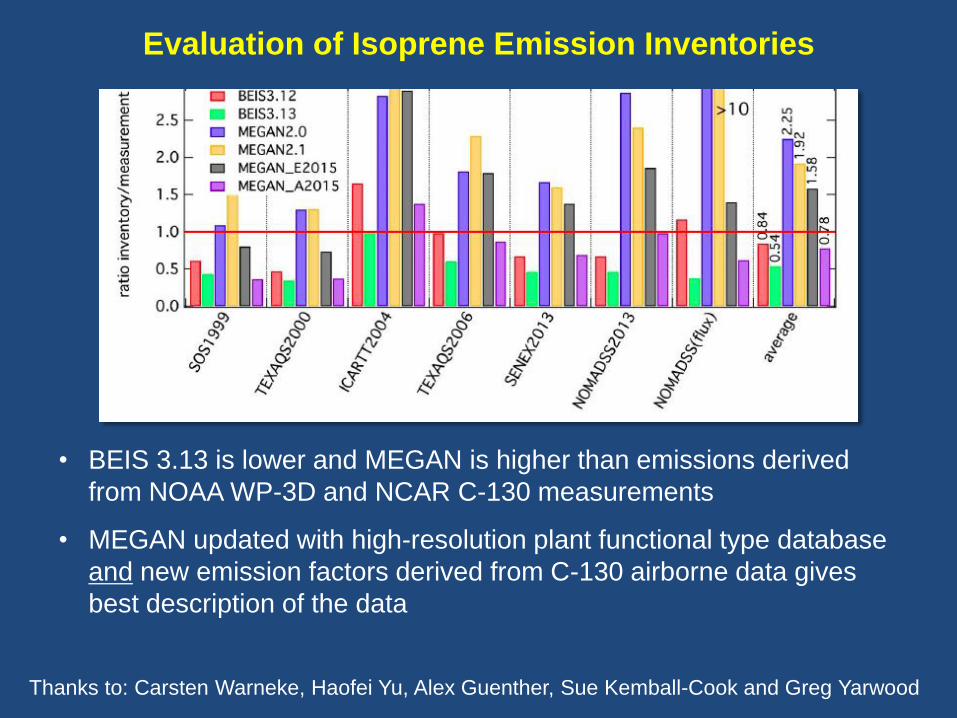
Evaluation of Isoprene Emission Inventories
• BEIS 3.13 is lower and MEGAN is higher than emissions derived
from NOAA WP-3D and NCAR C-130 measurements
• MEGAN updated with high-resolution plant functional type database
and new emission factors derived from C-130 airborne data gives
best description of the data
Thanks to: Carsten Warneke, Haofei Yu, Alex Guenther, Sue Kemball-Cook and Greg Yarwood
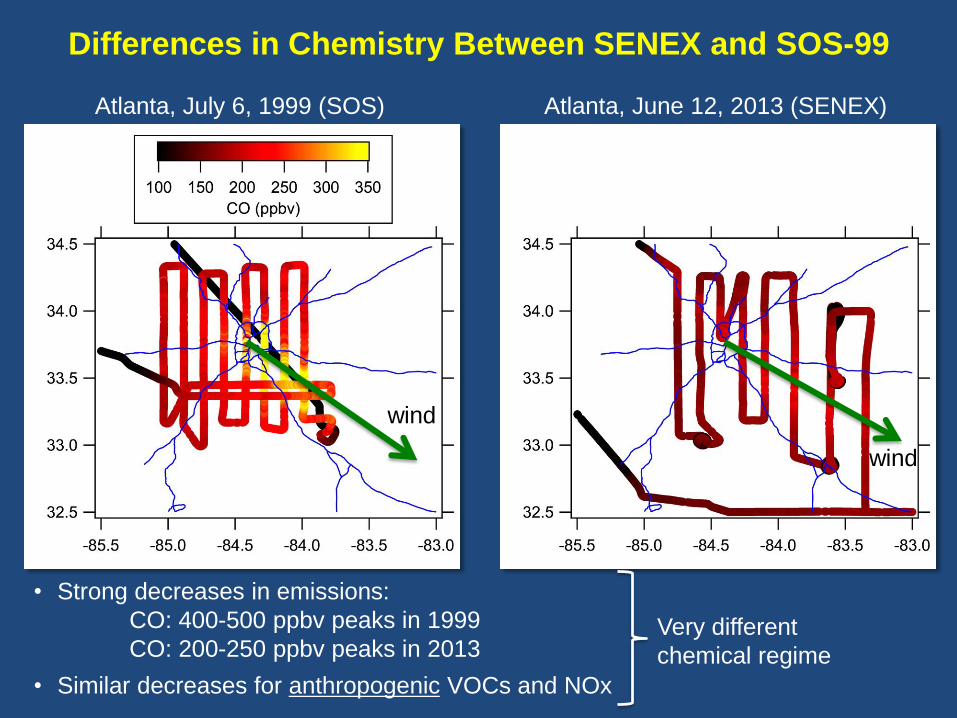
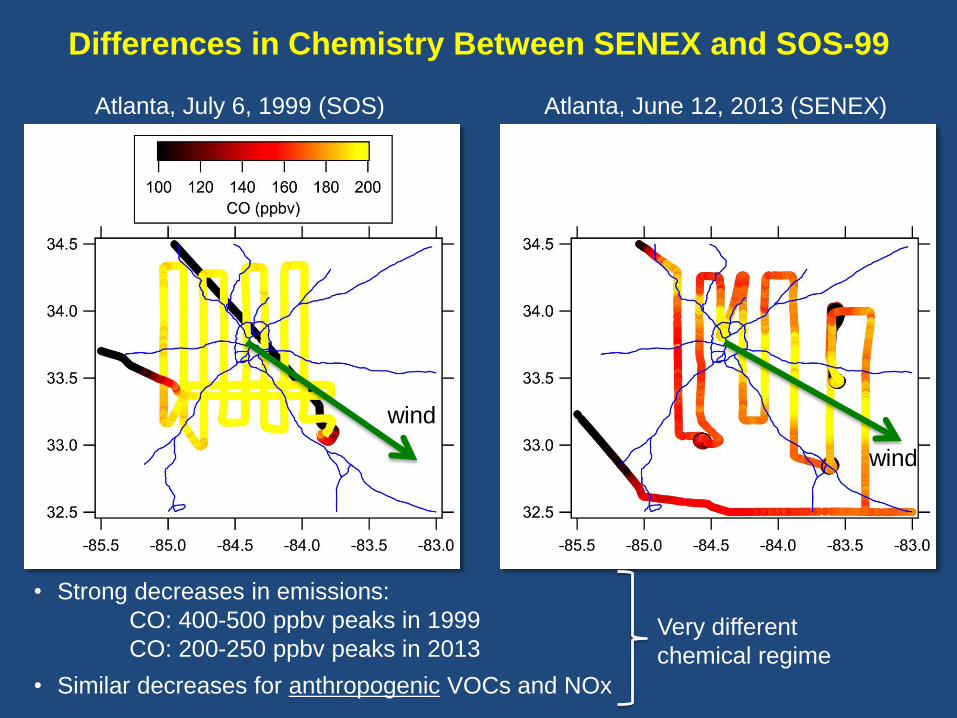
Atlanta, July 6, 1999 (SOS) Atlanta, June 12, 2013 (SENEX)
• Strong decreases in emissions:
CO: 400-500 ppbv peaks in 1999
CO: 200-250 ppbv peaks in 2013
• Similar decreases for anthropogenic VOCs and NOx
wind
wind
Differences in Chemistry Between SENEX and SOS-99
Very different
chemical regime
Atlanta, July 6, 1999 (SOS) Atlanta, June 12, 2013 (SENEX)
wind
wind
Differences in Chemistry Between SENEX and SOS-99
• Strong decreases in emissions:
CO: 400-500 ppbv peaks in 1999
CO: 200-250 ppbv peaks in 2013
• Similar decreases for anthropogenic VOCs and NOx
Very different
chemical regime
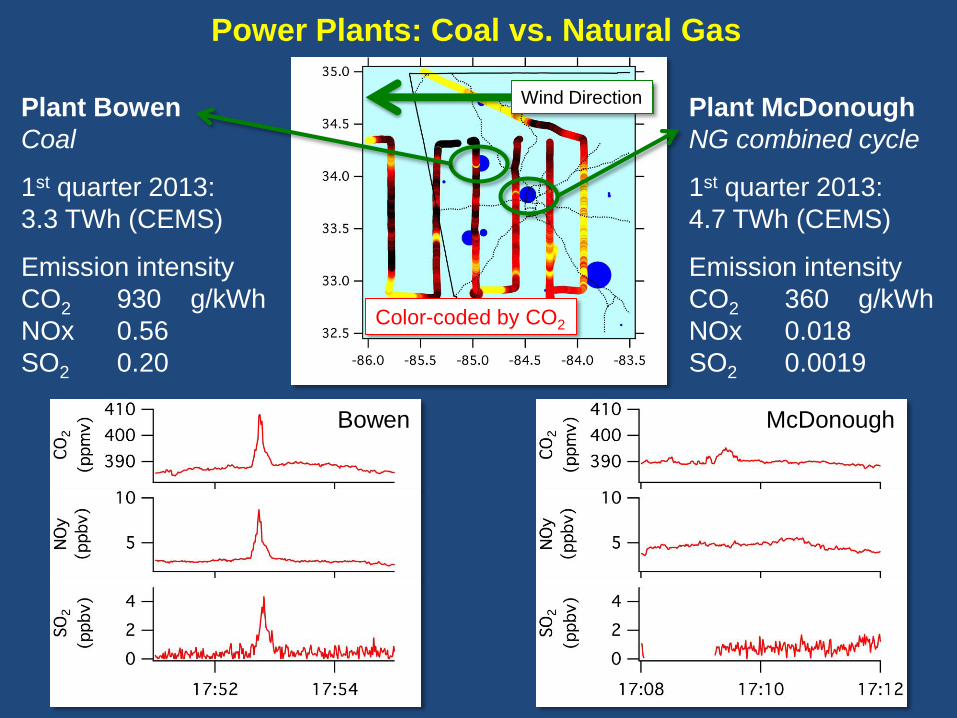
Plant Bowen
Coal
1st quarter 2013:
3.3 TWh (CEMS)
Emission intensity
CO2 930 g/kWh
NOx 0.56
SO2 0.20
Plant McDonough
NG combined cycle
1st quarter 2013:
4.7 TWh (CEMS)
Emission intensity
CO2 360 g/kWh
NOx 0.018
SO2 0.0019
Color-coded by CO2
Wind Direction
Power Plants: Coal vs. Natural Gas
Bowen McDonough
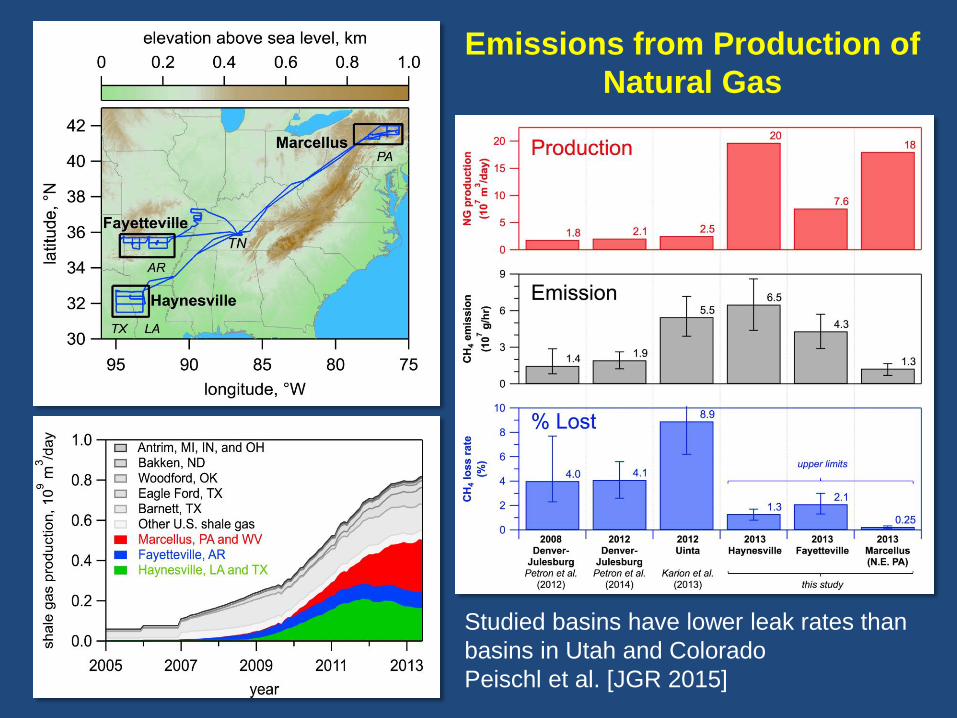
Emissions from Production of
Natural Gas
Studied basins have lower leak rates than
basins in Utah and Colorado
Peischl et al. [JGR 2015]
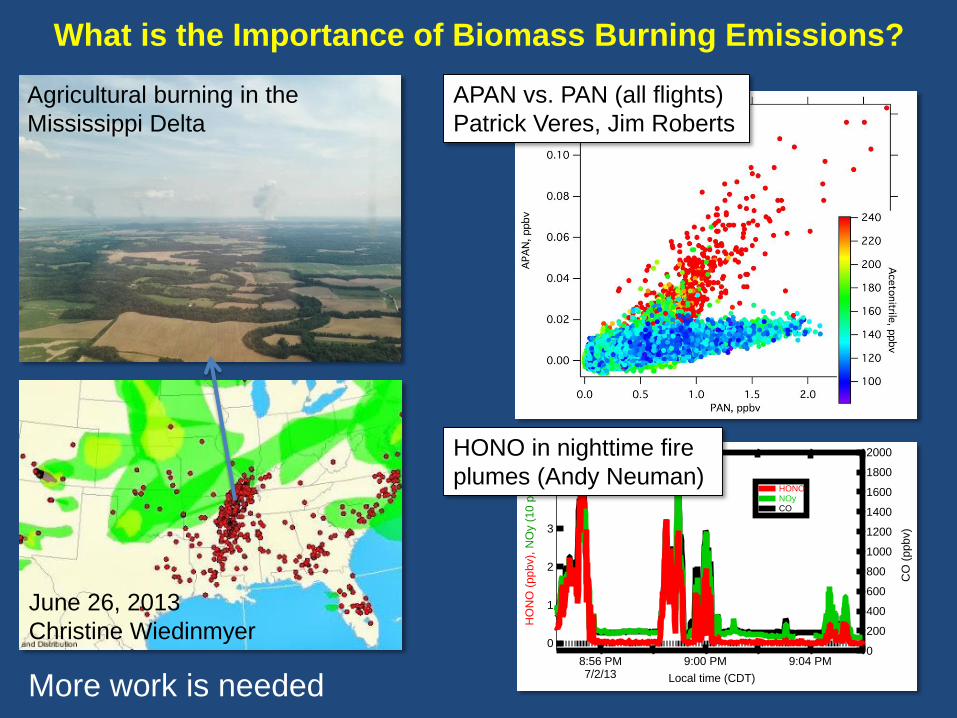
What is the Importance of Biomass Burning Emissions?
Agricultural burning in the
Mississippi Delta
June 26, 2013
Christine Wiedinmyer
APAN vs. PAN (all flights)
Patrick Veres, Jim Roberts
5
4
3
2
1
0
HO
NO
(p
pbv),
NO
y (
10
ppb
v)
8:56 PM7/2/13
9:00 PM 9:04 PM
Local time (CDT)
2000
1800
1600
1400
1200
1000
800
600
400
200
0
CO
(p
pb
v)
HONO NOy CO
HONO in nighttime fire
plumes (Andy Neuman)
More work is needed
Summary
• SENEX data constrain several mechanisms that couple the
emissions of biogenic and anthropogenic precursors to form
secondary pollutants
• More detailed analysis is in progress to quantify the relative
importance of these interactions, and determine the impact on air
quality and climate
Acknowledgements
Michael Trainer, Lu Xu, Sally Ng, Nick Wagner, Pete Edwards, Julie Fry, Steve Brown, Ann
Middlebrook, Jerome Brioude, Chuck Brock, Bin Yuan
PTR-MS Martin Graus, Carsten Warneke
iWAS Brian Lerner, Jessica Gilman, Megan Dumas, Alyssa Jaksich, Dagen Hughes,
Courtney Hatch
HCHO Jen Kaiser, Glenn Wolfe, Frank Keutsch, Tom Hanisco
AMS Ann Middlebrook, Jin Liao, Andre Welti
NO, NO2 Illana Pollack, Tom Ryerson
NO3 Peter Edwards, Steve Brown
HNO3, HONO Andy Neuman
PANs Patrick Veres, Jim Roberts
CO, SO2 John Holloway
CH4 Jeff Peischl
And colleagues from the NOAA Aircraft Operations Center