antarctic geodesy field report 2010/2011 · antarctic geodesy field report 2010/2011 ... antarctic...
TRANSCRIPT

Antarctic Geodesy Field Report 2010/2011Ryan Ruddick, Sam Griffiths and Nicholas Brown
Record 2012/59 | GeoCat 74374
APPLYING GEOSCIENCE TO AUSTRALIA’S MOST IMPORTANT CHALLENGES www.ga.gov.au


Antarctic Geodesy Field Report 2010/2011 GEOSCIENCE AUSTRALIA RECORD 2012/59 by Ryan Ruddick, Sam Griffiths and Nicholas Brown

Department of Resources, Energy and Tourism Minister for Resources and Energy: The Hon. Martin Ferguson, AM MP
ecretary: Mr Drew Clarke
hief Executive Officer: Dr Chris Pigram
his paper is published with the permission of the CEO, Geoscience Australia
S Geoscience Australia C T
© Commonwealth of Australia (Geoscience Australia) 2012
rial ns Attribution 3.0 Australia Licence
ttp://www.creativecommons.org/licenses/by/3.0/au/)
lete. Therefore, you hould not solely rely on this information when making a commercial decision.
SBN 978-1-922103-72-7 (PDF)
eoCat # 74374
dick, R., 2012. Antarctic Geodesy Field
With the exception of the Commonwealth Coat of Arms and where otherwise noted, all matein this publication is provided under a Creative Commo(h Geoscience Australia has tried to make the information in this product as accurate as possible. However, it does not guarantee that the information is totally accurate or comps ISSN 1448-2177 I G Bibliographic reference: Brown, N., Griffiths, S. and RudReport 2010/2011. Geoscience Australia, Record 2012/59.

Antarctic Geodesy Field Report 2010/2011
Contents
Acronyms..............................................................................................................................................1
Executive Summary..............................................................................................................................2
1. Introduction.......................................................................................................................................3 1.1 Project progress...........................................................................................................................3 1.2 Australian Antarctic Geodetic Network......................................................................................4
2. Australian Regional GNSS Network ................................................................................................5 2.1 ...........................................................................................................................6 Davis Station
2.1.1 Equipment Upgrade .............................................................................................................6 2.1.2 Local Monitoring Survey .....................................................................................................9
2.2 Mawson Station ........................................................................................................................11 2.2.1 Equipment Upgrade ...........................................................................................................11 2.2.2 Local Monitoring Survey ...................................................................................................13
2.3 Casey Station ............................................................................................................................15 2.3.1 Equipment Upgrade ...........................................................................................................15
2.4 Macquarie island.......................................................................................................................17 2.4.1 Equipment Upgrade ...........................................................................................................18 2.4.2 Local Monitoring Survey ...................................................................................................19
3. Tide Gauges ....................................................................................................................................22 3.1 Davis Station.............................................................................................................................24
3.1.1 Orthometric Levelling Results ...........................................................................................24 3.1.2 GPS Connection and Calibration .......................................................................................24
3.2 Mawson Station ........................................................................................................................28 3.2.1 Orthometric Levelling Results ...........................................................................................28 3.2.2 GPS Connection and Calibration .......................................................................................28
3.3 Larsemann Hills Tide Gauge ....................................................................................................32 3.4 Beaver Lake ..............................................................................................................................33 3.5 Macquarie island.......................................................................................................................34
4. Australian Antarctic Geodetic Network..........................................................................................37
5. Deep Field Campaign ....................................................................................................................45 5.1 Remote Site Design...................................................................................................................46
5.1.1 Structural System...............................................................................................................46 5.1.2 Power System.....................................................................................................................47
5.2 Wilson Bluff .............................................................................................................................48 5.2.1 Site Assessment .................................................................................................................48 5.2.2 Local Monitoring Survey ...................................................................................................50
5.3 Grove Mountains ......................................................................................................................51 5.3.1 Site Assessment .................................................................................................................51 5.3.2 Local Monitoring Survey ...................................................................................................53
5.4 Bunger Hills ..............................................................................................................................54 5.4.1 Site Assessment .................................................................................................................54 5.4.2 Local Monitoring Survey ...................................................................................................56
5.5 Mt Creswell...............................................................................................................................57 5.5.1 Site Assessment .................................................................................................................57
6. Lake Levelling ................................................................................................................................59
iii

Antarctic Geodesy Field Report 2010/2011
iv
7. Australian Antarctic Division Projects ...........................................................................................62 7.1 Davis Station.............................................................................................................................62
7.1.1 Detail and Engineering Surveys.........................................................................................62 7.1.2 ‘Pineapple’ Foundations ....................................................................................................65 7.1.3 Water Tank Holding Area..................................................................................................65 7.1.4 Wharf and Boat Ramp .......................................................................................................66 7.1.5 Pumphouse Extension and Foundations.............................................................................66 7.1.6 New Living Quarters..........................................................................................................66 7.1.7 Workshop Extension..........................................................................................................67 7.1.8 New Field Store .................................................................................................................67
7.2 Mawson Station ........................................................................................................................68 7.3 Support to other Programs ........................................................................................................70
8. Recommendations...........................................................................................................................71 8.1 Modernisation ...........................................................................................................................71 8.2 Network Densification ..............................................................................................................71 8.3 Network Processing ..................................................................................................................71
References...........................................................................................................................................72

Antarctic Geodesy Field Report 2010/2011
Acronyms AAD – Australian Antarctic Division AAGN – Australian Antarctic Geodetic Network AAT – Australian Antarctic Territory AGSO – Australian Geological Survey Organisation ANARE – Australian National Antarctic Research Expeditions ANU – Australian National University AOA – Allen Osborne Associates APREF – Asia-Pacific Reference Frame ARGN – Australian Regional GNSS Network CHINARE – Chinese National Antarctic Expedition CONGO – Cooperative Network for GIOVE Observation CORS – Continuously Operating Reference Station DMT – Dorne Margolin Type EDM – Electronic Distance Measurement GA – Geoscience Australia GIANT –Geodetic Infrastructure for Antarctica GIOVE – Galileo In-Orbit Validation Element GNSS – Global Navigation Satellite System GPS – Global Positioning System IGS – International GNSS Service ITRF – International Terrestrial Reference Frame MSL – Mean Sea Level MQZ – Magnetic Quiet Zone NGRS – National Geospatial Reference Systems (Section of Geoscience Australia) NTC – National Tidal Centre PCMEGA – Prince Charles Mountains Expedition of Germany and Australia RM – Reference Mark SCAR – Scientific Committee on Antarctic Research TGBM – Tide Gauge Bench Mark UTAS – University of Tasmania
1

Antarctic Geodesy Field Report 2010/2011
2
Executive Summary Geoscience Australia’s (GA) involvement in Antarctica has primarily been focused on the maintenance and enhancement of geodetic infrastructure within the Australian Antarctic Territory (AAT). Such infrastructure provides a fundamental reference frame for the region and supports earth monitoring science applications on local, regional and continental scales. These foundations have furthered the development of geodesy throughout the continent and provided information on the contemporary motion of the Antarctic plate for comparison with long-term geological records. Primary Antarctic geodetic control also contributes to a greater understanding of global earth movement through contribution to the International Terrestrial Reference Frame (ITRF) solutions. This report focuses on the field work undertaken during the 2010/11 Antarctic summer by Geoscience Australia surveyors at the Davis, Mawson and Macquarie Island research stations, as well as several remote sites in Eastern Antarctica. At each of the research stations, upgrades and local monitoring surveys were performed at the Continuously Operating Reference Stations (CORS), which form part of the Australian Regional Global Navigation Satellite Systems Network (ARGN) and also contribute to the International GNSS Service (IGS). Remote Global Positioning Systems (GPS) sites in the Grove Mountains, Bunger Hills, Wilson Bluff and Mt Creswell were also visited for equipment upgrades and data retrieval. Additional surveys were undertaken directed at enhancing the spatial infrastructure around both the Larsemann and Vestfold Hills. Support was also provided to a number of different Australian Antarctic Division (AAD) projects.

Antarctic Geodesy Field Report 2010/2011
1. Introduction Geoscience Australia’s (GA) Antarctic geodesy program primarily aims to maintain and enhance the geodetic infrastructure of the AAT and through international collaboration develop geodetic infrastructure across the entire Antarctic continent. The program also aims to provide information on the contemporary motion of the Antarctic continent for comparison with the long-term geological records, with special emphasis on the Australia-Antarctic separation and movement of the Macquarie Ridge and mid ocean-ridge. These aims are achieved through the operation of continuous Global Navigation Satellite System (GNSS) sites at each of the four main Australian research stations and at strategically placed rock outcrops throughout the territory, and also through the extension and maintenance of a comprehensive geodetic control network. Such infrastructure is combined with that of other international polar communities to help source a common geospatial reference frame, which is largely achieved through the continual calculation and realisation of the International Terrestrial Reference Frame (ITRF) and adoption of its 2000 realisation. Integration of the project amongst the wider polar community is achieved through GA’s association within the Scientific Committee on Antarctic Research (SCAR) and more specifically the Geodetic Infrastructure for Antarctica program (GIANT). This association has provided the existing Antarctic Geodetic program with a great opportunity to be incorporated as a platform for many scientific applications on both a national and international scale. The further scientific continuation of geodetic programs, including both the densification of control networks and an improvement in analysis capabilities, will be used to provide greater understanding of the Antarctic both regionally and as part of a global system. Geodetic techniques in both measurement and analysis within Antarctica are continually aiding the broader research community and the inclusion of improved geodetic control within the ITRF is aiding in further refining this product. 1.1 PROJECT PROGRESS Over the course of GA’s involvement within the Antarctic and Sub-Antarctic there have been a number of critical achievements. The establishment of four Continuously Operating GNSS Stations (Casey, Mawson, Davis and Macquarie) are fundamental to a number of applications, including the continual refinement of the ITRF and their contribution to the Australian Regional GNSS network (ARGN) http://www.ga.gov.au/earth-monitoring/geodesy/gnss-networks.html. The maintenance and operation of these stations still remains highest priority within the scope of the core Geodesy program. In addition to these four fundamental sites, remote continuous GNSS installations are also managed in the Grove Mountains, Bunger Hills and within the Prince Charles Mountains at Mt Creswell and Wilson Bluff. The data collected at these sites not only densifies the geodetic network in Antarctica but also supports geodynamic research into plate motion as well as the response of the Earth’s crust to ice loading or unloading. Combined with GNSS reference stations established via the greater polar community, these sites help to meet earth-monitoring objectives throughout the greater continent (via velocity fields) and contribute to the densification of a precise reference frame for both Earth and Antarctica. In order to maintain this GNSS network bi-annual visits are generally made to upgrade equipment and retrieve data. Whilst the acquisition and analysis of continuous GNSS sites is of fundamental priority, the collation, processing and adjustment of a wider array of geodetic infrastructure also remains an objective of the program. Over the course of GA’s involvement with the Antarctic program over
3

Antarctic Geodesy Field Report 2010/2011
4
460 marks have been established and re-established using a combination of measurement techniques including traditional terrestrial, Doppler and GNSS combinations. The resultant Australian Antarctic Geodetic Network (AAGN) consists of adjusted coordinates, relevant to the latest ITRF solution. The AAGN database is maintained by GA and made available through both National Geospatial Reference System (NGRS) Section and AAD data centre. 1.2 AUSTRALIAN ANTARCTIC GEODETIC NETWORK Within the scope of the GIANT program (http://www.scar.org/researchgroups/geoscience/giant/) an aim has been adopted to develop a unified datum for the greater Antarctic region. Within the AAT, ITRF positions have been adopted for the permanent Global Positioning System (GPS) tracking stations at Casey, Davis, Macquarie Island and Mawson and used with the GRS80 ellipsoid to define an Australian Antarctic Geodetic Datum. This provides a single, accurate, globally compatible datum for the AAT. The datum process is continually being realised across the continent with the collation of geodetic infrastructure from other nations. Whilst no official datum has ever been realised upon Antarctica, the coverage of geodetic infrastructure across the polar communities has allowed for a common geospatial reference to be adopted, usually by coordinating to the latest ITRF solution. To avoid a plethora of individual national datum’s being used across Antarctica (although they may be based on ITRF) and to avoid the confusion of a dynamic system of datum’s, it has been proposed to standardise on the use of ITRF2000 (at an epoch of 2000.0) as an Antarctic datum. Each permanent base station defined in ITRF2000 will also have computed velocities so that observations taken at different epochs in the future can be translated back into the Antarctic 2000 datum. At this stage this concept is still being adopted by GIANT participants; however a review maybe adopted in the immediate future to switch to a more current ITRF solution. The Australian Geodetic network currently consists of a series of survey marks placed on solid rock outcrops throughout the AAT. The majority of these marks were established using terrestrial-surveying techniques from the 1960’s onwards. Over the last 20 years GPS has been used where possible to strengthen the network since GPS (and indeed GNSS in a greater capacity) can be used over much longer distance with far greater accuracy, without the need for inter-visibility. Currently, the absolute accuracies of most remote survey marks within the AAGN, relative to the ITRF2000, are in the order of decimeters to metres. This is due to the methods and limitations of traditional terrestrial surveying employed from the 1960’s. Since the mid 1990’s the accuracies of these marks are gradually being improved to the centimeter and sub-centimetre level using geodetic quality GNSS observations (Brolsma and Corvino 2007, updated 2008). The network is now comprised of 462 stations that have been observed (and re-observed) via techniques including Transit Doppler, Terrestrial Surveying and GNSS survey campaigns. The resulting network has been rigorously adjusted through custom geodetic survey adjustment, adopting fixed ITRF 2000 coordinates from 7 continuously operating IGS stations. Raw campaign GNSS data can also be found within the internal GA directory N:\geodesy_data\gnss\data\campaign\antarctica.

Antarctic Geodesy Field Report 2010/2011
2. Australian Regional GNSS Network Geoscience Australia operates four CORS in the AAT at each of the primary research stations as shown in Figure 2.1. These sites are part of the ARGN and provide important contributions to both the Asia-Pacific Reference Frame (APREF) and the IGS. During the 2010/11 summer upgrades were made to the equipment at all of the sites and local monitoring surveys were undertaken at Davis, Mawson and Macquarie Island (Table 2.1). The local monitoring surveys were undertaken to support the distinction between localised site deformation and large-scale tectonic movement. Table 2.1: Australian operated permanent GNSS installations.
SITE RECIEVER TYPE ANTENNA TYPE DOME NUMBER
AUS099 (Davis) LEICA GRX1200GGPRO
LEIAR25 66010M001
AUS100 (Casey) LEICA GRX1200GGPRO
AOAD/M_T 66011M001
AUS64 (Mawson) LEICA GRX1200GGPRO
AOAD/M_T 66004M001
Figures 2.1: Location map of the four CORS sites operated by GA (red triangles) and the other IGS sites located in the Antarctic and sub-Antarctic regions (white triangles).
5

Antarctic Geodesy Field Report 2010/2011
2.1 DAVIS STATION The CORS at Davis (DAV1) was installed in 1992 on the control mark AUS099 and forms part of the AAGN and IGS. The antenna is located in the magnetic quiet zone behind the atmospheric and space physics building, where the receiver is housed. The control mark has three reference marks located nearby that are used for routine local monitoring surveys (Figure 2.2).
North
Figure 2.2: Site diagram of the Davis CORS setup. 2.1.1 Equipment Upgrade The equipment upgrades at Davis were undertaken in two steps the first on 1 December 2010, where the power system was upgraded and a Leica GRX1200+GNSS receiver installed as the secondary receiver to contribute to the Cooperative Network for GIOVE Observation (CONGO) under the site name DAVE. The second upgrade was undertaken on 21 February 2011, where the ASH701945G_M antenna was replaced with a broader-spectrum LEIAR25.R3 antenna. This final change was made at the request of the CONGO project to allow complete tracking of the Galileo In-Orbit Validation Element (GIOVE) satellites.
6

Antarctic Geodesy Field Report 2010/2011
The setup at Davis now consists of two GNSS receivers, a Leica GRX1200GG Pro (Primary – DAV1) and a Leica GRX1200+GNSS (Spare – DAVE). Both receivers are connected to the antenna via a 12 volt 4 port powered antenna splitter and ~85 m of LMR400 cable. The antenna is a Leica AR25.R3 covered by a LEIT style radome (Figure 2.3). Two 12 volt 78 amp hour GelTech batteries provide power to the equipment via a custom designed 4 switch power distribution box. The batteries are charged by a 12V charger connected to mains power. A PC running the standard ARGN Fedora 6 build and operating off mains power is also present to interface with the receivers if required. A True Time external frequency is connected to both receivers at 10 MHz. A Paroscientifc Met-4 AWS is connected to the primary receiver (Figure 2.5). Both the external frequency and AWS are powered via the power distribution box, with the external frequency having a 12-24 V DC_DC convertor. A spare antenna (ASH701945G_M) and radome (AUST) are situated on top of the rack.
7

Antarctic Geodesy Field Report 2010/2011
a) b)
c) d)
e) f)
Figure 2.3: a) the Davis CORS antenna facing north, b) east, c) south, d) west, e) the equipment rack and f) meteorological station.
8

Antarctic Geodesy Field Report 2010/2011
2.1.2 Local Monitoring Survey A local monitoring survey was conducted at the Davis ARGN on 21 November 2010 in nil-wind conditions. The survey was performed using the indirect method with observations made between AUS099 (DAV1) and the three already established reference marks. Five sets of observations were completed at each reference mark, using a Leica TCA2003 total station and Leica precision prism sets. A set consists of a round of face left observations, followed by a reverse round of face right observations to each of the visible survey marks. For each observation a horizontal direction, zenith angle and slope distance was recorded. At each instrument set-up atmospheric conditions (temperature, pressure, and relative humidity) were recorded. Atmospheric corrections were applied during the post-processing stage and not directly into the instrument. Instrument and target heights were measured using either an offset tape or steel rule. Survey tripods were centred and levelled using a zenith-nadir optical plummet. Height differences between the reference marks were obtained from a precise level survey (see section 3.0). Table 2.2: Comparison of orthometric height differences between the main pillar (AUS099) and the reference marks from 1996 to 2011. All units are metres.
AUS099 TO … 1996 2001 2005 2007 2009 2011
AUS099-RM1 -2.3270 -2.3271 -2.3266 -2.3265 -2.3269 -2.3272
AUS099-RM2 -0.4440 -0.4440 -0.4435 -0.4437 -0.4440 -0.4445
AUS099-RM3 -0.9480 -0.9485 -0.9474 -0.9473 -0.9477 -0.9484
The survey observations were adjusted using a classical least squares approach in SNAP (Land Information New Zealand). Observation precisions were specified based on previous experience with the instrumentation and survey techniques. A vertical angle and horizontal angle precision of 1 second and a slope distance precision of 1 mm + 1 ppm were applied. The network was fixed using the known [email protected] coordinates of AUS099 and aligned using the azimuth from AUS099 to AUS099-RM1 (Johnston and Digney 2001). The comparison of the orthometric height differences are in Table 2.2. The final geodetic and Cartesian coordinates are shown in Table 2.3 and 2.4 respectively. The survey adjusted well and shows very good agreement between the previous monitoring surveys (Table 2.5). Horizontal and height differences all agree at the 1 mm level. It has previously been reported that there may be some longitudinal movement of AUS099-RM3 (Ruddick and Woods, 2009); this survey shows no evidence of movement. In conclusion there does not appear to be any significant horizontal or vertical local deformation at the site. Table 2.3: Final geodetic coordinates from the 2010 Davis local monitoring survey. GRS80 ellipsoid aligned to ITRF2000 at 1 January 2000. Heights are based on the Davis MSL 1983. Final estimates of precision are shown as 1σ in mm.
SITE LATITUDE σ LONGITUDE σ HEIGHT (M) σ
AUS099 (DAV1) -68 34 38.3620 F 77 58 21.4090 F 44.4159 F
AUS099-RM1 -68 34 36.9441 0.2 77 58 21.6999 0.0 42.0887 0.1
AUS099-RM2 -68 34 38.6974 0.1 77 58 22.2745 0.1 43.9714 0.1
AUS099-RM3 -68 34 38.6337 0.1 77 58 21.1721 0.2 43.4675 0.1
9

Antarctic Geodesy Field Report 2010/2011
Table 2.4: Final Cartesian coordinates from the 2010 Davis local monitoring survey. GRS80 ellipsoid aligned to ITRF2000 at 1 January 2000. Final estimates of precision are shown as 1σ in mm.
SITE X σ Y σ Z σ
AUS099 (DAV1) 486854.5496 F 2285099.2912 F -5914955.7010 F AUS099-RM1 486859.6716 0.2 2285139.1463 0.0 -5914937.4882 0.1 AUS099-RM2 486842.9120 0.1 2285091.7147 0.1 -5914959.0824 0.1 AUS099-RM3 486855.4685 0.1 2285090.7278 0.2 -5914957.8932 0.1
Table 2.5: Comparison between the previous Davis local monitoring surveys.
YEAR AUS099 TO … Δ EAST Δ NORTH Δ UP RANGE
2001 AUS099-RM1 3.2954 43.9333 -2.3267 44.1181
2007 AUS099-RM1 3.2954 43.9331 -2.3266 44.1179
2009 AUS099-RM1 3.2954 43.9320 -2.3270 44.1168
2010 AUS099-RM1 3.2954 43.9328 -2.3273 44.1176
Std Dev 0.0000 0.0006 0.0003 0.0006
2001 AUS099-RM2 9.8021 -10.3904 -0.4442 14.2912
2007 AUS099-RM2 9.8020 -10.3916 -0.4437 14.2920
2009 AUS099-RM2 9.8019 -10.3910 -0.4441 14.2915
2010 AUS099-RM2 9.8033 -10.3908 -0.4445 14.2923
Std Dev 0.0007 0.0005 0.0003 0.0005
2001 AUS099-RM3 -2.6849 -8.4194 -0.9476 8.8878
2007 AUS099-RM3 -2.6841 -8.4211 -0.9473 8.8891
2009 AUS099-RM3 -2.6833 -8.4201 -0.9477 8.8880
2010 AUS099-RM3 -2.6832 -8.4192 -0.9484 8.8872
Std Dev 0.0008 0.0009 0.0005 0.0008
10

Antarctic Geodesy Field Report 2010/2011
2.2 MAWSON STATION The CORS at Mawson (MAW1) was installed in 1992 on the control mark AUS064 and forms part of the AAGN and IGS. The antenna is located on a rock outcrop in the magnetic quiet zone behind the cosray building, where the receiver is housed. The control mark has three reference marks located nearby that are used for routine local monitoring surveys (Figure 2.4).
North
Figure 2.4: Site diagram of the Mawson CORS setup. 2.2.1 Equipment Upgrade The equipment upgrade at Mawson was undertaken on 9 December 2010, where the power system was upgraded. This included the installation of new 12 v batteries and a custom designed 4 port power distribution box. During the upgrade there was a short data outage experienced. The setup at Mawson now consists of two GNSS receivers, a Leica GRX1200GG Pro (Primary) and an Ashtech UZ-12 (Spare). Both receivers are connected to the antenna via a 12 volt 4 port powered antenna splitter. The antenna is AOAD/M_T covered by an AUST style radome mounted on a large aluminium ground plane (Figure 2.5). Two 12 volt 78 amp hour GelTech batteries provide power to the equipment via a custom designed 4 switch power distribution box. The batteries are charged by a 12V charger connected to mains power. A PC running the standard ARGN Fedora 6 build and operating off mains power is also present to interface with the receivers if required. The Ashtech UZ-12 is connected to the PC via a serial cable mounted on /dev/ttyS0. A spare antenna (ASH701945G_M S/N. CR5200348019) and radome (SCIS) are situated on top of the rack.
11

Antarctic Geodesy Field Report 2010/2011
a)
c) c)
b)
c) d)
b)
e) f)
Figure 2.5: a) The Mawson CORS antenna facing north, b) east, c) south, d) west, e) the equipment rack and f) cosray building where the equipment is housed.
12

Antarctic Geodesy Field Report 2010/2011
2.2.2 Local Monitoring Survey A local monitoring survey was conducted at the Mawson ARGN site on 7 December 2010 in light-wind conditions. The survey was performed using the ‘direct’ method with observations made between AUS064 (MAW1) and three already established reference marks. The ‘direct’ method requires the antenna to be removed, prior to this the orientation of the antenna was marked and the number of shims recorded. Five sets of observations were completed at each reference mark, using a Leica TCA2003 total station. A set consists of a round of face left observations, followed by a reverse round of face right observations to each of the visible survey marks. For each observation a horizontal direction, zenith angle and slope distance was recorded. At each instrument set-up atmospheric conditions (temperature, pressure, and relative humidity) were recorded. Atmospheric corrections were applied during the post-processing stage and not directly into the instrument. Instrument and target heights were measured using either an offset tape or steel rule. Survey tripods were centred and levelled using a zenith-nadir optical plummet. Height differences between the reference marks were obtained from a precise level survey (see section 3.2). Table 2.6: Comparison of orthometric height differences between the main pillar (AUS099) and the reference marks from 1996 to 2011. All units are metres.
AUS064 TO … 1997 2001 2007 2011
AUS064-RM1 2.3650 2.3666 2.3655 2.3657
AUS064-RM2 0.4890 0.4901 0.4894 0.4899
AUS064-RM3 3.4540 3.4553 3.4544 3.4545
The survey observations were adjusted using a classical least squares approach in SNAP (LINZ). Observation precisions were specified based on previous experience with the instrumentation and survey techniques. A vertical angle and horizontal angle precision of 1 second and a slope distance precision of 1 mm + 1 ppm were applied. The network was fixed using the known [email protected] coordinates of AUS064 and aligned using the azimuth from AUS064 to AUS064-RM3 (Johnston and Digney 2001). The comparison of the orthometric height differences are shown in Table 2.6. Table 2.7 and Table 2.8 list the final geodetic and Cartesian coordinates respectively. The survey adjusted well and shows good agreement between the previous monitoring surveys (Table 2.9). Horizontal and height differences all agree at the 1 mm level. It appears that there may be some minor westerly movement of AUS064-RM1, this should be observed in the future but at the moment is of no cause for concern. It should also be noted that the survey techniques used in the survey prior to 2001 were not of the same precision as those in current use. Table 2.7: Final geodetic coordinates from the 2010 Mawson local monitoring survey. GRS80 ellipsoid aligned to ITRF2000 at 1 January 2000. Heights are based on the Mawson MSL 1951. Final estimates of precision are shown as 1σ in mm.
SITE LATITUDE σ LONGITUDE σ HEIGHT (M) σ
AUS064 (MAW1) -67 36 17.1592 F 62 52 14.5766 F 59.1460 F
AUS064-RM1 -67 36 17.9501 0.2 62 52 14.0788 0.0 56.7803 0.1
AUS064-RM2 -67 36 17.5384 0.1 62 52 16.4564 0.1 58.6564 0.1
AUS064-RM3 -67 36 16.5320 0.1 62 52 13.2732 0.2 55.6915 0.1
13

Antarctic Geodesy Field Report 2010/2011
Table 2.8: Final Cartesian coordinates from the 2010 Mawson local monitoring survey. GRS80 ellipsoid aligned to ITRF2000 at 1 January 2000. Final estimates of precision are shown as 1σ in mm.
SITE X σ Y σ Z σ
AUS064 (MAW1) 1111287.1710 F 2168911.2733 F -5874493.6049 F
AUS064-RM1 1111281.6646 0. 2 2168887.6266 0.0 -5874500.7530 0.1
AUS064-RM2 1111262.3666 0. 1 2168911.5677 0.1 -5874497.6282 0.1
AUS064-RM3 1111308.4692 0. 1 2168919.0679 0.2 -5874483.0079 0.1
Table 2.9: Comparison between the previous Mawson local monitoring surveys.
YEAR AUS064 TO … Δ EAST Δ NORTH Δ UP RANGE
2001 AUS064-RM1 -5.8799 -24.5031 -2.3674 25.3097
2006 AUS064-RM1 -5.8810 -24.5031 -2.3655 25.3098
2010 AUS064-RM1 -5.8823 -24.5027 -2.3657 25.3097
Std Dev 0.0012 0.0002 0.0010
2009 AUS064-RM2 22.2110 -11.7473 -0.4910 25.1310
2004 AUS064-RM2 22.2107 -11.7473 -0.4895 25.1307
2002 AUS054-RM2 22.2097 -11.7483 -0.4897 25.1303
Std Dev 0.0007 0.0006 0.0008
2009 AUS064-RM3 -15.4006 19.4305 -3.4570 25.3335
2004 AUS064-RM3 -15.4002 19.4303 -3.4544 25.3327
2002 AUS064-RM3 -15.4006 19.4307 -3.4546 25.3333
Std Dev 0.0002 0.0002 0.0014
14

Antarctic Geodesy Field Report 2010/2011
2.3 CASEY STATION The CORS at Casey (CAS1) was installed in 1992 on the control mark AUS100 and forms part of the AAGN and IGS. The antenna is located in the magnetic quiet zone on a rock outcrop approximately 200 m from the operations building, where the receiver is housed. The control mark has three reference marks located nearby that are used for routine local monitoring surveys. The equipment changes were undertaken by the supervising communication and technical officer and as such no local monitoring survey was undertaken. The results from the previous survey in 2009 showed no signs of any horizontal or vertical local deformation.
Figure 2.6: Installation configuration of the Casey CORS setup. 2.3.1 Equipment Upgrade The GPS equipment at Casey has for the past ten years been located in the Summer Logistics Room, within the Operations Building. In 2008 a request was made for our equipment to be moved into the main communications equipment rack, to free up space and provide easy access to the communications officers who maintain the equipment. The equipment was moved during October 2010 by the AAD station communication officers, as the equipment was originally located in this rack no additional antenna cable lengths were added. The setup at Casey (Figure 2.6) now consists of two GNSS receivers, a Leica GRX1200GG Pro (Primary) and a Ashtech UZ-12 (Spare). Both receivers are connected to the antenna via a 12 volt 4 port powered antenna splitter. The antenna is an ASH701945G_M covered by a AUST style radome (Figure 2.7). Two 12 volt 78 amp hour GelTech batteries provide power to the equipment. The batteries are charged by a 12V charger connected to mains power. A PC running the standard ARGN Fedora 6 build and operating off mains power is also present to interface with the receivers if required. A spare antenna (ASH701945G_M) and radome (SCIS) are situated on top of the rack.
15

Antarctic Geodesy Field Report 2010/2011
a) b)
c) d)
e) f)
Figure 2.7: a) the Casey CORS antenna facing north, b) east, c) south, d) west, e) the equipment rack and f) antenna showing condensation and small crack.
16

Antarctic Geodesy Field Report 2010/2011
2.4 MACQUARIE ISLAND In April 2011 Nicholas Brown performed an equipment upgrade and reference mark (RM) survey of the Macquarie Island GNSS site (MAC1) which forms part of the ARGN and IGS. The GNSS equipment is located in the science building and the GNSS antenna is approximately 25m to the north on a large rock (Figure 2.8). The position of MAC1 relative to the reference marks can be seen in Figure 2.9.
Figure 2.8: Position of MAC1 relative to science building
Figure 2.9: Macquarie Island RM survey network
AUS211
North
RM4
RM3
NMX1 / RM1
17

Antarctic Geodesy Field Report 2010/2011
2.4.1 Equipment Upgrade One of the major reasons for visiting Macquarie Island was to upgrade the GNSS equipment. Prior to the upgrade, Geoscience Australia staff noticed problems with the GNSS data. The cause was thought to be issues related to the Trimble NetR5 which was installed in 2009. The rationale for this was that the secondary receiver, an Ashtech UZ12 was not experiencing any problems. The installation in the science building is set up according to Figure 2.10.
Figure 2.10: Installation configuration of the Macquarie Island GNSS equipment. Receiver As part of the upgrade, the Trimble NetR5 was removed and replaced with a Leica GRX1200+ GNSS receiver. As shown in the Figure 2.11, the Ashtech receiver was left on site; however, it is no longer switched on. The receiver and PC is plugged into are both off and can be switched on if required. Antenna No change was made to the antenna. The antenna is an Allen Osborne Associates (AOA) Dorne and Margolin Type T element (DMT). See Figure 2.12 and Figure 2.13. True Charge Xantrex True Charge 2 (20A) was installed and is connected to the 2 x 12V batteries installed in 2009 and the mains power. Power Distribution Box The True Charge powers the Power Distribution Box which delivers power to the two GPS receivers and the powered splitter.
18

Antarctic Geodesy Field Report 2010/2011
Figure 2.11: Macquarie Island GNSS Equipment 2.4.2 Local Monitoring Survey The RM survey was undertaken at the Macquarie Island GNSS site on the 28th April 2011 between AUS211, RM1, RM3 and RM4 as shown in Figure 2.9. No line of sight is available between RM3 and RM4 and therefore no data was observed between these marks. The GNSS antenna mount at Macquarie Island is a special case and the surveyor must be very careful when performing the RM survey. The following steps were performed to remove the antenna, gain access the AUS211 spigot and ensure the antenna could be replaced with no change:
1. Remove dome 2. Place prism on antenna and measure the height difference between the top of antenna and
BM HT2 (base of pillar) 3. Unscrew the nuts which hold the antenna in place while making sure the bolts do not move 4. Remove antenna 5. Perform survey 6. Replace antenna 7. Screw nuts back in place 8. Place prism on antenna and measure the height difference between the top of antenna and
BM HT2 (base of pillar). Check that the difference is negligible when compared to previous values.
9. Replace dome.
19
Antarctic Geodesy Field Report 2010/2011
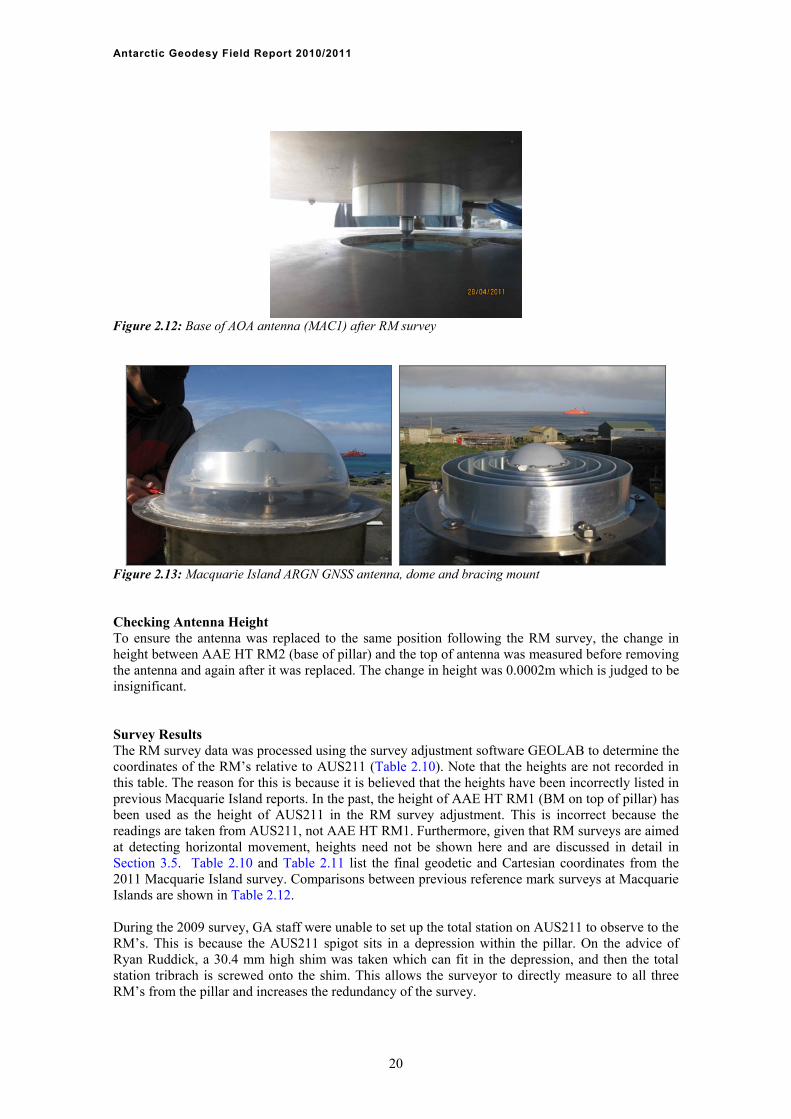
Figure 2.12: Base of AOA antenna (MAC1) after RM survey
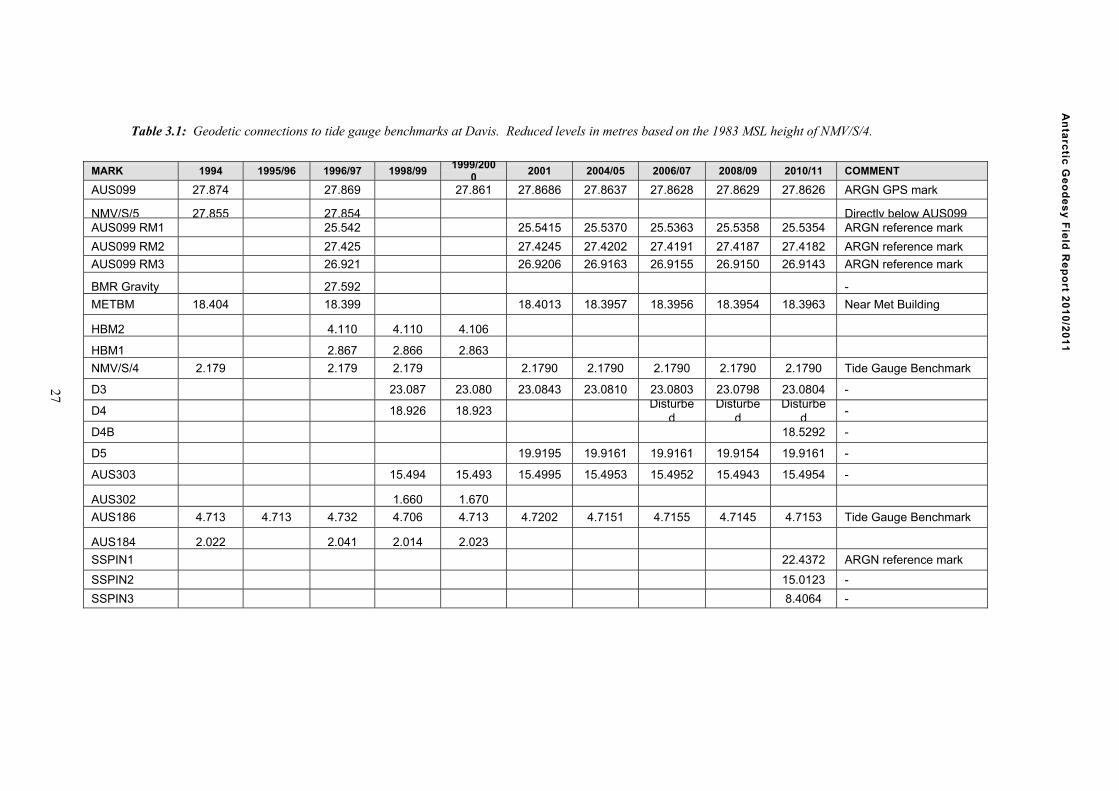
Figure 2.13: Macquarie Island ARGN GNSS antenna, dome and bracing mount Checking Antenna Height To ensure the antenna was replaced to the same position following the RM survey, the change in height between AAE HT RM2 (base of pillar) and the top of antenna was measured before removing the antenna and again after it was replaced. The change in height was 0.0002m which is judged to be insignificant. Survey Results The RM survey data was processed using the survey adjustment software GEOLAB to determine the coordinates of the RM’s relative to AUS211 (Table 2.10). Note that the heights are not recorded in this table. The reason for this is because it is believed that the heights have been incorrectly listed in previous Macquarie Island reports. In the past, the height of AAE HT RM1 (BM on top of pillar) has been used as the height of AUS211 in the RM survey adjustment. This is incorrect because the readings are taken from AUS211, not AAE HT RM1. Furthermore, given that RM surveys are aimed at detecting horizontal movement, heights need not be shown here and are discussed in detail in Section 3.5. Table 2.10 and Table 2.11 list the final geodetic and Cartesian coordinates from the 2011 Macquarie Island survey. Comparisons between previous reference mark surveys at Macquarie Islands are shown in Table 2.12. During the 2009 survey, GA staff were unable to set up the total station on AUS211 to observe to the RM’s. This is because the AUS211 spigot sits in a depression within the pillar. On the advice of Ryan Ruddick, a 30.4 mm high shim was taken which can fit in the depression, and then the total station tribrach is screwed onto the shim. This allows the surveyor to directly measure to all three RM’s from the pillar and increases the redundancy of the survey.
20

Antarctic Geodesy Field Report 2010/2011
21
Table 2.10: Final geodetic coordinates from the 2011 Macquarie Island reference mark survey. The height of AUS211 was held fixed at epoch ITRF1997.0 to allow for comparison with previous surveys. Final estimates of precision are shown as 1σ in mm. SITE LATITUDE σ LONGITUDE σ
AUS211 -54o 29’ 58.31811” 0.0 158 o 56’ 09.00137” 0.0
NMX/RM1 -54o 29’ 57.28898” 0.7 158 o 56’ 08.35536” 0.4
RM3 -54o 29’ 56.61145” 0.7 158 o 56’ 10.53013” 0.4
RM4 -54o 29’ 59.42705” 0.8 158 o 56’ 10.73670” 0.9
Table 2.11: Final Cartesian coordinates from the 2011 Macquarie Island reference mark survey. Final estimates of precision are shown as 1σ in mm. SITE X σ Y σ Z σ
AUS211 -3464049.1315 0.0 1334176.8676 0.0 -5169240.3217 0.0
NMX/RM1 -3464067.1169 0. 6 1334196.2534 0.4 -5169218.8212 0.5
RM3 -3464095.1684 0. 7 1334165.1155 0.2 -5169203.7543 0.5
RM4 -3464030.4946 0. 7 1334136.2233 1.0 -5169254.5077 0.6
Table 2.12: Comparison between the previous Macquarie Island reference mark surveys. YEAR AUS211 TO … Δ EAST Δ NORTH Δ UP
2006 AUS211-RM1 -11.6262 31.8220 -3.7187
2009 AUS211-RM1 -11.6256 31.8233 -3.7113
2011 AUS211-RM1 -11.6262 31.8216 -3.7113
2006 AUS211-RM3 27.5141 52.7738 -7.2826
2009 AUS211-RM3 27.5142 52.7732 -7.2752
2011 AUS211-RM3 27.5130 52.7710 -7.2751
2006 AUS211-RM4 31.2292 -34.2882 -7.0405
2009 AUS211-RM4 31.2300 -34.2884 -7.0332
2011 AUS211-RM4 31.2301 -34.2891 -7.0335

Antarctic Geodesy Field Report 2010/2011
3. Tide Gauges The AAD and the National Tidal Centre (NTC) operate a network of tide gauges across the AAT, including each of the main research stations (Figure 3.2). To geodetically control this network and facilitate the distinction between relative and absolute sea level change, GA have established permanent GNSS antennas at each of these sites and undertake routine precise level connections between the antennas, gauges and a series of well-defined benchmarks. During the 2010/11 summer, precise levelling was conducted at the Davis, Mawson and Macquarie Island stations using the Electronic Distance Measurement (EDM) height traversing technique (Johnston and Verrall 2002). Height difference observations were made using a Leica TCA2003 Total Station to a prism mounted on a fixed height stainless steel prism pole (approximately 1.5m in height) and to a fixed height stainless steel stub (approximately 0.2m in height). Atmospheric conditions (temperature, pressure, and relative humidity) were recorded and entered into the instrument every 30 minutes. Levelling loops covering all monuments in the survey network were completed in both directions. Each instrument set-up involved reading three rounds of face left and face right observations to a single prism set-up over two marks. The levelling observations were adjusted using least squares to derive adjusted height differences between all marks. To ensure the tide gauges are working correctly, calibrations were undertaken at Davis and Mawson using a GPS antenna setup on the sea ice directly above the tide gauge (Figure 3.1). Observations were made at 1 second and referenced to a second receiver located on a nearby tide gauge benchmark (TGBM). Observations were made over a 24 hour period and compared with the tide gauge observations, which were downloaded after the survey. A similar method was also used to establish a temporary GPS based tide gauge at Beaver Lake.
Figure 3.1: Schematic diagram of tide gauge calibration procedure. The tide gauge at Nella Fjord in the Larsemann Hills was also removed during the summer.
22

Antarctic Geodesy Field Report 2010/2011
Figure 3.2: Map showing the location of tide gauges in the Southern Ocean.
23

Antarctic Geodesy Field Report 2010/2011
3.1 DAVIS STATION There are two bottom-mounted pressure tide gauges at Davis Station, an inner and an outer gauge (Figure 3.4). These are located by lining up a series of barrels and antenna on the shoreline. The inner gauge is located at a depth of approximately 6 m. The inner gauge was covered in a substantial amount of weed and required cleaning. Download of the data was attempted, but was unsuccessful due to the weed covering. The outer gauge was not inspected during this visit. 3.1.1 Orthometric Levelling Results On 28th November 2010 a precise level connection was made between AUS099 (DAV1) and the TGBM’s NMV/S/4 and AUS186. The survey was conducted in light winds with the 1983 Mean Sea Level (MSL) height of NMV/S/4 held fixed as a reference. Along with the TGBM’s, connections were made to a number of other marks around the station (Figure 3.4). The final reduced levels and comparisons with previous surveys are shown in Table 3.1. The 2010 survey compares well with previous levels with differences compared to 2009 being no greater than 1 mm. This indicates that there has not been any local movement between the GPS antenna and the TGBM’s. 3.1.2 GPS Connection and Calibration Between the 26th November and 29th November a GPS antenna was setup on the sea ice over the inner tide gauge and also on the two TGBM’s AUS186 and NMV/S/4. Data was recorded at a rate of 1 Hz for a daily tidal cycle (~ 24 hours). Due to a significant amount of weed growing over the gauge download of data after the survey was not possible. As such a comparison between with the GPS observations cannot be made until the gauge is cleaned appropriately and the data downloaded. The GPS data was processed using a kinematic method in the Bernese GPS processing software version 5.2. The resulting time-series is shown in Figure 3.3 compared with the predicted tidal signature (BOM 2010).
24

Antarctic Geodesy Field Report 2010/2011
Figure 3.3: GPS time-series showing the tidal signature above the inner tide gauge at Davis for 27 November 2010. Also shown are the predicted tidal values for the same day from the Bureau of Meteorology.
25

Antarctic Geodesy Field Report 2010/2011
Figure 3.4: The level traverse from the CORS (AUS099) to the two TGBM (AUS186 and NMV/S/4). Primary survey control is indicated by red triangles, circles indicate change points on secondary control.
26
An
tarc
tic G
eo
de
sy
Fie
ld R
ep
ort 2
01
0/2
01
1
COMMENT
ARGN GPS mark
Directly below AUS099 ARGN reference mark
ARGN reference mark
ARGN reference mark
-
Near Met Building
Tide Gauge Benchmark
-
-
-
-
-
Tide Gauge Benchmark
ARGN reference mark
-
-
2010/11
27.8626
25.5354
27.4182
26.9143
18.3963
2.1790
23.0804 Disturbe
d18.5292
19.9161
15.4954
4.7153
22.4372
15.0123
8.4064
2008/09
27.8629
25.5358
27.4187
26.9150
18.3954
2.1790
23.0798 Disturbe
d
19.9154
15.4943
4.7145
2006/07
27.8628
25.5363
27.4191
26.9155
18.3956
2.1790
23.0803 Disturbe
d
19.9161
15.4952
4.7155
2004/05
27.8637
25.5370
27.4202
26.9163
18.3957
2.1790
23.0810
19.9161
15.4953
4.7151
2001
27.8686
25.5415
27.4245
26.9206
18.4013
2.1790
23.0843
19.9195
15.4995
4.7202
1999/2000
27.861
4.106
2.863
23.080
18.923
15.493
1.670
4.713
2.023
1998/99
4.110
2.866
2.179
23.087
18.926
15.494
1.660
4.706
2.014
1996/97
27.869
27.854 25.542
27.425
26.921
27.592
18.399
4.110
2.867
2.179
4.732
2.041
1995/96
4.713
1994
27.874
27.855
18.404
2.179
4.713
2.022
MARK
AUS099
NMV/S/5 AUS099 RM1
AUS099 RM2
AUS099 RM3
BMR Gravity
METBM
HBM2
HBM1
NMV/S/4
D3
D4
D4B
D5
AUS303
AUS302
AUS186
AUS184
SSPIN1
SSPIN2
SSPIN3
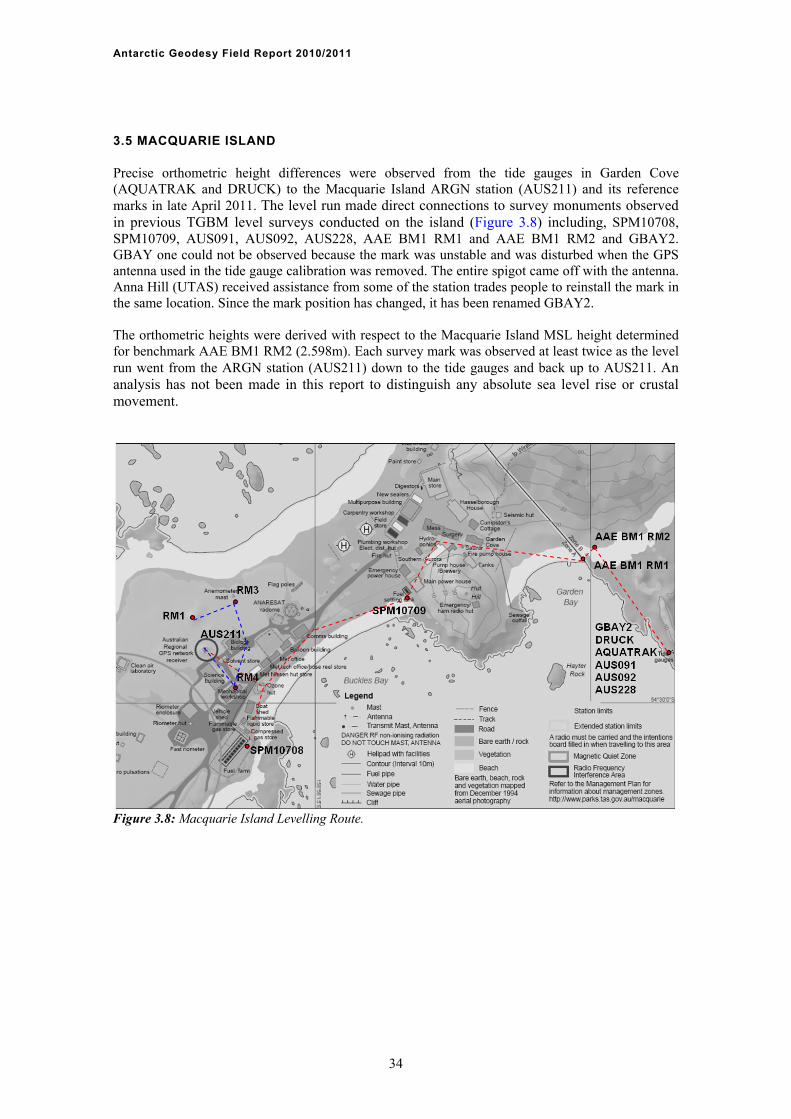
Table 3.1: Geodetic connections to tide gauge benchmarks at Davis. Reduced levels in metres based on the 1983 MSL height of NMV/S/4.
27

Antarctic Geodesy Field Report 2010/2011
3.2 MAWSON STATION There are two tide gauges at Mawson a bottom-mounted pressure gauge (TG020) and a shore-mounted gauge (Figure 3.6). The gauge TG020 is located by lining up a series on antennas on the shore. The shore-mounted gauge is near the magnetic variometer building inside the Magnetic Quiet Zone (MQZ). 3.2.1 Orthometric Levelling Results On the 12th December 2010 a precise level connection was made between AUS064 (MAW1) and the TGBM’s AUS258, AUS267 and AUS268. The survey was conducted in nil-wind conditions with the MSL height of ISTS051 (9.792 m) being used as a reference. Along with the TGBM’s connections were also made to AUS251, AUS301 and ISTS051 RM2 (Figure 3.6). Due to heavy snow cover the benchmarks NMV/S/1 and AUS300 could not be observed. The final reduced levels and comparisons with previous surveys are shown in table 3.2. The 2010 survey compares well with previous levels with differences compared to 2006 being no greater than 1 mm. This indicates that there has been no local movement between the GPS antenna and the TGBM’s. 3.2.2 GPS Connection and Calibration Between the 12th and 13th of December 2010 GPS antennae were setup on the ice over TG020 and on the TGBM AUS258. Data was recorded at a rate of 1 Hz for a daily tidal cycle (~ 24 hours). After the survey the data was downloaded from the tide gauge. The GPS data was processed using a kinematic method in the Bernese GPS processing software version 5.2 (Figure 3.5). The resulting time-series is shown in Figure 3.5 compared with the predicted tidal signature (BOM 2010) and the actual tidal observations.
28

Antarctic Geodesy Field Report 2010/2011
Figure 3.5: GPS time-series showing the tidal signature above the bottom-mounted pressure tide gauge (TG020) at Mawson for 13-15th December 2010. Also shown are the predicted tidal values for the same day from the Bureau of Meteorology.
29

Antarctic Geodesy Field Report 2010/2011
Figures 3.6: The level traverse from the CORS (AUS099) to the two TGBM (AUS186 and NMV/S/4). Primary survey control is indicated by red triangles, circles indicate change points on secondary control.
30

An
tarc
tic G
eo
de
sy
Fie
ld R
ep
ort 2
01
0/2
01
1
COMMENT
Datum for comparison
-
-
ARGN GPS mark
ARGN reference mark
ARGN reference mark
ARGN reference mark
North of fuel farm
North of aircraft hanger
-
-
-
-
Tide Gauge Benchmark
BM next to smoke hut
Tide Gauge Benchmark
Tide Gauge Benchmark
BM near ANARESAT
2010/11
9.7920
11.6835
32.4447
30.0790
31.9548
28.9902
1.8341
1.4094
18.1391
2.8768
3.5378
2006/07
9.7920
11.6833
32.4441
30.0786
31.9547
28.9897
2.1312
1.8342
1.4098
18.1385
2.8755
3.5365
15.5673
2000/01
9.7920
32.4458
30.0792
31.9557
28.9905
2.1328
1.8351
1.4108
1998/99
11.6770
30.0580
31.9560
28.9900
2.1220
1.4000
1997/98
32.4490
31.9560
28.9930
2.1480
1.8500
1.4270
1996/97
9.7920
11.6840
32.4490
30.0840
31.9600
28.9950
1.4140
1995/96
9.7920
11.6860
32.4490
31.9590
1.4130
MARK
ISTS051
ISTS051 RM2
ISTS051 RM4
AUS064
AUS064 RM1
AUS064 RM2
AUS064 RM3
AUS300
AUS301
AUS321
NMV/S/11
BM1
NMV/S/3
AUS258
AUS251
AUS267
AUS268
NMV/S/1
Notes: 1 based on a MSL height of 9.792 metres at ISTS051. This value was adopted from the ISTS051 May 1981 Station Summary. 2, 3 Class LC* optical leveling, using fiberglass staves. All values corrected for thermal expansion/contraction of the staves (King 2000). 4 Class LC* optical levelling, using Aluminum staves. All values corrected for thermal expansion/contraction of the staves (King 2000). Although included in the summary for completeness, these results may be dubious. 5 Class LC* optical levelling. All values corrected for thermal expansion/contraction of the staves (King 2000). Although included in the summary for completeness, these results may be dubious. 6 Class L2A* levelling, using the "Leap-Frog" EDM Height Traversing. Due to limited time at Mawson Station, only the section between AUS258 and ISTS051 was observed in both directions, with the remaining sections only leveled one way. However, the comparison with previous levelling was acceptable and the superior technique used means that this 200/2001 levelling is the most reliable (see section 3 of AUSLIG Technical Report 5 for more details). 7 The GPS antenna attached to AU064 was leveled to, but it is not clear which part of the antenna was used. Assuming that the top of the ground plane was leveled, the height shown was obtained by reducing the measured height by 38 mm to bring it to the base of the antenna (the antenna reference point - ARP), plus a further 31⁄2 mm for the height of this antenna above the AUS064 station mark (see the site log sheet for details). 8 AUS064 RM2 was used as the common point to compare the 1997/98 & 1998/99 results with the other years, as ISTS051 was not connected during these surveys.
Table 3.2: Geodetic connections to tide gauge benchmarks at Mawson. Reduced levels in metres based on the MSL height of ISTS51.
31

Antarctic Geodesy Field Report 2010/2011
3.3 LARSEMANN HILLS TIDE GAUGE In January 2000 a tide gauge was installed by the AAD mapping group at Nella Fjord in the Larsemann Hills. Since then the tide gauge has run out of batteries and has now been superseded by a tide gauge at Chinese station, Zhong Shan. During the summer we were tasked with the removal of the Nella Fjord tide gauge. On 27 November 2010 we visited the Larsemann Hills to remove the tide gauge with helicopter support from Davis. At Nella Fjord a Chinese National Antarctic Research Expedition (CHINARE) geodetic surveyor, Jifeng Haung, assisted us with the removal. The tide gauge was easily located using the offsets from AUS335; the fast ice had rafted up over the area and required a jiffy drill with four metres of extensions. Once the hole was drilled, the tide gauge was removes using a tide gauge “grabber” and under water camera, attached to 7 metres of cane poles. The tide gauge was not downloaded on site but Returned To Australia (RTA) to the AAD mapping group. In 2008/09 (Ruddick, Woods and Brown 2009) a precise level connection was made between the TGBM’s at Nella Fjord and Zhong Shan station survey network. This connection along with Chinese connection to the Zhong Shan tide gauge could be used to redefine the vertical datum across the Larsemann Hills.
32

Antarctic Geodesy Field Report 2010/2011
3.4 BEAVER LAKE Beaver Lake is located at Latitude: -70° 48’ 11.65”, Longitude: 68° 10’ 44.64” and has been used as a prominent field research station in the past. Located at the site is a number of field huts (apples) and it typically hosts a significant amount of aviation fuel due to its proximity to the lower reaches of the Prince Charles Mountains, as such accessibility to the site is frequent by both fixed wing and helicopter. During the 2010/11 summer GA was tasked by the AAD mapping group to setup a temporary GPS tide gauge on the lake ice. The aim of the survey was to measure the tidal signature over a 24-hour period (Figure 3.7). A GPS receiver was setup on the ice with a reference receiver on AUS2021, it was intended to also establish a reference receiver on AUS2022 (TGBM) but this mark was buried by ice. Due to logistics, it was not possible to return to the site immediately within a 24 hour period and the receivers were left running for a period of 6 weeks with data available over an 18 day period.
Figures 3.7: GPS time-series showing the tidal signature at Beaver Lake over a 24 hour period.
33
Antarctic Geodesy Field Report 2010/2011
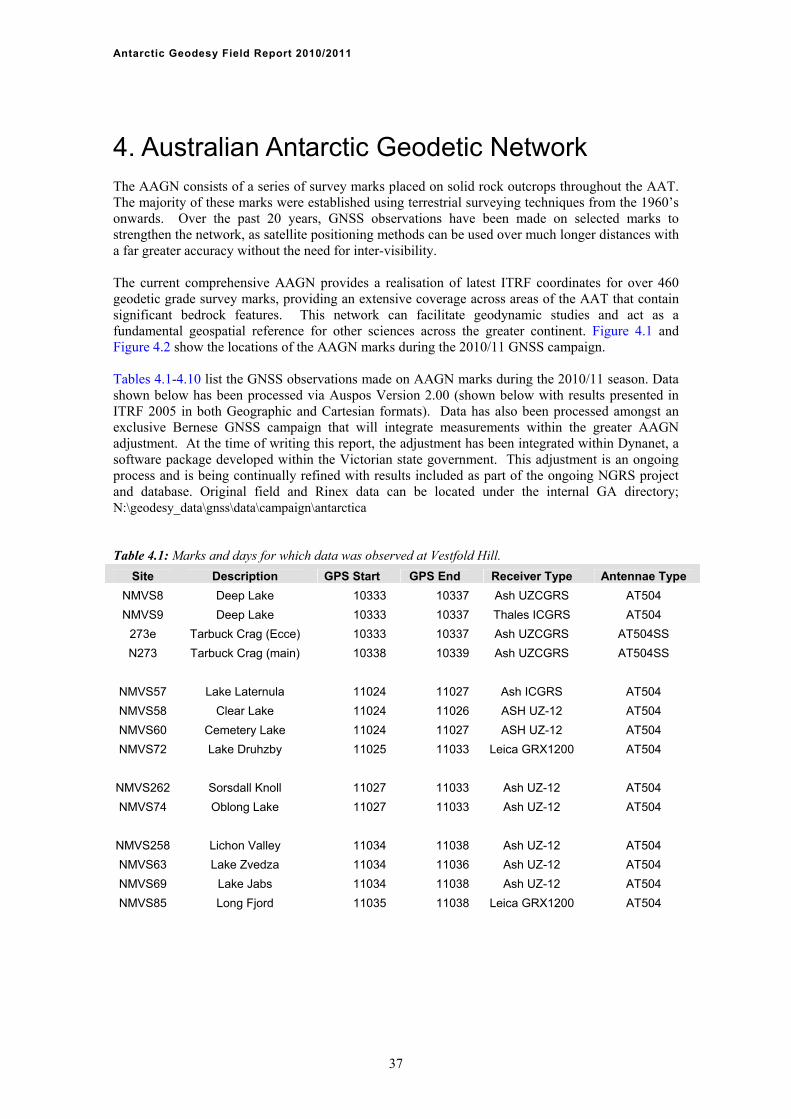
3.5 MACQUARIE ISLAND Precise orthometric height differences were observed from the tide gauges in Garden Cove (AQUATRAK and DRUCK) to the Macquarie Island ARGN station (AUS211) and its reference marks in late April 2011. The level run made direct connections to survey monuments observed in previous TGBM level surveys conducted on the island (Figure 3.8) including, SPM10708, SPM10709, AUS091, AUS092, AUS228, AAE BM1 RM1 and AAE BM1 RM2 and GBAY2. GBAY one could not be observed because the mark was unstable and was disturbed when the GPS antenna used in the tide gauge calibration was removed. The entire spigot came off with the antenna. Anna Hill (UTAS) received assistance from some of the station trades people to reinstall the mark in the same location. Since the mark position has changed, it has been renamed GBAY2. The orthometric heights were derived with respect to the Macquarie Island MSL height determined for benchmark AAE BM1 RM2 (2.598m). Each survey mark was observed at least twice as the level run went from the ARGN station (AUS211) down to the tide gauges and back up to AUS211. An analysis has not been made in this report to distinguish any absolute sea level rise or crustal movement.
Figure 3.8: Macquarie Island Levelling Route.
34

Antarctic Geodesy Field Report 2010/2011
CO
MM
EN
T
Top
of b
olt o
n to
p of
AR
GN
pill
ar
Top
of
bolt
at b
ase
of A
RG
N p
illar
Gro
und
mar
k on
mou
nd n
orth
of
AR
GN
pill
ar
Gro
und
mar
k at
Mec
hani
cal
Wor
ksho
p
Gro
und
mar
k at
Ane
mom
eter
ma
st
Top
of b
olt a
t ba
se o
f Ane
mom
eter
m
ast
Eas
t Cnr
of F
uel F
arm
Eas
t Cnr
of F
uel S
ettli
ng T
ank
On
top
of r
ock
at e
ast e
nd o
f bea
ch
in G
arde
n B
ay
On
rock
y m
ound
at e
ast e
nd o
f be
ach
in G
arde
n B
ay
Nea
r T
ide
Gau
ges
Tid
e G
auge
RM
Top
of b
rass
rim
of T
ide
Gau
ge
Tid
e G
auge
RM
Top
of b
rass
rim
of T
ide
Gau
ge
Nea
r T
ide
Gau
ges
Nea
r T
ide
Gau
ges
Bas
e of
thre
ade
d s
pigo
t nea
r T
ide
G
auge
s in
Gre
en B
ay
2011
12.8
83
12.6
83
9.16
5
5.84
3
5.60
1
- 7.21
5
4.97
1
1.90
3
2.59
8
3.29
6
3.21
2
- * - 3.33
1
3.49
4
6.61
9**
2009
12.8
8
11.6
8
9.16
3
5.84
1
5.6
5.72
3
7.21
4
4.97
1.90
3
2.59
8
3.29
6
3.21
2
3.22
8
3.33
4
3.35
1
3.33
1
3.49
4
-
2006
12.8
8
11.6
8
9.16
3
5.84
1
5.59
9
- 7.21
4
4.96
9
1.90
3
2.59
7
3.29
6
- 3.22
8
- 3.35
1
3.33
1
3.49
5
-
2002
- 11.6
8
9.16
2
5.84
5.59
8
- - - 1.90
4
2.59
9
- - 3.22
7
- 3.35
3.33
1
3.49
4
-
1999
/00
- - - - - 5.72
3
- - 1.90
4
- 3.29
7
- 3.22
9
- 3.35
3
3.33
2
3.49
5
-
1997
/98
- 11.6
81
9.16
1
- - 5.72
5
- - 1.90
3
2.59
8
3.29
7
- 3.22
9
- 3.35
2
3.33
2
3.49
5
-
1996
12.8
8
11.6
8
9.16
1
- - 5.72
3
- - 1.90
3
2.59
8
3.29
7
3.21
2
3.22
8
3.33
6
3.35
2
3.33
2
3.49
5
-
1996
- 11.6
8
9.16
2
- - 5.72
3
- - 1.90
3
2.59
8
3.29
6
3.21
2
3.22
8
3.33
5
3.35
1
3.33
2
3.49
5
-
1994
- 11.6
8
9.16
2
- - 5.72
2
- - 1.90
3
2.59
8
3.29
7
3.21
2
3.22
8
- - 3.33
2
3.49
5
-
MA
RK
AU
S21
1 H
T R
M1
AU
S21
1 H
T R
M2
NM
/X/1
RM
1
AU
S21
1 R
M4
AU
S21
1 R
M3
AU
S15
6
SP
1070
8
SP
1070
9
AA
E B
M1
RM
1
AA
E B
M1
RM
2
AU
S22
8
AQ
UA
TR
AK
RM
AQ
UA
TR
AK
RIM
DR
UC
K R
M
DR
UC
K R
IM
AU
S09
1
AU
S09
2
GB
AY
2**
Table 3.3: Comparison of the 2011 RL’s compared to previous surveys based on the AAE BM1 RM2 of 2.598m (installed in 1992). * The incorrect DRUCK RM point was observed. Nick Brown was advised that the reference mark was the bolt set up on in Figure 3.9 (circled in red). The true reference marks are the punch marks in the RIM and another punch mark in the base of the plate. Future advice is that these should be clearly marked on the gauge in the future. ** New mark after GBAY was destroyed
35

Antarctic Geodesy Field Report 2010/2011
36
Figure 3.9: The incorrect DRUCK reference point.
Antarctic Geodesy Field Report 2010/2011
4. Australian Antarctic Geodetic Network The AAGN consists of a series of survey marks placed on solid rock outcrops throughout the AAT. The majority of these marks were established using terrestrial surveying techniques from the 1960’s onwards. Over the past 20 years, GNSS observations have been made on selected marks to strengthen the network, as satellite positioning methods can be used over much longer distances with a far greater accuracy without the need for inter-visibility. The current comprehensive AAGN provides a realisation of latest ITRF coordinates for over 460 geodetic grade survey marks, providing an extensive coverage across areas of the AAT that contain significant bedrock features. This network can facilitate geodynamic studies and act as a fundamental geospatial reference for other sciences across the greater continent. Figure 4.1 and Figure 4.2 show the locations of the AAGN marks during the 2010/11 GNSS campaign. Tables 4.1-4.10 list the GNSS observations made on AAGN marks during the 2010/11 season. Data shown below has been processed via Auspos Version 2.00 (shown below with results presented in ITRF 2005 in both Geographic and Cartesian formats). Data has also been processed amongst an exclusive Bernese GNSS campaign that will integrate measurements within the greater AAGN adjustment. At the time of writing this report, the adjustment has been integrated within Dynanet, a software package developed within the Victorian state government. This adjustment is an ongoing process and is being continually refined with results included as part of the ongoing NGRS project and database. Original field and Rinex data can be located under the internal GA directory; N:\geodesy_data\gnss\data\campaign\antarctica Table 4.1: Marks and days for which data was observed at Vestfold Hill.
Site Description GPS Start GPS End Receiver Type Antennae Type
NMVS8 Deep Lake 10333 10337 Ash UZCGRS AT504
NMVS9 Deep Lake 10333 10337 Thales ICGRS AT504
273e Tarbuck Crag (Ecce) 10333 10337 Ash UZCGRS AT504SS
N273 Tarbuck Crag (main) 10338 10339 Ash UZCGRS AT504SS
NMVS57 Lake Laternula 11024 11027 Ash ICGRS AT504
NMVS58 Clear Lake 11024 11026 ASH UZ-12 AT504
NMVS60 Cemetery Lake 11024 11027 ASH UZ-12 AT504
NMVS72 Lake Druhzby 11025 11033 Leica GRX1200 AT504
NMVS262 Sorsdall Knoll 11027 11033 Ash UZ-12 AT504
NMVS74 Oblong Lake 11027 11033 Ash UZ-12 AT504
NMVS258 Lichon Valley 11034 11038 Ash UZ-12 AT504
NMVS63 Lake Zvedza 11034 11036 Ash UZ-12 AT504
NMVS69 Lake Jabs 11034 11038 Ash UZ-12 AT504
NMVS85 Long Fjord 11035 11038 Leica GRX1200 AT504
37

Antarctic Geodesy Field Report 2010/2011
Table 4.2: Marks and days for which data was observed at Davis Station.
Site Description GPS Start GPS End Receiver Type Antennae Type
A186 Tide Gauge BM 10328 10331 Leica GRX1200pro LeiAT504
NMVS4 Tide Gauge BM 10328 10331 Leica GRX1200pro LeiAT504
DTG1 Davis Tide Gauge 10330 10331 Leica GRX1200pro LeiAT504
D4B Davis Station Mark 11027 11031 Ash UZ-12 Lei AT504GG Table 4.3: Marks and days for which data was observed at Mawson Station.
Site Description GPS Start GPS End Receiver Type Antennae Type
A258 Tide Gauge BM 10347 10349 Leica GRX1200pro AT504
MTG1 Mawson Tide
Gauge 10347 10349 Ash UZ-12 AT504
AUS267 New Mawson BM 10354 10355 Leica GRX1200pro AT504
AUS268 New Mawson BM 10354 10356 Ash UZ-12 AT504
A252 Fang Saddle 10365 10365 Leica GRX1200pro AT504 Table 4.4: Marks and days for which data was observed at Bunger Hills.
Site Description GPS Start GPS End Receiver Type Antennae Type
BHIL Bunger Hills CORS 11019 11021 Leica GRX1200Pro Ashtech w/dome
RM01 RM1 11019 11020 ASH UZ-12 AT504
RM02 RM2 11020 11020 ASH UZ-12 AT504
RM03 RM3 11020 11021 ASH UZ-12 AT504
N238 Bunger E/D Camp 11019 11020 Leica GRX1200 Pro AT504
N237 Dobrowolski Camp 11020 11020 Leica GRX1200 Pro AT504 N238 RM1 Bunger E/D Camp 11021 11021 Leica GRX1200 Pro AT504 Table 4.5: Marks and days for which data was observed at Beaver Lake.
Site Description GPS Start GPS End Receiver Type Antennae Type
AUS2021 Beaver Lake BM 10334 11 Leica GRX1200Pro Lei AT504
BL01 Beaver Lake 10334 11 Leica GRX1200 Lei AT504 GG Table 4.6: Marks and days for which data was observed at Larsemann Hills.
Site Description GPS Start GPS End Receiver Type Antennae Type
NMS135 Blundell Peak 11041 11043 ASH UZ-12 Lei AT504
3 Man Three Man Peak 11041 11043 Leica GRX1200 Lei AT504
38

Antarctic Geodesy Field Report 2010/2011
Table 4.7: Marks and days for which data was observed at Grove Mountains.
Site Description GPS Start GPS End Receiver Type Antennae Type
A351 CORS Station 11014 11017 Leica GRX1200Pro Ashtech w/dome
GRM1 RM1 11014 11014 Leica GRX1200Pro Lei AT504
GRM2 RM2 11014 11015 Leica GRX1200Pro Lei AT504
GRM3 RM3 11015 11016 Leica GRX1200Pro Lei AT504 Table 4.8: Marks and days for which data was observed at Wilson Bluff.
Site Description GPS Start GPS End Receiver Type Antennae Type
A368 Wilson Bluff 11012 11013 Leica GRX1200Pro Ashtech w/dome
WBFO Dresden RM 11012 11013 Leica GRX1200Pro Lei AT504
39

Antarctic Geodesy Field Report 2010/2011
Table 4.9: Final geodetic coordinates from 2010/11 GPS campaigns. GRS80 ellipsoid aligned to ITRF2005 at 1 January 2005. Final estimates of precision are shown as 1σ in mm.
Site Latitude Longitude Ellipsoidal Height (m)
Height above MSL (m)
(Davis 1983 datum)
NMVS8 -68 33 22.94334 78 11 16.29784 -32.971 -50.313 NMVS9 -68 33 46.61611 78 11 15.30428 -31.782 -49.116 273e -68 34 38.52780 78 11 54.99623 157.676 140.357 N273 -68 34 38.54970 78 11 54.72070 157.59 140.271 NMVS57 -68 38 55.56708 77 58 54.03152 19.037 1.882 NMVS58 -68 38 32.84763 77 59 49.67580 11.432 -5.738 NMVS60 -68 37 25.26908 77 58 28.00700 20.31 3.119 NMVS72 -68 35 52.47783 78 18 48.95216 26.358 9.036 NMVS262 -68 38 58.70824 78 13 00.15050 97.846 80.607 NMVS74 -68 37 30.09899 78 14 13.59291 15.299 -1.974 NMVS258 -68 27 59.42845 78 24 31.49565 153.751 136.273 NMVS63 -68 31 32.65460 78 28 12.86644 33.921 16.497 NMVS69 -68 33 20.01395 78 16 19.93375 -17.365 -34.724 NMVS85 -68 29 50.13635 78 16 29.27080 39.384 21.955 A186 -68 34 20.60052 77 58 05.62821 21.256 3.987 NMVS4 -68 34 33.92398 77 57 48.96697 18.702 1.44 D4B_ -68 34 29.25318 77 58 11.28017 35.097 17.831 A258 -67 36 00.54591 62 52 22.69359 28.075 -0.571 AUS267 -67 36 08.98601 62 52 49.95457 29.547 0.905 AUS268 -67 36 09.44959 62 52 50.51059 30.212 1.57 A252 -67 47 32.32881 62 34 37.57070 862.84 833.959 A368 -74 17 26.07816 66 47 32.03258 1235.797 1227.177 WBFO -74 17 28.43685 66 47 32.62993 1240.407 1231.787 A351 -72 54 29.17667 74 54 36.42955 1907.467 1894.663 GRM1 -72 54 28.61504 74 54 35.40383 1903.81 1891.006 GRM2 -72 54 29.77262 74 54 36.28533 1904.974 1892.171 GRM3 -72 54 29.21184 74 54 34.75173 1903.287 1890.484 BHIL -66 15 04.92403 100 35 54.89047 18.006 20.714 RM01 -66 15 04.69433 100 35 55.16378 17.15 19.858 RM02 -66 15 05.44149 100 35 55.41304 17.933 20.642 RM03
N238 -66 14 59.78775 100 36 13.23686 5.269 7.978 N237 -66 16 26.61742 100 44 58.53316 34.592 37.381 N238 RM1 AUS2021 -70 48 11.65976 68 10 44.64606 37.148 19.073 NMS135 -69 25 33.67905 76 06 14.77860 N/A N/A
Three Man Peak -69 22 49.31953 76 17 41.30398 N/A N/A
40

Antarctic Geodesy Field Report 2010/2011
Table 4.10: Final Cartesian coordinates from the 2010/11 GPS campaigns. GRS80 ellipsoid aligned to ITRF2005 at 1 January 2005. Final estimates of precision are shown as 1σ in mm.
Site X Y Z
NMVS8 478706.03 2289013.614 -5914029.764
NMVS9 478577.386 2288343.47 -5914298.981 273e 477844.964 2287037.664 -5915063.012
N273 477847.883 2287036.377 -5915063.179 NMVS57 484946.056 2277909.251 -5917838.227
NMVS58 484467.292 2278678.575 -5917574.81 NMVS60 485776.425 2280396.919 -5916820.189
NMVS72 472812.319 2285856.151 -5915777.269 NMVS262 475585.137 2279818.727 -5917947.062 NMVS74 475288.483 2282461.689 -5916870.068
NMVS258 471765.657 2300046.051 -5910531.598 NMVS63 468059.506 2294485.217 -5912841.888
NMVS69 475354.259 2289804.125 -5914011.107 NMVS85 476484.6 2295771.204 -5911683.391 A186 487134.403 2285554.81 -5914733.113
NMVS4 487238.688 2285138.7 -5914881.537 D4B_ 487020.812 2285329.015 -5914843.935 A258 1111413.4 2169367.987 -5874268.764 AUS267 1111016.729 2169300.183 -5874369.762
AUS268 1111004.944 2169291.584 -5874375.848 A252 1113613.94 2146279.346 -5883175.489
A368 682780.468 1592449.829 -6118988.512 WBFO 682748.602 1592388.242 -6119012.754
A351 489658.74 1816031.161 -6076059.187 GRM1 489671.824 1816043.76 -6076050.573
GRM2 489655.22 1816013.056 -6076062.234 GRM3 489672.921 1816024.985 -6076055.512 BHIL -473772.994 2531930.486 -5815308.594
RM01 -473777.484 2531935.92 -5815304.945 RM02 -473776.705 2531914.835 -5815314.982
RM03
N238 -474024.05 2532026.432 -5815232.861
N237 -480013.829 2528403.786 -5816342.41 N238 RM1 AUS2021 781892.106 1952800.429 -6001133.935 NMS135
Three Man Peak
41

Antarctic Geodesy Field Report 2010/2011
Figure 4.1: Location of AAGN marks during 2010/11 GNSS campaign in the Vestfold Hills.
42

Antarctic Geodesy Field Report 2010/2011
Figure 4.2: Locations of Antarctic GNSS campaign 2010/11
43

Antarctic Geodesy Field Report 2010/2011
44
Figure 4.3: AUS252 being observed within the Framnes Mountains (near Fang Peak).

Antarctic Geodesy Field Report 2010/2011
5. Deep Field Campaign Continuous monitoring of the Antarctic tectonic plate is largely facilitated by three permanent GNSS stations included to the ARGN located at the Australian Antarctic Stations of: Casey, Davis and Mawson. The data collected from these stations has been used to compute temporal movement vectors of the Antarctic continent. The sites, however, are restricted to the coast and do not reliably represent neo-tectonic motion within the continental interior (Brolsma and Corvino 2007, updated 2008). Obtaining reliable inland measurements is a difficult process given the limitations in access and the severity of weather conditions. The large proportion of Geodetic marks in inland areas has been limited to restricted epoch GPS observations acquired at a few remote AAGN and Australia National University (ANU) study sites during summer Australian National Antarctic Research Expeditions (ANARE). However, with the introduction of permanent deep field sites to the Grove Mountains, Wilson Bluff, Bunger Hills and Mt Creswell (Figure 5.1), Geoscience Australia has established a series of suitable geodetic marks that will allow for a more complete geodynamic analysis of the continental plate. The CORS observations at each site provide base level historic data from which long-term calculations of Antarctica’s continental motion can be made (Brolsma and Corvino 2007, updated 2008).
Figure 5.1: Inland CORS operated by Geoscience Australia GA operates four CORS sites in remote areas of East Antarctica. The sites are located at the Grove Mountains, Wilson Bluff, Bunger Hills and Mount Creswell (Figure 5.1). The data collected at these
45

Antarctic Geodesy Field Report 2010/2011
sites is combined with the other GPS campaign data to improve precision and strengthen the geodetic network. The data from these sites also contribute to research on the physical Earth processes, such as tectonic motion and the response of the Earth’s crust to ice-loading or unloading. 5.1 REMOTE SITE DESIGN Continuous operation of GNSS sites in Antarctica is difficult, particularly in the winter months when there is little or no sunlight available for solar energy. Sites need to be well designed to withstand the strong winds and overcome the extreme cold. Previously, remote sites were powered during winter using Air Industrial wind turbines. These worked occasionally, but generally the wind turbines failed and were destroyed. This season sites were refurbished and installed at the Grove Mountains, Bunger Hills and Wilson Bluff with an emphasis on simplification to reduce prominent system failures which have been a common occurrence since the CORS inception. 5.1.1 Structural System During the winter months the remote sites experience strong winds, which have at times blown over or snapped the structures that house the equipment boxes and support the solar panels. To overcome this, a new structure was designed and built by Baxter Engineering in Canberra 2008. The structure was designed with a stable footprint of 1.6 x 1.6m and enclosed on the windward side (south) by aluminium panels angled at 60 degrees the leeward side (north) holds three solar panels also at 60 degrees to pick up sunlight low on the horizon. The base is slightly elevated to reduce snow build-up. Mounts on either side of the structure allow for the addition of an iridium antenna or vertical axis wind turbine (5/8” spigot), however these features have been removed in the 2010/11 season due to simplification requirements. A large insulated space-case contains all other equipment, including the batteries and rests on a mesh grid within the frame (Figure 5.2). The structure weighs 55kg and contains solely 13mm nuts and bolts.
Figure 5.2: Solar panel frame structure, as installed at the Grove Mountains (December 2009).
46

Antarctic Geodesy Field Report 2010/2011
5.1.2 Power System A Plasmatronics PL20 regulator controls the power, provided by three 60W solar panels and a 12V 296Ahr battery bank. The regulator is programmed (Figure 5.3) to restrict the flow of power to the battery bank during the intense solar periods of the summer and monitor the batteries during the winter months, switching off the load when the voltage drops to 11.1V. The load is disconnected preserving charge in the batteries until the solar system charges the battery voltage to 12.6V. This protects the batteries from being drained completely; leaving some charge so that they can recover when there is sufficient sunlight after winter. The system is designed to support wind turbines, such as Forgen 500 vertical axis wind turbines, however, none were installed in the 2008/09 season and this continued into the 2010/11 season. However there is potential scope to reintroduce turbines in the near future.
Figure 5.3: Configuration of Plasmatronics PL20 regulator.
47

Antarctic Geodesy Field Report 2010/2011
5.2 WILSON BLUFF Wilson Bluff is located in the southern Prince Charles Mountains at the southern end of the Lambert Glacier. The survey control point AUS368 was installed in 2002/03 during the Prince Charles Mountains Expedition of Germany-Australia (PCMEGA) campaign (Johnston, Manning, Dawson et al. 2003) and in 2003/04 the CORS equipment was installed at the site. Since then the site was been visited twice in 2006/07 (Brown and Woods 2009) and 2008/09 (Ruddick, Woods and Brown 2009). In 2008/09 the wind turbine was removed and the installation simplified. The CORS monument is located on a small rise within an undulating lateral moraine, mid-way along the northern face of Wilson Bluff (Figure 5.4). The marker is defined by the intersection of a stainless steel plate with a stainless steel 5/8” vertical spigot, anchored to an in-situ rock (Brolsma and Corvino 2007, updated 2008) via three levelling screws. The Antenna sits on a 0.0305m stainless steel shim and is orientated north. There are two additional survey control points in the vicinity; a marker (WBF0) established by the Dresden University of Technology during the PCMEGA campaign (Johnston, Manning, Dawson et al. 2003) located approximately 100 m south of AUS368, and a trigonometrical marker (NMS281) located on the eastern summit. The marker WBF0 consists of a vertical 5/8” spigot drilled into rock and acts as a reference mark for AUS368.
Figure 5.4: The CORS at Wilson Bluff is located on a rock outcrop beside the campsite. 5.2.1 Site Assessment During the 2010/11 season the CORS site was visited for maintenance and data download between 11 and 13 January 2011. On arrival the system was non-operational and the batteries drained, but the solar panels and frame were in perfect condition. On further inspection it was discovered that the Plasmatronics PL20 solar regulator had failed during the 2010 winter. A new regulator was installed, along with four new batteries restoring the site to full operational capacity. The setup now consists of a Leica GRX1200 Pro (Firmware 4.12/2.122) receiver connected to an ASH701945E_M antenna covered by an SCIS style radome by a 10 m length of RJ58 coaxial cable with a short 0.3 m extension at the receiver end (Figure 5.5). Four 12 V 74 Ahr GelTech batteries provide power to the equipment. The batteries are charged by four 3 Amp 12 V solar panels (2 x VLX53 and 2 x SX50U) connected to a Plasmatronics PL20 solar regulator, which is setup to shut down the load if the battery voltage drops below 11.5 V. A 4 Gb SanDisk Ultra II CF card is used to store the data and allows for up to 4 years of data recorded at 30-second epochs.
48

Antarctic Geodesy Field Report 2010/2011
a) b) c) d)
e) f) Figure 5.5: a) the Wilson Bluff CORS antenna facing north, b) east, c) south, d) west, e) inside the equipment box and f) the solar panel frame.
49

Antarctic Geodesy Field Report 2010/2011
5.2.2 Local Monitoring Survey There has been some doubt to the local stability of the CORS monument at Wilson Bluff (Figure 5.6), due to the environment being a moraine field. In 2004 observations were made on rock type and orientation and the monument was considered to be in-situ (Brolsma and Corvino 2007, updated 2008). To monitor the stability of the site GPS data is routinely observed on the nearby “Dresden” mark WBF0. During the visit a local monitoring survey was undertaken using a GPS survey method. 24 hours of observations were made on WBF0. Independent baselines were formed holding the CORS (A368) fixed to its [email protected] coordinates. The computed results are shown in Tables 5.1-5.3. Table 5.1: Final geodetic coordinates from the 2011 Wilson Bluff local monitoring survey. GRS80 ellipsoid aligned to ITRF2005 at 1 January 2000. Heights are ellipsoidal. Final estimates of precision are shown as 1σ in mm.
SITE LATITUDE σ LONGITUDE σ HEIGHT (M) σ
AUS368 -74° 17’ 26.0782 0.002 66° 47’ 32.0358 0.002 1235.797 0.003
WBF0 -74 17 28.43685 0.002 66 47 32.62993 0.002 1240.407 0.002
Table 5.2: Final Cartesian coordinates from the 2011 Wilson Bluff local monitoring survey. GRS80 ellipsoid aligned to ITRF2000 at 1 January 2000. Final estimates of precision are shown as 1σ in mm.
SITE X σ Y σ Z σ
AUS368 682780.468 0.002 1592449.829 0.002 -6118988.512 0.003
WBF0 682748.602 0.002 1592388.242 0.002 -6119012.754 0.002
Table 5.3: Comparison between the previous Wilson Bluff local monitoring surveys.
Year AUS368 to … Δ east Δ north Δ up range
2001 WBF0 n/a n/a n/a n/a
2006 WBF0 n/a n/a n/a n/a
2010 WBF0 5.0181 -73.1412 4.6106 73.4580
Std Dev 0.002 0.002 0.002 0.002
Figure 5.6: From left to right. The GPS antenna set up on WBF0 and A368.
50

Antarctic Geodesy Field Report 2010/2011
5.3 GROVE MOUNTAINS The Grove Mountains are a group of mountains and nunataks in Princess Elizabeth Land, approximately 500 km southwest of Davis station and 160 km east of the Mawson escarpment. The survey control point AUS351 was installed in 2000/01 by surveyors from GA (Johnston and Digney 2001) and in 2003/04 (Brolsma and Corvino 2007, updated 2008) the CORS equipment was installed at the site. Since then the site has been visited three times in 2004/05 (Naebkhil and Moore 2005), 2006/07 (Brown and Woods 2009) and 2008/09 (Ruddick, Woods and Brown 2009). In 2008/09 the installation was simplified and a new solar panel frame was installed. There was also the intention to install a Forgen 1000 vertical bladed wind turbine, but this was damaged during transport. The CORS monument is located on a flat ledge at the northern end of a small nunatak to the southwest of Mount Harding (Figure 5.7). The marker is defined by the intersection of a 150 mm stainless steel plate with a stainless steel 5/8” vertical spigot, anchored to bedrock via a small concrete pillar. The Antenna sits on a 0.0305m stainless steel shim and is orientated north. There are three reference marks situated in close proximity to the GPS antenna. There are also a number survey control points established by Chinese Antarctic Research Expedition (CHINARE) during their visits to the Grove Mountains.
Figure 5.7: The CORS at the Grove Mountains is located on the nunatak behind the campsite. 5.3.1 Site Assessment During the 2010/11 season the CORS site was visited for maintenance and data download between 13 and 17 January 2011. On arrival the site was discovered to have malfunctioned in April 2009, shortly after being established in December 2008. The problem was attributed to the power system, the Plasmatronics PL20 regulator was showing signs of failure and one of the solar panels behaving erratically. The solar panels and frame were still upright and in perfect condition. The setup now consists of a Leica GRX1200 Pro (Firmware 4.12/2.122) receiver connected to an ASH701945E_M antenna covered by an SCIS style radome by a 10 m length of RJ58 coaxial cable with a short 0.3 m extension at the receiver end. Four 12 V 74 Ahr GelTech batteries provide power to the equipment. The batteries are charged by four 3 Amp 12 V solar panels (2 x VLX53 and 2 x SX50U) connected to a Plasmatronics PL20 solar regulator, which is setup to shut down the load if the battery voltage drops below 11.5 V. A 4 Gb SanDisk Ultra II CF card is used to store the data and allows for up to 4 years of data recorded at 30-second epochs. Figure 5.8 shows a detailed diagram on how the setup is connected.
51

Antarctic Geodesy Field Report 2010/2011
a) b) c) d)
e) f) Figure 5.8: a) the Grove Mountains CORS antenna facing north, b) east, c) south, d) west, e) inside the equipment box and f) the solar panel frame.
52

Antarctic Geodesy Field Report 2010/2011
5.3.2 Local Monitoring Survey During the visit a local monitoring survey was undertaken using a GPS survey method. A minimum of 6 hours data were observed at each of the three local reference marks. Independent baselines were formed by holding the CORS (A351) fixed to its [email protected] coordinates. The computed results are shown in Tables 5.4-5.6. Table 5.4: Final geodetic coordinates from the 2011 Grove Mountains local monitoring survey (AUSPOS derived). GRS80 ellipsoid aligned to ITRF2005 at 1 January 2000. Heights are ellipsoidal. Final estimates of precision are shown as 1σ in mm.
SITE LATITUDE σ LONGITUDE σ HEIGHT (M) σ
AUS351 -72° 54 29.1767 0.001 74° 54 36.4296 0.001 1907.467 0.001
AUS351-RM1 -72° 54 28.6150 0.002 74° 54 35.40383 0.002 1903.810 0.003
AUS351-RM2 -72° 54 29.7726 0.002 74° 54 36.2853 0.002 1904.974 0.003
AUS351-RM3 -72° 54 29.2118 0.002 74° 54 34.7517 0.002 1903.287 0.004
Table 5.5: Final Cartesian coordinates from the 2011 Grove Mountains local monitoring survey. GRS80 ellipsoid aligned to ITRF2005 at 1 January 2000. Final estimates of precision are shown as 1σ in mm.
SITE X σ Y σ Z σ
AUS351 489658.740 0.001 1816031.161 0.001 -6076059.187 0.001
AUS351-RM1 489671.8240 0.002 1816043.7600 0.002 -6076050.5730 0.003
AUS351-RM2 489655.2200 0.002 1816013.0560 0.002 -6076062.2340 0.003
AUS351-RM3 489672.9210 0.002 1816024.9850 0.002 -6076055.5120 0.004 Table 5.6: Comparison between the previous Grove Mountains local monitoring surveys.
Year AUS361 to … Δ east Δ north Δ up range
2001 AUS361-RM1 n/a n/a n/a n/a
2006 AUS361-RM1 n/a n/a n/a n/a
2010 AUS361-RM1 -9.3529 17.4148 -3.6572 20.1029
Std Dev 0.002 0.002 0.002 0.002
2001 AUS361-RM2 n/a n/a n/a n/a
2006 AUS361-RM2 n/a n/a n/a n/a
2010 AUS361-RM2 -1.3147 -18.4801 -2.4946 18.6940
Std Dev 0.002 0.002 0.002 0.002
2001 AUS361-RM3 n/a n/a n/a n/a
2006 AUS361-RM3 n/a n/a n/a n/a
2010 AUS361-RM3 -15.2998 -1.0908 -4.1802 15.8981
Std Dev 0.002 0.002 0.002 0.002
53

Antarctic Geodesy Field Report 2010/2011
5.4 BUNGER HILLS Bunger Hills is a coastal range located along the Knox Coast in Wilkes Land. The AAD maintain a summer station, Edgeworth David (Figure 5.9), in the western section of the Bunger Hills consisting of 2 melon huts and 2 apple huts. The survey control point and CORS station was established in 2006/07 (Brown and Woods 2009) and collected data continuously until the 2008 winter when the receiver failed. AAD pilots visited the site in 2008/09 from Casey to remove the damaged equipment (Ruddick, Woods and Brown 2009). The CORS monument is located on a small hill approximately 275 m southwest of the Edgeworth David camp. The marker is defined by the intersection of a stainless steel plate with a stainless steel 5/8” vertical spigot, anchored to bedrock via three levelling screws. The antenna sits on a 0.0305m stainless steel shim and is orientated north. Surrounding the marker are three reference marks, which consist of an un-levelled stainless steel spigot drilled and set into rock. There are a number of other survey control marks scattered around the western section of the Bunger Hills: NMS238 is located in-front go the Edgeworth David camp; NMS237 is located at the nearby abandoned Polish station, Drobrowolski; NMS240 is located on an island along the eastern coastline and NMS239 along the south-western edge beside the plateau. During the 2010/11 season the CORS site was visited between 19 and 21 January 2011. Air support was provided for a return trip out of Davis station using the Twin Otter aircraft. The sea ice beside Edgeworth David camp provides a relatively safe landing spot with plenty of fuel.
Figure 5.9: The CORS at the Bunger Hills is located on a hill next to the Edgeworth David camp. 5.4.1 Site Assessment The majority of equipment was removed during the 2008/09 season, only the solar panel frame, two solar panels and antenna remained. The solar panels were replaced, due to corrosion on the cables, and an additional two panels added. A new insulated equipment box was installed along with the original (repaired) Leica GRX1200 Pro receiver, Plasmatronics PL20 regulator, 4 GelTech 12 V 74 Ahr batteries and a new 10 m antenna cable. The new site is an identical setup to those at the Grove Mountains and Wilson Bluff. The setup now consists of a Leica GRX1200 Pro (Firmware 4.12/2.122) receiver connected to an LEIAT504 antenna covered by an SCIS style radome by a 10 m length of RJ58 coaxial cable with a short 0.3 m extension at the receiver end. Four 12 V 74 Ahr GelTech batteries provide power to the equipment. The batteries are charged by four 3 Amp 12 V solar panels (4 x SX50U) connected to a Plasmatronics PL20 solar regulator, which is setup to shut down the load if the battery voltage drops below 11.5 V. A 4 Gb SanDisk Ultra II CF card is used to store the data and allows for up to 4 years of data recorded at 30-second epochs. Photographs of the station are shown in Figure 5.10.
54

Antarctic Geodesy Field Report 2010/2011
a) b)
c) d)
e) f) Figure 5.10: a) the Bunger Hills CORS antenna facing north, b) east, c) south, d) west, e) inside the equipment box and f) the solar panel frame.
55

Antarctic Geodesy Field Report 2010/2011
5.4.2 Local Monitoring Survey Despite reference marks being installed a local monitoring survey has never been conducted at the CORS site. During this visit GPS data were recorded for a minimum of 6 hours at each of the three reference marks in turn and in conjunction with data being recorded at the CORS site. Due to the reference mark spigots not being level a tribrach was used mount the antenna. The computed results are shown in Tables 5.7-5.9. Table 5.7: Final geodetic coordinates from the 2011 Bunger Hills local monitoring survey (AUSPOS derived). GRS80 ellipsoid aligned to ITRF2005 at 1 January 2000. Heights are ellipsoidal. Final estimates of precision are shown as 1σ in mm.
SITE LATITUDE σ LONGITUDE σ HEIGHT (M) σ
BHIL -66 15 04.924 0.002 100 35 54.8904 0.002 18.006 0.003
BHIL-RM1 -66 15 04.69433 0.002 100 35 55.1637 0.002 17.150 0.003
BHIL-RM2 -66 15 05.44149 0.002 100 35 55.4130 0.002 17.933 0.003
BHIL-RM3 n/a n/a n/a
Table 5.8: Final Cartesian coordinates from the 2011 Bunger Hills local monitoring survey. GRS80 ellipsoid aligned to ITRF2000 at 1 January 2000. Final estimates of precision are shown as 1σ in mm.
SITE X σ Y σ Z σ
BHIL -473772.994 0.002 2531930.486 0.002 -5815308.594 0.003
BHIL-RM1 -473777.484 0.002 2531935.920 0.002 -5815304.945 0.003
BHIL-RM2 -473776.705 0.002 2531914.835 0.002 -5815314.982 0.003
BHIL-RM3 n/a n/a n/a
Table 5.9: Comparison between the previous Bunger Hills local monitoring surveys.
Year BHIL to … Δ east Δ north Δ up range
2001 BHIL-RM1 n/a n/a n/a n/a
2006 BHIL-RM1 n/a n/a n/a n/a
2010 BHIL-RM1 3.4139 7.1144 -0.8564 7.9375
Std Dev 0.002 0.002 0.002 0.002
2009 BHIL-RM2 n/a n/a n/a n/a
2004 BHIL-RM2 n/a n/a n/a n/a
2002 BHIL-RM2 6.5263 -16.0291 -0.0736 17.3070
Std Dev 0.002 0.002 0.002 0.002
2009 BHIL-RM3 n/a n/a n/a n/a
2004 BHIL-RM3 n/a n/a n/a n/a
2002 BHIL-RM3 n/a n/a n/a n/a
Std Dev 0.002 0.002 0.002 0.002
56

Antarctic Geodesy Field Report 2010/2011
5.5 MT CRESWELL
Figures 5.11: Mt Creswell as approached from the North via helicopter. The site is located approximately 100m from a large rock cairn near the shear cliff in the centre south region of the mountain. The Mt Creswell CORS station was initially established at site AUS367 (Latitude: 72° 44’ 13.0273” S, Longitude: 64° 15’ 03.567” E) on the 17th of December 2003 as part of the PCMEGA campaign (Figure 5.11). The GPS monument is a stainless steel plate, with 5/8” spigot, drilled into an outcropping granite dyke 100m north of the survey cairn on the top of Mt. Creswell (Figure 5.12). Mt. Creswell is known to be notorious for its incessant katabatic winds and blowing snowdrift which make operations at the site substantially difficult and leaves equipment susceptible to damage. Accordingly the original apparatus was aligned roughly east-west along the trend of the outcrop to counter the prevailing southerly winds (Figure 5.12). This was to prevent any one piece of equipment from being buried by snowdrift accumulating in the lee of another. The wind turbine was located 10m to the west of the GPS antenna and away from any turbulence generated by the other equipment. 5.5.1 Site Assessment The site was revisited on the 9th of February 2011 to retrieve data and possibly dismantle according to a condition report. The mission was tasked as a day trip (approximately 12 hours) out of Davis via two Squirrel Helicopters taking advantage of fuel dumps at Fisher Massif, Beaver Lake and Samson Island. Unfortunately, upon arrival at the Mt. Creswell location the site was found to be severely damaged and the majority of equipment lost to the frequent blizzards encountered in the area. A helicopter reconnaissance around the immediate area was unable to locate any further parts to the setup. The solar panel frame, antenna cable, GPS receiver, and computer were unable to be located. The battery box was still on site, but badly damaged due to exploding batteries. The wind turbine frame was still standing, however this was somewhat damaged and non functional due to damage on the turbine blades.
57
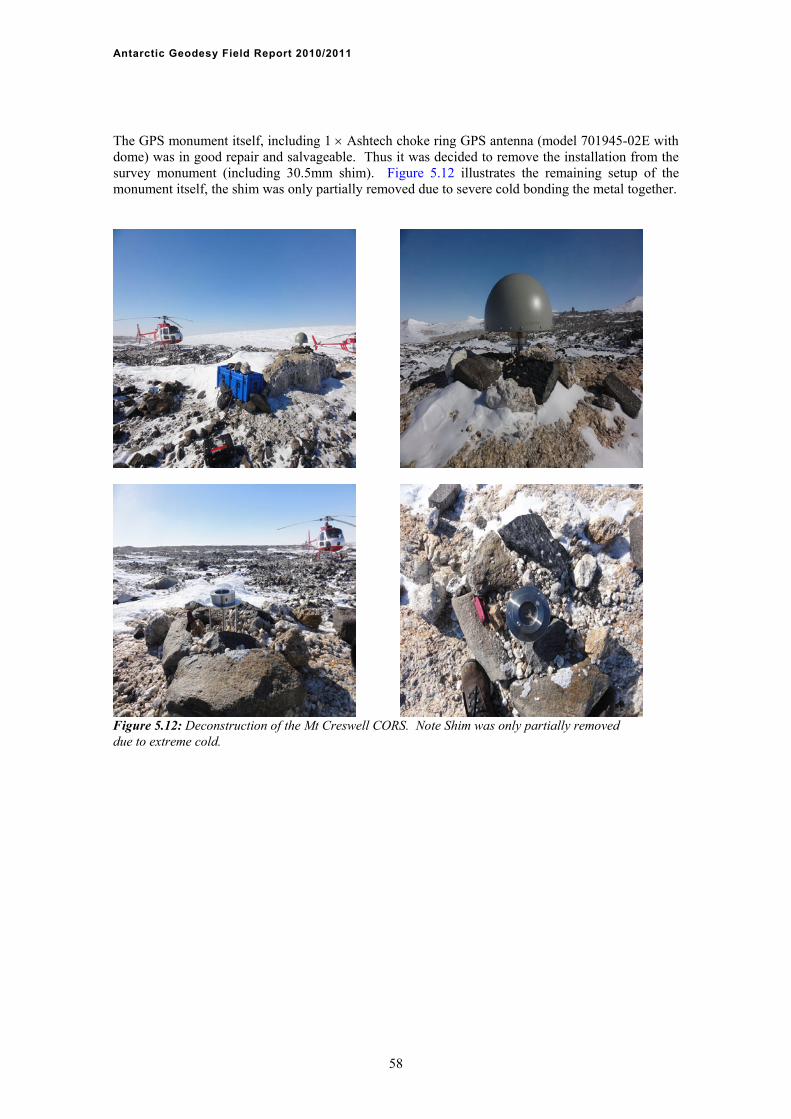
Antarctic Geodesy Field Report 2010/2011
58
The GPS monument itself, including 1 Ashtech choke ring GPS antenna (model 701945-02E with dome) was in good repair and salvageable. Thus it was decided to remove the installation from the survey monument (including 30.5mm shim). Figure 5.12 illustrates the remaining setup of the monument itself, the shim was only partially removed due to severe cold bonding the metal together.
Figure 5.12: Deconstruction of the Mt Creswell CORS. Note Shim was only partially removed due to extreme cold.

Antarctic Geodesy Field Report 2010/2011
6. Lake Levelling In support of the long running AAD lake levelling program relative height differences were measured between water levels and nearby benchmarks of 25 lakes scattered throughout the Vestfold Hills (Figure 6.1). Two-way level runs were undertaken at each lake to determine the height difference using a Topcon Digital Level and calibrated bar-code staff. The lakes were visited with helicopter support during January and February 2011. The average temperatures during the 2010/11 summer have been colder than usual; as a result a number of the lakes surveyed still had significant coverage of ice on the surface which could have biased the results. The lake levels are shown in Table 6.2 and compared with the values from the 2007 and 2009 surveys. Compared with the previous two surveys the majority of lakes are showing a decrease in the water level. The average change across all lakes compared with the 2009 survey was -0.116 m. The largest decrease was at Watts Lake (-0.532m), while only two lakes, Lake Pauk and Lake Zvebda showed increases. These lakes are the closet to the plateau and would be most affected by melt water run-off; Lake Pauk was also mostly frozen during the survey. During the survey readings were also made where applicable to permanent level staffs. The level at Deep Lake has been observed every month since the 1970’s. The level is read using a graduated staff situated in a bay at the north-western corner of the lake (Figure 6.1). To verify the calibration of the staff the level was read at the same time as the height difference from the benchmark, NMV/S/8 was calculated (Table 6.1). The stave has 10 mm graduations, hence the levels are generally observed to the nearest 5 mm. Table 6.1 shows the comparison of the calibration values for the 2011 survey with those of 2007 and 2009. During this time the staff does not appear to have moved locally and remains calibrated, Table 6.1: Level staff calibration value at Deep Lake for 2007, 2009 and 2011. Units are in metres.
LAKE NAME BENCHMARK DATE LAKE LEVEL STAFF LEVEL DIFFERENCE
Deep Lake NMV/S/8 1-Mar-07 -0.925 0.730 -1.655
Deep Lake NMV/S/8 9-Feb-09 -1.104 0.548 -1.652
Deep Lake NMV/S/8 25-Nov-10 -1.242 0.415 -1.657
Deep Lake NMV/S/8 29-Jan-11 -1.235 0.425 -1.660
Figures 6.1: a) level staff at Deep Lake, b) calculating the height difference between the benchmark and lake level at Pendant Lake.
59

An
tarc
tic G
eo
de
sy
Fie
ld R
ep
ort 2
01
0/2
01
1
DATE
28-Jan-11
24-Jan-11
29-Jan-11
15-Feb-11
29-Jan-11
28-Jan-11
2-Feb-11
3-Feb-11
15-Feb-11
24-Jan-11
3-Feb-11
24-Jan-11
29-Jan-11
15-Feb-11
3-Feb-11
24-Jan-11
2-Feb-11
2-Feb-11
28-Jan-11
29-Jan-11
24-Jan-11
28-Jan-11
29-Jan-11
29-Jan-11
2-Feb-11
2011
-1.817
-3.952
-3.914
-1.235
-2.285
-4.605
-2.940
-2.462
-13.405
-1.718
-3.262
-3.867
-4.018
-16.991
-1.234
-5.223
-3.757
-2.608
-3.996
-3.115
-3.529
-2.673
-3.053
-4.285
-11.340
DATE
2-Feb-09
15-Feb-09
10-Feb-09
9-Feb-09
10-Feb-09
3-Feb-09
17-Feb-09
11-Feb-09
9-Feb-09
18-Feb-09
10-Feb-09
15-Feb-09
11-Feb-09
9-Feb-09
15-Feb-09
17-Feb-09
18-Feb-09
2-Feb-09
10-Feb-09
15-Feb-09
2-Feb-09
10-Feb-09
17-Feb-09
2009
-1.784
-3.828
-3.813
-1.104
-2.212
-4.522
-2.853
-2.385
-13.218
-1.596
-3.105
-3.795
-3.959
-16.881
-1.265
-3.627
-2.355
-3.842
-2.944
-3.581
-2.637
-3.001
-10.808
DATE
2-Mar-07
2-Mar-07
1-Mar-07
1-Mar-07
1-Mar-07
2-Mar-07
2-Mar-07
3-Mar-07
1-Mar-07
3-Mar-07
1-Mar-07
2-Mar-07
1-Mar-07
1-Mar-07
3-Mar-07
2-Mar-07
2-Mar-07
2-Mar-07
1-Mar-07
3-Mar-07
2-Mar-07
1-Mar-07
2-Mar-07
LAKE LEVELS
2007
-1.719
-3.660
-3.659
-0.925
-2.035
-4.282
-2.679
-2.229
-13.093
-1.814
-3.087
-3.646
-3.546
-16.705
-1.270
-3.519
-2.313
-3.928
-2.756
-3.746
-2.689
-2.865
-10.547
BM HEIGHT
10.817
-4.838
-34.305
-49.656
0.423
16.970
6.078
36.595
3.765
9.755
-34.087
1.664
30.083
2.654
17.150
2.755
16.791
-1.196
5.761
-26.106
N/A
5.792
-4.374
-8.142
4.395
BENCHMARK
NMVS75
NMVS58
NMVS20
NMVS8
NMVS24
NMVS40
NMVS78
NMVS67
NMVS06
NMVS72
NMVS69
NMVS59
NMVS66
NMVS15
NMVS63
NMVS57
NMVS36
NMVS74
NMVS53
NMVS21
AUSV4
NMVS43
NMVS22
NMVS19
NMVS35
LAKE NAME
Ace Lake
Clear Lake
Club Lake
Deep Lake NW
Ekho Lake
Lake Abraxas
Lake Anderson
Lake Braunsteffer
Lake Dingle
Lake Druzhby
Lake Jabs
Lake McCallum
Lake McNeil
Lake Stinear SW
Lake Zvezda
Laternula Lake
Lebed' Lake
Oblong Lake
Organic Lake
Oval Lake
Pauk Lake
Pendant Lake
Shield Lake
Triple Lake
Watts Lake
Table 6.2: Vestfold Hills Lake levelling results. Benchmark heights are given with respect to Davis MSL 1983. Units are in metres.
60

Antarctic Geodesy Field Report 2010/2011
Figures 6.2: Lakes that were levelled in the Vestfold hills
61

Antarctic Geodesy Field Report 2010/2011
7. Australian Antarctic Division Projects 7
.1 DAVIS STATION
Geoscience Australia maintains high order survey control network throughout Davis station. This control set was most recently comprehensively surveyed (both horizontally and vertically) during the 2008/09 season to provide latest accurate ITRF coordinates. This was supported by linking terrestrial surveys to the reference mark survey of the ARGN Davis site (AUS099). Additional GNSS surveys have also been carried out on various marks around station and integrated with terrestrial survey data. During 2010/11 several days of GPS data was collected over four days to complement previous GNSS data over other station control points. The derived ITRF coordinates from the GNSS surveys have subsequently been adjusted alongside the terrestrial data to produce a best fit survey network. Final coordinates have been provided to the AAD mapping group to upgrade records of station spatial infrastructure Height has been established via the precise levelling tasks performed early season and aligned to MSL values. 7.1.1 Detail and Engineering Surveys Engineering surveys were conducted on a number of areas around station during the 10/11 season. This included the wharf, water tank holding area, mechanics workshop, new field store, new living quarters, Australian Geological Survey Office (AGSO) building (pineapple) and pumphouse foundations. The purposes of these surveys was to provide the onsite construction/plant manager (Mark Pekin) with appropriate information for the shift of a number of plant and building facilities and to also provide up to date mapping information for the update of AAD records. Detail and construction was enabled via the Davis Station Survey control network re-established this season (Figure 7.1). Control was derived from the ITRF2000 coordinate values from the 2008/09 Antarctic Geodesy Report. UTM values (Zone 43) where derived from Redfern’s formula via the Geoscience Australia Geodesy Calculation homepage: http://www.ga.gov.au/earth-monitoring/geodesy/geodetic-techniques/calculation-methods.html Corresponding values are listed in Table 7.1 and Table 7.2. Table 7.1: ITRF 2000 @ 2000 Coordinates for Davis Station Control network.
Mark Latitude Longitude E. Height MSL
AUS099 -68° 34’ 38.36207” 77° 58’ 21.40903” 44.4160 27.8629
RM1 -68° 34’ 36.94421” 77° 58’ 21.69995” 42.0891 25.5358
RM2 -68° 34’ 38.69743” 77° 58’ 22.27437” 43.9720 27.4187
RM3 -68° 34’ 38.63382” 77° 58’ 21.17215” 43.4683 26.9150
D16 -68° 34’ 34.59611” 77° 58’ 24.26627” 40.0034 23.4501
D3 -68° 34’ 32.54282” 77° 58’ 15.07076” 39.6331 23.0798
D4B -68° 34’ 29.25151” 77° 58’ 11.28110” 35.0815 18.5282
AUS303 -68° 34’ 24.64743” 77° 58’ 06.16749” 32.0475 15.4943
D5 -68° 34’ 30.59139” 77° 58’ 06.56102” 36.4687 19.9154
D9 -68° 34’ 34.43692” 77° 57’ 59.12868” 31.5934 15.0400
CON18 -68° 34’ 38.95082” 77° 58’ 00.74882” 32.1806 15.6272
D2 -68° 34’ 35.56651” 77° 58’ 11.06226” 40.3710 23.8177
62

Antarctic Geodesy Field Report 2010/2011
Table 7.2: UTM Zone 43 Coordinates for Control used in Engineering surveys.
Survey Mark Easting Northing
Height
D9 620880.859 2389974.814
31.5934
CON18 620892.447 2389834.264
32.1806
D2 621014.162 2389933.348
40.3710
D3 621064.025 2390024.715
39.6331
RM3 621123.935 2389832.916
43.4683
RM2 621136.308 2389830.345
43.9720
D4B 621026.074 2390128.623
35.0815
63

Antarctic Geodesy Field Report 2010/2011
#
#
#
##
#
#
#
#
#
D9
D5 D4
D3
D2
D16
NMVS4
CON18
AUS186
AUS099
Davis Station Survey MarksProduced from Survey by Geoscience Australia (2009)
Building Information from the Australian Antarctic Division Data Centre (2008)
Figure 7.1: Davis Control network diagram 2010.
64

Antarctic Geodesy Field Report 2010/2011
7.1.2 ‘Pineapple’ Foundations Works relating to the movement of the ‘Pineapple’ or new AGSO supply building included the location of underground service pipes within a trench from the EVS shed (Figure 7.2a). The foundation blocks of the pineapple were also surveyed. Each circular concrete block was (615mm diameter) and embedded into the crushed rock below (Figure 7.2b)
a) b)
Figure 7.2: a) underground Service Pipes running from EVS and b) foundation pillars This survey also located the horizontal and vertical position of the recently installed gravity mark within the EVS shed (installed 2008/09). 7.1.3 Water Tank Holding Area A topographical survey was completed to ascertain the size and grade of the area immediately adjacent to the existing water tanks and between the running pipes, TAD and Hothouse.
a) b)
Figure 7.3: Back view of Water Holding Tanks
65

Antarctic Geodesy Field Report 2010/2011
Plans were drawn up with 0.1m contours to indicate grade. Water tanks had an approximate diameter of 17m (Figure 7.3). 7.1.4 Wharf and Boat Ramp Detail and topography around the existing boat ramp and concrete foundations was surveyed to determine the possibility of extending the existing structure. 0.25m contours where provided in a topographic plan of the area. 7.1.5 Pumphouse Extension and Foundations Works on the pumphouse extension foundations were surveyed (Figure 7.4). At the time of survey, concrete base blocks had been laid, their relevant size (820mm) and level have been indicated on the reduced survey data.
Figure 7.4: Pumphouse extension foundations 7.1.6 New Living Quarters The new Living Quarters (LQ) has been an ongoing project and was still under construction at the end of summer (Figure 7.5). The walkway connecting new LQ to old LQ had been completed along with the entirety of the building outside structure (including veranda). These features have all been surveyed along with independent floor levels (3 x floor levels).
66

Antarctic Geodesy Field Report 2010/2011
Figure 7.5: New Living Quarters as of 20/2/2011 7.1.7 Workshop Extension Detail and topography were surveyed in the area adjacent to existing mechanics workshop for the possibility of extension. 7.1.8 New Field Store The foundations for the new field store had just been completed at the time of survey and work was being performed on construction of the building (Figure 7.6). All surveys have been reduced using ITRF 2000 coordinates and plans drawn up in *.dwg format. The onsite construction manager received completed copies of plans.
67

Antarctic Geodesy Field Report 2010/2011
7.2 MAWSON STATION As part of the regular station updates for the AAD a detail survey was completed on the 22nd of December to incorporate new building works amongst the greater station area. The location of several small buildings was updated from initial estimates provided on the previous station detail map (2008/09). These buildings included the Field Store, Riggers Hut, Service Huts and Emergency Food supplies container (Figure 7.6 and Figure 7.7). Horizontal control was established via a minimally constrained adjusted network using the AUS64 reference marks (RM2 and RM3). Subsequent heights were derived from the levelling activities associated with the tide gauge levelling. ISTS51 and ISTS_RM2 were used as primary control with ITRF2000 coordinates transformed to WGS84 (UTM41) for alignment with existing detail plans. The heights are reduced levels determined with respect to the MSL of ISTS051 (9.792m). The computed results are listed in Table 7.3 and Table 7.4. Table 7.3: Geocentric Cartesian coordinates (ITRF 2000) for Mawson Horizontal Control.
Name X Y Z
RM2 1111262.367 2168911.568 -5874497.628
RM3 1111308.469 2168919.068 -5874483.008
NAIL 1111309.710 2169164.386 -5874375.965
AUS251 1111200.924 2169135.801 -5874411.991
ISTS51 1111342.232 2169267.329 -5874328.166
ISTS51_RM2 1111326.035 2169272.004 -5874331.541 Table 7.4: UTM zone 41 coordinates for Mawson Horizontal Control.
Name East North Reduced Level
RM2 494525.467 2501182.223 31.9548
RM3 494487.807 2501213.310 28.9902
NAIL 494598.016 2501456.609 13.4241
AUS251 494681.937 2501373.706 18.1391
ISTS51 494615.763 2501573.229 9.7920
ISTS51_RM2 494632.313 2501568.998 11.6835
68
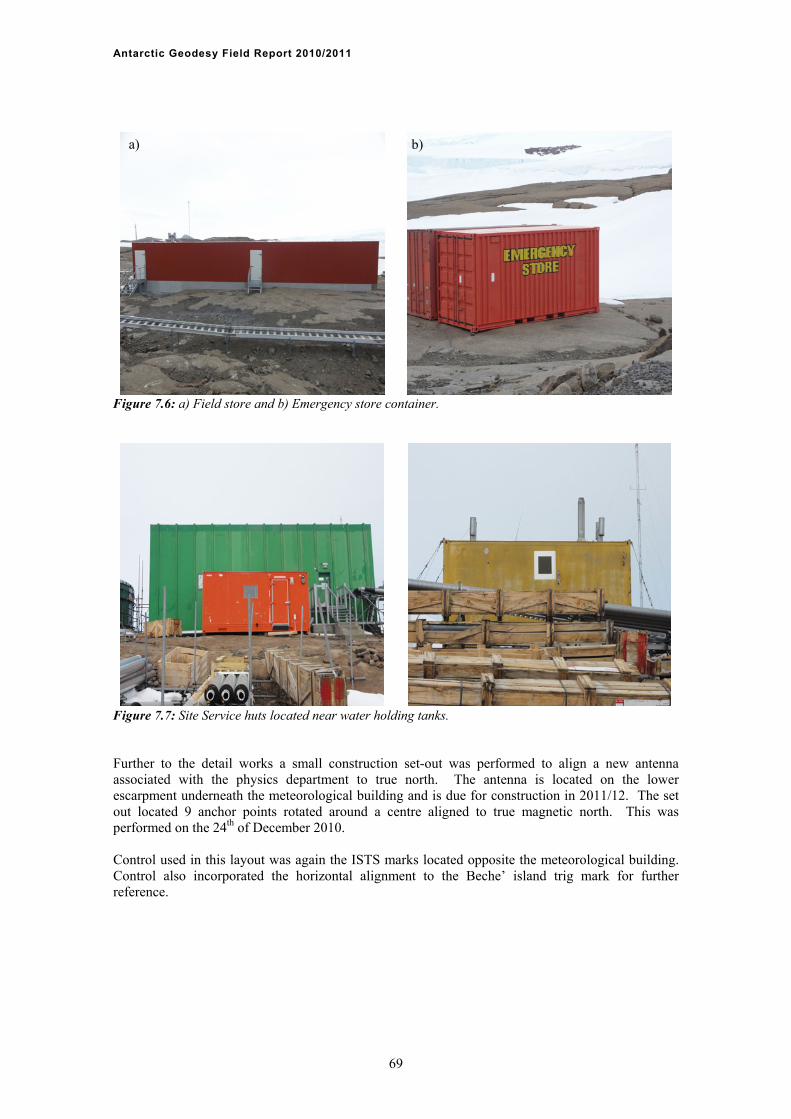
Antarctic Geodesy Field Report 2010/2011
a) b)
Figure 7.6: a) Field store and b) Emergency store container.
Figure 7.7: Site Service huts located near water holding tanks. Further to the detail works a small construction set-out was performed to align a new antenna associated with the physics department to true north. The antenna is located on the lower escarpment underneath the meteorological building and is due for construction in 2011/12. The set out located 9 anchor points rotated around a centre aligned to true magnetic north. This was performed on the 24th of December 2010. Control used in this layout was again the ISTS marks located opposite the meteorological building. Control also incorporated the horizontal alignment to the Beche’ island trig mark for further reference.
69

Antarctic Geodesy Field Report 2010/2011
70
7.3 SUPPORT TO OTHER PROGRAMS As well as supporting the AAD in numerous infrastructure and engineering tasks, GA has been able to lend spatial support to a number of independently tasked scientific programs. This is an important facet and key objective of both the ongoing GA project and also the agencies commitment to GIANT. It is envisioned that the geodetic infrastructure already established within the AAT will further compliment future programs. During the 2010/11 season support was provided to Jan Lisser and Kym Newberry of the University of Tasmania (UTAS) within their sea ice measurement research project. The use of high rate (1 second) data from permanent geodetic installations to supply kinematic positioning was essential to the success of the project. Further spatial support was supplied via the GA survey team with a high order survey conducted to the outfit of instruments to the support helicopter. High rate GNSS data at Casey was also used to aid in the calibration of the new series Cryosat Earth Monitoring Satellites. Data from the Casey CORS site was tasked to obtain precise static positioning of essential ground truthing on specific Cryosat passes. GNSS data from field campaigns and permanent installations has been routinely distributed to a number of projects, including Newcastle University, UK, with which analysis on the contemporary motion of the Antarctic plate has been performed. Matt King from Newcastle University has acknowledged the use of GA’s geodetic infrastructure on his recent Antarctic GPS velocity field paper which is due for release in July 2011.

Antarctic Geodesy Field Report 2010/2011
8. Recommendations Under the 2011/12 – 2020/21 AAD strategic plan the role of Geodesy has a large ongoing contribution. Specifically, Geodesy features amongst three out of the four identified feature groups of the plan, including Climate processes and Change, Continental Ecosystems and Frontier Science, where it can feature in both primary and support roles. Continuation of the program will aim to extend established geodetic infrastructure and also improve the continuity and quality of existing fundamental sites and the integration of their data sets amongst the greater scientific community. These continual refinements have flow on benefits including the support of numerous scientific projects requiring precise spatial support and of course improving our continual understanding of crustal deformation throughout the continent. GA’s involvement within SCAR and more specifically GIANT has also been a focus for a long time and it is envisioned that this will continue into the next decade. The challenge of the program is to incorporate a key set of objectives that can be met by the contributing parties. The 2011 GIANT meeting will focus on addressing a simplified program with a key aim to be able to deliver data portals to all freely available data, making this accessible to the greater SCAR community. 8.1 MODERNISATION GNSS modernisation of CORS sites is an objective being met through the installation of GNSS receivers capable of tracking the new Galileo satellites recently launched by the European space agency. In the coming years it is envisioned that all permanent installations will have full GNSS capabilities which will hopefully translate into an improvement in position resolution. With communications technologies also improving, permanent installations will always remain a target for improvement. The current setups have been trialled successfully over a number of years, however it is envisioned that further safeguards can be introduced into the system to reduce network outages and lost or delayed data. 8.2 NETWORK DENSIFICATION Future expeditions will aim to establish further CORS installations to densify the high order network and enhance understanding of Antarctic geodynamics. A possibility remains in 2011/12 to establish a Commonwealth Bay site, dependant on available budget. With a focus on improving the quality of observations within the AAGN, a key component of future GNSS campaigns will focus on the areas of the West Prince Charles Mountains. The area, West of Beaver Lake, has not been accessed for a number of years, but contains many Australian National Mapping Geodetic marks that have been originally observed via traditional methods and thus are key candidates for GNSS observations (and improved position resolution). Such campaigns would act to significantly strengthen the precision and accuracy of the overall AAGN adjustment which is heavily weighted in the immediate Davis/Vestfold hills area and Southern PCM’s. Access and Logistics to these areas is the main deterrent, although there has been an effort made in recent years to improve the Traverse capabilities of the AAD. With Helicopter and Fixed win support continuing, GA may have the opportunity to access these areas in upcoming campaigns. 8.3 NETWORK PROCESSING The collation and adjustment of the existing AAGN is also a focus of the program, with results to be incorporated amongst the NGRS project and recently updated database. There has been a distinct transition of data from original adjustment package Newgan to Dynanet over the past 4 years. It is an aim to continue the process of data formatting and adjustment within the Dynanet package and regularly produce updated results related to latest ITRF datum.
71

Antarctic Geodesy Field Report 2010/2011
References
BOM: "National Tidal Centre." from http://www.bom.gov.au/oceanography/projects/ntc/ntc.shtml, <accessed 2010>.
Brolsma, H. and Corvino, A.: "Survey report 2003/04 summer season Australian Antarctic Division Author - Adrian Corvino / University of Melbourne." from http://data.aad.gov.au/aadc/metadata/citation.cfm?entry_id=survey_2003_04, <accessed 2011>.
Brown, N. and Woods, A. (2009): Antarctic Geodesy Field Report 2006/07. Canberra, Geoscience Australia, Record 2009/32.
Johnston, G. and Digney, P. (2001): Technical Report 5 - Antarctic Geodesy Summer 2000-2001. Canberra, Australia, Australian Surveying and Land Information Group (AUSLIG).
Johnston, G., Manning, J., Dawson, J., et al.: "Geodesy Activities in the Prince Charles Mountains Expedition of Germany and Australia (PCMEGA) 2003." from http://www.scar.org/publications/reports/23/pcmega/index.html.
Johnston, G. and Verrall, P. (2002): Total Station Levelling. Canberra, Australian Survey and Land Information Group (AUSLIG).
Naebkhil, S. and Moore, M. (2005): Antarctic Geodesy Project No. 1159, Summer 2004-2005. Canberra, Geoscience Australia.
Ruddick, R., Woods, A. and Brown, N. (2009): Antarctic Geodesy Field Report 2008/09. Canberra, Geoscience Australia, Record 2009/33.
72