answers to algebra 1 unit 6 practice€¦© 2014 college board. all rights reserved. a1 springboard...
TRANSCRIPT

A1© 2014 College Board. All rights reserved. SpringBoard Algebra 1, Unit 6 Practice
LeSSon 36-1 1. a. Chloe is consistent. She exercises 15 min each
day during the week and 30 min each day on the weekend.; mean: 19, range: 15
b. Amanda is inconsistent. The amount of time she exercises each day varies.; mean: 19, range: 45
c. The means are the same. The effect of the exercising is about the same for each girl since Amanda makes up any time lost on any one day by increasing the time she exercises on the other days. The ranges are different. The routines are not the same.
2. a. Chloe Deviation Absolute Deviation
Time Time 2 Mean 5 Deviation
Time 2 Mean
30 30 2 19 5 11 11
15 15 2 19 5 24 4
15 15 2 19 5 24 4
15 15 2 19 5 24 4
15 15 2 19 5 24 4
15 15 2 19 5 24 4
30 30 2 19 5 11 11
b. 6
3. a. Amanda Deviation Absolute Deviation
Time Time 2 Mean Time 2 Mean
45 45 2 19 5 26 26
18 18 2 19 5 21 1
20 20 2 19 5 1 1
10 10 2 19 5 29 9
0 0 2 19 5 219 19
12 12 2 19 5 27 7
25 25 2 19 5 6 6
b. 10
c. The MADs are different. Amanda’s MAD is greater because her data values are further away from the mean.
4. a. census
b. sample
c. sample
d. census
5. B
LeSSon 36-2 6. a. 45
b. 4
c. 21
d. 441
e. 15.5
7. a.
xi x | xi 2 x | ( )x xi2
2
x1 5 12 11.5 0.85 0.7225
x2 5 9.5 11.5 1.65 2.7225
x3 5 11 11.5 0.15 0.0225
x4 5 10.25 11.5 0.9 0.81
x5 5 13 11.5 1.85 3.4225
∑ 55
xii 1
5
55.75 ∑ 2 55
x xii 1
5
5.4 ∑( )2 55
x xii
2
1
5
7.7
b. 1.08
c. 1.387
Answers to Algebra 1 Unit 6 Practice

A2© 2014 College Board. All rights reserved. SpringBoard Algebra 1, Unit 6 Practice
8. a.
xi xi | xi 2 xi | ( )x xi i2
2
x1 5 230.5 212.54 17.96 322.56
x2 5 230.8 212.54 18.26 333.43
x3 5 223.7 212.54 11.16 124.55
x4 5 214.2 212.54 1.66 2.76
x5 5 20.7 212.54 11.84 140.19
x6 5 5.6 212.54 18.14 329.06
x7 5 7.8 212.54 20.34 413.72
x8 5 4.5 212.54 17.04 290.36
x9 5 21.9 212.54 10.64 113.21
x10 5 213.7 212.54 1.16 1.35
x11 5 223.3 212.54 10.76 115.78
x12 5 229.6 212.54 17.06 291.04
∑ 55
xii 1
12
2150.5
∑ 2 55
x xi ii 1
12
156.02
∑( )2 55
x xi ii
2
1
12
2,478.01
b. 13
c. 15
9. B
10. The MAD is 10.5 and the standard deviation is 13.44. These measures are far apart which means that the data points are not all tightly clustered.
LeSSon 37-1 11. a. Sophomores
5 6 7 8 9 10 11 12 13 14 15 16 17 18 19 2043210
Juniors
5 6 7 8 9 10 11 12 13 14 15 16 17 18 19 2043210
Seniors
5 6 7 8 9 10 11 12 13 14 15 16 17 18 19 2043210
b. The center of data increases with the grade levels. The spread is not as great for seniors. More than 50% of the seniors spend more than 14 hours a week doing homework.
12. Sophomores Juniors Seniors
Minimum 3 5 9First quartile 7 10 10.5Median 10.5 12.5 14Third quartile 12 13 15Maximum 15 16 17
13. a. Sophomores
5 6 7 8 9 10 11 12 13 14 15 16 17 18 19 2043210
Juniors
5 6 7 8 9 10 11 12 13 14 15 16 17 18 19 2043210
Seniors
5 6 7 8 9 10 11 12 13 14 15 16 17 18 19 2043210

A3© 2014 College Board. All rights reserved. SpringBoard Algebra 1, Unit 6 Practice
b. Answers may vary. The “Juniors” group has the least spread in its middle 50%. Most juniors focus on their academic work in preparation for graduation.
14. A greater number of students tend to spend more time on homework as they advance to a higher grade level.
15. B
LeSSon 37-3 16. A z score tells us by how many standard deviations
a data value is above or below the mean.
17. Answers may vary. Possible answer: Divide the distance a data value is from the mean by the standard deviation.
18.
Daily High Mean Temperature in February Fairbanks, Alaska
DateTemperature
8F( x 2 x )
x xs2
1 9 21.86 20.48 2 5 25.86 21.52 3 6 24.86 22.78 4 6 24.86 22.78 5 7 23.86 21 6 7 23.86 21 7 7 23.86 21 8 8 22.86 20.74 9 8 22.86 20.7410 9 21.86 20.4811 9 21.86 20.4812 10 20.86 20.2213 10 20.86 20.2214 11 0.14 0.0415 11 0.14 0.0416 12 1.14 0.317 12 1.14 0.318 13 2.14 0.5619 13 2.14 0.5620 14 3.14 0.8221 14 3.14 0.8222 15 4.14 1.0823 15 4.14 1.0824 16 5.14 1.3425 16 5.14 1.3426 17 6.14 1.5927 17 6.14 1.5928 18 7.14 1.85
mean is 10.86 Sum 5 51.1 s 5 3.85
19. B
20. 17.5%

A4© 2014 College Board. All rights reserved. SpringBoard Algebra 1, Unit 6 Practice
LeSSon 38-1 21. B
22. As the number of hours studying for a test increases, the grade on the test should increase. There should be a strong positive relationship between the number of hours studying for a test and the grade achieved on the test.
23. Answers will vary. Sample answers are given.
a. No trend; A student’s height would not affect the test grade the student is likely to achieve.
b. Weak negative trend; While the price of an item tends to affect the number of items sold, other factors may include quality of the item and desirability.
c. Strong positive trend; As the time spent t increases, the distance traveled increases.
24. a. Hours in Practice and Games Won
01 2 3 4 5 6 7 8 9 10
123456
0
Gam
es W
on
Practice Hours
b. Weak positive trend.
c. Answers will vary. Sample answer: Some things that could affect the results of a game are the skill of the teams, wellness of the players, time of day, as well as time spent practicing.
25. A strong negative trend; As the temperature increases, the amount of energy used for heat will decrease.
LeSSon 38-2 26. The correlation coefficient measures the strength
and direction of a linear relationship.
27. Answers may vary. The correlation coefficient is negative and close to 0. This suggests a weak negative linear relationship between the two variables.
28. When there is no relationship between the two variables.
29. A. 5
B. 7
C. 1
D. 3
E. 2
F. 6
G. 4
30. The range of values for r is from 1 to 21. The value of r tells the strength of a linear relationship. The sign of r describes the direction of the relationship: positive or negative.
LeSSon 39-1
31. Answers may vary. Sample answer shown.
32. a. about 10.11 years
b. about 19.89 years
c. about 75.57 pounds
A5© 2014 College Board. All rights reserved. SpringBoard Algebra 1, Unit 6 Practice
33. a. 60 hot apple ciders
b. 31 hot apple ciders
c. 258F
d. predicted number 5 68; actual number 5 70; The predicted number is close to the actual number.
34. C
35. The relationship is weak.
LeSSon 39-2
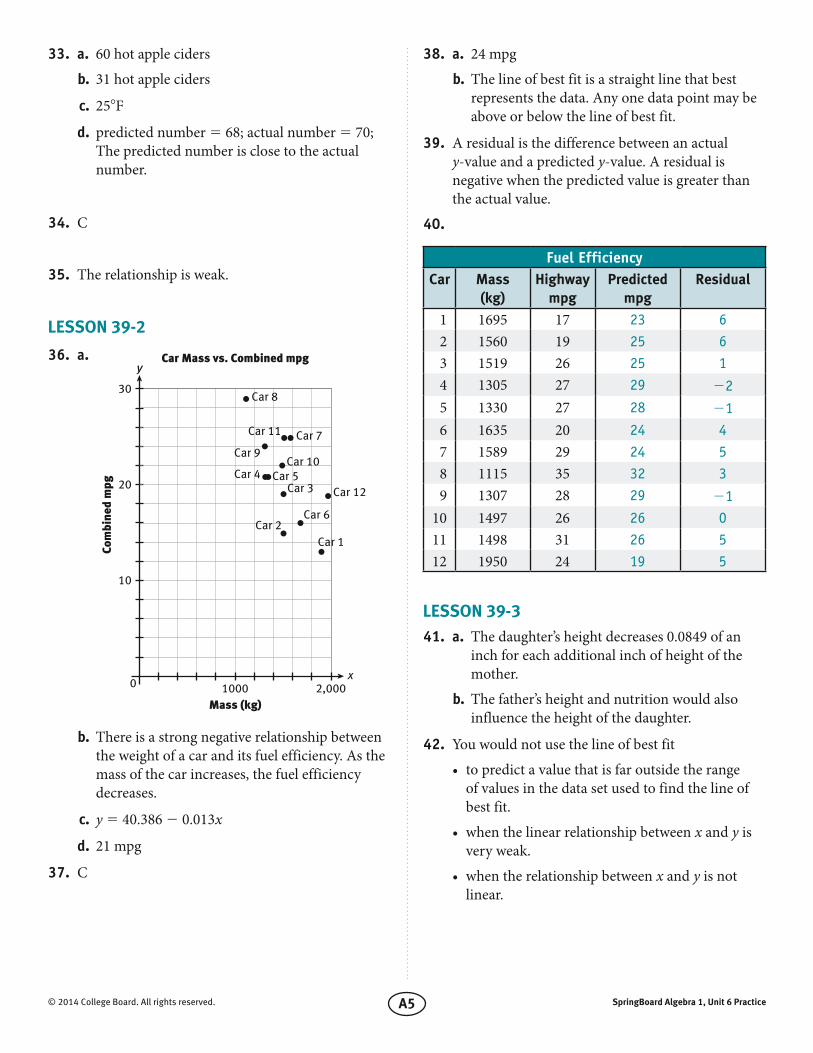
36. a.
0
10
20
Com
bine
d m
pg
1000Mass (kg)
2,000
Car 1
Car 6
Car 12
Car 2
x
y
30
Car 3Car 5Car 4
Car 10Car 9
Car 7
Car 8
Car Mass vs. Combined mpg
Car 11
b. There is a strong negative relationship between the weight of a car and its fuel efficiency. As the mass of the car increases, the fuel efficiency decreases.
c. y 5 40.386 2 0.013x
d. 21 mpg
37. C
38. a. 24 mpg
b. The line of best fit is a straight line that best represents the data. Any one data point may be above or below the line of best fit.
39. A residual is the difference between an actual y-value and a predicted y-value. A residual is negative when the predicted value is greater than the actual value.
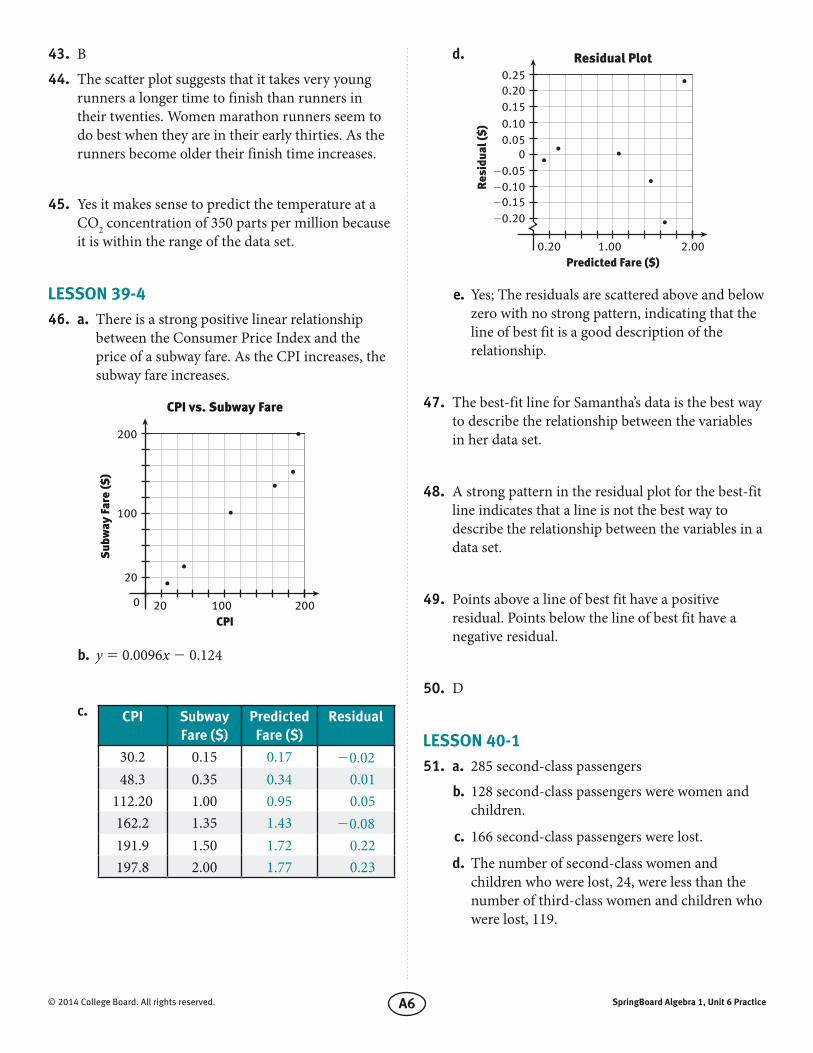
40.
Fuel EfficiencyCar Mass
(kg)Highway
mpgPredicted
mpgResidual
1 1695 17 23 6 2 1560 19 25 6 3 1519 26 25 1 4 1305 27 29 22 5 1330 27 28 21 6 1635 20 24 4 7 1589 29 24 5 8 1115 35 32 3 9 1307 28 29 2110 1497 26 26 011 1498 31 26 512 1950 24 19 5
LeSSon 39-3 41. a. The daughter’s height decreases 0.0849 of an
inch for each additional inch of height of the mother.
b. The father’s height and nutrition would also influence the height of the daughter.
42. You would not use the line of best fit
• topredictavaluethatisfaroutsidetherange of values in the data set used to find the line of best fit.
• whenthelinearrelationshipbetweenx and y is very weak.
• whentherelationshipbetweenx and y is not linear.
A6© 2014 College Board. All rights reserved. SpringBoard Algebra 1, Unit 6 Practice
43. B
44. The scatter plot suggests that it takes very young runners a longer time to finish than runners in their twenties. Women marathon runners seem to do best when they are in their early thirties. As the runners become older their finish time increases.
45. Yes it makes sense to predict the temperature at a CO2 concentration of 350 parts per million because it is within the range of the data set.
LeSSon 39-4 46. a. There is a strong positive linear relationship
between the Consumer Price Index and the price of a subway fare. As the CPI increases, the subway fare increases.
200
20
100
Sub
way
Far
e ($
)
200
100CPI
CPI vs. Subway Fare
200
b. y 5 0.0096x 2 0.124
c. CPI Subway Fare ($)
Predicted Fare ($)
Residual
30.2 0.15 0.17 20.0248.3 0.35 0.34 0.01
112.20 1.00 0.95 0.05162.2 1.35 1.43 20.08191.9 1.50 1.72 0.22197.8 2.00 1.77 0.23
d.
0.20
20.2020.1520.1020.05
00.050.100.150.20
Res
idua
l ($
)
0.25
1.00Predicted Fare ($)
Residual Plot
2.00
e. Yes; The residuals are scattered above and below zero with no strong pattern, indicating that the line of best fit is a good description of the relationship.
47. The best-fit line for Samantha’s data is the best way to describe the relationship between the variables in her data set.
48. A strong pattern in the residual plot for the best-fit line indicates that a line is not the best way to describe the relationship between the variables in a data set.
49. Points above a line of best fit have a positive residual. Points below the line of best fit have a negative residual.
50. D
LeSSon 40-1 51. a. 285 second-class passengers
b. 128 second-class passengers were women and children.
c. 166 second-class passengers were lost.
d. The number of second-class women and children who were lost, 24, were less than the number of third-class women and children who were lost, 119.

A7© 2014 College Board. All rights reserved. SpringBoard Algebra 1, Unit 6 Practice
52. Investigation into Loss of S. S. “Titanic”CPI on Board Saved Lost
Percent savedWomen and
ChildrenMen Total
Women and Children
Men TotalWomen and
ChildrenMen Total
PassengersFirst ClassSecond ClassThird Class
156128224
173157486
329 285 710
145104105
541569
199 119 174
1124
119
119142417
130 166 536
60 42 25
Total passengers
508 816 1,324 354 138 492 154 678 832 . . .
Crew 23 876 899 20 194 214 3 682 685 24Total 531 1,692 2,223 374 332 706 157 1,360 1,517 32
53. The percent of passengers saved by class and the percent crew saved can be found in the last column of the table.
54. A
55. Yes. 119 women and children who were lost were third-class passengers. This is out of a total of 154 women and children who were lost. 119 4 154 < 77%.
LeSSon 40-2
56. a.
United States Usage of Multimedia in Minutes Per Day
YearWeb
BrowsingMobile
ApplicationsTelevision Total
2010 70 66 162 2982011 72 94 168 3342012 70 127 168 365Total 212 287 498 997
b.
Raw Percentages U.S. Usage of Multimedia in
Minutes per Day
YearWeb
BrowsingMobile
ApplicationsTelevision Total
2010 23.5% 22.1% 54.4% 100%2011 21.6% 28.1% 50.3% 100%2012 19.2% 34.8% 46% 100%
c.
100
200
300
400
2010 2011 2012
Television
Mobil Application
Web Browsing
Year
Min
utes
Per
Day
U.S. Usage of Multimediain Minutes per Day
d. The distributions are similar for web browsing and television usage. The greatest difference appears to be in mobile applications.
57. Answers may vary. Possible answer: A segmented bar graph represents bivariate categorical data so that relationships between the categories can be easily seen. The total data set is represented by a bar, and the different possible categories are represented by sections of the bar. The area of the section for a particular category is proportional to the relative frequency of that category.

A8© 2014 College Board. All rights reserved. SpringBoard Algebra 1, Unit 6 Practice
58. B
59. Answers will vary. Possible answer: The report from the Transportation Committee to the manager of the industrial complex should include the table with the row and column totals; a raw percentages table, and a segmented bar graph with an analysis of the bar graph.
60. The number of employees who drive alone increases the later they begin work. However, the time an employee starts work does not affect the number of employees who carpool, take public transportation, or use other means of transportation.