answers for life. - henry scheinanswers for life. siemens healthcare diagnostics international...
TRANSCRIPT

Answers for life.
Siemens Healthcare Diagnostics International Allergy ConferenceBarcelona, SpainJune 12, 2008
Jean-Charles Clouet, Editor
Siemens Global Headquarters
Siemens AGWittelsbacherplatz 280333 MuenchenGermany
Global Division
Siemens Healthcare Diagnostics Inc.1717 Deerfield Road Deerfield, IL 60015-0778 USAwww.siemens.com/diagnostics
Global Siemens Healthcare Headquarters
Siemens AGHealthcare SectorHenkestrasse 12791052 ErlangenGermanyTelephone: +49 9131 84 - 0www.siemens.com/healthcare
Siemens Healthcare Diagnostics, the leading clinical diagnostics company, is committed to providing clinicians with the vital information they need for the accurate diagnosis, treatment and monitoring of patients. Our comprehensive portfolio of performance-driven systems, unmatched menu offering and IT solutions, in conjunction with highly responsive service, is designed to streamline workflow, enhance operational efficiency and support improved patient care.
IMMULITE, 3gAllergy, and all associated marks are trademarks of Siemens Healthcare Diagnostics Inc. All other trademarks and brands are the property of their respective owners.
Product availability may vary from country to country and is subject to varying regulatory requirements. Please contact your local representative for availability.
www.siemens.com/diagnostics
Order No. A91DX-0701505-XC1-4A00 | Printed in USA | © 2009 Siemens Healthcare Diagnostics Inc.
Siemen
s Intern
ation
al Allerg
y Co
nferen
ce | Jun
e 1
2, 2
00
8 | Je
an-C
harle
s Clo
ue
t

Proceedings of theSiemens Healthcare DiagnosticsInternational Allergy Conference
Barcelona, SpainJune 12, 2008
Jean-Charles Clouet, Editor


iii
Preface vii
Acknowledgments ix
Part 1: Lecture Summaries
1.1 In Vitro Allergy Diagnostics: New Guidelines from the Clinical 2 and Laboratory Standards Institute (CLSI) R. Hamilton (Division of Allergy and Clinical Immunology, Johns Hopkins University School of Medicine, Baltimore, MD, US)
1.2 Diagnosis of Cow’s Milk Allergy: Are Low Levels of Specific IgE Significant? 8 A. M. Plaza (Sant Joan de Déu Hospital, Barcelona, Spain)
1.3 Integration of In Vitro Allergy Testing into Laboratory Automation: A Lean Approach 12 J. Geijer (Unilabs, St Göran Hospital, Stockholm, Sweden)
1.4 Future Diagnostic Tools for Better Practice and Interpretation in 16 Allergic Diseases: From New In Vitro Markers to IT Integrated Solutions A. Mari (CACeS, IDI-IRCCS, Allergy Data Laboratories sc, Latina, Rome, Italy)
1.5 Chimeric Antibodies in Allergy Testing: Description of Potential Applications 26 T. Grunwald (PLS-Design GmbH, Hamburg, Germany)
1.6 Future Clinical Applications of Molecular Allergens for Specific IgE 38 and IgG/IgG4 Testing M. Ollert (Technische Universität München [TUM], Munich, Germany)
1.7 Allergo-oncology: Introduction of a Novel Concept 46 E. Jensen-Jarolim (Department of Pathophysiology, Medical University, Vienna, Austria)
1.8 Siemens Healthcare Diagnostics’ New Developments in Allergy 52 D. Hovanec-Burns (Allergy Diagnostics, Siemens Healthcare Diagnostics, Los Angeles, CA, US)
Part 2: Scientific Posters
2.1 Cross-reactive Carbohydrate Determinant (CCD) from Bromelain: 63 A New Allergy Marker (MUXF Glycopeptide) for Specific IgE Detection U. Banik1, K. Huynh1, W. X. Gan1, R. A. Evangelista1, M. Lopez1, K. Jaggi1, D. Davoudzadeh1, P. Palazzo2, M. L. Bernardi2, A. Mari2, D. Hovanec-Burns1 (1Siemens Healthcare Diagnostics, Los Angeles, CA, US; 2CACeS, IDI-IRCCS, Allergy Data Laboratories sc, Latina, Rome, Italy)
2.2 Native Art v 1: Evaluation of a Molecular Allergen for Mugwort Pollen Allergy 69 M. Sen1, K. Huynh1, R. Evangelista1, K. Jaggi1, D. Davoudzadeh1, P. Palazzo2, D. Zennaro2, A. Mari2, D. Hovanec-Burns1, U. Banik1 (1Siemens Healthcare Diagnostics, Los Angeles, CA, US; 2CACeS, IDI-IRCCS, Allergy Data Laboratories sc, Latina, Rome, Italy)
Contents

2.3 Evaluation of Native Birch Molecular Allergen nBet v 1: Major Allergen 73 for Birch Pollen Allergy Diagnosis M. Ordonez1, K. Huynh1, R. Rouhani1, R. Evangelista1, K. Jaggi1, D. Hovanec-Burns1, D. Davoudzadeh1, R. Ferrara2, L. Pirrotta2, A. Mari2, U. Banik1 (1Siemens Healthcare Diagnostics, Los Angeles, CA, US; 2CACeS, IDI-IRCCS, Allergy Data Laboratories sc, Latina, Rome, Italy)
2.4 Native Ole e 1: Evaluation of a Molecular Allergen for Olive Pollen Allergy 77 M. Sen1, K. Huynh1, R. Evangelista1, K. Jaggi1, D. Davoudzadeh1, D. Zennaro2, M. Giani2, A. Mari2, D. Hovanec-Burns1, U. Banik1 (1Siemens Healthcare Diagnostics, Los Angeles, CA, US; 2CACeS, IDI-IRCCS, Allergy Data Laboratories sc, Latina, Rome, Italy)
2.5 Evaluation of Native Major Peach Allergen nPru p 3: A Lipid Transfer Protein 81 for Allergy Diagnosis M. J. Marañón1, K. Huynh1, M. Poladian1, A. Drummond1, M. Lopez1, K. Jaggi1, D. Davoudzadeh1, A. Zaffiro2, D. Quaratino2, A. Mari2, D. Hovanec-Burns1, U. Banik1 (1Siemens Healthcare Diagnostics, Los Angeles, CA, US; 2CACeS, IDI-IRCCS, Allergy Data Laboratories sc, Latina, Rome, Italy)
2.6 Evaluation of Recombinant PR-10 Allergens rMal d 1 and rPru av 1: Diagnostic Tools 87 for Allergen Cross-reactivity M. J. Marañón1, K. Huynh1, M. Poladian1, R. Evangelista1, A. Drummond1, M. Lopez1, K. Jaggi1, D. Davoudzadeh1, E. Scala2, M. L. Bernardi2, A. Mari2, D. Hovanec-Burns1, U. Banik1 (1Siemens Healthcare Diagnostics, Los Angeles, CA, US; 2CACeS, IDI-IRCCS, Allergy Data Laboratories sc, Latina, Rome, Italy)
2.7 Development of Recombinant Cherry Profilin rPru av 4 Allergen: An Emerging Tool 93 for Investigating Cross-reactivity U. Banik1, M. J. Marañón1, M. Poladian1, A. Drummond1, M. Lopez1, K. Jaggi1, D. Davoudzadeh1, M. Giani2, R. Fantini2, A. Mari2, D. Hovanec-Burns1 (1Siemens Healthcare Diagnostics, Los Angeles, CA, US; 2CACeS, IDI-IRCCS, Allergy Data Laboratories sc, Latina, Rome, Italy)
2.8 Native Cat and Dog Allergenic Molecules nFel d 1 and nCan f 1: New Tools for 99 Component-Resolved Allergy Diagnosis M. J. Marañón1, U. Banik1, S. Maldonado1, M. Lopez1, K. Jaggi1, D. Quaratino2, D. Zennaro2, A. Mari2, D. Hovanec-Burns1, D. Davoudzadeh1 (1Siemens Healthcare Diagnostics, Los Angeles, CA, US; 2CACeS, IDI-IRCCS, Allergy Data Laboratories sc, Latina, Rome, Italy)
2.9 Native Mite Allergenic Molecules nDer p 1, nDer p 2, nDer f 1 and nDer f 2: 105 Novel Tools for Mite Component-Resolved Allergy Diagnosis U. Banik1, M. J. Marañón1, A. Achiles1, M. Lopez1, K. Jaggi1, R. Ferrara2, D. Pomponi2, A. Mari2, D. Davoudzadeh1, D. Hovanec-Burns1 (1Siemens Healthcare Diagnostics, Los Angeles, CA, US; 2CACeS, IDI-IRCCS, Allergy Data Laboratories sc, Latina, Rome, Italy)
2.10 Development and Analytical Performance of the IMMULITE® 2000 109 Allergen-Specific IgG Assay T. Chuang, M. Walker, R. Rouhani, A. Hoang, D. Hovanec-Burns (Siemens Healthcare Diagnostics, Los Angeles, CA, US)
2.11 Allergen-Specific IgG4 Detection on the IMMULITE® 2000 System 115 T. Chuang, S. Maldonado, H. Kubota, D. Hovanec-Burns (Siemens Healthcare Diagnostics, Los Angeles, CA, US)
iv


vii
In vitro measurements of allergen-specific IgE (sIgE) are well-established tests used by most laboratories worldwide for the diagnosis of IgE-mediated allergic diseases. In recent years, however, important innovations have tremen-dously modified the allergy testing paradigm, and other advances are appearing on the horizon.
From new detection technologies like chemilu-minescence emerged highly sensitive methods with the ability to detect sIgE at concentra-tions far below historical analytical limits. The development of fully automated laboratory instruments allowing centralization of allergy tests with other immunoassays (such as those for hormones, tumor markers, and infectious diseases) was another critical milestone towards an optimized integration of allergy testing in the laboratory workflow.
Siemens Healthcare Diagnostics has contrib-uted actively to all of these innovations. With the introduction of 3gAllergy™ tests on IMMULITE® 2000 immunoassay system, allergy testing could be consolidated for the first time alongside routine immunoassays.Today, IMMULITE 2000 and IMMULITE® 2500 remain the only platforms that provide workstation consolidation and random access testing for allergy and more than 90 other immunoassays.
Siemens sponsored an International Allergy Conference on June 12, 2008, in Barcelona, Spain. It was my privilege then to welcome the conference participants, and it is a pleasure for me now, on behalf of the Company, to offer these proceedings, which include summaries of the scientific lectures and posters presented during the conference.
Through this proceedings volume, I would also like to extend to you, the reader, an invita-tion to learn more about 3gAllergy tests; to become better acquainted with new tools such as molecular allergens, anti-CCD markers, and chimeric IgE antibodies that are becoming avail-able for diagnostic or research purposes; and even to discover that allergy mechanisms are being investigated as a possible weapon to help combat cancer!
It is my hope that you will benefit from the lecture summaries and posters included in these proceedings. I wish you good reading, and I hope that we can continue to take allergy diagnostics to the next level. Together.
PrefaceMr. Jean-Charles ClouetDirector Marketing, AssaysEurope, Middle East, AfricaSiemens Healthcare Diagnostics


ix
Siemens Healthcare Diagnostics is indebted to Prof. Markus Ollert of the Dermatology and Allergology Department of the Technische Universität München for having been a wonderful conference chairman, moder-ating the introductory and concluding sessions of the day. We also want to thank all the speakers for the excellence of their presenta-tions. Finally, we are very grateful to the many participants from all over Europe who attended this event.
A word of thanks also goes to Mike Geier and Connie Colin of Clinical Marketing and Scientific Publications for editing the manuscript, and to Michelle Muse of Eagle Eye Graphics for graphic design.
Acknowledgments


Part 1: Lecture Summaries

Robert G. Hamilton, Ph.D.
2

1.1
The Clinical and Laboratory Standards Institute (CLSI, formerly NCCLS) is an international, interdisciplinary, nonprofit educational organization. CLSI promotes the development and use of consensus standards and guide-lines within the healthcare community. The CLSI process is based on the principle that consensus is an effective and cost-effective way to improve methods used for in vitro testing and healthcare services. Therefore, CLSI provides an open and unbiased forum to address and debate critical issues affecting the quality of patient testing and healthcare.
This presentation focuses on the new CLSI guidelines for allergy diagnostics previ-ously known as the I/LA20-A2 document: Analytical Performance Characteristics and Clinical Utility of Immunological Assays for Human Immunoglobulin E (IgE) Antibodies and Defined Allergen Specificities; Approved Guideline—Second Edition.
CLSI levels of documents
There are three levels of CLSI documents:
• Standard document, which is a consensus document viewed as being used unmodified;
• Guideline, which is a consensus standard that identifies specific and essential require-ments and criteria for materials, methods, or practices for a particular area of healthcare (this is level of the current CSLI document for allergy);
• Report, which is not subjected to any critical review other than just by consensus (this category will not be discussed in this presentation).
In Vitro Allergy Diagnostics: New Guidelines from the Clinical and Laboratory Standards Institute (CLSI)
Robert G. Hamilton, Ph.D., Division of Allergy and Clinical Immunology, Johns Hopkins University School of Medicine, Baltimore, MD, US
3
The CLSI I/LA20-A2 IgE document
Scope of the documentThe goal of the CLSI I/LA20-A2 guideline is to foster uniformity (“harmonization”) and to enhance the quality of in vitro IgE measure-ments performed in laboratories throughout the world.
The document focuses on the harmonization of in vitro methods in three basic directions. First, I/LA20-A2 reviews the performance criteria and the methods for qualifying the various components of assays for IgE testing (i.e., allergen-containing reagents, anti–human IgE) and also the performance characteristics of the assay (analytical sensitivity and specificity, limits of detec-tion, parallelism, precision, reproducibility). Second, I/LA20-A2 is intended to provide rationale for why different IgE antibody assays do not yield comparable results. Third, it provides some guidelines for intra- and interlaboratory quality control assurances and overall quality assurance schemes to try to enhance the quality and reproducibility of IgE antibody measurements.
The CLSI I/LA20-A2 IgE document is intended for three groups of healthcare workers:
• For laboratorians working in a clinical laboratory or clinicians using serologic measurements, with practical information on assay characteristics, specimens, reagent validation, assay calibration, and quality assurance ( intra-/interlaboratory), and the clinical utility of IgE antibody measurements;
• For diagnostic kit manufacturers, to assign benchmark targets for validation and improvement of IgE antibody assays;

• For regulators and inspectors, to give guidelines for inspecting laboratories that perform these methods. (In the US, 150 laboratories perform diagnostic allergy testing; each laboratory has to be certified according to CLIA guidelines [1998]).
Early chapters of the document cover a variety of topics:
• The position of IgE testing in the allergy diagnostic algorithm as a confirmatory test for the clinical history–driven diagnosis.
• A section on terminology with 67 harmonized definitions related to total and allergen-specific IgE testing. In this vein, the term analyte-specific reagent (ASR) (only used in the US) is used to define allergens that are not characterized as defined by an interna-tional allergen database (like Allergome). This term has been widely discussed among the different manufacturers.
• A discussion, primarily for inspectors and clinicians with limited experience in the field of allergy, describing the biological activity of IgE and reminding the reader that the presence of IgE does not necessarily result in allergic disease.
The following section of the document describes the diagnostic algorithm followed by most clinicians (Figure1).
Figure 1. Algorithm for the diagnostic evaluation of an allergic patient.
Clinical history and physical examination drive the diagnosis of allergic diseases. Allergists relate exposure and symptoms to arrive at a probability of a clinically relevant symptom. On the basis of these findings, allergists can confirm their diagnosis with a variety of tests including in vivo skin tests and/or in vitro serologic testing. (In the US, the use of in vitro serologic testing is becoming more common, particularly with new molecular allergen extracts that are currently becoming available.)
If the result of the confirmatory test is not consistent with the clinical history, the next level of testing performed is the provocation test (a very common procedure for food allergy).
The different methods used for the assess-ment of IgE-mediated allergic diseases and their respective specific advantages are summarized in Table 1.
Table 1. Diagnostic use of IgE antibody confirmatory tests.
DBPCFC = double-blind placebo-controlled food challenge
Intradermal skin tests (which tend to produce false-positive reactions) remain the reference method for allergens which might induce systemic reactions, since allergists do not want to miss patients who might be at risk for systemic reaction. This situation may change with the development more sensitive in vitro methods using molecular allergens (insect venoms).
1.1
4
Clinical History & Physical ExaminationSymptoms vs. Exposure
Risk Factors[Clinical History Drives the Diagnosis]
Diagnostic (Confirmatory Test) for Sensitization (IgE)Skin Test (Puncture, Intradermal)
Allergen-Specific IgE Antibody Serology
Provocation TestInhalation, Ingestion or Injection Challenge
(Natural vs. Controlled Exposure)
Serum IgE antibody
Prick / puncture skin test
Intradermal skin test
Systemic reactions
• Venom allergy
• Drug allergy
Complementary to intradermal skin test
Sensitivity not sufficient
Preferred for venoms, up to 1 µg/mL
Systemic reactions
• Latex allergy
Diagnostic sensitivity: 75%–85% (rHev b 5)
Not available Not available
Systemic Reactions
• Food allergy DBPCFC, standard
Widely used (pediatric)
Widely used (adults)
Not needed (false positives)
Respiratory Allergy
• Composite standard
Acceptable 61%–94% sensitivity and 70%–100% specificity
Acceptable 94%–97% sensitivity and 81%–92% specificity
Usually not needed (false positives)

In the case of food allergy, serologic tests are becoming more widely accepted for several reasons:
• In vitro tests are preferred to skin tests in children.
• In vitro tests can help to select patients who should undergo an oral food challenge.
• The quality of food extracts for in vitro testing is superior to the the quality of those for skin testing procedures.
• Molecular food allergens are available only for in vitro testing.
Finally, for inhalant allergens, in vitro and in vivo tests are viewed as almost equivalent. Published studies show the same distributions of diagnostic sensitivity and specificity for in vivo and in vitro testing with crude extracts.
The CLSI I/LA20-A2 guideline also describes the methods available in the US for total IgE and allergen-specific IgE testing.
Serum total IgE assaysIn the US and all of North America, serum total IgE is a “regulated analyte.” This term means that if a laboratory misses a measure-ment of the interlaboratory quality control proficiency survey three times, the laboratory is disqualified from conducting IgE assays for at least 1 year.
Table 2 summarizes the results of serum IgE assays and the interlaboratory coefficient of variation from 150 laboratories in the US from five survey assessments performed every 6 months.
Table 2. Total IgE assay performance.
College of American Pathologists Diagnostic Allergy Laboratory Proficiency Survey: SE, 2007
These results indicate very good homogeneity of serum IgE values across the different meth-ods and excellent CVs (well below 10%) across the different laboratories investigated.
Today, total IgE measurements are now commonly prescribed for qualifying patients before they start anti-IgE (Xolair®) therapy.
Allergen-specific IgE assaysAllergen-specific IgE is a nonregulated analyte because no WHO international standard preparation is available as an allergen-specific IgE reference.
The interpretation of allergen-specific IgE tests must take into account the potential causes for false-positive and false-negative results due, for example, to interference:
• Human rheumatoid factor, naturally occur-ring and therapeutically administered anti–human IgE autoantibodies, and human IgG antiallergen antibodies may interfere.
• Cross-reactive carbohydrate determinants may produce positive IgE antibody results for which the clinical significance is unclear.
1.1
5
Method N Total IgE SE04
Interlab CV
Siemens Healthcare Diagnostics (formerly Bayer) ADVIA Centaur®
17 230.1 8.7%
Beckman Access® / Access® 2
7 221.0 8.1%
Siemens Healthcare Diagnostics (formerly Dade Behring) Nephelometer
7 254.3 4.6%
Siemens Healthcare Diagnostics (formerly DPC) IMMULITE® 2000
26 210.4 6.2%
Phadia (Pharmacia) ImmunoCAP® System
27 201.3 8.1%
Phadia (Pharmacia) UniCAP® System
70 200.1 7.4%
All methods 159 218.3 ± 19 8.7% CV
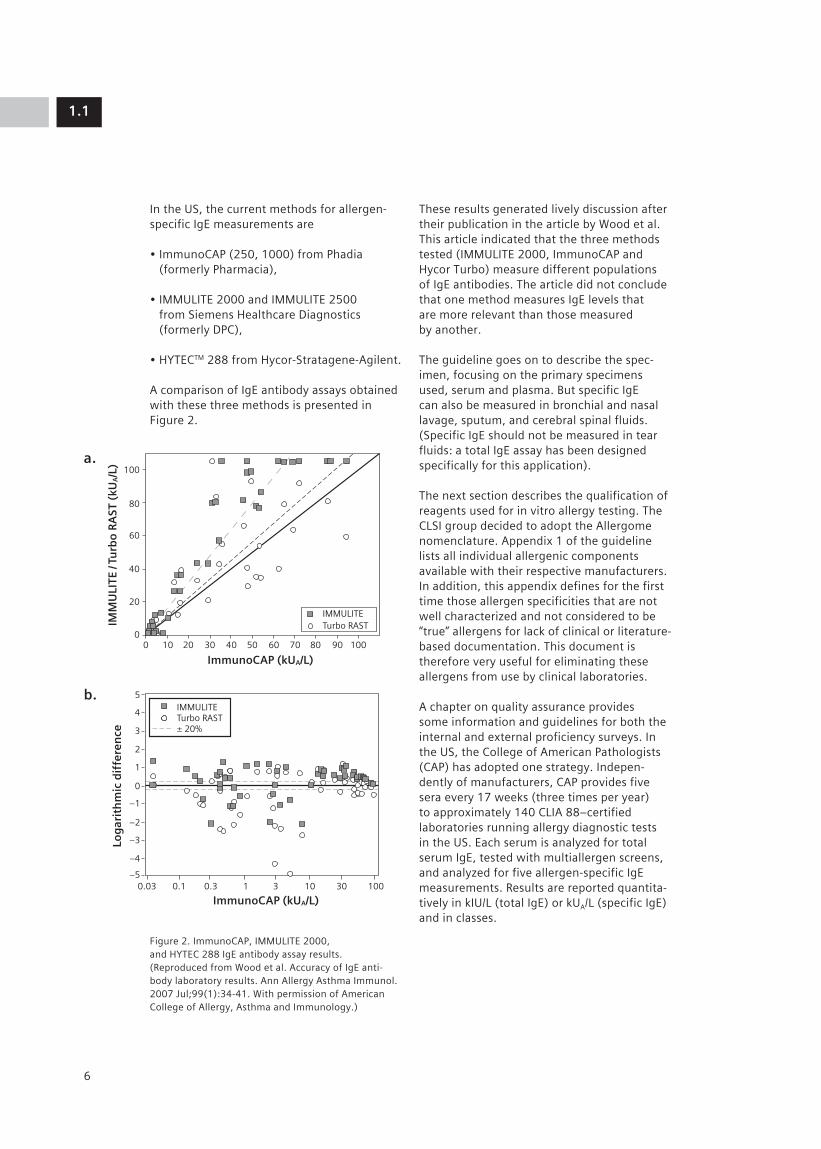
In the US, the current methods for allergen-specific IgE measurements are
• ImmunoCAP (250, 1000) from Phadia (formerly Pharmacia),
• IMMULITE 2000 and IMMULITE 2500 from Siemens Healthcare Diagnostics (formerly DPC),
• HYTECTM 288 from Hycor-Stratagene-Agilent.
A comparison of IgE antibody assays obtained with these three methods is presented in Figure 2.
Figure 2. ImmunoCAP, IMMULITE 2000, and HYTEC 288 IgE antibody assay results. (Reproduced from Wood et al. Accuracy of IgE anti-body laboratory results. Ann Allergy Asthma Immunol. 2007 Jul;99(1):34-41. With permission of American College of Allergy, Asthma and Immunology.)
These results generated lively discussion after their publication in the article by Wood et al. This article indicated that the three methods tested (IMMULITE 2000, ImmunoCAP and Hycor Turbo) measure different populations of IgE antibodies. The article did not conclude that one method measures IgE levels that are more relevant than those measured by another.
The guideline goes on to describe the spec-imen, focusing on the primary specimens used, serum and plasma. But specific IgE can also be measured in bronchial and nasal lavage, sputum, and cerebral spinal fluids. (Specific IgE should not be measured in tear fluids: a total IgE assay has been designed specifically for this application).
The next section describes the qualification of reagents used for in vitro allergy testing. The CLSI group decided to adopt the Allergome nomenclature. Appendix 1 of the guideline lists all individual allergenic components available with their respective manufacturers. In addition, this appendix defines for the first time those allergen specificities that are not well characterized and not considered to be “true” allergens for lack of clinical or literature-based documentation. This document is therefore very useful for eliminating these allergens from use by clinical laboratories.
A chapter on quality assurance provides some information and guidelines for both the internal and external proficiency surveys. In the US, the College of American Pathologists (CAP) has adopted one strategy. Indepen-dently of manufacturers, CAP provides five sera every 17 weeks (three times per year) to approximately 140 CLIA 88–certified laboratories running allergy diagnostic tests in the US. Each serum is analyzed for total serum IgE, tested with multiallergen screens, and analyzed for five allergen-specific IgE measurements. Results are reported quantita-tively in kIU/L (total IgE) or kUA/L (specific IgE) and in classes.
1.1
6
100
5
4
3
2
1
0
–1
–2
–3
–4
–50.03 0.1
IMMULITETurbo RAST± 20%
0.3 1 3 10 30 100
80
60
40
20
00 10
ImmunoCAP (kUA/L)
ImmunoCAP (kUA/L)
IMM
ULI
TE /
Turb
o R
AST
(kU
A/L
)Lo
gar
ith
mic
dif
fere
nce
20 30 40 50
IMMULITETurbo RAST
60 70 80 90 100
100
5
4
3
2
1
0
–1
–2
–3
–4
–50.03 0.1
IMMULITETurbo RAST± 20%
0.3 1 3 10 30 100
80
60
40
20
00 10
ImmunoCAP (kUA/L)
ImmunoCAP (kUA/L)
IMM
ULI
TE /
Turb
o R
AST
(kU
A/L
)Lo
gar
ith
mic
dif
fere
nce
20 30 40 50
IMMULITETurbo RAST
60 70 80 90 100
a.
b.
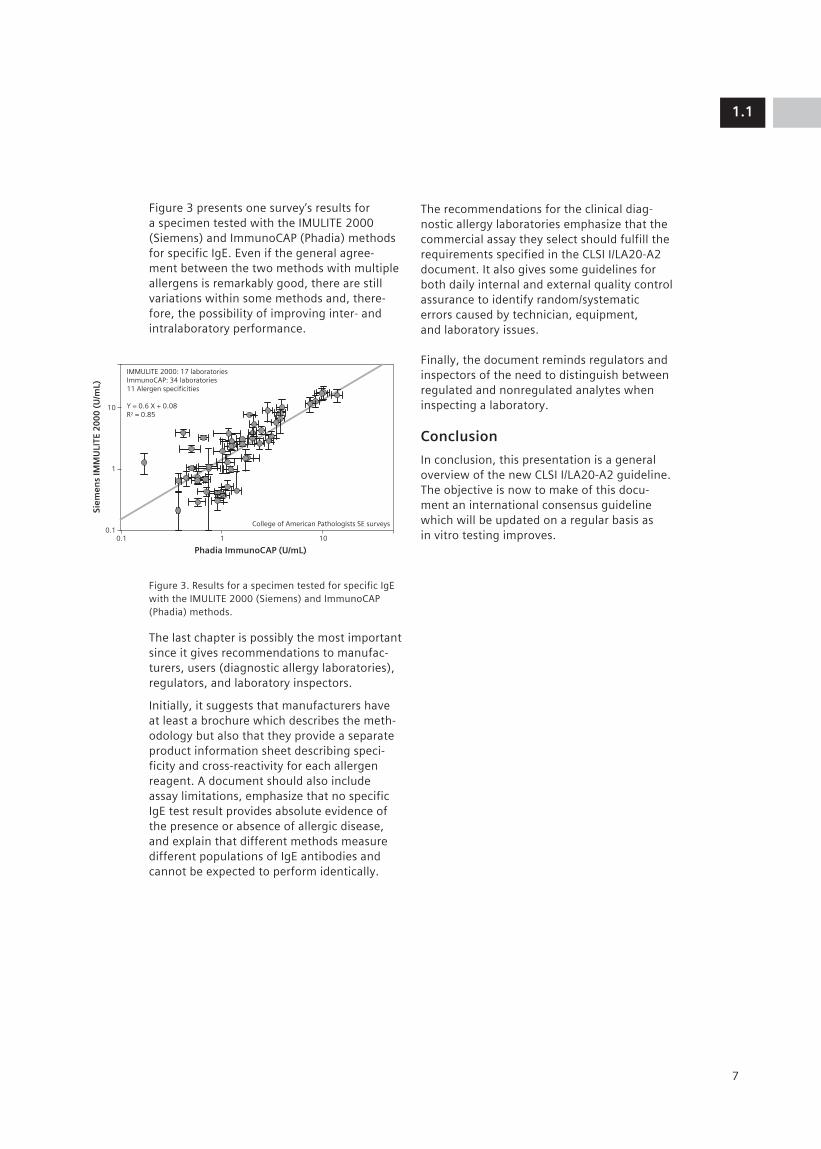
Figure 3 presents one survey’s results for a specimen tested with the IMULITE 2000 (Siemens) and ImmunoCAP (Phadia) methods for specific IgE. Even if the general agree-ment between the two methods with multiple allergens is remarkably good, there are still variations within some methods and, there-fore, the possibility of improving inter- and intralaboratory performance.
Figure 3. Results for a specimen tested for specific IgE with the IMULITE 2000 (Siemens) and ImmunoCAP (Phadia) methods.
The last chapter is possibly the most important since it gives recommendations to manufac-turers, users (diagnostic allergy laboratories), regulators, and laboratory inspectors.
Initially, it suggests that manufacturers have at least a brochure which describes the meth-odology but also that they provide a separate product information sheet describing speci-ficity and cross-reactivity for each allergen reagent. A document should also include assay limitations, emphasize that no specific IgE test result provides absolute evidence of the presence or absence of allergic disease, and explain that different methods measure different populations of IgE antibodies and cannot be expected to perform identically.
The recommendations for the clinical diag-nostic allergy laboratories emphasize that the commercial assay they select should fulfill the requirements specified in the CLSI I/LA20-A2 document. It also gives some guidelines for both daily internal and external quality control assurance to identify random/systematic errors caused by technician, equipment, and laboratory issues.
Finally, the document reminds regulators and inspectors of the need to distinguish between regulated and nonregulated analytes when inspecting a laboratory.
Conclusion
In conclusion, this presentation is a general overview of the new CLSI I/LA20-A2 guideline. The objective is now to make of this docu-ment an international consensus guideline which will be updated on a regular basis as in vitro testing improves.
1.1
7
10
1
0.10.1
IMMULITE 2000: 17 laboratoriesImmunoCAP: 34 laboratories11 Alergen specificities
Y = 0.6 X + 0.08R2 = 0.85
College of American Pathologists SE surveys
1
Phadia ImmunoCAP (U/mL)
Siem
ens
IMM
ULI
TE 2
00
0 (
U/m
L)
10

Ana María Plaza, M.D.
8

1.2
9
Reported here are the results of a clinical study conducted on infants consulting for a suspicion of cow’s milk allergy at the Sant Joan de Déu Hospital.
Management of food-allergic childrenIn Spain, allergy to cow’s milk proteins is the third most frequent cause of food allergy during infancy, after allergy to eggs and fish. Diagnosis of cow’s milk allergy (CMA) is based on clinical case history, determination of IgE sensitization via skin prick test (SPT) and measurement of total IgE (tIgE) and allergen-specific IgE (sIgE), and oral food challenge (OFC).
Figure 1 displays the algorithm for diagnosis of food allergy in infants at Sant Joan de Déu Hospital. A positive clinical history of allergy is followed by a skin prick test. A positive reac-tion to skin prick test and a negative result for sIgE involve an oral challenge. The same rule is applied with a negative skin prick test and a positive result for sIgE. When oral challenges are negative, a food sensitization is diag-nosed. When the oral challenge is positive, a food allergy is diagnosed.
Measurements of sIgE against single cow’s milk protein components (α-lactalbumin, β-lactoglobulin, casein) are preferred to measurement of sIgE against cow’s milk extract. Single components provide addi-tional information; for example, a correlation between elevated levels of casein sIgE levels and the persistence of clinical symptoms has been reported (Chatchatee P et al. J Allergy Clin Immunol. 2001;107:379-83).
Study objectivesOFC is the “gold standard” method since it is the only test which can establish a cause–effect relationship between the offending allergen and clinical symptoms. However, OFC can also induce severe patient reactions and side effects and is a time-consuming practice. Therefore, the objective of this study was to evaluate the diagnostic efficiency of two in vitro sIgE methods in identifying allergic patients and to improve selection criteria of patients who should undergo OFC. Measure-ments of sIgE down to 0.1 kU/L were also assessed to determine if low-level detection improves identification of allergic patients.
Diagnosis of Cow’s Milk Allergy: Are Low Levels of Specific IgE Significant?
Ana María Plaza, M.D., Sant Joan de Déu Hospital, Barcelona, Spain
Clinical history +
Skin prick tests +
Specific IgE +
Food allergy diagnosis
Food allergy diagnosis
Food allergy diagnosis
Food sensitization
Food sensitization
Challenge + Challenge – Challenge + Challenge –Consider other
diagnosis
Specific IgE – Specific IgE + Specific IgE –
Skin prick tests –
Figure 1. Algorithm for diagnosis of food allergy in infants at Sant Joan de Déu Hospital, Barcelona.

PopulationSixty consecutive infants (27 females and 33 males) who visited the Allergy Service of the Sant Joan de Déu Hospital for suspicion of cow’s milk allergy were studied. Parents were asked to sign an informed consent for their children. The age of clinical symptom onset was 3.5 months (range: 0.5–12), whereas the age at diagnosis was 9 months (range: 0.8–14). A family history of atopy was reported in 16 infants, and the clinical symp-toms listed in Table 1 were observed. Some infants had more than one symptom.
Table 1. Clinical symptoms of infants referred to Sant Joan de Déu Hospital on suspicion of cow’s milk allergy.
Skin prick testsSPTs were performed on the patients’ fore-arms (data not shown) using a positive and negative control. Extracts (LETI®) for total milk (5 mg/mL), α-lactalbumin (5 mg/mL), β-lactoglobulin (5 mg/mL), and casein (10 mg/mL) were used. A wheal diameter larger than 3 mm was considered positive.
Specific IgE measurementsTwo different methods for measurement of sIgE were used: the ImmunoCAP® system FEIA, with a positive cutoff of 0.35 kU/L; and the IMMULITE® 2000 3gAllergyTM, with an analytical sensitivity and positive cutoff of 0.1 kU/L and 0.2 kU/L, respectively. Cow’s milk, α-lactalbumin, β-lactoglobulin, and casein allergens were tested by both methods.
Oral food challengeThe children who underwent the OFC received, on the first day, increasing doses of 2, 5, and 10 mL of milk at 90-minute intervals. On the second day, the doses were 25 and 50 mL; and on the third day, 150 and 200 mL. An OFC was considered positive if any clinical symptom appeared.
StatisticsData management and statistical analysis were performed in MedCalc version 8.2.1.0 and included a ROC analysis for each allergen, a binary logistic regression, and a proportion comparison.
Results
Oral food challenge (primary variable)Four children representing a high risk of anaphylaxis and 12 children with sIgE levels against milk or milk components higher than 3 kU/L (García-Ara MC et al. J Allergy Clin Immunol. 2001;107:185-90) did not undergo OFC testing. In addition, five patients’ parents did not give their authorization for the chal-lenge. In total, 21 patients were excluded from the challenge.
Among 39 children who underwent the OFC, 19 had a positive response to OFC and 20 were negative, as shown in Figure 2.
Figure 2. Outcome of OFC.
1.2
10
Symptom N
Skin symptoms 44
Erythema 14
Urticaria 28
Angioedema 5
Atopic dermatitis 10
Gastrointestinal symptoms 27
Vomiting 22
Diarrhea 8
Rejection 9
Anaphylaxis 4
N = 60
4 not possible 39 performed
12 not recommended 19 positives
20 negatives
5 OFCwithdrawls
55
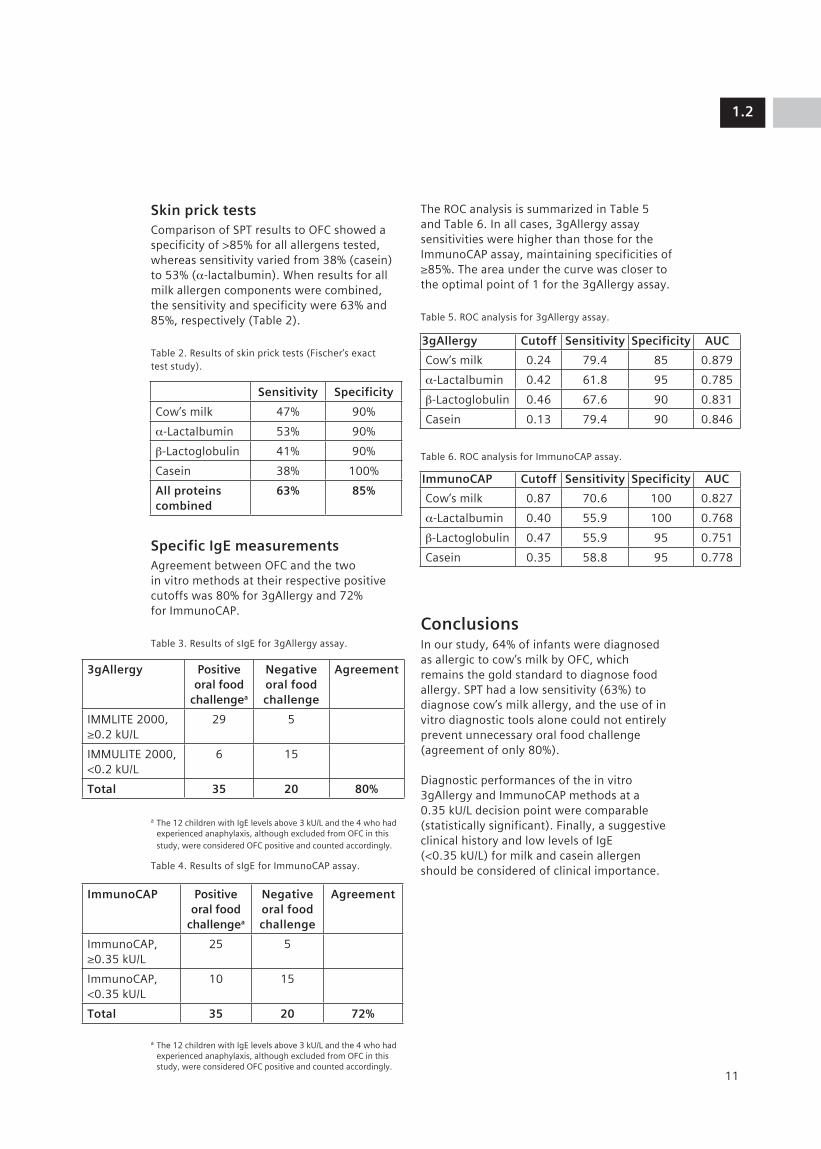
Skin prick testsComparison of SPT results to OFC showed a specificity of >85% for all allergens tested, whereas sensitivity varied from 38% (casein) to 53% (α-lactalbumin). When results for all milk allergen components were combined, the sensitivity and specificity were 63% and 85%, respectively (Table 2).
Table 2. Results of skin prick tests (Fischer’s exact test study).
Specific IgE measurementsAgreement between OFC and the two in vitro methods at their respective positive cutoffs was 80% for 3gAllergy and 72% for ImmunoCAP.
Table 3. Results of sIgE for 3gAllergy assay.
a The 12 children with IgE levels above 3 kU/L and the 4 who had experienced anaphylaxis, although excluded from OFC in this study, were considered OFC positive and counted accordingly.
Table 4. Results of sIgE for ImmunoCAP assay.
a The 12 children with IgE levels above 3 kU/L and the 4 who had experienced anaphylaxis, although excluded from OFC in this study, were considered OFC positive and counted accordingly.
The ROC analysis is summarized in Table 5 and Table 6. In all cases, 3gAllergy assay sensitivities were higher than those for the ImmunoCAP assay, maintaining specificities of ≥85%. The area under the curve was closer to the optimal point of 1 for the 3gAllergy assay.
Table 5. ROC analysis for 3gAllergy assay.
Table 6. ROC analysis for ImmunoCAP assay.
ConclusionsIn our study, 64% of infants were diagnosed as allergic to cow’s milk by OFC, which remains the gold standard to diagnose food allergy. SPT had a low sensitivity (63%) to diagnose cow’s milk allergy, and the use of in vitro diagnostic tools alone could not entirely prevent unnecessary oral food challenge (agreement of only 80%).
Diagnostic performances of the in vitro 3gAllergy and ImmunoCAP methods at a 0.35 kU/L decision point were comparable (statistically significant). Finally, a suggestive clinical history and low levels of IgE (<0.35 kU/L) for milk and casein allergen should be considered of clinical importance.
1.2
11
Sensitivity Specificity
Cow’s milk 47% 90%
α-Lactalbumin 53% 90%
β-Lactoglobulin 41% 90%
Casein 38% 100%
All proteins combined
63% 85%
3gAllergy Positive oral food
challengea
Negative oral food challenge
Agreement
IMMLITE 2000, ≥0.2 kU/L
29 5
IMMULITE 2000, <0.2 kU/L
6 15
Total 35 20 80%
ImmunoCAP Positive oral food
challengea
Negative oral food challenge
Agreement
ImmunoCAP, ≥0.35 kU/L
25 5
ImmunoCAP, <0.35 kU/L
10 15
Total 35 20 72%
3gAllergy Cutoff Sensitivity Specificity AUC
Cow’s milk 0.24 79.4 85 0.879
α-Lactalbumin 0.42 61.8 95 0.785
β-Lactoglobulin 0.46 67.6 90 0.831
Casein 0.13 79.4 90 0.846
ImmunoCAP Cutoff Sensitivity Specificity AUC
Cow’s milk 0.87 70.6 100 0.827
α-Lactalbumin 0.40 55.9 100 0.768
β-Lactoglobulin 0.47 55.9 95 0.751
Casein 0.35 58.8 95 0.778

Johan Geijer, MSc Eng
12

1.3
Capio Diagnostics is a large organization which provides services in laboratory medicine and imaging diagnostics. Capio Diagnostics’ customers are private and public healthcare providers. There are 40 laboratories located in Sweden, 11 in Norway, 9 in England, 1 in Denmark, and 1 in Finland (1,000 coworkers). In 2007, Capio Diagnostics merged with Unilabs (50 laboratory units in Switzerland, Spain, France, Portugal, Italy, and Russia). As a result, the combined organization now covers over 100 laboratory units located in more than 10 countries. Following the merger, the Capio Diagnostics name changed to Unilabs.
One of Unilabs’ goals is to work on new laboratory processes to better meet customer needs and provide a total integrated health-care service.
To achieve this objective, Unilabs has been working continually for 10 years on major projects. This presentation focuses on one of them: the implementation of the Siemens ADVIATM WorkCell Automation Solution in St Göran Laboratory Hospital, Stockholm.
Integration of In Vitro Allergy Testing into Laboratory Automation: A Lean Approach
Johan Geijer, MSc Eng, Production Manager and Project Leader, Unilabs, St Göran Hospital, Stockholm, Sweden
}
In Cooperation
Precentri-fuged, prelabeled, unique identity
Pat/Dr Sample Analyze Decision
POCT, i.e.,cardiac markers on Stratus CS
ADVIACentaur
WC, LMLIS MW
ADVIA1650
ADVIA1650
Siemens ADVIA WorkCell
Sample manager
ADVIACentaur
Wo
rkce
ll
Stand-alone decap
Load tray and loader
Download request to CentraLink
Analyze in ADVIA 1650, ADVIA Centaur
Unload and sort
Validate in CentraLink
Method Consolidation• Routine biochemistry• TDM• Proteins• Trad clin chem Immunochemistry• Allergy• Infectious disease serology• Autoimmunity
Emergency samples
13
Implementation of anautomation solution:The ADVIA WorkCell systemThe implementation of the Siemens ADVIA WorkCell Automation Solution in 1999 was the first “process-oriented” project initiated by Unilabs. Figure 1 illustrates the different steps which are part of the process managed by the Siemens ADVIA WorkCell system.
The Siemens ADVIA WorkCell system includes four analyzers (two ADVIA Centaur® immuno-assay systems and two ADVIA® 1650 clinical chemistry systems) connected to a sample track which carries the patient sample tubes to the analyzers, a sample manager which loads patients tubes onto the track, and an IT data system (Siemens CentraLink® networking solution) for validation of results and auto-matic reflex testing. Emergency samples can be processed through the Siemens ADVIA WorkCell system as well as on point-of-care testing (POCT) instruments (Siemens Stratus® CS) for cardiac marker testing.
Figure 1. The workcell process depicting the initial situation in 1999, with a view to integrating allergy, infectious disease serology, and autoimmunity in the future.

Implementation of an ADVIA WorkCell system generated these benefits:
• Consolidation of different methods—routine biochemistry, therapeutic drug moni-toring (TDM), proteins, and immunoassay testing—on an integrated testing platform
• Reduction of the number of patient sample tubes processed in the laboratory (allowing more tests to be performed from a single tube)
• More reproducible turnaround times (TATs) with strong reduction in the number of errors.
• Increased efficiency (60% reduction of manual work—tube transfers within the laboratory) and staff satisfaction.
Since the Siemens ADVIA WorkCell system permitted the integration of many processes, a single, strong, multidisciplinary laboratory team was created to facilitate the implemen-tation of this new equipment.
Lean and Six SigmaThe Lean process is a way to think of improve-ments by creating value and eliminating waste during processes. Lean is usually complemente d by the Six Sigma process to reduce variation.
Both the Lean and the Six Sigma processes result in improvements of process efficiency and were critical factors in the successful implementation of the Siemens ADVIA WorkCell Automation Solution.
Lean“What’s needed is Lean thinking to help managers clearly specify value, to line up all the value-creating activities for a specific product along a value stream, and to make value flow smoothly at the pull of the customer in pursuit of perfection.” (James P. Womack and Daniel T. Jones, authors of Lean Thinking: Banish Waste and Create Wealth in Your Corporation).
Lean aims to create value in four dimensions: business; process; employees; and customers, who are the driving force for improvements.
Six SigmaSix Sigma is a process focused on a contin-uous decrease of variability. It is a really good and natural complement to Lean.
Allergy testing: The situation before integration into the Siemens ADVIA WorkCell systemInitially in 1999, allergy testing was not integrated into the processes handled by the Siemens ADVIA WorkCell Automation Solu-tion. Allergy testing was done on a stand-alone instrument and presented the following main problems: 1) very long total TAT for allergy testing, with poor reproducibility; 2) poor flow of allergy tubes (significant waiting time, with a lot of manual procedures and interactions); 3) allergy testing performed in batch testing mode only twice a week; and 4) “staff-depen-dent” organization, with only a few laboratory operators able to run and validate allergy tests.
Unilabs decided to integrate allergy testing into the ADVIA WorkCell system to answer both customers’ demands for better, faster allergy TATs and an internal demand for better efficiency. The ultimate goal was to be able to perform allergy tests in the same manner as routine chemistry tests (chemistry testing serving to illustrate how a modern core laboratory should work).
For allergy, additional main goals were to provide faster and more reproducible TATs, to deliver allergy results consolidated with other results (like chemistry tests), to have a better flow of tests (elimination of waiting times and reduction of manual interactions), to optimize staff utilization (by creating a multidisciplinary team to overcome “staff dependency”), and to enhance the medical benefits (in particular by reducing risks of errors). Of course, the integration of allergy testing into the ADVIA WorkCell system was also driven by a Lean approach covering all aspects of the allergy process, with a strong focus on speed.
1.3
14

Achievements after integration of allergy testing into the Siemens ADVIA WorkCell systemThe addition of an IMMULITE® 2500 immu-noassay system for allergy testing into the Siemens ADVIA WorkCell Automation Solution allowed Unilabs to achieve most of its goals. After the integration of allergy testing, the following benefits were reported:
• TATs for allergy are better and more reproducible, with 94% of test results reported within 24 hours. Figure 2 illustrates the situation before and after integration of allergy testing into the Siemens ADVIA WorkCell system.
Figure 2. TATs before and after integration of allergy testing into the Siemens ADVIA WorkCell system.
• It is possible to process about 100 sample tubes per day (in high allergy season) and potentially more, with no additional full-time equivalent (FTE).
• Forty allergy tests constitute 85% of the total allergy testing volume.
• Before integration of allergy testing into the ADVIA WorkCell system, Unilabs offered its customers 12 panels covering 57 allergen specificites. Since the integration, Unilabs is able to offer 18 panels covering 68 aller-gens (Table 1) and to perform 94% of all its customers requests in house within 24 hours. The remaining 6% of rare allergens are sent out to another Unilabs facility to guarantee good control of TAT.
Table 1. Allergy panels at Unilabs after automation of allergy testing.
• Allergy testing is now run in random access instead of batch mode, and the CentraLink solution allows automatic reflex testing for allergy and contributes to the improvement of the allergy test workflow.
• Error frequency has dropped. Using the ADVIA WorkCell system for postsorting and postregistration for storage eliminates the need for presorting and prestorage steps, maximizes traceability, and minimizes manual interactions.
• With one FTE freed up, there is more time for validation, for improved medical safety.
In summary, the addition of an IMMULITE 2500 instrument for allergy testing into the ADVIA WorkCell Automation Solution permitted Unilabs to achieve better efficiency. Through better control of the whole allergy testing process, the laboratory now delivers faster and more comprehensive allergy reports to its customers. All of these achieve-ments also result in higher satisfaction of clients—the aim of the Lean process.
FutureFollowing the successful integration of allergy testing, Unilabs has initiated similar projects to integrate serology and autoimmune testing into the ADVIA WorkCell Automation Solution (Figure 1). As for allergy, the objectives are to maximize the number of tests reported per 24 hours and to better coordinate reporting of serology and autoimmune results with other methods.
1.3
15
Panel Number
Inhalation panels 2
Tree panel 1
Grass panels 2
Weed panels 2
Animal panels 4
Dust panel 1
Mite panel 1
Mold panel 1
Food panels 3
Occupational panel 1
Before
Hou
rs
0
20
40
60
80
100
120
140
160
Allergy TATs
After

Adriano Mari, M.D.
16

1.4
Allergenic molecules: Structures and interactions
Tropomyosin: Example of an allergenic molecule
Since more and more allergenic molecules are continually being identified, new graphical repre-sentations (like the ones used in bioinformatics to describe networks of items) have become necessary to understand and illustrate the “molecule-to-molecule” relationships. An example of these new graphical representations is the “O ring” presented in Figure 1.
Figure 1. Tropomyosin sequence homology O ring network.
Future Diagnostic Tools for Better Practice and Interpretation in Allergic Diseases: From New In Vitro Markers to IT Integrated Solutions
Adriano Mari, M.D., CACeS, IDI-IRCCS, Allergy Data Laboratories sc, Latina, Rome, Italy
17

This O ring depicts the interactions between tropomyosin molecules of different species. (Tropomyosin is the leading allergen for shrimp allergy.) The small rings created by the arrowheads indicate the degree of interaction of a particular tropomyosin molecule with the others. In addition, if the large ring is full, this indicates that all molecules of the group are connected to each other (in this example, through sequence homology). Such a figure represents a summary of the current knowledge of molecule-to-molecule inter-actions based on the literature. Of course, other O rings describing interactions between other types of molecules are also available at www.allergome.org. (Allergome is a computer-based Web platform dedi-cated to providing allergen knowledge. The platform is hosted on a free website. Users can select allergenic molecules and get information on their sequences as well as on all molecules sharing sequence homologies with these particular molecules).
More and more molecules are described in the literature, but this information is not always fully analyzed, in particular in terms of molecule-to-molecule relationships. That is why we took advantage of the information posted on the Allergome website to create new tools for such data analysis. The following figures describe the information that Allergome can provide on a specific molecule (in this case, Pen a 1.0102, an isoform of tropomyosin) from general information (Figure 2) and a description of amino acid sequences (Figure 3) to sequence homologies with other molecules (Figure 4).
When the Allergome user clicks on the name of a molecule (such as Pen a 1.0102), the following screen is displayed.
Figure 2. Pen a 1.0102: general information.
1.4
18
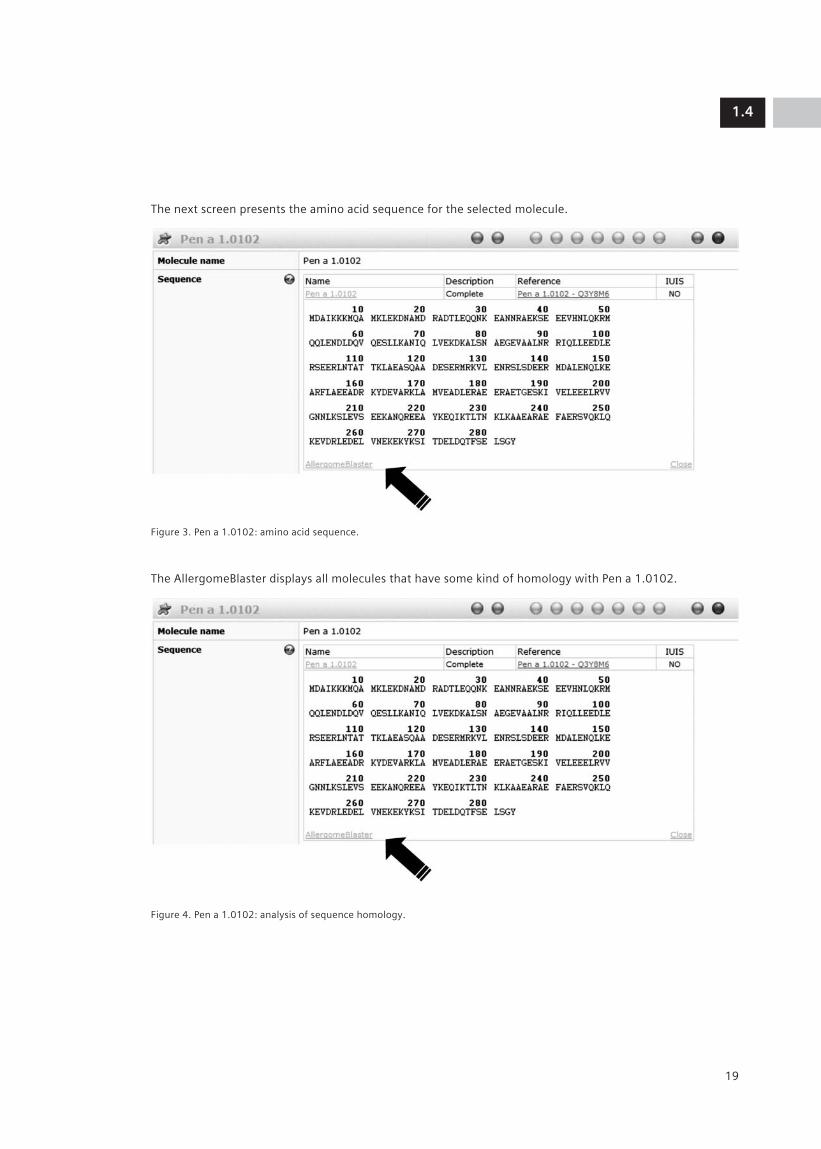
The next screen presents the amino acid sequence for the selected molecule.
Figure 3. Pen a 1.0102: amino acid sequence.
The AllergomeBlaster displays all molecules that have some kind of homology with Pen a 1.0102.
Figure 4. Pen a 1.0102: analysis of sequence homology.
1.4
19

This type of analysis provides very valuable information. In the case of tropomyosin, it shows, for example, that two other allergens (Pen i 1.0101 and Mar j 1.0101) from two different organisms (prawn and langous-tine) had a 100 percent matching sequence with the shrimp Pen a 1.0102 tropomyosin molecule. This information is very useful for patients, since it demonstrates that a molecule with possible allergenic proper-ties can be found in different organisms.
In addition, Allergome returned the following findings (Rasi et al. Abstract 1090. EAACI 2008) for the Pen a 1.0102 shrimp tropomyosin model and IgE-binding peptides:
• A total of 34 IgE-binding peptides were found (Ayuso et al. Int Arch Allergy Immunol. 2002;127:27-37).
• A total of 83 organisms were identified, 42 for Allergome and 41 for Uniprot (www.uniprot.org).
• A total of 137 allergens with 100% matching epitopes were found: 68 for Allergome and 69 for Uniprot.
Each new tropomyosin which will be entered in Allergome will be analyzed for its epitope content. New epitopes will be analyzed for their presence in molecules.
Moving from a representation of sequence homologies, Figure 5 shows which molecules are recognized by the same IgE (corecognition).
Figure 5. O ring network showing tropomyosin IgE corecognition.
1.4
20

So far, the IgE corecognition O ring is not as complete as the corresponding sequence homology O ring in Figure 1; it is a very complex and time-consuming undertaking to design clinical experiments that elucidate the relations of all these molecules with each other. Therefore, to document IgE corecognition among various tropomyosin molecules, we designed IgE inhibition studies (Figure 6).
1.4
21
100Inhibitor: rAni s 3
IgE
bin
din
g (
% in
hib
itio
n)
75
50
25
0
rAni s 3
rDer p 10rHel as 1
nPen i 1
nPen m 1rPer a 7
100Inhibitor: rHel as 1
IgE
bin
din
g (
% in
hib
itio
n)
75
50
25
0
rAni s 3
rDer p 10rHel as 1
nPen i 1
nPen m 1rPer a 7
100Inhibitor: rDer p 10
IgE
bin
din
g (
% in
hib
itio
n)
75
50
25
0
rAni s 3
rDer p 10rHel as 1
nPen i 1
nPen m 1rPer a 7
100Inhibitor: nPen i 1
IgE
bin
din
g (
% in
hib
itio
n)
75
50
25
0
rAni s 3
rDer p 10rHel as 1
nPen i 1
nPen m 1rPer a 7
100Inhibitor: rPer a 7
IgE
bin
din
g (
% in
hib
itio
n)
75
50
25
0
rAni s 3
rDer p 10rHel as 1
nPen i 1
nPen m 1rPer a 7
100Inhibitor: nPen m 1
IgE
bin
din
g (
% in
hib
itio
n)
75
50
25
0
rAni s 3
rDer p 10rHel as 1
nPen i 1
nPen m 1rPer a 7
Figure 6. IgE inhibition studies for tropomyosin molecules. (Palazzo et al. CACeS, IDI-IRCCS. 2008. Data on file.)

Six tropomyosin molecules (rAni s 3, rDer p 10, rHel as 1, nPen I 1, nPen m 1, and rPer a 7) were used for these inhibition studies. The best inhibitors were rDer p 10, rPen I 1 and nPen m 1, which indicates that these three molecules contain all the aller-genic epitopes present in the other molecules. This is an important finding for both diagnosis and treatment (immunotherapy) applications.
IgE inhibition studies with allergenic extracts
Since allergenic molecules are not always available (particularly for immunotherapy), IgE inhibition studies are also useful for analyzing the composition of crude allergenic extracts to identify which allergenic compo-nents are present. The crude extracts are then used as inhibitors vs. single allergenic molecules.
Such an experiment was performed in our laboratory for grass pollen extracts. Pooled samples and twenty whole grass-pollen extracts provided by Siemens were used for inhibition studies with molecular grass aller-gens (Palazzo et al. EAACI 2008). The results are summarized as follows:
• rPhl p 1: Eighteen extracts demonstrated 75% to 100% inhibition. (Similar inhibitions were observed with nLol p 1 vs. rPhl p 1).
• rPhl p 2: Nearly all of the extracts demon-strated 100% inhibition.
• rPhl p 5: Only around 75% of the extracts demonstrated inhibition above 80%, with six of these extracts demonstrating 100% inhibition.
• rPhl p 6: Approximately 50% of the extracts demonstrated inhibition greater than 80%, and of these, only four extracts demon-strated 100% inhibition.
• rPhl p 7: All extracts demonstrated inhibition above 80%, and all but three demonstrated 100% inhibition.
• rPhl p 12: All extracts demonstrated 100% inhibition.
The results obtained with each of the 20 grass pollen extracts and the six groups of molecules are summarized in Table 1. The presence of each group of molecules was detected in almost all of the 20 grass extracts.
Table 1. Summary of inhibition studies between mol-ecules and extracts. (Palazzo et al. EAACI 2008).
Yes = already identified
New = newly identified
No = not identified
Some of the information in Table 1 was already known from the literature. This experiment documented the information shown in the “New” cells.
1.4
22
Grass species rPhl p 1
rPhl p 2
rPhl p 5
rPhl p 6
rPhl p 7
rPhl p 12
Agrostis stolonifera New New New New New New
Alopecurus pratensis
Yes New New New New New
Anthoxanthum odoratum
Yes Yes Yes Yes Yes Yes
Avena sativa Yes Yes Yes New Yes Yes
Bromus inermis Yes New New New Yes New
Cynodon dactylon Yes Yes Yes Yes Yes Yes
Dactylis glomerata / Phalaris arundinacea
Yes Yes Yes New Yes Yes
Elymus triticoides New New New New New New
Festuca elatior Yes Yes Yes New Yes New
Holcus lanatus Yes Yes Yes New New New
Lolium perenne Yes Yes Yes New Yes Yes
Paspalum notatum Yes New New New New New
Phalaris arundinacea Yes New Yes New New Yes
Phragmites communis
Yes New Yes New New Yes
Phleum pratense Yes Yes Yes Yes Yes Yes
Poa pratensis Yes Yes Yes Yes Yes Yes
Secale cereale Yes Yes Yes New New Yes
Sorghum helapense Yes New No New Yes Yes
Triticum aestivum Yes Yes Yes New New Yes
Zea mais Yes No Yes No Yes Yes

A similar experiment was performed to investigate reactivity to cross-reactive carbo-hydrate determinants (CCD). Since it has been reported that IgE reactivity to CCD leads to positive in vitro IgE results but has no clinical relevance, it is important to identify true clinical reactivities, in particular to improve inclusion criteria for immunotherapy. By using a new marker, MUXF (glycan chain from bromelain), as an inhibitor vs. allergenic molecules, we have been able to rule out clinical false-positive results in a group of pollen-allergic patients (Palazzo et al. EAACI 2007).
Finally, Allergome provides a color-coded allergenicity score for each allergenic molecule (Figure 7). The different colored spots indicate
• Data generation Experimental vs. in silico
• Sequence Available or not available
• IgE Positive, negative nonfunctional test or not available
• IgE functional test Positive, negative or not available
•Skin test Positive, negative or not available
• Conjunctival Positive, negative provocation test or not available
• Nasal Positive, negative provocation test or not available
• Bronchial Positive, negative provocation test or not available
• Oral challenge Positive, negative or not available
• Epidemiology from literature
• ReTime
The Allergome ReTiME platform
How is it possible to combine informa-tion coming from laboratories with clinical information related to allergenic extracts and molecules? Two modules have been created within Allergome to achieve this objective.
• The ReTiME module for raw data mining, which allows storage and retrieval of real-time data
• The InterAll module for e-recording information
The overall structure of the Allergome IT system is displayed in Figure 7. Results of IgE measurements performed in laboratories can be automatically uploaded to the ReTime Allergome platform and transferred into an allergy e-record.
Figure 7. Components of the Allergome IT system.
1.4
23
• Allergens• Other IgE-Binding Antigens• No IgE-Binding Antigens
Allergens
Export bibliography
IgE DetectionLab systems
InterAllAllergy e-Record
ReTimeData Mining
RefArrayText Mining

Figure 8. The InterAll e-record.
The InterAll e-record has been designed for any physician and/or laboratory manager involved in allergy testing and is intended to be a world-based network. Each member of the InterAll network will have an e-record and will receive regular updates on allergenic molecules (Allergome Newsletter). Aller-gists will also be able to download clinical information about their patients as well as results of sIgE measurements. (In vitro results will be automatically uploaded from labora-tory instruments; see Figure 8.) InterAll will provide a complete and consolidated report for allergic patients.
Conclusions
Information technology has become a major tool to explore the allergenicity of molecules or crude extracts. Today, information and results generated by clinical departments and labora-tories can be automatically uploaded into the Allergome platform, which offers the possibility of expediting the process of identifying and comprehending allergenic structures.
1.4
24


Thomas Grunwald, Ph.D.
26

1.5
PLS-Design is a biotechnology research company dedicated to research of recombi-nant antibodies for allergy diagnosis.
A significant number of recent publications have shown an increasing demand for recom-binant antibodies in allergy diagnosis. The primary uses for chimeric antibodies are
• To improve reference sera materials (IgE, IgG4)
• To support the standardization of operating procedures in clinical trials
• To overcome problems (titration, frequency, etc.) and availability of some sera
• To achieve consistent antibody specificity, availability and quality
• To determine allergenic potency (rare allergens)
• To monitor immune modulation during therapy
• To perform inter- and intra-assay comparison of serologic tests
• To produce synthetic reference sera
Recombinant antibody development
Considerations for recombinant antibodies in allergy diagnosis
Several considerations must be taken into account to develop recombinant antibodies. These considerations can be summarized as follows and will be developed below:
Selection and Expression
• Methods for generation
• Choice of antibody library
• Conversion into isotypes
Chimeric Antibodies in Allergy Testing: Description of Potential Applications
Thomas Grunwald, Ph.D., VP Business Development, PLS-Design GmbH, Hamburg, Germany
27
Characteristics of chimeric human IgE
• Origin, preparation, and immobilization of allergens
• Functionality in diagnostic tests
• Applicability in cellular systems
• Stability
Applications of chimeric human IgE
• Performance of constructs in intra-assay system comparison
• Available IgE panel
Recombinant antibody generation methods
Recombinant antibodies are obtained by two methods: hybridoma cloning and an evolutionary approach.
Hybridoma cloning approach
Hybridoma cloning is the traditional method that is performed via conversion of existing antibodies. The source materials are mono-clonal cell lines, but sometimes these may not exist or be available.
Evolutionary methods approach
Evolutionary methods are carried out via in vitro generation of monoclonal immuno-globulins from libraries. Different libraries can be used. The source materials are synthetic-, immunization- or patient-derived libraries An example is the phage-display technology (Figure 1) that involves the following steps.
• Selection of allergen-specific antibody fragments
• Conversion to antibody isotypes involved in allergy
• Evaluation of expression systems
• Characterization of recombinant antibodies (stability, specificity, affinity, etc.)
• Preparation of standard sera with defined IgE, IgA, IgG

Figure 1. Steps of the phage-display technology.
The phage-display technology always starts with the amplification of the antibody genes.
The genes from the heavy chain together with the light chain compose the variable region from the naive or immunized organism and the main binding element.
Introducing synthetic nucleotides allows the assembly of fragments from naive or immu-nized organisms and the synthetic nucleotides that compose the single chain fragment of variable domains (scFv), which is the minimum binding antibody unit that can be produced. The introduction of the synthetic nucleotides allows variability. After fusion, the scFv is incorporated into the gIII protein.
After amplification of the genes, the scFv are then transferred into a vector system for the production of the corresponding proteins. The most commonly used vector systems are phages. The genes are displayed on top of the phage as a fusion gIII protein, and the phage also contains the DNA of that fragment.
This results in a coupling of the genotype and the phenotype in a single organism. It is then possible to select the phage by function (i.e., a protein), and the gene information is also made directly available. This is a very powerful method, because phages are small, allowing insertion of a large number of phages into a test tube with eventual selec-tion of a large library of phages. This could not be performed by using larger cells. With this technology, library sizes of 108 to 1012 can be achieved.
The selection process consists in starting from a library containing different scFv and transforming E. coli with this material. E. coli infected with the phages form recombinant phages. At the beginning of the selection process, different phages with different scFv are generated. The selection is normally done by a process called “panning,” where the allergen or the molecule of interest is immobi-lized on a solid surface. The phages bind to the solid surface, and eluting the surface allows the selection of a rich population of phages. It is then possible to obtain a population of monoclonal phages with a specific scFv.
1.5
28
Immunological repertoire of naive or immunized organisms
Synthetic repertoire of germ line sequences
Variable regionsVariable regions
Oligonucleotide synthesisHeavy chain Light chain
LigationLigation
Fusion with gIII protein
lac promoter
Ribosomal binding site
peIB leader myc epitope
His tag
gIII
Assembly
Amplification Insertion
Assembly

The whole process takes approximately 2 days. It is therefore possible to run several rounds within 1 week.
After three rounds of selection, there is enough binding material with very specific scFv. An example is shown in Figure 2.
Figure 2. Selection of donor-derived library against timothy grass pollen allergen Phl p 1.
Phl p 1 was the selecting agent, and an increase of the binding population of phages to Phl p 1 is obtained at the end of each round. After three rounds of selection, there were enough phages to select monoclonal antibodies. Six phages were picked from the library, including one carrying an scFv binding to Phl p 1.
Characteristics of antibody library types
The population of monoclonal antibodies obtained may vary according to the type of initial library used. There are three main types of libraries:
Immune libraries established from human allergic donors
• In these libraries, the diversity of antibody genes is isolated from blood monocytes. Such libraries are normally more challenging to generate because it is more difficult to obtain the material and enough cells to create a large library.
• The disadvantage of these librairies is to be preselected for the allergens to which patients are allergic, but their advantage is that they probably target natural epitopes.
• The affinities of antibodies are usually high because in vivo selection is already done, and the expression would usually be very good.
Immune libraries from immunized animals
Animal-derived libraries are somewhat more artificial. Following the selection of the molecule of interest and immunization of an animal, the B cells are drawn and the genes are amplified for the selected antibodies.
• Animal-derived libraries are moderately difficult to generate. There are more cells to work with. However, as the selection is done at the beginning of the process, these libraries are available only for some particular allergens. In addition, since immunization is involved, such libraries will probably also target non-IgE epitopes.
• The affinities remain high and the expres-sion is usually good.
Synthetic combinatorial libraries of VH and VL
• The advantages of such libraries is to be premade and ready for use “off the shelf.” There is one synthetic library which can be used to generate many different antigens.
• However, such libraries may also target nonnatural epitopes. The expression levels are sometimes negatively affected, due to the artificial combination of genes that do not always work.
1.5
29
0.6 PhI p 1
Control0.5
0.4
0.3
0.2
0.1
0Round 1
Ab
sorb
ance
(4
05
nm
)
Ab
sorb
ance
(4
05
nm
)
Monoclonal ELISA (3rd round clones)Polyclonal ELISA of selection rounds
Round 2 Round 3 1 2 3 4 5 6
0.6
0.5
0.4
0.3
0.2
0.1
0
PhI p 1
Control
0.6 PhI p 1
Control0.5
0.4
0.3
0.2
0.1
0Round 1
Ab
sorb
ance
(4
05
nm
)
Ab
sorb
ance
(4
05
nm
)
Monoclonal ELISA (3rd round clones)Polyclonal ELISA of selection rounds
Round 2 Round 3 1 2 3 4 5 6
0.6
0.5
0.4
0.3
0.2
0.1
0
PhI p 1
Control

Sometimes even libraries from pooled patients do not produce enough material for further analyses. It is therefore possible to mix antibodies from human, animal and synthetic sources without affecting the function.
Figure 3. Patient library–derived scFv likely to target natural IgE epitopes.
An example of a patient-derived library is given in Figure 3. The anti–Phl p 1 clone cross-reacts with Bet v 1 but not with Phl p 5. The patient is therefore allergic to timothy grass but also to birch pollen.
It is also possible to label an antibody against the minimal sequence scFv. It is even possible to make a full antibody against the scFv sequence.
In addition, it is also possible to make an artificial construct as shown in Figure 4. A heterotetrameric molecule is reduced to two homodimeric forms or even to shorter versions. All have the same scFv regions and therefore exhibit the same functional activity.
Figure 4. Possible artificial constructs that can be derived from a heterotetrameric molecule, all having the same scFv regions and therefore the same functional activity.
Another possibility is to make different immunoglobulin subclasses such as IgA1+2, IgG1-4, IgM (monomeric and polymeric) and IgE (Figure 5).
1.5
30
1.8 AllergenControl1.6
1.4
1.2
1
0.8
0.6
0.4
0.2
0PhI p 1
Ab
sorb
ance
(4
05
nm
)
PhI p 5 Bet v 1
Heterotetrameric IgG
Homodimeric scFv(CH1–3)
Homodimeric scFv(∆CH1)
scFv fusion
scFv
Library-derived
VH
VL
CL
CH1 VHVH
VL VL
CH1 CH1
CH2
CH3
CL
CH2
CH3
CH2
scFv IgE CH2-4 scFv IgG CH2-3
240 kDa170 kDa
130 kDa
100 kDa
70 kDa
55 kDa
160 kDa
116 kDa97 kDa
Coomassie staining
IgE IgG (including IgG4) IgA
Immunoblot
IgG scFv IgA2 CH2-3 IgA2IgE
Asn265Asn297
Asn131
Asn205
Asn327
Asn371Asn394CH3
CH4
Figure 5. Expression of recombinant antibodies of different subclasses. The first constant domain is deleted to increase expression rates.

The binding regions of the three different subclasses of molecules (IgG, IgA, IgE) were selected by phage display. The molecules were then rebuilt by molecular technology and finally expressed at expected sizes and molecular weights. These constructs are also recognized by specific secondary antibodies against IgA, as shown on the immunoblot.
The experiment below (Figure 6) shows mole-cules from different subclasses with the same scFv and the same binding specificity. All of these constructs bind an allergen and are detected by the secondary subclass antibody. The constructs can also be used to detect allergens by the immunoblotting technique.
Figure 6. Generation of IgG, IgA, and IgE isotypes from one scFv antibody.
Characteristics of chimeric human IgE
Expression system
For the selection process, it is important to use the protein conformation closest to that of the native protein. An example is displayed in Figure 7, where the scFv was selected against the bee venom allergen Api m 5, produced in insect cells. This selection ensures that the scFv will detect this allergen but also Api m 5 in bee venom extracts and purified Api m 5 produced in E. coli.
Figure 7. Dependence of antibody reactivity on the expression system used for the allergen; verification of binding of recombinant anti–Api m 5 antibody selected against insect cell–expressed protein.
Cross-reactive carbohydrate determinant reactivity
If the objective is to produce antibodies recognizing allergenic proteins and not carbohydrate epitopes, it is critical to start the selection process with a molecule that does not present such cross-reactive carbohydrate determinant (CCD) epitopes.
This principle is illustrated in Figure 8, which presents the CCD reactivity of a recombi-nant honeybee venom allergen (Api m 5) produced in two different types of insect cells. Depending on the type of insect cells used—Trichoplusia ni or Spodoptera frugiperda—the degree of glycosylation of the recombinant Api m 5 molecule will differ greatly.
1.5
31
3.0
2.5
2.0
1.5
1.0
0.5
0IgG1
Capture ELISARecombinant Bet v 1a–coated wellsRecombinant antibody (B2) supernatantIsotype-specific secondary antibody
ImmunoblottingRecombinant Bet v 1a blottedRecombinant IgE supernatantIgE-specific secondary antibody
Ab
sorb
ance
(4
05
nm
)
IgA2
1 M
70 kDa
55 kDa
25 kDarBet v 1
15 kDa
IgE
Bet v 1
Control
3Allergen
Control
2
Ab
sorb
ance
(4
05
nm
)
1
0
rApi m
5 inse
ct ce
lls
Bee venom
Native A
pi m 5
Api m 5-G
ST E. coli
Api m 5-M
BP E. coli
3.0
2.5
2.0
1.5
1.0
0.5
0IgG1
Capture ELISARecombinant Bet v 1a–coated wellsRecombinant antibody (B2) supernatantIsotype-specific secondary antibody
ImmunoblottingRecombinant Bet v 1a blottedRecombinant IgE supernatantIgE-specific secondary antibody
Ab
sorb
ance
(4
05
nm
)
IgA2
1 M
70 kDa
55 kDa
25 kDarBet v 1
15 kDa
IgE
Bet v 1
Control

Figure 8. Glycosylation “tuning” by choice of expression system. Cross-reactive carbohydrate determinants (CCD) in insects are mainly α(1,3)-corefucose residues detected by polyclonal anti-HRP antiserum (Sigma). Api m 5 produced in Trichoplusia ni and Spodoptera frugiperda insect cells differ greatly in the degree of insect-specific glycosylation.
It is possible, therefore, to select a certain type of antibody which will work only for a particular system.
Several means of avoiding this issue are possible:
• Use of combined chemistry immobilization strategies,
• Use of nonspecific reagents (e.g., photoactive linker),
• Selection of antibodies to work in different systems.
Stability
Figure 10 shows a dose-dependent curve (above) and 1-week stability test at RT (below), which demonstrate that the ScFv molecule that detects the Bos d 5 antigen is quite a stable construct.
Allergen immobilization
The selection process is performed on immo-bilized allergens, but the immobilization method employed may affect the accessibility of epitopes (Figure 9).
• One method may mask one epitope due to the position of the linking reagent (A).
• Another method may mask another epitope in a different manner (B).
• A third method, which is more random, may not mask any epitopes but may allow detec-tion of all epitopes equally (C).
Figure 9. Possible effects of allergen immobilization method on epitope availability.
1.5
32
3rApi m 5Control
Trichoplusia ni Spodoptera frugiperda
Ab
sorb
ance
(4
05
nm
)
ELISA with polyclonal anti-HRP(CCD reactivity) Immunoblot with polyclonal anti-HRP
(CCD reactivity)
2
1
0
130 kDa
100 kDa
70 kDa
55 kDa
40 kDa
rApi m 5T. ni
rApi m 5S. frugiperda
Matrix AEpitope 1 masked
Matrix BEpitope 2 masked
Matrix CNo specific epitope masked

Figure 10. Two anti–Bos d 5 (β-lactoglobulin) homodi-meric antibodies are reactive at various dilutions and are stable diluted 1:10 in negative sera. (Adapted, with permission of the American Association for Clinical Chemistry, from Braren I, Blank S, Seismann H, Deckers S, Ollert M, Grunwald T, et al. Generation of human monoclonal allergen-specific IgE and IgG antibodies from synthetic antibody libraries. Clin Chem. 2007 May;53(5):837-44).
Examples of applications of chimeric human IgE
It is possible to construct chimeric antibodies for use in currently available commer-cial methods for measurements of sIgE, as shown in Figure 11 for the IMMULITE® 2000 (Siemens Healthcare Diagnostics) and UniCAP® 250 (Phadia) systems. Both systems gave comparable results for two different IgE constructs (short and complete version) against hen egg lysozyme (Gal d 4).
Figure 11. Anti–Gal d 4 sIgE results obtained using two chimeric antibodies in the IMMULITE 2000 and UniCAP 250 systems.
Several examples of the use of such anti-bodies are presented below, with comparisons of results obtained with the IMMULITE 2000 and UniCAP 250 systems.
Interassay system comparison
With the anti–Bet v 1 chimeric antibody, similar dose-dependent curves were observed for the IMMULITE 2000 and the UniCAP 250 systems (Figure 12).
1.5
33
scFv IgE CH2-4
VH
VL
CH2Asn265Asn371Asn394CH3
CH4
2
1.8
1.6
1.4
1.2
1
0.8
0.6
0.4
0.2
01:10 1:20
Dilution
ELISA dilution series One-week stability of working solution
Ab
sorb
ance
(4
05
nm
)
1:50 1:100 1:200 1:500 1:1000
2
1.8
1.6
1.4
1.2
1
0.8
0.6
0.4
0.2
00 1
Days
RT4ºC
Ab
sorb
ance
(4
05
nm
)
2 3 4 5 6 7
Hy-IgEDC1His
Hy-IgEHis
8060
100
40
200
Dilution factor
Class V
IMMULITE 2000 Hen Egg White (F1)
SPE
F1
5121283282
Hy-IgEDC1His
Hy-IgEHis
8060
100
40
200
Dilution factor
Class 6
UniCAP 250 Hen Egg White (F1)
SPE
F1
5121283282

Figure 13. Specific IgE results using chimeric anti–Phl p 5a antibody.
With the anti–Bos d 5 chimeric antibody, comparable concentration-dependent curves were observed on IMMULITE 2000 and UniCAP 250 systems for the whole milk extract. On the UniCAP 250 system, however, the curves were different for the whole milk extract and the Bos d 5 molecule (Figure 14).
Figure 12. Specific IgE results using chimeric anti–Bet v 1 antibody.
With the anti–Phl p 5a chimeric antibody, comparable concentration-dependent curves were observed for the IMMULITE 2000 and UniCAP 250 systems. The difference in dose responses for the two systems was due to the specificity of the monoclonal antibody. Differ-ences between systems should be expected, as previously shown (immobilization, etc.) No binding was observed in the UniCAP 250 system with the Phl p 5a molecule. This can be explained because Phl p 5b is normally used in the Phadia system. It also demon-strates the high specificity of these monoclo-nal antibodies, which are able to differentiate allergen isotypes (Figure 13).
1.5
34
10
8
6
4
2
0
2 4 8 16 32 64 128 256 512 1024
Dilution factor
Class III
IMMULITE 2000
sIg
E (k
U/L
)
sIg
E (k
U/L
)
12G6G6
G215: PhI p 5
120
100
60
40
20
0
2 4 8 16 32 64 128 256 512 1024
Dilution factor
Class 6
UniCAP 250
80
140
160
G6: timothy grass: (Phleum pratense) pollen extractG215: PhI p 5
10
8
6
4
2
0
2 4 8 16 32 64 128 256 512 1024
Dilution factor
Class III
IMMULITE 2000
sIg
E (k
U/L
)
sIg
E (k
U/L
)
12G6G6
G215: PhI p 5
120
100
60
40
20
0
2 4 8 16 32 64 128 256 512 1024
Dilution factor
Class 6
UniCAP 250
80
140
160
G6: timothy grass: (Phleum pratense) pollen extractG215: PhI p 5
2.5
2
1.5
1
0.5
0
2 4 8 16 32 64 128 256 512 1024
Dilution factor
T3: birch pollen extractT215: Bet v 1
Class II Class 2
IMMULITE 2000
SPE
3 T3
T2152.5
1.5
1
0.5
0
2 4 8 16 32 64 128 256 512 1024
Dilution factor
UniCAP 250
sIg
E
2
T3
2.5
2
1.5
1
0.5
0
2 4 8 16 32 64 128 256 512 1024
Dilution factor
T3: birch pollen extractT215: Bet v 1
Class II Class 2
IMMULITE 2000
SPE
3 T3
T2152.5
1.5
1
0.5
0
2 4 8 16 32 64 128 256 512 1024
Dilution factor
UniCAP 250
sIg
E
2
T3

Figure 14. Specific IgE results using chimeric anti–Bos d 5 antibody.
Both IMMULITE 2000 and UniCAP 250 results are shown in Figure 15. The two IMMULITE 2000 curves for the whole extract and rApi m3 match perfectly. (It is also good to note that in this type of experiment, the absolute dose value is not the most important outcome.)
Figure 15. Specific IgE results using chimeric anti–Api m 3 antibody.
Both systems showed similar dose–response curves for another bee venom allergen, Api m 5 (Figure 16).
Figure 16. Specific IgE results using chimeric anti–Api m 5 antibody.
Figure 17 presents the results of two clones for the same Ves v 5 allergen tested in the IMMULITE 2000 and UniCAP 250 systems. Results for clone 1 (above) are similar, whereas those for clone 4 (below) show greater divergence. This dissimilarity is probably due to differences in the epitope specificities of the antibodies.
1.5
35
1.2 F2
F771
0.8
0.6
0.4
0.2
0
2 4 8 16 32 64 128 256 512 1024
Dilution factor
F2: milk extractF77: Bos d 5 (β-lactoglobulin)
Class II
IMMULITE 2000
SPE
80 F2
F7770
60
40
30
20
0
2 4 8 16 32 64 128 256 512 1024
Dilution factor
Class 5
Class 3
UniCAP 250
sIg
E
50
10
120
100
80
60
40
20
0
1 2 4 8 16
Dilution factor
Class 6
Class III
Api m 3–specific IgE (∆C1 construct)
sIg
E (k
U/L
)
32 64 128 256
SPE A47
CAP i1
SPE i1
A47: rApi m 3i1: honeybee venom
25 SPE i3
CAP i1
SPE i1 20
15
10
5
0
1 2 4 8 16
Dilution factor
Api m 5–specific IgE (∆C1 construct)
sIg
E (k
U/L
)
32 64 128 256
i3: wasp venomi1: honeybee venom
1.2 F2
F771
0.8
0.6
0.4
0.2
0
2 4 8 16 32 64 128 256 512 1024
Dilution factor
F2: milk extractF77: Bos d 5 (β-lactoglobulin)
Class II
IMMULITE 2000
SPE
80 F2
F7770
60
40
30
20
0
2 4 8 16 32 64 128 256 512 1024
Dilution factor
Class 5
Class 3
UniCAP 250
sIg
E
50
10

Table 1. Recombinant IgE antibodies available from PLS-Design for research use only (28).
Summary
• Recombinant antibody technologies provide access to monoclonal allergen-specific anti-bodies.
• Synthetic and patient-derived antibody libraries have been successfully used to select recombinant allergens.
• Functional antibodies of different isotypes (e.g., IgE, IgG4, IgA) having the same speci-ficity and affinity have been generated.
• Evaluation of different IgE antibodies in diagnostic systems has been demonstrated.
– Monoclonal specificity reveals expected differences in allergen recognition between systems.
– Clones can be selected to be compatible with certain systems, taking into account parameters such as allergen folding, glycosylation, and immobilization.
• Recombinant IgE antibodies are stable and suitable as diagnostic reagents.
– ΔC1 constructs are expressed better than full antibodies.
Figure 17. Specific IgE results using chimeric anti–Ves v 5 antibody clones.
In summary, a total of 28 chimeric IgE antibodies are currently available from PLS-Design (Table 1). These recombinant IgE antibodies are available for research use only.
1.5
36
Allergen Mol. weight No. of clones
Api m 1 17 kDa 4
Api m 2 45 kDa 1
Api m 3 49 kDa 1
Api m 5 100 kDa 2
Ves v 1 35 kDa 1
Ves v 2a 45 kDa 1
Ves v 3 100 kDa 2
Ves v 5 25 kDa 2
Bet v 1 17 kDa 2
Phl p 1 35–37 kDa 1
Phl p 5a/b 29 kDa 1/1
Bos d 5 18 kDa 4
Gal d 4 14 kda 1
Mal d 1 18 kDa 4
16 SPE i3
CAP i3
SPE i3
CAP i314
12
10
8
6
4
2
0
1 2 4 8 16
Dilution factor
Class 5
Class IV
Ves v 5–specific IgE (∆C1), clone 1 Ves v 5–specific IgE (∆C1), clone 4
sIg
E (k
U/L
)
32 64 128 256
60
50
40
30
20
10
0
1 2 4 8 16
Dilution factor
sIg
E (k
U/L
)
32 64 128 256
i3: wasp venom
16 SPE i3
CAP i3
SPE i3
CAP i314
12
10
8
6
4
2
0
1 2 4 8 16
Dilution factor
Class 5
Class IV
Ves v 5–specific IgE (∆C1), clone 1 Ves v 5–specific IgE (∆C1), clone 4
sIg
E (k
U/L
)
32 64 128 256
60
50
40
30
20
10
0
1 2 4 8 16
Dilution factor
sIg
E (k
U/L
)
32 64 128 256
i3: wasp venom

Application of recombinant antibodies in allergy diagnostics
• As a noninfectious synthetic substitute for pooled sera for standardization in diagnos-tics, and to eliminate the problem of rare and expiring serum pools
• For research purposes, such as epitope characterization with patient-derived IgE
– e.g., expression of IgE Fab and cocrystal-lization with allergens
• First sets of allergen-specific monoclonal IgE, IgG1, IgG4 and IgA2
– Quantitative analysis of involvement during the immune response
• Cellular studies of allergen–IgE– receptor interaction
1.5
37

Prof. Markus Ollert, M.D.
38

1.6
Considerations for a molecular approach to sIgE testing
Currently, natural extracts from allergenic sources are the materials predominantly used for allergy testing. In an ideal extract, all the allergens would be in equimolar concentra-tions, with the same number of each of the molecules that induce the IgE response. In most cases, however, this ideal is not observed: one or a limited number of the allergens dominate, and the other allergens are present in lesser numbers. The loss of some epitopes of allergens that are already underrepresented in the extract may result in the complete absence of detection by sIgE. On the other hand, an allergen which is overrep-resented will still be easily detected, even if some of the epitopes have been destroyed.
Several points must be considered for a molecular approach to IgE testing:
• Is representation of all natural isoforms necessary, or will a limited number of isoforms suffice?
• Which expression system is to be used for the recombinant production of allergen?
• Is glycosylation necessary or not?
• What are the interspecies variations?
Venom allergy
In Central Europe, venom allergies are mostly those to honeybee or vespid venoms.
Elicitors of venom allergy
Stinging insects in families of the order:
• Apidae (Apis, Bombus)
• Vespidae (Vespa, Vespula, Dolichovespula, Polistes)
• Myrmicidae (Solenopsis, Pogonomyrmex)
Future Clinical Applications of Molecular Allergens for Specific IgE and IgG/IgG4 Testing
Prof. Markus Ollert, M.D., Technische Universität München (TUM), Munich, Germany
39
Clinical consequences
The clinical consequences of hymenoptera venom allergy are well known:
• Anaphylaxis
– Generalized urticaria
– Angioedema
– Loss of blood pressure
– Loss of pulmonary function
– Anaphylactic shock / cardiac arrest
• Prevalence: 2%–4%
• Sensitization: 25%–30% (the proportion which could be due to cross-reactive carbo-hydrate determinant [CCD] reactivity is still unclear)
• Mortality: ~0.2 to 0.5/year/1 million.
Diagnosis of venom allergy
Diagnostic parameters consist of the following:
• Patient history / physical examination
• Skin test (prick and/or intradermal)
• In vitro test
– Specific IgE measurements
– Cellular allergy test, such as basophil activation test (BAT; reserved for other-wise unresolved cases)
– Basal serum tryptase to rule out mastocytosis (patients with masto- cytosis may exhibit serious reactions to immunotherapy).
It is critical to perform a good insect venom allergy diagnosis since the success rates of specific immunotherapy (SIT) reported in literature with partially purified extracts from honeybee and vespid venom is very high:

• Honeybee SIT: ~80% (~70%–90%)
• Vespid SIT: ~90% (~80%–95%)
The success of immunotherapy can be assessed by the so-called “sting challenge test” with the living insect.
The following problems and questions remain with venom allergy and daily practice:
• Negative sIgE measurments and/or skin test despite convincing history of anaphylaxis
• Double-positive sIgE measurements and/or skin test for honeybee and wasp
• Failure of specific venom immunotherapy (which occurs more often with honeybee than with vespid allergies)
• Danger of concluding SIT was successful, the only sure way to evaluate success being another insect stinging
• Duration of SIT, which can can last 3 to 5 years or longer
• Systemic side effects of SIT, which are seen more often with honeybee than with vespid allergies.
Thus, there is a need for new, more modern methods of evaluating venom allergy.
The component-resolved approach to venom allergy
The question is, therefore, to determine whether the use of molecular allergens should resolve these problems.
Component-resolved diagnosticsIdentification of a molecular allergen is a complex process. The allergen must first be characterized thoroughly in terms of the presentation of IgE epitopes, basophil activation, etc., and then materials must be obtained for preliminary evaluation in a clini-cally relevant situation.
Most of the allergens that have been identi-fied in insect venoms and detected in pooled serum from patients have already been cloned and their structures resolved. Nevertheless, these questions remain: to determine where we are now, how these molecules can be used in the assay systems currently employed in daily routine practice, and whether there are other allergens of clinical relevance in bee or vespid venom.
We present some very preliminary data obtained by using molecular allergens in an automated routine assay system. Sera from individual honeybee venom–allergic patients (n = 100) were collected before initiation of SIT, and sIgE was measured on the IMMULITE® 2000 immunoassay system (Siemens) with a cutoff of 0.1 kU/L. All of the patients met all criteria of honeybee venom allergy, including positive skin test and positive in vitro test using extract. The results are presented in Table 1.
Table 1. Positive patient results for sIgE against insect venom molecular allergens on the IMMULITE 2000 immunoassay system.
It should be noticed that these results confirm data from the literature for the major aller-gens Api m 1 and Api m 2. In addition, it should be noted that we confirmed that melittin (Api m 4) is a minor allergen found positive in less than 50 percent of patients.
The full panel of honeybee and vespid allergens with known sequence and recombinant expres-sion is summarized in Table 2. To provide a full panel of these venom allergens for molecular IgE testing, certain gaps had to be filled first. Of special interest were Api m 3 (acid phos-phatase), whose sequence had only partly been identified before; and Api m 5 (100 kDa allergen), whose sequence was still unknown and for which no recombinant form was avail-able. Ves v 1 (phospholipase A1), which is a dominant vespid allergen, had been cloned previously, but no recombinant expression is yet available.
1.6
40
Allergen Patient results
(pos/total)
Percentage
nApi m 1 Phospholipase A2 96/97 99%
rApi m 2 Hyaluronidase 86/97 89%
rApi m 3 Acid phosphatase 81/99 82%
sApi m 4 Melittin 39/99 39%
HBV extract (i1)
Honeybee extract 99/100 99%
MUXF3 Cross-reactive carbohy-drate determinant (CCD)
67/100 67%

Table 2. Major allergens with known primary sstructure in hymenoptera venom (as of January 2004).
New allergens such as Ves v 3 and Api m 3 are becoming available. The following allergens exhibit some similar characteristics:
• Approximately 38% (15/40) of honeybee venom–sensitized patients were shown reactive against recombinant rApi m 3 (Grunwald et al. J Allergy Clin Immunol. 2006;117:848-54).
• Api m 5 and Ves v 3 are dipeptidyl pepti-dases with an expected molecular weight of 100 kDa. They were recognized in pools of sera from either wasp or honeybee venom–allergic patients. Both the natural and recombinant molecules exhibited enzymatic activity and could be recognized by a mono-clonal chimeric antibody.
What can we do with these allergens?It remains for the clinician to investigate double-positive results (in vitro positivity for sIgE to both honeybee and wasp venom) in order to prescribe the appropriate treat-ment and improve inclusion criteria for immunotherapy. On the basis of sequence information available, it is already possible to get some indications:
• Both hyaluronidases Api m 2 and Ves v 2 are highly homologous and are a major cause of protein cross-reactivity between honeybee and wasp venoms.
• Api m 5 and Ves v 3 are also highly homologous, as described above.
• Api m 1, Api m 3, Ves v 1 and Ves v 5 have different sequences and constitute genuine markers of sensitization to honeybee and wasp venoms, respectively.
By testing these single molecular components, it will be possible to differentiate cosensitiza-tion (presence of sIgE directed towards differ-ent molecules) from cross-reactivity.
Cross-reactive carbohydrate determinant (CCD) immunoreactivity
Bees and vespids but not mammals generate carbohydrate structures with α(1,3)-core-fucosylation. These cross-reactive carbohydrate determinants (CCDs) can induce the production of highly cross-reactive IgE. Anti-CCD IgE has been identified as one of the causes of double-positive sIgE test results in honeybee and vespid venom allergy tests. Nevertheless, the clinical relevance of anti-CCD IgE in venom allergy remains unclear.
We know that it is possible to modify the glycosylation patterns by acting on the expression systems as demonstrated in Figure 1.
1.6
41
Allergen Organism kDa Sequence
known
Recombinant
expression
Cross-
reacts
with
Phospholipase
A2 (Api m 1)
Apis
mellifera
20 + +
Hyaluronidase
(Api m 2)
Apis
mellifera
43 + + Ves v 2
Acid
Phosphatase
(Api m 3)
Apis
mellifera
~49 Peptide
fragments
–
Melittin
(Api m 4)
Apis
mellifera
3 + Synthetic
100 kDa
allergen
(Api m 5)
Apis
mellifera
100 – – Ves v 3
Phospholipase
A1 (Ves v 1)
Vespula
spp.
35 + –
Hyaluronidase
(Ves v 2)
Vespula
spp.
45 + + Api m 2
100 kDa
allergen
(Ves v 3)
Vespula
spp.
100 – – Api m 5
Antigen 5
(Ves v 5)
Vespula
spp.
25 + +
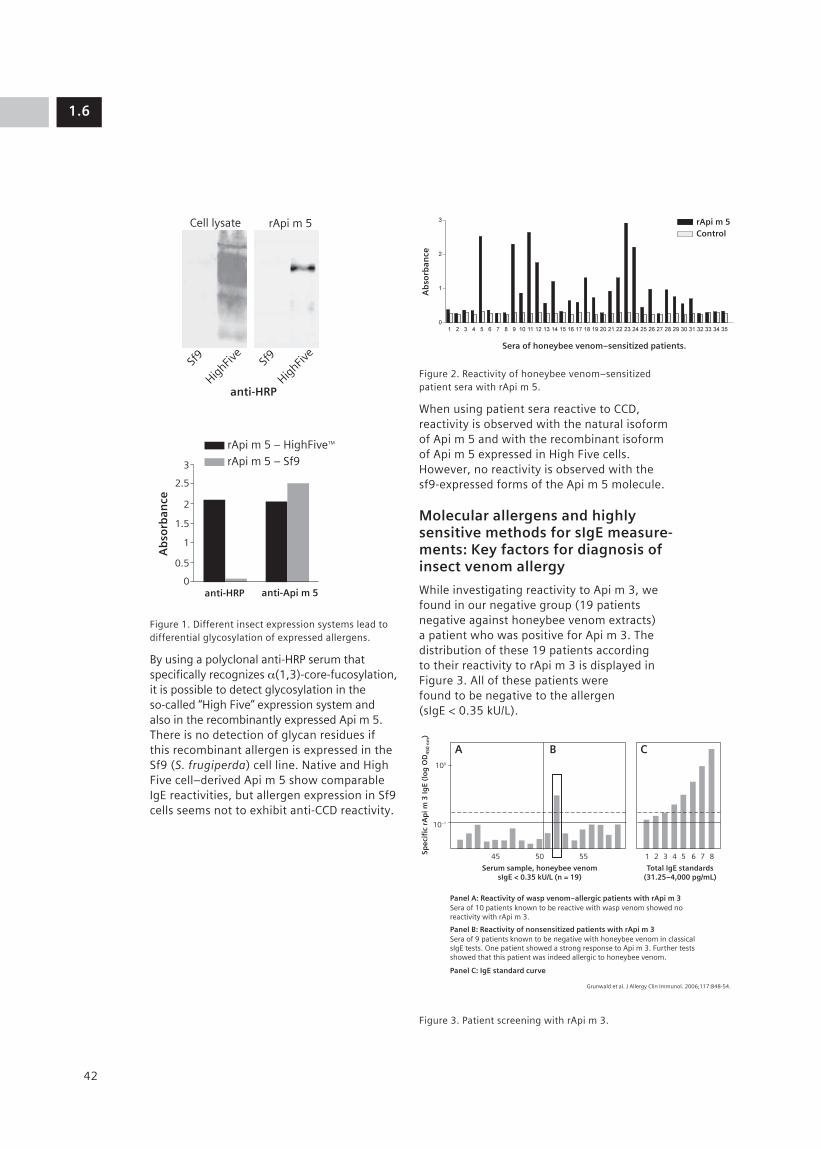
Figure 1. Different insect expression systems lead to differential glycosylation of expressed allergens.
By using a polyclonal anti-HRP serum that specifically recognizes α(1,3)-core-fucosylation, it is possible to detect glycosylation in the so-called “High Five” expression system and also in the recombinantly expressed Api m 5. There is no detection of glycan residues if this recombinant allergen is expressed in the Sf9 (S. frugiperda) cell line. Native and High Five cell–derived Api m 5 show comparable IgE reactivities, but allergen expression in Sf9 cells seems not to exhibit anti-CCD reactivity.
Figure 2. Reactivity of honeybee venom–sensitized patient sera with rApi m 5.
When using patient sera reactive to CCD, reactivity is observed with the natural isoform of Api m 5 and with the recombinant isoform of Api m 5 expressed in High Five cells. However, no reactivity is observed with the sf9-expressed forms of the Api m 5 molecule.
Molecular allergens and highly sensitive methods for sIgE measure-ments: Key factors for diagnosis of insect venom allergy
While investigating reactivity to Api m 3, we found in our negative group (19 patients negative against honeybee venom extracts) a patient who was positive for Api m 3. The distribution of these 19 patients according to their reactivity to rApi m 3 is displayed in Figure 3. All of these patients were found to be negative to the allergen (sIgE < 0.35 kU/L).
Figure 3. Patient screening with rApi m 3.
1.6
42
Cell lysate
Sf9
HighFiv
eSf
9
HighFiv
e
anti-HRP
anti-HRP anti-Api m 5A
bso
rban
ce
rApi m 5 – HighFiveTM
rApi m 5 – Sf9rApi m 5
0
0.5
1
1.5
2
2.5
3
Sera of honeybee venom–sensitized patients.
Ab
sorb
ance
ControlrApi m 5
100
10–1
45
Panel A: Reactivity of wasp venom–allergic patients with rApi m 3Sera of 10 patients known to be reactive with wasp venom showed no reactivity with rApi m 3.
Grunwald et al. J Allergy Clin Immunol. 2006;117:848-54.
Panel B: Reactivity of nonsensitized patients with rApi m 3
Panel C: IgE standard curve
Sera of 9 patients known to be negative with honeybee venom in classical sIgE tests. One patient showed a strong response to Api m 3. Further tests showed that this patient was indeed allergic to honeybee venom.
50
Serum sample, honeybee venomsIgE < 0.35 kU/L (n = 19)
Spec
ific
rA
pi m
3 Ig
E (l
og
OD
45
0 n
m)
Total IgE standards(31.25–4,000 pg/mL)
55 1 2 3 4 5 6 7 8
A B C
Cell lysate
Sf9
HighFiv
eSf
9
HighFiv
e
anti-HRP
anti-HRP anti-Api m 5
Ab
sorb
ance
rApi m 5 – HighFiveTM
rApi m 5 – Sf9rApi m 5
0
0.5
1
1.5
2
2.5
3

By consulting the file of patient 52 who was positive for Api m 3, we found that this patient had a history of severe anaphylactic reaction to honeybee venom but had not undergone immunotherapy. When retested using a more sensitive assay system (IMMULITE 2000), he had sIgE against honeybee venom allergen between 0.1 and 0.35 kU/L.
Systematic investigation of low-level sIgE
To evaluate the proportion of such patients, we looked for the patients of our depart-ment who had been found to be negative by classical serology but who had also been identified as allergic to honeybee or vespid venom. We were able to identify 30 patients who were treated by SIT despite the absence of measurable sIgE, and we found that
• 22 patients were allergic to vespid venom and
• 8 patients were allergic to honeybee venom.
All of these patients had sIgE for honeybee and wasp venoms below 0.35 kU/L (AlaSTAT® or ImmunoCAP®) but had a positive skin test and a positive history of allergy to hymen-optera venom, which motivated the start of immunotherapy.
When retested with a more sensitive method (IMMULITE 2000), 75 to 100 percent of these patients were found to be positive, with a sIgE result above 0.10 kU/L (Table 3).
Table 3. Results for honeybee and vespid allergy.
In addition, the 8 patients with sIgE against honeybee venom below 0.35 kU/L were, surprisingly, also found to be negative against the major honeybee venom allergen, Api m 1 (Figure 4, top), whereas the control group was found to be positive to Api m 1.
For Api m 3, 7 out of the 8 negative patients were also found to be positive (Figure 4, bottom). A similar percentage of the control group was positive.
Figure 4. Reactivity of “sIgE-negative” and “sIgE- positive” honeybee venom–allergic patients with nApi m 1 (top) and rApi m 3 (bottom).
Api m 3, being a “rare” allergen with a low concentration and a low abundance in insect venom, seems to be an indicator for some of the patients that are missed with the routine whole allergen extracts.
Figure 5 summarizes the reactivity against honeybee venom extract and molecular aller-gens for the eight patients that we studied.
1.6
43
Reactivity to the “abundant” allergen nApi m 1
With nApi m 1, 8/8 patients were negative (left)and 10/12 patients were positive (right).
With rApi m 3, 7/8 patients were positive (left)and 10/12 patients were positive (right).
Honeybee venom–allergic patientsLeft panel: sIgE < 0.35 kU/L (n = 8)Right panel: sIgE ≥ 0.35 kU/L (n = 12)
Honeybee venom–allergic patientsLeft panel: sIgE < 0.35 kU/L (n = 8)Right panel: sIgE ≥ 0.35 kU/L (n = 12)
Ap
i m 1
sIg
E (k
U/L
)
Ap
i m 3
sIg
E (L
og
OD
45
0 n
m)
Reactivity to the “rare” allergen rApi m 3
0
1
0.12
4
6
8
10
2 4 6 8 10 12 14 16 18 20 220 2 4 6 8 10 12 14 16 18 20 22
Test Patient results (pos/total)
Percentage
IMMULITE 2000 vespid venom sIgE (i3) > 0.10 kU/L
22/22 100%
IMMULITE 2000 honeybee venom sIgE (i1) > 0.10 kU/L
6/8 75%
IMMULITE 2000 vespid & honeybee venom sIgE (i1 & i3) > 0.10 kU/L
28/30 93%

Figure 5. Systematic approach to diagnostic problems in honeybee venom allergy.
This figure shows that by lowering the cutoff to 0.10 kU/L and testing with the whole extract, it was possible to detect 6 out 8 patients. When using molecular allergens, all patients were negative for Api m 1 but posi-tive for at least one other molecular allergen (Api m 2, Api m 3, or Api m 5).
Similar results were obtained for the 22 patients allergic to vespid venom with sIgE below 0.35 kU/L. Figure 6 summarizes the responses observed.
Figure 6. Systematic approach to diagnostic problems in vespid venom allergy.
As was the case for honeybee venom, this figure shows that by lowering the cutoff to 0.10 kU/L and testing with the whole extract, it was possible to detect the 22 patients that were originally missed. When molecular allergens were used, 5 out of 18 reacted to Ves v 1, 3 out of 18 to Ves v 2, 8 out of 19 to Ves v 3 and 15 out of 19 to Ves v 5. Overall, 16 out of 19 patients reacted to at least one the molecular allergens.
What other applications might be envisioned for these molecular allergens? For example, could molecular allergen testing be an alterna-tive to sting challenge to predict the outcome of immunotherapy and avoid treatment failure?
About 10 years ago, a first attempt along these lines was made using Western blot.
Figure 7. Immunoblots from a patient who underwent immunotherapy for 6 years.
Using 100 µg of the standard maintenance dose induced an IgG4 response, though an insufficient one, and the patient reacted severely even after 6 years of immunotherapy. He then received 200 µg for 1 year, which induced a more complete IgG4 immune response. At that time, the patient tolerated the sting of the living insect. (See Figure 7.)
This initial experiment with Western blots demonstrated the need to follow patients under immunotherapy with better tools like molecular allergens. The data presented in Figure 8 illustrate the cases of one patient (patient 1), who was treated successfully, and of two others (patients 2 and 3), who were treated unsuccessfully, with honeybee venom SIT.
Two patients (patients 1 and 2) were strongly positive for Api m 3, and one (patient 3) had sIgE below the assay detection limit. For patient 1, successfully treated, Api m 3 sIgE decreased during immunotherapy. Patient 2, who was not successfully treated, showed an increase in sIgE against Api m 3 during the course of immunotherapy. Patient 3, the other patient who was treated unsuccess-fully, started without sIgE against Api m 3 but became sensitized to this allergen during immunotherapy.
1.6
44
Classicalcutoff
Sensitivecutoff
Extract
Negative
Positive
Positive: > 0.1 < 0.35
Allergens
Api m 1 Api m 2
Positive sIgE results in control group:Ap1 m 1: 10/12Ap1 m 2: 8/12Ap1 m 3: 10/12Ap1 m 5: 8/12Extract (i1): 12/12
Api m 3 Api m 5
Negative
Positive
Positive: > 0.1 < 0.35
Positive sIgE results in diagnosticfailure group:Ves v 1: 5/18Ves v 2: 3/18Ves v 3: 8/18Ves v 5: 15/18Ves v 1/2/3/5: 16/18Extract (i3, 0.3 5 kU/L): 22/22
Positive sIgE results in control group:Ves v 1: 23/35Ves v 2: 15/34Ves v 3: 22/35 Ves v 5: 31/35Extract (i3, 0.3 5 kU/L): 35/35
No patient serum left
Classicalcutoff
Extract Allergens
Sensitivecutoff
Ves v 1 Ves v 2 Ves v 3 Ves v 5
Before SIT
Sting challenge
100 µg
IgE IgG IgG4 IgE IgG IgG4 IgE IgG IgG4
200 µg

Figure 8. rApi m 3–specific IgE before and after immunotherapy with honeybee venom.
Summary
The panel of available Apis mellifera and Vespula vulgaris venom allergens is rapidly expanding.
Molecular allergens will help to establish component-resolved diagnosis and probably component-resolved therapy. In addition, molecular allergens will provide advantages in diagnostic efficiency, thereby improving patient care. Finally, molecular allergens will help to establish longitudinal monitoring of sIgE/sIgG4 in patients during and after SIT.
1.6
45
2.0
Patient 1
• Successful 3-year immunotherapy with honeybee venom extract
• Protected in sting challenge test (no systemic reaction)
Patient 2
Patient 3
• Unsuccessful 3-year immunotherapy with honeybee venom extract
• Not protected in sting challenge test (systemic anaphylactic reaction)
1.5
1.0
0.5
0.0
Seru
m r
Ap
i m 3
sIg
E (l
og
OD
45
0 n
m)
After SITBefore SIT

Prof. Erika Jensen-Jarolim, M.D.
46

1.7
Allergy from an allergo- oncological point of view
The allergic reaction involves release of mediators from mast cells, basophils or eosinophils. These mediators are responsible for the symptoms observed, such as rhino-conjunctivitis, asthma, food allergy, urticaria, or anaphylaxis.
Some “innocent” allergens can produce very severe reactions, and still we do not know why. Therefore, two fundamental questions in allergology remain unanswered:
• What makes a protein an allergen?
• What is the physiological role of IgE?
What makes a protein an allergen
According to most textbooks, allergens should be multivalent to cross-link two different spec-ificities of IgE molecules and lead to mediator release. The literature shows, however, that some allergens such as shrimp tropomyosin, Hev b 5, and Bla g 1 have a repetitive epitope display and therefore do not need many sIgE specificities to induce mediator release.1–3
The literature also increasingly shows that allergens are found as dimers, oligomers or even as multimers (Table 1). In the case of milk allergen, for example, it is thought that the pasteurization process influences the epitope display, contributes to the formation of multimers, and finally enhances the cross-linking capabilities of the allergen. This may be a common characteristic of allergens and what makes these molecules allergenic.
Allergo-oncology: Introduction of a Novel Concept
Prof. Erika Jensen-Jarolim, M.D., Department of Pathophysiology, Medical University, Vienna, Austria
47
Table 1. Allergen dimers, oligomers or multimers.
Allergen Reference Year
ABA 1 (Ascaris)
McGibbon et al. Mol Biochem Parasitol. 39:163.
1990
Tropomyosin Gimona et al. PNAS. 92:9776. 1995
Phl p 1 Petersen et al. Progr Allergy Clin Imm. 4:139.
1997
Ara h 1 Shin et al. JBC. 273:13753. 1998
Tropomyosin Reese et al. IAAI. 119:247. 1999
Equ c 1 Gregoire et al. Acta Cryst D Biol Cryst. 55:880.
1999
Equ c 1 Lascombe et al. JBC. 275:21572. 2000
ABA-1 Xia et al. Parasitology. 120:211. 2000
Ara h 1 Maleki et al. JI. 164:5844. 2000
Ves v 5 Suck et al. IAAI. 121:284. 2000
Profilin Wopfner et al. Biol Chem. 383:1779-89.
2002
Parvalbumin Das Dores et al. Allergy. 57 Suppl 72:79.
2002
Ara h 2 Sen et al. JI. 169:882. 2002
Phl p 5b Rajashankar et al. Acta Cryst D Biol Cryst. 58:1175.
2002
Phl p 7 Verdino et al. EMBO J. 21:5007. 2002
Fel d 1 Grönlund et al. J. Biol Chem. 278(41):40144.
2003
Bet v 1 Schöll et al. J. Immunol. Dec 15;175(10):6645.
2005
Der p 1 de Halleux et al. JACI. 118(4):971.
2006
Can f 1 and Can f 2
Kamate Y et al, IAAI. 142(4):301-8.
2007
Dau c 1 Reese et al, JACI. 119(4):944. 2007
Milk ALA, BLG Roth-Walter et al, Allergy. In press.
2008

The possible role of IgE
We know that IgE is elevated in parasitic diseases and may participate in host defense mechanisms. In addition, parasitic diseases exhibit many similarities to allergic reactions: Th2 response, cross-linking mechanisms, and involvement of the same effector cells (eosin-ophils, etc.). On the other hand, elevated IgE in worm-infected patients can also be associ-ated with the presence of asthma. Therefore, the physiological function of IgE remains an open question.
There is some evidence in the literature suggesting that IgE may have a role in the recognition of tumor antigens.4
• In the US, clinicians have observed an inverse relationship between allergy and the occurrence of malignant diseases: the investigation of more than 1 million patients showed a statistically significant inverse association between asthma / hay fever and cancer mortality.5
• If IgE has a role in the protection against tumors, then IgE down-regulation should have adverse consequences. Therefore, it is important to note that the first clinical studies in patients treated with anti-IgE therapy by Xolair indicated a trend towards more malignancy in Xolair-treated patients than in controls. “Xolair patients had a 0.5% malig-nancy rate compared to 0.2% in control patients.”6 While not statistically significant, there was a trend towards more malignancy in Xolair-treated patients. As a consequence, Xolair should not be prescribed in patients with preexisting malignancies.
There are also some experimental studies suggesting that IgE may have very potent effects against tumor antigens.
• IgE is more effective for in vitro cytotoxocity than IgG.7–9 A SCID mouse model received recombinant antitumor antibodies against an ovarian cancer antigen. Mice treated with IgE had a longer survival time than those treated with the corresponding IgG variant (Figure 1). IgE has a very high cytotoxic potency against cancer cells, because it uses exclusive effector cells.
Figure 1. Gould and colleagues showed that the growth of IGROV1 cells (overexpressing folate-binding protein, FBP) was affected by passive application of IgG or IgE antibodies specific for FBP, using PBMC as effector cells in a SCID mouse model. The upper graph (a) compares the effects of MOv18-IgE and MOv18-IgG1 on tumor growth (y-axis), evaluated on days 19, 29, and 35 after IGROV1 challenge. In the lower graph (b), the effects of specific MOv18-IgE or control IgE SF-25 with PBMC were investigated and compared to the effects with PBMC alone. Again, the SCID model was used and tumor growth evaluated on days 36 and 48 after IGROV1 challenge. Both experiments illustrate the pronounced effect of the anti-FBP antibody of the IgE isotype. (Reproduced from Gould et al.7 with per-mission of Wiley-VCH Verlag GmbH & Co. KGaA.)
• Natural IgE has also been detected in human tumors.10 IgE is the only antibody class which was found to be abundant in human tumor cells from head and neck cancers (Figure 2). IgE binds to cells in the tumor tissue which have a critical role, such as macrophages and dendritic cells.
1.7
48
250
200
150
100
Tum
or
size
(m
m2)
Tum
or
size
(m
m2)
Group
a.
b.
50
Day 19
Day 29
Day 35
Day 36
Day 48
0
200
150
100
50
0
IGROVIAlone
IGROVIAlone
PBMCAlone
PBMC +100 µgMOv18-IgG
PBMC +50 µgMOv18-IgE
PBMC +100 µgMOv18-IgE
PBMC +100 µgMOv18-IgEDay 0
PBMC +50 µgMOv18-IgEDays 0, 4, 8
PBMC +100 µgMOv18-IgEDay 0
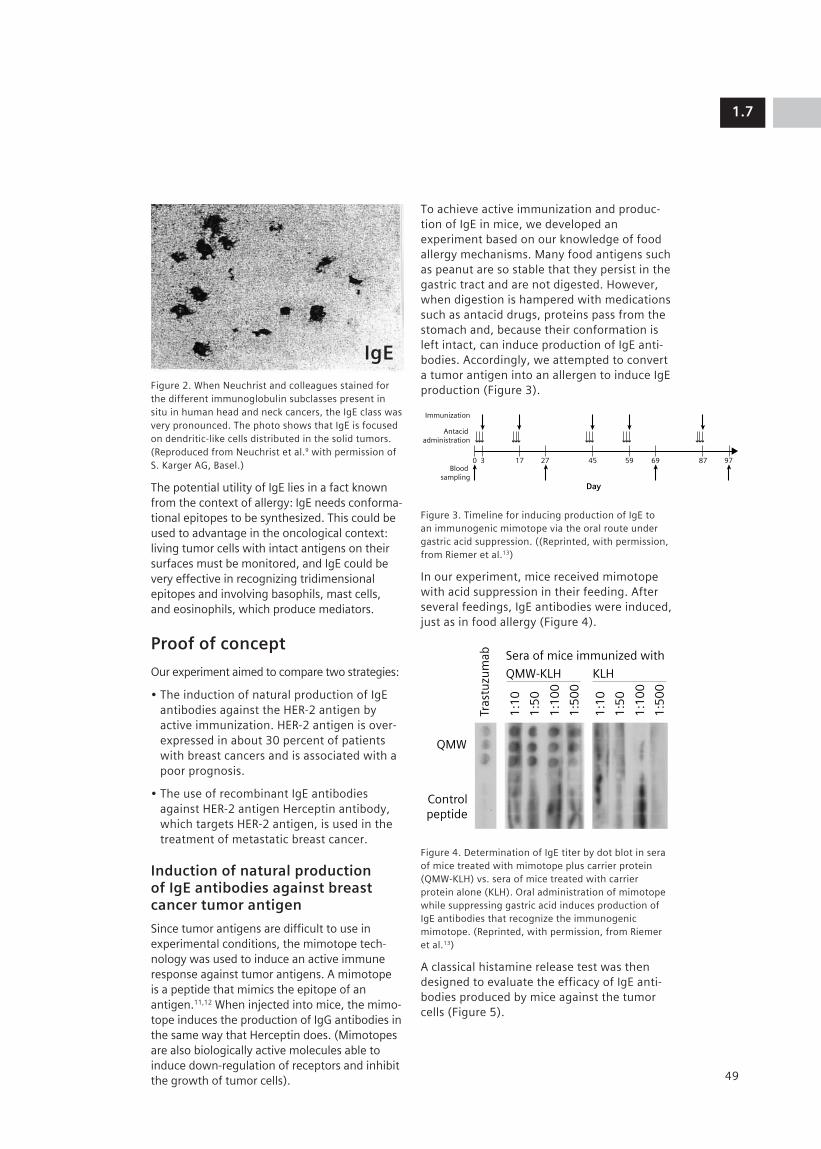
Figure 2. When Neuchrist and colleagues stained for the different immunoglobulin subclasses present in situ in human head and neck cancers, the IgE class was very pronounced. The photo shows that IgE is focused on dendritic-like cells distributed in the solid tumors. (Reproduced from Neuchrist et al.9 with permission of S. Karger AG, Basel.)
The potential utility of IgE lies in a fact known from the context of allergy: IgE needs conforma-tional epitopes to be synthesized. This could be used to advantage in the oncological context: living tumor cells with intact antigens on their surfaces must be monitored, and IgE could be very effective in recognizing tridimensional epitopes and involving basophils, mast cells, and eosinophils, which produce mediators.
Proof of concept
Our experiment aimed to compare two strategies:
• The induction of natural production of IgE antibodies against the HER-2 antigen by active immunization. HER-2 antigen is over-expressed in about 30 percent of patients with breast cancers and is associated with a poor prognosis.
• The use of recombinant IgE antibodies against HER-2 antigen Herceptin antibody, which targets HER-2 antigen, is used in the treatment of metastatic breast cancer.
Induction of natural production of IgE antibodies against breast cancer tumor antigen
Since tumor antigens are difficult to use in experimental conditions, the mimotope tech-nology was used to induce an active immune response against tumor antigens. A mimotope is a peptide that mimics the epitope of an antigen.11,12 When injected into mice, the mimo-tope induces the production of IgG antibodies in the same way that Herceptin does. (Mimotopes are also biologically active molecules able to induce down-regulation of receptors and inhibit the growth of tumor cells).
To achieve active immunization and produc-tion of IgE in mice, we developed an experiment based on our knowledge of food allergy mechanisms. Many food antigens such as peanut are so stable that they persist in the gastric tract and are not digested. However, when digestion is hampered with medications such as antacid drugs, proteins pass from the stomach and, because their conformation is left intact, can induce production of IgE anti-bodies. Accordingly, we attempted to convert a tumor antigen into an allergen to induce IgE production (Figure 3).
Figure 3. Timeline for inducing production of IgE to an immunogenic mimotope via the oral route under gastric acid suppression. ((Reprinted, with permission, from Riemer et al.13)
In our experiment, mice received mimotope with acid suppression in their feeding. After several feedings, IgE antibodies were induced, just as in food allergy (Figure 4).
Figure 4. Determination of IgE titer by dot blot in sera of mice treated with mimotope plus carrier protein (QMW-KLH) vs. sera of mice treated with carrier protein alone (KLH). Oral administration of mimotope while suppressing gastric acid induces production of IgE antibodies that recognize the immunogenic mimotope. (Reprinted, with permission, from Riemer et al.13)
A classical histamine release test was then designed to evaluate the efficacy of IgE anti-bodies produced by mice against the tumor cells (Figure 5).
1.7
49
Blood sampling
0 3 17 27 45 59 69 87 97
Day
Antacid administration
Immunization
QMW
Tras
tuzu
mab
1:1
0
1:5
0
1:1
00
1:5
00
1:1
0
1:5
0
1:1
00
1:5
00
Sera of mice immunized with
QMW-KLH KLH
Controlpeptide
IgE

IgE produced by the mice was used to sensi-tize mast cells. Mast cells were then incubated with tumor cells overexpressing the HER-2 antigen. Only tumor cells that overexpressed HER-2 could cross-link IgE like an allergen and induce mediator release that could be specifi-cally measured.
This experiment demonstrated that it is possible to induce the production of IgE antibodies against HER-2 antigen by active immunization of mice with a mimotope.
Passive immunotherapy with recombinant IgE antibodies against HER-2 antigen
It is important to note that tumor cells can be killed by
• Cytotoxicity, as observed when IgE binds to its high-affinity receptor FceRI, which is expressed in basophils and eosinophils; and
• Phagocytosis, as observed when IgE binds to its low-affinity receptor CD23, expressed in macrophages.
A recombinant IgE antibody against HER-2 was produced in collaboration with the group of A. Gould. When the tumor cells were incu-bated in the presence of this Herceptin-like recombinant IgE antibody, macrophages killed them by phagocytosis.14,15
These results are significant because they demonstrate that in addition to recombinant IgE antibodies against tumor antigens, which are already available, it is now possible to use the cascade of events which cause adverse reactions and symptoms in allergic patients to fight against tumor cells.
Allergens are usually small molecules (20 to 100 kDa), whereas tumor antigens are larger molecules (200 kDa). However, since both allergens and tumor antigens can induce the same type of IgE-mediated immune response, they probably possess similarities. A hypoth-esis is that tumor antigens are present in such a large density on the surface of tumor cells that they can be recognized by IgE, like aller-gens presenting repetitive epitopes.
1.7
50
Living tumor cell
Dead tumor cell
Target cells
% h
exo
sam
inid
ase
rele
ase
% R
BL-
med
iate
d S
K-B
R-3
cel
l lys
is
Mediator release Cytotoxicity
SK-BR-3
0 0
20
40
60
80
100
10
20
30
40
p = 0.0004p = 0.00015
p = 0.024
A-431 QMW-KLH
QMW-KLH
KLH
KLH
nIgE
IgEMediators
Mast cell
IgE
rIgE
Figure 5. In a β-hexosaminidase release assay, IgE from mice treated with mimotope plus carrier carrier (QMW-KLH) elicited significant degranulation after incubation with HER-2–overexpressing breast cancer cells (SK-BR-3), but not with HER-2–negative control cells (A-431). Mice treated with carrier protein alone (KLH) demonstrated no reactivity with either cell line. Box plots show the median and the 25th and 75th percentiles of β-hexosaminidase release for sera of individual mice in each group (n = 7). (Box plots reprinted, with permission, from Riemer et al.13)

Conclusion
In conclusion, allergo-oncology is a very new discipline, created in 2006. It aims to reveal the function of IgE-mediated and other Th2 immune responses against tumor cells, in order to enhance the understanding of their biology and to define novel treatment options against malignant diseases, such as vaccina-tion or production of recombinant antibodies for passive immunotherapy.
References
1. Ayuso R, Lehrer SB, Reese G. Identifica-tion of continuous, allergenic regions of the major shrimp allergen Pen a 1 (tropomyosin). Int Arch Allergy Immunol. 2002;127:27-37.
2. Beezhold DH, Hickey VL, Sutherland MF, O’Hehir RE. The latex allergen hev B 5 is an antigen with repetitive murine B-cell epitopes. Int Arch Allergy Immunol. 2004;134:334-40.
3. Pomes A, Vailes LD, Helm RM, Chapman MD. IgE reactivity of tandem repeats derived from cockroach allergen, Bla g 1. Eur J Biochem. 2002;269:3086-92.
4. Jensen-Jarolim E, Achatz G, Turner MC, Karagiannis S, Legrand F, Capron M, Penichet ML, Rodriguez JA, Siccardi AG, Vangelista L, Riemer AB, Gould H. Aller-goOncology: the role of IgE-mediated allergy in cancer. Allergy. 2008;63:1255-66.
5. Turner MC, Chen Y, Krewski D, Ghadirian P, Thun MJ, Calle EE. Cancer mortality among US men and women with asthma and hay fever. Am J Epidemiol. 2005;162:212-21.
6. Biological License Application (BLA) for Omalizumab, submitted by Genentech, Inc to FDA, Center for Biologics Evaluation and Research, April 18, 2003. Available at http://www.fda.gov/ohrms/dockets/AC/03/briefing/3952B1_02_FDA-Xolair-Safety.pdf (accessed May 2009).
7. Kershaw MH, Darcy PK, Trapani JA, MacGregor D, Smyth MJ. Tumor-specific IgE-mediated inhibition of human colorectal carcinoma xenograft growth. Oncol Res. 1998;10:133-42.
8. Gould HJ, Mackay GA, Karagiannis SN, O’Toole CM, Marsh PJ, Daniel BE, Coney LR, Zurawski VR Jr, Joseph M, Capron M, Gilbert M, Murphy GF, Korngold R. Compar-ison of IgE and IgG antibody-dependent cytotoxicity in vitro and in a SCID mouse xenograft model of ovarian carcinoma. Eur J Immunol. 1999;29:3527-37.
9. Reali E, Greiner JW, Corti A, Gould HJ, Bottazzoli F, Paganelli G, Schlom J, Siccardi AG. IgEs targeted on tumor cells: therapeutic activity and potential in the design of tumor vaccines. Cancer Res. 2001;61:5517-22.
10. Neuchrist C, Kornfehl J, Grasl M, Lassmann H, Kraft D, Ehrenberger K, Scheiner O. Distri-bution of immunoglobulins in squamous cell carcinoma of the head and neck. Int Arch Allergy Immunol. 1994;104:97-100.
11. Riemer AB, Klinger M, Wagner S, Bern-haus A, Mazzucchelli L, Pehamberger H, Scheiner O, Zielinski CC, Jensen-Jarolim E. Generation of peptide mimics of the epitope recognized by trastuzumab on the oncogenic protein Her-2/neu. J Immunol. 2004;173:394-401.
12. Riemer AB, Kurz H, Klinger M, Scheiner O, Zielinski CC, Jensen-Jarolim E. Vaccination with cetuximab mimotopes and biological properties of induced anti-epidermal growth factor receptor antibodies. J Natl Cancer Inst. 2005;97:1663-70.
13. Riemer AB, Untersmayr E, Knittelfelder R, Duschl A, Pehamberger H, Zielinski CC, Scheiner O, Jensen-Jarolim E. Active induction of tumor-specific IgE antibodies by oral mimotope vaccination. Cancer Res. 2007;67:3406-11.
14. Karagiannis SN, Bracher MG, Beavil RL, Beavil AJ, Hunt J, McCloskey N, Thompson RG, East N, Burke F, Sutton BJ, Dombrowicz D, Balkwill FR, Gould HJ. Role of IgE recep-tors in IgE antibody-dependent cytotoxicity and phagocytosis of ovarian tumor cells by human monocytic cells. Cancer Immunol Immunother. 2008;57:247-63.
15. Bracher M, Gould HJ, Sutton BJ, Dombro-wicz D, Karagiannis SN. Three-colour flow cytometric method to measure antibody-dependent tumour cell killing by cytotoxicity and phagocytosis. J Immunol Methods. 2007;323:160-71.
1.7
51

Debra Hovanec-Burns, Ph.D.
52

1.8
The impact of molecular biology on the under-standing of allergen structure and function has been highly significant. During the past decade, most clinically important allergens have been sequenced and their biochemical activities determined. Today, the DNA infor-mation has been identified for more than 400 allergens and is readily available on several different databanks, such as
• International Union of Immunological Soci-eties (IUIS), which maintains and updates a list of molecularly characterized allergens
• Allergome.org (See the summary of Dr. Mari’s presentation in this volume.)
Siemens Healthcare Diagnostics has intro-duced or will soon introduce on its IMMULITE® 2000 and IMMULITE® 2500 platforms a panel of molecular allergens for the 3gAllergyTM assay (Table 1). The results of the preliminary evaluations of these new diagnostic tools will be presented here.
Table 1. Molecular allergens available or in develop-ment for the 3gAllergy assay from Siemens.
Siemens Healthcare Diagnostics’ New Developments in Allergy
Debra Hovanec-Burns, Ph.D., Vice President and Head of Allergy Diagnostics, Siemens Healthcare Diagnostics, Los Angeles, CA, US
53
New tools for specific IgE detection and allergy diagnosis
MUXF as an immunodiagnostic tool for CCD detection
There has recently been heightened interest in IgE cross-reactivity to carbohydrates. Allergen cross-reactivity is the result of high-affinity IgE antibodies recognizing similar epitopes from another source or homologous structures from various sources.
Cross-reactive carbohydrate determinants (CCDs) have been reported to be responsible for false-positive specific IgE results in immu-noassays. This phenomenon is particularly prevalent with food allergens of plant origin.
The characterization and investigation of MUXF as an immunodiagnostic tool for CCD detection is discussed below.
Source, purification, and synthesis of MUXF
MUXF is typically a plant N-glycan derived from enzymatic (pronase) digestion of brome-lain from pineapple stem and then purified.
Purification and synthesis of the Siemens MUXF Allergen consists of these steps:
• Chromatographic purification of the glyco-peptide containing the MUXF structure
• Synthesis of MUXF derivative: covalent coupling of biotinylated HSA with the glyco-peptide containing the MUXF structure
• Chemical analysis: mass spectrometric and sugar analysis
The 212-amino-acid sequence of bromelain protein is reduced to four glycopeptides after pronase digestion. Mass spectrometry has shown that the same four glycopeptides are found on each duplication of the purification process , indicating the reproducibility of the purification technique. An example is given with biotin–HSA–MUXF glycopeptide (Figure 1).
Food allergens Animal allergens
rPru av 4 (Profilin) nFel d 1
rMal d 1 (PR-10) nCan f 1
rPru av 1 (PR10)
nPru p 3 (LTP)
Pollen allergens Mite allergens
nOle e 1 nDer p 1
nArt v 1 nDer p 2
nBet v 1 (PR-10) nDer f 1
nDer f 2
Tropomyosin Mold allergen
nPen m 1 nAsp r 1
Cross-reactive carbohy-drate determinant (CCD)
MUXF

Figure 1. Biotin–HSA–MUXF glycopeptide.
In a multisera evaluation, 24 samples with suspected CCD reactivity were tested with MUXF and bromelain allergen. Bromelain allergen was selected for comparison purposes because it is the allergen most commonly reported in the literature for detection of suspected CCD reactivity. The mean patient values obtained for bromelain and MUXF were 4.56 and 4.01 kU/L, respectively (Figure 2).
Figure 2. Multisera evaluation for bromelain and MUXF.
In a second step, clinically identified CCD-reactive samples were tested for reactivity to bromelain and MUXF. The results obtained for both allergens again confirmed similar reactivity: a mean dose value of 10 and 12.03 kU/L, respectively (Figure 3).
Figure 3. Bromelain and MUXF with clinically identified CCD-reactive samples.
Finally, it has been reported that hymenoptera venoms, grass (rye grass), tree (olive), and weed pollens (English plantain) share IgE epit-opes accounted for by CCDs. To test the utility of the MUXF glycopeptide for detection of the IgE reactivity to these epitopes, samples were tested with honeybee venom (I1), rye grass (G5), olive (T9), English plantain (W9), bromelain (K202), and MUXF (O214) allergens. The results showed a correlation between the data obtained with MUXF and the known CCD-containing allergens (Figure 4).
1.8
54
OH
HOHO
OH
OH
OH
OH
OH
HO
HO
HO
H
HO
HO
O
O
OO
O
O
OO
O
O
OO
O
O
O
O
O
O
O
O
C
C
C
OH
NH NH
NH
NH
NH
NH
HN NH
HN
NH2
H
N
H3C
CH3
CH3
CH2
CH2
C CH
CH2
CH-
CH-
CH2COOH
OH
S
HSA
Asn-Glu-Ser
BiotinMUXF
20
15
10
5
0.1
ND: <0.1
Bromelain
(K202)
sIg
E c
on
ce
ntr
atio
n (
kU
/L)
MUXF
(O214)
N = 24
Means: Bromelain: 4.56 kU/L
MUXF: 4.01 kU/L
100
80
60
20
40
0.1
ND
Bromelain
(K202)
sIg
E c
on
ce
ntr
atio
n (
kU
/L)
MUXF
(O214)
N = 8
Means: Bromelain: 10.0 kU/L
MUXF: 12.03 kU/L
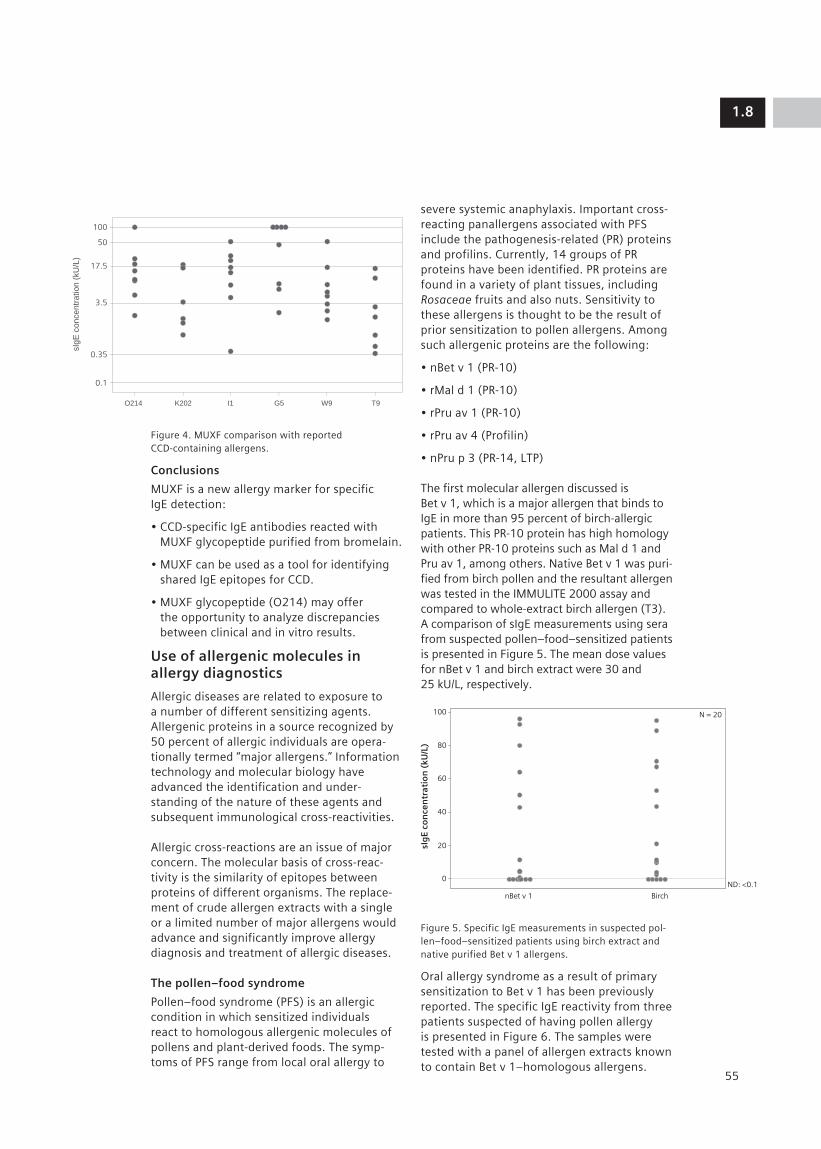
Figure 4. MUXF comparison with reported CCD-containing allergens.
Conclusions
MUXF is a new allergy marker for specific IgE detection:
• CCD-specific IgE antibodies reacted with MUXF glycopeptide purified from bromelain.
• MUXF can be used as a tool for identifying shared IgE epitopes for CCD.
• MUXF glycopeptide (O214) may offer the opportunity to analyze discrepancies between clinical and in vitro results.
Use of allergenic molecules in allergy diagnostics
Allergic diseases are related to exposure to a number of different sensitizing agents. Allergenic proteins in a source recognized by 50 percent of allergic individuals are opera-tionally termed “major allergens.” Information technology and molecular biology have advanced the identification and under-standing of the nature of these agents and subsequent immunological cross-reactivities.
Allergic cross-reactions are an issue of major concern. The molecular basis of cross-reac-tivity is the similarity of epitopes between proteins of different organisms. The replace-ment of crude allergen extracts with a single or a limited number of major allergens would advance and significantly improve allergy diagnosis and treatment of allergic diseases.
The pollen–food syndrome
Pollen–food syndrome (PFS) is an allergic condition in which sensitized individuals react to homologous allergenic molecules of pollens and plant-derived foods. The symp-toms of PFS range from local oral allergy to
severe systemic anaphylaxis. Important cross-reacting panallergens associated with PFS include the pathogenesis-related (PR) proteins and profilins. Currently, 14 groups of PR proteins have been identified. PR proteins are found in a variety of plant tissues, including Rosaceae fruits and also nuts. Sensitivity to these allergens is thought to be the result of prior sensitization to pollen allergens. Among such allergenic proteins are the following:
• nBet v 1 (PR-10)
• rMal d 1 (PR-10)
• rPru av 1 (PR-10)
• rPru av 4 (Profilin)
• nPru p 3 (PR-14, LTP)
The first molecular allergen discussed is Bet v 1, which is a major allergen that binds to IgE in more than 95 percent of birch-allergic patients. This PR-10 protein has high homology with other PR-10 proteins such as Mal d 1 and Pru av 1, among others. Native Bet v 1 was puri-fied from birch pollen and the resultant allergen was tested in the IMMULITE 2000 assay and compared to whole-extract birch allergen (T3). A comparison of sIgE measurements using sera from suspected pollen–food–sensitized patients is presented in Figure 5. The mean dose values for nBet v 1 and birch extract were 30 and 25 kU/L, respectively.
Figure 5. Specific IgE measurements in suspected pol-len–food–sensitized patients using birch extract and native purified Bet v 1 allergens.
Oral allergy syndrome as a result of primary sensitization to Bet v 1 has been previously reported. The specific IgE reactivity from three patients suspected of having pollen allergy is presented in Figure 6. The samples were tested with a panel of allergen extracts known to contain Bet v 1–homologous allergens.
1.8
55
O214
sIg
E c
on
ce
ntr
atio
n (
kU
/L)
K202 I1 G5 T9W9
100
50
17.5
3.5
0.35
0.1
100
80
60
40
20
0ND: <0.1
N = 20
nBet v 1
sIg
E co
nce
ntr
atio
n (
kU/L
)
Birch

The reactivities determined were compared to those of nBet v 1 (solid dots). The allergen extracts used in this study (open dots) and the Bet v 1–like homolo-gous molecular allergen present in the extracts are listed below the figure.
Figure 6. sIgE reactivity from three patients suspected of having pollen allergy.
Data from an evaluation where a panel of 20 patients with suspected PFS were tested with the PR-10 molecular allergens rMal d 1 and rPru av 1 and the corresponding apple and cherry extracts are presented in Figure 7. Similar patterns of reactivity were detected.
Figure 7. Pollen–food syndrome: PR-10 proteins
rMal d 1 and rPru av 1.
Pru p 3 is a lipid-transfer protein (LTP) that belongs to the PR-14 category. LTPs are found in many fruits and nuts, and cross-reactivity among LTPs is relatively high. Some patients sensitized to LTPs develop systemic symptoms of potential severity, while others may just develop local allergy syndrome. Native Pru p 3 was isolated and purified from peach, a Rosaceae fruit. Pru p 3 and peach extracts have been shown to induce very similar IgE reactivities. Figure 8 presents the results of a study that compared nPru p 3 and a panel of other LTP-containing allergenic molecules in patients suspected of pollen–food allergy.
Figure 8. Pollen–food syndrome: the PR-14 protein nPru p 3.
Profilin is an actin-binding protein that was first identified in birch pollen (Bet v 2) and is now recognized as an allergenic protein in a number of fruits and vegetables. Profilin is a panallergen that is responsible for allergic syndromes in birch-allergic patients.
A summary of IgE reactivity of 20 PFS-suspected patients tested in the IMMULITE 2000 assay with a recombinant profilin allergen and extracts of the Rosaceae fruits peach, apricot, and cherry (Figure 9).
1.8
56
100
80
60
40
20
0ND: <0.1
>100
Patient 2 Patient 3Patient 1
Allergens containing Bet v 1 homologuesnBet v 1
sIg
E co
nce
ntr
atio
n (
kU/L
)
50
100
17.5
3.5
0.35
0.1
ND: <0.1
Apple
sIg
E co
nce
ntr
atio
n (
kU/L
)
rMal d 1 Cherry rPru av 1
50
100
nPru p 3 Allergens containing LTP (18)
17.5
3.5
0.35
0.1
Patient 1
sIg
E co
nce
ntr
atio
n (
kU/L
)
Patient 2 Patient 3
Extract Molecule Extract Molecule
Peanut Ara h 8 Peach Pru p 1
Soybean Gly m 4 Apricot Pru ar 1
Hazelnut Cor a 1 Cherry Pru av 1
Carrot Dau c 1 Raspberry Rub I 1
Strawberry Fra a 1 Birch Bet v 1
Apple Mal d 1 Hazelnut Cor a 1
Celery Api g 1 Oak Que a 1
Pear Pyr c 1 Extract Molecule Extract Molecule
Mugwort Art v 3 Parietaria officinalis Par o 1
Asparagus Asp o 1 Apricot Pru ar 3
Chestnut Cas s 8 Cherry Pru av 3
Lemon Cit l 3 Plum Pru d 3
Hazelnut Cor a 8 Peach Pru p 3
Lettuce Lac s 1 Pear Pyr c 3
Tomato Lyc e 3 Grape Vit v 1
Apple Mal d 3 Maize, Corn Zea m 14
Parietaria Par j 1 Broccoli Bra o 3 judaica

Figure 9. Comparison of rPru av 4 (profilin)– containing Rosaceae fruit allergens.
Sera from three patients suspected of being allergic to profilin were tested with rPru av 4 and 27 different allergens known to contain profilin (Figure 10).
Figure 10. Comparison of profilin-containing allergens.
Pollenosis
Ole e 1 is the major allergen of olive and reacts with 80 percent of patients sensitized to olive pollen. Ole e 1, belonging to a large family of homologous proteins, cross-reacts with other major allergens of plants belonging to the Oleaceae family (ash, lilac, privet) and Elaeagnaceae (Russian olive) family Ole e1 is thus a good marker for identifying pollen sensitization.
Data obtained by testing allergen extracts known to contain proteins of the Ole e 1–like family of proteins with sera from patients suspected of being allergic to olive pollen are presented in Figure 11.
Figure 11. Comparison of allergen extracts known to contain Ole e 1–like proteins vs. nOle e 1.
Another set of sample data from patients identified as Ole e 1 positive is presented in Figure 12. The data obtained for olive allergen and for nOle e 1 in the IMMULITE 2000 system are shown on the left. Data for the same samples tested with Ole e 1 using another methodology are shown on the right.
1.8
57
100
50
17.5
3.5
0.35
0.1
ND: <0.1
Peach
sIgE
con
cen
trat
ion
(kU
/L)
Apricot Cherry rPru av 4
50
100
17.5
3.5
0.35
0.1
ND: <0.1
Patient 1
Allergens containing Ole e 1 homologues
sIg
E co
nce
ntr
atio
n (
kU/L
)
Patient 2 Patient 3
Ole e 1
100
50
17.5
3.5
0.35
0.1
Patient 1
>100
rPru av 4
Patient 2 Patient 3
Allergens containing profilin (27)
sIg
E co
nce
ntr
atio
n (k
U/L
)
Perennial rye grass Lol p 11
Timothy grass Phl p 11
English plantain Pla l 1
Lamb’s quarters Che a 1
White ash Fra a 1
Arizona ash Fra v 1
Privet Lig v 1 Extract Profilin Extract Profilin Extract Profilin molecule molecule molecule Peanut Ara h 5 Soybean Gly m 3 Hazelnut Cor a 2 Pineapple Ana c 1 Orange Cit s 2 Apple Mal d 4 Melon Cuc m 2 Banana Mus xp 1 Pear Pyr c 4 Peach Pru p 4 Date plum Pho d 2 Olive Ole e 2 Tomato Lyc e 1 Green pepper Cap a 2 Carrot Dau c 4 Celery Api g 4 Rice Ory s 12 Barley Hor v 12 Wheat Tri a profilin Bermuda grass Cyn d 12 Timothy grass Phl p 12 Sunflower Hel a 2 Birch Bet v 2 Ragweed Amb a 8 LambÕ s Che a 2 Parietaria Par j 3 Mugwort Art v 1/ quarters judaica Art v 4

Figure 12. Pollenosis: nOle e 1.
Mugwort (Artemesia vulgaris) pollen is considered in many parts of the world to be the most important cause of pollenosis. The prevalence of pollen sensitization is very high. Art v 1 is the major allergen in mugwort pol-len; more than 80 percent of patients with mugwort allergy react to this protein. The reactivity of IgE antibodies to nArt v 1 and mugwort pollen was confirmed by testing clinically identified positive sera with nArt v 1 and mugwort allergen (W6). The samples were also tested with an independent meth-odology for Art v 1 reactivity (Figure 13).
Figure 13. Pollenosis: nArt v 1.
To help elucidate the variable degrees of cosensitization to allergens and corecog-nition by sIgE, purified molecular allergen nArt v 1 was tested to detect weed allergy. In the IMMULITE 2000 study shown in Figure 14, three sera from patients suspected of having mugwort allergy were tested with nArt v 1 (solid dots) and with ragweed, Bermuda grass, timothy grass, and birch allergen extracts (open dots). As the data show, variable degrees of reactivity were observed in these patients.
Figure 14. Variable degrees of reactivity to nArt v 1.
Animal allergies
Two animal-derived major allergenic mole-cules—nCan f 1, which is a dog lipocalin, and nFel d 1, which is a cat uteroglobin—are under investigation in the 3gAllergy assay. The synthesized allergens were titered into the assay and patient IgE reactivity was evalu-ated. The data from these studies are shown in Figure 15.
Figure 15. Molecular allergens: nCan f 1 (above) and nFel d 1 (below).
1.8
58
100>100
N = 15
50
17.5
3.5
0.35
ND: <0.10.1
nArt v 1
sIg
E co
nce
ntr
atio
n (
kU/L
)
Mugwort3gAllergy Independent method
Art v 1
N = 30
50
100
17.5
3.5
0.35
0.1
nOle e 1
3gAllergy Independent method
sIg
E co
nce
ntr
atio
n (
kU/L
)
Olive Ole e 1
60
sIg
E c
on
ce
ntr
atio
n (
kU
/L)
40
50
30
20
10
0.1
Dog dander nCan f 1
ND: <0.1
100
sIg
E c
on
ce
ntr
atio
n (
kU
/L)
60
80
40
20
0.1
Cat dander nFel d 1
ND: <0.1
100
50
17.5
3.5
0.35
0.1
Patient 1
sIg
E co
nce
ntr
atio
n (
kU/L
)
Patient 2 Patient 3
Various allergen extracts (ragweed, Bermuda grass, timothy grass, birch) known to contain cross-reactive molecular allergens
nArt v 1

Four mite native purified allergen molecules have also been developed. The synthesized allergens were titered into the assay, and patient IgE reactivity to group 1 and group 2 allergens was compared in a multiple serum evaluation with corresponding allergenic extracts (Figure 16).
Figure 16. Group 1 and group 2 mite molecular allergens.
Conclusions
One of the main goals in allergy research is to improve tools for diagnosis and specific immunotherapy.
Specific allergenic molecules will help to provide a better understanding of cosensitiza-tion and corecognition of allergens and will be useful tools for diagnosing, identifying, and managing allergic diseases.
The active R&D program at Siemens Healthcare Diagnostics calls for an increasing number of molecular allergens. Siemens is committed to expanding the 3gAllergy testing menu available on its IMMULITE 2000 and IMMULITE 2500 platforms.
1.8
59
100
80
60
40
20
0.1
D1
nDer p 1
nDer p 1
nDer p 2
D2
nDer f 1
nDer f 2
nDer p 2
nDer f 1
nDer f 2
>100N = 25
sIg
E c
oncentr
ation (
kU
/L)
3gAllergy Independent method


Part 2: Scientific Posters


2.1
63
AbstractIntroduction: Cross-reactive carbohydrate determinants (CCDs) are a group of struc-turally similar carbohydrate moieties (e.g., N-glycan) present in association with food allergens of plant, arthropod and mollusk origin. Specific IgE reactivity to CCD is gener-ally considered to have no clinical relevance. To understand the complexities of CCD reac-tivity to patient sera, we characterized and investigated MUXF* (a CCD structure from bromelain, a glycoprotein in pineapple stem) using the IMMULITE® 2000 3gAllergy™ assay to detect anti-CCD IgE reactivity.
Methods: MUXF glycopeptide was obtained by enzymatic digestion of bromelain and purified using column chromatography. Patient sera, selected on the basis of a positive IgE test for glycoprotein-containing food allergenic extracts and a negative clinical history, were tested for reactivity to MUXF glycoprotein and to bromelain allergen using the IMMULITE 2000 3gAllergy assay. Inhibition studies were performed after preincubation of patient sera with excess MUXF prior to assaying for IgE reactivity.
Results: Mass spectrometry and sugar analysis indicated the presence of glycopeptides containing the MUXF structure isolated from bromelain. Using both bromelain and MUXF glycopeptide as inhibitors, greater than 90% inhibition was obtained. MUXF glycopeptides and bromelain both demonstrated similar reactivity with anti-CCD IgE in multiserum evaluation studies using clinical samples known to have reactivity against glycoprotein.
Conclusion: Our data demonstrate that CCD-specific IgE reacted with the MUXF glyco-peptides from bromelain. Similar reactivity for MUXF glycopeptides and bromelain implies that they share common determinants. MUXF glycopeptides or bromelain allergen, either together or individually, offer the opportunity to analyze discrepancies between skin prick test, clinical history, and in vitro results.
* Available outside the US
IntroductionA potential problem with determination of specific IgE using in vitro methodologies is the detection of cross-reactive IgE antibodies to carbohydrates resulting in pollen–food cross-reactions. Cross-reactive carbohydrate determinants (CCDs) are a group of structurally similar carbohydrate moieties (e.g., N-glycan) present in pollens, mollusks, arthropods, and food allergens of plant origin.1 To under-stand the complexities of CCD reactivity in patient sera, we characterized and inves-tigated, as an immunodiagnostic tool for detection of anti-CCD reactivity, one CCD structure—MUXF—isolated from bromelain, a glycoprotein found in pineapple stem. Recent studies describe the following IgE-reactive CCD structures, commonly referred to as MUXF, to be present in bromelain: Manα1-6 (Xylβ1-2) Manβ1-4GlcNAcβ1-4 (Fucα1-3) GlcNAc.2
MethodsA model glycopeptide (MUXF) for analysis of patient samples was prepared by pronase digestion of bromelain (purchased from a commercial source), and purified using column chromatography. The purified MUXF glycopeptide was coupled with biotinylated human serum albumin (HSA) using standard coupling procedures. Quantification of the MUXF glycopeptide was performed by MALDI-TOF mass spectrometry, and sugar analysis by the phenol–sulfuric acid method. The MUXF allergen was then optimized for use in the IMMULITE 2000 3gAllergy assay. Allergen-specific IgE in patient sera was measured with the 3gAllergy assay using Bromelain allergen (K202) and MUXF allergen (O214) in separate experiments. Competitive inhibition tests were carried out at ambient temperature by preincu-bation of positive serum samples with excess unbiotinylated MUXF glycopeptide for 1 hour. Percent inhibition was calculated for each allergen and compared to a positive control.
Cross-reactive Carbohydrate Determinant (CCD) from Bromelain: A New Allergy Marker (MUXF Glycopeptide) for Specific IgE DetectionBanik U1, Huynh K1, Gan WX1, Evangelista RA1, Lopez M1, Jaggi K1, Davoudzadeh D1, Palazzo P2, Bernardi ML2, Mari A2, Hovanec-Burns D1
1Siemens Healthcare Diagnostics, Los Angeles, CA, US 2CACeS, IDI-IRCCS, Allergy Data Laboratories sc, Latina, Rome, Italy

ResultsThe model MUXF glycopeptide (prepared as described in the Methods section) was used to analyze the complexities of IgE reactivity to CCD in patient samples. Bromelain (Figure 1a) contains the MUXF carbohydrate struc-ture (also referred to as N-glycan) which is attached at asparagine 117. Protease (e.g., pronase) digestion of bromelain produces multiple MUXF-containing glycopeptides (Figure 1b). The structure of one such MUXF glycopeptide is shown in Figure 2.
Figure 1. (a) The amino acid sequence of bromelain (K202) derived from pineapple stem. The attachment point for the MUXF sugar chain, asparagine 117, is designated in a box. (b) The mixture of glycopeptides obtained after pronase digestion of bromelain.3
2.1
64
AVPQS DI IWRD
10
70
130
190 200 210
140 150 160 170 180
80 90 100 110 120
20 30 40 50 60
Y
Y
Y Y YY Y
Y Y YYP PP
G
G GG G G G G GT T TCV VWE EEF F F S S SSSN N NNI I I IR
A A A A A AAVS S S SLNHG
G G R R D DP PTL LVSSSSG CGMY YI I I IE EEA A A
G P PCG G GGT TK K KK KW WQ Q QDPI I I ITV V V VD N NNF F
AA A AR RVAACK K K K DK
AVT TSV V VE E ES SYK KK KI I IKNQ QQNP PCG G GL L LDCACWA A A AAF
MM
NGGM
M
M/UX F
Asn
MM/UXF
Pronase digestion
Asn(glycan)-Glu-Ser
Asn-Asn(glycan)-Glu
Asn(glycan)-Glu-Ser-Ser
Asn-Asn(glycan)-Glu-Ser-Ser
OH
HOHO
OH
OH
OH
OH
OH
HO
HO
HO
H
HO
HO
O
O
OO
O
O
OO
O
O
OO
O
O
O
O
O
O
O
O
C
C
C
OH
NH NH
NH
NH
NH
NH
HN NH
HN
NH2
H
N
H3C
CH3
CH3
CH2
CH2
C CH
CH2
CH-
CH-
CH2COOH
OH
S
HSA
Asn-Glu-Ser
BiotinMUXF
a.
b.
a.
b.
Figure 2. a. N-glycan structure showing the carbo-hydrate composition of N-acetylglucosamine (G), mannose (M), xylose (X), fucose (F) and an unknown sugar (U) linked to the protein via asparagine (Asn). b. The skeleton structure of the MUXF glycopeptide shown linked to biotinylated HSA.
The resulting glycopeptides were further purified by chromatographic column and iden-tified by mass spectrometric analysis (Figures 3 and 4). Consistent with the published literature, four glycopeptides were identified (Figure 3).

Figure 3. MALDI-TOF mass spectrometric analysis of the MUXF glycopeptide following pronase digestion of bromelain (K202). A mixture of four major glycopep-tides was identified in two separate syntheses.
The presence of carbohydrate was confirmed by the phenol–sulfuric acid method. Quantifi-cation of biotin and MUXF incorporation was performed by mass spectrometry (6.1 moles per mole of HSA and 4.9 moles per mole of biotinylated HSA, respectively; Figure 4).
Figure 4. MALDI-TOF mass spectrometric analysis of the MUXF glycopeptide attached to biotinylated HSA. The molecular weights determined for unmodi-fied HSA, biotinylated HSA and MUXF glycopeptide containing biotinylated HSA are shown in the panel. The average molecular weights were determined from 10 replicas.
The reactivity of IgE antibodies to bromelain (K202) and MUXF (O214) in sera from pollen-, mold-, and animal-allergic (polysensitized) patients was determined. The concentration of specific IgE to K202 and O214 correlated well, with mean dose values of 4.56 and 4.01 kU/L, respectively (Figure 5).
Figure 5. Comparison of specific IgE to brome-lain (K202) and MUXF glycopeptide (O214) using suspected CCD-reactive serum. Points below 0.10 kU/L indicate nondetectable (ND) samples.
2.1
65
20
15
10
5
0.10
ND
Bromelain
(K202)
sIg
E c
oncentr
ation (
kU
/L)
MUXF
(O214)
10090
80
70
6050
40
3020
10
0
10,000 48,000 86,000 124,000 162,000 200,000
0
5769.3
10090
80
70
6050
40
3020
10
0
10,000 48,000 86,000 124,000 162,000 200,000
0
5308.1
10090
80
70
6050
40
3020
10
0
10,000 48,000 86,000 124,000 162,000 200,000
0
1776.5
% Inte
nsity
Mass (m/z)
Mass (m/z)
Mass (m/z)
Biotin–HSA-MUXF Glycopeptide
Avg MW = 75,578
4.9 MUXF Glycopeptide per HSA (mole/mole)
Biotin–HSA
Avg MW = 66,527
6.1 Biotin per HSA (mole/mole)
Unmodified HSA
Avg MW = 66,460
% Inte
nsity
% Inte
nsity
33316
66455
34155
68536
37920
75500
1493
1379
1580
1466
1580
1466
1493
1379
100
90
80
70
60
50
40
30
20
10
0
1000 1,200 1400 1600 1800 2000
0
2.6E+4
Asn(Glycan)-Glu-Ser and Na+
Asn(Glycan)-Glu-Ser-Ser and Na+
Asn-Asn(Glycan)-Glu and Na+
Asn-Asn(Glycan)-Glu-Ser-Ser and Na+
Mass (m/z)
% I
nte
nsity
100
90
80
70
60
50
40
30
20
10
0
1000 1200 1400 1600 1800 2000
0
2.8E+4
Asn(Glycan)-Glu-Ser and Na+
Asn(Glycan)-Glu-Ser-Ser and Na+ Asn-Asn(Glycan)-Glu and Na+
Asn-Asn(Glycan)-Glu-Ser-Ser and Na+
Mass (m/z)
% I
nte
nsity

In a second evaluation, we tested clinically identified CCD-reactive samples for reactivity to the K202 and O214 allergens. The results obtained with both allergens again confirmed similar reactivity (mean dose values of 10.0 and 12.03 kU/L, respectively; Figure 6).
Figure 6. In vitro assay results of clinically identified CCD-reactive serum tested against bromelain (K202) and MUXF glycopeptide (O214).
The immunoreactivity of the MUXF glycopep-tide was determined by competitive inhibition using both the K202 and O214 allergens independently. Greater than 90% inhibition was obtained using the MUXF glycopeptide as the inhibitor in both cases (Figure 7a). Scaling studies also confirmed linear correlation of IgE reactivity with the K202 and O214 allergens (Figure 7b).
Figure 7. (a) Competitive inhibition studies of brome-lain (K202) and MUXF glycopeptide (O214). (b) Patient serum scaling study of bromelain (K202) and MUXF glycopeptide (O214).
It has been reported that carbohydrate moieties of many allergens (e.g. hymenoptera venoms, grass, tree, weed pollens etc.) share IgE epitopes, accounted for by cross-reactive carbohydrate determinants.4 To test the utility of the MUXF glycopeptide for detection of IgE reactivity to these epitopes, we tested samples with Honey Bee Venom (I1), Rye Grass (G5), English Plantain (W9), Olive (T9), Bromelain (K202), and MUXF (O214) allergens. The results showed a correlation between the data obtained with MUXF and the known CCD-containing allergens (Figure 8).
1.2
66
2.1
0.1
1
10
100
1 10 100 1000
sIg
E c
oncentr
ation (
kU
/L)
Dilution
Bromelain
(K202)
MUXF
(O214)
b.
100
80
60
20
40
0.10
ND
Bromelain
(K202)
sIg
E c
oncentr
ation (
kU
/L)
MUXF
(O214)
100%
80%
60%
40%
20%
0%
Bromelain
(K202)
MUXF
(O214)
96%
MUXF as inhibitor at 100 µg/mL (final concentration)
% I
nh
ibitio
n
92%a.

Figure 8. Specific IgE binding in suspected CCD-reac-tive serum to bromelain (K202), MUXF glycopeptide (O214), Honey Bee Venom (I1), Rye Grass (G5), English Plantain (W9) and Olive (T9).
Conclusion• CCD-specific IgE antibody reacted with
the MUXF glycopeptide (O214) from bromelain (K202).
• MUXF (O214) can be used as a tool for identifying shared IgE epitopes for CCD.
• MUXF glycopeptide (O214) may offer the opportunity to analyze discrepancies between skin prick tests, clinical history and in vitro results.
References1. Aalberse R. C., van Ree R. Cross-reactive
carbohydrate determinants. Clin Rev Allergy Immunol. 1997;15:375-387.
2. Wilson IB, Harthill JE, Mullin NP, Ashford DA, Altmann F. Core alpha1,3-fucose is a key part of the epitope recognized by antibodies reacting against plant N-linked oligosaccharides and is present in a wide variety of plant extracts. Glycobiology. 1998;8:651-61.
3. Kuberan B, Gunay NS, Dordick JS, Linhardt RJ. Preparation and isolation of neogly-coconjugates using biotin-streptavidin complexes. Glycoconjugate J. 1999;16: 271-81.
4. Mahler V, Gutgesell C, Valenta R, Fuchs T. Natural rubber latex and hymenoptera venoms share immunoglobin E-epitopes accounting for cross-reactive carbohy-drate determinants. Clin Exp Allergy. 2006;36:1446-56
0214
sIg
E c
oncentr
ation (
kU
/L)
K202 I1 G5 T9W9
100
50
17.5
3.5
0.35
0.1
2.1
67

This area (the Photo Layer) is used for photos.

2.2
69
AbstractRationale: Mugwort (Artemisia vulgaris) pollen is considered in many parts of the world to be the most important cause of pollinosis. The molecular allergen Art v 1 from mugwort weed pollen is the major allergen. The post-translational glycosylation of Art v 1 may be important in the formation of epitopes recognized by IgE antibodies. To help eluci-date the variable degrees of cosensitization to allergens and corecognition by specific IgE (sIgE), we purified native Art v 1 (nArt v 1)* for evaluation as a molecular allergen to detect sIgE to weed pollen using the IMMULITE® 2000 3gAllergy™ assay.
Methods: nArt v 1 was purchased commer-cially and tested in the IMMULITE 2000 3gAllergy assay. Mugwort extract (W6) was used as a reference. Patient sera, selected on the basis of positive clinical history for mugwort pollen allergy and/or skin test results, were evaluated for immunoreactivity to mugwort extract and nArt v 1 using the IMMULITE 2000 3gAllergy assay. Standardized inhibition studies were performed by prein-cubating patient serum with the nArt v 1 and mugwort extract.
Results: Purified nArt v 1 appeared on SDS-PAGE as a major band (MW = ~24 kDa). MALD I-TOF spectroscopy confirmed the purity and heterogeneity of nArt v 1. One hundred percent of patient sera with sIgE to mugwort allergen also demonstrated sIgE to nArt v 1. Competitive inhibition studies with nArt v 1 showed greater than 90% inhibition.
Conclusions: Detection of mugwort pollen sensitization in patients positive for mugwort extract can be achieved using the molecular allergen nArt v 1. The data suggest that nArt v 1 may be a valuable tool to aid diagnosis of mugwort pollen allergy.
* Under development
BackgroundPollen grains from Compositae weeds, e.g., mugwort (Artemisia vulgaris) and ragweed (Ambrosia artemisiifolia), are major sources of allergens worldwide. The prevalence of mugwort pollen sensitization among patients with pollinosis is 10 to 14 percent,1,2 and among weed pollens, mugwort pollen is a major cause of type I allergy (IgE-mediated allergy).3,4 Art v 1 is the major allergen among several allergenic proteins in mugwort pollen. Art v 1 has 108 amino acid residues and is higly glycosylated (30 to 40 percent).3,4 Recombinant Art v 1, which is not glycosyl-ated, had little or no reactivity to positive patient sera, indicating that glycosylation is vital for reactivity and thus supporting the importance of glycosylation for this allergen.4,5 In a recent study, more than 80 percent of patients sensitive to mugwort pollen showed a positive reaction to Art v 1,2 suggesting that this molecular allergen could be a potentially useful tool for aiding in the diagnosis and management of mugwort allergy. Due to the importance of glycosylation for this allergen, we chose to use native Art v 1 (nArt v 1) rather than recombinant Art v 1. The aim of this study was to evaluate nArt v 1 as a diagnostic tool for mugwort allergy and to assess its utility for detecting sIgE that cross-reacts with mugwort pollen in the IMMULITE 2000 3gAllergy assay.
MethodsCommercially available purified nArt v 1 (Bial-Arístegui, Bilbao, Spain) was used in this study. The purity of nArt v 1 was checked by SDS-PAGE and by analytical HPLC using the Superdex G-75 column (Pharmacia, Uppsala, Sweden). Molecular mass was determined using ABI Voyager DE STR MALDI-TOF (Applied Biosystems, Foster City, CA, US). The nArt v 1 was biotinylated for use in the IMMULITE 2000 3gAllergy assay. The immunoreactivity of nArt v 1 was checked before and after bioti-nylation by Western blot using pooled patient sera. Patient serum was selected on the basis of a positive clinical history for weed pollen
Native Art v 1: Evaluation of a Molecular Allergen for Mugwort Pollen AllergySen M1, Huynh K1, Evangelista R1, Jaggi K1, Davoudzadeh D1, Palazzo P2, Zennaro D2, Mari A2, Hovanec-Burns D1, Banik U1
1Siemens Healthcare Diagnostics, Los Angeles, CA, US;2CACeS, IDI-IRCCS, Allergy Data Laboratories sc, Latina, Rome, Italy

allergy. Standardized inhibition studies for immunoreactivity were performed by preincubating patient serum with excess unbiotinylated mugwort pollen extract at ambient temperature for 1 hour. Percent inhibition was calculated for each allergen and compared with a positive control.
ResultsThe major mugwort pollen allergen nArt v 1 appeared as ~30 kDa on SDS-PAGE (Figure 1a). The immunoreactivity of both labeled and unlabeled nArt v 1 was compared on Western blot using a pool of suspected weed pollen–allergic patient sera, and both were equally immunoreactive (Figure 1b). Immunoreactivity of the unlabeled nArt v 1 (lane 2) and labeled nArt v 1 (lanes 3 and 4) was also verified using rabbit anti–nArt v 1 serum (Figure 1c). Gel filtration HPLC results indicated the presence of a major nArt v 1 protein peak (Figure 2). The molecular mass of nArt v 1 was calculated to be 12,977 and 15,059 Da by MALDI-TOF analysis (Figure 3). The broad peak at 15,059 reflects the micro-heterogeneity of this protein. The reactivity of IgE antibodies to nArt v 1 and corresponding mugwort pollen extract was determined by testing sera from patients clinically identified as positive and tested against nArt v 1 and mugwort extract. The mean dose values for nArt v 1 and mugwort extract were 35 and 25 kU/L, respectively (Figure 4).
Figure 1. (a) SDS-PAGE, (b) Western blot using patient sera, and (c) Western blot using rabbit anti–nArt v 1 serum with 5 µg purified nArt v 1 per lane (lanes 2–4). In each figure, lane 1 is the molecular weight marker, lane 2 is unlabeled nArt v 1, and lanes 3 and 4 are labeled nArt v 1 from two different preparations.
Figure 2. HPLC elution profile of native Art v 1. The major peak was seen at 21.97 min.
Figure 3. MALDI-TOF analysis of nArt v 1. The broad mutiple peaks are consistent with the heavy glycosyl-ation of this molecule.
Figure 4. Clinically identified weed pollen serum samples were tested with nArt v 1 and mugwort extract. The same serum samples were also tested independently on another platform for nArt v 1. Mea-surements below 0.1 kU/L are nondetectable (ND).
2.2
70
kDa250 –
98 –64 –50 –36 –30 –
16–6 –
1 2 3 4
a.
kDa
250 –
98 –64 –50 –36 –30 –16–6 –
1 2 3 4
b.
kDa
250 –
98 –64 –
50 –36 –30 –
16–6 –
1 2 3 4
c.
5 10 15 20
Time (minutes)
A2
80
25 30 35 40 45 50 55 60
14.90
19.01
21.97
38.26 50.74
S.P 1600
% In
ten
sity
Mass (m/z)
100908070605040
3020
100
10000 20000 30000 40000 50000 600000
2796.712977
15059
100>100
N = 15
50
17.5
3.5
0.35
ND <0.10.1
nArt v 1
sIg
E co
nce
ntr
atio
n (
kU/L
)
Mugwort3gAllergy Independent Method
Art v 1

The immunoreactivity of nArt v 1 was determined by competitive inhibition using nArt v 1 and mugwort pollen extract. In each case, greater than 90 percent inhibition was obtained using nArt v 1 as an inhibitor (data not shown). Figure 5 shows specific IgE measurements of various extracts (ragweed, Bermuda grass, timothy grass and birch) known to contain cross-reactive molecular allergens. These measurements were compared to those for nArt v 1 using sera from three patients with suspected mugwort pollen allergy.
Figure 5. Specific IgE measurements for cross-reactive extracts were compared to sIgE measurements for nArt v 1 and mugwort pollen extract using sera from three patients suspected of having weed pollen allergy. The black dots are the nArt v 1 sIgE measure-ments in these patients.
ConclusionsThe major mugwort pollen allergen nArt v 1 used in the IMMULITE 2000 3gAllergy assay could be a useful tool for mugwort allergy. Moreover, nArt v 1 might be useful in assessing IgE-mediated cross-reactivity in the context of the patient’s symptoms and clinical history.
References1. Asero R, Wopfner N, Gruber P, Gadermaier
G, Ferreira F. Artemisia and Ambrosia hypersensitivity: co-sensitization or co-recognition? Clin Exp Allergy. 2006 May;36(5):658-65.
2. Jahn-Schmid B, Kelemen P, Himly M, Bohle B, Fischer G, Ferreira F, et al. The T cell response to Art v 1, the major mugwort pollen allergen, is dominated by one epitope. J Immunol. 2002 Nov 15;169(10):6005-11.
3. Jimeno L, Duffort O, Serrano C, Barber D, Polo F. Monoclonal antibody-based ELISA to quantify the major allergen of Artemisia vulgaris pollen, Art v 1. Allergy. 2004 Sep;59(9):995-1001.
4. Leonard R, Petersen BO, Himly M, Kaar W, Wopfner N, Kolarich D, et al. Two novel types of O-glycans on the mugwort pollen allergen Art v 1 and their role in antibody binding. J Biol Chem. 2005 Mar 4;280(9):7932-40.
5. Oberhuber C, Ma Y, Wopfner N, Gadermaier G, Dedic A, Niggemann B, et al. Prevalence of IgE-binding to Art v 1, Art v 4 and Amb a 1 in mugwort-allergic patients. Int Arch Allergy Immunol. 2008;145(2):94-101.
2.2
71
100>100
50
17.5
3.5
0.35
0.1
Patient 1
sIg
E co
nce
ntr
atio
n (
kU/L
)
Patient 2 Patient 3


2.3
73
AbstractBackground: Bet v 1, a major allergenic protein of birch pollen, is a member of the pathogenesis-related PR-10 family of proteins. Oral allergy syndrome (OAS) as a result of primary sensitization to Bet v 1 has been previ-ously reported. In this study, we purified native Bet v 1 (nBet v 1) protein from birch extract and tested the resultant molecular allergen* in the IMMULITE® 2000 3gAllergy™ assay.
Methods: nBet v 1 was isolated from white birch (Betula verrucosa) extract and further purified to homogeneity using a series of chro-matographic procedures. Samples from patients known to be allergic to birch pollen were tested in the IMMULITE 2000 3gAllergy assay for specific IgE (sIgE) reactivity to birch extract (T3) and PR-10 proteins nBet v 1, Mal d 1, and Pru av 1. Additionally, samples selected on the basis of positive clinical histories and/or positive skin test results for OAS were also evaluated for nBet v 1 sIgE reactivity. Competi-tive inhibition studies were performed by preincubating serum with nBet v 1 and birch extract.
Results: Purity, identity and homogeneity of nBet v 1 (apparent MW = ~17 kDa) were char-acterized by SDS-PAGE, mass spectrometry and Western blot analysis. Birch-allergic patient sera were evaluated for sIgE to nBet v 1 using the IMMULITE 2000 3gAllergy assay and showed 100% reactivity to nBet v 1 and other PR-10 molecular allergens. Greater than 90% inhibi-tion was achieved using both birch extract and nBet v 1 as inhibitors.
Conclusion: Results of this study support birch allergen Bet v 1 as a sensitive diagnostic tool that can be used by physicians for birch pollen allergy diagnosis and associated OAS.
* In development
BackgroundPollen–food syndrome (PFS) is an allergic condition in which sensitized individuals react to homologous allergenic molecules from pollens and plant-derived foods. The clinical manifestation of pollen-food syndrome, also known as class 2 food allergy, ranges from localized reactions like oral allergy syndrome to severe systemic reactions like anaphylaxis. Bet v 1 is the major molecular allergen in birch pollen; more than 95 percent of birch pollen–allergic patients test positive for this molecular allergen.1 Bet v 1, a pathogenesis-related (PR-10) protein, has been shown to have high sequence homology with the other major molecular allergens of the Betulaceae family, such as Aln g 1 (alder), Cor a 1 (hazel), and Car b 1 (hornbeam).2 Homology and cross-reactivity have been observed between Bet v 1 and plant food allergens, for example, Mal d 1 (apple),3 Pru av 1 (cherry),4 and Api g 1 (celery), belonging to the PR-10 family.5 Studies using Bet v 1 have shown that it is a marker of birch pollen sensitization. We therefore developed native Bet v 1 (nBet v 1) for use in the IMMULITE 2000 3gAllergy assay.
Materials and MethodsnBet v 1 was purified from commercially available white birch extract using a Superdex™ 75 gel filtration column. Purity of nBet v 1 was assessed by SDS-PAGE, Western blot and MALDI-TOF studies. Patient sera, selected on the basis of positive clinical history for food and pollen allergy, were evaluated using the IMMULITE 2000 3gAllergy assay. Standardized inhibition studies for immunoreactivity were performed by preincubating serum with an excess of unbiotinylated birch extract or unbi-otinylated nBet v 1 at ambient temperature for 1 hour. Percent inhibition was calculated for each allergen and compared with a positive control.
Evaluation of Native Birch Molecular Allergen nBet v 1: Major Allergen for Birch Pollen Allergy DiagnosisOrdonez M1, Huynh K1, Rouhani R1, Evangelista R1, Jaggi K1, Hovanec-Burns D1, Davoudzadeh D1, Ferrara R2, Pirrotta L2, Mari A2, Banik U1
1Siemens Healthcare Diagnostics, Los Angeles, CA, US2CACeS, IDI-IRCCS, Allergy Data Laboratories sc, Latina, Rome, Italy

ResultsBiochemical characterization of purified nBet v 1 is shown in Figure 1. Pooled fractions from a preparative Superdex 75 gel filtration column appeared as a single protein band of MW of ~17 kDa on SDS-PAGE (Figure 1a) and on Western blot using a Bet v 1 mouse polyclonal antibody (Figure 1b). Homogeneity of nBet v 1 was further characterized by HPLC using an analytical Superdex 75 gel filtration column (Figure 2).
Figure 1. (a) SDS-PAGE and (b) Western blot using Bet v 1 anibody with 2.5 µg purified nBet v 1 per lane (lanes 2–3). In each figure, lane 1 is MW marker, and lanes 2 and 3 are unbiotinylated and biotinylated nBet v 1, respectively.
Figure 2. HPLC elution profile of nBet v 1, with the major peak at 24.21 min.
The molecular mass of 17,389 Da was deter-mined by MALDI-TOF (Figure 3).
Figure 3. MALDI-TOF analysis of nBet v 1, with a single major peak demonstrating purity.
The reactivity to nBet v 1 and birch extract was determined by measurement of sIgE in sera from patients suspected of having PFS. The concentrations of specific IgE (sIgE) to nBet v 1 and birch were in good agreement, with similar mean dose values of 8 and 9 kU/L, respectively (Figure 4).
Figure 4. A comparison of specific IgE measurements of nBet v 1 and birch extract (T3) using sera from suspected pollen-sensitized patients. Points below 0.1 kU/L are nondetectable (ND).
In a second evaluation, we tested serum samples from patients clinically identified as Bet v 1 positive with nBet v 1 and birch extract. The mean sIgE concentration values for nBet v 1 and birch extract were 30 and 25 kU/L, respectively (Figure 5). The cross-reactivity of the PR-10 molecules tested was determined by competitive inhibition using both nBet v 1 and birch extract. In each instance, greater than 95 percent inhibition was obtained using either nBet v 1 or birch extract as inhibitors (data not shown).
Figure 5. In vitro assay results of clinically identified birch pollen–reactive sera tested against nBet v 1 and birch extract (T3). These sera were also tested indepen-dently on another platform for Bet v 1.
We also tested sera from three patients suspected of having PFS with extracts known to contain PR-10 or Bet v 1 homologous proteins (Table 1). These patients all had detectable levels of Bet v 1 and birch sIgE (Figure 6).
2.3
74
5 10 15 20 25 30 35 40 45 50 55 60
24.21
Retention time (min)
A2
80
% In
ten
sity
Mass (m/z)
100
9080
70
6050
40
3020
100 0
2.4E+4
15000 16600 18200 19800 21400 23000
17389
15220 18729
kDa
250 –
98 –64 –50 –
36 –
30 –16–6 –4 –
1 2 3
kDa
250 –
98 –64 –
50 –
36 –
30 –
16–6 –
1 2 3
a. b.
100
80
60
40
20
0ND <0.1
N = 20
nBet v 1
sIg
E co
nce
ntr
atio
n (
kU/L
)
Birch
100
80
60
40
20
0ND <0.1
N = 16
nBet v 1 Bet v 1Birch
sIg
E co
nce
ntr
atio
n (
kU/L
)

Figure 6. Specific IgE concentrations to various extracts (listed in Table 1) known to contain Bet v 1 homolo-gous allergens and compared with nBet v 1 using three suspected pollen-allergic sera. The black dots represent nBet v 1 sIgE concentration values.
Table 1. Allergenic extracts tested against sera from patients suspected of being allergic to pollen (sIgE concentrations shown in Figure 6).
Conclusions
This study showed that patients who were positive for birch pollen extract were also positive for nBet v 1. It suggests that birch pollen sensitization can be detected by nBet v 1 as well as by birch pollen extract. This study also showed the extensive cross-reactivity between plant and pollen Bet v 1 homologous allergens, which is supportive of the use of a PR-10 molecular allergen like nBet v 1 in the diagnosis of PFS.
References 1. Breiteneder H, Pettenburger K, Bito A,
Valenta R, Kraft D, Rumpold H, et al. The gene coding for the major birch pollen allergen, Bet v 1, is highly homologous to a pea disease resistance response gene. EMBO J. 1989 Jul;8(7):1935-8.
2. Valenta R, Breiteneder H, Petternburger K, Breitenbach M, Rumpold H, Kraft D, et al. Homology of the major birch-pollen allergen, Bet v I, with the major pollen aller-gens of alder, hazel, and hornbeam at the nucleic acid level as determined by cross-hybridization. J Allergy Clin Immunol. 1991 Mar;87(3):677-82.
3. Vanek-Krebitz M, Hoffmann-Sommergruber K, Laimer da Camara Machado M, Susani M, Ebner C, et al. Cloning and sequencing of Mal d 1, the major allergen from apple (Malus domestica), and its immunological relationship to Bet v 1, the major birch pollen allergen. Biochem Biophys Res Commun. 1995 Sep 14;214(2):538-51.
4. Scheurer S, Metzner K, Haustein D, Vieths S. Molecular cloning, expression and char-acterization of Pru a 1, the major cherry allergen. Mol Immunol. 1997 Jun;34(8-9):619-29.
5. Breiteneder H, Hoffmann-Sommergruber K, O’Riordain G, Susani M, Ahorn H, Ebner C, et al. Molecular characterization of Api g 1, the major allergen of celery (Apium graveo-lens), and its immunological and structural relationships to a group of 17-kDa tree pollen allergens. Eur J Biochem. 1995 Oct 15;233(2):484-9.
2.3
75
100
80
60
40
20
0ND <0.1
>100
Patient 2 Patient 3Patient 1
sIg
E co
nce
ntr
atio
n (
kU/L
)
Extract Molecule Extract Molecule
Peanut Ara h 8 Peach Pru p 1
Soybean Gly m 4 Apricot Pru ar 1
Hazelnut Cor a 1 Cherry Pru av 1
Carrot Dau c 1 Raspberry Rub I 1
Strawberry Fra a 1 Birch Bet v 1
Apple Mal d 1 Hazelnut Cor a 1
Celery Api g 1 Oak Que a 1
Pear Pyr c 1


2.4
77
AbstractRationale: Pollens from trees of the family Oleaceae are important allergenic sources, with significant differences in geographic distribution. Molecular allergen Ole e 1 is one such major allergen in olive tree (Olea euro-paea) pollen and is a good marker of allergic sensitization. As a tool to help elucidate the variable degrees of allergen cross-reactivities and sources of sensitization for allergy diag-nosis, we evaluated a purified native Ole e 1 (nOle e 1) molecular allergen* in the IMMULITE® 2000 3gAllergy™ assay.
Methods: Native Ole e 1 was purchased commercially and evaluated in the IMMULITE 2000 3gAllergy assay. Olive extract (T9) was used as a reference. Patient sera, selected on the basis of positive clinical history for tree pollen allergy and/or skin test results, were evaluated for immunoreactivity to olive extract and nOle e 1 using the IMMULITE 2000 3gAllergy assay. Standardized inhibition studies were performed by preincubating sera with nOle e 1 and olive extract.
Results: Purified nOle e 1 appeared on SDS-PAGE as a major band (MW = ~19 kDa). MALDI-TOF spectroscopy confirmed the purity and homogeneity of nOle e 1. One hundred percent of the patient sera with specific IgE (sIgE) reactivity to T9 allergen also demon-strated sIgE reactivity to nOle e 1. Competitive inhibition studies of nOle e 1 showed greater than 90% inhibition.
Conclusions: Accurate detection of sIgE to olive pollen can be achieved using the major molecular allergen nOle e 1. This study supports the use of nOle e as a tool to aid in the diagnosis of olive pollen allergy.
* In development
BackgroundTrees of the family Oleaceae, varying widely in their geographic distribution, are important allergen sources. Ole e 1, the major allergen of olive (Olea europaea), reacts with more than 80 percent of the patients sensitive to olive pollen.1,2 Ole e 1 is a 145-amino-acid polypep-tide chain that exhibits three glycosylation variants in addition to microheterogeneity at several positions.3 Ole e 1 cross-reacts with other major allergens from plants belonging to the Oleaceae (ash, lilac, privet) and Elaeagnaceae (Russian olive) family.4
The aim of this study was to develop a diag-nostic tool for olive pollen allergy. Molecular allergens could be an effective tool to monitor the therapeutic progress of allergic patients. To better understand variable degrees of putative cross-reactivity and sources of sensi-tization for allergy diagnosis, we developed a native Ole e 1 molecular allergen for use in the IMMULITE 2000 3gAllergy assay.
MethodsThe purity of commercially available nOle e 1 was verified by SDS-PAGE and analytical HPLC using a Superdex column. The molecular mass was determined with a Voyager MALDI-TOF system (Applied Biosystems, Foster City, CA, US). The immunoreactivity of nOle e 1 was checked before and after biotinylation by Western blot using a pool of patient sera. Patient sera evaluated in this study were selected on the basis of positive clinical history for tree pollen allergy. Standardized inhibition studies for immunoreactivity were performed by preincubating serum with excess unbioti-nylated olive pollen extract and nOle e 1 at ambient temperature for 1 hour. Percent inhibition was calculated for each allergen and compared with a positive control.
Native Ole e 1: Evaluation of a Molecular Allergen for Olive Pollen AllergySen M1, Huynh K1, Evangelista R1, Jaggi K1, Davoudzadeh D1, Zennaro D2, Giani M2, Mari A2, Hovanec-Burns D1, Banik U1
1Siemens Healthcare Diagnostics, Los Angeles, CA, US 2CACeS, IDI-IRCCS, Allergy Data Laboratories sc, Latina, Rome, Italy

ResultsOle e 1 appeared as double bands of ~17 kDa and ~19 kDa on SDS-PAGE (Figure 1a) due to the presence of microheterogeneity in the nOle e 1 glycoprotein. Both biotinylated and unbiotinylated nOle e 1 were compared on Western blot (Figure 1b) using a pool of pollen-sensitive patient sera and were found to be equally immunoreactive. Biotin incor-poration was verified by Western blot using alkaline phosphatase–conjugated streptavidin (Figure 1c). Gel filtration HPLC results indicate the presence of one major peak (Figure 2). nOle e 1 isoelectric focusing appeared to have multiple bands, and most nOle e 1 isoforms were within acidic pI range (data not shown). The molecular masses of two different bands of Ole e 1 were calculated to be 16908 and 18066 Da by MALDI-TOF analysis (Figure 3).
Figure 1. (a) SDS-PAGE, (b) Western blot using patient sera, and (c) Western blot using alkaline phosphatase–conjugated streptavidin with 5 µg purified nOle e 1 per lane (lanes 2–4). In each figure, lane 1 is MW marker, lane 2 is unbiotinylated nOle e 1, and lanes 3 and 4 are biotinylated nOle e 1 from two different preparations.
Figure 2. HPLC elution profile (major peak at 20.88 min) of native Ole e 1 from Superdex column.
Figure 3. MALDI-TOF spectrum of nOle e 1 using a Voyager-DE STR instrument (Applied Biosystems).
The reactivity of specific IgE antibodies (sIgE) to nOle e 1 and to the corresponding olive pollen extract was determined in patient sera clinically identified as nOle e 1 positive. The mean dose values for nOle e 1 and olive extract are 38 and 19 kU/L, respectively. For unknown reasons, the sIgE reactivity is higher in some patients for nOle e 1 than for olive extract. The immunoreactivity of the nOle e 1 was deter-mined by competitive inhibition using nOle e 1 and olive pollen extract. In each case, greater than 95 percent inhibition was obtained using nOle e 1 (35 µg) as an inhibitor (data not shown).
We also tested additional allergenic extracts known to contain proteins of the Ole e 1–like family (Table 1)4 using sera from patients suspected of being allergic to olive pollen and compared specific IgE results with nOle e 1 (Figure 5).
Figure 4. In vitro assay results of clinically identified PR-10–reactive sera tested against nOle e 1 and olive extract. The same sera were tested independently on another platform for Ole e 1.
2.4
78
a.kDa
250 –
98 –64 –50 –36 –30 –16–6 –4 –
1 2 3 4
b.kDa
250 –
98 –64 –50 –36 –30 –16 –
6 –
1 2 3 4
c.kDa
250 –
98 –64 –50 –36 –30 –16 –
6 –
1 2 3 4
5 10 15 20 25 30 35 40 45 50 55 60
20.88
18.3238.02
42.02
45.38 50.64
Time (min)
A2
80
% In
ten
sity
Mass (m/z)
100
9080
70
6050
40
3020
100 0
3.1E+4
14995.0 19996.8 24988.6 30000.4 35002.2 40004.0
18066
16908
1579235813
N = 30
50
100
17.5
3.5
0.35
0.1
nOle e 1
3gAllergy Assay Independent Method
sIg
E co
nce
ntr
atio
n (
kU/L
)
Olive Ole e1

Figure 5. Specific IgE concentrations to various extracts (listed in Table 1) known to contain Ole e 1 cross- reactive allergens and compared with nOle e 1 and olive pollen extract using three suspected tree pollen–allergic sera. The sIgE concentration values for nOle e 1 are shown in black.
Table 1. Allergenic extracts tested against sera from patients suspected of being allergic to proteins of the Ole e 1–like family. (sIgE concentrations are shown in Figure 5.)
ConclusionsThe major olive pollen allergen nOle e 1 is a useful tool for diagnosing, identifying and managing patients with olive pollen allergy using the IMMULITE 2000 3gAllergy assay. In addition, IgE-mediated allergen cross-reac-tivity, especially among taxonomically related species and/or some glycoprotein allergens, can also be diagnosed using nOle e 1 allergen along with patient clinical history.
References 1. Boluda L, Alonso C, Fernández-Caldas E.
Purification, characterization, and partial sequencing of two new allergens of Olea europaea. J Allergy Clin Immunol. 1998 Feb;101(2 Pt 1):210-6.
2. van Ree R, Aalbers M, Kea O, Marco De La Calle FM, Sempere Ortells JM, Villalba M, et al. A sensitive monoclonal antibody sandwich ELISA for the measurement of the major olive pollen allergen Ole e 1. Int Arch Allergy Immunol. 2000 Jul;122(3):224-8.
3. Rodriguez R, Villalba M, Monsalve RI, Batanero E, Gonzalez EM, Monsalve RI, et al. Allergenic diversity of the olive pollen. Allergy. 2003;57:6-16.
4. Rodriguez R, Villalba M, Batanero E, Palomares O, Quiralte J, Salamanca G, et al. Olive pollen recombinant allergens: Value in diagnosis and immunotherapy. J Investig Allergol Clin Immunol. 2007;17:56-62.
2.4
79
Perennial Rye Grass Lol p 11
Timothy Grass Phl p 11
English Plantain Pla l 1
Lamb’s Quarters Che a 1
White Ash Fra a 1
Arizona Ash Fra v 1
Privet Lig v 1
50
100
17.5
3.5
0.35
0.1
ND = <0.1
Sample 1
sIg
E co
nce
ntr
atio
n (
kU/L
)
Sample 2 Sample 3

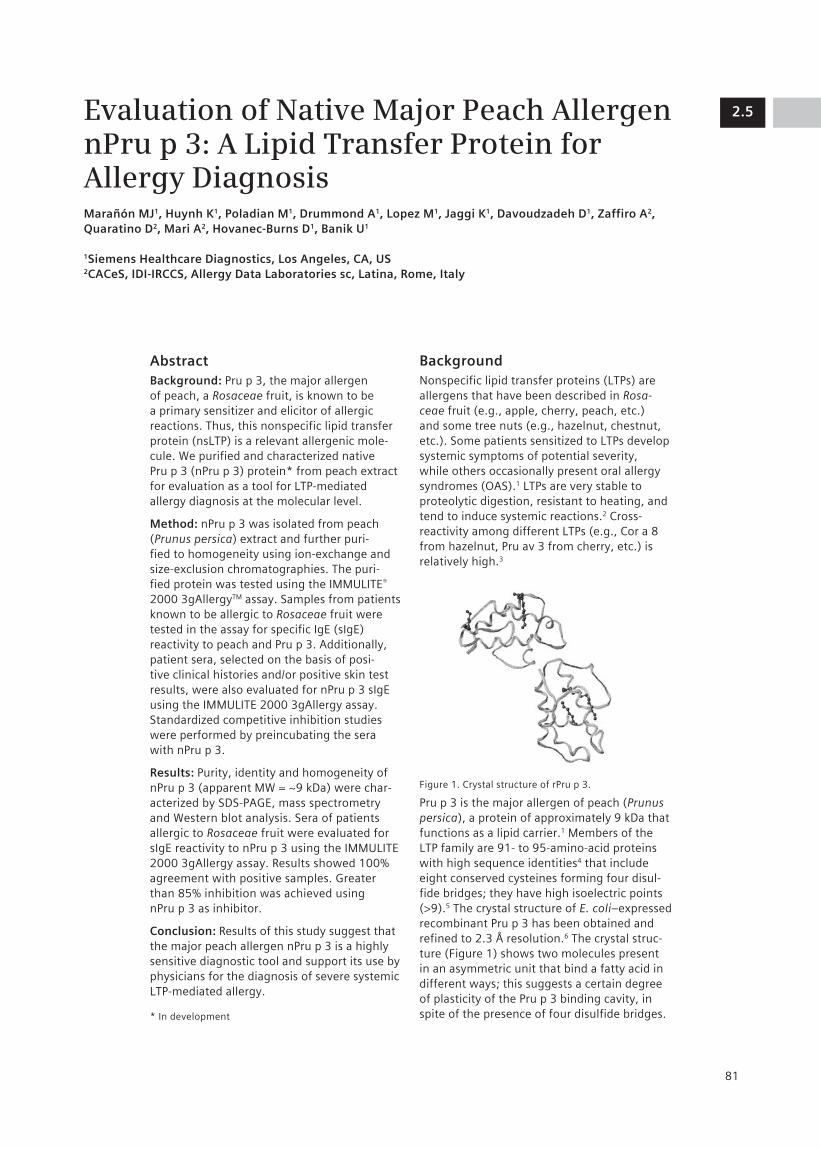
2.5
81
AbstractBackground: Pru p 3, the major allergen of peach, a Rosaceae fruit, is known to be a primary sensitizer and elicitor of allergic reactions. Thus, this nonspecific lipid transfer protein (nsLTP) is a relevant allergenic mole-cule. We purified and characterized native Pru p 3 (nPru p 3) protein* from peach extract for evaluation as a tool for LTP-mediated allergy diagnosis at the molecular level.
Method: nPru p 3 was isolated from peach (Prunus persica) extract and further puri-fied to homogeneity using ion-exchange and size-exclusion chromatographies. The puri-fied protein was tested using the IMMULITE® 2000 3gAllergyTM assay. Samples from patients known to be allergic to Rosaceae fruit were tested in the assay for specific IgE (sIgE) reactivity to peach and Pru p 3. Additionally, patient sera, selected on the basis of posi-tive clinical histories and/or positive skin test results, were also evaluated for nPru p 3 sIgE using the IMMULITE 2000 3gAllergy assay. Standardized competitive inhibition studies were performed by preincubating the sera with nPru p 3.
Results: Purity, identity and homogeneity of nPru p 3 (apparent MW = ~9 kDa) were char-acterized by SDS-PAGE, mass spectrometry and Western blot analysis. Sera of patients allergic to Rosaceae fruit were evaluated for sIgE reactivity to nPru p 3 using the IMMULITE 2000 3gAllergy assay. Results showed 100% agreement with positive samples. Greater than 85% inhibition was achieved using nPru p 3 as inhibitor.
Conclusion: Results of this study suggest that the major peach allergen nPru p 3 is a highly sensitive diagnostic tool and support its use by physicians for the diagnosis of severe systemic LTP-mediated allergy.
* In development
BackgroundNonspecific lipid transfer proteins (LTPs) are allergens that have been described in Rosa-ceae fruit (e.g., apple, cherry, peach, etc.) and some tree nuts (e.g., hazelnut, chestnut, etc.). Some patients sensitized to LTPs develop systemic symptoms of potential severity, while others occasionally present oral allergy syndromes (OAS).1 LTPs are very stable to proteolytic digestion, resistant to heating, and tend to induce systemic reactions.2 Cross-reactivity among different LTPs (e.g., Cor a 8 from hazelnut, Pru av 3 from cherry, etc.) is relatively high.3
Figure 1. Crystal structure of rPru p 3.
Pru p 3 is the major allergen of peach (Prunus persica), a protein of approximately 9 kDa that functions as a lipid carrier.1 Members of the LTP family are 91- to 95-amino-acid proteins with high sequence identities4 that include eight conserved cysteines forming four disul-fide bridges; they have high isoelectric points (>9).5 The crystal structure of E. coli–expressed recombinant Pru p 3 has been obtained and refined to 2.3 Å resolution.6 The crystal struc-ture (Figure 1) shows two molecules present in an asymmetric unit that bind a fatty acid in different ways; this suggests a certain degree of plasticity of the Pru p 3 binding cavity, in spite of the presence of four disulfide bridges.
Evaluation of Native Major Peach Allergen nPru p 3: A Lipid Transfer Protein for Allergy DiagnosisMarañón MJ1, Huynh K1, Poladian M1, Drummond A1, Lopez M1, Jaggi K1, Davoudzadeh D1, Zaffiro A2, Quaratino D2, Mari A2, Hovanec-Burns D1, Banik U1
1Siemens Healthcare Diagnostics, Los Angeles, CA, US2CACeS, IDI-IRCCS, Allergy Data Laboratories sc, Latina, Rome, Italy

To understand variable degrees of cross-reactivity and sources of sensitization for allergy, we developed native Pru p 3, a ~9 kDa molecular allergen, for use in the IMMULITE 2000 3gAllergy assay.
MethodsNative Pru p 3 (nPru p 3) was purified to homogeneity from fresh yellow peaches (Prunus persica). The minced fruit (peel and pulp) was frozen in liquid N
2 before extraction
to preserve proteins. Peach allergens were extracted in successive steps with ice-cold acetone and ethly ether and lyophilized before extraction with ice-cold phosphate buffered saline (PBS), pH 7.4. The extract in PBS was lyophilized for concentration and preservation at –70°C before being subjected to ion-exchange chromatography. The frac-tions with immunoreactivity against anti-LTP (anti–Pru av 3) monoclonal antibodies were collected, concentrated and purified to homogeneity through size-exclusion chroma-tography (SEC) using Superdex 75. The SEC peak appeared in SDS-PAGE as a single band of apparent MW = 9 kDa (>98% purity) and retained immunoreactivity against in-house anti-LTP mAbs. The purified nPru p 3 was biotinylated for use in the IMMULITE 2000 3gAllergy assay.
Recombinant Pru av 3 was expressed as a His-tag protein in baculovirus and purified to homogeneity by Ni2+ chelating chroma-tography. Purified rPru av 3 appeared in SDS-PAGE as a single band of apparent MW = 10 kDa (>98% purity), which was confirmed by MALDI-TOF spectroscopy (Figure 4). rPru av 3 was used to raise in-house anti-LTP mAbs for identification purposes.
Patient sera evaluated in this study were selected on the basis of positive clinical history for fruit allergy. Standardized inhi-bition studies for immunoreactivity were performed by preincubating serum with excess unbiotinylated cherry extract and nPru p 3. Percent inhibition was calculated for each allergen and compared with a positive control.
ResultsThe purified peach LTP, nPru p 3, appeared as a major protein band with an apparent molecular mass of ~9 kDa on SDS-PAGE (Figure 2a). The immunoreactivity of both biotinylated and unbiotinylated nPru p 3 was compared (Figure 2b) on Western blot. Biotin incorporation was verified by Western blot using alkaline phosphatase–conjugated strep-tavidin (Figure 2c). We also carried out nPru p 3 amino acid N-terminal sequencing. The first 10 amino acids (ITCGQVSSAL) were consistent with the published Pru p 3 sequence (Pru p 3.0101, UniProt accession number P81402, submitted by Pastorello et al7 and accessed through allergome.org8). (C is not detected by the sequencing method.) Sequence alignment of the major allergens of peach Pru p 3 (isoform Pru p 3.0101) and cherry Pru av 3 (isoform Pru av 3.0101) was performed with the program ClustalW9 and showed 87 percent sequence homology between the two LTPs (Figure 3). The molecular mass of nPru p 3 was calculated to be 9103 Da by MALDI-TOF analysis (Figure 4).
Figure 2. (a) SDS-PAGE, (b) Western blot using patient sera, and (c) Western blot using alkaline phosphatase–conjugated streptavidin with 7 µg purified nPru p 3 per lane (lanes 2–4). In each figure, lane 1 is MW marker, lane 2 is unbiotinylated nPru p 3, and lanes 3 and 4 are biotinylated nPru p 3 from two different preparations.
2.5
82
a.
250 –
98 –
64 –
50 –
36 –
30 –
16–
6 –1 2 3 4
b.
250 –
98 –64 –50 –
36 –
30 –
16–6 –
1 2 3 4
c.
250 –
98 –64 –
50 –
36 –
30 –
16–6 –
1 2 3 4

MALDI-TOF spectra were acquired using an Applied Biosystems Voyager-DE STR instru-ment calibrated with bovine serum albumin (BSA; MW = 66,431 Da). The sample matrix used was sinapinic acid. The difference in MW observed upon comparing nPru p 3 and rPru av 3 is due to the presence of a tag sequence on the recombinant protein. Smaller MW peaks are due to protein degrada-tion that takes place in both the native and recombinant proteins. nPru p 3 and rPru av 3 preparations were homogeneous by SDS-PAGE and analytical chromatography; the presence of small peaks of higher molecular weight are likely due to protein aggregation (also seen by analytical chromatography) (data not shown).
The reactivity of IgE antibodies to nPru p 3 and corresponding peach extract was deter-mined in sera from patients identified by clinical history as Pru p 3 positive and tested against nPru p 3 and peach extract. The mean dose values for nPru p 3 and peach extract are 30 and 10 kU/L, respectively (Figure 5). The immunoreactivity of the nPru p 3 molecules was determined by competitive inhibition using nPru p 3 and peach extract. In each case, 100 percent inhibition was obtained using nPru p 3 as an inhibitor (data not shown). We also tested additional allergenic extracts known to contain homologous LTPs (Table 1) using sera from patients suspected to be allergic to Rosaceae fruit allergens and compared specific IgE results with nPru p 3 (Figure 6).
Figure 5. In vitro assay results of clinically identified Rosaceae fruit–allergic sera tested against nPru p 3 and peach extract. The same sera were tested independently on another platform for Pru p 3.
Table 1. Allergenic extracts tested against sera from patients suspected to be allergic to LTPs (sIgE concen-trations shown in Figure 6).
2.5
83
P81402 | NLTP1_PRUPE ITCGQVSSALAPCIPYVRGGGAVPPACCNGIRNVNNLARTTPDRQAACNCLKQLSASVPG 60 Q9M5X8 | NLTP_PRUAV LTCGQVSSNLAPCIAYVRGGGAVPPACCNGIRNI NNLAKTTADRQTACNCLKQLSASVPG 60
: ******* *** **. **** * *************: **** : **.* * * : ************** P81402 | NLTP1_PRUPE VNPNNAAALPGKCGVHIPYKISASTNCATVK 91Q9M5X8 | NLTP_PRUAV VNANNAAALPGKCGVNVPYKISPSTNCATVK 91 * * . * * * * ***** * * * : : *****. *** ** * * *
100
100
80
60
40
2 0
05000 12000 15000 20000 25000 30000
0
1.8E+4
80
60
40
20
0 0
5661.5
5000 10000
7223
9103
7347
10369
20622
13138
Mass (m/z)
Mass (m/z)
% In
ten
sity
% In
ten
sity
15000 20000 25000 30000
a.
100
100
80
60
40
2 0
05000 12000 15000 20000 25000 30000
0
1.8E+4
80
60
40
20
0 0
5661.5
5000 10000
7223
9103
7347
10369
20622
13138
Mass (m/z)
Mass (m/z)
% In
tens
ity%
Inte
nsity
15000 20000 25000 30000
b.
100
50
17.5
3.5
0.35
0.1
Peach
sIg
E co
nce
ntr
atio
n (
kU/L
)
nPru p 33gAllergy Assay Independent Method
Pru p 3
Figure 4. MALDI-TOF spectrum of nPru p 3 (a), with that of rPru av 3 shown for comparison (b). The annotated MW values are the means of seven determinations.
Figure 3. Sequence alignment of the major allergens of peach Pru p 3 (isoform Pru p 3.0101, UniProt accession number P81402) and cherry Pru av 3 (isoform Pru av 3.0101, UniProt accession number Q9M5X8) performed with the program ClustalW9 showing 87% sequence homology between the two LTPs. Per ClustalW consensus, an asterisk (*) indicates identity; a colon (:), conserved substitutions; and a period (.), semiconserved substitutions. Residues are shaded according to their physicochemical properties: medium gray = small and hydrophobic (AVFPMILW), black = acidic (DE), light gray = basic (RHK), and dark gray = hydroxyl or amino groups (STYHCNGQ)
Extract Molecule Extract Molecule
Mugwort Art v 3 Parietaria officinalis Par o 1
Asparagus Asp o 1 Apricot Pru ar 3
Chestnut Cas s 8 Cherry Pru av 3
Lemon Cit l 3 Plum Pru d 3
Hazelnut Cor a 8 Peach Pru p 3
Lettuce Lac s 1 Pear Pyr c 3
Tomato Lyc e 3 Grape Vit v 1
Apple Mal d 3 Maize, Corn Zea m 14
Parietaria judaica Par j 1 Broccoli Bra o 3

Figure 6. Specific IgE concentrations to various extracts (listed in Table 1) known to contain LTPs and compared with nPru p 3 using three suspected LTP-allergic sera. The dose values for nPru p 3 are shown in black.
Conclusions The major peach allergen nPru p 3 is a useful tool for diagnosing, identifying and managing LTP-hypersensitive patients using the IMMU-LITE 3gAllergy assay. Cross-reactivity between members of the nonspecific lipid transfer protein family is deemed to be responsible for the majority of severe systemic reactions observed among peach-sensitized patients. Members of the LTP family of allergens (e.g., Pru p 3) can provide diagnostic reliability for skin systemic symptoms or oral allergy symp-toms related to LTP-mediated allergy.
References 1. Pastorello EA, Farioli L, Pravettoni V, Orto-
lani C, Ispano M, Monza M, et al. The major allergen of peach (Prunus persica) is a lipid transfer protein. J Allergy Clin Immunol. 1999;103(3):520-8.
2. Scheurer S, Lauer I, Foetisch K, San Miguel Moncin M, Retzek M, Hertz C, et al. Strong allergenicity of Pru av 3, the lipid transfer protein from cherry, is related to high stability against thermal processing and digestion. J Allergy Clin Immunol. 2004;114(4):900-7.
3. Asero R, Mistrello G, Roncarolo D, Amato S, Caldironi TG, Barocci F, et al. Immuno-logical cross-reactivity between lipid transfer proteins from botanically unrelated plant-derived foods: a clinical study. Allergy. 2002;57:900-6.
4. Diaz-Perales A, Sanz ML, Garcia-Casado G, Sanchez-Monge R, Garcia-Selles FJ, Lombardero M, et al. Recombinant Pru p 3 and natural Pru p 3 a major peach allergen, show equivalent immunologic reactivity: A new tool for the diagnosis of fruit allergy. J Allergy Clin Immunol. 2003;111(3):628-33.
5. Ballmer-Weber BC. Lipid transfer proteins as a potential panallergen? Allergy. 2002;57:873-5.
6. Pasquato N, Berni R, Folli C, Folloni S, Cianci M, Pantano S, et al. Crystal structure of peach Pru p 3, the prototypic member of the family of plant non-specific lipid transfer protein pan-allergens. J Mol Biol. 2005;355:684-94.
7. Pastorello EA, Ortolani C, Baroglio C, Pravettoni V, Ispano M, Giuffrida MG, et al. Complete amino acid sequence deter-mination of the major allergen of peach (Prunus persica) Pru p 1. J Biol Chem. 1999;380:1315-20.
8. Mari A. Allergome: A platform for allergen knowledge. www.allergome.org (accessed May 2008).
9. Chenna R, Sugawara H, Koike T, Lopez R, Gibson TJ, Higgins DG, et al. Multiple sequence alignment with the Clustal series of programs. Nucleic Acids Res. 2003 Jul 1; 31(13):3497-500.
1.2
84
2.5
84
>100
50
100
17.5
3.5
0.35
<0.1
Patient 1
sIg
E co
nce
ntr
atio
n (
kU/L
)
Patient 2 Patient 3


2.6
87
AbstractBackground: Pollen–food syndrome (PFS) is an allergic condition in which sensitized individuals react to homologous allergenic molecules in pollens and plant-derived foods. To better understand cross-reactivity between fruits of the Rosaceae family, we investigated the pathogenesis-related protein class 10 (PR-10) allergens Mal d 1 (apple) and Pru av 1 (cherry). These recombinant molecular aller-gens (rMal d 1 and rPru av 1)* were evaluated with the IMMULITE® 2000 3gAllergyTM assay for PFS allergy diagnosis.
Methods: rMal d 1 and rPru av 1 were cloned and expressed in baculovirus, isolated, and purified to homogeneity by column chroma-tography. Patient sera, selected on the basis of positive clinical histories and/or skin test results for Rosaceae fruit or pollen allergens, were evaluated for immunoreactivity to the recombinant allergenic molecules and to natural allergenic whole extracts using the 3gAllergy assay. Standardized inhibition studies to confirm the allergenic molecule responsible for the cross-reactivity were performed by preincubating the sera with extract or recombinant allergens.
Results: Purified rMal d 1 and rPru av 1 each appeared as a single band on SDS-PAGE (MW = ~18 kDa). Both proteins were recog-nized by specific monoclonal antibodies on Western blot analysis. IgE specific to the individual allergenic proteins and the corre-sponding extracts were measured with the IMMULITE 2000 3gAllergy assay. Eighty percent of the patient sera positive for apple extract were also positive for rMal d 1, and 75% of the patient sera positive for cherry extract were also positive for rPru av 1. Greater than 90% inhibition of both allergens was achieved using rMal d 1 and rPru av 1 as inhibitors.
Conclusion: Molecular allergens Mal d 1 and Pru av 1 are among the major causes of allergic reactions to Rosaceae. Component-resolved diagnosis may be a useful tool in allergy diagnosis and could be used by physi-cians in the management of patients with PFS and to understand allergen cross-reactivity.
* In development
BackgroundPollen–food syndrome (PFS) is an allergic condition in which sensitized individuals react to homologous allergenic molecules in pollens and plant-derived foods. Approximately 50 to 93 percent of birch pollen–allergic patients suffer from concomitant allergic reactions to fruits, nuts and vegetables.1 Bet v 1, the major birch pollen allergen, has been identified as the primary sensitizer, eliciting specific IgE antibodies (sIgE) that cross-react with similar conformational IgE epitopes present in homologous food proteins. Pru av 1 and Mal d 1 are two well-characterized Bet v 1 homologues. Structural similarities help explain their cross-reactivity, even though sequence identity between Pru av 1 or Mal d 1 and Bet v 1 is limited (59 and 57 percent, respectively). The tertiary structure of Pru av 1 has been determined by heteronu-clear multidimensional NMR spectroscopy as virtually identical to that of Bet v 1.2 The IgE cross-reactivity of Bet v 1 and its food homo-logues was shown to correlate predominantly with conformational epitopes and the integ-rity of the tertiary fold.3,4 Although the tertiary structure of Mal d 1 has not been determined in detail, it has been shown that 75 percent of its surface binds anti-Bet v 1 antibodies, even though its sequence identity is 57 percent.5 To better understand how the cross-reactivity between fruits of the Rosaceae family relates to IgE determination in vitro, we investigated recombinant pathogenesis-related class 10 (PR-10) allergens rMal d 1 and rPru av 1 for use in the IMMULITE 2000 3gAllergy assay as tools for PFS allergy diagnosis.
Evaluation of Recombinant PR-10 Allergens rMal d 1 and rPru av 1: Diagnostic Tools for Allergen Cross-reactivityMarañón MJ1, Huynh K1, Poladian M1, Evangelista R1, Drummond A1, Lopez M1, Jaggi K1, Davoudzadeh D1, Scala E2, Bernardi ML2, Mari A2, Hovanec-Burns D1, Banik U1
1Siemens Healthcare Diagnostics, Los Angeles, CA, US2CACeS, IDI-IRCCS, Allergy Data Laboratories sc, Latina, Rome, Italy

MethodsRecombinant isozymes of Mal d 1 (Mal d 1.0102, apple) and Pru av 1 (1.0101, cherry) were cloned and expressed in baculovirus and purified to homogeneity by ion-exchange and size-exclusion chromatography. Purity was determined by SDS-PAGE and MALDI-TOF analysis. The purified proteins were biotiny-lated for use in the IMMULITE 2000 3gAllergy assay. The immunoreactivity of the recom-binant allergens was checked before and after biotinylation on Western blot against specific monoclonal antibodies (anti–PR-10) and patient sera. Patient sera, selected on the basis of a positive clinical history for food and pollen allergy, were evaluated using the IMMULITE 2000 3gAllergy assay. Standardized inhibition studies for immunoreactivity were performed by preincubating serum sepa-rately with rMal d 1 or rPru av 1 and assaying against rMal d 1, rPru av 1 and the corre-sponding whole extract (F49 for r Mal d 1 and F242 for rPru av 1). Percent inhibition was calculated for each allergen and compared with a positive control.
ResultsPurified rMal d 1 and rPru av 1 each appeared as a major protein band with an apparent molecular weight of ~18 kDa on SDS-PAGE (Figure 1, a and d, respectively). The immunoreactivity of both biotinylated and unbiotinylated rMal d 1 and rPru av 1, respectively, were compared (Figure 1, b and e) on Western blot. Biotin incorpora-tion was also verified by Western blot using alkaline phosphatase–conjugated strepta-vidin (Figure 1, c and f). Both rMal d 1 and rPru av 1 exhibited apparent molecular weights greater than those calculated from their corresponding amino acid sequences. As expected, biotinylation increased their apparent molecular weight but did not affect their immunoreactivity.
Figure 1. (a and d) SDS-PAGE, (b and e) Western blot using PR-10 mAb (5F4), and (c and f) Western blot using alkaline phosphatase–conjugated streptavidin with 10 µg purified rMal d 1 and rPru av 1 per lane, respectively. In each figure, lane 1 is MW marker, lane 2 is unbiotinylated rMal d 1 (a through c) and unbioti-nylated rPru av 1 (d through f), and lanes 3 and 4 are increasing molar ratios of biotin (5-fold for lane 3 and 10-fold for lane 4) to rMal d 1 and rPru av 1 (a through f).
Sequence alignment of the major allergens of cherry and apple—Pru av 1 (isoform Pru av 1.0101) and Mal d 1 (isoform Mal d 1.0102), respectively—accessed through allergome.org6 and performed using the ClustalW7 program, showed an 84 percent sequence homology between these two PR-10 allergens (Figure 2).
2.6
88
250 –
98 –64 –50 –
36 –
30 –
16–
6 –
1 2 3 4
a.
250 –
98 –64 –50 –
36 –
30 –
16–
6 –1 2 3 4
d.
250 –
98 –64 –50 –
36 –
30 –16–
6 –
1 2 3 4
b.
250 –
98 –64 –50 –
36 –
30 –
16–
6 –
1 2 3 4
e.
250 –
98 –64 –
50 –
36 –
30 –
16–
6 –
1 2 3 4
c.
250 –
98 –64 –
50 –
36 –
30 –
16–
6 –
1 2 3 4
f.
rMal d 1
rPru av 1
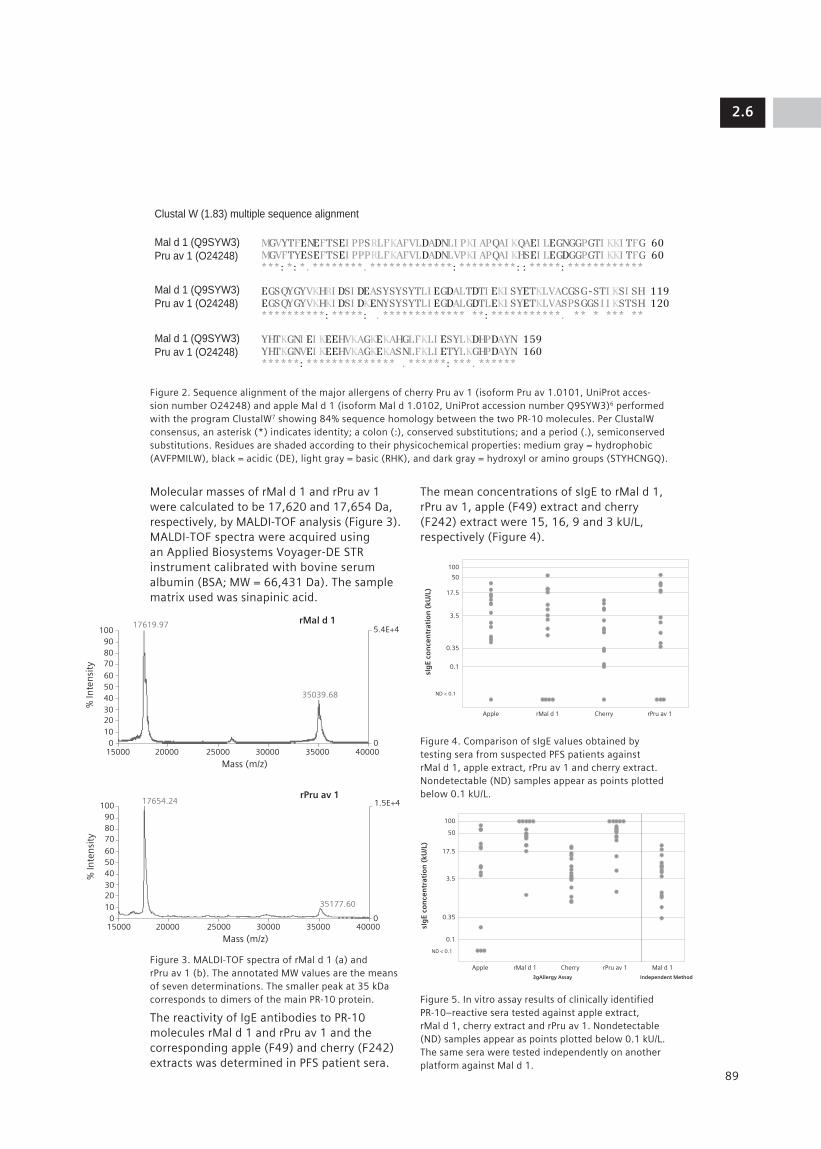
Molecular masses of rMal d 1 and rPru av 1 were calculated to be 17,620 and 17,654 Da, respectively, by MALDI-TOF analysis (Figure 3). MALDI-TOF spectra were acquired using an Applied Biosystems Voyager-DE STR instrument calibrated with bovine serum albumin (BSA; MW = 66,431 Da). The sample matrix used was sinapinic acid.
Figure 3. MALDI-TOF spectra of rMal d 1 (a) and rPru av 1 (b). The annotated MW values are the means of seven determinations. The smaller peak at 35 kDa corresponds to dimers of the main PR-10 protein.
The reactivity of IgE antibodies to PR-10 molecules rMal d 1 and rPru av 1 and the corresponding apple (F49) and cherry (F242) extracts was determined in PFS patient sera.
The mean concentrations of sIgE to rMal d 1, rPru av 1, apple (F49) extract and cherry (F242) extract were 15, 16, 9 and 3 kU/L, respectively (Figure 4).
Figure 4. Comparison of sIgE values obtained by testing sera from suspected PFS patients against rMal d 1, apple extract, rPru av 1 and cherry extract. Nondetectable (ND) samples appear as points plotted below 0.1 kU/L.
Figure 5. In vitro assay results of clinically identified PR-10–reactive sera tested against apple extract, rMal d 1, cherry extract and rPru av 1. Nondetectable (ND) samples appear as points plotted below 0.1 kU/L. The same sera were tested independently on another platform against Mal d 1.
2.6
89
Figure 2. Sequence alignment of the major allergens of cherry Pru av 1 (isoform Pru av 1.0101, UniProt acces-sion number O24248) and apple Mal d 1 (isoform Mal d 1.0102, UniProt accession number Q9SYW3)6 performed with the program ClustalW7 showing 84% sequence homology between the two PR-10 molecules. Per ClustalW consensus, an asterisk (*) indicates identity; a colon (:), conserved substitutions; and a period (.), semiconserved substitutions. Residues are shaded according to their physicochemical properties: medium gray = hydrophobic (AVFPMILW), black = acidic (DE), light gray = basic (RHK), and dark gray = hydroxyl or amino groups (STYHCNGQ).
MGVYTFENEFTSEI PPSRLFKAFVLDADNLI PKI APQAI KQAEI LEGNGGPGTI KKI TFG 60MGVFTYESEFTSEI PPPRLFKAFVLDADNLVPKI APQAI KHSEI LEGDGGPGTI KKI TFG 60***: *: *. ********. *************: *********: : *****: ************
EGSQYGYVKHRI DSI DEASYSYSYTLI EGDALTDTI EKI SYETKLVACGSG-STI KSI SH 119EGSQYGYVKHKI DSI DKENYSYSYTLI EGDALGDTLEKI SYETKLVASPSGGSI I KSTSH 120**********: *****: . ************* **: ***********. ** * *** **
YHTKGNI EI KEEHVKAGKEKAHGLFKLI ESYLKDHPDAYN 159YHTKGNVEI KEEHVKAGKEKASNLFKLI ETYLKGHPDAYN 160******: ************** . ******: ***. ******
Clustal W (1.83) multiple sequence alignment
Mal d 1 (Q9SYW3)
Pru av 1 (O24248)
Mal d 1 (Q9SYW3)
Pru av 1 (O24248)
Mal d 1 (Q9SYW3)
Pru av 1 (O24248)
rMal d 1
rPru av 1
Mass (m/z)
Mass (m/z)
100908070
605040302010
0
100908070
605040302010
0 0
0
5.4E+4
1.5E+4
15000 20000 25000 30000 35000 40000
15000 20000
17654.24
35177.60
17619.97
35039.68
25000 30000 35000 40000
50
100
17.5
3.5
0.35
0.1
ND < 0.1
Apple
sIg
E co
nce
ntr
atio
n (
kU/L
)
rMal d 1 Cherry rPru av 1
50
100
17.5
3.5
0.35
0.1
ND < 0.1
Apple
sIg
E co
nce
ntr
atio
n (
kU/L
)
rMal d 1
3gAllergy Assay Independent Method
Mal d 1Cherry rPru av 1
rMal d 1
rPru av 1
Mass (m/z)
Mass (m/z)
100908070
605040302010
0
100908070
605040302010
0 0
0
5.4E+4
1.5E+4
15000 20000 25000 30000 35000 40000
15000 20000
17654.24
35177.60
17619.97
35039.68
25000 30000 35000 40000
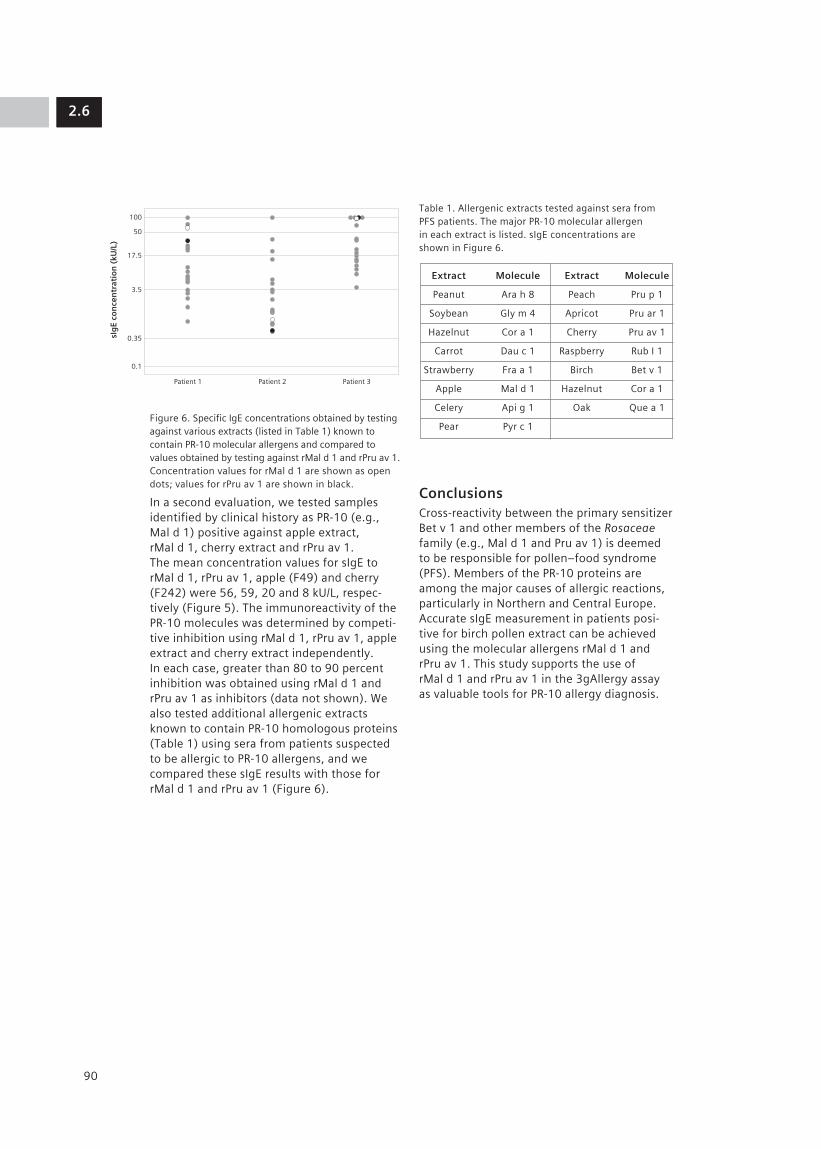
Figure 6. Specific IgE concentrations obtained by testing against various extracts (listed in Table 1) known to contain PR-10 molecular allergens and compared to values obtained by testing against rMal d 1 and rPru av 1. Concentration values for rMal d 1 are shown as open dots; values for rPru av 1 are shown in black.
In a second evaluation, we tested samples identified by clinical history as PR-10 (e.g., Mal d 1) positive against apple extract, rMal d 1, cherry extract and rPru av 1. The mean concentration values for sIgE to rMal d 1, rPru av 1, apple (F49) and cherry (F242) were 56, 59, 20 and 8 kU/L, respec-tively (Figure 5). The immunoreactivity of the PR-10 molecules was determined by competi-tive inhibition using rMal d 1, rPru av 1, apple extract and cherry extract independently. In each case, greater than 80 to 90 percent inhibition was obtained using rMal d 1 and rPru av 1 as inhibitors (data not shown). We also tested additional allergenic extracts known to contain PR-10 homologous proteins (Table 1) using sera from patients suspected to be allergic to PR-10 allergens, and we compared these sIgE results with those for rMal d 1 and rPru av 1 (Figure 6).
Table 1. Allergenic extracts tested against sera from PFS patients. The major PR-10 molecular allergen in each extract is listed. sIgE concentrations are shown in Figure 6.
ConclusionsCross-reactivity between the primary sensitizer Bet v 1 and other members of the Rosaceae family (e.g., Mal d 1 and Pru av 1) is deemed to be responsible for pollen–food syndrome (PFS). Members of the PR-10 proteins are among the major causes of allergic reactions, particularly in Northern and Central Europe. Accurate sIgE measurement in patients posi-tive for birch pollen extract can be achieved using the molecular allergens rMal d 1 and rPru av 1. This study supports the use of rMal d 1 and rPru av 1 in the 3gAllergy assay as valuable tools for PR-10 allergy diagnosis.
1.22.6
90
50
100
17.5
3.5
0.35
0.1
Patient 1 Patient 2 Patient 3
sIg
E co
nce
ntr
atio
n (
kU/L
)
Extract Molecule Extract Molecule
Peanut Ara h 8 Peach Pru p 1
Soybean Gly m 4 Apricot Pru ar 1
Hazelnut Cor a 1 Cherry Pru av 1
Carrot Dau c 1 Raspberry Rub I 1
Strawberry Fra a 1 Birch Bet v 1
Apple Mal d 1 Hazelnut Cor a 1
Celery Api g 1 Oak Que a 1
Pear Pyr c 1

References 1. Wuthrich B, Schindler C, Leuenberger P,
Ackermann-Liebrich U. Prevalence of atopy and pollinosis in the adult population of Switzerland (SAPALDIA study). Swiss Study on Air Pollution and Lung Diseases in Adults. Int Arch Allergy Immunol. 1995 Feb;106(2):149-56.
2. Schweimer K, Slicht H, Nerkamp J, Boehm M, Breitenbach M, Vieths S, et al. NMR spectro-scopy reveals common structural feature of the birch pollen Bet v 1 and the cherry allergen Pru av 1. Appl Mag Reson. 1999;17(2-3):449-64.
3. Neudecker P, Lehmann K, Nerkamp J, Haase T, Wangorsch A, Fotisch K, et al. Mutational epitope analysis of Pru av 1 and Api g 1, the major allergens of cherry (Prunus avium) and celery (Apium graveolens): correlating IgE reactivity with three-dimensional struc-ture. Biochem J. 2003 Nov 15;376 (Pt 1):97-107.
4. Wiche R, Gubesch M, Konig H, Fotisch K, Hoffmann A, Wangorsch A, et al. Molec-ular basis of pollen-related food allergy: identification of a second cross-reactive IgE epitope on Pru av 1, the major cherry (Prunus avium) allergen. Biochem J. 2005 Jan 1;385(Pt 1):319-27.
5. Jenkins JA, Griffiths-Jones S, Shewry PR, Breiteneder H, Mills EN. Structural related-ness of plant food allergens with specific reference to cross-reactive allergens: an in silico analysis. J Allergy Clin Immunol. 2005 Jan;115(1):163-70.
6. Mari A. Allergome: A platform for allergen knowledge. www.allergome.org (accessed May 2008).
7. Chenna R, Sugawara H, Koike T, Lopez R, Gibson TJ, Higgins DG, et al. Multiple sequence alignment with the Clustal series of programs. Nucleic Acids Res. 2003 Jul 1; 31(13):3497-500.
1.2
91
2.6


2.7
93
AbstractBackground: Pollen–food syndrome (PFS) is an allergic condition in which sensitized individuals react to homologous allergenic molecules in pollens and plant-derived foods. PFS patients may exhibit reactions to multiple related foods. To better understand cross-reactivity between fruits of the Rosaceae family and other plant-derived foods, we studied the IgE reactivity to the recombinant profilin, rPru av 4.
Method: Samples known to be positive to profilins (Bet v 2, Hev b 8, and Phl p 12) were evaluated for specific IgE to rPru av 4, cherry fruit and birch pollen allergens using the IMMULITE® 2000 3gAllergy™ assay. Addition-ally, samples with suspected PFS, selected on the basis of positive clinical histories and/or positive skin test results for fruit allergy, were also evaluated using rPru av 4 and various allergens of the Rosaceae family. Inhibition studies with rPru av 4 and cherry extract were performed on selected samples. rPru av 4 was expressed in E. coli. Its amino acid sequence, derived from cDNA, was greater than 98% identical to published sequences. rPru av 4 was purified to homogeneity by affinity chro-matography and chemically modified for use in the 3gAllergy assay.
Results: Purified rPru av 4 had an apparent MW = 14 kDa on SDS-PAGE and reacted with specific monoclonal antibodies on Western blot. IgE specific to rPru av 4, cherry, and birch allergens was measured and showed 100% qualitative agreement with the known profilin-positive samples. Greater than 90% inhibition was achieved using rPru av 4 as the inhibitor.
Conclusions: The recombinant profilin cherry allergen rPru av 4 is a highly sensi-tive diagnostic tool, as determined in the 3gAllergy assay, and can be used by physi-cians to detect patients with cross-reactive profilin sensitization.
IntroductionRecombinant allergens provide new oppor-tunities to define the diagnostic procedures used for determining IgE-mediated allergy. Using recombinant DNA technology, we developed one such cross-reactive cherry profilin allergen (rPru av 4) for designing improved tests that can address clinical and immunological questions. Profilins are cross-reactive plant allergens (Figure 1) responsible for multiple pollen sensitization and pollen-associated food allergy. Our objective was to characterize patient IgE reactivity to rPru av 4 and compare this with corresponding reac-tivity to the cherry allergen extract to develop a tool that can be used to address allergen cross-reactivity.
Development of Recombinant Cherry Profilin rPru av 4 Allergen: An Emerging Tool for Investigating Cross-reactivityBanik U1, Marañón MJ1, Poladian M1, Drummond A1, Lopez M1, Jaggi K1, Davoudzadeh D1, Giani M2, Fantini R2, Mari A2, Hovanec-Burns D1
1Siemens Healthcare Diagnostics, Los Angeles, CA, US 2CACeS, IDI-IRCCS, Allergy Data Laboratories sc, Latina, Rome, Italy
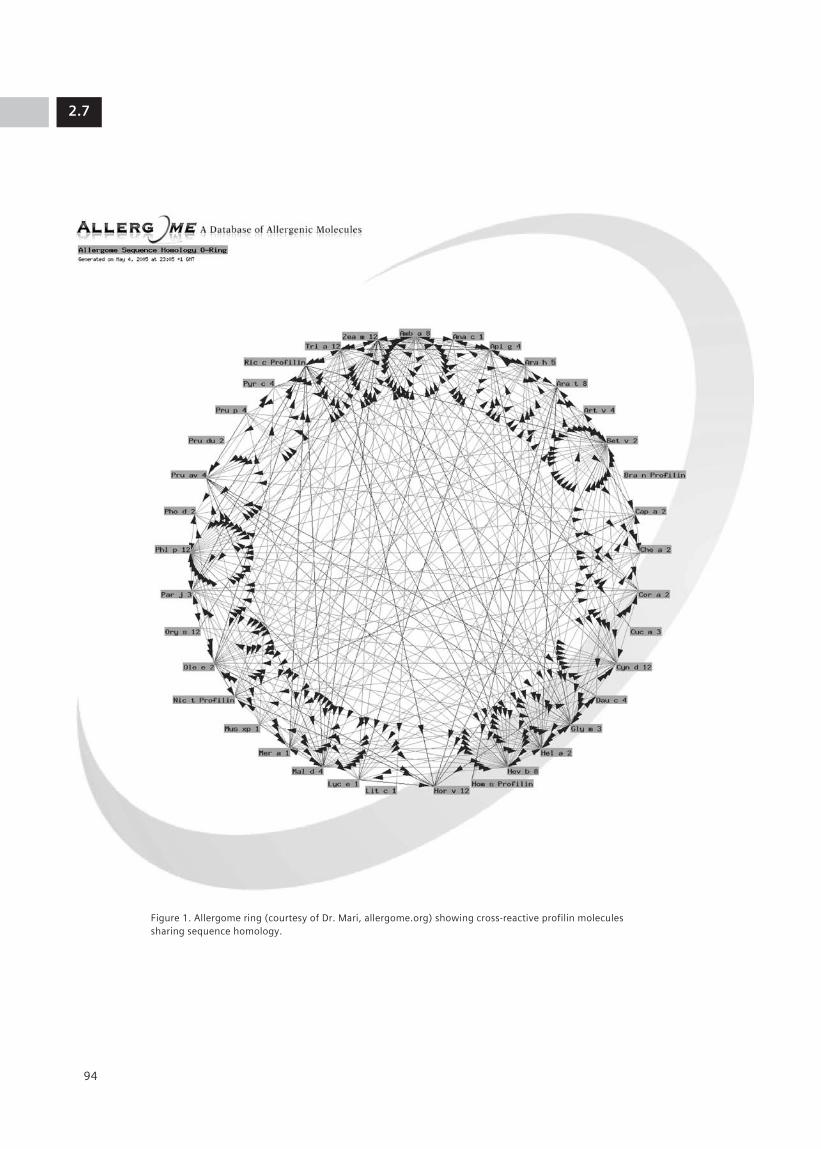
Figure 1. Allergome ring (courtesy of Dr. Mari, allergome.org) showing cross-reactive profilin molecules sharing sequence homology.
2.7
94

MethodsRecombinant rPru av 4 was cloned and expressed in E. coli, then purified to homoge-neity by affinity chromatography. Purity was determined by SDS-PAGE and MALDI-TOF. Measurement of allergen-specific IgE in patient sera was performed in separate trials using the IMMULITE 2000 3gAllergy assay in the pres-ence of biotinylated rPru av 4, cherry extract (F242) and other allergen extracts that are known to contain profilin. Competitive inhibi-tion tests were carried out after preincubating positive sera with excess unbiotinylated rPru av 4 allergen followed by incubation at ambient temperature for 1 hour. Percent inhibition was calculated for each allergen and compared to a positive control.
ResultsBiochemical characterization of rPru av 4 is shown in Figure 2. Purity was assessed at >95%.
Figure 2. (a) SDS-PAGE with 5 µg/mL of purified rPru av 4 per lane. In all cases, lane 2 shows the unmodi-fied protein, while lanes 3 and 4 show the addition of increasing molar ratios of biotin. (b) Western blot showing the reactivity between rPru av 4 and a mono-clonal antibody specific for Pru av 4 raised in-house. Alkaline phosphatase–conjugated goat-anti mouse IgG was used as the secondary antibody. (c) The reactivity between the native and the biotinylated rPru av 4 was determined by Western blot analysis using alkaline phosphatase–conjugated streptavidin. (d) MALDI-TOF spectrum of rPru av 4 acquired using an Applied Biosys-tems Voyager DE STR instrument (Foster City, California) calibrated using bovine serum albumin (MW = 66.4kDa). The sample matrix used was α-cyano-4-hydroxycinnamic acid (CHCA). The annotated molecular weight was deter-mined as the mean of seven measurements.
The MALDI-TOF results are consistent with the MW of rPru av 4.
The reactivity of IgE antibodies to profilin (in this case, rPru av 4) and corresponding Rosaceae fruit extracts cherry (F242), peach (F95) and apricot (F237) in sera from PFS patients was determined. The concentrations of specific IgE were calculated to have mean dose values of 37 kU/L to rPru av 4, 9 kU/L to cherry, 20 kU/L to peach and 8 kU/L to apricot (Figure 3). Higher mean dose values for rPru av 4 could have occurred for several reasons and further studies are in progress.
Figure 3. Specific IgE to rPru av 4, cherry (F242), peach (F95) and apricot (F237) comparison using suspected PFS patient sera. Points below 0.1 kU/L indicate samples with nondetectable (ND) amounts of sIgE.
In a second evaluation, we tested samples clinically identified as profilin positive (Bet v 2, Hev b 8 and Phl p 12) and compared them with birch extract, cherry extract, and rPru av 4. The results obtained confirmed similar reactivity between these two extracts (mean dose values of 10 and 3 kU/L, respec-tively). As in the first evaluation, a higher mean dose value was obtained for rPru av 4 (45 kU/L, Figure 4).
2.7
95
250 –
98 –64 –50 –
36 –30 –16–6 –
250 –
98 –64 –50 –
36 –30 –16–6 –
1 2 31 2 3
250 –
98 –64 –50 –
36 –30 –16–6 –
1 2 3
a. b. c.
Mass (m/z)
% In
ten
sity
6000
16268
32546
4871965145
12800 19600 26400 33200 40000
100
80
60
40
20
0
5.1E+4
0
100
50
17.5
3.5
0.35
0.10
Peach
Spec
ific
IgE,
kU
/L
Apricot Cherry rPru av 4
d.

Figure 5. Specific IgE to various extracts (listed in Table 1) known to contain profilin allergen and compared with rPru av 4 using three proflilin- suspected sera. The dose values for rPru av 4 are shown in black.
Because rPru av 4 produced higher mean dose responses compared to other extracts in general, we spiked the cherry extract with rPru av 4, resulting in an average increase in dose values of 74% (Figure 6), suggesting that cherry-allergic patients are more likely to be reactive to profilin.
Figure 6. Effect of spiking rPru av 4 into cherry extract (F242) using sera from suspected FPS patients. The graph shows the percent change in specific IgE concen-tration in the presence of rPru av 4.
1.22.7
96
Figure 4. In vitro assay results of clinically identified profilin reactive serum tested against rPru av 4, cherry (F242) and birch (T3). The same serum was tested independently on another platform for other profilin allergens (Bet v 2, Hev b 8 and Phl p 12).
We also tested additional allergenic extracts known to contain profilin molecules using sera from patients suspected to be allergic to profilin (Table 1).
Table 1. Allergenic extracts tested against sera from patients suspected to be allergic to profilin.
The mean dose value of these allergens was between 4 and 7 kU/L for each of these sera. As before, higher dose values for rPru av 4 (29, 87, and 16 kU/L) were found in these sera (Figure 5).
100
50
17.5
3.5
0.35
0.10
Birch Cherry rPru av 4 Bet v 2 Hev b 8 Phl p 12
Spec
ific
IgE,
kU
/L
3gAllergy Independent method
100
50
17.5
3.5
0.35
0.1
Sample 1 Sample 2 Sample 3
Spec
ific
IgE,
kU
/L
100
80
60
40
20
0
–20
–40
% C
han
ge
Extract Profilin Extract Profilin Extract Profilin molecule molecule molecule
Peanut Ara h 5 Soybean Gly m 3 Hazelnut Cor a 2
Pineapple Ana c 1 Orange Cit s 2 Apple Mal d 4
Melon Cuc m 2 Banana Mus xp 1 Pear Pyr c 4
Peach Pru p 4 Date plum Pho d 2 Olive Ole e 2
Tomato Lyc e 1 Green pepper Cap a 2 Carrot Dau c 4
Celery Api g 4 Rice Ory s 12 Barley Hor v 12
Wheat Tri a Bermuda Cyn d 12 Timothy Phl p 12 profilin grass grass
Sunflower Hel a 2 Birch Bet v 2 Ragweed Amb a 8
Lamb’s Che a 2 Parietaria Par j 3 Mugwort Art v 1/
quarters judaica Art v 4

The immunoreactivity of the rPru av 4 mole-cule was determined by competitive inhibition using rPru av 4 and cherry extract (F242). Inhibition exceeding 99% for rPru av 4 and 52% for cherry extract was measured using rPru av 4 (426 µg/mL) as an inhibitor (Figure 7). The lower inhibition of cherry extract by rPru av 4 is probably due to the presence of other allergenic molecules in the extract.
Figure 7. Competitive inhibition study of rPru av 4 on cherry extract (F242).
ConclusionThe large amount of cross-reactivity between plant profilins justifies using a single type of profilin molecule for diagnosis. However, the fine specificity of IgE directed to variable epit-opes may influence the clinical manifestation of profilin sensitization. Our studies suggest cherry profilin (rPru av 4) is an IgE-binding food allergen that is cross-reactive with pollen profilin. Serum IgE of nearly half of the tested patients reacted with cherry profilin. Because most of the patients whose sera were used in this study also had polinosis, the well-known cross-reactivity between pollen and food profilins could account for this pattern of reactivity. Component-resolved diagnosis using cross-reactive profilin allergen offers a tool for understanding the severity of PFS patient symptoms and also for analyzing geographic differences.
References1. Reuter A, Lidholm J, Andersson K,
Ostling J, Lundberg M, Scheurer S, Enrique E, et al. Clin Exp Allergy. 2006 Jun;36(6):815-23.
2. Ballmer-Weber BK, Scheurer S, Fritsche P, Enrique E, Cistero-Bahima A, Haase T, Wuthrich B. Component-resolved diagnosis with recombinant allergens in patients with cherry allergy. J Allergy Clin Immunol. 2002 Jul;110(1):167-73.
1.2
97
2.7
100
rPru av 4
Cherry (F242)
80
60
40
20
0
% In
hib
itio
n
Inhibited Allergen
Immunoreactivity of rPru av 4 allergen


2.8
99
AbstractBackground: Two major allergens present in the dander of domestic animals are Fel d 1 (cat) and Can f 1 (dog). We evaluated their utility as immunodiagnostic tools and compared them with the corresponding cat and dog dander extracts.
Method: Commercially available native allergens (nFel d 1 and nCan f 1) and the corresponding extracts for cat (E1) and dog (E5) dander were used in this study. Patient sera, selected on the basis of positive clinical histories and/or skin test results for cat and dog allergens, were evaluated for immuno-reactivity to the native molecules and to the natural allergenic whole extracts using the IMMULITE® 2000 3gAllergy™ assay. Standardized inhibition studies to confirm the immunoreactivity of the allergenic molecules were performed by preincubating the sera with the native molecules and the whole extracts.
Results: nFel d 1 from cat hair showed a single broad band (glycosylation) on SDS-PAGE with an apparent MW = 15 kDa, and was recognized by specific monoclonal antibodies (MAbs) on Western blot (WB). On SDS-PAGE nCan f 1 ran as a single band with an apparent MW = 19 kDa which reacted with specific MAbs on WB. MALDI-TOF spectroscopy corrob-orated the purity of the nCan f 1. Both nFel d 1 and nCan f 1, as well as the corresponding animal dander extracts, were synthesized for use in the 3gAllergy assay. IgE specific to individual allergenic proteins and to their corresponding extracts was then measured. Agreement of 100% was obtained for nFel d 1 and nCan f 1 in comparison with E1 and E5, respectively. Competitor inhibition studies of nFel d 1 and nCan f 1 showed greater than 95% inhibition.
Conclusion: Cat nFel d 1 and dog nCan f 1 allergenic molecules have been developed as part of the 3gAllergy component-resolved diagnosis menu and can be used by physi-cians in the management of patients with allergies to animal aeroallergens.
BackgroundAirborne particles derived from house-hold dogs (Canis familiaris) or cats (Felis domesticus) are common triggers for IgE mediated allergy worldwide and significant sources of indoor allergens. Specific allergen immunotherapy has been proven effective in downregulating allergen-specific T cell responses.1 Approximately 20–30% of indi-viduals suffering from allergic asthma are positive by in vitro and/or in vivo tests to cat allergens.2 A number of proteins have been identified in whole cat dander extract: Fel d 1, Fel d 2 (cat albumin) and Fel d 3 (cystatin). Of these, however, Fel d 1 is responsible for >80% of allergic reactions and has been desig-nated the major allergen.1 Natural Fel d 1 is a noncovalently linked 38 kDa dimer consisting of two18 kDa subunits; each one is composed of a and ‚ chains encoded by two separate genes.2 A single N-glycosylation site in the β-chain is the site of protein’s heterogeneity that is produced by the addition of terminal sialic acids, fucose and β-galactose.1
The major allergens in dog dander extracts are Can f 1, Can f 2 (both salivary lipocalins) and Can f 3 (dog albumin). Lipocalins are small eight stranded anti-parallel β-barrel lipid transporters. Can f 1 is an 18 kDa protein (on SDS-PAGE approximately 21 kDa).3 Among dog-allergic subjects 45% have IgE directed exclusively to recombinant Can f 1 and 25% have IgE to both recombinant Can f 1 and Can f 2.3,4 Can f 3 is present in higher amounts in the whole dog epithelium extract than in dog dander extract.
Native Cat and Dog Allergenic Molecules nFel d 1 and nCan f 1: New Tools for Component-Resolved Allergy Diagnosis
Marañón MJ1, Banik U1, Maldonado S1, Lopez M1, Jaggi K1, Quaratino D2, Zennaro D2, Mari A2, Hovanec-Burns D1, Davoudzadeh D1
1Siemens Healthcare Diagnostics, Los Angeles, CA, US 2CACeS, IDI-IRCCS, Allergy Data Laboratories sc, Latina, Rome, Italy
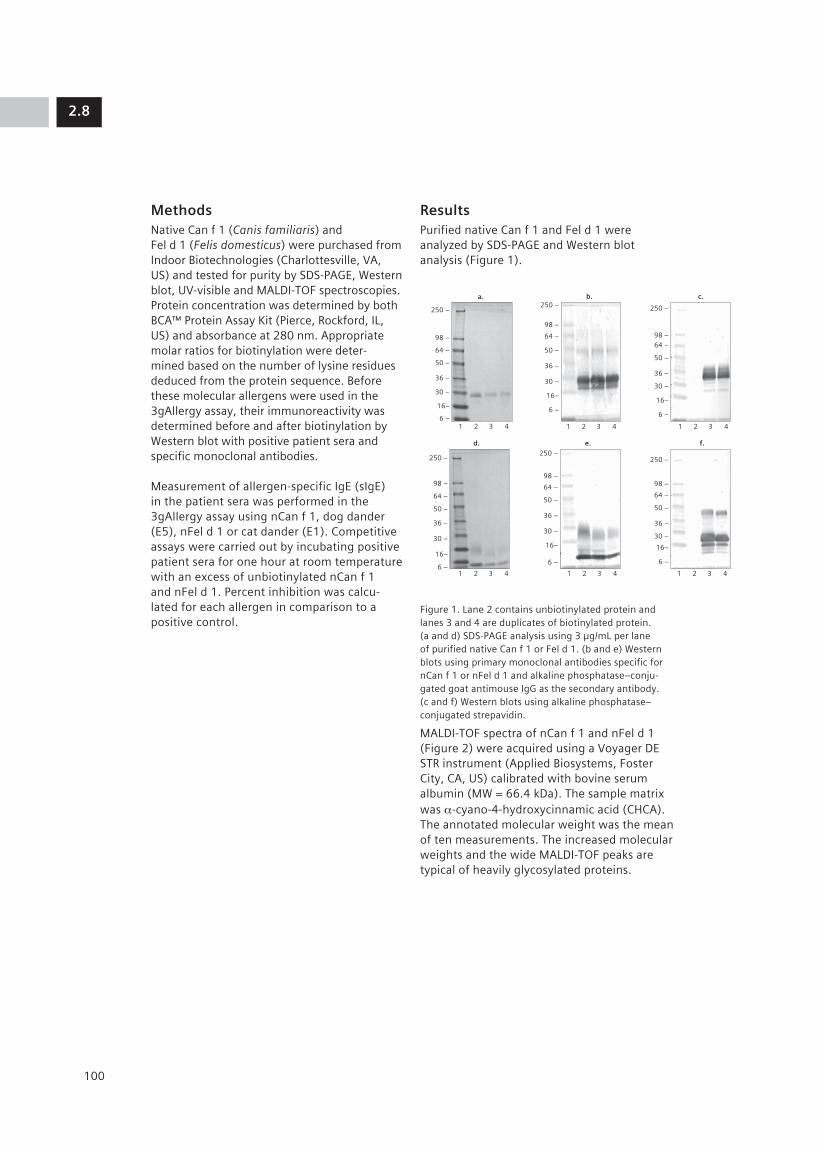
MethodsNative Can f 1 (Canis familiaris) and Fel d 1 (Felis domesticus) were purchased from Indoor Biotechnologies (Charlottesville, VA, US) and tested for purity by SDS-PAGE, Western blot, UV-visible and MALDI-TOF spectroscopies. Protein concentration was determined by both BCA™ Protein Assay Kit (Pierce, Rockford, IL, US) and absorbance at 280 nm. Appropriate molar ratios for biotinylation were deter-mined based on the number of lysine residues deduced from the protein sequence. Before these molecular allergens were used in the 3gAllergy assay, their immunoreactivity was determined before and after biotinylation by Western blot with positive patient sera and specific monoclonal antibodies.
Measurement of allergen-specific IgE (sIgE) in the patient sera was performed in the 3gAllergy assay using nCan f 1, dog dander (E5), nFel d 1 or cat dander (E1). Competitive assays were carried out by incubating positive patient sera for one hour at room temperature with an excess of unbiotinylated nCan f 1 and nFel d 1. Percent inhibition was calcu-lated for each allergen in comparison to a positive control.
ResultsPurified native Can f 1 and Fel d 1 were analyzed by SDS-PAGE and Western blot analysis (Figure 1).
Figure 1. Lane 2 contains unbiotinylated protein and lanes 3 and 4 are duplicates of biotinylated protein. (a and d) SDS-PAGE analysis using 3 µg/mL per lane of purified native Can f 1 or Fel d 1. (b and e) Western blots using primary monoclonal antibodies specific for nCan f 1 or nFel d 1 and alkaline phosphatase–conju-gated goat antimouse IgG as the secondary antibody. (c and f) Western blots using alkaline phosphatase– conjugated strepavidin.
MALDI-TOF spectra of nCan f 1 and nFel d 1 (Figure 2) were acquired using a Voyager DE STR instrument (Applied Biosystems, Foster City, CA, US) calibrated with bovine serum albumin (MW = 66.4 kDa). The sample matrix was α-cyano-4-hydroxycinnamic acid (CHCA). The annotated molecular weight was the mean of ten measurements. The increased molecular weights and the wide MALDI-TOF peaks are typical of heavily glycosylated proteins.
2.8
100
250 –
98 –
64 –
50 –
36 –
30 –
16–
6 –1 2 3 4
a.250 –
98 –
64 –
50 –
36 –
30 –
16–
6 –
1 2 3 4
b.
250 –
98 –64 –
50 –
36 –
30 –
16–
6 –
1 2 3 4
c.
250 –
98 –
64 –
50 –
36 –
30 –
16–
6 –1 2 3 4
d.250 –
98 –
64 –
50 –
36 –
30 –
16–
6 –
1 2 3 4
e.
250 –
98 –
64 –
50 –
36 –
30 –
16–
6 –
1 2 3 4
f.
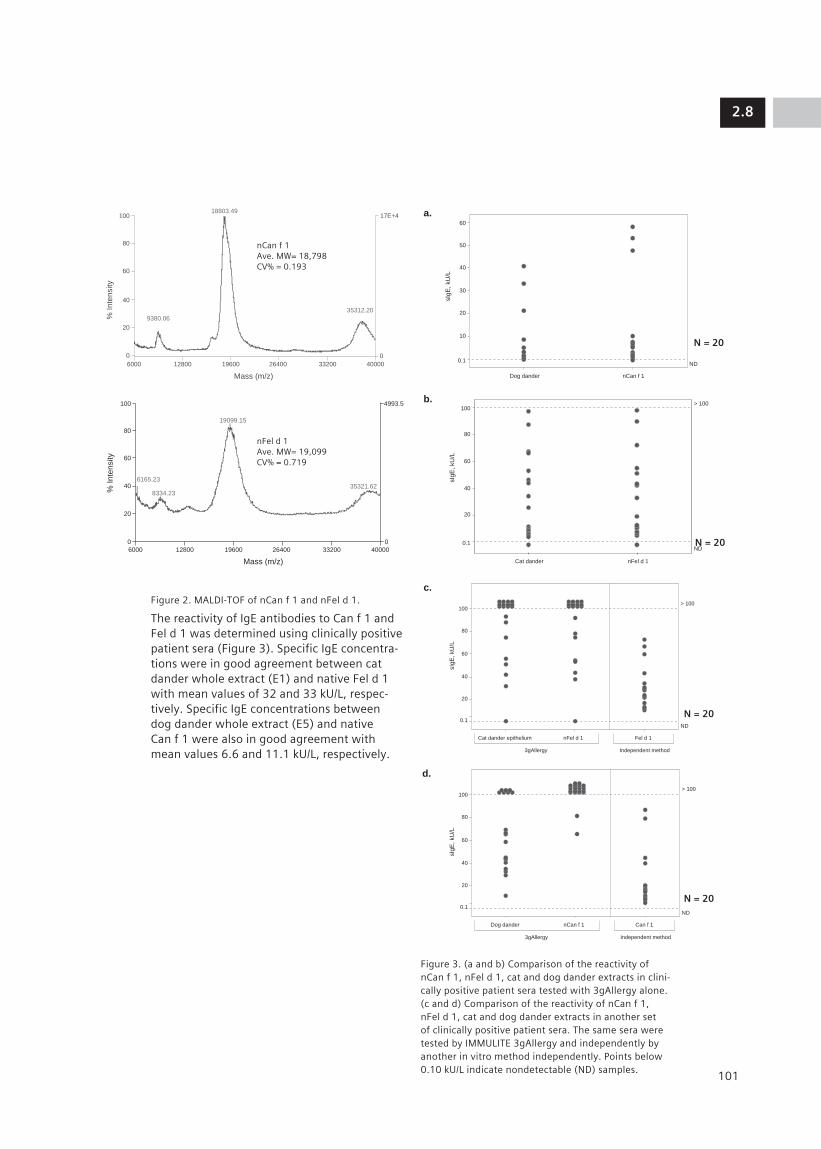
Figure 2. MALDI-TOF of nCan f 1 and nFel d 1.
The reactivity of IgE antibodies to Can f 1 and Fel d 1 was determined using clinically positive patient sera (Figure 3). Specific IgE concentra-tions were in good agreement between cat dander whole extract (E1) and native Fel d 1 with mean values of 32 and 33 kU/L, respec-tively. Specific IgE concentrations between dog dander whole extract (E5) and native Can f 1 were also in good agreement with mean values 6.6 and 11.1 kU/L, respectively.
Figure 3. (a and b) Comparison of the reactivity of nCan f 1, nFel d 1, cat and dog dander extracts in clini-cally positive patient sera tested with 3gAllergy alone. (c and d) Comparison of the reactivity of nCan f 1, nFel d 1, cat and dog dander extracts in another set of clinically positive patient sera. The same sera were tested by IMMULITE 3gAllergy and independently by another in vitro method independently. Points below 0.10 kU/L indicate nondetectable (ND) samples.
2.8
101
Mass (m/z)
% Inte
nsity
6000 12800 19600 26400 33200 40000
100
80
60
40
20
0
17E+4
0
9380.06
18803.49
35312.20
60
sIg
E,
kU
/L
40
50
30
20
10
0.1ND
Dog dander nCan f 1
100
80
sIg
E, kU
/L
60
40
20
0.1
ND
> 100
Cat dander epithelium nFel d 1 Fel d 1
3gAllergy Independent method
Mass (m/z)
% I
nte
nsity
6000 12800 19600
19099.15
35321.62
6165.23
8334.23
26400 33200 40000
100
80
60
40
20
0
4993.5
0
100> 100
sIg
E,
kU
/L
60
80
40
20
0.1
ND
Cat dander nFel d 1
100
80
sIg
E,
kU
/L
60
40
20
0.1
ND
> 100
Dog dander nCan f 1 Can f 1
3gAllergy Independent method
a.
c.
b.
d.
N = 20
N = 20
N = 20
N = 20
nCan f 1Ave. MW= 18,798CV% = 0.193
nFel d 1Ave. MW= 19,099CV% = 0.719

The immunoreactivity of the molecular aller-gens nCan f 1 and nFel d 1 was determined by competitive inhibition with the cat and dog dander extracts (Figure 4). Competitive inhibi-tion was carried out by preincubating patient sera with purified nCan f 1 or nFel d 1 and assaying it against nCan f 1 or nFel d 1 and the corresponding whole extracts (cat or dog). Native Can f 1 and Fel d 1 showed greater than 90% inhibition. Cat dander extract showed greater than 90% inhibition with nFel d 1, while dog dander extract showed only 33% inhibition with nCan f 1. This low inhibition may be consistent with the pres-ence of additional relevant allergens such as Can f 3 (dog albumin) and Can f 2 in dog dander extract.
Figure 4. Competitive inhibition study using nCan f 1 and nFel d 1 as inhibitors.
Conclusions• Native Can f 1 and Fel d 1 have been char-
acterized using biochemical, immunological and biophysical methods.
• The major molecular allergens nCan f 1 and nFel d 1 are useful tools for diagnosing, identifying and managing patient with allergies caused by domestic animals.
• The incomplete inhibition of the dog dander whole extract by the major known allergen, Can f 1, suggests the presence of additional major allergenic components in dog dander extract.
• The correlation between the sIgE levels in sera tested with the whole animal extract and the corresponding major purified molecular allergen provides good evidence to support the use of molecular allergens for in vitro diagnosis.
References1. Gronlund H, Bergman T, Sandstrom K,
Alvelius G, Reininger R, Verdino P, et al. Formation of disulfide bonds and homodi-mers of the major cat allergen Fel d 1 equivalent to the natural allergen by expression in Escherichia coli. J Biol Chem. 2003 Oct 10;278(41):40144-51.
2. Seppala U, Hagglund P, Wurtzen PA, Ipsen H, Thorsted P, Lenhard T, et al. Molecular characterization of major cat allergen Fel d 1: expression of heterodimer by use of a baculovirus expression system. J Biol Chem. 2005 Feb 4;280(5):3208-16.
3. Ford AW, Kemeny DM.The allergens of dog. II. Identification and partial purification of a major dander allergen. Clin Exp Allergy. 1992 Aug;22(8):793-803.
4. Konieczny A, Morgenstern JP, Bizinkauskas CB, Lilley CH, Brauer AW, Bond JF, et al. The major dog allergens, Can f 1 and Can f 2, are salivary lipocalin proteins: cloning and immu-nological characterization of the recombinant forms. Immunology. 1997 Dec;92(4):577-86.
2.8
102
100
80
60
40
20
nCan f 1
% I
nh
ibitio
n
Dog dander (E5) nFel d 1 Cat dander (E1)
0
nCan f 1, inhibitor nFel d 1 1, inhibitor


2.9
105
AbstractBackground: The major allergens of house dust mite groups 1 and 2, Der f 1 and Der f 2 (Dermatophagoides farinae) and Der p 1 and Der p 2 (Dermatophagoides pteronyssinus), are a major cause of allergies worldwide. We evaluated their utility as immunodiagnostic tools and compared them with the corre-sponding mite extracts.
Method: Commercially available native mite allergens nDer p 1, nDer p 2, nDer f 1 and nDer f 2 and the corresponding extracts of D. pteronyssinus (D1) and D. farinae (D2) were developed and compared with respect to their IgE reactivity using the IMMULITE® 2000 3gAllergy™ assay. Patient sera were selected on the basis of positive clinical histories and/or skin test results for mite allergens. Chimeric Der p 2 IgE MAb was used to evaluate the immunoreactivity to nDer p 2 and to the natural extract of D1. Standardized inhibition studies to confirm the immunoreactivity of each allergenic molecule were performed by preincubating the sera with native allergens and the whole extract.
Results: Purified nDer p 1 and nDer f 1 ran as single bands of apparent MW = 33 kDa (calcu-lated MW = 24 kDa), while purified nDer p 2 and nDer f 2 ran as single bands of apparent MW = 14 kDa on SDS-PAGE. Purity of nDer p 2 and nDer f 2 was also determined by MALDI-TOF. Reactivity to the mite allergens was determined by inhibition studies: greater than 95% inhibition was achieved using the nDer p 1, nDer p 2, nDer f 1 and nDer f 2. Multiple serum evaluation studies demon-strated IgE reactivity similar for both the native molecules and the D1 and D2 allergenic extracts. Similar recoveries were obtained for both D1 extract and nDer p 2 by chimeric Der p 2 IgE MAb.
Conclusion: Four major native mite allergenic molecules have been developed as part of component-resolved allergy diagnosis.
They can be used by physicians for managing patients with allergies to indoor mite aeroaller-gens and for the immunological monitoring of immunotherapy.
IntroductionThe house dust mites (HDM) Dermatophagoides pteronyssinus (D1) and Dermatophagoides farinae (D2) are among the most frequent and potent allergen sources and are also important risk factors for asthma and atopic dermatitis. Native allergenic molecules from HDM provide additional tools for allergy diagnosis and immu-notherapy. Using purified native mite allergenic molecules we developed group 1 (nDer p 1 and nDer f 1) and group 2 (nDer p 2 and nDer f 2) mite allergens for use in the 3gAllergy assay. Cross-reactivity between group 1 and 2 mite allergenic molecules plays an important role in HDM allergy.1 Within group 1 and group 2 mite allergenic molecules there is 79% and 86% sequence identity, respectively. Recently, the utility of mite allergenic molecules in the multiplex array assay was demonstrated.2 Our objective was to characterize patient IgE reactivity to group 1 and group 2 mite allergenic molecules and to compare with corresponding allergenic extracts.
MethodsNative mite allergenic molecules (nDer p 1, nDer p 2, nDer f 1 and nDer f 2) were purchased from Indoor Biotechnologies (Charlottesville, VA, US). Purity was determined by SDS-PAGE, Western blot and mass spectrom-etry analysis. Measurement of allergen-specific IgE in patient sera was performed with the IMMULITE 2000 3gAllergy assay using bioti-nylated allergenic molecules and allergenic extracts. Competitive inhibition tests were carried out after pre-incubating positive serum at ambient temperature for 1 hour with excess unbiotinylated mite allergenic molecules. Percent inhibition was calculated for each allergen in comparison to a positive control.
Native Mite Allergenic Molecules nDer p 1, nDer p 2, nDer f 1 and nDer f 2: Novel Tools for Mite Component-Resolved Allergy DiagnosisBanik U1, Marañón MJ1, Achiles A1, Lopez M1, Jaggi K1, Ferrara R2, Pomponi D2, Mari A2, Davoudzadeh D1, Hovanec-Burns D1
1Siemens Healthcare Diagnostics, Los Angeles, CA, US 2CACeS, IDI-IRCCS, Allergy Data Laboratories sc, Latina, Rome, Italy

ResultsSDS-PAGE, Western blot and MALDI-TOF were used to determine the purity of the native mite allergens.
Figure 1. Lanes 2 and 3 contain unbiotinylated and biotinylated protein, respectively. (a, d, g, j) SDS-PAGE analysis with 5 µg/mL per lane of purified of nDer p 1, nDer f 1 nDer p 2 or nDer f 2. (b, e, h, k) Western blot analysis with specific monoclonal antibodies (MAb) to nDer p 1, nDer f 1, nDer p 2 or nDer f 2. Alkaline phos-phatase-conjugated goat antimouse IgG was used as the secondary antibody. (c, f, i, l) Western blot analysis with alkaline phosphatase-conjugated strepavidin.
Figure 2. MALDI-TOF of nDer p 1, nDer f 1, nDer p2 and nDer f 2 acquired using an Applied Biosystems Voyager DE STR instrument (Foster City, CA, US) calibrated with bovine serum albumin (MW = 66.4 kDa). The sample matrix was α-cyano-4-hydroxycinnamic acid (CHCA). The annotated molecular weight was the mean of ten measurements.
The reactivity of IgE antibodies to groups 1 and 2 mite allergenic molecules and D1 and D2 allergenic extracts was determined in sera from suspected mite sensitized patients.
The concentration of specific IgE to nDer p 1, nDer p 2, nDer f 1, nDer f 2, D1 and D2 corre-lated well with mean dose values of 20, 21, 18, 20, 24 and 18 kU/L, respectively (Figure 3). We also calculated agreement between native allergenic molecules and allergenic extracts. The agreement between D1 and nDer p 1 and D1 and nDer p 2 was 86% and 77%, respectively, and the agreement between D2 and nDer f 1 and D2 and nDer f 2 was 86% and 64%, respectively.
2.9
106
250 –
98 –
64 –
50 –
36 –
30 –
16–
6 –
1 2 3
250 –
98 –
64 –
50 –
36 –30 –
16–
6 –
1 2 3
250 –
98 –
64 –
50 –
36 –
30 –
16–
6 –
1 2 3
250 –
98 –
64 –
50 –
36 –
30 –
16–
6 –1 2 3
250 –
98 –
64 –
50 –
36 –
30 –
16–
6 –
1 2 3
250 –
98 –64 –
50 –
36 –
30 –
16–
6 –
1 2 3
250 –
98 –
64 –
50 –
36 –
30 –
16–6 –
1 2 3
250 –
98 –64 –
50 –
36 –
30 –
16–
6 –
1 2 3
250 –
98 –
64 –50 –
36 –
30 –
16–
6 –
1 2 3
250 –
98 –
64 –
50 –
36 –
30 –
16–
6 –
1 2 3
250 –
98 –
64 –
50 –
36 –
30 –
16–
6 –
1 2 3
250 –
98 –64 –
50 –
36 –
30 –
16–
6 –
1 2 3
a. b. c.
d. e. f.
g. h. i.
j. k. l.
nDer p 1
nDer f 1
nDer p 2
Mass (m/z)
% Inte
nsity
6000 12800 19600
25505
12649
26400 33200 40000
100
80
60
40
20
0
1542.5
0
Mass (m/z)%
Inte
nsity
6000 12800 19600
12687
25525
26400 33200 40000
100
80
60
40
20
0
1542.5
0
6000 12800 19600
Mass (m/z)
% Inte
nsity
Mass (m/z)
% Inte
nsity
26400 33200 40000
100
80
60
40
20
0
9.0E+3
0
6000
7003
14053
28214
7704
15101
30698
12800 19600 26400 33200 40000
100
80
60
40
20
0
1.7E+
0
6000 12800 19600
Mass (m/z)
% Inte
nsity
Mass (m/z)
% Inte
nsity
26400 33200 40000
100
80
60
40
20
0
9.0E+3
0
6000
7003
14053
28214
7704
15101
30698
12800 19600 26400 33200 40000
100
80
60
40
20
0
1.7E+
0
nDer p 1Ave. MW= 25,506 DaCV% = 0.575
nDer f 1Ave. MW= 25,512 DaCV% = 0.169
nDer p 2Ave. MW= 14,053 DaCV% = 0.035
nDer f 2Ave. MW= 14,021 DaCV% = 0.104

Figure 3. Comparison of allergen specific IgE levels (sIgE) to native allergenic molecules and allergenic extracts using sera from suspected mite sensitized patients. Points below 0.10 indicate nondetectable (ND) samples.
We also tested samples from patients clinically identified as mite positive. The results showed similar reactivity between mite allergenic extracts and similar reactivity among all mite allergenic molecules (Figure 4).
Figure 4. In vitro assay results for patients clinically identified as mite positive using native allergenic molecules and allergenic extracts. The same sera were tested by IMMULITE 3gAllergy and an independently by another method.
A competitive inhibition study was performed using groups 1 and 2 mite allergenic mole-cules as inhibitors (167 µg/mL). Groups 1 and 2 allergenic molecules showed greater than 90% inhibition, while D1 and D2 allergenic extracts showed 50-70% inhibition (Figure 5). These data suggest that all four native mite
allergenic molecules are equally immunore-active. The comparatively lower inhibition observed for D1 and D2 allergenic extracts by the corresponding native mite allergenic molecules is probably due to the presence of other allergenic molecules in these extracts.
Figure 5. Competitive inhibition study of nDer p 1, nDer p 2, nDer f 1, nDer f 2, D1 and D2.
Conclusions• We have tested the utility of the major HDM
allergens (Der p 1, Der p 2, Der f 1, Der f 2) for improved specific IgE measurement. Our results indicate that mite sensitized patient sera is equally reactive to both groups 1 and 2 native allergenic molecules.
• Use of the major native mite allergenic molecules might be useful for the accurate diagnosis of mite allergy and monitoring mite immunotherapy.
References1. Taketomi EA, Silva DA, Sopelete MC,
Gervasio AM, Alves R, Sung SJ. Differen-tial IgE reactivity to Der p 1 and Der p 2 allergens of Dermatophagoides pteronys-sinus in mite-sensitized patients. J Investig Allergol Clin Immunol. 2006;16(2):104-9.
2. Earle CD, King EM, Tsay A, Pittman K, Saric B, Vailes L, Godbout R, Oliver KG, Chapman MD. High-throughput fluorescent multi-plex array for indoor allergen exposure assessment. J Allergy Clin Immunol. 2007 Feb;119(2):428-33.
2.9
107
100
80
60
40
20
0.10
ND
> 100
N = 21
D1
sIg
E c
on
ce
ntr
atio
n,
kU
/L
nDer p 1 nDer p 2
100
80
60
40
20
0
% Inhib
itio
n
Inhibition by Group 2 Native HDM
Allergens
nDer p 2, inhibitor nDer f 2, inhibitor
D1
nDer p 2
D2
nDer f 2
100
80
60
40
20
0
% Inhib
itio
n
Inhibition by Group 1 Native HDM
Allergens
nDer p 1, inhibitor nDer f 1, inhibitor
D1
nDer p 1
D2
nDer f 1100
80
60
40
20
0.10
ND
> 100
N = 21
D2
sIg
E c
on
ce
ntr
atio
n,
kU
/L
nDer f 1 nDer f 2
100
80
60
40
20
0.10
D1
nDer p 1
nDer p 1
nDer p 2
D2
nDer f 1
nDer f 2
nDer p 2
nDer f 1
nDer f 2
ND
> 100
N = 25
sIg
E c
oncentr
ation, kU
/L
3gAllergy Independent method

This area (the Photo Layer) is used for photos.

2.10
109
AbstractBackground: Quantitative measurement of specific IgG antibodies (sIgG) may serve as a monitoring tool for the evaluation of immuno-logical responses during immunotherapy. The aim of this study is to evaluate the analytical performance of the allergen-specific IgG assay on the IMMULITE 2000 immunoassay analyzer (Siemens Healthcare Diagnostics Inc., Los Angeles, US).
Method: Precision evaluation analytical sensitivity and normal distribution studies were performed on the IMMULITE 2000 allergen-specific IgG assay. In a retrospec-tive comparison study, five patient samples, collected on least two occasions following immunotherapy, were tested with the IMMU-LITE 2000 Allergen-Specific IgG assay with allergens relevant to the immunotherapy regimen: honey-bee venom, wasp venom, peanut and kiwi. The venom-treated samples were also tested in the IMMULITE 2000 assay with purified phospholipase A2 (nApi m 1), recombinant acid phosphatase (rApi m 3) and synthetic melittin (Api m 4) allergens. Three of these samples were subsequently tested for reactivity to venoms using the ImmunoCAP® 100 Specific IgG assay (Phadia, Uppsala, Sweden). Peanut and kiwi allergens were tested only on the IMMULITE 2000.
Results: IMMULITE 2000 Allergen-Specific IgG total CVs ranged from 6.4% to 23.5% for concentrations ranging from 7.1 to 107 mg/L. The analytical sensitivity is 1 mg/L, and the assay reportable range is 2 to 200 mg/L, traceable to the WHO First International Reference Preparation 67/86. The following representative groups of aller-gens were evaluated in the distribution study: insect venom, milk proteins and inhalant allergens. A total of 198 samples from presumed healthy individuals were tested. Mean results ranged from approximately 12 to 36 mg/L. Compared to the mean values
for the presumed healthy samples, all immu-notherapy samples tested with honeybee venom, wasp venom and Api m 1 allergens showed elevated responses, while rApi m 3 and Api m 4 remained closer to the mean.
Conclusions: The study results indicate that the IMMULITE 2000 Allergen-Specific IgG assay is sensitive and capable of quantitatively measuring sIgG in patients with suspected or known exposure. Recent discussions have also suggested the use of purified or cloned venom molecules for specific immunotherapy treatments. By using venom molecules for detection, we were able to demonstrate possible sIgG assay specificities toward an individual molecule (Api m 1).
IntroductionMeasurements of specific-IgE (sIgG) anti-bodies have long been used to correlate the exposure response and the frequency of contact (i.e. sustained response) with exposure to the eliciting antigen. Gauging immunological responses during the course of immunotherapy can be an added utility for such measurements. Although the clinical relevance on the amounts of IgG antibodies remains unclear, an assay to quantitate sIgG is still useful as an investigative tool for monitoring immunotherapy treatments. Here we evaluate the analytical performance of the IMMULITE 2000 Allergen-Specific IgG assay and explore its potential usage in conjunction with molecular allergens.1–3
Development and Analytical Performance of the IMMULITE® 2000 Allergen-Specific IgG AssayChuang T, Walker M, Rouhani R, Hoang A and Hovanec-Burns D
Siemens Healthcare Diagnostics, Los Angeles, CA, US

MethodsPrecision, linearity, and an evaluation of presumed healthy samples were performed using the IMMULITE 2000 Allergen Specific IgG assay (Siemens Healthcare Diagnostics). Calibration was confirmed by comparison to the WHO 1st international reference prepara-tion 67/86 for IgG, IgA, and IgM. During the course of treatment, samples were collected at two different times (between one and five years apart) from five monosensitized patients receiving immunotherapy. All immu-notherapy samples were tested using the IMMULITE 2000 sIgG assay with the specific allergen relevant to each patient’s treatment (honey bee venom, wasp venom, peanut, or kiwi). Since peanut and kiwi allergens were not available for testing on the ImmunoCAP system, only three samples were tested individually with honey bee or wasp venom allergen. Additionally, the three immuno-therapy samples from the patients who had undergone honey bee and wasp venom treatments were tested in the IMMULITE 2000 system using the following allergens: native phospholipase A2, nApi m 1 (purified from honey bee venom); recombinant acid phosphatase, rApi m 3 (purified from insect cell expression)4; and an in-house synthetic mellitin, Api m 4.
ResultsTable 1. Precision characteristic study of sample values ranging from 7.1 mg/L to 107 mg/L were performed in accordance with the Clinical and Laboratory Standards Institute (CLSI) EP5-A2 protocol.5
Figure 1. Individual value plot for 198 presumed healthy samples tested with 8 specific allergens using the IMMULITE 2000 sIgG assay.
Table 2. Values used to generate Figure 1.
Table 3. Evaluation of linearity using three samples, each diluted with human serum containing sIgG.
2.10
110
Allergen Mean (mg/L) Within-Run CV Total CV
Yellow Jacket Venom 9.4 12.9% 18.9%
59 5.2% 10.0%
Alternaria tenuis 9.5 9.3% 15.4%
21 6.6% 9.1%
Soybean 7.1 12.5% 20.7%
19.6 6.1% 11.2%
Dermatophagoides 10.7 11.7% 14.2%
pteronyssinus 16.7 6.7% 11.7%
Wheat 11 13.2% 23.5%
79 7.5% 11.2%
Dermatophagoides 12.8 8.4% 12.7%
farinae 22 6.1% 10.8%
Honey Bee Venom 16.2 7.8% 10.6%
107 4.1% 6.4%
Adjusted sIgG (observed reading Sample/ Dilution Observed minus diluent Expected Allergen factor (mg/L) reading) (mg/L) Recovery
Sample 1/ UNDILUTED 70.43 – – Wasp Venom 2 38.55 32.26 35.22 92% 4 22.76 16.47 17.61 94% 8 14.53 8.24 8.80 94% 16 10.35 4.06 4.40 92%
Diluted with MEAN Human Serum UNDILUTED 6.29 93% containing sIgG
Sample 2/ UNDILUTED 119.35 – – Honey Bee 2 61.96 55.90 59.68 94% Venom 4 33.94 27.88 29.84 93% 8 20.38 14.32 14.92 96% 16 13.07 7.01 7.46 94%
Diluted with MEAN Human Serum UNDILUTED 6.06 94% containing sIgG
Sample 3/ UNDILUTED 69.19 – – Dermatophagoides 2 38.52 31.90 34.60 92% farinae 4 23.65 17.03 17.30 98% 8 14.46 7.84 8.65 91% 16 10.73 4.11 4.32 95%
Diluted with MEAN Human Serum UNDILUTED 6.62 94% containing s-IgG
200
150
100
50
0 2.0
sIg
G c
on
ce
ntr
atio
n,
mg
/LH
oney B
ee V
enom
Yello
w J
acket Venom
Alp
ha L
acta
lbum
inBeta
Lacta
lbum
in
Casein
D. pte
ronyssin
us
D. fa
rinae
Tim
oth
y G
rass
Allergen Mean (mg/L) 95% CI
Honey Bee Venom 13.6 (11.85-15.36)
Yellow Jacket Venom 12.12 (11.60-12.63)
Alpha Lactalbumin 30.88 (26.61-35.15)
Beta Lactoglobulin 36.27 (30.95-41.59)
Casein 26.67 (24.83-28.52)
Dermatophagoides 12.55 (12.08-13.03) pteronyssinus
Dermatophagoides 14.67 (13.69-15.65) farinae
Timothy Grass 11.69 (11.31-12.07)

2.10
111
Figure 4. Specific IgG concentrations (mg/L) to purified honey bee venom molecules in serum samples from three patients who have undergone immunotherapy treatments. A cutoff of 13.6 mg/L (see Figure 1/Table 2) is shown to reflect the mean normal range value for honey bee venom sIgG. Although sIgG may change as a result of immunotherapy, this figure also suggests that it may be affected by additional exposure to the allergen or some other factor.
ConclusionsIn this study we have demonstrated the following:
• Good reproducibility and linearity performance for quantitation of sIgG
• Calibration of the assay to the WHO 67/86 IgG, IgA, IgM 1st international reference preparation
• Higher differentiation of sIgG values between intervals of immunotherapy treatment as compared to ImmunoCAP
• An assay for sIgG may provide a tool for measuring antigenic exposure at the molecular level to assess a patient’s response to venom immunotherapy and/or continued response to the allergen.2
Figure 2. Dilutional comparison between IMMULITE 2000 sIgG calibrators and the WHO 1st reference preparation 67/86. The response values for the y-axis are reported as kilocounts per second (KCPS) while the x-axis represents the adjusted sIgG concentration based on an assay dilution factor of 100.
Figure 3. Comparison of sIgG concentrations (mg/L) to sampling time in five patient samples (A to E). Samples A, B, and C were also tested using the Phadia Immu-noCAP system.
0
1 10
WHO 1st IRP 67/86 IML 2 SPG Calibration
sIgG Concentration, mg/L
Res
pons
e, k
CPS
100 1000
500
1000
1500
2000
2500
3000
100
50
0
0
40
20
0
40
80
95.3
70.94
Honey bee Venom – Sample A
Wasp Venom – Sample B
Peanut – Sample D and Kiwi – Sample E
Honey Bee – Samples A and C
Honey bee Venom – Sample C
IMMULITE 2000 ImmunoCAPIMMULITE 2000 Method
IMMULITE 2000 ImmunoCAP
ImmunoCAP
1.32
20.5
14.9211.14
46.77
Kiwi – Sample EPeanut – Sample D IMMULITE 2000
12.78
77.65
6.5722.95
116.6
2.510.6
21212121 Sampling Time
Method
Sampling Time
Sampling Time
sIg
G c
oncentr
ation, m
g/L
sIg
G c
oncentr
ation, m
g/L
sIg
G c
oncentr
ation, m
g/L
1 2
1 2 1 2
1
5.1910.5
2
Sampling Time
0
2
1
2
1
2
1
nApi m 1
rApi m 3
Api m 4
10 20 30 40 50 60
Sample 13.6
sIgG concentration, mg/L
A
B
C
A
B
C
A
B
C
A
B
C
A
B
C
A
B
C

1.2
References1. Gehlhar K, Schlaak M, Becker W, Bufe
A. Monitoring allergen immunotherapy of pollen-allergic patients: the ratio of allergen-specific IgG4 to IgG1 correlates with clinical outcome. Clin Exp Allergy. 1999;29:497-506.
2. Muller UR. Recombinant hymenoptera venom allergens. Allergy. 2002;57:570-6.
3. Lau S, Illi S, Platts-Mills TAE, Riposo D, Nickel R, Grüber C, et al. Longitudinal study on the relationship between cat allergen and endotoxin exposure, sensitization, cat-specific IgG and development of asthma in childhood-report of the German Multi-centre Allergy Study (MAS 90). Allergy. 2005;60:766-73.
4. Grunwald T, Bockisch B, Spillner E, Ring J, Bredehorst R, Ollert MW. Molecular cloning and expression in insect cells of honeybee venom allergen acid phosphatase (Api m3). J. Allergy Clin. Immunol. 2006;117:848-54.
5. Clinical and Laboratory Standards Institute (formerly NCCLS). Evaluation of precision performance of quantitative measurement methods, approved guideline, second edition. NCCLS Document EP5-A2, Wayne, PA: NCCLS, 2004.
2.10
112


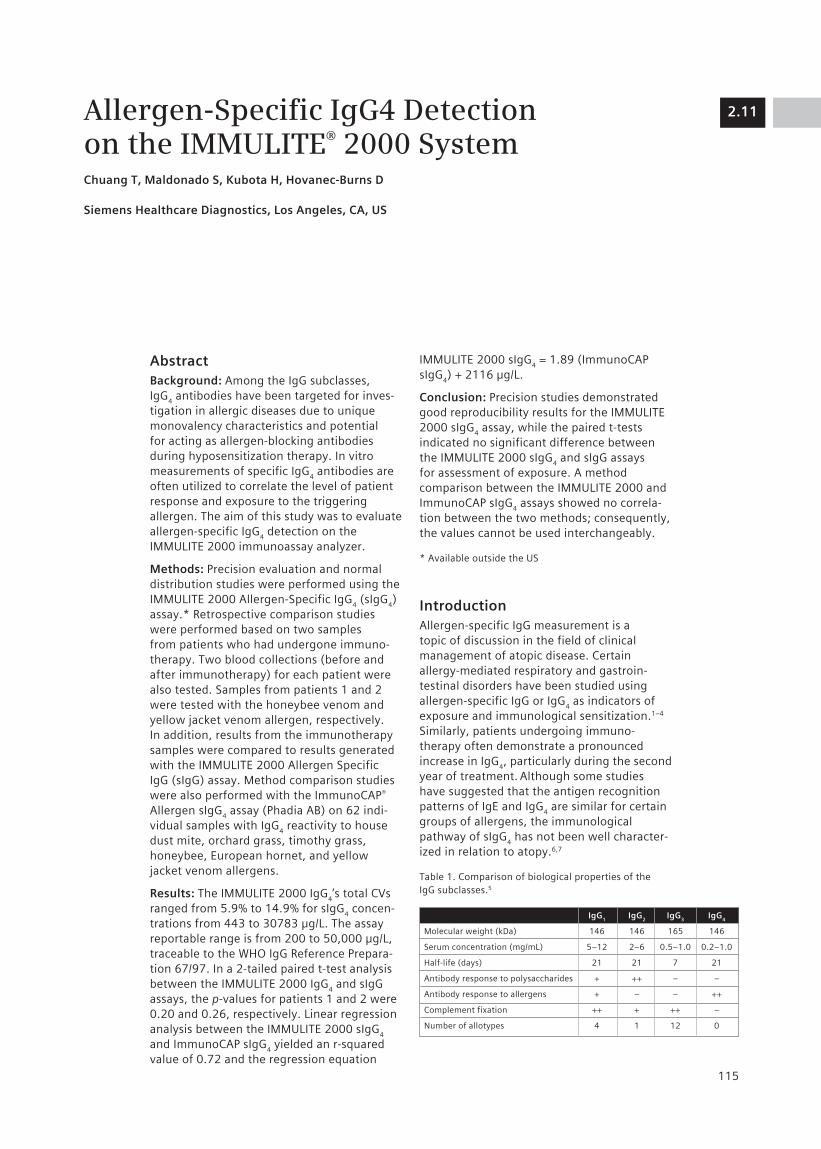
2.11
115
AbstractBackground: Among the IgG subclasses, IgG
4 antibodies have been targeted for inves-
tigation in allergic diseases due to unique monovalency characteristics and potential for acting as allergen-blocking antibodies during hyposensitization therapy. In vitro measurements of specific IgG
4 antibodies are
often utilized to correlate the level of patient response and exposure to the triggering allergen. The aim of this study was to evaluate allergen-specific IgG
4 detection on the
IMMULITE 2000 immunoassay analyzer.
Methods: Precision evaluation and normal distribution studies were performed using the IMMULITE 2000 Allergen-Specific IgG
4 (sIgG
4)
assay.* Retrospective comparison studies were performed based on two samples from patients who had undergone immuno-therapy. Two blood collections (before and after immunotherapy) for each patient were also tested. Samples from patients 1 and 2 were tested with the honeybee venom and yellow jacket venom allergen, respectively. In addition, results from the immunotherapy samples were compared to results generated with the IMMULITE 2000 Allergen Specific IgG (sIgG) assay. Method comparison studies were also performed with the ImmunoCAP® Allergen sIgG
4 assay (Phadia AB) on 62 indi-
vidual samples with IgG4 reactivity to house
dust mite, orchard grass, timothy grass, honeybee, European hornet, and yellow jacket venom allergens.
Results: The IMMULITE 2000 IgG4’s total CVs
ranged from 5.9% to 14.9% for sIgG4 concen-
trations from 443 to 30783 µg/L. The assay reportable range is from 200 to 50,000 µg/L, traceable to the WHO IgG Reference Prepara-tion 67/97. In a 2-tailed paired t-test analysis between the IMMULITE 2000 IgG
4 and sIgG
assays, the p-values for patients 1 and 2 were 0.20 and 0.26, respectively. Linear regression analysis between the IMMULITE 2000 sIgG
4
and ImmunoCAP sIgG4 yielded an r-squared
value of 0.72 and the regression equation
IMMULITE 2000 sIgG4 = 1.89 (ImmunoCAP
sIgG4) + 2116 µg/L.
Conclusion: Precision studies demonstrated good reproducibility results for the IMMULITE 2000 sIgG
4 assay, while the paired t-tests
indicated no significant difference between the IMMULITE 2000 sIgG
4 and sIgG assays
for assessment of exposure. A method comparison between the IMMULITE 2000 and ImmunoCAP sIgG
4 assays showed no correla-
tion between the two methods; consequently, the values cannot be used interchangeably.
* Available outside the US
IntroductionAllergen-specific IgG measurement is a topic of discussion in the field of clinical management of atopic disease. Certain allergy-mediated respiratory and gastroin-testinal disorders have been studied using allergen-specific IgG or IgG
4 as indicators of
exposure and immunological sensitization.1–4 Similarly, patients undergoing immuno-therapy often demonstrate a pronounced increase in IgG
4, particularly during the second
year of treatment. Although some studies have suggested that the antigen recognition patterns of IgE and IgG
4 are similar for certain
groups of allergens, the immunological pathway of sIgG
4 has not been well character-
ized in relation to atopy.6,7
Table 1. Comparison of biological properties of the IgG subclasses.5
Allergen-Specific IgG4 Detection on the IMMULITE® 2000 SystemChuang T, Maldonado S, Kubota H, Hovanec-Burns D
Siemens Healthcare Diagnostics, Los Angeles, CA, US
IgG1 IgG
2 IgG
3 IgG
4
Molecular weight (kDa) 146 146 165 146
Serum concentration (mg/mL) 5–12 2–6 0.5–1.0 0.2–1.0
Half-life (days) 21 21 7 21
Antibody response to polysaccharides + ++ – –
Antibody response to allergens + – – ++
Complement fixation ++ + ++ –
Number of allotypes 4 1 12 0

MethodsThe precision of the IMMULITE 2000 Allergen-Specific IgG
4 assay (Siemens Healthcare
Diagnostics, Deerfield, IL, US) was determined using sera from 160 presumably healthy individuals. Calibration was confirmed by dilutional comparison to the WHO reference preparation 67/97 for IgG. Two samples were collected before and after immunotherapy from each patient. One sample from each patient was tested either with honeybee venom or yellow jacket venom in the IMMULITE 2000 sIgG
4 and sIgG assays.
The interval between pre- and postimmuno-therapy sample collections ranged from 3 to 5 years. To evaluate differences between paired observations from IMMULITE 2000 sIgG
4 and IgG assays, 2-tailed t-tests were
performed. Additional statistical analysis was performed using the Minitab® 15 software (Minitab Inc, State College, PA, US). Method comparison studies between the IMMULITE 2000 and ImmunoCAP® (Phadia AB, Uppsala, Sweden) sIgG
4 assays were performed using
62 individual samples preselected for sIgG4
reactivity to house dust mite, orchard grass, timothy grass, honeybee, European hornet, and yellow jacket venom allergens.
ResultsTable 2. Precision study of samples with values ranging from 443 to 30,783 µg/L was performed in accordance with the Clinical and Laboratory Standards Institute (CLSI) EP5-A2 protocol.8
Figure 1. A total of 160 samples from presumed healthy individuals were tested with 14 allergens—M3 (Aspergillus fumigatus), M6 (Alternaria tenuis), I1 (Honey Bee Venom), I3 (Yellow Jacket Venom), D1 (Dermatophagoides pteronyssinus), D2 (Dermatopha-goides farinae), F1 (Egg White), F4 (Wheat), F2 (Milk), F76 (Alpha Lactalbumin), F77 (Beta Lactoglobulin), F78 (Casein), G6 (Timothy Grass), and T3 (Birch)—using the IMMULITE 2000 Allergen-Specific IgG
4 assay.
The interval bars indicate the 95% CI for the mean.
Figure 2. A comparison of the IMMULITE 2000 sIgG4
calibrators and the WHO IgG Reference Preparation 67/97. kCPS = kilocounts per second.
2.11
116
Mean sIgG4 Within-Run CV Total CV
(µg/L) (%) (%)
443 6.6% 10.2%
505 9.1% 14.9%
1,010 6.5% 8.7%
1,081 4.9% 9.0%
1,273 3.6% 5.9%
3,612 4.8% 6.8%
3,808 4.1% 6.8%
4,441 5.1% 7.7%
5,774 4.4% 7.3%
13,614 4.4% 6.2%
22,798 6.7% 9.4%
30,783 5.6% 8.5%
M3 M6 I1 I3 D1 D2 F1 F4
Specific allergensI
gG
4 c
on
cen
trat
ion
(µ
g/L
)
F2 F76 F77 F78 G6 T3
200
1000
10,000
50,000
10,000
1000
100
10
100
sIgG4 concentration (µg/L)
kCPS
1000
WHO 67/97 IgG4 Cal
10,000 100,000

2.11
117
Figure 5. Quantitative method comparison between the IMMULITE 2000 sIgG
4 and ImmunoCAP sIgG
4
assays for dust mite (D1), orchard grass (G3), timothy grass (G6), honey bee venom (I1), European hornet (I75), and yellow jacket venom (I3) allergens using 62 patient samples.
Conclusions • The IMMULITE 2000 sIgG
4 assay was highly
reproducible across the working range of the assay.
• There was no significant difference between the IMMULITE 2000 sIgG and sIgG
4 assays
for measuring immunological responses to honeybee and yellow jacket venom immunotherapy.
• Postimmunotherapy IgG and IgG4 levels
showed more than a 25-fold increase over preimmunotherapy levels.
• In a presumuably healthy population, elevated sIgG
4 indicated chronic exposure
to bovine milk allergens.
Figure 3. Method comparison study between the IMMULITE 2000 I1 (honey bee venom) specific IgG and IgG
4 assays. Two samples were collected from
each patient before and after immunotherapy (3-year sampling interval). Data are given as mean values of the two samples. The method comparison (IgG versus IgG
4) p value was determined from a 2-tailed t test.
Figure 4. Method comparison study between the IMMULITE 2000 I3 (yellow jacket venom) specific IgG and IgG
4 assays. Two samples were collected from
each patient before and after immunotherapy (5-year sampling interval). Data are given as mean values of the two samples. The method comparison (IgG versus IgG
4) p value was determined from a 2-tailed t test.
80
70
60
50
40
30
20
10
0IgG4 IgG IgG4
Sampling interval = 3 years
Sample 1 tested against honeybee venom (I1)
Co
nce
ntr
atio
n (
mg
/L)
After immunotherapyBefore immunotherapy
0.77
20.40
36.34
75.40
IgG ! p = 0.204
60,000
50,000
40,000
30,000
20,000
10,000
–10,000
0
0 5000 10,000
ImmunoCAP (µg/L)
y = 1.8933x + 2115.5
IMM
ULI
TE 2
00
0 (
µg
/L)
15,000 20,000
N = 62, r2 = 0.72
25,000
70
40
30
20
10
0
Sampling interval = 5 years
Sample 2 tested against yellow jacket venom (I3)
0.83
9.70
21.06
43.90
! p = 0.264 IgG4 IgG IgG4
Co
nce
ntr
atio
n (
mg
/L)
After immunotherapyBefore immunotherapy
IgG

1.2
References1. Tomee J, Dubois A, Koeter G, Beaumont F,
van der Werf T, Kauffman H. Specific IgG4
responses during chronic and transient antigen exposure in aspergillosis. Am J Resp and Crit Care Med. 1996;153(6):1952.
2. Yokota, Yamaguchi, Takeshita, Morimoto. The significance of specific IgG
4 antibodies
to methyltetrahydrophthalic anhydride in occupationally exposed subjects. Clin Exp Allergy. 1998;28(6):694.
3. Zar S, Mincher L, Benson M, Kumar D. Food-specific IgG
4 antibody-guided exclusion diet
improves symptoms and rectal compliance in irritable bowl syndrome. Scan J of Gastr. 2005;40(7):800.
4. Awazuhara H, Kawai H, Maruchi N. Major allergens in soybean and clinical signifi-cance of IgG
4 antibodies investigated by
IgE- and IgG4-immunoblotting with sera
from soybean-sensitive patients. Clin Exp Allergy. 1997 Mar;27(3):325-32.
5. Adkinson et al. Middleton’s allergy: principles and practice. vol 2. 6th ed. Phila-delphia: Mosby; 2003. p. 55-8.
6. Bodtger U, Ejrnaes A, Hummelshoj L, Jacobi H, Poulsen L, Svenson M. Is immuno-therapy-induced birch-pollen-specific IgG
4
a marker for decreased allergen-specific sensitivity? Int Arch Allergy Immunol. 2005 Apr;136(4):340-6.
7. Gehlhar K, Schlaak M, Becker W, Bufe A. Monitoring allergen immunotherapy of pollen-allergic patients: the ratio of allergen-specific IgG
4 to IgG1 correlates
with clinical outcome. Clin Exp Allergy. 1999 Apr;29(4):497-506.
8. National Committee for Clinical Labora-tory Standards. Evaluation of Precision Performance of Quantitative Measurement Methods; Approved Guideline. 2nd ed. NCCLS Document EP5-A2. Wayne, PA: CLSI, 2004.
2.11
118

