answer to ptp final syllabus 2012 jun2014 set 3€¦ · answer to ptp_final_syllabus...
TRANSCRIPT

Answer to PTP_Final_Syllabus 2012_Jun2014_Set 3
Academics Department, The Institute of Cost Accountants of India (Statutory Body under an Act of Parliament) Page 1
Paper – 20: Financial Analysis & Business Valuation
Time Allowed: 3 hours Full Marks: 100
Working Notes should form part of the answer.
―Whenever necessary, suitable assumptions should be made and indicated in answer by the
candidates.‖
Section A
(Answer Question No. 1 and Question No. 2 which are compulsory and any two from the rest in
this section)
Question 1.
Pawan Ltd.
The summarized Balance Sheets of the company as on 31st March 2012 and 2013 were:
Liabilities 2012 `
2013 `
Assets 2012 `
2013 `
Issued Share Capital
Securities Premium
Profit & Loss A/c
Debentures
Bank Overdraft
Creditors
Proposed Dividends
Depreciation:
Plant:
Fixtures:
1,00,000
15,000
28,000
70,000
14,000
34,000
15,000
45,000
13,000
1,50,000
35,000
70,000
30,000
---
48,000
20,000
54,000
15,000
Freehold Property at
cost
Plant & Machinery at
cost
Furniture & Fixture at
cost
Stocks
Debtors
Bank
Premium on
Redemption of
debentures
1,10,000
1,20,000
24,000
43,000
37,000
---
---
1,30,000
1,51,000
29,000
44,000
51,000
16,000
1,000
3,34,000 4,22,000 3,34,000 4,22,000
The following additional information is relevant:
(i) There had been no disposal of freehold property in the year. (ii) The Machine tool which has cost ` 8,000 and in respect of which ` 6,000 depreciation has
been provided, was sold for ` 3,000, and fixtures, which had cost ` 5,000 in respect of which
depreciation of ` 2,000 has been provided, were sold for ` 1,000. The Profit and losses on
these transactions had been dealt with through the Profit and Loss Account. (iii) The actual premium of the redemption of debentures was ` 2,000 of which ` 1,000 had been
written-off to the Profit and Loss A/c.
(iv) No interim dividend has been paid. (v) Interest paid on debentures amounted to ` 4,500.
After reading the above financial statements and informations, answer the following questions:
(a) Calculate the cash flows from the operating activities. Necessary workings should be part of
the answer.
(b) Find out those ratios which are essential to analyse the financial position of the company,
based on cash flows. Provided —

Answer to PTP_Final_Syllabus 2012_Jun2014_Set 3
Academics Department, The Institute of Cost Accountants of India (Statutory Body under an Act of Parliament) Page 2
Net cash flows from Investing Activities: (-) ` 65,000
Net cash flows from Financing Activities: ` 8,500
(c) Interpret and comment on the financial position of the company, based on the data
obtained from above point (b).
[6+4+5]
Answer:
(a) Calculation of Cash Flows from Operating Activities
For the year ended 31st March 2013
` ` `
Net Profit during the year:
Net Profit for the year 2012-13
Less: Net Profit for the year 2011-12
Add: Non-Operating Expenses Depreciation (` 15,000 + ` 4,000)
Loss on Sale of Fixtures
Discount on Debenture
Proposed Dividend
Debenture Interest
Less: Non-Operating Income
Profit on Sale of Plant
Add: Decrease in Current Assets or Increase in
Current Liabilities:
Decrease in Current Assets
Increase in Current Liabilities:
Increase in Creditors
Less: Increase in Current Assets or Decrease in
Current Liabilities:
Increase in Current Assets:
Increase in Stock
Increase in Debtors
Net Cash Flows from Operating Activities
70,000
28,000
42,000
46,500
86,500
19,000
2,000
1,000
20,000
4,500
14,000
88,500
1,000
87,500
Nil
14,000
1,000
14,000
1,01,500
15,000
Workings:
Plant & Machinery A/c
Dr. Cr.
` `
To Balance b/d
`` Profit & Loss Account – Profit
on Sale
`` Bank A/c – Purchase
1,20,000
1,000
39,000
By Bank Account – Sale
`` Provision for Depreciation
`` Balance c/d
3,000
6,000
1,51,000

Answer to PTP_Final_Syllabus 2012_Jun2014_Set 3
Academics Department, The Institute of Cost Accountants of India (Statutory Body under an Act of Parliament) Page 3
1,60,000 1,60,000
Fixtures & Fittings A/c
Dr. Cr.
` `
To Balance b/d
`` Bank Account – Purchase
24,000
10,000
By Bank Account – Sale
`` Profit & Loss Account –
Loss on Sale
`` Provision for Depreciation
`` Balance c/d
1,000
2,000
2,000
29,000
34,000 34,000
Provision for Depreciation on Plant & Machinery A/c
Dr. Cr.
` `
To Plant & Machinery Account
`` Balance c/d
6,000
54,000
By Balance b/d
`` Profit & Loss Account
45,000
15,000
60,000 60,000
Provision for Depreciation on Fixtures & Fittings A/c
Dr. Cr.
` `
To Furniture & Fixture
`` Balance c/d
2,000
15,000
By Balance b/d
`` Profit & Loss Account
13,000
4,000
17,000 17,000
(b) Ratios required to analyse financial position:
(i) Ratio of Dividend to Operating Cash Flow (OCF)
= Dividend
Operating Cash Flowsx 100 =
`
`
15,000
86,500 x 100 = 17.34%
(ii) Rate of Depreciation to Cash Flow
= `
`
19,000
86,500x 100 = 21.97%
(iii) Debts Coverage Ratio
=OCF - Interest - Dividend
Debts=
` ` `
`
86,500 - 4,500 - 15,000
30,000 =
`
`
67,000
30,000 = 2.23 times
(iv) Interest Coverage Ratio
=Operating Cash Flow (OCF)
Interest=
`
`
86,500
4,500 = 19.22 times
(v) Return of Cash to Total Assets
=Operating Cash Flow
Total Assetsx 100 =
`
`
86,500
4,21,000x 100 = 20.55%

Answer to PTP_Final_Syllabus 2012_Jun2014_Set 3
Academics Department, The Institute of Cost Accountants of India (Statutory Body under an Act of Parliament) Page 4
(vi) Dependence of Capital Investment on Internal Fund
=Operating Cash Flow - Increase in Cash Balance
Investing Cash Flow=
` `
`
86,500 - 30,000
65,000x 100 = 86.92%
(vii) Return of Cash on Net Worth
=Operating Cash Flow - Interest
Net Worthx 100 =
` `
(` ` ` `
86,500 - 4,500
1,50,000 + 35,000 + 70,000 - 1,000)
= `
`
82,000
2,54,000x 100 = 32.28%
(viii) Dependence of Extra Funds for Capital Expenditure Ratio
=Financing Cash Flow
Investing Cash Flowx 100 =
`
`
8,500
65,000x 100 = 13.08%
(c) Comments and Interpretation
Rate of Dividend to Operating Cash Flow is found to be 17.34% which indicates that
percentage of cash generated through operational activities which may be considered as
good. But if it is found to be „good‟, more cash will be required for paying dividend.
Similarly, Rate of Depreciation of Operating Cash Flow ratio is computed as only 21.96%
which reveals percentage of cash used to replace fixed assets. It may be considered as
normal. But Debt Coverage Ratio is found to be 2.23 times which is very poor and the same is
used to redeem the existing debts by the amount of net cash generated from operation.
Interest Coverage Ratio, on the other hand, is found to be 19.22 times. It means ability of the
firm to repay interest and also indicates the proportion of interest of „cash generated from
operation‟. This ratio is high which invites obstruction to take the benefit of trading on equity.
Return of cash to total assets ratio is found to be satisfactory, i.e., percentage of OCF to total
assets is 20.55% which is considered as good. Similarly, dependence of capital investments
on internal funds ratio is taken as 86.93% which reveals that percentage of OCF to Investing
Cash Flow is 86.93% i.e., 86.93%, of capital expenditure has been founded out of cash to be
generated from internal funds.
Return of Cash to Net Worth Ratio is found to be 32.28% which may be considered as good,
and it indicates that shareholder‟s fund is efficiently used. Dependence of External Funds to
Capital Expenditure Ratio is found to be 13.08% which reveals that external funds are used
only a little portion and the rest is used as Working Capital.
From the discussion made so far, it may be concluded that the overall position to be
measured in terms of Cash Flow Statement may be considered as sound. But whether such
ratios are satisfactory or not can be measured by making proper comparison with the
industry average ratio.

Answer to PTP_Final_Syllabus 2012_Jun2014_Set 3
Academics Department, The Institute of Cost Accountants of India (Statutory Body under an Act of Parliament) Page 5
Question 2.
Akash Ltd.
Profit and Loss Account (Extract)
for the year ended 31.03.2013
` `
To Opening Stock
`` Purchases
`` Gross Profit c/d
4,00,000
16,00,000
6,00,000
By Sales
`` Closing Stock
24,00,000
2,00,000
26,00,000 26,00,000
To Office and Administration
Expenses
`` Selling & Distribution
`` Net Profit
2,00,000
1,00,000
3,00,000
By Gross Profit b/d 6,00,000
6,00,000 6,00,000
Balance Sheet (Extract)
as at 31.03.2013
Liabilities ` Assets `
Share Capital: 50,000 Equity Shares of ` 10 each,
fully paid
General Reserve
Profit & Loss Account
8% Debentures
Sundry Creditors
Bank Overdraft
Bills Payable
5,00,000
1,00,000
3,00,000
2,00,000
50,000
1,00,000
1,50,000
Land & Building
Plant & Machinery
Stock
Debtors
Bills Receivable
Cash at Bank
3,00,000
3,50,000
2,00,000
3,50,000
1,00,000
1,00,000
14,00,000 14,00,000
Note: Dividend declared on Equity Share Capital amounted to ` 50,000.
You are required to answer the following questions:
(a) Calculate the ratios which will analyse the liquidity and solvency position of the company.
Comment on the result.
(b) Find out any five ratios which will measure the profitability of the company and also analyse
them.
(c) Analyse the financial statement from the management efficiency perspective with the
suitable ratios.
[5+5+5]
Answer:
(a) Calculation and comments on ratios for analysing the liquidity and solvency position:
(i) Current Ratio: Current Assets 7,50,000
= Current Liabilities 3,00,000
`
`= 2.5:1

Answer to PTP_Final_Syllabus 2012_Jun2014_Set 3
Academics Department, The Institute of Cost Accountants of India (Statutory Body under an Act of Parliament) Page 6
Since this ratio is more than normal Current Ratio of 2: 1, it reveals that the liquidity position is sound, i.e., the company is able to pay its maturing obligation as soon as it becomes due.
(ii) Liquid Ratio/Quick Ratio/Acid Test Ratio:
Liquid Assets Current Assets - Stock 5,50,000 = =
Liquid Liabilities Current Liabilities - Bank Overdraft 2,00,000
`
` = 2.75:1
The ratio is also more than its normal level (1: 1). It also indicates that the liquidity and
solvency position of the company is highly satisfactory, since two rupees and seventy-five paise of Liquid Assets are available against each rupee of Liquid Liability.
(iii) Proprietary Ratio:
Proprietor's Equity 9,00,000 =
Total Assets 14,00,000
`
` = 0.64:1.
It proves that the efficiency of the management is good as it fulfills its norms which are 60% to 75%.
Therefore, the financial position may be considered as sound.
(iv) Debt-Equity Ratio: Total Debts 5,00,000
= Proprietary Equity 9,00,000
`
` = 0.56:1.
This ratio reveals the claims of Creditors and Debenture holders and the Shareholders against
the Assets of the company. The norm of such ratio is 1: 2. Since it satisfies almost the normal level, the Creditors‟ and Debenture holders‟ claims are also secured.
(v) Capital Gearing Ratio:
Equity Share Capital 5,00,000 =
Debentures 2,00,000
`
` = 2.5:1
Since it is more than the normal gear ratio of 2: 1 the gearing is very much low, i.e., very low-geared, and, from the financial point of view, it is very much satisfactory.
(b) Analysis of ratios to measure profitability:
(i) Gross Profit Ratio: x 100 Gross Profit 6,00,000
= x 100 = 25%Sales 24,00,000
`
`
This ratio also maintains its norm and, hence, may be considered as good but not highly satisfactory.
(ii) Net Profit Ratio: 3,00,000
x 10024,00,000
`
` = 12.5%
Answer to PTP_Final_Syllabus 2012_Jun2014_Set 3
Academics Department, The Institute of Cost Accountants of India (Statutory Body under an Act of Parliament) Page 7
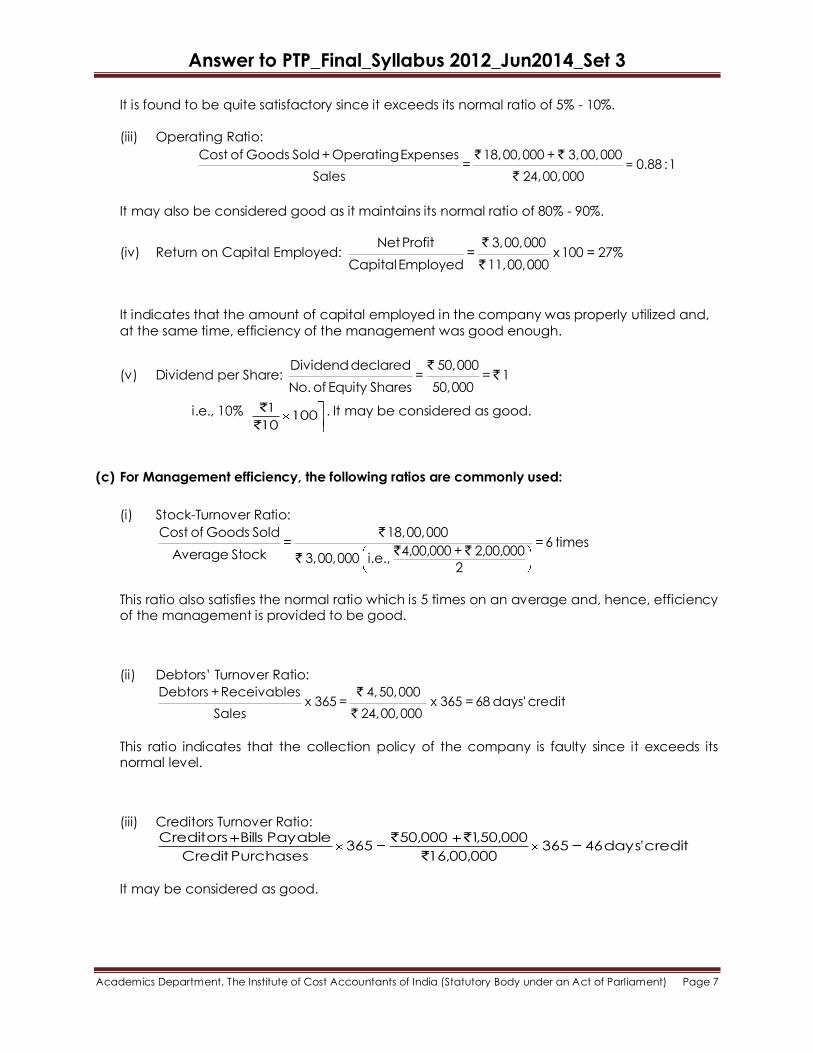
It is found to be quite satisfactory since it exceeds its normal ratio of 5% - 10%.
(iii) Operating Ratio:
=Cost of Goods Sold + Operating Expenses 18,00,000 + 3,00,000
= 0.88 : 1Sales 24,00,000
` `
`
It may also be considered good as it maintains its normal ratio of 80% - 90%.
(iv) Return on Capital Employed: Net Profit 3,00,000
= x 100 = 27%Capital Employed 11,00,000
`
`
It indicates that the amount of capital employed in the company was properly utilized and,
at the same time, efficiency of the management was good enough.
(v) Dividend per Share: Dividend declared 50,000
= = 1No. of Equity Shares 50,000
``
i.e., 10% 10010
1
`
` . It may be considered as good.
(c) For Management efficiency, the following ratios are commonly used:
(i) Stock-Turnover Ratio:
Cost of Goods Sold 18,00,000 = = 6 times
4,00,000 + 2,00,000Average Stock 3,00,000 i.e., 2
`
` ``
This ratio also satisfies the normal ratio which is 5 times on an average and, hence, efficiency of the management is provided to be good.
(ii) Debtors‟ Turnover Ratio:
Debtors + Receivables 4,50,000 x 365 = x 365 = 68 days' credit
Sales 24,00,000
`
`
This ratio indicates that the collection policy of the company is faulty since it exceeds its normal level.
(iii) Creditors Turnover Ratio:
credit'days46365000,00,16
000,50,1000,50365
PurchasesCredit
PayableBillsCreditors
`
``
It may be considered as good.

Answer to PTP_Final_Syllabus 2012_Jun2014_Set 3
Academics Department, The Institute of Cost Accountants of India (Statutory Body under an Act of Parliament) Page 8
(iv) Turnover to Fixed Assets: times69.3000,50,6
000,00,24
AssetsFixed
Turnover
`
`
It may also be considered as satisfactory.
(v) Turnover to Total Assets: Turnover 24,00,000
= = 1.71 timesTotal Assets 14,00,000
`
`
It is not desirable since turnover is nearly 2 times of Total Assets.
Question 3.
(a) Using Altman’s 1983 Multiple Discriminant Function, calculate Z-score of Somlata & Co. Ltd., where the five accounting ratios are as follows and comment about its financial position:
Working Capital to Total Assets=0.350
Retained Earnings to Total Assets = 50%
EBIT to Total Assets = 19%
Book Value of Equity to Book Value of Total Debt= 1.65
Sales to Total Assets = 3 times
(b) A ` 1,000 par value bond bears a coupon rate of 14 percent and matures after 5 years.
Interest is payable semi-annually. Compute the value of the bond if the required rate of
return is 16 percent. Given PVIFA8%, 10 years = 6.710 and PVIF8%, 10 years = 0.463.
(c) What is the relation between Financial Leverage and Debt-to-equity Ratios in relation to the
profitability analysis?
[5+3+2]
Answer:
(a) As per Altman‟s Model (1983) of Corporate Distress Prediction,
Z=0.717 X1 + 0.847 X2+3.107 X3 + 0.420 X4 + 0.998X5
Here, the five variables are as follows:
X1 = Working Capital to Total Assets = 0.350
X2 = Retained Earnings to Total Assets = 0.50
X3 = EBIT to Total Assets = 0.19
X4 = Market Value of Equity Shares to Book Value of Total Debt= 1.65
X5 = Sales to Total Assets = 3 times
Hence, Z-score = (0.717x0.350) + (0.847x0.50) + (3.107x0.19) + (0.420x 1.65) + (0.998x3)
= 0.25095 + 0.4235 + 0.59033+0.693 + 2.994 = 4.95
Note: As the calculated value of Z-score is much higher than 2.99, it can be strongly
predicted that the company is a non-bankrupt company (i.e., non-failed company).

Answer to PTP_Final_Syllabus 2012_Jun2014_Set 3
Academics Department, The Institute of Cost Accountants of India (Statutory Body under an Act of Parliament) Page 9
(b) In this case the number of half yearly period is 10, the half-yearly interest payment is ` 7, and
the discount rate applicable to a half-yearly period is 8 percent. Hence the value of the
bond is:
10
10
1tt )08.1(
1000
)08.1(
7V
= 7 (PVIFA8%, 10 years) + 1,000 (PVIF8%, 10 years)
= 7 (6.710) + 1,000 (0.463)
= 46.97 + 463
= ` 509.97
(c) A common measure of financial leverage is the debt-to-equity ratio, calculated as total
debt divided by equity. This measure is useful in credit analysis but, for the analysis of
profitability, it confuses operating liabilities (which create operating liability leverage) with
financial liabilities (which create financial leverage). And, as usually defined, it does not net
out financial liabilities against financial assets.
Question 4.
(a) The accompanying balance sheet and profit and loss account relate to T Ltd. Convert these
into common-size statements.
Balance Sheet as at 31st March (Extract) (Amount in ` lakhs)
Particulars Previous year Current Year
Liabilities Equity share capital (of ` 10 each)
General reserves
Long-term loans
Creditors
Outstanding expenses
Other current liabilities
240
96
182
67
6
19
240.0
182.0
169.5
52.0
-
6.5
610 650.0
Assets
Plant [net of accumulated depreciation]
Cash
Debtors
Inventories
402
54
70
84
390
78
65
117
610 650
Income Statement for the Year Ended 31st March (Extract) (Amount in ` lakhs)
Particulars Previous year Current year
Gross sales 370 480
Less: Returns 20 30
Net sales 350 450
Less: Cost of goods sold 190 215
Gross profit 160 235
Less: Selling, general and administrative
cost
50 72
Operating profit 110 163
Less: Interest expenses 20 17

Answer to PTP_Final_Syllabus 2012_Jun2014_Set 3
Academics Department, The Institute of Cost Accountants of India (Statutory Body under an Act of Parliament) Page 10
Earnings before taxes 90 146
Less: Taxes 31.5 51.5
Earnings after taxes 58.5 94.5
(b) There are different types of financial models. One of them is Macroeconomic Financial
Model. Write few sentences about this model.
[8+2]
Answer:
(a) Income Statement (Common-size) for the Years Ended 31st March
Particulars Previous year
(Percentages)
Current year
(Percentages)
Net sales 100.0 100.0
Cost of goods sold 54.3 47.8
Gross profit 45.7 52.2
Selling, general and administrative expenses 14.3 16.0
Operating profit 31.4 36.2
Interest 5.7 3.8
Earnings before taxes 25.7 32.4
Taxes 9.0 11.4
Earnings after taxes (EAT) 16.7 21.0
Balance Sheets (Common-size) as at 31st March
Particulars Previous year
(Percentages)
Current year
(Percentages)
Owners' equity:
Equity share capital 39.3 36.9
General reserves 15.7 28.0
55.0 64.9
Long-term borrowings:
Loan 29.8 26.1
Current liabilities:
Creditors 11.1 8.0
Outstanding expenses 1.0
Other liabilities 3.1 1.0
15.1 9.0
Total liabilities 100.0 100.0
Fixed assets:
Plant (net of accumulated depreciation) 65.9 60.0
Current assets:
Cash 8.9 12.0
Debtors 11.4 10.0
Inventories 13.8 18.0
34.1 40.0
Total assets 100.00 100.00
These percentage figures bring out clearly the relative significance of each group of items in
the aggregative position of the firm. For instance, in the current year the EAT of T Ltd. has
increased to 21 per cent from 16.7 per cent in the previous year. This improvement in

Answer to PTP_Final_Syllabus 2012_Jun2014_Set 3
Academics Department, The Institute of Cost Accountants of India (Statutory Body under an Act of Parliament) Page 11
profitability can mainly be traced to the decrease of 6.5 per cent in the cost of goods sold,
reflecting improvement in efficiency of manufacturing operations. The decrease in financial
overheads (interest) by 1.9 per cent during the current year can be traced to the repayment
of a part of long-term loans. Further analysis indicates that profitability would have been
more but for an increase in operating expenses ratio by 1.7 per cent.
The common-size balance sheets show that current assets as a percentage of total assets
have increased by 5.9 per cent over previous year. This increase was shared by inventories
(4.2 per cent) and cash (3.1 per cent); the share of debtors is reduced by 1.4 per cent. The
proportion of current liabilities (mainly due to creditors) was also lower at 9 per cent in the
current year compared to 15.1 per cent in the previous year. These facts signal overall
increase in the liquidity position of the firm. Further, the share of long-term debt has also
declined and owners' equity has gone up from 55 per cent in the previous year to 64.9 per
cent in the current year.
(b) The Macroeconomic Financial Models are usually econometric analysis based, built by
government departments, universities or economic consulting firms, and used to forecast the
economy of a country. Macroeconomic models are used to analyze the like effect of
government policy decisions on variables such as foreign exchange rates, interest rates,
disposable income and the gross national product (GNP).
Question 5.
(a) A firm has sales of `75,00,000, variable cost of `42,00,000 and fixed cost of `6,00,000. It has a
debt of ` 45,00,000 at 10% and equity of ` 55,00,000.
(i) What is the firm's Return on Investment (ROl)?
(ii) Does it have favourable financial leverage?
(iii) If the firm belongs to an industry whose asset turnover is 3, does it have a high or low
asset leverage?
(iv) What are the operating, financial and combined leverages of the firm? (v) If the sales drop to ` 50,00,000, what will be the new EBIT?
(vi) At what level the EBT of the firm will be equal to zero?
(b) When a firm can be called as ―no growth firm‖ in connection to the growth analysis?
[8+2]
Answer:
(a) Basic Calculations
`
Sales 75,00,000
Less: Variable 42,00,000
Contribution 33,00,000
Les: Fixed Cost 6,00,000
Earnings before Interest and Taxes (EBIT) 27,00,000
Less: Interest at 9% on Debt `45,00,000 4,50,000
Earnings before Taxes (EBT) 22,50,000

Answer to PTP_Final_Syllabus 2012_Jun2014_Set 3
Academics Department, The Institute of Cost Accountants of India (Statutory Body under an Act of Parliament) Page 12
(i) 100EmployedCapital
EBITROI = ` 100x
000,00,00,1
000,00,27= 27%
(ii) The return on investment at 27% is higher than the interest payable on debt at 10%. The
firm has a favourable financial leverage.
(iii) Asset Turnover = AssetsTotal
SalesNet
Firm‟s Assets Turnover is = `000,00,00,1
000,00,75= 0.75
The industry average is 3. Hence, the firm has a low asset leverage.
(iv) Operating leverage = EBIT
onContributi= `
000,00,27
000,00,33 = 1.2222
Financial leverage = EBT
EBIT = `
000,50,22
000,00,27 = 1.2
Combined Leverage = EBT
onContributi = `
000,50,22
000,00,33
Combined Leverage = Operating Leverage x Financial leverage
= 1.2222 x 1.2 = 1.46664
(v) If the sales drop to ` 50,00,000 from ` 75,00,000, the fall is by 33.33%. Hence, EBIT will drop
by 40.73% (% Fall In Sales x Operating Leverage) Hence, the new EBIT will be ` 27,00,000 x
(1 - 40.73%) = ` 16,00,290 or rounded to ` 16,00,000.
(vi) EBT to become zero means 100% reduction in EBT. The combined leverage is1.438,
hence, sales have to drop by 100/1.438 i.e. 68.18%. The new sales will therefore, be `75,00,000 x(1 – 68.18%) = ` 23,86,500 (approx.)
(b) Residual earnings are the relevant growth measure when evaluating the price-to-book (P/B)
ratio. Abnormal earnings growth is the relevant growth measure when evaluating the price-
earnings (P/E) ratio. However, the two measures are just different ways of looking at the
same thing: Abnormal earnings growth is equal to the change in residual earnings. If a firm
has no growth in residual earnings, its abnormal earnings growth must be zero: at this time,
the firm is called “no growth firm”.
Section B – Business Valuation
(Full Marks: 50)
(Answer Question No. 6 and Question No. 7 which are compulsory and any two from the rest
in this section)

Answer to PTP_Final_Syllabus 2012_Jun2014_Set 3
Academics Department, The Institute of Cost Accountants of India (Statutory Body under an Act of Parliament) Page 13
Question 6.
Super Cars Ltd. is engaged in the business of manufacture of electric Passenger Cars. The
Company requires you to determine the value of its goodwill also showing the leverage effect on
goodwill. Its Balance Sheet is as on 31.03.2013 is as under – (` Lakhs)
Liabilities ` Assets ` `
Share Capital – Equity Shares of
`10 each
1,500 Gross Fixed Assets 1,500
General Reserve 500 Less: Depreciation till date 500 1,000
12% Term Loan from Bank 500 Investments:
Creditors 210 Non- trade 300
Provision for Tax 10 Trade 90 390
Proposed Dividend 140 Current Assets:
Overseas Debtors (1$= INR 42) 420
Indian Debtors 400 820
Stock in Trade 350
Cash and Bank Balances 300
2,860 2,860
Additional Information:
(i) The closing exchange rate for the U.S. dollar was INR 48. Income from Non- trade
Investments was a loss for the year ended 31.03.2013 owing to write down of cost of
acquisition by 4%. There was no other transaction under Non-trade Investments during the
year.
(ii) Current Year Depreciation changed on Historical Cost was `100 Lakhs. Current Cost of Fixed
Assets is determined at `2,000 Lakhs.
(iii) While Current Cost of Closing Stock is `367 Lakhs, that of the Opening Stock was `200 lakhs
against its Historical Cost of `148 Lakhs. The Market Value of Non- Trade Investments at the
year end was `300 lakhs. The Overseas debtors made settlements in U.S.$ only.
(iv) The Industry Average rate of return on current cost of capital employed is 12% on long term
debt and 15% on equity. The opening balance in General reserve was `150 Lakhs. While
prevailing tax rate is 30% such is expected to decline by 5%.
(v) Using the above information you are required to arrive at value of the goodwill of the
company under equity and long-term fund approached and also show the leverage effect
on goodwill. [15]

Answer to PTP_Final_Syllabus 2012_Jun2014_Set 3
Academics Department, The Institute of Cost Accountants of India (Statutory Body under an Act of Parliament) Page 14
Answer:
Computation of Future Maintainable Profits
Particulars ` Lakhs
Profits for the year 2012-13:
Increase in Reserves [`500 Lakhs - `150 Lakhs] 350.00
Proposed Dividend 140.00 490.00
Add back: Tax
[( `490.00 Lakhs x Tax Rate of 30%) ÷ (100% - Tax Rate of 30%)] 210.00
Profit Before tax 700.00
Add: Forex Gain on Foreign Currency Debtors (See WN 2) 60.00
Add: Loss from Non- Trade Investments (`300 Lakhs x 4/96) 12.50
Add: Adjustment for Current Cost of Closing Stock (`367 - `350) 17.00
Less: Extra Depreciation Required (See WN 1) (81.80)
Less: Adjustment for Current Cost of Opening Stock (`200 - `148) (52.00)
Future Maintainable Profit Before Tax 655.70
Less: Future Tax Expense at 25% (`655.70 x 25%) (163.93)
Future maintainable Profit After Tax 491.77
Add: Interest on Long Term Loan (after considering tax)
`500 x 12% x (100% – 25%) 45.00
Future Maintainable Profit After Tax Before Interest 536.77
Therefore, Future Maintainable Profit on: –
(a) Long Term Capital Employed (including Long term Loans) is `536.77 Lakhs
(b) Net Worth (Shareholders Funds) is `491.77 Lakhs
Computation of Capital Employed
Particulars ` `
Fixed Assets
(1,000 + Revaluation Gain 1,000 – Addl. Depreciation `81.80) 1,918.20
Investments Trade 90.00
Overseas Debtors ($ 10.00 Lakhs x 48) 480.00

Answer to PTP_Final_Syllabus 2012_Jun2014_Set 3
Academics Department, The Institute of Cost Accountants of India (Statutory Body under an Act of Parliament) Page 15
Indian Debtors 400.00
Stock in Trade at Current Cost 367.00
Cash and Bank Balances 300.00
Current Cost of Total Assets 3,555.20
Less: Outside Liabilities:
Sundry Creditors 210.00
Provision for Taxation
[ 10.00 + Additional for Exchange Rate Difference 18.00]
28.00
Proposed Dividend (See Note) 140.00 (378.00)
Capital Employed (Total Long Term Funds) 3,177.20
Less: 12% Term Loan 500.00
Equity Capital Employed 2,677.20
Note: Since the Proxy Capital Employed is based on Closing Balances, proposed
dividend is treated as a liability. This is because, such funds will not stand invested in the
business in the future, but distributed in the immediate future. Adjustments for Exchange
Rate differences are assumed to be tax deductible.
Computation of Goodwill using different approaches
Particulars Owners funds Total Funds
a. Future Maintainable Profits 491.77 536.77
b. Normal Rate of Return 15% 12%
c. Capitalized Value of Future Maintainable Profits (a ÷b) 3,278.47 4,473.08
d. Capital Employed 2,677.20 3,177.20
e. Goodwill (c-d) 601.27 1,295.88
Leverage Effect on Goodwill
Goodwill computed using Equity Fund Concept (`601.27 Lakhs), is low when
compared to the Goodwill as computed using Total Long Term Funds Concept
(`1,295.88 Lakhs)
Leverage Effect on Goodwill = `1,295.88 - `601.27 = `694.61
Working Notes: 1. Computation of Additional Depreciation Required

Answer to PTP_Final_Syllabus 2012_Jun2014_Set 3
Academics Department, The Institute of Cost Accountants of India (Statutory Body under an Act of Parliament) Page 16
Particulars ` Lakhs
Calculation of Depreciation Rate:
Book Value as on 31.03.2013 1,000
Add: Depreciation for 2012-13 100
Book Value as on 1.4.2012 1,100
Therefore, Depreciation Rate
= Current Depreciation ÷ Opening bal. = 100 ÷ 1,100
9.09%
Calculation of Extra Depreciation on Sundry Fixed Assets:
Current Cost of Sundry Fixed Assets as on 1.4.2012 2,000
Depreciation on Current Cost of Fixed Assets = `2,000 x9.09% 181.80
Less: Depreciation already provided in the books (100.00)
Extra Depreciation to be provided 81.80
Note: It is assumed that the Company charges WDV method of depreciation
Alternatively, Depreciation Rate can be determined based on SLM i.e. on Gross Value.
[`100/1500= 6.67%]
Working Notes: 2. Computation of Foreign Exchange Gain
Dollar Value of Debtors (`420.00 Lakhs ÷ `42.00) `10.00 Lakhs
Exchange Gain [`10.00 Lakhs x (`48.00 – 42.00) `60 Lakhs
Adjustment in Provision for Tax [ 30% of `60.00 Lakhs] (Additional Provision) `18 Lakhs
Question 7.
Reliable Industries Ltd. (RIL) is considering a takeover of Sunflower Industries Ltd. (SIL). The
particulars of two companies are given below:
Particulars RIL SIL
Earnings After Tax (`) 20,00,000 10,00,000
Equity shares (No.) 10,00,000 10,00,000
EPS (`) 2 1
P/E ratio (times) 10 5
Required:
(i) What is the market value of each company before merger?

Answer to PTP_Final_Syllabus 2012_Jun2014_Set 3
Academics Department, The Institute of Cost Accountants of India (Statutory Body under an Act of Parliament) Page 17
(ii) Assuming that the management of RIL estimates that the shareholders of SIL will accept an
offer of one share of RIL for four shares of SIL. If there are no synergic effects, what is the
market value of the post-merger RIL? What is the new price for share? Are the shareholders of
RIL better or worse off than they were before the merger?
(iii) Due to synergic effects, the management of RIL estimates that the earnings will increase by
20%. What is the new post-merger EPS and price per share? Will the shareholders be better
off or worse off than before the merger? [3+(2+2+2)+(2+2+2)]
Answer:
(i) Market value of companies before merger
Particulars RIL SIL
EPS (`) 2 1
P/E ratio 10 5
Market price per share (`): (EPS × P/E Ratio) 20 5
Equity shares 10,00,000 10,00,000
Total market value 2,00,00,000 50,00,000
(ii) Post merger effect on RIL
Particulars `
Post merger earnings ` (20,00,000 + 10,00,000) 30,00,000
4
1000,00,10000,00,10 :Shares Equity
As exchange ratio is 1 : 4
12,50,000
000,50,12
30,00,000 :EPS
2.4
P/E ratio 10.00
Market price per share(`): (EPS × P/E Ratio)
i.e. 10 × 2.4
24
Total market value (12,50,000 × 24) 3,00,00,000
Gains from Merger
Post Merger Market value of the firm = ` 3,00,00,000
Less : Pre-Merger market value

Answer to PTP_Final_Syllabus 2012_Jun2014_Set 3
Academics Department, The Institute of Cost Accountants of India (Statutory Body under an Act of Parliament) Page 18
RIL 2,00,00,000
SIl 50,00,000
= ` 2,50,00,000
= ` 50,00,000
Apportionment of Gains between shareholders
Particulars RIL SIL
Post merger market value
10,00,000 × 24 2,40,00,000
2,50,000 × 24 60,00,000
Less : Pre merged market value 2,00,00,000 50,00,000
Gain 40,00,000 10,00,000
Thus the shareholders of both the Co. have gained from merger
(iii) Post Merger Earnings
When increase in earning by 20%
Particulars `
Post merger earnings ` (30,00,000 × 120%) 36,00,000
No. of Equity shares 12,50,000
000,50,12
36,00,000 :EPS
2.88
P/E ratio 10.00
Market price per share(`): (EPS × P/E Ratio)
i.e. 10 × 2.88
28.80
Total market value (12,50,000 × 28.80) 3,60,00,000
Gains from Merger
Post Merger Market value of the firm = ` 3,60,00,000
Less : Pre-Merger market value
RIL 2,00,00,000
SIl 50,00,000
= ` 2,50,00,000
= ` 1,10,00,000

Answer to PTP_Final_Syllabus 2012_Jun2014_Set 3
Academics Department, The Institute of Cost Accountants of India (Statutory Body under an Act of Parliament) Page 19
Apportionment of Gains between shareholders
Particulars RIL SIL
Post merger market value
10,00,000 × 28.80 2,88,00,000
2,50,000 × 28.80 72,00,000
Less : Pre merged market value 2,00,00,000 50,00,000
Gain 88,00,000 22,00,000
Hence, shareholders will be better off than before the merger situation.
Question 8.
(a) Who are the participants in the Merger and Acquisition Process?
(b) The following financial share date pertaining to TECHNO LTD an IT company is made
available to you:
Year ended March 31st 2014 2013 2012
EBIT (`) 696.03 325.65 155.86
Non-branded Income (`) 53.43 35.23 3.46
Inflation compound factor @ 8% 1.000 1.087 1.181
Remuneration of Capital 5% of average
capital employed
Average capital Employed (`) 1112.00
Corporate Tax Rate 35%
Capitalization Factor 16%
You are required to calculate the Brand Value for Techno Ltd. [4+6]
Answer:
(a) There are many professionals who play an essential role in the successful completion of a
deal.
(i) Investment Bankers: Investment bankers are always at the forefront of the acquisition
process. They offer strategic and tactical advice, screen potential buyers and sellers,
make initial contact with a seller and buyer and provide negotiation support,

Answer to PTP_Final_Syllabus 2012_Jun2014_Set 3
Academics Department, The Institute of Cost Accountants of India (Statutory Body under an Act of Parliament) Page 20
valuation and deal structuring. (ii) Lawyers: The legal framework surrounding a typical transaction has become so
complicated that no one individual can have sufficient expertise to address all the
issues. So, legal teams consist of more than a dozen lawyers each of whom
represents a specialised aspect of the law.
(iii) Accountants: Accountants perform the role of auditors by reviewing the target's
financial statements and operations through a series of interviews with senior and
middle level managers. (iv) Valuation Experts: They build models that incorporate various assumptions such as
costs or revenues growth rate. (v) Institutional Investors: Institutional investors can announce how they intend to vote on
a matter and advertise their position in order to seek support and have more
influence. (vi) Arbitrageurs: Arbitrageurs provide market liquidity during transactions. With the
number of merger arbitrageurs increasing, they are becoming more proactive in
trying to anticipate takeover situations. Their objective is to identify the target before
the potential acquirer is required by law to announce its intentions.
(b)
TECHNO LTD.
Computation of Brand Value (Amount in ` Crores)
Year ended March 31st 2014 2013 2012
EBIT (`) 696.03 325.65 155.86
Less : Non-brand income (`) 53.43 35.23 3.46
Adjusted Profits (`) 642.60 290.42 152.40
Inflation Compound Factor @ 8% 1.000 1.087 1.181
Present Value of Profits for the brand (`) 642.60 315.69 179.98
Weightage Factor 3 2 1
Weightage Profits (`) 1927.80 631.38 179.98
Weightage Average Profit (`)
123
98.17938.63180.1927
456.53
Remuneration of Capital
(5% of Average capital employed) i.e. ` 1112 × 5%
55.60
Brand Related 400.93
Corporate tax @ 35% 140.33
Brand Earning 260.60

Answer to PTP_Final_Syllabus 2012_Jun2014_Set 3
Academics Department, The Institute of Cost Accountants of India (Statutory Body under an Act of Parliament) Page 21
Capitalization Factor 16%
Brand Value: (Return / Capitalization Rate)
260.60 / 0.16 = ` 1628.75 Crore
Question 9.
(a) The stock of MOULIN LTD is currently trading at `500 and call option exercisable in three
months time and has an exercise rate of `488. The standard deviation of continuously
compounded stock price change for MOULIN LTD is estimated to be 20% per year. The
annualized Treasury bill rate corresponding to this option life is 6% p.a. The company is going
to declare a dividend of `15 and it is expected to be paid in two months time. Requirements:
(i) Determine the value of a three-month call option on the stock of MOULIN LTD (using Black Scholes model)
(ii) What would be the value of Put Option if the current price of stock is considered to be `
485.15?
Note: Extracted from tables:
(1) Natural Logarithm: In (0.99416) = - 0.005857
In (1.02459) = 0.024929
(2) Value of e – x : e – 0.02 = 0.9802, e – 0.015 = 0.9851
(3) For N (x) : Where X ≥ 0 : N(0.1414) = 0.5562
N(0.0414) = 0.5165
Where X ≤ 0 : N( - 0.144) = 0.4438
N(- 0.0414) = 0.4835
(4) PVIF (6%, 0.25 years) = 0.9852, PVIF (6%, 1/6 years) = 0.9901
(b) Identify the Factors that favour external growth and diversification through Mergers and
Acquisitions? [(5+2)+3]
Answer: (a)
(i) Since dividend is expected to be paid in two months time, we have to adjust the
stock price and then use Black and Scholes model to value the option.
P.V. of the expected dividend: 15 x 0.9901 = `14.85
Dividend adjusted stock price: `500 – `14.85 = ` 485.15
Valuation of CALL OPTION: (using Black & Scholes Mode)
Vo = Vs. N(d1)- Ee -rtN(d2)
Where, Vs = current price of stock (adjusted) = ` 485.15
E = exercise price = `488, r = Risk free rate = 0.06
tσ
tx]2σi/2[r/E)s(VIn1
d

Answer to PTP_Final_Syllabus 2012_Jun2014_Set 3
Academics Department, The Institute of Cost Accountants of India (Statutory Body under an Act of Parliament) Page 22
= 0.250.20
0.25x]21/2(0.020)[0.068)(488.15/48In
= 0.20)/0.100.005857(0.10
0.02(0.99416)In
= 0.1414
d2 = 0.1414 – 0.10 = 0.0414
N (d1) = N (0.1414) = 0.5562
N (d2) = N (0.414) = 0.5165
Value of call option (Vo) = Vs. N (d1) – Ee –rtN(d2)
Where e –rt = e - 0.06+ 0.25 = e – 0.015 = 0.9851
Therefore, Vo = (485.15 × 0.5562) - (488 × 0.9851 × 0.5165) = 269.84 - 248.30 = ` 21.54
(ii) Value of Put option : Xe –rt [1 – N(d2) – S [1 – N(d1)]
= 488 × 0.9851 [1 – 0.5165] – 485.15 [ 1- 0.5562]
= 232.43 – 215.31 = `17.12
(b) Factors that favour external growth and diversification through Mergers and Acquisitions:
(i) Some goals and objectives may be achieved more speedily through an external
acquisition.
(ii) The cost of Building an organization internally may exceed cost of an acquisition.
(iii) There may be fewer risks, lower costs, or shorter time requirements involved in
achieving an economically feasible market share by the external route.
(iv) The firm may not be utilizing their assets or arrangement as effectively as they could
be utilized by the acquiring firm.
(v) The firm may be able to use securities in obtaining other companies, where as it
might not be able to finance the acquisition of equivalent assets and capabilities
internally.
(vi) There may be tax advantages.
(vii) There may be opportunities to complement capabilities of other firms.
Question 10.
(a) A company has a capital base of `3 crore and has earned profits of `33 Lakhs. Return on
investment of the particular industry to which the company belongs is 12.5%. If the services of
a particular executive are acquired by the company, it is expected that the profits will
increase by `7.5 lakhs over and above the target profit. Determine the amount of maximum
bid price for that particular executive and the maximum salary that could be offered to him.
Particulars `

Answer to PTP_Final_Syllabus 2012_Jun2014_Set 3
Academics Department, The Institute of Cost Accountants of India (Statutory Body under an Act of Parliament) Page 23
Capital Base 3,00,00,000
Actual profit 33,00,000
Target profit (`3Cr ×12.5%) 37,50,000
(b) Describe the situations when FCFE models and dividend discount valuation models provide
similar as well as dissimilar results. [5+5]
Answer: (a)
(i) Maximum Salary Payable:
Particulars ` Lakhs
Capital Base 300.00
Target Profits (= Capital Base x 12.50%) 37.50
Add: Extra Profits due to induction of the Executive 7.50
Total Profits of the Company
(anticipated after induction of the Executive)
45.00
Less: Current Profits 33.00
Incremental Profit 12.00
Maximum Salary = Incremental Profit due to introduction = `12.00 Lakhs per annum.
(ii) Maximum Bid Price:
= Value of Salary Payable in perpetuity
= Maximum Salary Payable ÷ Desired Rate of Return on Investment
= `12 Lakh ÷ 12.5% = `96 Lakhs.
(b) FCFE model is alternative to dividend discounting model. But at times both provide similar
results.
When result obtained from FCFE and Dividend discount model may be same:
(i) Where dividends are equal to FCFE.
(ii) Where FCFE is greater than dividends but excess cash (FCFE - dividends) is invested in
projects with NPV = 0 (Investments are fairly priced)
When results from FCFE and Dividend discounting models are different:
(i) When FCFE is greater than dividends and excess cash earns below market interest
rates or is invested in negative NPV - value projects, the value from FCFE will be
greater than the value from discount model.

Answer to PTP_Final_Syllabus 2012_Jun2014_Set 3
Academics Department, The Institute of Cost Accountants of India (Statutory Body under an Act of Parliament) Page 24
(ii) When dividends are greater than FCFE, the firm will have to issue either new stock or
new debt to pay their dividends- with attendant costs.
(iii) Paying too much of dividend can lead to capital rationing constraints when good
projects are rejected, resulting in loss of wealth.
Conclusion:
The dividend model uses a strict definition of cash flows to equity, i.e. expected dividends
on stock, while FCFE model uses an expensive definition of cash flows to equity as the
residual cash flows after meeting all financial obligations and investment needs.
When the firms have dividends that are different from FCFE, the values from two models
will be different.
In valuing firms for takeover or where there is reasonable chance of changing corporate
control, the value from the FCFE provides the better value.