answer to mtp final syllabus 2012 dec2013 set 1
TRANSCRIPT

Answer to MTP_Final_Syllabus 2012_Dec2013_Set 1
Directorate of Studies, The Institute of Cost Accountants of India (Statutory Body under an Act of Parliament) Page 1
Paper 15 - Business Strategy & Strategic Cost Management
Section A
Question No. 1 & 2 are compulsory. Answer any two questions from the rest.
1. Tangy spices Ltd, the countries’ biggest spices marketer has decided to launch a hostile bid
for Italy’s major spice marketer Chilliano. This is a rare case of an Indian company making an
unsolicited hostile bid for a foreign company. The Tangy Spices Ltd. has competencies in Indian
spices. The major destination markets for the Tangy spices Ltd. exports have been the Europe
and America. The competencies of Chilliano lie in Italian herbs and spices. The Indian company
with the takeover wishes to synergies its operations in the world market. It also wants to take
advantage of the reach enjoyed by the Italian company in several countries where its products
are not being sold presently.
The move of hostile takeover follows Chilliano’s rejection to an agreement entered a year back.
At that time Chilliano was suffering losses and it offered majority shares at a price of € 2.25. A
total of 20% shares were transferred at that time. In one year Chilliano was able to turnaround its
operations and the company made handsome profits in the last quarter. The promoters who
have residual holding of 35% in the company are reluctant to transfer the shares now. They have
rejected the agreement with a plea that the earlier offer price was not sufficient.
Tangy spices Ltd has revised its offer to € 2.95. By this lucrative offer some of the large
shareholders of Chilliano reveal their interest for selling their stakes. On the other hand,
promoters maintained their position on this matter. Through the process of buying of shares in the
market the Tangy spices Ltd. gradually consolidated its holding in Chilliano to 45%. Being a
major shareholder they were ready for a takeover. At the same time, Tangy spices Ltd. was
trying hard to improve their position so that they do not leave any space for Chilliano’s
promoters in future.
Read the above case and answer the following questions:
Q (i) What strategic alternative is followed by Tangy spices Ltd? [4]
Answer.
There are different general strategic alternatives which are also known as Grand Strategies.
(1) Stability
(2) Expansion
(3) Retrenchment
(4) Combination
Expansion is the most popular strategy followed by organization. In expansion strategy,
organizations can expand their operations through acquisition route. Here Tangy Spicy Limited is
following up the expansion strategy by acquiring the Chilliano of Italy.
Q (ii) Is the hostile takeover by an Indian company appropriate? [3]
Answer.
Hostile takeovers are extremely expensive. Acquirer need to be ready to pay extra price than
market price of equity. It should be done when a cash rich company sees strategic advantage
in that acquisition. Indian companies can do the hostile takeover provided that takeover help
them to position much stronger in the market. Additionally, price paid for takeover should be in
line with the strengths or values to be achieved from that takeover. For example, Corus
acquisition by TATA STEEL is an example of hostile takeover but takeover positioned the TATA as

Answer to MTP_Final_Syllabus 2012_Dec2013_Set 1
Directorate of Studies, The Institute of Cost Accountants of India (Statutory Body under an Act of Parliament) Page 2
market leader in steel manufacturing capacity and technologies. So looking at this takeover, it seems if hostile takeover is done with proper long‐term strategy than it is quite appropriate for
the Indian companies.
Q.(iii) Why the Tangy Spices Ltd. is interested in this takeover? [4]
Answer.
The Tangy Spices Ltd. has competencies in Indian spices. The major destination markets for the
Tangy spices Ltd. exports have been the Europe and America. The competencies of Chilliano lie
in Italian herbs and spices. Tangy with this takeover will synergies its operations in the world
market, particularly in Europe and America—its major exports markets. It also wants to take
advantage of the reach enjoyed by the Italian company in several countries where its products
are not beng sold presently. Further, rejection of promoters to transfer the shares as agreed in an
agreement entered a year back also prompted the Tangy to go for his takeover.
Q.(iv) Why the promoters are reluctant to transfer the shares after the agreement? [4]
Answer.
Around a year back, the promoters of Chilliano had agreed to transfer the equity share to Tangy
at € 2.25 per share. But in one year, Chilliano was able to turnaround its operations and the
company made handsome profits in the last quarter. The promoters who have residual holding
of 35% in the company become reluctant to transfer the shares now. They have rejected the
agreement with a plea that the earlier offer price of € 2.25 per share was not sufficient. So, it is a
case where promoters either feel that they are not getting right value for their equity or they do
not intend sell equity due to increased profitability of company in the recent past.
2. Meters Limited is a company engaged in the designing, manufacturing, and marketing of
instruments like speed meters, oil pressure gauges, and so on, that are fitted into two and four wheelers. Their current investment in assets is around ` 5 crores and their last year turnover was
Rs. 15 crores, just adequate enough to breakeven. The company has been witnessing over the
last couple of years, a fall in their market share prices since many customers are switching over
to a new range of electronic instruments from the angle of mechanical instruments that have
been the mainstay of Meters Limited.
The Company has received a firm offer of cooperation from a competitor who is similarly placed
in respect of product range. The offer implied the following:
(i) transfer of the manufacturing line from the competitor to Meters Limited;
(ii) manufacture of mechanical instruments by Meters Limited for the competitor to the
latter's specifications and brand name; and
(iii) marketing by the competitor.
The benefits that will accrue to Meters Limited will be better utilization of its installed capacity
and appropriate financial compensation for the manufacturing effort. The production manager
of Meters Limited has welcomed the proposal and points out that it will enable the company to
make profits. The sales manager is doubtful about the same since the demand for mechanical
instruments in shrinking. The chief Executive is studying the offer.
Read the above case and answer the following questions:
Q.(i) What is divestment strategy? Do you see it being practised in the given case? Explain. [4]

Answer to MTP_Final_Syllabus 2012_Dec2013_Set 1
Directorate of Studies, The Institute of Cost Accountants of India (Statutory Body under an Act of Parliament) Page 3
Answer.
Divestment strategy involves retrenchment of some of the activities in a given business of the company or sell‐out of some of the businesses. This strategy is largely followed in the following
cases Obsolescence of product/process Business becoming unprofitable High competition
Industry overcapacity Retrenchment Strategy also includes turnaround of declining business
operations. I don’t believe this is being completely followed over here. The company is mainly
planning a turnaround of business operation through manufacturing other organization’s
products in order to better utilize the manufacturing capacity. However, it seems customers are
switching from mechanical instruments to electronic instruments, so this strategy should not be
viewed as turnaround of business operations or divestment strategy.
Q.(ii) What is stability strategy? Should Meters Limited adopt it? [4]
Answer.
If a firm is opting for stability of business operations by staying in the same business, same
product, market and functions, and firm normally maintains same levels of effort as at present,
then it is known as stability strategy. The main aim of this strategy is to enhance functional
efficiencies, better deployment and utilization of resources. Meters Limited should not adopt the
stability strategy. In this strategy, Meters Limited will continue manufacturing the mechanical
meters with improved utilization of capacity and reduced costs but w know that market is losing
customers base for mechanical meters.
Q(iii) What is expansion strategy? What are the implications for Meters Limited in case it is
adopted? [4]
Answer.
Expansion strategy is the most popular strategy and most of the business organizations opt for
expansion strategy because this strategy prompts for the growth of business organizations.
There are two key types of expansions strategy
(1) Intensifications
(2) Diversifications
Both of them are growth oriented strategies; the difference lies in the way by which the firm
actually pursues the growth.
Intensification involves the following:
Product Development
Market Penetration
Market Development
Diversification involves the following:
Vertically integrated diversification
Horizontally integrated diversification
Concentric diversification
Conglomerate diversification
Yes, company should adopt expansion strategy by adopting intensifications category. In
intensification strategy, company can initially focus on product development i.e. developing
new electronic instruments and then they can follow market penetration and market
development

Answer to MTP_Final_Syllabus 2012_Dec2013_Set 1
Directorate of Studies, The Institute of Cost Accountants of India (Statutory Body under an Act of Parliament) Page 4
Q.(iv) What are your suggestions to the Chief Executive? [3]
Answer.
My suggestions to chief executive will be the following: for the time being, till the time new
products are developed, we can accept the offer of other organization to manufacture their
products for better utilization of capacity but we have to be cautious about competition / sales
of products in the same category and that should be properly laid out in the agreement. However, in the long‐term, we should focus on new products developments and try to expand
product range by including the manufacturing of electronic instruments.
3. (a) What is the difference between the corporate strategy and business strategy ? [2]
Answer.
Corporate strategy is the most general level of strategy in an organisation. In the words of
Johnson and Scholes, corporate strategy is concerned with what, type of business, the company
as a whole should be in and is therefore concerned with decisions of scope. Business strategy however relates to how an organisation approaches a particular market, or
the activity of a particular business unit. Accordingly, while corporate strategy states some general level of various strategies, the
company would pursue, business strategy contains detailed strategy-at the micro level of the
same unit.
(b) Write short note on Merger / Acquisition Strategy. [4]
Answer. ‘Merger’ is the joining of two separate companies to form a single company. It may be brought
about in two ways: (i) Acquisition of one business unit by another, or (ii) Creation of a new company by complete consolidation of two or more units.
A Combination of two or more business units in which one acquires the assets and liabilities of
the other in exchange for cash or shares and /or debenture, is generally known as ‘Merger’
through acquisition or absorption. When all the combining units are dissolved and a new
company is formed to take over the assets and liabilities of those units against issue of new
shares or debentures, it is described as ‘amalgamation’ or consolidation. Merger by way of
acquisition as well as merger by way of amalgamation is widely recognised as desirable
strategies of external growth. Instances of ‘Mergers’, ‘Acquisitions’ and ‘Amalgamation’ are many in India. ACC was formed
by an amalgamation of 11 Cement companies. An example of merger through acquisition is the purchase of the Jamshedpur Bearings Unit of
Meta Box Ltd. by TISCO. Reasons for merger and acquisitions may be Buyer’s motives: Increasing the firm’s growth rate;.
Making a good investment;
Answer to MTP_Final_Syllabus 2012_Dec2013_Set 1
Directorate of Studies, The Institute of Cost Accountants of India (Statutory Body under an Act of Parliament) Page 5
Improving the stability of the firm’s earnings and sale;
Balancing product line;
Diversifying the product line;
Reducing competition by purchasing a competitor;
Increasing efficiency and profitability; and
Tax reasons.
Sellers’ motives: Increasing the value of owner’s stock and investment;
Acquiring the resources to stabilize operations and make them more efficient;
Dealing with top management problems;
Diversifying its owner’s family holding beyond a firm and tax reasons.
(c) Explain the linkage between environmental analysis and strategic management.
Answer:
Environmental analysis has three basic goals. First, the analysis should provide an understanding
of current and potential changes taking place in the environment. It is important that one must
be aware of the existing environment. At the same time one must have a long term perspective
too. Second, environmental analysis should provide inputs for strategic decision making. Mere
collection of data is not enough. The information collected must be used in strategic decision
making.
Third, environmental analysis should facilitate and foster strategic thinking in organisations -
typically a rich source of ideas and understanding of the context within which a firm operates. It
should challenge the current wisdom by bringing fresh view points into the organisation.
To be specific, the benefits of environmental study are as follows:
(a) Development of broad strategies and long-term policies of the firm.
(b) Development of action plans to deal with technological advancements.
(c) To foresee the impact of socio-economic changes at the national and international levels on
the firm’s stability.
(d) Analysis of competitor’s strategies and formulation of effective counter measures.
(e) To keep one self dynamic.
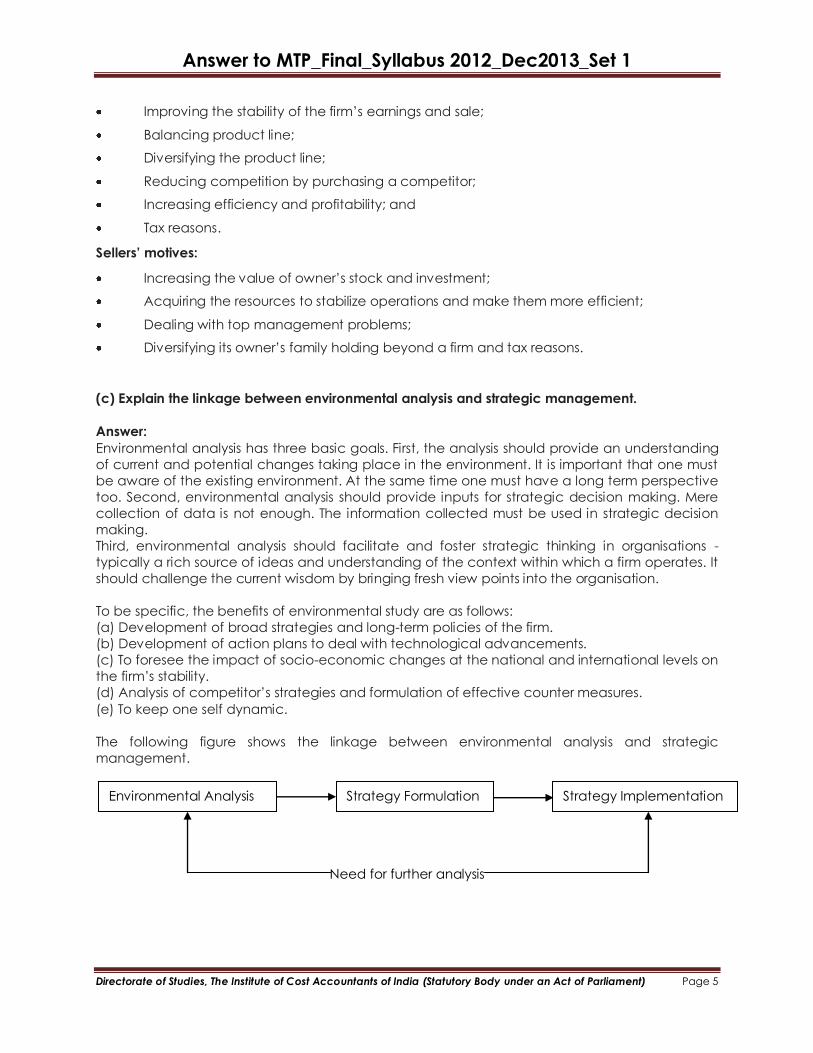
The following figure shows the linkage between environmental analysis and strategic
management.
Need for further analysis
Strategy Implementation Strategy Formulation Environmental Analysis

Answer to MTP_Final_Syllabus 2012_Dec2013_Set 1
Directorate of Studies, The Institute of Cost Accountants of India (Statutory Body under an Act of Parliament) Page 6
4. Why Environmental Scanning? Explain in detail. [10]
Answer:
Environmental scanning also referred as the basic monitoring system, is the process of monitoring
economic, competitive, technological, socio-cultural, demographic and political setting to
determine opportunities for and threats to the firm. Such an analysis involves information
compiling, processing and forecasting the above conditions.
Scanning of environmental forces is a stupendous task in view of their rapidly changing
character. This is much more different in the case of international environment which is highly
complex, turbulent and tumultuous. Even then this exercise is undertaken by every firm and more
so by a multinational firm if it has to survive successfully and growamidst highly volatile and
dynamic environment. Failure to monitor and evaluate the external environment in today’s
world can have serious and a very negative consequence.
A multinational firm can set its future directions and targets of performance and formulate the
most suitable strategy only when it has been able to visualise and perceive the opportunities
and constrain in store for it. Visualisation and perception of business opportunities and threats
arising out of developments inside and outside the country are, therefore essential for
comprehensive environmental scanning because both the favourable and unfavorable
components are inherent in the overall environment.
The environment may offer major profit opportunities due to anticipated economic,
sociopolitical and industrial trends and new opportunities in the market/product/customer
segments which the company can readily exploit particularly in the case of technological
advances. In the same vein, an economic downturn, an adverse social or political condition,
structural changes in an industry, market decline or product obsolescence, competitive threats
and, above all, tight financial market can pose considerable treats that greatly limit a
company’s range of choices.
The entire environmental frame work and its component parts, are dynamic and the pace of
change is tremendous and such as change affects the market for the firm’s present products,
the prospects for future and market choices. The environmental changes may threat on the
established strategies and call upon the management to be alert to the possibility that the
opportunity they have seized will soon expire. They may also provide new opportunities in terms
of new market needs which the management can satisfy. No international firm can remain
oblivious to these environmental developments which are relevant to its own sphere of
operation. It has not to adjust itself in consonance with environmental changes. In order to
respond the environment, the management should attempt to predict changes in different
environmental forces and discern the opportunities and threats emanating from changes in the
environment. It is inevitable because it takes sometime for the enterprise to bring about
necessary changes in the organisation. The more energy in international firm devotes to
environmental appraisal, the greater is the capacity to survive.
Environmental appraisal enables the firm to get clear idea about the existing competitors, their
current operations and future plans. This is inevitable if the firm has to formulate strategy to
counteract the competitors’moves. If the competitor is on something, it needs to be
investigated, otherwise the competitor’s move could lead to his pulling ahead, growing faster
and becoming more profitable. Assessment of the foreign competitive situation also is important
while considering any foreign environment. Itwill always be in the interest of the international firm
to ascertain how many local rivals are there and how good they are, if the rivals are very
efficient and their products excellent and their marketing superb, then the situation is much

Answer to MTP_Final_Syllabus 2012_Dec2013_Set 1
Directorate of Studies, The Institute of Cost Accountants of India (Statutory Body under an Act of Parliament) Page 7
different than if there are no competitors, or if the firms in the country are inefficient. A
multinational firm scanning alternative possibilities might well avoid a country, at least
temporarily that offers strong domestic or other foreign competition. This is especially true if the
market is relatively small or saturated.
Environment appraisal enables the management to predict future development to make the
invisible more visible and, thus, lessen the uncertainty about the future in the face of
spectacular, powerful and rapid environmental changes. Those who foresee the critical
changes that affect the firm will have a far better chance of being successful than those who
will not be able to do so.
Thus, the management has to search the environment to determine which factors pose threat to
the firm’s present product-market strategy and accomplishment of objectives and which
environment forces present opportunities for greater accomplishment of objectives by adjusting
the firm’s current strategy. No organisation can afford to ignore changes in technology,
competitive environment, government policy or changes in social values. If it does not react to
the demands of the environment by changing its strategy, it is counting decline or extinction.
Input-output relationship between a firm and environment also necessitates environmental
scanning. A firm, in order to function, must produce various inputs as human, capital,
managerial, and technical from the environment. These inputs are then converted into goods
and services and made available to those living in the environment. Thus, firm’s operations
regarding acquisition of quantum and kinds of input and distribution of output are subject to
environmental influences.
The management must also scan the environment of home as well as host countries so as to
fund out what are the diverse claims and expectations of different sections of the society which
the firm has to fulfill in order to be socially acceptable. These claims need to be accorded due
weight age while formulating overall as well as subsidiary level objectives, policies and
strategies.
While scanning environment the management must remember that such an appraisal facilitates
spotting of opportunities at the level of an industry rather than at firms or products level. As a
result of this aggregation, management decision loses the sharpness needed for choosing a
particular product-market. Furthermore, environmental analysis fails to answer whether the
desired economic and technological potential existing within a particular industry will be
available to the firm. The prospects in an industry as a whole are not necessarily the same for an
individual firm particularly when the total industry capacity substantially exceeds the demand.
Along with this, the determination of opportunities or threats is often as much a function of the
perception and the attitude of the management as it is of the factor itself. For example, there
are two factors, viz., increased government interference and competition increasingly centered
on technical specification of the control system as well as the machine. To the management
wedded to a philosophy of no government intervention of any type, both factors appear to be
a threat. However, to the management with less rigid attitudes a great opportunity is opened up
in terms of a chance to break into an existing competitor’s historical preserve by product
innovation for which the government subsidises part of the best and also instigates the risk
through adverse orders for prototypes or trail in factories. Thus, both factors seem equally valid
and yet the same basic factors are merely viewed with different attitudes. To the enterprising
arrangement, all changes offer new opportunities and the change to generate new alternatives
for an existing business.

Answer to MTP_Final_Syllabus 2012_Dec2013_Set 1
Directorate of Studies, The Institute of Cost Accountants of India (Statutory Body under an Act of Parliament) Page 8
5. Write a note on Tows Matrix. (10)
Answer.
The TOWS Matrix, is an important strategy formulation matching tool. The TOWS Matrix postulates
the following four alternatives strategies.
WT Strategy: The WT or the mini-mini strategy seeks to minimise the weaknesses and threats.
Some of the weakness may be overcome or minimised. For example, managerial weakness may
be solved by change of managerial personnel, training, etc. weakness due to excess manpower
may be addressed to by restructuring and retirement schemes. External threat may be met by
strategic alliance, or other type’s joint ventures. In some cases an unprofitable business that
cannot be revived may be given up.
WO Strategy: The WO or mini-maxi-strategy aims at minimising the weaknesses and maximising
the opportunities. For example, for a textile machinery manufacturer in India the main
weaknesses were dependence on foreign firms for technology and the long time taken to
execute an order. The solutions are to give thrust to R&D to develop technology and measures
to reduce the time lag so as to be is a better position to exploit to the maximum the growing
demand. ST Strategy: The ST or maxi-mini strategy attempts to use the organisations strengths to deal with
the environment threats. For example, a company may use its technological, financial and
marketing strengths to combat a new competition. For example, Hindustan Lever has been
employing this strategy to fight the increasing competition from companies like P&G, Nirma etc. SO Strategy: The SO or maxi-maxi strategy, which is the most desirable and advantages strategy,
seeks to mass up a firm’s strengths to exploit the opportunities. For instance, Hindustan Lever has
been augmenting its strengths (by measures such as the merger of BBLIL into HLL and takeover
of firms in the food business) to exploit the growing potential of the food business.

Answer to MTP_Final_Syllabus 2012_Dec2013_Set 1
Directorate of Studies, The Institute of Cost Accountants of India (Statutory Body under an Act of Parliament) Page 9
(Section B)
Question No.6 is Compulsory. Answer any two questions from the rest.
6. A Company is engaged in the manufactured of edible oil. It has three divisions as under:
(i) Harvesting Oil seeds and transportation thereof to the oil mill.
(ii) Oil Mill, which processes oilseeds and manufactures edible oil. (iii) Marketing division, which packs the edible oil in 2 kg. Containers for sale at `150 each.
The oil Mill has a yield of 1,000 kg. of oil from 2,000 kg. of oilseeds during a period. The marketing
Division has a yield of 500 cans of edible oil of 2 kg. each from every 1,000 kg. of oil.
The net weight per can is 2 kg. of oil.
The cost data for each division for the period are as under:
Harvesting division:
Variable cost per kg. of oilseed `2.50
Fixed cost per kg. of oilseed `5.00
Oil Mill Division:
Variable cost of processed edible oil `10.00 per kg.
Fixed cost of processed edible oil `7.50 per kg.
Marketing Division:
Variable cost per can of 2 kg. of oil `3.75
Fixed cost per can of 2 kg. of oil `8.75
The fixed costs are calculated on the basis of the estimated quantity of 2,000 kg. of oilseeds
harvested. 1,000 kg. of processed oil and 500 cans of edible oil packed by the aforesaid divisions
respectively during the period under review. The other oil mills buy the oilseeds of same quantity at `12.50 kg. in the market. The market price
of edible oil processed by the oil mill, if sold without being packed in the marketing division is `62.50 per kg. of oil.
Required:
(i) Compute the overall profit of the Company of harvesting 2,000 kg. of oilseeds, processing it
into edible oil and selling the same in 2 kg. cans as estimated for the period under review.
(ii) Compute the transfer prices that will be used for internal transfers from (1) Harvesting Division
under the following pricing methods:
1. Shared contribution in relation to variable costs: and
2. Market price.
(iii) Which transfer pricing method will each divisional manager prefer to use? (3+3+4) Solution:
(i) Statement showing profitability of the company
(By harvesting 200 kg. of oilseeds, processing into edible oils and selling the same into
2 kg can)
Harvesting Division Oil Mill Division Marketing Division Total
Output of each
department
2,000 kg. of oilseeds 1,000 kg. of oil
produced
500 cans of 2 kg.
each
Total Cost Variable Cost (`) 5,000
(2,000 kg. x `2.50) 10,000
(1,000 kg. x `10) 1,875
(500 x `3.75) 16,875
Fixed Cost (`) 10,000
(2,000 kg. x 5.00)
7,500
(1,000 kg x `7.50)
4,375 (500 x `8.75)
21,875
Total Cost 15,000 17,500 6,250 38,750
Sales revenue (500 x 5.00) 75,000
Profit 36,250

Answer to MTP_Final_Syllabus 2012_Dec2013_Set 1
Directorate of Studies, The Institute of Cost Accountants of India (Statutory Body under an Act of Parliament) Page 10
(ii) Computation of transfer price (for internal transfer under the following pricing methods):
(a) Shared Contribution in relation to Variable costs: Transfer price from Harvesting Division to Oil Division
= Variable Cost + share Contribution of Harvesting Division in relation to variable Cost =`5,000+`17,222 (Note 2)
=`22,222
Transfer Price from Oil Mill Division to Marketing Division
=Transfer Price from Harvesting Division to Oil Mill Division + Variable Cost of Oil Mill +
Division + Shared Contribution of Oil Mill Division =`22,222 + 10,000 + 34,445 (Note 2)
=`66,667
(b) Market Price: Transfer Price from Harvesting Division to Oil Mill Division
=Market price of 2,000 kg. of Oilseeds transferred to Oil Mill Division =2,000 kg. x `12.50
=`25,000
Transfer Price from Oil Mill Division to Marketing Division
=Market Price of 1,000 kg of edible oil =1,000 kg x `62.50
=`62,500
(iii) Statement showing profitability under different transfer pricing methods
Details From Harvesting
Division to Oil Mill
Division
From Oil Mill
Division to
Marketing
Division
From Marketing
Division to Market 500
cans of 2 kg. each
Shared Contribution
Transfer Price (refer to (ii) (i) `22,222 `66,667 `75,000
Less: (i) Transfer Price ------- (22,222) (66,667)
(ii) Variable Cost (5,000) (10,000) (1,875)
(iii) Fixed Cost (10,000) (7,500) (4,375)
Profit 7,222 26,975 2,083
Market Price Method
Transfer Price (Refer to (ii) (ii) 25,000 62,500 75,000
Less: (i) Transfer Price ------ (25,000) (62,500)
(ii) Variable cost (5,000) (10,000) (1,875)
(iii) Fixed Cost (10,000) (7,500) (4,375)
Total Cost 10,000 20,000 6,250
Decision:
(i) Division Manager of Harvesting Division would like to use Marketing method for transferring
2,000 kg. of oilseeds to Oil Mill Division, because by use of this method, Profit of Harvesting Division would increase by `2,778 (i.e., `10,000-7,222) over the shared contribution method.
(ii) The Manager of the Oil Mill Division would prefer Shared Contribution Method to Market Price
Method, Because the use of this method (Shared Contribution) would increase profit of Oil Mill Division by `6,945 (i.e., 26,9485-20,000) over the Market Price Method.
(iii) The manager of Marketing Division would be benefited by using Market Price Method. This would increase profit of Marketing Division by `4,167 (i.e., 6,250-2,083)
Working Notes: 1. Total Contribution= Sales Revenue- Total Variable Cost= `75,00-`16,875=`58,1525.
2. Amount of Shared Contribution in relation to variable Cost:

Answer to MTP_Final_Syllabus 2012_Dec2013_Set 1
Directorate of Studies, The Institute of Cost Accountants of India (Statutory Body under an Act of Parliament) Page 11
Harvesting Division=(`58,125/16,875) x `5,000=`17,222
Oil Mill Division=(`58,125/16,875) x `10,000=`34,445
Marketing Division=(`58,125/16,875) x 1,875=`6,458
7.
(a) The performance data for the last year and current year of an organization are shown
below:
Last Year Current Year
Sales `80,00,000 92,84,000
Material Cost 50,00,000 61,48,000
Variable Overheads 5,00,000 5,40,000
Labour Cost (fixed) 10,00,000 11,50,000
Fixed Overheads 8,00,000 8,50,000
Total Cost 73,00,000 86,88,000
Profit 7,00,000 5,96,0000
Assess the impact of different factors responsible for decline in profit during the current year,
given the following information:
Average price rise in materials 6%
Average increase in rate or expenses (both variable and fixed) 8%
Average increase in wage rates 10%
Average increase in selling price 5.5%
(10) Solution:
Sales % of last year
Current year’s Sales `92,84,000 105.5%
Less: Due to increase in selling price @ 5.5% 4,84,000 5.5%
Current year’s sales at last year price 88,00,000 100.00%
Last year Sales 80,00,000
Increase in sales volume (It is 10% of Sales of last year.) 8,00,000
Contribution on extra sales at last year (25/80) x 8,00,000= =`2,50,000
Materials:
Current year cost `61,48,000 106%
Less: Due to price rise @ 6%: (61,48,000÷106?) x 6 3,48,000
Current year material at last year price 58,00,000
Less: Last year material consumption plus 10% for increase in
sales volume (50,00,000 + 5,00,000)
55,00,000
Extra consumption 3,00,000
Variable Overheads
Current year Cost `5,40,000 108%
Less: Due to price rise 8%: (5,40,000 ÷ 108) x 8 40,000
Current year at last year’s price 5,00,000
Last year overhead plus 10% increase for sales volume
(5,00,000 + 50,000)
5,50,000
Extra variable Cost over last year (50,000)
Variance Analysis
Items Price/Cost Volume Policy of the
Company
Total
Sales `4,84,000 (F) `2,50,000 (F) `7,34,000 (F)
Material 3,48,000 (A) 3,00,000 (A) 6,48,000 (A)
Variable 40,000 (A) 50,000 (F) 10,000 (F)

Answer to MTP_Final_Syllabus 2012_Dec2013_Set 1
Directorate of Studies, The Institute of Cost Accountants of India (Statutory Body under an Act of Parliament) Page 12
overhead
Labour 1,00,000 (A) 50,000 (A) 1,50,000 (A)
Fixed Overheads 64,000 (A) 14,000 (F) 50,000 (A)
Total 68,000 (A) Nil 36,000 (A) 1,04,000 (A)
A=Adverse Variance
F=Favourable Variance Decline in profit `1,04,000 due to adverse reasons mentioned above.
(b) The Marketing Director of a Company engaged in the manufacture and sales of a range of
products wants to increase the market share and for the purpose proposes to spend `5,00,000 on advertisement campaign.
Two alternatives sales budget have been put forward as under:
Products A B C D
Budget: (Units’000)
A:Before advertisement 360 560 520 300
B:After advertisement 380 590 545 315
The selling prices on variable cost
data are as under:
Selling price/Units `20 `24 `50 `42
Direct materials/Unit `8 `11 `25 `21
Direct Labour/Units `3 `3 `6 `5
Variable Overheads/Unit `2 `2 `4 `3
Direct labour hour rate is `5 per hour. Fixed overheads amount to `51,40,000 per annum. The
production capacity is limited to `15,00,000 direct labour hour for the ensuring year. A and C
however, could be bought on subcontract basis at `17 and `40 per unit respectively for sale.
Required:
Present a statement showing profitability of the proposed scheme and state weather the investment in the advertisement campaign is worthwhile. (10)
Solution:
Calculation of contribution per unit
Particulars A B C D
Selling Price (i) 20 24 50 42
Variable cost:
Direct material 8 11 25 21
Direct Labour 3 3 6 5
Variable overhead 2 2 4 3
(ii) 13 16 35 29
Contribution(i)-(ii) 7 8 15 13
Direct Labour Hours p.u. 0.6 0.6 1.2 1.0
Contribution per Direct Labour hr. 11.67 13.33 12.50 13.0
Rank IV I III II
Calculation of Direct Labour hours required:
As per Budget A (Before advertisement) (Hours)
A 3,60,000 units x 0.6 hr. =2,16,000
B 5,60,000 units x 0.6 hr. =3,36,000
C 5,20,000 units x 1.2 hr. =6,24,000
D 3,00,000 units x 1.0 hr. =3,00,000
Total 14,76,000

Answer to MTP_Final_Syllabus 2012_Dec2013_Set 1
Directorate of Studies, The Institute of Cost Accountants of India (Statutory Body under an Act of Parliament) Page 13
As per Budget B (After advertisement) (Hours)
A 3,80,000 units x 0.6 hr. =2,28,000
B 5,90,000 units x 0.6 hrs. =3,54,000
C 5,45,000 units x 1.2 hrs. =6,54,000
D 3,15,000 units x 1.0 hrs. 3,15,000
Total 15,51,000
Budget B required 51,000 Direct labour hours in excess of 100% capacity of 15,00,000 Direct
Labour hours. Therefore product A or C can be purchased from outside to meet the excess
demand.
Profitability statement (Before advertisement)
Particulars A B C D Total
Units 3,60,000 5,60,000 5,20,000 3,00,000
Contribution p.u. 7 8 15 13
Total Contribution 25,20,000 44,80,000 78,00,000 39,00,000 1,87,00,000
Less: Fixed cost profit 51,40,000
1,35,60,000
Profitability statement if product C is bought on sub-contract basis for balance hours
Particulars A B D C C (Bought
out)
Total
Units 3,80,000 5,90,000 3,15,000 5,02,500 42,500 --------
Direct Labour hrs. p.u. 0.6 0.6 1.0 1.2 ------- --------
Total D.L. Hours 2,28,000 3,54,000 3,15,000 6,03,000 -------- 15,00,000
Contribution p.u. 7 8 13 15 10 -------
Total Contribution 26,60,000 47,20,000 40,95,000 75,37,500 4,25,000 1,94,37,500
Less: Fixed cost 51,40,000
Profit 1,42,97,500
Profitability statement if product A is bought on sub-contract basis for balance hours
Particulars B C D A A (bought
out)
Total
Units 5,90,000 5,45,000 3,15,000 2,95,000 85,000 ---------
Direct Labour hrs. p.u. 0.6 1.2 1.0 0.6 --------- ---------
Total D.L. hrs. 3,54,000 6,54,000 3,15,000 17,70,000 --------- 15,00,000
Contribution p.u. 8 15 13 7 3 ---------
Total contribution 47,20,000 81,75,000 40,95,000 20,65,000 2,55,000 1,93,10,000
Less: Fixed cost 51,40,000
Profit 1,41,70,000
Incremental profit if product C is bought out =1,42,97,500-1,41,70,000 =`1,27,500
Therefore product A can be produced
Profit if advertisement campaign is taken up =1,42,97,500-5,00,000 =`1,42,97,500
Profit, if no advertisement campaign is taken up =`1,35,60,000
Incremental profit if advertisement campaign is
taken up
=1,42,97,500-1,35,60,000 =`7,37,500
Suggestion: Hence it is suggested to take up advertisement campaign and procure product A
from outside for excess direct labour hours over the normal capacity.

Answer to MTP_Final_Syllabus 2012_Dec2013_Set 1
Directorate of Studies, The Institute of Cost Accountants of India (Statutory Body under an Act of Parliament) Page 14
8.
(a) The most recent audited summarized Balance Sheet of Stop and Shop Financial services is
given below:
Liabilities (` in lakhs) Assets (` in lakhs)
Equity Share capital 65 Fixed Assets:
Reserve & Surplus 110 -Assets on lease (Original cost: `550 lakhs)
375
Term Loan from IFCI 80 -Other fixed assets 50
Public Deposits 150 Investments (on wholly owned
subsidiaries)
20
Bank Borrowings 147 Current assets
Other Current Liabilities 50 -Stock on hire 80
-Receivables 30
-Other current assets 35
Miscellaneous expenditure
(not written off)
12
602 602
The Company intends to enhance its investment in the lease portfolio by another `1,000 lakhs.
For this purpose it would like to raise a mix of debt and equity in such a way that the overall cost
of raising additional funds is minimized. The following constraints apply to the way the funds can
be mobilized:
(i) Total debt divided by net owner funds, cannot exceed 10.
(ii) Amount borrowed from financial institutions cannot exceed 25% of the net worth.
(iii) Maximum amount of bank borrowings cannot exceed three times the net owned funds.
(iv) The Company would like to keep the total public deposit limited to 40% of the total debt.
The post-tax costs of different sources of finance are as follows:
Equity 25%
Term Loans 8.5%
Public Deposit 7%
Bank Borrowings 10%
Formulate the funding problem as an LPP.
[Note: Total Debt=Term loans from financial institutions + Public Deposits + Bank Borrowings
Net Worth=Equity Share Capital + Reserve & Surplus Net Owned Funds=Net Worth – Miscellaneous Expenditures.] (10)
Solution:
Step 1. The key decision is to raise funds from equity, term loans, Public deposits and Bank
Borrowings to minimize the post-tax costs.
Step 2.
Let,
X1 be the funds raised from equity.
X2 be the funds raised from term loans.
X3 be the funds raised from public deposits
X4 be the funds raised from bank borrowing. Step 3. Feasible alternatives are sets of values of X1, X2
Where X1, X2, X3, X4 ≥ 0 Formulation of LP model
Minimise Z=0.25X1 + 0.085X2 + 0.07X3 + 0.1X4
Subject to constraints:

Answer to MTP_Final_Syllabus 2012_Dec2013_Set 1
Directorate of Studies, The Institute of Cost Accountants of India (Statutory Body under an Act of Parliament) Page 15
(i) 110x12 - )1X (175
147 150 80 4X 3X 2X i.e., -10X1 + X2 + X3 + X4 ≤ 1,253
(ii) (80 + X2) ≤ 0.25 (175 + X1) i.e., X1 – 4X2 ≥ 145
(iii) (147 + X4) ≤ 3(X1 + 175 – 12)X1 i.e., -3X1 + X4 ≤ 342
(iv) (150 + X3) ≤ 0.4(X2 + X3 + X4 + 377) i.e., -4X2 + 6X3 – 4X4 ≤ 8
(v) X1 + X2 + X3 + X4=1,000
(vi) X1, X2, X3, X4 ≥ 0
(b) Computo Ltd manufactures two parts ‘p’ and ‘Q’ for computer Industry. P: Annual production and Sales of 1,00,000 units at a Selling price of `100.05 per unit.
Q: Annual production and Sales of 50,000 units at a Selling price of `150 per unit.
Direct and Indirect Costs incurred on these two parts are as follows:- (` in thousands)
Particulars P Q Total
Direct Material Cost (Variable) 4,200 3,000 7,200
Labour Cost (Variable) 1,500 1,000 2,500
Direct Machining Costs (See Note) 700 550 1,250
Indirect Costs:
Machine set Up Cost 462
Testing Cost 2,375
Engineering Cost 2,250
Total 16,037
Note: Direct Machining Costs represent the cost of machine capacity dedicated to the
production of each product. These costs are fixed and are not expected to vary over long-run
horizon. Additional information is as follows:-
Particulars P Q
Production Batch Size 1,000 units 500 units
Set up time per batch 30 hours 36 hours
Testing time per unit 5 hours 9 hours
Engineering Cost incurred on each product `8,40,000 `14,10,000
A foreign Competitor has introduced product very similar to ‘P’. To maintain the Company’s share and profit, Computo Ltd. has to reduce the price to `86.25. The Company calls for a
meeting and comes up with a proposal to change design of product ‘P’. The expected effect
of new design is as follows: Direct material Cost is expected to decrease by `5 per unit.
Labour Cost is expected to decrease by `2 per unit.
Machine time is expected to decrease by 15 minutes, previously took 3 hours to produce
1 unit of ‘P’. The machine will be dedicated to the production of new design.
Set up time will be 28 hours for each set up.
Time required for testing each unit will be reduced by 1 hour.
Engineering Cost and Batch Size will be unchanged.
Required:
(i) Company Management identifies that cost driver for Machine Set-Up Costs is ‘set up
hours used in batch setting’ and for Testing Costs is ‘testing time’. Engineering Costs are
assigned to products by special study. Calculate the full cost per unit foe ‘P’ and ‘Q’
using Activity-Based Costing.
(ii) What is the Mark-up on full cost per unit of P?

Answer to MTP_Final_Syllabus 2012_Dec2013_Set 1
Directorate of Studies, The Institute of Cost Accountants of India (Statutory Body under an Act of Parliament) Page 16
(iii) What is the Target Cost per unit for new design to maintain the same mark up
percentage on full cost per unit as it had earlier? Assume cost per unit of cost drivers for
the new design remains unchanged.
(iv) Will the new design achieve the cost reduction target?
(v) List possible management actions that the Computo Ltd. should take regarding new
design. (3+1+2+2+2)
Solution:
(i) Computation of Quantities of Cost drivers
Particulars P Q Total
a. Quantity 1,00,000 units 50,000 units
b. Batch Size 1,000 units 500 units
c. Number of Batches (a ÷ b) 100 batches 100 batches
d. Set Up Time per batch 30 hours 36 hours
e. Total Set Up Time for production (c x d) 3,000 hours 3,600 hours 6,600 hours
f. Testing Time per unit 5 hours 9 hours
g. Total Testing Time for production (a x f) 5,00,000 hours 4,50,000 9,50,000 hours
Computation of ABC Recovery Rates
Activity Activity Cost Pool Cost driver Cost Driver Quantity ABC Rate
Machine Set Up `4,62,000 Set Up Hours 6,600 set Up Hours `70 per hour
Testing `23,75,000 Testing Hours 9,50,000 Testing Hours `2.50 per hour
Note: Engineering Costs are assigned by special study. Hence ABC Rate is not calculated.
Computation of Cost per unit using ABC system
Particulars P Q
Direct Costs:
Direct Material 42,00,000÷1,00,000=42.00 30,00,000÷50,000=60.00
Direct Labour 15,00,000÷1,00,000=15.00 10,00,000÷50,000=20,000
Direct Machining 7,00,000÷1,00,000=7.00 5,50,000÷50,000=11.00
Sub Total Direct Costs 64.00 91.00
Indirect Cost:
Machine Set Up (`70x30hrs) ÷1,000 uts=2.10 (`70x36 hrs) ÷500 uts=5.04
Testing (`2.5 phx5 hours)=12.50 (`2.5 phx9 hours)=22.50
Engineering 8,40,000÷ 1,00,000=8.40 14,10,000÷50,000=28.20
Sub Total Indirect Costs 23 55.74
Total Costs 87.00 146.74
(ii) Markup (or) profit per unit of P=Selling price -Full Cost=`87.0=`13.05 p.u.
Percentage of Markup to full Cost=`13.05÷`87=15% on Cost.
(iii) New Selling Price (given) =`86.25
Less: Target Profit at 15% on Cost i.e. 15/115 on SP=86.25x15/115 =`11.25
Target Cost for New Design of P =`75.00
(iv) Computation of Cost per unit of New Design P
Particulars P
Direct Costs: Direct Material 42.00-5.00=37.00
Direct Labour 15.00-2.00=13.00
Direct Machining (dedicated machine, hence time
saved is not relevant, as the costs continue to be
fixed)
7,00,000÷1,00,000=7.00

Answer to MTP_Final_Syllabus 2012_Dec2013_Set 1
Directorate of Studies, The Institute of Cost Accountants of India (Statutory Body under an Act of Parliament) Page 17
Sub Total Direct Costs 57.00
Indirect Costs: Machining Set Up 1.96
Testing 10.00
Engineering 8.40
Sub Total Indirect Costs 20.36
Total Estimated Costs of New Design P 77.36
Target cost is `75.00 only. Hence, the new design will not achieve the cost reduction target.
Note:
It is assumed that output of P will remain at 1,00,000 units, inspite of the reduction in machine
time. To maintain 15% profit margin, probable SP of New Design P will Be `77.36 + 15%=`88.96
(v) Possible management actions for new design
(a) Value Engineering and Value Analysis to reduce the Direct Material Costs.
(b) Time and Motion Study in order to redefine the Direct Labour time and related costs.
(c) Exploring possibility of cost reduction in costs of Direct Machining.
(d) Identifying non-value added activities and eliminating them in order to reduce
Overheads.
(e) Analysis of effect of sale of New Design P on sale of Q. (f) Analysis of sensitivity of sale quantity of New Design P to price from `86.25 to `88.96.
9.
(a) A Small project is composed of seven activities, whose time estimates (in days) are listed
below. Activities are identified by their beginning (i) and ending (j) node numbers.
Activity (I -j) 1-2 1-3 1-4 2-5 3-5 4-6 5-6
Duration to 2 2 4 2 4 4 6
Duration tm 2 8 4 2 10 10 12
Duration tp 14 14 16 2 28 16 30
(i) Draw the project Network.
(ii) Find the expected duration and variance for each activity. What is the expected project
length?
(iii) If the project due date is 38 days, what is the probability of meeting the due date? (4+3+3)
Solution:
Activity To Tm Tp Te Variance
1 – 2 2 2 14 4 4
1 – 3 2 8 14 8 4
1 – 4 4 4 16 6 4
2 – 5 2 2 2 2 0
3 – 5 4 10 28 12 16
4 – 6 4 10 16 10 4
5 - 6 6 12 30 14 16

Answer to MTP_Final_Syllabus 2012_Dec2013_Set 1
Directorate of Studies, The Institute of Cost Accountants of India (Statutory Body under an Act of Parliament) Page 18
From the above, Critical path is 1 – 3 – 5 – 6, Expected Project Duration is 34 days. Variance of Critical Path Activities = 4 +16 + 16 = 36. Hence standard Deviation = 6 days.
Standard Normal Variate Z = (tr – Tcp) ÷ S. D = (38 – 34) ÷6 = 0.67.
Normal table value of Z = 0.2486. (From the Values from the Normal Tables)
Hence, Probability of completing the project within 38 days = 0.5 NT (Z) = 0.5 + 0.2486 = 74.86%
Probability of not completing the project within 38 days = 100% - 74.86% = 25.14%.
(b) What is Margin of Safety? How it is calculated? How it can be improved? (2+1+2)
Answer: The margin of safety refers to sales in excess of the break-even volume. It represents the
difference between sales at a given activity level and sales at break-even point. It is important
that there should be a reasonable margin of safety to run the operations of the company in
profitable position. A low margin of safety usually indicates high fixed overheads so that profits
are not made until there is a high level of activity to absorb the fixed costs. A margin of safety
provides strength and stability to a concern.
The margin of safety is an important measure, especially in times of receding sales, to
know the
real position to operate without incurring losses and to take steps to increase the margin
of safety to improve the profitability.
Margin of safety is calculated by using the following formula:
Margin of safety = Actual Sales – Break –even Sales
The higher the margin of safety, the better profitability of the product/ product line. The
margin of safety can be improved by adopting any of the following steps:
Keeping the break-even point at lowest level and try to maintain actual sales at
highest level.
Increase in sales volume
Increase in selling price
Change in product mix increasing contribution
Lowering fixed cost
Lowering variable cost
Discontinuance of unprofitable products in sales mix

Answer to MTP_Final_Syllabus 2012_Dec2013_Set 1
Directorate of Studies, The Institute of Cost Accountants of India (Statutory Body under an Act of Parliament) Page 19
(c) What is cost of quality? How it can be reduced? (2+3)
Answer: The cost of quality is the sum of cost of conformance, cost of non-conformance and
cost of lost opportunity. The quality costs amount to somewhere between 5-25% of turnover
depending on industry. The quality cost will be much more if we include the potential loss of
business from the affected customers. With cost of quality accounting for such a large
proportion of turnover any reduction in quality cost will improve profitability and provide
competitive edge to the company.
The quality cost reduction can be achieved in the following two stages :
First, when prevention costs are increased to pay for the right kind of systems
engineering work in quality control, a reduction will occur in rejection, defect and
rework of output. This defect reduction means a substantial reduction in both types of
failure costs.
Secondly, a reduction in defective output will have a positive effect on appraisal costs
because defect reduction means a reduced need for routine inspection and test
activities. It follows that as prevention is increased the need for appraisal decreases.
The end result is a substantial reduction in the cost of quality and an increase in the
level of quality.