answer key lecture tutorials for introductory physical ......crust and mantle 3. draw arrows on...
TRANSCRIPT
Answer Key Lecture Tutorials for
Introductory Physical Geology with Quantitative Reasoning
Original and adapted activities by Eileen Herrstrom
University of Illinois at Urbana-Champaign [email protected]
2019
Context
• The audience for these activities is an introductory physical geology or quantitative reasoning course for non-majors.
• The skills and concepts that students must have mastered involve creating and interpreting graphs (including triangle plots), explaining diagrams, and reading maps.
• These activities are designed to reinforce specific lecture topics and are scattered throughout the course.
Goals
• The content and concept goals for these activities follow those of the lecture topics: earthquakes, plate tectonics, minerals and rocks, volcanoes, geologic time, petroleum, rivers, groundwater, glaciers, and climate change.
• The higher order thinking skills goals for these activities involve making traditional lectures more interactive, holding students’ attention throughout a class and deepening their comprehension and retention of lecture topics.
• Other goals for these activities are to increase attendance in a traditional lecture class and to prepare students for laboratory exercises.
Reference
• The concept and the name “lecture tutorial” originate from the following publication: Kortz, K.M., and J.J. Smay, 2012, Lecture Tutorials for Introductory Geoscience, W.H. Freeman & Co., New York.
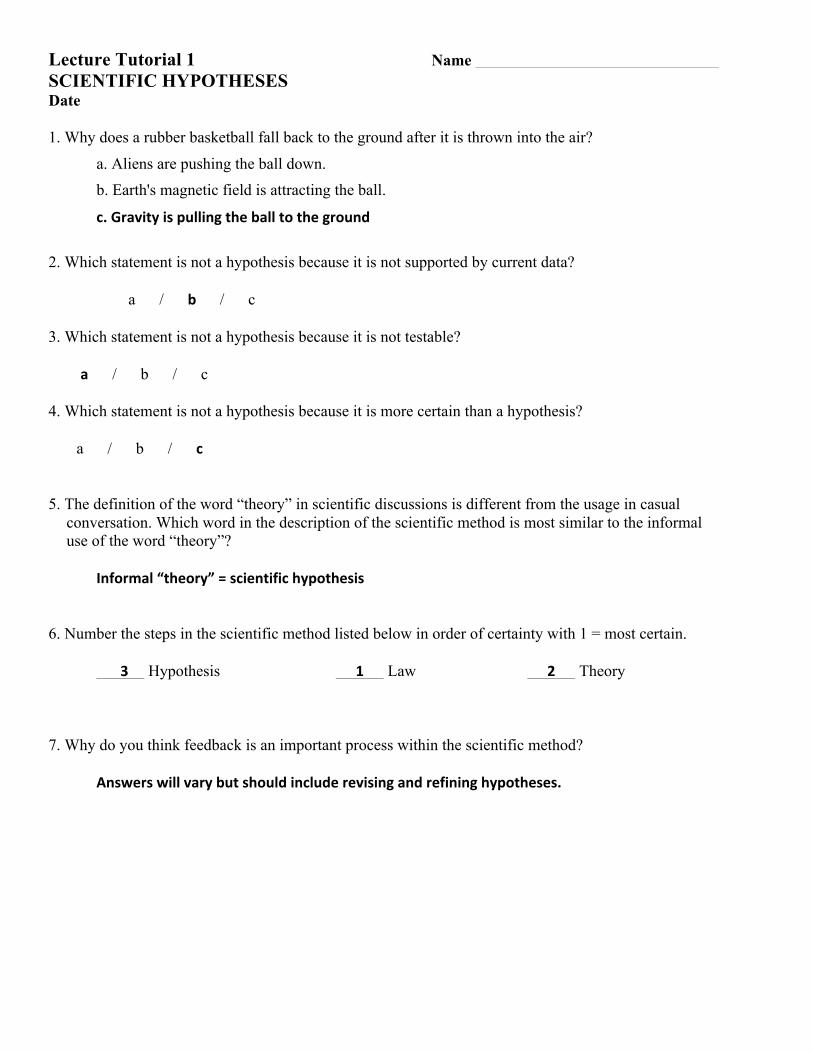
Lecture Tutorial 1 Name SCIENTIFIC HYPOTHESES Date 1. Why does a rubber basketball fall back to the ground after it is thrown into the air?
a. Aliens are pushing the ball down. b. Earth's magnetic field is attracting the ball.
c.Gravityispullingtheballtotheground 2. Which statement is not a hypothesis because it is not supported by current data? a / b / c 3. Which statement is not a hypothesis because it is not testable? a / b / c 4. Which statement is not a hypothesis because it is more certain than a hypothesis? a / b / c 5. The definition of the word “theory” in scientific discussions is different from the usage in casual
conversation. Which word in the description of the scientific method is most similar to the informal use of the word “theory”?
Informal“theory”=scientifichypothesis 6. Number the steps in the scientific method listed below in order of certainty with 1 = most certain. 3 Hypothesis 1 Law 2 Theory 7. Why do you think feedback is an important process within the scientific method? Answerswillvarybutshouldincluderevisingandrefininghypotheses.
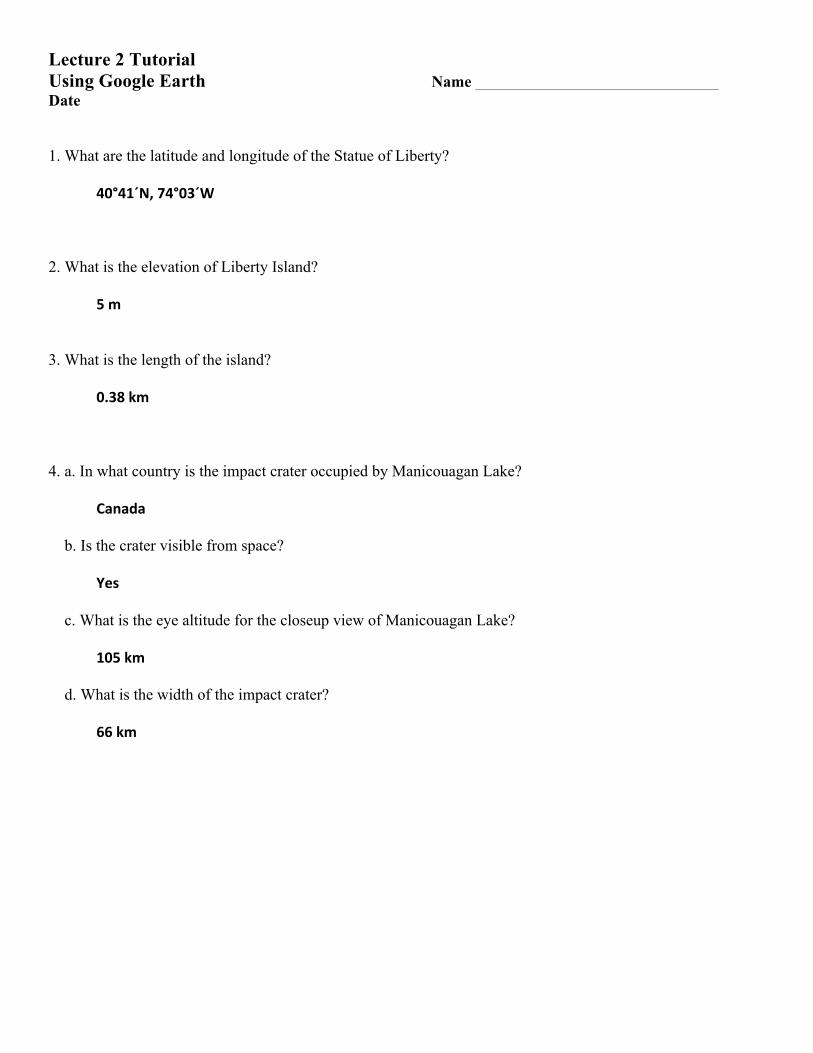
Lecture 2 Tutorial Using Google Earth Name Date 1. What are the latitude and longitude of the Statue of Liberty? 40°41´N,74°03´W 2. What is the elevation of Liberty Island? 5m 3. What is the length of the island? 0.38km 4. a. In what country is the impact crater occupied by Manicouagan Lake? Canada b. Is the crater visible from space? Yes c. What is the eye altitude for the closeup view of Manicouagan Lake? 105km d. What is the width of the impact crater? 66km
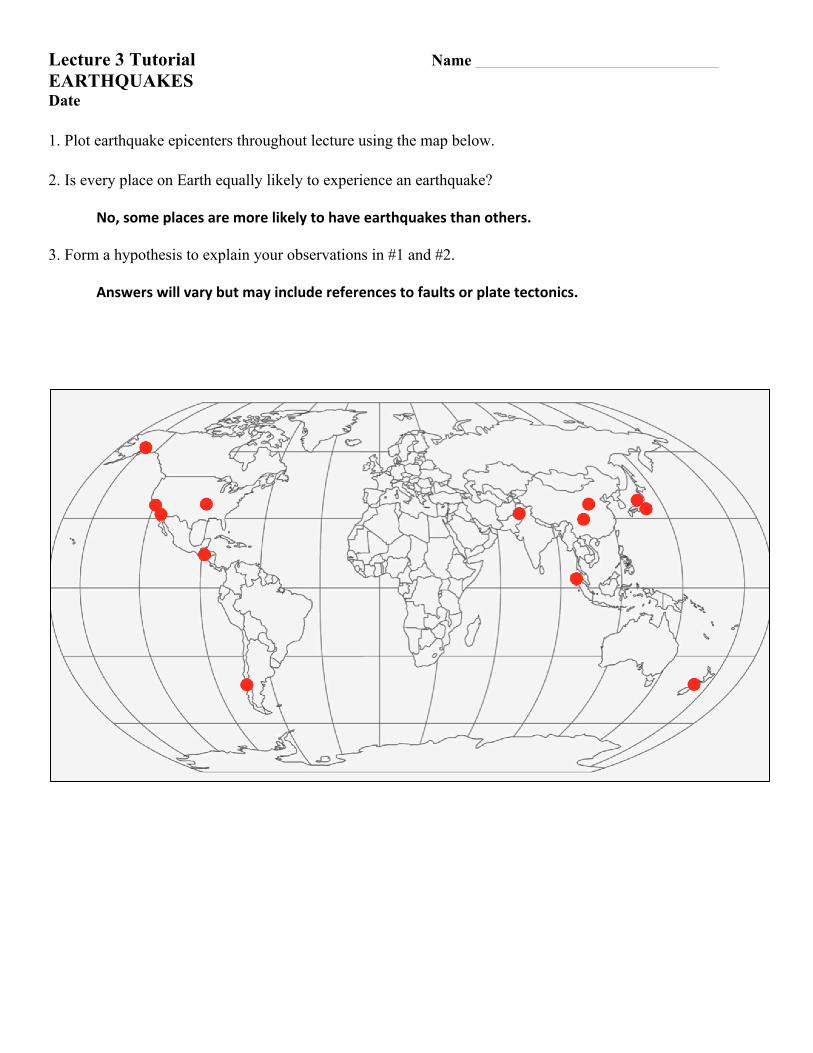
Lecture 3 Tutorial Name EARTHQUAKES Date 1. Plot earthquake epicenters throughout lecture using the map below. 2. Is every place on Earth equally likely to experience an earthquake? No,someplacesaremorelikelytohaveearthquakesthanothers. 3. Form a hypothesis to explain your observations in #1 and #2. Answerswillvarybutmayincludereferencestofaultsorplatetectonics.
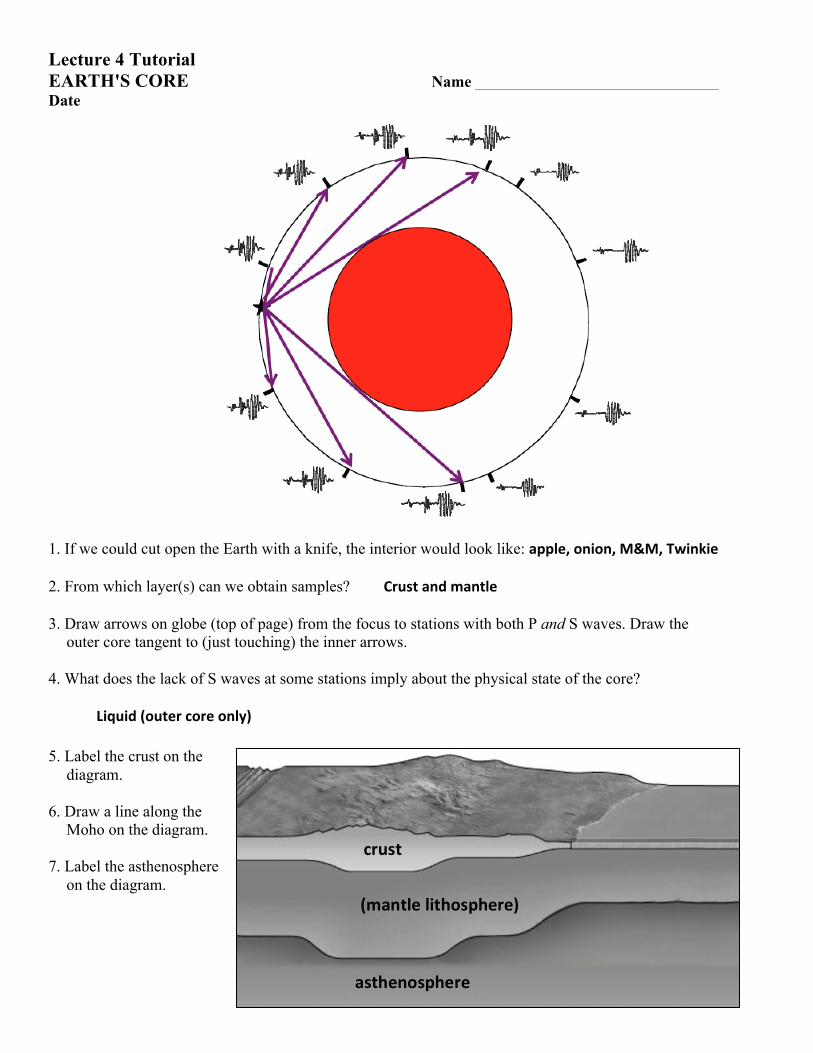
Lecture 4 Tutorial EARTH'S CORE Name Date
1. If we could cut open the Earth with a knife, the interior would look like: apple,onion,M&M,Twinkie 2. From which layer(s) can we obtain samples? Crustandmantle 3. Draw arrows on globe (top of page) from the focus to stations with both P and S waves. Draw the
outer core tangent to (just touching) the inner arrows. 4. What does the lack of S waves at some stations imply about the physical state of the core? Liquid(outercoreonly) 5. Label the crust on the
diagram. 6. Draw a line along the
Moho on the diagram. 7. Label the asthenosphere
on the diagram.
crust
(mantlelithosphere)
asthenosphere
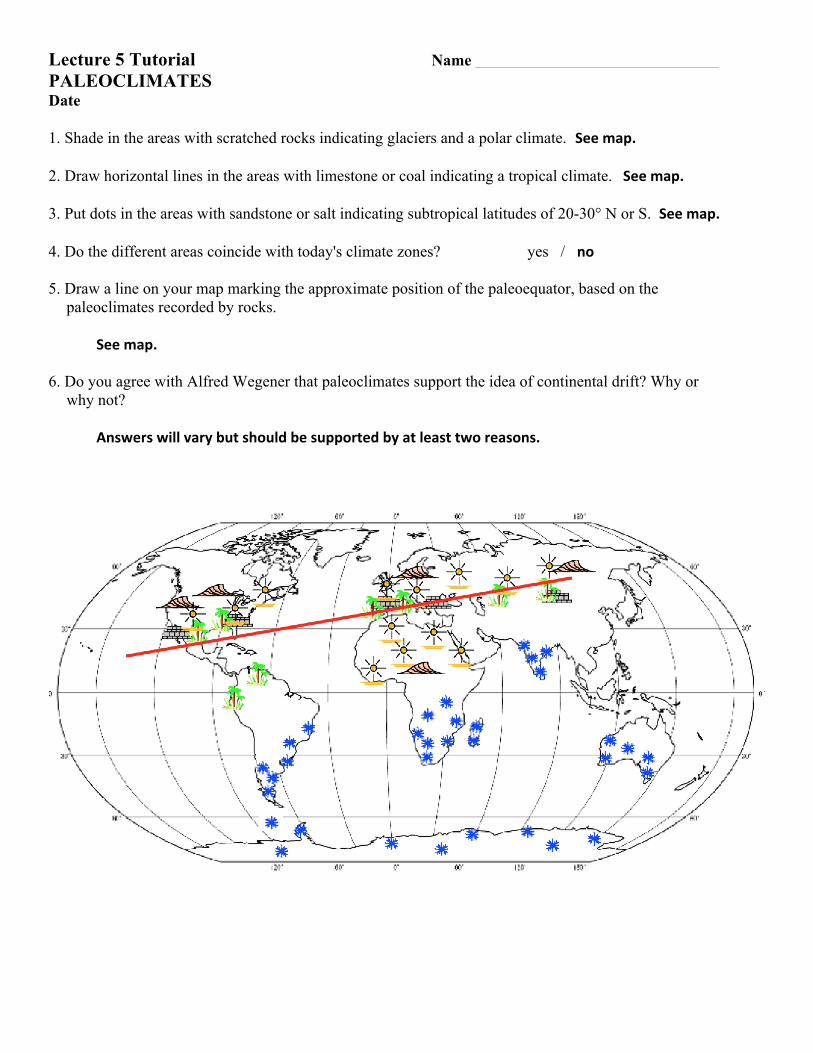
Lecture 5 Tutorial Name PALEOCLIMATES Date 1. Shade in the areas with scratched rocks indicating glaciers and a polar climate. Seemap. 2. Draw horizontal lines in the areas with limestone or coal indicating a tropical climate. Seemap. 3. Put dots in the areas with sandstone or salt indicating subtropical latitudes of 20-30° N or S. Seemap. 4. Do the different areas coincide with today's climate zones? yes / no 5. Draw a line on your map marking the approximate position of the paleoequator, based on the
paleoclimates recorded by rocks. Seemap. 6. Do you agree with Alfred Wegener that paleoclimates support the idea of continental drift? Why or
why not? Answerswillvarybutshouldbesupportedbyatleasttworeasons.
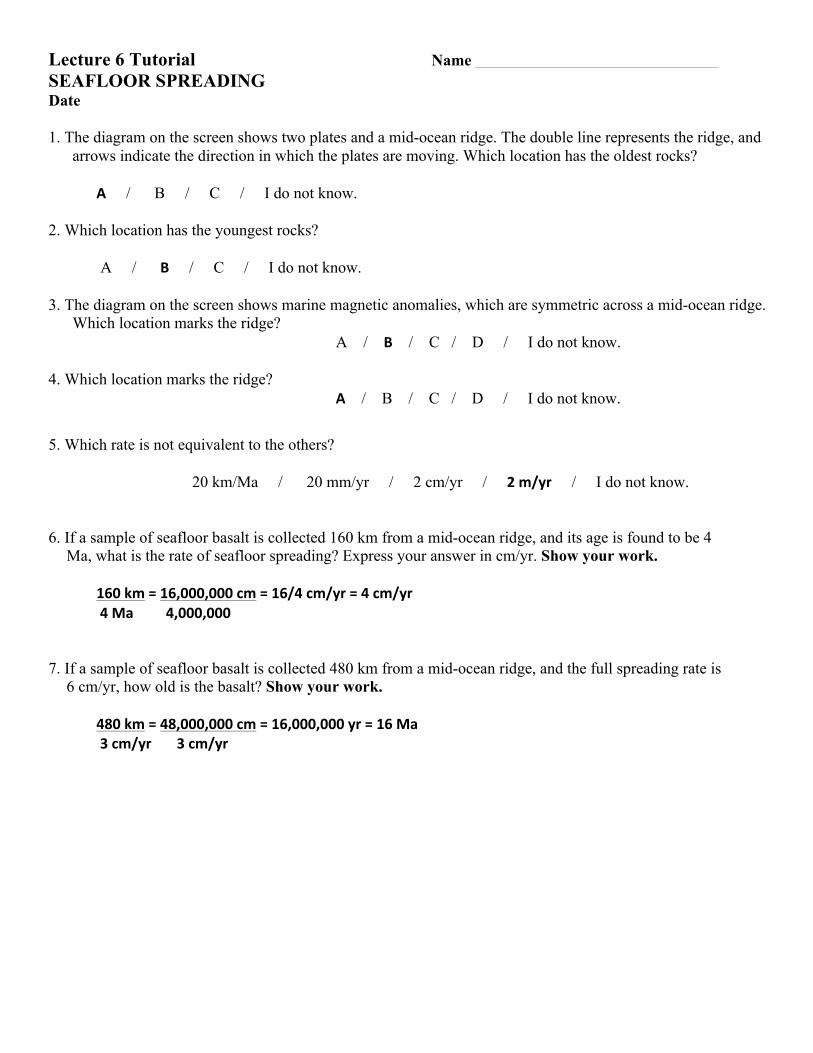
Lecture 6 Tutorial Name SEAFLOOR SPREADING Date 1. The diagram on the screen shows two plates and a mid-ocean ridge. The double line represents the ridge, and
arrows indicate the direction in which the plates are moving. Which location has the oldest rocks? A / B / C / I do not know. 2. Which location has the youngest rocks? A / B / C / I do not know. 3. The diagram on the screen shows marine magnetic anomalies, which are symmetric across a mid-ocean ridge.
Which location marks the ridge? A / B / C / D / I do not know. 4. Which location marks the ridge? A / B / C / D / I do not know.
5. Which rate is not equivalent to the others? 20 km/Ma / 20 mm/yr / 2 cm/yr / 2m/yr / I do not know. 6. If a sample of seafloor basalt is collected 160 km from a mid-ocean ridge, and its age is found to be 4
Ma, what is the rate of seafloor spreading? Express your answer in cm/yr. Show your work. 160km=16,000,000cm=16/4cm/yr=4cm/yr 4Ma 4,000,000 7. If a sample of seafloor basalt is collected 480 km from a mid-ocean ridge, and the full spreading rate is
6 cm/yr, how old is the basalt? Show your work. 480km=48,000,000cm=16,000,000yr=16Ma 3cm/yr3cm/yr
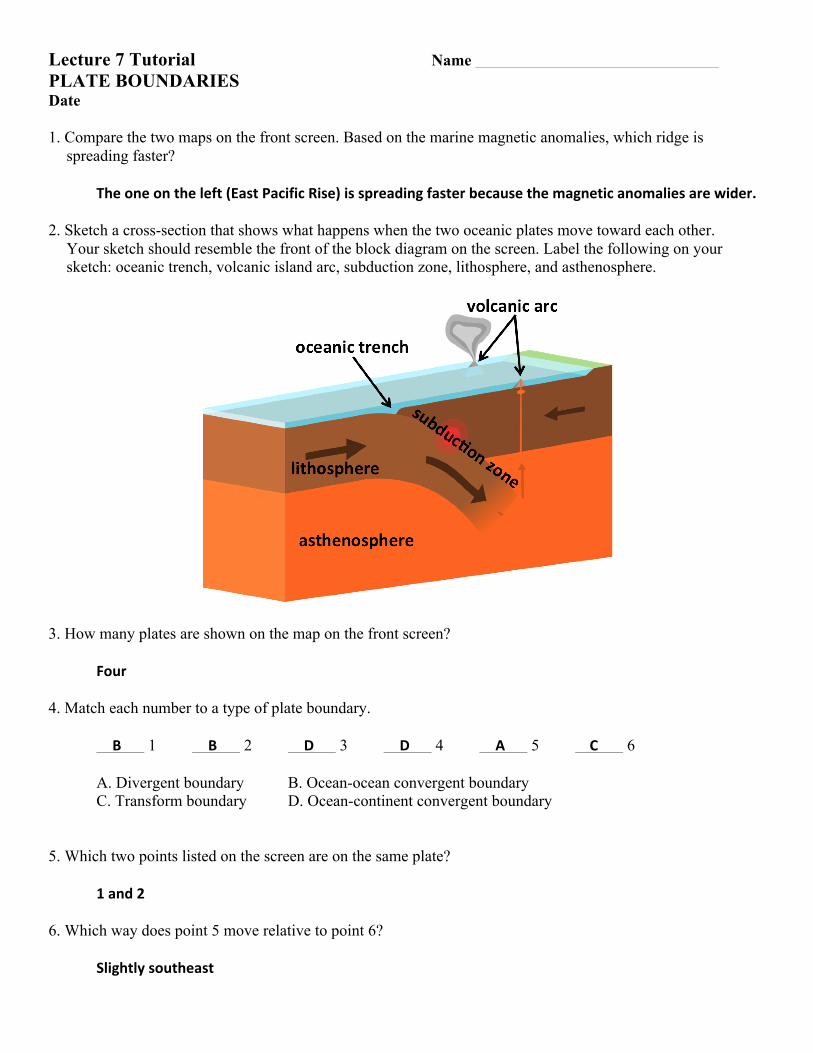
Lecture 7 Tutorial Name PLATE BOUNDARIES Date 1. Compare the two maps on the front screen. Based on the marine magnetic anomalies, which ridge is
spreading faster? Theoneontheleft(EastPacificRise)isspreadingfasterbecausethemagneticanomaliesarewider. 2. Sketch a cross-section that shows what happens when the two oceanic plates move toward each other.
Your sketch should resemble the front of the block diagram on the screen. Label the following on your sketch: oceanic trench, volcanic island arc, subduction zone, lithosphere, and asthenosphere.
3. How many plates are shown on the map on the front screen? Four 4. Match each number to a type of plate boundary. B 1 B 2 D 3 D 4 A 5 C 6 A. Divergent boundary B. Ocean-ocean convergent boundary C. Transform boundary D. Ocean-continent convergent boundary 5. Which two points listed on the screen are on the same plate? 1and2 6. Which way does point 5 move relative to point 6? Slightlysoutheast
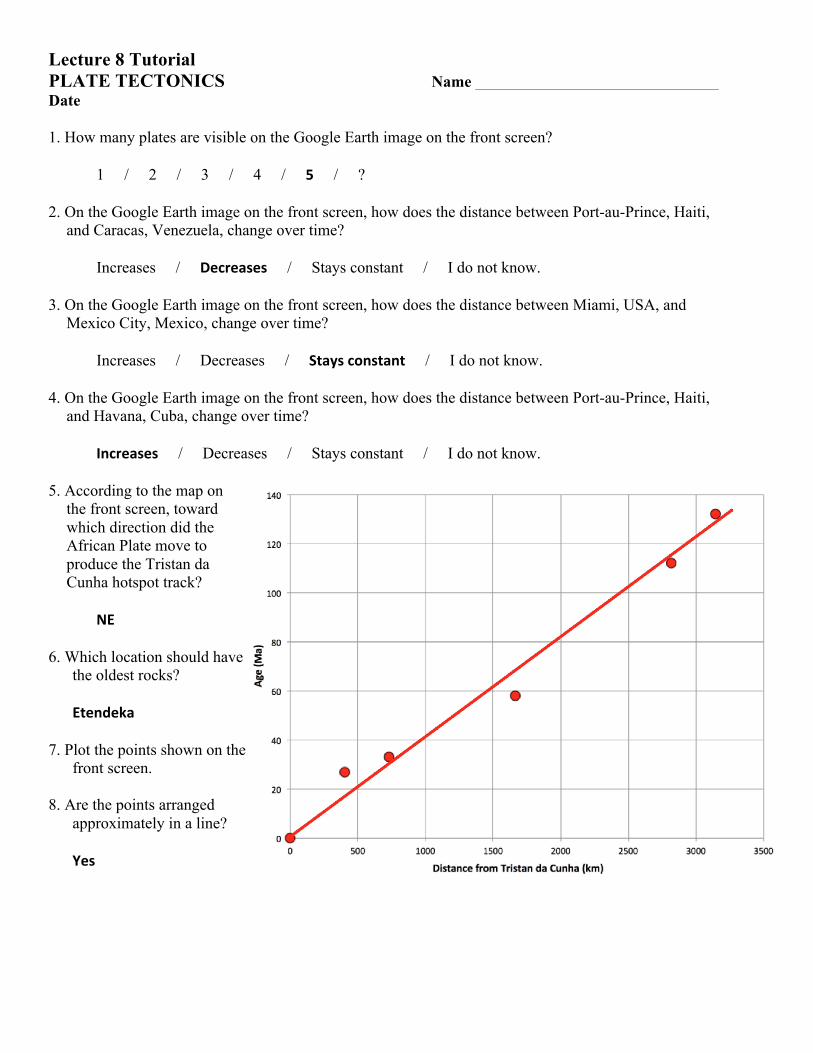
Lecture 8 TutorialPLATE TECTONICS Name Date 1. How many plates are visible on the Google Earth image on the front screen? 1 / 2 / 3 / 4 / 5 / ? 2. On the Google Earth image on the front screen, how does the distance between Port-au-Prince, Haiti,
and Caracas, Venezuela, change over time? Increases / Decreases / Stays constant / I do not know. 3. On the Google Earth image on the front screen, how does the distance between Miami, USA, and
Mexico City, Mexico, change over time? Increases / Decreases / Staysconstant / I do not know. 4. On the Google Earth image on the front screen, how does the distance between Port-au-Prince, Haiti,
and Havana, Cuba, change over time? Increases / Decreases / Stays constant / I do not know. 5. According to the map on
the front screen, toward which direction did the African Plate move to produce the Tristan da Cunha hotspot track?
NE 6. Which location should have
the oldest rocks? Etendeka 7. Plot the points shown on the
front screen. 8. Are the points arranged
approximately in a line? Yes
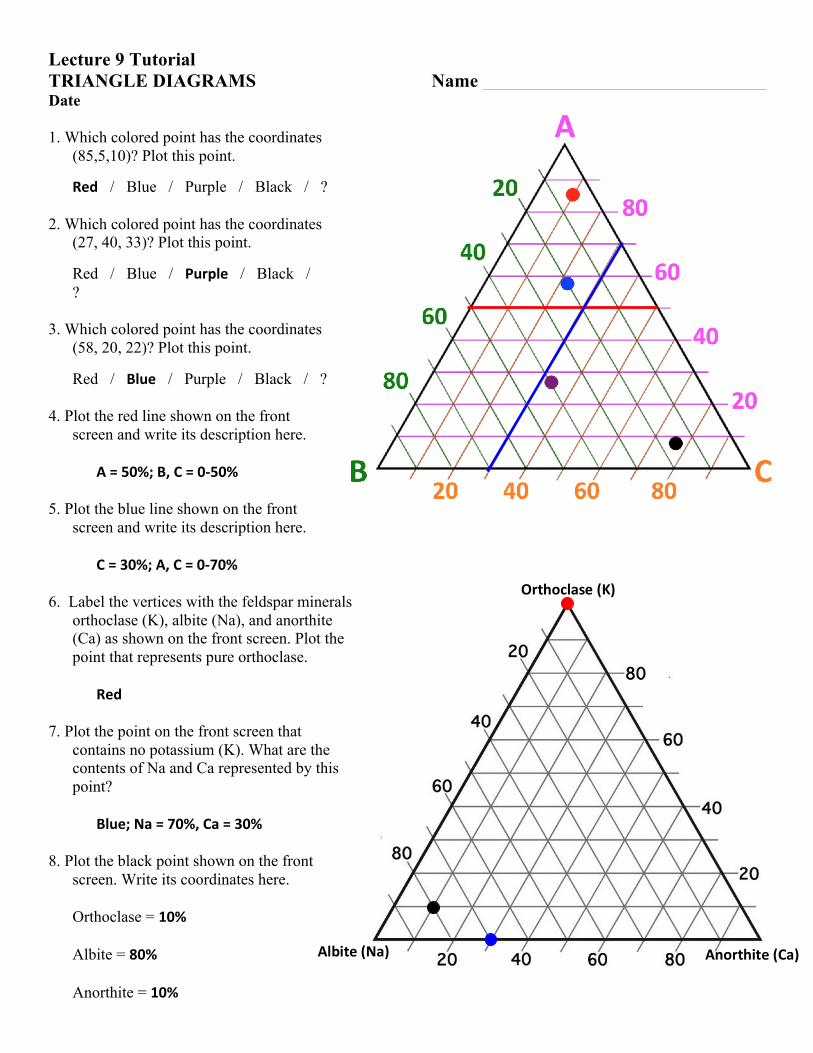
Lecture 9 Tutorial TRIANGLE DIAGRAMS Name Date 1. Which colored point has the coordinates
(85,5,10)? Plot this point.
Red / Blue / Purple / Black / ? 2. Which colored point has the coordinates
(27, 40, 33)? Plot this point.
Red / Blue / Purple / Black / ?
3. Which colored point has the coordinates
(58, 20, 22)? Plot this point.
Red / Blue / Purple / Black / ? 4. Plot the red line shown on the front
screen and write its description here. A=50%;B,C=0-50% 5. Plot the blue line shown on the front
screen and write its description here. C=30%;A,C=0-70% 6. Label the vertices with the feldspar minerals
orthoclase (K), albite (Na), and anorthite (Ca) as shown on the front screen. Plot the point that represents pure orthoclase.
Red 7. Plot the point on the front screen that
contains no potassium (K). What are the contents of Na and Ca represented by this point?
Blue;Na=70%,Ca=30% 8. Plot the black point shown on the front
screen. Write its coordinates here. Orthoclase = 10% Albite = 80% Anorthite = 10%
Orthoclase(K)
Anorthite(Ca)Albite(Na)
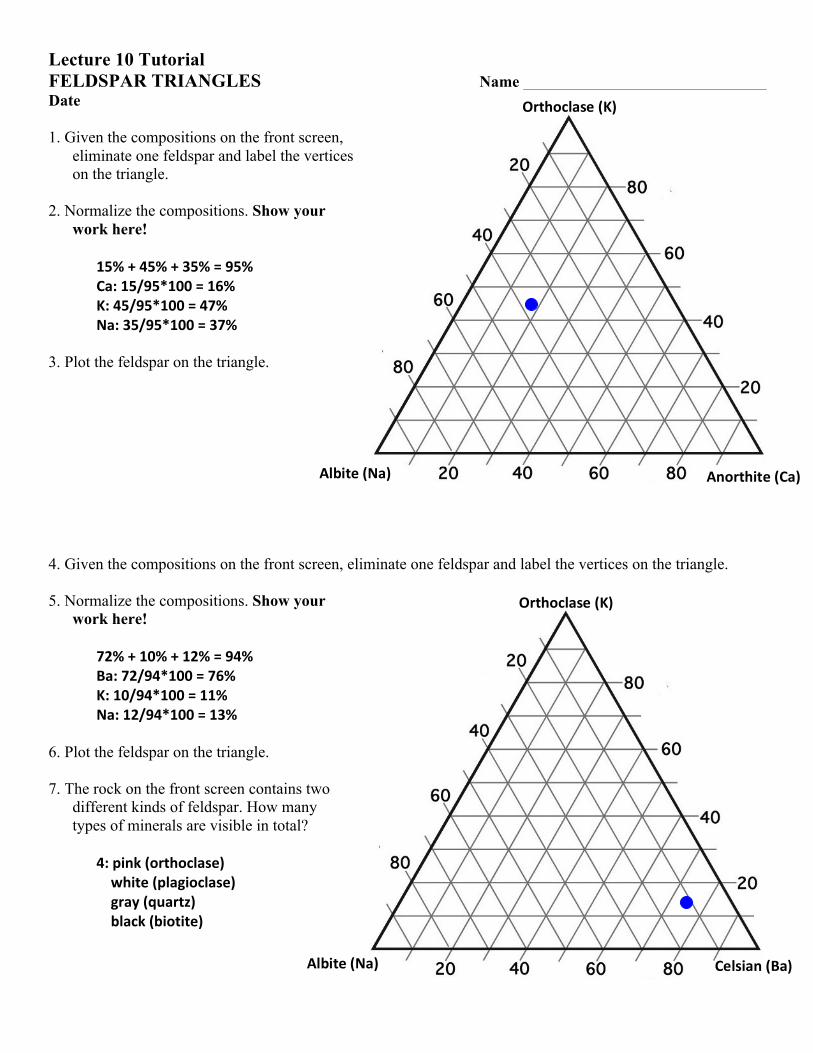
Lecture 10 Tutorial FELDSPAR TRIANGLES Name Date 1. Given the compositions on the front screen,
eliminate one feldspar and label the vertices on the triangle.
2. Normalize the compositions. Show your
work here! 15%+45%+35%=95% Ca:15/95*100=16% K:45/95*100=47% Na:35/95*100=37% 3. Plot the feldspar on the triangle. 4. Given the compositions on the front screen, eliminate one feldspar and label the vertices on the triangle. 5. Normalize the compositions. Show your
work here! 72%+10%+12%=94% Ba:72/94*100=76% K:10/94*100=11% Na:12/94*100=13% 6. Plot the feldspar on the triangle. 7. The rock on the front screen contains two
different kinds of feldspar. How many types of minerals are visible in total?
4:pink(orthoclase) white(plagioclase) gray(quartz) black(biotite)
Orthoclase(K)
Anorthite(Ca)Albite(Na)
Celsian(Ba)Albite(Na)
Orthoclase(K)
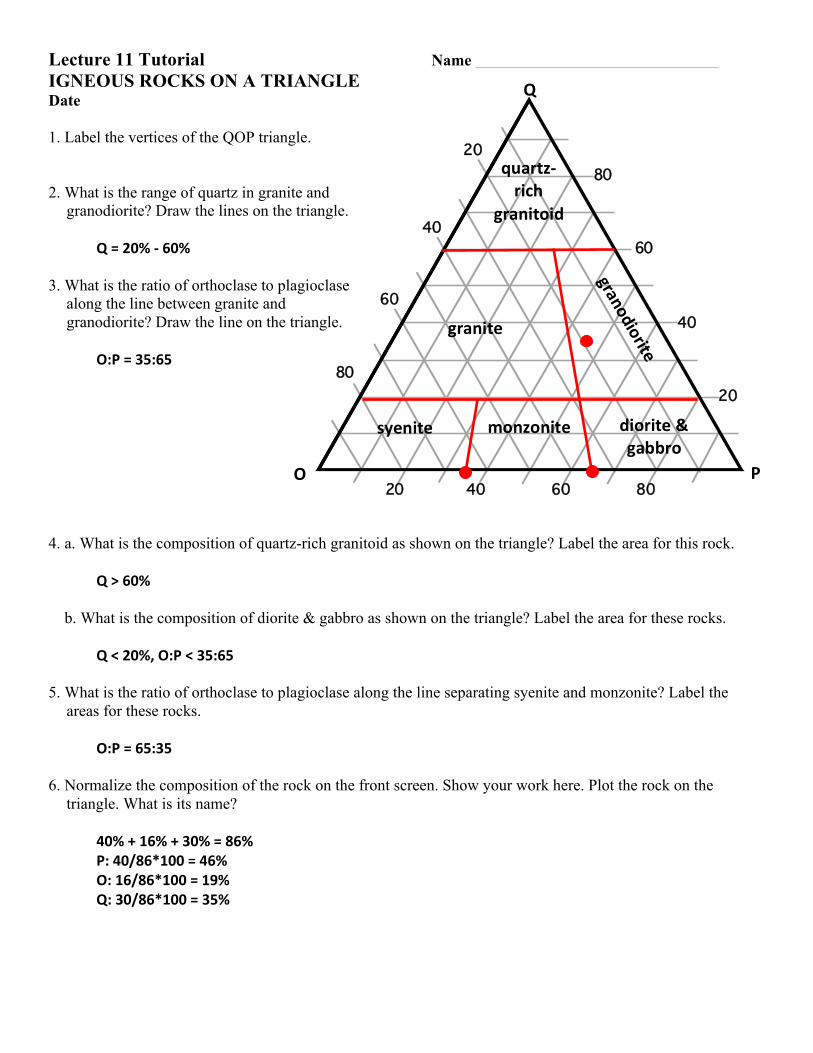
Lecture 11 Tutorial Name IGNEOUS ROCKS ON A TRIANGLE Date
1. Label the vertices of the QOP triangle. 2. What is the range of quartz in granite and
granodiorite? Draw the lines on the triangle. Q=20%-60% 3. What is the ratio of orthoclase to plagioclase
along the line between granite and granodiorite? Draw the line on the triangle.
O:P=35:65
4. a. What is the composition of quartz-rich granitoid as shown on the triangle? Label the area for this rock. Q>60% b. What is the composition of diorite & gabbro as shown on the triangle? Label the area for these rocks. Q<20%,O:P<35:65 5. What is the ratio of orthoclase to plagioclase along the line separating syenite and monzonite? Label the
areas for these rocks. O:P=65:35 6. Normalize the composition of the rock on the front screen. Show your work here. Plot the rock on the
triangle. What is its name? 40%+16%+30%=86% P:40/86*100=46% O:16/86*100=19% Q:30/86*100=35%
20 40 60 80
20
40
60
8020
40
60
80
Q
PO
syenite monzonite diorite&gabbro
granite
granodioritequartz-rich
granitoid
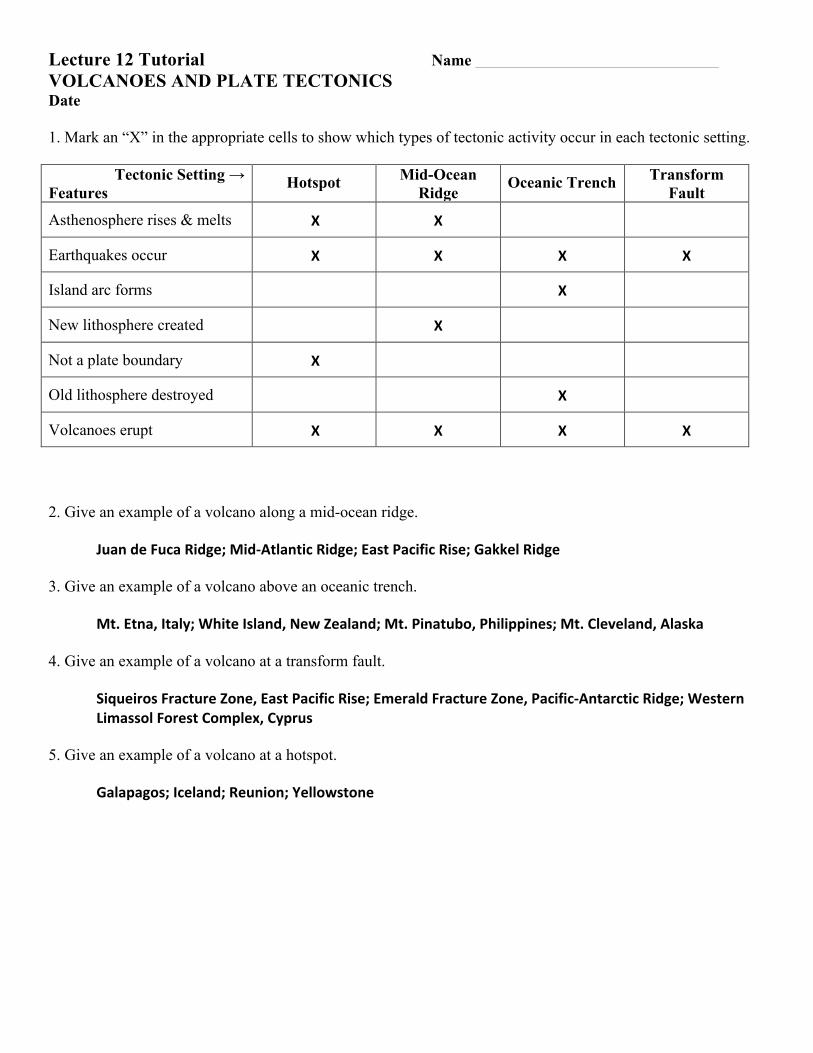
Lecture 12 Tutorial Name VOLCANOES AND PLATE TECTONICS Date 1. Mark an “X” in the appropriate cells to show which types of tectonic activity occur in each tectonic setting.
Tectonic Setting → Features Hotspot Mid-Ocean
Ridge Oceanic Trench Transform Fault
Asthenosphere rises & melts X X
Earthquakes occur X X X X
Island arc forms X
New lithosphere created X
Not a plate boundary X
Old lithosphere destroyed X
Volcanoes erupt X X X X
2. Give an example of a volcano along a mid-ocean ridge. JuandeFucaRidge;Mid-AtlanticRidge;EastPacificRise;GakkelRidge 3. Give an example of a volcano above an oceanic trench. Mt.Etna,Italy;WhiteIsland,NewZealand;Mt.Pinatubo,Philippines;Mt.Cleveland,Alaska 4. Give an example of a volcano at a transform fault.
SiqueirosFractureZone,EastPacificRise;EmeraldFractureZone,Pacific-AntarcticRidge;WesternLimassolForestComplex,Cyprus
5. Give an example of a volcano at a hotspot. Galapagos;Iceland;Reunion;Yellowstone
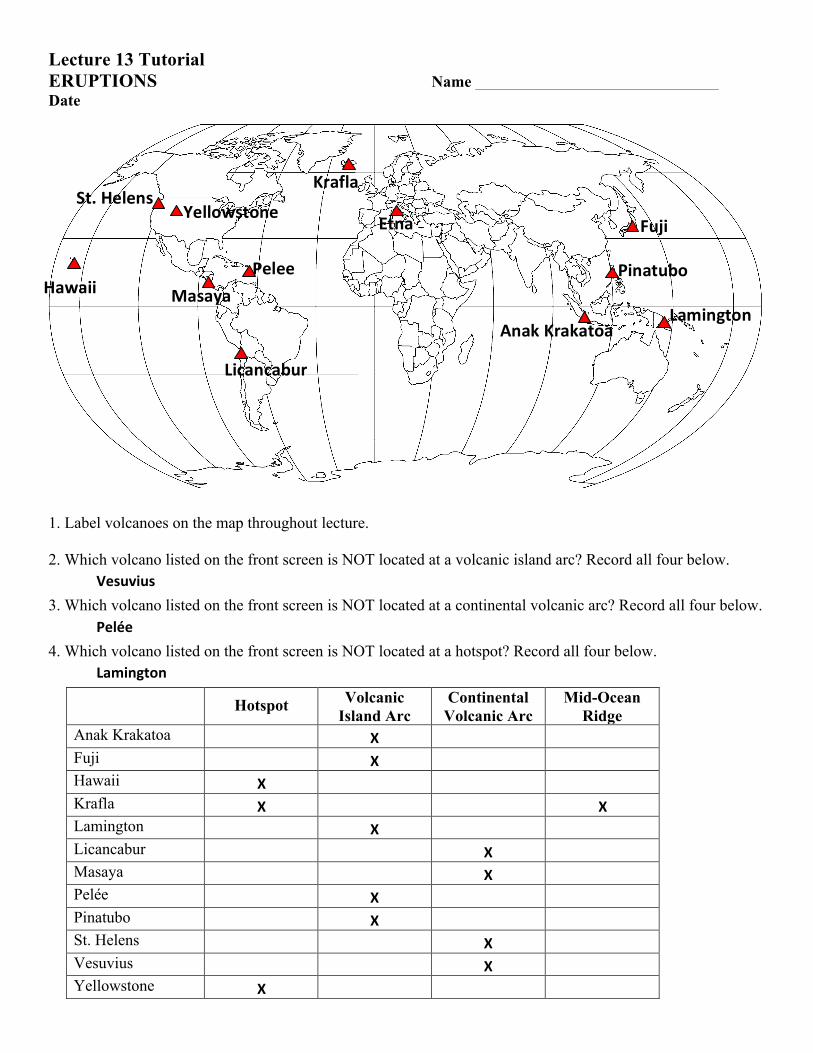
Lecture 13 Tutorial ERUPTIONS Name Date
1. Label volcanoes on the map throughout lecture. 2. Which volcano listed on the front screen is NOT located at a volcanic island arc? Record all four below. Vesuvius3. Which volcano listed on the front screen is NOT located at a continental volcanic arc? Record all four below. Pelée4. Which volcano listed on the front screen is NOT located at a hotspot? Record all four below. Lamington
Hotspot Volcanic Island Arc
Continental Volcanic Arc
Mid-Ocean Ridge
Anak Krakatoa X Fuji X Hawaii X Krafla X XLamington X Licancabur X Masaya X Pelée X Pinatubo X St. Helens X Vesuvius X Yellowstone X
Hawaii
EtnaSt.Helens
Yellowstone
PeleeMasaya
Licancabur
Krafla
AnakKrakatoa
Pinatubo
Fuji
Lamington
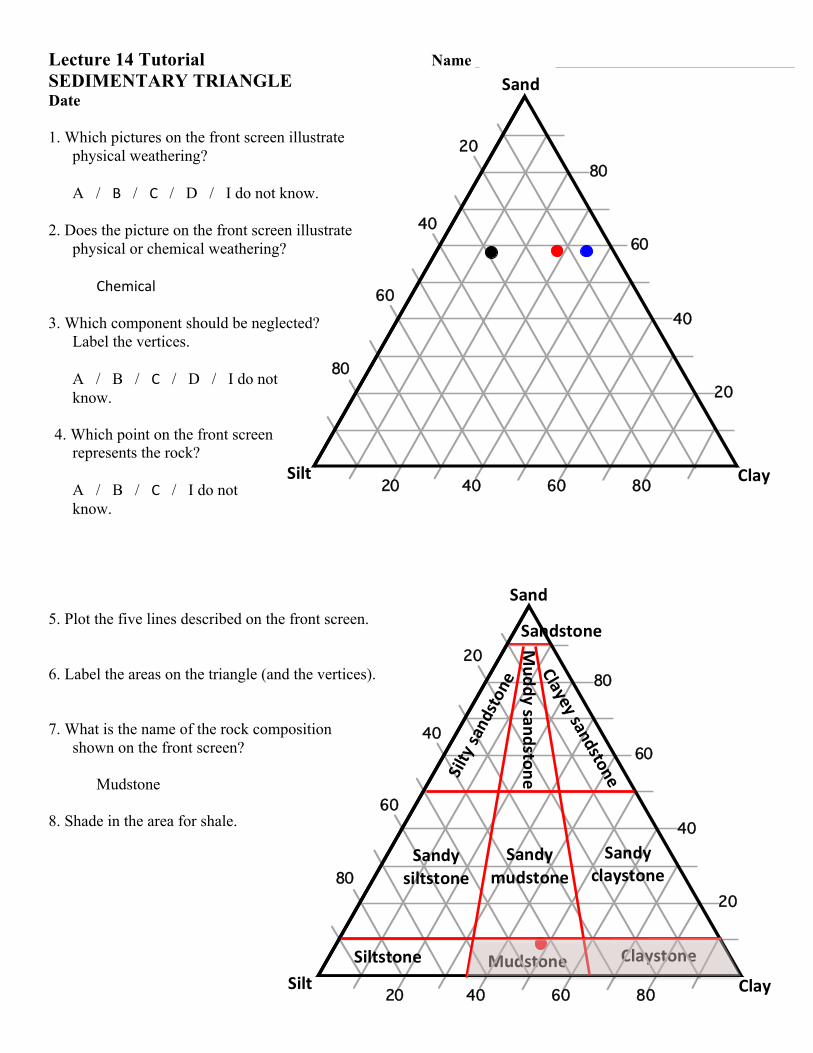
Lecture 14 Tutorial Name SEDIMENTARY TRIANGLE Date 1. Which pictures on the front screen illustrate
physical weathering? A / B / C / D / I do not know. 2. Does the picture on the front screen illustrate
physical or chemical weathering? Chemical 3. Which component should be neglected?
Label the vertices. A / B / C / D / I do not
know. 4. Which point on the front screen
represents the rock? A / B / C / I do not
know. 5. Plot the five lines described on the front screen. 6. Label the areas on the triangle (and the vertices). 7. What is the name of the rock composition
shown on the front screen? Mudstone 8. Shade in the area for shale.
20 40 60 80
20
40
60
8020
40
60
80
Sand
ClaySilt
Mudstone Claystone
20 40 60 80
20
40
60
8020
40
60
80
ClaySilt
Sand
Sandstone
Siltysandstone
MuddysandstoneClayeysandstone
Sandymudstone
Sandyclaystone
Siltstone
Sandysiltstone
20 40 60 80
20
40
60
8020
40
60
80
C
A
FCalcite
Plagioclase
Muscovite
Garnet
AmphibolePyroxene
20 40 60 80
20
40
60
8020
40
60
80
C
A
FCalcite
Plagioclase
Muscovite
Garnet
AmphibolePyroxene
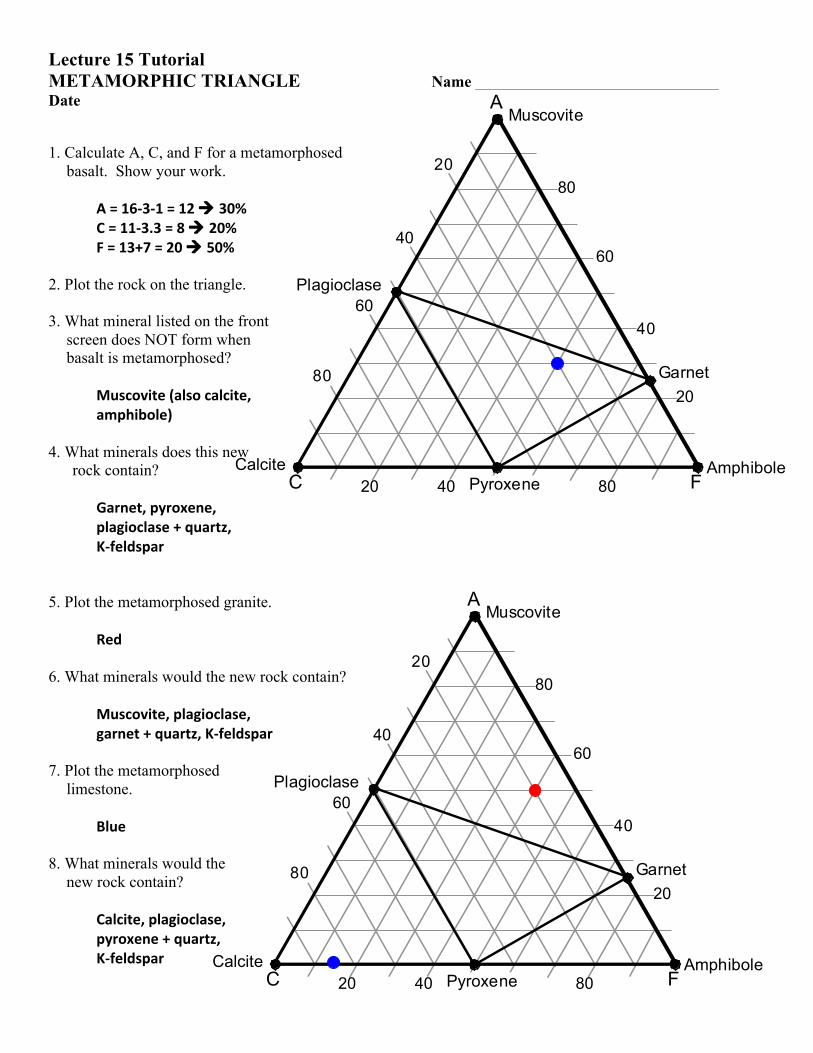
Lecture 15 Tutorial METAMORPHIC TRIANGLE Name Date 1. Calculate A, C, and F for a metamorphosed
basalt. Show your work. A=16-3-1=12à 30% C=11-3.3=8à 20% F=13+7=20à 50% 2. Plot the rock on the triangle. 3. What mineral listed on the front
screen does NOT form when basalt is metamorphosed?
Muscovite(alsocalcite,amphibole)
4. What minerals does this new
rock contain?
Garnet,pyroxene,plagioclase+quartz,K-feldspar
5. Plot the metamorphosed granite. Red 6. What minerals would the new rock contain?
Muscovite,plagioclase,garnet+quartz,K-feldspar
7. Plot the metamorphosed
limestone. Blue 8. What minerals would the
new rock contain?
Calcite,plagioclase,pyroxene+quartz,K-feldspar
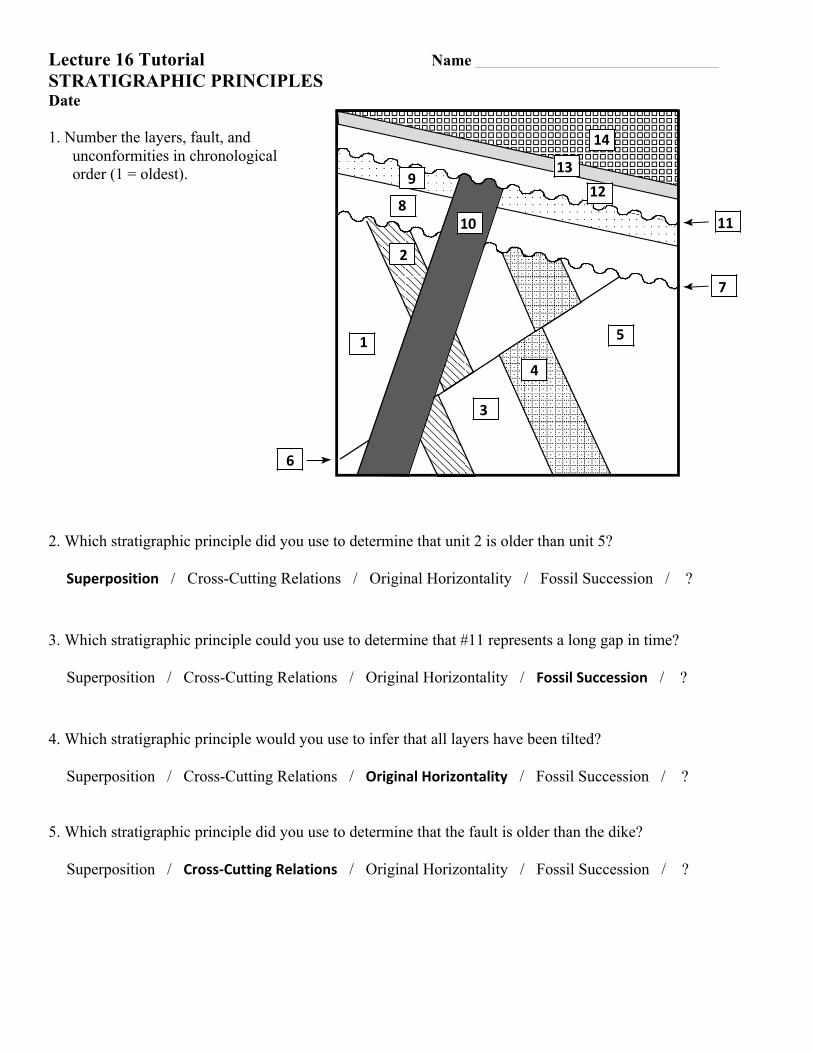
Lecture 16 Tutorial Name STRATIGRAPHIC PRINCIPLES Date 1. Number the layers, fault, and
unconformities in chronological order (1 = oldest).
2. Which stratigraphic principle did you use to determine that unit 2 is older than unit 5? Superposition / Cross-Cutting Relations / Original Horizontality / Fossil Succession / ? 3. Which stratigraphic principle could you use to determine that #11 represents a long gap in time? Superposition / Cross-Cutting Relations / Original Horizontality / FossilSuccession / ? 4. Which stratigraphic principle would you use to infer that all layers have been tilted? Superposition / Cross-Cutting Relations / OriginalHorizontality / Fossil Succession / ? 5. Which stratigraphic principle did you use to determine that the fault is older than the dike? Superposition / Cross-CuttingRelations / Original Horizontality / Fossil Succession / ?
14
2
3
4
5
6
7
8
9
10
12
11
1
13
Lecture 17 Tutorial Name ISOTOPIC DATING Date
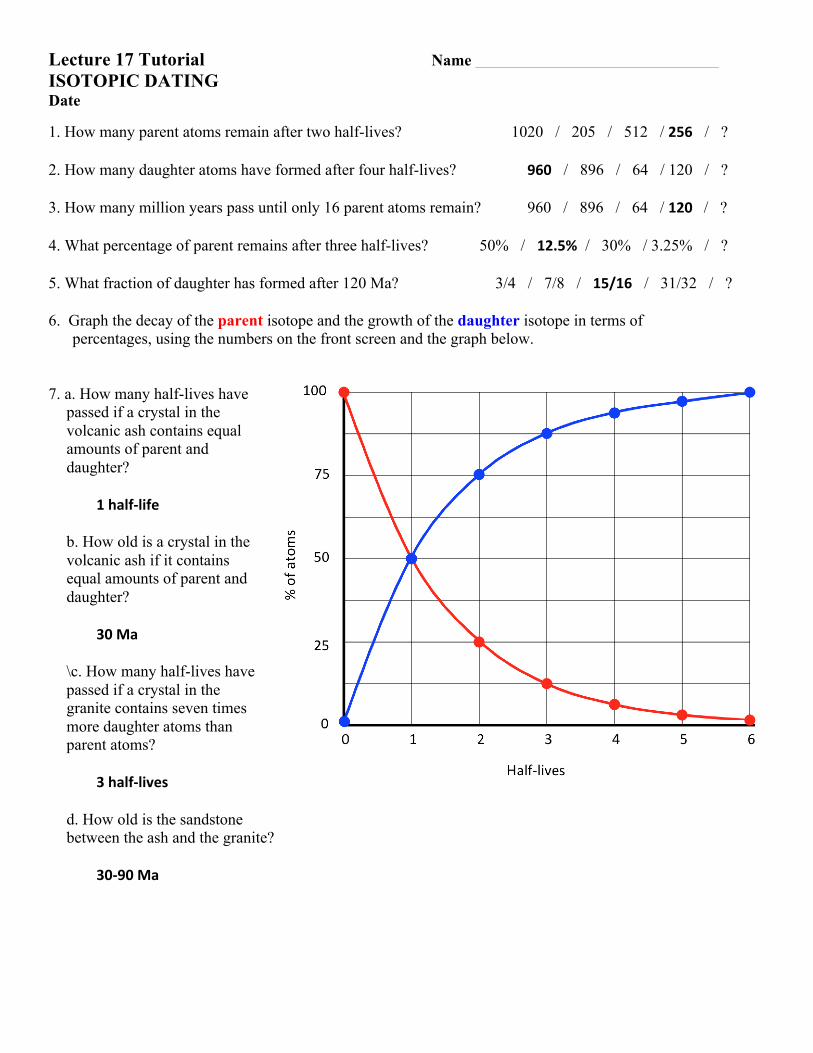
1. How many parent atoms remain after two half-lives? 1020 / 205 / 512 / 256 / ? 2. How many daughter atoms have formed after four half-lives? 960 / 896 / 64 / 120 / ? 3. How many million years pass until only 16 parent atoms remain? 960 / 896 / 64 / 120 / ? 4. What percentage of parent remains after three half-lives? 50% / 12.5% / 30% / 3.25% / ? 5. What fraction of daughter has formed after 120 Ma? 3/4 / 7/8 / 15/16 / 31/32 / ? 6. Graph the decay of the parent isotope and the growth of the daughter isotope in terms of
percentages, using the numbers on the front screen and the graph below. 7. a. How many half-lives have
passed if a crystal in the volcanic ash contains equal amounts of parent and daughter?
1half-life
b. How old is a crystal in the volcanic ash if it contains equal amounts of parent and daughter?
30Ma
\c. How many half-lives have passed if a crystal in the granite contains seven times more daughter atoms than parent atoms?
3half-lives
d. How old is the sandstone between the ash and the granite?
30-90Ma
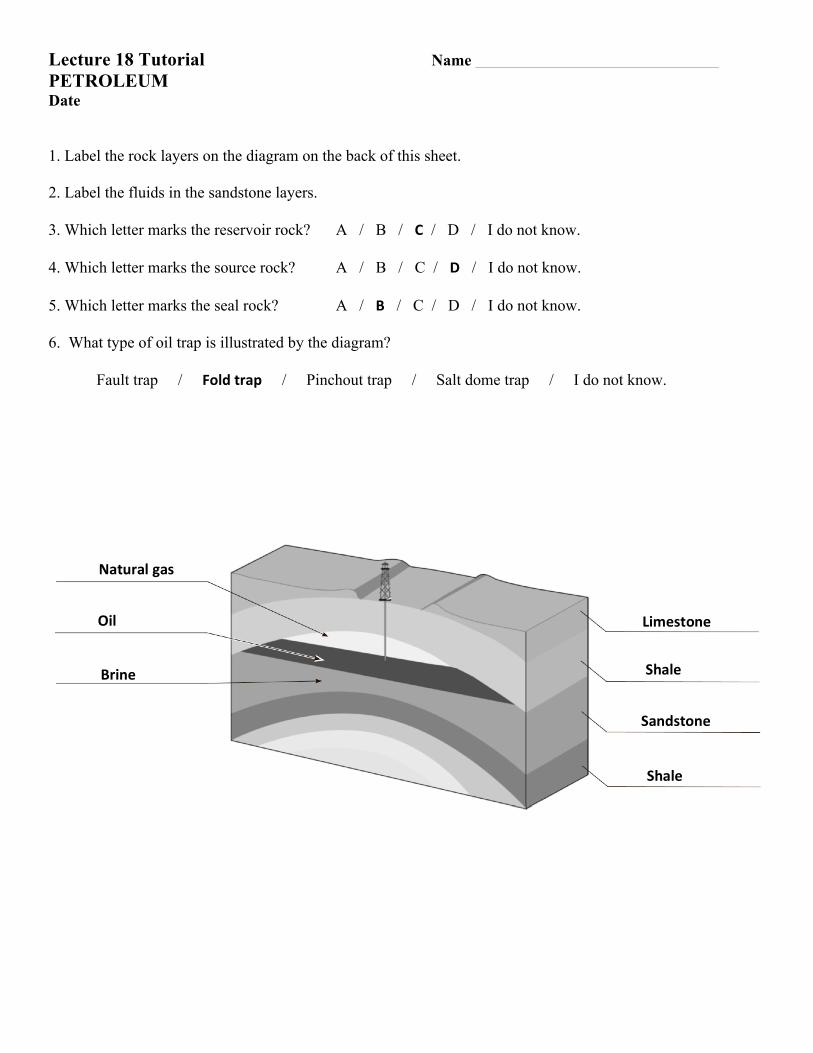
Lecture 18 Tutorial Name PETROLEUM Date 1. Label the rock layers on the diagram on the back of this sheet. 2. Label the fluids in the sandstone layers. 3. Which letter marks the reservoir rock? A / B / C / D / I do not know. 4. Which letter marks the source rock? A / B / C / D / I do not know. 5. Which letter marks the seal rock? A / B / C / D / I do not know. 6. What type of oil trap is illustrated by the diagram? Fault trap / Foldtrap / Pinchout trap / Salt dome trap / I do not know.
Naturalgas
Oil Limestone
Shale
Sandstone
Brine
Shale
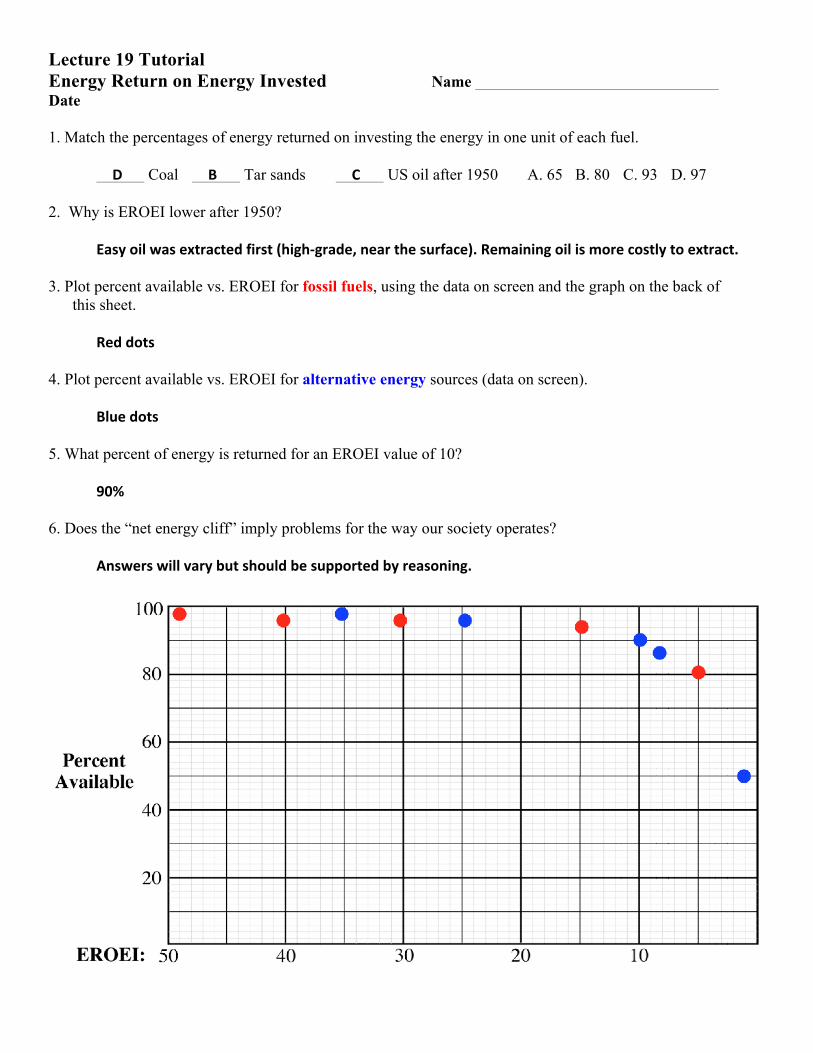
Lecture 19 Tutorial Energy Return on Energy Invested Name Date 1. Match the percentages of energy returned on investing the energy in one unit of each fuel. D Coal B Tar sands C US oil after 1950 A. 65 B. 80 C. 93 D. 97 2. Why is EROEI lower after 1950?
Easyoilwasextractedfirst(high-grade,nearthesurface).Remainingoilismorecostlytoextract. 3. Plot percent available vs. EROEI for fossil fuels, using the data on screen and the graph on the back of
this sheet. Reddots 4. Plot percent available vs. EROEI for alternative energy sources (data on screen). Bluedots 5. What percent of energy is returned for an EROEI value of 10? 90% 6. Does the “net energy cliff” imply problems for the way our society operates?
Answerswillvarybutshouldbesupportedbyreasoning.
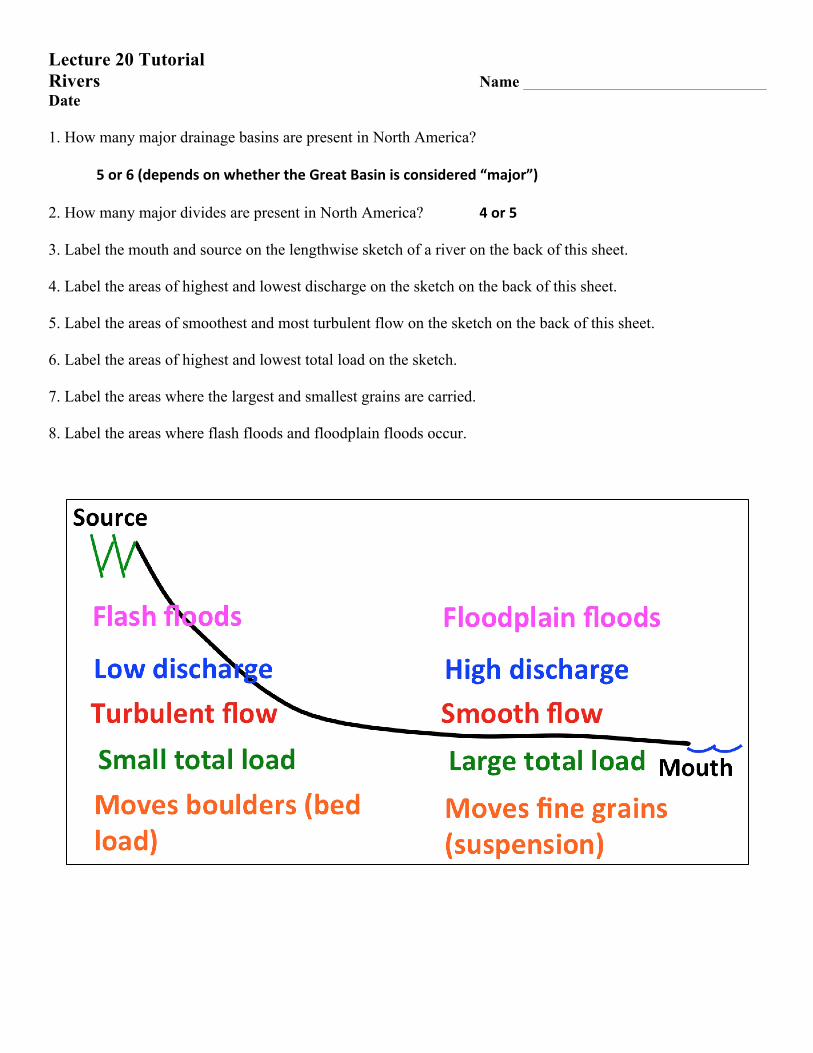
Lecture 20 Tutorial Rivers Name Date 1. How many major drainage basins are present in North America? 5or6(dependsonwhethertheGreatBasinisconsidered“major”) 2. How many major divides are present in North America? 4or5 3. Label the mouth and source on the lengthwise sketch of a river on the back of this sheet. 4. Label the areas of highest and lowest discharge on the sketch on the back of this sheet. 5. Label the areas of smoothest and most turbulent flow on the sketch on the back of this sheet. 6. Label the areas of highest and lowest total load on the sketch. 7. Label the areas where the largest and smallest grains are carried. 8. Label the areas where flash floods and floodplain floods occur.
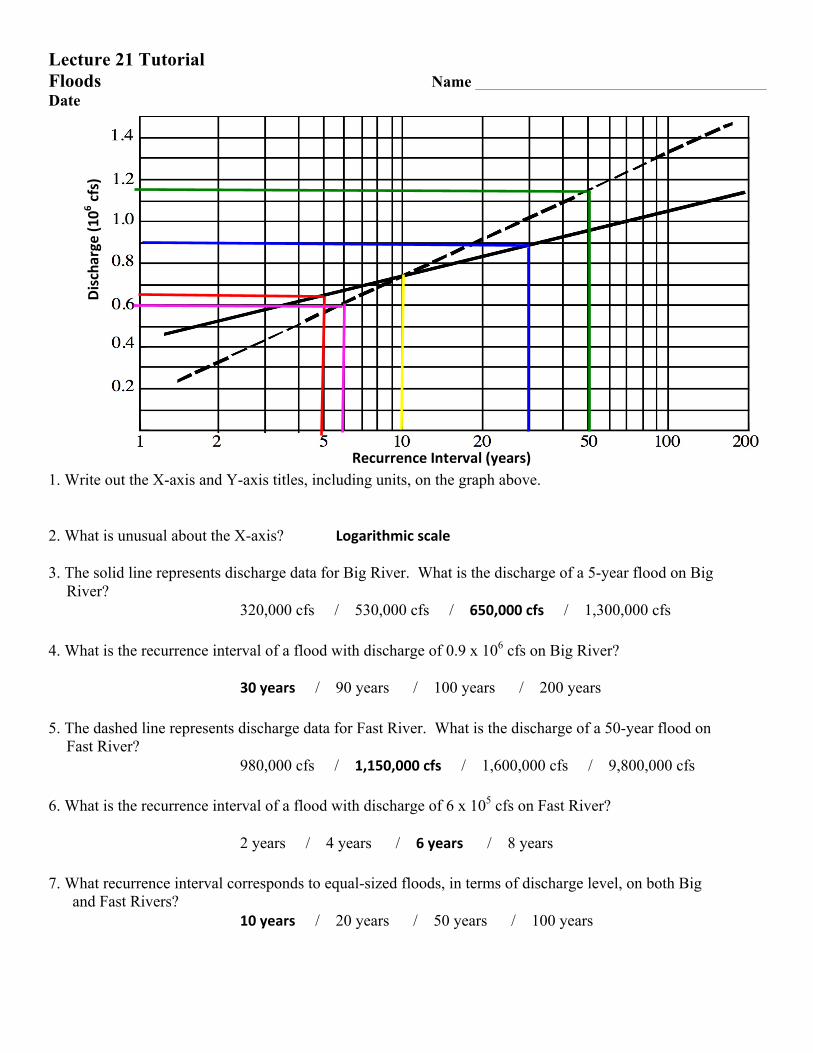
Lecture 21 Tutorial Floods Name Date 1. Write out the X-axis and Y-axis titles, including units, on the graph above. 2. What is unusual about the X-axis? Logarithmicscale 3. The solid line represents discharge data for Big River. What is the discharge of a 5-year flood on Big
River? 320,000 cfs / 530,000 cfs / 650,000cfs / 1,300,000 cfs 4. What is the recurrence interval of a flood with discharge of 0.9 x 10⁶ cfs on Big River? 30years / 90 years / 100 years / 200 years 5. The dashed line represents discharge data for Fast River. What is the discharge of a 50-year flood on
Fast River? 980,000 cfs / 1,150,000cfs / 1,600,000 cfs / 9,800,000 cfs 6. What is the recurrence interval of a flood with discharge of 6 x 10⁵ cfs on Fast River? 2 years / 4 years / 6years / 8 years 7. What recurrence interval corresponds to equal-sized floods, in terms of discharge level, on both Big
and Fast Rivers? 10years / 20 years / 50 years / 100 years
RecurrenceInterval(years)
Discharge(1
06cfs)
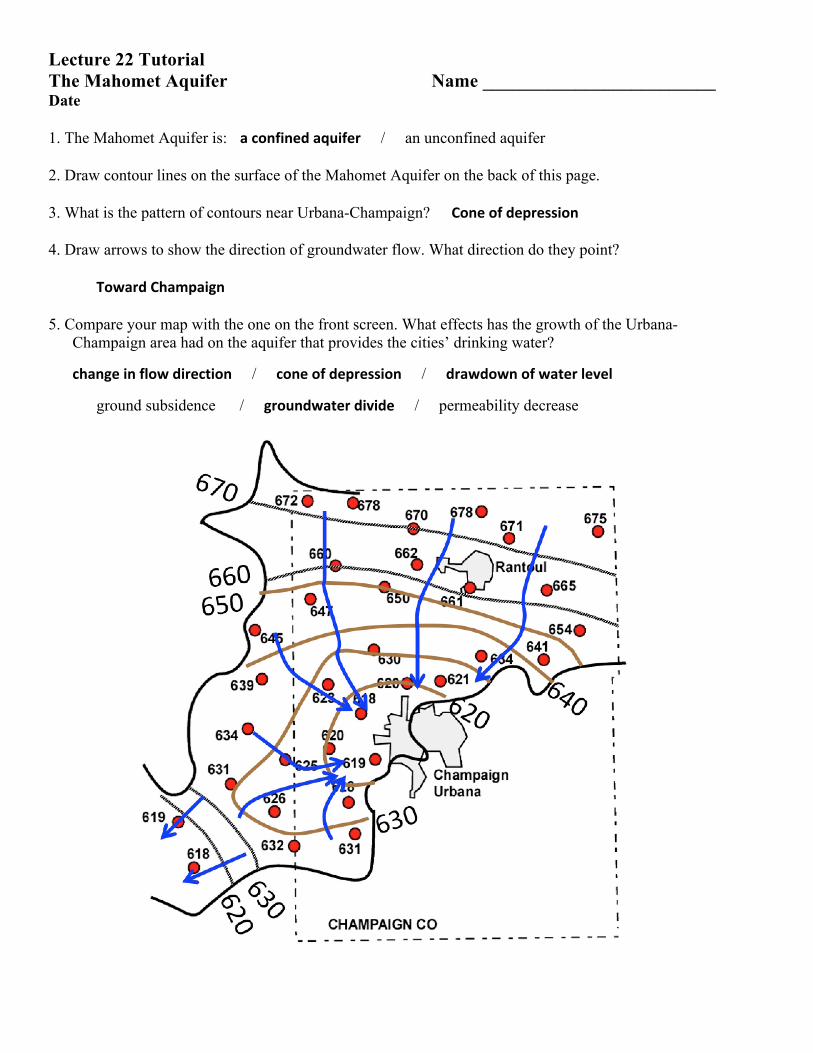
Lecture 22 Tutorial The Mahomet Aquifer Name _________________________ Date 1. The Mahomet Aquifer is: aconfinedaquifer / an unconfined aquifer 2. Draw contour lines on the surface of the Mahomet Aquifer on the back of this page. 3. What is the pattern of contours near Urbana-Champaign? Coneofdepression 4. Draw arrows to show the direction of groundwater flow. What direction do they point? TowardChampaign 5. Compare your map with the one on the front screen. What effects has the growth of the Urbana-
Champaign area had on the aquifer that provides the cities’ drinking water?
changeinflowdirection / coneofdepression / drawdownofwaterlevel
ground subsidence / groundwaterdivide / permeability decrease
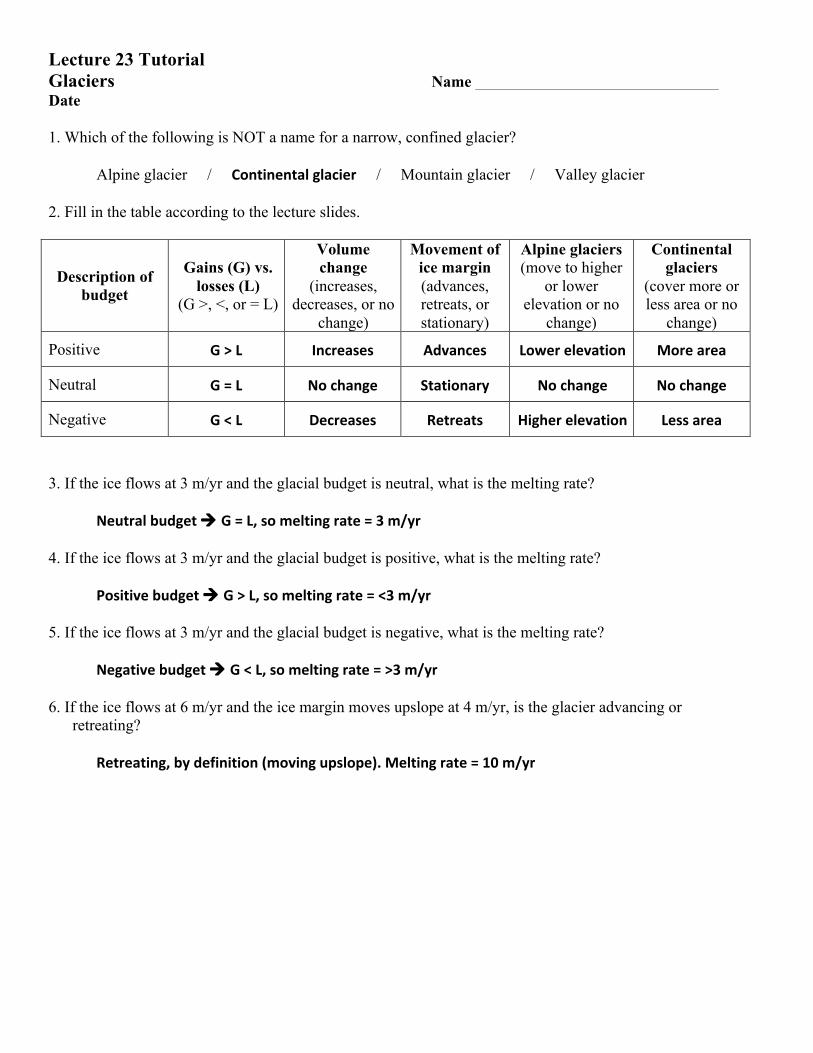
Lecture 23 Tutorial Glaciers Name Date 1. Which of the following is NOT a name for a narrow, confined glacier? Alpine glacier / Continentalglacier / Mountain glacier / Valley glacier 2. Fill in the table according to the lecture slides.
Description of budget
Gains (G) vs. losses (L)
(G >, <, or = L)
Volume change
(increases, decreases, or no
change)
Movement of ice margin (advances, retreats, or stationary)
Alpine glaciers (move to higher
or lower elevation or no
change)
Continental glaciers
(cover more or less area or no
change)
Positive G>L Increases Advances Lowerelevation Morearea
Neutral G=L Nochange Stationary Nochange Nochange
Negative G<L Decreases Retreats Higherelevation Lessarea
3. If the ice flows at 3 m/yr and the glacial budget is neutral, what is the melting rate? Neutralbudgetà G=L,someltingrate=3m/yr 4. If the ice flows at 3 m/yr and the glacial budget is positive, what is the melting rate? Positivebudgetà G>L,someltingrate=<3m/yr 5. If the ice flows at 3 m/yr and the glacial budget is negative, what is the melting rate? Negativebudgetà G<L,someltingrate=>3m/yr 6. If the ice flows at 6 m/yr and the ice margin moves upslope at 4 m/yr, is the glacier advancing or
retreating? Retreating,bydefinition(movingupslope).Meltingrate=10m/yr
X
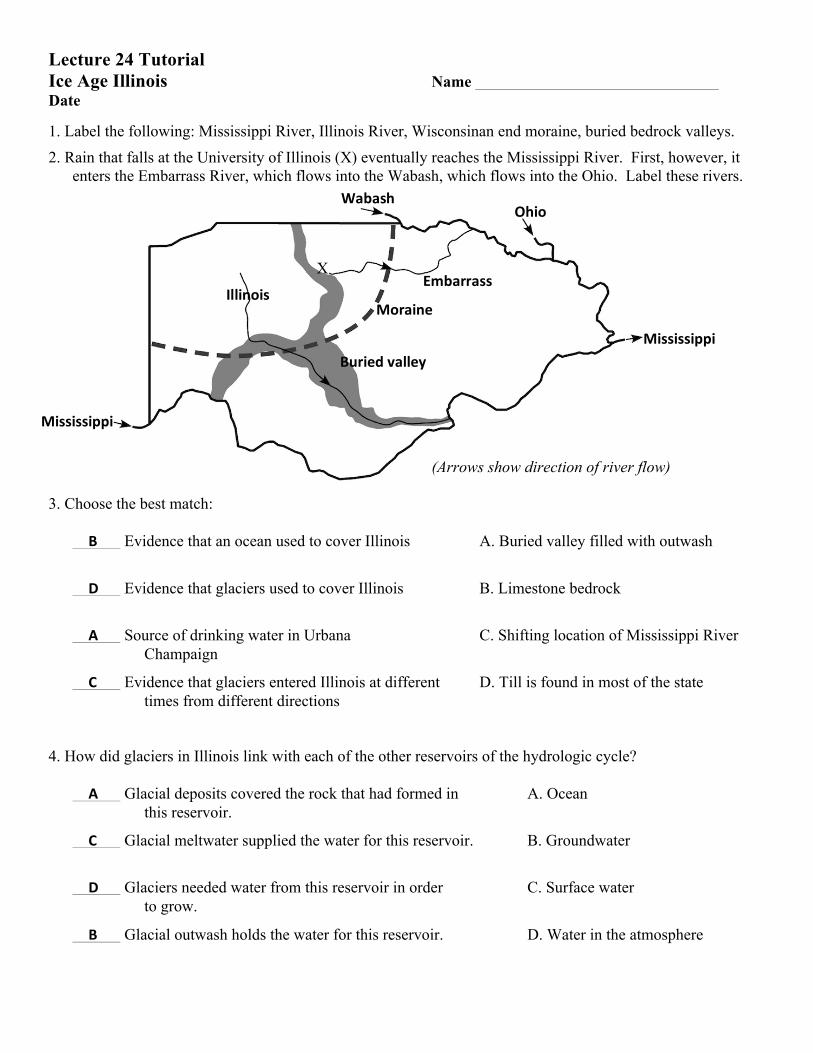
Lecture 24 Tutorial Ice Age Illinois Name Date 1. Label the following: Mississippi River, Illinois River, Wisconsinan end moraine, buried bedrock valleys. 2. Rain that falls at the University of Illinois (X) eventually reaches the Mississippi River. First, however, it
enters the Embarrass River, which flows into the Wabash, which flows into the Ohio. Label these rivers.
(Arrows show direction of river flow) 3. Choose the best match: B Evidence that an ocean used to cover Illinois A. Buried valley filled with outwash
D Evidence that glaciers used to cover Illinois B. Limestone bedrock
A Source of drinking water in Urbana C. Shifting location of Mississippi River Champaign
C Evidence that glaciers entered Illinois at different D. Till is found in most of the state times from different directions 4. How did glaciers in Illinois link with each of the other reservoirs of the hydrologic cycle? A Glacial deposits covered the rock that had formed in A. Ocean this reservoir.
C Glacial meltwater supplied the water for this reservoir. B. Groundwater
D Glaciers needed water from this reservoir in order C. Surface water to grow.
B Glacial outwash holds the water for this reservoir. D. Water in the atmosphere
Mississippi
Embarrass
WabashOhio
Mississippi
Buriedvalley
MoraineIllinois
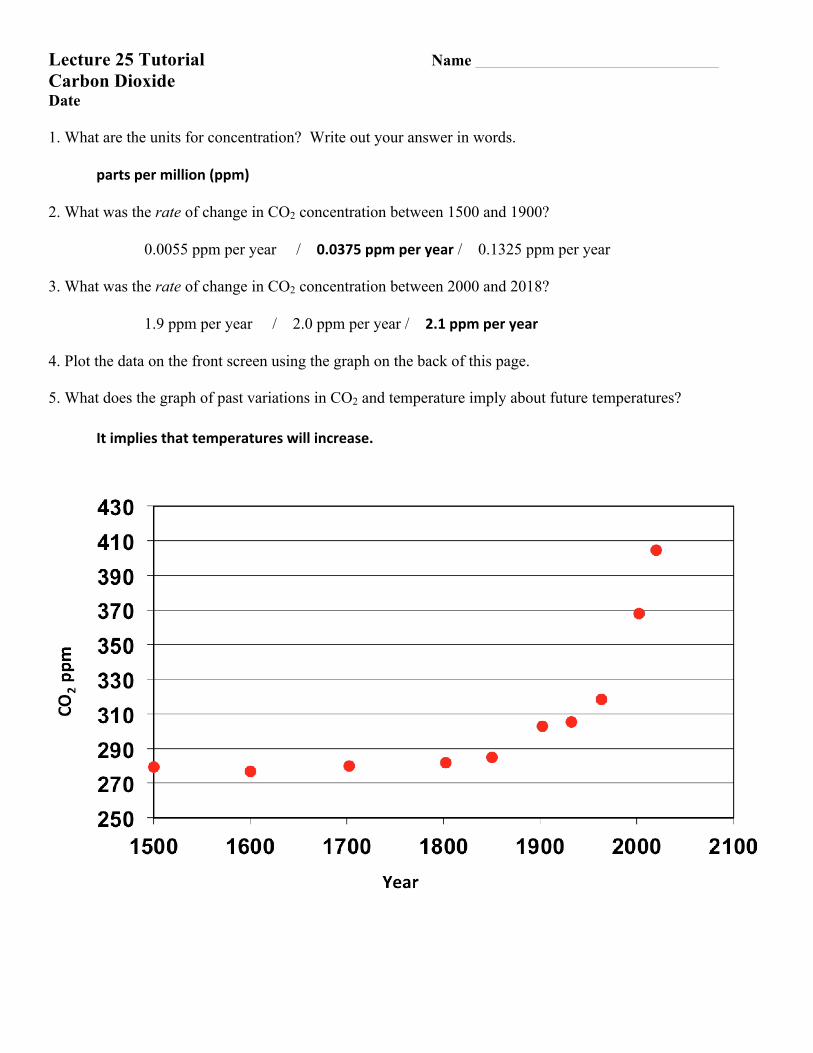
Lecture 25 Tutorial Name Carbon Dioxide Date 1. What are the units for concentration? Write out your answer in words. partspermillion(ppm) 2. What was the rate of change in CO2 concentration between 1500 and 1900? 0.0055 ppm per year / 0.0375ppmperyear / 0.1325 ppm per year 3. What was the rate of change in CO2 concentration between 2000 and 2018? 1.9 ppm per year / 2.0 ppm per year / 2.1ppmperyear 4. Plot the data on the front screen using the graph on the back of this page.
5. What does the graph of past variations in CO2 and temperature imply about future temperatures? Itimpliesthattemperatureswillincrease.
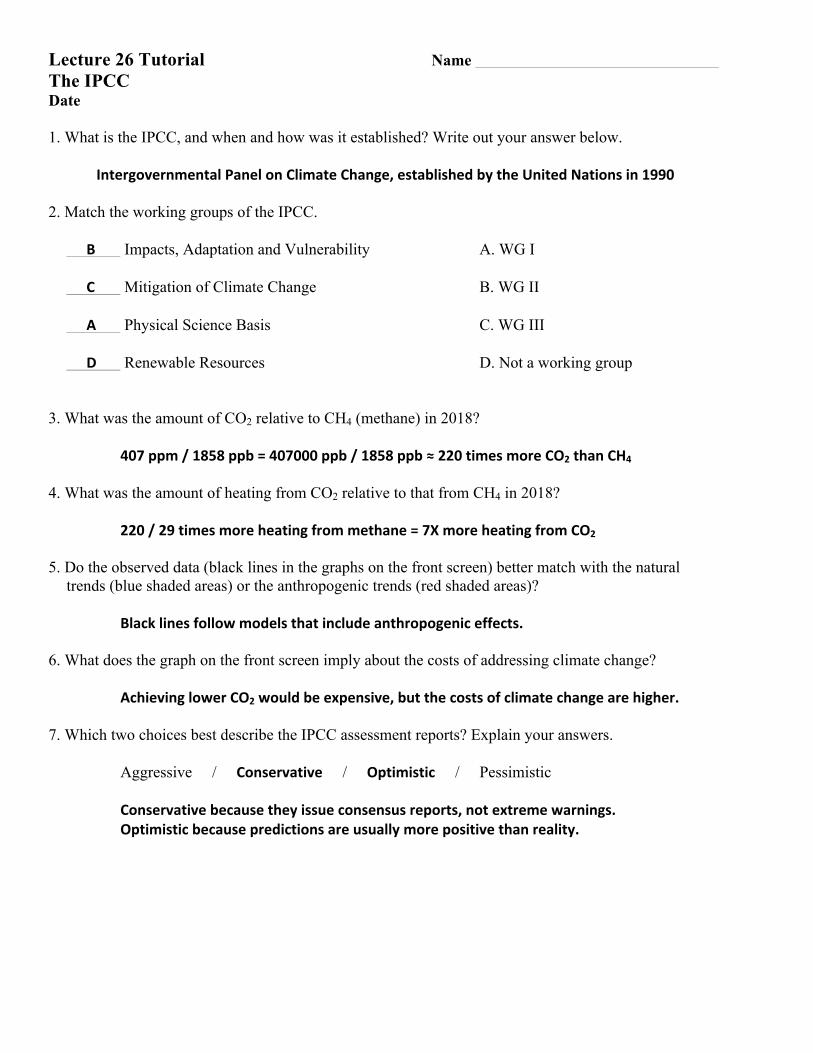
Lecture 26 Tutorial Name The IPCC Date 1. What is the IPCC, and when and how was it established? Write out your answer below. IntergovernmentalPanelonClimateChange,establishedbytheUnitedNationsin1990 2. Match the working groups of the IPCC. B Impacts, Adaptation and Vulnerability A. WG I C Mitigation of Climate Change B. WG II A Physical Science Basis C. WG III D Renewable Resources D. Not a working group 3. What was the amount of CO2 relative to CH4 (methane) in 2018? 407ppm/1858ppb=407000ppb/1858ppb≈220timesmoreCO2thanCH4 4. What was the amount of heating from CO2 relative to that from CH4 in 2018? 220/29timesmoreheatingfrommethane=7XmoreheatingfromCO2
5. Do the observed data (black lines in the graphs on the front screen) better match with the natural
trends (blue shaded areas) or the anthropogenic trends (red shaded areas)? Blacklinesfollowmodelsthatincludeanthropogeniceffects. 6. What does the graph on the front screen imply about the costs of addressing climate change? AchievinglowerCO2wouldbeexpensive,butthecostsofclimatechangearehigher. 7. Which two choices best describe the IPCC assessment reports? Explain your answers. Aggressive / Conservative / Optimistic / Pessimistic Conservativebecausetheyissueconsensusreports,notextremewarnings. Optimisticbecausepredictionsareusuallymorepositivethanreality.