anp-2971(np), rev 1, 'sequoyah units 1 and 2 htp fuel s ... · sequoyah units 1 and 2 htp fuel...
TRANSCRIPT

ATTACHMENT 9
ANP-2971(NP), Revision 1
Sequoyah Units 1 and 2 HTP Fuel S-RELAP5 Small Break LOCA Analysis
May 2011
(NON-PROPRIETARY VERSION)

ANP-2971 (NP)Revision 1
Sequoyah Units 1 and 2HTP Fuel S-RELAP5
Small Break LOCA Analysis
May 2011
AAREVAAREVA MP Inc.
AAREVA
Sequoyah Units 1 and 2 HTP FuelS-RELAP5 Small Break LOCA Analysis
ANP-2971(NP)Revision 1
Page 2
AREVA NP Inc.
Copyright © 2011
AREVA NP Inc.All Rights Reserved

AAR EVA
Sequoyah Units 1 and 2 HTP FuelS-RELAP5 Small Break LOCA Analysis
ANP-2971(NP)Revision 1
Paae 3
Nature of Changes
Item Page Description and Justification
1 All Revision 1. Changed the PCT result for the accumulator line break.
AREVA NP Inc.

AAREVA
Sequoyah Units 1 and 2 HTP FuelS-RELAP5 Small Break LOCA Analysis
ANP-2971(NP)Revision 1
Paae 4
Table of Contents
Table of Contents .......................................................................................................................... 4
List of Tables ................................................................................................................................. 5
List of Figures ............................................................................................................................... 6
Nom enclature ................................................................................................................................ 7
1.0 Introduction ....................................................................................................................... 8
2.0 Sum m ary of Results ...................................................................................................... 9
3.0 Description of Analysis ................................................................................................ 103.1 Description of SBLOCA Event ......................................................................... 103.2 Analytical Models ............................................................................................. 103.3 Plant Description and Summary of Analysis Parameters ................................ 15
4.0 Analytical Results ............................................................................................................ 224.1 Results ................................................................................................................ 224.2 Discussion of Transient for 9.76-inch Break ................................................... 234.3 RCP Trip Sensitivity Study ............................................................................. 24
4.3.1 Cold Leg Breaks RCP Trip Sensitivity Study ..................................... 254.3.2 Hot Leg Breaks RCP Trip Sensitivity Study ..................................... 25
4.4 Attached Piping LOCA Cases ......................................................................... 254.5 Results Com parison against AOR ................................................................... 25
5.0 References ...................................................................................................................... 55
This document contains a total of 55 pages.
AREVA NP Inc.

AAREVA
ANP-2971(NP)Sequoyah Units 1 and 2 HTP Fuel Revision 1S-RELAP5 Small Break LOCA Analysis Page 5
List of Tables
Table 3-1 System Parameters and Initial Conditions ............................................................................ 17
Table 3-2 CCI, HHSI, & RHR Flows as Function of the Primary System Pressure ............................... 18
Table 3-3 M oderator Density Reactivity ................................................................................................ 19
T able 3-4 D oppler R eactivity ...................................................................................................................... 19
Table 4-1 Summary of SBLOCA Break Spectrum Results ................................................................... 27
Table 4-2 Sequence of Events for Break Spectrum Calculations, sec ................................................ 28
Table 4-3 Summary of Results for the Cold Leg Break RCP Trip Sensitivity ........................................ 29
Table 4-4 Summary of Results for the Hot Leg Break RCP Trip Sensitivity Study ............................... 29
AREVA NP Inc.
AAREVA
ANP-2971 (NP)Sequoyah Units 1 and 2 HTP Fuel Revision 1S-RELAP5 Small Break LOCA Analysis Page 6
List of Figures
Figure 3-1 S-RELAP5 SBLOCA Reactor Coolant System Nodalization .............................................. 12
Figure 3-2 S-RELAP5 SBLOCA Secondary System Nodalization ....................................................... 13
Figure 3-3 S-RELAP5 SBLOCA Reactor Vessel Nodalization .............................................................. 14
Figure 3-4 A xial P ow er S hape ................................................................................................................... 20
Figure 3-5 Axial Power Distribution Comparison .................................................................................. 21
Figure 4-1 Reactor Power - 9.76-inch Break ........................................................................................ 30
Figure 4-2 Primary and Secondary System Pressures - 9.76-inch Break ............................................ 31
Figure 4-3 Liquid and Vapor Break Flow - 9.76-inch Break ................................................................. 32
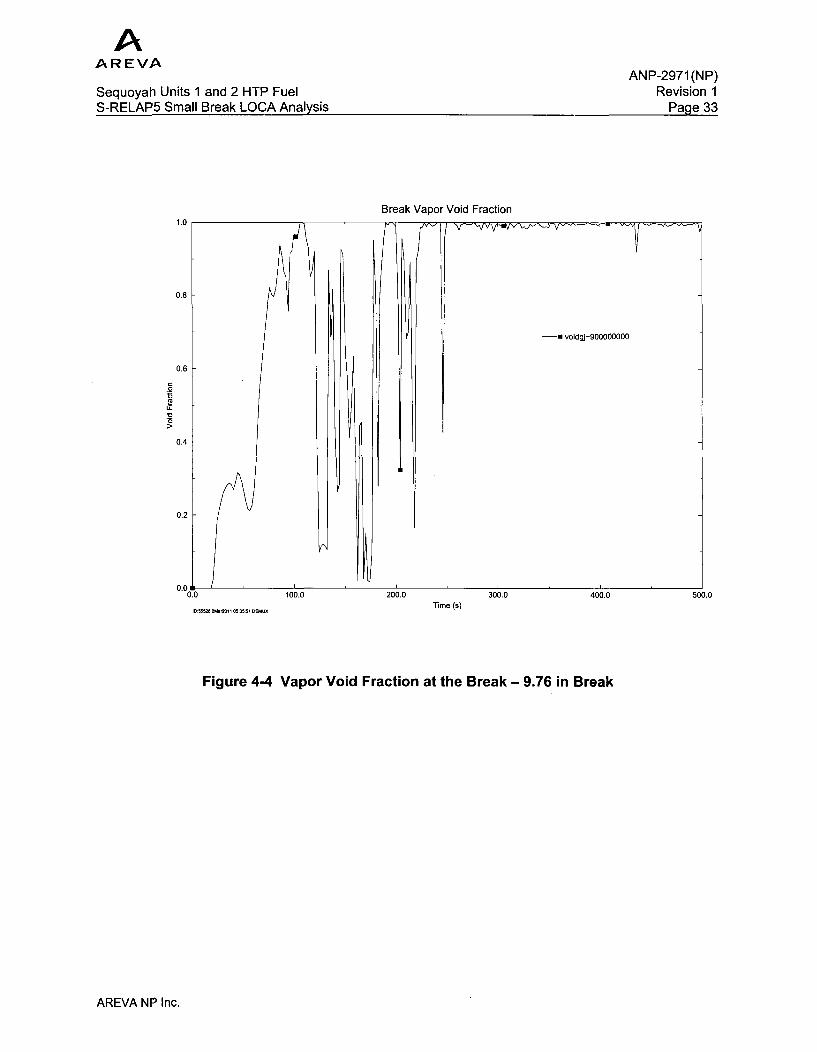
Figure 4-4 Vapor Void Fraction at the Break - 9.76 in Break .............................................................. 33
Figure 4-5 Loop Seal Void Fraction - 9.76-inch Break .......................................................................... 34
Figure 4-6 Total Core Inlet Mass Flow Rate - 9.76-inch Break ............................................................ 35
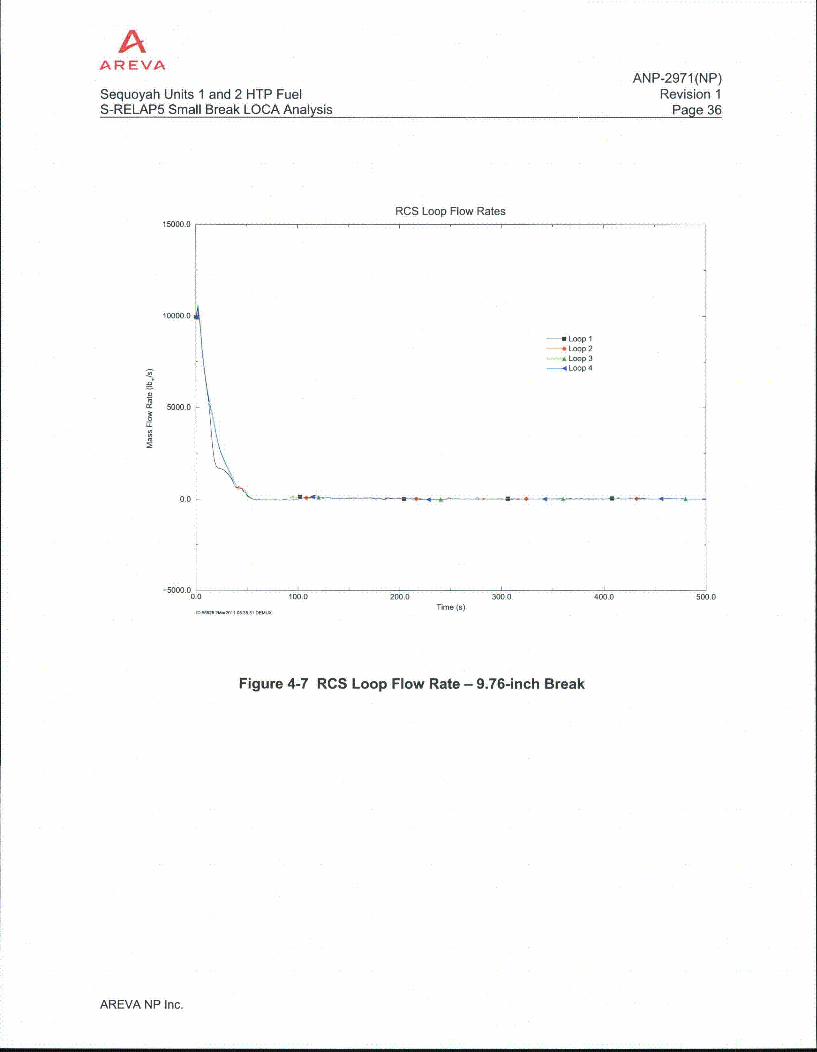
Figure 4-7 RCS Loop Flow Rate - 9.76-inch Break .............................................................................. 36
Figure 4-8 Steam Generator Main Feedwater Flow Rates - 9.76-inch Break ...................................... 37
Figure 4-9 Auxiliary Feedwater Flow - 9.76 in Break ............................................................................ 38
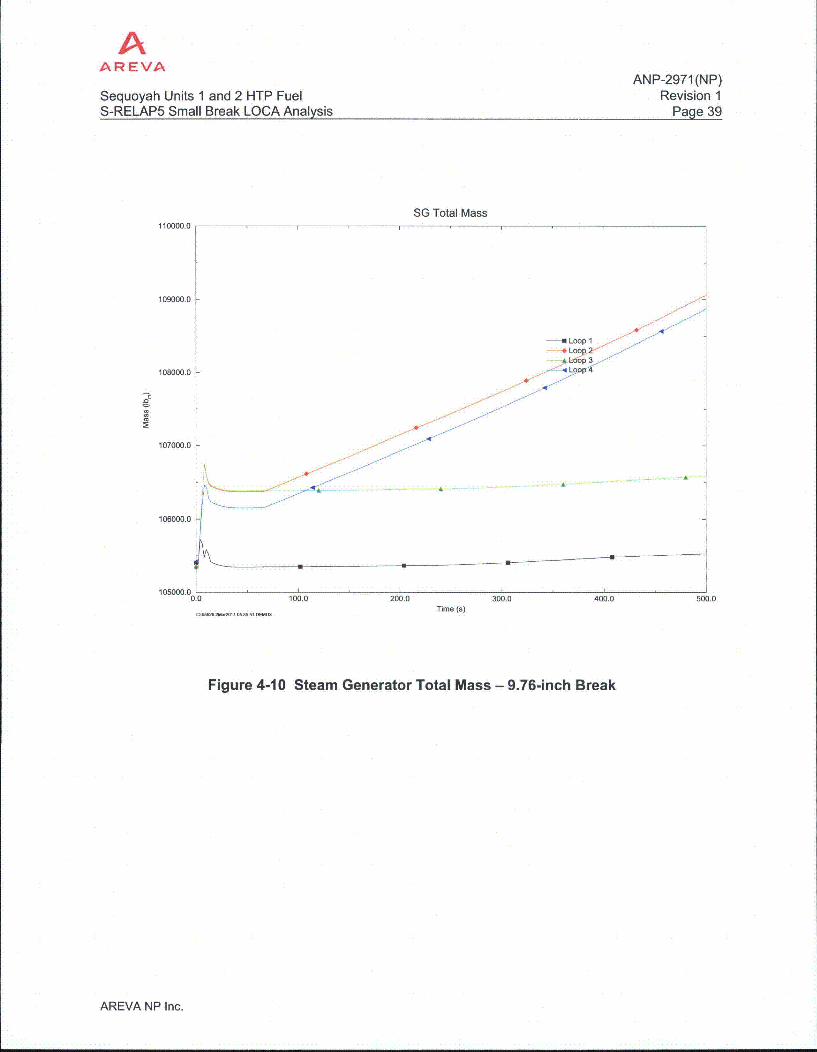
Figure 4-10 Steam Generator Total Mass - 9.76-inch Break ............................................................... 39
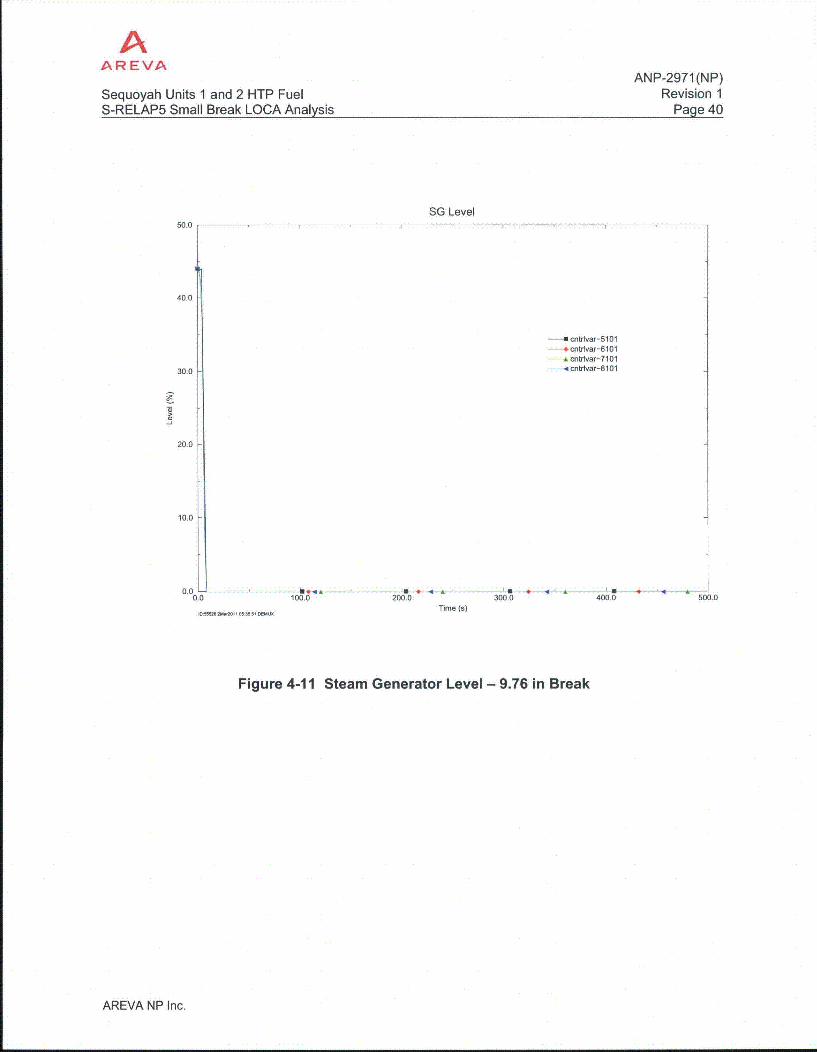
Figure 4-11 Steam Generator Level - 9.76 in Break ............................................................................ 40
Figure 4-12 Total HHSI Mass Flow - 9.76-inch Break ......................................................................... 41
Figure 4-13 Total Accumulator Flow - 9.76-inch Break ........................................................................ 42
Figure 4-14 Integrated Break Flow and ECC Flow - 9.76 in Break ...................................................... 43
Figure 4-15 Total Primary Mass - 9.76-inch Break .............................................................................. 44
Figure 4-16 Reactor Vessel Mass - 9.76-inch Break ............................................................................ 45
Figure 4-17 Hot Assembly Collapsed Liquid Level - 9.76-inch Break ................................................. 46
Figure 4-18 Hot Rod Mixture Level - 9.76 in Break ............................................................................... 47
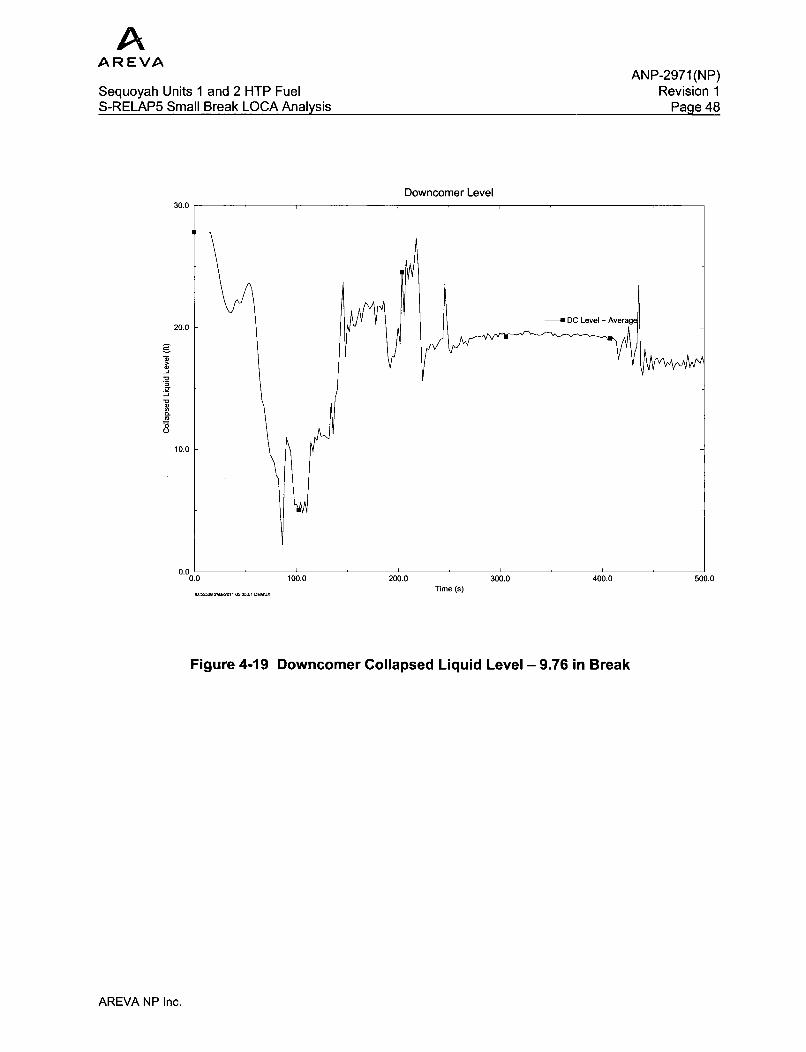
Figure 4-19 Downcomer Collapsed Liquid Level - 9.76 in Break ........................................................ 48
Figure 4-20 Volume Liquid Temperature at PCT Location - 9.76 in Break .......................................... 49
Figure 4-21 Liquid Void Fraction Distribution in the Hot Channel 0.75 - 7.75 ft Elevation- 9 .7 6 in B re a k ............................................................................................................................... 5 0
Figure 4-22 Liquid Void Fraction Distribution in the Hot Channel 8.25 - 11.75 ft Elevation- 9 .7 6 in B re a k ............................................................................................................................... 5 1
Figure 4-23 Heat Transfer Coefficient at PCT Location - 9.76-inch Break .......................................... 52
Figure 4-24 Peak Cladding Temperature at PCT Location - 9.76-inch Break ..................................... 53
Figure 4-25 Comparison of PCTs - AOR vs. S-RELAP5 Analysis ........................................................ 54
AREVA NP Inc.

AAREVA
ANP-2971(NP)Sequoyah Units 1 and 2 HTP Fuel Revision 1S-RELAP5 Small Break LOCA Analysis Page 7
Nomenclature
ADV Atmospheric dump valveAFAS Auxiliary feedwater actuation signalAFW Auxiliary feedwaterAOR Analysis of Record
BOC Beginning-of-cycle
CCI Centrifugal Charging InjectionCEA Control Element AssemblyCFR Code of Federal RegulationCRGT Control Rod Guide Tube
DC-HL Downcomer - Upper Head
ECCS Emergency core cooling systemEDG Emergency diesel generatorEOC End-of-cycleEOP Emergency Operating Procedure
HHSI High head safety injectionHTP High Thermal Performance
LHR Linear heat rateLOCA Loss of coolant accidentLOOP Loss of offsite powerLHSI Low head safety injection
MFW Main feedwaterMSIV Main steam isolation valveMSSV Main steam safety valveMWt Mega-Watt thermal
NRC Nuclear Regulatory Commission
PCT Peak cladding temperaturePWR Pressurized water reactor
RAI Request for Additional InformationRCP Reactor coolant pumpRCS Reactor coolant systemRHR Residual Heat Removal
SBLOCA Small Break Loss-of-Coolant-AccidentSEQ SequoyahSG Steam generatorSGTP Steam generator tube pluggingSI Safety injectionSIAS Safety injection actuation signal
AREVA NP Inc.
AAREVA
ANP-2971(NP)Sequoyah Units 1 and 2 HTP Fuel Revision 1S-RELAP5 Small Break LOCA Analysis Page 8
1.0 Introduction
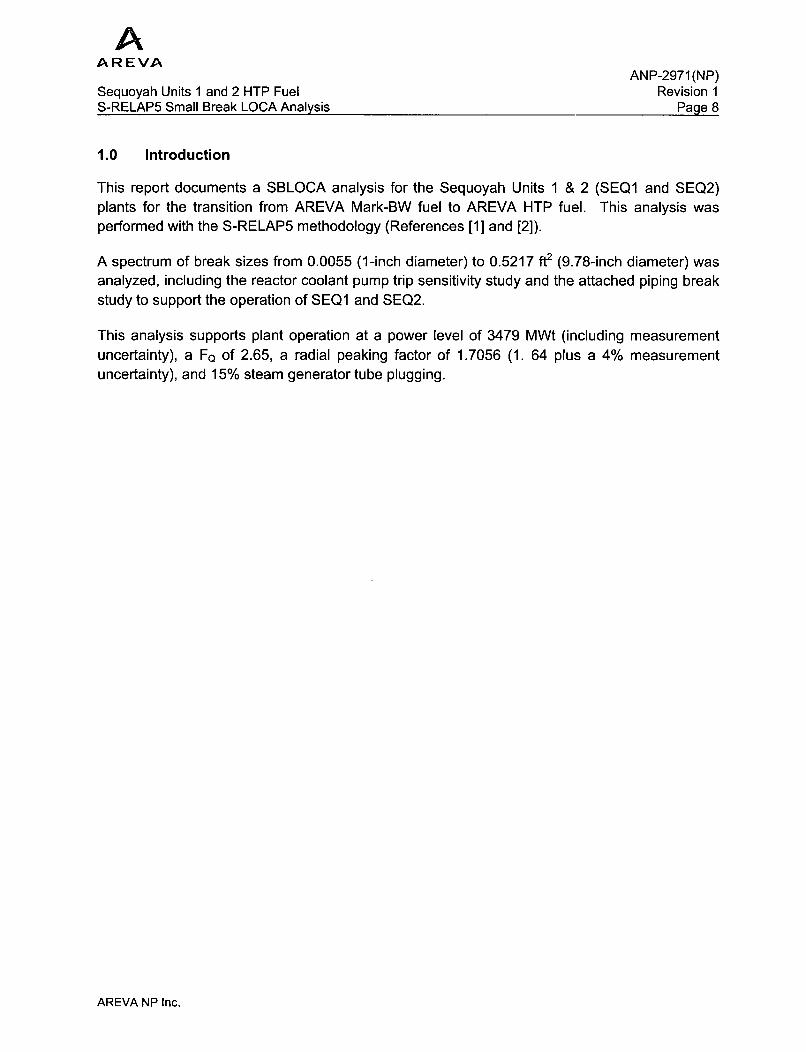
This report documents a SBLOCA analysis for the Sequoyah Units 1 & 2 (SEQ1 and SEQ2)plants for the transition from AREVA Mark-BW fuel to AREVA HTP fuel. This analysis wasperformed with the S-RELAP5 methodology (References [1] and [2]).
A spectrum of break sizes from 0.0055 (1 -inch diameter) to 0.5217 ft2 (9.78-inch diameter) wasanalyzed, including the reactor coolant pump trip sensitivity study and the attached piping breakstudy to support the operation of SEQ1 and SEQ2.
This analysis supports plant operation at a power level of 3479 MWt (including measurementuncertainty), a FQ of 2.65, a radial peaking factor of 1.7056 (1. 64 plus a 4% measurementuncertainty), and 15% steam generator tube plugging.
AREVA NP Inc.

AAR EVA
ANP-2971 (NP)Sequoyah Units 1 and 2 HTP Fuel Revision 1S-RELAP5 Small Break LOCA Analysis Page 9
2.0 Summary of Results
A SBLOCA break spectrum analysis was performed for SEQW and SEQ2. The limiting PCT is1470 OF for a break of 9.76-inch diameter pump discharge cold leg break.
This analysis was performed to demonstrate that the following acceptance criteria for EmergencyCore Cooling Systems, as stated in 10 CFR 50.46(b)(1-4), have been met.
(1) The calculated maximum fuel element cladding temperature shall not exceed 22000 F.
(2) The calculated total oxidation of the cladding shall nowhere exceed 0.17 times the totalcladding thickness before oxidation.
(3) The calculated total amount of hydrogen generated from the chemical reaction of. thecladding with water or steam shall not exceed 0.01 times the hypothetical amount thatwould be generated if all of the metal in the cladding cylinders surrounding the fuel,excluding the cladding surrounding the plenum volume, were to react.
(4) Calculated changes in core geometry shall be such that the core remains amenable tocooling.
The break spectrum calculations conservatively assumed RCP trip at reactor trip and loss ofoffsite power. An evaluation of delayed RCP trip was performed since a delayed RCP trip can
potentially produce more limiting results. Section 4.3 discusses the RCP trip sensitivity study.The results with respect to RCP trip would be "a trip within 2 minutes of loss of subcooling orSIAS actuation" does not result in a violation of 50.46(b).
AREVA NP Inc.
AAREVA
ANP-2971(NP)Sequoyah Units 1 and 2 HTP Fuel Revision 1S-RELAP5 Small Break LOCA Analysis Page 10
3.0 Description of Analysis
Section 3.1 below provides a brief description of the postulated SBLOCA event. Section 3.2describes the analytical models used in the analysis. Section 3.3 presents a description of SEQ1and SEQ2 plant parameters and outlines the system parameters used in the SBLOCA analysis.
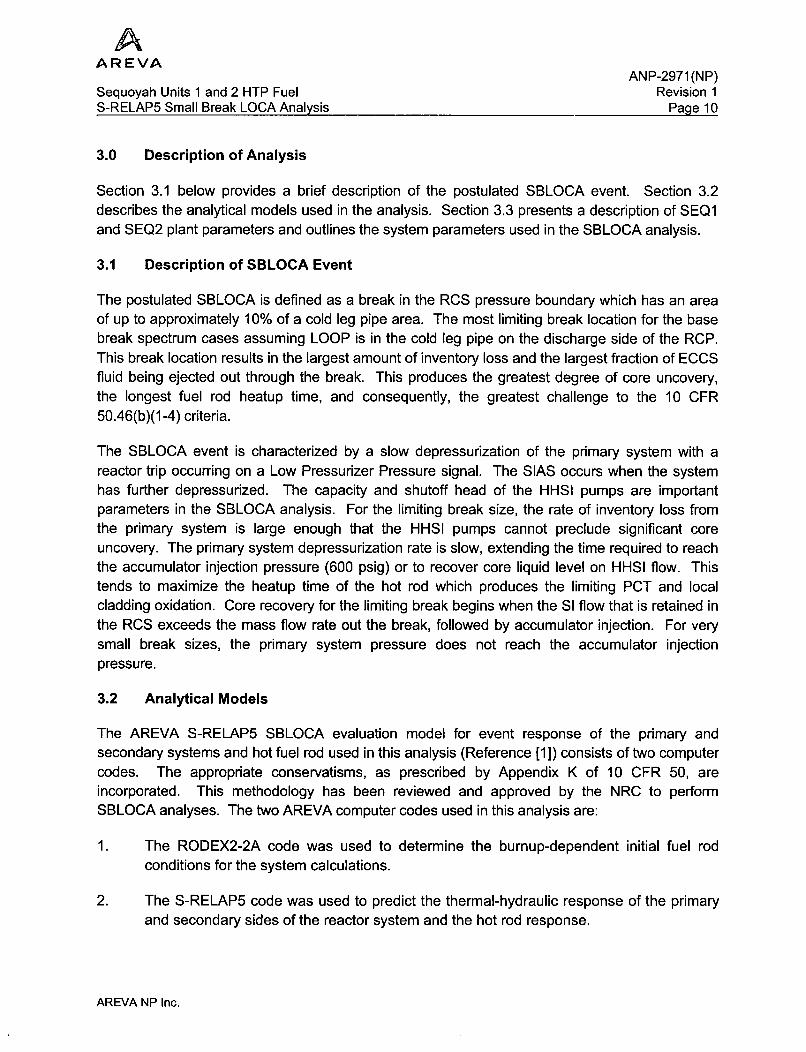
3.1 Description of SBLOCA Event
The postulated SBLOCA is defined as a break in the RCS pressure boundary which has an areaof up to approximately 10% of a cold leg pipe area. The most limiting break location for the basebreak spectrum cases assuming LOOP is in the cold leg pipe on the discharge side of the RCP.This break location results in the largest amount of inventory loss and the largest fraction of ECCSfluid being ejected out through the break. This produces the greatest degree of core uncovery,the longest fuel rod heatup time, and consequently, the greatest challenge to the 10 CFR50.46(b)(1 -4) criteria.
The SBLOCA event is characterized by a slow depressurization of the primary system with areactor trip occurring on a Low Pressurizer Pressure signal. The SIAS occurs when the systemhas further depressurized. The capacity and shutoff head of the HHSI pumps are importantparameters in the SBLOCA analysis. For the limiting break size, the rate of inventory loss fromthe primary system is large enough that the HHSI pumps cannot preclude significant coreuncovery. The primary system depressurization rate is slow, extending the time required to reachthe accumulator injection pressure (600 psig) or to recover core liquid level on HHSI flow. Thistends to maximize the heatup time of the hot rod which produces the limiting PCT and localcladding oxidation. Core recovery for the limiting break begins when the SI flow that is retained inthe RCS exceeds the mass flow rate out the break, followed by accumulator injection. For verysmall break sizes, the primary system pressure does not reach the accumulator injectionpressure.
3.2 Analytical Models
The AREVA S-RELAP5 SBLOCA evaluation model for event response of the primary andsecondary systems and hot fuel rod used in this analysis (Reference [1]) consists of two computercodes. The appropriate conservatisms, as prescribed by Appendix K of 10 CFR 50, areincorporated. This methodology has been reviewed and approved by the NRC to performSBLOCA analyses. The two AREVA computer codes used in this analysis are:
1. The RODEX2-2A code was used to determine the burnup-dependent initial fuel rodconditions for the system calculations.
2. The S-RELAP5 code was used to predict the thermal-hydraulic response of the primaryand secondary sides of the reactor system and the hot rod response.
AREVA NP Inc.

AAREVA
Sequoyah Units 1 and 2 HTP FuelS-RELAP5 Small Break LOCA Analysis
ANP-2971(NP)Revision 1
Paae 11
The gap conditions used to initialize S-RELAP5 are taken at EOC, consistent with an EOC top-peaked axial power distribution. The use of EOC fuel rod conditions along with an EOC powershape is bounding of BOC because (1) the gap conductance is higher at EOC, and (2) thepower shape is more top-skewed at EOC. The initial stored energy, although higher at BOC,has a negligible impact on SBLOCA results since the stored energy is dissipated long beforecore uncovery.
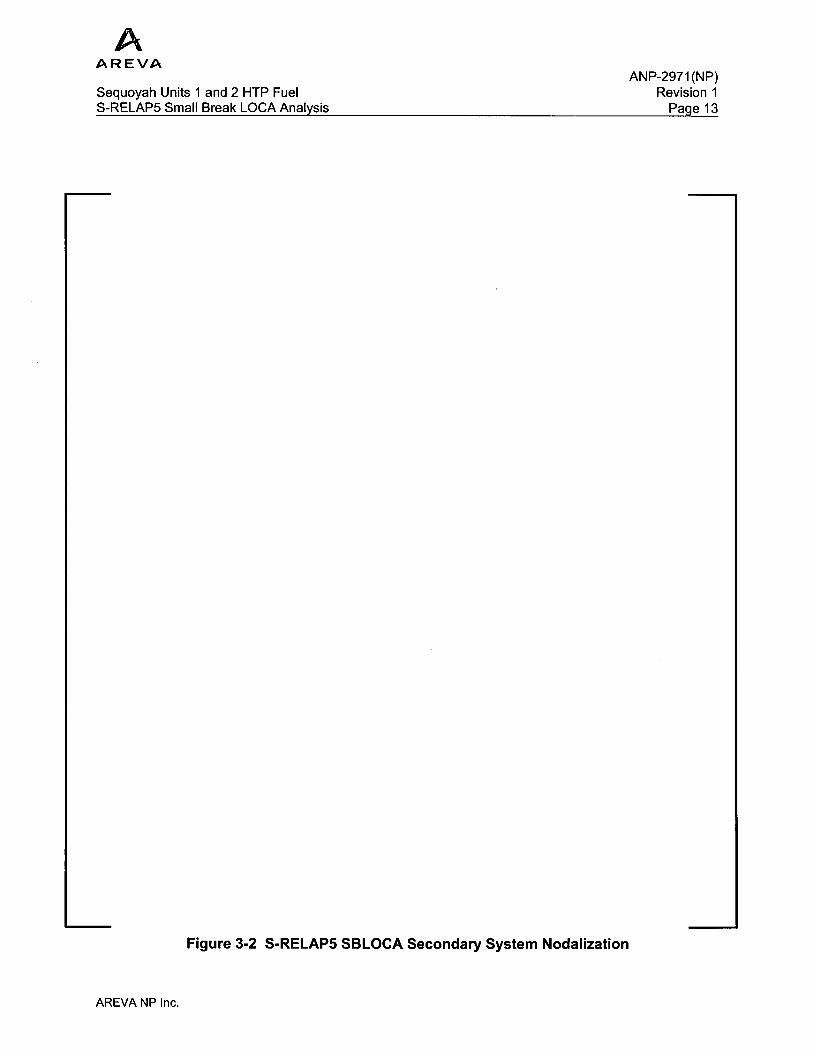
Figures 3-1 through 3-3 show the RCS, Secondary, and Reactor Vessel nodalization.
AREVA NP Inc.

AAAR EVA
Sequoyah Units 1 and 2 HTP FuelS-RELAP5 Small Break LOCA Analysis
ANP-2971(NP)Revision 1
Page 12
Figure 3-1 S-RELAP5 SBLOCA Reactor Coolant SystemNodalization
AREVA NP Inc.
AAREVA
Sequoyah Units 1 and 2 HTP FuelS-RELAP5 Small Break LOCA Analysis
ANP-2971(NP)Revision 1
Page 13
Figure 3-2 S-RELAP5 SBLOCA Secondary System Nodalization
AREVA NP Inc.

AAREVA
Sequoyah Units 1 and 2 HTP FuelS-RELAP5 Small Break LOCA Analysis
ANP-2971(NP)Revision 1
Paqe 14
Figure 3-3 S-RELAP5 SBLOCA Reactor Vessel Nodalization
AREVA NP Inc.
AAREVA
ANP-2971(NP)Sequoyah Units 1 and 2 HTP Fuel Revision 1S-RELAP5 Small Break LOCA Analysis Page 15
3.3 Plant Description and Summary of Analysis Parameters
The plant analysis presented in this report is for a Westinghouse-designed PWR, which has fourloops, each with a hot leg, a U-tube steam generator, and a cold leg with a RCP 1. The RCSAlso includes one pressurizer connected to a hot leg. The core contains (193) 17x17 AREVAfuel assemblies. The ECCS includes one charging and one accumulator/SI/RHR injection pathper RCS loop. The SI and RHR feed into common headers which are connected to theaccumulator lines. The charging pumps are also cross-connected. The limiting break locationwill be in a cold leg pump discharge location of piping. The RLBLOCA transients are ofsufficiently short duration that the switchover to sump cooling water (i.e., RAS) for ECCSpumped injection need not be considered.
The S-RELAP5 model explicitly describes the RCS, RV, pressurizer, and accumulator lines.The charging injection flows are connected to the RCS, and the SI and RHR injection flows areconnected to the accumulator lines, consistent with the plant layout. A symmetric steamgenerator tube plugging level of 15-percent per steam generator was assumed.
MFW is injected into the downcomer of each SG. There are three AFW pumps, that is, twomotor-driven and one turbine-driven pumps. The ECCS for the SBLOCA contains two HHSIpumps, four accumulators.
The RCS was nodalized in the S-RELAP5 model into control volumes interconnected by flowpaths or "junctions." The model includes four accumulators, a pressurizer, and four SGs withboth primary and secondary sides modeled. All of the loops were modeled explicitly to providean accurate representation of the plant. A SGTP level of 15% in each steam generator wasassumed. The HHSI system was modeled to deliver the total SI flow asymmetrically to thebroken loop and three intact loops in the S-RELAP5 model. The RHR system is included in themodel.
The heat generation rate in the S-RELAP5 reactor core model was determined from reactorkinetics equations with actinide and decay heating as prescribed by Appendix K.The analysis assumed loss of offsite power concurrent with reactor scram on low pressurizerpressure. The single-failure criterion required by Appendix K was satisfied by assuming the lossof one EDG, which resulted in the disabling of one HHSI pump and a motor-driven AFW pump.This yields only one HHSI pump providing flow to the RCS. It also results in only one motordriven AFW pump being available. Minimum capability, degraded flow was assumed from thesingle operable HHSI pump. For Sequoyah, where charging pumps are considered safety grade,charging pump flow is included with the HHSI flow. Initiation of the HHSI system was delayed by37-seconds beyond the time of SIAS. The 37-second delay represents the time required fordiesel generator startup and switching, and the time it takes for the centrifugal charging pump coldleg injection valves to fully open.
The RCPs are Westinghouse 93A type pumps. The homologous pump performance curves for this type
of pump were input to the S-RELAP5 plant model.
AREVA NP Inc.

AAREVA
ANP-2971(NP)Sequoyah Units 1 and 2 HTP Fuel Revision 1S-RELAP5 Small Break LOCA Analysis Page 16
The initiation of the motor-driven pump was delayed by 60-seconds. No credit is taken for theturbine-driven AFW pump.
The input model included details of both main steam lines from the SGs to the turbine controlvalve, including the MSSV inlet piping connected to the main steam lines. For this small areabreak, the primary and secondary pressure remained coupled at the MSSV actuation pressuresetpoint.
Important system parameters and initial conditions used in the analysis are given in Table 3-1.The HHSI flow used in the analysis is shown in Table 3-2. The reactivity feedback tables (Table3-3 and Table 3-4) are applicable for the HTP transition core designs.
The axial power shapes for this analysis is shown in Figure 3-4. Figure 3-5 compares the axialpower shape at mid-node elevation for hot rod, hot assembly, inner and outer core used in theanalysis.
AREVA NP Inc.

AAREVA
Sequoyah Units 1 and 2 HTP FuelS-RELAP5 Small Break LOCA Analysis
ANP-2971(NP)Revision 1
Paae 17
Table 3-1 System Parameters and Initial Conditions
Parameter Value
Reactor Power, MWt 34791Axial Power Shape Figure 3-4
Radial Peaking Factor (includes uncertainty) 1.7056
Total Power Peaking Factor (includes uncertainty) 2.65
RCS Flow Rate, gpm 378400
Pressurizer Pressure, psia 2249.7
Core Inlet Coolant Temperature, OF 583
Accumulator Pressure, psia 614.7
Accumulator Fluid Temperature, OF 105
Accumulator Water Volume, ft3 1050
SG Tube Plugging Level, % 15
SG Secondary Pressure, psia 877.4
MFW Temperature, 'F 435.8
AFW Temperature, OF 120
Low SG Level AFAS Setpoint for harsh conditions, %NR Span 0
CCI, HHSI, and RHR Fluid Temperature, OF 110
Pressurizer Pressure - Low Reactor Trip Setpoint (RPS), psia 1859.70
Reactor Scram Delay Time on Low Pressurizer Pressure, sec 2
Scram CEA Holding Coil Release Delay Time, sec 0.5
SIAS Activation Setpoint Pressure, psia 1744.7
HHSI Pump Delay Time on SIAS, sec 37
MSSV lift pressures 1064.01077.01090.0
1103.01117.0
1 Includes uncertainty.
AREVA NP Inc.

AAREVA
Sequoyah Units 1 and 2 HTP FuelS-RELAP5 Small Break LOCA Analysis
ANP-2971(NP)Revision 1
Page 18
Table 3-2 CCI, HHSI, & RHR Flows as Function of the PrimarySystem Pressure
CCI Flow HHSI Flow RHR Flow
Primary Mass Flow Primary Mass Flow Primary Mass FlowPressure Rate Pressure Rate Pressure Rate
(psia) (ILb s) (psia) (Ibm/s) (psia) (Ib s)
2237 0.00 -
1902 2.20 -
1676 12.50 -
1443 20.80 -
1392 22.30 1392 0.00
1220 27.30 1220 23.70
1038 32.10 1038 37.80
861 36.80 861 48.00
675 41.20 675 56.10
482 45.10 482 62.80
291 49.30 291 69.30
242 50.30 242 70.90
194 51.40 194 72.50
179 51.80 179 73.00 179 0.00
149 52.40 149 73.90 149 246.40
125 53.00 125 74.60 125 331.00
100 53.50 100 75.40 100 393.40
75 54.00 75 76.10 75 446.50
50 54.60 50 76.90 50 494.40
15 55.30 15 78.00 15 550.00
AREVA NP Inc.

AAR EVA
Sequoyah Units I and 2 HTP FuelS-RELAP5 Small Break LOCA Analysis
ANP-2971(NP)Revision 1
Page 19
Table 3-3 Moderator Density Reactivity
Table 3-4 Doppler Reactivity
AREVA NP Inc.

AAREVA
Sequoyah Units 1 and 2 HTP FuelS-RELAP5 Small Break LOCA Analysis
ANP-2971(NP)Revision 1
Paae 20
Figure 3-4 Axial Power Shape
AREVA NP Inc.

AAR EVA
Sequoyah Units 1 and 2 HTP FuelS-RELAP5 Small Break LOCA Analysis
ANP-2971(NP)Revision 1
Page 21
Figure 3-5 Axial Power Distribution Comparison
AREVA NP Inc.

AAREVA
Sequoyah Units 1 and 2 HTP FuelS-RELAP5 Small Break LOCA Analysis
ANP-2971 (NP)Revision 1
Pace 22
4.0 Analytical Results
4.1 Results
The break spectrum should include breaks of varying diameter through the break thatrepresents 10% of the cold leg flow area. Once the preliminary limiting break size (DLIM) hasbeen identified, additional calculations should be run with diameters of DLIM±0.25 in,DLIM+0.50 in, and DLIM±0.75 in. The expectation is to
1. Cover the entire 0-10% small break area range; and
2. Demonstrate that the actual limiting break size has been identified within 0.25-inchdiameter.
The current analysis takes into consideration breaks in the attached piping (accumulator line,charging line).
For the RCP trip sensitivity study, a hot leg break was analyzed in addition to the cold legbreaks. The break spectrum calculations were executed for breaks of 1.00, 2.00, 2.75, 3:00,3.50, 4.00, 4.50, 4.75, 4.90, 4.95, 5.00, 5.05, 5.10, 5.12, 5.13, 5.14, 5.15, 5.20, 5.25, 5.50, 5.75,6.00, 6.50, 7.00, 8.00, 8.50, 9.00, 9.75, 9.76, 9.77 and 9.78-inch diameter (the 9.76-inchdiameter break corresponds to an area equal to 10% of the cold leg area). The results for thebreak spectrum calculations are presented in Table 4-1. Predicted event times are summarizedin Table 4-21 for the break spectrum calculations.
The break spectrum calculations conservatively assumed RCP trip at reactor trip due to anassumed loss of offsite power at reactor trip. However, a delayed RCP trip can potentiallyproduce more limiting results than tripping the RCPs at reactor trip. This delayed trip sensitivityis discussed in Section 4.3.
The ."' in Table 4-2 indicates that the loop seals cleared after the accumulator injection occurred.
AREVA NP Inc.

AAREVA
ANP-2971 (NP)Sequoyah Units 1 and 2 HTP Fuel Revision 1S-RELAP5 Small Break LOCA Analysis Page 23
The key parameters for the limiting case (9.76-inch break) are shown in Figure 4-1 through Figure4-24. The results of the analysis demonstrate the adequacy of the Emergency Core CoolingSystem (ECCS) to support the criteria given in 10 CFR 50.46(b) for SEQ1 and SEQ2 operatingwith AREVA supplied 17x17 HTP M5 clad fuel; as follows:
(1) Peak cladding temperature: The calculated limiting fuel element cladding temperature is1470°F, which is less than the 22000 F limit criterion.
(2) Maximum local cladding oxidation: The calculated maximum local oxidation of thecladding is 0.17% which is less than the 17% limit of the criterion.
(3) Maximum core-wide oxidation: The calculated core-wide total oxidation is 0.0013%,which is less than the 1% limit of the criterion.
(4) Coolable geometry: The cladding remains amenable to cooling. None of the casesanalyzed predicted hot rod rupture, hence no blockage is predicted to occur, whichwould degrade core cooling. Further, an M5 mechanical deformation analysis presentedin Appendix F of Reference [4] is not changed by the fuel design changes. Both thermaland mechanical deformations of the fuel assemblies in the core have been assessedand the resultant deformations have been shown to maintain coolable coreconfigurations. Therefore, the coolable geometry requirements of the criterion are met.
4.2 Discussion of Transient for 9.76-inch Break
The break opens at the initiation of the transient t=0 seconds and initiates a subcooleddepressurization of the primary system. The Low Pressurizer Pressure Trip setpoint is reachedwithin 0.4 seconds and within 3 seconds the reactor is tripped, the offsite power is lost,concurrent with the turbine trip, RCP trip, and Main Feedwater Pumps trip. After 7 seconds theSafety Injection Actuation Signal is issued on Low Pressurizer Pressure and at the same timethe motor-driven Auxiliary Feedwater Pump actuation signal is issued.
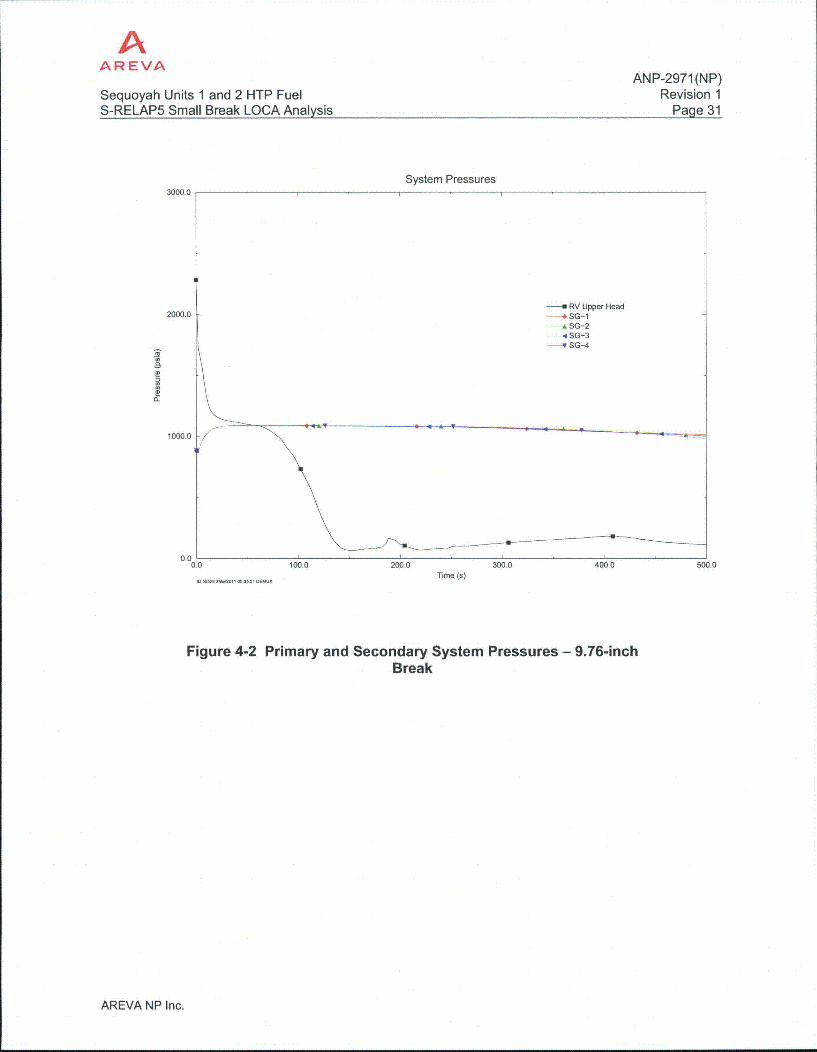
The primary depressurization continues at a relatively high rate for the first approximately20 seconds, after which it decreases significantly for approximately 60 seconds, while thepressure is relatively flat, and then remains relatively constant through the rest of the transient.The secondary side pressure increases in all four Steam Generators but not enough to reachthe MSSV lift setpoint(s) and it stabilizes and remains almost constant through the rest of thetransient (Figure 4-2). The single Auxiliary Feedwater Pump left running by the single-failureassumption starts delivering flow to the Steam Generators 2 and 4 around 66 seconds (Figure4-9), but it is unable to increase the SG level above the lower boundary of the narrow rangelevel span (Figure 4-11).
The continued depressurization causes the flashing of the liquid and the generation of steambubbles that tend to accumulate to the high elevation points in the primary, e.g. the bend of theSteam Generator U-tubes. The liquid in the pressurizer drains rapidly and liquid in the core
AREVA NP Inc.

AAR EVA
ANP-2971(NP)Sequoyah Units 1 and 2 HTP Fuel Revision 1S-RELAP5 Small Break LOCA Analysis Page 24
starts to boil as the saturation pressure is reached and progressively the nodes in the hotassembly start voiding. As a result, the collapsed liquid level decreases rapidly at thebeginning, but as the volume heat source decreases rapidly following the reactor trip, some ofthe steam bubbles formed initially collapse and the level briefly recovers around 10 seconds intothe transient, after which it continues to decrease until the entire hot channel is completely voidof liquid around approximately 50 seconds (Figure 4-17). At the same time, the hot rod mixturelevel remains to the top of the core (Figure 4-18) and remains there until around 45 secondswhen it abruptly drops to the bottom. As downcomer level decreases (Figure 4-19), it reachesthe point where the cold leg nozzles are uncovered and steam can start venting out to the coldlegs (Figure 4-3 and Figure 4-4).
As the core is voided of liquid, the heat transfer conditions worsen (Figure 4-23) and reach thepoint where the hot rod is no longer properly cooled and starts the adiabatic heatup (Figure4-24). Meanwhile, both Centrifugal Charging Injection and High Head Safety Injection startdelivering fluid to the cold legs at 46 seconds (Figure 4-12), but the liquid injected cannot makeup for the large amount of fluid lost to the break up to this point (Figure 4-14) and the claddingtemperature keeps rising. As break uncovers around 86 seconds, the amount of liquid lost outthe break decreases sharply and steam is vented out the break (Figure 4-3) releasing energyfrom the primary. The primary system pressure starts decreasing again and the loop seals beginto clear between 90 and 102 seconds (Figure 4-5). Seconds later, the accumulator injectionbegins (Figure 4-13) and the large amount of liquid added to the primary turns the transientaround, liquid levels start rising, first in the downcomer (Figure 4-19), and later into the core(Figure 4-17). Cladding temperature reaches its peak of 1469.3 OF at 143 seconds, and then, ascooling conditions in the core starts improving due to the increased presence of liquid, it dropsas core quenches.
4.3 RCP Trip Sensitivity Study
A Reactor Coolant Pump trip sensitivity study has been performed as required in Reference [3].For plants that do not have an automatic RCP trip, a delayed RCP trip can potentially result in amore limiting condition than tripping the RCPs at reactor trip. Continued operation of the RCPscan result in earlier loop seal clearing with associated two-phase flow out the break, whichwould results in less inventory loss out the break early in the transient. It is possible that trippingthe pumps at minimum RCS inventory could cause a collapse of core voids, thus depressing thecore level and provoking a deeper core uncovery, and a potentially higher PCT.
The TVA Emergency Operating Procedure No. E-1, "Loss of Reactor or Secondary Coolant"requires the RCPs to be tripped when:
(1) Primary system pressure is less than 1250 psig and at least one charging or one safetyinjection pump is running, or, when
(2) A Phase B isolation signal has been generated on high-high containment pressure (i.e.containment pressure _> 2.9 psig).
AREVA NP Inc.

AAREVA
ANP-2971(NP)Sequoyah Units 1 and 2 HTP Fuel Revision 1S-RELAP5 Small Break LOCA Analysis Page 25
The nominal setpoint of 1250 psig is based on an instrument uncertainty of ±111 psi, thus thepump trip could occur at actual primary system pressures as high as 1361 psig or as low as1139 psig.
The RCP trip sensitivity study will include those breaks for which the break uncovery time fromthe break spectrum case is less than the RCP trip time determined based on the EOPs. Fromthe break spectrum transient study, this means breaks of 6.5-inch diameter and higher, i.e. 6.50,7.00, 8.00, 9.00, 9.75, 9.76, 9.77 and 9.78-inch diameter.
4.3.1 Cold Leg Breaks RCP Trip Sensitivity Study
For the cold leg breaks RCP trip sensitivity study the selected breaks of 6.50, 7.00, 8.00, 9.00,9.75, 9.76, 9.77 and 9.78-inch diameter are being re-analyzed with a delayed RCP trip. For thesecases the RCP trip time based on EOPs is the same, 166.0 seconds.
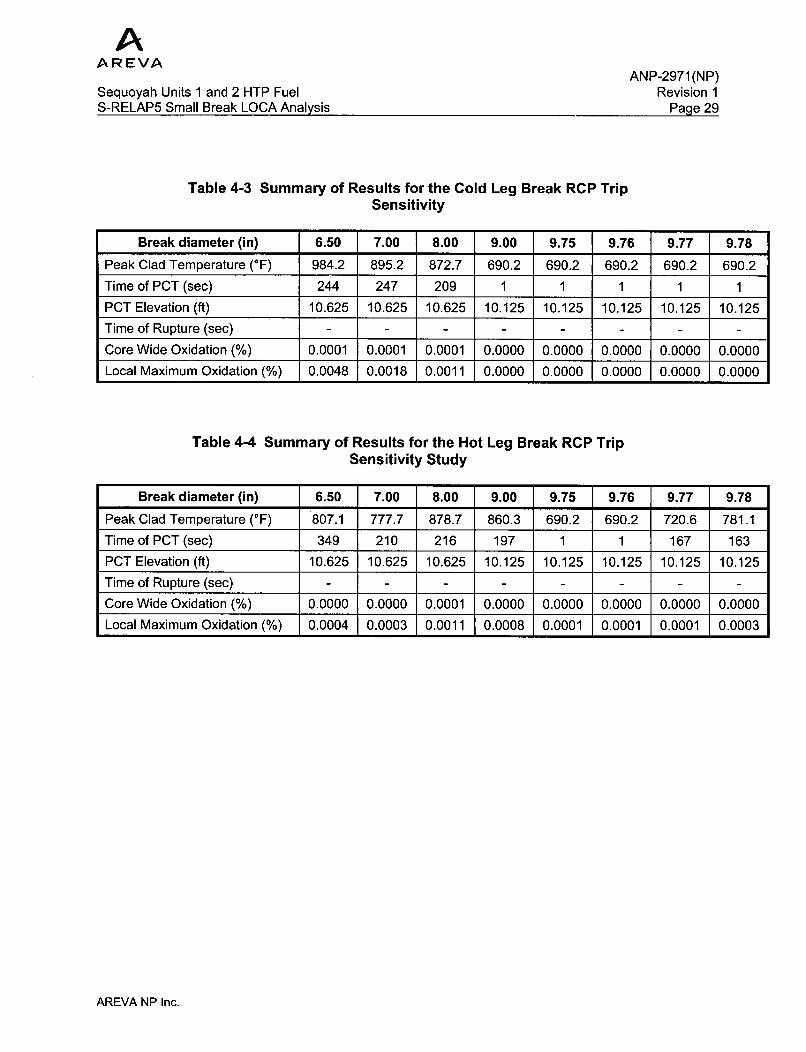
A summary of results of the cold leg break RCP trip sensitivity runs are presented in Table 4-3.The results of the cold leg breaks RCP trip sensitivity study do not impact the limiting PCT of1470°F from the SBLOCA break spectrum study.
4.3.2 Hot Leg Breaks RCP Trip Sensitivity Study
For the hot leg breaks RCP trip sensitivity study the same selected breaks of 6.50, 7.00, 8.00,9.00, 9.75, 9.76, 9.77 and 9.78 inch diameter are being re-analyzed with a delayed RCP trip and ahot leg break. For these cases the RCP trip time based on EOPs is the same, 166.0 seconds.
A summary of results of the cold leg break RCP trip sensitivity runs are presented in Table 4-4.The results of the hot leg breaks RCP trip sensitivity study do not impact the limiting PCT of1470°F from the SBLOCA break spectrum study.
4.4 Attached Piping LOCA Cases
Sensitivity calculations for breaks in the attached piping have also been performed. Theseconsist of a double ended guillotine (DEG) break of the accumulator line and a DEG break ofthe charging line.
For the DEG break of the accumulator, the calculated PCT is 1386.1 OF. The results of thecharging line break analysis showed that there is no heat up occurred, which is consistent withthe conclusion of the Sequoyah FSAR analysis of this break. The results of these two breaks donot challenge the limiting PCT of 1470°F from the SBLOCA break spectrum study.
4.5 Results Comparison against AOR
The results from the current analysis break spectrum were compared to the analysis of record
(AOR) as provided in Figure 4-25. In the AOR, the limiting break was the 2.75-inch diameterbreak, which resulted in a PCT of 1403 'F. In the current analysis, the 2.75-inch diameter break
AREVA NP Inc.

AAREVA
ANP-2971(NP)Sequoyah Units 1 and 2 HTP Fuel Revision 1S-RELAP5 Small Break LOCA Analysis Page 26
resulted in a PCT of 1027 'F. The difference in results can be attributed to several factors ofwhich the most important are enumerated below:
The most important difference comes from the axial power shape used by each of the analyses.The AOR uses a more conservative axial shape which puts more power in the top half of thecore. As a result, the fuel nodes at the top of the core experience a faster liquid dry-out, lesscooling and a prolonged adiabatic heatup which drives the PCT higher. Also, the FAH valuesused are different - the AOR uses a very conservative value of 1.8928 (due to an axial peakfixed at 1.4 by the BAW-10168 (P)(A) methodology), while the current analysis complies withthe EM requirements of using the Technical Specifications limit of 1.7056.
There are several important modeling differences that account for the different thermal-hydraulicbehavior. The AOR model uses a lumped triple loop for modeling the intact loops, while thecurrent analysis uses distinct loop models for each loop. This accounts for major differences inthe system response with respect to steam venting and also plays a role in the loop sealclearing. Also, the AOR model for the break is very different using a "dummy" node connectedto the bottom of the pipe, and a valve connected to this "dummy" node, while the S-RELAP5model uses a trip valve directly connected to the centerline cold leg piping. This modelingdifference is responsible for the differences in the vapor void fraction at the break, thus affectingthe break uncovery time, the fluid mass lost out the break and the steam and energy venting outthe break. This modeling difference plays a role in the significant difference in the primarypressure, which is lower in the current analysis from early into the transient and almost to theend, and, as a result, determines a higher pumped SI flow being delivered in the currentanalysis vs. the AOR. The differences in the SI flow being delivered and the fluid lost out thebreak account for the difference in reactor vessel mass and consequently the lower collapsedcore liquid level in the AOR, the prolonged and deeper core uncovery and thus the higher PCTresult in the AOR.
One other important difference is that the AOR model has been built with the original SteamGenerators, while the current analysis uses the replacement Steam Generators. While thereplacement Steam Generators are functionally identical to the original ones, there aredifferences in design that come into play and affect the transient behavior, with consequenceson the loop seal clearing and steam venting.
AREVA NP Inc.

AAREVA
Sequoyah Units 1 and 2 HTP FuelS-RELAP5 Small Break LOCA Analysis
ANP-2971 (NP)Revision 1
Page 27
Table 4-1 Summary of SBLOCA Break Spectrum Results
Break diameter (in) 1.00 2.00 2.20 2.40 2.60 2.75 2.90 3.00
Peak Clad Temperature (°F) 690.2 690.2 976.6 986.9 960.7 1027.0 884.5 1069.1
Time of PCT (sec) 1 1 1369 2856 2487 2004 2011 1832
PCT Elevation (ft) 10.125 10.125 10.625 10.625 11.125 10.625 11.125 11.125
Time of Rupture (sec) N/A N/A N/A N/A N/A N/A N/A N/A
Core Wide Oxidation (%) 0.0002 0.0002 0.0002 0.0004 0.0003 0.0004 0.0001 0.0006
Local Maximum Oxidation (%) 0.0004 0.0002 0.0036 0.0163 0.0158 0.0238 0.0055 0.0334
Break diameter (in) 3.25 3.50 3.75 4.00 4.25 4.50 4.75 4.80
Peak Clad Temperature (OF) 945.6 947.2 957.2 758.2 816.2 844.4 1246.9 852.0
Time of PCT (sec) 1580 1320 1035 387 340 294 547 255
PCTElevation (ft) 11.125 11.125 11.125 10.625 10.625 10.625 11.125 10.625
Time of Rupture (sec) N/A N/A N/A N/A N/A N/A N/A N/A
Core Wide Oxidation (%) 0.0001 0.0001 0.0001 0.0001 0.0001 0.0001 0.0009 0.0001
Local Maximum Oxidation (%) 0.0068 0.0048 0.0061 0.0002 0.0005 0.0007 0.0686 0.0008
Break diameter (in) 4.85 4.90 4.95 5.00 5.50 6.00 6.50 7.00
Peak Clad Temperature (OF) 868.8 889.3 894.5 904.1 1040.5 1056.1 1095.8 1214.4
Time of PCT (sec) 252 249 244 240 212 180 164 182
PCT Elevation (ft) 10.625 10.625 10.625 10.625 10.625 10.625 10.625 10.625
Time of Rupture (sec) N/A N/A N/A N/A N/A N/A N/A N/A
Core Wide Oxidation (%) 0.0001 0.0001 0.0001 0.0001 0.0002 0.0002 0.0002 0.0005
Local Maximum Oxidation (%) 0.0010 0.0013 0.0013 0.0015 0.0082 0.0107 0.0150 0.0474
Break diameter (in) 8.00 9.00 9.75 9.76 9.77 9.78
Peak Clad Temperature (OF) 1367.6 1341.5 1385.7 1469.3 1325.6 1379.4
Time of PCT (sec) 175 149 132 143 139 136
PCT Elevation (ft) 10.625 10.625 10.125 10.625 10.125 10.625
Time of Rupture (sec) N/A N/A N/A N/A N/A N/A
Core Wide Oxidation (%) 0.0009 0.0004 0.0007 0.0013 0.0003 0.0006
Local Maximum Oxidation (%) 0.1082 0.0812 0.1145 0.1659 0.0848 0.1184
AREVA NP Inc.

AAREVA
Sequoyah Units 1 and 2 HTP FuelS-RELAP5 Small Break LOCA Analysis
ANP-2971(NP)Revision 1
Page 28
Table 4-2 Sequence of Events for Break Spectrum Calculations, sec
a) .. I Z U
CLC L w M iu M w0 -00 w EL 4) - E
CD 0 4 >E2 C -> - 40 10 0 3 46 5.- 1 30 w 39 1
20 0 N7- 2 3 132 33 0 M M 36 E a598I ) U) E .20 ~ c 'W 0.Xa. =. w E - 0 > O
2.70-018 200 00 04 76 269 0 - 20 - F
1.00 0 225 227 240 684 231 - - - - - - 4040 - 1 680
2.00 0 43 46 57 176 50 - 1370 - - 1390 - 3993 - 1
2.20 0 34 36 47 152 40 - 1300 - - 1138 - 3506 - 1369 1210
2.40 0 27 29 39 132 33 - 1038 - - 936 - 2648 - 2856 980
2.60 0 21 23 33 116 27 - 872 - - 880 13450 2268 - 2487 704 3
2.75 0 18 20 30 106 24 - 746 - - 764 2690 1982 - 2004 738 -
2.90 0 15 17 27 64 21 - 694 - - 670 2312 1938 - 2011 680
3.00 0 13 16 25 64 19 - 638 - - 648 1878 1664 - 1832 624
3.25 0 10 13 22 60 16 1 566 - - 550 1574 1578 - 1580 544
3.50 0 8 10 19 56 14 486 - - 498 1262 1252 - 1320 276
3.75 0 6 9 17 54 12 * 412 - - 422 1020 1026 - 1035 382
4.00 0 5 7 15 54 11 386 - 384 - 394 914 922 - 387 336 -
4.25 0 4 7 14 52 10 336 336 334 - 346 762 814 - 340 176 -
4.50 0 0.8 3 12 50 7 288 290 290 - 300 652 700 - 294 168
4.75 0 0.7 3 12 50 7 2 - 250 264 514 518 - 547 130
4.80 0 0.7 3 11 50 7 250 250 250 - 260 550 602 - 255 128
4.85 0 0.7 3 11 50 7 1 246 246 - 256 532 540 - 252 126
4.90 0 0.7 3 11 50 7 1 244 1244 252 520 534 - 249 126
4.95 0 0.7 3 11 50 7 240 20 240 4 248 508 554 - 244 124
5.00 0 0.7 3 11 48 7 236 234 234 - 248 492 538 - 240 122 3
5.50 0 0.6 3 10 48 7 198 202 200 * 212 392 428 - 212 106 -
6.00 0 0.6 3 9 48 7 1698166 168 10 8 328 338 - 180 92 4
6.50 0 0.6 3 9 46 7 146 146 146 152 160 276 298 - 164 82
7.00 0 0.5 3 8 46 7 130 128 128 142 138 234 260 - 182 78 -
8.00 0 0.5 3 8 46 7 126 126 126 136 132 166 118 - 175 56 308
9.00 0 0.5 3 7 46 7 98 98 98 108 90 130 142 - 149 46 244
9.75 0 0.4 3 7 46 7 92 92 92 104 86 110 120 - 132 40 214
9.76 0 0.4 3 7 46 7 90 92 92 102 86 110 130 - 143 40 220
9,77 0 0.4 3 7 46 7 90 98 98 106 92 112 114 - 139 40 208
9.78 0 0.4 3 7 46 7 98 98 98 106 92 112 114 - 136 40 210
AREVA NP Inc.
AARE VA
Sequoyah Units 1 and 2 HTP FuelS-RELAP5 Small Break LOCA Analysis
ANP-2971(NP)Revision 1
Page 29
Table 4-3 Summary of Results for the Cold Leg Break RCP TripSensitivity
Break diameter (in) 6.50 7.00 8.00 9.00 9.75 9.76 9.77 9.78
Peak Clad Temperature (°F) 984.2 895.2 872.7 690.2 690.2 690.2 690.2 690.2
Time of PCT (sec) 244 247 209 1 1 1 1 1
PCT Elevation (ft) 10.625 10.625 10.625 10.125 10.125 10.125 10.125 10.125
Time of Rupture (sec) - - - - - - - -
Core Wide Oxidation (%) 0.0001 0.0001 0.0001 0.0000 0.0000 0.0000 0.0000 0.0000
Local Maximum Oxidation (%) 0.0048 0.0018 0.0011 0.0000 0.0000 0.0000 0.0000 0.0000
Table 4-4 Summary of Results for the Hot Leg Break RCP TripSensitivity Study
Break diameter (in) 6.50 7.00 8.00 9.00 9.75 9.76 9.77 9.78
Peak Clad Temperature (°F) 807.1 777.7 878.7 860.3 690.2 690.2 720.6 781.1
Time of PCT (sec) 349 210 216 197 1 1 167 163
PCT Elevation (ft) 10.625 10.625 10.625 10.125 10.125 10.125 10.125 10.125
Time of Rupture (sec) - - - - - - - -
Core Wide Oxidation (%) 0.0000 0.0000 0.0001 0.0000 0.0000 0.0000 0.0000 0.0000
Local Maximum Oxidation (%) 0.0004 0.0003 0.0011 0.0008 0.0001 0.0001 0.0001 0.0003
AREVA NP Inc.

AAREVA
Sequoyah Units 1 and 2 HTP FuelS-RELAP5 Small Break LOCA Analysis
ANP-2971(NP)Revision 1
Page 30
Reactor Power4000.0
3000.0
2000.0
1000.0
0.00.0
Time (s)
Figure 4-1 Reactor Power - 9.76-inch Break
AREVA NP Inc.
AAREVA
Sequoyah Units 1 and 2 HTP FuelS-RELAP5 Small Break LOCA Analysis
ANP-2971 (NP)Revision 1
Page 31
System Pressures3000.0
2000.0
E
1000.0
0.0 1 1 1 10.0 100.0 200.0 300.0 400,0
Time (s)500.0
Figure 4-2 Primary and Secondary System Pressures - 9.76-inchBreak
AREVA NP Inc.

AAREVA
Sequoyah Units 1 and 2 HTP FuelS-RELAP5 Small Break LOCA Analysis
ANP-2971(NP)Revision 1
PaQe 32
Liquid&Vapor Break Flow10000.0
8000.0
6000.0
2
4000.0
2000.0
Time (s)
Figure 4-3 Liquid and Vapor Break Flow - 9.76-inch Break
AREVA NP Inc.
AAREVA
Sequoyah Units 1 and 2 HTP FuelS-RELAP5 Small Break LOCA Analysis
ANP-2971(NP)Revision 1
Page 33
Break Vapor Void Fraction1.0
a
Time (s)
Figure 4-4 Vapor Void Fraction at the Break - 9.76 in Break
AREVA NP Inc.

AAREVA
Sequoyah Units 1 and 2 HTP FuelS-RELAP5 Small Break LOCA Analysis
ANP-2971(NP)Revision 1
Page 34
1.0
0.8
Loop Seal Void Fraction
-Uvoidg-1 300700004voidg-230070000
A voidg-330070000-A--- voidg-4300700000.6
0.4
0.2 -
/^
0.100.0 200.0 300.0 400.0 500.0
Time (s)ID - - 1 D5,35 51 -UX
Figure 4-5 Loop Seal Void Fraction - 9.76-inch Break
AREVA NP Inc.

AAREVA
Sequoyah Units 1 and 2 HTP FuelS-RELAP5 Small Break LOCA Analysis
ANP-2971 (NP)Revision 1
Page 35
Total Core Inlet Mass Flow Rate40000.0
30000.0
E.
20000.0
10000.0
0.0
-10000.0500.0
Time (s)
Figure 4-6 Total Core Inlet Mass Flow Rate - 9.76-inch Break
AREVA NP Inc.
AAR EVA
Sequoyah Units 1 and 2 HTP FuelS-RELAP5 Small Break LOCA Analysis
ANP-2971(NP)Revision 1
Paae 36
RCS Loop Flow Rates15000.0
50K0• 5000.0
Time (s)
Figure 4-7 RCS Loop Flow Rate - 9.76-inch Break
AREVA NP Inc.

AAREVA
Sequoyah Units 1 and 2 HTP FuelS-RELAP5 Small Break LOCA Analysis
ANP-2971(NP)Revision 1
Page 37
SG MFW Flow Rates1500.0
1000.0Loop 1
. Loop 2• Loop 3A- Loop 4
500.0
0.0 1 -.- t -0.0 100.0 200.0
Time (s)
30A * 4, '300.0 400.0* .4
500.0
Figure 4-8 Steam Generator Main Feedwater Flow Rates - 9.76-inchBreak
AREVA NP Inc.

AAREVA
Sequoyah Units 1 and 2 HTP FuelS-RELAP5 Small Break LOCA Analysis
ANP-2971 (NP)Revision 1
Paqe 38
Auxiliary Feedwater Flow6.0
-w4 * 4 -*- -- 4
4.0 P-Umflowj-503000000-. mflov4-603000000
A mflowj-703000000-4 mflov4-803000000
2.0
0.-0.0
100A100.0
1, A .
200.0Time (s)
300.0A 40.
500.0
Figure 4-9 Auxiliary Feedwater Flow - 9.76 in Break
AREVA NP Inc.
AAREVA
Sequoyah Units 1 and 2 HTP FuelS-RELAP5 Small Break LOCA Analysis
ANP-2971(NP)Revision 1
Pa~qe 39
SG Total Mass110000.0
n%
Time (s)
Figure 4-10 Steam Generator Total Mass - 9.76-inch Break
AREVA NP Inc.
AAREVA
Sequoyah Units 1 and 2 HTP FuelS-RELAP5 Small Break LOCA Analvsis
ANP-2971(NP)Revision 1
Paae 40
SG Level50.0
I40.0
30.0
20.0
10.0
0.00
-- a cntrlvar-5101* *crtrvar-6 101A cntrlvar-7101.4 cntrlvar-81 01
'.0 100.0 200.0Time (s)
300.0I U
400.0* '4 - .0)
500.0
Figure 4-11 Steam Generator Level - 9.76 in Break
AREVA NP Inc.

AAREVA
Sequoyah Units 1 and 2 HTP FuelS-RELAP5 Small Break LOCA Analysis
ANP-2971(NP)Revision 1
Page 41
Total SI Flow80.0
60.0
0E
40.0u8.
20.0
500.0
ID -m-h 105 , 51 DEMUX Time (s)
Figure 4-12 Total HHSI Mass Flow - 9.76-inch Break
AREVA NP Inc.

AAR EVA
Sequoyah Units 1 and 2 HTP FuelS-RELAP5 Small Break LOCA Analysis
ANP-2971(NP)Revision 1
Page 42
Total Accumulator Flow4000.0
3000.0
S
2000.0
1000.0
0.0O
-1000.0 I0.0 100.0 200.0 300.0 400.0
Time (s)500.0
Figure 4-13 Total Accumulator Flow - 9.76-inch Break
AREVA NP Inc.

AAREVA
Sequoyah Units 1 and 2 HTP FuelS-RELAP5 Small Break LOCA Analysis
ANP-2971(NP)Revision 1
Page 43
Integrated Break Flow and Total ECC Flow800000.0
600000.0
400000.0
2 0
200000.0
-200000.0I I ,0.0 100.0 200.0 300.0 400.0
Time (s)500.0
Figure 4-14 Integrated Break Flow and ECC Flow - 9.76 in Break
AREVA NP Inc.

AAR EVA
Sequoyah Units 1 and 2 HTP FuelS-RELAP5 Small Break LOCA Analysis
ANP-2971(NP)Revision 1
Page 44
Total Primary Mass500000.0
400000.0
300000.0
.2
200000.0
100000.0
Time (s)
Figure 4-15 Total Primary Mass - 9.76-inch Break
AREVA NP Inc.

AAR EVA
Sequoyah Units 1 and 2 HTP FuelS-RELAP5 Small Break LOCA Analysis
ANP-2971(NP)Revision 1
Page 45
RV Mass300000.0
250000.0
200000.0
150000.0
100000.0
50000.0
Time (s)
Figure 4-16 Reactor Vessel Mass - 9.76-inch Break
AREVA NP Inc.

AAREVA
Sequoyah Units 1 and 2 HTP FuelS-RELAP5 Small Break LOCA Analysis
ANP-2971(NP)Revision 1
Page 46
Hot Assembly Collapsed Level15.0
.0
Time (s)
Figure 4-17 Hot Assembly Collapsed Liquid Level - 9.76-inch Break
AREVA NP Inc.

AAREVA
Sequoyah Units 1 and 2 HTP FuelS-RELAP5 Small Break LOCA Analysis
ANP-2971(NP)Revision 1
Paae 47
Hot Rod Mixture Level15.0
2=
Time (s)
Figure 4-18 Hot Rod Mixture Level - 9.76 in Break
AREVA NP Inc.
AAREVA
Sequoyah Units 1 and 2 HTP FuelS-RELAP5 Small Break LOCA Analysis
ANP-2971(NP)Revision 1
Paae 48
Downcomer Level30.0
20.0
0L)
Time (s)
Figure 4-19 Downcomer Collapsed Liquid Level - 9.76 in Break
AREVA NP Inc.

AARE VA
Sequoyah Units 1 and 2 HTP FuelS-RELAP5 Small Break LOCA Analysis
ANP-2971(NP)Revision 1
Page 49
Volume Liquid Temperature at PCT Location700.0
2 500.0
E
400.00
Time (s)
Figure 4-20 Volume Liquid Temperature at PCT Location - 9.76 inBreak
AREVA NP Inc.

AAREVA
Sequoyah Units 1 and 2 HTP FuelS-RELAP5 Small Break LOCA Analysis
ANP-2971(NP)Revision 1
Paqe 50
0.8
Liquid Void Fraction Distribution in the Hot Channel
ii-- 3 .7
P • 4.7!
5.7:ii 6.7;
2 0.6
0
'ft elev.5ft plev.5 ft eley.5 ft elev.5 ft elev.5 ft elev.5 ft elev.5 ft eAv.e*7.7!
0
0.2
0.0 0.0
Time (s)
Figure 4-21 Liquid Void Fraction Distribution in the Hot Channel0.75 - 7.75 ft Elevation - 9.76 in Break
AREVA NP Inc.

AAREVA
Sequoyah Units 1 and 2 HTP FuelS-RELAP5 Small Break LOCA Analysis
ANP-2971(NP)Revision 1
Page 51
Liquid Void Fraction Distribution in the Hot Channel1.0:
0.8
2 0.6
I--.2
O 0.4
0.2
500.0Time (s)
Figure 4-22 Liquid Void Fraction Distribution in the Hot Channel8.25 - 11.75 ft Elevation - 9.76 in Break
AREVA NP Inc.

AAREVA
Sequoyah Units 1 and 2 HTP FuelS-RELAP5 Small Break LOCA Analysis
ANP-2971(NP)Revision 1
Page 52
Heat Transfer
Coefficient
at PCT Location
Heat Transfer Coefficient at PCT Location4.0
3.0
4I .
C-,
I-
-Uhthtc-20102901
1.0
fl-0.0.0 100.0 200.0
Time (s)300.0 400.0 500.0
Figure 4-23 Heat Transfer Coefficient at PCT Location - 9.76-inchBreak
AREVA NP Inc.

AAREVA
Sequoyah Units 1 and 2 HTP FuelS-RELAP5 Small Break LOCA Analysis
ANP-2971(NP)Revision 1
Paae 53
Peak Cladding Temperature1500.0
1000.0
E
500.0
I -55.) 2-.,1o 05 35)51 DEMUX Time (s)
Figure 4-24 Peak Cladding Temperature at PCT Location - 9.76-inchBreak
AREVA NP Inc.

AAR EVA
Sequoyah Units 1 and 2 HTP FuelS-RELAP5 Small Break LOCA Analysis
ANP-2971 (NP)Revision 1
Page 54
Peak Cladding Temperature Comparison1400.0
1200.0
E
1000.0
800.0
600.0
400.00.0 1000.0 2000.0 3000.0
Time (s)4000.0
Figure 4-25 Comparison of PCTs - AOR vs. S-RELAP5 Analysis
AREVA NP Inc.
AAREVA
ANP-2971(NP)Sequoyah Units 1 and 2 HTP Fuel Revision 1S-RELAP5 Small Break LOCA Analysis Page 55
5.0 References
1. AREVA NP Document EMF-2328(P)(A) Revision 0, PWR Small Break LOCA EvaluationModel, S-RELAP5 Based, March 2001.
2. AREVA NP Document BAW-10240(P)(A) Revision 0, Incorporation of M5 Properties inFramatome ANP Approved Methods, May 2004.
3. AREVA NP Document 51-9012330-001, Guidelines for PWR Safety Analysis: SmallBreak LOCA Analysis Using S-RELAP5, July 2007.
4. Topical Report BAW-10227P-A, Revision 1, "Evaluation of Advanced Cladding andStructural Material (M5) in PWR Reactor Fuel, "AREVA NP (June 2003).
AREVA NP Inc.