annual workforce and age profile report 2005-2006 · annual workforce and age profile report...
TRANSCRIPT

Annual Workforceand Age ProfileReport 2005-2006As at 31 March 2006
Human Resources UnitJuly 2006

INTRODUCTION The human resource indicators in this report provide broad workforce data and analysis, including key workforce information at the corporate level. This report will assist managers in the comparison of local information with corporate and benchmarking data to:
• achieve a greater understanding of the University of South Australia’s (UniSA’s) workforce, • identify trends and gaps in the workforce, and • provide a measure of human resource strategy success. HUMAN RESOURCE INDICATORS The workforce planning framework includes the identification of suitable human resource indicators to provide a corporate overview of the workforce and the continuous monitoring of corporate strategies. The indicators are only intended to provide a snapshot of workforce issues and are to be considered along with other relevant data. The human resource indicators provide a measure of the human resource capacity of the organisation and the effectiveness of workforce planning initiatives. This report includes the following human resource indicators: • Workforce size • Employment type – non casual • Temporary staff • Staff turnover • Length of service • Diversity profiling - Indigenous, youth, women in the UniSA workforce, country of birth, first
language and disability • Academic and general staff qualifications • Career development – academic promotion, reclassification of general staff, higher duties
opportunities, professional development program and staff study support • Leave, including family friendly leave initiatives • Occupational Health Safety and Welfare • Age Profile
BENCHMARKING Where possible, benchmarking information for most indicators has been included and information has been obtained from the following sources: • Department of Education, Science & Training (DEST) data 2005 • Australian Bureau of Statistics (AusStats 2001 & 2006) • Australian Bureau of Statistics, Year Book Australia 2005. • Australian Universities HR Benchmarking Program 2006 – HR Performance Indicators for the
period 2003 – 2005 (Queensland University of Technology [QUT]) • Government of South Australia, Office of Public Employment Workforce Analysis 2005 • University of South Australia Annual Workforce Report 2003-2004 & 2004-2005 • Mercer HR Consulting, Human Resource Effectiveness Monitor 2005 • Advancing the AVCC Action Plan for Women, Cross Institution comparisons based on 2005
data, prepared by QUT for the Australian Technology Network (ATN)

TREND The Annual Workforce Profile Report provides trends against measures for the last three years. The trend analysis for each indicator can be used to plan, implement and evaluate human resource policies and initiatives. This year the report includes a separate section on the age profile of the University.
ANNUAL WORKFORCE REPORT The Annual Workforce Profile Report forms part of the University’s workforce planning and reporting framework and provides an overview of the workforce profile, establishes base measures where appropriate and presents an analysis of the data. The data in this report is based on the annual data provided to DEST, which is finalised in June. It is for this reason that the data is either static as at 31 March 2006 or reflects data captured from 1 April 2005 to 31 March 2006. The exception to this is casual employment where data is provided based on calendar year (1 January to 31 December 2005). At the beginning of 2006, the Portfolio: Access and Learning Support changed its name to Portfolio: Academic. At this time the Whyalla Campus came under the responsibility of the Portfolio: Organisational Strategy and Change. Tables with historical data have changed to reflect the new name. For further advice and information please contact the Director: Human Resources, Shard Lorenzo or the Remuneration and Workforce Strategy Team in the Human Resources Unit (HRU): Carroll DeVizio Senior Consultant: Remuneration and Workforce Strategy Phone: x21641 [email protected] Bernice McGrath Consultant: Remuneration and Workforce Strategy Phone: x21613 [email protected]

TABLE OF CONTENTS
Results Overview: 2003–2004, 2004–2005 and 2005–2006 1 Executive Summary 3 Overview 5 PART A: WORKFORCE PROFILING 7 1. Workforce Size 7 2. Employment Type – Non-Casual 11 2.1 Continuing and Fixed-Term Staff 11 2.2 Employment Type by Division and Portfolio 13 3. Temporary Staff 17 3.1 Casual Staff 17 4. Staff Turnover 25 5. Length of Service 29 6. Diversity 31 6.1 Indigenous Employment 32 6.2 Youth Employment 35 6.3 Women in the UniSA Workforce 37 6.4 Country of Birth 43 6.5 First Languages 45 6.6 Disability 47 7. Staff Qualifications 49 7.1 Academic Staff Qualifications 49 7.2 General Staff Qualifications 52 8. Career Development 55 8.1 Academic Promotions 55 8.2 General Staff Reclassifications 58 8.3 Higher Duties Opportunities for General Staff 60 8.4 Professional Experience Program 62 8.5 Staff Study Support 63 9. Leave 65 9.1 Planned and Unplanned Leave 65 9.2 Recreation Leave Liability 68 9.3 Long Service Leave Liability 70 9.4 Family Friendly Leave Initiatives 72

PART B: OCCUPATIONAL HEALTH & SAFETY 75 1. Workers Compensation 75 1.1 Total Number of Workers Compensation Claims & Types of Injury or Illness 75 1.2 Total Number of Days Lost 77 1.3 Total Cost of Claims 78 1.4 Incidence Rate 79 1.5 Frequency Rate 80 1.6 Average Time Lost Rate 81 PART C: ANALYSIS OF THE AGE PROFILE OF UNISA 83 1. Age 83 1.1 Background 83 1.2 UniSA’s Age Profile 85 1.3 Age and Gender 87 1.4 Classification 91
1.5 Division and Portfolio 93 2. Recruitment 95 2.1 Background 95 2.2 Ageing and Recruitment at UniSA 95 3. Exits 101 3.1 Background 101 3.2 Ageing and Retention at UniSA 101 4. Health and Wellbeing 107 4.1 Background 107 4.2 Ageing and Unplanned Leave at UniSA 107 4.3 Ageing and Injury at UniSA 108 5. Summary 109

TABLE LISTING
Table 1 Continuing and Fixed-Term and Casual Staff FTE by Academic and General and Division and Portfolio as at 31 March 2004, 2005 and 2006
Table 2 Total FTE numbers and percentage change by Division and Portfolio as at 31 March 2004, 2005 and 2006 (including casuals)
Table 3 Academic and General by Division and Portfolio as at 31 March 2006
Table 4 Employment Type by Division and Portfolio as at 31 March 2006 (excluding casuals)
Table 5 Casual Hours and FTE by Division and Portfolio, 1 January 2005 to 31 December 2005
Table 6 Total University Summary of Casual Hours and FTE by Award and Work Type, 1 January 2005 to 31 December 2005
Table 7 Academic Casual Hours and FTE by Division and Portfolio and Work Type, 1 January 2005 to 31 December 2005
Table 8 General Casual Work Code ‘Other’ Hours and FTE by Division and Portfolio, 1 January 2005 to 31 December 2005
Table 9 Casual Hours and FTE by Division and Portfolio and Gender,1 January 2005 to 31 December 2005
Table 10 University-wide Voluntary and Involuntary Staff Turnover Annualised, 1 April 2005 to 31 March 2006
Table 11 Number of Involuntary and Voluntary Staff Separations by Gender and Academic and General, 1 April 2005 to 31 March 2006
Table 12 Indigenous Employment as a Percentage of Staff as at 31 March 2006
Table 13 Youth Employment as a Percentage of General Staff FTE as at 31 March 2006
Table 14 General Staff Youth Employment (FTE) by Division and Portfolio as at 31 March 2006
Table 15 Female Staff Percentages by Academic and General and Division and Portfolio as at 31 March 2006
Table 16 Staff Gender (headcount) across all Levels as at 31 March 2006
Table 17 Staff as a Percentage by Country of Birth as at 31 March 2006
Table 18 First Language as a Percentage of Staff as at 31 March 2006
Table 19 Number of Staff who identified as having a Disability as at 31 March 2006
Table 20 Academic Staff Highest Qualification Completed as a Percentage of Academic Staff by Division and Portfolio as at 31 March 2006
Table 21 Academic Staff Highest Qualification Completed as a Percentage of Academic Staff by Academic Level as at 31 March 2006
Table 22 General Staff Highest Qualification Completed as a Percentage of General Staff by Division and Portfolio as at 31 March 2006
Table 23 Number of Applications Received for Academic Promotion for 2005 round
Table 24 Number of Successful Applications for Academic Promotion for 2005 round
Table 25 Academic Application for Promotion Rate and Academic Promotion Rate for Academic Promotion for 2005 Round

TABLE LISTING (cont.)
Table 26 Number of Applications for Reclassification, 1 April 2005 to 31 March 2006
Table 27 Number of Applications for Reclassification by Division and Portfolio, 1 April 2005 to 31 March 2006
Table 28 Number of Higher Duties Opportunities by Substantive Classification Level, 1 April 2005 to 31 March 2006
Table 29 Number of Higher Duties Opportunities by Division and Portfolio, 1 April 2005 to 31 March 2006
Table 30 Number of Academic Staff Accessed Professional Experience Program by Division and Portfolio, 1 April 2005 to 31 March 2006
Table 31 Number of Staff paid Staff Study Support by Division and Portfolio, 1 April 2005 to 31 March 2006
Table 32 Unplanned, Planned and Total Leave Annualised by Academic and General, 1 April 2005 to 31 March 2006
Table 33 Unplanned and Planned Leave Annualised by Division and Portfolio for all Staff and Total University, 1 April 2005 to 31 March 2006
Table 34 Average Recreation Leave Liability for Academic and General by Division and Portfolio as at 31 March 2006
Table 35 Long Service Leave Liability Average Days for Academic and General by Division and Portfolio as at 31 March 2006
Table 36 Take up of Family Friendly Leave Initiatives by Division and Portfolio, 1 April 2005 to 31 March 2006
Table 37 Total Number of Workers Compensation Claims, 1 April 2005 to 31 March 2006
Table 38 Total Number of Days Lost Due to Workers Compensation Claims, 1 April 2005 to 31 March 2006
Table 39 Total Cost of Workers Compensation Claims, 1 April 2005 to 31 March 2006
Table 40 Incidence Rate, 1 April 2005 to 31 March 2006
Table 41 Frequency Rate, 1 April 2005 to 31 March 2006
Table 42 Average Time Lost, 1 April 2005 to 31 March 2006
Table 43 Median Age of General and Academic Staff by Gender as at 31 March 2006
Table 44 Age of Staff Compared to Australian Population and Broader Workforce
Table 45 Number of Staff by Age and Gender (headcount)
Table 46 Academic and General Staff by Age and Gender (headcount)
Table 47 Classification by Age of Staff (headcount)
Table 48 Age by Division/Portfolio
Table 49 Recruitment by Age, Gender and Award, 1 April 2005 to 31 March 2006
Table 50 Involuntary and Voluntary Exits by Age, Gender and Award, 1 April 2005 to 31 March 2006
Table 51 Age by Voluntary Exits and Recruits

FIGURES LISTING
Figure 1 Continuing, Fixed-Term and Casual Staff FTE total Percentages by Academic and General and University-wide as at 31 March 2006
Figure 2 Academic and General by Division and Portfolio as at 31 March 2006
Figure 3 Voluntary and Involuntary Staff Turnover Annualised by Division and Portfolio, 1 April 2005 to 31 March 2006
Figure 4 Length of Service for Academic Staff as at 31 March 2006
Figure 5 Length of Service for General Staff as at 31 March 2006
Figure 6 Length of Service for Total University as at 31 March 2006
Figure 7 Claims by Injury or Illness, 1 April 2005 to 31 March 2006
Figure 8 Total Male and Female Staff by Classification
Figure 9 Female Academic Staff as a Percentage of Total Academic Staff, all Universities, 1996-2004
Figure 10 Total Fertility Rate
Figure 11 Labour Force Participation by Women, 1983-84 and 2003-04 Compared
Figure 12 Percentage of Staff by Age and Gender
Figure 13 Academic Staff by Age and Gender
Figure 14 General Staff by Age and Gender
Figure 15 Percentage of Staff by Age and Classification
Figure 16 Female Staff by Classification and Age Group
Figure 17 Age and Gender of New Recruits, 1 April 2005 to 31 March 2006
Figure 18 Academic Staff Recruits by Gender and Age, 1 April 2005 to 31 March 2006
Figure 19 Academic Staff Recruits by Gender and Classification, 1 April 2005 to 31 March 2006
Figure 20 General Staff Recruits by Gender and Age, 1 April 2005 to 31 March 2006
Figure 21 General Staff Recruits by Gender and Classification, 1 April 2005 to 31 March 2006
Figure 22 Exit by Age
Figure 23 Staff Turnover by Age Group
Figure 24 Total Exits by Age Group and Award, 1 April 2005 to 31 March 2006
Figure 25 Total Exits by Age Group and Gender, 1 April 2005 to 31 March 2006
Figure 26 Voluntary Exits by Staff Type and Gender, 1 April 2005 to 31 March 2006
Figure 27 Average Unplanned Leave by Age
Figure 28 Work-related Injuries or Illness by Age


Annual Workforce Profile Report 2005-2006
1
Results Overview: 2003–2004, 2004–2005 and 2005–2006
PART A: WORKFORCE PROFILE
2003-2004 2004-2005 2005-2006
1. Workforce Size FTE (including casuals) FTE FTE FTE Total Staff 2448.5 2445.4 2509.4
2. Staff Numbers (excluding casuals) FTE Percentage FTE Percentage FTE Percentage Academic Staff 891.1 43% 919.8 44.8% 956.2 44.2% General Staff 1194.5 57% 1183.0 56.2% 1205.4 55.8% Continuing Staff 1607.7 77% 1662.8 79% 1661.0 77% Fixed-Term Contract Staff 477.9 23% 440.0 21% 500.5 23% Total Staff (FTE) Non-Casual 2085.6 2102.8 2161.5 Total Staff (headcount) Non-Casual 2223.0 2226.0 2287 Ratio of general staff to academic staff (FTE) 1.34 1.29 1.26 Total number of Payment Summaries issued 5784 6013 6043
3. Casual Employment FTE Percentage FTE Percentage FTE Percentage Academic staff, FTE & percentage of academic FTE 256.2 22.3% 245.4 21.0% 255.49 21.1% General staff, FTE & percentage of general FTE 106.7 8.2% 97.3 7.6% 92.36 7.1% Total casual staff, FTE & percentage of total FTE 362.9 14.8% 342.7 14.0% 347.85 13.9%
Academic staff, total casual hours 248,872 hours 255,759 hours 276,321 hours General staff, total casual hours 194,183 hours 177,020 hours 168,102 hours
4. Staff Turnover Headcount % turnover Headcount % turnover Headcount % turnover Voluntary Separation 162 7.1% 183 8.2% 225 10.0% Involuntary Separation 71 3.1% 118 5.3% 65 2.9% Total Staff Separation 233 10.3% 301 13.5% 290 12.9%
5. Length of Service - Average Years Academic 10 years 1 month 10 years 1 month 10 years 1 month General 9 years 5 months 9 years 7 months 9 years 4 months
6. Diversity - percentage of Workforce Indigenous Staff (Headcount) 1.26% 1.17% 1.53% Youth (16 to 24) (FTE General Staff) 5.3% 5.1% 5.8% Female academic staff (headcount as % of all
academic staff) 45.5% 45.0% 46.7%
Female general staff (headcount as % of all general staff) 64.0% 65.0% 66.5%
Female total staff (headcount as % of total staff) 56.0% 56.0% 57.8%

Annual Workforce Profile Report 2005-2006
2
PART A: WORKFORCE PROFILE (cont)
2003-2004 2004-2005 2005-2006
7. Staff Qualifications Academic Staff Qualifications - Doctorate 42.9% 46.5% 50.45% General Staff Qualifications – Bachelor or higher 26.6% 28.3% 30.0%
8. Career Development Academic Staff Promotions (Level B to E) 33 40 37 Academic Promotion Application Rate 6.6% 8.2% 6.3% Academic Promotion Rate 3.8% 4.5% 4.1% General Staff Reclassifications 35 40 21 General Staff Higher Duties Opportunities 363 406 402 Professional Experience Program Leave (no. of staff
who accessed PEP) Not reported 80 72
9. Leave (Days) Unplanned Leave 5.3 6.2 6.3 Total Planned Leave 19.9 27.5 21.5 Average Rec Leave Liability: Academic Staff 16.7 17.7 16.7 Average Rec Leave Liability: General Staff 16.5 17.1 16.7 Long Service Leave Liability: Academic Staff 58.6 55.6 56.3 Long Service Leave Liability: General Staff 46.1 46.9 44.5
PART B: OCCUPATIONAL HEALTH & SAFETY
Workcover Claims Registered 55 56 54 Number of lost time claims 22 22 22 Total Days Lost 351 376 382
PART C: AGE PROFILE
Academic Median Age 48 years 48 years 49 years
General Median Age 42 years 42 years 42 years

Annual Workforce Profile Report 2005-2006
3
Executive Summary Following is a summary of the key findings contained in this report and includes an outline of trends for the periods 2003-2004, 2004-2005 and 2005-2006. Workforce Size The total number of full-time equivalent (FTE) staff (including casuals) for 2006 was 2509.4, an increase of 64 FTE (2.6%) since 2005. When compared to 2004, total staff numbers have increased by 60.9 FTE (2.5%). The ratio of general staff to academic staff is 1.26. This represents a decrease from 1.29 in 2005 and 1.34 in 2004. Sixty-six per cent of University staff are employed on a continuing basis, 20% are fixed-term and 14% are casual. Turnover Voluntary turnover has continued to increase and is at its highest for the three year period, with 225 staff leaving voluntarily in 2006. This equates to a voluntary turnover rate of 10%. Involuntary turnover was 2.9%, a decrease from 5.3% in 2005. The total turnover for the University has decreased over the last 12 months from 13.5% in 2005 to 12.9% in 2006. Length of Service The average length of service for academic staff was 10 years and 1 month as at 31 March 2006. The average length of service for general staff was 9 years and 4 months. Indigenous Employment The percentage of staff that identify themselves as Indigenous origin has increased over the last year from 1.17% of total headcount in 2005 to 1.53% in 2006. Youth Employment The percentage of general staff under the age of 25 has increased from 5.1% (50 FTE) in 2005 to 5.8% (74 FTE) in 2006. Women in the UniSA Workforce As a total percentage, women comprise 57.8% of the non-casual UniSA workforce. Women account for 46.7% of all academic staff and this has increased slightly over the 3 year reporting period. The University 2006 KPI target is 48%. Women represent 66.5% of general staff and this has also increased over the period. At the senior levels, women represent 28.3% of academic staff at Academic Level D and above (KPI 30%) and 42.1% of general staff at level HEO10 and above (KPI 44%). Academic Staff Qualifications As at 31 March 2006, 50.5% of academic staff held a doctoral qualification. The 2006 University KPI target is 48%. The percentage of staff holding a doctoral qualification has increased during the reporting period (42.9% in 2004 and 46.5% in 2005). Academic Promotions 57 academic staff applied for promotion in the 2005 round – 21 women and 36 men. Of these, 37 were successful (13 women and 24 men). The academic application for promotion rate for the 2005 round was 6.3%, down from 8.2% in 2004 and 6.6% in 2003. As a comparison, the Australian Universities Benchmarking Program 2006 showed the average academic application for promotion rate for all universities for 2005 to be 7.5% and for ATN universities 8.2%. The academic promotion rate for the 2005 round was 4.1%, down from 4.5% in 2004 and slightly higher than 3.8% for 2003. As a comparison, the Australian Universities Benchmarking Program
Annual Workforce Profile Report 2005-2006
4
2006 showed the average academic promotion rate for all universities was 4.8% and for ATN universities 4.7%. The benchmarking reveals that both the academic application for promotion rate and the academic promotion rate for UniSA are lower than the national average. General Staff Reclassification 21 applications were received for general staff reclassification. Of these, 13 (65%) were successful. Over the three year reporting period, the number of applications for reclassification has fluctuated from 35 in 2004, 40 in 2005 and 21 in 2006. This is seen as an improved result as it reflects a clearer and more transparent process for employees and indicates that reclassification is no longer used as a reward mechanism. Professional Experience Program (PEP) 72 academic staff (7.1% of total academic headcount) were recorded as accessing PEP leave during the reporting period. This represents a decrease of 8 from the previous year. Planned and Unplanned Leave The unplanned leave rate for 2006 was 2.52%, meaning that on average staff members took 6.3 days off as unplanned leave. This has increased from 6.2 days in 2005 and 5.3 days in 2004. The total planned leave rate was 8.65% equating to approximately 21.5 days off per year for each staff member. This is significantly lower than the rate for 2005 (27.5 days) and slightly higher than in 2004 (19.9 days). Leave Liability The recreation leave liability for 2006 was an average of 16.7 days per staff member. This has decreased slightly from 17.4 in 2005, and is slightly higher than for 2004 (16.6). A new process to eliminate excess recreation leave will be implemented in 2006. The average long service liability of all staff has decreased over the three year reporting period, from 51.4 days in 2004, 50.7 days in 2005 down to 49.7 days in 2006. Local HR officers will provide managers with 6-monthly reports on long service leave accruals, to help monitor and address the long service leave liability. Family Friendly Leave Initiatives The full range of family friendly leave initiatives have been included in this report for the first time, therefore the data shows a significant increase in the number of occasions staff participated in these initiatives – 760 in total for 2006 compared with 68 for 2005 and 60 for 2004. It should be noted that this data represents each separate occasion that family friendly leave initiatives were accessed – it may be that the same staff members are accessing different initiatives, or the same initiative a number of times, e.g. family responsibility leave. Workers Compensation There were a total of 54 workers compensation claims registered, representing 2.36% of staff. This compares to 56 claims in 2005 and 55 in 2004. 382 days were lost to 22 lost time workers compen-sation claims. While the number of lost time claims has remained steady over the 3 year reporting period, the number of days lost has increased from 351 in 2004, 367 in 2005 to 382 in 2006. Age Profile The median age for academic staff is 49 years and general staff 42 years. University-wide the median age is 46 years. The highest proportion of UniSA staff are in the 45-54 age group (29.9%), followed closely by the 35-44 age group (28%). Fifty-eight per cent of all academic staff are in the 45 years and over age categories, compared with 40% of general staff.

Annual Workforce Profile Report 2005-2006
5
Overview
CONTEXT As the 2005 Corporate Performance Report indicates, the key challenges confronting the University in the immediate development of its workforce are competition for high performing research staff as universities prepare for implementation of the Research Quality Framework (RQF) and recruiting younger academic staff in response to the ageing academic profile. The RQF emphasis on the quality and impact of research performance of staff as individuals and as interdisciplinary groups has already resulted in a significant increase in competition between universities and poaching of key staff and research groups. At the same time there will be a marked decrease in the overall supply of labour in Australia due to an ageing workforce and decreased fertility rate. Attracting and retaining the best staff in this environment will require initiatives that focus on:
• workforce planning in relation to research capability • capture of candidate demographics in order to understand the pool of resources and any
trends or issues in University recruitment • building a better understanding of reasons for staff departures through an improved exit
interview and data gathering process University-wide. • retention of high performing academic staff in a competitive research environment.
The global scope of recruitment has become more evident as 32% of academic staff have one or more qualification awarded by an overseas institution.
INITIATIVES A number of initiatives have been implemented that will impact on the workforce and the human resource indicators: Attraction and Retention of High Performing Academic Staff Among a range of initiatives, UniSA is contributing to an ATN project on recruitment and retention of senior, high performing academic staff. It is our expectation that this qualitative study across the five institutions will contribute insights into future policy formation. Workforce Planning Workforce planning priorities have been incorporated into the Corporate Planning process since 2003 and workplace plans are developed at the local level. The 2005 Workforce Planning Priorities were:
• Attraction and Retention of talent • Academic Staff Qualifications • Staff Gender – Senior Women • Workforce Demographics – the ageing workforce
Age Profile The demographic profile of Australia is shifting, and current projections indicate that by the middle of this century half the population will be aged over 45 years. This ageing of a significant proportion of the population is the combined result of increasing life expectancy and sustained low fertility. Australian universities face a generational shift over the next ten years as the “baby boom” generation retires.
Annual Workforce Profile Report 2005-2006
6
In her address at the 3rd Annual Higher Education Summit in March 2005, Professor Hilary Winchester, Pro Vice Chancellor: Organisational Strategy and Change stated: “University human resources for the next decade is not so much a staffing
issue but a key organisational strategy, which will link individual capabilities with organisational requirements”.
This issue highlights the need for workforce planning, including the development of capabilities for current staff and succession planning. To assist in the development of appropriate strategies to address medium term capability loss, this report contains a dedicated section on the age profile of the University. Family-friendly leave initiatives The UniSA Academic and General Staff Enterprise Agreement 2004 provided new family friendly leave initiatives for staff. These initiatives are provided in further detail in this report and include flexible work arrangements for reducing the working year, 1/2 leave, 4/5 leave, paid maternity leave, pre-natal leave, phased in return to work leave following a maternity leave absence, child rearing leave and family responsibility leave.
Annual Workforce Profile Report 2005-2006
7
PART A: WORKFORCE PROFILING 1. WORKFORCE SIZE Description
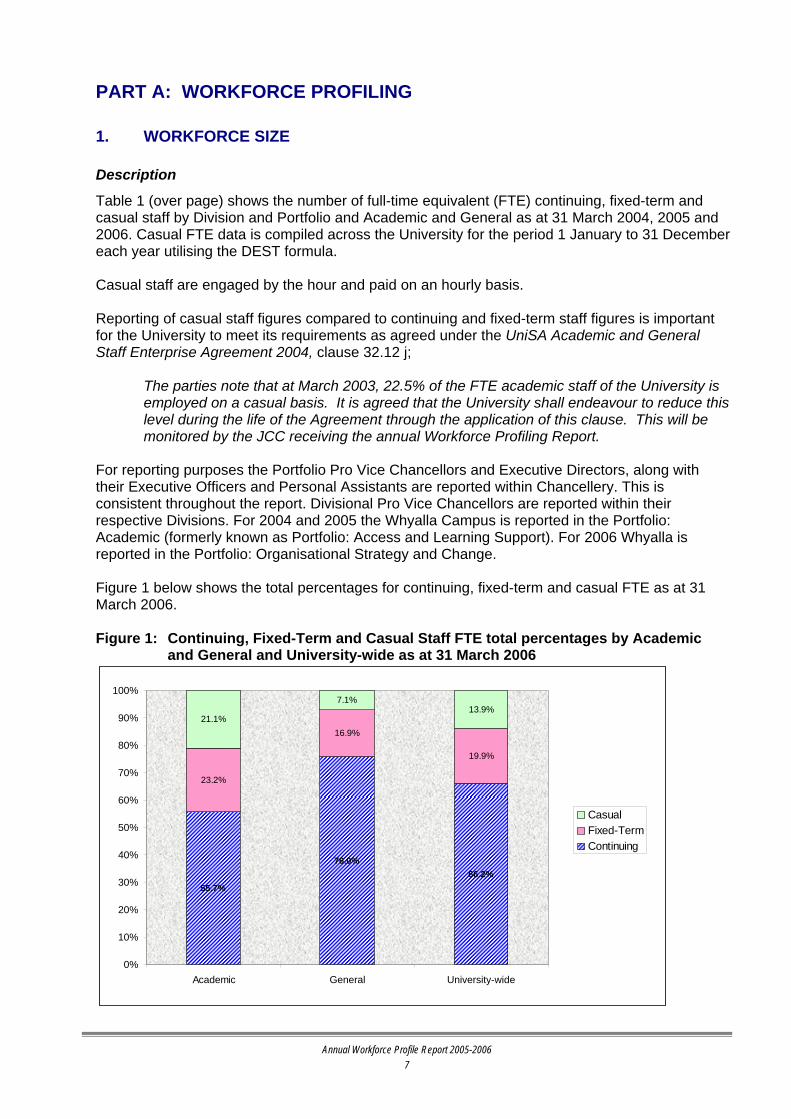
Table 1 (over page) shows the number of full-time equivalent (FTE) continuing, fixed-term and casual staff by Division and Portfolio and Academic and General as at 31 March 2004, 2005 and 2006. Casual FTE data is compiled across the University for the period 1 January to 31 December each year utilising the DEST formula. Casual staff are engaged by the hour and paid on an hourly basis. Reporting of casual staff figures compared to continuing and fixed-term staff figures is important for the University to meet its requirements as agreed under the UniSA Academic and General Staff Enterprise Agreement 2004, clause 32.12 j;
The parties note that at March 2003, 22.5% of the FTE academic staff of the University is employed on a casual basis. It is agreed that the University shall endeavour to reduce this level during the life of the Agreement through the application of this clause. This will be monitored by the JCC receiving the annual Workforce Profiling Report.
For reporting purposes the Portfolio Pro Vice Chancellors and Executive Directors, along with their Executive Officers and Personal Assistants are reported within Chancellery. This is consistent throughout the report. Divisional Pro Vice Chancellors are reported within their respective Divisions. For 2004 and 2005 the Whyalla Campus is reported in the Portfolio: Academic (formerly known as Portfolio: Access and Learning Support). For 2006 Whyalla is reported in the Portfolio: Organisational Strategy and Change. Figure 1 below shows the total percentages for continuing, fixed-term and casual FTE as at 31 March 2006. Figure 1: Continuing, Fixed-Term and Casual Staff FTE total percentages by Academic
and General and University-wide as at 31 March 2006
55.7%
76.0%66.2%
23.2%
16.9%
19.9%
21.1%
7.1%13.9%
0%
10%
20%
30%
40%
50%
60%
70%
80%
90%
100%
Academic General University-wide
CasualFixed-TermContinuing

Annual Workforce Profile Report 2005-2006
8
Table 1: Continuing and Fixed-Term and Casual Staff FTE by Academic and General and Division and Portfolio as at 31 March 2004, 2005 and 2006
31 March 2004 31 March 2005 31 March 2006
Continuing Fixed-Term Casual TOTAL Continuing Fixed-Term Casual TOTAL Continuing Fixed-Term Casual TOTAL Division/
Portfolio Acad Gen Acad Gen Acad Gen Acad Gen Total
FTE Acad Gen Acad Gen Acad Gen Acad Gen Total FTE
Acad Gen Acad Gen Acad Gen Acad Gen Total FTE
Division: Business 139.25 109.30 24.90 14.60 73.87 16.97 238.02 140.87 378.89 124 115.5 18.2 10.8 66.86 16.62 209.06 142.92 351.98 124.05 94.60 17.30 20.10 56.93 14.96 198.28 129.66 327.94
Division: Education, Arts & Social Sciences 217.90 99.70 54.00 21.40 96.43 22.70 368.33 143.80 512.13 234.1 99.6 40.9 14.01 90.84 20.42 365.84 134.03 499.87 245.70 100.70 47.60 22.30 104.33 21.34 397.63 144.34 541.97
Division: Health Sciences 121.10 76.16 64.75 29.40 37.76 9.20 223.61 114.76 338.37 126.3 87.49 74.73 28.23 35.55 9.48 236.58 125.20 361.78 131.00 90.91 76.05 31.43 35.12 8.56 242.17 130.90 373.07
Division: Information Technology, Engineering & Environment
115.13 82.20 52.06 15.20 43.74 13.38 210.93 110.78 321.71 127.8 89.9 71.13 15.7 47.06 8.80 245.99 114.40 360.39 129.33 90.90 76.83 19.20 50.83 7.37 256.98 117.47 374.45
Chancellery 2.00 16.20 3.60 10.40 0.27 0.10 5.87 26.70 32.57 1 19.6 3.6 10 0.42 0.43 5.02 30.03 35.05 21.40 3.60 11.80 0.01 0.40 3.61 33.60 37.21
Portfolio: Academic* 34.60 215.51 4.40 55.00 2.93 24.06 41.93 294.57 336.50 32 237.56 8.9 29.15 3.91 24.14 44.81 290.85 335.66 17.00 224.84 5.80 32.12 1.09 15.71 23.89 272.67 296.56
Portfolio: Finance & Resources 0 147.30 0 43.71 0.00 7.85 0.00 198.86 198.86 0 146.3 0 22.7 6.16 0.00 175.16 175.16 0.00 129.89 0.00 17.80 0.07 7.30 0.07 154.99 155.06
Portfolio: International & Development 0 57.25 0 8.40 0.00 4.69 0.00 70.34 70.34 0 61.65 0 8 0.16 5.64 0.16 75.29 75.45 0.00 65.40 0.00 12.00 0.17 7.83 0.17 85.23 85.40
Portfolio: Organisational Strategy & Change**
0 120.50 0 11.00 0.00 5.26 0.00 136.76 136.76 0 110.4 0 15.58 0.03 4.15 0.03 130.13 130.16 16.00 132.67 5.30 23.40 5.81 6.38 27.11 162.45 189.56
Portfolio: Research & Innovation 16.00 37.60 41.41 23.70 1.16 2.48 58.57 63.78 122.35 13 36.6 44.13 24.2 0.57 1.43 57.70 62.23 119.93 12.00 34.60 48.60 29.33 1.13 2.51 61.73 66.44 128.17
University Total 645.98 961.72 245.12 232.81 256.16 106.69 1147.26 1301.22 2448.48 658.2 1004.6 261.59 178.37 245.40 97.27 1,165.19 1,280.24 2,445.43 675.08 985.91 281.08 219.47 255.49 92.36 1211.64 1297.75 2509.39
* Portfolio: Academic was restructured at the beginning of 2006 when the name was changed from Access and Learning Support. Whyalla is reported within Portfolio: Organisational Strategy and Change. ** Portfolio: Organisational Strategy and Change was restructured at the beginning of 2006 to include Whyalla.

Annual Workforce Profile Report 2005-2006
9
Summary
Total Staff (FTE) as at 31 March 2006 was 2509.4. Of the total academic staff FTE, 55.7% were employed in continuing positions, 23.2% on fixed-term contracts and 21.1% were casually employed. The percentage of academic casual staff employed during the reporting period was consistent with the previous 12 months. Of the total general staff FTE, 76% were employed in continuing positions, 16.9% on fixed-term contracts and 7.1% were casually employed. University-wide, 66.2% of staff were employed in continuing positions with 19.9% on fixed-term contracts and 13.9% were casually employed.
Trend
Total FTE (including casuals) 2004 2005 2006
University Total 2448.5 2445.4 2509.4
Percentage of Academic Staff that are Casual 22.3% 21.0% 21.1%
Total staff numbers (including casuals) have increased by 64 FTE (2.6%) across the University since 2005. When compared to 2004, total staff numbers have increased by 60.9 FTE (2.5%). Further trend analysis (over page) shows that for the period 31 March 2005 to 31 March 2006 the largest increases in staff numbers were in the Portfolio: Organisational Strategy and Change (45.6%) and Portfolio: International and Development (13.2%). The increase in the Portfolio: Organisational Strategy and Change is due to the Whyalla Campus being reported in the Portfolio from the commencement of 2006. A corresponding decrease in staff numbers is seen for the Portfolio: Academic. The Portfolio: Finance and Resources has been continually decreasing over the three year period. During this period all Units within the Portfolio have been reviewed which may explain the overall decrease in staff numbers. Of the Divisions, Education, Arts and Social Sciences had the largest increase (8.4%) which can be explained in part by an increase in academic staff numbers within the Hawke Research Institute. Student numbers in the Division have also increased and may explain the increase in the number of academic teaching staff. The Division of Business had the largest decrease (-6.8%) and follows a similar decrease over the previous 12 months. This may be explained by the review and restructure of the Division which occurred in 2004 and 2005.

Annual Workforce Profile Report 2005-2006
10
Table 2: Total FTE numbers and percentage change by Division and Portfolio as at
31 March 2004, 2005 and 2006 (including casuals)
31 March 2004
31 March 2005
31 March 2006
Division and Portfolio Total FTE
% change from 2004
to 2005 Total FTE
% change from 2005
to 2006 Total FTE
Division: Business 378.89 -7.1 351.98 -6.8 327.94
Division: Education, Arts & Social Sciences 512.13 -2.4 499.87 8.4 541.97
Division: Health Sciences 338.37 6.9 361.78 3.1 373.07
Division: Information Technology, Engineering & the Environment 321.71 12.0 360.39 3.9 374.45
Chancellery 32.57 7.6 35.05 6.1 37.21
Portfolio: Academic 336.50 -0.3 335.66 -11.6 296.56
Portfolio: Finance & Resources 198.86 -11.9 175.16 -11.5 155.06
Portfolio: International & Development 70.34 7.3 75.45 13.2 85.40
Portfolio: Organisational Strategy & Change 136.76 -4.8 130.16 45.6 189.56
Portfolio: Research & Innovation 122.35 -2.0 119.93 6.9 128.17
University Total 2448.48 -0.12 2,445.43 2.6 2509.39

Annual Workforce Profile Report 2005-2006
2. EMPLOYMENT TYPE – NON-CASUAL 2.1 CONTINUING AND FIXED-TERM STAFF Description
Figure 2 and Table 3 show the number of FTE continuing and fixed-term staff (excluding casual employees) by Academic and General and Division and Portfolio as at 31 March 2006. Figure 2: Academic and General by Division and Portfolio as at 31 March 2006
0
50
100
150
200
250
300
350
400
450
500
Division: Business Division:Education, Arts &Social Sciences
Division: HealthSciences
Division:Information
Technology,Engineering & the
Environment
Chancellery Portfolio:Academic
Portfolio: Finance& Resources
Portfolio:International &Development
Portfolio:Organisational
Strategy &Change
Portfolio:Research &Innovation
FTE
Academic General
Table 3: Academic and General by Division and Portfolio as at 31 March 2006
FTE % FTE Headcount Division and Portfolio Academic General Academic General Total Academic General Total
Division: Business 55% 45% 141.35 114.70 256.05 148 121 269
Division: Education, Arts & Social Sciences 70% 30% 293.30 123.00 416.30 316 135 449*
Division: Health Sciences 63% 37% 207.05 122.34 329.39 225 128 353
Division: Information Technology, Engineering & the Environment 65% 35% 206.15 110.10 316.25 212 114 326
Chancellery 10% 90% 3.60 33.20 36.80 4 35 39
Portfolio: Academic 8% 92% 22.80 256.96 279.76 24 277 301
Portfolio: Finance & Resources 0% 100% 0.00 147.69 147.69 0 150 150
Portfolio: International & Development 0% 100% 0.00 77.40 77.40 0 82 82
Portfolio: Organisational Strategy & Change 12% 88% 21.30 156.07 177.37 22 166 188
Portfolio: Research & Innovation 49% 51% 60.60 63.93 124.53 61 69 130
University Total 44% 56% 956.15 1205.39 2161.54 1012* 1277* 2287*
* The total headcount does not add up as one person holds both an academic and general position and one person holds two
general staff positions in the Division of Education, Arts & Social Sciences.
11
Annual Workforce Profile Report 2005-2006
12
Summary
Total staff (headcount) as at 31 March 2006, excluding casuals, was 2287 and the total staff FTE was 2161.5. The ratio of general staff to academic staff was 1.26 (per FTE). Of the 2161.5 FTE staff, 55.8% were general staff (slightly lower than 56.2% for 2005) and 44.2% were academic staff (an increase from 43.8% in 2005). The distribution of academic and general staff varied across Divisions due to different administrative and technical structures. Across the four Divisions, the Division of Business had the highest percentage of general staff (45%) and the Division of Education, Arts and Social Sciences had the lowest (30%). Trend
University Total (excluding casuals) 2004 2005
2006
University Total (FTE) 2085.6 2102.8 2161.5
University Total (headcount) 2223 2226 2287
Ratio General Staff to Academic (FTE) 1.34 1.29 1.26
Over the 12 month reporting period, total FTE staff numbers have increased by 58.7. In comparison to the 2005 report, the largest areas of growth in this period in FTE were the Divisions of Education, Arts and Social Sciences (increased by 27.7 FTE) and Health Sciences (increased by 12.6 FTE). The ratio of general staff to academic staff has continued a downward trend since 2004 (1.34), 2005 (1.29) down to 1.26 in 2006. This may be explained by the gradual increase in academic staff numbers over the three year reporting period. The change in the percentage of academic staff across Divisions for the three year period differs. The Division of Business (2004: 57%, 2005: 53% and 2006: 55%) and the Division of Health Sciences (2004: 64%, 2005: 63% and 2006: 63%) had the lowest percentage of academic staff as a proportion of total staff FTE in the Division. The Division of Education, Arts and Social Sciences (2004: 69%, 2005: 71% and 2006: 70%) and the Division of Information Technology, Engineering and the Environment (2004: 63%, 2005: 65% and 2006: 65%) had the highest percentage of academic staff during the period. Benchmarking
The Australian Universities HR Benchmarking Program 2006 data indicates that the average ratio of general staff to academic staff, using headcount figures, is 1.37 for 2005. Benchmarking information contained in the customised report for ATN universities reveals that the ATN universities have a higher general to academic staff ratio (1.46 general staff for every academic employee) compared the average for the whole sector (1.33 general staff for every academic employee). The following benchmarking information is obtained from DEST based on 2005 data utilising FTE figures. For universities in a group, the number and percentage of staff has been averaged.

Annual Workforce Profile Report 2005-2006
13
Ratio of General Staff
to Academic Staff Percentage of
Academic Staff Percentage of General Staff
All Australian Universities 1.35 42.6 57.4 ATN Universities 1.44 41.0 59.0 Adelaide University 1.22 45.0 55.0 Flinders University 1.42 41.3 58.7 UniSA 1.29 43.7 56.3
The DEST data reveals that, UniSA’s ratio of general to academic staff (1.29) is lower than the ATN average (1.44) and lower than the average for all Australian universities (1.35). 2.2 EMPLOYMENT TYPE BY DIVISION AND PORTFOLIO Description
Table 4 on the following page shows the percentage of staff (FTE) employed as continuing or fixed-term by Division and Portfolio. This indicator reflects the flexibility of the organisational structures across the University. Summary
As at 31 March 2006, 77% of UniSA staff were employed on a continuing basis and 23% on fixed-term contracts (excluding casual employees). When casual employees are included in the employment profile the percentages change to 66% employed as continuing, 20% as fixed-term and 14% as casual. The areas with the highest fixed-term contracts include:
• Portfolio: Research & Innovation (63%, 77.9 FTE staff on fixed-term contracts) • Chancellery (42%, 15.4 FTE staff on fixed-term contracts) • Division of Health Sciences (33%, 107.5 FTE staff on fixed-term contracts) • Division of Information Technology, Engineering and the Environment (30%, 96 FTE
staff on fixed-term contracts). The high number of fixed-term contracts in the following areas is directly related to:
• the number of Senior Management Group members on individual senior contracts in Chancellery;
• the number of staff on research contracts in the Portfolio: Research and Innovation and the Division of Information Technology, Engineering and the Environment; and
• the number of staff on specific task, project (a high number of these contracts are for the South Australian Centre for Rural and Remote Health) and research contracts in the Division of Health Sciences.

Annual Workforce Profile Report 2005-2006
14
Table 4: Employment Type by Division and Portfolio as at 31 March 2006 (excluding casuals)
Continuing Fixed-Term Contract Percentage of FTE
Part-time Part-time Division and Portfolio Full-time FTE FTE Headcount
Total FTE
Full-time FTE FTE Headcount
Total FTE Cont Fixed-
Term
Division: Business 209.0 9.65 14.0 218.65 25.0 12.40 21.0 37.40 85% 15%
Division: Education, Arts & Social Sciences 318.0 28.40 49.0 346.40 49.0 20.90 35.0 69.90 83% 17%
Division: Health Sciences 197.0 24.91 38.0 221.91 92.0 15.48 26.0 107.48 67% 33%
Division: Information Technology, Engineering & the Environment 213.0 7.23 12.0 220.23 89.0 7.03 12.0 96.03 70% 30%
Chancellery 19.0 2.40 3.0 21.40 12.0 3.40 5.0 15.40 58% 42%
Portfolio: Academic 208.0 33.84 53.0 241.84 34.0 3.92 6.0 37.92 86% 14%
Portfolio: Finance & Resources 123.0 6.89 9.0 129.89 17.0 0.80 1.0 17.80 88% 12%
Portfolio: International & Development 56.0 9.40 13.0 65.40 11.0 1.00 2.0 12.00 84% 16%
Portfolio: Organisational Strategy & Change 134.0 14.67 23.0 148.67 24.0 4.70 7.0 28.70 84% 16%
Portfolio: Research & Innovation 44.0 2.60 5.0 46.60 73.0 4.93 8.0 77.93 37% 63%
University Total 1521.0 139.99 217.0* 1660.99 426.0 74.55 123.00 500.55 77% 23%
* The total headcount does not add up as two people hold two positions across the University in the Division: Education, Arts & Social Sciences

Annual Workforce Profile Report 2005-2006
15
Trend
University Total (percentage of FTE) 2004
2005 2006
Continuing 77% 79% 77%
Fixed-Term 23% 21% 23% For the period 2005 to 2006 there was a slight decrease in the percentage of staff members in continuing employment within the University. However, over the three year period the percentage of staff members in continuing employment has remained constant. Benchmarking
At June 2005, 62.3% of the SA Public Sector workforce was employed on a continuing basis. Fixed-term contract staff accounted for 26.3% of the workforce, with casual staff making up the remaining 11.4%. The long-term trend across the public sector workforce has been that the proportion of people appointed on a contract basis has continued to increase. The following benchmarking information is obtained from DEST data 2005 utilising FTE figures. For universities in a group, the number and percentage of staff has been averaged. DEST uses the terminology tenured term, limited tenure and other tenure. For comparison to UniSA, tenured term has been interpreted as continuing and limited tenure and other tenure has been interpreted as fixed-term. The DEST data relates to staff in current roles at the time of data collection, i.e. higher duties and secondments are reported as limited tenure even though those staff members may hold continuing substantive positions. Based on the data in the table on the following page and the definition of continuing and fixed-term positions as described above, UniSA’s percentage of continuing staff is below the national average for universities and also below the ATN average.
Percentage of Continuing
Percentage of Fixed-Term
All Australian Universities 69.4 30.6 ATN Universities 71.3 28.7 Adelaide University 57.6 42.4 Flinders University 69.7 30.3 UniSA 66.6 33.4

Annual Workforce Profile Report 2005-2006
16

Annual Workforce Profile Report 2005-2006
17
3. TEMPORARY STAFF 3.1 CASUAL STAFF Description
Casual staff are engaged by the hour and paid on an hourly basis. The data used describes the utilisation and payment of academic and general casual staff across the University for the period 1 January 2005 to 31 December 2005. It does not include any payments made outside these dates for work performed during the period. Full-time equivalence is derived using the prescribed DEST formula:
FTE = (hours worked) (F x N)
F = factor based on average hours worked per week for various staff categories prescribed as:
• 9 for lecturing staff • 25 for tutors and supervisors • 35 for marking, research and all other non-academic staff
N = number of weeks worked per year for various staff categories prescribed as:
• 28 for lecturing, tutoring and supervisory staff • 52 for marking, research and all other non-academic staff
The following definitions are prescribed by DEST and used within the tables:
• Lecture – where the work performed is lecturing.
• Tutor – where the work performed is supervising or conducting demonstrations, tutorials or workshops.
• Other – where the work performed is marking, research and all other work including all non-academic activities.
This data is presented as follows:
• Table 5 shows total casual hours and FTE by Division/Portfolio.
• Table 6 shows total University casual hours and FTE by award and work type.
• Table 7 shows the breakdown of casual academic hours and FTE by Division and Portfolio and work type.
• Table 8 shows casual general hours and FTE by Division and Portfolio.
• Table 9 shows casual hours and FTE by Division and Portfolio and gender.

Annual Workforce Profile Report 2005-2006
18
Table 5: Casual Hours and FTE by Division and Portfolio, 1 January 2005 to 31 December 2005
Division and Portfolio Number of hours FTE
Division: Business 83,528 71.88
Division: Education, Arts & Social Sciences 143,723 125.67
Division: Health Sciences 65,699 43.68
Division: Information Technology, Engineering & the Environment 68,116 58.19
Chancellery 755 0.42
Portfolio: Academic 30,568 16.80
Portfolio: Finance & Resources 13,415 7.37
Portfolio: International & Development 14,549 7.99
Portfolio: Organisational Strategy & Change 17,511 12.20
Portfolio: Research & Innovation 6,559 3.65
Grand Total 444,423 347.85
Table 6: Total University Summary of Casual Hours and FTE by Award and Work Type, 1 January 2005 to 31 December 2005
Award Work Code Number of hours FTE
Lecture 15,621 61.99
Tutor 57,161 81.66 Academic – Non Research
Other 126,610 69.57
Academic – Non Research Total 199,392 213.22
Academic – Research Other 76,929 42.27
Academic - Research Total 76,929 42.27
Academic Total 276,321 255.49
General – Administrative Other 147,846 81.23
General – Research Other 20,256 11.13
General Total 168,102 92.36
Grand Total 444,423 347.85

Annual Workforce Profile Report 2005-2006
19
Table 7: Academic Casual Hours and FTE by Division and Portfolio and Work Type, 1 January 2005 to 31 December 2005
Division and Portfolio Work Code
Number of hours FTE
Lecture 4,454 17.68 Tutor 12,241 17.48 Division: Business Other 39,612 21.76
Total: Division: Business 56,307 56.92
Lecture 5,678 22.53 Tutor 31,037 44.34 Division: Education, Arts & Social
Sciences Other 68,170 37.46
Total: Division: Education, Arts & Social Sciences 104,885 104.33
Lecture 931 3.69 Tutor 5,003 7.15 Division: Health Sciences Other 44,184 24.28
Total: Division: Health Sciences 50,118 35.12
Lecture 4,096 16.25 Tutor 7,694 10.99 Division: Information Technology,
Engineering & the Environment Other 42,914 23.58
Total: Division: Information Technology, Engineering & the Environment 54,704 50.82
Chancellery Other 23 0.02
Total: Chancellery 23 0.02
Portfolio: Academic Other 1,976 1.09
Total: Portfolio: Academic 1,976 1.09
Portfolio: Finance & Resources Other 121 0.07
Total: Portfolio: Finance & Resources 121 0.07
Portfolio: International & Development Other 303 0.16
Total: Portfolio: International & Development 303 0.16
Lecture 462 1.84 Tutor 1,134 1.62 Portfolio: Organisational Strategy &
Change Other 4,299 2.36
Total: Portfolio: Organisational Strategy & Change 5,895 5.82
Tutor 52 0.08 Portfolio: Research & Innovation Other 1,937 1.06
Total: Portfolio: Research & Innovation 1,989 1.14
Grand Total 276,321 255.49

Annual Workforce Profile Report 2005-2006
20
Table 8: General Casual Work Code ‘Other’ Hours and FTE by Division and Portfolio,
1 January 2005 to 31 December 2005
Division and Portfolio Number of hours FTE
Division: Business 27,221 14.96
Division: Education, Arts & Social Sciences 38,838 21.34
Division: Health Sciences 15,581 8.56
Division: Information Technology, Engineering & the Environment 13,412 7.37
Chancellery 732 0.40
Portfolio: Academic 28,592 15.71
Portfolio: Finance & Resources 13,294 7.30
Portfolio: International & Development 14,246 7.83
Portfolio: Organisational Strategy & Change 11,616 6.38
Portfolio: Research & Innovation 4,570 2.51
Total 168,102 92.36
Annual Workforce Profile Report 2005-2006
21
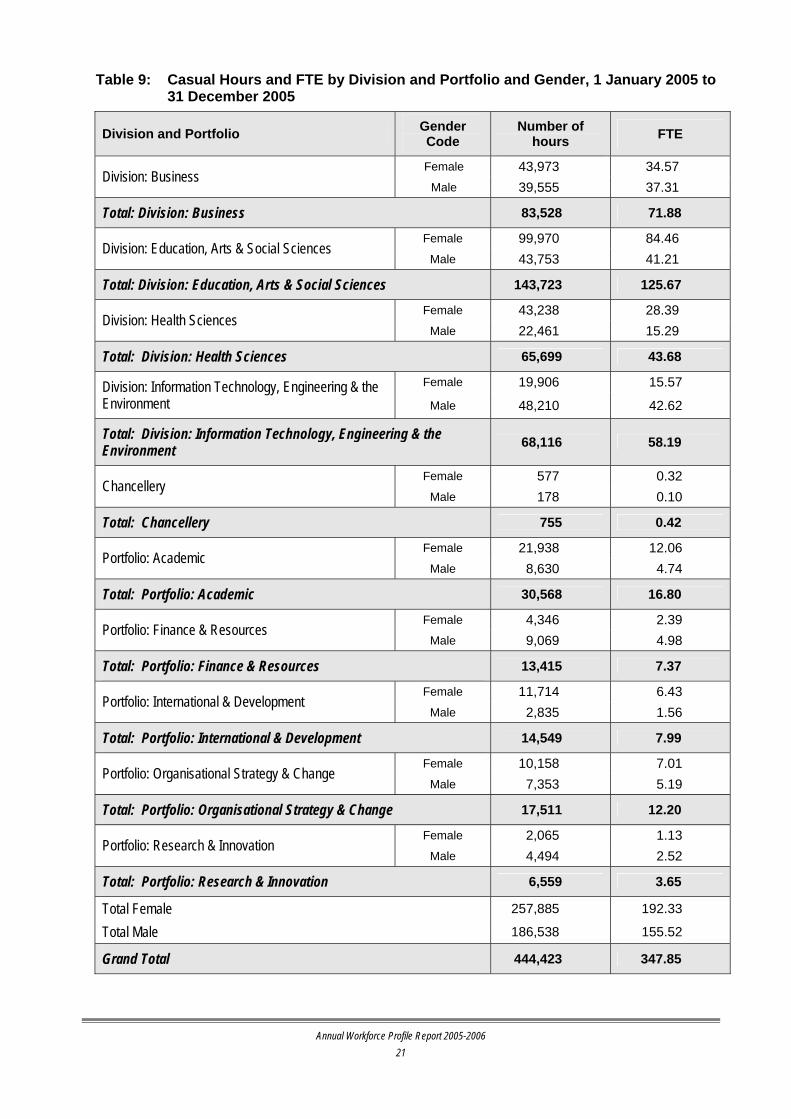
Table 9: Casual Hours and FTE by Division and Portfolio and Gender, 1 January 2005 to 31 December 2005
Division and Portfolio Gender Code
Number of hours FTE
Female 43,973 34.57 Division: Business
Male 39,555 37.31
Total: Division: Business 83,528 71.88
Female 99,970 84.46 Division: Education, Arts & Social Sciences
Male 43,753 41.21
Total: Division: Education, Arts & Social Sciences 143,723 125.67
Female 43,238 28.39 Division: Health Sciences
Male 22,461 15.29
Total: Division: Health Sciences 65,699 43.68
Female 19,906 15.57 Division: Information Technology, Engineering & the Environment Male 48,210 42.62
Total: Division: Information Technology, Engineering & the Environment 68,116 58.19
Female 577 0.32 Chancellery
Male 178 0.10
Total: Chancellery 755 0.42
Female 21,938 12.06 Portfolio: Academic
Male 8,630 4.74
Total: Portfolio: Academic 30,568 16.80
Female 4,346 2.39 Portfolio: Finance & Resources
Male 9,069 4.98
Total: Portfolio: Finance & Resources 13,415 7.37
Female 11,714 6.43 Portfolio: International & Development
Male 2,835 1.56
Total: Portfolio: International & Development 14,549 7.99
Female 10,158 7.01 Portfolio: Organisational Strategy & Change
Male 7,353 5.19
Total: Portfolio: Organisational Strategy & Change 17,511 12.20
Female 2,065 1.13 Portfolio: Research & Innovation
Male 4,494 2.52
Total: Portfolio: Research & Innovation 6,559 3.65
Total Female 257,885 192.33
Total Male 186,538 155.52
Grand Total 444,423 347.85
Annual Workforce Profile Report 2005-2006
22
Summary
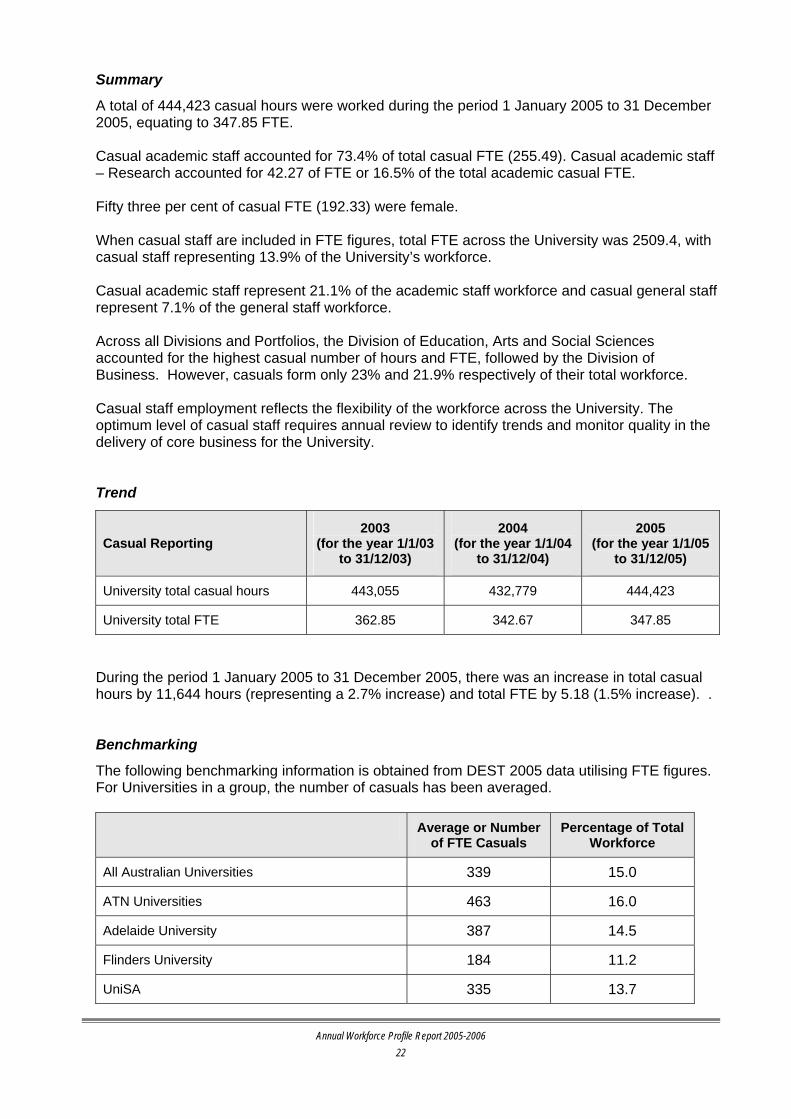
A total of 444,423 casual hours were worked during the period 1 January 2005 to 31 December 2005, equating to 347.85 FTE. Casual academic staff accounted for 73.4% of total casual FTE (255.49). Casual academic staff – Research accounted for 42.27 of FTE or 16.5% of the total academic casual FTE. Fifty three per cent of casual FTE (192.33) were female. When casual staff are included in FTE figures, total FTE across the University was 2509.4, with casual staff representing 13.9% of the University’s workforce. Casual academic staff represent 21.1% of the academic staff workforce and casual general staff represent 7.1% of the general staff workforce. Across all Divisions and Portfolios, the Division of Education, Arts and Social Sciences accounted for the highest casual number of hours and FTE, followed by the Division of Business. However, casuals form only 23% and 21.9% respectively of their total workforce. Casual staff employment reflects the flexibility of the workforce across the University. The optimum level of casual staff requires annual review to identify trends and monitor quality in the delivery of core business for the University. Trend
Casual Reporting 2003
(for the year 1/1/03 to 31/12/03)
2004 (for the year 1/1/04
to 31/12/04)
2005 (for the year 1/1/05
to 31/12/05)
University total casual hours 443,055 432,779 444,423
University total FTE 362.85 342.67 347.85
During the period 1 January 2005 to 31 December 2005, there was an increase in total casual hours by 11,644 hours (representing a 2.7% increase) and total FTE by 5.18 (1.5% increase). . Benchmarking
The following benchmarking information is obtained from DEST 2005 data utilising FTE figures. For Universities in a group, the number of casuals has been averaged. Average or Number
of FTE Casuals Percentage of Total
Workforce
All Australian Universities 339 15.0
ATN Universities 463 16.0
Adelaide University 387 14.5
Flinders University 184 11.2
UniSA 335 13.7
Annual Workforce Profile Report 2005-2006
23
Estimated casual numbers (FTE) for all Australian Universities ranges from zero at Batchelor Institute of Indigenous Tertiary Education in the Northern Territory to 1123 at the University of Sydney. Of the ATN Universities, UniSA recorded the lowest number of FTE casual staff, with 335, compared to the highest of 702 FTE at the Queensland University of Technology (2005 DEST data).

Annual Workforce Profile Report 2005-2006
24

Annual Workforce Profile Report 2005-2006
25
4. STAFF TURNOVER Description
For the purposes of this report, turnover includes both voluntary and involuntary turnover and does not include casual staff. Voluntary turnover represents the number of staff (headcount) who initiated termination of employment and includes:
• resignation; • voluntary redundancy; and • retirement.
This indicator monitors the unplanned loss of skills and impacts on productivity and costs of rehiring and training. Whilst some turnover is healthy, very high levels of turnover may be indicative of management or organisational culture issues, skills shortages, competitor strategies, employee dissatisfaction and individual performance. However, turnover can also represent an opportunity to introduce new skills, facilitate change in the workplace and be functional for the particular area. Involuntary turnover represents the number of employer-initiated terminations of employment and includes:
• expiration of fixed-term contract employment; • redundancy; • dismissal; and • employment not continuing after probation.
Dismissals and probation terminations of employment are a guide to the effectiveness of recruitment and selection procedures, training, performance management and workforce planning. Further statistical analysis of UniSA exits and recruitment can be found in the Age Profile section of this report. Turnover represents the ratio of staff that has left the organisation to the average number of staff employed over a 12 month period. It has been calculated with the following formula: Number of Staff terminated (headcount) x 100%
Average No. of staff for the 12 month period Figure 3 (over page) shows voluntary and involuntary turnover annualised by Division and Portfolio from 1 April 2005 to 31 March 2006. Table 10 (over page) shows voluntary and involuntary staff turnover annualised from 1 April 2005 to 31 March 2006 for academic and general staff. Table 11 (over page) illustrates the information by gender and academic and general for the same period.

Figure 3: Voluntary and Involuntary Staff Turnover Annualised by Division and
Portfolio, 1 April 2005 to 31 March 2006
0%
5%
10%
15%
20%
25%
30%
Div: Business &Enterprise
Div: Education, Arts& Social Sciences
Div: Health Sciences Div: InformationTechnology,
Engineering & theEnvironment
Chancellery Portfolio: Academic Portfolio: Finance &Resources
Portfolio:International &Development
Portfolio:Organisational
Strategy & Change
Portfolio: Research& Innovation
University Total
Involuntary Voluntary Grand Total
Table 10: University-wide Voluntary and Involuntary Staff Turnover Annualised by
Academic and General, 1 April 2005 to 31 March 2006
Academic General Total University
Involuntary 4.1% 2.4% 2.9%
Voluntary 4.8% 13.0% 10.0%
Total Turnover 4.5% 8.3% 12.9%
Table 11: Number of Involuntary and Voluntary Staff Separations by Gender
and Academic and General, 1 April 2005 to 31 March 2006
Gender Award Involuntary Voluntary Total
Academic 21 19 40 Female
General 17 95 112
Total: Female 38 114 152
Academic 20 42 62 Male
General 7 69 76
Total: Male 27 111 138
Total 65 225 290
Annual Workforce Profile Report 2005-2006
26

Annual Workforce Profile Report 2005-2006
27
Summary
The total University-wide turnover (including both involuntary and voluntary) for the period 1 April 2005 to 31 March 2006 was 12.9% which represents 290 separations. The high involuntary turnover in the Divisions of Health Sciences and Education, Arts and Social Sciences occurred due to a high number of fixed-term contracts expiring during the period. The high voluntary turnover in Portfolio: Finance and Resources occurred due to the high (relative to the Portfolio size) number of staff (36) who resigned or accepted voluntary redundancy from the University through the Services Unit managing change process. The total turnover in each Division ranges from 14.6% in the Division of Education, Arts and Social Sciences to 10.0% in the Division of Information Technology, Engineering and the Environment. This variation may be caused by different organisational changes throughout the period. The total turnover in each Portfolio ranges from 24.8% in the Portfolio: Finance and Resources to 9.5% in the Portfolio: Academic. As previously stated, the Portfolio: Finance and Resources high total turnover can partly be explained by the Services Unit managing change process. The total number of women leaving the organisation was 152, representing 52.4% of all separations. This is slightly lower than the proportion of female staff within the University (57.8%). This has decreased when compared to last year’s figures (188 female separations representing 62.5% of all separations). The total number of female academic staff leaving the organisation was 40, representing 39.2% of academic staff separations. This is lower than the proportion of female academic staff within the University (46.7%) and is significantly less than for the previous year (75 separations representing 58.1% of academic staff separations). Trend
Total University 2004 2005 2006
Involuntary 3.1% 5.3% 2.9%
Voluntary 7.1% 8.2% 10.0%
Total Turnover 10.2% 13.5% 12.9%
Voluntary turnover has continued to increase and is at its highest for the three year period, with 225 staff leaving voluntarily in 2006, up from 183 in 2005, whereas involuntary turnover has decreased from 5.3% in 2005 to 2.9% in 2006. The total turnover for the University has decreased over the last 12 months from 13.5% in 2005 to 12.9% in 2006. While exit interviews are currently undertaken for voluntary exits, the information is captured locally. This information needs to be collated centrally to establish any consistent trends/issues across the University.
Annual Workforce Profile Report 2005-2006
28
Benchmarking The Australian Universities HR Benchmarking Program 2006 (sample size 30 universities) has an overall average result of 18.3% for total turnover (includes expiration of fixed-term contracts) for the calendar year 2005. The overall average result for the ATN universities is 16.3% for total turnover for the calendar year 2005. In comparison, UniSA’s total turnover of 12.8% for the period 1 April 2005 to 31 March 2006 is significantly lower than the average for all Australian universities. The average voluntary (employee initiated) turnover for Australian Universities is 9.1% (sample size 30) for 2005, which is fairly consistent with UniSA’s voluntary turnover rate of 10.0%. For ATN universities, average voluntary turnover in 2005 was 9.1%. This reflects a slight decrease of 0.6% on the ATN results for 2004. The greatest incidence of voluntary turnover occurred at the Academic Level A and HEW 1-5 levels. The Mercer Human Resources Effectiveness Monitor 2005 reports the average total turnover for all industries with staff numbers above 1000 is 15.4%. Across all Australian industries the voluntary turnover has increased from 13.3% in 2004 to 17.5% in 2005.

5. LENGTH OF SERVICE Description
Figure 4 shows the length of service (as a percentage) for continuing and fixed-term academic staff from commencement date at UniSA or the previous amalgamated institutions. Figure 5 shows general staff length of service and Figure 6 (over page) shows length of service for the total University. For reporting purposes the information has been grouped into the following:
• less than 6 months • 6 months to 3 years • 3 to 7 years • 7 to 15 years • 15 plus years
Figure 4: Length of Service for Academic Staff as at 31 March 2006
7 - 15 years23.9%
3 - 7 years21.6%
6 months - 3 years18.1%
15 + years30.3%
Less than 6 months6.1%
Figure 5: Length of Service for General Staff as at 31 March 2006
7 - 15 years23.1% 3 - 7 years
24.1%
6 months - 3 years22.9%
15 + years24.3%
Less than 6 months5.6%
Annual Workforce Profile Report 2005-2006
29
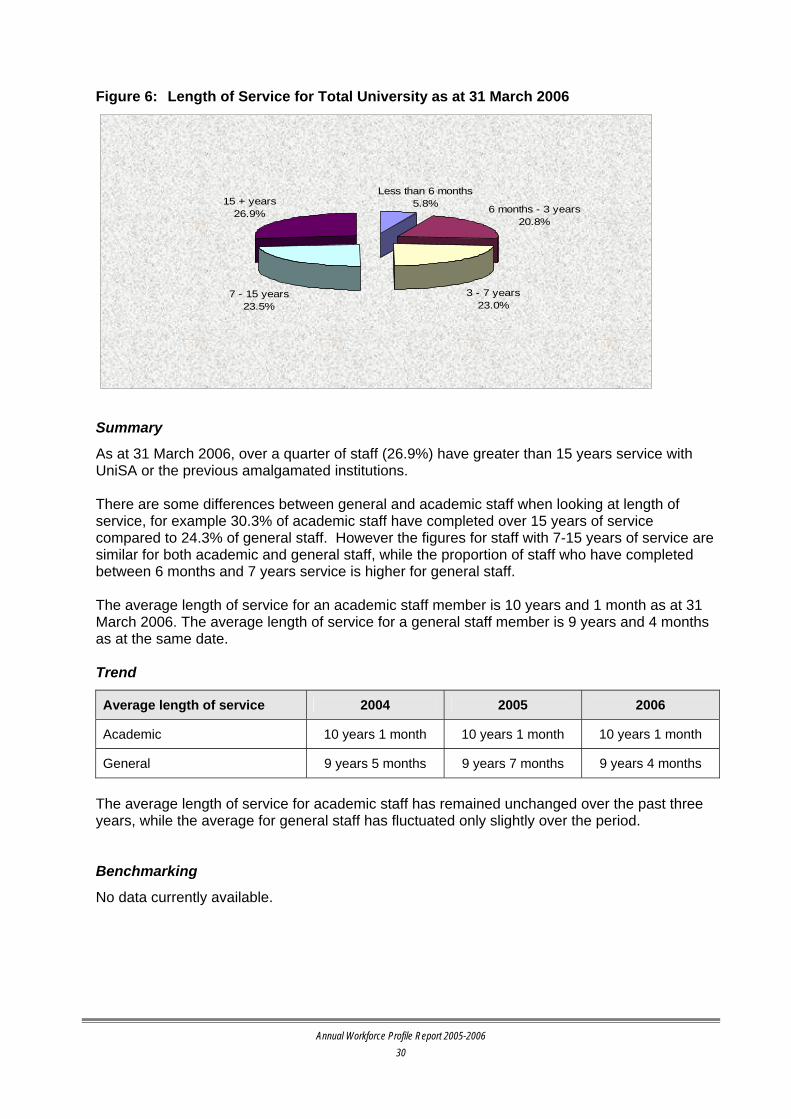
Figure 6: Length of Service for Total University as at 31 March 2006
15 + years26.9%
7 - 15 years23.5%
3 - 7 years23.0%
6 months - 3 years20.8%
Less than 6 months5.8%
Summary
As at 31 March 2006, over a quarter of staff (26.9%) have greater than 15 years service with UniSA or the previous amalgamated institutions. There are some differences between general and academic staff when looking at length of service, for example 30.3% of academic staff have completed over 15 years of service compared to 24.3% of general staff. However the figures for staff with 7-15 years of service are similar for both academic and general staff, while the proportion of staff who have completed between 6 months and 7 years service is higher for general staff. The average length of service for an academic staff member is 10 years and 1 month as at 31 March 2006. The average length of service for a general staff member is 9 years and 4 months as at the same date. Trend
Average length of service 2004 2005 2006
Academic 10 years 1 month 10 years 1 month 10 years 1 month
General 9 years 5 months 9 years 7 months 9 years 4 months
The average length of service for academic staff has remained unchanged over the past three years, while the average for general staff has fluctuated only slightly over the period. Benchmarking
No data currently available.
Annual Workforce Profile Report 2005-2006
30

Annual Workforce Profile Report 2005-2006
31
6. DIVERSITY This section contains diversity profiling indicators (Indigenous employment, youth employment, women in the UniSA workforce, country of birth, first languages and disability). UniSA encourages management practices that create and sustain an environment where all staff can achieve their potential in contributing to the corporate objectives. The University acknowledges the benefits of a diverse workforce and the valuing of differences among staff. Recognising a broad range of experiences, values and skills within the workforce enhances organisational performance. A number of recent initiatives reflect UniSA’s commitment to diversity:
• In the early part of 2005 a review of the Equity and Diversity website was undertaken. Changes to this website were completed in August 2005 and have provided a more effective resource for staff and managers.
• During 2006, short informative sessions on equity and diversity at UniSA are being presented at School Board and other staff meetings across the University. The aim of the roadshow is to remind all staff of their obligations under various anti-discrimination legislation as well as the University’s policies in this area and to direct staff to available resources.
• Multi-access suites have been created and are now available to female and male members of the University community. These suites provide a dignified, private and appropriate space that supports the needs of parents, breastfeeding mothers and people with disabilities or medical conditions who need an area to rest or to conduct disability-related cares.
• Enhanced provisions for maternity leave, partner leave and flexibility in working hours. The following initiatives implemented in previous years will continue to be supported:
• Embedding the staff equity and diversity function within all teams across the HR Unit.
• Addressing equity issues in employment in the Staff Attitude Survey.
• Provision of a multi-faceted Women and Leadership program.
• Establishment of flexible family and culturally friendly work practices.
• Provision of equity and diversity training development opportunities.
• Provision of Indigenous cultural awareness training for non-Indigenous staff.
The Staff Diversity Survey, a confidential data collection process, was initiated in 2000 to gather data on the diversity attributes of the workforce. Currently 65% of staff have completed and returned the Staff Diversity Survey.

Annual Workforce Profile Report 2005-2006
32
6.1 INDIGENOUS EMPLOYMENT Description
Indigenous staff are those who identify themselves as being of Aboriginal and/or Torres Strait Islander origin. Table 12 shows Indigenous employment as a percentage of staff by Division and Portfolio and total University as at 31 March 2006. This percentage is calculated as:
Number of Indigenous Staff (headcount) x 100% Total Staff (headcount) The data contained in Table 12 is sourced from a confidential database, maintained by the Consultant: HR Services (Indigenous and Employment Schemes) and is based on interviews with staff members. Due to the small number of Indigenous staff spread across the University, the data is shown as a percentage and does not include the actual number of Indigenous staff across each Division and Portfolio. Table 12: Indigenous Employment as a Percentage of Staff as at 31 March 2006
Division and Portfolio Indigenous 2006 (% Headcount)
Division: Business 0.00%
Division: Education, Arts & Social Sciences 5.79%
Division: Health Sciences 1.13%
Division: Information Technology, Engineering & the Environment 0.00%
Chancellery 0.00%
Portfolio: Academic 1.00%
Portfolio: Finance & Resources 0.00%
Portfolio: International & Development 0.00%
Portfolio: Organisational Strategy & Change 1.06%
Portfolio: Research & Innovation 0.00%
Total Across the University 1.53%
Summary
From information collected in the HRU database, the percentage of staff that identify themselves as being of Indigenous origin is 1.53%. UniSA remains committed to achieving a target of 2% Indigenous employment across the University.

Annual Workforce Profile Report 2005-2006
33
Current strategies to achieve this target include:
• Ongoing support and commitment to the role of Consultant: HR Services (Indigenous and Employment Schemes) and the services it provides.
• Annual review of the Indigenous Employment Strategy and the range of initiatives it incorporates.
• Provision of Indigenous cultural awareness training for non-Indigenous staff.
• Mentoring and support networks for Indigenous staff.
• A focus on young Indigenous people through the Youth Traineeship scheme.
• Funding for professional development of Indigenous staff who are newly appointed to UniSA calculated as 20% of the employee’s base salary plus on-costs at the time of appointment for a 3 year period.
These strategies are supported by the Indigenous Employment Advisory Committee (which includes community members). Further information about strategies to increase the Indigenous employment participation rate is available on the workforce planning website.
Trend
2004 2005 2006
Indigenous employment as a percentage of staff (headcount) 1.26% 1.17% 1.53%
The percentage of staff that identify themselves as Indigenous has increased over the last year from 1.17% of total headcount in 2005 to 1.53% in 2006. Achieving the 2% goal for Indigenous employment continues to pose a challenge for the University. However, ongoing support and commitment to the role of Consultant: HR Services (Indigenous and Employment Schemes) and the services it provides will assist in achieving this target. Benchmarking
The Australian Bureau of Statistics 2001 Census of Population and Housing information indicated that 1.6% of the South Australian population was identified as Indigenous. This figure was calculated using the total Indigenous population and broken into the following age groups.
Age Group Indigenous Population % of Total Population of South Australia
0-4 years 2,930 3.3%
5-14 years 6,081 3.1%
15-24 years 4,331 2.3%
25-44 years 6,669 1.6%
45-64 years 2,758 0.8%
65 years and over 656 0.3%
Total 23,425 1.6%
Annual Workforce Profile Report 2005-2006
34
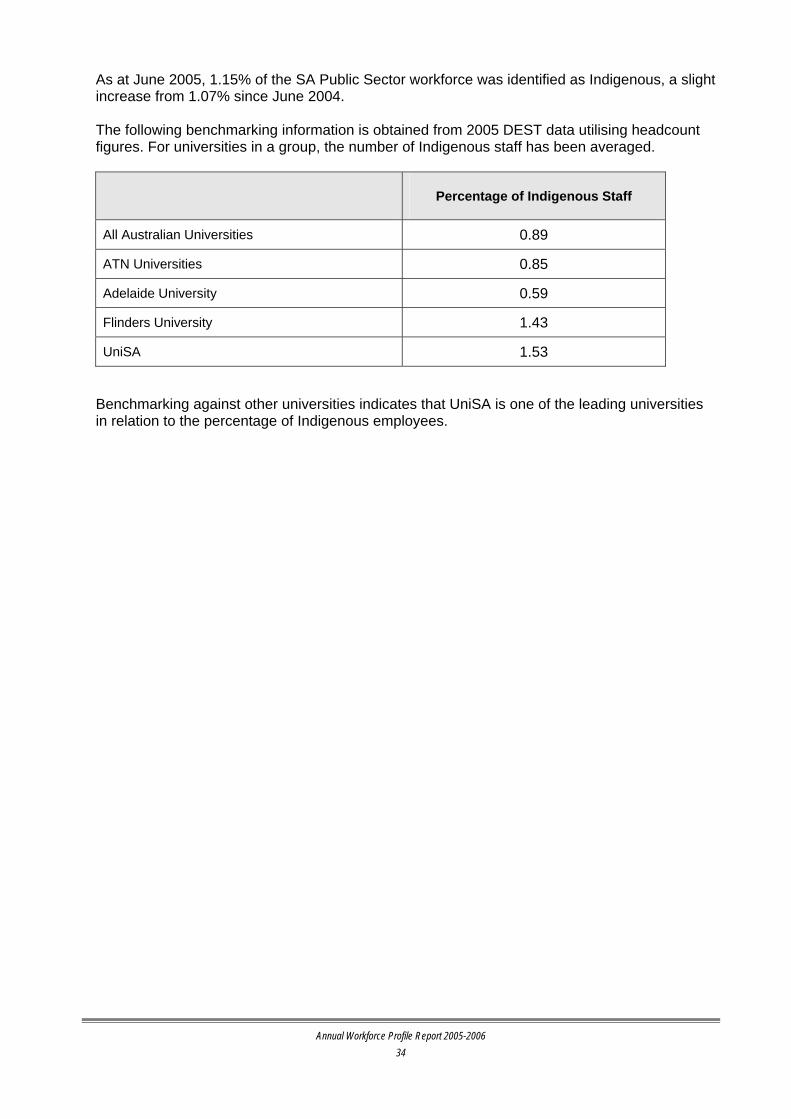
As at June 2005, 1.15% of the SA Public Sector workforce was identified as Indigenous, a slight increase from 1.07% since June 2004. The following benchmarking information is obtained from 2005 DEST data utilising headcount figures. For universities in a group, the number of Indigenous staff has been averaged.
Percentage of Indigenous Staff
All Australian Universities 0.89
ATN Universities 0.85
Adelaide University 0.59
Flinders University 1.43
UniSA 1.53
Benchmarking against other universities indicates that UniSA is one of the leading universities in relation to the percentage of Indigenous employees.

Annual Workforce Profile Report 2005-2006
35
6.2 YOUTH EMPLOYMENT Description
Youth employment at UniSA is defined as the employment (continuing and fixed-term) of general staff between 16 and 24 years of age. This is shown as a percentage of staff (FTE non-casual): Total Youth Employed (FTE) x 100% Total General Staff (FTE) The intention is to increase the participation rate of young people less than 25 years of age within UniSA to reflect the diversity and characteristics of the student population and South Australian community. Further information regarding youth employment strategies can be found on Human Resources website. Table 13 shows youth employment as a percentage of general staff as at 31 March 2006. Table 13: Youth Employment as a Percentage of General Staff FTE
as at 31 March 2006
Continuing and Fixed-term (excludes casuals) Youth 2006 (% FTE)
Total University general staff under 25 5.8%
Table 14 illustrates general staff youth employment (FTE) by Division and Portfolio as at the same date. Table 14: General Staff Youth Employment (FTE) by Division and Portfolio
as at 31 March 2006
Division and Portfolio Continuing Fixed-term Total
Division: Business 8.0 7.0 15.0
Division: Education, Arts & Social Science 4.0 5.0 9.0
Division: Health Sciences 4.0 8.0 12.0
Division: Information Technology, Engineering & the Environment 6.0 3.0 9.0
Chancellery 0.0 2.0 2.0
Portfolio: Academic 5.0 2.0 7.0
Portfolio: Finance & Resources 2.0 0.0 2.0
Portfolio: International & Development 2.0 4.0 6.0
Portfolio: Organisational Strategy & Change 3.0 8.0 11.0
Portfolio: Research & Innovation 0.0 1.0 1.0
Grand Total 34.0 40.0 74.0

Annual Workforce Profile Report 2005-2006
36
Summary
Youth employment represents 5.8% of total general staff numbers (non-casuals). Forty-six per cent of staff employed under the age of 25 years are in continuing employment. The Division of Business has the highest number of general staff youth employed (15 FTE) due to ongoing strong commitment to the Youth Traineeship Scheme and the higher number of HEO3 positions. All general staff employed on the Youth Traineeship Scheme are employed in full-time positions.
Trend
2004 2005 2005
Youth Employment as a percentage of General Staff (non-casual) FTE 5.3% 5.1% 5.8%
Over the previous 12 months, the percentage of general staff under the age of 25 has increased from 5.1% (60 FTE) to 5.8% (74 FTE). The largest increase in the number of FTE general staff youth occurred in the Division of Health Sciences with an increase of 5 FTE general staff youth and the Portfolio: Organisational Strategy and Change with an increase of 4 FTE. UniSA’s commitment to youth employment is reflected through the Youth Traineeship Scheme. This year the HRU undertook an extensive review of the scheme. As a result the Youth Traineeship Scheme will be centrally coordinated to bring greater focus to this area. It is anticipated that improvements undertaken this year will lead to an increase in youth employed under this scheme over the next six to twelve months. Benchmarking
Australian Bureau of Statistics labour force data shows that as at 30 June 2005, 18.4% of the South Australian labour force was made up of young people in the 15 to 24 year age group. The proportion of employees in this age cohort in South Australian Public Sector was 5.9% as at June 2005. This figure has remained static since June 2004. DEST data shows that the average percentage of general staff across all Australian Universities under 25 years of age is 5.1%. However this data uses headcount and not FTE. Data is unavailable for individual universities or groups of universities.

Annual Workforce Profile Report 2005-2006
37
6.3 WOMEN IN THE UNISA WORKFORCE
Description
Table 15 shows the percentage of female staff (headcount) for academic and general staff within each Division and Portfolio as at 31 March 2006. For reporting purposes the Portfolio Pro Vice Chancellors and Executive Directors, along with their Executive Officers and Personal Assistants are reported within Chancellery. This is consistent throughout the report. Divisional Pro Vice Chancellors are reported within their respective Divisions. Table 15: Female Staff Percentages by Academic and General and Division and
Portfolio as at 31 March 2006
Academic Staff
General Staff Total
Division: Business 34.5% 82.6% 56.1%
Division: Education, Arts & Social Sciences 57.5% 76.9% 63.3%
Division: Health Sciences 62.7% 71.9% 66.0%
Division: Information Technology, Engineering & the Environment 21.7% 62.3% 35.9%
Chancellery 100.0% 82.9% 84.6%
Portfolio: Academic 75.0% 72.6% 72.8%
Portfolio: Finance & Resources - 41.3% 41.3%
Portfolio: International & Development - 79.3% 79.3%
Portfolio: Organisational Strategy & Change 68.2% 53.0% 54.8%
Portfolio: Research & Innovation 26.2% 55.1% 41.5%
Total Across University 46.7% 66.5% 57.8%
Table 16 (over page) shows staff gender breakdown across all levels for academic and general staff as at 31 March 2006.

Table 16: Staff Gender (Headcount) across all Levels as at 31 March 2006
Continuing staff Fixed-Term staff Totals
Full-time Part-time Full-time Part-time Total Grand Total
Occupational Classifications
F M F M F M F M F M
Vice Chancellor 1 1 1
Pro Vice Chancellor* 3 3 3 3 6
Executive Directors 1 1 1 1 2
Academic Staff (T&R) Level E 22 50 3 1 12 3 23 68 91
Academic Staff (T&R) Level D 22 44 1 1 3 1 1 24 49 73
Academic Staff (T&R) Level C 115 143 6 2 7 11 2 130 156 286
Academic Staff (T&R) Level B 96 84 27 9 16 18 11 3 150 114 264
Academic Staff (T&R) Level A 30 15 7 2 20 9 7 4 64 30 94
Academic Staff (Research) Level E 2 2 1 5 5
Academic Staff (Research) Level D 1 4 1 5 2 9 11
Academic Staff (Research) Level C 2 4 1 1 7 18 1 1 11 24 35
Academic Staff (Research) Level B 1 1 14 29 3 6 18 36 54
Academic Staff (Research) Level A 1 1 25 34 20 10 46 45 91
General Senior Executives (Level 10 and above) 9 5 1 5 16 15 21 36
General Staff HE09 19 24 3 1 1 3 1 23 29 52
General Staff HE08 42 50 3 6 8 4 55 58 113
General Staff HE07 71 52 16 12 8 4 1 103 61 164
General Staff HE06 76 71 15 1 16 11 5 112 83 195
General Staff HE05 130 42 17 3 16 10 10 173 55 228
General Staff HE04 142 51 51 1 36 9 14 2 243 63 306
General Staff HE03 54 43 35 1 10 8 7 1 106 53 159
General Staff HE02 1 1 6 2 1 9 2 11
General Staff HE01 1 1 1
Trainee 8 1 8 1 9
Grand Total 833 687 191 25 208 220 89 34 1321 966 2287
Due to employees holding multiple positions the headcount total for part-time positions does not add up. * One Pro Vice Chancellor position was held by an hourly-paid academic staff member as at 31 March 2006.
Annual Workforce Profile Report 2005-2006
38
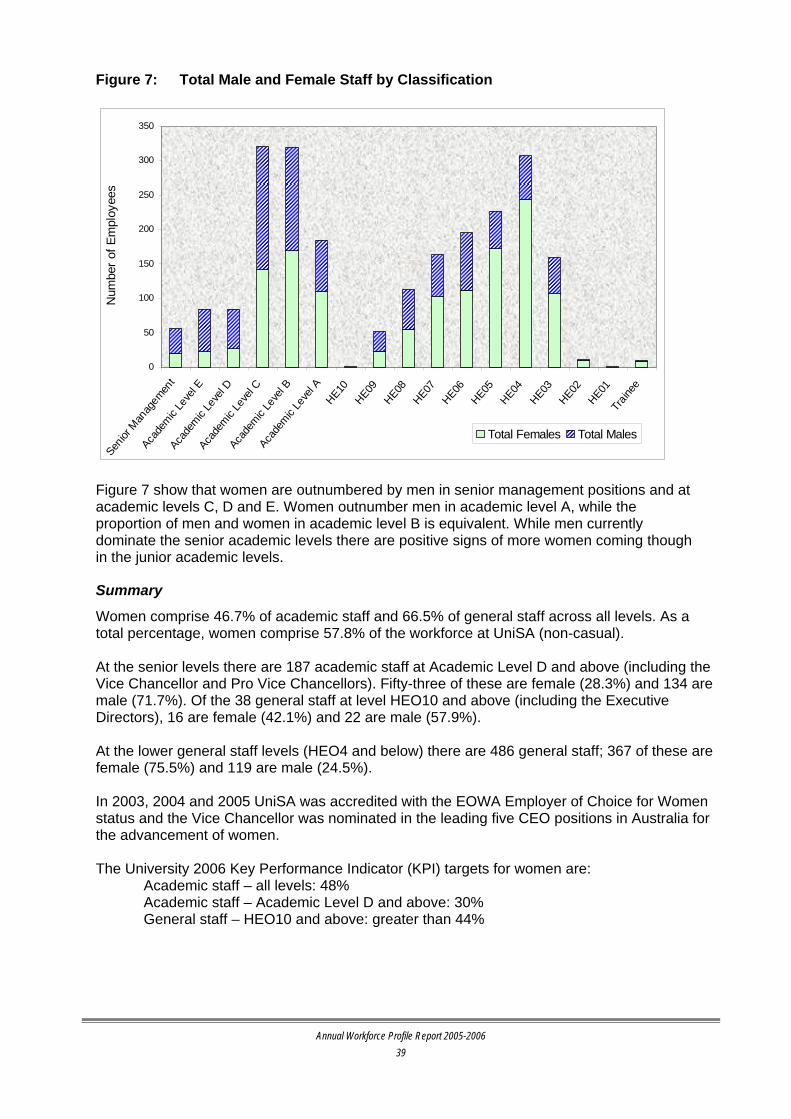
Figure 7: Total Male and Female Staff by Classification
0
50
100
150
200
250
300
350
Senior
Man
agem
ent
Acade
mic Le
vel E
Acade
mic Le
vel D
Acade
mic Le
vel C
Acade
mic Le
vel B
Acade
mic Le
vel A
HE10HE09HE08HE07HE06HE05HE04HE03HE02HE01
Train
ee
Num
ber o
f Em
ploy
ees
Total Females Total Males
Figure 7 show that women are outnumbered by men in senior management positions and at academic levels C, D and E. Women outnumber men in academic level A, while the proportion of men and women in academic level B is equivalent. While men currently dominate the senior academic levels there are positive signs of more women coming though in the junior academic levels. Summary
Women comprise 46.7% of academic staff and 66.5% of general staff across all levels. As a total percentage, women comprise 57.8% of the workforce at UniSA (non-casual). At the senior levels there are 187 academic staff at Academic Level D and above (including the Vice Chancellor and Pro Vice Chancellors). Fifty-three of these are female (28.3%) and 134 are male (71.7%). Of the 38 general staff at level HEO10 and above (including the Executive Directors), 16 are female (42.1%) and 22 are male (57.9%). At the lower general staff levels (HEO4 and below) there are 486 general staff; 367 of these are female (75.5%) and 119 are male (24.5%). In 2003, 2004 and 2005 UniSA was accredited with the EOWA Employer of Choice for Women status and the Vice Chancellor was nominated in the leading five CEO positions in Australia for the advancement of women. The University 2006 Key Performance Indicator (KPI) targets for women are:
Academic staff – all levels: 48% Academic staff – Academic Level D and above: 30% General staff – HEO10 and above: greater than 44%
Annual Workforce Profile Report 2005-2006
39

Annual Workforce Profile Report 2005-2006
40
Despite a gradual improvement in the University’s KPIs targets for women over recent years, the 2006 targets still have not been achieved with female academic staff at all levels representing 46.7% (target 48%), female academics at Level D and above representing 28.3% (target 30%) and general staff HEO10 and above women representing 42.1% (target 44%). Strategies to achieve these targets are outlined in the Equal Opportunity for Women in the Workplace Plan and the Equal Opportunity for Women in Workplace Report. In 2004, strategies implemented at the local level were documented in the workforce planning section of the Medium Term Strategic Plans. Strategies identified at the local level include providing support in encouraging women to apply for academic promotion, providing resources for women to complete doctoral qualifications and ensuring women have appropriate professional development opportunities incorporated in their performance management plans. Trend
Female 2004 2005 2006
Academic staff – all levels 45.0% 45.0% 46.7%
Academic Staff – academic level D and above 27.1% 27.3% 28.3%
General staff – all levels 64.0% 65.0% 66.5%
General staff – HEO10 and above 42.1% 40.0% 42.1%
Total Workforce 56% 56% 57.8%
Female academic staff numbers at all levels have increased over the 3 year reporting period, from 45.0% in 2004 and 2005 to 46.7% in 2006. Female general staff at all levels increased during the reporting period from 64% in 2004 to 66.5% in 2006. Following a slight decrease in 2005, the proportion of female general staff HEO10 and above increased during 2006 to 42.1%, identical to that of 2004.
Figure 8 (over page) shows that the workforce profile for all Universities is marked by significant gender imbalance at senior levels. Women are slightly over-represented at Level A, but their numbers decline with levels of seniority. The proportion of women at Level B and above has been rising steadily for the last decade, with the most rapid increase over the period being at Level C. However, at Levels D and E, although there are clear indications of progress, only one in four professors are women. It was noted by Professor Hilary Winchester, Pro Vice Chancellor: Organisational Strategy and Change at the Annual Higher Education Summit held in March 2005, that the distribution of female professors is highly segmented within particular disciplines such as nursing. Women are particularly under-represented in science, IT and in research leadership positions.

Figure 8: Female Academic Staff as a Percentage of Total Academic Staff,
All Universities, 1996-2004
0%
10%
20%
30%
40%
50%
60%
Academic Level A Academic Level B Academic Level C Academic Level D Academic Level E
1996 1997 1998 1999 2000 2001 2002 2003 2004
(DEST statistics, 1995-2004) Benchmarking Women represent 50.45% of the total South Australian population (Australian Bureau of Statistics, 2006). The proportion of women employed in the South Australian Public sector has increased steadily over time, and as at June 2005 women represented 64.7% of the public sector workforce. However, men continued to be highly represented in senior roles (66%) while women accounted for only 34% of all executives. The Australian Universities HR Benchmarking Program for 2005 (sample size 30) reports the average proportion of women employed in the university sector to be 52.2%. The percentage of female academic staff is reported at 40% and general staff 62.1%. The following benchmarking information is obtained from 2005 DEST data utilising headcount figures. For universities in a group, the number of staff has been averaged.
Percentage of
Female Academic
Staff
Percentage of Female
General Staff
Percentage of Females, Total
Staff
Percentage of Female
Academic Staff Level D
and above
All Australian Universities 40.1 62.7 53.0 21.5
ATN Universities 40.4 60.4 52.3 25.9
Adelaide University 34.6 64.3 50.9 14.1
Flinders University 48.0 69.2 60.6 29.5
University of SA 44.8 64.8 56.0 27.3
Annual Workforce Profile Report 2005-2006
41

Annual Workforce Profile Report 2005-2006
42
The Advancing the AVCC Action Plan for Women provides a cross-institution comparison based on DEST data. When examining 2005 DEST data for all 42 Australian universities (based on FTE figures), the following can be seen:
• UniSA ranks 14th for representation of women in general staff within the range of approximately 45% at the Australian Defence Force Academy (ADFA) in the ACT to 76% at the University of Notre Dame Australia in WA.
• UniSA ranks 12th for representation of women in academic staff within the range of approximately 58% at Batchelor Institute of Indigenous Tertiary Education in the Northern Territory, to 13% at the Australian Maritime College in Tasmania. In comparison to the ATN Universities, UniSA ranks first.
• UniSA ranks 14th for representation of women in senior academic staff (Level D and above) within the range of approximately 86% at Batchelor Institute of Indigenous Tertiary Education to zero at ADFA. In comparison to the ATN Universities, UniSA ranks third.

Annual Workforce Profile Report 2005-2006
43
6.4 COUNTRY OF BIRTH Description
Table 17 shows staff as a percentage of total staff (headcount) by country of birth. This indicator reflects the multicultural nature of UniSA’s workforce and assists in measuring the increase in cultural diversity of the workforce. This data is difficult to collect as not all staff complete or return the Staff Diversity Survey. No information has been collected for 34.8% of staff. Table 17: Staff as a Percentage by Country of Birth as at 31 March 2006
Country of Birth Percentage
Australia 42.8%
No information 34.8%
United Kingdom 9.4%
China 1.3%
India 0.8%
Malaysia 0.8%
New Zealand 0.8%
Italy 0.7%
USA 0.7%
Canada 0.6%
Netherlands 0.6%
Germany 0.6%
South Africa 0.5%
Other 5.5% Summary
The majority of UniSA staff (42.8%) were born in Australia, followed by the United Kingdom (9.4%). However, as no information is recorded for 34.8% of staff, the figures will be skewed to a significant extent. Note: 1% of staff numbers equates to approximately 23 staff. Other countries of birth disclosed by staff include Poland, Russia, Hong Kong, Vietnam, France, Singapore, Ireland, Denmark, Northern Ireland, Philippines, Spain, Ukraine, Bangladesh, Cambodia, Iran, Kenya, Romania, Sri Lanka, Bulgaria, Croatia, Ecuador, Fiji, Greece, Indonesia, Japan, Namibia, Papua New Guinea, Sweden, Switzerland, Taiwan, Tanzania, Yugoslavia, Algeria, Austria, Bosnia-Herzegovina, Chile, Czechoslovakia, Egypt, Finland, Ghana, Iraq, Latvia, Malta, South Korea, Thailand, Tonga, Turkey, United Arab Emirates, Uzbekistan, Venezuela, Zambia and Zimbabwe.

Annual Workforce Profile Report 2005-2006
44
Trend
2004 2005 2006
Non-Australian born 21.1% 22.1% 22.4%
The percentage of staff that was born outside Australia has increased slightly from 22.1% in 2005 to 22.4% in 2006. Benchmarking
Census data (2001) indicates that 21.1% of the South Australian population was born overseas (Australian Bureau of Statistics). The most common country of birth was the United Kingdom, followed by New Zealand, Italy and Vietnam. DEST data is unavailable for this indicator. In comparing the staff profile with the student profile, 57.6% of UniSA students (based on 2005 calendar year data) nominated Australia as their country of birth. Other countries represented include: Hong Kong (7.4%), China (5.8%), Malaysia (5.4%), Singapore (4%), India (3.9%) and United Kingdom (2.9%).
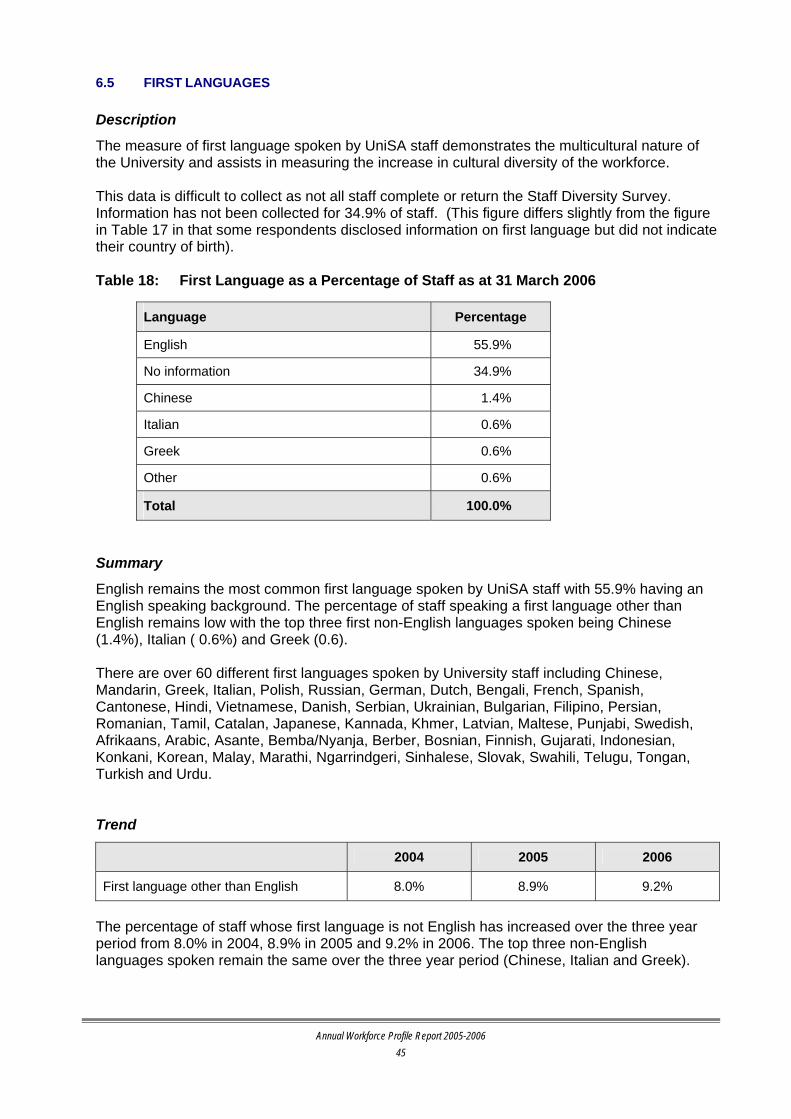
Annual Workforce Profile Report 2005-2006
45
6.5 FIRST LANGUAGES Description
The measure of first language spoken by UniSA staff demonstrates the multicultural nature of the University and assists in measuring the increase in cultural diversity of the workforce. This data is difficult to collect as not all staff complete or return the Staff Diversity Survey. Information has not been collected for 34.9% of staff. (This figure differs slightly from the figure in Table 17 in that some respondents disclosed information on first language but did not indicate their country of birth). Table 18: First Language as a Percentage of Staff as at 31 March 2006
Language Percentage
English 55.9%
No information 34.9%
Chinese 1.4%
Italian 0.6%
Greek 0.6%
Other 0.6%
Total 100.0%
Summary
English remains the most common first language spoken by UniSA staff with 55.9% having an English speaking background. The percentage of staff speaking a first language other than English remains low with the top three first non-English languages spoken being Chinese (1.4%), Italian ( 0.6%) and Greek (0.6). There are over 60 different first languages spoken by University staff including Chinese, Mandarin, Greek, Italian, Polish, Russian, German, Dutch, Bengali, French, Spanish, Cantonese, Hindi, Vietnamese, Danish, Serbian, Ukrainian, Bulgarian, Filipino, Persian, Romanian, Tamil, Catalan, Japanese, Kannada, Khmer, Latvian, Maltese, Punjabi, Swedish, Afrikaans, Arabic, Asante, Bemba/Nyanja, Berber, Bosnian, Finnish, Gujarati, Indonesian, Konkani, Korean, Malay, Marathi, Ngarrindgeri, Sinhalese, Slovak, Swahili, Telugu, Tongan, Turkish and Urdu. Trend
2004 2005 2006
First language other than English 8.0% 8.9% 9.2%
The percentage of staff whose first language is not English has increased over the three year period from 8.0% in 2004, 8.9% in 2005 and 9.2% in 2006. The top three non-English languages spoken remain the same over the three year period (Chinese, Italian and Greek).
Annual Workforce Profile Report 2005-2006
46
When compared with last year the increase can be partly explained by the increase in Indian dialects and African languages that are identified by UniSA staff as their first language. Benchmarking
Census data (2001) indicates that the percentage of South Australians who speak a language other than English at home was 16%, with the most common non-English languages being Italian (2%), Greek (2%), Cantonese (1%) and Vietnamese (1%) (Australian Bureau of Statistics). UniSA has a lower percentage with a total of 9.2% of staff nominating a language other than English as their first language. DEST data is unavailable for this indicator. In comparing the staff profile with the student profile, 63.7% of the UniSA student population speak English as their first language (based on 2005 calendar year data). The following languages are spoken as a proportion of the student population: Cantonese (8.0%),Chinese (6.5%), Mandarin (4.8%), Malay (1.9%), Vietnamese (1.6%), Hindi (0.8%) and Tamil (0.8%).

Annual Workforce Profile Report 2005-2006
47
6.6 DISABILITY Description
Table 19 shows the number of staff (headcount) with a disability who chose to disclose this information through the Staff Diversity Survey. This is also represented as a percentage of total staff. Table 19: Number of Staff who identified as having a disability as at 31 March 2006
Number of Staff who identified as
having a Disability Percentage of Staff
(headcount)
Total University 69 3.02%
Summary
The number of staff identified as having a disability is 69 (3.02%). Of the 69 only 15 required a workplace adjustment. In order to provide a culture that supports UniSA staff with disabilities, UniSA has undertaken several initiatives to provide a safe and inclusive working environment for staff with disabilities. These initiatives include:
• Maintaining the position Consultant: HR Services (Disability).
• Reviewing and establishing a staff-specific section of the Disability Action Plan and implementing associated strategies.
• Reviewing the University website and online environment in order to achieve an appropriate level of compliance with World Wide Web Consortium (W3C) Web Accessibility Guidelines.
A Disability Action Plan implemented during 2005 has instigated some change in evacuation procedures for staff with disabilities during non-emergency situations and improvements to the disability section of the UniSA website. An online accessibility working party also continues to review and improve the accessibility to the UniSA online environment. Currently UniSA hosts the Regional Disability Liaison Officer (RDLO) position on behalf of the three South Australian universities, a range of government departments and the TAFE sector. The Director: Human Resources chairs a statewide advisory committee for the RDLO initiative. UniSA also initiates employment of people with disabilities through its Youth Traineeship Scheme. Trend
Percentage of staff who identified as having a disability 2004 2005
2006
Percentage of Staff (headcount) 3.51% 3.23% 3.02%
The number of staff who identified as having a disability has decreased over the reporting period from 78 in 2004, 72 in 2005 and 69 in 2006. The decrease in the percentage of staff that identified as having a disability may be due to the decrease in staff completing the Staff Diversity Survey.
Annual Workforce Profile Report 2005-2006
48
Benchmarking
Australian Bureau of Statistics data (2001) indicates that 22.4% of the South Australian population has a disability. Analysing this data by age group, 9% of South Australians aged 15-34 years have a disability, 21% in the 35-64 age group and 52% for people aged over 65 years. South Australia has the highest disability rate in Australia which may be related to our ageing population. DEST data is unavailable for this indicator.

Annual Workforce Profile Report 2005-2006
49
7. STAFF QUALIFICATIONS 7.1 ACADEMIC STAFF QUALIFICATIONS Description
Table 20 shows academic staff highest completed qualification as a percentage of academic staff (headcount). Qualifications include doctorate, masters or other qualification for both continuing and fixed-term academic staff by Division and Portfolio. The Portfolios with academic staff are Portfolio: Academic and Portfolio: Research & Innovation. (The Portfolio Pro Vice Chancellors are included in Chancellery). The percentage of academic staff with a doctorate is a corporate KPI. The 2006 corporate KPI target is 48%. Table 20: Academic Staff Highest Qualification Completed as a Percentage of
Academic Staff by Division and Portfolio as at 31 March 2006
Division and Portfolio Doctorate Masters Other Not recorded
Division: Business 47.97% 31.76% 20.27% 0.00%
Division: Education, Arts & Social Sciences 45.40% 31.11% 23.49% 0.00%
Division: Health Sciences 43.11% 31.56% 24.89% 0.44%*
Division: Information Technology Engineering & the Environment 61.32% 17.45% 21.23% 0.00%
Chancellery 50.00% 50.00% 0.00% 0.00%
Portfolio: Academic 33.33% 41.67% 25.00% 0.00%
Portfolio: Organisational Strategy & Change 27.27% 59.09% 13.64% 0.00%
Portfolio: Research & Innovation 86.89% 6.56% 6.56% 0.00%
University-wide 50.45% 27.89% 21.56% 0.10%
* One staff member did not have Academic Qualifications in the South Australian Centre for Rural and Remote
Health (which falls in the Division of Health Sciences), however they have equivalent experience. Table 21 (over page) shows academic staff qualifications as a percentage of academic staff by level (headcount) highest completed qualification. Qualifications include doctorate, masters or other qualification for both continuing and fixed-term academic staff by academic staff level.

Annual Workforce Profile Report 2005-2006
50
Table 21: Academic Staff Highest Qualification Completed as a Percentage of Academic Staff by Academic Level as at 31 March 2006
Division and Portfolio Doctorate Masters Other Not recorded
Academic Staff (T&R) Level E 89.80% 8.16% 2.04% 0.00%
Academic Staff (T&R) Level D 87.67% 9.59% 2.74% 0.00%
Academic Staff (T&R) Level C 56.64% 32.52% 10.84% 0.00%
Academic Staff (T&R) Level B 27.65% 47.73% 24.62% 0.00%
Academic Staff (T&R) Level A 7.45% 29.79% 62.77% 0.00%
Academic Staff (Research) Level E 100.00% 0.00% 0.00% 0.00%
Academic Staff (Research) Level D 100.00% 0.00% 0.00% 0.00%
Academic Staff (Research) Level C 85.71% 11.43% 2.86% 0.00%
Academic Staff (Research) Level B 77.78% 3.70% 18.52% 0.00%
Academic Staff (Research) Level A 30.77% 15.38% 52.75% 1.10%
University-wide 50.45% 27.89% 21.56% 0.10%
Summary
As at 31 March 2006, 50.45% of academic staff held a doctoral qualification. This percentage is above the 2006 corporate KPI target of 48%. As at 31 March 2006, the highest percentage by academic level holding a doctoral qualification was 100% of Academic Research Level D and E, followed by Academic Level E (T&R) at 89.8% and Academic Level D (T&R) at 87.67%. Trend
2004 2005 2006
Doctorate qualification percentage of academic staff 42.9% 46.5% 50.5%
There has been a continual increase in the percentage of academic staff that holds a doctoral qualification over the three year period from 42.9% in 2004 to 46.5% in 2005 and 50.5% in 2006. All Divisions recorded an increase in staff holding doctoral qualifications over the three year reporting period. The greatest increase was in the Division of Education, Arts and Social Sciences with an increase from 33.5% in 2004 to 39.5% in 2005 to 45.4% in 2006. The steady increase in the percentage of academic staff that have completed a doctorate may be attributed to more academic staff completing doctorates and improved processes for capturing data at the local level and consistent recruitment practices of employing academic staff who have completed doctoral qualifications. Procedures have been developed for the appointment of academic staff who do not hold doctoral qualifications. These procedures provide for consideration to be given to candidates who are nearing completion of their PhD, or if the field of candidates is expected to be extremely limited due to the nature of the discipline, doctoral qualifications may not be required as an essential criterion.

Annual Workforce Profile Report 2005-2006
51
Following the endorsement by Senior Management Group in early 2005 of guidelines for academic staff for the commencement and completion of doctoral qualifications, the number of academic staff completing qualifications is expected to continue to increase.
Benchmarking
The Australian Universities HR Benchmarking Program for 2005 reported an overall average of 57.2% for doctoral qualifications held in 2005 (28 Universities were included in this sample). For ATN Universities the overall average result was 50.5% for doctoral qualifications held in 2005. The following benchmarking information is obtained from 2005 DEST data utilising information based on completion (headcount) of a doctorate by research or coursework. Percentage of Academic Staff completion
of a Doctorate by Research or Coursework
All Australian Universities 57.8%
ATN Universities 47.6%
Adelaide University 71.7%
Flinders University 59.9%
UniSA 48.3%
This data reveals that UniSA has a higher percentage of academic staff with doctoral qualifications than the average for the ATN Universities, but is lower when compared to the average of all Australian universities.
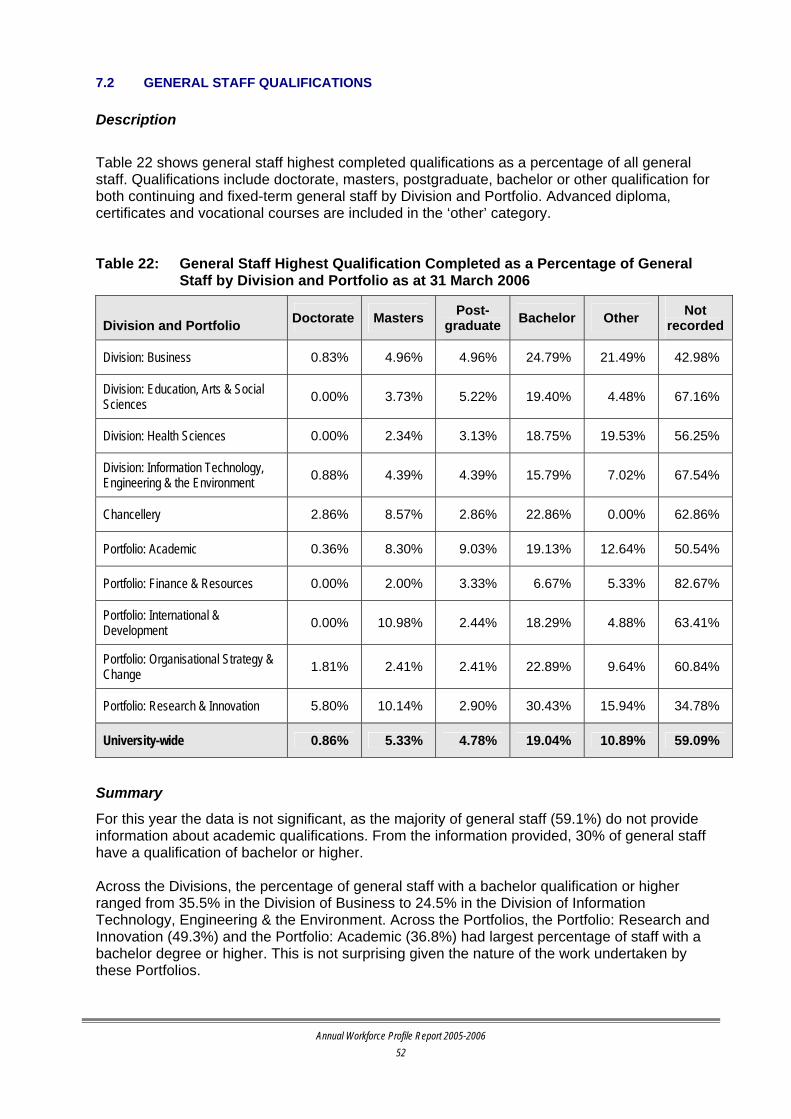
Annual Workforce Profile Report 2005-2006
52
7.2 GENERAL STAFF QUALIFICATIONS Description
Table 22 shows general staff highest completed qualifications as a percentage of all general staff. Qualifications include doctorate, masters, postgraduate, bachelor or other qualification for both continuing and fixed-term general staff by Division and Portfolio. Advanced diploma, certificates and vocational courses are included in the ‘other’ category. Table 22: General Staff Highest Qualification Completed as a Percentage of General
Staff by Division and Portfolio as at 31 March 2006
Division and Portfolio Doctorate Masters Post-graduate Bachelor Other Not
recorded
Division: Business 0.83% 4.96% 4.96% 24.79% 21.49% 42.98%
Division: Education, Arts & Social Sciences 0.00% 3.73% 5.22% 19.40% 4.48% 67.16%
Division: Health Sciences 0.00% 2.34% 3.13% 18.75% 19.53% 56.25%
Division: Information Technology, Engineering & the Environment 0.88% 4.39% 4.39% 15.79% 7.02% 67.54%
Chancellery 2.86% 8.57% 2.86% 22.86% 0.00% 62.86%
Portfolio: Academic 0.36% 8.30% 9.03% 19.13% 12.64% 50.54%
Portfolio: Finance & Resources 0.00% 2.00% 3.33% 6.67% 5.33% 82.67%
Portfolio: International & Development 0.00% 10.98% 2.44% 18.29% 4.88% 63.41%
Portfolio: Organisational Strategy & Change 1.81% 2.41% 2.41% 22.89% 9.64% 60.84%
Portfolio: Research & Innovation 5.80% 10.14% 2.90% 30.43% 15.94% 34.78%
University-wide 0.86% 5.33% 4.78% 19.04% 10.89% 59.09%
Summary
For this year the data is not significant, as the majority of general staff (59.1%) do not provide information about academic qualifications. From the information provided, 30% of general staff have a qualification of bachelor or higher. Across the Divisions, the percentage of general staff with a bachelor qualification or higher ranged from 35.5% in the Division of Business to 24.5% in the Division of Information Technology, Engineering & the Environment. Across the Portfolios, the Portfolio: Research and Innovation (49.3%) and the Portfolio: Academic (36.8%) had largest percentage of staff with a bachelor degree or higher. This is not surprising given the nature of the work undertaken by these Portfolios.
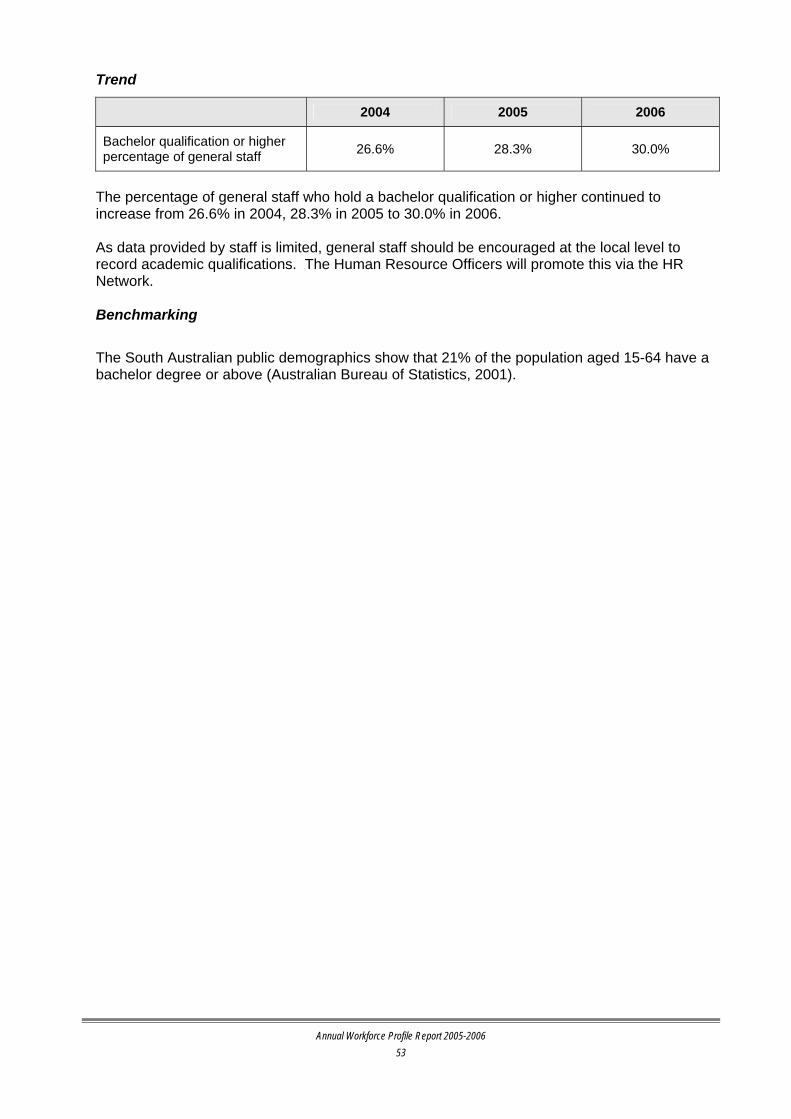
Annual Workforce Profile Report 2005-2006
53
Trend
2004 2005 2006
Bachelor qualification or higher percentage of general staff 26.6% 28.3% 30.0%
The percentage of general staff who hold a bachelor qualification or higher continued to increase from 26.6% in 2004, 28.3% in 2005 to 30.0% in 2006. As data provided by staff is limited, general staff should be encouraged at the local level to record academic qualifications. The Human Resource Officers will promote this via the HR Network. Benchmarking
The South Australian public demographics show that 21% of the population aged 15-64 have a bachelor degree or above (Australian Bureau of Statistics, 2001).

Annual Workforce Profile Report 2005-2006
54

Annual Workforce Profile Report 2005-2006
55
8. CAREER DEVELOPMENT
8.1 ACADEMIC PROMOTIONS Description
The mission of UniSA encapsulated in its positioning statement is ‘educating professionals, creating and applying knowledge and serving the community’. Academic promotion, at all levels, is based on the merit of the applicant’s contribution towards this mission as expressed through his/her role within the University. Academic promotion occurs once a year and is based on criteria outlined in the Academic Promotion Policy HR26. Table 23 shows the number of applications for promotion by gender and by the academic level applied for by the applicant. Table 23: Number of Applications Received for Academic Promotion for 2005 round
Total BUE EASS HSC ITEE OSC R&I
Male 5 - 2 1 - - 2 Level B
Female 5 1 1 1 - - 2 Male 12 3 2 1 4 - 2
Level C Female 10 1 5 2 2 - - Male 14 3 4 1 4 - 2
Level D Female 4 1 1 - 2 - - Male 5 - 2 1 1 1 -
Level E Female 2 - 1 - 1 - - Male 36 6 10 4 9 1 6
Total Female 21 3 8 3 5 - 2
University Total 57 9 18 7 14 1 8
Table 24 shows the number of successful promotions by gender and by the academic level applied for by the applicant. Table 24: Number of Successful Applications for Academic Promotion for 2005 round
Total BUE EASS HSC ITEE OSC R&I
Male 5 - 2 1 - - 2 Level B
Female 4 1 1 1 - - 1 Male 10 3 1 1 3 - 2
Level C Female 7 - 5 1 1 - - Male 8 1 3 1 2 - 1
Level D Female 1 - - - 1 - - Male 1 - - - - 1 -
Level E Female 1 - - - 1 - - Male 24 4 6 3 5 1 5
Total Female 13 1 6 2 3 - 1
University Total 37 5 12 5 8 1 6

Annual Workforce Profile Report 2005-2006
56
Table 25 shows the academic promotion rate and the academic application for promotion rate by all academic staff and by gender. The academic application for promotion rate is the rate of academic staff applying for academic staff promotion. It has been calculated with the following formula:
Number of academic staff applications for promotion A – D x 100% Academic staff headcount Academic Levels A – D For 2005 round of academic promotion, this formula equates to 57 applications for academic promotion divided by 908 academic staff headcount at Academic Levels A – D. The academic promotion rate is the rate of successful academic staff promotions. This index shows the rate of career progression for academic staff. It has been calculated with the following formula:
Number of academic staff promoted A – D x 100% Academic staff headcount Academic Levels A – D For 2005 round of academic promotion, this formula equates to 37 academic promotions divided by 908 academic staff headcount at Academic Levels A – D. Table 25: Academic Application for Promotion Rate and Academic Promotion Rate
for 2005 Round
Male Female All Academic Staff
Academic Application for Promotion Rate 7.8% 4.7% 6.3%
Academic Promotion Rate 5.2% 2.9% 4.1%
Summary
Fifty-seven academic staff applied for promotion in 2005: 21 women and 36 men. This represents a marked decrease from 2004, where 73 applications for academic promotion were received (28 women and 45 men). Thirty-seven staff were successful when applying for academic promotion for the 2005 round, comprising 13 women (35%) and 24 (65%) men. The highest number of academic staff applying for promotion in 2005 was in the Division of Education, Arts and Social Sciences with 31.5% of total applications (18 applications). The proportion of academic women applying for promotion for the 2005 round and consequently being successful is consistently lower on both counts when compared with academic men. As shown in Table 26 the academic application for promotion rate was 7.8% for men compared with 4.7% for women. The academic promotion rate for women was also lower at 2.9% compared with 5.2% for men.
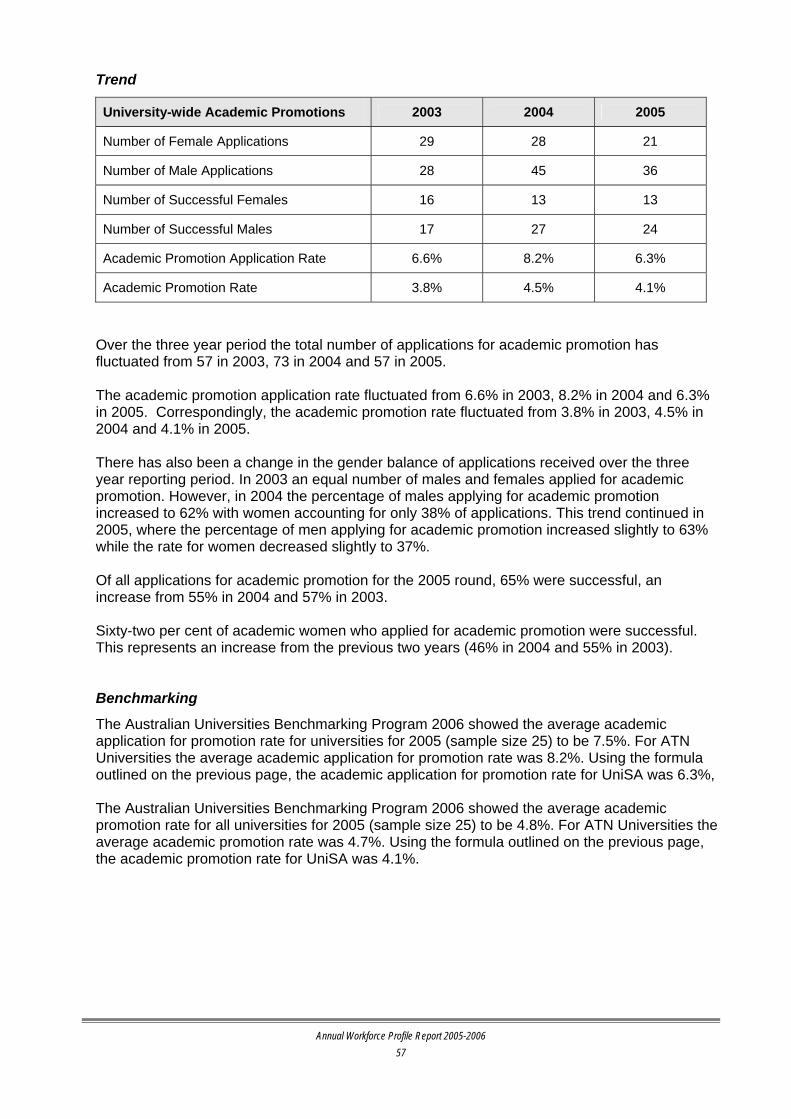
Annual Workforce Profile Report 2005-2006
57
Trend
University-wide Academic Promotions 2003 2004 2005
Number of Female Applications 29 28 21
Number of Male Applications 28 45 36
Number of Successful Females 16 13 13
Number of Successful Males 17 27 24
Academic Promotion Application Rate 6.6% 8.2% 6.3%
Academic Promotion Rate 3.8% 4.5% 4.1%
Over the three year period the total number of applications for academic promotion has fluctuated from 57 in 2003, 73 in 2004 and 57 in 2005. The academic promotion application rate fluctuated from 6.6% in 2003, 8.2% in 2004 and 6.3% in 2005. Correspondingly, the academic promotion rate fluctuated from 3.8% in 2003, 4.5% in 2004 and 4.1% in 2005. There has also been a change in the gender balance of applications received over the three year reporting period. In 2003 an equal number of males and females applied for academic promotion. However, in 2004 the percentage of males applying for academic promotion increased to 62% with women accounting for only 38% of applications. This trend continued in 2005, where the percentage of men applying for academic promotion increased slightly to 63% while the rate for women decreased slightly to 37%. Of all applications for academic promotion for the 2005 round, 65% were successful, an increase from 55% in 2004 and 57% in 2003. Sixty-two per cent of academic women who applied for academic promotion were successful. This represents an increase from the previous two years (46% in 2004 and 55% in 2003). Benchmarking
The Australian Universities Benchmarking Program 2006 showed the average academic application for promotion rate for universities for 2005 (sample size 25) to be 7.5%. For ATN Universities the average academic application for promotion rate was 8.2%. Using the formula outlined on the previous page, the academic application for promotion rate for UniSA was 6.3%, The Australian Universities Benchmarking Program 2006 showed the average academic promotion rate for all universities for 2005 (sample size 25) to be 4.8%. For ATN Universities the average academic promotion rate was 4.7%. Using the formula outlined on the previous page, the academic promotion rate for UniSA was 4.1%.

Annual Workforce Profile Report 2005-2006
58
8.2 GENERAL STAFF RECLASSIFICATIONS Description Reclassification is available to all general staff when there are significant changes to a position. During 2005 the Computer Aided Job Evaluation (CAJE) process was utilised to review positions submitted for reclassification. Table 26 shows the number of general staff reclassification applications received by substantive position, number of successful applications (classification level increased) and number of applications which resulted in the classification remaining the same. Table 27 shows applications for reclassification by Division and Portfolio for the period 1 April 2005 to 31 March 2006. Table 26: Number of Applications for Reclassification, 1 April 2005 to 31 March 2006
General Staff Level
Applications for Reclassifications by
Substantive Position
Classification level increased
Classification level remained the same
HEO1 - - -
HEO2 3 2 1
HEO3 3 3 -
HEO4 5 2 3
HEO5 5 2 3
HEO6 1 1 -
HEO7 3 2 1
HEO8 1 1 -
HEO9 - - -
HEO10 - - -
Total University 21 13 8 Table 27: Number of Applications for Reclassifications by Division and Portfolio,
1 April 2005 to 31 March 2006
Division and Portfolio No. of Reclassifications
Division: Business -
Division: Education, Arts & Social Sciences 7
Division: Health Sciences 5
Division: Information Technology, Engineering & the Environment 4
Chancellery -
Portfolio: Academic 1
Portfolio: Finance & Resources -
Portfolio: International & Development -
Portfolio: Organisational Strategy & Change 2
Portfolio: Research & Innovation 2
University-wide 21

Annual Workforce Profile Report 2005-2006
59
Summary
Of the 21 applications for reclassification, 62% resulted in an increase of classification level. Approximately 50% of applications received for reclassification were at Higher Education Officer (HEO) 4 and 5 (each with five applications). This is consistent with the proportion of general staff classified at these levels (23.6% at HEO4 and 17.6% at HEO5). The majority of applications were received from the Divisions, with the Division of Education, Arts and Social Sciences submitting seven applications, Health Sciences submitting five applications and four from the Division of Information Technology, Engineering and the Environment. The number of applications represents a relatively low percentage of general staff (21 applications, 1.6% of general staff headcount). Trend
Number of applications for reclassifications 2004 2005 2006
Total University 35 40 21
Percentage which resulted in an increase of classification level 74% 65% 62%
Over the three year period the number of applications for reclassification has fluctuated from 35 in 2004, 40 in 2005 and 21 in 2006. During 2005 a review of the CAJE classification tool system was undertaken. As a result it was agreed that the CAJE tool would no longer be used for reclassifying general staff positions. In March 2006 the Mercer CED Job Evaluation system was introduced for reclassification. Although the reclassification process has not changed, it has been streamlined with the introduction of a questionnaire which will replace the 35 page CAJE application. The new questionnaire has been designed to facilitate discussions between the staff member and their manager, assist in accurately describing the responsibility of the role and provide further information to evaluators to understand the nature and scope of the role. It is anticipated that the introduction of the new classification tool will result in an increase in applications for general staff classification.
Classification Linking
The University acknowledges that the duties and responsibilities of general staff positions may, in certain circumstances, extend beyond a single HEO classification level. The 2004 Academic and General Staff Enterprise Agreement provided for classification linking with the introduction of an 18 month trial. Classification linking provides the local area with the capacity to link classification levels for such positions and provides good career development opportunities for general staff. Classification linking guidelines were developed and the trial was put in place in late November 2005 for an 18 month period.

Annual Workforce Profile Report 2005-2006
60
8.3 HIGHER DUTIES OPPORTUNITIES FOR GENERAL STAFF Description
Higher duties allowances (HDA) are provided to general staff when they temporarily perform duties at a higher classification level. This indicator provides a measure of staff development opportunities available for general staff. Table 28 shows the number of higher duties opportunities by the classification level of the employees’ substantive position. Table 28: Number of Higher Duties Opportunities by Substantive Classification Level,
1 April 2005 to 31 March 2006
Number of HDA opportunities General Staff Substantive Classification
Female Male Total
HEO1 0 0 0 HEO2 3 0 3 HEO3 29 10 39 HEO4 108 23 131 HEO5 55 22 77 HEO6 34 22 56 HEO7 24 23 47 HEO8 10 18 28 HEO9 6 10 16 HEO10 & above 1 4 5
Grand Total 270 132 402
Table 29 shows the same information detailed by Division and Portfolio based on the area that provided the higher duties opportunity. Table 29: Number of Higher Duties Opportunities by Division and Portfolio,
1 April 2005 to 31 March 2006
Number of HDA opportunities Division and Portfolio
Female Male Total
Division: Business 54 13 67 Division: Education, Arts & Social Sciences 46 7 53 Division: Health Sciences 11 4 15 Division: Information Technology, Engineering & the Environment 18 4 22 Chancellery 11 4 15 Portfolio: Academic 36 20 56 Portfolio: Finance & Resources 28 6 34 Portfolio: International & Development 39 48 87 Portfolio: Organisational Strategy & Change 12 1 13 Portfolio: Research & Innovation 15 25 40
University-wide 270 132 402

Annual Workforce Profile Report 2005-2006
61
Summary
The highest number of opportunities for HDAs were for general staff at classification HEO4 (131). Sixty-seven per cent of higher duties opportunities were awarded to women, which is consistent with the percentage of women making up general staff numbers (67%). The Portfolio: International and Development had the highest number of general staff higher duties opportunities (87), which represented 21.6% of the total. Trend
Number of opportunities for higher duties 2004 2005
2006
Total University 363 406 402
There has been a slight decrease in the number of higher duties opportunities over the past year If each opportunity was spread equally across the University, in theory 31.5% of general staff (headcount) may have had an opportunity to undertake higher duties during this period.
Benchmarking
No data available.

Annual Workforce Profile Report 2005-2006
62
8.4 PROFESSIONAL EXPERIENCE PROGRAM Description
Professional Experience Program (PEP) for academic staff is intended to provide for a period of professional development to the mutual benefit of a staff member and the University. A member of the academic staff in the range Levels A – E is eligible to apply for PEP under the conditions of the Professional Experience Program Policy (HR-9.1). Table 30 shows the number of academic staff who accessed PEP during the period 1 April 2005 to 31 March 2006 by Division and Portfolio. This means that a staff member who commenced PEP leave prior to the 1 April 2005 but was still on PEP leave as at 1 April 2005 has been counted in this data. Table 30: Number of Academic Staff who Accessed Professional Experience Program
by Division and Portfolio, 1 April 2005 to 31 March 2006
Division and Portfolio Total
Division: Business 10
Division: Education, Arts & Social Sciences 33
Division: Health Sciences 8
Division: Information Technology, Engineering & the Environment 17
Portfolio: Academic 3
Portfolio: Research & Innovation 1
University-wide 72
Summary
Seventy-two academic staff (7.1% of total academic headcount) are recorded as accessing PEP leave during the reporting period, representing a low participation rate in the scheme. The highest number of academic staff accessing PEP leave was in the Division of Education, Arts and Social Sciences with 33 staff members (45.8% of total number accessing PEP leave). Trend
Number of academic staff accessing PEP leave 2005
2006
Total University 80 72
This is the second year of reporting on PEP leave, therefore data for 2004 is not included. The number of staff accessing PEP leave has decreased by 8 from last year. Benchmarking
No data available.

Annual Workforce Profile Report 2005-2006
63
8.5 STAFF STUDY SUPPORT Description
Staff Study Support is designed to assist staff in the successful completion of an approved program of study. All staff other than hourly paid staff and staff on a contract of less than 12 months, who are undertaking an approved program of study in addition to their normal duties are eligible to apply for study support under Staff Study Support Policy (HR 13-1). This indicator provides a measure of general staff undertaking further study, however provides only a ‘sense’ for academic staff as many academics receive payment for study from their local area. Table 31 shows the number of staff paid Staff Study Support in 2005 for study undertaken in 2004. Table 31: Number of Staff paid Staff Study Support by Division and Portfolio,
1 April 2005 to 31 March 2006
Number of Staff Study Support Division and Portfolio
Academic General Total
Division: Business 1 2 3 Division: Education, Arts & Social Sciences 2 7 9 Division: Health Sciences 3 5 8 Division: Information Technology, Engineering & the Environment 1 3 4 Chancellery 1 1 Portfolio: Academic 17 17 Portfolio: Finance & Resources 5 5 Portfolio: International & Development 4 4 Portfolio: Organisational Strategy & Change 6 6 Portfolio: Research & Innovation 1 1 University-wide 7 51 58
Summary
Fifty eight staff members (including both academic and general staff) are recorded as accessing staff study support during the reporting period. The majority of staff accessing the scheme were general staff (51) and represents only 4.0% of the total general staff headcount. The highest number of staff who received staff study support was in the Portfolio: Academic (17, 29.3% of applications) followed by the Division of Education, Arts and Social Sciences (9, 15.5%). Trend
Number of staff paid staff study support 2005 2006
Academic Staff 10 7 General Staff 58 51 Total University 68 58
Overall, there has been a decrease of 14.7% in the number of staff paid staff study support from 2005 to 2006. Benchmarking
No data available.

Annual Workforce Profile Report 2005-2006
64

Annual Workforce Profile Report 2005-2006
65
9. LEAVE 9.1 PLANNED AND UNPLANNED LEAVE Description
Unplanned leave is time absent from the University which includes sick leave, dependent child leave, carer’s leave, bereavement leave, emergency service leave, workers compensation leave and industrial action. Planned leave is time absent from the University which includes recreation leave and long service leave. The rate of planned and unplanned leave is shown as a percentage and is calculated as follows: FTE days Leave x 100%
Total Working Days (248) x average FTE Planned and unplanned leave rates are shown as a percentage of all working days and are shown by academic and general staff in Table 32. Table 32: Unplanned, Planned and Total Leave Annualised by Academic and General, 1
April 2005 to 31 March 2006
Academic Staff General Staff
Division and Portfolio Planned Working
Days
Unplanned Working
Days
Academic Staff
Total Leave Planned Working
Days
Unplanned Working
Days
General Staff
Total Leave
Division: Business 9.15% 1.24% 10.40% 8.54% 3.50% 12.03%
Division: Education, Arts & Social Sciences 9.63% 2.28% 11.92% 8.02% 3.92% 11.94%
Division: Health Sciences 9.40% 1.34% 10.75% 8.22% 3.02% 11.24%
Division: Information Technology, Engineering & the Environment 7.39% 0.68% 8.07% 7.85% 3.11% 10.96%
Chancellery 9.52% 0.22% 9.74% 8.79% 1.89% 10.68%
Portfolio: Academic 9.56% 3.50% 13.06% 10.69% 3.62% 14.31%
Portfolio: Finance & Resources N/A N/A N/A 9.96% 4.71% 14.67%
Portfolio: International & Development N/A N/A N/A 6.97% 2.23% 9.19%
Portfolio: Organisational Strategy & Change 2.29% 0.57% 2.86% 6.83% 2.40% 9.23%
Portfolio: Research & Innovation 6.95% 1.29% 8.24% 6.83% 2.74% 9.58%
Total University 8.69% 1.50% 10.19% 10.87% 3.33% 11.94%

Annual Workforce Profile Report 2005-2006
66
Table 33 shows the percentage of total unplanned and planned leave for all staff by Division and Portfolio. Table 33: Unplanned and Planned Leave Annualised by Division and Portfolio for all
Staff and Total University, 1 April 2005 to 31 March 2006
Division and Portfolio Planned Leave
Unplanned Leave
Total (days)
Division: Business 8.88% 2.25% 11.13%
Division: Education, Arts & Social Sciences 9.16% 2.77% 11.92%
Division: Health Sciences 8.96% 1.97% 10.93%
Division: Information Technology, Engineering & the Environment 7.55% 1.52% 9.07%
Chancellery 8.86% 1.73% 10.59%
Portfolio: Academic 10.60% 3.61% 14.21%
Portfolio: Finance & Resources 9.96% 4.71% 14.67%
Portfolio: International & Development 6.97% 2.23% 9.19%
Portfolio: Organisational Strategy & Change 6.28% 2.18% 8.47%
Portfolio: Research & Innovation 6.89% 2.03% 8.93%
Total University 8.65% 2.52% 11.17%
Summary
The unplanned leave rate (2.52%) means that on average staff members took 6.25 days off as unplanned days. Unplanned leave for general staff (3.33%, 8.26 average days) is higher than for academic staff (1.5%, 3.72 average days). The lower average days for academic staff may be a reflection of the difficulty in ensuring leave forms are completed. The total planned leave rate of 8.65% equates to approximately 21.5 days off per year for each staff member. Trend
2004 2005 2006
Planned Leave 8.01% 8.59% 8.65%
Unplanned Leave 2.15% 2.48% 2.52%
Total Leave 10.17% 11.07% 11.17%
The total leave rate increased marginally in the period 2005 to 2006 from 11.07% to 11.17% with a slight increase in both planned leave and unplanned leave. The increase in planned leave may indicate that staff are taking their leave entitlements on a more regular basis. The increase in unplanned leave may indicate staff are taking more sick days or carer’s leave. It may also indicate that staff are completing the appropriate leave forms

Annual Workforce Profile Report 2005-2006
67
as a result of the HRU’s continued commitment to ensure both academic and general staff complete leave forms as required by the Auditor General’s Department. Benchmarking For information purposes the following data is provided, however it is not a direct comparison to the data provided for UniSA. The Mercer HR data reports that for organisations with over 1000 employees the average number of sick days per staff FTE per year is 6.8 days including both paid and unpaid sick leave (Mercer Human Resources Effectiveness Monitor, September 2005). For all Australian industries the average sick leave days per employee has remained constant over the last two years at 5.4 days. Although the general trend over the last few years has seen an increase in sick leave, the data for the past two years would suggest that rates may be stabilising. This can be explained by the increase in the provision of flexible work arrangements and the trend that organisations do not place a cap on the number of unused sick leave days that can be accrued, therefore staff do not feel that they must “use it or lose it”. Over the period July 2004 to June 2005 the level of sick leave in the South Australian Public Sector (including leave for family caring purposes) was an average of 6.9 days per FTE. This represents a decrease from previous years (7.4 days in 2004 and 7.2 days in 2003).
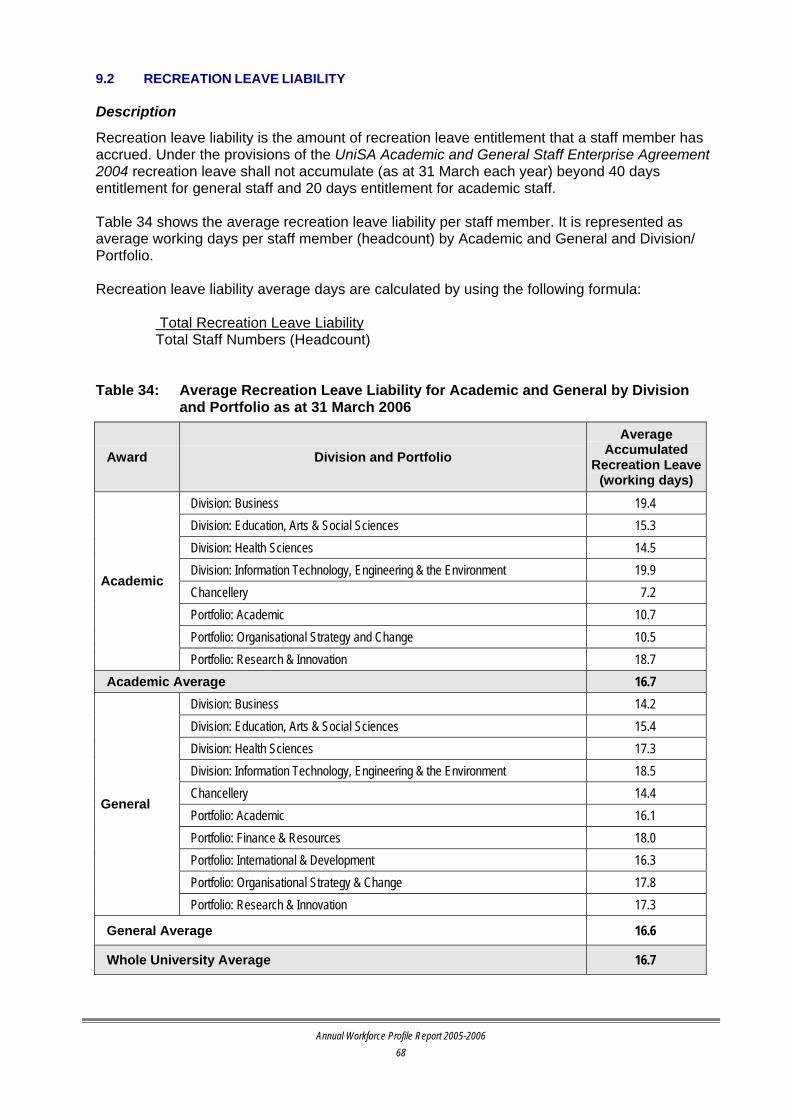
Annual Workforce Profile Report 2005-2006
68
9.2 RECREATION LEAVE LIABILITY Description
Recreation leave liability is the amount of recreation leave entitlement that a staff member has accrued. Under the provisions of the UniSA Academic and General Staff Enterprise Agreement 2004 recreation leave shall not accumulate (as at 31 March each year) beyond 40 days entitlement for general staff and 20 days entitlement for academic staff. Table 34 shows the average recreation leave liability per staff member. It is represented as average working days per staff member (headcount) by Academic and General and Division/ Portfolio. Recreation leave liability average days are calculated by using the following formula:
Total Recreation Leave Liability Total Staff Numbers (Headcount)
Table 34: Average Recreation Leave Liability for Academic and General by Division
and Portfolio as at 31 March 2006
Award Division and Portfolio Average
Accumulated Recreation Leave
(working days)
Division: Business 19.4 Division: Education, Arts & Social Sciences 15.3 Division: Health Sciences 14.5 Division: Information Technology, Engineering & the Environment 19.9 Chancellery 7.2 Portfolio: Academic 10.7 Portfolio: Organisational Strategy and Change 10.5
Academic
Portfolio: Research & Innovation 18.7 Academic Average 16.7
Division: Business 14.2 Division: Education, Arts & Social Sciences 15.4 Division: Health Sciences 17.3 Division: Information Technology, Engineering & the Environment 18.5 Chancellery 14.4 Portfolio: Academic 16.1 Portfolio: Finance & Resources 18.0 Portfolio: International & Development 16.3 Portfolio: Organisational Strategy & Change 17.8
General
Portfolio: Research & Innovation 17.3
General Average 16.6
Whole University Average 16.7

Annual Workforce Profile Report 2005-2006
69
Summary On average academic staff have a marginally higher recreation leave liability of 16.7 days per staff member when compared to general staff at 16.6 days. Trend
Average recreational leave liability 2004 2005 2006
Academic Average 16.7 17.7 16.7
General Average 16.5 17.1 16.6
Whole University Average 16.6 17.4 16.7
Average recreational leave liabilities for 2006 have decreased from the previous year and are now at the level they were in 2004. The University has a commitment to a safe and healthy work environment and acknowledges the important role that effective management of recreation leave plays in this regard. Hence staff members are encouraged to take their recreation leave as soon as possible in the year following its accrual and should not accumulate beyond entitlements. Managers are required to implement staff recreation leave plans in order to ensure the needs of the work group and individual are balanced. The HRU has developed procedures to assist managers regarding the management of excess recreation leave. Benchmarking
No data available.

Annual Workforce Profile Report 2005-2006
70
9.3 LONG SERVICE LEAVE LIABILITY Description
Long service leave liability is shown as average calendar days per staff member (headcount) by Academic and General and Division and Portfolio (Table 35). Long service leave liability is the amount of long service leave entitlement that a staff member has accrued. However, staff are not able to utilise long service leave until they have completed 7 years of continuous service. Therefore, staff with less than 7 years service record zero long service leave liability. The rate of accumulation of long service is 91 days for the first 10 years service and 9.1 days per year for subsequent years. General staff and ex-SACAE staff are entitled to accumulate 15 days for each year of service after completion of 15 years. Long service leave liability average days are calculated by using the following formula:
Long Service Leave Liability Total Staff Numbers (Headcount)
Table 35: Long Service Leave Liability Average Days for Academic and General by
Division and Portfolio as at 31 March 2006
Award Division and Portfolio Average Accumulated
Long Service Leave (Calendar days)
Academic Division: Business 61.4 Division: Education, Arts & Social Sciences 65.4
Division: Health Sciences 48.6 Division: Information Technology, Engineering & the Environment 54.8 Chancellery 93.8 Portfolio: Academic 54.2 Portfolio: Organisational Strategy & Change 23.1 Portfolio: Research & Innovation 40.2
Academic Average 56.3 General Division: Business 16.6
Division: Education, Arts & Social Sciences 46.5 Division: Health Sciences 45.0 Division: Information Technology, Engineering & the Environment 53.0 Chancellery 36.0 Portfolio: Academic 52.0 Portfolio: Finance & Resources 55.7 Portfolio: International & Development 25.7 Portfolio: Organisational Strategy & Change 45.5 Portfolio: Research & Innovation 44.7
General Average 44.5
Whole University Average 49.7

Annual Workforce Profile Report 2005-2006
71
Summary A large long service liability to the University represents a significant financial liability to the organisation. On average academic staff have a higher long service leave liability (56.3 calendar days per staff member) when compared to general staff, (44.5 calendar days). This correlates with academic staff having on average a greater length of service, hence more time to accrue long service leave. Trend
Long service liability average days 2004 2005 2006
Academic Average 58.6 55.6 56.3
General Average 46.1 46.9 44.5
Whole University Average 51.4 50.7 49.7
The average long service liability of all staff has decreased over the three year reporting period, from 51.4 days in 2004, 50.7 days in 2005 down to 49.7 days in 2006. The increase in applications from staff wishing to exercise their entitlement to payment in lieu of long service leave (Clause 68.3.5 of the Academic and General Staff Enterprise Agreement 2004) has helped in decreasing the liability. However as 20% of University staff are in the perceived retirement age of over 55 this liability needs to be monitored carefully. The HRU has provided advice that encourages all pre-separation contracts to include a clause seeking a commitment to use all or a portion of outstanding long service leave during the life of the contract. Benchmarking
No data available.
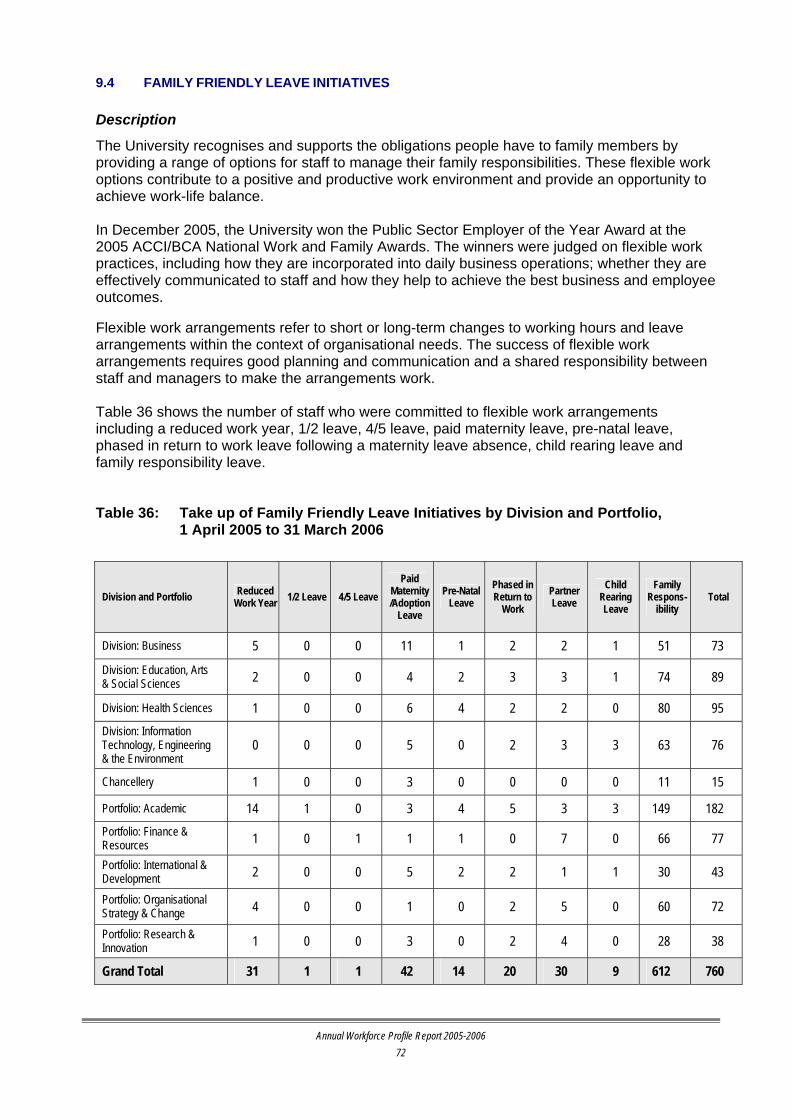
Annual Workforce Profile Report 2005-2006
72
9.4 FAMILY FRIENDLY LEAVE INITIATIVES Description
The University recognises and supports the obligations people have to family members by providing a range of options for staff to manage their family responsibilities. These flexible work options contribute to a positive and productive work environment and provide an opportunity to achieve work-life balance. In December 2005, the University won the Public Sector Employer of the Year Award at the 2005 ACCI/BCA National Work and Family Awards. The winners were judged on flexible work practices, including how they are incorporated into daily business operations; whether they are effectively communicated to staff and how they help to achieve the best business and employee outcomes. Flexible work arrangements refer to short or long-term changes to working hours and leave arrangements within the context of organisational needs. The success of flexible work arrangements requires good planning and communication and a shared responsibility between staff and managers to make the arrangements work. Table 36 shows the number of staff who were committed to flexible work arrangements including a reduced work year, 1/2 leave, 4/5 leave, paid maternity leave, pre-natal leave, phased in return to work leave following a maternity leave absence, child rearing leave and family responsibility leave. Table 36: Take up of Family Friendly Leave Initiatives by Division and Portfolio,
1 April 2005 to 31 March 2006
Division and Portfolio Reduced Work Year 1/2 Leave 4/5 Leave
Paid Maternity /Adoption
Leave
Pre-Natal Leave
Phased in Return to
Work Partner Leave
Child Rearing Leave
Family Respons-
ibility Total
Division: Business 5 0 0 11 1 2 2 1 51 73
Division: Education, Arts & Social Sciences 2 0 0 4 2 3 3 1 74 89
Division: Health Sciences 1 0 0 6 4 2 2 0 80 95 Division: Information Technology, Engineering & the Environment
0 0 0 5 0 2 3 3 63 76
Chancellery 1 0 0 3 0 0 0 0 11 15
Portfolio: Academic 14 1 0 3 4 5 3 3 149 182 Portfolio: Finance & Resources 1 0 1 1 1 0 7 0 66 77
Portfolio: International & Development 2 0 0 5 2 2 1 1 30 43
Portfolio: Organisational Strategy & Change 4 0 0 1 0 2 5 0 60 72
Portfolio: Research & Innovation 1 0 0 3 0 2 4 0 28 38
Grand Total 31 1 1 42 14 20 30 9 612 760

Annual Workforce Profile Report 2005-2006
73
A reduced work year is where a staff member receives additional unpaid leave within a twelve month period in return for a pro-rata reduction in their annual salary. The reduced salary is averaged over the year to allow the staff member to be paid during the extra period of leave. This includes 46/52, 47/52, 48/52, 49/52, 50/52 and 51/52 leave. 1/2 leave is an arrangement where a staff member can take 6 months or 12 months unpaid leave over a 1 to 2 year period and have the reduced salary spread over the 1 to 2 years. 4/5 leave allows staff to take 12 months unpaid leave and the reduction in salary is spread over the 5 years. Paid maternity leave is available at the rate of 16 weeks on full pay or 32 weeks half-pay. In addition staff members are entitled to 6 days pre-natal leave and phased-in return to work arrangements where a staff member returning from maternity leave may work a reduced fraction of 0.6 FTE for 8 weeks and will be paid at the full rate of pay. Partner leave of up to 10 days is available when associated with a partner’s pregnancy or adoption. Child rearing leave (unpaid) is available in addition to any other form of maternity/adoption leave for a period of 52 weeks for the purpose of caring for a pre-school age child. Summary
Whilst the take-up of these family-friendly leave arrangements has been very positive, it should be noted that this data represents each separate occasion family friendly initiatives were accessed. It may be that the same staff members accessed different initiatives, or the same initiative a number of times, i.e. family responsibility leave. The data shows that staff participated in family friendly initiatives on 760 occasions. Out of 41 staff recorded as utilising the reduced work year component of the program, 4 were male, while 190 male staff accessed family responsibility leave arrangements. Forty-two women took paid maternity leave, which represents 3.2% of female staff (excluding casuals). Trend
Take up of Family Friendly Initiatives in total 2004 2005
2006
University-wide 60 68 760
The trend data shows a very high increase in the take-up of family-friendly initiatives. This is due to limited reporting for the past two years. Family responsibility leave, partner leave, pre-natal leave and return-to work arrangements have been included for the first time in this report.
Benchmarking
No data available.

Annual Workforce Profile Report 2005-2006
74
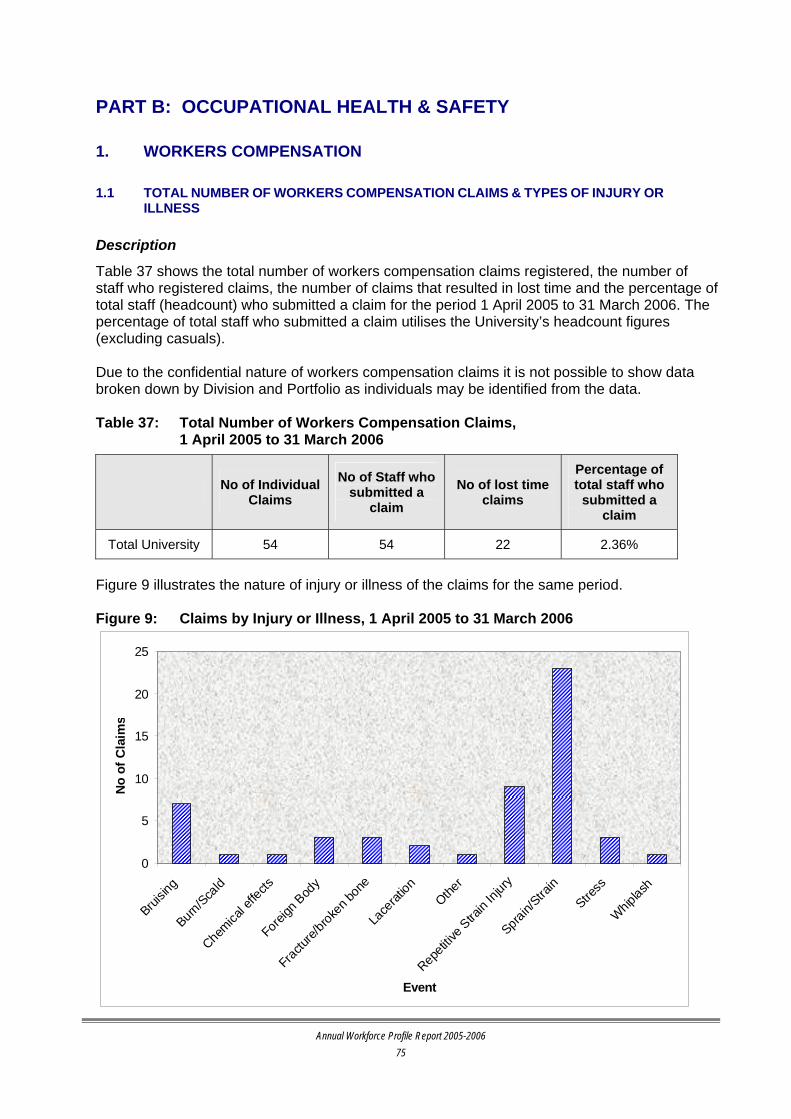
PART B: OCCUPATIONAL HEALTH & SAFETY 1. WORKERS COMPENSATION 1.1 TOTAL NUMBER OF WORKERS COMPENSATION CLAIMS & TYPES OF INJURY OR
ILLNESS Description
Table 37 shows the total number of workers compensation claims registered, the number of staff who registered claims, the number of claims that resulted in lost time and the percentage of total staff (headcount) who submitted a claim for the period 1 April 2005 to 31 March 2006. The percentage of total staff who submitted a claim utilises the University’s headcount figures (excluding casuals). Due to the confidential nature of workers compensation claims it is not possible to show data broken down by Division and Portfolio as individuals may be identified from the data. Table 37: Total Number of Workers Compensation Claims,
1 April 2005 to 31 March 2006
No of Individual Claims
No of Staff who submitted a
claim No of lost time
claims
Percentage of total staff who
submitted a claim
Total University 54 54 22 2.36%
Figure 9 illustrates the nature of injury or illness of the claims for the same period. Figure 9: Claims by Injury or Illness, 1 April 2005 to 31 March 2006
0
5
10
15
20
25
Bruisin
g
Burn/Sca
ld
Chemica
l effe
cts
Foreign
Body
Fractur
e/broke
n bon
e
Lace
ration
Other
Repeti
tive Stra
in Injur
y
Sprain/
Strain
Stress
Whiplas
h
Event
No
of C
laim
s
Annual Workforce Profile Report 2005-2006
75

Annual Workforce Profile Report 2005-2006
76
Definitions
Chemical effects – an injury to a person from exposure to chemical products over a period of time. Other Events - includes any injury that does not fall into the specified categories. Summary
There were a total of 54 workers compensation claims registered between 1 April 2005 and 31 March 2006. A total of 54 staff submitted a claim, which represents 2.36% of staff. The data indicates that the three major causes of injury or illness to staff for the reporting period were:
• sprain and strain from manual handling tasks (23 injuries), • repetitive movement from working at computer based workstations (9 injuries), and • bruising (7 injuries).
This information assists the University in identifying preventive strategies to reduce the risk of incidence across the organisation. These strategies include the further implementation of the OHSW online learning programs to increase knowledge and raise awareness of OHSW issues amongst staff, and the continued implementation of the WorkPace software program. This program provides ergonomic information, scheduled work pauses, compulsory rest breaks and relevant exercises. In addition OHSW Services have conducted a significant number of computer workstation assessments to reduce the risk of staff contracting occupational overuse injuries. It is anticipated that the continued implementation of these strategies will assist the University in reducing the injury rate. Trend
Total University 2004 2005 2006
Number of Individual Claims 55 56 54
This data indicates that the number of claims registered has decreased slightly from 56 in 2005 to 54 in 2006. The three major causes of injury/illness to staff over the three year period have remained relatively consistent as sprains/strains from manual handling tasks, repetitive movement and slips, trips and falls. Over the three year period, sprains and strain injuries from manual handling tasks have increased from 12 to 23, repetitive movement injuries have decreased from 14 to 9 and slips, trips and falls have decreased from 11 to 4. It is anticipated that the further implementation of the OHSW online learning programs, the WorkPace program, and an increase in the general awareness of staff should impact on injury experience. Benchmarking
No data available

Annual Workforce Profile Report 2005-2006
77
1.2 TOTAL NUMBER OF DAYS LOST Description
Table 38 shows the total number of days lost due to work related injuries that resulted in a workers compensation claim during the period 1 April 2005 to 31 March 2006. Table 38: Total Number of Days Lost Due to Workers Compensation Claims,
1 April 2005 to 31 March 2006
No of Days
Total University 382
Summary
382 days were lost due to 22 lost time workers compensation claims and represents an increase of 6 days for the same period in 2005 (1.6% increase). The increase in lost time days in the 2006 reporting period can be mainly attributed to one claim that was lodged for a stress related illness that has to date resulted in 183 days lost time. This claim represents 48% of the total days lost for the reporting period. Trend
Total Number of Days Lost due to Workers Compensation Claims
2004 2005 2006
Total University 351 376 382
Benchmarking
Refer to benchmarking data under 1.4 Incidence Rate, 1.5 Frequency Rate and 1.6 Average Time Lost Rate.

Annual Workforce Profile Report 2005-2006
78
1.3 TOTAL COST OF CLAIMS Description
The total cost of claims registered across the University for the reporting period 1 April 2005 to 31 March 2006 is shown in Table 39. Table 39: Total Cost of Workers Compensation Claims, 1 April 2005 to 31 March 2006
Total Cost
Total University $143,911
Summary
The total cost of workers compensation claims registered for the reporting period is $143,911. A significant proportion of this cost is due to four claims lodged during the reporting period. These four claims to date have contributed to $74,830 of the total cost for claims. The cost of these four claims to date represents 52% of the total cost to injuries/illnesses registered in the reporting period. Trend
Total Cost of Claims 2004 2005 2006
Total University $105,850 $125,247 $143,911
The total cost of claims over the period has increased by $18,664 representing a 14.9% increase in costs. The main types of injuries that have attributed to the greatest amount in the total cost during the reporting period are stress, repetitive strain injuries and manual handling. Benchmarking
No data available.

Annual Workforce Profile Report 2005-2006
79
1.4 INCIDENCE RATE Description
The average time lost rate shown in Table 40 is the average time lost per incident of injury/illness for the reporting period. This average time lost rate provides a measure of the severity of incidents being experienced by the University. The incidence rate is calculated as: Number of Incidents in the Period x 100 Number of Staff (Headcount, excluding casuals) The ‘number of incidences in the period’ refers to all cases of lost-time injury/illness which were recorded in the period. Table 40: Incidence Rate, 1 April 2005 to 31 March 2006
Incidence Rate
Total University 0.96
Summary
The data indicates that there is marginally less than one workers compensation claim for every 100 staff members. The goal of the University through OHSW Services will be to further improve this incidence rate during the next reporting period.
Trend
Incidence Rate 2004 2005 2006
Total University 0.99 0.99 0.96
There has been a minor decrease in the incidence rate over the three year period. This indicates that the number of incidents involving lost time injury/illness has not changed in real terms in relation to the total number of staff. The University’s stabilized performance may be attributed to continuous improvement in OHS&W practices across the University and the increased awareness of staff by completing a range of online OHS&W learning programs. Benchmarking
The Mercer Human Resources Effectiveness Monitor 2005 reports the average lost time occurrence incidence rate for organisations with more than 1000 staff as 1.6. The Australian Universities HR Benchmarking Program reports incidence rate of 0.92%, using a sample of 21 Universities.

Annual Workforce Profile Report 2005-2006
80
1.5 FREQUENCY RATE Description
The frequency rate shown in Table 41 is the number of incidents of injury/illness for each one million hours worked. The frequency rate is calculated as: Number of Incidents in the Period x 1,000,000 Number of Hours Worked in the Period The ‘number of incidents in the period’ refers to all cases of lost-time injury/illness which were recorded in the period. The ‘number of hours worked in the period’ refers to the total number of hours worked by all staff in the University. Table 41: Frequency Rate, 1 April 2005 to 31 March 2006
Frequency Rate
Total University 5.3
Summary
This data indicates that just over 5.3 workers compensation claims occur for each one million hours worked. The goal of the University is to achieve a further 5% reduction in the frequency rate of claims over the next reporting period.
Trend
Frequency Rate 2004 2005 2006
Total University 5.07 5.06 5.3
The frequency rate has increased slightly since 2005. Benchmarking
The Mercer Human Resources Effectiveness Monitor 2005 reports the lost time occurrence frequency rate for organisations with more than 1000 staff as 45.7 and all Australian industries as 36.3 (this includes manufacturing industries). The University data of 5.3 shows that the incidence rate is significantly lower than the average.

Annual Workforce Profile Report 2005-2006
81
1.6 AVERAGE TIME LOST RATE Description
The average time lost rate shown in Table 42 is the average time lost per incident of injury/illness. For the purposes of this calculation an upper limit of 12 months of work is assigned. This rate provides a measure of the severity of the incidents being experienced by the University. The average time lost rate is calculated as: Number of Working Days Lost Number of lost time OH&S Incidents in the Period The ‘number of working days lost’ refers to the total number of working days, irrespective of the number of hours that would normally have been worked each day, that were lost as a result of the injury/illness. Table 42: Average Time Lost Rate, 1 April 2005 to 31 March 2006
Average Time Lost
Rate (days)
Total University 17.36
Summary
The data indicates that each accepted lost time claim recorded, resulted in an average of 17.36 days lost time. This represents an overall increase of 1.6% when compared to 2005. The goal of the University is to decrease the average time lost per workers compensation claim to less than 16 lost time days during the next reporting period. The average time lost of over 17 days per claim is largely due to 5 claims that were registered in the reporting period, which so far have contributed to 311 lost time days. Evaluating the average time lost rate excluding these claims, results in an average time lost rate of 4.17 days. Trend
Average Time Lost Rate (days) 2004 2005 2006
Total University 15.9 17.09 17.36
There has been an increase in the average time lost rate over the reporting period. This indicates that the average time lost for all workers compensation claims has risen slightly in real terms. Benchmarking
The Mercer Human Resources Effectiveness Monitor 2005 reports the average lost time rate for organisations with more than 1000 staff as 15.6 days and the all Australian industries (includes manufacturing industries) average is 15.7 days. The Australian Universities HR Benchmarking Program reports the 2005 average time lost rate, using a sample of 20 Universities, to be 22 days.

Annual Workforce Profile Report 2005-2006
82
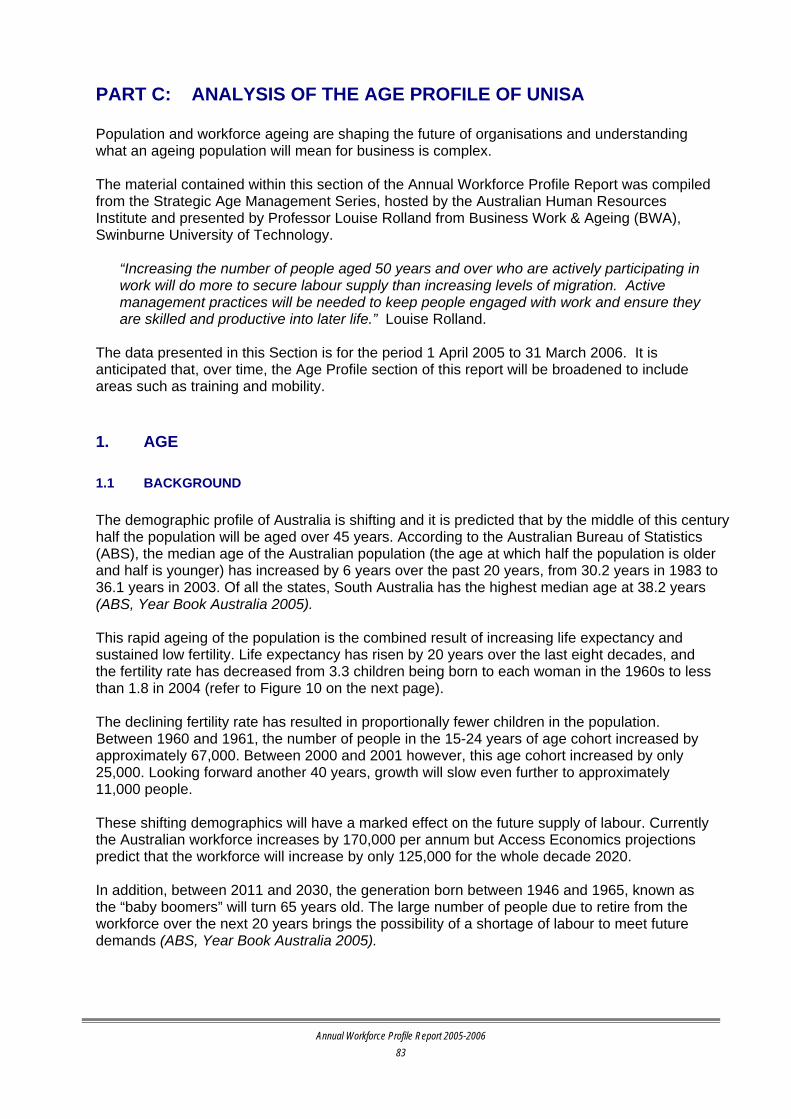
Annual Workforce Profile Report 2005-2006
83
PART C: ANALYSIS OF THE AGE PROFILE OF UNISA Population and workforce ageing are shaping the future of organisations and understanding what an ageing population will mean for business is complex. The material contained within this section of the Annual Workforce Profile Report was compiled from the Strategic Age Management Series, hosted by the Australian Human Resources Institute and presented by Professor Louise Rolland from Business Work & Ageing (BWA), Swinburne University of Technology.
“Increasing the number of people aged 50 years and over who are actively participating in work will do more to secure labour supply than increasing levels of migration. Active management practices will be needed to keep people engaged with work and ensure they are skilled and productive into later life.” Louise Rolland.
The data presented in this Section is for the period 1 April 2005 to 31 March 2006. It is anticipated that, over time, the Age Profile section of this report will be broadened to include areas such as training and mobility. 1. AGE 1.1 BACKGROUND The demographic profile of Australia is shifting and it is predicted that by the middle of this century half the population will be aged over 45 years. According to the Australian Bureau of Statistics (ABS), the median age of the Australian population (the age at which half the population is older and half is younger) has increased by 6 years over the past 20 years, from 30.2 years in 1983 to 36.1 years in 2003. Of all the states, South Australia has the highest median age at 38.2 years (ABS, Year Book Australia 2005). This rapid ageing of the population is the combined result of increasing life expectancy and sustained low fertility. Life expectancy has risen by 20 years over the last eight decades, and the fertility rate has decreased from 3.3 children being born to each woman in the 1960s to less than 1.8 in 2004 (refer to Figure 10 on the next page). The declining fertility rate has resulted in proportionally fewer children in the population. Between 1960 and 1961, the number of people in the 15-24 years of age cohort increased by approximately 67,000. Between 2000 and 2001 however, this age cohort increased by only 25,000. Looking forward another 40 years, growth will slow even further to approximately 11,000 people. These shifting demographics will have a marked effect on the future supply of labour. Currently the Australian workforce increases by 170,000 per annum but Access Economics projections predict that the workforce will increase by only 125,000 for the whole decade 2020. In addition, between 2011 and 2030, the generation born between 1946 and 1965, known as the “baby boomers” will turn 65 years old. The large number of people due to retire from the workforce over the next 20 years brings the possibility of a shortage of labour to meet future demands (ABS, Year Book Australia 2005).

These figures form a backdrop to the unprecedented ageing of the workforce, where for every new young person entering the labour market today, there are seven people aged 45 and over available. As Australia’s population continues to age, organisations will be forced to embrace older workers and to consider the impact of ageing on their products and services if they are to secure a continuing supply of skilled labour and profit from the opportunities presented by major changes in consumer needs and demands. Figure 10: Total Fertility Rate
Annual Workforce Profile Report 2005-2006
84

Annual Workforce Profile Report 2005-2006
85
1.2 UNISA’S AGE PROFILE According to the ABS, the education industry employs the highest proportion of mature age workers, with 47% of people employed in this industry aged 45-64 years (ABS, Year Book Australia 2005). UniSA’s age profile is consistent with this finding, which is not surprising given that a large proportion of staff are employed in academic teaching and would tend to be in the over 45 years age brackets. The median age of UniSA staff is 46 years, with a slight difference between males and females (47 and 45 years respectively). Academic staff have a higher median age (49 years) than general staff (42 years). There is a slight gender difference in the median age of male and female general staff (43 and 41 years respectively) and a slight difference exists between male and female academics (50 and 48 years respectively). Table 43: Median Age of General and Academic Staff by Gender as at 31 March 2006
Median Age
Male Female Uni-Wide
Academic 50 48 49
General 43 41 42
University-wide 47 45 46
As shown in Table 44 (over page), the highest proportion of UniSA staff are in the 45-54 age group (29.9%), followed closely by the 35-44 age group (28.0%). The proportion of UniSA’s workforce in the 35 years and older age group (78.1%) is slightly higher than the average for all Australian universities (76.6%) and significantly higher than for all industries as a whole. Fifty-eight per cent of all academic staff are in the 45 years and over age categories, compared with 40% of general staff. With the changing face of the labour market, i.e. for every young person entering the labour market today, there are seven people aged 45 years and over, the University could focus on attracting and retaining staff in the 45 years and over age category in order to address the labour market shortage UniSA has family friendly and flexible work arrangements which are attractive to this age group and should assist in retaining them in the workforce. UniSA was recently recognised for its family friendly and flexible work environment by winning the national gold award as Public Sector Employer of the Year at the 2005 Australian Council of Commerce and Industry and Business Council of Australia National Work and Family Awards. However, better promotion of these benefits will also assist in attracting the age groups that comprise the largest resource pool in the employment market. Access to candidates within this age group will become more and more competitive, particularly in the tertiary sector.

Annual Workforce Profile Report 2005-2006
86
Table 44: Age of Staff Compared to Australian Population and Broader Workforce
Percentage of staff in each age group Persons
15 - 24 25 - 34 35 - 44 45 - 54 55+
Division: Business 5.9% 20.4% 27.5% 26.0% 20.1% Division: Education, Arts & Social Sciences 2.2% 11.6% 22.9% 34.3% 29.0% Division: Health Sciences 4.5% 17.6% 29.2% 31.2% 17.6% Division: Information Technology, Engineering & the Environment 3.1% 17.2% 26.7% 27.6% 25.5% Chancellery 5.1% 28.2% 23.1% 25.6% 17.9% Portfolio: Academic 2.3% 17.9% 31.6% 32.9% 15.3% Portfolio: Finance & Resources 1.3% 20.0% 34.0% 30.7% 14.0% Portfolio: International & Development 7.3% 34.1% 25.6% 24.4% 8.5% Portfolio: Organisational Strategy & Change 5.9% 19.7% 28.7% 28.2% 17.6% Portfolio: Research & Innovation 0.8% 27.7% 33.1% 24.6% 13.8%
Total UniSA 3.5% 18.4% 28.0% 29.9% 20.2%
Australian Universities 3.2% 20.1% 26.8% 30.4% 19.4%
All Industries 16.8% 23.5% 25.4% 22.5% 11.7%
Current Population Age Profile for Australia 18.5% 19.5% 19.7% 17.2% 25.1% * Australian Bureau of Statistics population projections Trend
University 2003 2004 2005
Academic Median Age 48 48 49
General Median Age 42 42 42
University-wide Median Age 44 45 46
The median age of the University’s academic workforce has increased slightly over the past year to 49 years and the median age of the general staff workforce has remained constant at 42 years.

1.3 AGE AND GENDER Background Over the last 20 years, the overall labour force participation rate in Australia has increased from 60.5% in 1983-84 to 63.5% in 2003-04. This has been driven by the increased labour force participation rate for women, which has risen from 45.0% in 1983-84 to 55.6% in 2003-04 (ABS, Year Book Australia 2005). The increase in participation reflects a range of social changes, including the greater acceptance of and more opportunities for women in the workforce. Figure 11 illustrates the increased participation rate for women in the workforce, particularly in the 25 years and over age groups. There has been a marked increase in participation in the 25.34 age group, however the largest increase has been in the 45-54 and the 55-59 age groups, suggesting that many women re-enter the workforce when their children have grown up. Figure 11: Labour Force Participation by Women, 1983-84 and 2003-04 Compared
Compared to other OECD countries Australia has had one of the more highly segregated labour forces. In 1998 approximately half of female staff in their main job worked in the clerical, sales and service groups of occupations, and substantially outnumbered men in these areas. In contrast, the trades, production and transport occupations, including labourers (which covered 47% of male staff) were largely dominated by men. Less than one quarter of managers and administrators were women. (ABS, Australian Social Trends 1998, Paid Work: Trends in Women's Employment).
Annual Workforce Profile Report 2005-2006
87
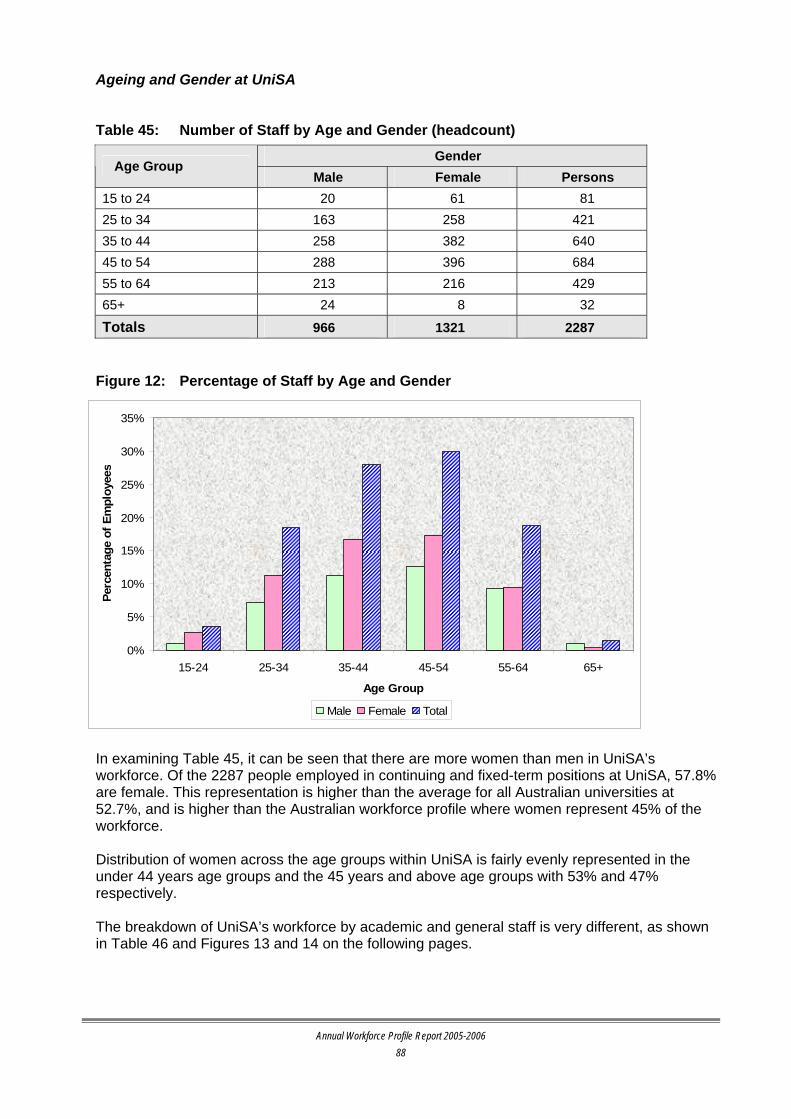
Ageing and Gender at UniSA Table 45: Number of Staff by Age and Gender (headcount)
Gender Age Group
Male Female Persons 15 to 24 20 61 81 25 to 34 163 258 421 35 to 44 258 382 640 45 to 54 288 396 684 55 to 64 213 216 429 65+ 24 8 32
Totals 966 1321 2287 Figure 12: Percentage of Staff by Age and Gender
0%
5%
10%
15%
20%
25%
30%
35%
15-24 25-34 35-44 45-54 55-64 65+
Age Group
Perc
enta
ge o
f Em
ploy
ees
Male Female Total
In examining Table 45, it can be seen that there are more women than men in UniSA’s workforce. Of the 2287 people employed in continuing and fixed-term positions at UniSA, 57.8% are female. This representation is higher than the average for all Australian universities at 52.7%, and is higher than the Australian workforce profile where women represent 45% of the workforce. Distribution of women across the age groups within UniSA is fairly evenly represented in the under 44 years age groups and the 45 years and above age groups with 53% and 47% respectively. The breakdown of UniSA’s workforce by academic and general staff is very different, as shown in Table 46 and Figures 13 and 14 on the following pages.
Annual Workforce Profile Report 2005-2006
88
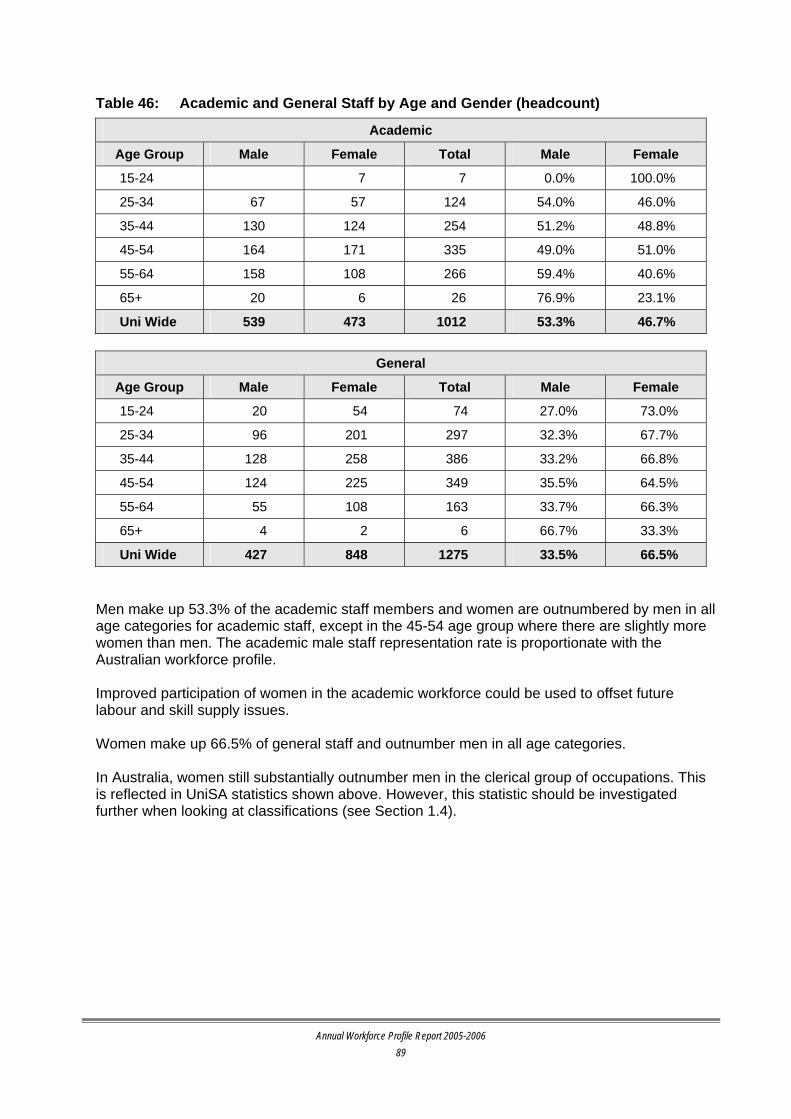
Annual Workforce Profile Report 2005-2006
89
Table 46: Academic and General Staff by Age and Gender (headcount)
Academic
Age Group Male Female Total Male Female
15-24 7 7 0.0% 100.0%
25-34 67 57 124 54.0% 46.0%
35-44 130 124 254 51.2% 48.8%
45-54 164 171 335 49.0% 51.0%
55-64 158 108 266 59.4% 40.6%
65+ 20 6 26 76.9% 23.1%
Uni Wide 539 473 1012 53.3% 46.7%
General
Age Group Male Female Total Male Female
15-24 20 54 74 27.0% 73.0%
25-34 96 201 297 32.3% 67.7%
35-44 128 258 386 33.2% 66.8%
45-54 124 225 349 35.5% 64.5%
55-64 55 108 163 33.7% 66.3%
65+ 4 2 6 66.7% 33.3%
Uni Wide 427 848 1275 33.5% 66.5% Men make up 53.3% of the academic staff members and women are outnumbered by men in all age categories for academic staff, except in the 45-54 age group where there are slightly more women than men. The academic male staff representation rate is proportionate with the Australian workforce profile. Improved participation of women in the academic workforce could be used to offset future labour and skill supply issues. Women make up 66.5% of general staff and outnumber men in all age categories. In Australia, women still substantially outnumber men in the clerical group of occupations. This is reflected in UniSA statistics shown above. However, this statistic should be investigated further when looking at classifications (see Section 1.4).
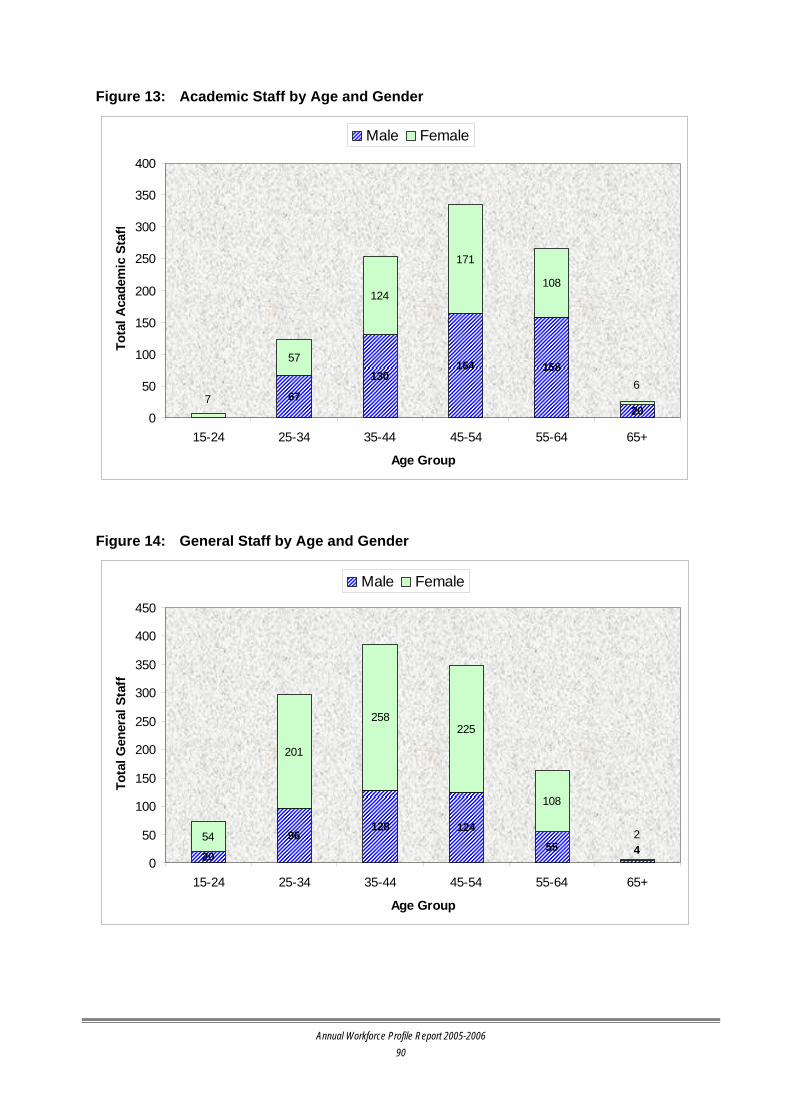
Figure 13: Academic Staff by Age and Gender
67
130164 158
20
57
124
171
108
67
0
50
100
150
200
250
300
350
400
15-24 25-34 35-44 45-54 55-64 65+
Age Group
Tota
l Aca
dem
ic S
taff
Male Female
Figure 14: General Staff by Age and Gender
20
96128 124
5554
201
258225
108
42
0
50
100
150
200
250
300
350
400
450
15-24 25-34 35-44 45-54 55-64 65+
Age Group
Tota
l Gen
eral
Sta
ff
Male Female
Annual Workforce Profile Report 2005-2006
90

Annual Workforce Profile Report 2005-2006
91
1.4 CLASSIFICATION Background The requirements of the Australian workforce have undergone a fundamental change in recent decades. Demand for low and semi-skilled workers has declined as a result of both technological advancement and the professionalisation of occupations that are increasingly seeking staff with improved skill sets. Yet, gender and age continue to determine the occupational field of staff. Men dominate management positions, with older staff (over 45 years) more likely to take on generalist management roles (48%), and younger employees (under 45 years) more likely to take on supervisory and specialist roles (45% and 42% respectively). Women dominate intermediate to elementary service, sales and clerical roles, with 97% of all secretaries and personal assistants and 70% of intermediate service workers being female. A large proportion of older women (over 45 years) are in intermediate to advanced clerical and service work positions, while younger women are more likely to be in elementary to intermediate positions (ABS Labour Force Survey, August Quarter 2003). Ageing and Classification at UniSA In the following tables and figures senior management is defined as members of the Senior Management Group (SMG), Unit Directors, Division Managers and Directors of Research Institutes. Table 47: Classification by Age of Staff (headcount)
Age Group Classification Level
15 to 24 25 to 34 35 to 44 45 to 54 55 to 64 65+ Total
Senior Management 1 11 28 16 56
Academic Level E 10 28 39 7 84
Academic Level D 16 32 35 1 84
Academic Level C 9 72 124 105 11 321
Academic Level B 48 91 106 68 6 319
Academic Level A 7 67 64 36 10 1 185
HE10 1 1
HE09 6 14 21 11 52
HE08 22 36 37 18 113
HE07 39 55 50 18 1 163
HE06 9 57 67 45 16 1 195
HE05 8 65 68 57 28 1 227
HE04 31 79 87 71 36 3 307
HE03 13 26 49 45 26 159
HE02 4 1 4 2 11
HE01 1 1
Trainee 9 9
Totals 81 421 640 684 429 32 2287

Figure 15: Percentage of Staff by Age and Classification
0%
10%
20%
30%
40%
50%
60%
70%
80%
90%
100%
Senior
Man
agem
ent
Acade
mic Le
vel E
Acade
mic Le
vel D
Acade
mic Le
vel C
Acade
mic Le
vel B
Acade
mic Le
vel A
HE10HE09HE08HE07HE06HE05HE04HE03HE02HE01
Train
ee
15-24 25-34 35-44 45-54 55-64 65+
Senior management positions are predominantly held by individuals in the 45 to 64 age brackets with a small percentage below 35. Staff in the 15 to 24 age bracket are predominately at the more junior levels with a small percentage of representation at academic level A and HE06. It is interesting to note that the 25 to 34 age group is represented in all classification categories except the more senior academic levels D and E and HEO10. The 35 to 44 age group is represented at all levels from HE03 upward, except for HEO10. Analysis of this data presents no particular implications for UniSA.
Annual Workforce Profile Report 2005-2006
92

1.5 DIVISION AND PORTFOLIO Background So far this report has looked at data at the organisational level only. The next section breaks down the structure of age by Division and Portfolio. This provides a high level view of the variability of the distribution of age compared to the University’s workforce, the broader workforce and the Australian population. The Division/Portfolio view is important as age-related trends are likely to alter across Division and Portfolio, requiring different strategies to address the divergence of priorities. Data will need careful consideration at the local level, particularly if there are small numbers represented. Future reports will endeavour to break down these statistics by Research Institutes and Units. Ageing and Division/Portfolio at UniSA Table 48: Age by Division/Portfolio
Age Group Business EASS Health
Sciences ITEE Chanc Academic Fin & Res
Int & Dev OSC Research
& Inn Total
15-24 16 10 16 10 2 7 2 6 11 1 81
25-34 55 52 62 56 11 54 30 28 37 36 421
35-44 74 103 103 87 9 95 51 21 54 43 640
45-54 70 154 110 90 10 99 46 20 53 32 684
55-64 47 116 62 75 7 46 19 7 32 18 429
65+ 7 14 8 2 1 32
Total 269 449 353 326 39 301 150 82 188 130 2287
Figure 16: Percentage of Staff by Age and Division/Portfolio
0%
5%
10%
15%
20%
25%
30%
35%
40%
BUE EAS HSC IEE CHA ALS RES INO OSC R&I
Prop
ortio
n of
Wor
kfor
ce
15-24 25-34 35-44 45-54 55-64
Annual Workforce Profile Report 2005-2006
93

Annual Workforce Profile Report 2005-2006
94
Overall the Division of Education, Arts & Social Sciences (EASS) has the largest proportion of staff in the 45 years and over age categories and the least in the under 35 years age categories. The Division also has the greatest “years of service” amongst its staff which would attribute to the older profile. Not surprisingly, the Portfolio: International and Development which incorporates the Marketing Development Unit has the highest percentage of staff under the age of 35.

Annual Workforce Profile Report 2005-2006
95
2. RECRUITMENT 2.1 BACKGROUND In Australia, literature suggests that the recruitment process is the most overt point in employment for ‘age discrimination’ to occur (Vic, SA and WA, 2001; Bennington, 2001). Work by Reark Research (1994) indicates that recruitment decisions are made at two levels. Firstly, the applicant is evaluated on ability and competence to perform the job, taking education and experience into consideration. Secondly, at a subconscious level, the applicant’s capacity to fit in the organisation is assessed taking ambition, productivity, commitment and personal characteristics, such as family status, into account. A survey conducted by the Social Policy Research Centre (SPRC) at the University of New South Wales in 2000, asked 1006 businesses in high growth industries to comment on the reasons candidates aged 45 years and over were unsuccessful with their job applications. The three main reasons stated were “because they did not hold current skills, they lack relevant technical experience and that they would not ‘fit in’ to the business”. BWA’s analysis however, shows that recruiting an employee who is over the age of 45 can produce a saving of $1424 compared to recruiting a younger employee. 2.2 AGEING AND RECRUITMENT AT UNISA Overall, new recruits at UniSA are predominately in the 25 to 34 age group with strong representation in the 35 to 44 and 45 to 54 age brackets. Table 49: Recruitment by Age, Gender and Award, 1 April 2005 to 31 March 2006
Age (Years)
15-24 25-34 35-44 45-54 55-64 65+ Total
Women 4 14 21 11 6 0 56 Academic
Men 0 11 11 11 9 0 42
Academic Total 4 25 32 22 15 0 98
Women 20 42 29 13 1 0 105 General
Men 8 16 11 11 4 0 50
General Total 28 58 40 24 5 0 155
Grand Total 32 83 72 46 20 0 253 Women make up majority of new recruits, representing 63.6% of total recruits. This compares to the University’s gender profile, where women make up 57.8% of total staff numbers. Women dominate in all age groups, except for the 55-64 age group.
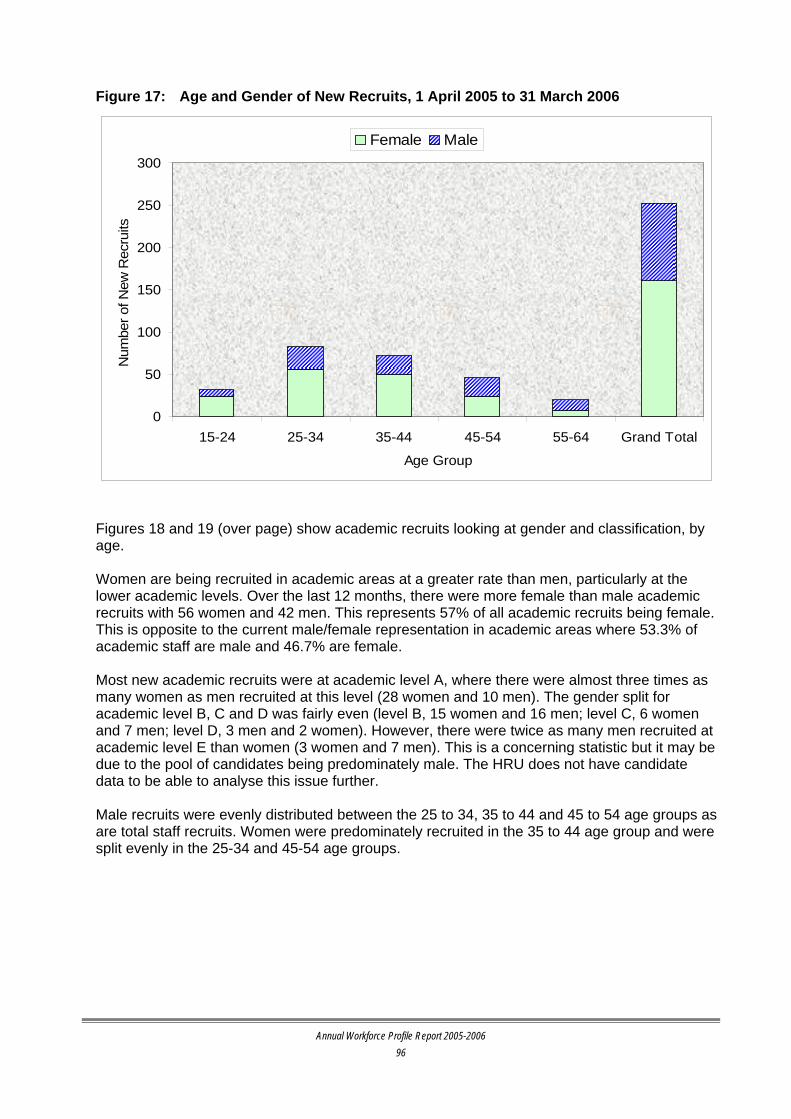
Figure 17: Age and Gender of New Recruits, 1 April 2005 to 31 March 2006
0
50
100
150
200
250
300
15-24 25-34 35-44 45-54 55-64 Grand Total
Age Group
Num
ber o
f New
Rec
ruits
Female Male
Figures 18 and 19 (over page) show academic recruits looking at gender and classification, by age. Women are being recruited in academic areas at a greater rate than men, particularly at the lower academic levels. Over the last 12 months, there were more female than male academic recruits with 56 women and 42 men. This represents 57% of all academic recruits being female. This is opposite to the current male/female representation in academic areas where 53.3% of academic staff are male and 46.7% are female. Most new academic recruits were at academic level A, where there were almost three times as many women as men recruited at this level (28 women and 10 men). The gender split for academic level B, C and D was fairly even (level B, 15 women and 16 men; level C, 6 women and 7 men; level D, 3 men and 2 women). However, there were twice as many men recruited at academic level E than women (3 women and 7 men). This is a concerning statistic but it may be due to the pool of candidates being predominately male. The HRU does not have candidate data to be able to analyse this issue further. Male recruits were evenly distributed between the 25 to 34, 35 to 44 and 45 to 54 age groups as are total staff recruits. Women were predominately recruited in the 35 to 44 age group and were split evenly in the 25-34 and 45-54 age groups.
Annual Workforce Profile Report 2005-2006
96

Figure 18: Academic Staff Recruits by Gender and Age, 1 April 2005 to 31 March 2006
0
10
20
30
40
50
60
70
80
90
100
15-24 25-34 35-44 45-54 55-64 65+ GrandTotalAge Group
Num
ber o
f Aca
dem
ic R
ecru
itsFemale Male
Figure 19: Academic Staff Recruits by Gender and Classification, 1 April 2005 to 31
March 2006
0
10
20
30
40
50
60
70
80
90
100
Level A Level B Level C Level D Level E SeniorManagement
Grand Total
Age Group
Num
ber o
f Aca
dem
ic R
ecru
its
Female Male
Annual Workforce Profile Report 2005-2006
97

Figures 20 and 21 look at the recruiting profile for general staff. Women make up 68% of general staff recruitments. They dominate in numbers for all age groups (except for the 55-64 years age group) and all classifications (except for HEO9 and senior management). This is of some concern, but as with academic staff recruits this could be due to the pool of candidates being predominately female at the lower levels, with more men in the candidate pool at HEO9 and above. The HRU does not have sufficient data to analyse this. Significant work has been done in order to attract more women and this has been very successful in the general staff areas. However, addressing future staff supply shortages in general staff positions could be addressed through endeavouring to attract males into these roles to create a more equitable balance. Overall most new recruits have been in the 25 to 34 age group which is an interesting statistic considering the candidate pool in that age category is smaller than the two older categories. The next most common age category for general staff recruits is in the 35-44 age category, followed by the 15-24 group. However this data cannot be further analysed without additional candidate information. It would be useful to gather candidate demographics, i.e. gender and age group, to help understand the candidate pools and whether this directly impacts on the gender balance of recruits, or whether there are other underlying reasons. The HRU are currently reviewing recruitment practices and processes and the above comments will be taken into consideration in that review. Figure 20: General Staff Recruits by Gender and Age, 1 April 2005 to 31 March 2006
0
20
40
60
80
100
120
140
160
15-24 25-34 35-44 45-54 55-64 65+ GrandTotal
Age Group
Num
ber o
f Rec
ruits
Female Male
Annual Workforce Profile Report 2005-2006
98

Figure 21: General Staff Recruits by Gender and Classification,
1 April 2005 to 31 March 2006
0
20
40
60
80
100
120
140
160
Trainee
HE01HE02
HE03HE04
HE05HE06
HE07HE08
HE09HE10
Senior M
anagem
ent
Grand T
otal
Classification
Num
ber o
f Rec
ruits
Female Male
Annual Workforce Profile Report 2005-2006
99

Annual Workforce Profile Report 2005-2006
100

Annual Workforce Profile Report 2005-2006
101
3. EXITS
3.1 BACKGROUND A commonly held stereotype of older workers is that they are more likely to leave their employment earlier than younger workers as they intend to retire. In fact, older workers are most likely to have left employment involuntarily, for example, through retrenchment. BWA analysis of ABS labour mobility data has demonstrated that older workers are 2.6 times less likely to have left their jobs in the preceding 12 months than younger workers. Overseas research has shown that companies which suffer from high turnover, especially in retail and administrative positions, have found that mature staff offer stability. As a result, some companies such as the United Kingdom supermarket chain Sainsbury have begun targeting recruitment programs to mature people, as have the Westpac Banking Corporation in Australia. Factors which may inhibit the retention of older workers include: lack of functional flexibility, occupational health and safety risks and questions about whether the older workforce can adapt to new information technology. Retention of older workers can be facilitated through 'whole-of-workforce approaches' which involve strategic deployment of older workers, training, career development, job design and occupational health and safety policies. 'Reconversion' has been suggested as a strategy for retaining older workers. This involves the adaptation of jobs and working conditions to meet individual limits. Reconversion solutions enable a worker to be retained in a position that is linked to their previous activity. 3.2 AGEING AND RETENTION AT UNISA Data on exits include both voluntary and involuntary exits. Voluntary exits represent the number of staff (headcount) who initiated termination of employment and includes resignation, voluntary redundancy and retirement. Involuntary exits are defined as employer-initiated terminations of employment and includes redundancy, dismissal and employment not continuing after probation. This also includes expiration of fixed-term contract employment. Table 50: Involuntary and Voluntary Exits, by Age, Gender and Academic/General,
1 April 2005 to 31 March 2006
Age (Years)
15-24 25-34 35-44 45-54 55-64 65+ Total Academic 11 4 3 3 21 Women General 4 2 4 4 3 17
Women Total 4 13 8 7 6 38 Academic 3 8 4 4 1 20 Men General 1 3 2 1 7
Involuntary Exits
Men Total 1 6 10 5 4 1 27 Involuntary Total 5 19 18 12 10 1 65
Academic 3 5 3 7 1 19 Women General 9 24 19 30 12 1 95
Women Total 9 27 24 33 19 2 114 Academic 10 11 6 13 2 42 Men General 3 12 18 22 12 2 69
Voluntary Exits
Men Total 3 22 29 28 25 4 111 Voluntary Total 12 49 53 61 44 6 225 Grand Total 17 68 71 73 54 7 290

Table 50 shows that for the period 1 April 2005 to 31 March 2006 there were a total of 290 exits (including both involuntary and voluntary separations). The total number of women leaving the organisation was 152 compared with 138 men. The total number of female academic staff leaving the organisation was 40, representing 39.2% of academic staff separations. This is considerably lower than the proportion of female academic staff within the University (47%). Total voluntary exits comprised 225, of these 61 were academics and 164 were general staff. There was almost an equal split between men (111) and women (114) of all voluntary exits. As shown in Figure 22, the size of the age group has an influence on the pattern of job exit, with the level of exits generally being highest for the largest age groups. Figure 22: Exit by Age
0%
5%
10%
15%
20%
25%
30%
15-24 25-34 35-44 45-54 55-64 65+
Age Group
Prop
ortio
n of
Exi
ts
Figure 23 on the next page illustrates the annual attrition rate by each age group. This rate is calculated as follows: number of people leaving in the age group x 100 total number of people in that age group When looking at the turnover rate within each age group the largest percentage of exits are in the 65+ range which is to be expected due to retirement. However the second and third highest rate of turnover is in the youngest age groups.
Annual Workforce Profile Report 2005-2006
102

Figure 23: Staff Turnover by Age Group
0%
5%
10%
15%
20%
25%
15-24 25-34 35-44 45-54 55-64 65+
Age Group
Perc
enta
ge
It is important to analyse turnover data and compare the number of voluntary exits, i.e. resignation, retirement and voluntary redundancy, with the number of recruits in each age group. Table 51: Age by Voluntary Exits and Recruits
Age Group Voluntary Exits Recruits
15 to 24 12 32 25 to 34 49 83 35 to 44 53 72 45 to 54 61 46 55 to 64 44 20 65+ 6 0
Totals 225 253 The above analysis shows that the University is currently recruiting more people than it is losing through voluntary exits, particularly in the younger age groups. The only age groups where the reverse is true is in the 55-64 and 65+ age groups. It would be reasonable to assume that there would tend to be fewer recruitments and more retirements in these older age groups. Using voluntary exit figures, this represents a turnover rate for the University (based on average headcount of continuing and fixed-term staff for the previous 12 months) of 10% per annum. Whilst some turnover is healthy, very high levels of turnover may be indicative of management or organisational culture issues, skills shortages, competitor strategies, employee dissatisfaction and individual performance. However, turnover can also represent an opportunity to introduce new skills, facilitate change in the workplace and be functional for the particular area. As mentioned earlier, statistics show that organisations are more likely to have a higher turnover in the younger age groups (refer “Background” earlier in this section).
Annual Workforce Profile Report 2005-2006
103

Figure 24: Total Exits by Age Group and Award, 1 April 2005 to 31 March 2006
0
50
100
150
200
250
300
15-24 25-34 35-44 45-54 55-64 65+ Grand Total
Age Group
Num
ber
of E
xits
Academic General
Figure 25: Total Exits by Age Group and Gender, 1 April 2005 to 31 March 2006
0
50
100
150
200
250
300
15-24 25-34 35-44 45-54 55-64 65+ Grand Total
Age Group
Num
ber
of E
xits
Female Male
Annual Workforce Profile Report 2005-2006
104
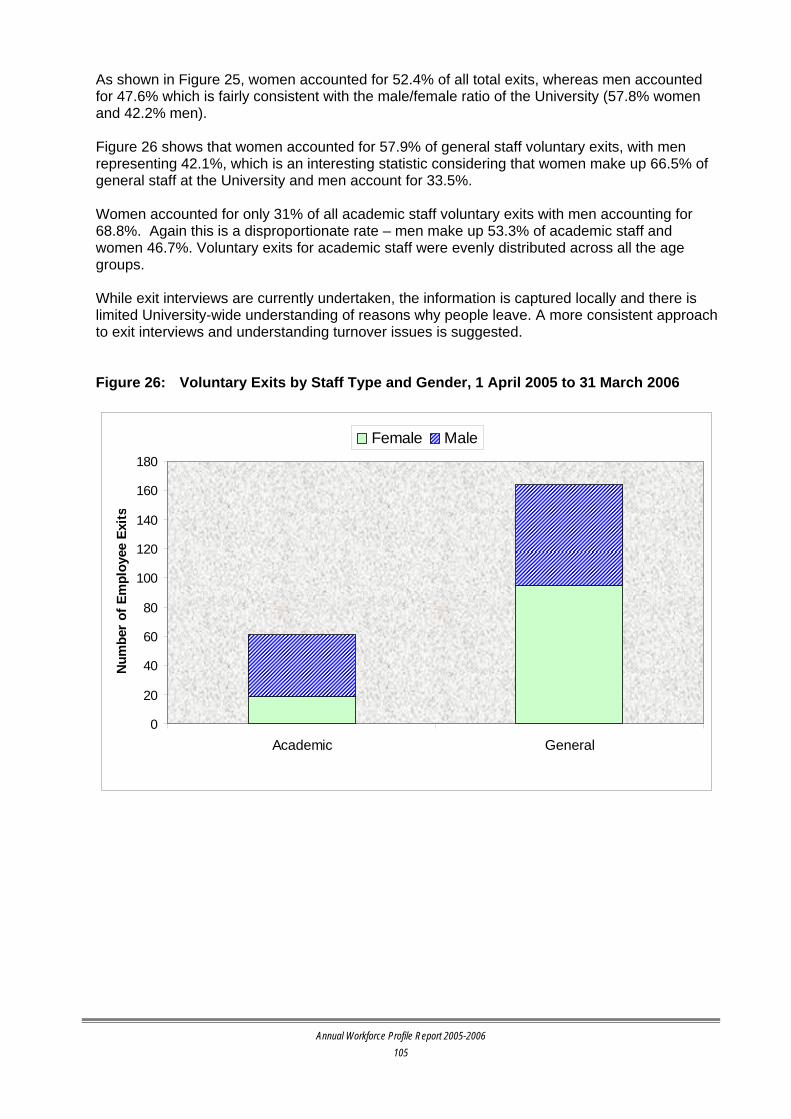
As shown in Figure 25, women accounted for 52.4% of all total exits, whereas men accounted for 47.6% which is fairly consistent with the male/female ratio of the University (57.8% women and 42.2% men). Figure 26 shows that women accounted for 57.9% of general staff voluntary exits, with men representing 42.1%, which is an interesting statistic considering that women make up 66.5% of general staff at the University and men account for 33.5%. Women accounted for only 31% of all academic staff voluntary exits with men accounting for 68.8%. Again this is a disproportionate rate – men make up 53.3% of academic staff and women 46.7%. Voluntary exits for academic staff were evenly distributed across all the age groups. While exit interviews are currently undertaken, the information is captured locally and there is limited University-wide understanding of reasons why people leave. A more consistent approach to exit interviews and understanding turnover issues is suggested. Figure 26: Voluntary Exits by Staff Type and Gender, 1 April 2005 to 31 March 2006
0
20
40
60
80
100
120
140
160
180
Academic General
Num
ber
of E
mpl
oyee
Exi
ts
Female Male
Annual Workforce Profile Report 2005-2006
105

Annual Workforce Profile Report 2005-2006
106

4. HEALTH AND WELLBEING 4.1 BACKGROUND As the workforce ages, business will be challenged to find new strategies to offset issues of planned and unplanned leave associated with health and safety. Analysis of data from the ABS has found a slightly higher incidence amongst older workers in comparison to younger counterparts. According to this analysis, workers aged 45 and over took an average of 10.4 days of unscheduled absence leave compared to 9.7 for those aged 44 and under. Thus, even though the total number of days absent from work is longer for workers aged 45 and over (approximately 0.7 days longer), there are less incidences of “casual” absence. Commentators argue that “casual” absences are overall more disruptive to the workplace, because some form of replacement can often be arranged for longer absences. In Australia approximately 33% of men retire from work because of ill health or injury. Yet, in most cases, injury and illness occur at a younger age, with close to half of these men leaving before the age of 55 years. According to ABS work related injury data, 44% of workers over 45 years reported experiencing work related injury/illness compared to 56% of workers less than 45 years. 4.2 AGEING AND UNPLANNED LEAVE AT UNISA Figure 27 provides data on average unplanned leave across the age groups. Unplanned leave is defined as sick leave, dependent child leave, carer’s leave, bereavement leave, emergency service leave, workers compensation leave and absences due to industrial action. While this does not present any major areas of concern at UniSA, it reveals that the 55-64 year age take slightly more unplanned leave than the other age groups Figure 27: Average Unplanned Leave by Age
4.545.02
5.30
6.40
7.28
4.00
0
1
2
3
4
5
6
7
8
15-24 25-34 35-44 45-54 55-64 65+
Age Group
Ave
rage
Day
s A
bsen
t
Annual Workforce Profile Report 2005-2006
107

4.3 AGEING AND INJURY AT UNISA Figure 28: Work-related Injuries or Illness by Age
2
8
12
22
9
1
0
2
4
6
8
10
12
14
16
18
20
22
24
15 to 24 25 to 34 35 to 44 45 to 54 55 to 64 65 +
Age Group
No.
of W
orke
rs
Figure 28 indicates that work related injuries or illness are most prevalent in the larger age groups, particularly in the 45-54 age group which accounts approximately 30% of total University staff numbers. While the 35-44 age group account for 28% of University staff, there were significantly less workers in this group affected by work-related injuries or illness, when compared to the 45-54 age group.
Annual Workforce Profile Report 2005-2006
108

Annual Workforce Profile Report 2005-2006
109
5. SUMMARY Overall UniSA’s age profile is reasonably good. When compared to other universities UniSA’s workforce profile is younger and has a larger proportion of women with an increase in the number of female academic recruits during the reporting period. The following comments have largely been taken from Professor Winchester’s paper presented to the 3rd Annual Higher Education Summit in 2005. With the onset of a labour shortage, recruitment and retention strategies will become a major staffing issue. The shift will require increased diversity and flexibility within the University, looking closely at contract types, position descriptions and more importantly, the introduction of strategic workforce plans. Professor Winchester states: “Retention of key staff beyond normal retiring age depends heavily on the attractiveness of continued employment, often measured in relatively intangible terms such as satisfaction. A key role for these staff will be in mentoring and coaching their replacements.”