annual transamerica retirement survey · welcome to this compendium of insights and findings from...
TRANSCRIPT

18th Annual Transamerica Retirement SurveyA Compendium of Findings About American Workers
June 2018TCRS 1364-0618
© Transamerica Institute®, 2018

• Welcome to the 18th Annual Transamerica Retirement Survey Page 3
– About Transamerica Center for Retirement Studies® Page 4
– About the Survey Page 5
– Worker Survey Methodology Page 6
– Demographic Breakout Terminology & Sample Sizes Page 7
• The American Worker – An Overview Page 8
• Influences of Demographics on Retirement Preparations
– Company size Page 85
– Generation Page 135
– Gender Page 185
– Household Income Page 235
– Education Page 285
– Ethnicity Page 336
• Appendix: Respondent Profiles by Full/Part-Time Status Page 383
• Acknowledgements Page 386
Table of Contents
2

Welcome to this compendium of insights and findings from the 18th Annual Transamerica Retirement Survey of
Workers from the Transamerica Center for Retirement Studies® (TCRS).
This report is an exploration of retirement preparedness of American workers that offers perspectives on
retirement confidence, access to employer-sponsored retirement benefits, savings rates, and planning-related
activities. It is comprised of these chapters:
• The American Worker – An Overview. This chapter contains a comprehensive set of more than 50 key
measures of retirement preparedness and five-year trend analysis looking at overall survey findings among
workers of for-profit companies. Data prior for 2016 and 2017 are from workers in companies or five or
more employees and data prior to that are from workers in companies of 10 or more employees.
• Influences of Demographics on Retirement Preparations. These chapters are demographic segmentation
analyses by employer size, generation, gender, household income, level of education, and ethnicity. Each
chapter presents a concise set of 38-40 key measures for each demographic segment.
We hope that you find this compendium to be a helpful source of retirement-related research and survey data.
If you are seeking survey data that you do not find in this report, please contact TCRS at
[email protected] and we will do our best to assist you.
Thank you.
Welcome to the 18th Annual Transamerica Retirement Survey
3

• Transamerica Center for Retirement Studies® (TCRS) is a division of Transamerica Institute® (The Institute),
a nonprofit, private foundation. TCRS is dedicated to educating the public on emerging trends surrounding
retirement security in the United States. Its research emphasizes employer-sponsored retirement plans,
including companies and their employees, unemployed and underemployed workers, and the implications
of legislative and regulatory changes. For more information about TCRS, please refer to
www.transamericacenter.org.
• The Institute is funded by contributions from Transamerica Life Insurance Company and its affiliates and
may receive funds from unaffiliated third parties.
• TCRS and its representatives cannot give ERISA, tax, investment or legal advice. This material is provided
for informational purposes only and should not be construed as ERISA, tax, investment or legal advice.
Interested parties must consult and rely solely upon their own independent advisors regarding their
particular situation and the concepts presented here.
• Although care has been taken in preparing this material and presenting it accurately, TCRS disclaims any
express or implied warranty as to the accuracy of any material contained herein and any liability with
respect to it.
About Transamerica Center for Retirement Studies®
4

• Since 1998, Transamerica Center for Retirement Studies® has conducted national surveys of U.S.
business employers and workers regarding their attitudes toward retirement. The overall goals for the
study are to illuminate emerging trends, promote awareness, and help educate the public.
• The Harris Poll was commissioned to conduct the 18th Annual Retirement Survey for Transamerica Center
for Retirement Studies. Transamerica Center for Retirement Studies is not affiliated with The Harris Poll.
• The Harris Poll is one of the longest running surveys in the U.S. tracking public opinion, motivations and
social sentiment since 1963 that is now part of Harris Insights & Analytics, a global consulting and market
research firm that delivers social intelligence for transformational times. Harris Insights & Analytics works
with clients in three primary areas; building twenty-first-century corporate reputation, crafting brand
strategy and performance tracking, and earning organic media through public relations research. Our
mission is to provide insights and advisory to help leaders make the best decisions possible. To learn
more, please visit www.theharrispoll.com.
About the Survey
5
• A 25-minute, online survey was conducted in English between August 9 – October 28, 2017 among a
nationally representative sample of 6,372 workers using the Harris online panel. Respondents met the
following criteria:
– U.S. residents, age 18 or older
– Full-time or part-time workers in a for-profit company employing five or more people
• Data were weighted as follows:
– Census data were referenced for education, age by gender, race/ethnicity, region, household income, and number of employees by company size. Results were weighted where necessary to bring them into line with the population of US residents age 18+, employed full time in a for-profit company with 5+ employees or employed part time in a for profit company.
– The weighting also adjusts for attitudinal and behavioral differences between those who are online versus those who are not, those who join online panels versus those who do not, and those who responded to this survey versus those who did not.
• Data before 2017 is from full-time or part-time workers in a for-profit company employing 10 or more
people
• Percentages are rounded to the nearest whole percent. Differences in the sums of combined
categories/answers are due to rounding.
• This report focuses on full-time and part-time workers combined.
Worker Survey Methodology
6

Demographic characteristics are self-identified by respondents. This report uses the following terminology:
All Workers Base Size
• Refers to all workers age 18 and older N=6,372
Company Size
• Small Company: 5 to 499 employees N=3,428
• Large Company: 500 or more employees N=2,944
Generation
• Millennial: Born 1979 – 2000 N=2,593
• Generation X: Born 1965 – 1978 N=1,586
• Baby Boomer: Born 1946 – 1964 N=2,076
Gender
• Women: N=3,917
• Men: N=2,432
Household Income
• Less than $50,000: N=2,508
• $50,000 - $99,999: N=2,351
• $100,000 or more: N=1,241
Education
• High School or less: N=1,107
• Some College or Trade School: N=1,834
• College Graduate: N=2,488
• Some Graduate School or Graduate Degree: N=943
Race
• White: N=3,949
• Hispanic: N=1,037
• African American: N=789
• Asian/Pacific: N=467
Demographic Breakout Terminology and Sample Sizes
7

The American Worker – An Overview
Detailed Findings
8

The 18th Annual Transamerica Retirement Survey finds that many American workers are still recovering from
what is commonly referred to as the Great Recession. Most are focused on saving for retirement and have
varying degrees of confidence they will be able to retire comfortably. This year’s survey offers a multi-year trend
analysis on approximately 60 indicators of retirement readiness. At Transamerica Center for Retirement
Studies, our goal is to raise awareness of the issues faced and inspire positive change.
Key Highlights from this 2017 Survey
• Retirement Confidence Has Recovered but Plateaued. In 2017, 62 percent of workers are confident that
they will be able to fully retire with a comfortable lifestyle, including 18 percent who are “very confident”
and 44 percent who are “somewhat confident.” This is an improvement over 2013 and 2015, but
consistent with 2016. Slightly more than half of workers (54 percent) agree that they are building a large
enough retirement nest egg. This number has increased more than 12 percentage points since 2013.
• Workers Continuing to Recover From the Great Recession. Many workers (56 percent) say they have not
yet fully recovered financially from the Great Recession, with 37 percent saying that they have “somewhat”
recovered, 12 percent saying that they have not yet begun to recover, and seven percent saying that they
may never recover from it. In contrast, 44 percent of workers say that they have either fully recovered (24
percent) or were not impacted by Great Recession (20 percent).
• Retirement Dreams Include Leisure and Work. Workers have many dreams for retirement, including
traveling (70 percent), spending more time with family and friends (57 percent), and/or pursuing hobbies
(50 percent). Interestingly, 30 percent of workers dream of doing some form of work in retirement. These
are largely unchanged from 2016, with the exception being that slightly more workers cite traveling as a
dream in 2017.
The American Worker – An Overview
9

• Greatest Retirement Fears Range From Financial to Health. Workers’ most frequently cited retirement fear
is “outliving my savings/investments” (52 percent), followed closely by “Social Security will be reduced or
cease to exist in the future” (48 percent) and “declining health that requires long-term care” (44 percent).
Approximately one-third of workers fear lack of adequate and affordable healthcare (38 percent) and
cognitive decline, dementia, Alzheimer’s Disease (35 percent).
• Retirement Beliefs, Preparations, and Involvement. Many workers have concerns about their life in
retirement — the majority (79 percent) believe their generation will have a much harder time achieving
financial security compared to their parents’ generation, and 76 percent are concerned that Social Security
will not be there for them when they are ready to retire. These concerns present an opportunity for
education, with 68 percent of workers admitting they don’t know as much as they should about retirement
investing, and two-thirds looking to their company for more information and advice on how to reach their
goals.
• Expected Standard of Living in Retirement. In 2017, 62 percent of workers expect that their standard of
living will stay the same or increase while in retirement. However, one in three workers expect that they will
see a decrease in their standard of living during retirement.
• Expected Retirement Age. Workers’ expectations regarding when and how they will retire represent a
dramatic change from long-held societal notions about fully retiring at age 65. In 2017, the majority of
workers (53 percent) plan to work past age 65 (40 percent) or do not plan to retire (13 percent). These
survey findings remain relatively consistent with previous years.
• Planning to Work in Retirement. Fifty-six percent of workers plan to continue working in retirement, either
part-time (42 percent) or full-time (14 percent). Twenty-four percent do not plan to work in retirement and
20 percent are “not sure.” The proportion of workers who plan to work in retirement has gone up slightly
since prior years.
The American Worker – An Overview
10

• Reasons for Working in Retirement. Among workers who plan to work in retirement or past age 65, larger
proportions do so because of financial reasons (83 percent) than healthy-aging reasons (75 percent). The
top financial reason for doing so is because workers want the income (57 percent), while the top healthy-
aging reason is to be active (54 percent).
• Retirement Transitions: Phased Versus Immediate. Only 23 percent of workers plan to immediately stop
working at a specific point in time. Many (47 percent) are planning to transition into retirement by either
shifting from full-time to part-time (30 percent) or moving into a less demanding or more personally
satisfying role (17 percent). Another 20 percent plan to continue working as long as possible in their
current or similar position until they cannot work any longer, and 10 percent are “not sure” about their
transition.
• Phased Retirement and Compensation-Related Expectations. Among workers who envision a phased
transition into retirement, 79 percent agree that if they reduce their work hours at their current employer
they would expect to be paid the same hourly rate for hours worked that they are earning now. Seventy-
eight percent agree that if they were to take on a new role with fewer responsibilities at their current
employer, they would expect their job title to change, while 71 percent agree that if they took on a role with
reduced responsibilities they may have a reduction in pay.
• Where Transition to Retirement May Take Place. More than half of workers (54 percent) would prefer to
stay with their current employer when working past age 65 as they transition into retirement. Another 20
percent each would like to start their own business or change employers. Nineteen percent of workers are
“not sure” what they would prefer.
• Employer Support for Working Past Age 65. Seventy-two percent of workers agree that their employer is
supportive of their employees working past the age of 65. These findings are consistent since 2014.
The American Worker – An Overview
11

• Transitioning to Retirement: How Employers Help. One in four workers (24 percent) indicate their employer
allows flexible work schedules or reduced work hours to employees transitioning into retirement. However,
one-quarter of workers (25 percent) state that their employer does not do anything to help employees
enter retirement, and 24 percent are “not sure.”
• “Aging Friendly” Employer. Just over half of workers (56 percent) consider their employer to be “aging
friendly,” significantly more than last year, while one-quarter (23 percent) are “not sure.”
• Very Important Criteria Re: Where to Live in Retirement. Seven in ten workers (71 percent) cite an
affordable cost of living as a very important criterion for choosing where to live in retirement, a finding that
is similar to previous years. Being near family and friends (54 percent) is the second most commonly cited
criterion. The survey finds a disconnect in that only 25 percent of workers cite employment opportunities
as a very important criterion, while 56 percent plan to work in retirement.
• Proactive Steps to Continue to Working in Retirement. When asked what steps they are taking to help
ensure they can continue working past age 65 or in retirement, 62 percent of workers say they are staying
healthy so that they can continue working, while 56 percent say that they are focusing on performing well
at their current job. Only 46 percent say they are keeping their job skills up to date. Even fewer workers are
networking and meeting new people (21 percent), scoping out the employment market (18 percent), or
going back to school and learning new skills (13 percent).
• Level of Concern About Health in Older Age. Almost three in four workers (73 percent) are concerned about
their health in older age. Half of workers are somewhat concerned while 23 percent are very concerned.
• Engagement in Health-Related Activities on a Consistent Basis. Nearly all workers (96 percent) are doing at
least one health-related activity on a consistent basis, with more than half of workers eating healthfully (56
percent), exercising regularly (54 percent), maintaining a positive outlook (53 percent), seeking medical
attention when needed (53 percent), and/or avoiding harmful substances (50 percent).
The American Worker – An Overview
12

• Perceptions of Older Workers. Eighty-four percent of workers have a positive perception of workers age 50
and older compared to younger workers in today’s workforce, while 54 percent of workers hold a negative
perception. The most common positive perception is that they bring more knowledge, wisdom, and life
experience (62 percent), while the most common negative perception is that they have higher healthcare
costs (28 percent).
• Age That Workers Consider a Person to Be “Too Old” to Work. A majority of workers (54 percent) believe it
is not a particular age when they consider a person “too old” to work but “it depends on the person.” Of
those who provided an age deeming a person “too old” to work, the median age is 75.
• Age That Workers Consider a Person to Be “Old.” Two in five workers (40 percent) believe that there it is
not a particular age when they consider a person to be “old,” but rather “it depends on the person.” Of
those who provided an age, the median age when workers deem a person to be “old” is 70, with the
largest proportion of responses falling between ages 70 and 79 (18 percent).
• Planning to Live to Age ... Workers in 2017 are planning to live to age 90 (median), an increase from 86
(median) in 2016. About half (49 percent) are planning to live to age 80 or older. Thirty-two percent are
planning to live to age 90 or older. Fourteen percent are planning to 100 or older. And four in ten workers
(41 percent) say that they are “not sure.”
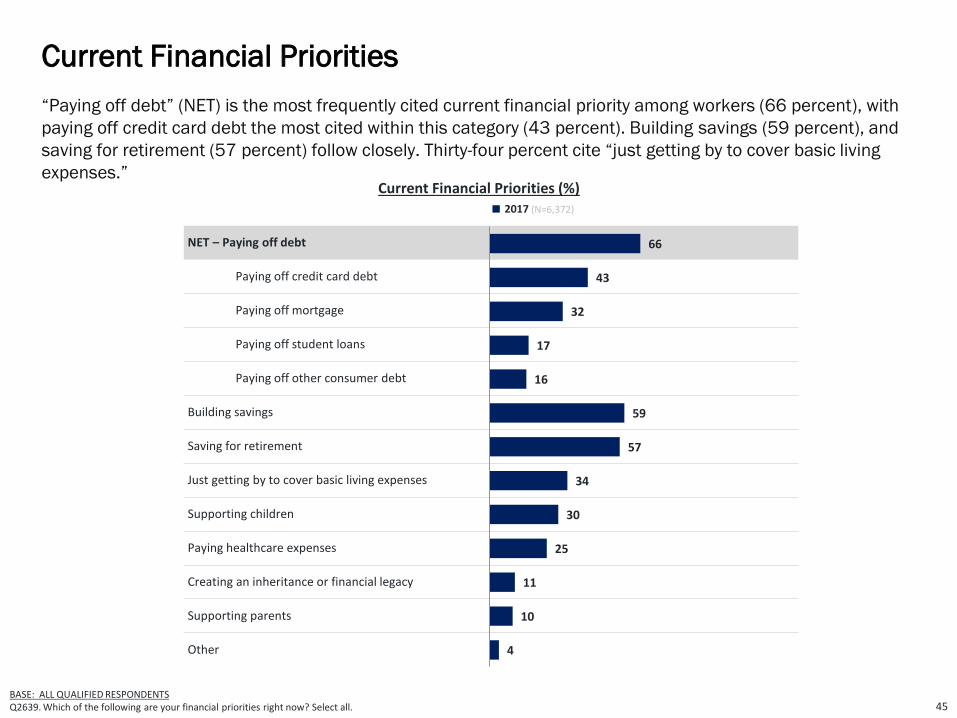
• Current Financial Priorities. “Paying off debt” (NET) is the most frequently cited current financial priority
among workers (66 percent), with paying off credit card debt the most cited within this category (43
percent). Building savings (59 percent), and saving for retirement (57 percent) follow closely. Thirty-four
percent cite “just getting by to cover basic living expenses.”
The American Worker – An Overview
13

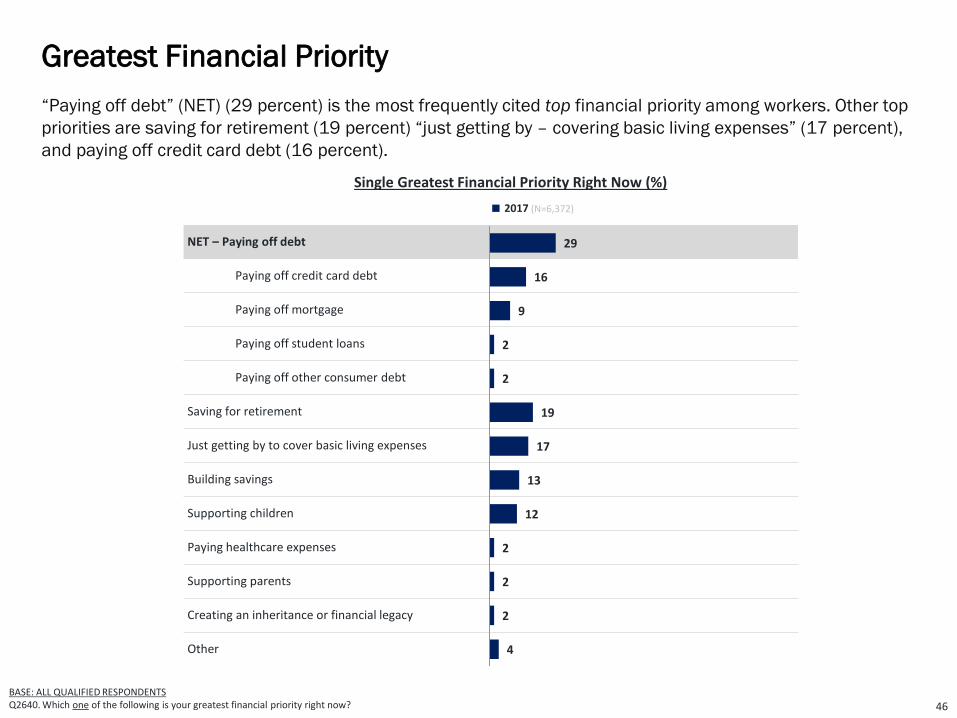
• Greatest Financial Priority. “Paying off debt” (NET) (29 percent) is the most frequently cited top financial
priority among workers. Other top priorities are saving for retirement (19 percent) “just getting by –
covering basic living expenses” (17 percent), and paying off credit card debt (16 percent).
• Types of Household Debt. A large majority (86 percent) of American workers’ households carry at least
some form of debt with credit card debt being most prevalent (59 percent), followed by a mortgage (43
percent), or a car loan (40 percent). Only 14 percent of households have no debt.
• Emergency Savings Are Low. Many workers have little in terms of emergency savings specifically to cover
the cost of major financial setbacks such as unemployment, medical bills, home repairs, auto repairs, and
other. Workers have saved $5,000 (median) to cover such emergencies. Thirty-six percent of workers
report having saved less than $5,000. Only 19 percent say that they have saved more than $25,000.
• Saving for Retirement / Age Started Saving. Seventy-seven percent of workers are saving for retirement
through an employer-sponsored retirement plan and/or outside of work. The median age workers begin
saving for retirement is age 27. These findings are consistent since 2013.
• Expected Sources of Retirement Income. Self-funded savings including retirement accounts (e.g., 401(k)s,
403(b)s, IRAs) and other savings and investment are the most frequently cited sources of retirement
income expected by workers (82 percent), followed by Social Security (74 percent). Today’s workers are
expecting diverse sources of income, including 39 percent who cite “working” as an expected source of
retirement income. Company-funded pension plans (23 percent), home equity (14 percent), and
inheritance (11 percent) are less frequently cited by workers.
The American Worker – An Overview
14

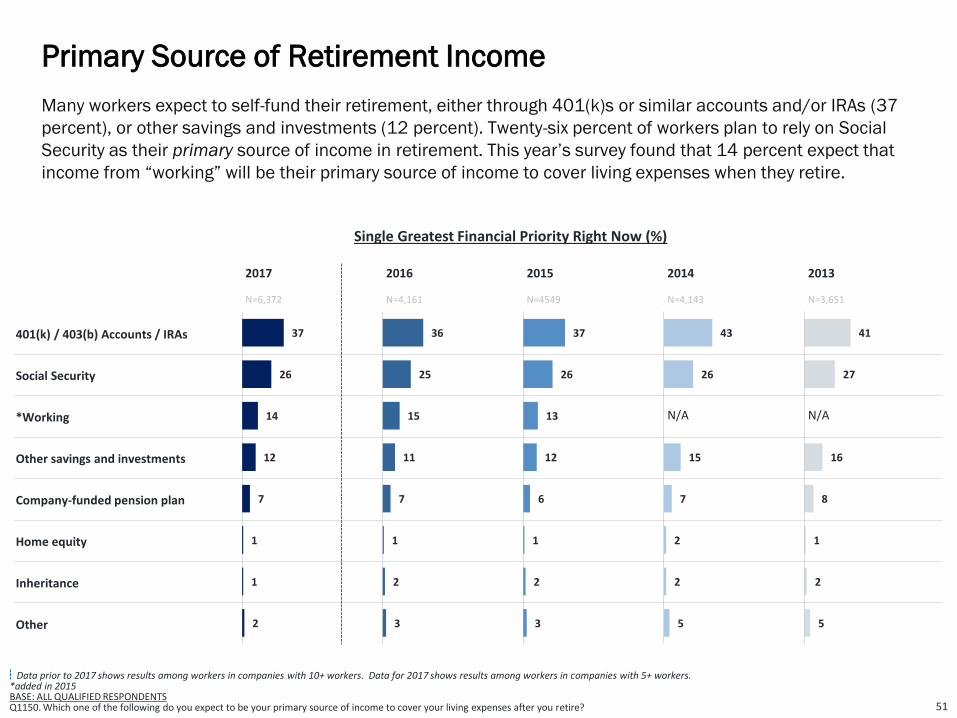
• Primary Source of Retirement Income. Many workers expect to self-fund their retirement, either through
401(k)s or similar accounts and/or IRAs (38 percent), or other savings and investments (12 percent).
Twenty-six percent of workers plan to rely on Social Security as their primary source of income in
retirement. This year’s survey found that 14 percent expect that income from “working” will be their
primary source of income to cover living expenses when they retire.
• Importance of Retirement Benefits Compared to Other Benefits. Workers highly value employer-sponsored
retirement benefits — 88 percent of workers say that an employee-funded retirement plan is “very” or
“somewhat” important and 72 percent indicate pension plans are important. Health insurance continues
to be the most frequently cited important benefit (95 percent).
• Importance of Retirement Benefits in Job Selection. The majority of workers (81 percent) agree that the
retirement savings programs offered by a prospective employer will be a major factor in their job search
decision, a slight increase from previous years.
• Better Retirement Benefits Versus Higher Salary. When selecting between two hypothetical job offers,
workers are equally likely to say they would select a job with a higher than expected salary, but poor
retirement benefits (50 percent) versus a job with excellent retirement benefits, but only meeting minimum
salary requirements (50 percent).
• Workers May Switch Employers for Better Retirement Benefits. The majority of workers (65 percent) whose
employers do not offer a retirement plan would be likely to switch jobs for a similar job with a retirement
plan. Among all workers, more than half (59 percent) would switch jobs for a better retirement plan. These
are up somewhat from previous years.
The American Worker – An Overview
15

• Health & Welfare Benefits Currently Offered. The vast majority of workers (77 percent) are offered health
insurance at their company. Life insurance (55 percent) and disability insurance (45 percent) are also
commonly offered. These trends have remained relatively consistent over the past five years.
• Retirement Benefits Currently Offered. Seventy-one percent of workers are offered employee-funded
retirement plans such as 401(k)s and/or other employee-funded plans. A quarter (26 percent) are offered
a company-funded pension plan. However, 22 percent of workers are not offered any type of retirement
plan.
• Retirement Plan Participation and Contribution Rates. Among workers who are offered an employee-
funded retirement plan, participation is relatively high at 81 percent, slightly higher than last year. The
median percentage of salary being saved in 2017 is 10 percent of annual pay, an increase from prior
years.
• Reasons for Not Participating in Retirement Plan. Among workers not participating in their company-
sponsored plan, the reason most frequently cited is being financially stretched with other financial
priorities (33 percent). Almost one in five cite that they save for retirement in other ways (19 percent).
• Appeal of Automatic Enrollment. Eight in ten workers (81 percent) find automatic enrollment by their
current employer into an employee sponsored retirement plan appealing. If workers were to be
automatically enrolled, the median default contribution rate they feel is appropriate is 7 percent.
The American Worker – An Overview
16
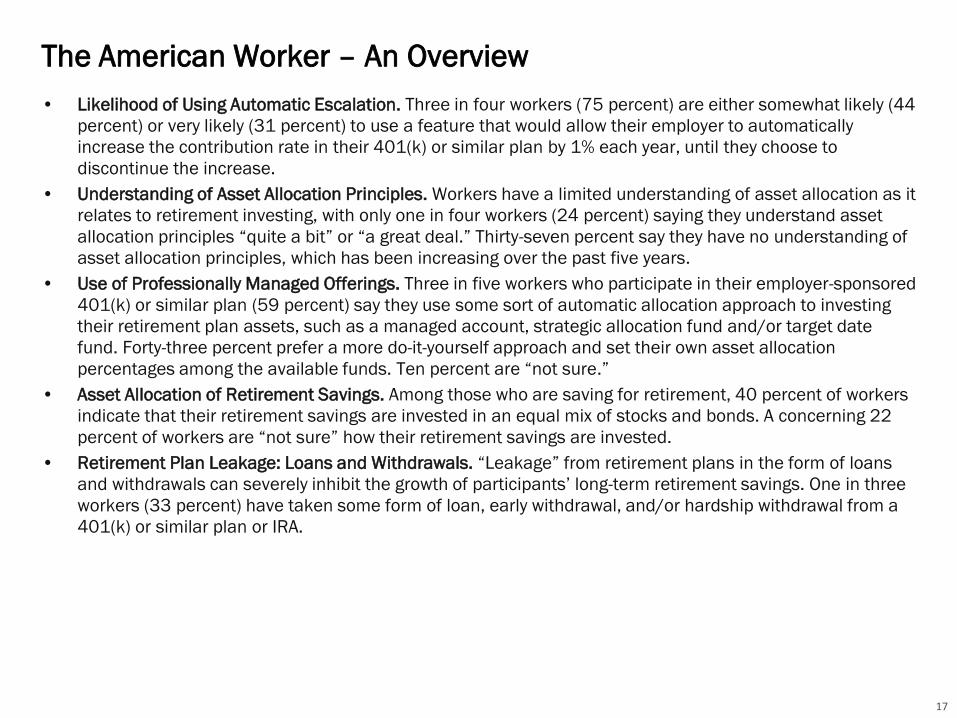
• Likelihood of Using Automatic Escalation. Three in four workers (75 percent) are either somewhat likely (44
percent) or very likely (31 percent) to use a feature that would allow their employer to automatically
increase the contribution rate in their 401(k) or similar plan by 1% each year, until they choose to
discontinue the increase.
• Understanding of Asset Allocation Principles. Workers have a limited understanding of asset allocation as it
relates to retirement investing, with only one in four workers (24 percent) saying they understand asset
allocation principles “quite a bit” or “a great deal.” Thirty-seven percent say they have no understanding of
asset allocation principles, which has been increasing over the past five years.
• Use of Professionally Managed Offerings. Three in five workers who participate in their employer-sponsored
401(k) or similar plan (59 percent) say they use some sort of automatic allocation approach to investing
their retirement plan assets, such as a managed account, strategic allocation fund and/or target date
fund. Forty-three percent prefer a more do-it-yourself approach and set their own asset allocation
percentages among the available funds. Ten percent are “not sure.”
• Asset Allocation of Retirement Savings. Among those who are saving for retirement, 40 percent of workers
indicate that their retirement savings are invested in an equal mix of stocks and bonds. A concerning 22
percent of workers are “not sure” how their retirement savings are invested.
• Retirement Plan Leakage: Loans and Withdrawals. “Leakage” from retirement plans in the form of loans
and withdrawals can severely inhibit the growth of participants’ long-term retirement savings. One in three
workers (33 percent) have taken some form of loan, early withdrawal, and/or hardship withdrawal from a
401(k) or similar plan or IRA.
The American Worker – An Overview
17

• Reasons for Taking Plan Loans. Among workers who have taken a retirement plan loan, the most
frequently cited reason for doing so is to pay off debt (35 percent), including credit card debt (24 percent)
and/or other debt (20 percent). Other reasons for taking a loan include a financial emergency (24
percent), medical bills (23 percent), or unplanned major expenses (21 percent).
• Reasons for Taking Hardship Withdrawals From Plans. Among workers who have taken a hardship
withdrawal from their employer-sponsored retirement plan, one in five (24 percent) say the primary reason
for the withdrawal is to prevent eviction from their home, and another 17 percent say it is to pay for certain
medical expenses.
• Saving for Retirement Outside of Work. The majority of workers (59 percent) are saving for retirement
outside of work in an IRA, mutual fund, bank account or other vehicle. This is a slight increase from last
year.
• Household Retirement Savings. Total household retirement savings among workers is $71,000 (estimated
median), a slight increase from last year. In 2017, 10 percent of workers have saved less than $5,000 in
household retirement accounts, while 25 percent have less than $25,000 saved. In contrast, 30 percent
of workers report having saved more than $250,000 in household retirement accounts.
• Information Sources: Retirement Planning & Investing. Friends and family (35 percent) continue to be the
top source of information for workers when it comes to retirement planning and investing. Other popular
information sources include financial websites (33 percent), financial planners/brokers (28 percent), and
retirement plan provider websites (23 percent).
The American Worker – An Overview
18

• Helpfulness of Resources Offered by Retirement Plan Provider. Among those offered a retirement plan,
quarterly statements from the retirement plan provider continue to be seen as the most helpful resource
for retirement planning, saving, and investing. This is followed closely by professional advice. Workers are
more likely to say mobile apps from the retirement plan provider are helpful this year than last year.
• Motivators to Learn More About Retirement Investing. Workers most frequently cite “a good starting point
that is easier to understand” and “educational materials that are easier to understand” as potential
motivators for learning more about saving and investing for retirement. Both of these are somewhat higher
than prior years. Nine percent of workers feel that they are already educated enough and seven percent
say that they are just not interested in learning more about retirement.
• Use a Professional Financial Advisor. Among workers investing for retirement, 40 percent use a
professional advisor to help manage their retirement savings or investments. Of those who use advisors,
most do so to get retirement investment recommendations (69 percent), general financial planning (48
percent), and/or to help calculate a retirement goal (47 percent).
• Estimated Retirement Savings Needs. Workers estimate they will need to have saved $500,000 (median)
by the time they retire in order to feel financially secure, a survey finding consistent with last year but lower
than 2015 and 2014. In 2017, 36 percent of workers estimate they will need $1 million or more.
• Basis for Estimating Retirement Savings Needs. Among workers who provided an estimate of their
retirement savings needs, 46 percent say they “guessed” when asked how they arrived at their estimate.
Twenty-three percent estimated the amount based on current living expenses. Only seven percent used a
retirement calculator.
The American Worker – An Overview
19

• Retirement Strategies: Written, Unwritten, or None. Sixty-three percent of workers have some form of a
retirement strategy — but only 16 percent have a written plan, while 47 percent have a plan that is not
written down. Conversely, 37 percent of workers do not have a retirement strategy. These finding are
consistent with previous years.
• Retirement Strategies: Factors. Workers who have a retirement strategy take into account many different
factors in their planning, including Social Security and Medicare benefits (58 percent), on-going living
expenses (54 percent), and total retirement savings and income needs (49 percent). Workers are not as
likely to factor in long-term care needs (30 percent), tax planning (23 percent), or estate planning (19
percent).
• Confidence that Financial Strategy Will Enable Travel Goals. Among workers who dream of traveling in
retirement, 59 percent are “very” or “somewhat” confident that their current financial strategy will allow
them to meet their travel goals throughout retirement. Thirteen percent say that they haven’t given much
thought to a financial strategy for travel.
• Backup Plans if Unable to Work Before Planned Retirement. The majority of workers (58 percent) do not
have a backup plan for retirement income if they are unable to work before their planned retirement. One-
quarter (28 percent) do have a backup plan, up slightly from prior years.
• Awareness of Roth 401(k). Among workers who are offered a retirement plan, 75 percent are aware of a
Roth 401(k) option (including those who are and who are not offered the option).
The American Worker – An Overview
20

• Awareness of Saver’s Credit and Catch-Up Contributions. The Internal Revenue Service offers two
meaningful incentives to save for retirement which many workers are unaware of: the Saver’s Credit, a tax
credit for eligible taxpayers who are saving for retirement in a qualified retirement plan or IRA; and catch-
up contributions, which allow workers age 50 and older to contribute to a qualified plan an additional
amount over and above the plan- or IRA-contribution limit. Only 36 percent of workers are aware of the
Saver’s Credit, although awareness of the Credit is increasing. Only 49 percent of workers are aware of
catch-up contributions. Raising awareness of these incentives may prompt workers to save more.
• Awareness of the IRS’ Free File Program. Just under half (45 percent) of workers are aware of the IRS’ Free
File program that offers federal income tax preparation software for free to eligible tax filers.
• Understanding of Government Benefits. Most workers have limited understanding of government benefits
that can be utilized in retirement. Case in point: only 20 percent of workers know “a great deal” about
Social Security benefits and even fewer know a great deal about Medicare and Medicaid.
• Frequency of Discussions About Retirement. Most workers (73 percent) discuss saving, investing and
planning for retirement with family and friends. However, only 15 percent do so frequently. Twenty-seven
percent of workers say that they never discuss it. This has remained relatively unchanged in the recent
years.
The American Worker – An Overview
21

In 2017, 62 percent of workers are confident that they will be able to fully retire with a comfortable lifestyle,
including 18 percent who are “very confident” and 44 percent who are “somewhat confident.” This is an
improvement over 2013 and 2015, but consistent with 2016. Slightly more than half of workers (54
percent) agree that they are building a large enough retirement nest egg. This number has increased more
than 12 percentage points since 2013.
Retirement Confidence Has Recovered but Plateaued
22
44 47 45 48 45
18 15 1416
10
62 6259
64
55
2017 2016 2015 2014 2013
Very confident
Somewhat confident
N=6,372 N=4,161 N=4,550 N=4,143 N=3,651
Data prior to 2017 shows results among workers in companies with 10+ workers. Data for 2017 shows results among workers in companies with 5+ workers.BASE: ALL QUALIFIED RESPONDENTSQ880. How confident are you that you will be able to fully retire with a lifestyle you consider comfortable?Q800. How much do you agree or disagree that you are currently building a large enough retirement nest egg?
Confidence in Retiring Comfortably
% Very/Somewhat Confident (NET)
Building a Large Enough Nest Egg?% Strongly/Somewhat Agree (NET)
34 35 34 3831
20 16 1515
11
5451 49
52
42
2017 2016 2015 2014 2013
Strongly agree
Somewhat agree
N=6,372 N=4,161 N=4,550 N=4,143 N=3,651

Many workers (56 percent) say they have not yet fully recovered financially from the Great Recession, with 37
percent saying that they have “somewhat” recovered, 12 percent saying that they have not yet begun to recover,
and seven percent saying that they may never recover from it. In contrast, 44 percent of workers say that they
have either fully recovered (24 percent) or were not impacted by Great Recession (20 percent).
Workers Continuing to Recover From the Great Recession
23
Data prior to 2017 shows results among workers in companies with 10+ workers. Data for 2017 shows results among workers in companies with 5+ workers.BASE: ALL QUALIFIED RESPONDENTSQ2655. How would you describe your financial recovery from the deep recession in recent years, which is commonly referred to as the “Great Recession”?
2017 2016 2015 2014N=6,372 N=4,161 N=4,550 N=4,143
I have fully recovered
I have somewhat recovered
I have not yet begun to recover
I may never recover
I was not impacted
Financial Recovery From the Great Recession (%)
24
37
12
7
20
20
41
13
7
19
16
40
15
8
21
14
44
18
9
15

Workers have many dreams for retirement, including traveling (70 percent), spending more time with family
and friends (57 percent), and/or pursuing hobbies (50 percent). Interestingly, 30 percent of workers dream of
doing some form of work in retirement. These are largely unchanged from 2016, with the exception being that
slightly more workers cite traveling as a dream in 2017.
Retirement Dreams Include Leisure and Work
24
Data prior to 2017 shows results among workers in companies with 10+ workers. Data for 2017 shows results among workers in companies with 5+ workers.BASE: ALL QUALIFIED RESPONDENTS Q1418. How do you dream of spending your retirement? Select all.
How do you dream of spending your retirement? Please select all that apply. (%)
2017 2016N=6,372 N=4,161
Traveling
Spending more time with family and friends
Pursuing hobbies
Doing volunteer work
Pursuing an encore career (pursuing a new role, work, activity, or career)
Starting a business
Continue working in the same field
Other
None of the above
70
57
50
26
13
13
11
5
2
NET: Working
30%
NET: Working
28%
65
56
49
27
13
11
12
7
4

2017 2016 2015N=6,372 N=4,161 N=4,550
Outliving my savings and investments
Social Security will be reduced or cease to exist in the future
Declining health that requires long-term care
Not being able to meet the basic financial needs of my family
Lack of access to adequate and affordable healthcare
Cognitive decline, dementia, Alzheimer’s Disease
Finding meaningful ways to spend time and stay involved
Feeling isolated and alone
Being laid off - not being able to retire on my own terms
None of the above
Data prior to 2017 shows results among workers in companies with 10+ workers. Data for 2017 shows results among workers in companies with 5+ workers.BASE: ALL QUALIFIED RESPONDENTSQ1422. What are your greatest fears about retirement? Select all.
Workers’ most frequently cited retirement fear is “outliving my savings/investments” (52 percent), followed
closely by “Social Security will be reduced or cease to exist in the future” (48 percent) and “declining health that
requires long-term care” (44 percent). Approximately one-third of workers fear lack of adequate and affordable
healthcare (38 percent) and cognitive decline, dementia, Alzheimer’s Disease (35 percent).
Greatest Retirement Fears Range From Financial to Health
25
Workers’ Greatest Retirement Fears (%)
52
48
44
42
38
35
21
20
18
5
51
47
45
42
32
35
19
19
19
7
44
36
36
33
25
26
13
13
14
8

82
77
72
68
66
65
63
58
40
80
76
67
61
66
63
53
39
82
76
67
63
66
69
56
38
69
60
68
61
51
35
2017 2016 2015 2014 2013
N=6,372 N=4,161 N=4,550 N=4,143 N=3,651
**Compared to my parent's generation, people in my generation will have a much harder time in achieving financial security
N/A
**Concerned that when I am ready to retire, Social Security will not be there for me
N/A
*My current employer is supportive of its employees working past 65
N/A N/A N/A
Do not know as much as I should about retirement investing
Like more info and advice from my company on how to reach my goals
Could work until age 65 and still not have enough money saved
Very involved in monitoring and managing my retirement savings
Prefer to rely on outside experts to monitor and manage my plan
Prefer not to think about or concern myself with it until closer to retirement
26
Many workers have concerns about their life in retirement — the majority (79 percent) believe their generation
will have a much harder time achieving financial security compared to their parents’ generation, and 76
percent are concerned that Social Security will not be there for them when they are ready to retire. These
concerns present an opportunity for education, with 68 percent of workers admitting they don’t know as much
as they should about retirement investing, and two-thirds looking to their company for more information and
advice on how to reach their goals.
Retirement Beliefs, Preparations, and Involvement
Data prior to 2017 shows results among workers in companies with 10+ workers. Data for 2017 shows results among workers in companies with 5+ workers.*added in 2016 **added in 2014BASE: ALL QUALIFIED RESPONDENTSQ930. How much do you agree or disagree with each of the following statements regarding retirement investing?
Retirement Preparations and Involvement% Strongly/Somewhat Agree (NET)
79
76
72
68
66
65
65
57
40

Not Sure
2017N=6,372
8
2016N=4,161
11
2015N=4,550
10
2014N=4,143
9
2013N=3,651
10
41
41
42
41
38
30
30
33
32
41
21
18
15
17
12
■ Decrease ■ Stay the Same ■ Increase
Data prior to 2017 shows results among workers in companies with 10+ workers. Data for 2017 shows results among workers in companies with 5+ workers.BASE: ALL QUALIFIED RESPONDENTS
Q1500. Do you expect your standard of living to increase, decrease, or stay the same when you retire?
In 2017, 62 percent of workers expect that their standard of living will stay the same or increase while in
retirement. However, one in three workers expect that they will see a decrease in their standard of living during
retirement.
Expected Standard of Living in Retirement
27
Expected Changes in Standard of Living in Retirement (%)

21
20
21
24
24
21
24
21
22
23
41
43
44
41
40
16
13
14
13
13
2013
2014
2015
2016
2017
Before Age 65 At Age 65 After Age 65 Do Not Plan to Retire
N=6,372
N=4,550
N=4,161
N=4,143
N=3,651
Data prior to 2017 shows results among workers in companies with 10+ workers. Data for 2017 shows results among workers in companies with 5+ workers.BASE: ALL QUALIFIED RESPONDENTSQ910. At what age do you expect to retire?
Workers’ expectations regarding when and how they will retire represent a dramatic change from long-held
societal notions about fully retiring at age 65. In 2017, the majority of workers (53 percent) plan to work past
age 65 (40 percent) or do not plan to retire (13 percent). These survey findings remain relatively consistent
with previous years.
Expected Retirement Age
28
NET – After Age 65 or Do Not Plan to Retire = 57%
NET – After Age 65 or Do Not Plan to Retire = 55%
NET – After Age 65 or Do Not Plan to Retire = 58%
NET – After Age 65 or Do Not Plan to Retire = 54%
NET – After Age 65 or Do Not Plan to Retire = 53%
Age Expecting to Retire (%)

NET – Yes:
Fifty-six percent of workers plan to continue working in retirement, either part-time (42 percent) or full-time (14
percent). Twenty-four percent do not plan to work in retirement and 20 percent are “not sure.” The proportion
of workers who plan to work in retirement has gone up slightly since prior years.
Planning to Work in Retirement
29
Data prior to 2017 shows results among workers in companies with 10+ workers. Data for 2017 shows results among workers in companies with 5+ workers.BASE: ALL QUALIFIED RESPONDENTSQ1525. Do you plan to work after you retire?
Plan to Work in Retirement (%)
42 38 39 40 44
1413 12 12 10
24 27 25 2719
2022 24 21
27
N=4,161
2016
N=4,143 N=3,651N=4,550N=6,372
2017 2015 2014 2013
56 51 52 5451
Yes, I plan to work full-time
Yes, I plan to work part-time
No, I do not plan to work
Not sure

Among workers who plan to work in retirement or past age 65, larger proportions do so because of financial
reasons (83 percent) than healthy-aging reasons (75 percent). The top financial reason for doing so is because
workers want the income (57 percent), while the top healthy-aging reason is to be active (54 percent).
Reasons for Working in Retirement
30
57 54
43 41 38 37 37
31 25
16 15
3
Want theincome
Be active Keep my brainalert
Concernedthat Social
Security willbe less than
expected
Can't afford toretire becauseI haven't saved
enough
Have a senseof purpose
Enjoy what Ido
Need healthbenefits
Maintainsocial
connections
Concernedthat employer
retirementbenefits willbe less than
expected
Anxious aboutvolatility in
financialmarkets andinvestment
performance
None of theabove
New question added in 2017BASE: PLAN ON RETIRING AFTER 65 AND/OR WORKING AFTER RETIREMENTQ1530x1. What are your reason(s) for working in retirement or past age 65? Select all.
What are your reason(s) for working in retirement or past age 65? (%)
2017 (N=4,816)
Financial reasons (NET = 83%)
Healthy-aging reasons (NET = 75%)

Only 23 percent of workers plan to immediately stop working at a specific point in time. Many (47 percent) are
planning to transition into retirement by either shifting from full-time to part-time (30 percent) or moving into a
less demanding or more personally satisfying role (17 percent). Another 20 percent plan to continue working as
long as possible in their current or similar position until they cannot work any longer, and 10 percent are “not
sure” about their transition.
Retirement Transitions: Phased Versus Immediate
31
Data prior to 2017 shows results among workers in companies with 10+ workers. Data for 2017 shows results among workers in companies with 5+ workers.BASE: ALL QUALIFIED RESPONDENTSQ1545. How do you envision transitioning into retirement?
18
20
22
20
29
26
28
30
17
15
14
17
14
14
14
15
8
7
9
8
14
18
13
10
2014
2015
2016
2017
How do you envision transitioning into retirement? (%) Continue working as long as possiblein current or similar position until Icannot work any more
Transition into retirement byreducing work hours with moreleisure time to enjoy life
Transition into retirement by workingin a difference capacity that is eitherless demanding and/or brings greaterpersonal satisfaction
Immediately stop working once Ireach a specific age and beginpursuing my retirement dreams
Immediately stop working once I savea specific amount of money andbegin pursuing my retirementdreams
Not sure
NET – Transition = 42%
NET – Transition = 41%
NET – Planned Stop = 23%
NET – Planned Stop = 21%
NET – Transition = 46% NET – Planned Stop = 22%
N=4,161
N=6,372
N=4,550
N=4,143
NET – Transition = 47% NET – Planned Stop = 23%

Phased Retirement and Compensation-Related Expectations
Among workers who envision a phased transition into retirement, 79 percent agree that if they reduce their
work hours at their current employer they would expect to be paid the same hourly rate for hours worked that
they are earning now. Seventy-eight percent agree that if they were to take on a new role with fewer
responsibilities at their current employer, they would expect their job title to change, while 71 percent agree
that if they took on a role with reduced responsibilities they may have a reduction in pay.
2017N=3,013
If I reduce my work hours at my current employer, I would expect to be paid the same hourly rate for hours worked that I am earning now.
If I were to take on a new role with fewer responsibilities at my current employer, I would expect my job title to change.
If I were to take on a new role with fewer responsibilities at my current employer, I would expect to be paid the market rate for the duties involved, even if it means a reduction in my current level of pay.
If I were to shift from full-time to part-time at my current employer, I would expect to receive the same employee benefits that I have now.
New question added in 2017BASE: RESPONDENTS WHO ENVISION A PHASED TRANSITION INTO RETIREMENTQ1546. In thinking about your vision of transitioning into retirement, to what extent do you agree or disagree with the following statements?
79
78
71
60
32
In thinking about your vision of transitioning into retirement, to what extent do you agree or disagree with the following statements? (NET - Agree %)
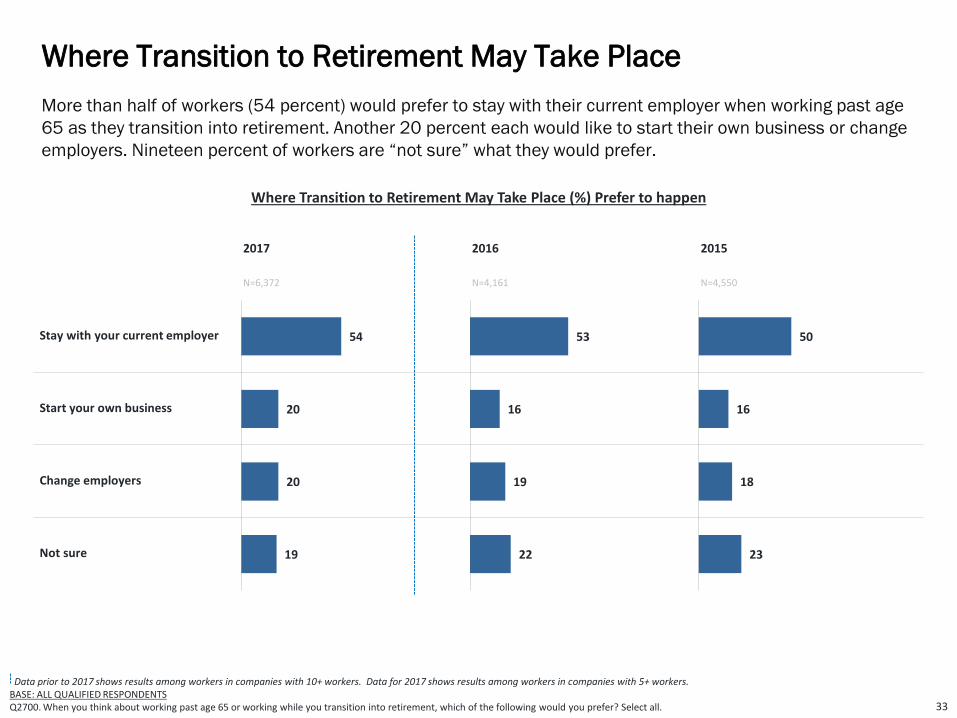
More than half of workers (54 percent) would prefer to stay with their current employer when working past age
65 as they transition into retirement. Another 20 percent each would like to start their own business or change
employers. Nineteen percent of workers are “not sure” what they would prefer.
Where Transition to Retirement May Take Place
33
Data prior to 2017 shows results among workers in companies with 10+ workers. Data for 2017 shows results among workers in companies with 5+ workers.BASE: ALL QUALIFIED RESPONDENTSQ2700. When you think about working past age 65 or working while you transition into retirement, which of the following would you prefer? Select all.
2017 2016 2015
N=6,372 N=4,161 N=4,550
Stay with your current employer
Start your own business
Change employers
Not sure
Where Transition to Retirement May Take Place (%) Prefer to happen
54
20
20
19
50
16
18
23
53
16
19
22

Seventy-two percent of workers agree that their employer is supportive of their employees working past the age
of 65. These findings are consistent since 2014.
Employer Support for Working Past Age 65
34
Data prior to 2017 shows results among workers in companies with 10+ workers. Data for 2017 shows results among workers in companies with 5+ workers.BASE: ALL QUALIFIED RESPONDENTSQ930. How much do you agree or disagree with each of the following statements regarding retirement? “My current employer is supportive of its employees working past 65.”
2017 2016 2015 2014
N=6,372 N=4,161 N=4,550 N=4,143
Strongly agree
Somewhat agree
Somewhat disagree
Strongly disagree
Agree that Employer is Supportive of Employees Working Past 65 (%)
29
43
18
10
28
44
20
8
23
47
20
9
22
50
19
9
NET: Strongly/Somewhat
Agree
72%
NET: Strongly/Somewhat Disagree
28%
NET: Strongly/Somewhat
Agree
71%
NET: Strongly/Somewhat Disagree
29%
NET: Strongly/Somewhat
Agree
72%
NET: Strongly/Somewhat Disagree
28%
NET: Strongly/Somewhat
Agree
72%
NET: Strongly/Somewhat Disagree
28%

2017 2016 2015 2014
N=6,372 N=4,161 N=4,550 N=4,143
*Accommodate flexible work schedules and arrangements
N/A
Enables employees to reduce work hours and shift from full-time to part-time
Enables employees to take positions which are less stressful or demanding
Offers financial counseling about retirement
Encourages employees to participate in succession planning, training and mentoring
*Offer retirement-oriented lifestyle and transition planning resources
N/A
Provides seminars and education about transitioning into retirement
*Provide information about encore careers opportunities
N/A
Other
None of these
Not sure
21
14
13
14
12
3
26
32
One in four workers (24 percent) indicate their employer allows flexible work schedules or reduced work hours
to employees transitioning into retirement. However, one-quarter of workers (25 percent) state that their
employer does not do anything to help employees enter retirement, and 24 percent are “not sure.”
Transitioning to Retirement: How Employers Help
35
Data prior to 2017 shows results among workers in companies with 10+ workers. Data for 2017 shows results among workers in companies with 5+ workers.*added in 2015BASE: ALL QUALIFIED RESPONDENTSQ1533. In which of the following ways, if any, does your current employer help its employees who are transitioning into retirement? Select all.
How Employers Assist Workers With Transitioning Into Retirement (%)
20
20
12
14
12
9
10
9
2
26
30
24
21
16
16
14
12
11
10
2
25
24
19
19
12
12
11
8
9
7
1
23
33

Just over half of workers (56 percent) consider their employer to be “aging friendly,” significantly more than last
year, while one-quarter (23 percent) are “not sure.”
“Aging Friendly” Employer
36
Data prior to 2017 shows results among workers in companies with 10+ workers. Data for 2017 shows results among workers in companies with 5+ workers.BASE: ALL QUALIFIED RESPONDENTS Q2745. Do you consider your employer to be “aging friendly” (for example offering opportunities, work arrangements, and training and tools needed for employees of all ages to be successful in their current role or contribution to the company)?
“Aging Friendly” Employers (%)
2017N=6,372
2016N=4,161
2015N=4,550
Yes
No
Not sure
56
21
23
48
25
27
45
23
32

Seven in ten workers (71 percent) cite an affordable cost of living as a very important criterion for choosing
where to live in retirement, a finding that is similar to previous years. Being near family and friends (54 percent)
is the second most commonly cited criterion. The survey finds a disconnect in that only 25 percent of workers
cite employment opportunities as a very important criterion, while 56 percent plan to work in retirement.
Very Important Criteria Re: Where to Live in Retirement
37
Data prior to 2017 shows results among workers in companies with 10+ workers. Data for 2017 shows results among workers in companies with 5+ workers.BASE: ALL QUALIFIED RESPONDENTSQ2725. When thinking about where you want to live in retirement, which of the following criteria will be very important in your decision-making? Select all.
2017 2016 2015N=6,372 N=4,161 N=4,550
Affordable cost of living
Nearby family and friends
Good weather
Low crime rate
Access to excellent healthcare and hospitals
Leisure and recreational activities
A walkable community with easy access to retailers and amenities
Convenient transportation
Cultural activities and events
Employment opportunities
Community engagement or volunteer opportunities including churches and charitable organizations
Access to continuing education at nearby schools, universities, and educational resources
Very Important Criteria in Choosing Where to Live in Retirement (%)
70
51
46
44
41
40
31
29
24
20
16
9
71
54
49
49
43
41
33
31
27
25
18
9
74
51
54
50
44
44
34
32
27
21
17
8
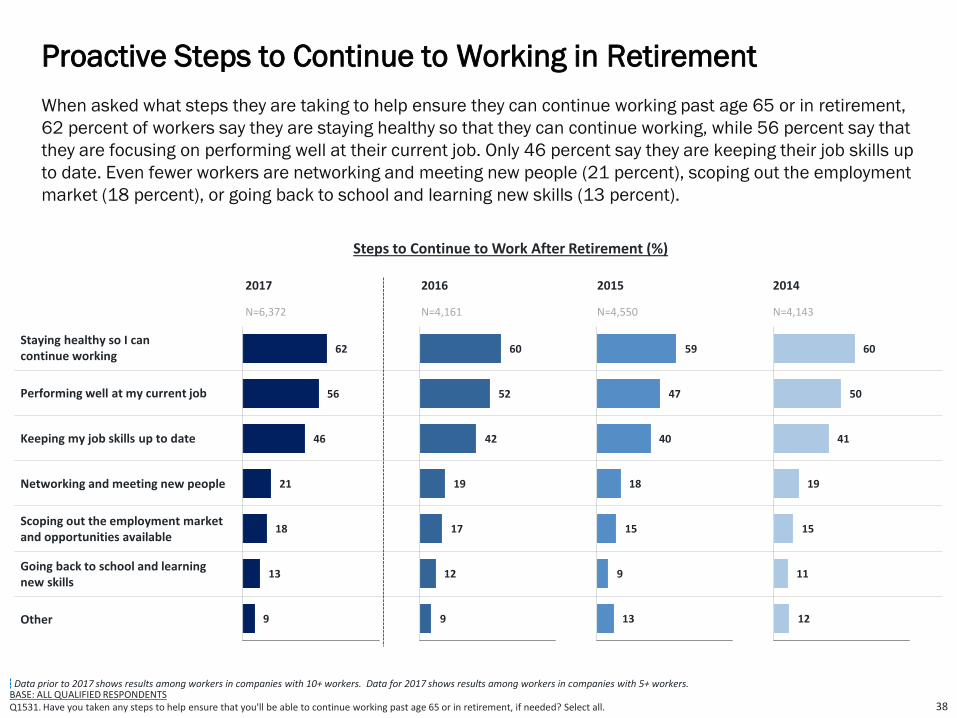
When asked what steps they are taking to help ensure they can continue working past age 65 or in retirement,
62 percent of workers say they are staying healthy so that they can continue working, while 56 percent say that
they are focusing on performing well at their current job. Only 46 percent say they are keeping their job skills up
to date. Even fewer workers are networking and meeting new people (21 percent), scoping out the employment
market (18 percent), or going back to school and learning new skills (13 percent).
Proactive Steps to Continue to Working in Retirement
38
Data prior to 2017 shows results among workers in companies with 10+ workers. Data for 2017 shows results among workers in companies with 5+ workers.BASE: ALL QUALIFIED RESPONDENTSQ1531. Have you taken any steps to help ensure that you'll be able to continue working past age 65 or in retirement, if needed? Select all.
2017 2016 2015 2014
N=6,372 N=4,161 N=4,550 N=4,143
Staying healthy so I can continue working
Performing well at my current job
Keeping my job skills up to date
Networking and meeting new people
Scoping out the employment market and opportunities available
Going back to school and learning new skills
Other
Steps to Continue to Work After Retirement (%)
60
52
42
19
17
12
9
62
56
46
21
18
13
9
59
47
40
18
15
9
13
60
50
41
19
15
11
12

Almost three in four workers (73 percent) are concerned about their health in older age. Half of workers are
somewhat concerned while 23 percent are very concerned.
Level of Concern About Health in Older Age
39
New question added in 2017BASE: ALL QUALIFIED RESPONDENTSQ1445X1. How concerned are you about your health in older age?
23
50
23
4
Very concerned Somewhat concerned
Not too concerned Not at all concerned
2017N=6,372
Concerned About Health in Older Age (%)
NET – Concerned:73%

Engagement in Health-Related Activities on a Consistent Basis
2017N=6,372
Eating healthfully
Exercising regularly
Maintaining a positive outlook
Seeking medical attention when needed
Avoiding harmful substances (e.g., cigarettes, alcohol, illicit drugs, etc.)
Getting plenty of rest
Getting routine physicals and recommended health screenings
Managing stress
Considering long-term health when making lifestyle decisions
Practicing mindfulness and meditation
Other
Nothing
56
54
53
53
50
49
48
44
25
20
1
4
New question added in 2017
BASE: ALL QUALIFIED RESPONDENTS
Q1446. Which of the following health-related activities are you doing on a consistent basis? Select all. 40
Almost all workers (96 percent) are doing at least one health-related activity on a consistent basis, with more
than half of workers eating healthfully (56 percent), exercising regularly (54 percent), maintaining a positive
outlook (53 percent), seeking medical attention when needed (53 percent), and/or avoiding harmful
substances (50 percent). Engaging in Health-Related Activities on a Consistent Basis (%)

Perceptions of Older Workers
41
2017N=6,372
NET – Positive perceptions
Bring more knowledge, wisdom, and life experience
Are more responsible, reliable, and dependable
Are a valuable resource for training and mentoring
Are an important source of institutional knowledge
Are more adept at problem-solving
Are better at getting along with others in a team environment
NET – Negative perceptions
Have higher healthcare costs
Command higher wages and salaries
Are less open to learning and new ideas
Have higher disability costs
Have outdated skill sets
Are less productive
Other
None
84
62
57
50
42
34
31
54
28
20
19
14
13
10
1
8
New question added in 2017BASE: ALL QUALIFIED RESPONDENTS Q1528. What are your perceptions of workers age 50 and older compared to younger workers in today’s workforce? Select all.
Eighty-four percent of workers have a positive perception of workers age 50 and older compared to younger
workers in today’s workforce, while 54 percent of workers hold a negative perception. The most common
positive perception is that they bring more knowledge, wisdom, and life experience (62 percent), while the most
common negative perception is that they have higher healthcare costs (28 percent).
Perceptions of workers age 50+ compared to younger workers in today’s workforce? (%)

Age That Workers Consider a Person to Be “Too Old” to Work
42
A majority of workers (54 percent) believe it is not a particular age when they consider a person “too old” to
work but “it depends on the person.” Of those who provided an age deeming a person “too old” to work, the
median age is 75.
27
18
11
3 1
54
4
<60 60-69 70-79 80-89 90-99 100+ It depends on theperson
Not Sure
Age When Person is Considered “Too Old” to Work (%)
2017 (N=6,372)
New question added in 2017BASE: ALL QUALIFIED RESPONDENTS Q1527. At what age do you consider a person to be “too old” to work?
Median: Age 75

Age That Workers Consider a Person to Be “Old”
43
Two in five workers (40 percent) believe that there it is not a particular age when they consider a person to be
“old,” but rather “it depends on the person.” Of those who provided an age, the median age when workers
deem a person to be “old” is 70, with the largest proportion of responses falling between ages 70 and 79 (18
percent)
New question added in 2017BASE: ALL QUALIFIED RESPONDENTS Q1526. At what age do you consider a person to be “old”?
1015
18
10
3 1
40
3
<60 60-69 70-79 80-89 90-99 100+ It depends on theperson
Not Sure
Age When Person Is Considered “Old” (%)
2017 (N=6,372)
Median: Age 70

Workers in 2017 are planning to live to age 90 (median), an increase from 86 (median) in 2016. About half (49
percent) are planning to live to age 80 or older. Thirty-two percent are planning to live to age 90 or older.
Fourteen percent are planning to 100 or older. And four in ten workers (41 percent) say that they are “not
sure.”
Planning to Live to Age ...
44
Data prior to 2017 shows results among workers in companies with 10+ workers. Data for 2017 shows results among workers in companies with 5+ workers.
BASE: ALL QUALIFIED RESPONDENTS
Q2850. What age are you planning to live to?
2017: Median Age: 902016: Median Age: 86
What age are you planning to live to? (%)
2 2 6
17 18 14
41
5 310
2923
16 14
<60 60-69 70-79 80-89 90-99 100+ Not Sure
2017
2016
N=6,372
N=4,161
“Paying off debt” (NET) is the most frequently cited current financial priority among workers (66 percent), with
paying off credit card debt the most cited within this category (43 percent). Building savings (59 percent), and
saving for retirement (57 percent) follow closely. Thirty-four percent cite “just getting by to cover basic living
expenses.”
45
■ 2017 (N=6,372)
NET – Paying off debt
Paying off credit card debt
Paying off mortgage
Paying off student loans
Paying off other consumer debt
Building savings
Saving for retirement
Just getting by to cover basic living expenses
Supporting children
Paying healthcare expenses
Creating an inheritance or financial legacy
Supporting parents
Other
66
43
32
17
16
59
57
34
30
25
11
10
4
BASE: ALL QUALIFIED RESPONDENTSQ2639. Which of the following are your financial priorities right now? Select all.
Current Financial Priorities (%)
Current Financial Priorities
“Paying off debt” (NET) (29 percent) is the most frequently cited top financial priority among workers. Other top
priorities are saving for retirement (19 percent) “just getting by – covering basic living expenses” (17 percent),
and paying off credit card debt (16 percent).
Greatest Financial Priority
46
Single Greatest Financial Priority Right Now (%)
BASE: ALL QUALIFIED RESPONDENTS Q2640. Which one of the following is your greatest financial priority right now?
■ 2017 (N=6,372)
NET – Paying off debt
Paying off credit card debt
Paying off mortgage
Paying off student loans
Paying off other consumer debt
Saving for retirement
Just getting by to cover basic living expenses
Building savings
Supporting children
Paying healthcare expenses
Supporting parents
Creating an inheritance or financial legacy
Other
29
16
9
2
2
19
17
13
12
2
2
2
4

A large majority (86 percent) of American workers’ households carry at least some form of debt with credit card
debt being most prevalent (59 percent), followed by a mortgage (43 percent), or a car loan (40 percent). Only
14 percent of households have no debt.
Types of Household Debt
47
2017N=6,372
Credit card
Mortgage
Car loan
Student loan
Medical debt
Personal loan
Home equity loan
Loan from family or friends
Tax debt
Payday loan
Business loan
Investment debt
Other debt
My household currently does not have any debts
59
43
40
20
15
14
9
6
6
5
3
3
3
14
New question added in 2017BASE: ALL QUALIFIED RESPONDENTS Q1286. Which of the following types of debt does your household currently have? Select all.
Which of the following types of debt does your household currently have? Select all (%)
NET – Has Debt2017 = 86%

Many workers have little in terms of emergency savings specifically to cover the cost of major financial setbacks
such as unemployment, medical bills, home repairs, auto repairs, and other. Workers have saved $5,000
(median) to cover such emergencies. Thirty-six percent of workers report having saved less than $5,000. Only
19 percent say that they have saved more than $25,000.
Emergency Savings Are Low
48
21 21
15 14
8 8
7 6
3 3
33
19 21
2017 2016
$25k or more
$20k to less than $25k
$15k to less than $20k
$10k to less than $15k
$5k to less than $10k
$1k to less than $5k
Less than $1k
Not sure 24 24Median $5,000 $5,000
Estimated Emergency Savings (%)
Data prior to 2017 shows results among workers in companies with 10+ workers. Data for 2017 shows results among workers in companies with 5+ workers.
BASE: ALL QUALIFIED RESPONDENTS
Q2825. How much do you have in emergency savings specifically to cover the cost of unexpected major financial setbacks (e.g., unemployment, medical bills, home repairs, auto repairs, other)?
N=6,372 N=4,161

Seventy-seven percent of workers are saving for retirement through an employer-sponsored retirement plan
and/or outside of work. The median age workers begin saving for retirement is age 27. These findings are
consistent since 2013.
Saving for Retirement / Age Started Saving
49
77 77 76 78 78
2017 2016 2015 2014 2013
Workers Who Are Saving For Retirement Through an Employer-Sponsored Retirement Plan And/Or Outside of Work (%)
Age Started Saving (Median)
27 years 27 years 27 years 27 years 27 years
Data prior to 2017 shows results among workers in companies with 10+ workers. Data for 2017 shows results among workers in companies with 5+ workers.BASE: THOSE CURRENTLY OFFERED QUALIFIED PLANQ1190. Do you currently participate in, or have money invested in your company’s employee-funded retirement savings plan?BASE: ALL QUALIFIED RESPONDENTSQ740. Are you currently saving for retirement outside of work, such as in an IRA, mutual funds, bank account, etc.?BASE: INVESTING FOR RETIREMENTQ790. At what age did you first start saving for retirement?

Data prior to 2017 shows results among workers in companies with 10+ workers. Data for 2017 shows results among workers in companies with 5+ workers.BASE: ALL QUALIFIED RESPONDENTS Q1145. Which one of the following do you expect to be sources of income to cover your living expenses after you retire? Select all.
Self-funded savings including retirement accounts (e.g., 401(k)s, 403(b)s, IRAs) and other savings and
investment are the most frequently cited sources of retirement income expected by workers (82 percent),
followed by Social Security (74 percent). Today’s workers are expecting diverse sources of income, including
39 percent who cite “working” as an expected source of retirement income. Company-funded pension plans
(23 percent), home equity (14 percent), and inheritance (11 percent) are less frequently cited by workers.
Expected Sources of Retirement Income
50
2017 2016 2015N=6,372 N=4,161 N=4,550
NET – Self-Funded Savings
401(k) / 403(b) Accounts / IRAs
Other savings and investments
Social Security
Working
Company-funded pension plan
Home equity
Inheritance
Other
Expected Sources of Income During Retirement (%)
82
71
51
74
39
23
14
11
3
78
69
47
70
38
25
14
11
4
77
68
45
69
37
23
13
11
5
Data prior to 2017 shows results among workers in companies with 10+ workers. Data for 2017 shows results among workers in companies with 5+ workers.*added in 2015BASE: ALL QUALIFIED RESPONDENTS Q1150. Which one of the following do you expect to be your primary source of income to cover your living expenses after you retire?
Many workers expect to self-fund their retirement, either through 401(k)s or similar accounts and/or IRAs (37
percent), or other savings and investments (12 percent). Twenty-six percent of workers plan to rely on Social
Security as their primary source of income in retirement. This year’s survey found that 14 percent expect that
income from “working” will be their primary source of income to cover living expenses when they retire.
Primary Source of Retirement Income
51
2017 2016 2015 2014 2013
N=6,372 N=4,161 N=4549 N=4,143 N=3,651
401(k) / 403(b) Accounts / IRAs
Social Security
*Working N/A N/A
Other savings and investments
Company-funded pension plan
Home equity
Inheritance
Other
Single Greatest Financial Priority Right Now (%)
36
25
15
11
7
1
2
3
37
26
14
12
7
1
1
2
37
26
13
12
6
1
2
3
43
26
15
7
2
2
5
41
27
16
8
1
2
5

Workers highly value employer-sponsored retirement benefits — 88 percent of workers say that an employee-
funded retirement plan is “very” or “somewhat” important and 72 percent indicate pension plans are
important. Health insurance continues to be the most frequently cited important benefit (95 percent).
Importance of Retirement Benefits Compared to Other Benefits
52
Data prior to 2017 shows results among workers in companies with 10+ workers. Data for 2017 shows results among workers in companies with 5+ workers.*added in 2014; **added in 2017BASE: ALL QUALIFIED RESPONDENTS
Q1170. Businesses typically offer a number of different benefits for their workers. For each of the following, please tell us how important that benefit is to you, personally.
2017 2016 2015 2014 2013
N=6,372 N=4,161 N=4,550 N=4,143 N=3,651
Health insurance
401(k) / 403(b) / 457(b) or other employee self-funded plan
Life insurance
Disability insurance
Long-Term Care insurance
Company-funded defined-benefit pension plan
*A company-funded cash balance plan N/A
Critical Illness Insurance
**Financial Wellness Program N/A N/A N/A N/A
**Employee Assistance Program N/A N/A N/A N/A
**Workplace Wellness Program N/A N/A N/A N/A
Cancer Insurance
Top 2 Box % – (Very/Somewhat Important)
Very important
Somewhat important
16
26
38
42
40
33
34
39
34
78
62
37
34
31
39
22
25
21
94
88
75
76
71
72
56
64
55
16
31
38
42
42
38
40
42
39
78
58
34
36
29
40
21
25
20
94
89
72
78
71
78
62
67
59
16
30
40
43
42
36
42
37
78
60
30
34
25
40
24
21
94
90
70
77
67
76
65
57
16
29
38
42
43
36
36
39
35
79
60
37
34
28
37
18
23
17
95
89
74
76
71
73
54
61
52
17
26
37
41
42
36
37
39
39
38
36
35
78
62
39
34
31
36
29
26
24
24
23
22
95
88
76
75
73
72
66
65
63
62
59
57

The majority of workers (81 percent) agree that the retirement savings programs offered by a prospective
employer will be a major factor in their job search decision, a slight increase from previous years.
Importance of Retirement Benefits in Job Selection
53
Data prior to 2017 shows results among workers in companies with 10+ workers. Data for 2017 shows results among workers in companies with 5+ workers.BASE: ALL QUALIFIED RESPONDENTSQ831. How much do you agree or disagree with the following statement? “The next time I look for a job, all things being equal, the retirement savings programs offered by the prospective employer will be a major factor in my final decision”
2017 2016 2015 2014
n=6,372 n=4,161 N=4,550 N=4,143
Strongly agree
Somewhat agree
Somewhat disagree
Strongly disagree
“The next time I look for a job, all things being equal, the retirement savings programs offered by the prospective employer will be a major factor in my final decision” (%)
29
52
14
5
24
54
16
6
23
54
17
6
23
54
17
6
NET: Strongly/Somewhat
Agree
78%
NET: Strongly/Somewhat
Agree
77%
NET: Strongly/Somewhat
Agree
77%
NET: Strongly/Somewhat
Agree
81%

When selecting between two hypothetical job offers, workers are equally likely to say they would select a job
with a higher than expected salary, but poor retirement benefits (50 percent) versus a job with excellent
retirement benefits, but only meeting minimum salary requirements (50 percent).
Better Retirement Benefits Versus Higher Salary
54
50 50 49 5047
50 50 51 5053
2017 2016 2015 2014 2013 2017 2016 2015 2014 2013
Data prior to 2017 shows results among workers in companies with 10+ workers. Data for 2017 shows results among workers in companies with 5+ workers.BASE: ALL QUALIFIED RESPONDENTS Q830. Suppose that two job offers come your way. Which of the following job offers would you select?
Excellent retirement benefits, but only meets your minimum salary requirements.
A higher than expected salary, but poor retirement benefits.
N=6,372 N=4,161 N=4,550 N=4,143 N=3,651 N=6,372 N=4,161 N=4,550 N=4,143 N=3,651
OPTIONS

◄ NOT LIKELY LIKELY ► ◄ NOT LIKELY LIKELY ►
2017 N=1,797 2017 N=6,372
2016 N=1,048 2016 N=4,161
2015 N=1,242 2015 N=4,550
2014 N=1,118 2014 N=4,143
2013 N=1,014 2013 N=3,651
Data prior to 2017 shows results among workers in companies with 10+ workers. Data for 2017 shows results among workers in companies with 5+ workers.
BASE: ALL QUALIFIED RESPONDENTS
Q730. How likely would you be to leave your current employer to take a nearly identical job, with a similar employer, if that employer offered you [a retirement plan/a better retirement plan than that offered by your current employer]?
The majority of workers (65 percent) whose employers do not offer a retirement plan would be likely to switch
jobs for a similar job with a retirement plan. Among all workers, more than half (59 percent) would switch jobs
for a better retirement plan. These are up somewhat from previous years.
Workers May Switch Employers for Better Retirement Benefits
55
Among Those Whose EmployerDoesn’t Offer Retirement Plan (%) Among All Workers (%)
21
21
23
24
22
14
19
17
17
13
35
40
40
42
34
36
33
35
33
37
29
27
25
26
29
65
60
60
58
66
Not at all likely Not too likely
Somewhat likely Very likely
26
27
31
29
30
15
19
19
19
15
41
46
50
48
45
36
35
34
35
37
23
19
17
17
18
59
54
50
52
55
Not likely at all Not too likely
Somewhat likely Very likely

The vast majority of workers (77 percent) are offered health insurance at their company. Life insurance (55
percent) and disability insurance (45 percent) are also commonly offered. These trends have remained
relatively consistent over the past five years.
Health & Welfare Benefits Currently Offered
56
Data prior to 2017 shows results among workers in companies with 10+ workers. Data for 2017 shows results among workers in companies with 5+ workers.**added in 2017 BASE: ALL QUALIFIED RESPONDENTS Q1175. Which of the following benefits does your company offer you, personally? Select all.
2017 2016 2015 2014 2013
N=6,372 N=4,161 N=4,550 N=4,143 N=3,651
Health Insurance
Life Insurance
Disability Insurance
**Employee Assistance Program N/A N/A N/A N/A
**Workplace Wellness Program N/A N/A N/A N/A
Long Term Care Insurance
**Financial Wellness Program N/A N/A N/A N/A
Critical Illness Insurance
Cancer Insurance
None of the above
Which of the following benefits does your company offer you, personally? Select all. (%)
80
57
48
23
14
9
17
77
55
45
28
25
20
14
13
8
18
76
54
47
23
12
7
22
78
55
48
26
13
8
20
74
55
46
20
9
6
22

2017 2016 2015 2014 2013
N=6,372 N=4,161 N=4,550 N=4,143 N=3,651
NET - EMPLOYEE-FUNDED PLAN
Employee-funded 401(k) plan
Other employee self-funded plan (e.g., SEP, SIMPLE, Other)
NET - COMPANY-FUNDED PLAN N/A
Company-funded defined benefit pension plan
*Company-funded cash balance plan
N/A
NET - NONE OF THE ABOVE
Other N/A N/A N/A N/A
None N/A N/A N/A N/A
68
65
5
18
28
Seventy-one percent of workers are offered employee-funded retirement plans such as 401(k)s and/or other
employee-funded plans. A quarter (26 percent) are offered a company-funded pension plan. However, 22
percent of workers are not offered any type of retirement plan.
Retirement Benefits Currently Offered
57
Data prior to 2017 shows results among workers in companies with 10+ workers. Data for 2017 shows results among workers in companies with 5+ worker.*added in 2014BASE: ALL QUALIFIED RESPONDENTSQ1180. Which of the following retirement benefits does your company currently offer to you, personally? Select all.
Retirement Benefits Currently Offered (%)
71
68
4
26
23
8
23
71
67
7
26
22
9
24
2
22
66
64
4
24
20
8
28
68
66
3
24
19
9
25

Among workers who are offered an employee-funded retirement plan, participation is relatively high at 81
percent, slightly higher than last year. The median percentage of salary being saved in 2017 is 10 percent of
annual pay, an increase from prior years.
Retirement Plan Participation and Contribution Rates
58
Data prior to 2017 shows results among workers in companies with 10+ workers. Data for 2017 shows results among workers in companies with 5+ workers.BASE: THOSE WITH QUALIFIED PLANS CURRENTLY OFFERED TO THEMQ1190. Do you currently participate in, or have money invested in your company’s employee-funded retirement savings plan?BASE: THOSE CURRENTLY PARTICIPATING IN THEIR QUALIFIED PLAN Q601. What percentage of your salary are you saving for retirement through your company-sponsored plan this year?
N=4,084 N=2,820 N=2,976 N=2,753 N=2,510
81 77 80 80 78
2017 2016 2015 2014 2013
Mean 12.9% 10.9% 10.4% 11.1% 9.6%
N=3,131 N=2,155 N=2,290 N=2,167 N=1,968
Participation in Company’s Employee-FundedRetirement Savings Plan, % Indicate “Yes”
Median Percentage of Salary Being SavedAmong Those Participating (%)
10.08.0 8.0 8.0 7.0
2017 2016 2015 2014 2013

Among workers not participating in their company-sponsored plan, the reason most frequently cited is being
financially stretched with other financial priorities (33 percent). Almost one in five cite that they save for
retirement in other ways (19 percent).
Reasons for Not Participating in Retirement Plan
59BASE: THOSE NOT CURRENTLY CONTRIBUTING TO PLANQ670. Which of the following is the main reason you are not currently participating in your company’s retirement plan? Select all.
■ 2017 (N=947)
Financially stretched with other financial priorities
I save for retirement in other ways
Intend to sign up - just haven't taken the time to do so yet
Need to pay off credit debt
Do not plan to stay at current employer much longer
Just started with company
Not eligible to join
Need to pay off other consumer debt
My spouse/partner already contributes to their retirement funds
Some other reason
33
19
16
16
15
14
9
8
5
8
Reasons for Not Participating in Retirement Plan (%)

Eight in ten workers (81 percent) find automatic enrollment by their current employer into an employee
sponsored retirement plan appealing. If workers were to be automatically enrolled, the median default
contribution rate they feel is appropriate is 7 percent.
Appeal of Automatic Enrollment
60
New question added in 2017BASE: ALL QUALIFIED RESPONDENTS Q635. Imagine that your current employer automatically enrolled you into a 401(k), 403(b) or similar retirement plan, deducting a percentage of each paycheck, and investing it for your future retirement. How appealing would this seem to you?Q636. Imagine that your current employer automatically enrolled you into a 401(k), 403(b) or similar retirement plan, what would you consider to be an appropriate percentage to deduct from your paycheck to be invested for your future retirement?
39
42
12
7
Very appealing Somewhat appealing
Somewhat unappealing Not at all appealing
2017 (N=6,372)
Appeal of Automatic Enrollment (%)
2017 (N=6,372)
Appropriate Default Contribution Rate (%)
3
4134
10 12
0% 1-5% 6-10% 11-15% 16-20%
Median:7%
NET – Appealing:81%

Three in four workers (75 percent) are either somewhat likely (44 percent) or very likely (31 percent) to use a
feature that would allow their employer to automatically increase the contribution rate in their 401(k) or similar
plan by 1% each year, until they choose to discontinue the increase.
Likelihood of Using Automatic Escalation
61
New question added in 2017BASE: ALL QUALIFIED RESPONDENTS Q702. How likely would you be to use a feature in a 401(k) or similar plan where your employer would automatically increase your contribution rate (as a percentage of your salary) to the plan by 1% each year, until you choose to discontinue this increase?
31
44
16
9
2017 (N=6,372)
Likelihood of Using a Feature That Automatically Increases Contribution by 1% Each Year, Until You Choose to Discontinue (%)
Very likely Somewhat likely Not too likely Not at all likely
NET – Likely:75%
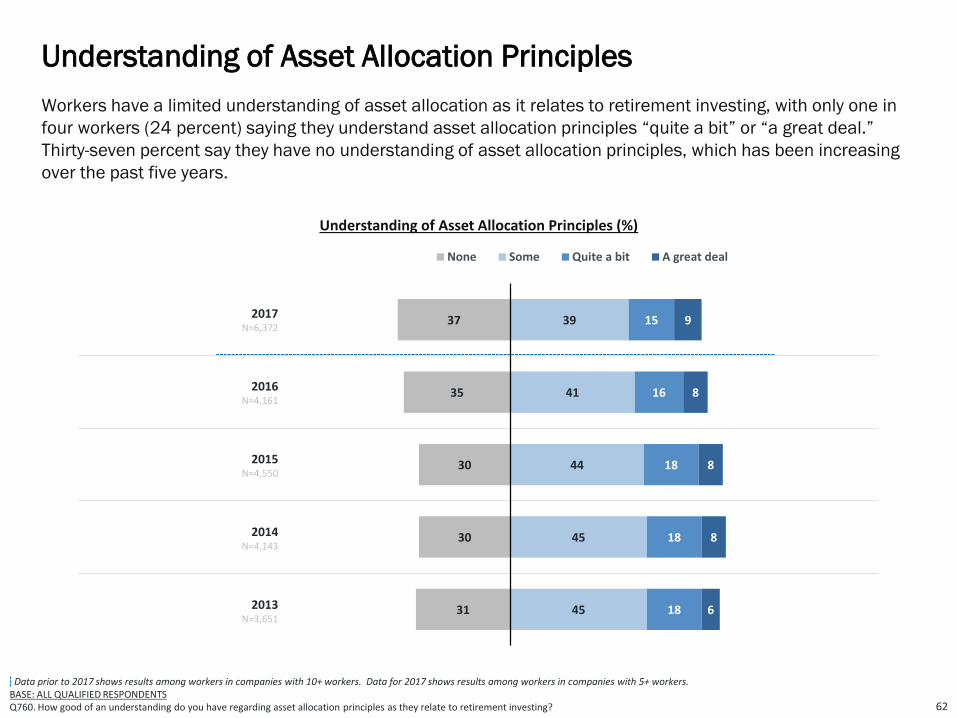
2017N=6,372
2016N=4,161
2015N=4,550
2014N=4,143
2013N=3,651
Data prior to 2017 shows results among workers in companies with 10+ workers. Data for 2017 shows results among workers in companies with 5+ workers.BASE: ALL QUALIFIED RESPONDENTSQ760. How good of an understanding do you have regarding asset allocation principles as they relate to retirement investing?
Workers have a limited understanding of asset allocation as it relates to retirement investing, with only one in
four workers (24 percent) saying they understand asset allocation principles “quite a bit” or “a great deal.”
Thirty-seven percent say they have no understanding of asset allocation principles, which has been increasing
over the past five years.
Understanding of Asset Allocation Principles
62
37
35
30
30
31
39
41
44
45
45
15
16
18
18
18
9
8
8
8
6
None Some Quite a bit A great deal
Understanding of Asset Allocation Principles (%)
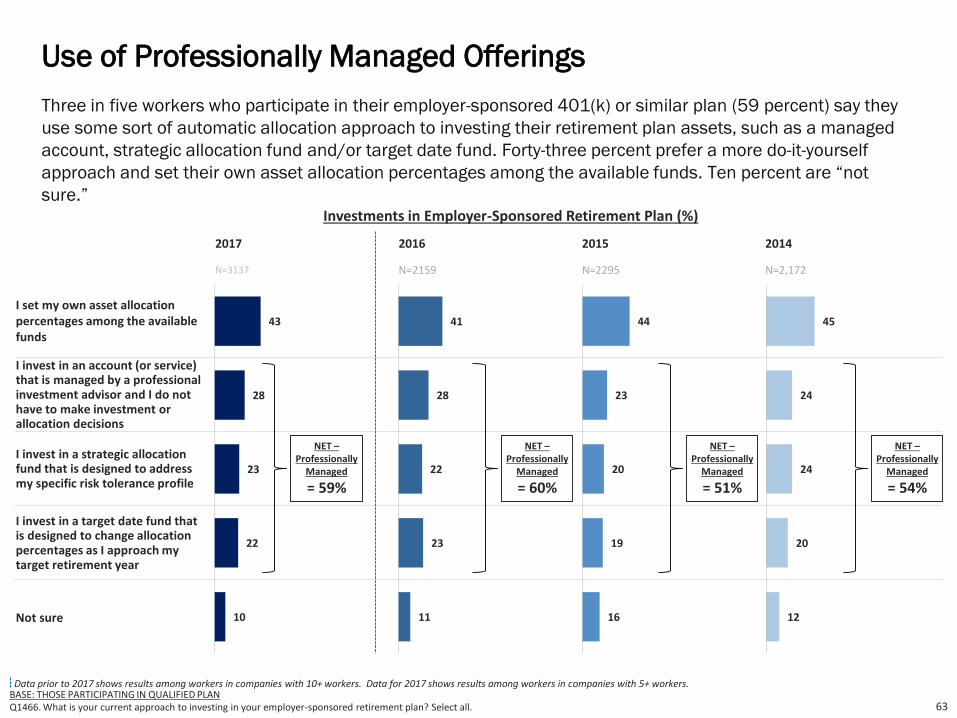
Three in five workers who participate in their employer-sponsored 401(k) or similar plan (59 percent) say they
use some sort of automatic allocation approach to investing their retirement plan assets, such as a managed
account, strategic allocation fund and/or target date fund. Forty-three percent prefer a more do-it-yourself
approach and set their own asset allocation percentages among the available funds. Ten percent are “not
sure.”
Use of Professionally Managed Offerings
63
Data prior to 2017 shows results among workers in companies with 10+ workers. Data for 2017 shows results among workers in companies with 5+ workers.BASE: THOSE PARTICIPATING IN QUALIFIED PLANQ1466. What is your current approach to investing in your employer-sponsored retirement plan? Select all.
2017 2016 2015 2014
N=3137 N=2159 N=2295 N=2,172
I set my own asset allocation percentages among the available funds
I invest in an account (or service) that is managed by a professional investment advisor and I do not have to make investment or allocation decisions
I invest in a strategic allocation fund that is designed to address my specific risk tolerance profile
I invest in a target date fund that is designed to change allocation percentages as I approach my target retirement year
Not sure
Investments in Employer-Sponsored Retirement Plan (%)
41
28
22
23
11
43
28
23
22
10
44
23
20
19
16
45
24
24
20
12
NET –Professionally
Managed
= 59%
NET –Professionally
Managed
= 54%
NET –Professionally
Managed
= 51%
NET –Professionally
Managed
= 60%
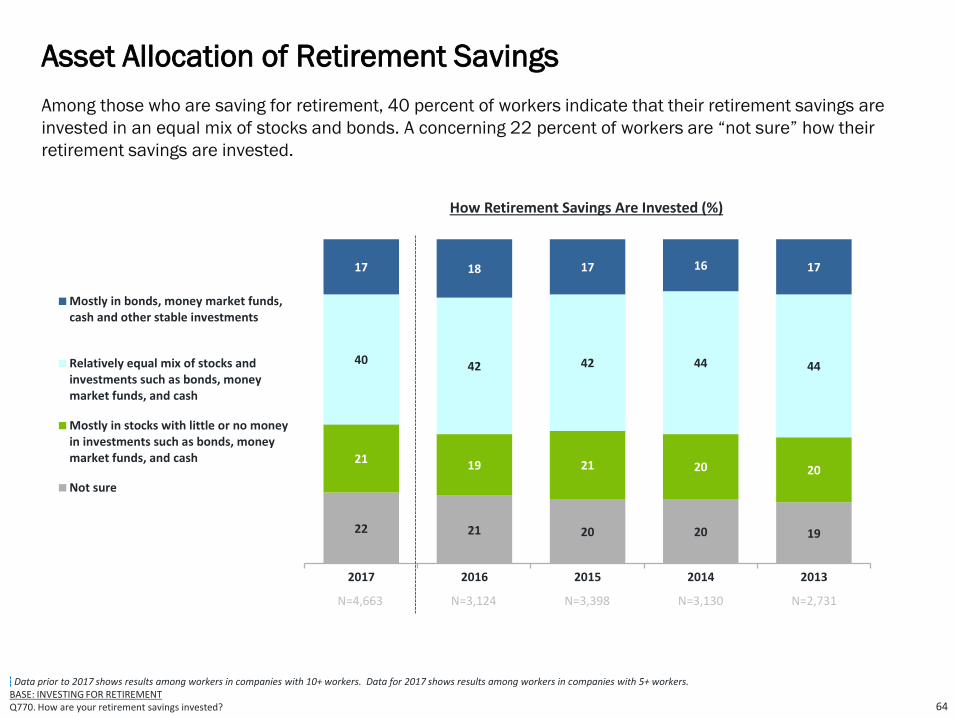
22 21 20 20 19
21 19 21 20 20
40 42 42 44 44
17 18 17 16 17
2017 2016 2015 2014 2013
Mostly in bonds, money market funds,cash and other stable investments
Relatively equal mix of stocks andinvestments such as bonds, moneymarket funds, and cash
Mostly in stocks with little or no moneyin investments such as bonds, moneymarket funds, and cash
Not sure
Data prior to 2017 shows results among workers in companies with 10+ workers. Data for 2017 shows results among workers in companies with 5+ workers.BASE: INVESTING FOR RETIREMENTQ770. How are your retirement savings invested?
N=4,663 N=3,124 N=3,398 N=3,130 N=2,731
Among those who are saving for retirement, 40 percent of workers indicate that their retirement savings are
invested in an equal mix of stocks and bonds. A concerning 22 percent of workers are “not sure” how their
retirement savings are invested.
Asset Allocation of Retirement Savings
64
How Retirement Savings Are Invested (%)

“Leakage” from retirement plans in the form of loans and withdrawals can severely inhibit the growth of
participants’ long-term retirement savings. About one in three workers (29 percent) have taken some form of
loan, early withdrawal, and/or hardship withdrawal from a 401(k) or similar plan or IRA.
Retirement Plan Leakage: Loans and Withdrawals
65
Data prior to 2017 shows results among workers in companies with 10+ workers. Data for 2017 shows results among workers in companies with 5+ workers.BASE: ALL QUALIFIED RESPONDENTSQ754. Have you ever taken any form of loan or early withdrawal from a qualified retirement account such as a 401(k) or similar plan or IRA? Select all.
■ 2017 (N=4084) ■ 2016 (N=2820)
NET - Have Taken a Loan, Early Withdrawal, and/or Hardship Withdrawal From 401(k) or Similar Plan or IRA
Yes, I have taken a loan from a 401(k) or similar plan and am paying it back
Yes, I have taken a hardship withdrawal and incurred taxes and penalties
Yes, I have taken an early withdrawal and cashed out a portion or all of a 401(k) or similar plan balance after my separation of employment from a prior employer and incurred taxes and penalties
Yes, I have taken a loan from a 401(k) or similar plan but was unable to pay it back so it became an early withdrawal and incurred taxes and penalties
Yes, I have taken an early withdrawal and cashed out a portion or all of an IRA and incurred taxes and penalties
No, I have never taken a loan or early withdrawal from a 401(k) or similar plan or IRA
Not sure
29
15
7
7
6
5
67
3
Have you ever taken any form of loan or early withdrawal from a qualified retirement account such as a 401(k) or similar plan or IRA? (%)
26
14
5
7
5
4
70
5

Among workers who have taken a retirement plan loan, the most frequently cited reason for doing so is to pay
off debt (35 percent), including credit card debt (24 percent) and/or other debt (20 percent). Other reasons for
taking a loan include a financial emergency (24 percent), medical bills (23 percent), or unplanned major
expenses (21 percent).
Reasons for Taking Plan Loans
66
Reasons for Taking Loan From Retirement Plan (%) 2017N=1096
NET – Pay Off Debt
Pay off credit card debt
Pay off other debt
A financial emergency
Medical bills
Unplanned major expenses (e.g. home or car repair, etc.)
Home improvements
Everyday expenses
Purchase of primary residence
Purchase of a vehicle
College tuition
Avoid eviction
Burial or funeral expense
Some other purpose
35
24
20
24
23
21
19
19
17
14
10
10
8
10
BASE: THOSE WHO HAVE TAKEN A LOANQ659. For what purpose(s) did you take out a loan(s)? Select all.

Data prior to 2017 shows results among workers in companies with 10+ workers. Data for 2017 shows results among workers in companies with 5+ workers.BASE: THOSE WHO HAVE TAKEN A HARDSHIP WITHDRAWALQ1465. What is the primary reason you have taken a hardship withdrawal from your employee-funded retirement savings plan?
Among workers who have taken a hardship withdrawal from their employer-sponsored retirement plan, about
one in five (23 percent) say the primary reason for the withdrawal is to prevent eviction from their home, and
another 17 percent say it is to pay for certain medical expenses.
Reasons for Taking Hardship Withdrawals From Plans
67
Note: Findings from prior years should be considered directional due to small base.
Primary Reason for Hardship Withdrawal (%)
Payments to prevent your eviction from your principal residence
Pay for certain medical expenses
Cover the costs related to the purchase of a principal residence
Payment of tuition and related educational fees for the next 12 months of post-secondary education
Expenses for repairs of damage to your principal residence that would qualify for the casualty deduction
Burial or funeral expenses for your deceased parent, spouse, children or dependents (as defined in Internal
Revenue Code section 152)
Other
23
17
15
14
9
7
15
20
24
16
15
8
7
10
17
28
7
14
12
7
15
19
30
8
15
11
9
8
30
14
13
18
6
6
13
■ 2017 N=389■ 2016 N=218■ 2015 N=153■ 2014 N=117■ 2013 N=108

Data prior to 2017 shows results among workers in companies with 10+ workers. Data for 2017 shows results among workers in companies with 5+ workers.BASE: ALL QUALIFIED RESPONDENTS Q740. Are you currently saving for retirement outside of work, such as in an IRA, mutual funds, bank account, etc.?
The majority of workers (59 percent) are saving for retirement outside of work in an IRA, mutual fund, bank
account or other vehicle. This is a slight increase from last year.
Saving for Retirement Outside of Work
68
N=6,372 N=4,161 N=4,550 N=4,143 N=3,651
5956 58 60 61
2017 2016 2015 2014 2013
Currently Saving for Retirement Outside of Work% Indicate Yes
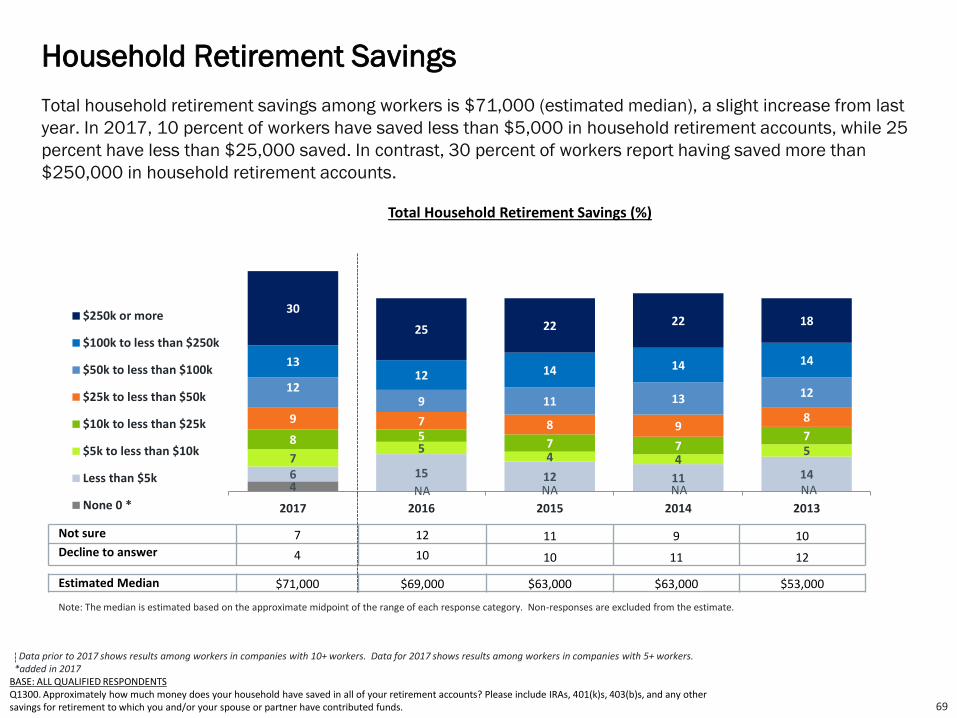
Total household retirement savings among workers is $71,000 (estimated median), a slight increase from last
year. In 2017, 10 percent of workers have saved less than $5,000 in household retirement accounts, while 25
percent have less than $25,000 saved. In contrast, 30 percent of workers report having saved more than
$250,000 in household retirement accounts.
Household Retirement Savings
69
Data prior to 2017 shows results among workers in companies with 10+ workers. Data for 2017 shows results among workers in companies with 5+ workers.*added in 2017
BASE: ALL QUALIFIED RESPONDENTSQ1300. Approximately how much money does your household have saved in all of your retirement accounts? Please include IRAs, 401(k)s, 403(b)s, and any other savings for retirement to which you and/or your spouse or partner have contributed funds.
46 15 12 11 147
54 4
58 5
7 77
9 7 8 98
129 11 13 12
1312 14 14 14
30
25 22 22 18
2017 2016 2015 2014 2013
$250k or more
$100k to less than $250k
$50k to less than $100k
$25k to less than $50k
$10k to less than $25k
$5k to less than $10k
Less than $5k
None 0 *
Not sure 7 12 11 9 10Decline to answer 4 10 10 11 12
Estimated Median $71,000 $69,000 $63,000 $63,000 $53,000
Note: The median is estimated based on the approximate midpoint of the range of each response category. Non-responses are excluded from the estimate.
Total Household Retirement Savings (%)
NA NA NA NA

Data prior to 2017 shows results among workers in companies with 10+ workers. Data for 2017 shows results among workers in companies with 5+ workers.
BASE: ALL QUALIFIED RESPONDENTSQ825. What sources of information do you rely on for retirement planning and investing? Select all.
Friends and family (35 percent) continue to be the top source of information for workers when it comes to
retirement planning and investing. Other popular information sources include financial websites (33 percent),
financial planners/brokers (28 percent), and retirement plan provider websites (23 percent).
Information Sources: Retirement Planning & Investing
70
Sources of Information (%) 2017 2016 2015 2014 2013
N=6,372 N=4,161 N=4,550 N=4,143 N=3,651
Friends/Family
Financial websites
Financial Planner/Broker
Retirement plan provider website
Online newspapers, magazines, and blogs
Employer
Retirement calculators
Print newspapers and magazines
Financial-related television shows
Accountant
Plan provider printed material
Online social media
Insurance agent
Lawyer
Other
None
32
28
27
23
19
19
18
15
13
10
12
5
5
4
4
19
35
33
28
23
20
20
16
15
14
13
12
7
6
5
4
15
30
25
28
22
17
18
16
15
13
9
13
3
4
3
6
21
32
29
27
19
20
17
16
16
15
10
12
3
6
3
6
19
33
27
31
23
20
16
15
17
14
11
14
3
5
4
6
19

2017 2016 2015
N=4414 N=3071 N=3238
Quarterly statements from the retirement plan provider
Professional advice on how to invest my retirement savings from the retirement plan provider
Online tools and calculators to project retirement savings and income needs on the retirement plan provider's website
Educational articles and videos from the retirement plan provider that share ideas and insights on how to save and plan for a financially secure retirement
Informative emails sent to my work and/or my personal address from the retirement plan provider
Informational seminars, meetings, webinars, and/or workshops by the retirement plan provider
Mobile apps from the retirement plan provider that include tools and calculators to project retirement savings and income needs
Mobile apps from the retirement plan provider to manage my account
Information on social media (e.g., Twitter, Facebook) from the retirement
44
42
45
48
47
45
40
39
31
42
43
39
31
28
30
34
34
22
86
85
84
79
76
75
74
73
53
Among those offered a retirement plan, quarterly statements from the retirement plan provider continue to be
seen as the most helpful resource for retirement planning, saving, and investing. This is followed closely by
professional advice. Workers are more likely to say mobile apps from the retirement plan provider are helpful
this year than last year.
Helpfulness of Resources Offered by Retirement Plan Provider
71
Data prior to 2017 shows results among workers in companies with 10+ workers. Data for 2017 shows results among workers in companies with 5+ workers.BASE: THOSE OFFERED A RETIREMENT PLANQ2035. How helpful do you find the following from your employer’s retirement plan provider in assisting you to plan, save, and invest for retirement?
Helpfulness of Resources
% Very/Somewhat Helpful (NET)
44
42
46
47
47
40
41
39
30
41
41
35
29
24
32
27
27
18
85
83
81
76
71
72
68
66
48
45
46
48
47
47
45
39
36
29
40
35
35
29
23
30
21
20
15
85
81
83
76
71
75
59
56
44
Somewhat helpful Very helpful
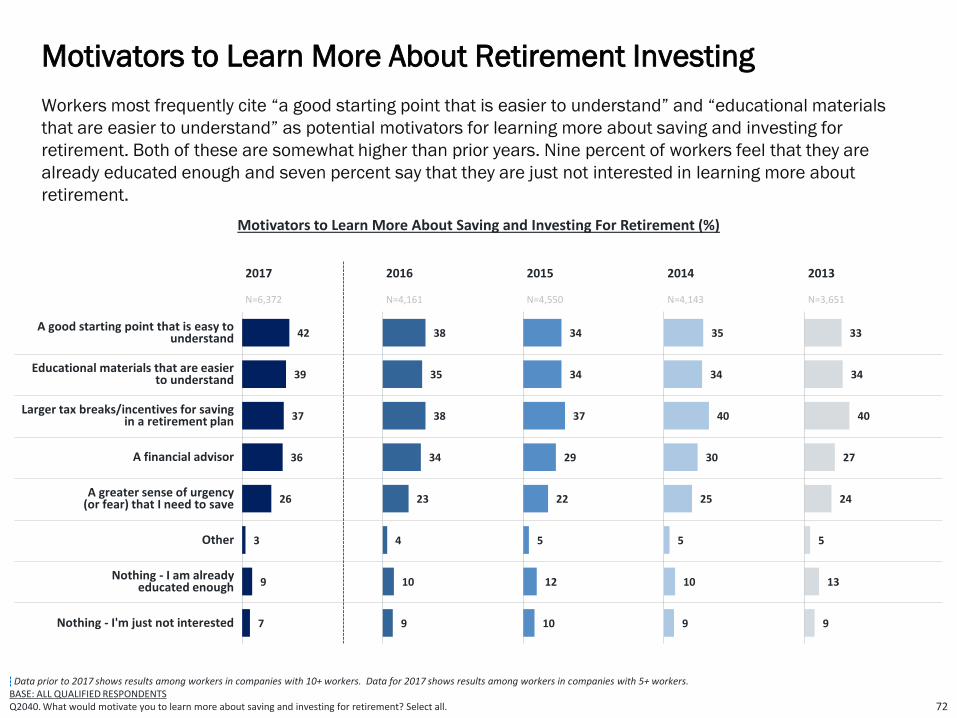
Data prior to 2017 shows results among workers in companies with 10+ workers. Data for 2017 shows results among workers in companies with 5+ workers.BASE: ALL QUALIFIED RESPONDENTSQ2040. What would motivate you to learn more about saving and investing for retirement? Select all.
Workers most frequently cite “a good starting point that is easier to understand” and “educational materials
that are easier to understand” as potential motivators for learning more about saving and investing for
retirement. Both of these are somewhat higher than prior years. Nine percent of workers feel that they are
already educated enough and seven percent say that they are just not interested in learning more about
retirement.
Motivators to Learn More About Retirement Investing
72
2017 2016 2015 2014 2013
N=6,372 N=4,161 N=4,550 N=4,143 N=3,651
A good starting point that is easy to understand
Educational materials that are easier to understand
Larger tax breaks/incentives for saving in a retirement plan N/A N/A
A financial advisor
A greater sense of urgency(or fear) that I need to save
Other
Nothing - I am already educated enough
Nothing - I'm just not interested
Motivators to Learn More About Saving and Investing For Retirement (%)
38
35
38
34
23
4
10
9
42
39
37
36
26
3
9
7
34
34
37
29
22
5
12
10
35
34
40
30
25
5
10
9
33
34
40
27
24
5
13
9

Data prior to 2017 shows results among workers in companies with 10+ workers. Data for 2017 shows results among workers in companies with 5+ workers.BASE: INVESTING FOR RETIREMENTQ860. Do you use a professional financial advisor to help manage your retirement savings or investments?BASE: USE FINANCIAL ADVISOR Q870. What types of services do you use your professional financial advisor to perform? Select all.
Among workers investing for retirement, 40 percent use a professional advisor to help manage their retirement
savings or investments. Of those who use advisors, most do so to get retirement investment recommendations
(69 percent), general financial planning (48 percent), and/or to help calculate a retirement goal (47 percent).
Use a Professional Financial Advisor
73
N=4,663 N=3,124 N=3,398 N=3,130 N=2,731
40 3935 37 36
2017 2016 2015 2014 2013
Use a Professional Financial Advisor to Help Manage Your Retirement Savings or
Investments, % Indicate “Yes”Types of Services Financial Advisor Performs (%)
Make retirement investment recommendations such as mutual
funds, annuities, stocks, bonds, etc.
General financial planning
Calculate retirement savings goal
Recommend other retirement-related product needs including health, life,
and long-term care insurance
Tax preparation
Some other services
69
48
47
43
33
4
74
46
49
42
25
7
73
45
43
37
22
5
76
44
44
36
25
5
76
50
45
36
20
10 ■ 2017 N=1,850■ 2016 N=1,245■ 2015 N=1,257■ 2014 N=1,153■ 2013 N=966

74
Data prior to 2017 shows results among workers in companies with 10+ workers. Data for 2017 shows results among workers in companies with 5+ workers.BASE: ALL QUALIFIED RESPONDENTSQ890. Thinking of what money can buy today, how much money do you believe you will need to have saved by the time you retire in order to feel financially secure?
Workers estimate they will need to have saved $500,000 (median) by the time they retire in order to feel
financially secure, a survey finding consistent with last year but lower than 2015 and 2014. In 2017, 36
percent of workers estimate they will need $1 million or more.
Estimated Retirement Savings Needs
19 20
9 10 14
25 23
1719
26
20 21
1920
23
20 21
2522
21
16 15
30 28
16
2017 2016 2015 2014 2013
$2m or more
$1m to less than $2m
$500k to less than $1m
$100k to less than $500k
Less than $100k
N=6,372 N=4,161 N=4,550 N=4,143 N=3,651
Estimated Retirement Savings Needs (%)
Median $500,000 $500,000 $1,000,000 $999,999 $500,000
Note: The median is estimated based on the approximate midpoint of the range of each response category. Non-responses are excluded from the estimate.

Data prior to 2017 shows results among workers in companies with 10+ workers. Data for 2017 shows results among workers in companies with 5+ workers.*added in 2014BASE: PROVIDED ESTIMATE OF MONEY NEEDED FOR RETIREMENTQ900. How did you arrive at that number?
Among workers who provided an estimate of their retirement savings needs, 46 percent say they “guessed”
when asked how they arrived at their estimate. Twenty-three percent estimated the amount based on current
living expenses. Only seven percent used a retirement calculator.
Basis for Estimating Retirement Savings Needs
75
2017 2016 2015 2014 2013
N=6,261 N=4,056 N=4,485 N=4,064 N=3,610
Guessed
Estimated based on current living expenses
*Used a retirement calculator N/A
Expected earnings on investments
Read / heard that is how much is needed
Amount given to me by financial advisor
Completed a worksheet / did calculation
Other
How Workers Estimated Their Retirement Savings Needs (%)
47
23
9
6
5
4
4
2
46
23
7
7
5
5
4
3
53
20
7
5
3
3
3
6
50
22
7
5
4
5
4
4
49
25
5
5
3
9
4

Data prior to 2017 shows results among workers in companies with 10+ workers. Data for 2017 shows results among workers in companies with 5+ workers.
BASE: ALL QUALIFIED RESPONDENTSQ1155. Which of the following best describes your retirement strategy?
Sixty-three percent of workers have some form of a retirement strategy — but only 16 percent have a written
plan, while 47 percent have a plan that is not written down. Conversely, 37 percent of workers do not have a
retirement strategy. These finding are consistent with previous years.
Retirement Strategies: Written, Unwritten, or None
76
◄ Do not have a plan Have a plan ►
2017N=6,372
2016N=4,161
2015N=4,550
2014N=4,143
2013N=3,651
37
37
42
39
42
47
47
44
47
46
16
16
14
14
12
63
63
58
61
58
Do not have a plan Have a plan, butnot written down
Have a written plan
Workers’ Retirement Strategies (%)
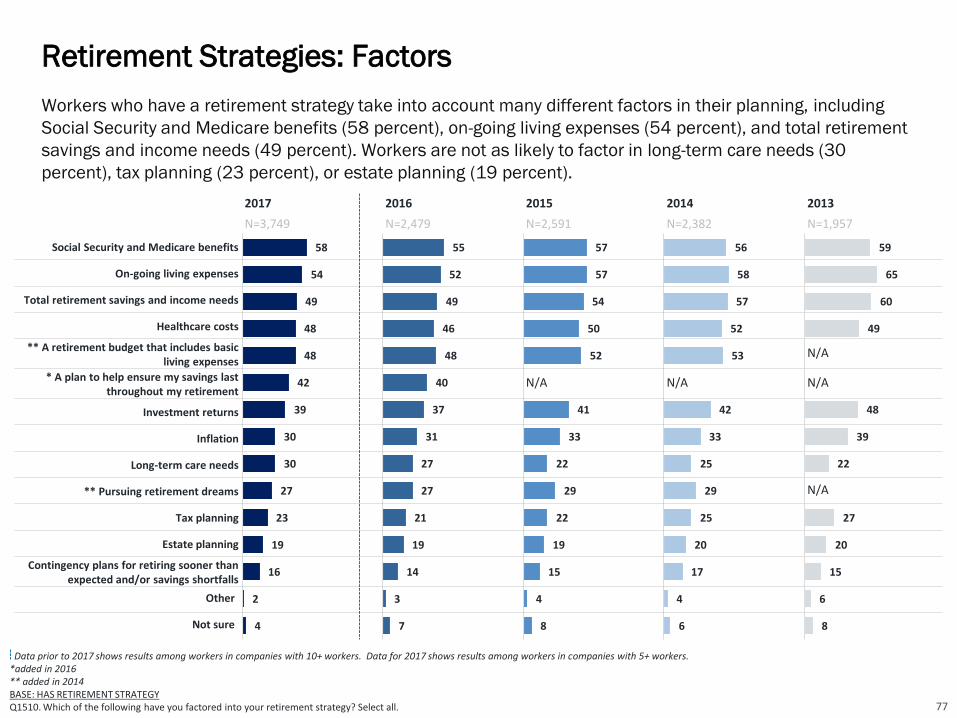
59
65
60
49
48
39
22
27
20
15
6
8
Data prior to 2017 shows results among workers in companies with 10+ workers. Data for 2017 shows results among workers in companies with 5+ workers.*added in 2016** added in 2014BASE: HAS RETIREMENT STRATEGYQ1510. Which of the following have you factored into your retirement strategy? Select all.
Workers who have a retirement strategy take into account many different factors in their planning, including
Social Security and Medicare benefits (58 percent), on-going living expenses (54 percent), and total retirement
savings and income needs (49 percent). Workers are not as likely to factor in long-term care needs (30
percent), tax planning (23 percent), or estate planning (19 percent).
Retirement Strategies: Factors
77
2017 2016 2015 2014 2013
N=3,749 N=2,479 N=2,591 N=2,382 N=1,957
Social Security and Medicare benefits
On-going living expenses
Total retirement savings and income needs
Healthcare costs
** A retirement budget that includes basic living expenses
N/A
* A plan to help ensure my savings last throughout my retirement
N/A N/A N/A
Investment returns
Inflation
Long-term care needs
** Pursuing retirement dreams N/A
Tax planning
Estate planning
Contingency plans for retiring sooner than expected and/or savings shortfalls
Other
Not sure
58
54
49
48
48
42
39
30
30
27
23
19
16
2
4
56
58
57
52
53
42
33
25
29
25
20
17
4
6
57
57
54
50
52
41
33
22
29
22
19
15
4
8
55
52
49
46
48
40
37
31
27
27
21
19
14
3
7

Among workers who dream of traveling in retirement, 59 percent are “very” or “somewhat” confident that their
current financial strategy will allow them to meet their travel goals throughout retirement. Thirteen percent say
that they haven’t given much thought to a financial strategy for travel.
Confidence that Financial Strategy Will Enable Travel Goals
78
Confidence That Current Financial Strategy Will Allow Meeting Retirement Travel-Related Goals (%)
■ 2017 N=4,275 ■ 2016 N=2,748
Very confident
Somewhat confident
Not too confident
Not at all confident
I haven’t given much thought to a financial strategy for travel in retirement
21
38
18
10
13
Data prior to 2017 shows results among workers in companies with 10+ workers. Data for 2017 shows results among workers in companies with 5+ workers.
BASE: WORKERS WHO DREAM OF TRAVELING IN RETIREMENTQ2845. How confident are you that your current financial strategy will allow you to meet your travel goals throughout retirement?
NETCONFIDENT
59%
18
40
16
10
16
NETCONFIDENT
58%

Data prior to 2017 shows results among workers in companies with 10+ workers. Data for 2017 shows results among workers in companies with 5+ workers.BASE: ALL QUALIFIED RESPONDENTSQ1535. In the event you are unable to work before your planned retirement, do you have a backup plan for retirement income?
28 25 23 24 19
58 60 61 60 63
14 15 16 15 18
2017 2016 2015 2014 2013
Not sure
No
Yes
N=6,372 N=4,161 N=4,550 N=4,143 N=3,651
The majority of workers (58 percent) do not have a backup plan for retirement income if they are unable to
work before their planned retirement. One-quarter (28 percent) do have a backup plan, up slightly from prior
years.
Backup Plans if Unable to Work Before Planned Retirement
79
Backup Plan for Retirement Income if Unable to Work Before Planned Retirement (%)

Data prior to 2017 shows results among workers in companies with 10+ workers. Data for 2017 shows results among workers in companies with 5+ workers.BASE: THOSE WITH QUALIFIED PLANS CURRENTLY OFFERED TO THEM Q605. Are you aware of the Roth 401(k)/403(b) option? (Allows you to make post-tax contributions to your 401(k)/403(b).)
75 75 73 7268
2017 2016 2015 2014 2013
Workers Aware of the Roth 401(k)/403(b) Option% Indicate Yes
N=4,084 N=2,820 N=2,976 N=2,753 N=2,510
Among workers who are offered a retirement plan, 75 percent are aware of a Roth 401(k) option (including
those who are and who are not offered the option).
Awareness of Roth 401(k)
80

4952 50 52 50
2017 2016 2015 2014 2013
Data prior to 2017 shows results among workers in companies with 10+ workers. Data for 2017 shows results among workers in companies with 5+ workers.
BASE: ALL QUALIFIED RESPONDENTS
Q1120. Are you aware of a tax credit called the “Saver’s Credit,” which is available to individuals and households, who meet certain income requirements, for making contributions to an IRA or a company-sponsored retirement plan such as a 401(k) plan or 403(b) plan?
Q1000. Are you aware that people age 50 and older may be allowed to make catch-up contributions to their 401(k)/403(b)/457(b) plan or IRA?
The Internal Revenue Service offers two meaningful incentives to save for retirement which many workers are
unaware of: the Saver’s Credit, a tax credit for eligible taxpayers who are saving for retirement in a qualified
retirement plan or IRA; and catch-up contributions, which allow workers age 50 and older to contribute to a
qualified plan an additional amount over and above the plan- or IRA-contribution limit. Only 36 percent of
workers are aware of the Saver’s Credit, although awareness of the Credit is increasing. Only 49 percent of
workers are aware of catch-up contributions. Raising awareness of these incentives may prompt workers to
save more.
Awareness of Saver’s Credit and Catch-Up Contributions
81
3633
30 2824
2017 2016 2015 2014 2013
N=6,372 n=4,161 N=4,550 N=4,143 N=3,651
Aware of Saver’s Credit, % Indicate “Yes”
Aware of Catch-Up Contributions, % Indicate “Yes”
N=6,372 N=4,161 N=4,550 N=4,143 N=3,651

Just under half (45 percent) of workers are aware of the IRS’ Free File program that offers federal income tax
preparation software for free to eligible tax filers.
Awareness of the IRS’ Free File Program
82
45
55
Yes, I am aware
No, I am not aware
2017N=6,372
New question added in 2017BASE: ALL QUALIFIED RESPONDENTS Q2821. Are you aware of the IRS’ Free File program that offers federal income tax preparation software for free for eligible tax filers?
Awareness of the IRS’ Free File Program (%)

2017N =6372
2016N =4161
2015N =4550
2014N =4143
2013N =3651
Social Security
Medicare
Medicaid
Most workers have limited understanding of government benefits that can be utilized in retirement. Case in
point: only 20 percent of workers know “a great deal” about Social Security benefits and even fewer know a
great deal about Medicare and Medicaid.
Data prior to 2017 shows results among workers in companies with 10+ workers. Data for 2017 shows results among workers in companies with 5+ workers.BASE: ALL QUALIFIED RESPONDENTSQ1540. How good of an understanding do you have of the following government benefits? 83
Understanding of Government Benefits
22
18
9
43
44
45
20
21
26
15
17
20
Understanding of Retirement-Related Government Benefits (%)
None Some Quite a bit A great deal
24
18
10
52
50
48
15
20
26
9
12
15
24
19
10
47
46
46
17
21
26
12
14
18
28
21
11
47
48
47
15
19
26
10
12
16
26
20
10
48
46
46
16
20
26
11
14
18

Most workers (73 percent) discuss saving, investing and planning for retirement with family and friends.
However, only 15 percent do so frequently. Twenty-seven percent of workers say that they never discuss it. This
has remained relatively unchanged in the recent years.
Frequency of Discussions About Retirement
84
913111415
6259
585758
2828312927
20132014201520162017
Data prior to 2017 shows results among workers in companies with 10+ workers. Data for 2017 shows results among workers in companies with 5+ workers.BASE: ALL QUALIFIED RESPONDENTSQ1515. How frequently do you discuss saving, investing and planning for retirement with family and friends?
Frequency of Discussing Retirement with Family and Friends (%)
N=6,372 N=4,161 N=4,550 N=4,143 N=3,651
Never
Occasionally
Frequently

Influences of Company Size on Retirement Readiness
Detailed Findings
85

Access to retirement benefits can improve the long-term financial health and wealth of workers. Large
companies (500+ employees) typically offer more robust benefits, including retirement benefits, to their
employees than small companies (5 to 499 employees). Increasing access to retirement benefits among all
workers, especially those in small companies, can help them achieve higher levels of retirement readiness.
Forty Indicators of Retirement Readiness
• Confidence in Retiring Comfortably. Retirement confidence is relatively consistent between workers of
small and large companies, with 61 percent being “very” or “somewhat” confident.
• Recovery From the Great Recession. Workers of small and large companies report similar stages of
financial recovery from the Great Recession. more than four in 10 workers in small companies (42
percent) and in large companies (43 percent) say they were either were “not impacted” or have “fully
recovered.” Yet, one in five workers of small companies (20 percent) and 18 percent of workers in large
companies say they have “not yet begun to recover” or feel they may “never recover.”
• Building a Large Enough Nest Egg? About half of workers in small companies (52 percent) and large
companies (52 percent) agree they are building a large enough nest egg.
• Retirement Dreams Include Leisure and Work. Workers of both small companies (68 percent) and large
companies (71 percent) most frequently cite traveling as a retirement dream. Other frequently cited
dreams include spending more time with family and friends (56 percent small companies, 58 percent large
companies), and pursuing hobbies (50 percent for both small and large companies). Interestingly, 31
percent of workers in small companies and 28 percent in large companies dream of doing some sort of
work in retirement.
Influences of Company Size on Retirement Readiness
86

• Retirement Beliefs, Preparations, and Involvement. Most workers in small companies (79 percent) and
large companies (80 percent) agree that people in their generation will have a much harder time in
achieving financial security compared to their parent’s generation. Workers in small companies (76
percent) and large companies (77 percent) share a similar level of concern that Social Security will not be
there for them when they are ready to retire.
• Expected Retirement Age. The majority of both small company workers (55 percent) and large company
workers (52 percent) plan to work past age 65 or do not plan to retire. Large company workers (25
percent) are somewhat more likely than small company workers (23 percent) to expect to retire before age
65. A similar percentage of small company workers (22 percent) and large company workers (23 percent)
expect to retire at age 65.
• Planning to Work in Retirement. Almost three in five (59 percent) workers in small companies plan to work
full- or part-time in retirement, while just over half (53 percent) of large company workers plan to do so.
Over the past five years, small company workers have been consistently more likely to say they plan to
work in retirement.
• Reasons for Working in Retirement. Across company size, workers who plan to work in retirement and/or
past age 65 share both financial and healthy-aging reasons for doing so: 83 percent of workers in both
large and small companies say they plan to do it for financial reasons while around three in four workers in
small companies (75 percent) and large companies (73 percent) say they plan to do so for healthy-aging
reasons.
• Retirement Transitions: Phased Versus Immediate. Many workers across company size envision a
transition into retirement by changing work patterns (e.g., reducing work hours with more leisure time to
enjoy life or working in a different capacity that is less demanding and/or brings greater personal
satisfaction, a finding that is higher for small companies. More large company workers (24 percent) than
small company workers (21 percent) plan to immediately stop working and retire once they reach a
specific age or amount of money.
Influences of Company Size on Retirement Readiness
87

• Phased Retirement and Compensation-Related Expectations. Among workers who envision a phased
transition into retirement, most are conscious about how changes in their work arrangements may affect
their compensation, job title, and employee benefits. Workers in small companies (80 percent) are
somewhat more likely than workers in large companies (78 percent) to agree that “If I reduce my work
hours at my current employer, I would expect to be paid the same hourly rate for hours worked that I am
earning now.” Furthermore workers in larger companies (81 percent) are more likely than workers in
smaller companies (76 percent) to say they would expect their job title to change if they were to take on a
new role with fewer responsibilities at their current employer.
• Perceptions of Older Workers. Workers in small and large companies share similar perceptions – positive
or negative – about workers age 50 and older compared to younger workers in today’s workforce. A strong
majority of workers in small (84 percent) and large companies (83 percent) have positive perceptions
about older workers, namely they are more knowledgeable and responsible. However, more than half of
workers across company sizes have negative perceptions with older workers having higher healthcare
costs being cited most frequently.
• Age That Workers Consider a Person to Be “Old.” Workers in small and large companies have similar
perceptions of when they consider a person to be “old.” The median age for those who provided an age is
70 for both workers of large and small companies. Four in 10 workers in small companies (40 percent)
and in large companies (39 percent) feel that it depends on the person.
• Age That Workers Consider a Person to Be “Too Old” to Work. Workers in small and large companies have
similar perceptions of when they consider a person to be “too old” to work. More than half of workers in
small and large companies are most likely to say it depends on the person. Among those who provided a
specific age, workers say age 75 (median) is when a person is considered too old to work.
• Level of Concern About Health in Older Age. Workers in small companies (72 percent) are equally as likely
as those in large companies (73 percent) to be “very” or “somewhat” concerned about their health in older
age.
Influences of Company Size on Retirement Readiness
88

• Engagement in Health-Related Activities on a Consistent Basis. Workers in small and large companies do
many health-related activities on a consistent basis. However, small company workers are slightly more
likely to engage in health-related activities compared to large company workers. Of concern, only about a
quarter of workers across company size consider their long-term health when making lifestyle decisions.
• Planning to Live to Age ... Both small and large company workers share similar expectations regarding age
they are planning to live to. Large company workers are planning to live to an age of 90 (median) and 13
percent of them are planning to become centenarians. Small company workers are also planning to live to
age 90 (median) with 15 percent planning to live to 100+.
• Current Financial Priorities. A majority of workers in both small (63 percent) and large (69 percent)
companies indicate that “paying off debt” (NET) is a current financial priority. A majority of workers in small
companies (55 percent) cite saving for retirement as a current priority, while a significantly more (64
percent) workers in large companies cite retirement savings as a financial priority. Approximately two in
five workers of both small and large companies cite paying off credit card or consumer debt as a priority.
• Greatest Financial Priority Right Now. Financial priorities among workers of small and large companies are
similarly shared. The top three most frequently cited priorities among workers are “paying off debt”(NET)
(28 percent small, 32 percent large), saving for retirement” (21 percent small, 20 percent large), and “just
getting by” (18 percent small, 17 percent large).
• Types of Household Debt. The most frequently cited types of household debt are credit card (63 percent in
large company workers; 57 percent for small company workers), mortgage (46 percent in large company
workers; 39 percent in small company workers), and car loan (43 percent in large company workers; 38
percent in small company workers).
Influences of Company Size on Retirement Readiness
89
• Estimated Emergency Savings. Workers of both small and large companies lack emergency savings that
could help cover the cost of a major financial setback (e.g., unemployment, medical bills, home repairs,
auto repairs, other). Workers in small companies have saved just $5,000 (median) for such emergencies
while workers in large companies have saved even less, $3,000 (median). More than one-third of small
company (36 percent) and large company workers (39 percent) have saved less than $5,000. Of concern,
one in five workers are "not sure" how much they have saved in emergency savings: 23 percent of small
company workers and 25 percent of large company workers.
• Saving for Retirement / Age Started Saving. More large company workers (79 percent) than small company
workers (73 percent) are saving for retirement at work through employer sponsored plans, such as a
401(k) or similar plan. The median age at which workers started saving is relatively consistent between
small (age 28) and large (age 27) company workers.
• Expected Sources of Retirement Income. Self-funded savings including retirement accounts (e.g., 401(k)s,
403(b)s, IRAs) and other savings and investments are the most frequently cited source of retirement
income expected by workers of both company sizes: 78 percent of small company workers and 86 percent
of large company workers. This is closely followed by Social Security as an expected source of retirement
income for 72 percent of small company workers and 76 percent of large company workers.
• Expected Primary Source of Income in Retirement. Workers of large companies (41 percent) are more
likely to expect to rely on retirement accounts (e.g., 401(k)s, 403(b)s, IRAs) as their primary source of
income in retirement compared to workers of small companies (32 percent). Expectations that “working”
will be their primary source of income is higher among workers of small companies compared to those in
large companies (16 percent and 13 percent, respectively).
Influences of Company Size on Retirement Readiness
90

• Importance of Retirement Benefits Compared to Other Benefits. The vast majority of workers across small
and large companies believe that retirement benefits are important. Large company workers (91 percent)
are somewhat more likely than those of small companies (86 percent) to value a 401(k) or similar plan as
an important benefit. This trend has remained consistent over the past five years.
• Retirement Benefits Currently Offered. A majority of workers are offered a 401(k) or similar employee-
funded retirement plan in the workplace; however, access is greater among workers of large companies
(82 percent) compared to those of small companies (59 percent). Relatively few workers are offered a
traditional company-funded defined benefit plan. Of note, a third of small company workers say their
employer does not offer any retirement benefits, compared to 11 percent of large company workers.
• Retirement Plan Participation. Among workers who are offered a 401(k) or similar plan, the participation
rate is similar among large company workers (78 percent) and small company workers (81 percent). This
trend has remained consistent over the past five years.
• Retirement Plan Contribution Rate. Among workers who participate in a 401(k) or similar plan, the median
contribution rate is directionally higher among small company workers (10 percent) than large company
workers (8 percent). The average contribution rate among workers in small companies contributing to their
qualified plan increased slightly compared to previous years.
• Appeal of Automatic Enrollment. Automatic enrollment is a retirement plan feature that eliminates the
decision-making and action steps normally required of employees to enroll and to start contributing to the
plan. It simply automatically enrolls employees into a plan and they only need to take action if they desire
to opt out and not contribute to the plan. Workers in small companies (82 percent) are more likely than
workers in large companies (79 percent) to find automatic enrollment into a 401(k), 403(b) or similar
retirement plan as “very” or “somewhat” appealing. Workers in smaller companies feel the appropriate
default contribution rate for such a plan feature would be 10 percent while workers in large companies
believe 6 percent is appropriate.
Influences of Company Size on Retirement Readiness
91
• Likelihood of Using Automatic Escalation. More than seven in 10 workers in both small companies (76
percent) and large companies (73 percent) say they would be “very” or “somewhat” likely to use a plan
feature that automatically increases their contribution rate to their 401(k) or similar plan by 1% each year.
About three in 10 workers across company sizes would be “very” likely to use this plan feature.
• Use of Professionally Managed Offerings. “Professionally managed” accounts refers to a managed account
service, strategic allocation funds, and/or target date funds. Many plan participants in both small (61
percent) and large companies (57 percent) are using some form of professionally managed offering in their
401(k) or similar plans. Small business workers (45 percent) are slightly more likely to set their own asset
allocation among the available funds compared to large company workers (42 percent).
• Asset Allocation of Retirement Investments. Among workers investing for retirement, those in both large
and small companies (both 40 percent) most frequently indicate that their retirement savings are invested
in relatively equal mix of stocks and investments such as bonds, money market funds and cash. A
concerning one in five say that they are “not sure” how their savings are invested.
• Retirement Plan Leakage: Loans and Withdrawals. “Leakage” from retirement plans in the form of loans
and withdrawals can severely inhibit the growth of participants’ long-term retirement savings. Twenty-five
percent of small company and 34 percent of large company workers have taken some form of loan, early
withdrawal, and/or hardship withdrawal from a 401(k), similar plan or IRA.
• Total Household Retirement Savings. Workers of large companies report higher levels of total household
savings in retirement accounts compared to those of small companies. Large company workers have
saved $78,000 (estimated median), while small company workers have saved $62,000 (estimated
median). Large company workers (31 percent) are also slightly more likely than small company workers
(28 percent) to say that they have saved $250,000 or more, a consistent finding over the past five years.
Retirement savings have been increasing incrementally among small and large company workers since
2012.
Influences of Company Size on Retirement Readiness
92

• Estimated Retirement Savings Needs. Workers of both large and small companies believe that they will
need to save $500,000 (median) to feel financially secure when they retire. This year’s survey finding is
consistent with last year’s, but a major decrease from 2015 when workers indicated they would need to
save $1,000,000 (median).
• Basis for Estimating Retirement Savings Needs. Among those who provided an estimate of their retirement
savings needs, just under half of workers of both small (45 percent) and large companies (49 percent) say
that they “guessed” these needs. Approximately more one in five estimated the amount based on current
living expenses, and fewer than 10 percent used a retirement calculator.
• Retirement Strategy: Written, Unwritten, or None. Most workers of both small and large companies (64
percent small, 60 percent large) say that they have some form of retirement strategy, either written or
unwritten. However, only 17 percent of small company workers and 14 percent of large company workers
have a written plan.
• Confidence that Financial Strategy Will Enable Travel Goals. Travel is the top retirement dream among
workers in small and large companies. Among workers who dream of traveling in retirement, most are
confident their current financial strategy will allow them to meet their retirement travel goals including 58
percent of small company workers and 57 percent of large company workers. However, relatively few
workers are “very” confident (21 percent small companies, 19 percent large companies). Interestingly,
some workers haven’t given much thought to it (14 percent small companies, 15 percent large
companies).
• Professional Financial Advisor Usage. Small company workers (45 percent) who are investing for
retirement are more likely to use a professional financial advisor to help manage their retirement savings
or investments compared to large company workers (33 percent). This gap has been relatively consistent
over the past five years.
Influences of Company Size on Retirement Readiness
93

• Awareness of Saver’s Credit. The IRS Saver’s Credit is a tax credit available to eligible taxpayers who are
saving for retirement in a qualified retirement plan or IRA. Workers in small companies (37 percent) are
more likely to be aware of the credit, compared to workers in large companies (32 percent).
• Awareness of the IRS’ Free File Program. Fewer than half of workers in small and large companies (44
percent for both) are aware of the IRS’ Free File program that offers federal income tax preparation
software for free to eligible tax filers.
Influences of Company Size on Retirement Readiness
94

4248
43 45 44 45 46 47 5146
1914
15 1511
16 16 1416
10
61 6258 60
5561 62 61
67
55
2017 2016 2015 2014 2013 2017 2016 2015 2014 2013
Very Confident Somewhat Confident
Data prior to 2017 shows results among workers in companies with 10+ workers. Data for 2017 shows results among workers in companies with 5+ workers.BASE: ALL QUALIFIED RESPONDENTS
Q880. How confident are you that you will be able to fully retire with a lifestyle you consider comfortable?
N=3,428 N=2,023 N=2,056 N=1,925 N=1,764 N=2,944 N=2,138 N=2,494 N=2,218 N=1,887
Small Companies Large Companies
Confidence in Retiring Comfortably
Very/Somewhat Confident (%) (NET)
95
Retirement confidence is relatively consistent between workers of small and large companies, with 61 percent
being “very” or “somewhat” confident.
Confidence in Retiring Comfortably

Workers of small and large companies report similar stages of financial recovery from the Great Recession. more
than four in 10 workers in small companies (42 percent) and in large companies (43 percent) say they were either
were “not impacted” or have “fully recovered.” Yet, one in five workers of small companies (20 percent) and 18
percent of workers in large companies say they have “not yet begun to recover” or feel they may “never recover.”
Recovery From the Great Recession
96
Data prior to 2017 shows results among workers in companies with 10+ workers. Data for 2017 shows results among workers in companies with 5+ workers.BASE: ALL QUALIFIED RESPONDENTS Q2655. How would you describe your financial recovery from the deep recession in recent years, which is commonly referred to as the “Great Recession”?
I was not impacted I have fully recovered I have somewhat recovered I have not yet begun to recover I may never recover
How would you describe your financial recovery from the Great Recession? (%)
19
21
23
22
38
39
13
10
7
6
SmallCompanies
LargeCompanies
NET - Not Impacted orFully Recovered= 42%
NET - Not Impacted orFully Recovered= 43%
NET - Not Yet Begun orNever Recover = 20%
NET - Not Yet Begun orNever Recover = 16%
N=3,428
N=2,944
18
20
19
20
42
40
13
13
8
7
SmallCompanies
LargeCompanies
NET - Not Impacted orFully Recovered= 40%
NET - Not Impacted orFully Recovered= 37%
NET - Not Yet Begun orNever Recover = 21%
NET - Not Yet Begun orNever Recover = 20%
N=2,023
N=2,138
2017 2016
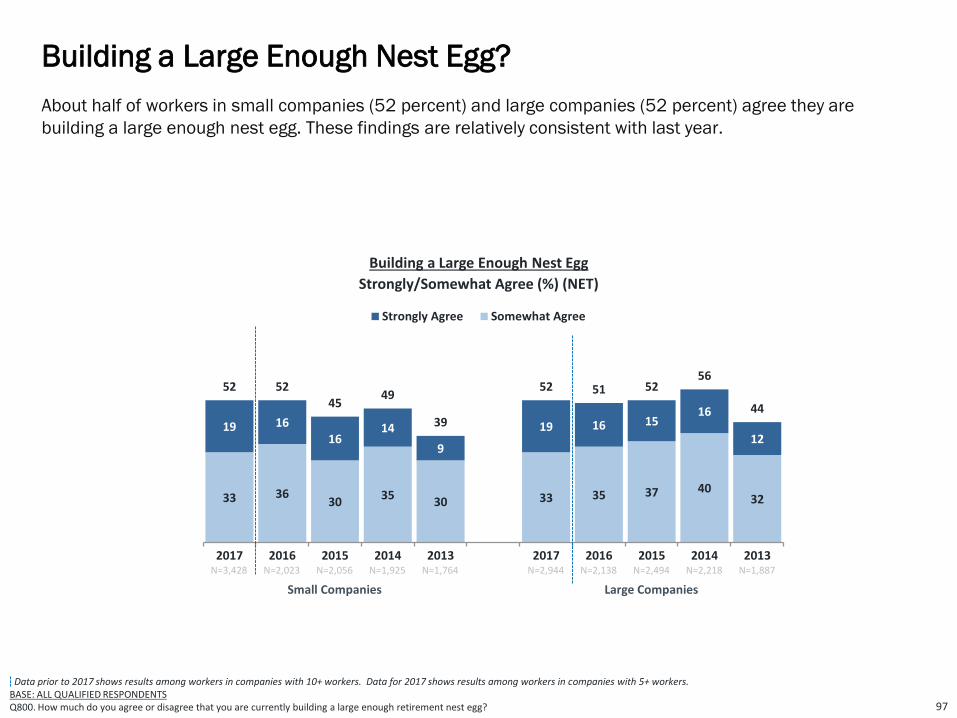
33 3630
3530 33 35 37 40
32
19 1616
14
9
19 16 1516
12
52 5245
49
39
52 51 5256
44
2017 2016 2015 2014 2013 2017 2016 2015 2014 2013
Strongly Agree Somewhat Agree
Data prior to 2017 shows results among workers in companies with 10+ workers. Data for 2017 shows results among workers in companies with 5+ workers.BASE: ALL QUALIFIED RESPONDENTSQ800. How much do you agree or disagree that you are currently building a large enough retirement nest egg?
About half of workers in small companies (52 percent) and large companies (52 percent) agree they are
building a large enough nest egg. These findings are relatively consistent with last year.
Building a Large Enough Nest Egg?
97
Building a Large Enough Nest Egg
Strongly/Somewhat Agree (%) (NET)
N=3,428 N=2,023 N=2,056 N=1,925 N=1,764 N=2,944 N=2,138 N=2,494 N=2,218 N=1,887
Small Companies Large Companies

Workers of both small companies (68 percent) and large companies (71 percent) most frequently cite traveling
as a retirement dream. Other frequently cited dreams include spending more time with family and friends (56
percent small companies, 58 percent large companies), and pursuing hobbies (50 percent for both small and
large companies). Interestingly, 31 percent of workers in small companies and 28 percent in large companies
dream of doing some sort of work in retirement.
Retirement Dreams Include Leisure and Work
98
Note: Data prior to 2017 shows results among workers in companies with 10+ workers. Data for 2017 shows results among workers in companies with 5+ workers.BASE: ALL QUALIFIED RESPONDENTS Q1418. How do you dream of spending your retirement? Select all.
How do you dream of spending your retirement? (%)
Small Companies Large Companies
■ 2017 (N=3,428)
■ 2016 (N=2,023)
■ 2017 (N=2,944)
■ 2016 (N=2,138)
Traveling
Spending more time with family and friends
Pursuing hobbies
Doing volunteer work
Pursuing an encore career (pursuing a new role, work, activity, or career)
Starting a business
Continue working in the same field
Other
None of the above
68
56
50
24
13
13
12
4
2
63
57
46
24
13
11
14
5
4
71
58
50
27
14
13
10
5
2
66
56
51
30
12
11
10
8
4
NET: Working2017: 28%2016: 27%
NET: Working2017: 31%2016: 30%

Data prior to 2017 shows results among workers in companies with 10+ workers. Data for 2017 shows results among workers in companies with 5+ workers.*added in 2016 **added in 2014BASE: ALL QUALIFIED RESPONDENTSQ930. How much do you agree or disagree with each of the following statements regarding retirement investing?
Small Companies Large Companies
How Much Do You Agree or Disagree?Strongly/Somewhat Agree (%) (NET)
■ 2017 (N=3,428)■ 2016 (N=2,023)■ 2015 (N=2,056)■ 2014 (N=1,925)■ 2013 (N=1,764)
■ 2017 (N=2,944)■ 2016 (N=2,138)■ 2015 (N=2,494)■ 2014 (N=2,218)■ 2013 (N=1,887)
**Compared to my parent's generation, people in my generation will have a much harder time in achieving financial security
**I am concerned that when I am ready to retire, Social Security will not be there for me
*My current employer is supportive of its employees working past 65
I do not know as much as I should about retirement investing
I would like to receive more information and advice from my employer on how to reach my retirement goals
I could work until age 65 and still not have enough money saved to meet my retirement needs
I am currently very involved in monitoring and managing my retirement savings
I would prefer to rely on outside experts to monitor and manage my retirement savings plan
I prefer not to think about or concern myself with retirement investing until I get closer to my retirement date
Retirement Beliefs, Preparations, and Involvement
99
79
76
72
66
62
66
63
59
41
80
76
71
69
63
67
62
60
44
80
77
67
61
67
64
55
41
83
77
69
63
67
68
56
39
68
56
71
60
51
35
80
77
71
70
69
67
65
55
39
83
78
72
67
69
64
64
55
38
80
75
66
61
65
63
52
37
80
74
65
64
66
70
56
37
69
64
66
62
51
34
Most workers in small companies (79 percent) and large companies (80 percent) agree that people in their
generation will have a much harder time in achieving financial security compared to their parent’s generation.
Workers in small companies (76 percent) and large companies (77 percent) share a similar level of concern that
Social Security will not be there for them when they are ready to retire.
N/AN/A
N/AN/A
N/AN/A

Data prior to 2017 shows results among workers in companies with 10+ workers. Data for 2017 shows results among workers in companies with 5+ workers.BASE: ALL QUALIFIED RESPONDENTSQ910. At what age do you expect to retire?
The majority of both small company workers (55 percent) and large company workers (52 percent) plan to work
past age 65 or do not plan to retire. Large company workers (25 percent) are somewhat more likely than small
company workers (23 percent) to expect to retire before age 65. A similar percentage of small company
workers (22 percent) and large company workers (23 percent) expect to retire at age 65.
Expected Retirement Age
100
14 16 15 15 16 13 11 13 1116
41 41 44 43 4239 41
43 4340
2223 22 24 22
23 2121 23 21
23 20 19 18 2025 27 23 23 23
2017 2016 2015 2014 2013 2017 2016 2015 2014 2013
Before Age 65
At Age 65
After Age 65
Do Not Plan to Retire
N=3,428 N=2,023 N=2,056 N=1,925 N=1,764 N=2,944 N=2,138 N=2,494 N=2,218 N=1,887
Small Companies Large Companies
Age Expecting to Retire (%)

4538 42 41 46 40 38 37 40 43
1416 13 13
1013 11 11 11 9
23 24 23 24 1926 30 27 29
19
18 22 22 2225
2121 25 20
29
59Yes (Net) 55 54 56
Nearly three in five (59 percent) workers in small companies plan to work full- or part-time in retirement, while
just over half (53 percent) of large company workers plan to do so. Over the past five years, small company
workers have been consistently more likely to say they plan to work in retirement.
Planning to Work in Retirement
101
Data prior to 2017 shows results among workers in companies with 10+ workers. Data for 2017 shows results among workers in companies with 5+ workers.BASE: ALL QUALIFIED RESPONDENTSQ1525. Do you plan to work after you retire?
Planning to Work in Retirement (%)
Yes, I plan to work full-timeYes, I plan to work part-timeNo, I do not plan to workNot sure
54
2017 2016 2015 2014 2013 2017 2016 2015 2014 2013
N=3,428
N=2,023
N=2,056
N=1,925
N=1,764
N=2,944
N=2,138
N=2,494
N=2,218
N=1,887
Small Companies Large Companies
5348 51 5249

Across company size, workers who plan to work in retirement and/or past age 65 share both financial and
healthy-aging reasons for doing so: 83 percent of workers in both large and small companies say they plan to
do it for financial reasons while around three in four workers in small companies (75 percent) and large
companies (73 percent) say they plan to do so for healthy-aging reasons.
Reasons for Working in Retirement
102
NET
Financial Reasons
NET
Healthy-aging
Reasons
Want the income
Be activeKeep my
brain alert
Concerned that Social
Security will be less than
expected
Can’t afford to retire because I haven’t
saved enough
Have a sense of purpose
Enjoy what I do
Need health benefits
Maintain social
connections
Concernedemployer
retirement benefits will be less than
expected
Anxious re: volatility in
financial markets and investment
performance
83 75 57 55 43 41 38 36 39 27 25 14 13 Sm
all
Co
mp
any
N=2
65
0
83 73 56 52 43 42 41 36 33 34 24 18 14
New question added in 2017BASE: PLAN ON RETIRING AFTER 65 AND/OR WORKING AFTER RETIREMENTQ1530x1. What are your reason(s) for working in retirement or past age 65? Select all.
Larg
e
Co
mp
any
N=2
16
6

Many workers across company size envision a transition into retirement by changing work patterns (e.g.,
reducing work hours with more leisure time to enjoy life or working in a different capacity that is less
demanding and/or brings greater personal satisfaction, a finding that is higher for small companies. More large
company workers (24 percent) than small company workers (21 percent) plan to immediately stop working and
retire once they reach a specific age or amount of money.
Retirement Transitions: Phased Versus Immediate
103
Small Companies Large Companies■ 2017 (N=3,428)■ 2016 (N=2,023)■ 2015 (N=2,056)■ 2014 (N=1,925)
■ 2017 (N=2,944)■ 2016 (N=2,138)■ 2015 (N=2,494)■ 2014 (N=2,218)
Continue working as long as possible in current or similar position until I cannot work anymore
TRANSITION (NET)
Transition into retirement by reducing work hours
Transition into retirement by working in a different capacity
PLAN TO STOP (NET)
Immediately stop working once I reach a specific age
Immediately stop working once I save a specific amount of money
Not sure
Data prior to 2017 shows results among workers in companies with 10+ workers. Data for 2017 shows results among workers in companies with 5+ workers.BASE: ALL QUALIFIED RESPONDENTSQ1545. How do you envision transitioning into retirement?
19
45
28
17
24
16
8
12
20
39
24
15
26
16
10
15
20
38
23
15
25
17
8
17
18
46
28
18
23
16
7
13
22
48
31
17
21
13
8
9
23
45
32
13
20
12
8
12
21
45
29
16
17
11
6
17
18
47
31
16
20
11
9
15
How do you envision transitioning into retirement? (%)
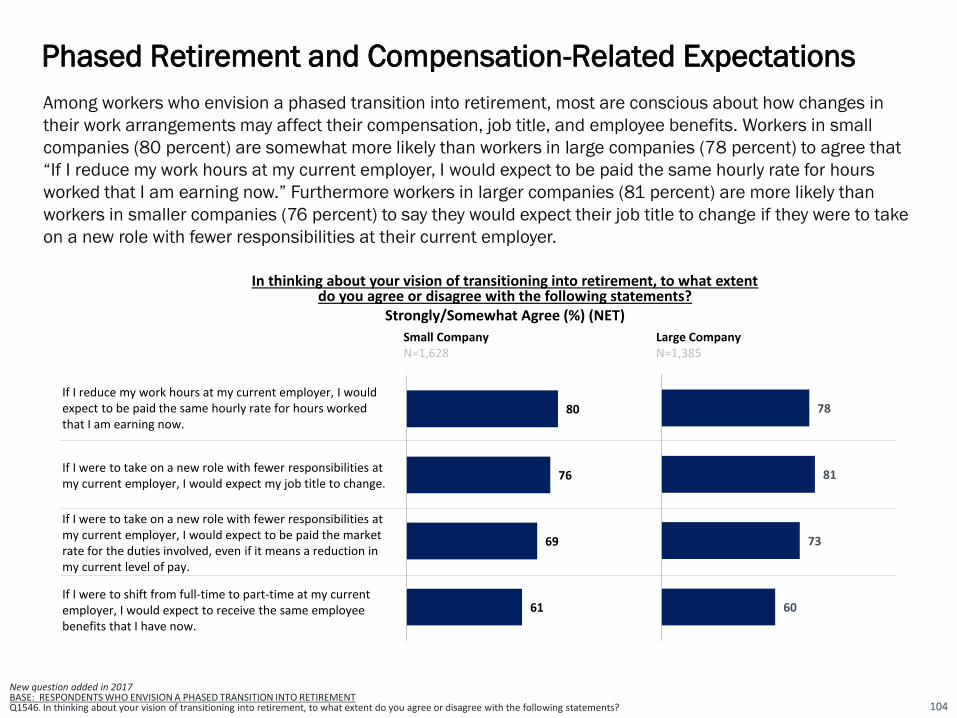
Phased Retirement and Compensation-Related Expectations
New question added in 2017BASE: RESPONDENTS WHO ENVISION A PHASED TRANSITION INTO RETIREMENTQ1546. In thinking about your vision of transitioning into retirement, to what extent do you agree or disagree with the following statements? 104
Among workers who envision a phased transition into retirement, most are conscious about how changes in
their work arrangements may affect their compensation, job title, and employee benefits. Workers in small
companies (80 percent) are somewhat more likely than workers in large companies (78 percent) to agree that
“If I reduce my work hours at my current employer, I would expect to be paid the same hourly rate for hours
worked that I am earning now.” Furthermore workers in larger companies (81 percent) are more likely than
workers in smaller companies (76 percent) to say they would expect their job title to change if they were to take
on a new role with fewer responsibilities at their current employer.
In thinking about your vision of transitioning into retirement, to what extent do you agree or disagree with the following statements?
Strongly/Somewhat Agree (%) (NET)
Small CompanyN=1,628
Large CompanyN=1,385
If I reduce my work hours at my current employer, I would expect to be paid the same hourly rate for hours worked that I am earning now.
If I were to take on a new role with fewer responsibilities at my current employer, I would expect my job title to change.
If I were to take on a new role with fewer responsibilities at my current employer, I would expect to be paid the market rate for the duties involved, even if it means a reduction in my current level of pay.
If I were to shift from full-time to part-time at my current employer, I would expect to receive the same employee benefits that I have now.
80
76
69
61
78
81
73
60

Small CompaniesN=3,428
Large CompaniesN=2,944
NET – Positive perceptions
Bring more knowledge, wisdom, and life experience
Are more responsible, reliable, and dependable
Are a valuable resource for training and mentoring
Are an important source of institutional knowledge
Are more adept at problem-solving
Are better at getting along with others in a team environment
NET – Negative perceptions
Have higher healthcare costs
Command higher wages and salaries
Are less open to learning and new ideas
Have higher disability costs
Have outdated skill sets
Are less productive
Other
None
Perceptions of Older Workers
105
New question added in 2017BASE: ALL QUALIFIED RESPONDENTS Q1528. What are your perceptions of workers age 50 and older compared to younger workers in today’s workforce? Select all.
Workers in small and large companies share similar perceptions – positive or negative – about workers age 50
and older compared to younger workers in today’s workforce. A strong majority of workers in small (84 percent)
and large companies (83 percent) have positive perceptions about older workers, namely they are more
knowledgeable and responsible. However, more than half of workers across company sizes have negative
perceptions with older workers having higher healthcare costs being cited most frequently.
84
60
57
49
41
36
31
52
27
17
18
13
13
10
1
8
83
64
56
50
44
32
30
55
28
22
21
15
13
10
1
8
Perceptions of workers age 50+ compared to younger workers in today’s workforce? (%)

Age That Workers Consider a Person to Be “Old”
106
1015 17
11
3 1
40
3
1114
19
93 1
39
4
<60 60-69 70-79 80-89 90-99 100+ It depends on theperson
Not Sure
Age When Person is Considered “Old” (%)
Workers in small and large companies have similar perceptions of when they consider a person to be “old.” The
median age for those who provided an age is 70 for both workers of large and small companies. Four in 10
workers in small companies (40 percent) and in large companies (39 percent) feel that it depends on the
person.
Median Age
Small Companies (N=3,428) Age 70Large Companies (N=2,944) Age 70
New question added in 2017BASE: ALL QUALIFIED RESPONDENTS Q1526. At what age do you consider a person to be “old”?

Age That Workers Consider a Person to Be “Too Old” to Work
107
26
18
11
4 2
54
327
18
10
3 1
55
4
<60 60-69 70-79 80-89 90-99 100+ It depends on theperson
Not Sure
Age When Person is Considered “Too Old” to Work (%)
Median Age
Small Companies (N=3,428) Age 75Large Companies (N=2,944) Age 75
New question added in 2017BASE: ALL QUALIFIED RESPONDENTS Q1527. At what age do you consider a person to be “too old” to work?
Workers in small and large companies have similar perceptions of when they consider a person to be “too old”
to work. More than half of workers in small and large companies are most likely to say it depends on the
person. Among those who provided a specific age, workers say age 75 (median) is when a person is considered
too old to work.

Level of Concern About Health in Older Age
Workers in small companies (72 percent) are equally as likely as those in large companies (73 percent) to be
“very” or “somewhat” concerned about their health in older age.
New question added in 2017BASE: ALL QUALIFIED RESPONDENTSQ1445X1. How concerned are you about your health in older age?
Small Companies2017 (N=3,428)
Large Companies2017 (N=2,944)
22
50
23
5
23
50
23
4
NET – Concerned:72%
Very concerned Somewhat concerned Not too concerned Not at all concerned
Concerned About Health in Older Age (%)
NET – Concerned:73%
108

Engagement in Health-Related Activities on a Consistent Basis
Workers in small and large companies do many health-related activities on a consistent basis. However, small
company workers are slightly more likely to engage in health-related activities compared to large company
workers. Of concern, only about a quarter of workers across company size consider their long-term health when
making lifestyle decisions.
New question added in 2017
BASE: ALL QUALIFIED RESPONDENTS
Q1446. Which of the following health-related activities are you doing on a consistent basis? Select all. 109
Engaging in Health-Related Activities on a Consistent Basis (%)
Small CompanyN=3,428
Large CompanyN=2,944
Eating healthfully
Exercising regularly
Maintaining a positive outlook
Seeking medical attention when needed
Avoiding harmful substances (e.g., cigarettes, alcohol, illicit drugs, etc.)
Getting plenty of rest
Getting routine physicals and recommended health screenings
Managing stress
Considering long-term health when making lifestyle decisions
Practicing mindfulness and meditation
Other
Nothing
57
56
54
50
49
50
47
45
24
20
1
4
54
51
52
55
51
46
49
43
26
19
1
5

Both small and large company workers share similar expectations regarding age they are planning to live to.
Large company workers are planning to live to an age of 90 (median) and 13 percent of them are planning to
become centenarians. Small company workers are also planning to live to age 90 (median) with 15 percent
planning to live to 100+.
Planning to Live to Age ...
110
Data prior to 2017 shows results among workers in companies with 10+ workers. Data for 2017 shows results among workers in companies with 5+ workers.BASE: ALL QUALIFIED RESPONDENTS Q2850. What age are you planning to live to?
What age are you planning to live to? (%)
Not sure 41 17Median Age 90 Age 85
53
11
30
20
14
2016
Not sure 43 14Median Age 90 Age 89
Small Company Large Company
N=2,944 N=2,138N=3,428 N=2,023
Age 100+
Age 90-99
Age 80-89
Age 70-79
Age 60-69
Age <60
439
28
25
18
2016
1 16
17
19
15
2017
22
5
18
17
13
2017

Current Financial Priorities
111BASE: ALL QUALIFIED RESPONDENTSQ2639. Which of the following are your financial priorities right now? Select all.
A majority of workers in both small (63 percent) and large (69 percent) companies indicate that “paying off
debt” (NET) is a current financial priority. A majority of workers in small companies (55 percent) cite saving for
retirement as a current priority, while significantly more (64 percent) workers in large companies cite retirement
savings as a financial priority. Approximately two in five workers of both small and large companies cite paying
off credit card or consumer debt as a priority.Current Financial Priorities (%)
Small Companies Large Companies
■ 2017 (N=3,428) ■ 2017 (N=2,944)
NET – Paying off debt
Paying off credit card debt
Paying off mortgage
Paying off other consumer debt
Paying off student loans
Building savings
Saving for retirement
Just getting by to cover basic living expenses
Supporting children
Paying healthcare expenses
Creating an inheritance or financial legacy
Supporting parents
Other
63
41
30
15
14
58
55
34
31
23
10
10
4
69
46
34
19
17
59
64
35
29
25
12
9
4

Financial priorities among workers of small and large companies are similarly shared. The top three most
frequently cited priorities among workers are “paying off debt”(NET) (28 percent small, 32 percent large),
saving for retirement” (21 percent small, 20 percent large), and “just getting by” (18 percent small, 17 percent
large).
Greatest Financial Priority Right Now
112BASE: ALL QUALIFIED RESPONDENTSQ2640. Which one of the following is your greatest financial priority right now?
Small Companies Large Companies
■ 2017 (N=3,428) ■ 2017 (N=2,944)
NET – Paying off debt
Paying off credit card debt
Paying off mortgage
Paying off student loans
Paying off other consumer debt
Saving for retirement
Just getting by to cover basic living expenses
Building savings
Supporting children
Paying healthcare expenses
Supporting parents
Creating an inheritance or financial legacy
Other
28
15
9
2
2
21
18
13
12
2
2
2
2
Greatest Financial Priority Right Now (%)
32
18
9
2
3
20
17
12
11
3
2
1
2

The most frequently cited types of household debt are credit card (63 percent in large company workers, 57
percent for small company workers), mortgage (46 percent in large company workers, 39 percent in small
company workers), and car loan (43 percent in large company workers, 38 percent in small company workers).
Types of Household Debt
113
Which of the following types of debtdoes your household currently have? Select all (%)
Small companiesN=3,428
Large companiesN=2,944
Credit card
Mortgage
Car loan
Student loan
Medical debt
Personal loan
Home equity loan
Loan from family or friends
Tax debt
Payday loan
Business loan
Investment debt
Other debt
My household currently does not have any debts
63
46
43
23
18
16
8
6
7
5
3
3
4
11
57
39
38
17
12
12
9
6
5
4
4
3
3
16
New question added in 2017BASE: ALL QUALIFIED RESPONDENTS Q1286. Which of the following types of debt does your household currently have? Select all.
NET – Has DebtSmall companies = 84%
NET – Has DebtLarge companies = 89%

Workers of both small and large companies lack emergency savings that could help cover the cost of a major
financial setback (e.g., unemployment, medical bills, home repairs, auto repairs, other). Workers in small
companies have saved just $5,000 (median) for such emergencies while workers in large companies have
saved even less, $3,000 (median). More than one-third of small company (36 percent) and large company
workers (39 percent) have saved less than $5,000. Of concern, one in five workers are "not sure" how much
they have saved in emergency savings: 23 percent of small company workers and 25 percent of large company
workers.
Estimated Emergency Savings
114
Data prior to 2017 shows results among workers in companies with 10+ workers. Data for 2017 shows results among workers in companies with 5+ workers.BASE: ALL QUALIFIED RESPONDENTS Q2825. How much do you have in emergency savings specifically to cover the cost of unexpected major financial setbacks (e.g., unemployment, medical bills, home repairs, auto repairs, other)?
N=3,428 N=2,944
How much do you have in emergency savings to cover the cost ofunexpected major financial setbacks? (%)
20 20
16 14
8 10
7 63 23 3
16 16
4 4
2017 2016
Small Companies Large Companies
Not sure 23 25 25 22
Median $5,000 $5,000 $3,000 $5,000
$100k or more
$25k to less than $100k
$20k to less than $25k
$15k to less than $20k
$10k to less than $15k
$5k to less than $10k
$1k to less than $5k
Less than $1k
24 22
1513
77
67
33
3 3
13 17
4 6
2017 2016
N=2,023 N=2,138

Data prior to 2017 shows results among workers in companies with 10+ workers. Data for 2017 shows results among workers in companies with 5+ workers.BASE: THOSE CURRENTLY OFFERED QUALIFIED PLANQ1190. Do you currently participate in, or have money invested in your company’s employee-funded retirement savings plan?BASE: ALL QUALIFIED RESPONDENTSQ740. Are you currently saving for retirement outside of work, such as in an IRA, mutual funds, bank account, etc.?BASE: INVESTING FOR RETIREMENTQ790. At what age did you first start saving for retirement?
More large company workers (79 percent) than small company workers (73 percent) are saving for retirement
at work through employer sponsored plans, such as a 401(k) or similar plan. The median age at which workers
started saving is relatively consistent between small (age 28) and large (age 27) company workers.
Saving for Retirement / Age Started Saving
115
73 73 73 74 7579 80 78
83 81
2017 2016 2015 2014 2013 2017 2016 2015 2014 2013
Workers Who Are Saving For Retirement Through an Employer-Sponsored Retirement Plan And/Or Outside of Work (%)
Age Started Saving
(Median)28 27 28 28 27 27 26 27 27 26
Small Companies Large Companies

Data prior to 2017 shows results among workers in companies with 10+ workers. Data for 2017 shows results among workers in companies with 5+ workers.BASE: ALL QUALIFIED RESPONDENTS Q1145. Which one of the following do you expect to be sources of income to cover your living expenses after you retire? Select all.
Self-funded savings including retirement accounts (e.g., 401(k)s, 403(b)s, IRAs) and other savings and
investments are the most frequently cited source of retirement income expected by workers of both company
sizes: 78 percent of small company workers and 86 percent of large company workers. This is closely followed
by Social Security as an expected source of retirement income for 72 percent of small company workers and 76
percent of large company workers.
Expected Sources of Retirement Income
116
Expected Sources of Income During Retirement (%)
Small Companies Large Companies
■ 2017 (N=3,428)
■ 2016 (N=2,023)
■ 2017 (N=2,944)
■ 2016 (N=2,138)
NET – Self-Funded Savings
401(k) / 403(b) Accounts / IRAs
Other savings and investments
Social Security
Working
Company-funded pension plan
Home equity
Inheritance
Other
78
63
50
72
41
18
14
11
3
75
63
46
68
39
21
15
11
4
86
77
50
76
36
28
13
11
2
81
73
48
72
38
29
13
11
4

Workers of large companies (41 percent) are more likely to expect to rely on retirement accounts (e.g., 401(k)s,
403(b)s, IRAs) as their primary source of income in retirement compared to workers of small companies (32
percent). Expectations that “working” will be their primary source of income is higher among workers of small
companies compared to those in large companies (16 percent and 13 percent, respectively).
Data prior to 2017 shows results among workers in companies with 10+ workers. Data for 2017 shows results among workers in companies with 5+ workers.BASE: ALL QUALIFIED RESPONDENTS Q1150. Which one of the following do you expect to be your primary source of income to cover your living expenses after you retire?
Small Companies Large Companies
■ 2017 (N=3,428)■ 2016 (N=2,023)■ 2015 (N=2055)
■ 2014 (N=1,925)
■ 2013 (N=1,764)
■ 2017 (N=2,944)■ 2016 (N=2,138)■ 2015 (N=2,494)
■ 2014 (N=2118)
■ 2013 (N=1,887)
401(k) / 403(b) accounts / IRAs
Social Security
*Working
Other savings and investments
Company-funded pension plan
Home equity
Inheritance
Other
32
28
16
14
5
2
2
1
33
25
16
13
6
2
2
3
34
27
14
15
3
1
3
3
37
30
17
6
2
3
5
36
28
20
7
2
3
5
41
25
13
10
8
1
1
1
37
25
14
10
9
1
2
2
40
26
12
9
9
1
1
3
49
22
13
8
2
2
5
45
26
12
10
1
2
5
Expected Primary Source of Income in Retirement
N/A N/A
Expected Primary Source of Income in Retirement (%)
117

Small Companies Large Companies
■ 2017 (N=3,428)■ 2016 (N=2,023)■ 2015 (N=2,056)
■ 2014 (N=1,925)
■ 2013 (N=1,764)
■ 2017 (N=2,944)■ 2016 (N=2,138)■ 2015 (N=2,494)
■ 2014 (N=2,218)
■ 2013 (N=1,887)
Health insurance
A 401(k)/403(b)/457(b) or other employee self-funded plan
Life insurance
Disability insurance
Long-Term Care insurance
Company-funded defined-benefit pension plan
*A company-funded cash balance plan
Critical Illness Insurance
**Financial Wellness Program
**Employee Assistance Program
**Workplace Wellness Program
Cancer Insurance
Note: Data prior to 2017 shows results among workers in companies with 10+ workers. Data for 2017 shows results among workers in companies with 5+ workers.*added in 2014; **added in 2017 BASE: ALL QUALIFIED RESPONDENTS
Q1171. Businesses typically offer a number of different benefits for their workers. For each of the following, please tell us how important that benefit is to you, personally.
The vast majority of workers across small and large companies believe that retirement benefits are
important. Large company workers (91 percent) are somewhat more likely than those of small companies (86
percent) to value a 401(k) or similar plan as an important benefit. This trend has remained consistent over
the past five years.
Importance of Retirement Benefits Compared to Other Benefits
118
94
86
73
73
72
70
64
62
61
59
57
55
95
86
75
76
70
71
56
63
55
94
86
72
74
69
69
52
59
50
93
86
69
75
70
76
60
66
59
92
88
65
76
66
71
63
56
96
91
77
76
74
76
68
67
65
65
62
59
95
90
74
77
72
73
55
64
55
95
91
76
77
73
76
56
63
54
95
92
74
80
72
80
63
68
59
95
92
74
78
69
80
68
59
N/A N/A
Very/Somewhat Important(%) (NET)
N/A N/A
N/A N/A
N/A N/A

Small Company Large Company
■ 2017 (N=3,428)■ 2016 (N=2,023)■ 2015 (N=2,056)
■ 2014 (N=1,925)
■ 2013 (N=1,764)
■ 2017 (N=2,944)■ 2016 (N=2,138)■ 2015 (N=2,494)
■ 2014 (N=2,218)
■ 2013 (N=1,887)
NET – AN EMPLOYEE-FUNDED PLAN
Employee-funded 401(k) plan
Other employee self-funded plan(e.g., SEP, SIMPLE, Other)
NET – COMPANY-FUNDED PLAN
Company-funded defined benefit pension plan
*Company-funded cash balance plan
NET - NONE OF THE ABOVE
Other
None
59
54
8
22
18
8
35
2
33
60
58
4
21
19
7
32
56
53
5
15
12
6
37
57
55
4
17
13
7
35
58
53
6
11
38
A majority of workers are offered a 401(k) or similar employee-funded retirement plan in the workplace; however, access is
greater among workers of large companies (82 percent) compared to those of small companies (59 percent). Relatively few
workers are offered a traditional company-funded defined benefit plan. Of note, a third of small company workers say their
employer does not offer any retirement benefits, compared to 11 percent of large company workers.
Retirement Benefits Currently Offered
119
Data prior to 2017 shows results among workers in companies with 10+ workers. Data for 2017 shows results among workers in companies with 5+ workers.*added in 2014BASE: ALL QUALIFIED RESPONDENTSQ1180. Which of the following retirement benefits does your company currently offer to you, personally? Select all.
82
79
6
30
26
11
13
2
11
80
78
4
31
27
9
14
74
73
4
31
27
9
19
78
77
3
30
25
12
15
77
75
4
24
19
N/AN/A
N/AN/A
Employer-Sponsored Retirement Benefits Currently Offered (%)
N/AN/A
N/AN/A

Data prior to 2017 shows results among workers in companies with 10+ workers. Data for 2017 shows results among workers in companies with 5+ workers.BASE: THOSE CURRENTLY OFFERED QUALIFIED PLANQ1190. Do you currently participate in, or have money invested in your company’s employee-funded retirement savings plan?
Among workers who are offered a 401(k) or similar plan, the participation rate is similar among large company
workers (78 percent) and small company workers (81 percent). This trend has remained consistent over the
past five years.
Retirement Plan Participation
120
Participation in Company’s Employee-funded Retirement Savings Plan, % Indicate “Yes”
N=1,797
N=1,187
N=1,153
N=1,093
N=1,039
N=2,287
N=1,633
N=1,823
N=1,660
N=1,471
Small Companies Large Companies
78 77 79 78 7681 78 80 80 79
2017 2016 2015 2014 2013 2017 2016 2015 2014 2013

10%9%
7% 7%8% 8% 8% 8%
10%
7%
2017 2016 2015 2014 2013 2017 2016 2015 2014 2013
Data prior to 2017 shows results among workers in companies with 10+ workers. Data for 2017 shows results among workers in companies with 5+ workers.BASE: CURRENTLY PARTICIPATES IN QUALIFIED PLAN Q601. What percentage of your salary are you saving for retirement through your company-sponsored plan this year?
Among workers who participate in a 401(k) or similar plan, the median contribution rate is directionally higher
among small company workers (10 percent) than large company workers (8 percent). The average contribution
rate among workers in small companies contributing to their qualified plan increased slightly compared to
previous years.
Retirement Plan Contribution Rate
121
Contribution Rate, Median %
Mean 14.0 11.2 10.1 10.9 9.9 11.9 10.7 10.7 11.3 9.3
N=1,343 N=901 N=880 N=833 N=809 N=1,788 N=1,254 N=1,410 N=1,334 N=1,159
Small Companies Large Companies

42 41
40 38
82 79
Automatic enrollment is a retirement plan feature that eliminates the decision-making and action steps
normally required of employees to enroll and to start contributing to the plan. It simply automatically enrolls
employees into a plan and they only need to take action if they desire to opt out and not contribute to the plan.
Workers in small companies (82 percent) are more likely than workers in large companies (79 percent) to find
automatic enrollment into a 401(k), 403(b) or similar retirement plan as “very” or “somewhat” appealing.
Workers in smaller companies feel the appropriate default contribution rate for such a plan feature would be
10 percent while workers in large companies believe 6 percent is appropriate.
Appeal of Automatic Enrollment
122
New question added in 2017BASE: ALL QUALIFIED RESPONDENTS Q635. Imagine that your current employer automatically enrolled you into a 401(k), 403(b) or similar retirement plan, deducting a percentage of each paycheck, and investing it for your future retirement. How appealing would this seem to you?Q636. Imagine that your current employer automatically enrolled you into a 401(k), 403(b) or similar retirement plan, what would you consider to be an appropriate percentage to deduct from your paycheck to be invested for your future retirement?
Appeal of Automatic Enrollment (%)
Appropriate Default Contribution Rate
(median):10%
Very appealing
Somewhat appealing
NET - Appealing
Small Companies
N=3,428
Large Companies
N=2,944
Appropriate Default Contribution Rate
(median):6%

Likelihood of Using Automatic Escalation
More than seven in 10 workers in both small companies (76 percent) and large companies (73 percent) say
they would be “very” or “somewhat” likely to use a plan feature that automatically increases their contribution
rate to their 401(k) or similar plan by 1% each year. About three in 10 workers across company sizes would be
“very” likely to use this plan feature.
New question added in 2017BASE: ALL QUALIFIED RESPONDENTS Q702. How likely would you be to use a feature in a 401(k) or similar plan where your employer would automatically increase your contribution rate (as a percentage of your salary) to the plan by 1% each year, until you choose to discontinue this increase?
Small CompaniesN=3,428
32
44
15
9
29
44
17
10
NET – Likely:73%
NET – Likely:76%
Very likely Somewhat likely Not too likely Not at all likely
Likelihood of Using a Feature That Automatically Increases Contribution by 1% Each Year, Until You Choose to Discontinue (%)
Large CompaniesN=2,944
123

“Professionally managed” accounts refers to a managed account service, strategic allocation funds, and/or
target date funds. Many plan participants in both small (61 percent) and large companies (57 percent) are
using some form of professionally managed offering in their 401(k) or similar plans. Small business workers
(45 percent) are slightly more likely to set their own asset allocation among the available funds compared to
large company workers (42 percent).
Use of Professionally Managed Offerings
124
Data prior to 2017 shows results among workers in companies with 10+ workers. Data for 2017 shows results among workers in companies with 5+ workers.BASE: PARTICIPATING IN QUALIFIED PLANQ1466. What is your current approach to investing in your employer-sponsored retirement plan? Select all.
Small Companies
■ 2017 (N=1,346)
■ 2016 (N=903)
■ 2015 (N=882)
■ 2014 (N=835)
Large Companies
■ 2017 (N=1,791)
■ 2016 (N=1,256)
■ 2015 (N=1,413)
■ 2014 (N=1,337)
NET – Professionally Managed
I invest in an account (or service) that is managed by a professional investment advisor and I do not have to make investment or allocation decisions
I invest in a strategic allocation fund that is designed to address my specific risk tolerance profile
I invest in a target date fund that is designed to change allocation percentages as I approach my target retirement year
I set my own asset allocation percentages among the available funds
Not sure
Investments in Employer-Sponsored Retirement Plan (%)
61
28
26
19
45
7
62
30
26
20
42
9
51
22
20
17
44
14
57
28
25
17
41
12
42
57
27
19
23
13
40
58
26
20
25
13
44
52
23
21
20
17
47
52
22
23
23
12
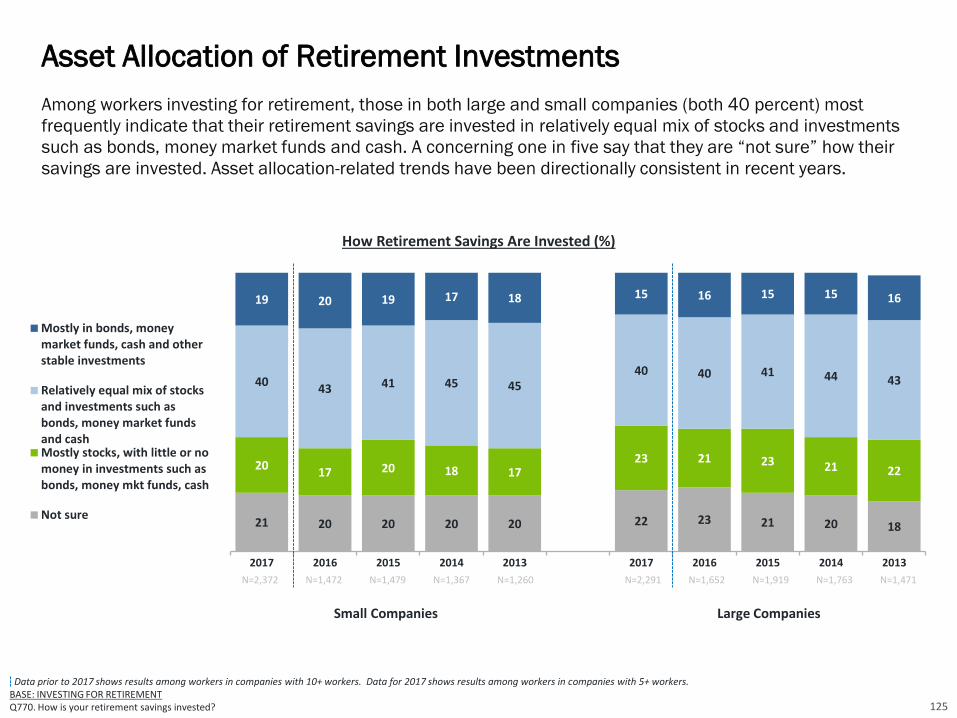
Data prior to 2017 shows results among workers in companies with 10+ workers. Data for 2017 shows results among workers in companies with 5+ workers.BASE: INVESTING FOR RETIREMENTQ770. How is your retirement savings invested?
Among workers investing for retirement, those in both large and small companies (both 40 percent) most
frequently indicate that their retirement savings are invested in relatively equal mix of stocks and investments
such as bonds, money market funds and cash. A concerning one in five say that they are “not sure” how their
savings are invested. Asset allocation-related trends have been directionally consistent in recent years.
Asset Allocation of Retirement Investments
125
21 20 20 20 20 22 23 21 20 18
2017 20 18 17
23 21 23 21 22
4043 41 45 45
40 40 41 44 43
19 20 19 17 18 15 16 15 15 16
2017 2016 2015 2014 2013 2017 2016 2015 2014 2013
Mostly in bonds, moneymarket funds, cash and otherstable investments
Relatively equal mix of stocksand investments such asbonds, money market fundsand cashMostly stocks, with little or nomoney in investments such asbonds, money mkt funds, cash
Not sure
N=2,372 N=1,472 N=1,479 N=1,367 N=1,260 N=2,291 N=1,652 N=1,919 N=1,763 N=1,471
Small Companies Large Companies
How Retirement Savings Are Invested (%)

“Leakage” from retirement plans in the form of loans and withdrawals can severely inhibit the growth of
participants’ long-term retirement savings. Twenty-five percent of small company and 34 percent of large
company workers have taken some form of loan, early withdrawal, and/or hardship withdrawal from a 401(k),
or similar plan or IRA.
Retirement Plan Leakage: Loans and Withdrawals
Data prior to 2017 shows results among workers in companies with 10+ workers. Data for 2017 shows results among workers in companies with 5+ workers.BASE: ALL QUALIFIED RESPONDENTSQ754. Have you ever taken any form of loan or early withdrawal from a qualified retirement account such as a 401(k) or similar plan or IRA? Select all.
Have you ever taken any form of loan or early withdrawal from a qualifiedretirement account such as a 401(k) or similar plan or IRA? (%)
Small Companies Large Companies■ 2017 (N=1,797)
■ 2016 (N=1,187)
■ 2017 (N=2,287)
■ 2016 (N=1,633)
NET - Have Taken a Loan, Early Withdrawal, and/or Hardship Withdrawal From 401(k) or Similar Plan or IRA
Yes, I have taken a loan from a 401(k) or similar plan and am paying it back
Yes, I have taken a hardship withdrawal and incurred taxes and penalties
Yes, I have taken an early withdrawal and cashed out a portion or all of a 401(k) or similar plan balance after my separation of employment from a prior employer and incurred taxes and penalties
Yes, I have taken a loan from a 401(k) or similar plan but was unable to pay it back so it became an early withdrawal and incurred taxes and penalties
Yes, I have taken an early withdrawal and cashed out a portion or all of an IRA and incurred taxes and penalties
No, I have never taken a loan or early withdrawal from a 401(k) or similar plan or IRA
Not sure
25
11
5
7
5
5
71
4
24
11
4
7
5
4
70
6
34
20
8
7
6
5
64
3
27
17
5
7
5
4
70
3
126

4 46 16 14 14 16 6 14 11 9 13
7
65 5 5
64
4 45
95 8 7 7
7 56 6
7
10 7 9 10 88 6 8 8
8
1310
12 13 1212
8 9 1411
12
1113 13 15
13
13 1415
14
28
2419 19 16 31
28 2624 20
2017 2016 2015 2014 2013 2017 2016 2015 2014 2013
$250k or more
$100k to less than $250k
$50k to less than $100k
$25k to less than $50k
$10k to less than $25k
$5k to less than $10k
Less than $5k
None 0 *
N=2,555
N=2,023
N=2,056
N=1,925
N=1,764
N=2,320
N=2,138
N=2,494
N=2,218
N=1,887
Small Companies Large Companies
Workers of large companies report higher levels of total household savings in retirement accounts compared to
those of small companies. Large company workers have saved $78,000 (estimated median), while small
company workers have saved $62,000 (estimated median). Large company workers (31 percent) are also
slightly more likely than small company workers (28 percent) to say they have saved $250,000 or more, a
consistent finding over the past five years. Retirement savings have been increasing incrementally among small
and large company workers since 2012.
Total Household Retirement Savings
127
Data prior to 2017 shows results among workers in companies with 10+ workers. Data for 2017 shows results among workers in companies with 5+ workers.*added in 2017
BASE: ALL QUALIFIED RESPONDENTSQ1300. Approximately how much money does your household have saved in all of your retirement accounts? Please include IRAs, 401(k)s, 403(b)s, and any other savings for retirement to which you and/or your spouse or partner have contributed funds.
Note: The median is estimated based on the approximate midpoint of the range of each response category. Non-responses are excluded from the estimate.
Total Household Retirement Savings by Company Size (%)
Not sure 7 12 10 8 9 9 12 12 10 11
Decline to answer 4 9 10 11 12 4 10 10 10 11
Estimated Median $62,000 $56,000 $50,000 $51,000 $47,000 $78,000 $87,000 $79,000 $73,000 $58,000
N/A N/A N/A N/A N/A N/A N/A N/A

Workers of both large and small companies believe that they will need to save $500,000 (median) to feel
financially secure when they retire. This year’s survey finding is consistent with last year’s, but a major decrease
from 2015 when workers indicated they would need to save $1,000,000 (median).
Estimated Retirement Savings Needs
128
20 228 12 14
28 22
2022
27
2122
18
21
23
17 19
24
21
22
14 1530 24
14
2017 2016 2015 2014 2013
$2m or more
$1m to less than $2m
$500k to less than $1m
$100k to less than $500k
Less than $100k
Median $500,000 $500,000 $1,000,000 $750,000 $500,000 $500,000 $500,000 $1,000,000 $1,000,000 $500,000
Note: The median is estimated based on the approximate midpoint of the range of each response category.
Small Company
Data prior to 2017 shows results among workers in companies with 10+ workers. Data for 2017 shows results among workers in companies with 5+ workers.BASE: ALL QUALIFIED RESPONDENTSQ890. Thinking of what money can buy today, how much money do you believe you will need to have saved by the time you retire in order to feel financially secure?
Large Company
17 1810 9 14
26 22
15 17
25
19 21
19 20
22
22 23
26 23
20
16 1630 31
18
2017 2016 2015 2014 2013
N=3,428 N=2,023 N=2,056 N=1,925 N=1,764 N=2,944 N=2,138 N=2,494 N=2,218 N=1,887
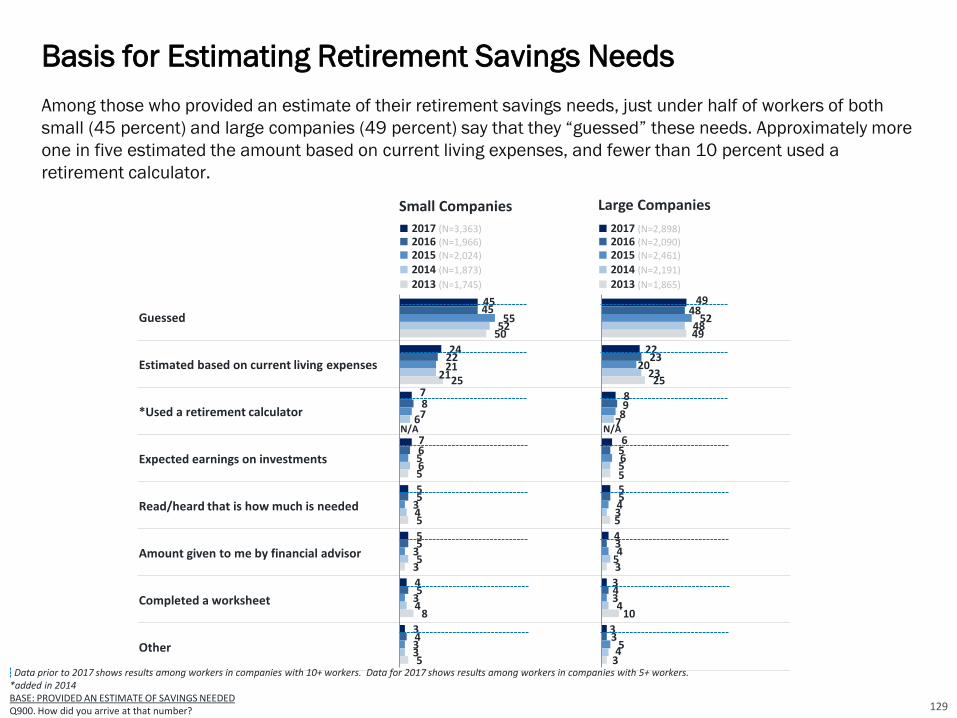
Small Companies Large Companies
■ 2017 (N=3,363)■ 2016 (N=1,966)■ 2015 (N=2,024)
■ 2014 (N=1,873)
■ 2013 (N=1,745)
■ 2017 (N=2,898)■ 2016 (N=2,090)■ 2015 (N=2,461)
■ 2014 (N=2,191)
■ 2013 (N=1,865)
Guessed
Estimated based on current living expenses
*Used a retirement calculator
Expected earnings on investments
Read/heard that is how much is needed
Amount given to me by financial advisor
Completed a worksheet
Other
49
22
8
6
5
4
3
3
48
23
9
5
5
3
4
3
52
20
8
6
4
4
3
5
48
23
7
5
3
5
4
4
49
25
5
5
3
10
3
45
24
7
7
5
5
4
3
45
22
8
6
5
5
5
4
55
21
7
5
3
3
3
3
52
21
6
6
4
5
4
3
50
25
5
5
3
8
5Data prior to 2017 shows results among workers in companies with 10+ workers. Data for 2017 shows results among workers in companies with 5+ workers.
*added in 2014BASE: PROVIDED AN ESTIMATE OF SAVINGS NEEDEDQ900. How did you arrive at that number?
Among those who provided an estimate of their retirement savings needs, just under half of workers of both
small (45 percent) and large companies (49 percent) say that they “guessed” these needs. Approximately more
one in five estimated the amount based on current living expenses, and fewer than 10 percent used a
retirement calculator.
Basis for Estimating Retirement Savings Needs
129
N/AN/A

Most workers of both small and large companies (64 percent small, 60 percent large) say that they have some
form of retirement strategy, either written or unwritten. However, only 17 percent of small company workers
and 14 percent of large company workers have a written plan.
Retirement Strategy: Written, Unwritten, or None
130
Data prior to 2017 shows results among workers in companies with 10+ workers. Data for 2017 shows results among workers in companies with 5+ workers.BASE: ALL QUALIFIED RESPONDENTSQ1155. Which of the following best describes your retirement strategy?
47 45 43 46 44 46 47 45 48 47
17 1813
1312
14 1615
14 12
64 63
5659
5660
6360 62
60
2017 2016 2015 2014 2013 2017 2016 2015 2014 2013
I have a written plan
I have a plan, but it is not written down
N=3,428 N=2,023 N=2,056 N=1,925 N=1,764 N=2,944 N=2,138 N=2,494 N=2,218 N=1,887
Small Companies Large Companies
Have a Retirement Strategy (%)

Travel is the top retirement dream among workers in small and large companies (see page 79). Among workers
who dream of traveling in retirement, most are confident their current financial strategy will allow them to meet
their retirement travel goals including 58 percent of small company workers and 57 percent of large company
workers. However, relatively few workers are “very” confident (21 percent small companies, 19 percent large
companies). Interestingly, some workers haven’t given much thought to it (14 percent small companies, 15
percent large companies).
Confidence that Financial Strategy Will Enable Travel Goals
Note: Data prior to 2017 shows results among workers in companies with 10+ workers. Data for 2017 shows results among workers in companies with 5+ workers.BASE: THOSE WHO DREAM OF TRAVELING IN RETIREMENTQ2845. How confident are you that your current financial strategy will allow you to meet your travel goals throughout retirement?
Confidence That Current Financial Strategy Will Meet Retirement Travel Goals (%)
Small Companies Large Companies
■ 2017 (N=2270)
■ 2016 (N=1319)
■ 2017 (N=2005)
■ 2016 (N=1,429)
Very confident
Somewhat confident
Not too confident
Not at all confident
I haven’t given much thought to a financial strategy for travel in retirement
131
21
37
18
10
14
17
43
15
10
15
19
38
18
10
15
18
39
16
10
17
NET Confident2017: 57%2016: 57%
NET Confident2017: 58%2016: 60%

Small company workers (45 percent) who are investing for retirement are more likely to use a professional
financial advisor to help manage their retirement savings or investments compared to large company
workers (33 percent). This gap has been relatively consistent over the past five years.
Professional Financial Advisor Usage
132
Data prior to 2017 shows results among workers in companies with 10+ workers. Data for 2017 shows results among workers in companies with 5+ workers.BASE: INVESTING FOR RETIREMENTQ860. Do you use a professional financial advisor to help manage your retirement savings or investments?
4541
3740 42
3337
33 34 32
2017 2016 2015 2014 2013 2017 2016 2015 2014 2013
N=2,372 N=1,472 N=1,479 N=1,367 N=1,260 N=2,291 N=1,652 N=1,919 N=1,763 N=1,471
Small Companies Large Companies
Use a Professional Financial Advisor % Indicate “Yes”

The IRS Saver’s Credit is a tax credit available to eligible taxpayers who are saving for retirement in a qualified
retirement plan or IRA. Workers in small companies (37 percent) are more likely to be aware of the credit,
compared to workers in large companies (32 percent), a finding similar to last year.
Awareness of Saver’s Credit
133
Data prior to 2017 shows results among workers in companies with 10+ workers. Data for 2017 shows results among workers in companies with 5+ workers.BASE: ALL QUALIFIED RESPONDENTS Q1120. Are you aware of a tax credit called the “Saver’s Credit,” which is available to individuals and households, who meet certain income requirements, for making contributions to an IRA or a company-sponsored retirement plan such as a 401(k) plan or 403(b) plan?
37
63
Small Companies2017 (N=3,428)
32
68
Large Companies2017 (N=2,944)
35
65
Small Companies2016 (N=2,023)
31
69
Large Companies2016 (N=2,138)
Yes, I am aware No, I am not aware

Fewer than half of workers in small and large companies (44 percent) are aware of the IRS’ Free File program
that offers federal income tax preparation software for free to eligible tax filers.
Awareness of the IRS’ Free File Program
134
New question added in 2017BASE: ALL QUALIFIED RESPONDENTS Q2821. Are you aware of the IRS’ Free File program that offers federal income tax preparation software for free for eligible tax filers?
44
56
Small CompaniesN=3,428
44
56
Large CompaniesN=2,944
No Yes
Awareness of the IRS’ Free File Program (%)

Influences of Generation on Retirement Readiness
Detailed Findings
135

Baby Boomers, Generation X, and Millennials face unique circumstances as well as common challenges in
achieving long-term financial security. Baby Boomers (born 1946 to 1964) have re-written societal rules at
every stage of their life – and are now trailblazing a new brand of retirement. Generation X (born 1965 and
1978) entered the workforce in the late 1980s and were making their first appearance and defined benefit
plans were beginning to disappear. Millennials (born 1979 to 2000) are a digital do-it-yourself generation of
retirement savers that will be self-funding a greater portion of their future retirement income compared to older
generations. All three generations face risks and opportunities for improving their long-term retirement outlook.
Forty Indicators of Retirement Readiness
• Confidence in Retiring Comfortably. More than half of workers are “somewhat” or “very” confident that they
will be able to retire comfortably; confidence is highest among Millennials (67 percent) and Baby Boomers
(62 percent) and notably lower among Generation X (55 percent). Relatively few workers of all three
generations are “very” confident, including 22 percent of Millennials, 14 percent of Generation X, and 16
percent of Baby Boomers.
• Recovery From the Great Recession. Many workers across generations have not yet fully recovered from
the Great Recession. Financial recovery varies across generations. Millennial workers (27 percent) are
most likely to say they were “not impacted,” followed by Generation X (16 percent) and Baby Boomers (14
percent). Generation X (23 percent) are more likely than Baby Boomers (18 percent) and Millennials (17
percent) to say they have “not yet begun to recover” or “may never recover.”
• Building a Large Enough Nest Egg? At least half of Generation X (50 percent) and Baby Boomers (53
percent) either “somewhat” or “strongly” agree that they are building a large enough retirement nest egg,
and slightly more Millennials (56 percent) agree. Among all three generations, fewer than one in four
“strongly” agree.
Influences of Generation on Retirement Readiness
136

• Retirement Dreams Include Leisure and Work. Workers across generations share the same top three
retirement dreams: traveling, spending more time with family and friends, and pursuing hobbies. Workers
of all generations most frequently cite traveling as a retirement dream, including Millennials (73 percent),
Generation X (69 percent), and Baby Boomers (65 percent). The second most frequently cited retirement
dream is spending more time with family and friends (59 percent Millennials, 55 percent Generation X, 55
percent Baby Boomers). Interestingly, 36 percent of Millennials, 27 percent of Generation X, and 25
percent of Baby Boomer workers dream of doing some sort of work in retirement.
• Retirement Beliefs, Preparations, and Involvement. Across generations, at least three out of four workers
agree that their generation will have a much harder time achieving financial security compared to their
parent’s generation. Generation X (83 percent) and Millennials (80 percent) are more likely than Baby
Boomers (65 percent) to be concerned that Social Security will not be there for them when they are ready
to retire.
• Expected Retirement Age. Sixty-six percent of Baby Boomers expect to either work past age 65 (53
percent) or do not plan to retire (13 percent). Fifty-six percent of Generation X share these expectations
including 43 percent who plan to work past age 65 and 13 percent who do not plan to retire. In contrast,
the majority of Millennials (58 percent) expect to either retire at age 65 (25 percent) or sooner (33
percent).
• Planning to Work in Retirement. More than half of workers across generations plan to continue working
after they retire, including 54 percent of Baby Boomers, 54 percent of Generation X, and 58 percent of
Millennials. Among those planning to work, most plan to do so on a part-time basis.
• Reasons for Working in Retirement. Many workers across the generations who expect to retire after age 65
or work after retirement cite financial reasons (Millennial, 81 percent; Generation X, 85 percent; Baby
Boomer, 84 percent) and a smaller majority cite healthy-aging reasons (Millennial, 78 percent; Generation
X, 69 percent; Baby Boomer, 74 percent).
Influences of Generation on Retirement Readiness
137

• Retirement Transitions: Phased Versus Immediate. Many workers across the three generations plan to
either transition into retirement by changing work patterns (e.g., shifting from full-time to part-time or
working in a different capacity) or plan to continue working until they cannot work any longer. Baby
Boomers (26 percent) are more likely to plan to immediately stop working when they reach a certain age or
savings goal compared to Generation X and Millennials (both 22 percent).
• Phased Retirement and Compensation-Related Expectations. Among workers who envision a phased
transition into retirement, most have realistic expectations regarding how changes in their work
arrangements may affect their job title, compensation, and benefits. The majority of workers across
generations who envision a phased transition into retirement expect to receive the same benefits they
have now if they were to shift from full-time to part-time work at their current employer. Baby Boomer (83
percent) workers are more likely to believe that if they reduce their work hours at their current employer,
they would expect to be paid the same hourly rate that they earn now, followed by slightly fewer Millennial
(78 percent) and Generation X workers (76 percent).
• Perceptions of Older Workers. Ageism is a common concern in today’s society, especially with so many
workers planning to extend their working lives beyond age 65. More Baby Boomer and Generation X than
Millennial workers have positive perceptions of workers age 50 and older compared to younger workers in
today’s workforce. Baby Boomer (80 percent) and Generation X (65 percent) believe workers age 50 and
older bring more knowledge, wisdom, and life experience, compared to 47 percent of Millennial workers
who think this.
Influences of Generation on Retirement Readiness
138

• Age That Workers Consider a Person to Be “Old.” The median age a worker considers a person to be “old”
rises with each generation from younger to older (Millennials, 65 years old; Generation X, 70 years old;
Baby Boomer, 75 years old). Slightly more than half of Baby Boomers (52 percent) think “it depends on
the person,” significantly more than Millennial (33 percent) or Baby Boomer (37 percent) workers.
• Age That Workers Consider a Person to Be “Too Old” to Work. Workers across generations have a smaller
range of the age they consider to be “too old” to work. Millennial workers believe that the age of 70
(median) is “too old” for a person to work, while Generation X and Baby Boomer workers believe that 75
(median) is “too old” to work. More than half of Baby Boomers (69 percent) and Generation X (54 percent)
think “it depends on the person” compared to fewer Millennials (44 percent).
• Level of Concern About Health in Older Age. Many workers, regardless of generation, are “very” or
“somewhat concerned” about their health in older age, including 75 percent of Generation X, 73 percent of
Millennial, and 71 percent of Baby Boomer workers. Interestingly Millennial workers are most likely to be
“very concerned” about their health (27 percent), compared to Generation X (24 percent) and Baby
Boomers (17 percent).
• Engagement in Health-Related Activities on a Consistent Basis. Workers across generations are engaging
in health-related activities on a consistent basis. In general, higher proportions of Baby Boomers are doing
these activities compared to both Generation X and Millennial workers.
• Planning to Live to Age ... Workers across generations share similar expectations regarding the age they
are planning to live to with each generation planning to live to the age of 90 (median among those who
gave an estimate). Nearly one in five Millennials (18 percent) expect to live to 100+ compared to 13
percent in Generation X and 10 percent in Baby Boomers.
Influences of Generation on Retirement Readiness
139

• Current Financial Priorities. Financial priorities change by life stage although some are common to all
“paying off debt” (NET) is the most frequently cited current financial priority across generations, including
Baby Boomers workers (59 percent), Generation X (72 percent), and Millennials (67 percent). Baby
Boomer workers (72 percent) are more likely to cite saving for retirement as a financial priority compared
to Generation X (61 percent) and Millennials (45 percent).
• Greatest Financial Priority Right Now. Baby Boomers are most likely to cite “saving for retirement” as their
greatest financial priority right now (39 percent), compared to Generation X (21 percent) and Millennials (9
percent).
• Types of Household Debt. Debt poses a significant financial risk to workers across generations. Credit card
debt is the most common household debt among Millennial (59 percent), Generation X (66 percent), and
Baby Boomer (55 percent) workers. Millennial workers are more likely to have student loans, personal
loans, or payday loans compared to older workers.
• Estimated Emergency Savings. Many workers lack emergency savings that could help cover the cost of a
major financial setback (e.g., unemployment, medical bills, home repairs, auto repairs, other). Emergency
savings are low across the three generations, including Millennials at $2,000 (median), Generation X at
$4,000 (median), and Baby Boomers at $10,000 (median). Moreover, one in four Millennials (27 percent)
have saved less than $1,000. Baby Boomers (27 percent) are more likely to have saved more than
$25,000.
• Saving for Retirement / Age Started Saving. The majority of workers across all three generations are saving
for retirement through an employer-sponsored plan and/or outside of work. Baby Boomers (85 percent)
are most likely to be saving, followed by Generation X (80 percent) and Millennials (71 percent). In terms of
the median age that they started saving, Millennials started at a younger age (age 24) compared to
Generation X (age 30) and Baby Boomers (age 35).
Influences of Generation on Retirement Readiness
140

• Expected Sources of Retirement Income. Self-funded savings including retirement accounts (e.g., 401(k)s,
403(b)s, IRAs) and other savings and investments are the most frequently cited source of retirement
income expected by Millennials (84 percent) and Generation X (81 percent), while Baby Boomers are most
likely to expect income from Social Security (91 percent).
• Expected Primary Source of Income in Retirement. Millennial (41 percent) and Generation X (41 percent)
workers most frequently cite 401(k)s, 403(b)s, or IRAs to be their expected primary source of retirement
income, while Baby Boomers (37 percent) are more likely to expect to rely on Social Security during
retirement. Approximately one in seven Millennials (17 percent) and Generation X (15 percent) expect
“working” to be their primary source of retirement income.
• Importance of Retirement Benefits Compared to Other Benefits. The vast majority of workers — including
89 percent of Millennials, 91 percent of Generation X, and 85 percent of Baby Boomers — believe that a
401(k) or similar plan is a “somewhat” or “very” important employee benefit. This trend has remained
consistent over time.
• Retirement Benefits Currently Offered. Most workers are offered a 401(k) or similar plan by their
employers. Generation X (75 percent) are more likely to be offered such benefits compared to Millennials
(68 percent) and Baby Boomers (71 percent). Few workers are offered a company-funded defined benefit
plan.
• Retirement Plan Participation. Among workers who are offered a 401(k) or similar plan, Generation X and
Baby Boomers (both 85 percent) are more likely to participate in the plan compared to Millennial workers
(75 percent).
• Retirement Plan Contribution Rate. Among workers who participate in a 401(k) or similar plan, Millennials
contribute 10 percent (median) of their annual pay, up from 7 percent (median) last year. Baby boomer
workers also contribute 10 percent (median) while Generation X workers contribute 8 percent (median).
Influences of Generation on Retirement Readiness
141
• Appeal of Automatic Enrollment. Automatic enrollment is a retirement plan feature that eliminates the
decision-making and action steps normally required of employees to enroll and to start contributing to the
plan. It simply automatically enrolls employees into a plan and they only need to take action if they desire
to opt out and not contribute to the plan. The majorities of workers across generations find automatic
enrollment appealing, including Millennials (82 percent), Generation X (83 percent) and Baby Boomers (77
percent). Millennial workers suggest the highest median appropriate default contribution rate (10 percent)
compared to Generation X (6 percent) and Baby Boomers (6 percent).
• Likelihood of Using Automatic Escalation. Likelihood to use a feature that automatically increases their
contribution by 1% each year is high across the generations. However, more Millennials (78 percent) and
Generation X (75 percent) workers indicate they are likely to use the feature than Baby Boomers (71
percent).
• Use of Professionally Managed Offerings. “Professionally managed” accounts refers to a managed account
service, strategic allocation funds, and/or target date funds. The majority of plan participants across
generations use some form of professionally managed offering in their 401(k) or similar plans: 63 percent
of Millennials, 60 percent of Generation X, and 53 percent of Baby Boomers.
• Asset Allocation of Retirement Investments. Workers across generations most frequently cite that their
retirement savings are invested in a relatively equal mix of stocks and investments such as bonds, money
market funds and cash; however, more Baby Boomers (47 percent) invest this way compared to
Generation X (39 percent) and Millennials (35 percent). A concerning 26 percent of Millennials are “not
sure” how their savings are invested.
• Retirement Plan Leakage: Loans and Withdrawals. A concerning percentage of workers are dipping into
their retirement savings before they retire. “Leakage” from retirement plans in the form of loans and
withdrawals can severely inhibit the growth of participants’ long-term retirement savings. Generation X (30
percent) and Baby Boomers (28 percent) workers are more likely to have taken some form of loan, early
withdrawal, and/or hardship withdrawal from a 401(k), compared to Millennials (22 percent).
Influences of Generation on Retirement Readiness
142

• Total Household Retirement Savings. Baby Boomer workers have the highest reported total household
retirement savings at $164,000 (estimated median) compared to Generation X ($72,000) and Millennials
($37,000). Baby Boomer workers (42 percent) are most likely to have saved $250,000 or more compared
to Generation X (30 percent) and Millennials (21 percent). A worrying 14 percent of Millennials have less
than $5,000 in retirement savings.
• Estimated Retirement Savings Needs. Millennial workers believe that they will need to have saved
$400,000 (median) in order to feel financially secure when they retire while Generation X and Baby
Boomers feel they will need to have $500,000 (median).
• Basis for Estimating Retirement Savings Needs. Many workers are “guessing” their retirement savings
needs, including 48 percent of Millennials, 48 percent of Generation X, and 45 percent of Baby Boomers.
Fewer than one in 10 say they have used a retirement calculator to estimate their needs.
• Retirement Strategy: Written, Unwritten, or None. Achieving retirement readiness is more than just saving
enough; it involves planning for both the expected and, moreover, the unexpected. One of the most
important secrets to attaining retirement readiness is having a well-defined written strategy about
retirement income needs, costs and expenses, and risk factors. The majority of workers across all
generations has a retirement strategy including 66 percent of Baby Boomers, 62 percent of Generation X
and 63 percent of Millennials. However, across generations, workers’ retirement strategies are seldom
written.
• Confidence that Financial Strategy Will Enable Travel Goals. Among workers who dream of traveling in
retirement, most are confident their current financial strategy will allow them to meet their travel goals,
including 60 percent of Millennials, 54 percent of Generation X, and 62 percent of Baby Boomer workers.
However, relatively few across generations are “very” confident (24 percent Millennials, 16 percent
Generation X, 20 percent Baby Boomers). Interestingly, some workers say that they haven’t given it much
thought: 17 percent Millennials, 9 percent Generation X, 12 percent Baby Boomers.
Influences of Generation on Retirement Readiness
143
• Professional Financial Advisor Usage. Millennials (42 percent), and Baby Boomers (40 percent) are
somewhat more likely than Generation X (37 percent) workers to use a financial advisor to help manage
retirement savings and investments. Since last year, more Millennial workers use financial advisors.
• Awareness of Saver’s Credit. The IRS Saver’s Credit is a tax credit available to eligible taxpayers who are
saving for retirement in a qualified retirement plan or IRA. Level of awareness about the credit is highest
among Millennials (42 percent), followed by Generation X (33 percent) and Baby Boomers (28 percent).
• Awareness of the IRS’ Free File Program. Fewer than half of workers across generations are aware of the
IRS’ Free File program, which offers federal income tax preparation software for free for eligible tax filers.
Awareness of the program decreases slightly by generation, with 46 percent of Millennials, 45 percent of
Generation X and 43 percent of Baby Boomers being aware of this IRS program.
Influences of Generation on Retirement Readiness
144

4550 46 49 49
41 44 44 4741
46 47 46 49 45
2218
1719
11
14 12 1114
9
16 15 15 13
8
67 6863
68
5955 56 54
61
50
62 62 61 62
53
2017 2016 2015 2014 2013 2017 2016 2015 2014 2013 2017 2016 2015 2014 2013
Very confident Somewhat confident
N=2,593 N=1,353 N=1,135 N=1,021 N=523 N=1,586 N=1,232 N=1,224 N=1,120 N=801 N=2,076 N=1,462 N=2,026 N=1,805 N=1,929
Millennial Generation X Baby Boomer
More than half of workers are “somewhat” or “very” confident that they will be able to retire comfortably;
confidence is highest among Millennials (67 percent) and Baby Boomers (62 percent) and notably lower among
Generation X (55 percent). Relatively few workers of all three generations are “very” confident, including 22
percent of Millennials, 14 percent of Generation X, and 16 percent of Baby Boomers.
Confidence in Retiring Comfortably
145
Data prior to 2017 shows results among workers in companies with 10+ workers. Data for 2017 shows results among workers in companies with 5+ workers.BASE: ALL QUALIFIED RESPONDENTS
Q880. How confident are you that you will be able to fully retire with a lifestyle you consider comfortable?
Confidence in Retiring Comfortably
Very/Somewhat Confident (%) (NET)

Many workers across generations have not yet fully recovered from the Great Recession. Financial recovery
varies across generations. Millennial workers (27 percent) are most likely to say they were “not impacted,”
followed by Generation X (16 percent) and Baby Boomers (14 percent). Generation X (23 percent) are more
likely than Baby Boomers (18 percent) and Millennials (17 percent) to say they have “not yet begun to recover”
or “may never recover.”
Recovery From the Great Recession
146
Data prior to 2017 shows results among workers in companies with 10+ workers. Data for 2017 shows results among workers in companies with 5+ workers.BASE: ALL QUALIFIED RESPONDENTS Q2655. How would you describe your financial recovery from the deep recession in recent years, which is commonly referred to as the “Great Recession”?
I was not impacted I have fully recovered I have somewhat recovered I have not yet begun to recover I may never recover
How would you describe your financial recovery from the Great Recession? (%)
27
17
12
19
20
18
38
41
45
13
14
13
3
8
12
Millennials
GenerationX
BabyBoomers
NET - Not Impacted or Fully Recovered= 46%
NET - Not Yet Begun or Never Recover = 16%
N=1,353
N=1,462
N=1,232
NET - Not Impacted or Fully Recovered= 37%
NET - Not Yet Begun or Never Recover = 22%
NET - Not Impacted or Fully Recovered= 30%
NET - Not Yet Begun or Never Recover = 25%
2017 2016
27
16
14
22
23
26
34
38
42
13
14
9
4
9
9
Millennials
GenerationX
BabyBoomers
NET - Not Impacted or Fully Recovered= 49%
NET - Not Yet Begun or Never Recover = 17%
N=2,593
N=2,076
N=1,586
NET - Not Impacted or Fully Recovered= 39%
NET - Not Yet Begun or Never Recover = 23%
NET - Not Impacted or Fully Recovered= 40%
NET - Not Yet Begun or Never Recover = 18%

3237 34
4031 34 35 34 36 32 36 35 33
3831
2419
1816
1316 12 12
15
9
17 1615
13
9
56 5651
56
4450
47 4750
41
53 5148
51
40
2017 2016 2015 2014 2013 2017 2016 2015 2014 2013 2017 2016 2015 2014 2013
Strongly agree Somewhat agree
At least half of Generation X (50 percent) and Baby Boomers (53 percent) either “somewhat” or “strongly”
agree that they are building a large enough retirement nest egg, and slightly more Millennials (56 percent)
agree. Among all three generations, fewer than one in four “strongly” agree.
Building a Large Enough Nest Egg?
147
Building a Large Enough Nest Egg
Strongly/Somewhat Agree (%) (NET)
N=2,593 N=1,353 N=1,135 N=1,021 N=523 N=1,586 N=1,232 N=1,224 N=1,120 N=801 N=2,076 N=1,462 N=2,026 N=1,805 N=1,929
Millennial Generation X Baby Boomer
Data prior to 2017 shows results among workers in companies with 10+ workers. Data for 2017 shows results among workers in companies with 5+ workers.BASE: ALL QUALIFIED RESPONDENTSQ800. How much do you agree or disagree that you are currently building a large enough retirement nest egg?

Workers across generations share the same top three retirement dreams: traveling, spending more time with family and friends,
and pursuing hobbies. Workers of all generations most frequently cite traveling as a retirement dream, including Millennials (73
percent), Generation X (69 percent), and Baby Boomers (65 percent). The second most frequently cited retirement dream is
spending more time with family and friends (59 percent Millennials, 55 percent Generation X, 55 percent Baby Boomers).
Interestingly, 36 percent of Millennials, 27 percent of Generation X, and 25 percent of Baby Boomer workers dream of doing
some sort of work in retirement.
Retirement Dreams Include Leisure and Work
148
Data prior to 2017 shows results among workers in companies with 10+ workers. Data for 2017 shows results among workers in companies with 5+ workers.BASE: ALL QUALIFIED RESPONDENTS Q1418. How do you dream of spending your retirement? Select all.
How do you dream of spending your retirement? Please select all that apply. (%)
Millennial Generation X Baby Boomer
■ 2017 (N=2,593) ■ 2017 (N=1,586) ■ 2017 (N=2,076)
■ 2016 (N=1,353) ■ 2016 (N=1,232) ■ 2016 (N=1,462)
Traveling
Spending more time with family and friends
Pursuing hobbies
Doing volunteer work
Pursuing an encore career (pursuing a new role, work, activity, or career)
Starting a business
Continue working in the same field
Other
None of the above
73
59
54
24
15
21
12
3
2
70
63
55
24
16
19
12
5
4
69
55
48
25
13
10
10
4
2
64
54
46
24
10
8
10
5
4
65
55
47
30
11
5
12
8
3
59
51
46
33
11
6
12
9
4
NET: Working2017: 36%2016: 34%
NET: Working2017: 27%2016: 23%
NET: Working2017: 25%2016: 25%

How Much Do You Agree or Disagree?
Strongly/Somewhat Agree (%) (NET)
Millennial Generation X Baby Boomer
■ 2017 (N=2,593) ■ 2016 (N=1,353) ■ 2015 (N=1,135)■ 2014(N=1,021)■ 2013 (N=523)
■ 2017(N=1,586)■ 2016 (N=1,232) ■ 2015 (N=1,224)■ 2014 (N=1,120)■ 2013 (N=801)
■ 2017 (N=2,076) ■ 2016 (N=1,462)■ 2015 (N=2,026)■ 2014 (N=1,805)■ 2013 (N=1,929)
**Compared to my parent's generation, people in my generation will have a much harder time in achieving financial security
**I am concerned that when I am ready to retire, Social Security will not be there for me
*My current employer is supportive of its employees working past 65
I do not know as much as I should about retirement investing
I would like to receive more information and advice from my company on how to reach my retirement goals
I could work until age 65 and still not have enough money saved to meet my retirement needs
I am currently very involved in monitoring and managing my retirement savings
I would prefer to rely on outside experts to monitor and manage my retirement savings plan
I prefer not to think about or concern myself with retirement investing until I get closer to my retirement date
Across generations, at least three out of four workers agree that their generation will have a much harder time
achieving financial security compared to their parent’s generation. Generation X (83 percent) and Millennials
(80 percent) are more likely than Baby Boomers (65 percent) to be concerned that Social Security will not be
there for them when they are ready to retire.
Retirement Beliefs, Preparations, and Involvement
149
83
80
69
73
76
68
61
63
54
82
81
71
72
75
67
59
61
52
81
83
73
71
69
59
57
51
82
81
72
73
67
66
62
52
77
72
72
55
56
46
80
83
71
65
66
69
64
59
34
83
86
69
69
68
70
63
61
40
83
85
66
64
69
63
54
45
85
83
65
65
69
69
56
39
70
61
73
59
50
37
75
65
75
63
52
59
71
47
25
80
67
73
63
55
60
67
52
28
79
65
63
51
61
66
50
24
80
67
65
57
65
72
51
26
67
56
66
66
50
25Data prior to 2017 shows results among workers in companies with 10+ workers. Data for 2017 shows results among workers in companies with 5+ workers.*added in 2016 **added in 2014BASE: ALL QUALIFIED RESPONDENTSQ930. How much do you agree or disagree with each of the following statements regarding retirement investing?
N/A N/A N/A
N/A N/A N/A
N/A N/A N/A
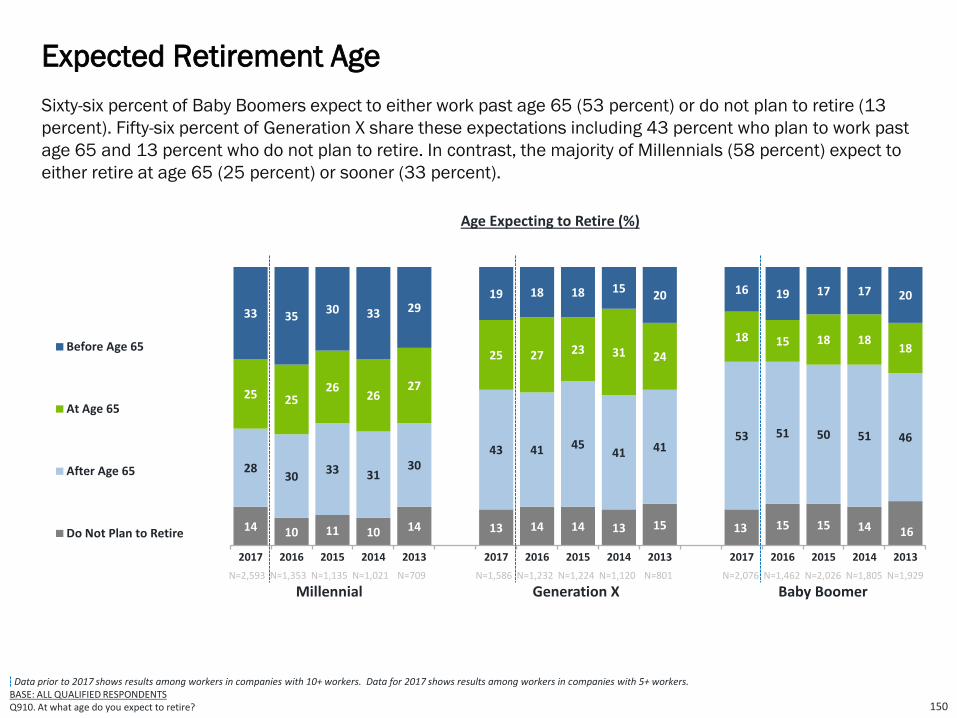
Data prior to 2017 shows results among workers in companies with 10+ workers. Data for 2017 shows results among workers in companies with 5+ workers.BASE: ALL QUALIFIED RESPONDENTSQ910. At what age do you expect to retire?
Sixty-six percent of Baby Boomers expect to either work past age 65 (53 percent) or do not plan to retire (13
percent). Fifty-six percent of Generation X share these expectations including 43 percent who plan to work past
age 65 and 13 percent who do not plan to retire. In contrast, the majority of Millennials (58 percent) expect to
either retire at age 65 (25 percent) or sooner (33 percent).
Expected Retirement Age
150
14 10 11 10 14 13 14 14 13 15 13 15 15 14 16
2830
33 3130
43 41 4541 41
53 51 50 51 46
25 2526
2627
25 27 23 31 24
18 15 18 1818
33 3530 33 29
19 18 18 1520 16 19 17 17 20
2017 2016 2015 2014 2013 2017 2016 2015 2014 2013 2017 2016 2015 2014 2013
Before Age 65
At Age 65
After Age 65
Do Not Plan to Retire
N=2,593 N=1,353 N=1,135 N=1,021 N=709 N=1,586 N=1,232 N=1,224 N=1,120 N=801 N=2,076 N=1,462 N=2,026 N=1,805 N=1,929
Millennial Generation X Baby Boomer
Age Expecting to Retire (%)

Net Yes:
39 35 35 36 40 43 37 37 38 40 46 40 44 4250
1917 13 14 10 11
14 14 13 108
10 9 109
23 25 25 2920 24 28 23 26 21 27 29 28 27
17
1923 27 21
30 22 21 26 23 29 19 21 19 2124
More than half of workers across generations plan to continue working after they retire, including 54 percent of
Baby Boomers, 54 percent of Generation X, and 58 percent of Millennials. Among those planning to work, most
plan to do so on a part-time basis.
Planning to Work in Retirement
151
Data prior to 2017 shows results among workers in companies with 10+ workers. Data for 2017 shows results among workers in companies with 5+ workers.BASE: ALL QUALIFIED RESPONDENTSQ1525. Do you plan to work after you retire?
Planning to Work in Retirement (%)
58
Yes, I plan to work full-timeYes, I plan to work part-timeNo, I do not plan to workNot sure
2017 2016 2015 2014 2013 2017 2016 2015 2014 2013 2017 2016 2015 2014 2013
N=2,593 N=1,353 N=1,135 N=1,021 N=709 N=1,586 N=1,232 N=1,224 N=1,120 N=801 N=2,076 N=1,462 N=2,026 N=1,805 N=1,929
Millennial Generation X Baby Boomer
5248 50 50
54 51 51 51 5054 50 53 52
59

Many workers across the generations who expect to retire after age 65 or to work after retirement cite financial
reasons (Millennial, 81 percent; Generation X, 85 percent; Baby Boomer, 84 percent) and a smaller majority
cite healthy-aging reasons (Millennial, 78 percent; Generation X, 69 percent; Baby Boomer, 74 percent).
Reasons for Working in Retirement
152
NET
Financial Reasons
NET
Healthy-aging
Reasons
Want the income
Be activeKeep my
brain alert
Concerned that Social
Security will be less than
expected
Can’t afford to retire because I haven’t
saved enough
Have a sense of purpose
Enjoy what I do
Need health benefits
Maintain social
connections
Concernedemployer
retirement benefits will be less than
expected
Anxious re: volatility in
financial markets and investment
performance
81 7853 54
41 36 33 40 39 30 27 20 17Mill
en
nia
l N
=1,8
13
85 69 58 49 41 44 44 34 30 33 22 17 13
84 7460 57 48 48 40 35 39 31 25
11 13
New question added in 2017BASE: PLAN ON RETIRING AFTER 65 AND/OR WORKING AFTER RETIREMENTQ1530x1. What are your reason(s) for working in retirement or past age 65? Select all.
Ge
ne
rati
on
X
N=1
,19
2
Bab
y B
oo
me
rN
=1,6
96

Many workers across the three generations plan to either transition into retirement by changing work patterns (e.g.,
shifting from full-time to part-time or working in a different capacity) or plan to continue working until they cannot work
any longer. Baby Boomers (26 percent) are more likely to be planning to immediately stop working when they reach a
certain age or savings goal compared to Generation X and Millennials (both 22 percent).
Retirement Transitions: Phased Versus Immediate
153
Millennial Generation X Baby Boomer■ 2017 (N=2,593)
■ 2016 (N=1,353)
■ 2015 (N=1,135)
■ 2014 (N=1,021)
■ 2017 (N=1,586)
■ 2016 (N=1,232)
■ 2015 (N=1,224)
■ 2014 (N=1,120)
■ 2017 (N=2,076)
■ 2016 (N=1,462)
■ 2015 (N=2,026)
■ 2014 (N=1,805)
CONTINUE WORKING (NET)
Transition into retirement by reducing work hours
Continue working as long as possible in current or similar position until I cannot work anymore
Transition into retirement by working in a different capacity
PLAN TO STOP (NET)
Immediately stop working once I reach a specific age
Immediately stop working once I save a specific amount of money
Not sure
Data prior to 2017 shows results among workers in companies with 10+ workers. Data for 2017 shows results among workers in companies with 5+ workers.BASE: ALL QUALIFIED RESPONDENTSQ1545. How do you envision transitioning into retirement?
68
31
19
18
22
12
10
10
63
29
19
15
22
11
11
15
64
28
18
18
18
10
8
18
61
28
13
20
23
11
12
15
66
28
22
16
22
14
8
12
65
29
21
15
22
13
9
13
59
24
21
14
21
13
8
20
62
30
16
16
22
13
10
16
65
29
20
16
26
20
6
9
64
26
25
13
26
20
6
10
61
26
20
15
25
20
5
14
68
28
24
16
21
17
5
12
How do you envision transitioning into retirement? (%)

Phased Retirement and Compensation-Related Expectations
New question added in 2017BASE: RESPONDENTS WHO ENVISION A PHASED TRANSITION INTO RETIREMENTQ1546. In thinking about your vision of transitioning into retirement, to what extent do you agree or disagree with the following statements? 154
Among workers who envision a phased transition into retirement, most have realistic expectations regarding how changes in their
work arrangements may affect their job title, compensation, and benefits. The majority of workers across generations who
envision a phased transition into retirement expect to receive the same benefits they have now if they were to shift from full-time
to part-time work at their current employer. Baby Boomer workers (83 percent) are more likely to believe that if they reduce their
work hours at their current employer, they would expect to be paid the same hourly rate that they earn now, followed by slightly
less Millennial (78 percent) and Generation X workers (76 percent).
In thinking about your vision of transitioning into retirement, to what extent do you agree or disagree with the following statements? (NET - Agree %)
MillennialN=1,292
Generation XN=715
Baby BoomerN=944
If I reduce my work hours at my current employer, I would expect to be paid the same hourly rate for hours worked that I am earning now.
If I were to take on a new role with fewer responsibilities at my current employer, I would expect my job title to change.
If I were to take on a new role with fewer responsibilities at my current employer, I would expect to be paid the market rate for the duties involved, even if it means a reduction in my current level of pay.
If I were to shift from full-time to part-time at my current employer, I would expect to receive the same employee benefits that I have now.
78
78
67
65
76
80
75
57
83
77
72
57

MillennialN=2,593
Generation XN=1,586
Baby BoomerN=2,076
NET – Positive perceptions
Bring more knowledge, wisdom, and life experience
Are more responsible, reliable, and dependable
Are a valuable resource for training and mentoring
Are an important source of institutional knowledge
Are more adept at problem-solving
Are better at getting along with others in a team environment
NET – Negative perceptions
Have higher healthcare costs
Command higher wages and salaries
Are less open to learning and new ideas
Have higher disability costs
Have outdated skill sets
Are less productive
Other
None
Perceptions of Older Workers
155
New question added in 2017BASE: ALL QUALIFIED RESPONDENTS Q1528. What are your perceptions of workers age 50 and older compared to younger workers in today’s workforce? Select all.
Ageism is a common concern in today’s society, especially with so many workers planning to extend their working lives
beyond age 65. More Baby Boomer and Generation X workers than Millennial workers have positive perceptions of
workers age 50 and older compared to younger workers in today’s workforce. Baby Boomers (80 percent) and
Generation X (65 percent) believe workers age 50 and older bring more knowledge, wisdom, and life experience,
compared to 47 percent of Millennial workers who think this.
83
65
60
48
41
33
31
52
30
20
16
15
13
9
1
9
77
47
40
38
33
23
22
61
25
20
27
17
18
14
1
10
94
80
80
69
58
51
44
47
30
22
12
9
6
3
1
3
Perceptions of workers age 50+ compared to younger workers in today’s workforce? (%)

Age That Workers Consider a Person to Be “Old”
156
19 19 17
72 1
33
27
1720
11
3 1
37
426
17 15
51
52
2
<60 60-69 70-79 80-89 90-99 100+ It depends on theperson
Not Sure
Age When Person is Considered “Old” (%)
The median age a worker considers a person to be “old” rises with each generation from younger to older
(Millennials, median 65 years old; Generation X, median 70 years old; Baby Boomer, median 75 years old).
Slightly more than half of Baby Boomers (52 percent) think “it depends on the person,” significantly more than
Millennial (33 percent) or Baby Boomer (37 percent) workers.
Median Age
Millennial (N=2,593) Age 65Generation X (N=1,586) Age 70Baby Boomer (N=2,076) Age 75
New question added in 2017BASE: ALL QUALIFIED RESPONDENTS Q1526. At what age do you consider a person to be “old”?

4
11
20
12
41
44
41
5
21
12
3 1
54
3<1 2
129
3 2
69
3
<60 60-69 70-79 80-89 90-99 100+ It depends on theperson
Not Sure
Median Age
Millennial (N=2,593) Age 70Generation X (N=1,586) Age 75Baby Boomer (N=2,076) Age 75
Age That Workers Consider a Person to Be “Too Old” to Work
157
Age When Person is Considered “Too Old” to Work (%)
New question added in 2017BASE: ALL QUALIFIED RESPONDENTS Q1527. At what age do you consider a person to be “too old” to work?
Workers across generations have a smaller range of the age they consider to be “too old” to work. Millennial
workers believe that the age of 70 (median) is “too old” for a person to work, while Generation X and Baby
Boomer workers believe that 75 (median) is “too old” to work. More than half of Baby Boomers (69 percent)
and Generation X (54 percent) think “it depends on the person” compared to Millennials (44 percent).
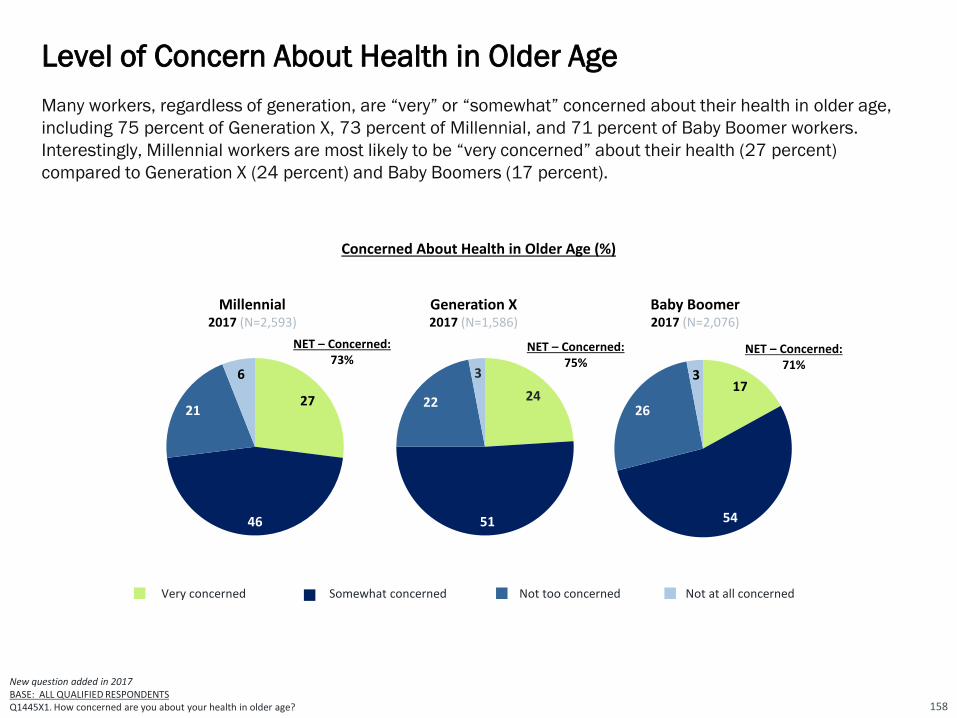
Level of Concern About Health in Older Age
Many workers, regardless of generation, are “very” or “somewhat” concerned about their health in older age,
including 75 percent of Generation X, 73 percent of Millennial, and 71 percent of Baby Boomer workers.
Interestingly, Millennial workers are most likely to be “very concerned” about their health (27 percent)
compared to Generation X (24 percent) and Baby Boomers (17 percent).
New question added in 2017BASE: ALL QUALIFIED RESPONDENTSQ1445X1. How concerned are you about your health in older age?
Millennial2017 (N=2,593)
Generation X2017 (N=1,586)
Baby Boomer2017 (N=2,076)
27
46
21
6
24
51
22
317
54
26
3
NET – Concerned:73%
Very concerned Somewhat concerned Not too concerned Not at all concerned
Concerned About Health in Older Age (%)
NET – Concerned:75%
NET – Concerned:71%
158

Engagement in Health-Related Activities on a Consistent Basis
Workers across generations are engaging in health-related activities on a consistent basis. In general, higher
proportions of Baby Boomers are doing these activities compared to both Generation X and Millennial workers.
New question added in 2017
BASE: ALL QUALIFIED RESPONDENTS
Q1446. Which of the following health-related activities are you doing on a consistent basis? Select all. 159
Engaging in Health-Related Activities on a Consistent Basis (%)
MillennialN=2,593
Generation XN=1,586
Baby BoomerN=2,076
Eating healthfully
Exercising regularly
Maintaining a positive outlook
Seeking medical attention when needed
Avoiding harmful substances (e.g., cigarettes, alcohol, illicit drugs, etc.)
Getting plenty of rest
Getting routine physicals and recommended health screenings
Managing stress
Considering long-term health when making lifestyle decisions
Practicing mindfulness and meditation
Other
Nothing
52
53
48
42
45
46
36
43
25
24
<1
4
55
52
49
54
46
48
51
43
24
17
1
6
63
57
63
67
61
54
64
49
27
17
1
3

3 7237
9
17
24
16
2018
21
2017 2016
Workers across generations share similar expectations regarding the age they are planning to live to with each
generation planning to live to the age of 90 (median among those who gave an estimate). Nearly one in five
Millennials (18 percent) expect to live to 100+ compared to 13 percent in Generation X and 10 percent in Baby
Boomers.
Planning to Live to Age ...
160
Data prior to 2017 shows results among workers in companies with 10+ workers. Data for 2017 shows results among workers in companies with 5+ workers.BASE: ALL QUALIFIED RESPONDENTS Q2850. What age are you planning to live to?
N=2,593 N=1,586 N=2,076
What age are you planning to live to? (%)
Baby BoomerMillennial Generation X
Not sure 37 16 42 14 45 15Median Age 90 Age 89 Age 90 Age 85 Age 90 Age 85
N=1,353 N=1,232 N=1,462
Age 100+
Age 90-99
Age 80-89
Age 70-79
Age 60-69
Age <60
1 5235
1119
3018
24
13
13
2017 2016
<1 2135
1018
3321
24
10
13
2017 2016

161BASE: ALL QUALIFIED RESPONDENTSQ2639. Which of the following are your financial priorities right now? Select all.
Financial priorities change by life stage although “paying off debt” (NET) is the most frequently cited current
financial priority across generations, including Baby Boomers workers (59 percent), Generation X (72 percent),
and Millennials (67 percent). Baby Boomer workers (72 percent) are more likely to cite saving for retirement as
a financial priority compared to Generation X (61 percent) and Millennials (45 percent).
Current Financial Priorities
Current Financial Priorities (%)
Millennial Generation X Baby Boomer
■ 2017 (N=2,593) ■ 2017 (N=1,586) ■ 2017 (N=2,076)
NET – Paying off debt
Paying off credit card debt
Paying off mortgage
Paying off other consumer debt
Paying off student loans
Building savings
Saving for retirement
Just getting by to cover basic living expenses
Supporting children
Paying healthcare expenses
Creating an inheritance or financial legacy
Supporting parents
Other
67
44
26
18
26
62
45
34
38
24
14
17
5
59
36
36
12
5
53
72
23
11
25
8
4
3
72
50
38
20
12
61
61
33
39
24
10
7
3
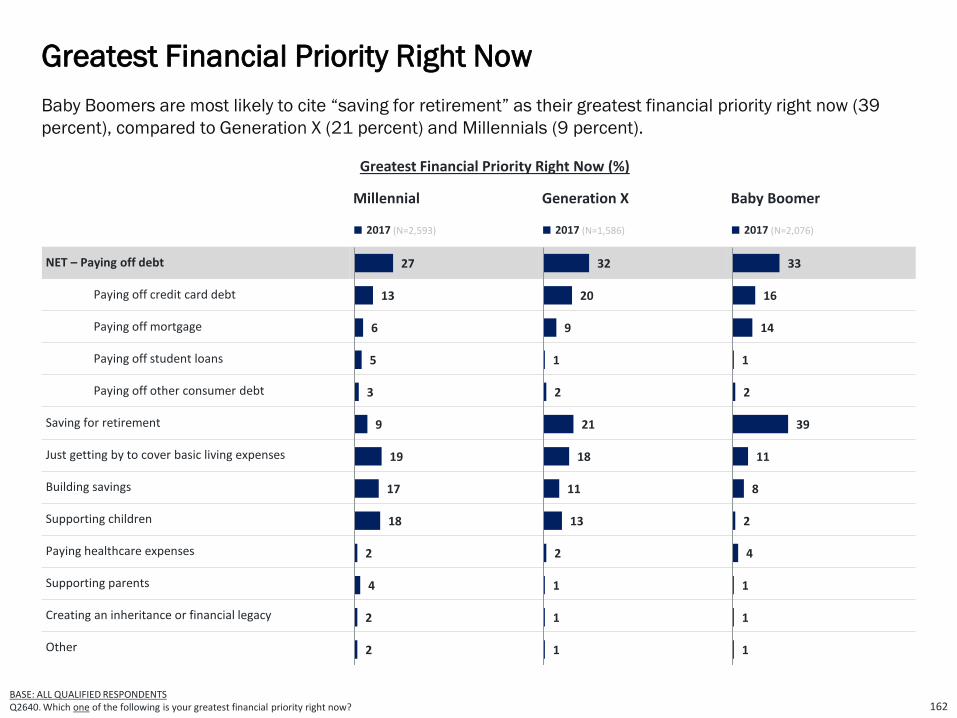
BASE: ALL QUALIFIED RESPONDENTS Q2640. Which one of the following is your greatest financial priority right now?
Baby Boomers are most likely to cite “saving for retirement” as their greatest financial priority right now (39
percent), compared to Generation X (21 percent) and Millennials (9 percent).
Greatest Financial Priority Right Now
162
Millennial Generation X Baby Boomer
■ 2017 (N=2,593) ■ 2017 (N=1,586) ■ 2017 (N=2,076)
NET – Paying off debt
Paying off credit card debt
Paying off mortgage
Paying off student loans
Paying off other consumer debt
Saving for retirement
Just getting by to cover basic living expenses
Building savings
Supporting children
Paying healthcare expenses
Supporting parents
Creating an inheritance or financial legacy
Other
27
13
6
5
3
9
19
17
18
2
4
2
2
Greatest Financial Priority Right Now (%)
33
16
14
1
2
39
11
8
2
4
1
1
1
32
20
9
1
2
21
18
11
13
2
1
1
1

Debt poses a significant financial risk to workers across generations. Credit card debt is the most common
household debt among Millennial (59 percent), Generation X (66 percent), and Baby Boomer (55 percent)
workers. Millennial workers are more likely to have student loans, personal loans, or payday loans compared to
older workers.
Types of Household Debt
163
Which of the following types of debtdoes your household currently have? Select all (%)
MillennialN=2,593
Generation X N=1,586
Baby BoomerN=2,076
Credit card
Mortgage
Car loan
Student loan
Medical debt
Personal loan
Home equity loan
Loan from family or friends
Tax debt
Payday loan
Business loan
Investment debt
Other debt
My household currently does not have any debts
59
31
38
28
17
18
7
9
7
8
6
6
4
13
66
55
48
20
16
14
9
6
8
4
2
2
4
8
55
49
38
8
10
9
12
3
3
1
<1
<1
2
19
New question added in 2017BASE: ALL QUALIFIED RESPONDENTS Q1286. Which of the following types of debt does your household currently have? Select all.
NET – Has DebtMillennial = 87%
NET – Has DebtGeneration X = 92%
NET – Has DebtBaby Boomer = 81%

21 24
17 13
9 9
6 63 22 2
14 16
4 4
2017 2016
13 14
11 12
9 8
9 7
5 3
43
2123
6 7
2017 2016
27 25
1716
6 9
7 62 33 49 103 3
2017 2016
$100k or more
$25k to less than $100k
$20k to less than $25k
$15k to less than $20k
$10k to less than $15k
$5k to less than $10k
$1k to less than $5k
Less than $1k
Many workers lack emergency savings that could help cover the cost of a major financial setback (e.g.,
unemployment, medical bills, home repairs, auto repairs, other). Emergency savings are low across the three
generations, including Millennials at $2,000 (median), Generation X at $4,000 (median), and Baby Boomers at
$10,000 (median). Moreover, one in four Millennials (27 percent) have saved less than $1,000. Baby Boomers
(27 percent) are more likely to have saved more than $25,000.
Estimated Emergency Savings
164
Data prior to 2017 shows results among workers in companies with 10+ workers. Data for 2017 shows results among workers in companies with 5+ workers.BASE: ALL QUALIFIED RESPONDENTS Q2825. How much do you have in emergency savings specifically to cover the cost of unexpected major financial setbacks (e.g., unemployment, medical bills, home repairs, auto repairs, other)?
Not sure 26 24 24 24 22 23Median $2,000 $2,000 $4,000 $5,000 $10,000 $10,000
Millennial Generation X Baby Boomer
N=1,586N=2,593 N=2,076
How much do you have in emergency savings to cover the cost of unexpected major financial setbacks? (%)
N=1,232N=1,353 N=1,462

Data prior to 2017 shows results among workers in companies with 10+ workers. Data for 2017 shows results among workers in companies with 5+ workers.BASE: THOSE CURRENTLY OFFERED QUALIFIED PLANQ1190. Do you currently participate in, or have money invested in your company’s employee-funded retirement savings plan?BASE: ALL QUALIFIED RESPONDENTSQ740. Are you currently saving for retirement outside of work, such as in an IRA, mutual funds, bank account, etc.?BASE: INVESTING FOR RETIREMENTQ790. At what age did you first start saving for retirement?
The majority of workers across all three generations are saving for retirement through an employer-sponsored
plan and/or outside of work. Baby Boomers (85 percent) are most likely to be saving, followed by Generation X
(80 percent) and Millennials (71 percent). In terms of the median age that they started saving, Millennials
started at a younger age (age 24) compared to Generation X (age 30) and Baby Boomers (age 35).
Saving for Retirement / Age Started Saving
165
Age Started Saving
(Median)24 22 23 22 22 30 28 28 27 25 35 35 34 35 35
Millennial Generation X Baby Boomer
Workers Who Are Saving For Retirement Through an Employer-Sponsored Retirement Plan And/Or Outside of Work (%)
71 7268 70 68
80 77 7783 82 85 83 81 81 81
2017 2016 2015 2014 2013 2017 2016 2015 2014 2013 2017 2016 2015 2014 2013

Millennials Generation X Baby Boomer
■ 2017 (N=2,593) ■ 2017 (N=1,586) ■ 2017 (N=2,079)
■ 2016 (N=1,353) ■ 2016 (N=1,232) ■ 2016 (N=1,462)
NET – Self-Funded Savings
401(k) / 403(b) Accounts / IRAs
Other savings and investments
Social Security
Working
Company-funded pension plan
Home equity
Inheritance
Other
82
72
54
91
35
33
15
9
3
78
71
49
87
38
33
16
10
3
81
72
46
76
39
20
13
11
2
76
68
43
67
36
21
12
12
4
84
70
52
61
40
19
14
12
2
79
67
49
58
40
21
12
12
4
Data prior to 2017 shows results among workers in companies with 10+ workers. Data for 2017 shows results among workers in companies with 5+ workers.BASE: ALL QUALIFIED RESPONDENTS Q1145. Which one of the following do you expect to be sources of income to cover your living expenses after you retire? Select all.
Self-funded savings including retirement accounts (e.g., 401(k)s, 403(b)s, IRAs) and other savings and
investments are the most frequently cited source of retirement income expected by Millennials (84 percent)
and Generation X (81 percent), while Baby Boomers are most likely to expect income from Social Security (91
percent).
Expected Sources of Retirement Income
166
Expected Sources of Income During Retirement (%)

Millennial Generation X Baby Boomer
■ 2017 (N=2,593)■ 2016 (N=1,353) ■ 2015 (N=1,134)■ 2014 (N=1,021)
■ 2013 (N=523)
■ 2017 (N=1,586)■ 2016 (N=1,232) ■ 2015 (N=1,224)■ 2014 (N=1,120)
■ 2013 (N=801)
■ 2017 (N=2,076) ■ 2016 (N=1,462)■ 2015 (N=2,026)
■ 2014 (N=1,805)
■ 2013 (N=1,929)
401(k) / 403(b) accounts / IRAs
Social Security
*Working
Other savings and investments
Company-funded pension plan
Home equity
Inheritance
Other
Data prior to 2017 shows results among workers in companies with 10+ workers. Data for 2017 shows results among workers in companies with 5+ workers.*added in 2015BASE: ALL QUALIFIED RESPONDENTS Q1150. Which one of the following do you expect to be your primary source of income to cover your living expenses after you retire?
41
17
17
15
4
2
2
2
43
17
16
12
5
2
2
3
48
14
14
15
2
1
2
4
48
18
18
4
2
3
7
51
17
19
4
2
3
5
41
26
15
9
5
1
2
1
38
24
17
10
5
1
2
3
40
24
14
11
4
1
3
3
52
20
14
5
3
2
5
50
22
16
4
1
2
5
29
37
9
10
11
1
1
2
28
34
11
11
11
1
2
2
26
35
12
10
12
1
2
2
34
36
12
13
0
2
4
30
37
11
14
1
2
4
Millennial (41 percent) and Generation X (41 percent) workers most frequently cite 401(k)s, 403(b)s, or IRAs to
be their expected primary source of retirement income, while Baby Boomers (37 percent) are more likely to
expect to rely on Social Security during retirement. Approximately one in seven Millennials (17 percent) and
Generation X (15 percent) expect “working” to be their primary source of retirement income.
Expected Primary Source of Income in Retirement
167
N/AN/A N/A
Expected Primary Source of Income in Retirement (%)

Data prior to 2017 shows results among workers in companies with 10+ workers. Data for 2017 shows results among workers in companies with 5+ workers.*added in 2014; **added in 2017 BASE: ALL QUALIFIED RESPONDENTS
Q1171. Businesses typically offer a number of different benefits for their workers. For each of the following, please tell us how important that benefit is to you, personally.
Millennial Generation X Baby Boomer■ 2017 (N=2,593) ■ 2016 (N=1,353) ■ 2015 (N=1,135)■ 2014 (N=1,021)
■ 2013 (N=523)
■ 2017 (N=1,586)■ 2016 (N=1,232)■ 2014 (N=1,120)■ 2014 (N=1,120)
■ 2013 (N=801)
■ 2017 (N=2,076) ■ 2016 (N=1,462)■ 2015 (N=2,026)
■ 2014 (N=1,805)
■ 2013 (N=1,929)
Health insurance
401(k) / 403(b) / 457(b) or other employee self-funded plan
Life insurance
Disability insurance
Long-Term Care insurance
Company-funded defined-benefit pension plan
*A company-funded cash balance plan
Critical Illness Insurance
**Financial Wellness Program
**Employee Assistance Program
**Workplace Wellness Program
Cancer Insurance
95
89
85
77
77
75
73
72
72
74
69
66
96
91
84
77
73
75
64
69
61
94
90
79
76
72
76
64
65
58
94
90
75
72
70
77
65
67
63
96
91
73
71
64
71
63
62
97
91
75
74
71
71
65
60
61
59
58
53
95
91
78
78
72
72
56
62
57
97
90
77
75
70
72
54
60
53
97
91
76
80
74
77
65
70
62
94
91
67
75
61
79
61
50
94
86
65
72
70
71
59
58
51
47
47
48
94
84
64
74
69
69
46
60
48
94
87
70
76
71
72
47
59
45
94
89
68
82
72
80
58
66
55
94
91
69
83
73
79
67
58
N/A N/A
The vast majority of workers — including 89 percent of Millennials, 91 percent of Generation X, and 85 percent
of Baby Boomers — believe that a 401(k) or similar plan is a “somewhat” or “very” important employee benefit.
This trend has remained consistent over time.
Importance of Retirement Benefits Compared to Other Benefits
168
N/A
Very/Somewhat Important(%) (NET)
N/A N/AN/A
N/A N/AN/A
N/A N/AN/A

Millennial Generation X Baby Boomer
■ 2017 (N=2,593) ■ 2016 (N=1,353) ■ 2015 (N=1,135)■ 2014 (N=1,021)
■ 2013 (N=523)
■ 2017 (N=1,586)■ 2016 (N=1,232) ■ 2015 (N=1,224)■ 2014 (N=1,120)
■ 2013 (N=801)
■ 2017 (N=2,076) ■ 2016 (N=1,462)■ 2015 (N=2,026)
■ 2014 (N=1,805)
■ 2013 (N=1,929)
NET – AN EMPLOYEE-FUNDED PLAN
Employee-funded 401(k) plan
Other employee self-funded plan(e.g., SEP, SIMPLE, Other)
NET – COMPANY-FUNDED PLAN
Company-funded defined benefit pension plan
*Company-funded cash balance plan
NET NONE OF THE ABOVE
Other
None
68
62
10
29
25
13
25
2
23
66
65
4
29
25
13
24
59
56
5
26
20
11
30
62
59
3
27
21
14
27
67
63
8
18
29
Most workers are offered a 401(k) or similar plan by their employers. Generation X (75 percent) are more likely
to be offered such benefits compared to Millennials (68 percent) and Baby Boomers (71 percent). Few workers
are offered a company-funded defined benefit plan.
Retirement Benefits Currently Offered
169
Data prior to 2017 shows results among workers in companies with 10+ workers. Data for 2017 shows results among workers in companies with 5+ workers.*added in 2014BASE: ALL QUALIFIED RESPONDENTSQ1180. Which of the following retirement benefits does your company currently offer to you, personally? Select all.
75
73
6
22
19
7
21
2
19
76
74
3
24
21
6
19
69
68
3
21
18
7
25
74
72
3
21
16
9
21
75
72
4
15
22
71
68
5
25
22
6
26
2
24
73
70
4
26
23
6
23
69
67
4
25
21
6
26
71
69
3
25
20
6
24
69
67
4
22
26
N/A N/AN/A
N/A N/AN/A
Employer-Sponsored Retirement Benefits Currently Offered (%)
N/A N/AN/A
N/A N/AN/A
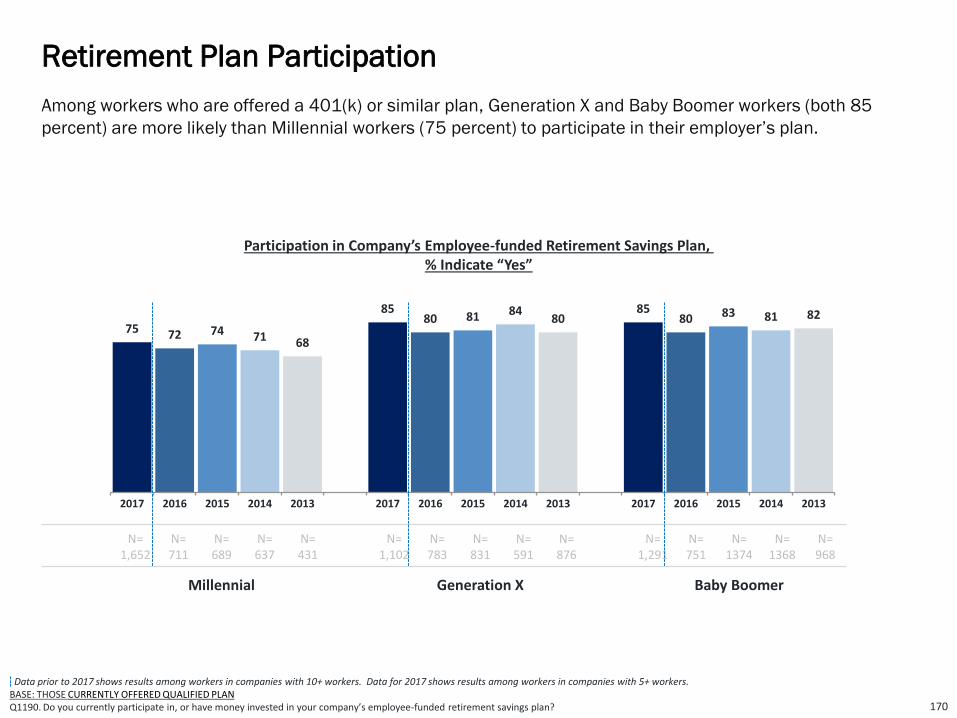
Among workers who are offered a 401(k) or similar plan, Generation X and Baby Boomer workers (both 85
percent) are more likely than Millennial workers (75 percent) to participate in their employer’s plan.
Retirement Plan Participation
170
Participation in Company’s Employee-funded Retirement Savings Plan, % Indicate “Yes”
Data prior to 2017 shows results among workers in companies with 10+ workers. Data for 2017 shows results among workers in companies with 5+ workers.BASE: THOSE CURRENTLY OFFERED QUALIFIED PLANQ1190. Do you currently participate in, or have money invested in your company’s employee-funded retirement savings plan?
75 72 74 71 68
8580 81 84
8085
80 83 81 82
2017 2016 2015 2014 2013 2017 2016 2015 2014 2013 2017 2016 2015 2014 2013
N=1,652
N=711
N=689
N=637
N=431
N=1,102
N=783
N=831
N=591
N=876
N=1,291
N=751
N=1374
N=1368
N=968
Millennial Generation X Baby Boomer

10%
7%
8% 8%
6%
8%
7% 7% 7% 7%
10% 10%
8%
10%
8%
2017 2016 2015 2014 2013 2017 2016 2015 2014 2013 2017 2016 2015 2014 2013
Data prior to 2017 shows results among workers in companies with 10+ workers. Data for 2017 shows results among workers in companies with 5+ workers.BASE: CURRENTLY PARTICIPATES IN QUALIFIED PLAN Q601. What percentage of your salary are you saving for retirement through your company-sponsored plan this year?
Among workers who participate in a 401(k) or similar plan, Millennials contribute 10 percent (median) of their
annual pay, up from 7 percent (median) last year. Baby boomer workers also contribute 10 percent (median)
while Generation X workers contribute 8 percent (median).
Retirement Plan Contribution Rate
171
Mean 16.3 12.8 11.9 12.0 9.3 10.7 9.3 9.2 11.0 8.9 11.0 10.9 10.6 10.5 9.3
N=1,197 N=655 N=499 N=446 N=260 N=895 N=699 N=657 N=662 N=479 N=1,017 N=771 N=1078 N=991 N=1,107
Millennial Generation X Baby Boomer
Contribution Rate, Median %

46 39 38
36 44 39
82 8377
Automatic enrollment is a retirement plan feature that eliminates the decision-making and action steps
normally required of employees to enroll and to start contributing to the plan. It simply automatically enrolls
employees into a plan and they only need to take action if they desire to opt out and not contribute to the plan.
The majorities of workers across generations find automatic enrollment appealing, including Millennials (82
percent) and Generation X (83 percent) and Baby Boomers (77 percent). Millennial workers suggest the
highest median appropriate default contribution rate (10 percent) compared to Generation X (6 percent) and
Baby Boomers (6 percent).
Appeal of Automatic Enrollment
172
New question added in 2017BASE: ALL QUALIFIED RESPONDENTS Q635. Imagine that your current employer automatically enrolled you into a 401(k), 403(b) or similar retirement plan, deducting a percentage of each paycheck, and investing it for your future retirement. How appealing would this seem to you?Q636. Imagine that your current employer automatically enrolled you into a 401(k), 403(b) or similar retirement plan, what would you consider to be an appropriate percentage to deduct from your paycheck to be invested for your future retirement?
Appeal of Automatic Enrollment (%)
Appropriate Default Contribution Rate
(median):10%
Very appealing
Somewhat appealing
NET - Appealing
Millennial
N=2,593
Baby Boomer
N=2,076
Appropriate Default Contribution Rate
(median):6%
Generation X
N=1,586
Appropriate Default Contribution Rate
(median):6%

Likelihood of Using Automatic Escalation
Likelihood to use a feature that automatically increases their contribution by 1% each year is high across the
generations. However, significantly more Millennial (78 percent) and Generation X (75 percent) workers than
Baby Boomers (71 percent) indicate they would be likely to use the feature.
New question added in 2017BASE: ALL QUALIFIED RESPONDENTS Q702. How likely would you be to use a feature in a 401(k) or similar plan where your employer would automatically increase your contribution rate (as a percentage of your salary) to the plan by 1% each year, until you choose to discontinue this increase?
Millennial N=2,593
30
48
14
8
31
40
17
12
NET – Likely:71%
NET – Likely:78%
Very likely Somewhat likely Not too likely Not at all likely
Likelihood of Using a Feature That Automatically Increases Contribution by 1% Each Year, Until You Choose to Discontinue (%)
Baby Boomer N=2,076
33
42
17
8
NET – Likely:75%
Generation XN=1,586
173

Millennials■ 2017 (N=1,200)■ 2016 (N=655)
■ 2015 (N=500)■ 2014 (N=448)
Generation X■ 2017 (N=896)■ 2016 (N=699)
■ 2015 (N=658)■ 2014 (N=665)
Baby Boomer■ 2017 (N=1,019)■ 2016 (N=775)
■ 2015 (N=1,081)■ 2014 (N=991)
I set my own asset allocation percentages among the available funds
NET – Professionally Managed
I invest in an account (or service) that is managed by a professional investment advisor and I do not have to make investment or allocation decisions
I invest in a strategic allocation fund that is designed to address my specific risk tolerance profile
I invest in a target date fund that is designed to change allocation percentages as I approach my target retirement year
Not sure
“Professionally managed” accounts refers to a managed account service, strategic allocation funds, and/or
target date funds. The majority of plan participants across generations use some form of professionally managed
offering in their 401(k) or similar plans: 63 percent of Millennials, 60 percent of Generation X, and 53 percent of
Baby Boomers.
Use of Professionally Managed Offerings
174
Data prior to 2017 shows results among workers in companies with 10+ workers. Data for 2017 shows results among workers in companies with 5+ workers.BASE: PARTICIPATING IN QUALIFIED PLANQ1466. What is your current approach to investing in your employer-sponsored retirement plan? Select all.
Investments in Employer-Sponsored Retirement Plan (%)
43
63
31
27
26
11
42
60
27
25
27
15
38
56
25
23
25
17
40
62
25
29
30
14
41
60
29
23
20
10
36
62
29
24
22
12
44
50
20
22
21
19
44
56
24
26
23
12
46
53
24
17
18
10
44
59
26
18
21
7
47
49
23
18
14
13
50
47
22
18
12
11
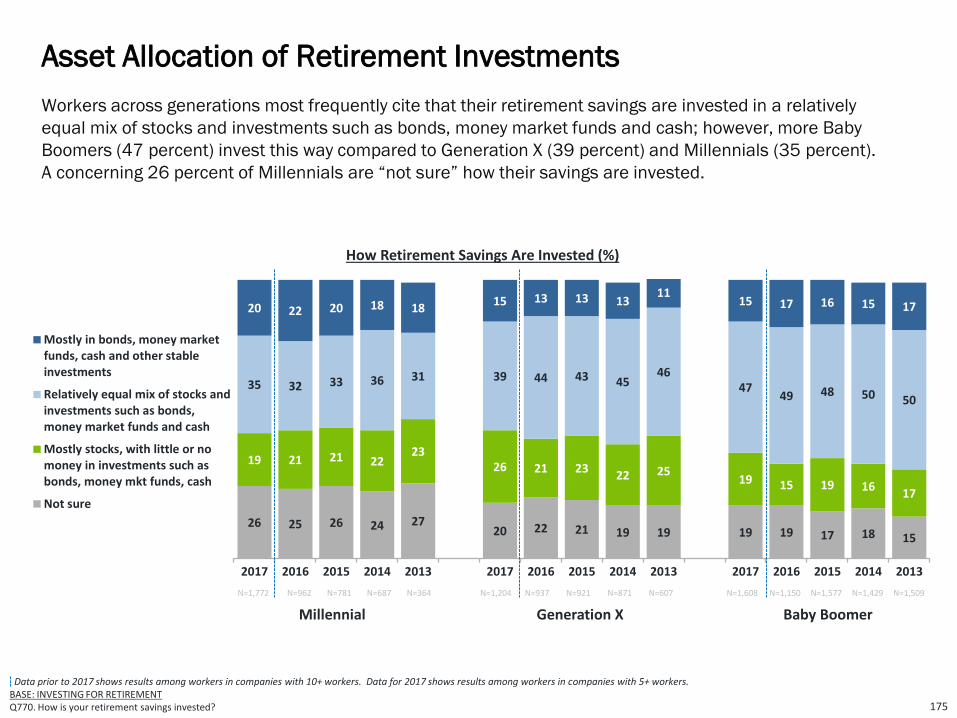
Data prior to 2017 shows results among workers in companies with 10+ workers. Data for 2017 shows results among workers in companies with 5+ workers.BASE: INVESTING FOR RETIREMENTQ770. How is your retirement savings invested?
Workers across generations most frequently cite that their retirement savings are invested in a relatively
equal mix of stocks and investments such as bonds, money market funds and cash; however, more Baby
Boomers (47 percent) invest this way compared to Generation X (39 percent) and Millennials (35 percent).
A concerning 26 percent of Millennials are “not sure” how their savings are invested.
Asset Allocation of Retirement Investments
175
26 25 26 24 2720 22 21 19 19 19 19 17 18 15
19 21 21 2223
26 21 2322 25
19 15 19 1617
35 32 33 36 31 39 44 43 4546
4749 48 50 50
20 22 20 18 1815 13 13 13
1115 17 16 15 17
2017 2016 2015 2014 2013 2017 2016 2015 2014 2013 2017 2016 2015 2014 2013
Mostly in bonds, money marketfunds, cash and other stableinvestments
Relatively equal mix of stocks andinvestments such as bonds,money market funds and cash
Mostly stocks, with little or nomoney in investments such asbonds, money mkt funds, cash
Not sure
N=1,772 N=962 N=781 N=687 N=364 N=1,204 N=937 N=921 N=871 N=607 N=1,608 N=1,150 N=1,577 N=1,429 N=1,509
Millennial Generation X Baby Boomer
How Retirement Savings Are Invested (%)

A concerning percentage of workers are dipping into their retirement savings before they retire. “Leakage” from
retirement plans in the form of loans and withdrawals can severely inhibit the growth of participants’ long-term
retirement savings. Generation X (30 percent) and Baby Boomers (28 percent) workers are more likely to have taken
some form of loan, early withdrawal, and/or hardship withdrawal from a 401(k), compared to Millennials (22 percent).
Retirement Plan Leakage: Loans and Withdrawals
176
Data prior to 2017 shows results among workers in companies with 10+ workers. Data for 2017 shows results among workers in companies with 5+ workers.BASE: All Qualified RespondentsQ754. Have you ever taken any form of loan or early withdrawal from a qualified retirement account such as a 401(k) or similar plan or IRA? Select all.
Millennial■ 2017 (N=1,652)
■ 2016 (N=900)
Generation X■ 2017 (N=1,102)
■ 2016 (N=882)
Baby Boomer■ 2017 (N=1,291)
■ 2016 (N=991)
NET - Have Taken a Loan, Early Withdrawal, and/or Hardship Withdrawal From 401(k) or Similar Plan or IRA
Yes, I have taken a loan from a 401(k) or similar plan and am paying it back
Yes, I have taken a hardship withdrawal and incurred taxes and penalties
Yes, I have taken an early withdrawal and cashed out a portion or all of a 401(k) or similar plan balance after my separation of employment from a prior employer and incurred taxes and penalties
Yes, I have taken a loan from a 401(k) or similar plan but was unable to pay it back so it became an early withdrawal and incurred taxes and penalties
Yes, I have taken an early withdrawal and cashed out a portion or all of an IRA and incurred taxes and penalties
No, I have never taken a loan or early withdrawal from a 401(k) or similar plan or IRA
Not sure
Have you ever taken any form of loan or early withdrawal from a qualified retirement account such as a 401(k) or similar plan or IRA? (%)
28
16
7
8
8
4
68
4
22
13
5
6
6
2
72
6
34
19
8
6
5
5
63
3
29
16
5
7
5
4
67
2
26
12
5
6
3
5
71
2
27
12
4
6
4
6
70
4

5 3 3
9 2015 15 17
5 14 13 916
3 11 10 10 11
8
77 6
8
85 4
5
5
32 3 3 4
97
11 910
76 6
7
7
64 5 5 5
12 9 1112
10
7 7 8 9
10
6 5 7 7 6
12 10 1019 13
15 10 13 14
14
9 910 9 10
911 11
99
1412
16 20
16
17 1314 13
17
2115 10
75
30
26 1719 13
42
3633 34
28
2017 2016 2015 2014 2013 2017 2016 2015 2014 2013 2017 2016 2015 2014 2013
$250k or more
$100k to less than $250k
$50k to less than $100k
$25k to less than $50k
$10k to less than $25k
$5k to less than $10k
Less than $5k
None *
Baby Boomer workers have the highest reported total household retirement savings at $164,000 (estimated
median) compared to Generation X ($72,000) and Millennials ($37,000). Baby Boomer workers (42 percent)
are most likely to have saved $250k or more compared to Generation X (30 percent) and Millennials (21
percent). A worrying 14 percent of Millennials have less than $5k in retirement savings.
Total Household Retirement Savings
177
Data prior to 2017 shows results among workers in companies with 10+ workers. Data for 2017 shows results among workers in companies with 5+ workers.*added in 2017
BASE: ALL QUALIFIED RESPONDENTSQ1300. Approximately how much money does your household have saved in all of your retirement accounts? Please include IRAs, 401(k)s, 403(b)s, and any other savings for retirement to which you and/or your spouse or partner have contributed funds.
Not sure 12 13 17 14 19 8 10 11 8 8 7 8 7 7 6
Decline to answer
3 8 8 9 9 3 10 12 9 11 7 12 11 12 13
Estimated Median
$37,000 $31,000 $25,000 $32,000 $19,000 $72,000 $69,000 $61,000 $70,000 $45,000 $164,000 $147,000 $132,000 $127,000 $103,000
Note: The median is estimated based on the approximate midpoint of the range of each response category. Non-responses are excluded from the estimate.
Total Household Retirement Savings (%)
N=1,918 N=1,353 N=1,135 N=1,021 N=709 N=1,222 N=1,232 N=1,224 N=1,120 N=801 N=1,640 N=1,462 N=2,026 N=1,805 N=1,929
Millennial Generation X Baby Boomer
NETNA NA NA NA NA NA NA NA NA NA NA NA

Millennial workers believe that they will need to have saved $400,000 (median) in order to feel financially
secure when they retire while Generation X and Baby Boomers feel they will need to have $500,000 (median).
Estimated Retirement Savings Needs
178178
27 2512 14
2013 15
8 8 11 12 177 10 12
2522
1624
28
26 23
19 1521
2622
1719
29
1818
17
15
19
21 22
16 20
21
23 24
2325
26
1518
2218
1822 22
27 25
22
24 25
2624
21
15 17
33 2914 18 18
30 3125
15 12
2723
12
2017 2016 2015 2014 2013 2017 2016 2015 2014 2013 2017 2016 2015 2014 2013
$2m or more
$1m to less than $2m
$500k to less than $1m
$100k to less than $500k
Less than $100k
N=2,593 N=1,353 N=1,135 N=709 N=1,111 N=1,586 N=1,232 N=1,224 N=801 N=1,113 N=2,076 N=1,462 N=2,026 N=1,929 N=1,282
Median $400K $500k $1m $500k $500k $500k $500k $1m $750k $900k $500k $500k $1m $500k $500k
Note: The median is estimated based on the approximate midpoint of the range of each response category.
Data prior to 2017 shows results among workers in companies with 10+ workers. Data for 2017 shows results among workers in companies with 5+ workers.BASE: ALL QUALIFIED RESPONDENTSQ890. Thinking of what money can buy today, how much money do you believe you will need to have saved by the time you retire in order to feel financially secure?
Millennial Generation X Baby Boomer

Millennial Generation X Baby Boomer
■ 2017 (N=2,552) ■ 2016 (N=1,342) ■ 2015 (N=1,124)■ 2014 (N=1,101)■ 2013 (N=584)
■ 2017 (N=1,559)■ 2016 (N=1,199) ■ 2015 (N=1,209)■ 2014 (N=1,100)■ 2013 (N=790)
■ 2017 (N=2,035) ■ 2016 (N=1,409)■ 2015 (N=1,992)■ 2014 (N=1,766)■ 2013 (N=1,909)
Guessed
Estimated based on current living expenses
*Used a retirement calculator
Expected earnings on investments
Read/heard that is how much is needed
Amount given to me by financial advisor
Completed a worksheet
Other
Many workers are “guessing” their retirement savings needs, including 48 percent of Millennials, 48 percent of
Generation X, and 45 percent of Baby Boomers. Fewer than one in ten say they used a retirement calculator to
estimate their needs.
Basis for Estimating Retirement Savings Needs
179
Data prior to 2017 shows results among workers in companies with 10+ workers. Data for 2017 shows results among workers in companies with 5+ workers.*added in 2014BASE: PROVIDED ESTIMATE OF MONEY NEEDED FOR RETIREMENT Q900. How did you arrive at that number?
48
21
6
8
5
5
4
3
49
22
8
4
4
3
7
3
57
16
6
7
4
3
2
5
52
20
6
7
3
3
4
4
53
21
5
5
3
8
5
48
23
9
6
5
4
3
2
52
20
8
4
3
5
4
4
55
19
7
5
4
3
4
3
51
21
7
4
6
3
4
3
53
22
5
3
5
9
3
45
27
7
5
4
4
4
4
42
25
10
4
5
4
6
4
49
24
9
4
3
4
3
4
48
24
7
5
4
5
4
4
46
30
5
4
2
9
3
N/A N/A N/A

43 45 41 46 4047 44 40
47 4554 51 51 48 50
20 2015
1310
15 1612
1411
12 13 14 14 12
63 65
56 59
50
62 60
52
6156
66 64 64 61 62
2017 2016 2015 2014 2013 2017 2016 2015 2014 2013 2017 2016 2015 2014 2013
I have a written plan
I have a plan, but it is not written down
N=2,593 N=1,353 N=1,135 N=1,021 N=523 N=1,586 N=1,232 N=1,224 N=1,120 N=801 N=2,076 N=1,462 N=2,026 N=1,805 N=1,929
Millennial Generation X Baby Boomer
Achieving retirement readiness is more than just saving enough; it involves planning for both the expected and,
moreover, the unexpected. One of the most important secrets to attaining retirement readiness is having a well-
defined written strategy about retirement income needs, costs and expenses, and risk factors. The majority of
workers across all generations has a retirement strategy including 66 percent of Baby Boomers, 62 percent of
Generation X and 63 percent of Millennials. However, across all generations, workers’ retirement strategies are
seldom written.
Retirement Strategy: Written, Unwritten, or None
180
Have a Retirement Strategy (%)
Data prior to 2017 shows results among workers in companies with 10+ workers. Data for 2017 shows results among workers in companies with 5+ workers.BASE: ALL QUALIFIED RESPONDENTSQ1155. Which of the following best describes your retirement strategy?

Among workers who dream of traveling in retirement, most are confident their current financial strategy will
allow them to meet their travel goals, including 60 percent of Millennials, 54 percent of Generation X, and 62
percent of Baby Boomer workers. However, relatively few across generations are “very” confident (24 percent
Millennials, 16 percent Generation X, 20 percent Baby Boomers). Interestingly, some workers say that they
haven’t given it much thought: 17 percent Millennials, 9 percent Generation X, 12 percent Baby Boomers.
Confidence that Financial Strategy Will Enable Travel Goals
181
Millennial Generation X Baby Boomer
■ 2017 (N=1,882)
■ 2016 (N=989)
■ 2017 (N=1,052)
■ 2016 (N=816)
■ 2017 (N=1,260)
■ 2016 (N=877)
Very confident
Somewhat confident
Not too confident
Not at all confident
I haven’t given much thought to a financial strategy for travel in retirement
24
36
15
8
17
19
39
13
9
20
Data prior to 2017 shows results among workers in companies with 10+ workers. Data for 2017 shows results among workers in companies with 5+ workers.BASE: THOSE WHO DREAM OF TRAVELING IN RETIREMENTQ2845. How confident are you that your current financial strategy will allow you to meet your travel goals throughout retirement?
16
38
22
15
9
13
41
18
11
17
20
42
19
7
12
20
43
16
11
10
Confidence That Current Financial Strategy Will Meet Retirement Travel Goals (%)
NET Confident2017: 62%2016: 63%
NET Confident2017: 54%2016: 54%
NET Confident2017: 60%2016: 58%

Millennials (42 percent), and Baby Boomers (40 percent) are somewhat more likely than Generation X (37
percent) workers to use a financial advisor to help manage retirement savings and investments. Since last year,
more Millennial workers use financial advisors.
Professional Financial Advisor Usage
182
Data prior to 2017 shows results among workers in companies with 10+ workers. Data for 2017 shows results among workers in companies with 5+ workers.BASE: INVESTING FOR RETIREMENTQ860. Do you use a professional financial advisor to help manage your retirement savings or investments?
4236 34 32
28
37 39
3035 33
40 40 39 40 42
2017 2016 2015 2014 2013 2017 2016 2015 2014 2013 2017 2016 2015 2014 2013
N=1,772 N=962 N=781 N=687 N=364 N=1,204 N=937 N=921 N=871 N=607 N=1,608 N=1,150 N=1,577 N=1,429 N=1,509
Millennial Generation X Baby Boomer
Use a Professional Financial Advisor % Indicate “Yes”

The IRS Saver’s Credit is a tax credit available to eligible taxpayers who are saving for retirement in a qualified
retirement plan or IRA. Level of awareness about the credit is highest among Millennials (42 percent), followed
by Generation X (33 percent) and Baby Boomers (28 percent).
Awareness of the Saver’s Credit
183
Millennial2017 (N=2,593)
Generation X2017 (N=1,586)
Baby Boomers2017 (N=2,076)
Data prior to 2017 shows results among workers in companies with 10+ workers. Data for 2017 shows results among workers in companies with 5+ workers.BASE: ALL QUALIFIED RESPONDENTS Q1120. Are you aware of a tax credit called the “Saver’s Credit,” which is available to individuals and households, who meet certain income requirements, for making contributions to an IRA or a company-sponsored retirement plan such as a 401(k) plan or 403(b) plan?
42
58
33
67
28
72
Millennial2016 (N=1,353)
Generation X2016 (N=1,232)
Baby Boomers2016 (N=1,462)
38
62
30
70
29
71
2017
2016
Yes, I am aware No, I am not aware

Fewer than half of workers across generations are aware of the IRS’ Free File program which offers federal
income tax preparation software for free for eligible tax filers. Awareness of the program decreases slightly by
generation, with 46 percent of Millennials, 45 percent of Generation X and 43 percent of Baby Boomers being
aware of this IRS program.
Awareness of the IRS’ Free File Program
184
New question added in 2017BASE: ALL QUALIFIED RESPONDENTS Q2821. Are you aware of the IRS’ Free File program that offers federal income tax preparation software for free for eligible tax filers?
46
54
MillennialN=2,593
45
55
43
57
Generation XN=1,586
Baby BoomerN=2,076
No Yes
Awareness of the IRS’ Free File Program (%)

Influences of Gender on Retirement Readiness
Detailed Findings
185

The gender gap persists in retirement readiness: Women continue to lag behind men of not achieving a
financially secure retirement. Underlying reasons include lower income, lesser access to retirement benefits,
longer life expectancy, and time out of the workforce to be a parent or family caregiver. However, men also face
retirement risks. Efforts to help improve women’s retirement outlook, such as increasing access to retirement
benefits and flexible work arrangements, should benefit men as well.
Forty Indicators of Retirement Readiness
• Confidence in Retiring Comfortably. Retirement confidence is lower among women (54 percent) compared
to men (69 percent). Twice as many men (24 percent) than women (12 percent) are “very” confident they
will be able to fully retire with a lifestyle they consider comfortable. This gap has been consistent for the
past five years.
• Recovery From the Great Recession. Stages of financial recovery from the Great Recession differ between
genders. Seventeen percent of working women feel they have fully recovered, compared to 29 percent of
working men. In addition, 21 percent of women have either not yet begun to recover or feel they may never
recover, compared to 16 percent of men.
• Building a Large Enough Nest Egg? Men (62 percent) are more likely than women (45 percent) to either
“strongly” or “somewhat” agree that they are building a large enough retirement nest egg. Nearly twice as
many men (25 percent) than women (14 percent) “strongly” agree. For both men and women level of
agreement has increased since last year.
• Retirement Dreams Include Leisure and Work. Traveling is the most commonly cited retirement dream
among both women (71 percent) and men workers (69 percent). Women (61 percent) are more likely to
dream of spending more time with family and friends than men (53 percent). Other dreams are pursuing
hobbies (48 percent women, 52 percent men), as well as some form of work in retirement: 25 percent of
women and 35 percent of men.
Influences of Gender on Retirement Readiness
186

• Retirement Beliefs, Preparations, and Involvement. Both women (81 percent) and men (78 percent) agree
that their generation will have a much harder time in achieving financial security compared to their
parent’s generation. Women (81 percent) are more likely than men (72 percent) to be concerned that
Social Security will note be there for them when they are ready to retire.
• Expected Retirement Age. The majority of both men (53 percent) and women (53 percent) expect to work
past age 65 or do not plan to retire. Twenty-one percent of men and 25 percent of women expect to retire
at age 65. Slightly more men (26 percent) than women (22 percent) plan to retire before age 65. This
trend has remained consistent for the past five years.
• Planning to Work in Retirement. A little more than half of working men (58 percent) and women (54
percent) plan to continue working after they retire, at least on a part-time basis. Sixteen percent of men
and 11 percent of women plan to work full-time after retiring. Both men and women are more likely to plan
to continue working in retirement compared to last year.
• Reasons for Working in Retirement. Among workers who plan to retire after age 65 and/or work in
retirement, men and women more frequently cite financial reasons (women 85 percent and men 81
percent) than healthy-aging reasons (women 71 percent; men 78 percent).
• Retirement Transitions: Phased Versus Immediate. Women and men envision a phased transition into
retirement by changing work patterns (e.g., reducing work hours with more leisure time to enjoy life or
working in a different capacity that is less demanding and/or brings greater personal satisfaction). More
Men (26 percent) than women (19 percent) plan to immediately stop working and retire once they reach a
specific age or amount of money.
Influences of Gender on Retirement Readiness
187

• Phased Retirement and Compensation-Related Expectations. Among workers who envision a phased
transition into retirement, most are conscious about how changes in their work arrangements may affect
their compensation, job title, and employee benefits. Women workers (80 percent) are somewhat more
likely than men (78 percent) to agree that “If I reduce my work hours at my current employer, I would
expect to be paid the same hourly rate for hours worked that I am earning now.” In contrast, men (76
percent) are more likely than women (66 percent) to agree that if “I were to take on a new role with fewer
responsibilities at my current employer, I would expect to be paid the market rate for the duties involved,
even if it means a reduction in my current level of pay.”
• Perceptions of Older Workers. A strong majority of women (85 percent) and men (82 percent) have positive
perceptions about older workers, namely they are more knowledgeable, responsible, and a valuable
resource for training and mentoring. However, more than half of both women (50 percent) and men (59
percent) have negative perceptions of older workers, including their having higher healthcare costs,
commanding higher wages/salaries, and being less open to learning new ideas.
• Age That Workers Consider a Person to Be “Old.” Men and women both consider a person to be “old” at
age 70 (median among those who provided an age). However, large minorities of both genders say “It
depends on the person”: women, 41 percent and men, 39 percent.
• Age That Workers Consider a Person to Be “Too Old” to Work. Women and men have similar perceptions of
when a person is considered “too old” to work. The majority of women (57 percent) and men (51 percent)
indicate “it depends on the person.” Among those who did provide an age, both men and women say a
person is “too old” to work at age 75 (median).
• Level of Concern About Health in Older Age. The majority of women and men (both 73 percent) are
concerned about their health in older age. More than one in five are “very concerned”: 22 percent of
women and 25 percent of men.
Influences of Gender on Retirement Readiness
188

• Engagement in Health-Related Activities on a Consistent Basis. Most men and women are engaging in
health-related activities. Women are more likely to seek medical attention when needed, get routine
physicals and recommended health screenings, and to consider long-term health when making lifestyle
decisions. In contrast, men are more likely to exercise regularly. Only about a quarter of women (26
percent) and men (24 percent) consider their long-term health when making lifestyle decisions.
• Planning to Live to Age ... Women and men plan on living long lives with both genders responding with a
plan to live until age 90 (median). More than one in ten women (15 percent) and men (14 percent) are
planning to become centenarians and live to age 100 or older. Forty-five percent of women and 37 percent
of men are not sure about the age they plan to live to.
• Current Financial Priorities. The majority of both genders indicate that “Paying off debt” (NET) is a current
priority (68 percent of women and 65 percent of men). In contrast, working men (62 percent) are more
likely than working women (51 percent) to say saving for retirement is a financial priority right now. Women
(41 percent) are more likely to say “just getting by – covering basic living expenses” is a current financial
priority compared to men (28 percent).
• Greatest Financial Priority Right Now. “Paying off debt” (NET) is greatest financial priority for both women
(32 percent) and men (28 percent). However, men more frequently cite “saving for retirement” as their
greatest financial priority right now (25 percent) while women more frequently cited “just getting by –
covering basic living expenses” (21 percent) as their greatest priority.
• Types of Household Debt. Credit card debt is the most common type of household debt for both women
(61 percent) and men (58 percent), followed by mortgage (41 percent of women, 44 percent of men),
and/or car loan (43 percent of women and 38 percent of men). Only 12 percent of women and 15 percent
of men have no household debt.
Influences of Gender on Retirement Readiness
189

• Estimated Emergency Savings. Many workers lack emergency savings that could help cover the cost of a
major financial setback (e.g., unemployment, medical bills, home repairs, auto repairs, other). Gender
differences are evident with women having only $2,000 (median) in emergency savings, an amount far
less than the $10,000 (median) among men. Moreover, 27 percent of women have saved less than
$1,000. While men (24 percent) are more to have saved $25,000 or more for emergencies. Of concern,
about a quarter of workers are "not sure" how much they have in emergency savings: 26 percent of women
and 22 percent of men.
• Saving for Retirement / Age Started Saving. A large majority of workers of both genders are saving for
retirement through an employer-sponsored plan and/or outside of work, but men are more likely (82
percent) than women (73 percent) to be currently saving. In addition, both women and men started saving
at age 27 (median).
• Expected Sources of Retirement Income. Self-funded savings including retirement accounts (e.g., 401(k)s,
403(b)s, IRAs) and other savings and investments are the most frequently cited source of retirement
income expected by both women (80 percent) and men (84 percent). Social Security is the second most
frequently cited source of retirement income that is expected among both women (74 percent) and men
(74 percent). Additionally, about four in ten women (40 percent) and men (38 percent) expect income
from “working” to be a source of income during retirement.
• Expected Primary Source of Income in Retirement. Both men (40 percent) and women (33 percent) most
frequently cite 401(k)s, 403(b)s, or IRAs to be their expected primary source of income in retirement.
Women (30 percent) are more likely than men (23 percent) to expect Social Security to be their primary
source of income. Additionally, 16 percent of women and 12 percent of men expect to rely on “working.”
Influences of Gender on Retirement Readiness
190

• Importance of Retirement Benefits Compared to Other Benefits. The vast majority of women (89 percent)
and men (88 percent) believe that a 401(k), 403(b) or similar plan is “very” or “somewhat” important
benefit. This trend has remained consistent over the past five years.
• Retirement Benefits Currently Offered. Although most workers are offered a 401(k) or other similar
employee-funded retirement plan in the workplace, men (75 percent) are more likely to have access
compared to women (66 percent). In contrast, few workers (32 percent of men, 19 percent of women) are
offered a company-funded defined benefit plan. Of note, 27 percent of women say their employer does not
offer them any retirement benefits compared to just 19 percent of men.
• Retirement Plan Participation. Among workers who are offered a 401(k) or similar plan, the participation
rate is higher among men (84 percent) compared to women (77 percent). For both men and women, plan
participation has increased since last year.
• Retirement Plan Contribution Rate. Among workers who participate in 401(k) or similar plan, men
contribute 10 percent (median) of their annual pay, whereas women contribute 7 percent (median). Over
the past five years, the median contribution rate has been consistently higher among men than women.
• Appeal of Automatic Enrollment. The majority of workers (82 percent men and 79 percent women) find
automatic enrollment into a 401(k) or similar retirement plan “very” or “somewhat” appealing. Forty-two
percent of men and 37 percent of women find it “very appealing.” Men workers believe the appropriate
default contribution rate should be 9 percent (median), which is higher than the 5 percent (median) among
women workers.
• Likelihood of Using Automatic Escalation. The majority of both women (73 percent) and men (77 percent)
workers say they are “very” or “somewhat” likely to use a feature that automatically increases contribution
rate by 1% each year until they choose to discontinue the increase. Twenty-nine percent of women and 33
percent of men are “very likely” to use the feature.
Influences of Gender on Retirement Readiness
191
• Use of Professionally Managed Offerings. “Professionally managed” accounts are a managed account
service, strategic allocation funds, and/or target date funds. The majority of plan participants of both
genders use some form of professionally managed offering in their 401(k) or similar plans: 54 percent of
women and 63 percent of men. Men (47 percent) are more likely than women (39 percent) to set their own
asset allocation percentages among the available funds. More women (15 percent) than men (7 percent)
are “not sure” about their current approach to investing in their employer-sponsored plan.
• Asset Allocation of Retirement Investments. Among those investing for retirement, Men (43 percent) and
women (36 percent) most frequently say that their retirement savings are invested in a relatively equal mix
of stocks and investments such as bonds, money market funds and cash. A concerning 32 percent of
women say that they are “not sure” how their savings are invested, compared to 13 percent of men.
• Retirement Plan Leakage: Loans and Withdrawals. “Leakage” from retirement plans in the form of loans
and withdrawals can severely inhibit the growth of participants’ long-term retirement savings. About one in
three women (32 percent) and men (34 percent) have taken some form of loan, early withdrawal, and/or
hardship withdrawal from a 401(k) or similar plan.
• Total Household Retirement Savings. Total household retirement savings differ by gender. Working men
have saved $123,000 (estimated median) compared to $42,000 (estimated median) among women.
Almost twice as many men (38 percent) as women (20 percent) have saved $250,000 or more in total
household retirement accounts. Over the past five years, men have consistently reported higher levels of
household retirement savings compared to women.
• Estimated Retirement Savings Needs. Working men and women both expect they will need to have saved
$500,000 (median) by the time they retire in order to feel financially secure. More women (47 percent)
than men (41 percent) estimate they will need less than $500,000 in order to feel financially secure in
retirement.
Influences of Gender on Retirement Readiness
192

• Basis for Estimating Retirement Savings Needs. Among those who provided an estimate of their retirement
savings needs, many arrived at that amount by “guessing.” Women (55 percent) are more likely than men
(39 percent) to say that they “guessed.” Men (10 percent) are twice as likely as women (5 percent) to have
used a retirement calculator.
• Retirement Strategy: Written, Unwritten, or None. Men (71 percent) are more likely than women (55
percent) to have some form of a retirement strategy, either written or unwritten. However, of them, only 11
percent of women have a written retirement strategy compared to 21 percent of men. Over the past five
years, men have been consistently more likely than women to have some form of retirement strategy.
• Confidence that Financial Strategy Will Enable Travel Goals. Travel was the top retirement dream for both
men and women. However, among those dreaming of travel in retirement, only 46 percent of women
compared to 69 percent of men are confident that their current financial strategy will allow them to meet
their travel goals throughout retirement. Men are more likely than women to be “very” confident (29
percent and 12 percent, respectively). Additionally, more women (20 percent) than men (9 percent)
haven’t given much thought to a financial strategy for travel in retirement.
• Professional Financial Advisor Usage. Significantly more men (45 percent) than women (33 percent) who
are investing for retirement use a professional financial advisor to manage their retirement savings or
investments. The use of a professional financial advisor has increased in men and decreased in women
compared to last year.
Influences of Gender on Retirement Readiness
193

• Awareness of Saver’s Credit. Level of awareness about the IRS Saver’s Credit -- a tax credit available to
eligible taxpayers who are saving for retirement in a qualified retirement plan or IRA – varies significantly
between genders. Working men (43 percent) are more likely than women (28 percent) to be aware of the
IRS Saver’s Credit. This gender gap in awareness is consistent with last year, however, both genders did
see a rise in awareness when compared to last year.
• Awareness of the IRS’ Free File Program. Women workers (40 percent) are less likely than men (49
percent) to be aware of the IRS’ Free File program which offers federal income tax preparation software for
free for eligible tax filers.
Influences of Gender on Retirement Readiness
194

42 45 42 46 43 45 49 48 50 47
12 10 1214
7
24 1916
1713
54 55 54
60
50
69 6864
67
60
2017 2016 2015 2014 2013 2017 2016 2015 2014 2013
Very confident Somewhat confident
Data prior to 2017 shows results among workers in companies with 10+ workers. Data for 2017 shows results among workers in companies with 5+ workers.BASE: ALL QUALIFIED RESPONDENTS
Q880. How confident are you that you will be able to fully retire with a lifestyle you consider comfortable?
Retirement confidence is lower among women (54 percent) compared to men (69 percent). Twice as many men
(24 percent) than women (12 percent) are “very” confident they will be able to fully retire with a lifestyle they
consider comfortable. This gap has been consistent for the past five years.
Confidence in Retiring Comfortably
195
N=3,917 N=2,315 N=2,421 N=2,172 N=1,902 N=2,432 N=1,837 N=2,129 N=1,971 N=1,749
Women Men
Confidence in Retiring Comfortably
Very/Somewhat Confident (%) (NET)

Stages of financial recovery from the Great Recession differ between genders. Seventeen percent of working
women feel they have fully recovered, compared to 29 percent of working men. In addition, 21 percent of women
have either not yet begun to recover or feel they may never recover, compared to 16 percent of men.
Recovery From the Great Recession
196
Data prior to 2017 shows results among workers in companies with 10+ workers. Data for 2017 shows results among workers in companies with 5+ workers.BASE: ALL QUALIFIED RESPONDENTS Q2655. How would you describe your financial recovery from the deep recession in recent years, which is commonly referred to as the “Great Recession”?
I was not impacted I have fully recovered I have somewhat recovered I have not yet begun to recover I may never recover
How would you describe your financial recovery from the Great Recession? (%)
24
16
17
29
38
39
14
10
7
6
Women
Men
NET - Not Impacted orFully Recovered= 41%
NET - Not Impacted orFully Recovered= 45%
NET - Not Yet Begun orNever Recover = 21%
NET - Not Yet Begun orNever Recover = 16%
N=3,917
N=2,432
21
18
14
25
42
38
15
12
8
7
Women
Men
NET - Not Impacted orFully Recovered= 43%
NET - Not Impacted orFully Recovered= 35%
NET - Not Yet Begun orNever Recover = 23%
NET - Not Yet Begun orNever Recover = 19%
N=2,315
N=1,837
2017 2016

Data prior to 2017 shows results among workers in companies with 10+ workers. Data for 2017 shows results among workers in companies with 5+ workers.BASE: ALL QUALIFIED RESPONDENTSQ800. How much do you agree or disagree that you are currently building a large enough retirement nest egg?
Men (62 percent) are more likely than women (45 percent) to either “strongly” or “somewhat” agree that they
are building a large enough retirement nest egg. Nearly twice as many men (25 percent) than women (14
percent) “strongly” agree. For both men and women level of agreement has increased since last year.
Building a Large Enough Nest Egg?
197
31 32 30 3428
37 38 37 4133
14 11 1314
7
25 2118
16
14
45 43 4248
36
6259
55 56
47
2017 2016 2015 2014 2013 2017 2016 2015 2014 2013
Strongly agree Somewhat agree
N=3,917 N=2,315 N=2,421 N=2,172 N=1,902 N=2,432 N=1,837 N=2,129 N=1,971 N=1,749
Women Men
Building a Large Enough Nest Egg
Strongly/Somewhat Agree (%) (NET)

Traveling is the most commonly cited retirement dream among both women (71 percent) and men workers (69
percent). Women (61 percent) are more likely to say they dream of spending more time with family and friends
than men (53 percent). Other dreams are pursuing hobbies (48 percent women, 52 percent men), as well as
some form of work in retirement (25 percent of women, 35 percent of men).
Retirement Dreams Include Leisure and Work
198
Data prior to 2017 shows results among workers in companies with 10+ workers. Data for 2017 shows results among workers in companies with 5+ workers.BASE: ALL QUALIFIED RESPONDENTS Q1418. How do you dream of spending your retirement? Select all.
How do you dream of spending your retirement? Please select all that apply. (%)
Women Men
■ 2017 (N=3,917)
■ 2016 (N=2,315)
■ 2017 (N=2,432)
■ 2016 (N=1,837)
Traveling
Spending more time with family and friends
Pursuing hobbies
Doing volunteer work
Pursuing an encore career (pursuing a new role, work, activity, or career)
Starting a business
Continue working in the same field
Other
None of the above
71
61
48
28
11
9
9
4
2
66
60
46
28
9
9
9
5
4
69
53
52
24
15
16
14
6
2
63
54
52
26
16
14
15
8
4
NET: Working2017: 35%2016: 33%
NET: Working2017: 25%2016: 22%

How Much Do You Agree or Disagree?
Strongly/Somewhat Agree (%) (NET)
Women Men
■ 2017 (N=3,917) ■ 2016 (N=2,315)
■ 2015 (N=2,421)■ 2014 (N=2,172)■ 2013 (N=1,902)
■ 2017 (N=2,432) ■ 2016 (N=1,837)■ 2015 (N=2,129)■ 2014 (N=1,971)■ 2013 (N=1,749)
**Compared to my parent's generation, people in my generation will have a much harder time in achieving financial security
**I am concerned that when I am ready to retire, Social Security will not be there for me
*My current employer is supportive of its employees working past 65
Do not know as much as I should about retirement investing
I would like to receive more information and advice from my employer on how to reach my retirement goals
Could work until age 65 and still not have enough money saved
Very involved in monitoring and managing my retirement savings
Prefer to rely on outside experts to monitor and manage my plan
Prefer not to think about or concern myself with it until closer to retirement
78
72
72
60
68
62
73
58
41
80
72
72
62
67
63
70
57
43
77
71
59
61
62
70
52
39
80
72
61
65
63
73
56
36
64
62
65
70
49
35
81
81
71
76
64
71
56
57
39
84
82
71
75
65
68
56
58
37
83
81
74
61
70
56
55
40
83
80
74
62
70
65
55
40
74
59
71
51
53
34
Note: Data prior to 2017 shows results among workers in companies with 10+ workers. Data for 2017 shows results among workers in companies with 5+ workers.*added in 2016 **added in 2014
BASE: ALL QUALIFIED RESPONDENTS Q930. How much do you agree or disagree with each of the following statements regarding retirement investing?
Both women (81 percent) and men (78 percent) agree that their generation will have a much harder time in
achieving financial security compared to their parent’s generation. Women (81 percent) are more likely than
men (72 percent) to be concerned that Social Security will note be there for them when they are ready to retire.
Retirement Beliefs, Preparations, and Involvement
199
N/A
N/A
N/A
N/A
N/A
N/A
N/A
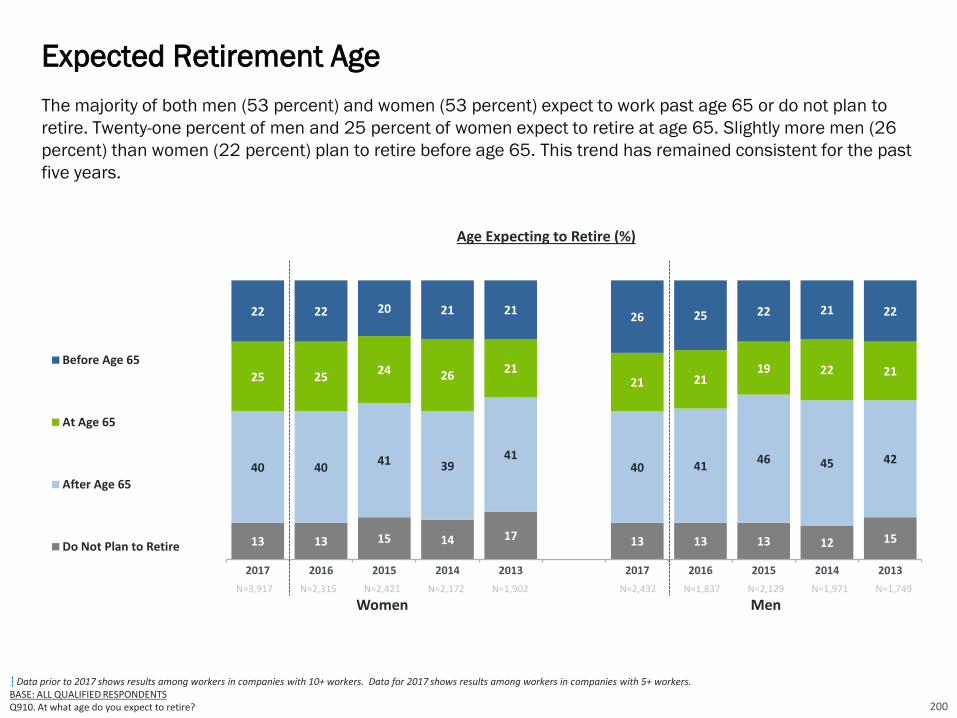
Data prior to 2017 shows results among workers in companies with 10+ workers. Data for 2017 shows results among workers in companies with 5+ workers.BASE: ALL QUALIFIED RESPONDENTSQ910. At what age do you expect to retire?
The majority of both men (53 percent) and women (53 percent) expect to work past age 65 or do not plan to
retire. Twenty-one percent of men and 25 percent of women expect to retire at age 65. Slightly more men (26
percent) than women (22 percent) plan to retire before age 65. This trend has remained consistent for the past
five years.
Expected Retirement Age
200
13 13 15 14 17 13 13 13 12 15
40 4041 39
4140 41
46 45 42
25 2524 26
2121 21
19 22 21
22 22 20 21 2126 25 22 21 22
2017 2016 2015 2014 2013 2017 2016 2015 2014 2013
Before Age 65
At Age 65
After Age 65
Do Not Plan to Retire
N=3,917 N=2,315 N=2,421 N=2,172 N=1,902 N=2,432 N=1,837 N=2,129 N=1,971 N=1,749
Women Men
Age Expecting to Retire (%)

43 39 40 3845 42 37 39 42 44
1111 11 11
7 1615 13 13 12
23 25 23 2717
26 29 27 27 21
23 25 27 2431 16
19 21 1823
50Yes (NET):
Somewhat more than half of working men (58 percent) and women (54 percent) plan to continue working after
they retire, at least on a part-time basis. Sixteen percent of men and 11 percent of women plan to work full-
time after retiring. Both men and women are more likely to plan to continue working in retirement compared to
last year.
Planning to Work in Retirement
201
Data prior to 2017 shows results among workers in companies with 10+ workers. Data for 2017 shows results among workers in companies with 5+ workers.BASE: ALL QUALIFIED RESPONDENTSQ1525. Do you plan to work after you retire?
Planning to Work in Retirement (%)
Yes, I plan to work full-timeYes, I plan to work part-timeNo, I do not plan to workNot sure
2017 2016 2015 2014 2013 2017 2016 2015 2014 2013
N=3,917 N=2,315 N=2,421 N=2,172 N=1,902 N=2,432 N=1,837 N=2,129 N=1,971 N=1,749
Women Men
51 49 52 52 52 55 565458

Among workers who plan to retire after age 65 and/or work in retirement, men and women more frequently cite
financial reasons (women 85 percent, men 81 percent) than healthy-aging reasons (women 71 percent, men
78 percent).
Reasons for Working in Retirement
202
NET
Financial Reasons
NET
Healthy-aging
Reasons
Want the income
Be activeKeep my
brain alert
Concerned that Social
Security will be less than
expected
Can’t afford to retire because I haven’t
saved enough
Have a sense of purpose
Enjoy what I do
Need health benefits
Maintain social
connections
Concernedemployer
retirement benefits will be less than
expected
Anxious re: volatility in
financial markets and investment
performance
85 71 58 51 44 48 47 36 33 33 27 18 16
Wo
me
nN
=28
83
81 78 55 56
43 36 31 38 40 29 23 14 14
New question added in 2017BASE: PLAN ON RETIRING AFTER 65 AND/OR WORKING AFTER RETIREMENTQ1530x1. What are your reason(s) for working in retirement or past age 65? Select all.
Me
nN
=19
16

Women and men envision a phased transition into retirement by changing work patterns (e.g., reducing work
hours with more leisure time to enjoy life, or working in a different capacity that is less demanding and/or
brings greater personal satisfaction). More Men (26 percent) than women (19 percent) plan to immediately
stop working and retire once they reach a specific age or amount of money.
Retirement Transitions: Phased Versus Immediate
203
Women Men
■ 2017 (N=3,917)
■ 2016 (N=2,315)
■ 2015 (N=2,421)
■ 2014 (N=2,172)
■ 2017 (N=2,432)
■ 2016 (N=1,837)
■ 2015 (N=2,129)
■ 2014 (N=1,971)
Continue working as long as possible in current or similar position until I cannot work anymore
TRANSITION (NET)
Transition into retirement by reducing work hours
Transition into retirement by working in a different capacity
PLAN TO STOP (NET)
Immediately stop working once I reach a specific age
Immediately stop working once I save a specific amount of money
Not sure
Data prior to 2017 shows results among workers in companies with 10+ workers. Data for 2017 shows results among workers in companies with 5+ workers.BASE: ALL QUALIFIED RESPONDENTSQ1545. How do you envision transitioning into retirement?
21
49
32
17
19
12
7
11
22
46
31
14
19
12
7
14
22
40
26
14
19
13
6
19
18
47
30
17
19
12
7
16
20
45
28
17
26
17
9
9
21
39
25
14
27
16
11
13
19
41
24
17
24
16
8
16
19
45
28
17
24
15
9
12
How do you envision transitioning into retirement? (%)

Phased Retirement and Compensation-Related Expectations
New question added in 2017BASE: RESPONDENTS WHO ENVISION A PHASED TRANSITION INTO RETIREMENTQ1546. In thinking about your vision of transitioning into retirement, to what extent do you agree or disagree with the following statements? 204
Among workers who envision a phased transition into retirement, most are conscious about how changes in their work
arrangements may affect their compensation, job title, and employee benefits. Women workers (80 percent) are
somewhat more likely than men (78 percent) to agree that “If I reduce my work hours at my current employer, I would
expect to be paid the same hourly rate for hours worked that I am earning now.” In contrast, men (76 percent) are more
likely than women (66 percent) to agree that “If I were to take on a new role with fewer responsibilities at my current
employer, I would expect to be paid the market rate for the duties involved, even if it means a reduction in my current
level of pay.”In thinking about your vision of transitioning into retirement, to what extent
do you agree or disagree with the following statements? Strongly/Somewhat Agree (%) (NET)
WomenN=1907
MenN=1095
If I reduce my work hours at my current employer, I would expect to be paid the same hourly rate for hours worked that I am earning now.
If I were to take on a new role with fewer responsibilities at my current employer, I would expect my job title to change.
If I were to take on a new role with fewer responsibilities at my current employer, I would expect to be paid the market rate for the duties involved, even if it means a reduction in my current level of pay.
If I were to shift from full-time to part-time at my current employer, I would expect to receive the same employee benefits that I have now.
80
75
66
60
78
81
76
60

WomenN=3,917
MenN=2,432
NET – Positive perceptions
Bring more knowledge, wisdom, and life experience
Are more responsible, reliable, and dependable
Are a valuable resource for training and mentoring
Are an important source of institutional knowledge
Are more adept at problem-solving
Are better at getting along with others in a team environment
NET – Negative perceptions
Have higher healthcare costs
Command higher wages and salaries
Are less open to learning and new ideas
Have higher disability costs
Have outdated skill sets
Are less productive
Other
None
82
60
54
50
43
36
30
59
31
23
18
17
13
11
1
8
Perceptions of Older Workers
205
New question added in 2017BASE: ALL QUALIFIED RESPONDENTS Q1528. What are your perceptions of workers age 50 and older compared to younger workers in today’s workforce? Select all.
Perceptions of workers age 50+ compared to younger workers in today’s workforce? (%)
A strong majority of women (85 percent) and men (82 percent) have positive perceptions about older workers, namely they are
more knowledgeable, responsible, and a valuable resource for training and mentoring. However, more than half of both women
(50 percent) and men (59 percent) have negative perceptions of older workers, including their having higher healthcare costs,
command higher wages/salaries, and are less open to learning new ideas.
85
64
61
50
42
32
31
50
25
17
21
11
13
8
1
7

Age That Workers Consider a Person to Be “Old”
206
913
18
11
41
41
3
1316 17
93 1
39
2
<60 60-69 70-79 80-89 90-99 100+ It depends on theperson
Not Sure
Age When Person is Considered “Old” (%)
Men and women both consider a person to be “old” at age 70 (median among those who provided an age).
However, large minorities of both genders say “It depends on the person”: women, 41 percent and men, 39
percent.
Median Age
Women (N=3,917) Age 70Men (N=2,432) Age 70
New question added in 2017BASE: ALL QUALIFIED RESPONDENTS Q1526. At what age do you consider a person to be “old”?
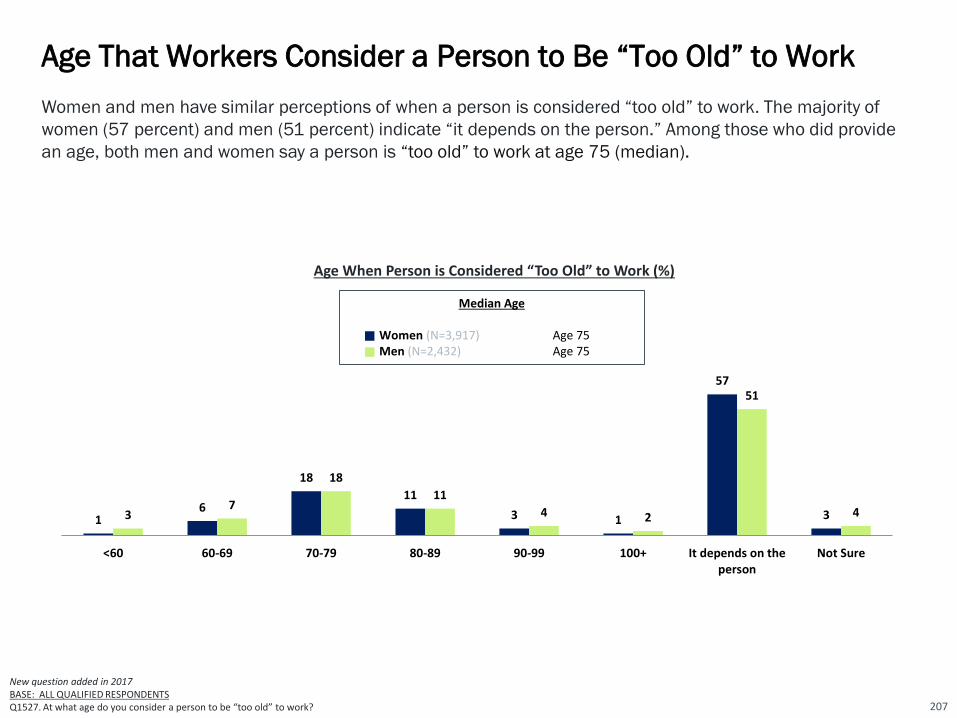
Age That Workers Consider a Person to Be “Too Old” to Work
207
16
18
11
3 1
57
337
18
11
4 2
51
4
<60 60-69 70-79 80-89 90-99 100+ It depends on theperson
Not Sure
Age When Person is Considered “Too Old” to Work (%)
Median Age
Women (N=3,917) Age 75Men (N=2,432) Age 75
New question added in 2017BASE: ALL QUALIFIED RESPONDENTS Q1527. At what age do you consider a person to be “too old” to work?
Women and men have similar perceptions of when a person is considered “too old” to work. The majority of
women (57 percent) and men (51 percent) indicate “it depends on the person.” Among those who did provide
an age, both men and women say a person is “too old” to work at age 75 (median).

Level of Concern About Health in Older Age
The majority of women and men (both 73 percent) are concerned about their health in older age. More than
one in five are “very concerned”: 22 percent of women and 25 percent of men.
New question added in 2017BASE: ALL QUALIFIED RESPONDENTSQ1445X1. How concerned are you about your health in older age?
Women2017 (N=3,917)
Men2017 (N=2,432)
22
51
23
4
25
48
22
5
NET – Concerned:73%
Very concerned Somewhat concerned Not too concerned Not at all concerned
Concerned About Health in Older Age (%)
NET – Concerned:73%
208

Engagement in Health-Related Activities on a Consistent Basis
Most men and women are engaging in health-related activities. Women are more likely to seek medical
attention when needed, get routine physicals and recommended health screenings, and to consider long-term
health when making lifestyle decisions. In contrast, men are more likely to exercise regularly. Only about a
quarter of women (26 percent) and men (24 percent) say they consider their long-term health when making
lifestyle decisions.
New question added in 2017
BASE: ALL QUALIFIED RESPONDENTS
Q1446. Which of the following health-related activities are you doing on a consistent basis? Select all. 209
Engaging in Health-Related Activities on a Consistent Basis (%)
WomenN=3,917
MenN=2,432
Eating healthfully
Exercising regularly
Maintaining a positive outlook
Seeking medical attention when needed
Avoiding harmful substances (e.g., cigarettes, alcohol, illicit drugs, etc.)
Getting plenty of rest
Getting routine physicals and recommended health screenings
Managing stress
Considering long-term health when making lifestyle decisions
Practicing mindfulness and meditation
Other
Nothing
57
50
55
58
55
52
54
44
26
23
<1
4
54
57
51
49
45
46
44
45
24
17
1
4

Women and men plan on living long lives with both genders responding with a plan to live until age 90
(median). More than one in ten women (15 percent) and men (14 percent) are planning to become
centenarians and live to age 100 or older. Forty-five percent of women and 37 percent of men are not sure
about the age they plan to live to.
Planning to Live to Age ...
210
Data prior to 2017 shows results among workers in companies with 10+ workers. Data for 2017 shows results among workers in companies with 5+ workers.BASE: ALL QUALIFIED RESPONDENTS Q2850. What age are you planning to live to?
Women Men
N=3,917 N=2,432
Not sure 45 17 37 15Median Age 90 Age 90 Age 90 Age 85
What age are you planning to live to? (%)
N=2,315 N=1,837
Age 100+
Age 90-99
Age 80-89
Age 70-79
Age 60-69
Age <60
1 41258
17
2716
25
15
17
2017 2016
2 5237
12
18
3020
2014
15
2017 2016
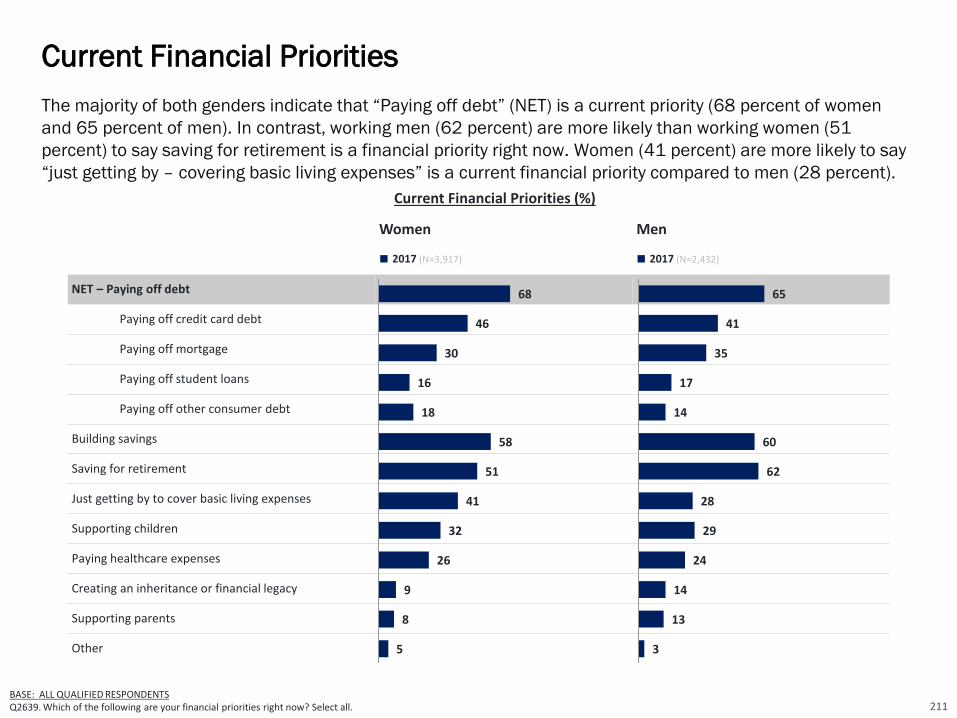
The majority of both genders indicate that “Paying off debt” (NET) is a current priority (68 percent of women
and 65 percent of men). In contrast, working men (62 percent) are more likely than working women (51
percent) to say saving for retirement is a financial priority right now. Women (41 percent) are more likely to say
“just getting by – covering basic living expenses” is a current financial priority compared to men (28 percent).
Current Financial Priorities
211BASE: ALL QUALIFIED RESPONDENTSQ2639. Which of the following are your financial priorities right now? Select all.
Women Men
■ 2017 (N=3,917) ■ 2017 (N=2,432)
NET – Paying off debt
Paying off credit card debt
Paying off mortgage
Paying off student loans
Paying off other consumer debt
Building savings
Saving for retirement
Just getting by to cover basic living expenses
Supporting children
Paying healthcare expenses
Creating an inheritance or financial legacy
Supporting parents
Other
68
46
30
16
18
58
51
41
32
26
9
8
5
Current Financial Priorities (%)
65
41
35
17
14
60
62
28
29
24
14
13
3

BASE: ALL QUALIFIED RESPONDENTS Q2640. Which one of the following is your greatest financial priority right now?
“Paying off debt” (NET) is greatest financial priority for both women (32 percent) and men (28 percent).
However, men more frequently cite “saving for retirement” as their greatest financial priority right now (25
percent) while women more frequently cited “just getting by – covering basic living expenses” (21 percent) as
their greatest priority.
Greatest Financial Priority Right Now
212
Women Men
■ 2017 (N=3,917) ■ 2017 (N=2,432)
NET – Paying off debt
Paying off credit card debt
Paying off mortgage
Paying off student loans
Paying off other consumer debt
Saving for retirement
Just getting by to cover basic living expenses
Building savings
Supporting children
Paying healthcare expenses
Supporting parents
Creating an inheritance or financial legacy
Other
32
19
7
3
2
15
21
12
13
2
1
1
2
Greatest Financial Priority Right Now (%)
28
13
10
2
2
25
13
13
11
3
3
2
1

Credit card debt is the most common type of household debt for both women (61 percent) and men (58
percent), followed by mortgage (41 percent of women, 44 percent of men), and/or car loan (43 percent of
women and 38 percent of men). Only 12 percent of women and 15 percent of men have no household debt.
Types of Household Debt
213
Which of the following types of debtdoes your household currently have? Select All (%)
WomenN=3,917
MenN=2,432
Credit card
Mortgage
Car loan
Student loan
Medical debt
Personal loan
Home equity loan
Loan from family or friends
Tax debt
Payday loan
Business loan
Investment debt
Other debt
My household currently does not have any debts
61
41
43
24
19
15
8
8
6
4
2
1
4
12
58
44
38
16
11
13
10
5
7
5
5
5
3
15
New question added in 2017BASE: ALL QUALIFIED RESPONDENTS Q1286. Which of the following types of debt does your household currently have? Select all.
NET – Has DebtWomen = 88%
NET – Has DebtMen = 85%

Many workers lack emergency savings that could help cover the cost of a major financial setback (e.g.,
unemployment, medical bills, home repairs, auto repairs, other). Gender differences are evident with women
having only $2,000 (median) in emergency savings, an amount far less than the $10,000 (median) among
men. Moreover, 27 percent of women have saved less than $1,000. While men (24 percent) are more to have
saved $25,000 or more for emergencies. Of concern, about a quarter of workers are "not sure" how much they
have in emergency savings: 26 percent of women and 22 percent of men.
Estimated Emergency Savings
214
Data prior to 2017 shows results among workers in companies with 10+ workers. Data for 2017 shows results among workers in companies with 5+ workers.BASE: ALL QUALIFIED RESPONDENTS Q2825. How much do you have in emergency savings specifically to cover the cost of unexpected major financial setbacks (e.g., unemployment, medical bills, home repairs, auto repairs, other)?
16 16
14 12
8 9
8 7
43
44
18 21
6 6
2017 2016
27 26
17 16
7 8
6 62 22 2
10 12
3 3
2017 2016
$100k or more
$25k to less than $100k
$20k to less than $25k
$15k to less than $20k
$10k to less than $15k
$5k to less than $10k
$1k to less than $5k
Less than $1k
Women Men
N=3,917 N=2,432
Not sure 26 25 22 22Median $2,000 $2,000 $10,000 $10,000
How much do you have in emergency savings to cover the cost of unexpected major financial setbacks? (%)
N=1,837N=2,315

Data prior to 2017 shows results among workers in companies with 10+ workers. Data for 2017 shows results among workers in companies with 5+ workers.BASE: THOSE CURRENTLY OFFERED QUALIFIED PLANQ1190. Do you currently participate in, or have money invested in your company’s employee-funded retirement savings plan?BASE: ALL QUALIFIED RESPONDENTSQ740. Are you currently saving for retirement outside of work, such as in an IRA, mutual funds, bank account, etc.?BASE: INVESTING FOR RETIREMENTQ790. At what age did you first start saving for retirement?
A large majority of workers of both genders are saving for retirement through an employer-sponsored plan
and/or outside of work, but men are more likely (82 percent) than women (73 percent) to be currently saving.
In addition, both women and men started saving at age 27 (median).
Saving for Retirement / Age Started Saving
215
73 72 72 75 7482 80 79 82 82
2017 2016 2015 2014 2013 2017 2016 2015 2014 2013
Workers Who Are Saving For Retirement Through an Employer-Sponsored Retirement Plan And/Or Outside of Work (%)
Age Started Saving
(Median)27 28 30 28 28 27 26 27 27 26
Women Men

Women Men
■ 2017 (N=3,917)
■ 2016 (N=2,315)
■ 2017 (N=2,432)
■ 2016 (N=1,837)
NET – Self-Funded Savings
401(k) / 403(b) Accounts / IRAs
Other savings and investments
Social Security
Working
Company-funded pension plan
Home equity
Inheritance
Other
84
74
52
74
38
27
17
11
3
78
69
49
71
39
28
18
13
3
80
68
50
74
40
20
11
11
2
77
68
45
70
38
22
9
10
4
Data prior to 2017 shows results among workers in companies with 10+ workers. Data for 2017 shows results among workers in companies with 5+ workers.BASE: ALL QUALIFIED RESPONDENTS Q1145. Which one of the following do you expect to be sources of income to cover your living expenses after you retire? Select all.
Self-funded savings including retirement accounts (e.g., 401(k)s, 403(b)s, IRAs) and other savings and
investments are the most frequently cited source of retirement income expected by both women (80 percent)
and men (84 percent). Social Security is the second most frequently cited source of retirement income that is
expected among both women (74 percent) and men (74 percent). Additionally, about four in ten women (40
percent) and men (38 percent) expect income from “working” to be a source of income during retirement.
Expected Sources of Retirement Income
216
Expected Sources of Income During Retirement (%)

Women Men
■ 2017 (N=3,917)■ 2016 (N=2,315)■ 2015 (N=2,421)■ 2014 (N=2,172)
■ 2013 (N=1,902)
■ 2017 (N=2,432) ■ 2016 (N=1,837)■ 2015 (N=2128)■ 2014 (N=1,971)■ 2013 (N=1,749)
401(k) / 403(b) accounts / IRAs
Social Security
*Working
Other savings and investments
Company-funded pension plan
Inheritance
Home equity
Other
Note: Data prior to 2017 shows results among workers in companies with 10+ workers. Data for 2017 shows results among workers in companies with 5+ workers.*added in 2015BASE: ALL QUALIFIED RESPONDENTSQ1150. Which one of the following do you expect to be your primary source of income to cover your living expenses after you retire?
Both men (40 percent) and women (33 percent) most frequently cite 401(k)s/403(b)s/IRAs to be their
expected primary source of income in retirement. Women (30 percent) are more likely than men (23 percent) to
expect Social Security to be their primary source of income. Additionally, 16 percent of women and 12 percent
of men expect to rely on “working.”
Expected Primary Source of Income in Retirement
217
403639
4344
23232425
23
1215
12
1212121415
88710
9223
13
22121
12255
333635
4337
302729
2731
161414
121111
1616
67
557
11132
11112
13455
N/A N/A
Expected Primary Source of Income in Retirement (%)

Women Men■ 2017 (N=3,917)■ 2016 (N=2,315)■ 2015 (N=2,421)■ 2014 (N=2,172)
■ 2013 (N=1,902)
■ 2017 (N=2,432) ■ 2016 (N=1,837)■ 2015 (N=2,129)■ 2014 (N=1,971)■ 2013 (N=1,749)
Health insurance
401(k) / 403(b) / 457(b) or other employee self-funded plan
Life insurance
Disability insurance
Long-Term Care insurance
Company-funded defined-benefit pension plan
*A company-funded cash balance plan
Critical Illness Insurance
**Financial Wellness Program
**Employee Assistance Program
**Workplace Wellness Program
Cancer Insurance
9695959494
898989
909078
77767371
7778 76
7877737271
7370747374 7977
67555759
666562
6768
62
62
61
605756 6160
9493
959493
8888888990
7472
7068
7274
7578
77727171706572
7072
777667
5652
64
6363
6067
6363
61
58
545348
5855
Data prior to 2017 shows results among workers in companies with 10+ workers. Data for 2017 shows results among workers in companies with 5+ workers.*added in 2014; ** added in 2017
BASE: ALL QUALIFIED RESPONDENTSQ1170. Businesses typically offer a number of different benefits for their workers. For each of the following, please tell us how important that benefit is to you, personally.
The vast majority of women (89 percent) and men (88 percent) believe that a 401(k), 403(b) or similar plan is
“very” or “somewhat” important benefit. This trend has remained consistent over the past five years.
Importance of Retirement Benefits Compared to Other Benefits
218
N/A N/A
Very/Somewhat Important(%) (NET)
N/A N/A
N/A N/A

Although most workers are offered a 401(k) or other similar employee-funded retirement plan in the workplace, men (75 percent)
are more likely to have access compared to women (66 percent) workers. In contrast, few workers (32 percent of men, 19
percent of women) are offered a company-funded defined benefit plan. Of note, 27 percent of women say their employer does not
offer them any retirement benefits compared to just 19 percent of men.
Retirement Benefits Currently Offered
219
Women Men■ 2017 (N=3,917) ■ 2016 (N=2,315)
■ 2015 (N=2,421)■ 2014 (N=2,172)■ 2013 (N=1,902)
■ 2017 (N=2,432) ■ 2016 (N=1,837)
■ 2015 (N=2,129)■ 2014 (N=1,971)■ 2013 (N=1,749)
NET – AN EMPLOYEE-FUNDED PLAN
Employee-funded 401(k) plan
Other employee self-funded plan(e.g., SEP, SIMPLE, Other)
NET – COMPANY-FUNDED PLAN
Company-funded defined benefit pension plan
*Company-funded cash balance plan
Other
None. My employer doesn’t offer anyretirement benefits.
Note: Data prior to 2017 shows results among workers in companies with 10+ workers. Data for 2017 shows results among workers in companies with 5+ workers.*added in 2014BASE: ALL QUALIFIED RESPONDENTSQ1180. Which of the following retirement benefits does your company currently offer to you, personally? Select all.
66
62
7
19
17
7
2
27
68
66
3
19
17
6
62
60
4
21
16
7
66
64
3
20
16
8
61
58
4
14
75
71
8
32
28
12
2
17
73
71
5
32
29
10
69
67
4
27
22
8
71
68
4
28
22
11
74
71
5
21
N/AN/A
N/AN/A
Employer-Sponsored Retirement Benefits Currently Offered (%)
N/AN/A
N/AN/A
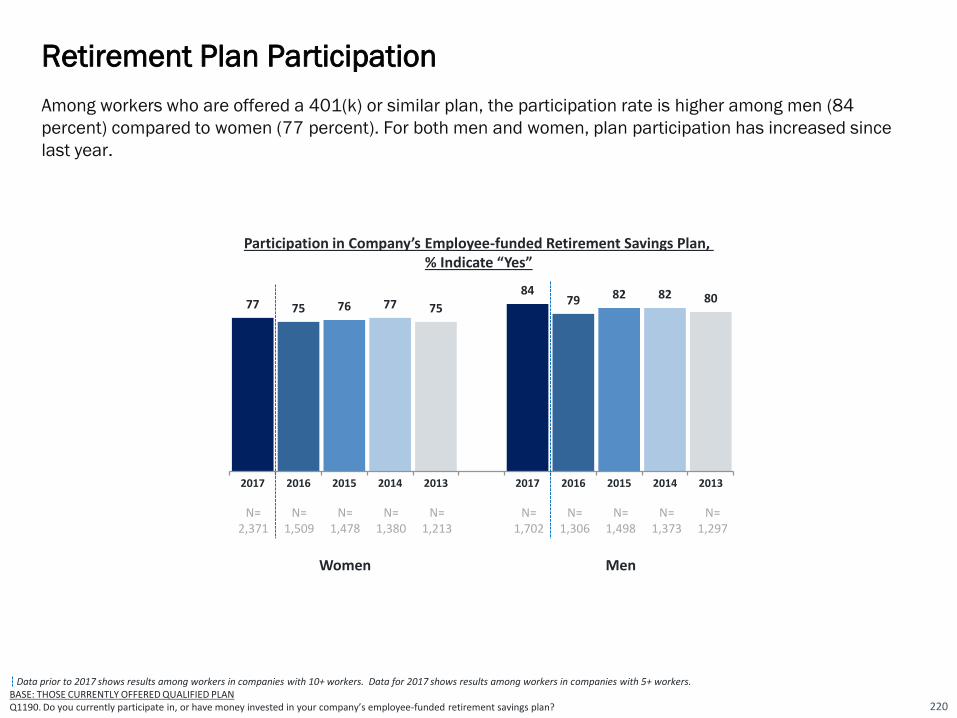
Among workers who are offered a 401(k) or similar plan, the participation rate is higher among men (84
percent) compared to women (77 percent). For both men and women, plan participation has increased since
last year.
Retirement Plan Participation
220
Data prior to 2017 shows results among workers in companies with 10+ workers. Data for 2017 shows results among workers in companies with 5+ workers.BASE: THOSE CURRENTLY OFFERED QUALIFIED PLANQ1190. Do you currently participate in, or have money invested in your company’s employee-funded retirement savings plan?
Participation in Company’s Employee-funded Retirement Savings Plan, % Indicate “Yes”
77 75 76 77 75
8479 82 82 80
2017 2016 2015 2014 2013 2017 2016 2015 2014 2013
N=2,371
N=1,509
N=1,478
N=1,380
N=1,213
N=1,702
N=1,306
N=1,498
N=1,373
N=1,297
Women Men

7%
6%
7% 7%
6%
10% 10%
8%
10%
8%
2017 2016 2015 2014 2013 2017 2016 2015 2014 2013
Data prior to 2017 shows results among workers in companies with 10+ workers. Data for 2017 shows results among workers in companies with 5+ workers.BASE: CURRENTLY PARTICIPATES IN QUALIFIED PLAN Q601. What percentage of your salary are you saving for retirement through your company-sponsored plan this year?
Among workers who participate in 401(k) or similar plan, men contribute 10 percent (median) of their annual
pay, whereas women contribute 7 percent (median). Over the past five years, the median contribution rate has
been consistently higher among men than women.
Retirement Plan Contribution Rate
221
Mean 11.6 9.7 10.1 10.8 9.3 14 11.9 10.7 11.4 9.8N=1,736 N=1,102 N=1,100 N=1,059 N=929 N=1,386 N=1,049 N=1,190 N=1,108 N=1,039
Women Men
Contribution Rate, Median %
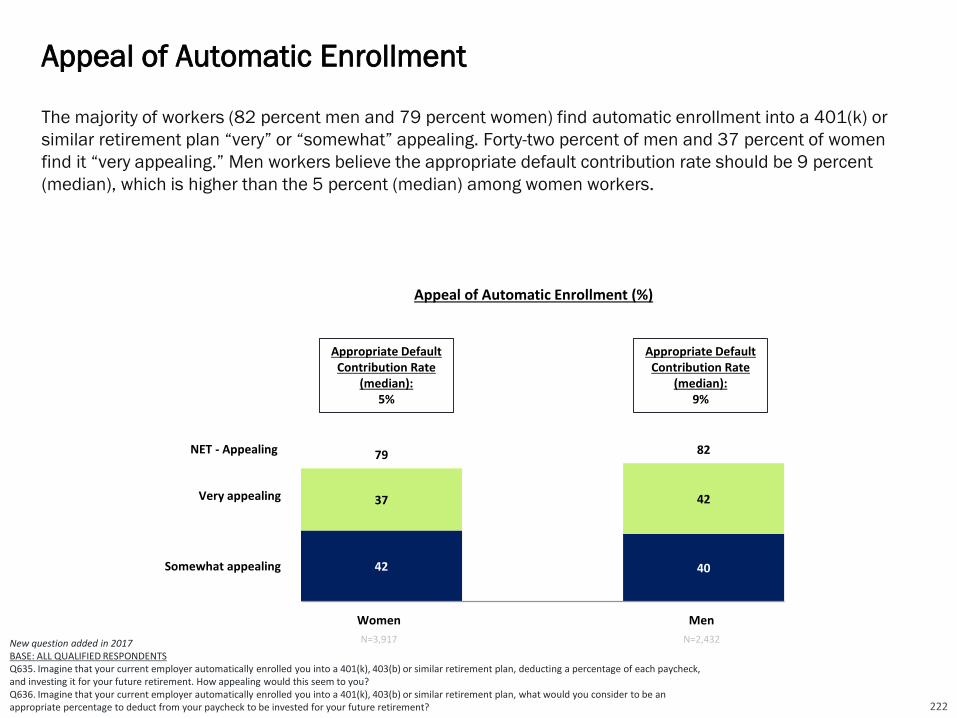
42 40
37 42
79 82
The majority of workers (82 percent men and 79 percent women) find automatic enrollment into a 401(k) or
similar retirement plan “very” or “somewhat” appealing. Forty-two percent of men and 37 percent of women
find it “very appealing.” Men workers believe the appropriate default contribution rate should be 9 percent
(median), which is higher than the 5 percent (median) among women workers.
Appeal of Automatic Enrollment
222
New question added in 2017BASE: ALL QUALIFIED RESPONDENTS Q635. Imagine that your current employer automatically enrolled you into a 401(k), 403(b) or similar retirement plan, deducting a percentage of each paycheck, and investing it for your future retirement. How appealing would this seem to you?Q636. Imagine that your current employer automatically enrolled you into a 401(k), 403(b) or similar retirement plan, what would you consider to be an appropriate percentage to deduct from your paycheck to be invested for your future retirement?
Appeal of Automatic Enrollment (%)
Appropriate Default Contribution Rate
(median):5%
Very appealing
Somewhat appealing
NET - Appealing
Women
N=3,917
Men
N=2,432
Appropriate Default Contribution Rate
(median):9%

Likelihood of Using Automatic Escalation
The majority of both women (73 percent) and men (77 percent) workers say they are “very” or “somewhat”
likely to use a feature that automatically increases contribution rate by 1% each year until they choose to
discontinue the increase. Twenty-nine percent of women and 33 percent of men are “very likely” to use the
feature.
New question added in 2017BASE: ALL QUALIFIED RESPONDENTS Q702. How likely would you be to use a feature in a 401(k) or similar plan where your employer would automatically increase your contribution rate (as a percentage of your salary) to the plan by 1% each year, until you choose to discontinue this increase?
MenN=2,432
33
44
14
9
NET – Likely:77%
Very likely Somewhat likely Not too likely Not at all likely
Likelihood of Using a Feature That Automatically Increases Contribution by 1% Each Year, Until You Choose to Discontinue (%)
29
44
17
10
NET – Likely:73%
WomenN=3,917
223

“Professionally managed” accounts are a managed account service, strategic allocation funds, and/or target
date funds. The majority of plan participants of both genders use some form of professionally managed offering
in their 401(k) or similar plans: 54 percent of women and 63 percent of men. Men (47 percent) are more likely
than women (39 percent) to set their own asset allocation percentages among the available funds. More
women (15 percent) than men (7 percent) are not sure about their current approach to investing in their
employer-sponsored plan.
Use of Professionally Managed Offerings
224
Data prior to 2017 shows results among workers in companies with 10+ workers. Data for 2017 shows results among workers in companies with 5+ workers.BASE: PARTICIPATING IN QUALIFIED PLANQ1466. What is your current approach to investing in your employer-sponsored retirement plan? Select all.
Women■ 2017 (N=1,739)■ 2016 (N=1,104)
■ 2015 (N=1,104)■ 2014 (N=1,063)
Men■ 2017 (N=1,389)■ 2016 (N=1,051)
■ 2015 (N=1,191)■ 2014 (N=1,109)
NET – Professionally Managed
I invest in an account (or service) that is managed by a professional investment advisor and I do not have to make investment or allocation decisions
I invest in a strategic allocation fund that is designed to address my specific risk tolerance profile
I invest in a target date fund that is designed to change allocation percentages as I approach my target retirement year
I set my own asset allocation percentages among the available funds
Not sure
Investments in Employer-Sponsored Retirement Plan (%)
54
28
16
17
39
15
57
28
19
19
34
15
51
24
18
18
35
22
50
23
23
19
43
16
63
28
28
25
47
7
62
27
25
26
46
8
51
22
22
20
50
11
57
25
24
22
47
9

Data prior to 2017 shows results among workers in companies with 10+ workers. Data for 2017 shows results among workers in companies with 5+ workers.BASE: INVESTING FOR RETIREMENTQ770. How is your retirement savings invested?
Among those investing for retirement, Men (43 percent) and women (36 percent) most frequently say that their
retirement savings are invested in a relatively equal mix of stocks and investments such as bonds, money
market funds and cash. A concerning 32 percent of women say that they are “not sure” how their savings are
invested, compared to 13 percent of men.
Asset Allocation of Retirement Investments
225
32 32 29 25 25
13 14 14 16 14
16 13 1615 13
26 24 26 23 26
36 38 3944
42 43 44 43 45 45
16 17 16 16 20 18 18 17 16 15
2017 2016 2015 2014 2013 2017 2016 2015 2014 2013
Mostly in bonds, moneymarket funds, cash and otherstable investments
Relatively equal mix of stocksand investments such asbonds, money market fundsand cashMostly stocks, with little or nomoney in investments such asbonds, money mkt funds, cash
Not sure
N=2,372 N=1,472 N=1,479 N=1,367 N=1,260 N=2,291 N=1,652 N=1,919 N=1,763 N=1,471
Small Companies Large Companies
How Retirement Savings Are Invested (%)

“Leakage” from retirement plans in the form of loans and withdrawals can severely inhibit the growth of
participants’ long-term retirement savings. About one in three women (32 percent) and men (34 percent)
have taken some form of loan, early withdrawal, and/or hardship withdrawal from a 401(k) or similar plan.
Retirement Plan Leakage: Loans and Withdrawals
226
Data prior to 2017 shows results among workers in companies with 10+ workers. Data for 2017 shows results among workers in companies with 5+ workers.BASE: All Qualified RespondentsQ754. Have you ever taken any form of loan or early withdrawal from a qualified retirement account such as a 401(k) or similar plan or IRA? Select all.
Women■ 2017 (N=2,371)
■ 2016 (N=1,509)
Men■ 2017 (N=1,702)
■ 2016 (N=1,306)
NET - Have Taken a Loan, Early Withdrawal, and/or Hardship Withdrawal From 401(k) or Similar Plan or IRA
Yes, I have taken a loan from a 401(k) or similar plan and am paying it back
Yes, I have taken a hardship withdrawal and incurred taxes and penalties
Yes, I have taken an early withdrawal and cashed out a portion or all of a 401(k) or similar plan balance after my separation of employment from a prior employer and incurred taxes and penalties
Yes, I have taken a loan from a 401(k) or similar plan but was unable to pay it back so it became an early withdrawal and incurred taxes and penalties
Yes, I have taken an early withdrawal and cashed out a portion or all of an IRA and incurred taxes and penalties
No, I have never taken a loan or early withdrawal from a 401(k) or similar plan or IRA
Not sure
31
17
8
8
8
4
66
3
29
16
6
8
7
5
67
5
Have you ever taken any form of loan or early withdrawal from a qualified retirement account such as a 401(k) or similar plan or IRA? (%)
27
14
6
6
4
5
69
4
22
11
4
5
3
3
74
4
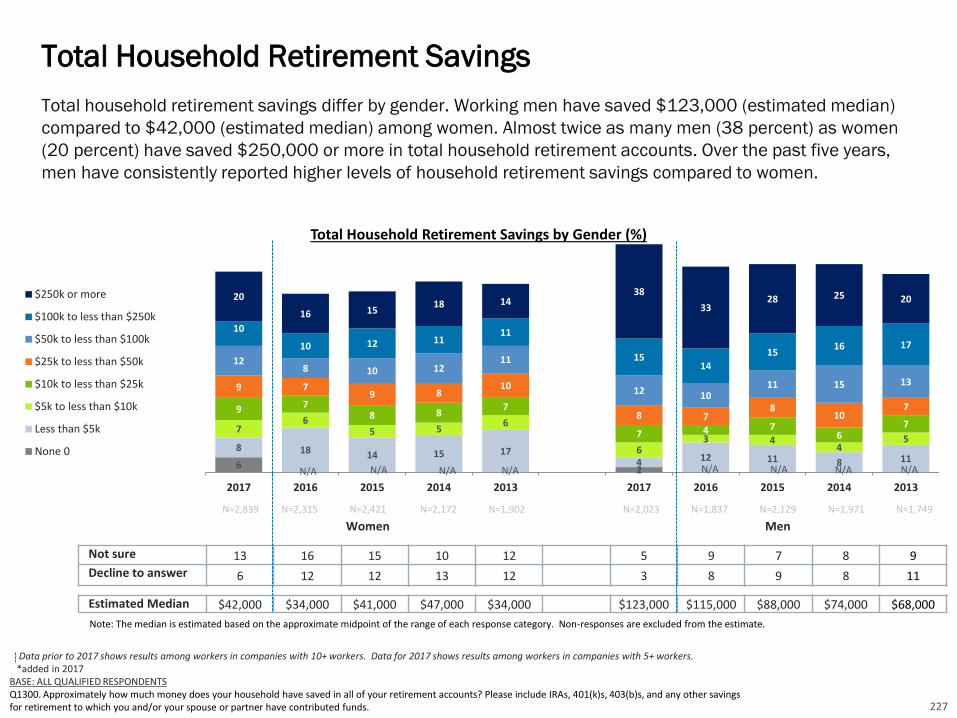
6 2
8 18 14 15 174 12 11 8 11
76
5 56
63 4
45
9 78 8
7
7 4 76
7
9 79 8
10
8 78
107
128 10 12
11
12 1011 15 13
10
10 12 1111
1514
1516 17
20
16 1518 14
38
3328 25 20
2017 2016 2015 2014 2013 2017 2016 2015 2014 2013
$250k or more
$100k to less than $250k
$50k to less than $100k
$25k to less than $50k
$10k to less than $25k
$5k to less than $10k
Less than $5k
None 0
Total household retirement savings differ by gender. Working men have saved $123,000 (estimated median)
compared to $42,000 (estimated median) among women. Almost twice as many men (38 percent) as women
(20 percent) have saved $250,000 or more in total household retirement accounts. Over the past five years,
men have consistently reported higher levels of household retirement savings compared to women.
Total Household Retirement Savings
227
Data prior to 2017 shows results among workers in companies with 10+ workers. Data for 2017 shows results among workers in companies with 5+ workers.*added in 2017
BASE: ALL QUALIFIED RESPONDENTSQ1300. Approximately how much money does your household have saved in all of your retirement accounts? Please include IRAs, 401(k)s, 403(b)s, and any other savings for retirement to which you and/or your spouse or partner have contributed funds.
Not sure 13 16 15 10 12 5 9 7 8 9
Decline to answer 6 12 12 13 12 3 8 9 8 11
Estimated Median $42,000 $34,000 $41,000 $47,000 $34,000 $123,000 $115,000 $88,000 $74,000 $68,000
Note: The median is estimated based on the approximate midpoint of the range of each response category. Non-responses are excluded from the estimate.
Total Household Retirement Savings by Gender (%)
N=2,839 N=2,315 N=2,421 N=2,172 N=1,902 N=2,023 N=1,837 N=2,129 N=1,971 N=1,749
Women Men
N/A N/A N/A N/A N/A N/A N/A N/A
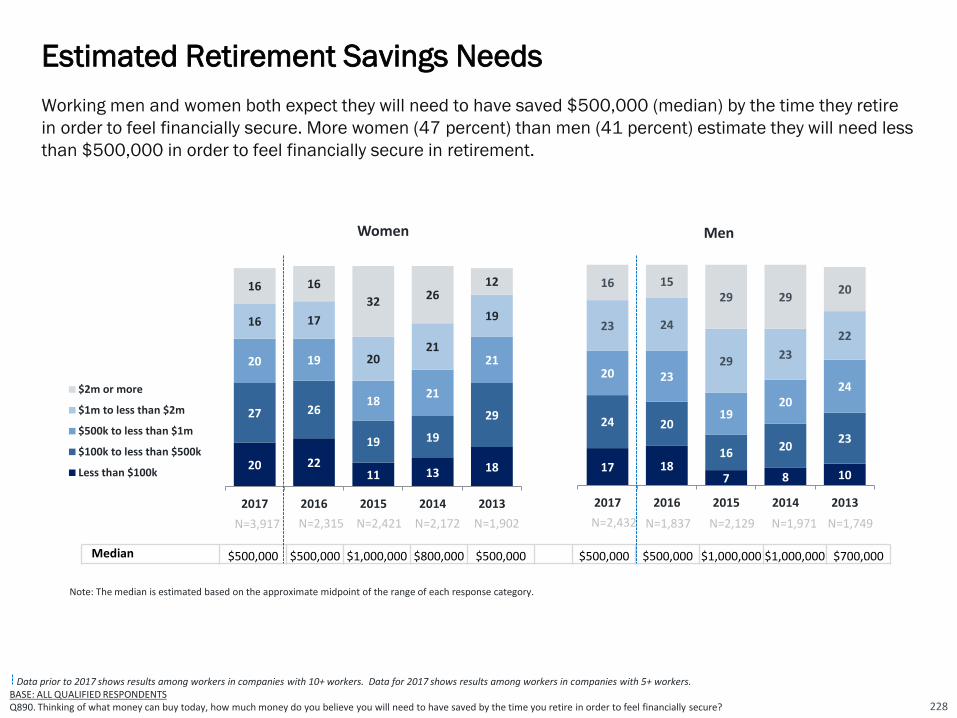
Working men and women both expect they will need to have saved $500,000 (median) by the time they retire
in order to feel financially secure. More women (47 percent) than men (41 percent) estimate they will need less
than $500,000 in order to feel financially secure in retirement.
Estimated Retirement Savings Needs
228
20 2211 13 18
27 26
19 19
29
20 19
1821
21
16 17
2021
19
16 16
3226
12
2017 2016 2015 2014 2013
$2m or more
$1m to less than $2m
$500k to less than $1m
$100k to less than $500k
Less than $100k
Median $500,000 $500,000 $1,000,000 $800,000 $500,000 $500,000 $500,000 $1,000,000 $1,000,000 $700,000
Note: The median is estimated based on the approximate midpoint of the range of each response category.
Women
Data prior to 2017 shows results among workers in companies with 10+ workers. Data for 2017 shows results among workers in companies with 5+ workers.BASE: ALL QUALIFIED RESPONDENTSQ890. Thinking of what money can buy today, how much money do you believe you will need to have saved by the time you retire in order to feel financially secure?
Men
17 187 8 10
24 20
1620
23
20 23
1920
24
23 24
2923
22
16 1529 29
20
2017 2016 2015 2014 2013
N=2,421 N=2,172 N=1,902 N=2,129 N=1,971 N=1,749N=2,315 N=1,837N=3,917 N=2,432

Women Men
■ 2017 (N=3,833)
■ 2016 (N=2,243)
■ 2015 (N=2,388)■ 2014 (N=2,131)■ 2013 (N=1,881)
■ 2017 (N=2,406)
■ 2016 (N=1,805)
■ 2015 (N=2,097)■ 2014 (N=1,933)■ 2013 (N=1,729)
Guessed
Estimated based on current living expenses
*Used a retirement calculator
Expected earnings on investments
Read/heard that is how much is needed
Amount given to me by financial advisor
Completed a worksheet
Other
Among those who provided an estimate of their retirement savings needs, many arrived at that amount by
“guessing.” Women (55 percent) more likely than men (39 percent) to say that they “guessed.” Men (10 percent)
are twice as likely to have used a retirement calculator as women (5 percent) to estimate their retirement savings
needs.
Note: Data prior to 2017 shows results among workers in companies with 10+ workers. Data for 2017 shows results among workers in companies with 5+ workers.*added in 2014BASE: PROVIDED ESTIMATE OF MONEY NEEDED FOR RETIREMENT Q900. How did you arrive at that number?
Basis for Estimating Retirement Savings Needs
229
55
24
5
3
5
3
2
3
56
21
5
4
4
3
3
4
62
17
5
4
3
3
2
4
57
21
5
3
3
4
3
4
59
21
4
4
2
6
3
39
22
10
10
5
6
6
3
40
25
11
7
5
4
5
3
46
23
9
7
3
4
4
4
43
23
8
7
4
5
5
4
40
29
7
5
3
12
4
N/AN/A

Have a Retirement Strategy (%)
44 41 39 42 4150 52 49 52 50
11 1311
129
21 1916
15 1555 54
5055
50
71 7165 66 65
2017 2016 2015 2014 2013 2017 2016 2015 2014 2013
I have a written plan
I have a plan, but it is not written down
Data prior to 2017 shows results among workers in companies with 10+ workers. Data for 2017 shows results among workers in companies with 5+ workers.BASE: ALL QUALIFIED RESPONDENTSQ1155. Which of the following best describes your retirement strategy?
Men (71 percent) are more likely than women (55 percent) to have some form of a retirement strategy, either
written or unwritten. However, of them, only 11 percent of women have a written retirement strategy compared
to 21 percent of men. Over the past five years, men have been consistently more likely than women to have
some form of retirement strategy.
Retirement Strategy: Written, Unwritten, or None
230
N=3,917 N=2,315 N=2,421 N=2,172 N=1,902 N=2,432 N=1,837 N=2,129 N=1,971 N=1,749
Women Men
Have Plan (NET)

Women Men■ 2017 (N=2,694) ■ 2017 (N=1,562)
■ 2016 (N=1,584) ■ 2016 (N=1,159)
Very confident
Somewhat confident
Not too confident
Not at all confident
I haven’t given much thought to a financial strategy for travel in retirement
12
34
22
12
20
11
40
17
12
20
29
40
14
8
9
24
42
14
8
12
Travel was the top retirement dream for both men and women. However, among those dreaming of travel in
retirement, only 46 percent of women compared to 69 percent of men are confident that their current financial
strategy will allow them to meet their travel goals throughout retirement. Men are more likely than women to be
“very” confident (29 percent and 12 percent, respectively). Additionally, more women (20 percent) than men (9
percent) haven’t given much thought to a financial strategy for travel in retirement.
Confidence that Financial Strategy Will Enable Travel Goals
231
Data prior to 2017 shows results among workers in companies with 10+ workers. Data for 2017 shows results among workers in companies with 5+ workers.BASE: THOSE WHO DREAM OF TRAVELING IN RETIREMENTQ2845. How confident are you that your current financial strategy will allow you to meet your travel goals throughout retirement?
Confidence That Current Financial Strategy Will Meet Retirement Travel Goals (%)
NET-- Confident2017: 69%2016: 66%
NET-- Confident2017: 46%2016: 51%

Data prior to 2017 shows results among workers in companies with 10+ workers. Data for 2017 shows results among workers in companies with 5+ workers.BASE: INVESTING FOR RETIREMENTQ860. Do you use a professional financial advisor to help manage your retirement savings or investments?
33
45
3840
3634
36 3735
37
Significantly more men (45 percent) than women (33 percent) who are investing for retirement use a
professional financial advisor to manage their retirement savings or investments. The use of a professional
financial advisor has increased in men and decreased in women compared to last year.
Professional Financial Advisor Usage
232
2017 2016 2015 2014 2013 2017 2016 2015 2014 2013
N=2,704 N=1,639 N=1,719 N=1,557 N=1,341 N=1,947 N=1,480 N=1,679 N=1,573 N=1,390
Women Men
Use a Professional Financial Advisor % Indicate “Yes”
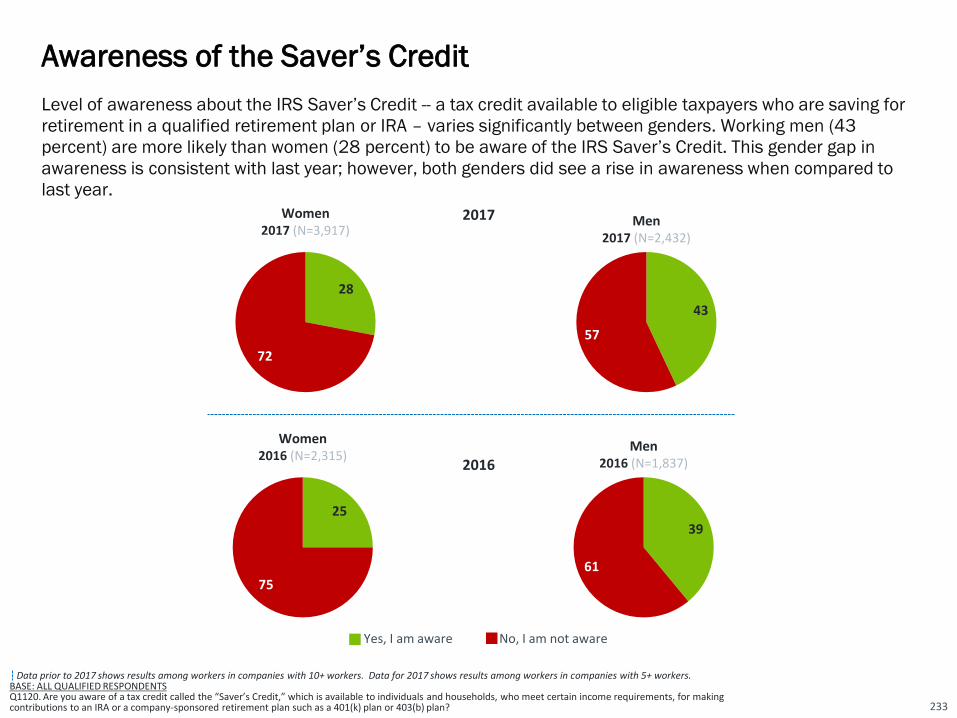
25
75
Level of awareness about the IRS Saver’s Credit -- a tax credit available to eligible taxpayers who are saving for
retirement in a qualified retirement plan or IRA – varies significantly between genders. Working men (43
percent) are more likely than women (28 percent) to be aware of the IRS Saver’s Credit. This gender gap in
awareness is consistent with last year; however, both genders did see a rise in awareness when compared to
last year.
Awareness of the Saver’s Credit
233
Data prior to 2017 shows results among workers in companies with 10+ workers. Data for 2017 shows results among workers in companies with 5+ workers.BASE: ALL QUALIFIED RESPONDENTS Q1120. Are you aware of a tax credit called the “Saver’s Credit,” which is available to individuals and households, who meet certain income requirements, for making contributions to an IRA or a company-sponsored retirement plan such as a 401(k) plan or 403(b) plan?
Women2017 (N=3,917)
Men2017 (N=2,432)
28
72
43
57
Women2016 (N=2,315)
Men2016 (N=1,837)
39
61
2017
2016
Yes, I am aware No, I am not aware

Women workers (40 percent) are less likely than men (49 percent) to be aware of the IRS’ Free File program
that offers federal income tax preparation software for free for eligible tax filers.
Awareness of the IRS’ Free File Program
234
New question added in 2017BASE: ALL QUALIFIED RESPONDENTS Q2821. Are you aware of the IRS’ Free File program that offers federal income tax preparation software for free for eligible tax filers?
40
60
WomenN=3,917
4951
MenN=2,432
No Yes
Awareness of the IRS’ Free File Program (%)

Influences of Household Income on
Retirement Readiness
Detailed Findings
235

Retirement readiness increases with higher levels of workers’ household income (HHI). Lower income workers
have less access to benefits and they are more likely to depend on Social Security as their primary source of
income during retirement. Higher income workers also face long-term retirement risks including potentially
inadequate savings. Workers across levels of HHI share concerns that their generation will have a more difficult
time achieving financial security compared to their parent’s generation.
Forty Indicators of Retirement Readiness
• Confidence in Retiring Comfortably. Retirement confidence varies dramatically by workers’ household
income. Seventy-six percent of workers with HHI of $100k+ are “very” or “somewhat” confident that they
will be able to fully retire with a comfortable lifestyle, compared to 62 percent of workers with HHI of $50k
to $99k and just 46 percent of workers with HHI of less than $50k. Over the past five years, workers with
higher HHI have reported consistently greater levels of retirement confidence.
• Recovery From the Great Recession. Financial recovery from the Great Recession improves with higher
levels of household income. In 2017, workers with HHI of $100k+ are more likely to say they have “fully
recovered” (35 percent), compared to workers with HHI of $50k to $99k (22 percent) and those with HHI
of less than $50k (13 percent). Thirty percent of workers with HHI of less than $50k have “not yet begun to
recover” or feel they may “never recover,” compared to 18 percent of workers with HHI of $50k to $99k
and 12 percent of those with HHI of $100k+.
• Building a Large Enough Nest Egg? Workers’ level of agreement that they are building a large enough
retirement nest egg rises with higher levels of household income. Sixty-nine percent of workers with HHI of
$100k+ either “strongly” or “somewhat” agree that they are building a large enough retirement nest egg,
compared to 52 percent of workers with HHI of $50k to $99k and just 38 percent of workers with a HHI of
less than $50k. Over the past five years, workers with a higher HHI have consistently reported higher levels
of agreement.
Influences of Household Income on Retirement Readiness
236

• Retirement Dreams Include Leisure and Work. “Traveling” is the most frequently cited retirement dream
among workers across levels of household income, including 60 percent of workers with HHI less than
$50k, 67 percent of workers with HHI $50k to $99k, and 80 percent of workers with HHI of $100k or
more. “Spending more time with family and friends” is second most frequently cited retirement dream (51
percent of HHI less than $50k, 57 percent of HHI $50k to $99k, and 61 percent of HHI of $100k or more).
About one-third of workers across income levels also dream of some form of continued work in retirement.
• Retirement Beliefs, Preparations, and Involvement. Across levels of household income, at least three out of
four workers agree that their generation will have a much harder time achieving financial security
compared to their parent’s generation. Workers with HHI of less than $50k (77 percent) and those with
HHI of $50k to $99k (78 percent) are more likely to be concerned that Social Security will not be there for
them when they are ready to retire, compared to workers with HHI of $100k+ (73 percent).
• Expected Retirement Age. Regardless of their level of household income, around half of workers are
expecting to work past age 65 or do not plan to retire. Fifty-eight percent of workers with HHI of less than
$50k are most likely to expect to do so, followed by 55 percent of workers with HHI of $50k to $99k and
47 percent of those earning $100k+.
• Planning to Work in Retirement. More than half of workers plan to continue working in retirement, a finding
which is relatively consistent across levels of household income: 57 percent of those with HHI less than
$50k, 59 percent of those with HHI $50k to $99k and 53 percent of those with HHI $100k or more. Most
workers who are planning to work in retirement say that they will do so on a part-time basis.
• Reasons for Working in Retirement. Among workers planning to retire after age 65 and/or working after
retirement, those with lower household incomes are more likely to do because of financial reasons (87
percent for those with HHI less than $50k, 82 percent for those with HHI $50k to $99k, and 81 percent for
those with HHI $100k or more), while those with higher HHIs are more likely to do for healthy-aging
reasons (68 percent for those with HHI less than $50k, 73 percent for those with HHI $50k to $99k, and
82 percent for those with HHI $100k or more).
Influences of Household Income on Retirement Readiness
237
N/A

• Retirement Transitions: Phased Versus Immediate. Across levels of household income, most workers
envision continuing to work in some capacity into retirement by changing work patterns (e.g., reducing
work hours or working in a different capacity), including 44 percent of workers with HHI of $100k+, 49
percent of those with HHI of $50k to $99k, and 47 percent of those with HHI of less than $50k.
• Phased Retirement and Compensation-Related Expectations. Workers across household incomes have
mixed feelings regarding compensation-related expectations of a phased retirement. As HHI increases,
workers are more likely to expect to be paid the market rate for the duties involved, even if it means a
reduction in their current level of pay or to expect their job title to change if they were to take on a new role
with fewer responsibilities.
• Perceptions of Older Workers. Both positive and negative perceptions of older workers increase with higher
levels of household income. Eighty-six percent of workers with HHI of $100k+ more frequently cite positive
perceptions while 60 percent have negative perceptions. For workers with an HHI of $50k to $99K, 83
percent hold positive perceptions while 54 percent hold negative ones. Finally, for workers with an HHI of
less than $50k, 81 percent view older workers positively compared with 49 percent who view them
negatively.
• Age That Workers Consider a Person to Be “Old.” Workers across household income levels say age 70
(median) is the age when a person is considered to be “old.” However, many workers say that it depends
on the person (39 percent of those with an HHI of less than $50k, 42 percent of those with $50k to $99k,
and 37 percent of those with $100k+).
• Age That Workers Consider a Person to Be “Too Old” to Work. Regardless of household income levels,
workers have similar thoughts on the age a person is considered to be “too old” to work. More than half of
workers say that it depends on the person (52 percent of those with HHI of less than $50k, 53 percent of
those with HHI of $50k to $99k, and 55 percent of those with HHI of $100k+). For those who provided an
age, the median age for all three HHI groups is 75.
Influences of Household Income on Retirement Readiness
238

• Level of Concern About Health in Older Age. Workers with household income less than $100,000 are more
likely to say they are “very” or “somewhat” concerned about their health in older age than those with HHI of
$100k+. Seventy-four percent of workers with HHI less than $50k and 75 percent of workers with HHI of
$50k to $99k say they are concerned, compared to 70 percent of those with HHI of $100k or more.
• Engagement in Health-Related Activities on a Consistent Basis. Workers with higher levels of household
income are more likely to engage in health-related activities such as eating healthfully, exercising regularly,
and seeking medical attention when needed. Only 22 percent of workers with HHI less than $50k and 25
percent with HHI $50k to $99k are considering long term health when making lifestyle decisions. Workers
with lower levels of HHI (7 percent of those with less than $50,000) are more likely to be engaging in no
health-related activities on a consistent basis (compared to 4 percent of those with HHI of $50k to 99k
and 2 percent of those with HHI 100k+).
• Planning to Live to Age ... Workers across levels of household income share similar expectations regarding
the age they are planning to live to, each with a median age of 90. More than one in eight workers are
planning to become centenarians, including 15 percent of those with HHI of $100k+, 13 percent with HHI
of $50k to $99k and 16 percent with HHI of less than $50k. Many are not sure of the age they are
planning to live to including 42 percent with HHI less than $50k, 44 percent HHI $50k to $99,999k, 35
percent HHI $100k+.
• Current Financial Priorities. Workers’ financial priorities differ by levels of household income. Workers with
HHI of $100k+ (72 percent) most frequently cite “saving for retirement” as a financial priority right now
while those with HHI $50k to $99k (69 percent) and HHI of less than $50k (62 percent) most frequently
cite “paying off debt” (NET).
• Greatest Financial Priority Right Now. Workers with HHIs of less than $50k (34 percent) most frequently
cite “just getting by to cover basic living expenses” as their greatest financial priority, while those with HHI
$50k to $99k (31 percent) and those with HHI of $100k+ (32 percent) cite “paying off debt”(NET).
Unsurprisingly the percentage of those workers who deemed saving for retirement as their greatest priority
increased with higher levels of HHI.
Influences of Household Income on Retirement Readiness
239
• Types of Household Debt. The most common type of household debt held across all levels of household
incomes is credit card debt, with 56 percent with HHI less than $50k, 63 percent with HHI $50k to $99k,
and 60 percent with HHI of $100k+ having this type of debt. The biggest difference in debt type is found in
mortgages – only 23 percent of those with HHI of less than $50k have mortgages compared to 45 percent
of those with HHI of $50K to $99k and 57 percent of those with HHI of $100k+.
• Estimated Emergency Savings. Workers across levels of household income lack emergency savings that
could help cover the cost of a major financial setback (e.g., unemployment, medical bills, home repairs,
auto repairs, other). Workers with a HHI of less than $50k have saved a concerning $0 (median) and 37
percent have saved less than $1,000 for such emergencies. Workers with a HHI of $50k to $99k have
saved $5,000 (median) and 20 percent have saved less than $1,000. Workers with HHIs of $100k or
more have saved $14,000 (median) and 11 percent have saved less than $1,000 for such emergencies.
• Saving for Retirement / Age Started Saving. The majority of workers are saving for retirement through an
employer-sponsored retirement plan and/or outside of work; however, the proportion of savers varies
dramatically by household income. Ninety percent of workers with HHI of $100k+ are saving for retirement,
and 81 percent of workers with HHI of $50k to $99k, compared to 59 percent of those with HHI of less
than $50k. Workers across levels of HHI started saving for retirement in their mid- to late-twenties.
• Expected Sources of Retirement Income. Across levels of household income, the majority of workers expect
retirement income from self-funded savings including retirement accounts (e.g., 401(k)s, 403(b)s, IRAs)
and other savings and investments: 92 percent of workers with HHI of $100k+, 86 percent of those with
HHI of $50k to $99k, and 67 percent of those with HHI of less than $50k. Nearly half of workers with HHI
of less than $50k (47 percent) expect income from working, compared to those with HHI of $50k to $99k
(39 percent) and those with HHI of $100k+ (32 percent).
Influences of Household Income on Retirement Readiness
240
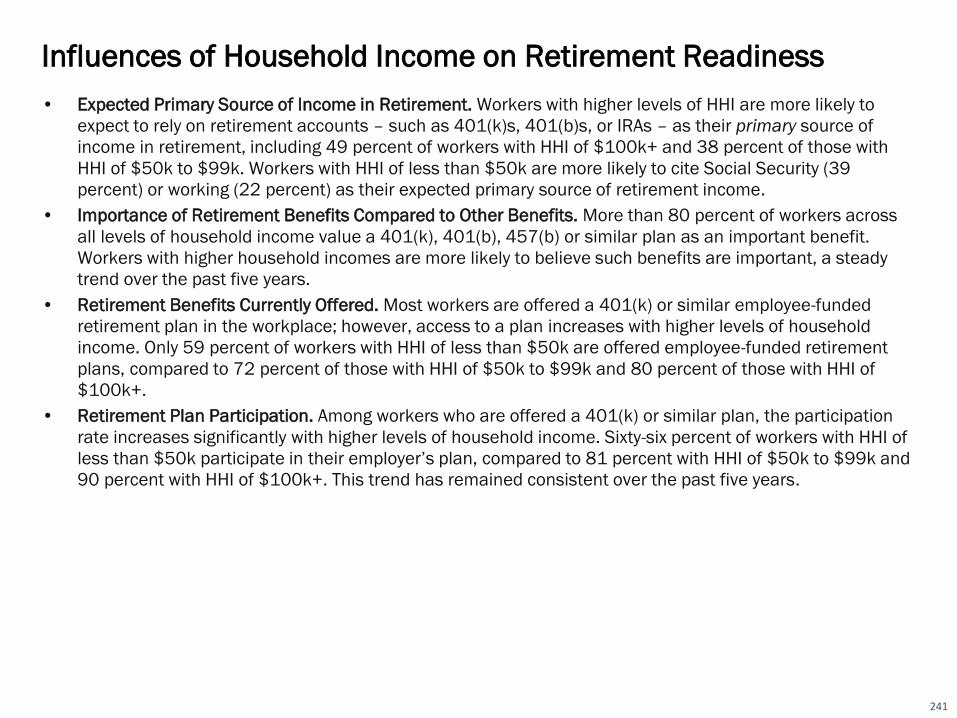
• Expected Primary Source of Income in Retirement. Workers with higher levels of HHI are more likely to
expect to rely on retirement accounts – such as 401(k)s, 401(b)s, or IRAs – as their primary source of
income in retirement, including 49 percent of workers with HHI of $100k+ and 38 percent of those with
HHI of $50k to $99k. Workers with HHI of less than $50k are more likely to cite Social Security (39
percent) or working (22 percent) as their expected primary source of retirement income.
• Importance of Retirement Benefits Compared to Other Benefits. More than 80 percent of workers across
all levels of household income value a 401(k), 401(b), 457(b) or similar plan as an important benefit.
Workers with higher household incomes are more likely to believe such benefits are important, a steady
trend over the past five years.
• Retirement Benefits Currently Offered. Most workers are offered a 401(k) or similar employee-funded
retirement plan in the workplace; however, access to a plan increases with higher levels of household
income. Only 59 percent of workers with HHI of less than $50k are offered employee-funded retirement
plans, compared to 72 percent of those with HHI of $50k to $99k and 80 percent of those with HHI of
$100k+.
• Retirement Plan Participation. Among workers who are offered a 401(k) or similar plan, the participation
rate increases significantly with higher levels of household income. Sixty-six percent of workers with HHI of
less than $50k participate in their employer’s plan, compared to 81 percent with HHI of $50k to $99k and
90 percent with HHI of $100k+. This trend has remained consistent over the past five years.
Influences of Household Income on Retirement Readiness
241

• Retirement Plan Contribution Rate. Among workers who participate in a 401(k) or similar plan, those with
higher household incomes contribute more. Workers with HHI of $100k+ contribute 10 percent (median)
of their annual pay, while those with HHI of $50k to 99k contribute 8 percent (median) and those with HHI
less than $50k contribute 6 percent (median). This trend has been consistent over the past five years.
• Appeal of Automatic Enrollment. Workers with higher levels of household income are more likely to find
automatic enrollment as a plan feature appealing, as 85 percent of those with $100k+ find it “very” or
“somewhat” appealing, compared to 81 percent of those with HHI $50k to $99k and 78 percent of those
with HHI less than $50k. When it comes to the appropriate contribution rate for such a plan, workers with
HHI $100k+ think it should be 9 percent (median) while those with both HHI $50k to $99k and less than
$50k believe the appropriate default contribution rate should be 6 percent (median).
• Likelihood of Using Automatic Escalation. Workers with household income of $50k to $99k (77 percent)
and those with HHI of $100k+ (78 percent) are more likely than those with less than $50k (70 percent) to
say they are “very” or “somewhat” likely to use a feature that automatically increases their contribution by
1 percent each year.
• Use of Professionally Managed Offerings. “Professionally managed” accounts refers to a managed account
service, strategic allocation funds, and/or target date funds. At least four in ten plan participants, across
levels of household income, use some form of professionally managed offering in their 401(k) or similar
plans: 45 percent of workers with HHI of less than $50k, 59 percent of those with HHI of $50k to $99k,
and 67 percent of those with HHI of $100k+. Workers with HHI of $100k+ (47 percent) are somewhat
more likely to set their own asset allocation percentage among the available funds, compared to those with
HHI of less than $50k (42 percent) and those with HHI of $50k to $99k (40 percent).
Influences of Household Income on Retirement Readiness
242

• Asset Allocation of Retirement Investments. Workers across levels of household income who are investing
for retirement, most frequently say that their retirement savings are invested in a relatively equal mix of
stocks and investments such as bonds, money market funds and cash: However, responses are higher
among those with HHI of $100k+ (48 percent), compared to those with HHI of $50k to $99k (39 percent)
and those with HHI of less than $50k (30 percent). Workers with HHI of less than $50k are the most
uncertain as to how their retirement savings are invested.
• Retirement Plan Leakage: Loans and Withdrawals. “Leakage” from retirement plans in the form of loans
and withdrawals can severely inhibit the growth of participants’ long-term retirement savings. About one in
three workers across levels of household income have taken some form of loan, early withdrawal, and/or
hardship withdrawal from a 401(k) or similar plan — 31 percent of workers with HHI of less than $50k, 33
percent of those with HHI of $50k to $99k, and 35 percent of those with HHI of $100k+.
• Total Household Retirement Savings. Workers with a household income of $100k+ have saved $215,000
(estimated median) in total household retirement accounts, compared to $61,000 for those with HHI of
$50k to $99k and just $11,000 for those with HHI of less than $50k (estimated medians). A concerning
24 percent of workers with HHI of less than $50k have less than $5,000 in household retirement savings.
• Estimated Retirement Savings Needs. Workers’ estimated retirement savings needs increase with higher
levels of household income. Workers with HHI of less than $50k believe they need to save $200,000
(median) to feel financially secure in retirement, whereas those with HHI of $100k+ will need $1 million.
Workers with HHI of $50k to $99k have an estimated retirement savings needs of $500,000 (median) this
year.
• Basis for Estimating Retirement Savings Needs. Many workers are guessing their retirement savings
needs. Among those who provided an estimate of their retirement savings needs, workers with a
household income of less than $50k (57 percent) are more likely to have guessed the amount, compared
to those with HHI of $50k to $99k (48 percent) and those with HHI of $100k+ (34 percent). Few workers
across levels of HHI indicate that they have used a retirement calculator to estimate their savings needs.
Influences of Household Income on Retirement Readiness
243

• Retirement Strategy: Written, Unwritten, or None. The likelihood of a worker having a retirement strategy,
either written or unwritten, increases with higher levels of HHI. Seventy-eight percent of workers with HHI of
$100k+ have some form of a retirement strategy, compared to 63 percent of those with HHI of $50k to
$99k and just 49 percent of those with HHI of less than $50k. In terms of having a written strategy,
relatively few workers across HHIs have one. Over the past five years, workers with HHI of less than $100k
have been consistently less likely to have a written plan, compared to those with HHI of $100k+.
• Confidence that Financial Strategy Will Enable Travel Goals. Workers’ confidence that their current
financial strategy will enable them to realize their travel goals increases with higher levels of household
income. Among those who dream of traveling in retirement, 69 percent of workers with HHI of $100k+ are
confident, compared to 59 percent of those with HHI of $50k to $99k and 42 percent of those with HHI of
less than $50k.
• Professional Financial Advisor Usage. Among those investing for retirement, use of a professional financial
advisor increases with higher levels of household income. Forty-nine percent of workers with HHI of
$100K+ use an advisor, compared to 37 percent of those with HHI of $50k to $99k and 29 percent of
those with HHI of less than $50k.
• Awareness of Saver’s Credit. The IRS Saver’s Credit is a tax credit available to eligible taxpayers who are
saving for retirement in a qualified retirement plan or IRA; however, few workers who are potentially eligible
to claim the credit are aware of it. Only 28 percent of workers with HHI of less than $50k are aware of the
Saver’s Credit, compared to 35 percent of those with HHI of $50k to $99k and 45 percent of those with
HHI of $100k+.
• Awareness of the IRS’ Free File Program. Similar proportions of workers across levels of household income
lack awareness of the IRS’ Free File Program: 56 percent of workers with HHI less than $50k, 54 percent
of those with HHI $100k+, and 55 percent of those with HHI $50k to $99k, are unaware of the Free File
Program that offers federal income tax preparation for free to eligible tax filers.
Influences of Household Income on Retirement Readiness
244

3540 36 37 35
46 4843 47 45 48 52 56 59
54
117 11 13
7
16 1413
158
28 2320
19
15
46 47 4750
42
62 6256
61
53
76 75 76 78
69
2017 2016 2015 2014 2013 2017 2016 2015 2014 2013 2017 2016 2015 2014 2013
Very confident Somewhat confident
Data prior to 2017 shows results among workers in companies with 10+ workers. Data for 2017 shows results among workers in companies with 5+ workers.BASE: ALL QUALIFIED RESPONDENTS
Q880. How confident are you that you will be able to fully retire with a lifestyle you consider comfortable?
Retirement confidence varies dramatically by workers’ household income (HHI). Seventy-six percent of workers
with HHI of $100k+ are “very” or “somewhat” confident that they will be able to fully retire with a comfortable
lifestyle, compared to 62 percent of workers with HHI of $50k to $99k and just 46 percent of workers with HHI
of less than $50k. Over the past five years, workers with higher HHI have reported consistently greater levels of
retirement confidence.
Confidence in Retiring Comfortably
245
N=2,508 N=1,352 N=1,450 N=1,427 N=1,302 N=2,351 N=1,611 N=1,786 N=1,566 N=1,324 N=1,241 N=1,005 N=1,042 N=958 N=791
Less than $50,000 $50,000 - $99,999 $100,000 or more
Confidence in Retiring Comfortably
Very/Somewhat Confident (%) (NET)

26
19
14
13
22
35
31
41
39
20
12
7
10
6
5
Less than$50,000
$50,000 -$99,999
$100,000 ormore
NET - Not Impacted or Fully Recovered= 39%
NET - Not Yet Begun or Never Recover = 30%
N=2,508
N=1,241
N=2,351
NET - Not Impacted or Fully Recovered= 41%
NET - Not Yet Begun or Never Recover = 18%
NET - Not Impacted or Fully Recovered= 49%
NET - Not Yet Begun or Never Recover = 12%
Financial recovery from the Great Recession improves with higher levels of household income (HHI). In 2017,
workers with HHI of $100k+ are more likely to say they have “fully recovered” (35 percent), compared to workers
with HHI of $50k to $99k (22 percent) and those with HHI of less than $50k (13 percent). Thirty percent of
workers with HHI of less than $50k have “not yet begun to recover” or feel they may “never recover,” compared
to 18 percent of workers with HHI of $50k to $99k and 12 percent of those with HHI of $100k+.
Recovery From the Great Recession
246
Data prior to 2017 shows results among workers in companies with 10+ workers. Data for 2017 shows results among workers in companies with 5+ workers.BASE: ALL QUALIFIED RESPONDENTS Q2655. How would you describe your financial recovery from the deep recession in recent years, which is commonly referred to as the “Great Recession”?
I have fully recovered I have somewhat recovered I have not yet begun to recover I may never recoverI was not impacted
How would you describe your financial recovery from the Great Recession? (%)
25
18
15
12
18
29
35
43
42
17
13
10
11
8
4
Less than$50,000
$50,000 -$99,999
$100,000 ormore
NET - Not Impacted or Fully Recovered= 37%
NET - Not Yet Begun or Never Recover = 28%
N=1,352
N=1,005
N=1,611
NET - Not Impacted or Fully Recovered= 36%
NET - Not Yet Begun or Never Recover = 21%
NET - Not Impacted or Fully Recovered= 44%
NET - Not Yet Begun or Never Recover = 14%
2017 2016

26 25 24 2819
35 3832
3731
39 42 45 4741
12 11 910
6
17 1416
13
8
30 23 2122
18
38 3633
38
26
52 5248 50
39
6965 66
69
59
2017 2016 2015 2014 2013 2017 2016 2015 2014 2013 2017 2016 2015 2014 2013
Strongly agree Somewhat agree
Data prior to 2017 shows results among workers in companies with 10+ workers. Data for 2017 shows results among workers in companies with 5+ workers.BASE: ALL QUALIFIED RESPONDENTSQ800. How much do you agree or disagree that you are currently building a large enough retirement nest egg?
Workers’ level of agreement that they are building a large enough retirement nest egg rises with higher levels of
household income (HHI). Sixty-nine percent of workers with HHI of $100k+ either “strongly” or “somewhat”
agree that they are building a large enough retirement nest egg, compared to 52 percent of workers with HHI of
$50k to $99k and just 38 percent of workers with a HHI of less than $50k. Over the past five years, workers
with a higher HHI have consistently reported higher levels of agreement.
Building a Large Enough Nest Egg?
247
N=2,508 N=1,352 N=1,450 N=1,427 N=1,302 N=2,351 N=1,611 N=1,786 N=1,566 N=1,324 N=1,241 N=1,005 N=1,042 N=958 N=791
Less than $50,000 $50,000 - $99,999 $100,000 or more
Building a Large Enough Nest Egg
Strongly/Somewhat Agree (%) (NET)

“Traveling” is the most frequently cited retirement dream among workers across levels of household income (HHI), including
60 percent of workers with HHI less than $50k, 67 percent of workers with HHI $50k to $99k, and 80 percent of workers
with HHI of $100k or more. “Spending more time with family and friends” is second most frequently cited retirement dream
(51 percent of HHI less than $50k, 57 percent of HHI $50k to $99k, and 61 percent of HHI of $100k or more). About one-
third of workers across income levels also dream of some form of continued work in retirement.
Retirement Dreams Include Leisure and Work
248
Data prior to 2017 shows results among workers in companies with 10+ workers. Data for 2017 shows results among workers in companies with 5+ workers.BASE: ALL QUALIFIED RESPONDENTS Q1418. How do you dream of spending your retirement? Select all.
How do you dream of spending your retirement? Please select all that apply. (%)
Less than $50,000 $50,000 - $99,999 $100,000 or more
■ 2017 (N=2,508)
■ 2016 (N=1,352)
■ 2017 (N=2,351)
■ 2016 (N=1,611)
■ 2017 (N=1,241)
■ 2016 (N=1,005)
Traveling
Spending more time with family and friends
Pursuing hobbies
Doing volunteer work
Pursuing an encore career (pursuing a new role, work, activity, or career)
Starting a business
Continue working in the same field
Other
None of the above
60
51
44
20
10
14
9
4
3
54
54
46
23
11
14
11
7
5
67
57
52
26
13
12
11
5
2
65
57
49
27
14
12
13
6
4
80
61
53
31
17
14
13
4
1
73
60
51
31
13
10
12
6
2
NET: Working2017: 29%2016: 30%
NET: Working2017: 33%2016: 27%
NET: Working2017: 30%2016: 29%

How Much Do You Agree or Disagree?
Strongly/Somewhat Agree (%) (NET)
Less than $50,000 $50,000 - $99,999 $100,000 or more
■ 2017 (N=2,508) ■ 2016 (N=1,352) ■ 2015 (N=1,450)■ 2014 (N=1,427)■ 2013 (N=1,302)
■ 2017 (N=2,351)■ 2016 (N=1,611) ■ 2015 (N=1,786)■ 2014 (N=1,566)■ 2013 (N=1,324)
■ 2017 (N=1,241)■ 2016 (N=1,005) ■ 2015 (N=1,042)■ 2014 (N=958)■ 2013 (N=791)
**Compared to my parent's generation, people in my generation will have a much harder time in achieving financial security
**Concerned that when I am ready to retire, Social Security will not be there for me
*My current employer is supportive of its employees working past 65
Do not know as much as I should about retirement investing
Like more info and advice from my company on how to reach my goals
Could work until age 65 and still not have enough money saved
Very involved in monitoring and managing my retirement savings
Prefer to rely on outside experts to monitor and manage my plan
Prefer not to think about or concern myself with it until closer to retirement
Note: Data prior to 2017 shows results among workers in companies with 10+ workers. Data for 2017 shows results among workers in companies with 5+ workers.*added in 2016 **added in 2014BASE: ALL QUALIFIED RESPONDENTSQ930. How much do you agree or disagree with each of the following statements regarding retirement investing?
Across levels of household income (HHI), at least three out of four workers agree that their generation will have a
much harder time achieving financial security compared to their parent’s generation. Workers with HHI of less
than $50k (77 percent) and those with HHI of $50k to $99k (78 percent) are more likely to be concerned that
Social Security will not be there for them when they are ready to retire, compared to workers with HHI of $100k+
(73 percent).
Retirement Beliefs, Preparations, and Involvement
249
83
77
65
75
65
74
53
52
47
87
80
71
76
67
74
50
55
48
82
80
76
63
77
50
49
47
75
68
73
59
54
48
73
61
75
50
48
41
80
78
74
69
67
69
65
61
41
83
78
71
69
68
66
66
58
42
82
77
67
62
68
64
54
39
70
64
71
67
58
40
72
63
70
61
50
35
75
73
75
61
66
57
74
59
35
78
75
75
62
65
58
72
61
34
76
71
55
58
53
78
57
32
55
60
55
81
54
28
60
58
63
71
55
27
N/A N/A N/A
N/A N/A N/A
N/A N/A N/A

Data prior to 2017 shows results among workers in companies with 10+ workers. Data for 2017 shows results among workers in companies with 5+ workers.BASE: ALL QUALIFIED RESPONDENTSQ910. At what age do you expect to retire?
Regardless of their level of household income (HHI), around half of workers are expecting to work past age 65
or do not plan to retire. Fifty-eight percent of workers with HHI of less than $50k are most likely to expect to do
so, followed by 55 percent of workers with HHI of $50k to $99k and 47 percent of those earning $100k+.
Expected Retirement Age
250
18 20 17 19 2313 11 14 11 15
9 9 9 9 8
4041
41 3839
42 4347
4644
38 40 43 41 42
2020
20 2521
25 23
21 25 21
23 2223 23 22
22 19 22 18 17 20 2318 18 20
30 29 25 27 28
2017 2016 2015 2014 2013 2017 2016 2015 2014 2013 2017 2016 2015 2014 2013
Before Age 65
At Age 65
After Age 65
Do Not Plan to Retire
N=2,508 N=1,352 N=1,450 N=1,427 N=1,302 N=2,351 N=1,611 N=1,786 N=1,566 N=1,324 N=1,241 N=1,005 N=1,042 N=958 N=791
Less than $50,000 $50,000 - $99,999 $100,000 or more
Age Expecting to Retire (%)

Yes (NET):
4437 38 41 44 45 41 41 40 44 38 35 40 40 45
1317 14 13
15 1412 12 13 8 15
13 9 11 7
21 21 23 21 17 22 26 24 2617
29 34 29 3325
22 25 25 2524 19
21 23 2131
1818 22 16
23
57
More than half of workers plan to continue working in retirement, a finding which is relatively consistent across
levels of household income (HHI): 57 percent of those with HHI less than $50k, 59 percent of those with HHI
$50k to $99k and 53 percent of those with HHI $100k or more. Most workers who are planning to work in
retirement say that they will do so on a part-time basis.
Planning to Work in Retirement
251
Data prior to 2017 shows results among workers in companies with 10+ workers. Data for 2017 shows results among workers in companies with 5+ workers.BASE: ALL QUALIFIED RESPONDENTSQ1525. Do you plan to work after you retire?
Planning to Work in Retirement (%)
Yes, I plan to work full-timeYes, I plan to work part-timeNo, I do not plan to workNot sure
2017 2016 2015 2014 2013 2017 2016 2015 2014 2013 2017 2016 2015 2014 2013
N=2,508 N=1,352 N=1,450 N=1,427 N=1,302 N=2,351 N=1,611 N=1,786 N=1,566 N=1,324 N=1,241 N=1,005 N=1,042 N=958 N=791
Less than $50,000 $50,000 - $99,999 $100,000 or more
54 52 5459 59
53 53 53 52 5348 49 51 52
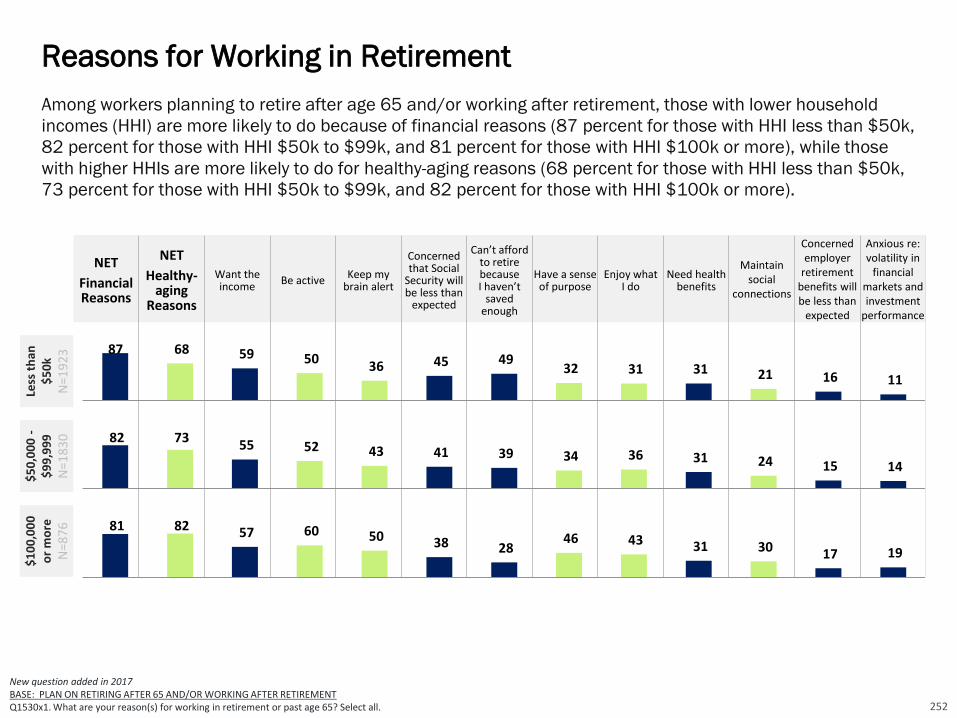
Among workers planning to retire after age 65 and/or working after retirement, those with lower household
incomes (HHI) are more likely to do because of financial reasons (87 percent for those with HHI less than $50k,
82 percent for those with HHI $50k to $99k, and 81 percent for those with HHI $100k or more), while those
with higher HHIs are more likely to do for healthy-aging reasons (68 percent for those with HHI less than $50k,
73 percent for those with HHI $50k to $99k, and 82 percent for those with HHI $100k or more).
Reasons for Working in Retirement
252
NET
Financial Reasons
NET
Healthy-aging
Reasons
Want the income
Be activeKeep my
brain alert
Concerned that Social
Security will be less than
expected
Can’t afford to retire because I haven’t
saved enough
Have a sense of purpose
Enjoy what I do
Need health benefits
Maintain social
connections
Concernedemployer
retirement benefits will be less than
expected
Anxious re: volatility in
financial markets and investment
performance
87 68 59 50 36 45 49
32 31 31 21 16 11
Less
th
an
$5
0k
N=
19
23
82 73 55 52 43 41 39 34 36 31 24 15 14
81 82 57 60 50 38 28 46 43 31 30 17 19
New question added in 2017BASE: PLAN ON RETIRING AFTER 65 AND/OR WORKING AFTER RETIREMENTQ1530x1. What are your reason(s) for working in retirement or past age 65? Select all.
$5
0,0
00
-$
99
,99
9
N=
18
30
$1
00
,00
0
or
mo
re
N=
87
6

Less than $50,000 $50,000 - $99,999 $100,000 or more■2017 (N=2,508)
■2016 (N=1,352)
■2015 (N=1,450)
■2014 (N=1,427)
■2017 (N=2,351)
■2016 (N=1,611)
■2015 (N=1,786)
■2014 (N=1,566)
■2017 (N=1,241)
■2016 (N=1,005)
■2015 (N=1,042)
■2014 (N=958)
Continue working as long as possible in current or similar position until I cannot work anymore
Transition (NET)
Transition into retirement by reducing work hours
Transition into retirement by working in a different capacity
PLAN TO STOP (NET)
Immediately stop working once I reach a specific age
Immediately stop working once I save a specific amount of money
Not sure
Across levels of household income (HHI), most workers envision continuing to work in some capacity into
retirement by changing work patterns (e.g., reducing work hours or working in a different capacity), including 44
percent of workers with HHI of $100k+, 49 percent of those with HHI of $50k to $99k, and 47 percent of those
with HHI of less than $50k.
Retirement Transitions: Phased Versus Immediate
253
Data prior to 2017 shows results among workers in companies with 10+ workers. Data for 2017 shows results among workers in companies with 5+ workers.BASE: ALL QUALIFIED RESPONDENTSQ1545. How do you envision transitioning into retirement?
25
44
27
17
18
11
7
13
28
41
25
16
15
9
6
16
24
35
24
11
17
10
8
23
19
48
32
16
17
9
8
16
20
49
32
17
22
15
7
9
21
43
30
13
23
14
9
13
20
41
24
17
22
16
7
16
18
46
29
18
21
14
8
13
18
47
30
17
29
18
11
6
17
43
28
15
30
19
11
10
17
47
28
19
25
18
7
11
18
42
26
16
28
18
10
12
How do you envision transitioning into retirement? (%)

Phased Retirement and Compensation-Related Expectations
New question added in 2017BASE: RESPONDENTS WHO ENVISION A PHASED TRANSITION INTO RETIREMENTQ1546. In thinking about your vision of transitioning into retirement, to what extent do you agree or disagree with the following statements? 254
Workers across household incomes (HHI) have mixed feelings regarding compensation-related expectations of a
phased retirement. As HHI increases, workers are more likely to expect to be paid the market rate for the duties
involved, even if it means a reduction in their current level of pay or to expect their job title to change if they
were to take on a new role with fewer responsibilities.
In thinking about your vision of transitioning into retirement, to what extent do you agree or disagree with the following statements?
Strongly/Somewhat Agree (%) (NET)
Less than $50,000N=1,120
$50,000 - $99,999N=1,150
$100,000 or moreN=613
If I reduce my work hours at my current employer, I would expect to be paid the same hourly rate for hours worked that I am earning now.
If I were to take on a new role with fewer responsibilities at my current employer, I would expect my job title to change.
If I were to take on a new role with fewer responsibilities at my current employer, I would expect to be paid the market rate for the duties involved, even if it means a reduction in my current level of pay.
If I were to shift from full-time to part-time at my current employer, I would expect to receive the same employee benefits that I have now.
81
72
63
63
79
77
71
61
79
84
80
58

Less than $50,000N=2,508
$50,000 - $99,999N=2,351
$100,000 or moreN=1,241
NET – Positive perceptions
Bring more knowledge, wisdom, and life experience
Are more responsible, reliable, and dependable
Are a valuable resource for training and mentoring
Are an important source of institutional knowledge
Are more adept at problem-solving
Are better at getting along with others in a team environment
NET – Negative perceptions
Have higher healthcare costs
Command higher wages and salaries
Are less open to learning and new ideas
Have higher disability costs
Have outdated skill sets
Are less productive
Other
None
Perceptions of Older Workers
255
New question added in 2017BASE: ALL QUALIFIED RESPONDENTS Q1528. What are your perceptions of workers age 50 and older compared to younger workers in today’s workforce? Select all.
Both positive and negative perceptions of older workers increase with higher levels of household income (HHI).
Eighty-six percent of workers with HHI of $100k+ more frequently cite positive perceptions while 60 percent
have negative perceptions. For workers with an HHI of $50k to $99K, 83 percent hold positive perceptions
while 54 percent hold negative ones. Finally, for workers with an HHI of less than $50k, 81 percent view older
workers positively compared with 49 percent who view them negatively.
83
61
55
48
40
34
31
54
28
18
19
15
13
11
1
8
81
58
54
46
35
31
29
49
25
13
16
12
12
9
1
9
86
65
61
55
49
37
33
60
32
28
22
15
14
9
1
6
Perceptions of workers age 50+ compared to younger workers in today’s workforce? (%)

Age That Workers Consider a Person to Be “Old”
256
13 15 17
94
1
39
2
1114 15
93 1
42
58
1522
12
3<1
37
3
<60 60-69 70-79 80-89 90-99 100+ It depends on theperson
Not Sure
Age When Person is Considered “Old” (%)
Workers across household income (HHI) levels say age 70 (median) is the age when a person is considered to
be “old.” However, many workers say that it depends on the person (39 percent of those with an HHI of less
than $50k, 42 percent of those with $50k to $99k, and 37 percent of those with $100k+).
Median Age
Less than $50,000 (N=2,508) Age 70
$50,000 - $99,999 (N=2,351) Age 70
$100,000 or more (N=1,241) Age 70
New question added in 2017BASE: ALL QUALIFIED RESPONDENTS Q1526. At what age do you consider a person to be “old”?
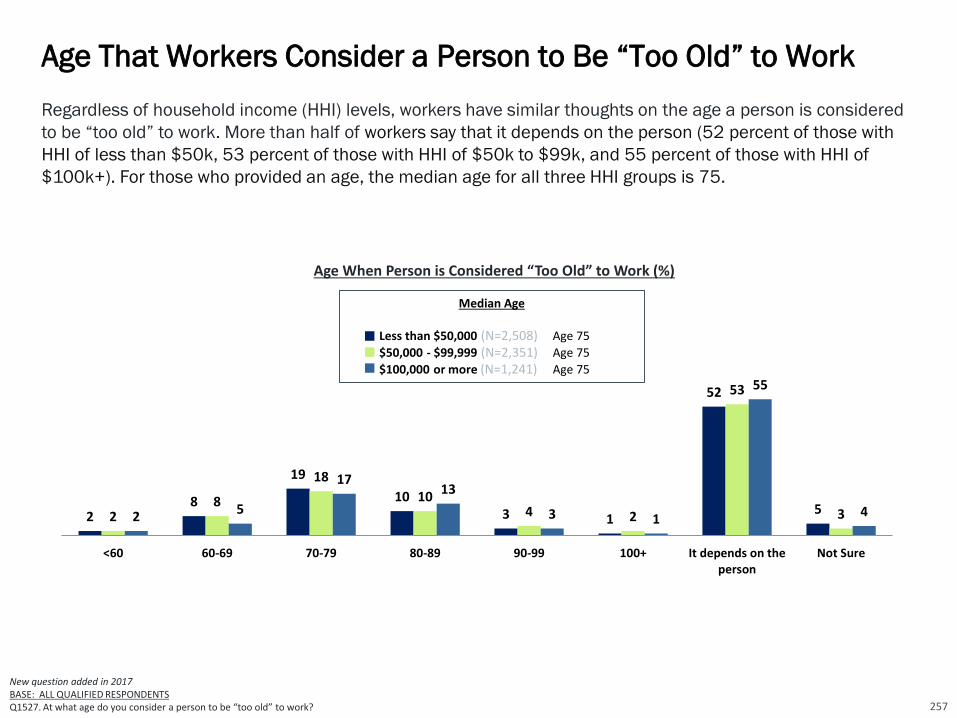
Age That Workers Consider a Person to Be “Too Old” to Work
257
28
19
103 1
52
52
8
18
104 2
53
325
1713
3 1
55
4
<60 60-69 70-79 80-89 90-99 100+ It depends on theperson
Not Sure
Age When Person is Considered “Too Old” to Work (%)
Median Age
Less than $50,000 (N=2,508) Age 75
$50,000 - $99,999 (N=2,351) Age 75
$100,000 or more (N=1,241) Age 75
New question added in 2017BASE: ALL QUALIFIED RESPONDENTS Q1527. At what age do you consider a person to be “too old” to work?
Regardless of household income (HHI) levels, workers have similar thoughts on the age a person is considered
to be “too old” to work. More than half of workers say that it depends on the person (52 percent of those with
HHI of less than $50k, 53 percent of those with HHI of $50k to $99k, and 55 percent of those with HHI of
$100k+). For those who provided an age, the median age for all three HHI groups is 75.

Level of Concern About Health in Older Age
Workers with household income (HHI) less than $100,000 are more likely to say they are “very” or “somewhat”
concerned about their health in older age than those with HHI of $100k+. Seventy-four percent of workers with
HHI less than $50k and 75 percent of workers with HHI of $50k to $99k say they are concerned, compared to
70 percent of those with HHI of $100k or more.
New question added in 2017BASE: ALL QUALIFIED RESPONDENTSQ1445X1. How concerned are you about your health in older age?
Less than $50,000(N=2,508)
$50,000 to $99,999(N=2,351)
$100,000 or more(N=1,241)
25
49
20
622
53
21
4
23
47
26
4
NET – Concerned:74%
Very concerned Somewhat concerned Not too concerned Not at all concerned
Concerned About Health in Older Age (%)
NET – Concerned:75%
NET – Concerned:70%
258

Engagement in Health-Related Activities on a Consistent Basis
Workers with higher levels of household income (HHI) are more likely to engage in health-related activities such as eating
healthfully, exercising regularly, and seeking medical attention when needed. Only 22 percent of workers with HHI less than $50k
and 25 percent with HHI $50k to $99k are considering long term health when making lifestyle decisions. Workers with lower
levels of HHI (7 percent of those with less than $50,000) are more likely to be engaging in no health-related activities on a
consistent basis (compared to 4 percent of those with HHI of $50k to 99k and 2 percent of those with HHI 100k+).
New question added in 2017
BASE: ALL QUALIFIED RESPONDENTS
Q1446. Which of the following health-related activities are you doing on a consistent basis? Select all.
Engaging in Health-Related Activities on a Consistent Basis (%)
Less than $50,000N=2,508
$50,000 - $99,999N=2,351
$100,000 or moreN=1,241
Eating healthfully
Exercising regularly
Maintaining a positive outlook
Seeking medical attention when needed
Avoiding harmful substances (e.g., cigarettes, alcohol, illicit drugs, etc.)
Getting plenty of rest
Getting routine physicals and recommended health screenings
Managing stress
Considering long-term health when making lifestyle decisions
Practicing mindfulness and meditation
Other
Nothing
46
45
48
45
44
46
38
42
22
18
1
7
60
53
52
53
49
49
47
43
25
20
1
4
60
63
58
59
54
53
59
48
30
23
1
2
259

Workers across levels of household income (HHI) share similar expectations regarding the age they are
planning to live to, each with a median age of 90. More than one in eight workers are planning to become
centenarians, including 15 percent of those with HHI of $100k+, 13 percent with HHI of $50k to $99k and 16
percent with HHI of less than $50k. Many are not sure to what age they plan to live – 42 percent HHI less than
$50k, 44 percent HHI $50k to $99,999k, and 35 percent HHI $100k+.
Planning to Live to Age ...
260
Data prior to 2017 shows results among workers in companies with 10+ workers. Data for 2017 shows results among workers in companies with 5+ workers.BASE: ALL QUALIFIED RESPONDENTS Q2850. What age are you planning to live to?
2 6347
1015
2315
1716
21
2017 2016
N=2,508 N=1,352Not sure 42 19Median Age 90 Age 87
N=2,351 N=1,611Not sure 44 15Median Age 90 Age 85
N=1,241 N=1,005Not sure 35 12Median Age 90 Age 88
Less than $50,000 $50,000 - $99,999 $100,000 or more
What age are you planning to live to? (%)
Age 100+
Age 90-99
Age 80-89
Age 70-79
Age 60-69
Age <60
1 4235
1218
3017
21
13
15
2017 2016
2 41268
19
32
22
2915
13
2017 2016

Workers’ financial priorities differ by levels of household income (HHI). Workers with HHI of $100k+ (72
percent) most frequently cite “saving for retirement” as a financial priority right now while those with HHI $50k
to $99k (69 percent) and HHI of less than $50k (62 percent) most frequently cite “paying off debt” (NET).
Current Financial Priorities
261BASE: ALL QUALIFIED RESPONDENTSQ2639. Which of the following are your financial priorities right now? Select all.
Current Financial Priorities (%)
Less than $50,000 $50,000 - $99,999 $100,000 or more
■ 2017 (N=2,508) ■ 2017 (N=2,351) ■ 2017 (N=1,241)
NET – Paying off debt
Paying off credit card debt
Paying off mortgage
Paying off other consumer debt
Paying off student loans
Building savings
Saving for retirement
Just getting by to cover basic living expenses
Supporting children
Paying healthcare expenses
Creating an inheritance or financial legacy
Supporting parents
Other
62
43
19
16
16
50
38
55
28
24
6
9
5
67
40
42
18
18
63
72
18
32
23
15
12
3
69
48
35
17
15
61
59
32
32
28
12
10
4

BASE: ALL QUALIFIED RESPONDENTSQ2640. Which one of the following is your greatest financial priority right now?
Workers with HHIs of less than $50k (34 percent) most frequently cite “just getting by to cover basic living
expenses” as their greatest financial priority, while those with HHI $50k to $99k (31 percent) and those with
HHI of $100k+ (32 percent) cite “paying off debt”(NET). Unsurprisingly the percentage of those workers who
deemed saving for retirement their greatest priority increased with higher levels of HHI.
Greatest Financial Priority Right Now
262
Less than $50,000 $50,000 - $99,999 $100,000 or more
■ 2017 (N=2,508) ■ 2017 (N=2,351) ■ 2017 (N=1,241)
NET – Paying off debt
Paying off credit card debt
Paying off mortgage
Paying off student loans
Paying off other consumer debt
Saving for retirement
Just getting by to cover basic living expenses
Building savings
Supporting children
Paying healthcare expenses
Supporting parents
Creating an inheritance or financial legacy
Other
24
13
6
3
2
10
34
12
13
2
2
1
2
Greatest Financial Priority Right Now (%)
32
16
10
3
3
31
5
12
12
2
2
2
1
31
17
10
2
2
18
16
13
13
3
2
2
2
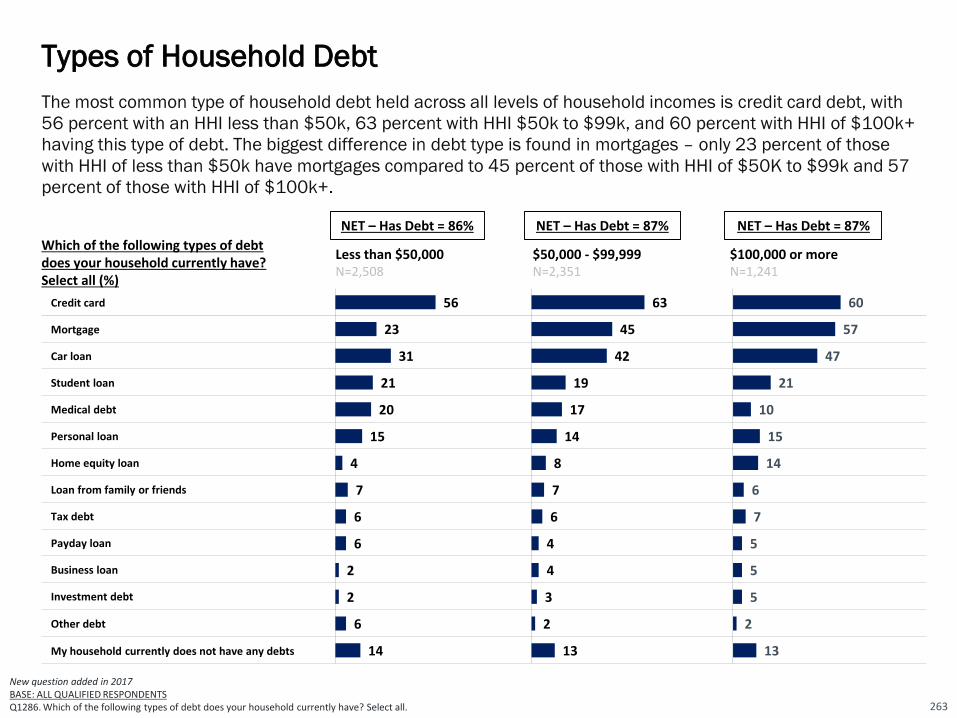
The most common type of household debt held across all levels of household incomes is credit card debt, with
56 percent with an HHI less than $50k, 63 percent with HHI $50k to $99k, and 60 percent with HHI of $100k+
having this type of debt. The biggest difference in debt type is found in mortgages – only 23 percent of those
with HHI of less than $50k have mortgages compared to 45 percent of those with HHI of $50K to $99k and 57
percent of those with HHI of $100k+.
Types of Household Debt
263
Which of the following types of debtdoes your household currently have? Select all (%)
Less than $50,000 N=2,508
$50,000 - $99,999N=2,351
$100,000 or more N=1,241
Credit card
Mortgage
Car loan
Student loan
Medical debt
Personal loan
Home equity loan
Loan from family or friends
Tax debt
Payday loan
Business loan
Investment debt
Other debt
My household currently does not have any debts
56
23
31
21
20
15
4
7
6
6
2
2
6
14
63
45
42
19
17
14
8
7
6
4
4
3
2
13
60
57
47
21
10
15
14
6
7
5
5
5
2
13
New question added in 2017BASE: ALL QUALIFIED RESPONDENTS Q1286. Which of the following types of debt does your household currently have? Select all.
NET – Has Debt = 86% NET – Has Debt = 87% NET – Has Debt = 87%
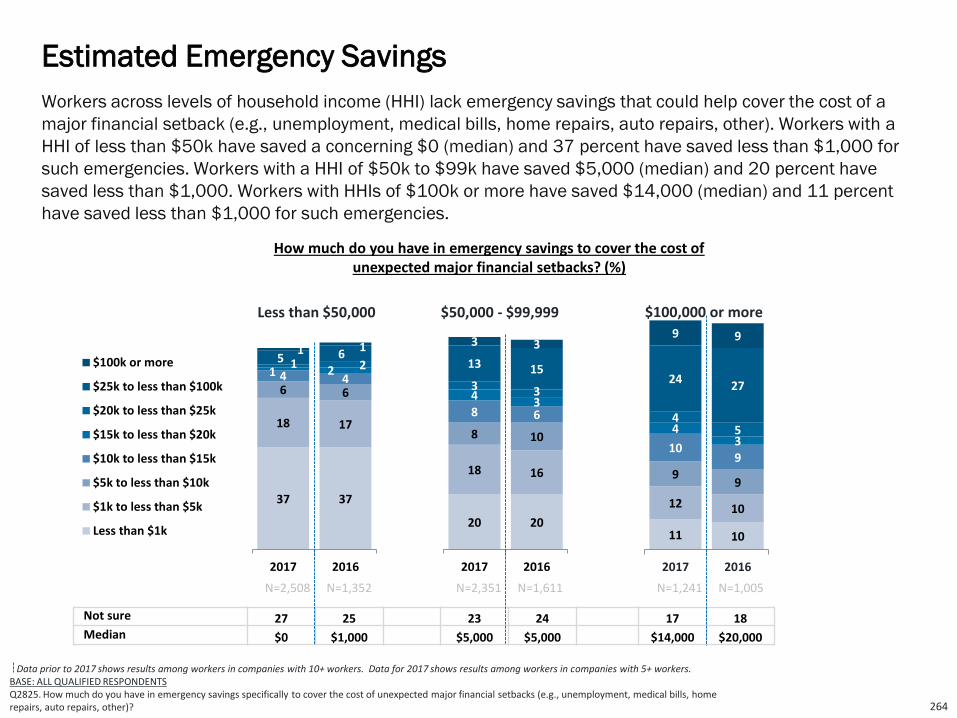
11 10
12 10
99
109
43
45
2427
9 9
2017 2016
20 20
18 16
8 10
8 6
43
3 3
13 15
3 3
2017 2016
37 37
18 17
6 6
4 41 2
1 25 61 1
2017 2016
$100k or more
$25k to less than $100k
$20k to less than $25k
$15k to less than $20k
$10k to less than $15k
$5k to less than $10k
$1k to less than $5k
Less than $1k
Workers across levels of household income (HHI) lack emergency savings that could help cover the cost of a
major financial setback (e.g., unemployment, medical bills, home repairs, auto repairs, other). Workers with a
HHI of less than $50k have saved a concerning $0 (median) and 37 percent have saved less than $1,000 for
such emergencies. Workers with a HHI of $50k to $99k have saved $5,000 (median) and 20 percent have
saved less than $1,000. Workers with HHIs of $100k or more have saved $14,000 (median) and 11 percent
have saved less than $1,000 for such emergencies.
Estimated Emergency Savings
264
Data prior to 2017 shows results among workers in companies with 10+ workers. Data for 2017 shows results among workers in companies with 5+ workers.BASE: ALL QUALIFIED RESPONDENTS Q2825. How much do you have in emergency savings specifically to cover the cost of unexpected major financial setbacks (e.g., unemployment, medical bills, home repairs, auto repairs, other)?
How much do you have in emergency savings to cover the cost of unexpected major financial setbacks? (%)
Not sure 27 25 23 24 17 18Median $0 $1,000 $5,000 $5,000 $14,000 $20,000
Less than $50,000 $50,000 - $99,999 $100,000 or more
N=2,351N=2,508 N=1,241N=1,611N=1,352 N=1,005
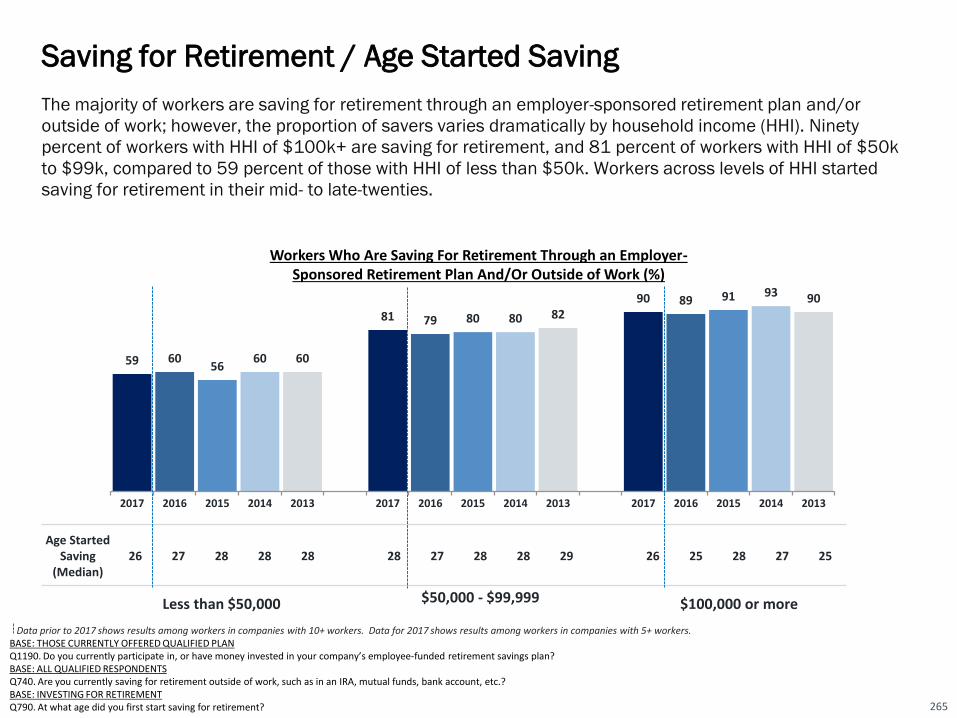
Data prior to 2017 shows results among workers in companies with 10+ workers. Data for 2017 shows results among workers in companies with 5+ workers.BASE: THOSE CURRENTLY OFFERED QUALIFIED PLANQ1190. Do you currently participate in, or have money invested in your company’s employee-funded retirement savings plan?BASE: ALL QUALIFIED RESPONDENTSQ740. Are you currently saving for retirement outside of work, such as in an IRA, mutual funds, bank account, etc.?BASE: INVESTING FOR RETIREMENTQ790. At what age did you first start saving for retirement?
The majority of workers are saving for retirement through an employer-sponsored retirement plan and/or
outside of work; however, the proportion of savers varies dramatically by household income (HHI). Ninety
percent of workers with HHI of $100k+ are saving for retirement, and 81 percent of workers with HHI of $50k
to $99k, compared to 59 percent of those with HHI of less than $50k. Workers across levels of HHI started
saving for retirement in their mid- to late-twenties.
Saving for Retirement / Age Started Saving
265
Age Started Saving
(Median)26 27 28 28 28 28 27 28 28 29 26 25 28 27 25
Less than $50,000 $50,000 - $99,999 $100,000 or more
Workers Who Are Saving For Retirement Through an Employer-Sponsored Retirement Plan And/Or Outside of Work (%)
59 6056
60 60
81 79 80 80 8290 89 91 93 90
2017 2016 2015 2014 2013 2017 2016 2015 2014 2013 2017 2016 2015 2014 2013

Data prior to 2017 shows results among workers in companies with 10+ workers. Data for 2017 shows results among workers in companies with 5+ workers.BASE: ALL QUALIFIED RESPONDENTS Q1145. Which one of the following do you expect to be sources of income to cover your living expenses after you retire? Select all.
Across levels of household income (HHI), the majority of workers expect retirement income from self-funded
savings including retirement accounts (e.g., 401(k)s, 403(b)s, IRAs) and other savings and investments: 92
percent of workers with HHI of $100k+, 86 percent of those with HHI of $50k to $99k, and 67 percent of those
with HHI of less than $50k. Nearly half of workers with HHI of less than $50k (47 percent) expect income from
working, compared to those with HHI of $50k to $99k (39 percent) and those with HHI of $100k+ (32 percent).
Expected Sources of Retirement Income
266
Less than $50,000 $50,000 - $99,999 $100,000 or more
■ 2017 (N=2,508)
■ 2016 (N=1,352)
■ 2017 (N=2,351)
■ 2016 (N=1,611)
■ 2017 (N=1,241)
■ 2016 (N=1,005)
NET – Self-Funded Savings
401(k) / 403(b) Accounts / IRAs
Other savings and investments
Social Security
Working
Company-funded pension plan
Home equity
Inheritance
Other
67
52
39
73
47
12
7
8
4
64
52
36
68
47
15
7
8
4
Expected Sources of Income During Retirement (%)
86
73
49
74
39
24
12
11
2
80
70
44
72
39
23
14
11
4
92
85
63
76
32
32
22
13
2
89
82
60
72
30
38
19
14
3

Less than $50,000 $50,000 - $99,999 $100,000 or more
■ 2017 (N=2,508) ■ 2016 (N=1,352)■ 2015 (N=1,450)■ 2014 (N=1,427)■ 2013 (N=1,302)
■ 2017 (N=2,351)■ 2016 (N=1,611) ■ 2015 (N=1785)■ 2014 (N=1,566)
■ 2013 (N=1,324)
■ 2017 (N=1,241)
■ 2016 (N=1,005)■ 2015 (N=1,042)■ 2014 (N=958)■ 2013 (N=791)
401(k) / 403(b) accounts / IRAs
Social Security
*Working
Other savings and investments
Company-funded pension plan
Home equity
Inheritance
Other
Data prior to 2017 shows results among workers in companies with 10+ workers. Data for 2017 shows results among workers in companies with 5+ workers.*added in 2015BASE: ALL QUALIFIED RESPONDENTS Q1150. Which one of the following do you expect to be your primary source of income to cover your living expenses after you retire?
Workers with higher levels of HHI are more likely to expect to rely on retirement accounts — such as 401(k),
401(b), or IRA — as their primary source of income in retirement, including 49 percent of workers with HHI of
$100k+ and 38 percent of those with HHI of $50k to $99k. Workers with HHI of less than $50k are more likely
to cite Social Security (39 percent) or working (22 percent) as their expected primary source of retirement
income.
Expected Primary Source of Income in Retirement
267
Expected Primary Source of Income in Retirement (%)
22
39
22
10
3
1
1
2
24
33
24
10
3
1
2
3
23
39
18
10
2
0
3
5
28
41
15
5
1
2
8
28
41
15
4
1
3
8
38
26
13
13
7
1
1
1
38
27
11
10
7
2
2
3
36
27
14
11
6
2
2
2
43
27
13
0
2
2
2
40
27
15
10
2
3
4
49
16
8
13
10
2
2
<1
44
17
9
13
12
1
2
2
51
13
7
14
10
1
2
2
58
12
15
8
2
2
2
53
14
17
10
1
1
3
N/A N/AN/A

Less than $50,000 $50,000 - $99,999 $100,000 or more■ 2017 (N=2,508)■ 2016 (N=1,352)■ 2015 (N=1,450)■ 2014 (N=1,427)■ 2013 (N=1,302)
■ 2017 (N=2,351)■ 2016 (N=1,611)■ 2015 (N=1,786) ■ 2014 (N=1,566)■ 2013 (N=1,324)
■ 2017 (N=1,241)■ 2016 (N=1,005) ■ 2015 (N=1,042)■ 2014 (N=958)■ 2013 (N=791)
Health insurance
401(k) / 403(b) / 457(b) or other employee self-funded plan
Life insurance
Disability insurance
Long-Term Care insurance
Company-funded defined-benefit pension plan
*A company-funded cash balance plan
Critical Illness Insurance
**Financial Wellness Program
**Employee Assistance Program
**Workplace Wellness Program
Cancer Insurance
Note: Data prior to 2017 shows results among workers in companies with 10+ workers. Data for 2017 shows results among workers in companies with 5+ workers.*added in 2014 **added in 2017BASE: ALL QUALIFIED RESPONDENTS Q1170. Businesses typically offer a number of different benefits for their workers. For each of the following, please tell us howimportant that benefit is to you, personally.
More than 80 percent of workers across all levels of household income value a 401(k), 401(b), 457(b) or
similar plan as an important benefit. Workers with higher household incomes are more likely to believe such
benefits are important, a steady trend over the past five years.
Importance of Retirement Benefits Compared to Other Benefits
268
Very/Somewhat Important(%) (NET)
94
84
77
74
74
72
67
67
65
68
61
62
93
83
75
79
71
69
54
65
57
92
83
73
74
73
71
54
62
55
92
84
72
78
74
79
64
72
65
91
83
72
78
68
77
71
63
96
93
74
73
71
72
68
64
60
57
59
55
96
93
75
75
71
75
56
64
52
96
94
75
78
72
73
53
60
48
94
93
71
78
71
76
60
64
55
94
95
68
77
69
75
60
52
96
88
76
75
74
74
66
62
64
63
59
56
96
88
76
76
72
74
57
64
57
95
89
75
73
70
73
54
61
52
95
90
73
79
69
80
62
66
58
95
92
70
78
66
76
66
57
N/A N/AN/A
N/A N/AN/A
N/A N/AN/A
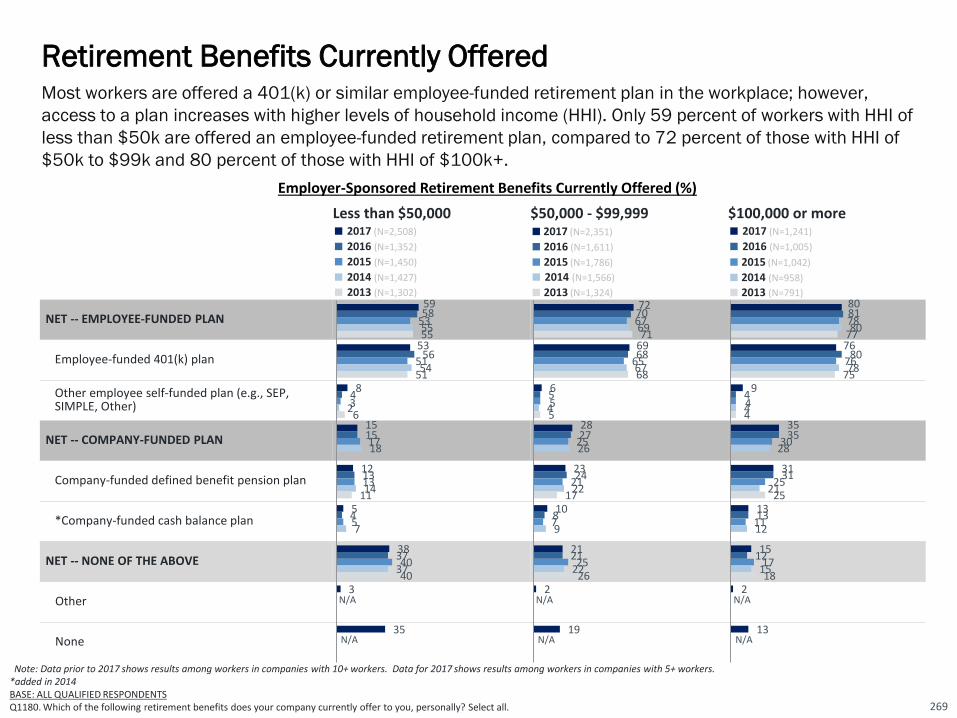
Less than $50,000 $50,000 - $99,999 $100,000 or more■ 2017 (N=2,508)
■ 2016 (N=1,352)
■ 2015 (N=1,450)
■ 2014 (N=1,427)
■ 2013 (N=1,302)
■ 2017 (N=2,351)
■ 2016 (N=1,611)
■ 2015 (N=1,786)
■ 2014 (N=1,566)
■ 2013 (N=1,324)
■ 2017 (N=1,241)
■ 2016 (N=1,005)
■ 2015 (N=1,042)
■ 2014 (N=958)
■ 2013 (N=791)
NET -- EMPLOYEE-FUNDED PLAN
Employee-funded 401(k) plan
Other employee self-funded plan (e.g., SEP, SIMPLE, Other)
NET -- COMPANY-FUNDED PLAN
Company-funded defined benefit pension plan
*Company-funded cash balance plan
NET -- NONE OF THE ABOVE
Other
None
Note: Data prior to 2017 shows results among workers in companies with 10+ workers. Data for 2017 shows results among workers in companies with 5+ workers.*added in 2014BASE: ALL QUALIFIED RESPONDENTSQ1180. Which of the following retirement benefits does your company currently offer to you, personally? Select all.
Most workers are offered a 401(k) or similar employee-funded retirement plan in the workplace; however,
access to a plan increases with higher levels of household income (HHI). Only 59 percent of workers with HHI of
less than $50k are offered an employee-funded retirement plan, compared to 72 percent of those with HHI of
$50k to $99k and 80 percent of those with HHI of $100k+.
Retirement Benefits Currently Offered
269
Employer-Sponsored Retirement Benefits Currently Offered (%)
59
53
8
15
12
5
38
3
35
58
56
4
15
13
4
37
53
51
3
17
13
5
40
55
54
2
18
14
7
37
55
51
6
11
40
72
69
6
28
23
10
21
2
19
70
68
5
27
24
8
21
67
65
5
25
21
7
25
69
67
4
26
22
9
22
71
68
5
17
26
80
76
9
35
31
13
15
2
13
81
80
4
35
31
13
12
78
76
4
30
25
11
17
80
78
4
28
21
12
15
77
75
4
25
18
N/A
N/A
N/A
N/A
N/A
N/A

Among workers who are offered a 401(k) or similar plan, the participation rate increases significantly with
higher levels of household income (HHI). Sixty-six percent of workers with HHI of less than $50k participate in
their employer’s plan, compared to 81 percent with HHI of $50k to $99k and 90 percent with HHI of $100k+.
This trend has remained consistent over the past five years.
Retirement Plan Participation
270
Data prior to 2017 shows results among workers in companies with 10+ workers. Data for 2017 shows results among workers in companies with 5+ workers.BASE: THOSE CURRENTLY OFFERED QUALIFIED PLANQ1190. Do you currently participate in, or have money invested in your company’s employee-funded retirement savings plan?
Participation in Company’s Employee-funded Retirement Savings Plan, % Indicate “Yes”
66 64 63 6357
81 81 81 79 80
9082
89 90 90
2017 2016 2015 2014 2013 2017 2016 2015 2014 2013 2017 2016 2015 2014 2013
N=1,353
N=429
N=759
N=748
N=713
N=1,626
N=799
N=1,220
N=1,102
N=974
N=951
N=939
N=780
N=729
N=912
Less than $50,000 $50,000 - $99,999 $100,000 or more

6% 6%5%
6%5%
8%
6%7%
6% 6%
10% 10% 10% 10% 10%
2017 2016 2015 2014 2013 2017 2016 2015 2014 2013 2017 2016 2015 2014 2013
Data prior to 2017 shows results among workers in companies with 10+ workers. Data for 2017 shows results among workers in companies with 5+ workers.BASE: CURRENTLY PARTICIPATES IN QUALIFIED PLAN Q601. What percentage of your salary are you saving for retirement through your company-sponsored plan this year?
Among workers who participate in a 401(k) or similar plan, those with higher household incomes (HHI)
contribute more. Workers with HHI of $100k+ contribute 10 percent (median) of their annual pay, while
those with HHI of $50k to 99k contribute 8 percent (median) and those with HHI less than $50k contribute
6 percent (median). This trend has been consistent over the past five years.
Retirement Plan Contribution Rate
271
Mean 11.4 9.9 8.7 9.2 7.1 12.0 10.2 10.4 10.1 9.1 14.7 12.1 11.5 13.2 11.1
N=852 N=469 N=466 N=474 N=442 N=1,325 N=901 N=955 N=892 N=801 N=843 N=679 N=738 N=700 N=595
Less than $50,000 $50,000 - $99,999 $100,000 or more
Contribution Rate, Median %

48 43 35
30 38 50
78 81 85
Workers with higher levels of household income (HHI) are more likely to find automatic enrollment as a plan
feature appealing, as 85 percent of those with $100k+ find it “very” or “somewhat” appealing, compared to 81
percent of those with HHI $50k to $99k and 78 percent of those with HHI less than $50k. When it comes to the
appropriate contribution rate for such a plan, workers with HHI $100k+ think it should be 9 percent (median)
while those with both HHI $50k to $99k and less than $50k believe the appropriate default contribution rate
should be 6 percent (median).
Appeal of Automatic Enrollment
272
New question added in 2017BASE: ALL QUALIFIED RESPONDENTS Q635. Imagine that your current employer automatically enrolled you into a 401(k), 403(b) or similar retirement plan, deducting a percentage of each paycheck, and investing it for your future retirement. How appealing would this seem to you?Q636. Imagine that your current employer automatically enrolled you into a 401(k), 403(b) or similar retirement plan, what would you consider to be an appropriate percentage to deduct from your paycheck to be invested for your future retirement?
Appeal of Automatic Enrollment (%)
Appropriate Default Contribution Rate
(median):6%
Very appealing
Somewhat appealing
NET - Appealing
Less than $50,000
N=2,508
$100,000 or more
N=1,241
Appropriate Default Contribution Rate
(median):6%
$50,000 - $99,999
N=2,351
Appropriate Default Contribution Rate
(median):9%

Likelihood of Using Automatic Escalation
Workers with household income (HHI) of $50k to $99k (77 percent) and those with HHI of $100k+ (78 percent)
are more likely than those with less than $50k (70 percent) to say they are “very” or “somewhat” likely to use a
feature that automatically increases their contribution by 1 percent each year.
New question added in 2017BASE: ALL QUALIFIED RESPONDENTS Q702. How likely would you be to use a feature in a 401(k) or similar plan where your employer would automatically increase your contribution rate (as a percentage of your salary) to the plan by 1% each year, until you choose to discontinue this increase?
Less than $50,000 N=2,508
22
48
19
11
39
39
13
9
NET – Likely:78%
NET – Likely:70%
Very likely Somewhat likely Not too likely Not at all likely
Likelihood of Using a Feature That Automatically Increases Contribution by 1% Each Year, Until You Choose to Discontinue (%)
$100,000 or more N=1,241
31
46
15
8
NET – Likely:77%
$50,000 - $99,999N=2,351
273

“Professionally managed” accounts refers to a managed account service, strategic allocation funds, and/or
target date funds. At least four in ten plan participants, across levels of household income (HHI), use some
form of professionally managed offering in their 401(k) or similar plans: 45 percent of workers with HHI of less
than $50k, 59 percent of those with HHI of $50k to $99k, and 67 percent of those with HHI of $100k+.
Workers with HHI of $100k+ (47 percent) are somewhat more likely to set their own asset allocation
percentage among the available funds, compared to those with HHI of less than $50k (42 percent) and those
with HHI of $50k to $99k (40 percent).
Use of Professionally Managed Offerings
274
Data prior to 2017 shows results among workers in companies with 10+ workers. Data for 2017 shows results among workers in companies with 5+ workers.BASE: PARTICIPATING IN QUALIFIED PLANQ1466. What is your current approach to investing in your employer-sponsored retirement plan? Select all.
Less than $50,000■ 2017 (N=853)■ 2016 (N=471)
■ 2015 (N=466)■ 2014 (N=474)
$50,000 - $99,999■ 2017 (N=1,327)■ 2016 (N=901)
■ 2015 (N=956)■ 2014 (N=893)
$100,000 or More■ 2017 (N=845)■ 2016 (N=681)
■ 2015 (N=741)■ 2014 (N=704)
I set my own asset allocation percentages among the available funds
I invest in an account (or service) that is managed by a professional investment advisor and I do not have to make investment or allocation decisions
I invest in a strategic allocation fund that is designed to address my specific risk tolerance profile
I invest in a target date fund that is designed to change allocation percentages as I approach my target retirement year
NET – Professionally Managed
Not sure
Investments in Employer-Sponsored Retirement Plan (%)
42
24
12
13
45
20
35
26
25
17
55
20
38
22
15
14
43
24
37
21
19
15
48
21
40
59
26
23
22
12
38
61
31
20
23
11
39
50
22
18
19
20
41
57
28
23
19
13
47
67
32
28
26
4
45
62
27
22
27
7
51
57
24
24
21
8
52
53
21
27
23
8

35 38 3730 30
23 20 21 22 1911 13 10 12 11
1717
1417 13
2018
21 17 21
25 22 26 24 24
30 2831
3335 39
4239 45 43 48 48
51 50 50
18 17 18 21 22 18 20 19 16 17 16 17 13 14 15
2017 2016 2015 2014 2013 2017 2016 2015 2014 2013 2017 2016 2015 2014 2013
Mostly in bonds, moneymarket funds, cash and otherstable investments
Relatively equal mix of stocksand investments such asbonds, money market fundsand cash
Mostly stocks, with little or nomoney in investments such asbonds, money market funds,cash
Not sure
Data prior to 2017 shows results among workers in companies with 10+ workers. Data for 2017 shows results among workers in companies with 5+ workers.BASE: INVESTING FOR RETIREMENTQ770. How is your retirement savings invested?
Workers across levels of household income (HHI), who are investing for retirement, most frequently say that
their retirement savings are invested in a relatively equal mix of stocks and investments such as bonds, money
market funds and cash: However, responses are higher among those with HHI of $100k+ (48 percent),
compared to those with HHI of $50k to $99k (39 percent) and those with HHI of less than $50k (30 percent).
Workers with HHI of less than $50k are the most uncertain as to how their retirement savings are invested.
Asset Allocation of Retirement Investments
275
N=1,440 N=796 N=829 N=824 N=733 N=1,907 N=1,289 N=1,406 N=1,272 N=1,091 N=1,131 N=895 N=959 N=889 N=729
Less than $50,000 $50,000 - $99,999 $100,000 or more
How Retirement Savings Are Invested (%)

“Leakage” from retirement plans in the form of loans and withdrawals can severely inhibit the growth of
participants’ long-term retirement savings. About one in three workers across levels of household income
(HHI) have taken some form of loan, early withdrawal, and/or hardship withdrawal from a 401(k) or similar
plan — 31 percent of workers with HHI of less than $50k, 33 percent of those with HHI of $50k to $99k, and
35 percent of those with HHI of $100k+.
Retirement Plan Leakage: Loans and Withdrawals
276
Data prior to 2017 shows results among workers in companies with 10+ workers. Data for 2017 shows results among workers in companies with 5+ workers.BASE: All Qualified Respondents Q754. Have you ever taken any form of loan or early withdrawal from a qualified retirement account such as a 401(k) or similar plan or IRA? Select all.
Have you ever taken any form of loan or early withdrawal from a qualified retirement account such as a 401(k) or similar plan or IRA? (%)
Less than $50,000■ 2017 (N=1,353)
■ 2016 (N=758)
$50,000 - $99,999■ 2017 (N=1,626)
■ 2016 (N=1,128)
$100,000 or More■ 2017 (N=951)
■ 2016 (N=805)
NET - Have Taken a Loan, Early Withdrawal, and/or Hardship Withdrawal From 401(k) or Similar Plan or IRA
Yes, I have taken a loan from a 401(k) or similar plan and am paying it back
Yes, I have taken a hardship withdrawal and incurred taxes and penalties
Yes, I have taken an early withdrawal and cashed out a portion or all of a 401(k) or similar plan balance after my separation of employment from a prior employer and incurred taxes and penalties
Yes, I have taken a loan from a 401(k) or similar plan but was unable to pay it back so it became an early withdrawal and incurred taxes and penalties
Yes, I have taken an early withdrawal and cashed out a portion or all of an IRA and incurred taxes and penalties
No, I have never taken a loan or early withdrawal from a 401(k) or similar plan or IRA
Not sure
29
11
6
8
5
5
64
6
23
9
4
8
3
4
70
7
30
16
8
7
9
7
66
3
27
15
5
8
10
6
68
5
34
22
10
9
8
4
65
1
26
18
6
6
6
4
71
2

112 1
13 3626 26
33
5 11 11 10 111 3 2 2 4
14
7
9 8
8
66 4 5 6
2 2 1 12
127
12 12
12
86 8 6
7
4 42 4
4
11 11 17 1511
11 8 8 1011
4 33 3
4
115
7 98
1714 17 21 17
8 98
912
7
55 5 5
1416
1617 16
17 15 2120
24
7
63 2 2
2418 17
16 13
5450 49 49
40
2017 2016 2015 2014 2013 2017 2016 2015 2014 2013 2017 2016 2015 2014 2013
$250k or more
$100k to less than $250k
$50k to less than $100k
$25k to less than $50k
$10k to less than $25k
$5k to less than $10k
Less than $5k
None 0 *
Workers with a household income (HHI) of $100k+ have saved $215,000 (estimated median) in total
household retirement accounts, compared to $61,000 for those with HHI of $50k to $99k and just $11,000
for those with HHI of less than $50k (estimated medians). A concerning 24 percent of workers with HHI of less
than $50k have less than $5,000 in household retirement savings.
Total Household Retirement Savings
277
Data prior to 2017 shows results among workers in companies with 10+ workers. Data for 2017 shows results among workers in companies with 5+ workers.*added in 2017
BASE: ALL QUALIFIED RESPONDENTSQ1300. Approximately how much money does your household have saved in all of your retirement accounts? Please include IRAs, 401(k)s, 403(b)s, and any other savings for retirement to which you and/or your spouse or partner have contributed funds.
Not sure 11 14 14 13 13 9 13 11 9 12 6 9 7 6 5
Decline to answer
3 9 7 10 8 4 8 8 6 7 3 5 7 6 5
Estimated Median
$11,000 $4,000 $11,000 $12,000 $6,000 $61,000 $62,000 $58,000 $57,000 $51,000 $215,000 $210,00 $183,000 $184,000 $157,000
Total Household Retirement Savings by Level of Household Income (%)
N=1,686 N=1,352 N=1,450 N=1,427 N=1,302 N=1,954 N=1,611 N=1,786 N=1,566 N=1,324 N=1,116 N=1,005 N=1,042 N=958 N=791
Less than $50,000 $50,000 - $99,999 $100,000 or more
NA NA NA NA NA NA NA NA NA NA NA NA
Note: The median is estimated based on the approximate midpoint of the range of each response category. Non-responses are excluded from the estimate.

278
30 30
16 1824
17 20
7 10 12 11 125 5 6
31 29
2328
34
31 27
2223
31
15 12
9 814
18 20
1817
19
22 23
1924
25
20 21
18 20
24
12 12
1714
1518 19
25
22
19
28 31
33 29
28
9 9
26 23
8 12 11
2722
1326 24
35 3828
2017 2016 2015 2014 2013 2017 2016 2015 2014 2013 2017 2016 2015 2014 2013
$2m or more
$1m to less than $2m
$500k to less than $1m
$100k to less than $500k
Less than $100k
N=2,508 N=1,352 N=1,450 N=1,427 N=1,302 N=2,351 N=1,611 N=1,786 N=1,566 N=1,324 N=1,241 N=1,005 N=1,042 N=958 N=791
Median $200k $250k $500k $500k $250k $500k $500k $1m $750k $500k $1m $1m $1m $1m $1m
Note: The median is estimated based on the approximate midpoint of the range of each response category.
Data prior to 2017 shows results among workers in companies with 10+ workers. Data for 2017 shows results among workers in companies with 5+ workers.BASE: ALL QUALIFIED RESPONDENTSQ890. Thinking of what money can buy today, how much money do you believe you will need to have saved by the time you retire in order to feel financially secure?
Less than $50,000 $50,000 - $99,999 $100,000 or more
Workers’ estimated retirement savings needs increase with higher levels of household income (HHI). Workers
with HHI of less than $50k believe they need to save $200,000 (median) to feel financially secure in
retirement, whereas those with HHI of $100k+ will need $1 million. Workers with HHI of $50k to $99k have an
estimated retirement savings needs of $500,000 (median) this year.
Estimated Retirement Savings Needs
Estimated Retirement Savings Needs (%)
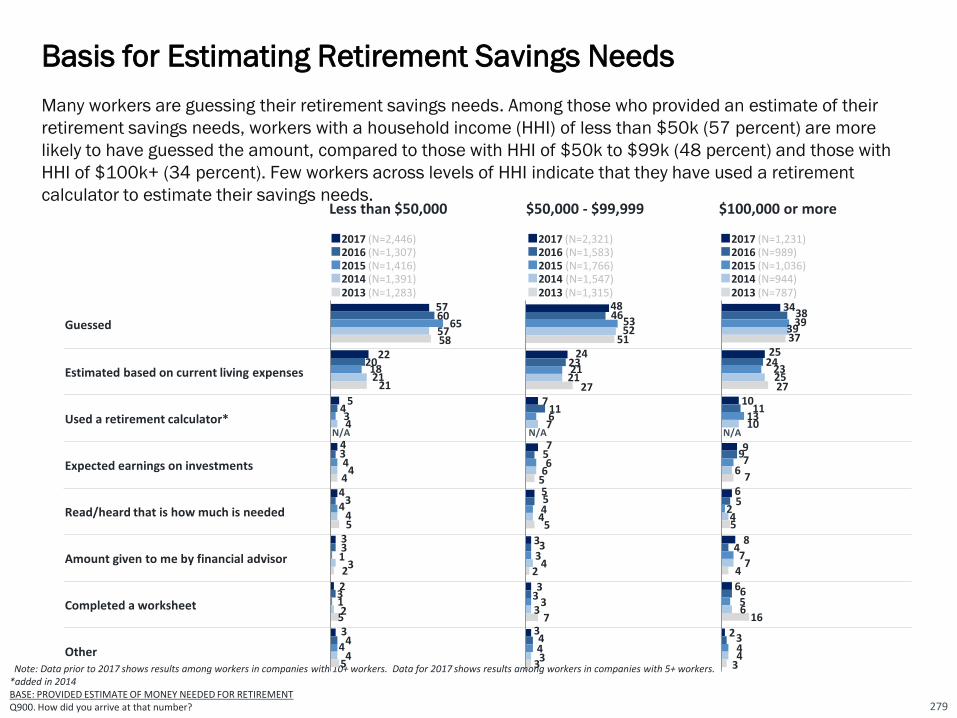
Less than $50,000 $50,000 - $99,999 $100,000 or more
■2017 (N=2,446) ■2016 (N=1,307) ■2015 (N=1,416)■2014 (N=1,391)■2013 (N=1,283)
■2017 (N=2,321)■2016 (N=1,583) ■2015 (N=1,766)■2014 (N=1,547)■2013 (N=1,315)
■2017 (N=1,231)■2016 (N=989)■2015 (N=1,036)■2014 (N=944)■2013 (N=787)
Guessed
Estimated based on current living expenses
Used a retirement calculator*
Expected earnings on investments
Read/heard that is how much is needed
Amount given to me by financial advisor
Completed a worksheet
Other
48
24
7
7
5
3
3
3
46
23
11
5
5
3
3
4
53
21
6
6
4
3
3
4
52
21
7
6
4
4
3
3
51
27
5
5
2
7
3
Many workers are guessing their retirement savings needs. Among those who provided an estimate of their
retirement savings needs, workers with a household income (HHI) of less than $50k (57 percent) are more
likely to have guessed the amount, compared to those with HHI of $50k to $99k (48 percent) and those with
HHI of $100k+ (34 percent). Few workers across levels of HHI indicate that they have used a retirement
calculator to estimate their savings needs.
Basis for Estimating Retirement Savings Needs
279
Note: Data prior to 2017 shows results among workers in companies with 10+ workers. Data for 2017 shows results among workers in companies with 5+ workers.*added in 2014BASE: PROVIDED ESTIMATE OF MONEY NEEDED FOR RETIREMENTQ900. How did you arrive at that number?
57
22
5
4
4
3
2
3
60
20
4
3
3
3
3
4
65
18
3
4
4
1
1
4
57
21
4
4
4
3
2
4
58
21
4
5
2
5
5
34
25
10
9
6
8
6
2
38
24
11
9
5
4
6
3
39
23
13
7
2
7
5
4
39
25
10
6
4
7
6
4
37
27
7
5
4
16
3
N/A N/A N/A
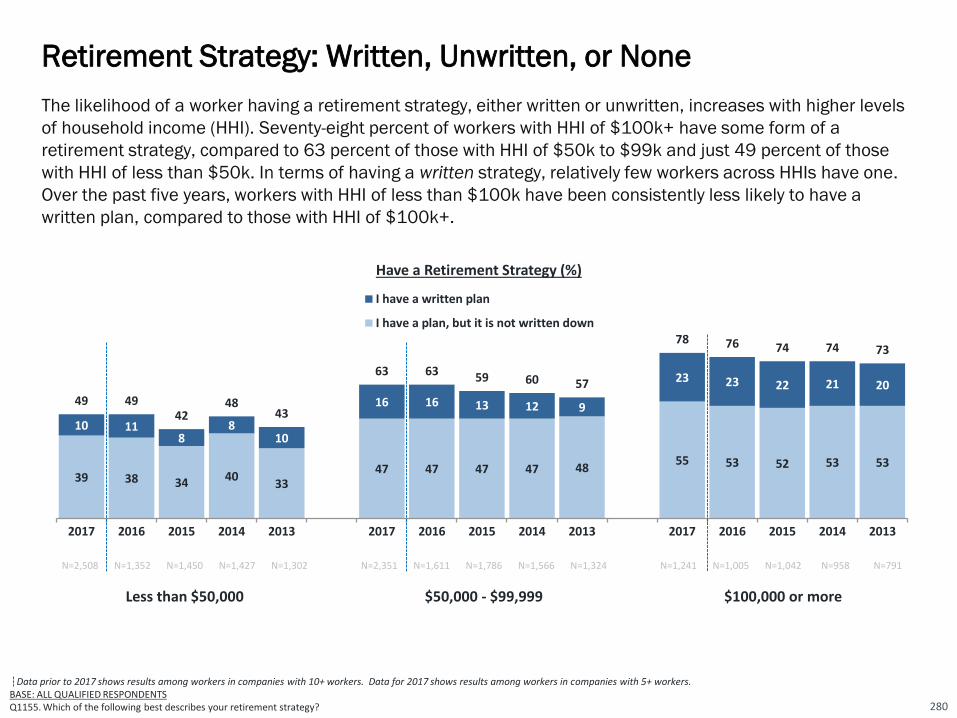
The likelihood of a worker having a retirement strategy, either written or unwritten, increases with higher levels
of household income (HHI). Seventy-eight percent of workers with HHI of $100k+ have some form of a
retirement strategy, compared to 63 percent of those with HHI of $50k to $99k and just 49 percent of those
with HHI of less than $50k. In terms of having a written strategy, relatively few workers across HHIs have one.
Over the past five years, workers with HHI of less than $100k have been consistently less likely to have a
written plan, compared to those with HHI of $100k+.
Retirement Strategy: Written, Unwritten, or None
280
39 38 34 4033
47 47 47 47 4855 53 52 53 53
10 118
810
16 16 13 12 9
23 23 22 21 2049 49
4248
43
63 63 59 60 57
78 76 74 74 73
2017 2016 2015 2014 2013 2017 2016 2015 2014 2013 2017 2016 2015 2014 2013
I have a written plan
I have a plan, but it is not written down
Have a Retirement Strategy (%)
Data prior to 2017 shows results among workers in companies with 10+ workers. Data for 2017 shows results among workers in companies with 5+ workers.BASE: ALL QUALIFIED RESPONDENTSQ1155. Which of the following best describes your retirement strategy?
N=2,508 N=1,352 N=1,450 N=1,427 N=1,302 N=2,351 N=1,611 N=1,786 N=1,566 N=1,324 N=1,241 N=1,005 N=1,042 N=958 N=791
Less than $50,000 $50,000 - $99,999 $100,000 or more

Workers’ confidence that their current financial strategy will enable them to realize their travel goals increases
with higher levels of household income (HHI). Among those who dream of traveling in retirement, 69 percent of
workers with HHI of $100k+ are confident, compared to 59 percent of those with HHI of $50k to $99k and 42
percent of those with HHI of less than $50k.
Confidence that Financial Strategy Will Enable Travel Goals
281
Data prior to 2017 shows results among workers in companies with 10+ workers. Data for 2017 shows results among workers in companies with 5+ workers.BASE: THOSE WHO DREAM OF TRAVELING IN RETIREMENTQ2845. How confident are you that your current financial strategy will allow you to meet your travel goals throughout retirement?
Confidence That Current Financial Strategy Will Meet Retirement Travel Goals (%)
Less than $50,000 $50,000 - $99,999 $100,000 or more
■ 2017 (N=1,503)
■ 2016 (N=782)
■ 2017 (N=1,595)
■ 2016 (N=1,085)
■ 2017 (N=985)
■ 2016 (N=753)
Very confident
Somewhat confident
Not too confident
Not at all confident
I haven’t given much thought to a financial strategy for travel in retirement
10
32
21
17
20
11
31
17
18
23
19
40
19
9
13
15
42
16
10
17
30
39
15
6
10
25
45
15
5
10
NET Confident2017: 69%2016: 70%
NET Confident2017: 59%2016: 57%
NET Confident2017: 42%2016: 42%

Data prior to 2017 shows results among workers in companies with 10+ workers. Data for 2017 shows results among workers in companies with 5+ workers.BASE: INVESTING FOR RETIREMENTQ860. Do you use a professional financial advisor to help manage your retirement savings or investments?
29 3025 26 28
37 3734 35
32
4945 43 43
47
2017 2016 2015 2014 2013 2017 2016 2015 2014 2013 2017 2016 2015 2014 2013
Among those investing for retirement, use of a professional financial advisor increases with higher levels of
household income (HHI). Forty-nine percent of workers with HHI of $100K+ use an advisor, compared to 37
percent of those with HHI of $50k to $99k and 29 percent of those with HHI of less than $50k.
Professional Financial Advisor Usage
282
N=1,440 N=796 N=829 N=824 N=733 N=1,907 N=1,289 N=1,406 N=1,272 N=1,091 N=1,131 N=895 N=959 N=889 N=729
Less than $50,000 $50,000 - $99,999 $100,000 or more
Use a Professional Financial Advisor % Indicate “Yes”

The IRS Saver’s Credit is a tax credit available to eligible taxpayers who are saving for retirement in a qualified
retirement plan or IRA; however, few workers who are potentially eligible to claim the credit are aware of it. Only
28 percent of workers with HHI of less than $50k are aware of the Saver’s Credit, compared to 35 percent of
those with HHI of $50k to $99k and 45 percent of those with HHI of $100k+.
Awareness of the Saver’s Credit
283
Data prior to 2017 shows results among workers in companies with 10+ workers. Data for 2017 shows results among workers in companies with 5+ workers.BASE: ALL QUALIFIED RESPONDENTS Q1120. Are you aware of a tax credit called the “Saver’s Credit,” which is available to individuals and households, who meet certain income requirements, for making contributions to an IRA or a company-sponsored retirement plan such as a 401(k) plan or 403(b) plan?
Less than $50,0002017 (N=2,508)
$50,000 - $99,9992017 (N=2,351)
$100,000 or more2017 (N=1,241)
28
72
35
65
4555
Less than $50,0002016 (N=1,352)
$50,000 - $99,9992016 (N=1,611)
$100,000 or more2016 (N=1,005)
26
74
35
65
38
62
Yes, I am aware No, I am not aware
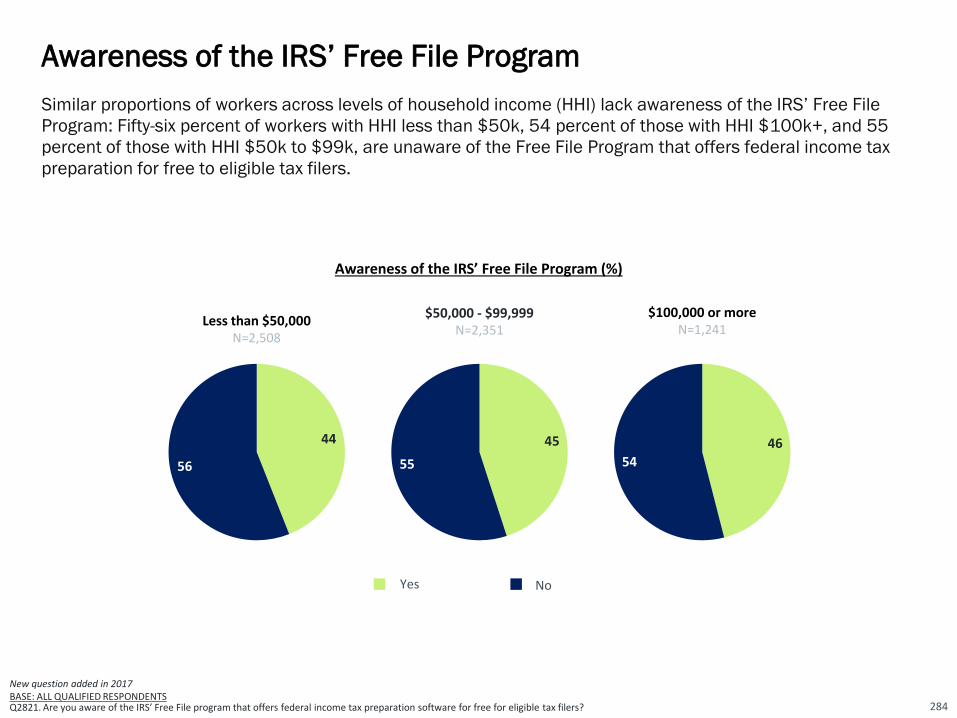
Similar proportions of workers across levels of household income (HHI) lack awareness of the IRS’ Free File
Program: Fifty-six percent of workers with HHI less than $50k, 54 percent of those with HHI $100k+, and 55
percent of those with HHI $50k to $99k, are unaware of the Free File Program that offers federal income tax
preparation for free to eligible tax filers.
Awareness of the IRS’ Free File Program
284
New question added in 2017BASE: ALL QUALIFIED RESPONDENTS Q2821. Are you aware of the IRS’ Free File program that offers federal income tax preparation software for free for eligible tax filers?
44
56
Less than $50,000N=2,508
45
55
46
54
$50,000 - $99,999N=2,351
$100,000 or moreN=1,241
No Yes
Awareness of the IRS’ Free File Program (%)

Influences of Educational Attainment on
Retirement Readiness
Detailed Findings
285
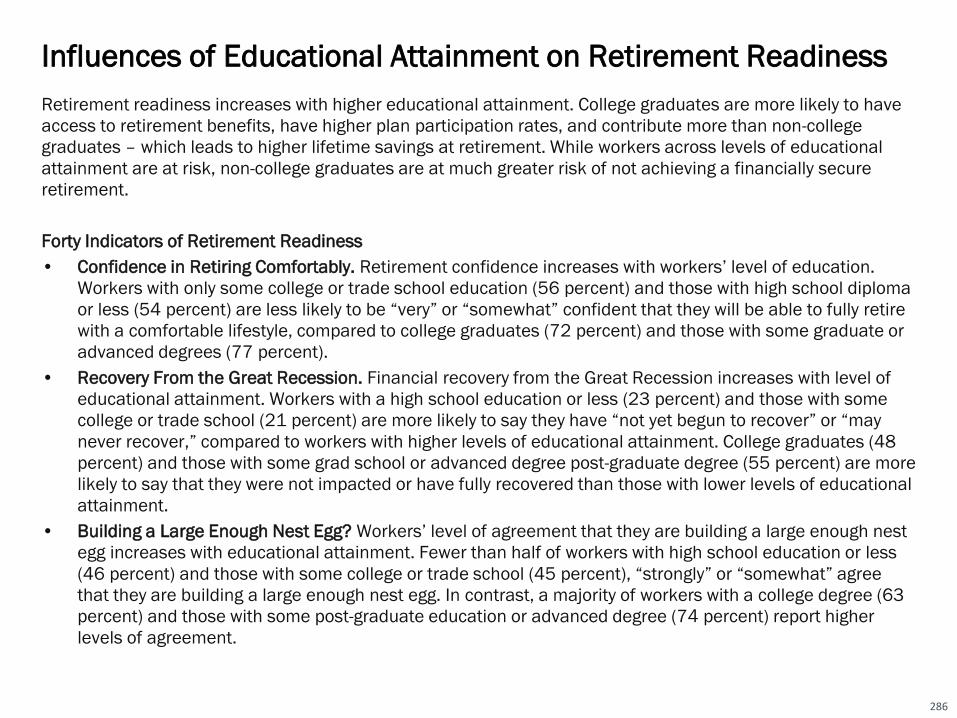
Retirement readiness increases with higher educational attainment. College graduates are more likely to have
access to retirement benefits, have higher plan participation rates, and contribute more than non-college
graduates – which leads to higher lifetime savings at retirement. While workers across levels of educational
attainment are at risk, non-college graduates are at much greater risk of not achieving a financially secure
retirement.
Forty Indicators of Retirement Readiness
• Confidence in Retiring Comfortably. Retirement confidence increases with workers’ level of education.
Workers with only some college or trade school education (56 percent) and those with high school diploma
or less (54 percent) are less likely to be “very” or “somewhat” confident that they will be able to fully retire
with a comfortable lifestyle, compared to college graduates (72 percent) and those with some graduate or
advanced degrees (77 percent).
• Recovery From the Great Recession. Financial recovery from the Great Recession increases with level of
educational attainment. Workers with a high school education or less (23 percent) and those with some
college or trade school (21 percent) are more likely to say they have “not yet begun to recover” or “may
never recover,” compared to workers with higher levels of educational attainment. College graduates (48
percent) and those with some grad school or advanced degree post-graduate degree (55 percent) are more
likely to say that they were not impacted or have fully recovered than those with lower levels of educational
attainment.
• Building a Large Enough Nest Egg? Workers’ level of agreement that they are building a large enough nest
egg increases with educational attainment. Fewer than half of workers with high school education or less
(46 percent) and those with some college or trade school (45 percent), “strongly” or “somewhat” agree
that they are building a large enough nest egg. In contrast, a majority of workers with a college degree (63
percent) and those with some post-graduate education or advanced degree (74 percent) report higher
levels of agreement.
Influences of Educational Attainment on Retirement Readiness
286

• Retirement Dreams Include Leisure and Work. “Traveling” is the most frequently cited retirement dream
among workers across educational attainments: 61 percent of those with high school or less, 70 percent
of those with some college or trade school, 75 percent of college graduates, and 80 percent of those with
some graduate school or post-graduate degree. Many workers dream of some form of continued work in
retirement, interestingly this number increases with higher educational attainment, with about a quarter of
non-college graduates compared to 32 percent of college graduates and 46 percent of workers with some
post-graduate education or graduate degree.
• Retirement Beliefs, Preparations, and Involvement. Across levels of educational attainment, more than
three-quarters of workers feel that their generation will have a much harder time achieving financial
security compared to their parent’s generation. Strong majorities also feel that Social Security will not be
there when they are ready to retire.
• Expected Retirement Age. Most workers across levels of educational attainment expect to retire after age
65 or do not plan to retire, including 55 percent of those with a high school education or less, 57 percent
of those with some college or trade school, 49 percent of college graduates, and 48 percent of those with
some graduate school or advanced degree. Additionally, twice as many workers with a high school
education or less (18 percent) do not plan to retire compared to workers with some graduate school or
advanced degree (9 percent).
• Planning to Work in Retirement. Expectations of working in retirement are similar across education
attainment, with more than half of workers planning to continue working in retirement: 58 percent of those
with some graduate school or advanced degree, 57 percent with some college or trade school education,
56 percent of college graduates, and 55 percent with a high school education or less. At least one in 10
workers across levels of educational attainment plan to work full-time in retirement.
Influences of Educational Attainment on Retirement Readiness
287

• Reasons for Working in Retirement. Among those planning to retire after age 65 and/or working after
retirement, workers with some graduate school or advanced degree (86 percent) and college graduates
(80 percent) are more likely to do so for healthy-aging reasons, while non-college grads are somewhat
more likely to do for financial reasons (84 percent some college/trade school, and 85 percent of with a
high school education or less).
• Retirement Transitions: Phased Versus Immediate. Many workers envision a phased transition into
retirement by changing work patterns (e.g., reducing work hours or working in a different capacity).
Workers with some graduate school or graduate degree (51 percent) and those with college degrees (50
percent) are somewhat more likely to expect this phased transition in contrast to those with some college
or trade school (47 percent) and those with a H.S. education or less (41 percent).
• Phased Retirement and Compensation-Related Expectations. Across all levels of educational attainment,
workers who envision a phased transition into retirement share similar feelings regarding phased
retirement and compensation-related expectations. However, as educational attainment increases,
workers are more likely to expect to be paid the market rate for duties involved, even if it means a
reduction in their current level of pay, and are more likely to expect their job title to change if they were to
take on a new role with fewer responsibilities.
• Perceptions of Older Workers. The majority of workers across levels of educational attainment share
positive perceptions of workers age 50 or older compared to younger workers in today’s workforce.
However, negative perceptions, such as their having higher healthcare costs and commanding higher
wages, increases with higher levels of educational attainment.
Influences of Educational Attainment on Retirement Readiness
288
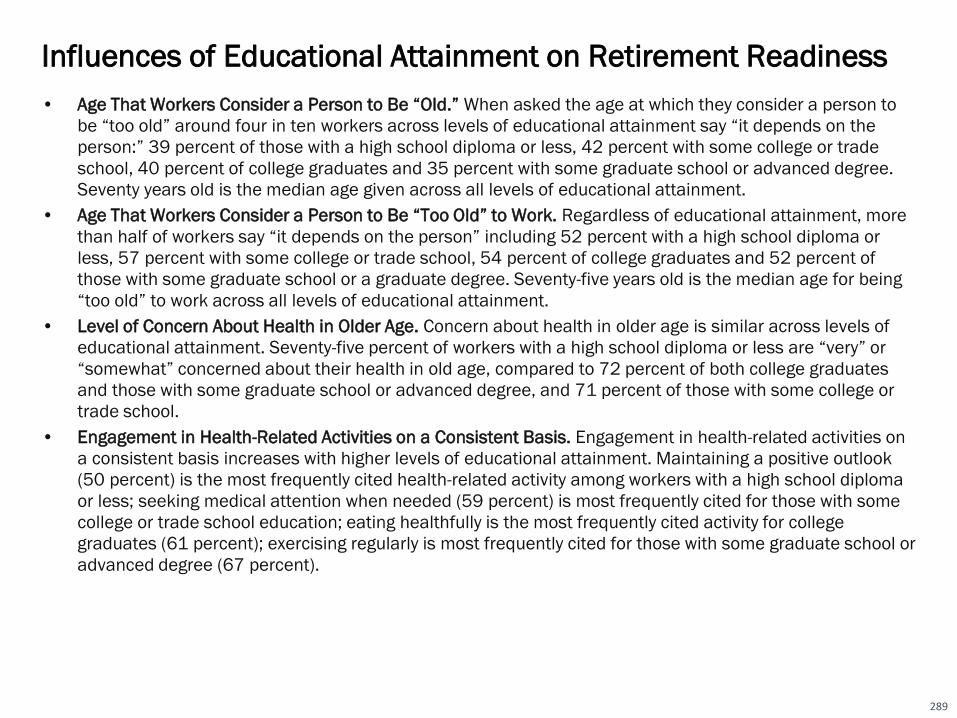
• Age That Workers Consider a Person to Be “Old.” When asked the age at which they consider a person to
be “too old” around four in ten workers across levels of educational attainment say “it depends on the
person:” 39 percent of those with a high school diploma or less, 42 percent with some college or trade
school, 40 percent of college graduates and 35 percent with some graduate school or advanced degree.
Seventy years old is the median age given across all levels of educational attainment.
• Age That Workers Consider a Person to Be “Too Old” to Work. Regardless of educational attainment, more
than half of workers say “it depends on the person” including 52 percent with a high school diploma or
less, 57 percent with some college or trade school, 54 percent of college graduates and 52 percent of
those with some graduate school or a graduate degree. Seventy-five years old is the median age for being
“too old” to work across all levels of educational attainment.
• Level of Concern About Health in Older Age. Concern about health in older age is similar across levels of
educational attainment. Seventy-five percent of workers with a high school diploma or less are “very” or
“somewhat” concerned about their health in old age, compared to 72 percent of both college graduates
and those with some graduate school or advanced degree, and 71 percent of those with some college or
trade school.
• Engagement in Health-Related Activities on a Consistent Basis. Engagement in health-related activities on
a consistent basis increases with higher levels of educational attainment. Maintaining a positive outlook
(50 percent) is the most frequently cited health-related activity among workers with a high school diploma
or less; seeking medical attention when needed (59 percent) is most frequently cited for those with some
college or trade school education; eating healthfully is the most frequently cited activity for college
graduates (61 percent); exercising regularly is most frequently cited for those with some graduate school or
advanced degree (67 percent).
Influences of Educational Attainment on Retirement Readiness
289
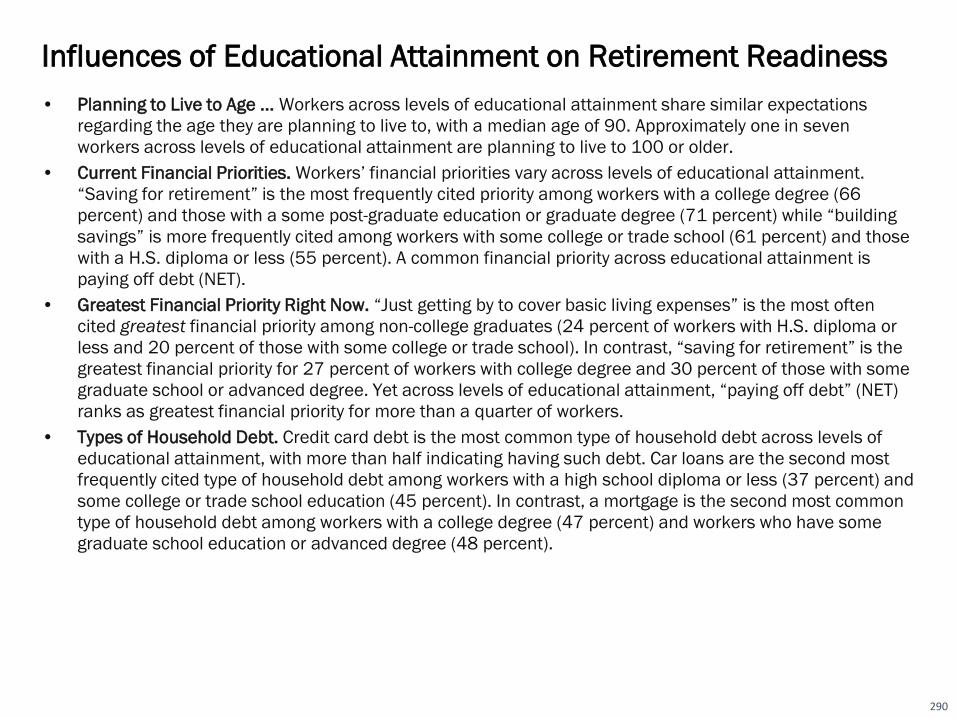
• Planning to Live to Age ... Workers across levels of educational attainment share similar expectations
regarding the age they are planning to live to, with a median age of 90. Approximately one in seven
workers across levels of educational attainment are planning to live to 100 or older.
• Current Financial Priorities. Workers’ financial priorities vary across levels of educational attainment.
“Saving for retirement” is the most frequently cited priority among workers with a college degree (66
percent) and those with a some post-graduate education or graduate degree (71 percent) while “building
savings” is more frequently cited among workers with some college or trade school (61 percent) and those
with a H.S. diploma or less (55 percent). A common financial priority across educational attainment is
paying off debt (NET).
• Greatest Financial Priority Right Now. “Just getting by to cover basic living expenses” is the most often
cited greatest financial priority among non-college graduates (24 percent of workers with H.S. diploma or
less and 20 percent of those with some college or trade school). In contrast, “saving for retirement” is the
greatest financial priority for 27 percent of workers with college degree and 30 percent of those with some
graduate school or advanced degree. Yet across levels of educational attainment, “paying off debt” (NET)
ranks as greatest financial priority for more than a quarter of workers.
• Types of Household Debt. Credit card debt is the most common type of household debt across levels of
educational attainment, with more than half indicating having such debt. Car loans are the second most
frequently cited type of household debt among workers with a high school diploma or less (37 percent) and
some college or trade school education (45 percent). In contrast, a mortgage is the second most common
type of household debt among workers with a college degree (47 percent) and workers who have some
graduate school education or advanced degree (48 percent).
Influences of Educational Attainment on Retirement Readiness
290

• Estimated Emergency Savings. Emergency savings can help cover the cost of a major financial setback
(e.g., unemployment, medical bills, home repairs, auto repairs, other); however, many workers have saved
little. Workers with a high school education or less have saved just $1,000 (median) and those with some
college or trade school have saved $3,000 (median), compared to college graduates who have saved
$10,000 (median) and workers with some graduate school or a graduate degree have saved $15,000
(median) for such emergencies.
• Saving for Retirement / Age Started Saving. Savings rates increase with higher levels of educational
attainment. College graduates (87 percent) and those with some post-graduate education or graduate
degree (93 percent) are more likely to be saving for retirement through an employer sponsored retirement
plan and/or outside of work, in contrast to those with some college or trade school (76 percent) and those
with a high school diploma or less (65 percent). Adding to this trend, workers with at least a college degree
started saving earlier at age (25 median), compared to those with some college or trade school (median
age 29) and those with a high school diploma or less (median age 30).
• Expected Sources of Retirement Income. Across levels of education, the majority of workers expect
retirement income from self-funded savings including retirement accounts (e.g., 401(k)s, 403(b)s, IRAs)
and other savings and investments: 91 percent of those with some graduate school or advanced degree,
90 percent of college graduates, 82 percent of those with some college or trade school, and 73 percent of
those with a high school diploma or less. More than one-third of workers across levels of educational
attainment are expecting income from working to be a source of retirement income.
• Expected Primary Source of Income in Retirement. Most often, workers expect their primary source of
income in retirement to be through retirement accounts (e.g., 401(k)s, 403(b)s, or IRAs), a finding which
increases with higher educational attainment, including 35 percent of those with some college or trade
school, 44 percent of college graduates and 50 percent of workers with some graduate school or
advanced degree. In contrast, 27 percent of those with a high school education or less most likely expect
to rely on Social Security as their primary source of retirement income.
Influences of Educational Attainment on Retirement Readiness
291

• Importance of Retirement Benefits Compared to Other Benefits. More than 85 percent of workers across
all levels of educational attainment value a 401(k), 403(b), 457(b) or similar plan as an important benefit,
a finding that increases with higher educational attainment.
• Retirement Benefits Currently Offered. Although the majority of workers have access to employer-
sponsored retirement benefits, workers with higher educational attainment are more likely to be offered a
plan than workers with lower educational levels. An alarming 32 percent of workers with a high school
education or less and 26 percent of those with some college or trade school are not offered employee-
funded plans, compared to 18 percent of college graduates and 15 percent of those with post-graduate
education or graduate degree.
• Retirement Plan Participation. Among workers who are offered a 401(k) or similar plan, the participation
rate increases among workers with higher level of educational attainment. Specifically, 91 percent of
workers with some post-graduate education or graduate degree participate in their employer’s plan,
compared to 72 percent of those with a high school education or less.
• Retirement Plan Contribution Rate. Among workers who participate in a 401(k) or similar plan, those with
higher educational attainment continue to contribute a higher rate than workers with lower educational
levels. Specifically, college graduates contribute 10 percent (median) and those with a some graduate
school or advanced degree contribute 12 percent (median), in contrast to workers with some college or
trade school contribute 7 percent and those with a high school education or less contribute 6 percent
(median).
• Appeal of Automatic Enrollment. The majority of workers across the levels of educational attainment find
automatic enrollment into a 401(k) or similar retirement plan appealing. The percentage of those who find
this feature “very appealing” increases with level of educational attainment – 34 percent for workers with
a high school diploma or less to 45 percent of workers with some post-graduate education or graduate
degree.
Influences of Educational Attainment on Retirement Readiness
292
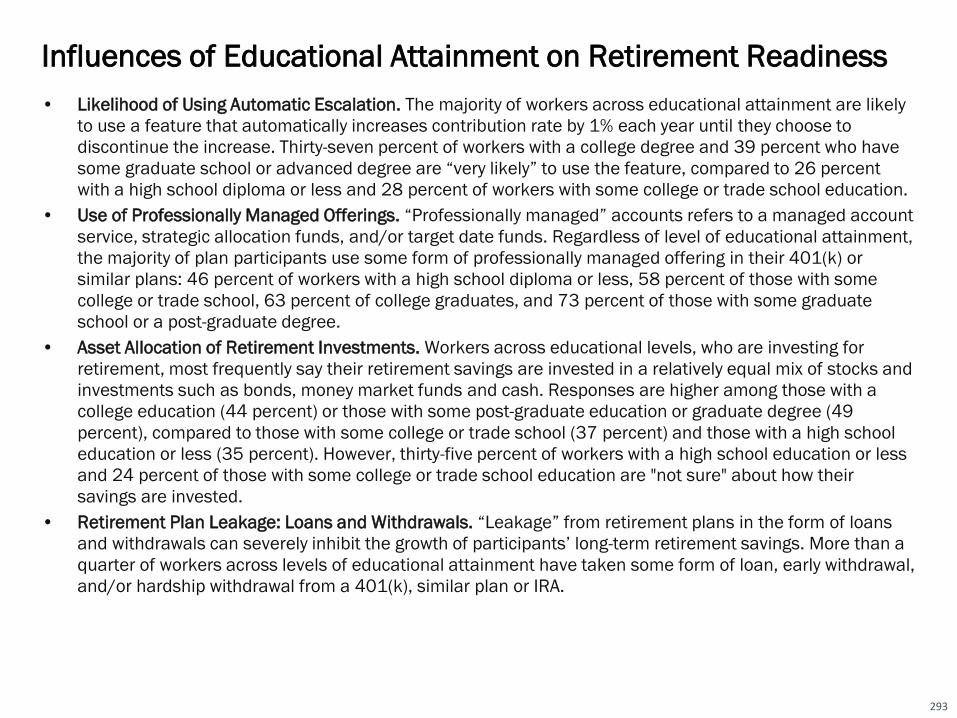
• Likelihood of Using Automatic Escalation. The majority of workers across educational attainment are likely
to use a feature that automatically increases contribution rate by 1% each year until they choose to
discontinue the increase. Thirty-seven percent of workers with a college degree and 39 percent who have
some graduate school or advanced degree are “very likely” to use the feature, compared to 26 percent
with a high school diploma or less and 28 percent of workers with some college or trade school education.
• Use of Professionally Managed Offerings. “Professionally managed” accounts refers to a managed account
service, strategic allocation funds, and/or target date funds. Regardless of level of educational attainment,
the majority of plan participants use some form of professionally managed offering in their 401(k) or
similar plans: 46 percent of workers with a high school diploma or less, 58 percent of those with some
college or trade school, 63 percent of college graduates, and 73 percent of those with some graduate
school or a post-graduate degree.
• Asset Allocation of Retirement Investments. Workers across educational levels, who are investing for
retirement, most frequently say their retirement savings are invested in a relatively equal mix of stocks and
investments such as bonds, money market funds and cash. Responses are higher among those with a
college education (44 percent) or those with some post-graduate education or graduate degree (49
percent), compared to those with some college or trade school (37 percent) and those with a high school
education or less (35 percent). However, thirty-five percent of workers with a high school education or less
and 24 percent of those with some college or trade school education are "not sure" about how their
savings are invested.
• Retirement Plan Leakage: Loans and Withdrawals. “Leakage” from retirement plans in the form of loans
and withdrawals can severely inhibit the growth of participants’ long-term retirement savings. More than a
quarter of workers across levels of educational attainment have taken some form of loan, early withdrawal,
and/or hardship withdrawal from a 401(k), similar plan or IRA.
Influences of Educational Attainment on Retirement Readiness
293

• Total Household Retirement Savings. Household retirement savings increase with higher educational
attainment. College graduates have saved $154,000 and those with some post-graduate education or
advanced degree have saved $225,000 (estimated medians) compared to workers with some college or
trade school who have saved $51,000 and those with a high school education or less who have saved
$36,000 (estimated medians). Fifty-nine percent of workers with some post-graduate education or
advanced degree have saved $250,000 or more compared to only 13 percent of workers with a high
school education or less.
• Estimated Retirement Savings Needs. Workers with higher educational attainment have higher estimated
retirement saving needs. College graduates estimate that they will need $700,000 and workers with some
graduate school or advanced degree estimate $1 million (medians), compared to workers with some
college or trade school estimating they will need $500,000 and those with a high school education or less
estimating $250,000 (medians).
• Basis for Estimating Retirement Savings Needs. Among workers who provided an estimate of their
retirement savings needs, the percentage of workers “guessing” the amount decreases with higher
educational attainment. Those with a high school education or less (56 percent) are most likely to have
guessed, compared to those with some graduate school or advanced degrees (27 percent). Few workers
across education levels used a retirement calculator to estimate their amount needed for retirement.
• Retirement Strategy: Written, Unwritten, or None. The likelihood of workers having a retirement strategy,
either written or unwritten, increases with higher educational attainment. Seventy-two percent of college
graduates and 81 percent of workers with some post-graduate education or graduate degree have a
retirement strategy, compared to only 54 percent of those with a high school diploma or less and 57
percent of those with some college or trade school. Workers with higher educational attainment are more
likely to have their retirement strategy written down.
Influences of Educational Attainment on Retirement Readiness
294

• Confidence that Financial Strategy Will Enable Travel Goals. Among those who dream of traveling in
retirement, workers’ confidence that their current financial strategy will enable travel goals varies by level
of education. The majority of workers with at least a college degree are confident, compared to just half of
non-college graduates. Some workers haven’t given it much thought, a finding that is more common
among workers with lower levels of educational attainment: 17 percent of workers with a high school
diploma or less and 16 percent of those with some college/trade school.
• Professional Financial Advisor Usage. Use of a professional financial advisor increases with higher
educational attainment. Workers who are college graduates (49 percent) and workers with some post-
graduate education or graduate degree (55 percent) are more likely to use a financial advisor than workers
with only some college or trade school (29 percent) or those with a high school education or less (33
percent).
• Awareness of Saver’s Credit. Level of awareness about the IRS Saver’s Credit -- a tax credit available to
eligible taxpayers who are saving for retirement in a qualified retirement plan or IRA increases with higher
educational attainment. College graduates (43 percent) and workers with some graduate school or a post-
graduate degree (51 percent) are more likely to be aware of the Saver’s Credit than workers with some
college or trade school (30 percent) and those with a high school education or less (29 percent).
• Awareness of the IRS’ Free File Program. Awareness of the IRS’ Free File program – a program that offers
federal income tax preparation software for free for eligible tax filers – increases with level of educational
attainment. Forty percent of those with a high school diploma or less attainment, 42 percent of those with
some college or trade school, 50 percent of college graduates and 51 percent of those with some graduate
school or advanced degree are aware of this program.
Influences of Educational Attainment on Retirement Readiness
295

41 4237
42 3843 47 44 47
4048 50 51 52 51
4449 53 56 58
13 913
15
7
1313
1213
8
24 21 16 1815 33 24
22 19 1354
51 50
57
45
5660
5660
49
72 7167
7066
7773 75 75
71
2017 2016 2015 2014 2013 2017 2016 2015 2014 2013 2017 2016 2015 2014 2013 2017 2016 2015 2014 2013
Very confident Somewhat confident
Data prior to 2017 shows results among workers in companies with 10+ workers. Data for 2017 shows results among workers in companies with 5+ workers.BASE: ALL QUALIFIED RESPONDENTSQ880. How confident are you that you will be able to fully retire with a lifestyle you consider comfortable?
Retirement confidence increases with workers’ level of education. Workers with only some college or trade
school education (56 percent) and those with high school diploma or less (54 percent) are less likely to be
“very” or “somewhat” confident that they will be able to fully retire with a comfortable lifestyle, compared to
college graduates (72 percent) and those with some graduate or advanced degrees (77 percent).
Confidence in Retiring Comfortably
296
N=1,107 N=535 N=629 N=567 N=734 N=1,834 N=1,470 N=1,577 N=1,480 N=1,278 N=2,488 N=1,393 N=1,513 N=1,284 N=994 N=943 N=763 N=831 N=812 N=645
High School or Less
Some College or Trade School College Graduate Some Grad. School
or Grad. Degree
Confidence in Retiring Comfortably
Very/Somewhat Confident (%) (NET)

Financial recovery from the Great Recession increases with level of educational attainment. Workers with a high
school education or less (23 percent) and those with some college or trade school (21 percent) are more likely to
say they have “not yet begun to recover” or “may never recover,” compared to workers with higher levels of
educational attainment. College graduates (48 percent) and those with some grad school or advanced degree
post-graduate degree (55 percent) are more likely to say that they were not impacted or have fully recovered than
those with lower levels of educational attainment.
Recovery From the Great Recession
297
Data prior to 2017 shows results among workers in companies with 10+ workers. Data for 2017 shows results among workers in companies with 5+ workers.BASE: ALL QUALIFIED RESPONDENTS Q2655. How would you describe your financial recovery from the deep recession in recent years, which is commonly referred to as the “Great Recession”?
How would you describe your financial recovery from the Great Recession?
23
21
18
14
17
17
30
41
37
41
38
33
17
12
9
8
6
9
5
4
High School orLess
Some Collegeor Trade School
CollegeGraduate
Some Grad.School or Grad.
Degree
NET - Not Impacted or Fully Recovered= 40%
NET - Not Yet Begun or Never Recover = 23%
2017 2016
I have fully recovered I have somewhat recovered I have not yet begun to recover I may never recoverI was not impacted
NET - Not Impacted or Fully Recovered= 38%
NET - Not Yet Begun or Never Recover = 21%
NET - Not Impacted or Fully Recovered= 48%
NET - Not Yet Begun or Never Recover = 14%
NET - Not Impacted or Fully Recovered= 55%
NET - Not Yet Begun or Never Recover = 12%
N=1,107
N=1,834
N=2,488
N=943
22
18
18
18
15
16
27
27
40
40
40
42
16
15
10
9
7
11
5
4
High School orLess
Some Collegeor Trade School
CollegeGraduate
Some Grad.School or Grad.
Degree
NET - Not Impacted or Fully Recovered= 37%
NET - Not Yet Begun or Never Recover = 23%
NET - Not Impacted or Fully Recovered= 34%
NET - Not Yet Begun or Never Recover = 26%
NET - Not Impacted or Fully Recovered= 45%
NET - Not Yet Begun or Never Recover = 15%
NET - Not Impacted or Fully Recovered= 45%
NET - Not Yet Begun or Never Recover = 13%
N=535
N=1,470
N=1,393
N=763

31 29 2430
2333 34 32 37
2636
42 43 43 40 38 41 41 45 40
1511
1212
7
12 12 1311
8
2722 18 18
14
36 26 2224
214640
3642
30
45 46 4648
34
63 6461 61
54
74
6763
69
61
2017 2016 2015 2014 2013 2017 2016 2015 2014 2013 2017 2016 2015 2014 2013 2017 2016 2015 2014 2013
Strongly agree Somewhat agree
Data prior to 2017 shows results among workers in companies with 10+ workers. Data for 2017 shows results among workers in companies with 5+ workers.BASE: ALL QUALIFIED RESPONDENTSQ800. How much do you agree or disagree that you are currently building a large enough retirement nest egg?
Workers’ level of agreement that they are building a large enough nest egg increases with educational
attainment. Fewer than half of workers with high school education or less (46 percent) and those with some
college or trade school (45 percent), “strongly” or “somewhat” agree that they are building a large enough nest
egg. In contrast, a majority of workers with a college degree (63 percent) and those with some post-graduate
education or advanced degree (74 percent) report higher levels of agreement.
Building a Large Enough Nest Egg?
298
Building a Large Enough Nest Egg
Strongly/Somewhat Agree (%) (NET)
N=1,107 N=535 N=629 N=567 N=734 N=1,834 N=1,470 N=1,577 N=1,480 N=1,278 N=2,488 N=1,393 N=1,513 N=1,284 N=994 N=943 N=763 N=831 N=812 N=645
High School or Less
Some College or Trade School College Graduate Some Grad. School
or Grad. Degree

“Traveling” is the most frequently cited retirement dream among workers across educational attainments: 61 percent of those with
high school or less, 70 percent of those with some college or trade school, 75 percent of college graduates, and 80 percent of those
with some graduate school or post-graduate degree. Many workers dream of some form of continued work in retirement; interestingly
this number increases with higher educational attainment, with about a quarter of non-college graduates compared to 32 percent of
college graduates and 46 percent of workers with some post-graduate education or graduate degree.
Retirement Dreams Include Leisure and Work
299
Data prior to 2017 shows results among workers in companies with 10+ workers. Data for 2017 shows results among workers in companies with 5+ workers.BASE: ALL QUALIFIED RESPONDENTS Q1418. How do you dream of spending your retirement? Select all.
How do you dream of spending your retirement? Please select all that apply. (%)
High School or Less Some College or
Trade School College Graduate
Some Grad. School or Grad. Degree
■ 2017 (N=1,107) ■ 2017 (N=1,834) ■ 2017 (N=2,488) ■ 2017 (N=943)
■ 2016 (N=535) ■ 2016 (N=1,470) ■ 2016 (N=1,393) ■ 2016 (N=763)
Traveling
Spending more time with family and friends
Pursuing hobbies
Doing volunteer work
Pursuing an encore career (pursuing a new role, work, activity, or career)
Starting a business
Continue working in the same field
Other
None of the above
61
56
44
19
9
10
10
5
3
53
57
43
18
10
12
12
7
5
70
55
49
24
13
12
9
5
2
65
53
48
26
11
9
8
8
4
75
58
54
33
14
14
13
5
2
73
60
55
34
17
13
13
6
2
80
60
58
34
24
22
19
3
2
73
58
54
36
14
13
18
4
4
NET: Working2017: 25%2016: 28%
NET: Working2017: 28%2016: 24%
NET: Working2017: 32%2016: 31%
NET: Working2017: 46%2016: 36%

How Much Do You Agree or Disagree?
Strongly/Somewhat Agree (%) (NET)
High School or Less
Some College or Trade School
College Graduate
Some Grad. School or Graduate Degree
■ 2017 (N=1,107)
■ 2016 (N=535)
■ 2015 (N=629)
■ 2014 (N=567)
■ 2013 (N=734)
■ 2017 (N=1,834)
■ 2016 (N=1,470)
■ 2015 (N=1,577)
■ 2014 (N=1,480)
■ 2013 (N=1,278)
■ 2017 (N=2,488)
■ 2016 (N=1,393)
■ 2015 (N=1,513)
■ 2014 (N=1,284)
■ 2013 (N=994)
■ 2017 (N=943)
■ 2016 (N=763)
■ 2015 (N=831)
■ 2014 (N=812)
■ 2013 (N=645)
**Compared to my parent's generation, people in my generation will have a much harder time in achieving financial security
**I am concerned that when I am ready to retire, Social Security will not be there for me
*My current employer is supportive of its employees working past 65
I do not know as much as I should about retirement investing
I would like to receive more information and advice from my employer on how to reach my retirement goals
I could work until age 65 and still not have enough money saved to meet my retirement needs
I am currently very involved in monitoring and managing my retirement savings
I would prefer to rely on outside experts to monitor and manage my retirement savings plan
I prefer not to think about or concern myself with retirement investing until I get closer to my retirement date
76
74
78
58
68
55
79
61
41
77
73
76
60
69
59
77
57
39
81
67
54
60
53
80
55
30
78
71
52
60
55
82
54
30
57
62
58
74
52
25
79
76
73
62
70
63
71
62
39
79
75
70
60
69
59
68
60
37
81
74
59
62
61
70
58
37
80
73
59
65
63
71
57
33
65
58
65
67
51
37
77
75
71
70
62
67
61
56
35
82
78
73
70
63
66
60
56
38
79
76
68
58
66
63
51
38
83
75
71
63
69
70
56
36
73
61
75
59
52
34
83
79
69
74
65
72
56
52
45
85
79
71
77
64
73
55
56
48
82
81
77
63
75
52
52
46
82
81
76
64
72
61
55
48
73
60
69
51
50
37Data prior to 2017 shows results among workers in companies with 10+ workers. Data for 2017 shows results among workers in companies with 5+ workers.*added in 2016 **added in 2014BASE: ALL QUALIFIED RESPONDENTS Q930. How much do you agree or disagree with each of the following statements regarding retirement investing?
Across levels of educational attainment, more than three-quarters of workers feel that their generation will have a much
harder time achieving financial security compared to their parent’s generation. Strong majorities also feel that Social
Security will not be there when they are ready to retire.
Retirement Beliefs, Preparations, and Involvement
300
N/A
N/A
N/A
N/A
N/A
N/A
N/A
N/A
N/A
N/A
N/A
N/A

Most workers across levels of educational attainment expect to retire after age 65 or do not plan to retire,
including 55 percent of those with a high school education or less, 57 percent of those with some college or trade
school, 49 percent of college graduates, and 48 percent of those with some graduate school or advanced degree.
Additionally, twice as many workers with a high school education or less (18 percent) do not plan to retire
compared to workers with some graduate school or advanced degree (9 percent).
Expected Retirement Age
301
18 20 19 1520
13 12 15 15 1911 9 9 9 10 9 10 11 11 11
3738 39
4238
44 4347
4242
38 42 45 41 4339 40 41 45 46
22 20 21 23 19 21 2319
2320
27 2426
27 25
20 19 1922 22
23 22 21 20 23 22 22 19 20 1924 25
20 23 2232 31 29
22 21
2017 2016 2015 2014 2013 2017 2016 2015 2014 2013 2017 2016 2015 2014 2013 2017 2016 2015 2014 2013
Before Age 65
At Age 65
After Age 65
Do Not Plan to Retire
Data prior to 2017 shows results among workers in companies with 10+ workers. Data for 2017 shows results among workers in companies with 5+ workers.BASE: ALL QUALIFIED RESPONDENTSQ910. At what age do you expect to retire?
N=1,107 N=535 N=629 N=567 N=734 N=1,834 N=1,470 N=1,577 N=1,480 N=1,278 N=2,488 N=1,393 N=1,513 N=1,284 N=994 N=943 N=763 N=831 N=812 N=645
High School or Less
Some College or Trade School
College Graduate Some Grad. School or Grad. Degree
Age Expecting to Retire (%)

Expectations of working in retirement are similar across education attainment, with more than half of workers
planning to continue working in retirement: 58 percent of those with some graduate school or advanced degree,
57 percent with some college or trade school education, 56 percent of college graduates, and 55 percent with a
high school education or less. At least one in 10 workers across levels of educational attainment plan to work
full-time in retirement.
Planning to Work in Retirement
302
Data prior to 2017 shows results among workers in companies with 10+ workers. Data for 2017 shows results among workers in companies with 5+ workers.
BASE: ALL QUALIFIED RESPONDENTSQ1525. Do you plan to work after you retire?
Planning to Work in Retirement (%)
Yes, I plan to work full-timeYes, I plan to work part-timeNo, I do not plan to workNot sure
2017 2016 2015 2014 2013 2017 2016 2015 2014 2013 2017 2016 2015 2014 2013 2017 2016 2015 2014 2013
N=1,107 N=535 N=629 N=567 N=734 N=1,834 N=1,470 N=1,577N=1,480N=1,278 N=2,488 N=1,393 N=1,513N=1,284N=994 N=943 N=763 N=831 N=812 N=645
High School or Less
Some College or Trade School
College Graduate Some Grad. School or Grad. Degree
41 36 32 38 3947
38 44 4047 41 37 39 39 44 39 42 44 44 49
1415
1412 11
10
1210 12
1015
13 12 12 7 19 14 12 1312
26 22 25 26 20 2129 24 26
1826 31 27 28
21 27 27 25 3017
20 2729 24 30 22
2122 22
2518
19 22 2128 14 17 19 13
22
Yes (NET): 4650 50
54 5257
51 51 5156 57
6156
50505150
565755
58
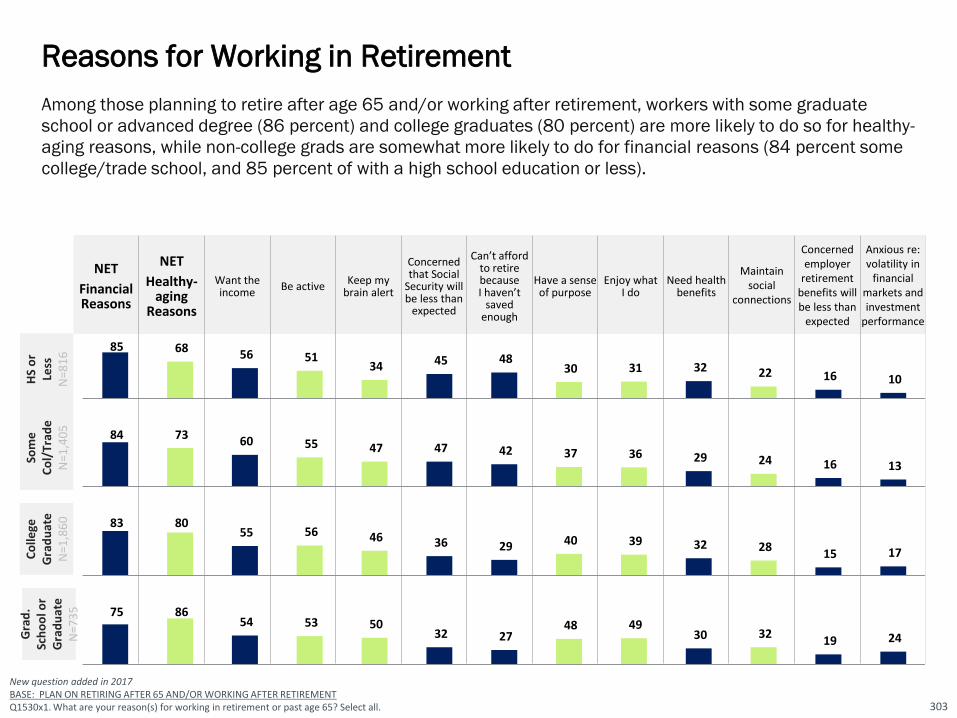
Among those planning to retire after age 65 and/or working after retirement, workers with some graduate
school or advanced degree (86 percent) and college graduates (80 percent) are more likely to do so for healthy-
aging reasons, while non-college grads are somewhat more likely to do for financial reasons (84 percent some
college/trade school, and 85 percent of with a high school education or less).
Reasons for Working in Retirement
303
NET
Financial Reasons
NET
Healthy-aging
Reasons
Want the income
Be activeKeep my
brain alert
Concerned that Social
Security will be less than
expected
Can’t afford to retire because I haven’t
saved enough
Have a sense of purpose
Enjoy what I do
Need health benefits
Maintain social
connections
Concernedemployer
retirement benefits will be less than
expected
Anxious re: volatility in
financial markets and investment
performance
85 68 56 51 34 45 48
30 31 32 22 16 10 HS
or
Less
N=8
16
84 73 60 55 47 47 42 37 36 29 24 16 13
83 80 55 56 46 36 29 40 39 32 28
15 17
New question added in 2017BASE: PLAN ON RETIRING AFTER 65 AND/OR WORKING AFTER RETIREMENTQ1530x1. What are your reason(s) for working in retirement or past age 65? Select all.
75 86 54 53 50
32 27 48 49
30 32 19 24
Som
e
Co
l/Tr
ade
N=1
,40
5
Co
llege
G
rad
uat
eN
=1,8
60
Gra
d.
Sch
oo
l or
Gra
du
ate
N=7
35

High School or Less
Some College or Trade School College Graduate Some Grad. School
or Grad. Degree ■ 2017 (N=1,107)
■ 2016 (N=535)
■ 2015 (N=629)
■ 2014 (N=567)
■ 2017 (N=1,834)
■ 2016 (N=1,470)
■ 2015 (N=1,577)
■ 2014 (N=1,480)
■ 2017 (N=2,488)
■ 2016 (N=1,393)
■ 2015 (N=1,513)
■ 2014 (N=1,284)
■ 2017 (N=943)
■ 2016 (N=763)
■ 2015 (N=831)
■ 2014 (N=812)
Continue working as long as possible in current or similar position until I cannot work anymore
Transition (NET)
Transition into retirement by reducing work hours
Transition into retirement by working in a different capacity
PLAN TO STOP (NET)
Immediately stop working once I reach a specific age
Immediately stop working once I save a specific amount of money
Not sure
Many workers envision a phased transition into retirement by changing work patterns (e.g., reducing work hours
or working in a different capacity). Workers with some graduate school or graduate degree (51 percent) and
those with college degrees (50 percent) are somewhat more likely to expect this phased transition in contrast to
those with some college or trade school (47 percent) and those with a H.S. education or less (41 percent).
Retirement Transitions: Phased Versus Immediate
304
Data prior to 2017 shows results among workers in companies with 10+ workers. Data for 2017 shows results among workers in companies with 5+ workers.BASE: ALL QUALIFIED RESPONDENTSQ1545. How do you envision transitioning into retirement?
How do you envision transitioning into retirement? (%)
24
41
27
14
21
14
7
14
31
36
25
11
17
10
7
16
23
32
22
10
20
13
7
25
20
42
28
14
18
10
8
20
20
47
32
15
22
14
8
11
20
44
29
15
23
15
8
13
22
42
25
17
21
15
6
15
19
48
31
17
20
14
6
12
18
50
29
21
24
15
9
8
17
45
29
16
29
19
10
9
18
47
30
17
23
15
8
12
16
46
27
19
26
16
10
12
17
51
32
19
26
16
10
6
15
48
30
18
26
14
13
10
15
52
29
23
21
13
8
12
19
68
31
18
24
13
10
9

Phased Retirement and Compensation-Related Expectations
New question added in 2017BASE: RESPONDENTS WHO ENVISION A PHASED TRANSITION INTO RETIREMENTQ1546. In thinking about your vision of transitioning into retirement, to what extent do you agree or disagree with the following statements? 329
Across all levels of educational attainment, workers who envision a phased transition into retirement share
similar feelings regarding phased retirement and compensation-related expectations. However, as educational
attainment increases workers are more likely to expect to be paid the market rate for duties involved, even if it
means a reduction in their current level of pay, and are more likely to expect their job title to change if they were
to take on a new role with fewer responsibilities.
High School or LessN=431
Some College or Trade School N=862
College GraduateN=1,241
Some Grad. School or Graduate Degree N=479
If I reduce my work hours at my current employer, I would expect to be paid the same hourly rate for hours worked that I am earning now.
If I were to take on a new role with fewer responsibilities at my current employer, I would expect my job title to change.
If I were to take on a new role with fewer responsibilities at my current employer, I would expect to be paid the market rate for the duties involved, even if it means a reduction in my current level of pay.
If I were to shift from full-time to part-time at my current employer, I would expect to receive the same employee benefits that I have now.
In thinking about your vision of transitioning into retirement, to what extent do you agree or disagree with the following statements? (NET - Agree %)
76
73
62
64
82
84
84
58
80
77
69
57
78
80
76
61

Perceptions of Older Workers
306
High School or LessN=1,107
Some College or Trade School N=1,834
College GraduateN=2,488
Some Grad. School or Graduate Degree N=943
NET – Positive perceptions
Bring more knowledge, wisdom, and life experience
Are more responsible, reliable, and dependable
Are a valuable resource for training and mentoring
Are an important source of institutional knowledge
Are more adept at problem-solving
Are better at getting along with others in a team environment
NET – Negative perceptions
Have higher healthcare costs
Command higher wages and salaries
Are less open to learning and new ideas
Have higher disability costs
Have outdated skill sets
Are less productive
Other
None
New question added in 2017BASE: ALL QUALIFIED RESPONDENTS Q1528. What are your perceptions of workers age 50 and older compared to younger workers in today’s workforce? Select all.
The majority of workers across levels of educational attainment share positive perceptions of workers age 50 or
older compared to younger workers in today’s workforce. However, negative perceptions such as their having
higher healthcare costs and commanding higher wages increase with higher levels of educational attainment.
83
66
60
53
45
35
33
53
29
18
18
13
13
9
1
8
82
59
57
45
36
34
28
46
21
15
15
10
10
8
1
9
85
61
55
51
44
33
31
60
31
24
23
17
14
11
1
6
84
61
54
54
48
35
33
66
37
32
26
20
18
13
1
7
Perceptions of workers age 50+ compared to younger workers in today’s workforce? (%)

Age That Workers Consider a Person to Be “Old”
307
12 1217
105
1
39
410
1417
11
2 1
42
39
1420
10
3 1
40
3
10
2017
11
3<1
35
4
<60 60-69 70-79 80-89 90-99 100+ It depends on theperson
Not Sure
Age When Person is Considered “Old” (%)
When asked the age at which they consider a person to be “old,” about four in 10 workers across levels of
educational attainment say “it depends on the person”: 39 percent of those with a high school diploma or less,
42 percent with some college or trade school, 40 percent of college graduates and 35 percent with some
graduate school or advanced degree. Seventy years old is the median age given across all levels of educational
attainment.
Median Age
High School or Less (N=1,107) Age 70Some College or Trade School (N=1,834) Age 70College Graduate (N=2,488) Age 70Some Grad. School or Graduate Degree (N=943) Age 70
New question added in 2017BASE: ALL QUALIFIED RESPONDENTS Q1526. At what age do you consider a person to be “old”?
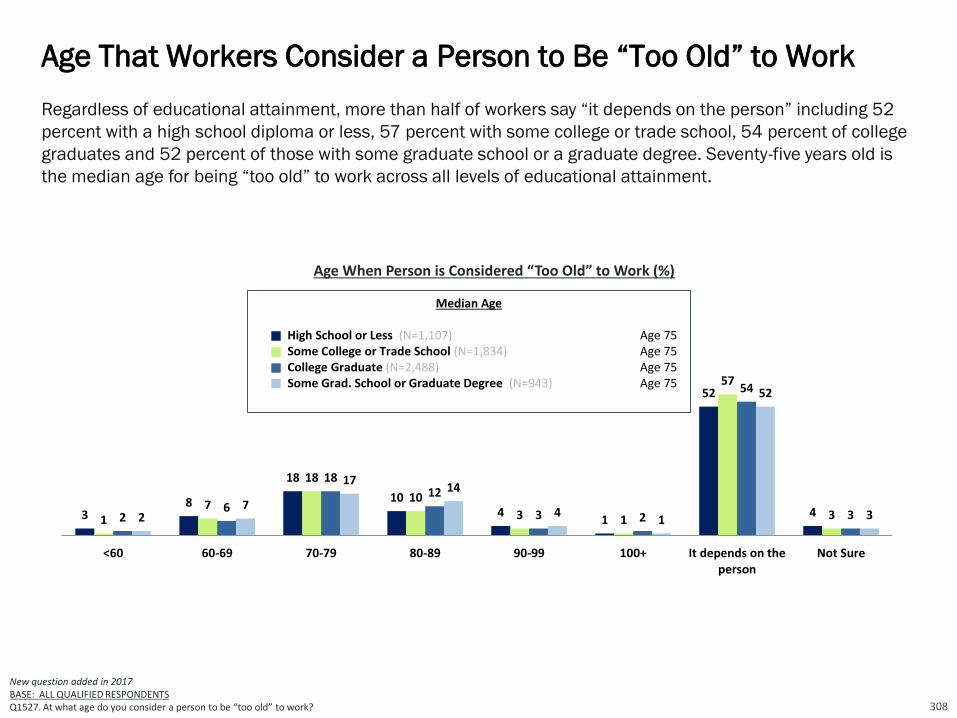
38
18
104
1
52
41
7
18
10
3 1
57
326
1812
3 2
54
327
1714
41
52
3
<60 60-69 70-79 80-89 90-99 100+ It depends on theperson
Not Sure
Median Age
High School or Less (N=1,107) Age 75Some College or Trade School (N=1,834) Age 75College Graduate (N=2,488) Age 75Some Grad. School or Graduate Degree (N=943) Age 75
Age That Workers Consider a Person to Be “Too Old” to Work
308
Age When Person is Considered “Too Old” to Work (%)
New question added in 2017BASE: ALL QUALIFIED RESPONDENTS Q1527. At what age do you consider a person to be “too old” to work?
Regardless of educational attainment, more than half of workers say “it depends on the person” including 52
percent with a high school diploma or less, 57 percent with some college or trade school, 54 percent of college
graduates and 52 percent of those with some graduate school or a graduate degree. Seventy-five years old is
the median age for being “too old” to work across all levels of educational attainment.

Level of Concern About Health in Older Age
Concern about health in older age is similar across levels of educational attainment. Seventy-five percent of
workers with a high school diploma or less are “very” or “somewhat” concerned about their health in old age,
compared to 72 percent of both college graduates and those with some graduate school or advanced degree,
and 71 percent of those with some college or trade school.
New question added in 2017BASE: ALL QUALIFIED RESPONDENTSQ1445X1. How concerned are you about your health in older age?
High School or Less2017 (N=1,107)
Some College or Trade School2017 (N=1,834)
College Graduate2017 (N=2,488)
Some Grad. School or Graduate Degree 2017 (N=943)
23
52
20
521
50
24
5
23
49
24
4
28
44
24
4
NET – Concerned:75%
Very concerned Somewhat concerned Not too concerned Not at all concerned
Concerned About Health in Older Age (%)
NET – Concerned:71%
NET – Concerned:72%
NET – Concerned:72%
309
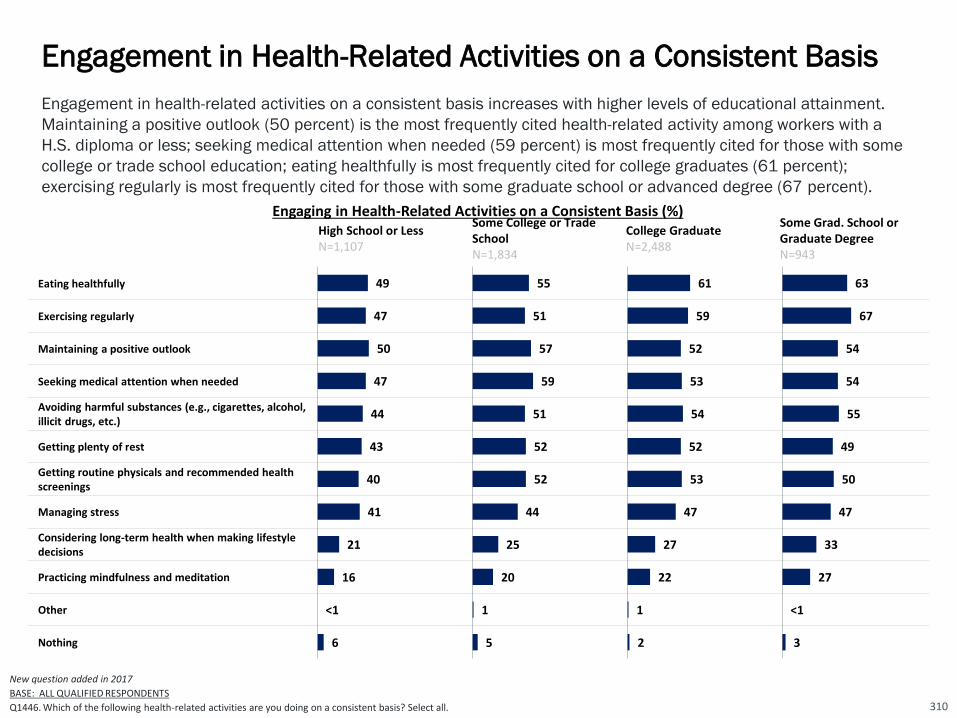
Engagement in Health-Related Activities on a Consistent Basis
High School or Less N=1,107
Some College or Trade SchoolN=1,834
College GraduateN=2,488
Some Grad. School or Graduate Degree N=943
Eating healthfully
Exercising regularly
Maintaining a positive outlook
Seeking medical attention when needed
Avoiding harmful substances (e.g., cigarettes, alcohol, illicit drugs, etc.)
Getting plenty of rest
Getting routine physicals and recommended health screenings
Managing stress
Considering long-term health when making lifestyle decisions
Practicing mindfulness and meditation
Other
Nothing
Engaging in Health-Related Activities on a Consistent Basis (%)
49
47
50
47
44
43
40
41
21
16
<1
6
New question added in 2017
BASE: ALL QUALIFIED RESPONDENTS
Q1446. Which of the following health-related activities are you doing on a consistent basis? Select all. 310
Engagement in health-related activities on a consistent basis increases with higher levels of educational attainment.
Maintaining a positive outlook (50 percent) is the most frequently cited health-related activity among workers with a
H.S. diploma or less; seeking medical attention when needed (59 percent) is most frequently cited for those with some
college or trade school education; eating healthfully is most frequently cited for college graduates (61 percent);
exercising regularly is most frequently cited for those with some graduate school or advanced degree (67 percent).
55
51
57
59
51
52
52
44
25
20
1
5
63
67
54
54
55
49
50
47
33
27
<1
3
61
59
52
53
54
52
53
47
27
22
1
2
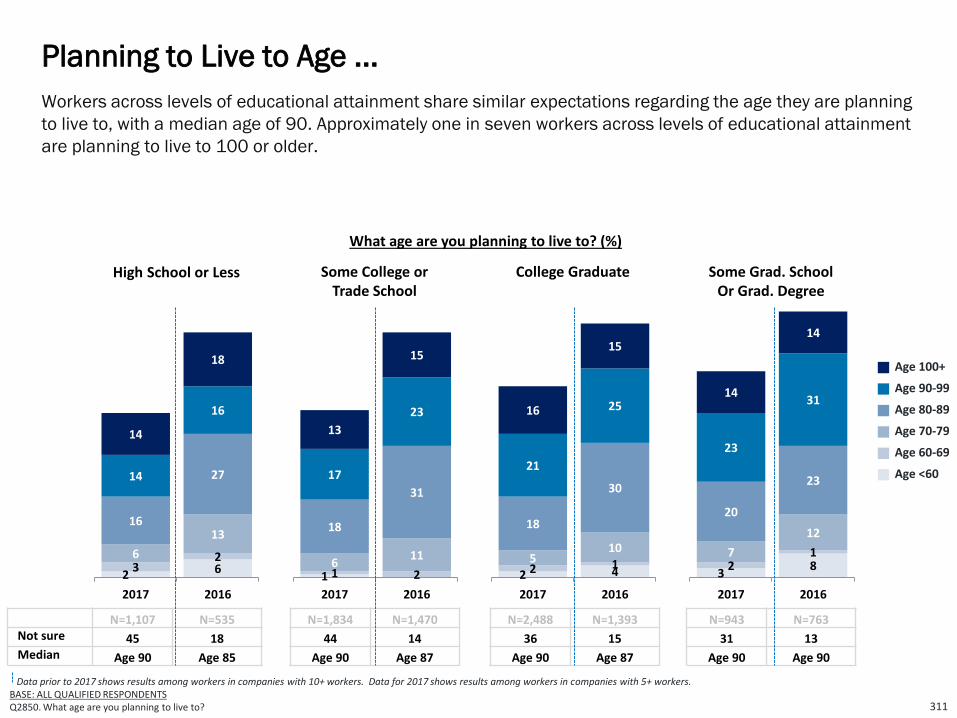
Workers across levels of educational attainment share similar expectations regarding the age they are planning
to live to, with a median age of 90. Approximately one in seven workers across levels of educational attainment
are planning to live to 100 or older.
Planning to Live to Age ...
311
Data prior to 2017 shows results among workers in companies with 10+ workers. Data for 2017 shows results among workers in companies with 5+ workers.BASE: ALL QUALIFIED RESPONDENTS Q2850. What age are you planning to live to?
High School or Less Some College orTrade School
College Graduate Some Grad. SchoolOr Grad. Degree
What age are you planning to live to? (%)
N=1,107 N=535Not sure 45 18Median Age 90 Age 85
N=1,834 N=1,470
44 14
Age 90 Age 87
N=2,488 N=1,393
36 15
Age 90 Age 87
N=943 N=763
31 13
Age 90 Age 90
Age 100+
Age 90-99
Age 80-89
Age 70-79
Age 60-69
Age <60
2 6326
1316
2714
16
14
18
2017 2016
1 1 26
11
18
31
17
23
13
15
2017 2016
2 42 1510
18
30
21
2516
15
2017 2016
38217
12
20
23
23
3114
14
2017 2016

Workers’ financial priorities vary across levels of educational attainment. “Saving for retirement” is the most frequently
cited priority among workers with a college degree (66 percent) and those with a some post-graduate education or
graduate degree (71 percent) while “building savings” is more frequently cited among workers with some college or
trade school (61 percent) and those with a H.S. diploma or less (55 percent). A common financial priority across
educational attainment is paying off debt.
Current Financial Priorities
312BASE: ALL QUALIFIED RESPONDENTSQ2639. Which of the following are your financial priorities right now? Select all.
High School or LessSome College or Trade School
College Graduate
Some Grad. School or Graduate Degree
■ 2017 (N=1,107) ■ 2017 (N=1,834) ■ 2017 (N=2,488) ■ 2017 (N=943)
NET – Paying off debt
Paying off credit card debt
Paying off mortgage
Paying off student loans
Paying off other consumer debt
Building savings
Saving for retirement
Just getting by to cover basic living expenses
Supporting children
Paying healthcare expenses
Creating an inheritance or financial legacy
Supporting parents
Other
61
41
27
7
15
55
45
44
26
23
7
8
4
Current Financial Priorities (%)
64
37
38
20
16
56
71
19
40
29
22
16
4
69
43
37
22
16
62
66
26
33
25
14
12
3
69
48
30
17
19
61
55
38
28
24
9
9
4

“Just getting by to cover basic living expenses” is the most often cited greatest financial priority among non-college graduates (24
percent of workers with H.S. diploma or less and 20 percent of those with some college or trade school). In contrast, “saving for
retirement” is the greatest financial priority for 27 percent of workers with college degree and 30 percent of those with some
graduate school or advanced degree. Yet across levels of educational attainment, “paying off debt (NET)” ranks as the greatest
financial priority for more than a quarter of workers.
Greatest Financial Priority Right Now
313BASE: ALL QUALIFIED RESPONDENTS Q2640. Which one of the following is your greatest financial priority right now?
High School or LessSome College or Trade School
College Graduate
Some Grad. School or Graduate Degree
■ 2017 (N=1,107) ■ 2017 (N=1,834) ■ 2017 (N=2,488) ■ 2017 (N=943)
NET – Paying off debt
Paying off credit card debt
Paying off mortgage
Paying off student loans
Paying off other consumer debt
Saving for retirement
Just getting by to cover basic living expenses
Building savings
Supporting children
Paying healthcare expenses
Supporting parents
Creating an inheritance or financial legacy
Other
28
14
9
1
3
15
24
14
12
2
2
1
2
Greatest Financial Priority Right Now (%)
29
13
9
4
2
30
7
10
12
4
1
4
2
29
14
9
4
2
27
10
11
14
2
2
2
2
33
20
9
2
2
16
20
14
10
3
2
1
1

Credit card debt is the most common type of household debt across levels of educational attainment, with more
than half indicating having such debt. Car loans are the second most frequently cited type of household debt
among workers with a high school diploma or less (37 percent) and some college or trade school education (45
percent). In contrast, a mortgage is the second most common type of household debt among workers with a
college degree (47 percent) and workers who have some graduate school education or advanced degree (48
percent).
Types of Household Debt
314
Which of the following types of debtdoes your household currently have? Select all (%)
High School or Less N=1,107
Some College or Trade SchoolN=1,834
College GraduateN=2,488
Some Grad. School or Graduate Degree N=943
Credit card
Mortgage
Car loan
Student loan
Medical debt
Personal loan
Home equity loan
Loan from family or friends
Tax debt
Payday loan
Business loan
Investment debt
Other debt
My household currently does not have any debts
56
34
37
11
17
13
5
6
5
4
2
1
4
15
64
44
45
25
18
15
9
7
6
5
1
2
4
11
58
47
40
24
11
13
10
5
7
5
5
5
2
13
58
48
37
22
11
17
18
8
8
7
9
8
2
18
New question added in 2017BASE: ALL QUALIFIED RESPONDENTS Q1286. Which of the following types of debt does your household currently have? Select all.
NET – Has Debt = 85% NET – Has Debt = 89% NET – Has Debt = 87% NET – Has Debt = 82%

Emergency savings can help cover the cost of a major financial setback (e.g., unemployment, medical bills,
home repairs, auto repairs, other); however, many workers have saved little. Workers with a high school
education or less have saved just $1,000 (median) and those with some college or trade school have saved
$3,000 (median), compared to college graduates who have saved $10,000 (median) and workers with some
graduate school or a graduate degree have saved $15,000 (median) for such emergencies.
Estimated Emergency Savings
315
Data prior to 2017 shows results among workers in companies with 10+ workers. Data for 2017 shows results among workers in companies with 5+ workers.BASE: ALL QUALIFIED RESPONDENTS Q2825. How much do you have in emergency savings specifically to cover the cost of unexpected major financial setbacks (e.g., unemployment, medical bills, home repairs, auto repairs, other)?
High School or Less Some College or Trade School
College Graduate Some Grad. Schoolor Grad. Degree
How much do you have in emergency savings to cover the cost of unexpected major financial setbacks? (%)
27 30
1717
66553 22 2
8 922
2017 2016
$100k or more
$25k to less than $100k
$20k to less than $25k
$15k to less than $20k
$10k to less than $15k
$5k to less than $10k
$1k to less than $5k
Less than $1k
Not sure 30 27 23 25 22 22 19 18
Median $1,000 $1,000 $3,000 $4,000 $10,000 $10,000 $15,000 $25,000
25 23
16 16
9 10
7 5
32
33
1213
2 3
2017 2016
14 12
1511
89
89
34
44
19 23
7 7
2017 2016
12 13
8 6
8 8
10 7
42
43
2431
11 12
2017 2016N=1,107 N=535 N=1,834 N=1,470 N=2,488 N=1,393 N=943 N=763

Data prior to 2017 shows results among workers in companies with 10+ workers. Data for 2017 shows results among workers in companies with 5+ workers.BASE: THOSE CURRENTLY OFFERED QUALIFIED PLANQ1190. Do you currently participate in, or have money invested in your company’s employee-funded retirement savings plan?BASE: ALL QUALIFIED RESPONDENTSQ740. Are you currently saving for retirement outside of work, such as in an IRA, mutual funds, bank account, etc.?BASE: INVESTING FOR RETIREMENTQ790. At what age did you first start saving for retirement?
Savings rates increase with higher levels of educational attainment. College graduates (87 percent) and those
with some post-graduate education or graduate degree (93 percent) are more likely to be saving for retirement
through an employer sponsored retirement plan and/or outside of work, in contrast to those with some college
or trade school (76 percent) and those with a high school diploma or less (65 percent). Adding to this trend,
workers with at least a college degree started saving earlier at age (25 median), compared to those with some
college or trade school (median age 29) and those with a high school diploma or less (median age 30).
Saving for Retirement / Age Started Saving
316
65 6760
65 6776 72 75 78 74
87 86 87 88 8793 91 90 90 92
2017 2016 2015 2014 2013 2017 2016 2015 2014 2013 2017 2016 2015 2014 2013 2017 2016 2015 2014 2013
N=1,107
N=535
N=629
N=567
N=734
N=1,834
N=1,470
N=1,577
N=1,480
N=1,278
N=2,488
N=1,393
N=1,513
N=1,284
N=994
N=943
N=763
N=831
N=812
N=645
Age Started Saving
(Median)
30 30 30 30 30 29 28 30 30 30 25 25 25 25 25 26 25 25 25 25
High School or LessSome College or
Trade School College Graduate
Some Grad. School or Grad. Degree
Workers Who Are Saving For Retirement Through an Employer-Sponsored Retirement Plan And/Or Outside of Work (%)

Data prior to 2017 shows results among workers in companies with 10+ workers. Data for 2017 shows results among workers in companies with 5+ workers.BASE: ALL QUALIFIED RESPONDENTS Q1145. Which one of the following do you expect to be sources of income to cover your living expenses after you retire? Select all.
Across levels of education, the majority of workers expect retirement income from self-funded savings including
retirement accounts (e.g., 401(k)s, 403(b)s, IRAs) and other savings and investments: 91 percent of those with
some graduate school or advanced degree, 90 percent of college graduates, 82 percent of those with some
college or trade school, and 73 percent of those with a high school diploma or less. More than one-third of
workers across levels of educational attainment are expecting income from working to be a source of
retirement income.
Expected Sources of Retirement Income
317
Expected Sources of Income During Retirement (%)
High School or LessSome College or Trade School
College GraduateSome Grad. School or Grad. Degree
■ 2017 (N=1,107) ■ 2017 (N=1,834) ■ 2017 (N=2,488) ■ 2017 (N=943)
■ 2016 (N=535) ■ 2016 (N=1,470) ■ 2016 (N=1,393) ■ 2016 (N=763)
NET – Self-Funded Savings
401(k) / 403(b) Accounts / IRAs
Other savings and investments
Social Security
Working
Company-funded pension plan
Home equity
Inheritance
Other
73
58
42
72
41
18
7
8
3
65
56
30
71
41
21
7
8
5
82
71
49
77
38
23
13
10
3
78
67
47
73
40
25
14
10
4
90
80
56
73
36
25
17
13
2
87
80
57
69
35
29
18
16
3
91
85
63
70
39
33
26
16
3
88
78
66
67
34
28
18
12
4

High School or Less
Some College or Trade School
College Graduate
Some Grad. School or Graduate Degree
■ 2017(N=1,107)■ 2016(N=535)
■ 2015(N=629)
■ 2014(N=567)■ 2013(N=734)
■ 2017 (N=1,834)■ 2016 (N=1,470)■ 2015(N=1576)■ 2014 (N=1,278)■ 2013 (N=1,278)
■ 2017 (N=2,488)■ 2016 (N=1,393)■ 2015 (N=1,513)■ 2014 (N=1,284)■ 2013 (N=994)
■ 2017 (N=943)■ 2016 (N=763)■ 2015 (N=831)■ 2014 (N=812)■ 2013 (N=645)
401(k) / 403(b) accounts / IRAs
Social Security
*Working
Other savings and investments
Company-funded pension plan
Inheritance
Home equity
Other
30
36
16
8
1
2
7
34
37
12
8
1
1
7
28
36
16
8
5
2
1
4
28
29
22
5
8
2
2
4
27
33
20
10
6
2
1
2
Data prior to 2017 shows results among workers in companies with 10+ workers. Data for 2017 shows results among workers in companies with 5+ workers.*added in 2015BASE: ALL QUALIFIED RESPONDENTS Q1150. Which one of the following do you expect to be your primary source of income to cover your living expenses after you retire?
Most often, workers expect their primary source of income in retirement to be through retirement accounts (e.g.,
401(k)s, 403(b)s, or IRAs), a finding which increases with higher educational attainment, including 35 percent of
those with some college or trade school, 44 percent of college graduates and 50 percent of workers with some
graduate school or advanced degree. In contrast, 27 percent of those with a high school education or less most
likely expect to rely on Social Security as their primary source of retirement income.
Expected Primary Source of Income in Retirement
318
35
34
13
10
2
1
5
36
32
15
8
2
1
5
30
29
15
13
8
1
1
3
32
30
15
12
7
1
1
2
35
30
11
13
7
1
1
1
52
17
18
5
3
1
3
56
13
16
6
3
2
3
49
18
9
14
5
3
1
1
47
17
10
13
7
2
2
2
44
20
12
13
7
2
2
1
52
13
16
10
5
1
3
55
12
17
6
2
3
4
50
12
9
15
7
3
2
2
44
16
9
19
7
2
1
2
50
10
11
16
8
2
3
1
N/A N/A N/A N/A
Expected Primary Source of Income in Retirement (%)

High School or Less
Some College or Trade School
College Graduate
Some Grad. School or Graduate Degree
■ 2017 (N=1,107)■ 2016 (N=535)
■ 2015 (N=629)
■ 2014 (N=567)■ 2013 (N=734)
■ 2017 (N=1,834)■ 2016 (N=1,470)
■ 2015 (N=1,577)■ 2014 (N=1,480)■ 2013 (N=1,278)
■ 2017 (N=2,488)■ 2016 (N=1,393)
■ 2015 (N=1,513)
■ 2014 (N=1,284)■ 2013 (N=994)
■ 2017 (N=943)
■ 2016 (N=763)
■ 2015 (N=831)
■ 2014 (N=812)■ 2013 (N=645)
Health insurance
401(k) / 403(b) / 457(b) or other employee self-funded plan
Life insurance
Disability insurance
Long-Term Care insurance
Company-funded defined-benefit pension plan
*A company-funded cash balance plan
Critical Illness Insurance
**Financial Wellness Program
**Employee Assistance Program
**Workplace Wellness Program
Cancer Insurance
More than 85 percent of workers across all levels of educational attainment value a 401(k), 403(b), 457(b) or
similar plan as an important benefit, a finding that increases with higher educational attainment.
Data prior to 2017 shows results among workers in companies with 10+ workers. Data for 2017 shows results among workers in companies with 5+ workers.*added in 2014; **added in 2017BASE: ALL QUALIFIED RESPONDENTS
Q1170. Businesses typically offer a number of different benefits for their workers. For each of the following, please tell us how important that benefit is to you, personally.
Importance of Retirement Benefits Compared to Other Benefits
319
Very/Somewhat Important(%) (NET)
N/A
95
85
79
74
73
73
68
67
65
65
60
62
94
84
80
81
71
68
51
66
58
58
58
58
93
86
78
77
76
73
57
67
60
60
60
60
93
87
75
82
74
79
75
66
66
66
66
92
87
75
80
73
79
73
64
64
64
64
94
87
74
74
70
72
64
62
60
59
56
54
94
87
73
75
72
74
54
61
52
52
52
52
96
89
76
77
70
77
54
63
52
52
52
52
93
89
73
79
71
83
66
59
59
59
59
93
89
69
78
68
78
66
57
57
57
57
96
92
74
75
74
73
67
64
62
61
60
55
96
93
73
76
71
76
59
64
54
54
54
54
95
91
70
74
66
70
53
54
46
46
46
46
96
92
67
71
68
73
62
54
54
54
54
94
91
66
74
64
71
61
53
53
53
53
96
93
76
78
76
74
70
67
65
61
65
57
94
92
71
71
71
71
58
64
55
55
55
55
94
92
68
75
71
66
51
58
43
43
43
43
94
91
72
80
70
73
64
53
53
53
53
96
95
67
76
62
75
57
52
52
52
52
N/A N/A N/A

High School or Less
Some College or Trade School
College Graduate
Some Grad. School or Graduate Degree
■ 2017 (N=1,107)■ 2016 (N=535)
■ 2015 (N=629)
■ 2014 (N=567)■ 2013 (N=734)
■ 2017 (N=1,834)■ 2016 (N=1,470)■ 2015 (N=1,577)■ 2014 (N=1,480)■ 2013 (N=1,278)
■ 2017 (N=2,488)■ 2016 (N=1,393)■ 2015 (N=1,513)■ 2014 (N=1,284)■ 2013 (N=994)
■ 2017 (N=943)■ 2016 (N=763)■ 2015 (N=831)■ 2014 (N=812)■ 2013 (N=645)
NET EMPLOYEE-FUNDED PLAN
Employee-funded 401(k) plan
Other employee self-funded plan (e.g., SEP, SIMPLE, Other)
NET COMPANY-FUNDED PLAN
Company-funded defined benefit pension plan
*Company-funded cash balance plan
NET NONE OF THE ABOVE
Other
None
Note: Data prior to 2017 shows results among workers in companies with 10+ workers. Data for 2017 shows results among workers in companies with 5+ workers.*added in 2014BASE: ALL QUALIFIED RESPONDENTSQ1180. Which of the following retirement benefits does your company currently offer to you, personally? Select all.
Although the majority of workers have access to employer-sponsored retirement benefits, workers with higher
educational attainment are more likely to be offered a plan than workers with lower educational levels. An alarming 32
percent of workers with a high school education or less and 26 percent of those with some college or trade school are
not offered employee-funded plans, compared to 18 percent of college graduates and 15 percent of those with post-
graduate education or graduate degree.
Retirement Benefits Currently Offered
320
Employer-Sponsored Retirement Benefits Currently Offered (%)
61
56
7
20
17
6
32
2
30
61
59
4
22
21
6
56
53
3
19
15
6
61
60
2
23
19
8
55
51
6
15
71
67
6
21
18
6
26
3
23
69
67
4
23
20
6
65
62
5
22
19
6
64
62
3
23
17
8
65
63
4
15
77
73
7
32
28
12
18
2
16
79
77
4
31
25
12
73
73
4
28
23
10
77
75
4
24
19
10
79
75
6
21
82
78
12
38
34
18
15
3
12
77
75
5
35
31
11
77
76
5
30
26
10
78
75
5
29
23
12
80
79
4
25
N/A N/A N/A N/A
N/A N/A N/A N/A
N/A N/A N/A N/A

Among workers who are offered a 401(k) or similar plan, the participation rate increases among workers with
higher level of educational attainment. Specifically, 91 percent of workers with some post-graduate education
or graduate degree participate in their employer’s plan, compared to 72 percent of those with a high school
education or less.
Retirement Plan Participation
321
Data prior to 2017 shows results among workers in companies with 10+ workers. Data for 2017 shows results among workers in companies with 5+ workers.BASE: THOSE CURRENTLY OFFERED QUALIFIED PLANQ1190. Do you currently participate in, or have money invested in your company’s employee-funded retirement savings plan?
Participation in Company’s Employee-funded Retirement Savings Plan, % Indicate “Yes”
7277
67 6963
7873
79 79 76
8680
87 85 8591
84 8791 92
2017 2016 2015 2014 2013 2017 2016 2015 2014 2013 2017 2016 2015 2014 2013 2017 2016 2015 2014 2013
N=597
N=545
N=329
N=331
N=421
N=1,095
N=720
N=983
N=891
N=834
N=1,707
N=657
N=1,052
N=939
N=755
N=685
N=347
N=612
N=592
N=500
High School or LessSome College or
Trade School College Graduate Some Grad. School
or Grad. Degree

6% 6% 6% 6% 6%7% 7%
6%7%
6%
10%8%
10%9%
7%
12%10% 10% 10% 10%
2017 2016 2015 2014 2013 2017 2016 2015 2014 2013 2017 2016 2015 2014 2013 2017 2016 2015 2014 2013
Data prior to 2017 shows results among workers in companies with 10+ workers. Data for 2017 shows results among workers in companies with 5+ workers.BASE: CURRENTLY PARTICIPATES IN QUALIFIED PLAN Q601. What percentage of your salary are you saving for retirement through your company-sponsored plan this year?
Contribution Rate, Median %
Among workers who participate in a 401(k) or similar plan, those with higher educational attainment continue
to contribute a higher rate than workers with lower educational levels. Specifically, college graduates contribute
10 percent (median) and those with a some graduate school or advanced degree contribute 12 percent
(median), in contrast to workers with some college or trade school contribute 7 percent and those with a high
school education or less contribute 6 percent (median).
Retirement Plan Contribution Rate
322
Mean 11.1 10.4 10.0 11.0 7.8 10.2 10.3 9.2 9.9 8.7 14.2 11.6 11.3 11.5 10.3 18.4 11.8 12.0 12.9 11.3
N=398 N=226 N=219 N=223 N=279 N=761 N=666 N=699 N=663 N=626 N=1,372 N=x789 N=858 N=759 N=631 N=600 N=474 N=514 N=522 N=432
High School or Less
Some College or Trade School
College Graduate
Some Grad. School or Grad. Degree

The majority of workers across the levels of educational attainment find automatic enrollment into a 401(k) or
similar retirement plan appealing. The percentage of those who find this feature “very appealing” increases
with level of educational attainment – 34 percent for workers with a high school diploma or less to 45 percent
of workers with some post-graduate education or graduate degree.
Appeal of Automatic Enrollment
323
New question added in 2017BASE: ALL QUALIFIED RESPONDENTS Q635. Imagine that your current employer automatically enrolled you into a 401(k), 403(b) or similar retirement plan, deducting a percentage of each paycheck, and investing it for your future retirement. How appealing would this seem to you?Q636. Imagine that your current employer automatically enrolled you into a 401(k), 403(b) or similar retirement plan, what would you consider to be an appropriate percentage to deduct from your paycheck to be invested for your future retirement?
Appeal of Automatic Enrollment (%)
Appropriate Default Contribution Rate
(median):6%
Very appealing
Somewhat appealing
NET - Appealing
46 40 38 41
3438 44 45
80 7882
86
Post Grad
N=943
Appropriate Default Contribution Rate
(median):6%
Col Grad
N=2,488
Appropriate Default Contribution Rate
(median):10%
HS or Less
N=1,107
Some Col/Trade
N=1,834
Appropriate Default Contribution Rate
(median):8%
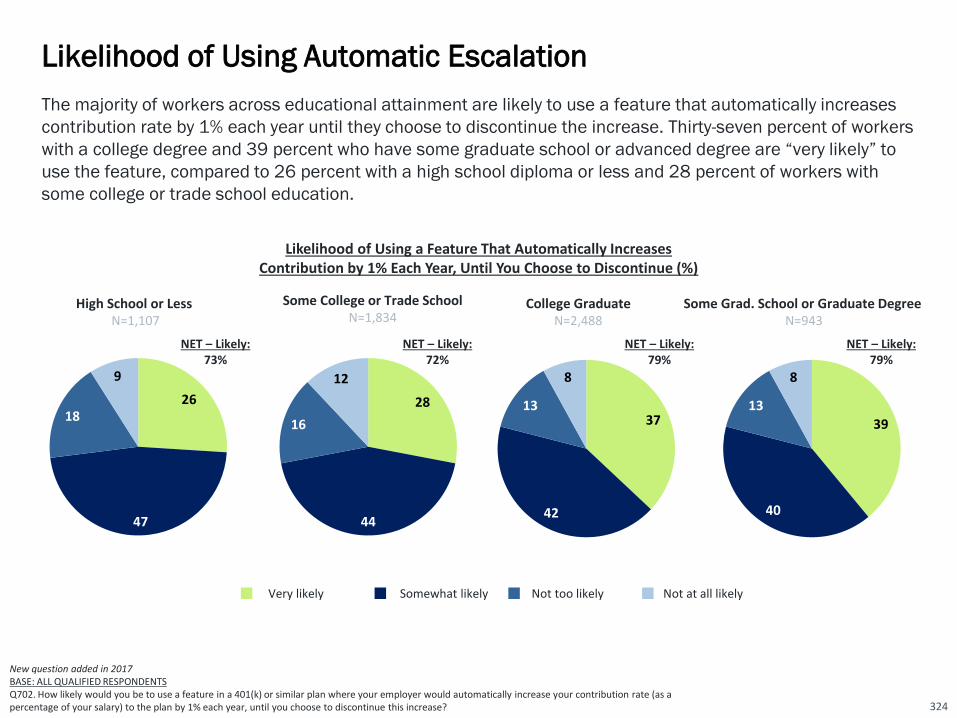
Likelihood of Using Automatic Escalation
The majority of workers across educational attainment are likely to use a feature that automatically increases
contribution rate by 1% each year until they choose to discontinue the increase. Thirty-seven percent of workers
with a college degree and 39 percent who have some graduate school or advanced degree are “very likely” to
use the feature, compared to 26 percent with a high school diploma or less and 28 percent of workers with
some college or trade school education.
New question added in 2017BASE: ALL QUALIFIED RESPONDENTS Q702. How likely would you be to use a feature in a 401(k) or similar plan where your employer would automatically increase your contribution rate (as a percentage of your salary) to the plan by 1% each year, until you choose to discontinue this increase?
High School or Less N=1,107
College GraduateN=2,488
Some Grad. School or Graduate Degree N=943
26
47
18
9
28
44
16
12
37
42
13
8
39
40
13
8
NET – Likely:72%
NET – Likely:79%
NET – Likely:79%
NET – Likely:73%
Very likely Somewhat likely Not too likely Not at all likely
Likelihood of Using a Feature That Automatically Increases Contribution by 1% Each Year, Until You Choose to Discontinue (%)
Some College or Trade SchoolN=1,834
324
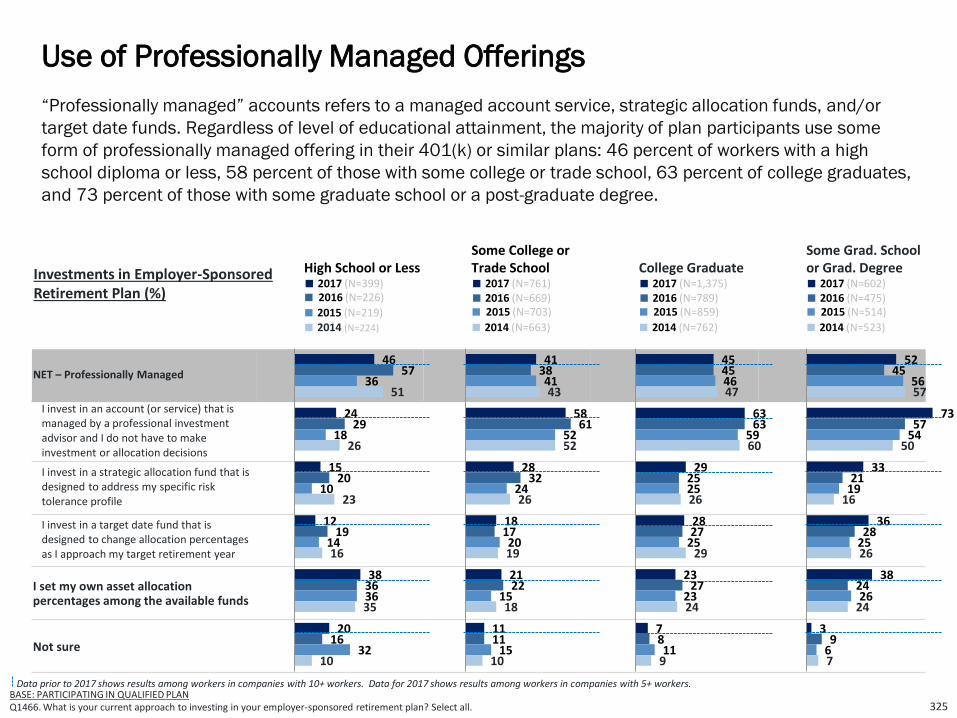
“Professionally managed” accounts refers to a managed account service, strategic allocation funds, and/or
target date funds. Regardless of level of educational attainment, the majority of plan participants use some
form of professionally managed offering in their 401(k) or similar plans: 46 percent of workers with a high
school diploma or less, 58 percent of those with some college or trade school, 63 percent of college graduates,
and 73 percent of those with some graduate school or a post-graduate degree.
Use of Professionally Managed Offerings
325
Data prior to 2017 shows results among workers in companies with 10+ workers. Data for 2017 shows results among workers in companies with 5+ workers.BASE: PARTICIPATING IN QUALIFIED PLANQ1466. What is your current approach to investing in your employer-sponsored retirement plan? Select all.
High School or Less■ 2017 (N=399)■ 2016 (N=226)
■ 2015 (N=219)■ 2014 (N=224)
Some College or Trade School■ 2017 (N=761)■ 2016 (N=669)■ 2015 (N=703)
■ 2014 (N=663)
College Graduate■ 2017 (N=1,375)■ 2016 (N=789)■ 2015 (N=859)
■ 2014 (N=762)
Some Grad. School or Grad. Degree■ 2017 (N=602)■ 2016 (N=475)■ 2015 (N=514)
■ 2014 (N=523)
NET – Professionally Managed
I invest in an account (or service) that is managed by a professional investment advisor and I do not have to make investment or allocation decisions
I invest in a strategic allocation fund that is designed to address my specific risk tolerance profile
I invest in a target date fund that is designed to change allocation percentages as I approach my target retirement year
I set my own asset allocation percentages among the available funds
Not sure
Investments in Employer-Sponsored Retirement Plan (%)
46
24
15
12
38
20
57
29
20
19
36
16
36
18
10
14
36
32
51
26
23
16
35
10
41
58
28
18
21
11
38
61
32
17
22
11
41
52
24
20
15
15
43
52
26
19
18
10
45
63
29
28
23
7
45
63
25
27
27
8
46
59
25
25
23
11
47
60
26
29
24
9
52
73
33
36
38
3
45
57
21
28
24
9
56
54
19
25
26
6
57
50
16
26
24
7
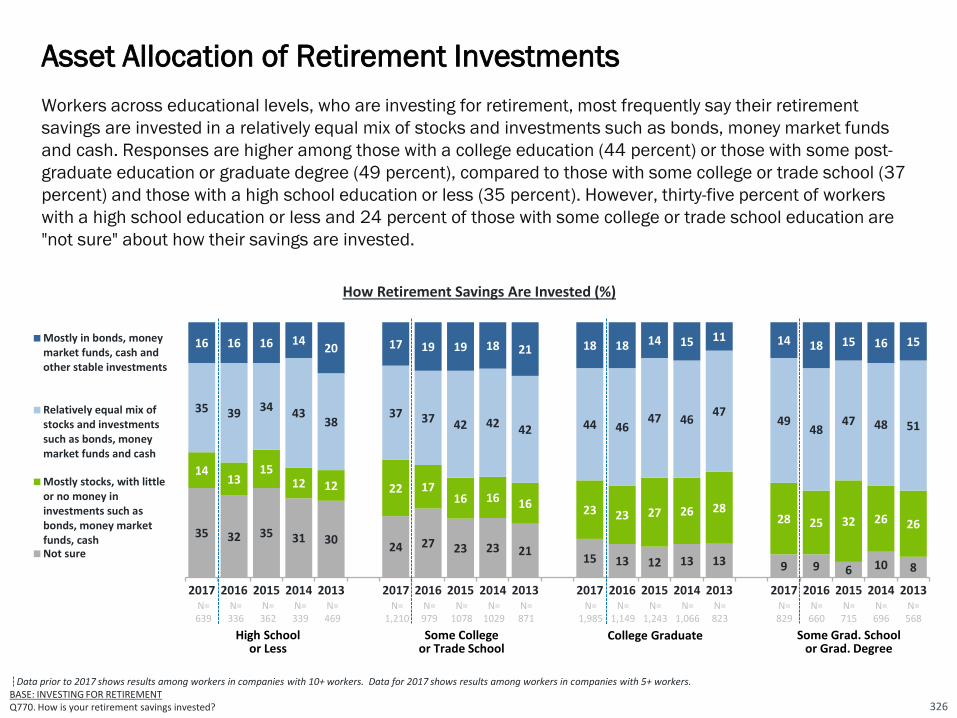
35 32 35 31 3024 27 23 23 21
15 13 12 13 13 9 9 6 10 8
1413
1512 12 22 17
16 16 16 23 23 27 26 2828 25 32 26 26
35 39 34 4338
37 37 42 42 42 44 4647 46
4749
4847 48 51
16 16 16 1420 17 19 19 18 21 18 18 14 15 11 14 18 15 16 15
2017 2016 2015 2014 2013 2017 2016 2015 2014 2013 2017 2016 2015 2014 2013 2017 2016 2015 2014 2013
Mostly in bonds, moneymarket funds, cash andother stable investments
Relatively equal mix ofstocks and investmentssuch as bonds, moneymarket funds and cash
Mostly stocks, with littleor no money ininvestments such asbonds, money marketfunds, cashNot sure
N=639
N=336
N=362
N=339
N=469
N=1,210
N=979
N=1078
N=1029
N=871
N=1,985
N=1,149
N=1,243
N=1,066
N=823
N=829
N=660
N=715
N=696
N=568
High School or Less
Some College or Trade School
College Graduate Some Grad. School or Grad. Degree
Data prior to 2017 shows results among workers in companies with 10+ workers. Data for 2017 shows results among workers in companies with 5+ workers.BASE: INVESTING FOR RETIREMENTQ770. How is your retirement savings invested?
Workers across educational levels, who are investing for retirement, most frequently say their retirement
savings are invested in a relatively equal mix of stocks and investments such as bonds, money market funds
and cash. Responses are higher among those with a college education (44 percent) or those with some post-
graduate education or graduate degree (49 percent), compared to those with some college or trade school (37
percent) and those with a high school education or less (35 percent). However, thirty-five percent of workers
with a high school education or less and 24 percent of those with some college or trade school education are
"not sure" about how their savings are invested.
Asset Allocation of Retirement Investments
326
How Retirement Savings Are Invested (%)

“Leakage” from retirement plans in the form of loans and withdrawals can severely inhibit the growth of
participants’ long-term retirement savings. More than a quarter of workers across levels of educational
attainment have taken some form of loan, early withdrawal, and/or hardship withdrawal from a 401(k),
similar plan or IRA.
Retirement Plan Leakage: Loans and Withdrawals
327
Data prior to 2017 shows results among workers in companies with 10+ workers. Data for 2017 shows results among workers in companies with 5+ workers.BASE: ALL QUALIFIED RESPONDENTSQ754. Have you ever taken any form of loan or early withdrawal from a qualified retirement account such as a 401(k) or similar plan or IRA? Select all.
Have you ever taken any form of loan or early withdrawal from a qualified retirement account such as a 401(k) or similar plan or IRA? (%)
High School or Less■ 2017 (N=597)
■ 2016 (N=309)
Some College or Trade School■ 2017 (N=1,095)
■ 2016 (N=936)
College Graduate■ 2017 (N=1,707)
■ 2016 (N=1015)
Some Grad. School or Grad. Degree■ 2017 (N=685)
■ 2016 (N=560)
NET - Have Taken a Loan, Early Withdrawal, and/or Hardship Withdrawal From 401(k) or Similar Plan or IRA
Yes, I have taken a loan from a 401(k) or similar plan and am paying it back
Yes, I have taken a hardship withdrawal and incurred taxes and penalties
Yes, I have taken an early withdrawal and cashed out a portion or all of a 401(k) or similar plan balance after my separation of employment from a prior employer and incurred taxes and penalties
Yes, I have taken a loan from a 401(k) or similar plan but was unable to pay it back so it became an early withdrawal and incurred taxes and penalties
Yes, I have taken an early withdrawal and cashed out a portion or all of an IRA and incurred taxes and penalties
No, I have never taken a loan or early withdrawal from a 401(k) or similar plan or IRA
Not sure
25
13
4
5
4
4
69
6
29
15
5
8
5
5
64
8
32
16
8
7
4
5
65
3
26
12
4
6
5
5
70
5
29
15
7
7
8
5
69
2
23
13
5
7
6
3
75
2
33
22
12
12
11
5
65
2
24
16
6
6
5
3
73
2

7 5 2 1
9 2518 15 18 7 16 14 14 17
4 7 7 6 102 5 7 5 4
9
6
45
8
85 6 5
6
4 4 3 44
3 2 2 2 2
105
8 85
9 7 8 810
6 4 5 55
5 35
4 7
8 812 12 10 11
8 7 9
8
7 5 7 79
5 34
45
168 11 15 13 11
8 1114
13
1110
11 1311
8 128 10 8
13
10 911 11 13
1113
1011
1315
1819
18
1015 16 20 21
13
149
9 8
24
2219 19 13
4135
3231 21
5941
47 43 41
2017 2016 2015 2014 2013 2017 2016 2015 2014 2013 2017 2016 2015 2014 2013 2017 2016 2015 2014 2013
$250k or more
$100k to less than $250k
$50k to less than $100k
$25k to less than $50k
$10k to less than $25k
$5k to less than $10k
Less than $5k
None ($0) *
Household retirement savings increase with higher educational attainment. College graduates have saved
$154,000 and those with some post-graduate education or advanced degree have saved $225,000 (estimated
medians) compared to workers with some college or trade school who have saved $51,000 and those with a
high school education or less who have saved $36,000 (estimated medians). Fifty-nine percent of workers with
some post-graduate education or advanced degree have saved $250,000 or more compared to only 13
percent of workers with a high school education or less.
Total Household Retirement Savings
328
Data prior to 2017 shows results among workers in companies with 10+ workers. Data for 2017 shows results among workers in companies with 5+ workers.* added in 2017
Note: The median is estimated based on the approximate midpoint of the range of each response category. Non-responses are excluded from the estimate. BASE: ALL QUALIFIED RESPONDENTSQ1300. Approximately how much money does your household have saved in all of your retirement accounts? Please include IRAs, 401(k)s, 403(b)s, and any other savings for retirement to which you and/or your spouse or partner have contributed funds.
Not sure 12 13 16 12 13 7 15 11 11 11 6 10 8 7 10 5 10 5 4 5
Decline to answer 3 11 13 13 14 5 8 11 10 11 6 10 9 8 12 2 9 6 8 7
Estimated Median $36k $23k $27k $31k $28k $51k $47k $51k $47k $33k $154k $143k $117k $114k $79k $225k $176k $178k $169k $157k
Total Household Retirement Savings by Level of Educational Attainment (%)
N=744 N=535 N=629 N=567 N=734 N=1,281 N=1,470 N=1,577N=1,480 N=1,278 N=2,023 N=1,393 N=1,513N=1,284 N=994 N=827 N=763 N=831 N=812 N=645
High School or Less
Some College or Trade School
College Graduate Some Grad. School or Grad. Degree
NA NA NA NA NA NA NA NA NA NA NA NA NA NA NA NA
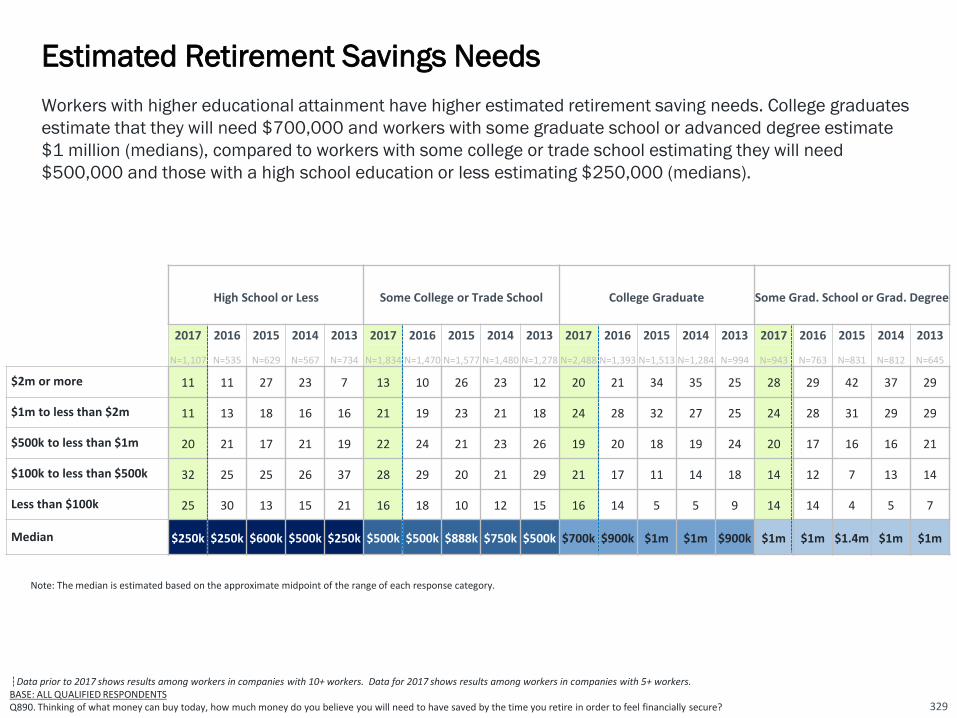
329
Note: The median is estimated based on the approximate midpoint of the range of each response category.
Data prior to 2017 shows results among workers in companies with 10+ workers. Data for 2017 shows results among workers in companies with 5+ workers.BASE: ALL QUALIFIED RESPONDENTSQ890. Thinking of what money can buy today, how much money do you believe you will need to have saved by the time you retire in order to feel financially secure?
Workers with higher educational attainment have higher estimated retirement saving needs. College graduates
estimate that they will need $700,000 and workers with some graduate school or advanced degree estimate
$1 million (medians), compared to workers with some college or trade school estimating they will need
$500,000 and those with a high school education or less estimating $250,000 (medians).
Estimated Retirement Savings Needs
High School or Less Some College or Trade School College Graduate Some Grad. School or Grad. Degree
2017 2016 2015 2014 2013 2017 2016 2015 2014 2013 2017 2016 2015 2014 2013 2017 2016 2015 2014 2013
N=1,107 N=535 N=629 N=567 N=734 N=1,834 N=1,470 N=1,577 N=1,480 N=1,278 N=2,488 N=1,393 N=1,513 N=1,284 N=994 N=943 N=763 N=831 N=812 N=645
$2m or more 11 11 27 23 7 13 10 26 23 12 20 21 34 35 25 28 29 42 37 29
$1m to less than $2m 11 13 18 16 16 21 19 23 21 18 24 28 32 27 25 24 28 31 29 29
$500k to less than $1m 20 21 17 21 19 22 24 21 23 26 19 20 18 19 24 20 17 16 16 21
$100k to less than $500k 32 25 25 26 37 28 29 20 21 29 21 17 11 14 18 14 12 7 13 14
Less than $100k 25 30 13 15 21 16 18 10 12 15 16 14 5 5 9 14 14 4 5 7
Median $250k $250k $600k $500k $250k $500k $500k $888k $750k $500k $700k $900k $1m $1m $900k $1m $1m $1.4m $1m $1m

High School or Less Some College / Trade School College GraduateSome Grad. School or Grad Degree
■ 2017 (N=1,075)■ 2016 (N=516)■ 2015 (N=620)■ 2014 (N=558)■ 2013 (N=721)
■ 2017 (N=1,794)■ 2016 (N=1,423)■ 2015 (N=1,547)■ 2014 (N=1,440)■ 2013 (N=1,262)
■ 2017 (N=2,453)■ 2016 (N=1,364)■ 2015 (N=1,498) ■ 2014 (N=1,266)■ 2013 (N=986)
■ 2017 (N=939)■ 2016 (N=753) ■ 2015 (N=820)■ 2014 (N=800)■ 2013 (N=641)
Guessed
Estimated based on current living expenses
*Used a retirement calculator
Expected earnings on investments
Read/heard that is how much is needed
Amount given to me by financial advisor
Completed a worksheet
Other
Among workers who provided an estimate of their retirement savings needs, the percentage of workers
“guessing” the amount decreases with higher educational attainment. Those with a high school education or
less (56 percent) are most likely to have guessed, compared to those with some graduate school or advanced
degrees (27 percent). Few workers across education levels used a retirement calculator to estimate their
amount needed for retirement.
Basis for Estimating Retirement Savings Needs
330
Note: Data prior to 2017 shows results among workers in companies with 10+ workers. Data for 2017 shows results among workers in companies with 5+ workers.*added in 2014BASE: PROVIDED ESTIMATE OF MONEY NEEDED FOR RETIREMENT Q900. How did you arrive at that number?
56
23
5
6
3
3
1
4
56
19
6
4
6
2
3
4
65
18
2
1
3
2
4
5
61
20
2
3
2
3
5
3
57
23
3
5
2
5
5
N/A
52
22
7
4
6
3
3
2
50
24
8
5
4
2
4
3
54
20
6
5
4
3
3
5
51
24
6
3
4
4
3
5
53
27
4
3
3
7
4
N/A
38
24
9
8
6
6
6
3
39
25
11
6
4
6
5
4
44
21
11
7
4
6
4
3
46
22
10
5
4
5
5
3
45
24
5
6
2
15
3
N/A
27
26
10
13
4
9
9
2
33
23
10
11
5
7
6
5
37
23
14
8
4
6
5
3
32
25
11
10
5
6
8
3
35
26
8
6
6
17
3
N/A

45 42 36 41 3947 48 44 49 46 48 48 51 51 50 47 51 49 51 50
9 107
8 8
10 1313
1110
24 24 18 18 1434 24 24 22 2054 52
4349 47
5761
57 6056
72 72 70 6965
8175 73 73 70
2017 2016 2015 2014 2013 2017 2016 2015 2014 2013 2017 2016 2015 2014 2013 2017 2016 2015 2014 2013
I have a written plan
I have a plan, but it is not written down
Have a Retirement Strategy (%)
Data prior to 2017 shows results among workers in companies with 10+ workers. Data for 2017 shows results among workers in companies with 5+ workers.BASE: ALL QUALIFIED RESPONDENTSQ1155. Which of the following best describes your retirement strategy?
N=1,107
N=535
N=629
N=567
N=734
N=1,834
N=1,470
N=1,577
N=1,480
N=1,278
N=2,488
N=1,393
N=1,513
N=1,284
N=994
N=943
N=763
N=831
N=812
N=645
High School or Less Some College/Trade School
College Graduate Some Grad./ Grad. Degree
The likelihood of workers having a retirement strategy, either written or unwritten, increases with higher
educational attainment. Seventy-two percent of college graduates and 81 percent of workers with some post-
graduate education or graduate degree have a retirement strategy, compared to only 54 percent of those with a
high school diploma or less and 57 percent of those with some college or trade school. Workers with higher
educational attainment are more likely to have their retirement strategy written down.
Retirement Strategy: Written, Unwritten, or None
331

Among those who dream of traveling in retirement, workers’ confidence that their current financial strategy will
enable travel goals varies by level of education. The majority of workers with at least a college degree are
confident, compared to just half of non-college graduates. Some workers haven’t given it much thought, a
finding that is more common among workers with lower levels of educational attainment: 17 percent of workers
with a high school diploma or less and 16 percent of those with some college/trade school.
Confidence that Financial Strategy Will Enable Travel Goals
332
Data prior to 2017 shows results among workers in companies with 10+ workers. Data for 2017 shows results among workers in companies with 5+ workers.BASE: THOSE WHO DREAM OF TRAVELING IN RETIREMENTQ2845. How confident are you that your current financial strategy will allow you to meet your travel goals throughout retirement?
Confidence That Current Financial Strategy Will Meet Retirement Travel Goals (%)
High School or Less
Some College/Trade School
College GraduateSome Grad./ Grad. Degree
■ 2017 (N=627)
■ 2016 (N=279)
■ 2017 (N=1,176)
■ 2016 (N=932)
■ 2017 (N=1,770)
■ 2016 (N=998)
■ 2017 (N=702)
■ 2016 (N=539)
Very confident
Somewhat confident
Not too confident
Not at all confident
I haven’t given much thought to a financial strategy for travel in retirement
13
37
20
13
17
12
35
15
14
23
NET Confident2017: 50%2016: 47%
12
38
22
12
16
13
39
18
13
18
NET Confident2017: 50%2016: 52%
29
37
14
7
13
23
45
15
6
11
NET Confident2017: 66%2016: 68%
38
41
12
5
4
27
44
12
5
11
NET Confident2017: 79%2016: 71%

Use of a professional financial advisor increases with higher educational attainment. Workers who are college
graduates (49 percent) and workers with some post-graduate education or graduate degree (55 percent) are
more likely to use a financial advisor than workers with only some college or trade school (29 percent) or those
with a high school education or less (33 percent).
Professional Financial Advisor Usage
333
Data prior to 2017 shows results among workers in companies with 10+ workers. Data for 2017 shows results among workers in companies with 5+ workers.BASE: INVESTING FOR RETIREMENTQ860. Do you use a professional financial advisor to help manage your retirement savings or investments?
33 35
2530 31 29
34 33 33 35
4943
4043
38
5548 47 45 44
2017 2016 2015 2014 2013 2017 2016 2015 2014 2013 2017 2016 2015 2014 2013 2017 2016 2015 2014 2013
N=639 N=336 N=362 N=339 N=469 N=1,210 N=979 N=1,078 N=1,029 N=871 N=1,985 N=1,149 N=1,243 N=1,066 N=823 N=829 N=660 N=715 N=696 N=568
High School or Less Some College or Trade School College Graduate Some Grad. School or Grad Degree
Use a Professional Financial Advisor % Indicate “Yes”

Level of awareness about the IRS Saver’s Credit -- a tax credit available to eligible taxpayers who are saving for
retirement in a qualified retirement plan or IRA increases with higher educational attainment. College graduates
(43 percent) and workers with some graduate school or a post-graduate degree (51 percent) are more likely to
be aware of the Saver’s Credit than workers with some college or trade school (30 percent) and those with a
high school education or less (29 percent).
Awareness of the Saver’s Credit
334
29
71
Yes, I am aware No, I am not aware
High School or Less2017 (N=1,107)
30
70
Some College or Trade School2017 (N=1,834)
43
57
College Graduate2017 (N=2,488)
5149
Some Grad. or Grad. Degree2017 (N=943)
Data prior to 2017 shows results among workers in companies with 10+ workers. Data for 2017 shows results among workers in companies with 5+ workers.BASE: ALL QUALIFIED RESPONDENTS Q1120. Are you aware of a tax credit called the “Saver’s Credit,” which is available to individuals and households, who meet certain income requirements, for making contributions to an IRA or a company-sponsored retirement plan such as a 401(k) plan or 403(b) plan?
24
76
High School or Less2016 (N=535)
32
68
Some College or Trade School2016 (N=1,470)
39
61
College Graduate2016 (N=1,393)
43
57
Some Grad. or Grad. Degree2016 (N=763)

Awareness of the IRS’ Free File program – a program that offers federal income tax preparation software for
free for eligible tax filers – increases with level of educational attainment. Forty percent of those with a high
school diploma or less attainment, 42 percent of those with some college or trade school, 50 percent of college
graduates and 51 percent of those with some graduate school or advanced degree are aware of this program.
Awareness of the IRS’ Free File Program
335
New question added in 2017BASE: ALL QUALIFIED RESPONDENTS Q2821. Are you aware of the IRS’ Free File program that offers federal income tax preparation software for free for eligible tax filers?
40
60
High School or Less N=1,107
42
585050 5149
Some College or Trade School N=1,834
College Graduate N=2,488
Some Grad. School or Graduate Degree N=943
No Yes
Awareness of the IRS’ Free File Program (%)

Influences of Ethnicity on Retirement Readiness
Detailed Findings
336

Retirement expectations are generally similar across ethnicities. Workers of different ethnicities envision a
phased transition into retirement and are planning to live well into their eighties. However, there are some
disparities by ethnicity. Hispanic and African American workers are less likely to be saving for retirement and to
have emergency savings in the event of a major financial setback, compared to White and Asian workers.
However, White and Asian workers also face retirement risks. Efforts to improve the retirement outlook of
Hispanic and African American workers, such as improving retirement plan participation, should benefit other
ethnicities as well.
Thirty-Eight Indicators of Retirement Readiness
• Confidence in Retiring Comfortably. The majority of workers across ethnicities are confident that they will
be able to fully retire with a comfortable lifestyle: including 61 percent of White, 64 percent of Hispanic, 67
percent of African American, and 63 percent of Asian workers. Relatively few workers of all four ethnic
groups are “very” confident, including 18 percent of White, 20 percent of Hispanic, 19 percent of African
American, and 13 percent of Asian workers.
• Recovery From the Great Recession. In 2017, over four in 10 workers across ethnicities say they were
either not impacted or have fully recovered from the Great Recession, including 45 percent of both
Hispanics and Asians, 43 percent of Whites, and 42 percent of African Americans. Around one in five
workers across ethnicities have not yet begun to recover or may never recover from the Great Recession.
• Building a Large Enough Nest Egg? Workers’ agreement that they are building a large enough retirement
nest egg varies by ethnicity. Asian workers (60 percent) are most likely to agree that they are building a
large enough nest egg, compared to Hispanic and White (both 53 percent), and African American workers
(52 percent). For workers of all ethnicities, agreement has increased since 2013, although it has
fluctuated over the last five years.
Influences of Ethnicity on Retirement Readiness
337

• Retirement Dreams Include Leisure and Work. Traveling is the most frequently cited retirement dream
among workers across ethnicities, including White (67 percent), Hispanic (73 percent), African American
(73 percent), and Asian (76 percent). Spending more time with family and friends is the second most
frequently cited dream, a finding which is consistent across ethnicities. Interestingly, around one in three
workers of all ethnicities dream of working in retirement.
• Retirement Beliefs, Preparations, and Involvement. Most workers across ethnicities feel that their
generation compared to their parent’s generation will have a much harder time achieving financial security
in retirement. Similarly, workers across ethnic groups are concerned that Social Security will not be there
for them when they are ready to retire, including Hispanic (83 percent), Asian (78 percent), African
American (76 percent), and White workers (74 percent).
• Expected Retirement Age. The majority of White workers (58 percent) expect to work past age 65 or do not
plan to retire. In contrast, the majority of African American (57 percent), Asian (57 percent), and Hispanic
workers (54 percent) expect to retire at age 65 or sooner.
• Planning to Work in Retirement. Across ethnicities, approximately half of workers plan to work full- or part-
time in retirement, including 58 percent of Hispanic, 57 percent of White, 54 percent of African American,
and 50 percent of Asian workers. In all cases, most plan to do so part-time.
• Reasons for Working in Retirement. Across ethnicities, among workers who plan on retiring after 65 or
working in retirement, the most common reasons for doing so are financial: White (84 percent), Hispanic
(83 percent), African American (80 percent), and Asian (79 percent). Large majorities also plan to do so for
healthy-aging reasons including “being active,” “keeping my brain alert,” “having a sense of purpose,”
“enjoying what I do,” and “maintaining social connections.”
Influences of Ethnicity on Retirement Readiness
338

• Retirement Transitions: Phased Versus Immediate. Many workers across ethnicities envision continuing to
work as they transition to retirement or have a phased transition into retirement by changing work patterns
(e.g., shifting from full-time to part-time or working in a different capacity), including 68 percent of Whites,
69 percent of Hispanics, 63 percent of African Americans, and 66 percent of Asians. Approximately one in
five workers across ethnicities plan to immediately stop working when they reach a specific age or savings
goal.
• Phased Retirement and Compensation-Related Expectations. Among workers who envision a phased
transition into retirement, about three in four workers across ethnicities expect that if they reduce their
work hours at their current employer, they would be paid the same hourly rate for hours worked that they
are earning now. Other expectations about compensation and phased retirement are similar across
ethnicities.
• Perceptions of Older Workers. Most workers hold positive perceptions of workers age 50 and older
compared to younger workers in today’s workforce, including White workers (87 percent), Hispanic workers
(80 percent), African American workers (77 percent), and to a somewhat lesser extent, Asian workers (62
percent).
• Age That Workers Consider a Person to Be “Old.” Among respondents who gave an age, interestingly, White
and African American workers consider someone to be old at the age of 70 (median), Hispanic workers
consider a person to be “old” at 65 (median) and Asian workers at the younger age of 60 (median).
Considerable proportions also indicate that it depends on the person with 43 percent of White, 40 percent
of African American, 36 percent of Asian and 30 percent of Hispanic workers believing this.
• Age That Workers Consider a Person to Be “Too Old” to Work. Large proportions of workers believe that “it
depends on the person” whether someone is too old to work: White (60 percent), Hispanic (41 percent),
African American (49 percent), and Asian (46 percent). Of those who gave ages, both Asian and African
American workers believe someone is too old to work at age 70 (median), Hispanic workers do so at 73
(median), and White workers at age 75 (median).
Influences of Ethnicity on Retirement Readiness
339

• Level of Concern About Health in Older Age. The majority of workers across ethnicities are “very” or
“somewhat” concerned about their health in older age, with Asian (77 percent), White (73 percent), and
Hispanic workers (76 percent) being more likely than African workers (67 percent) to be concerned about
this.
• Engagement in Health-Related Activities on a Consistent Basis. When it comes to health-related activities
that are done on a consistent bases, White workers are most likely to seek medical attention when needed
(58 percent), Hispanic and Asian workers (both 56 percent) are most likely to eat healthfully, and African
American workers (55 percent) are most likely to maintain a positive outlook.
• Planning to Live to Age ... Among ethnicities, African American workers are planning to live to an age of 95
(median) with 24 percent planning to become centenarians. Hispanic workers are planning to live to age
90 (median) with 19 percent planning to live to age 100+; White workers are planning to live to age 90
(median) with 14 percent planning to live to age 100+; and Asian workers are planning to live to age 85
(median) with 14 percent of them planning to live to age 100+.
• Types of Household Debt. The type of household debt most frequently cited by all workers is credit card
debt (Hispanic 62 percent; African Americans 59 percent; White 59 percent; Asian 58 percent). The
second most common type of debt for White and Asian workers is a mortgage, while for Hispanic and
African American workers it is a car loan.
• Estimated Emergency Savings. Emergency savings can help cover the cost of a major financial setback
(e.g., unemployment, medical bills, home repairs, auto repairs, other); however, workers report having
saved relatively little in this regard. White workers have saved $5,000 (median), Hispanics have saved
$2,000 (median), African Americans have saved $1,000 (median), and Asian workers have saved
$10,000 (median). At least one in four Hispanic and African American workers have saved less than
$1,000 for such emergencies.
Influences of Ethnicity on Retirement Readiness
340

• Saving for Retirement / Age Started Saving. Savings rates vary among ethnic groups. Asian workers (84
percent) are most likely to be saving for retirement through an employer-sponsored retirement plan and/or
outside of work, followed by White workers (80 percent), which are both significantly higher than African
American (72 percent) and Hispanic workers (71 percent). In terms of the median age that they started
saving, Hispanic and Asian workers started at a relatively younger age (age 25), compared to White (age
29) and African American (age 26) workers.
• Expected Sources of Retirement Income. Across ethnicities, the majority of workers expect to have
retirement income from self-funded savings including retirement accounts (e.g., 401(k)s, 403(b)s, IRAs)
and other savings and investments: 88 percent of Asians, 82 percent of Whites, 82 percent of Hispanics,
and 80 percent of African Americans. Expectations of retirement income from Social Security vary
somewhat by ethnicity (78 percent of Whites, 71 percent of Asians, 69 percent of African Americans, and
66 percent of Hispanics).
• Expected Primary Source of Income in Retirement. When asked about their expected primary source of
income in retirement – 401(k)s/403(b)/IRAs were the most often identified source across ethnicities.
However there are some differences among workers with Asian workers (44 percent) being more likely
than Whites (38 percent), Hispanics (37 percent), and African Americans (33 percent) to expect these
retirement accounts to be their primary source of income.
• Importance of Retirement Benefits Compared to Other Benefits. Approximately nine in 10 workers across
ethnicities value a 401(k) or similar employee-funded retirement as an important benefit. They value
retirement plans second only to health insurance.
• Retirement Benefits Currently Offered. Most workers across ethnic groups are offered a 401(k) or other
self-funded plan by their employers. Such access is greatest among Asian workers (79 percent) followed by
African American workers (71 percent), Hispanic (70 percent) and White workers (70 percent).
Influences of Ethnicity on Retirement Readiness
341

• Retirement Plan Participation. Among workers who are offered a 401(k) or similar plan, the participation
rate varies across ethnic groups. White workers (84 percent) are the most likely to be participating in their
employer’s plan, followed by Asian (82 percent), African American (75 percent) and Hispanic workers (75
percent). Across all ethnicities, participation in company employee-funded retirement savings plan has
increased compared to last year.
• Retirement Plan Contribution Rate. Of workers who participate in a 401(k) or similar plan, the median
contribution rate is almost the same among workers of different ethnicities: Asian, Hispanic, and African
American workers (each 10 percent), followed by White workers (9 percent).
• Appeal of Automatic Enrollment. Among different ethnic groups, Hispanic workers (85 percent) are more
likely to find a feature that automatically enrolls workers into a 401(k), 403 (b) or similar retirement plan to
be “very” or “somewhat” appealing, followed closely by African American workers (82 percent), White
workers (80 percent), and Asian workers (78 percent). White workers think the default contribution rate
should be 6 percent (median) while all others think it should be 10 percent (median).
• Likelihood of Using Automatic Escalation. Hispanic workers (81 percent) are most likely to use a feature
that automatically increases their contribution to their retirement plans by 1% each year. Seventy-eight
percent of African American, 74 percent of White, and 71 percent of Asian workers say the same.
• Use of Professionally Managed Offerings. “Professionally managed” accounts refers to a managed account
service, strategic allocation funds, and/or target date funds. Across ethnicities, the majority of retirement
plan participants use some form of professionally managed offering in their 401(k) or similar plans: 60
percent of Whites, 64 percent of Hispanics, 51 percent of Asians, and 57 percent of African Americans.
Asian workers (57 percent) are more likely to set their own asset allocation percentage among the
available funds, compared to White (43 percent), Hispanic (41 percent), and African American (40 percent)
workers.
Influences of Ethnicity on Retirement Readiness
342

• Asset Allocation of Retirement Investments. Workers across ethnicities most frequently indicate that their
retirement savings are invested in a relatively equal mix of stocks and investments such as bonds, money
market funds and cash; White (42 percent), Asian, (38 percent), African American (37 percent), and
Hispanic (36 percent) workers. At least one in four Hispanic (27 percent) and African American (25
percent) workers are "not sure" how their savings are invested, significantly more than Asian (18 percent)
and White (20 percent) workers.
• Retirement Plan Leakage: Loans and Withdrawals. “Leakage” from retirement plans in the form of loans
and withdrawals can severely inhibit the growth of participants’ long-term retirement savings. Some
workers across ethnicities have taken some form of loan, early withdrawal, and/or hardship withdrawal
from a 401(k) or similar plan, including African American workers (39 percent) who are most likely to have
done so, followed by Hispanic workers (37 percent), White workers (32 percent), and Asian workers (22
percent).
• Total Household Retirement Savings. White and Asian workers have the highest reported total household
retirement savings (estimated medians of $104k and $81k, respectively). They are also most likely to say
that they have saved $250k or more (34 percent of Whites and 33 percent of Asians). In contrast, Hispanic
workers have saved $48k (estimated median) with 23 percent saving more than $250k, and African
American workers have saved $29k (estimated median) with 14 percent saving more than $250k.
• Estimated Retirement Savings Needs. Retirement savings needs vary across ethnic groups. Asian workers
estimate that they will need to have saved $1 million (median) by the time they retire in order to feel
financially secure. White and Hispanic workers estimate they will need $500k (median), and African
American workers estimate $250k (median).
• Basis for Estimating Retirement Savings Needs. Many workers are “guessing” their retirement savings
needs. African American workers (51 percent) and Asian workers (51 percent) are most likely to have
guessed compared to White (46 percent) and Hispanic workers (43 percent. Few workers across
ethnicities indicate they used a retirement calculator to estimate their savings needs.
Influences of Ethnicity on Retirement Readiness
343

• Retirement Strategy: Written, Unwritten, or None. The majority of workers across ethnicities have some
form of retirement strategy (either written or unwritten), including 63 percent of Whites and Asians, 64
percent of Hispanics, and 65 percent of African Americans. However, although few workers across
ethnicities have a written strategy, Hispanics (21 percent) are more likely to have their plan written
compared to Whites (16 percent), African Americans (14 percent), and Asians (14 percent).
• Confidence that Financial Strategy Will Enable Travel Goals. Among workers who dream of traveling in
retirement, the majority are confident their current financial strategy will allow them to meet their travel
goals: 58 percent of Whites, 61 percent of Hispanics, 59 percent of African Americans, and 54 percent of
Asians. However, relatively few across ethnic groups are “very” confident, and some haven’t given it much
thought.
• Professional Financial Advisor Usage. Among those who are investing for retirement, Hispanic and White
workers (both 41 percent) are more likely to use a professional financial advisor to help manage their
retirement savings or investments than Asian (32 percent) and African American (35 percent) workers.
• Awareness of Saver’s Credit. The IRS offers a tax credit to eligible taxpayers who are saving for retirement
in a qualified retirement plan or IRA, called the Saver’s Credit; however, only about four in ten workers
across ethnicities are aware of it. Asian workers (41 percent) are more likely to be aware of the Saver’s
Credit, compared to Hispanic (39 percent), White (35 percent) and African American (33 percent) workers.
Across all ethnicities, awareness of the Saver’s credit has increased since last year.
• Awareness of the IRS’ Free File Program. Fewer than half of workers across ethnicities are aware of the
IRS’ Free File Program. African American workers (49 percent) are more likely to be aware of the IRS’ Free
File Program, which offers federal income tax preparation software for free to eligible tax filers. Forty-five
percent of Hispanic workers, 44 percent of White workers, and 43 percent of Asian workers are aware of
the program.
Influences of Ethnicity on Retirement Readiness
344

43 46 44 49 46 44 50 44 44 4048 47 46 45 47 50 46 52 56
48
18 1512
1410 20 13 19 18
11
19 18 22 2512
13 1716 11
7
61 6156
6355
64 63 63 62
51
67 65 67 70
5963 63
68 66
54
Very confident Somewhat confident
The majority of workers across ethnicities are confident that they will be able to fully retire with a comfortable
lifestyle: including 61 percent of White, 64 percent of Hispanic, 67 percent of African American, and 63 percent
of Asian workers. Relatively few workers of all four ethnic groups are “very” confident, including 18 percent of
White, 20 percent of Hispanic, 19 percent of African American, and 13 percent of Asian workers.
Confidence in Retiring Comfortably
345
Data prior to 2017 shows results among workers in companies with 10+ workers. Data for 2017 shows results among workers in companies with 5+ workers.BASE: ALL QUALIFIED RESPONDENTSQ880. How confident are you that you will be able to fully retire with a lifestyle you consider comfortable?
Confidence in Retiring ComfortablyStrongly/Somewhat Confident (%) (NET)
2017 2016 2015 2014 2013 2017 2016 2015 2014 2013 2017 2016 2015 2014 2013 2017 2016 2015 2014 2013
N=3,949 N=2,645 N=2,892 N=2,716 N=2,975 N=1,037 N=670 N=663 N=664 N=169 N=789 N=489 N=537 N=444 N=182 N=467 N=270 N=373 N=235 N=232
White Hispanic African American Asian/Pac.

In 2017, more than four in 10 workers across ethnicities say they were either not impacted or have fully
recovered from the Great Recession, including 45 percent of both Hispanics and Asians, 43 percent of Whites,
and 42 percent of African Americans. Around one in five workers across ethnicities have not yet begun to
recover or may never recover from the Great Recession.
Recovery From the Great Recession
346
Data prior to 2017 shows results among workers in companies with 10+ workers. Data for 2017 shows results among workers in companies with 5+ workers.BASE: ALL QUALIFIED RESPONDENTS Q2655. How would you describe your financial recovery from the deep recession in recent years, which is commonly referred to as the “Great Recession”?
18
23
25
19
25
22
17
26
38
34
39
39
11
16
13
11
8
5
6
5
White
Hispanic
AfricanAmerican
Asian/Pacific
NET - Not Impacted or Fully Recovered= 43%
How would you describe your financial recovery from the Great Recession?
NET - Not Yet Begun or Never Recover = 19%
N=3,949
N=1,037
N=789
N=467
NET - Not Impacted or Fully Recovered= 45%
NET - Not Yet Begun or Never Recover = 21%
NET - Not Impacted or Fully Recovered= 42%
NET - Not Yet Begun or Never Recover = 19%
NET - Not Impacted or Fully Recovered= 45%
NET - Not Yet Begun or Never Recover = 16%
17
22
26
22
22
16
15
16
42
38
37
41
11
16
17
16
8
8
5
5
White
Hispanic
AfricanAmerican
Asian/Pacific
NET - Not Impacted or Fully Recovered= 39%
NET - Not Yet Begun or Never Recover = 19%
N=2,645
N=670
N=489
N=270
NET - Not Impacted or Fully Recovered= 38%
NET - Not Yet Begun or Never Recover = 24%
NET - Not Impacted or Fully Recovered= 41%
NET - Not Yet Begun or Never Recover = 22%
NET - Not Impacted or Fully Recovered= 38%
NET - Not Yet Begun or Never Recover = 21%
2017 2016
I have fully recovered I have somewhat recovered I have not yet begun to recover I may never recoverI was not impacted
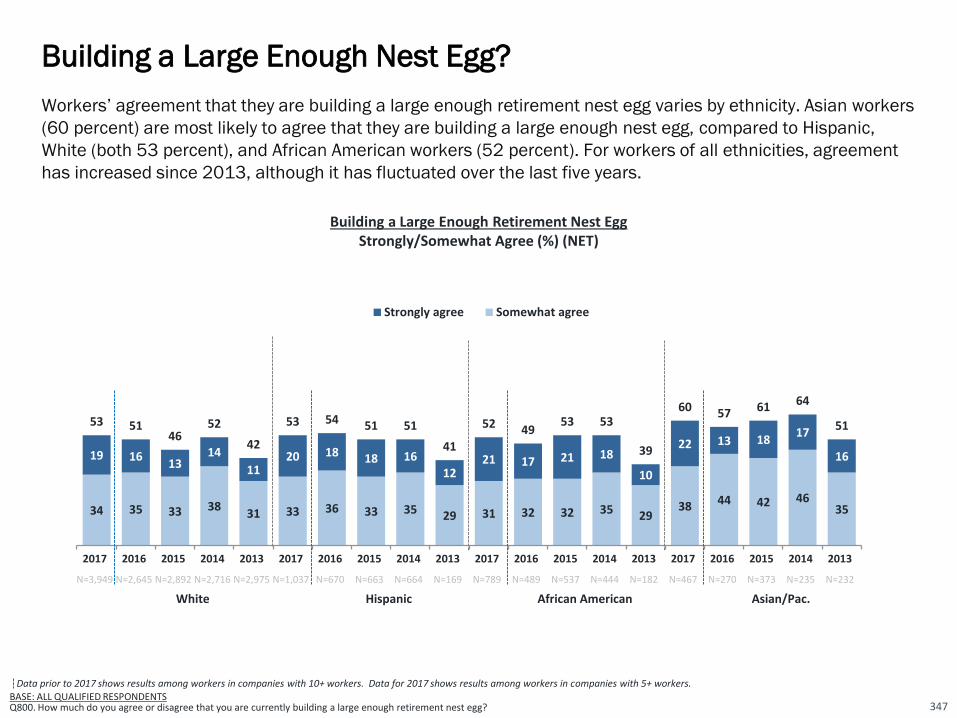
Workers’ agreement that they are building a large enough retirement nest egg varies by ethnicity. Asian workers
(60 percent) are most likely to agree that they are building a large enough nest egg, compared to Hispanic,
White (both 53 percent), and African American workers (52 percent). For workers of all ethnicities, agreement
has increased since 2013, although it has fluctuated over the last five years.
Building a Large Enough Nest Egg?
347
Data prior to 2017 shows results among workers in companies with 10+ workers. Data for 2017 shows results among workers in companies with 5+ workers.BASE: ALL QUALIFIED RESPONDENTSQ800. How much do you agree or disagree that you are currently building a large enough retirement nest egg?
34 35 33 3831 33 36 33 35 29 31 32 32 35 29
38 44 42 4635
19 1613
14
1120 18 18 16
1221 17 21 18
10
22 13 1817
16
53 5146
52
42
53 54 51 51
41
52 4953 53
39
60 57 61 64
51
Strongly agree Somewhat agree
Building a Large Enough Retirement Nest EggStrongly/Somewhat Agree (%) (NET)
2017 2016 2015 2014 2013 2017 2016 2015 2014 2013 2017 2016 2015 2014 2013 2017 2016 2015 2014 2013
N=3,949 N=2,645 N=2,892 N=2,716 N=2,975 N=1,037 N=670 N=663 N=664 N=169 N=789 N=489 N=537 N=444 N=182 N=467 N=270 N=373 N=235 N=232
White Hispanic African American Asian/Pac.

Traveling is the most frequently cited retirement dream among workers across ethnicities, including White (67
percent), Hispanic (73 percent), African American (73 percent), and Asian (76 percent). Spending more time with
family and friends is the second most frequently cited dream, a finding which is consistent across ethnicities.
Interestingly, around one in three workers of all ethnicities dream of working in retirement.
Retirement Dreams Include Leisure and Work
348
Data prior to 2017 shows results among workers in companies with 10+ workers. Data for 2017 shows results among workers in companies with 5+ workers.BASE: ALL QUALIFIED RESPONDENTS Q1418. How do you dream of spending your retirement? Select all.
How do you dream of spending your retirement? Please select all that apply. (%)
White Hispanic African American Asian/Pacific
■ 2017 (N=3494) ■ 2017 (N=1,037) ■ 2017 (N=789) ■ 2017 (N=467)
■ 2016 (N=2,645) ■ 2016 (N=670) ■ 2016 (N=489) ■ 2016 (N=270)
Traveling
Spending more time with family and friends
Pursuing hobbies
Doing volunteer work
Pursuing an encore career (pursuing a new role, work, activity, or career)
Starting a business
Continue working in the same field
Other
None of the above
67
57
49
26
13
11
12
6
3
63
55
50
26
12
8
11
7
4
73
57
50
26
14
16
11
3
2
69
63
48
25
13
17
15
4
2
73
52
50
23
12
22
8
3
2
60
52
48
29
14
23
14
7
5
NET: Working2017: 29%2016: 25%
76
64
54
31
16
14
11
2
2
71
64
46
35
12
9
10
5
5
NET: Working2017: 31%2016: 35%
NET: Working2017: 35%2016: 39%
NET: Working2017: 32%2016: 24%

How Much Do You Agree or Disagree?
Strongly/Somewhat Agree (%) (NET)
White Hispanic African American Asian/Pacific
■ 2017 (N=3,949)■ 2016 (N=2,645)■ 2015 (N=2,892)■ 2014 (N=2,716)■ 2013 (N=2,975)
■ 2017 (N=1,037)■ 2016 (N=670)■ 2015 (N=663)■ 2014 (N=664)■ 2013 (N=169)
■ 2017 (N=789)■ 2016 (N=489)■ 2015 (N=537)■ 2014 (N=444)■ 2013 (N=182)
■ 2017 (N=467)■ 2016 (N=270)■ 2015 (N=373)■ 2014 (N=235)■ 2013 (N=232)
**Compared to my parent's generation, people in my generation will have a much harder time in achieving financial security
**Concerned that when I am ready to retire, Social Security will not be there for me
*My current employer is supportive of its employees working past 65
Do not know as much as I should about retirement investing
Like more info and advice from my company on how to reach my goals
Could work until age 65 and still not have enough money saved
Very involved in monitoring and managing my retirement savings
Prefer to rely on outside experts to monitor and manage my plan
Prefer not to think about or concern myself with it until closer to retirement
80
74
73
66
61
66
65
57
36
82
76
73
68
60
65
62
58
36
80
76
64
54
66
61
51
35
82
74
66
57
66
68
54
33
68
58
68
61
50
34
81
83
68
72
74
69
62
63
48
83
80
67
72
74
69
62
61
50
82
76
69
74
65
68
60
48
84
83
72
73
67
68
53
44
79
75
70
61
56
35
79
78
69
66
73
61
64
56
47
75
81
64
63
69
63
69
59
50
79
77
64
68
64
70
59
49
79
77
62
74
68
77
62
57
63
68
74
66
63
56
78
76
70
72
75
64
65
56
41
82
77
78
69
79
64
66
57
42
77
76
77
76
71
68
54
49
76
71
70
76
68
74
63
47
66
70
64
64
49
30Note: Data prior to 2017 shows results among workers in companies with 10+ workers. Data for 2017 shows results among workers in companies with 5+ workers.*added in 2016 **added in 2014BASE: ALL QUALIFIED RESPONDENTSQ930. How much do you agree or disagree with each of the following statements regarding retirement investing?
Most workers across ethnicities feel that their generation compared to their parent’s generation will have a
much harder time achieving financial security in retirement. Similarly, workers across ethnic groups are
concerned that Social Security will not be there for them when they are ready to retire, including Hispanic (83
percent), Asian (78 percent), African American (76 percent), and White workers (74 percent).
Retirement Beliefs, Preparations, and Involvement
349
N/A
N/A
N/A
N/A
N/A
N/A
N/A
N/A
N/A
N/A
N/A
N/A
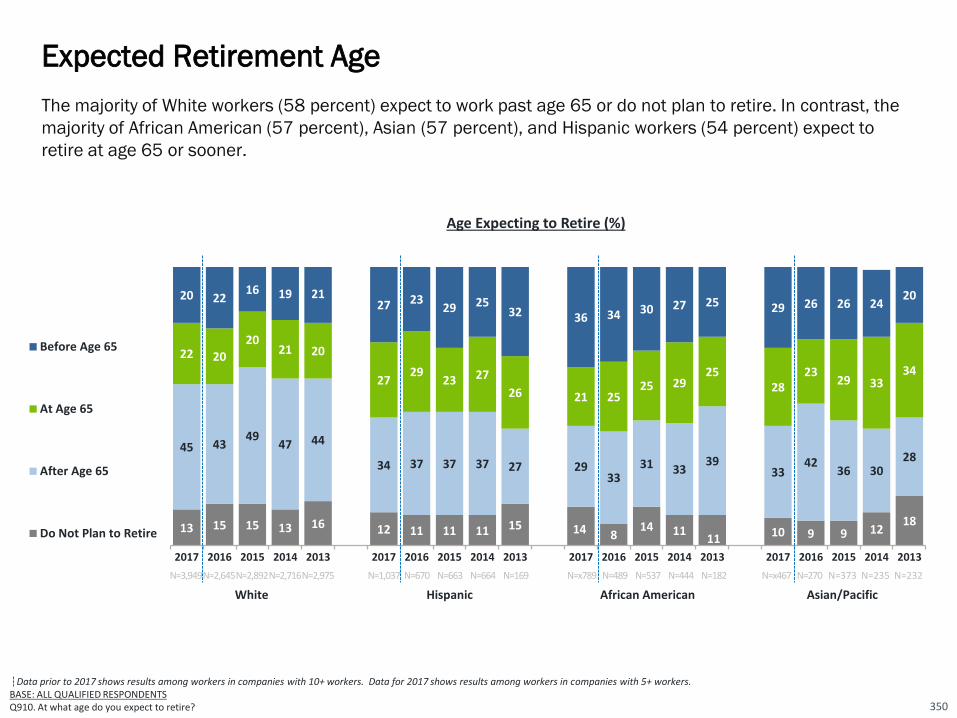
Data prior to 2017 shows results among workers in companies with 10+ workers. Data for 2017 shows results among workers in companies with 5+ workers.BASE: ALL QUALIFIED RESPONDENTSQ910. At what age do you expect to retire?
The majority of White workers (58 percent) expect to work past age 65 or do not plan to retire. In contrast, the
majority of African American (57 percent), Asian (57 percent), and Hispanic workers (54 percent) expect to
retire at age 65 or sooner.
Expected Retirement Age
350
13 15 15 13 16 12 11 11 11 15 14 814 11
11 10 9 9 1218
45 4349
47 44
34 37 37 37 27 2933
31 3339
3342
36 3028
22 20
2021 20
2729
23 27
26 21 2525 29
2528
2329 33
34
20 2216 19 21
27 2329 25
32 36 34 30 27 25 29 26 26 2420
2017 2016 2015 2014 2013 2017 2016 2015 2014 2013 2017 2016 2015 2014 2013 2017 2016 2015 2014 2013
Before Age 65
At Age 65
After Age 65
Do Not Plan to Retire
N=3,949N=2,645N=2,892N=2,716N=2,975 N=1,037 N=670 N=663 N=664 N=169 N=x789 N=489 N=537 N=444 N=182 N=x467 N=270 N=373 N=235 N=232
White Hispanic African American Asian/Pacific
Age Expecting to Retire (%)

Across ethnicities, approximately half of workers plan to work full- or part-time in retirement, including 58
percent of Hispanic, 57 percent of White, 54 percent of African American, and 50 percent of Asian workers. In
all cases, most plan to do so part-time.
Planning to Work in Retirement
351
Data prior to 2017 shows results among workers in companies with 10+ workers. Data for 2017 shows results among workers in companies with 5+ workers.BASE: ALL QUALIFIED RESPONDENTSQ1525. Do you plan to work after you retire?
44 38 41 40 44 41 36 3543 39 40 36 36 37
5138 35 36 33
41
1313 10 11 9 17
14 1614 18 14
13 12 13
12
12 15 18 2117
24 28 25 2720 21 23 28 23 18
28 30 26 2815
3326 24
3119
1921 24 22
27 2127 21
19 2518
21 26 22
22
1724 22
15
22
Yes (NET):
Planning to Work in Retirement (%)
Yes, I plan to work full-timeYes, I plan to work part-timeNo, I do not plan to workNot sure
2017 2016 2015 2014 2013 2017 2016 2015 2014 2013 2017 2016 2015 2014 2013 2017 2016 2015 2014 2013
N=3,949
N=2,645
N=2,892
N=2,716
N=2,975
N=1,037
N=670
N=663
N=664
N=169
N=789
N=489
N=537
N=444
N=182
N=467
N=270
N=373
N=235
N=232
White Hispanic African American Asian/Pacific
51 51 53 5157 57
48 50
63
54 5458
51 50 49 5050545857

Across ethnicities, among workers who plan on retiring after 65 or working in retirement, the most common
reasons for doing so are financial: White (84 percent), Hispanic (83 percent), African American (80 percent),
and Asian (79 percent). Large majorities also plan to do so for healthy-aging reasons including “being active,”
“keeping my brain alert,” “having a sense of purpose,” “enjoying what I do,” and “maintaining social
connections.”
Reasons for Working in Retirement
352
NET
Financial Reasons
NET
Healthy-aging
Reasons
Want the income
Be activeKeep my
brain alert
Concerned that Social
Security will be less than
expected
Can’t afford to retire because I haven’t
saved enough
Have a sense of purpose
Enjoy what I do
Need health benefits
Maintain social
connections
Concernedemployer
retirement benefits will be less than
expected
Anxious re: volatility in
financial markets and investment
performance
84 73 59 54 44 42 41 36 37 31 26 15 13
83 74 50 53 42 43 34 41 37 31 27 20 20
80 80 59 55 43 36 33 39 38
24 19 13 10
New question added in 2017BASE: PLAN ON RETIRING AFTER 65 AND/OR WORKING AFTER RETIREMENTQ1530x1. What are your reason(s) for working in retirement or past age 65? Select all.
79 81 49 55 47
34 31 34 36 39 29 18 17
Wh
ite
N=3
,09
8H
isp
anic
N=7
48
Afr
ican
A
me
rica
nN
=55
4
Asi
an/
Pac
ific
N=3
24
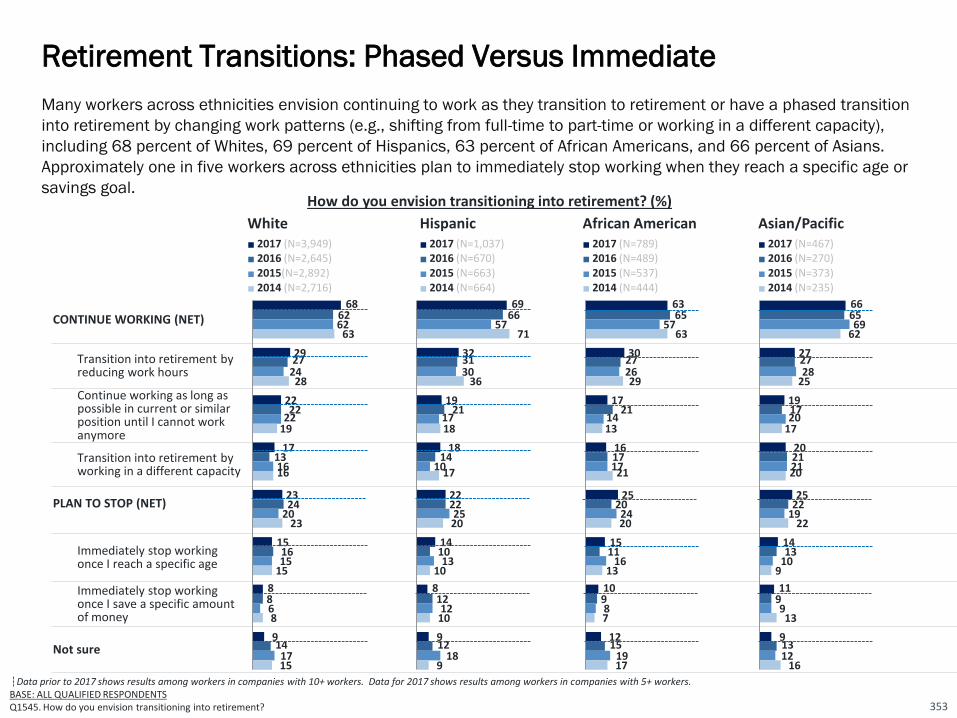
White Hispanic African American Asian/Pacific ■ 2017 (N=3,949)■ 2016 (N=2,645)
■ 2015(N=2,892)
■ 2014 (N=2,716)
■ 2017 (N=1,037)■ 2016 (N=670)
■ 2015 (N=663)
■ 2014 (N=664)
■ 2017 (N=789)■ 2016 (N=489)
■ 2015 (N=537)
■ 2014 (N=444)
■ 2017 (N=467)■ 2016 (N=270)
■ 2015 (N=373)
■ 2014 (N=235)
CONTINUE WORKING (NET)
Transition into retirement by reducing work hours
Continue working as long as possible in current or similar position until I cannot work anymore
Transition into retirement by working in a different capacity
PLAN TO STOP (NET)
Immediately stop working once I reach a specific age
Immediately stop working once I save a specific amount of money
Not sure
Many workers across ethnicities envision continuing to work as they transition to retirement or have a phased transition
into retirement by changing work patterns (e.g., shifting from full-time to part-time or working in a different capacity),
including 68 percent of Whites, 69 percent of Hispanics, 63 percent of African Americans, and 66 percent of Asians.
Approximately one in five workers across ethnicities plan to immediately stop working when they reach a specific age or
savings goal.
Retirement Transitions: Phased Versus Immediate
353
Data prior to 2017 shows results among workers in companies with 10+ workers. Data for 2017 shows results among workers in companies with 5+ workers.BASE: ALL QUALIFIED RESPONDENTSQ1545. How do you envision transitioning into retirement?
686262
63
2927
2428
2222
2219
17131616
2324
2023
151615
15
8868
9141715
How do you envision transitioning into retirement? (%)
6966
5771
323130
36
1921
1718
1814
1017
22222520
141013
10
8121210
912
189
666569
62
272728
25
191720
17
20212120
2522
1922
1413
109
119913
91312
16
6365
5763
30272629
1721
1413
16171721
25202420
1511
1613
10987
1215
1917

Phased Retirement and Compensation-Related Expectations
WhiteN=1,846
HispanicN=513
African AmericanN=369
Asian/PacificN=229
If I reduce my work hours at my current employer, I would expect to be paid the same hourly rate for hours worked that I am earning now.
If I were to take on a new role with fewer responsibilities at my current employer, I would expect my job title to change.
If I were to take on a new role with fewer responsibilities at my current employer, I would expect to be paid the market rate for the duties involved, even if it means a reduction in my current level of pay.
If I were to shift from full-time to part-time at my current employer, I would expect to receive the same employee benefits that I have now.
New question added in 2017BASE: RESPONDENTS WHO ENVISION A PHASED TRANSITION INTO RETIREMENTQ1546. In thinking about your vision of transitioning into retirement, to what extent do you agree or disagree with the following statements?
In thinking about your vision of transitioning into retirement, to what extent do you agree or disagree with the following statements? (NET - Agree %)
80
78
73
59
73
79
75
59
75
78
67
62
81
78
66
64
354
Among workers who envision a phased transition into retirement, about three in four workers across ethnicities
expect that if they reduce their work hours at their current employer, they would be paid the same hourly rate for hours worked that they are earning now. Other expectations about compensation and phased retirement are similar across ethnicities.
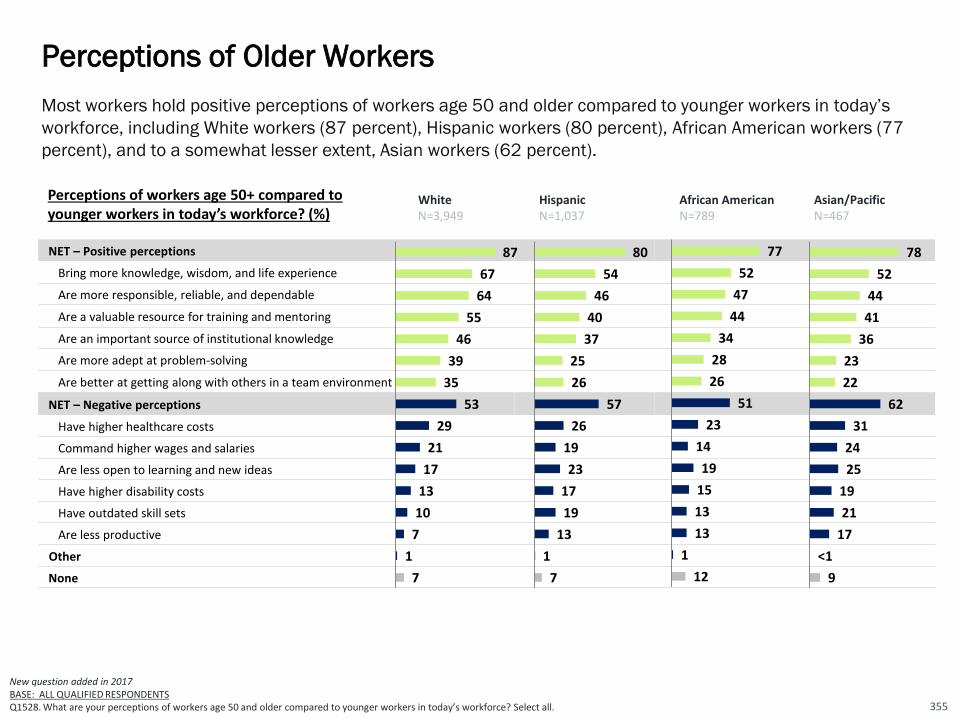
Perceptions of Older Workers
355
WhiteN=3,949
HispanicN=1,037
African AmericanN=789
Asian/PacificN=467
NET – Positive perceptions
Bring more knowledge, wisdom, and life experience
Are more responsible, reliable, and dependable
Are a valuable resource for training and mentoring
Are an important source of institutional knowledge
Are more adept at problem-solving
Are better at getting along with others in a team environment
NET – Negative perceptions
Have higher healthcare costs
Command higher wages and salaries
Are less open to learning and new ideas
Have higher disability costs
Have outdated skill sets
Are less productive
Other
None
New question added in 2017BASE: ALL QUALIFIED RESPONDENTS Q1528. What are your perceptions of workers age 50 and older compared to younger workers in today’s workforce? Select all.
80
54
46
40
37
25
26
57
26
19
23
17
19
13
1
7
87
67
64
55
46
39
35
53
29
21
17
13
10
7
1
7
77
52
47
44
34
28
26
51
23
14
19
15
13
13
1
12
78
52
44
41
36
23
22
62
31
24
25
19
21
17
<1
9
Most workers hold positive perceptions of workers age 50 and older compared to younger workers in today’s
workforce, including White workers (87 percent), Hispanic workers (80 percent), African American workers (77
percent), and to a somewhat lesser extent, Asian workers (62 percent).
Perceptions of workers age 50+ compared to younger workers in today’s workforce? (%)

Age That Workers Consider a Person to Be “Old”
356
813
18
11
41
43
2
1520 19
11
1 1
30
3
14 1418
63 1
40
4
19 2115
51 <1
36
3
<60 60-69 70-79 80-89 90-99 100+ It depends on theperson
Not Sure
Age When Person is Considered “Old” (%)
Among respondents who gave an age, interestingly, White and African American workers consider someone to
be old at the age of 70 (median), Hispanic workers consider a person to be “old” at 65 (median) and Asian
workers at the younger age of 60 (median). Considerable proportions also indicate that it depends on the
person with 43 percent of White, 40 percent of African American, 36 percent of Asian and 30 percent of
Hispanic workers believing this.
Median Age
White (N=3,949) Age 70Hispanic (N=1,037) Age 65African American (N=789) Age 70Asian/Pacific (N=467) Age 60
New question added in 2017BASE: ALL QUALIFIED RESPONDENTS Q1526. At what age do you consider a person to be “old”?

2 4
17
10
3 1
60
32
11
21
14
52
41
43
11
19
93 1
49
52
11
22
11
2 1
46
5
<60 60-69 70-79 80-89 90-99 100+ It depends on theperson
Not Sure
Median Age
White (N=3,949) Age 75Hispanic (N=1,037) Age 73African American (N=789) Age 70Asian/Pacific (N=467) Age 70
Age That Workers Consider a Person to Be “Too Old” to Work
357
Age When Person is Considered “Too Old” to Work (%)
New question added in 2017BASE: ALL QUALIFIED RESPONDENTS Q1527. At what age do you consider a person to be “too old” to work?
Large proportions of workers believe that “it depends on the person” whether someone is too old to work: White
(60 percent), Hispanic (41 percent), African American (49 percent), and Asian (46 percent). Of those who gave
ages, both Asian and African American workers believe someone is too old to work at age 70 (median), Hispanic
workers do so at 73 (median), and White workers at age 75 (median).

Level of Concern About Health in Older Age
The majority of workers across ethnicities are “very” or “somewhat” concerned about their health in older age,
with Asian (77 percent), White (73 percent), and Hispanic workers (76 percent) being more likely than African
workers (67 percent) to be concerned about this.
New question added in 2017BASE: ALL QUALIFIED RESPONDENTSQ1445X1. How concerned are you about your health in older age?
White2017 (N=3,949)
Hispanic2017 (N=1,037)
African American2017 (N=789)
Asian/Pacific2017 (N=467)
20
53
24
3
30
46
19
5
29
38
24
9
26
51
19
4
NET – Concerned:73%
Very concerned Somewhat concerned Not too concerned Not at all concerned
Concerned About Health in Older Age (%)
NET – Concerned:76%
NET – Concerned:67%
NET – Concerned:77%
358

Engagement in Health-Related Activities on a Consistent Basis
New question added in 2017
BASE: ALL QUALIFIED RESPONDENTS
Q1446. Which of the following health-related activities are you doing on a consistent basis? Select all. 359
When it comes to health-related activities that are done on a consistent bases, White workers are most likely to
seek medical attention when needed (58 percent), Hispanic and Asian workers (both 56 percent) are most
likely to eat healthfully, and African American workers (55 percent) are most likely to maintain a positive
outlook.
WhiteN=3,949
HispanicN=1,037
African AmericanN=789
Asian/PacificN=467
Eating healthfully
Exercising regularly
Maintaining a positive outlook
Seeking medical attention when needed
Avoiding harmful substances (e.g., cigarettes, alcohol, illicit drugs, etc.)
Getting plenty of rest
Getting routine physicals and recommended health screenings
Managing stress
Considering long-term health when making lifestyle decisions
Practicing mindfulness and meditation
Other
Nothing
Engaging in Health-Related Activities on a Consistent Basis (%)
57
54
56
58
51
50
53
45
26
18
0
4
56
55
48
47
45
49
40
43
22
24
1
5
56
56
40
39
48
43
43
41
27
18
0
5
51
52
55
44
50
52
42
47
27
21
0
4
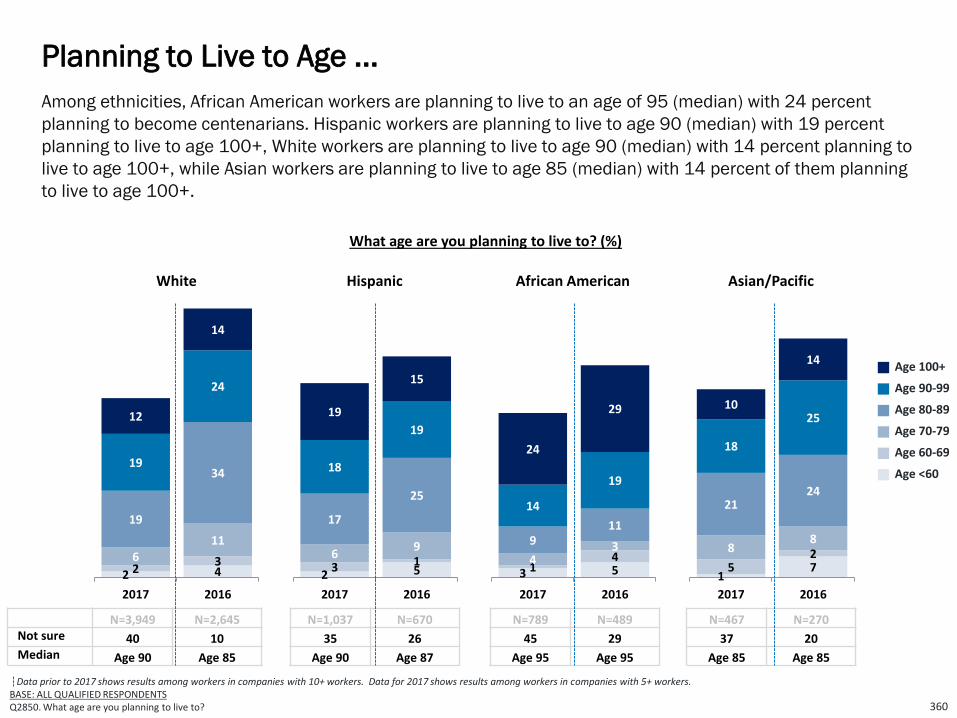
Among ethnicities, African American workers are planning to live to an age of 95 (median) with 24 percent
planning to become centenarians. Hispanic workers are planning to live to age 90 (median) with 19 percent
planning to live to age 100+, White workers are planning to live to age 90 (median) with 14 percent planning to
live to age 100+, while Asian workers are planning to live to age 85 (median) with 14 percent of them planning
to live to age 100+.
Planning to Live to Age ...
360
Data prior to 2017 shows results among workers in companies with 10+ workers. Data for 2017 shows results among workers in companies with 5+ workers.BASE: ALL QUALIFIED RESPONDENTS Q2850. What age are you planning to live to?
White Hispanic African American Asian/Pacific
What age are you planning to live to? (%)
N=3,949 N=2,645Not sure 40 10Median Age 90 Age 85
N=1,037 N=670
35 26
Age 90 Age 87
N=789 N=489
45 29
Age 95 Age 95
N=467 N=270
37 20
Age 85 Age 85
Age 100+
Age 90-99
Age 80-89
Age 70-79
Age 60-69
Age <60
2 4236
11
19
3419
24
12
14
2017 2016
2 53 16
9
17
25
18
19
19
15
2017 2016
3 514439
11
14
19
24
29
2017 2016
175288
2124
18
2510
14
2017 2016

Which of the following types of debtdoes your household currently have? Select all (%)
WhiteN=3,949
HispanicN=1,037
African AmericanN=789
Asian/PacificN=467
Credit card
Mortgage
Car loan
Student loan
Medical debt
Personal loan
Home equity loan
Loan from family or friends
Tax debt
Payday loan
Business loan
Investment debt
Other debt
My household currently does not have any debts
The type of household debt most frequently cited by all workers is credit card debt (Hispanic 62 percent; African
Americans 59 percent; White 59 percent; Asian 58 percent). The second most common type of debt for White
and Asian workers is a mortgage, while for Hispanic and African American workers it is a car loan.
Types of Household Debt
361
59
47
42
16
14
13
10
6
5
4
4
3
3
14
62
35
40
25
18
18
8
10
8
8
4
4
4
12
59
26
33
33
18
20
5
4
8
7
2
4
4
13
58
46
37
17
7
9
9
6
5
4
3
2
2
13
New question added in 2017BASE: ALL QUALIFIED RESPONDENTS Q1286. Which of the following types of debt does your household currently have? Select all.
NET – Has Debt = 86% NET – Has Debt = 88% NET – Has Debt = 87% NET – Has Debt = 87%
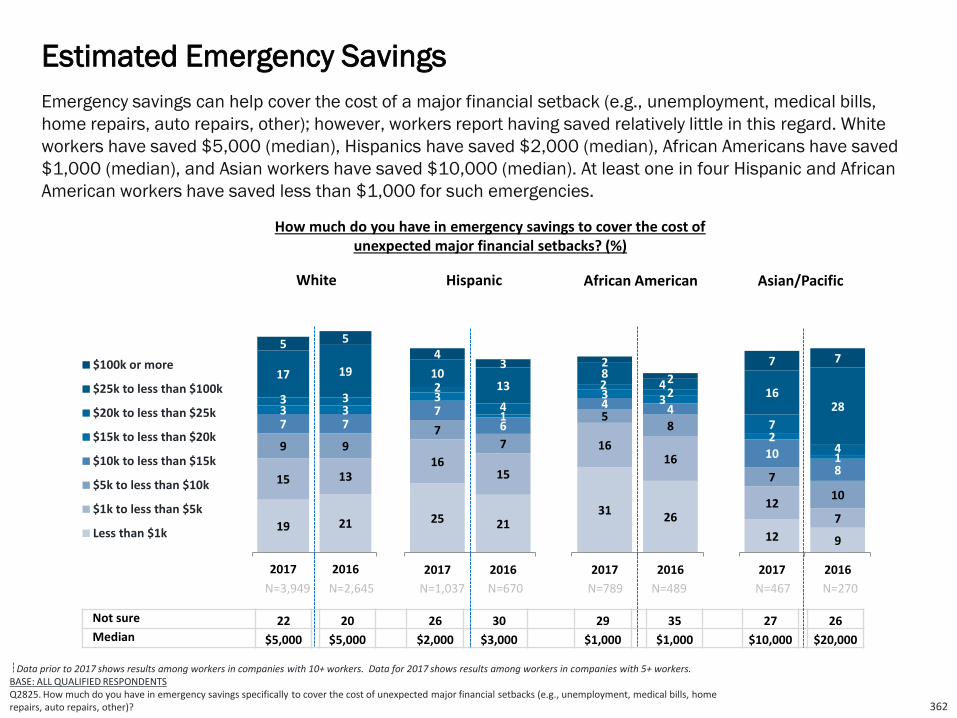
19 21
15 13
9 9
7 73 33 3
17 19
5 5
2017 2016
$100k or more
$25k to less than $100k
$20k to less than $25k
$15k to less than $20k
$10k to less than $15k
$5k to less than $10k
$1k to less than $5k
Less than $1k 12 9
127
7
10
10
8
2
1
7
4
1628
7 7
2017 2016
25 21
1615
77
76
3
1
2
4
1013
43
2017 2016
3126
1616
58
4 43 32
2
84
2
2
2017 2016
Emergency savings can help cover the cost of a major financial setback (e.g., unemployment, medical bills,
home repairs, auto repairs, other); however, workers report having saved relatively little in this regard. White
workers have saved $5,000 (median), Hispanics have saved $2,000 (median), African Americans have saved
$1,000 (median), and Asian workers have saved $10,000 (median). At least one in four Hispanic and African
American workers have saved less than $1,000 for such emergencies.
Estimated Emergency Savings
362
Data prior to 2017 shows results among workers in companies with 10+ workers. Data for 2017 shows results among workers in companies with 5+ workers.BASE: ALL QUALIFIED RESPONDENTS Q2825. How much do you have in emergency savings specifically to cover the cost of unexpected major financial setbacks (e.g., unemployment, medical bills, home repairs, auto repairs, other)?
Not sure 22 20 26 30 29 35 27 26Median $5,000 $5,000 $2,000 $3,000 $1,000 $1,000 $10,000 $20,000
White Hispanic African American
N=3,949
Asian/Pacific
N=2,645 N=789 N=467
How much do you have in emergency savings to cover the cost of unexpected major financial setbacks? (%)
N=489 N=270N=1,037 N=670

80 78 78 80 7971 70 69 71 67
72 73 7076 73
84 86 84 87 86
2017 2016 2015 2014 2013 2017 2016 2015 2014 2013 2017 2016 2015 2014 2013 2017 2016 2015 2014 2013
Data prior to 2017 shows results among workers in companies with 10+ workers. Data for 2017 shows results among workers in companies with 5+ workers.BASE: THOSE CURRENTLY OFFERED QUALIFIED PLANQ1190. Do you currently participate in, or have money invested in your company’s employee-funded retirement savings plan?BASE: ALL QUALIFIED RESPONDENTSQ740. Are you currently saving for retirement outside of work, such as in an IRA, mutual funds, bank account, etc.?BASE: INVESTING FOR RETIREMENTQ790. At what age did you first start saving for retirement?
Savings rates vary among ethnic groups. Asian workers (84 percent) are most likely to be saving for retirement
through an employer-sponsored retirement plan and/or outside of work, followed by White workers (80
percent), which are both significantly higher than African American (72 percent) and Hispanic workers (71
percent). In terms of the median age that they started saving, Hispanic and Asian workers started at a relatively
younger age (age 25), compared to White (age 29) and African American (age 26) workers.
Saving for Retirement / Age Started Saving
363
Age Started Saving
(Median)29 28 30 28 27 25 26 26 25 26 26 25 27 27 30 25 25 27 28 25
White Hispanic African American Asian/Pacific
Workers Who Are Saving For Retirement Through an Employer-Sponsored Retirement Plan And/Or Outside of Work (%)

White Hispanic African American Asian/Pacific
■ 2017 (N=3,949) ■ 2017 (N=1,037) ■ 2017 (N=789) ■ 2017 (N=467)
■ 2016 (N=2,645) ■ 2016 (N=670) ■ 2016 (N=489) ■ 2016 (N=270)
NET – Self-Funded Savings
401(k) / 403(b) Accounts / IRAs
Other savings and investments
Social Security
Working
Company-funded pension plan
Home equity
Inheritance
Other
88
79
59
71
32
23
16
12
2
84
77
52
66
34
26
19
10
3
Data prior to 2017 shows results among workers in companies with 10+ workers. Data for 2017 shows results among workers in companies with 5+ workers.BASE: ALL QUALIFIED RESPONDENTS Q1145. Which one of the following do you expect to be sources of income to cover your living expenses after you retire? Select all.
Across ethnicities, the majority of workers expect to have retirement income from self-funded savings
including retirement accounts (e.g., 401(k)s, 403(b)s, IRAs) and other savings and investments: 88 percent of
Asians, 82 percent of Whites, 82 percent of Hispanics, and 80 percent of African Americans. Expectations of
retirement income from Social Security vary somewhat by ethnicity (78 percent of Whites, 71 percent of
Asians, 69 percent of African Americans, and 66 percent of Hispanics).
Expected Sources of Retirement Income
364
Expected Sources of Income During Retirement (%)
82
72
52
78
39
26
14
11
2
79
70
48
73
39
26
14
12
3
82
69
45
66
39
20
16
12
3
74
62
44
64
37
20
14
10
4
80
67
49
69
39
19
9
5
2
75
65
43
70
39
29
8
9
6

When asked about their expected primary source of income in retirement—401(k)s/403(b)/IRAs were the most
often identified source across ethnicities. However there are some differences among workers with, Asians (44
percent) being more likely than Whites (38 percent), Hispanic workers (37 percent), and African Americans (33
percent) to expect these retirement accounts to be their primary source of income.
Expected Primary Source of Income in Retirement
365
Data prior to 2017 shows results among workers in companies with 10+ workers. Data for 2017 shows results among workers in companies with 5+ workers.*added in 2015
BASE: ALL QUALIFIED RESPONDENTS
Q1150. Which one of the following do you expect to be your primary source of income to cover your living expenses after you retire?
White Hispanic African American Asian/Pacific
■ 2017 (N=3,949)■ 2016 (N=2,645)
■ 2015 (N=2,892)■ 2014 (N=2,716)■ 2013 (N=2,975)
■ 2017 (N=1,037)■ 2016 (N=670)
■ 2015 (N=662)■ 2014 (N=664)■ 2013 (N=169)
■ 2017 (N=789)■ 2016 (N=489)
■ 2015 (N=537)■ 2014 (N=444)■ 2013 (N=182)
■ 2017 (N=467)■ 2016 (N=270)
■ 2015 (N=373)■ 2014 (N=235)■ 2013 (N=232)
401(k) / 403(b) accounts / IRAs
Social Security
*Working
Other savings and investments
Company-funded pension plan
Inheritance
Home equity
Other
37
22
16
13
7
2
1
2
37
22
15
3
10
7
3
3
40
23
14
1
13
3
3
3
37
26
2
21
7
2
5
41
21
3
15
7
5
8
33
25
16
17
4
1
3
1
30
26
17
0
12
8
3
4
36
25
13
1
16
5
1
3
42
27
1
14
7
<1
8
36
32
2
13
13
1
4
44
18
10
18
5
2
2
1
41
17
9
3
19
7
1
3
48
16
13
3
11
5
1
3
50
21
2
20
3
2
2
46
21
2
23
4
<1
4
38
29
13
10
7
1
1
1
37
26
14
1
11
8
1
2
35
28
13
1
11
7
2
3
44
27
2
12
8
3
4
40
28
1
16
9
2
4
N/A N/A N/A N/A
Expected Primary Source of Income in Retirement (%)

White Hispanic African American Asian/Pacific
■ 2017 (N=3,949)
■ 2016 (N=2,645)
■ 2015 (N=2,892)
■ 2014 (N=2,716)
■ 2013 (N=2,975)
■ 2017 (N=1,037)
■ 2016 (N=670)
■ 2015 (N=663)
■ 2014 (N=664)
■ 2013 (N=169)
■ 2017 (N=789)
■ 2016 (N=489)
■ 2015 (N=537)
■ 2014 (N=444)
■ 2013 (N=182)
■ 2017 (N=467)
■ 2016 (N=270)
■ 2015 (N=373)
■ 2014 (N=235)
■ 2013 (N=232)
Health insurance
401(k) / 403(b) / 457(b) or other employee self-funded plan
Life insurance
Disability insurance
Long-Term Care insurance
Company-funded defined-benefit pension plan
*A company-funded cash balance plan
Critical Illness Insurance
**Financial Wellness Program
**Employee Assistance Program
**Workplace Wellness Program
Cancer Insurance
94
89
71
72
69
70
62
60
56
55
53
53
94
88
69
75
66
71
50
60
50
94
88
69
74
66
70
48
55
46
93
89
74
75
67
68
55
62
54
93
89
74
76
65
67
63
55
96
88
89
81
82
79
76
75
79
79
73
64
98
93
87
84
83
83
66
75
71
98
92
83
85
89
89
70
75
67
98
93
92
87
86
88
78
80
73
94
91
83
86
82
86
77
62
95
90
86
80
78
78
76
75
74
74
73
68
95
89
81
81
80
79
68
73
65
94
90
82
79
79
80
66
72
64
95
88
77
83
76
84
71
76
65
96
95
80
82
76
89
71
63
94
91
76
77
75
75
73
67
69
67
67
60
96
89
75
71
79
71
60
60
50
91
90
73
72
75
77
64
65
65
94
91
74
81
82
83
77
77
67
97
94
74
77
76
80
71
68
Approximately nine in 10 workers across ethnicities value a 401(k) or similar employee-funded retirement as
an important benefit. They value retirement plans second only to health insurance.
Note: Data prior to 2017 shows results among workers in companies with 10+ workers. Data for 2017 shows results among workers in companies with 5+ workers.*added in 2014BASE: ALL QUALIFIED RESPONDENTS Q1170. Businesses typically offer a number of different benefits for their workers. For each of the following, please tell us how important that benefit is to you, personally.
Importance of Retirement Benefits Compared to Other Benefits
366
Very/Somewhat Important(%) (NET)
N/A N/A N/A N/A
N/A N/A N/A N/A
N/A N/A N/A N/A
N/A N/A N/A N/A

White Hispanic African American Asian/Pacific
■ 2017 (N=3,949)■ 2016 (N=2,645)
■ 2015 (N=2,892)
■ 2014 (N=2,716)
■ 2013 (N=2,975)
■ 2017 (N=1,037)■ 2016 (N=670)
■ 2015 (N=663)
■ 2014 (N=664)
■ 2013 (N=169)
■ 2017 (N=789)■ 2016 (N=489)
■ 2015 (N=537)
■ 2014 (N=444)
■ 2013 (N=182)
■ 2017 (N=467)■ 2016 (N=270)
■ 2015 (N=373)
■ 2014 (N=235)
■ 2013 (N=232)
NET – AN EMPLOYEE-FUNDED PLAN
Employee-funded 401(k) plan
Other employee self-funded plan(e.g., SEP, SIMPLE, Other)
NET – COMPANY-FUNDED PLAN
Company-funded defined benefit pension plan
*Company-funded cash balance plan
NET - NONE OF THE ABOVE
Other
None
79
76
8
27
22
9
16
2
14
79
77
5
28
23
11
15
72
70
6
30
23
13
18
74
73
4
32
26
14
16
80
76
7
15
16
71
65
9
26
21
10
22
2
20
73
72
6
31
29
10
20
69
68
4
30
27
11
23
66
65
4
31
28
12
24
61
61
5
25
31
70
68
6
26
23
9
25
2
23
71
68
4
25
22
8
24
67
65
3
20
17
6
28
70
69
3
22
17
7
24
69
65
5
18
27
Most workers across ethnic groups are offered a 401(k) or other self-funded plan by their employers. Such
access is greatest among Asian workers (79 percent) followed by African American workers (71 percent),
Hispanic (70 percent) and White workers (70 percent).
Retirement Benefits Currently Offered
367
Note: Data prior to 2017 shows results among workers in companies with 10+ workers. Data for 2017 shows results among workers in companies with 5+ workers.*added in 2014BASE: ALL QUALIFIED RESPONDENTSQ1180. Which of the following retirement benefits does your company currently offer to you, personally? Select all.
70
62
12
25
21
10
24
2
22
66
64
3
28
23
9
22
56
52
7
30
23
12
32
59
57
4
26
19
14
28
63
61
6
22
30
N/A N/A N/AN/A
N/A N/A N/AN/A
Employer-Sponsored Retirement Benefits Currently Offered (%)
N/A N/A N/AN/A
N/A N/A N/AN/A

Among workers who are offered a 401(k) or similar plan, the participation rate varies across ethnic groups. White
workers (84 percent) are the most likely to be participating in their employer’s plan, followed by Asian (82
percent), African American (75 percent) and Hispanic workers (75 percent). Across all ethnicities, participation in
company employee-funded retirement savings plan has increased compared to last year.
Retirement Plan Participation
368
Data prior to 2017 shows results among workers in companies with 10+ workers. Data for 2017 shows results among workers in companies with 5+ workers.BASE: THOSE CURRENTLY OFFERED QUALIFIED PLANQ1190. Do you currently participate in, or have money invested in your company’s employee-funded retirement savings plan?
Participation in Company’s Employee-funded Retirement Savings Plan, % Indicate “Yes”
84 81 80 81 78 7567
81
7179
7571 69
8276
8278
83 82 80
2017 2016 2015 2014 2013 2017 2016 2015 2014 2013 2017 2016 2015 2014 2013 2017 2016 2015 2014 2013
N=2,433
N=1,769
N=1,918
N=1,802
N=2,120
N=710
N=454
N=393
N=424
N=103
N=533
N=341
N=341
N=303
N=118
N=327
N=201
N=259
N=165
N=164
White Hispanic African American Asian/Pacific

Of workers who participate in a 401(k) or similar plan, the median contribution rate is almost the same among
workers of different ethnicities: Asian, Hispanic, and African American workers (each 10 percent), followed by
White workers (9 percent).
Retirement Plan Contribution Rate
369
Data prior to 2017 shows results among workers in companies with 10+ workers. Data for 2017 shows results among workers in companies with 5+ workers.BASE: CURRENTLY PARTICIPATES IN QUALIFIED PLAN Q601. What percentage of your salary are you saving for retirement through your company-sponsored plan this year?
9%7% 7% 7% 7%
10%8%
10% 10% 10% 10%8% 8%
7%6%
10%10% 10%
12%10%
2017 2016 2015 2014 2013 2017 2016 2015 2014 2013 2017 2016 2015 2014 2013 2017 2016 2015 2014 2013
Mean 12.5 10.0 9.7 11.0 9.1 12.9 11.7 12.7 9.9 11.5 15.4 13.8 12.6 11.5 12.3 13.1 14.1 10.1 12.9 11.4
N=1,941
N=1,380
N=1,510
N=223
N=1,617
N=502
N=336
N=298
N=663
N=84
N=379
N=240
N=226
N=759
N=88
N=251
N=156
N=203
N=522
N=123
White Hispanic African American Asian/Pacific
Contribution Rate, Median

Among different ethnic groups, Hispanic workers (85 percent) are more likely to find a feature that
automatically enrolls workers into a 401(k), 403 (b) or similar retirement plan to be “very” or “somewhat”
appealing, followed closely by African American workers (82 percent), White workers (80 percent), and Asian
workers (78 percent). White workers think the default contribution rate should be 6 percent (median) while all
others think it should be 10 percent (median).
Appeal of Automatic Enrollment
370
New question added in 2017BASE: ALL QUALIFIED RESPONDENTS Q635. Imagine that your current employer automatically enrolled you into a 401(k), 403(b) or similar retirement plan, deducting a percentage of each paycheck, and investing it for your future retirement. How appealing would this seem to you?Q636. Imagine that your current employer automatically enrolled you into a 401(k), 403(b) or similar retirement plan, what would you consider to be an appropriate percentage to deduct from your paycheck to be invested for your future retirement?
Appeal of Automatic Enrollment (%)
Appropriate Default Contribution Rate
(median):6%
Very appealing
Somewhat appealing
NET - Appealing
40 43 42 48
4042 40 30
8085 82
78
Asian/Pacific
N=467
Appropriate Default Contribution Rate
(median):10%
African American
N=789
Appropriate Default Contribution Rate
(median):10%
White
N=3,949
Hispanic
N=1,037
Appropriate Default Contribution Rate
(median):10%

Likelihood of Using Automatic Escalation
Hispanic workers (81 percent) are somewhat more likely to use a feature that automatically increases their
contribution to their retirement plans by 1% each year, compared to the 78 percent of African American, 74
percent of White, and 71 percent of Asian workers who say the same.
New question added in 2017BASE: ALL QUALIFIED RESPONDENTS Q702. How likely would you be to use a feature in a 401(k) or similar plan where your employer would automatically increase your contribution rate (as a percentage of your salary) to the plan by 1% each year, until you choose to discontinue this increase?
WhiteN=3,949
African AmericanN=789
Asian/Pacific N=467
31
43
16
10
37
44
14
5
27
51
14
8
25
46
18
11
NET – Likely:81%
NET – Likely:78%
NET – Likely:71%
NET – Likely:74%
Very likely Somewhat likely Not too likely Not at all likely
Likelihood of Using a Feature That Automatically Increases Contribution by 1% Each Year, Until You Choose to Discontinue (%)
HispanicN=1,037
371

“Professionally managed” accounts refers to a managed account service, strategic allocation funds, and/or
target date funds. Across ethnicities, the majority of retirement plan participants use some form of professionally
managed offering in their 401(k) or similar plans: 60 percent of Whites, 64 percent of Hispanics, 51 percent of
Asians, and 57 percent of African Americans. Asian workers (57 percent) are more likely to set their own asset
allocation percentage among the available funds, compared to White (43 percent), Hispanic (41 percent), and
African American (40 percent) workers.
Use of Professionally Managed Offerings
372
Data prior to 2017 shows results among workers in companies with 10+ workers. Data for 2017 shows results among workers in companies with 5+ workers.BASE: PARTICIPATING IN QUALIFIED PLANQ1466. What is your current approach to investing in your employer-sponsored retirement plan? Select all.
White■ 2017 (N=1,944)■ 2016 (N=1,384)■ 2015 (N=1,512)
■ 2014 (N=1,458)
Hispanic■ 2017 (N=503)■ 2016 (N=336)■ 2015 (N=299)
■ 2014 (N=310)
African American■ 2017 (N=379)■ 2016 (N=240)■ 2015 (N=227)
■ 2014 (N=233)
Asian/Pacific■ 2017 (N=253)■ 2016 (N=156)■ 2015 (N=204)
■ 2014 (N=130)
I set my own asset allocation percentages among the available funds
NET – Professionally Managed
I invest in an account (or service) that is managed by a professional investment advisor and I do not have to make investment or allocation decisions
I invest in a strategic allocation fund that is designed to address my specific risk tolerance profile
I invest in a target date fund that is designed to change allocation percentages as I approach my target retirement year
Not sure
Investment Approach in Employer-Sponsored Retirement Plan (%)
43
60
29
22
23
9
43
59
28
21
22
10
45
47
20
19
14
16
45
52
22
24
19
13
41
64
31
30
22
12
40
62
27
31
22
11
39
60
24
28
31
13
37
62
34
29
21
11
40
57
28
19
16
15
34
63
38
24
21
14
36
55
30
13
22
22
40
55
22
20
26
16
57
51
20
20
21
8
36
62
21
18
39
15
47
62
30
22
24
10
61
53
30
24
25
4
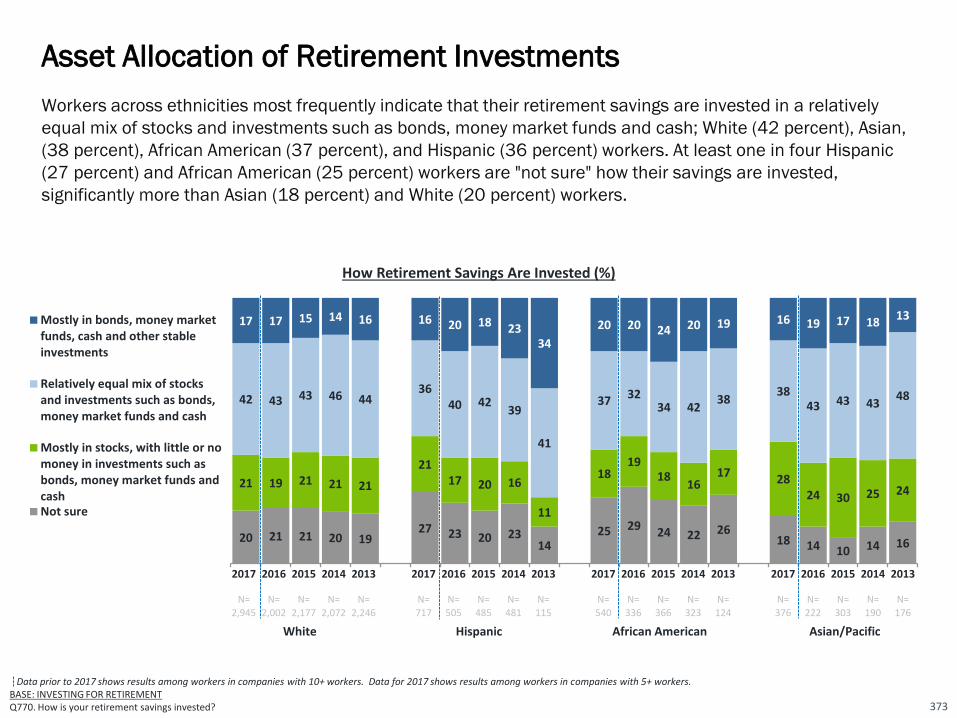
Workers across ethnicities most frequently indicate that their retirement savings are invested in a relatively
equal mix of stocks and investments such as bonds, money market funds and cash; White (42 percent), Asian,
(38 percent), African American (37 percent), and Hispanic (36 percent) workers. At least one in four Hispanic
(27 percent) and African American (25 percent) workers are "not sure" how their savings are invested,
significantly more than Asian (18 percent) and White (20 percent) workers.
Asset Allocation of Retirement Investments
373
Data prior to 2017 shows results among workers in companies with 10+ workers. Data for 2017 shows results among workers in companies with 5+ workers.BASE: INVESTING FOR RETIREMENTQ770. How is your retirement savings invested?
20 21 21 20 1927 23 20 23
1425 29
24 22 2618 14 10 14 16
21 19 21 21 21
2117 20 16
11
1819
1816
1728
24 30 25 24
42 43 43 46 4436
40 4239
41
3732
34 4238
3843 43 43
48
17 17 15 14 16 16 20 18 2334
20 20 24 20 19 16 19 17 1813Mostly in bonds, money market
funds, cash and other stableinvestments
Relatively equal mix of stocksand investments such as bonds,money market funds and cash
Mostly in stocks, with little or nomoney in investments such asbonds, money market funds andcashNot sure
2017
N=
2,945
2016
N=
2,002
2015
N=
2,177
2014
N=
2,072
2013
N=
2,246
2017
N=
717
2016
N=
505
2015
N=
485
2014
N=
481
2013
N=
115
2017
N=
540
2016
N=
336
2015
N=
366
2014
N=
323
2013
N=
124
2017
N=
376
2016
N=
222
2015
N=
303
2014
N=
190
2013
N=
176
White Hispanic African American Asian/Pacific
How Retirement Savings Are Invested (%)

White■ 2017 (N=2,433)
■ 2016 (N=1,769)
Hispanic■ 2017 (N=710)
■ 2016 (N=454)
African American■ 2017 (N=533)
■ 2016 (N=341)
Asian/Pacific■ 2017 (N=327)
■ 2016 (N=201)
NET - Have Taken a Loan, Early Withdrawal, and/or Hardship Withdrawal From 401(k) or Similar Plan or IRA
Yes, I have taken a loan from a 401(k) or similar plan and am paying it back
Yes, I have taken a hardship withdrawal and incurred taxes and penalties
Yes, I have taken an early withdrawal and cashed out a portion or all of a 401(k) or similar plan balance after my separation of employment from a prior employer and incurred taxes and penalties
Yes, I have taken a loan from a 401(k) or similar plan but was unable to pay it back so it became an early withdrawal and incurred taxes and penalties
Yes, I have taken an early withdrawal and cashed out a portion or all of an IRA and incurred taxes and penalties
No, I have never taken a loan or early withdrawal from a 401(k) or similar plan or IRA
Not sure
“Leakage” from retirement plans in the form of loans and withdrawals can severely inhibit the growth of
participants’ long-term retirement savings. Some workers across ethnicities have taken some form of loan,
early withdrawal, and/or hardship withdrawal from a 401(k) or similar plan, including African American
workers (39 percent) who are most likely to have done so, followed by Hispanic workers (37 percent), White
workers (32 percent), and Asian workers (22 percent).
Retirement Plan Leakage: Loans and Withdrawals
374
Data prior to 2017 shows results among workers in companies with 10+ workers. Data for 2017 shows results among workers in companies with 5+ workers.BASE: ALL QUALIFIED RESPONDENTSQ754. Have you ever taken any form of loan or early withdrawal from a qualified retirement account such as a 401(k) or similar plan or IRA? Select all.
Have you ever taken any form of loan or early withdrawal from a qualified retirement account such as a 401(k) or similar plan or IRA? (%)
32
19
8
8
6
5
66
2
27
15
6
8
5
3
71
2
22
15
3
3
5
3
75
3
18
12
4
3
4
4
81
1
39
22
11
7
9
4
60
1
31
23
6
7
7
3
68
2
37
21
10
11
9
3
61
2
29
18
5
6
5
4
69
2

White and Asian workers have the highest reported total household retirement savings (estimated medians of
$104k and $81k, respectively). They are also most likely to say that they have saved $250k or more (34
percent of Whites and 33 percent of Asians). In contrast, Hispanic workers have saved $48k with 23 percent
saving more than $250k, and African American workers have saved $29k with 14 percent saving more than
$250k.
Total Household Retirement Savings
375
Data prior to 2017 shows results among workers in companies with 10+ workers. Data for 2017 shows results among workers in companies with 5+ workers.*added in 2017
Note: The median is estimated based on the approximate midpoint of the range of each response category. Non-responses are excluded from the estimate. BASE: ALL QUALIFIED RESPONDENTSQ1300. Approximately how much money does your household have saved in all of your retirement accounts? Please include IRAs, 401(k)s, 403(b)s, and any other savings for retirement to which you and/or your spouse or partner have contributed funds.
Not sure 8 8 10 9 10 12 14 14 10 14 11 14 15 11 12 6 12 10 6 12
Decline to answer 4 9 10 9 11 2 10 8 13 8 5 11 13 8 11 5 11 13 9 11
Estimated Median $104k $89k $76k $75k $57k $48k $48k $39k $43k $48k $29k $22k $30k $27k $15k $81k $134k $100k $106k $63k
Total Household Retirement Savings (%)
4 6 5 35 15 13 11 14 5 16
11 1420 12 20 16 16 16
45 5 4 8
5
54 4
5 10 47 5
3 98
3 713
73 2 3
7
85 7
67
85 9 6
68 7
8
12
11
5
4 4 5
7
76 7
88
119
1211
8
14 10
13
11
14
9
8 8 9
5
11 9 10 1212
12
12
13 16 10
13
810
169
16
11 15 15
18
14 14 14 1515
11
11
10 1115
9
8 12
124
12
13
20 18
16
3429 25 26 19
23
1916 14 17
14
14 10
6
8 33
3323
30 17
2017 2016 2015 2014 2013 2017 2016 2015 2014 2013 2017 2016 2015 2014 2013 2017 2016 2015 2014 2013
$250k or more
$100k to less than $250k
$50k to less than $100k
$25k to less than $50k
$10k to less than $25k
$5k to less than $10k
Less than $5k
None
N=3,069N=2,645N=2,892N=2,716N=2,975 N=782 N=670 N=663 N=664 N=169 N=569 N=489 N=537 N=444 N=182 N=372 N=270 N=373 N=235 N=232
White Hispanic African American Asian/Pacific
NA NA NA NA NA NA NA NA NA NA NA NA NA NA NA NA

376
Data prior to 2017 shows results among workers in companies with 10+ workers. Data for 2017 shows results among workers in companies with 5+ workers.Note: The median is estimated based on the approximate midpoint of the range of each response category. BASE: ALL QUALIFIED RESPONDENTSQ890. Thinking of what money can buy today, how much money do you believe you will need to have saved by the time you retire in order to feel financially secure?
White Hispanic African American Asian/Pacific
2017 2016 2015 2014 2013 2017 2016 2015 2014 2013 2017 2016 2015 2014 2013 2017 2016 2015 2014 2013
N=3,949 N=2,645 N=2,892 N=2,716 N=2,975 N=1,037 N=670 N=663 N=664 N=169 N=789 N=489 N=537 N=444 N=182 N=467 N=270 N=373 N=235 N=232
$2m or more 15 16 29 27 16 15 13 30 24 17 14 10 27 27 11 28 32 36 39 27
$1m to less than $2m 22 22 26 23 22 16 19 23 18 16 8 13 22 14 10 25 27 23 35 29
$500k to less than $1m 21 23 20 22 23 19 19 18 19 27 18 17 15 19 25 15 18 17 10 15
$100k to less than $500k 26 21 18 18 26 27 24 15 26 26 32 32 21 23 31 16 11 11 9 20
Less than $100k 16 18 7 9 13 23 25 14 12 15 28 28 15 17 23 16 12 13 7 10
Median $500k $500k $1m $1m $500k $500k $500k $1m $650k $500k $250k $250k $850k $500k $300k $1m $1m $1m $1m $1m
Estimated Retirement Savings Needs
Retirement savings needs vary across ethnic groups. Asian workers estimate that they will need to have saved
$1 million (median) by the time they retire in order to feel financially secure. White and Hispanic workers
estimate they will need $500k (median), and African American workers estimate $250k (median).

White Hispanic African American Asian/Pacific
■ 2017 (N=3,883) ■ 2016 (N=2,571) ■ 2015 (N=2,844)■ 2014 (N=2,657)■ 2013 (N=2,943)
■ 2017 (N=1,019)■ 2016 (N=657) ■ 2015 (N=657)■ 2014 (N=659)■ 2013 (N=168)
■ 2017 (N=772) ■ 2016 (N=478)■ 2015 (N=530)■ 2014 (N=433)■ 2013 (N=182)
■ 2017 (461) ■ 2016 (N=267)■ 2015 (N=370)■ 2014 (N=233)■ 2013 (N=228)
Guessed
Estimated based on current living expenses
Used a retirement calculator*
Expected earnings on investments
Read/heard that is how much is needed
Amount given to me by financial advisor
Completed a worksheet
Other
Many workers are “guessing” their retirement savings needs. African American workers (51 percent) and Asian
workers (51 percent) are most likely to have guessed compared to White (46 percent) and Hispanic workers (43
percent). Few workers across ethnicities indicate they used a retirement calculator to estimate their savings
needs.
Basis for Estimating Retirement Savings Needs
377
Note: Data prior to 2017 shows results among workers in companies with 10+ workers. Data for 2017 shows results among workers in companies with 5+ workers.*added in 2014BASE: PROVIDED ESTIMATE OF MONEY NEEDED FOR RETIREMENTQ900. How did you arrive at that number?
N/A N/A
51
22
6
8
2
5
3
3
52
21
6
6
5
3
4
3
60
18
8
4
2
2
2
4
54
21
4
8
3
2
3
4
45
29
7
3
3
11
2
N/A
51
21
7
7
5
5
3
1
39
34
7
13
2
2
2
1
43
24
5
9
6
1
6
6
43
18
6
9
7
8
8
2
46
23
5
9
5
10
2
N/A
46
24
8
6
5
4
4
3
48
22
10
4
5
3
4
4
56
20
7
4
2
4
3
4
51
22
6
4
3
5
4
4
49
25
6
5
3
9
4
43
24
7
8
7
4
4
3
46
21
6
8
6
6
5
2
49
20
7
10
6
3
2
3
46
24
9
6
5
4
3
3
52
28
3
2
3
9
2
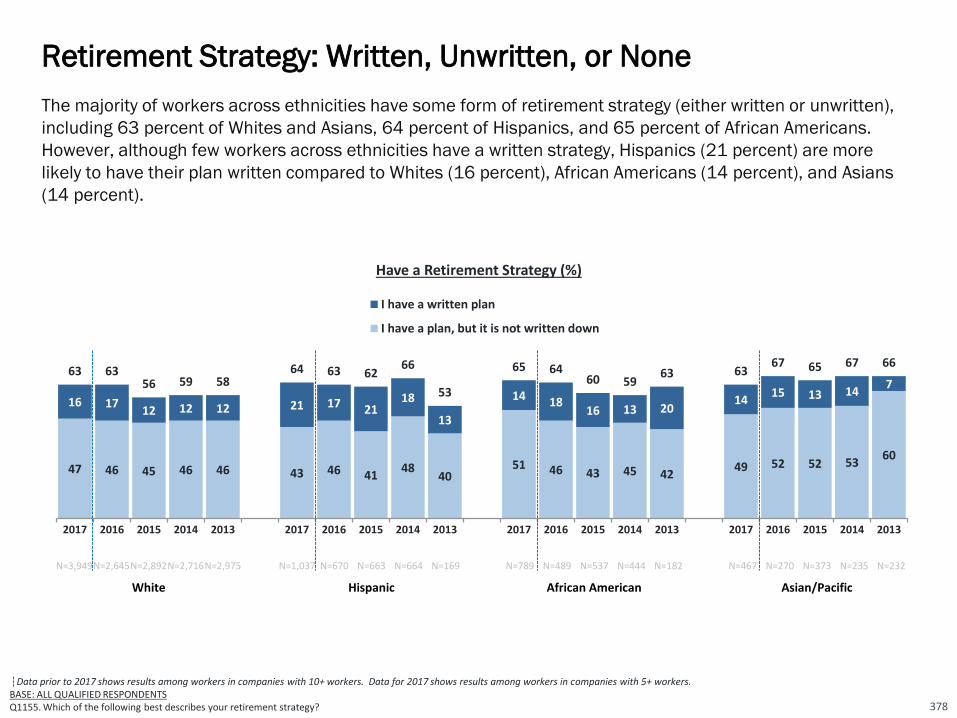
Have a Retirement Strategy (%)
Data prior to 2017 shows results among workers in companies with 10+ workers. Data for 2017 shows results among workers in companies with 5+ workers.BASE: ALL QUALIFIED RESPONDENTSQ1155. Which of the following best describes your retirement strategy?
The majority of workers across ethnicities have some form of retirement strategy (either written or unwritten),
including 63 percent of Whites and Asians, 64 percent of Hispanics, and 65 percent of African Americans.
However, although few workers across ethnicities have a written strategy, Hispanics (21 percent) are more
likely to have their plan written compared to Whites (16 percent), African Americans (14 percent), and Asians
(14 percent).
Retirement Strategy: Written, Unwritten, or None
378
47 46 45 46 46 43 46 4148
4051 46 43 45 42
49 52 52 5360
16 1712 12 12 21 17 21
18
13
14 1816 13 20
1415 13 14
763 63
56 59 5864 63 62
66
53
65 6460 59
63 6367 65 67 66
2017 2016 2015 2014 2013 2017 2016 2015 2014 2013 2017 2016 2015 2014 2013 2017 2016 2015 2014 2013
I have a written plan
I have a plan, but it is not written down
N=3,949N=2,645N=2,892N=2,716N=2,975 N=1,037 N=670 N=663 N=664 N=169 N=789 N=489 N=537 N=444 N=182 N=467 N=270 N=373 N=235 N=232
White Hispanic African American Asian/Pacific

White Hispanic African American Asian/Pacific
■ 2017 (N=2,546)
■ 2016 (N=1,664)
■ 2017 (N=758)
■ 2016 (N=480)
■ 2017 (N=539)
■ 2016 (N=335)
■ 2017 (N=343)
■ 2016 (N=208)
Very confident
Somewhat confident
Not too confident
Not at all confident
I haven’t given much thought to a financial strategy for travel in retirement
21
37
17
11
14
18
41
16
10
15
24
37
19
6
14
15
44
12
11
18
16
43
16
10
15
23
36
15
9
17
14
40
21
9
16
19
41
19
4
17
Among workers who dream of traveling in retirement, the majority are confident their current financial strategy
will allow them to meet their travel goals: 58 percent of Whites, 61 percent of Hispanics, 59 percent of African
Americans, and 54 percent of Asians. However, relatively few across ethnic groups are “very” confident, and
some haven’t given it much thought.
Confidence that Financial Strategy Will Enable Travel Goals
379
Data prior to 2017 shows results among workers in companies with 10+ workers. Data for 2017 shows results among workers in companies with 5+ workers.BASE: THOSE WHO DREAM OF TRAVELING IN RETIREMENTQ2845. How confident are you that your current financial strategy will allow you to meet your travel goals throughout retirement?
Confidence That Current Financial Strategy Will Meet Retirement Travel Goals (%)
NET Confident2017: 54%2016: 60%
NET Confident2017: 59%2016: 59%
NET Confident2017: 61%2016: 59%
NET Confident2017: 58%2016: 59%

Among those who are investing for retirement, Hispanic and White workers (both 41 percent) are more likely to
use a professional financial advisor to help manage their retirement savings or investments than Asian (32
percent) and African American (35 percent) workers.
Professional Financial Advisor Usage
380
Data prior to 2017 shows results among workers in companies with 10+ workers. Data for 2017 shows results among workers in companies with 5+ workers.BASE: INVESTING FOR RETIREMENTQ860. Do you use a professional financial advisor to help manage your retirement savings or investments?
41 4036 37 38
4146
4237
26
35 3630
33 34 3229 29
3733
2017 2016 2015 2014 2013 2017 2016 2015 2014 2013 2017 2016 2015 2014 2013 2017 2016 2015 2014 2013
N=2,945
N=2,002
N=2,177
N=2,072
N=2246
N=717
N=505
N=485
N=481
N=115
N=540
N=336
N=366
N=323
N=124
N=376
N=222
N=303
N=190
N=176
White Hispanic African American Asian/Pacific
Use a Professional Financial Advisor % Indicate “Yes”

36
64
The IRS offers a tax credit to eligible taxpayers who are saving for retirement in a qualified retirement plan or
IRA, called the Saver’s Credit; however, only about four in ten workers across ethnicities are aware of it. Asian
workers (41 percent) are more likely to be aware of the Saver’s Credit, compared to Hispanic (39 percent),
White (35 percent) and African American (33 percent) workers. Across all ethnicities, awareness of the Saver’s
credit has increased since last year.
Awareness of the Saver’s Credit
381
Yes, I am aware No, I am not aware
Data prior to 2017 shows results among workers in companies with 10+ workers. Data for 2017 shows results among workers in companies with 5+ workers.BASE: ALL QUALIFIED RESPONDENTS Q1120. Are you aware of a tax credit called the “Saver’s Credit,” which is available to individuals and households, who meet certain income requirements, for making contributions to an IRA or a company-sponsored retirement plan such as a 401(k) plan or 403(b) plan?
White2017 (N=3,949)
35
65
Hispanic2017 (N=1,037)
39
61
African American2017 (N=789)
33
67
Asian/Pacific2017 (N=467)
41
59
White2016 (N=2,645)
32
68
Hispanic2016 (N=670)
African American2016 (N=489)
30
70
Asian/Pacific2016 (N=270)
35
65
2017
2016

Fewer than half of workers across ethnicities are aware of the IRS’ Free File Program. African American workers
(49 percent) are more likely to be aware of the IRS’ Free File Program, which offers federal income tax
preparation software for free to eligible tax filers. Forty-five percent of Hispanic workers, 44 percent of White
workers, and 43 percent of Asian workers are aware of the program.
382
New question added in 2017BASE: ALL QUALIFIED RESPONDENTS Q2821. Are you aware of the IRS’ Free File program that offers federal income tax preparation software for free for eligible tax filers?
44
56
White N=3,949
45
554951
43
57
HispanicN=1,037
African AmericanN=789
Asian/PacificN=467
No Yes
Awareness of the IRS’ Free File Program (%)
Awareness of the IRS’ Free File Program
Respondent Profiles
Comparison of Full- and Part-Time
Workers
Appendix
383

Profile of Respondents – Total Respondents
384
Full- & Part-time
N=6372Full-time
N=4390Part-time
N=1982
Gender
Male 52% 57% 35%
Female 48% 43% 65%
Age
18 - 19 2% 1% 7%20 – 24 7% 5% 13%25 – 29 12% 13% 11%30 – 34 12% 13% 7%35 – 39 12% 13% 8%40 – 44 10% 11% 7%45 – 49 11% 11% 8%50 – 54 9% 9% 7%55 – 59 12% 13% 10%60 – 64 7% 7% 7%65 and over 6% 4% 15%MEAN 42.8 42.7 42.9MEDIAN 42 42 42
Ethnicity
White, non-Hispanic 61% 62% 62%Hispanic 19% 19% 18%African American 11% 11% 13%
Asian/Pacific 7% 7% 5%
Other/Mixed 1% 1% 1%
Decline to answer 1% * 1%
Full- & Part-time
N=6372Full-time
N=4390Part-time
N=1982
Level of Education
Less than high school graduate * * 1%
High school graduate 30% 28% 35%
Some college or trade school 30% 29% 36%
College graduate 28% 30% 21%
Some grad. school/grad. Degree 12% 13% 7%
Marital Status
Married or civil union 56% 58% 49%
Single, never married 25% 23% 33%
Divorced/widowed/separated 10% 10% 10%
Living with Partner 9% 9% 8%
Sexual Orientation
Heterosexual 90% 91% 88%
Gay 3% 3% 2%
Bisexual 4% 3% 6%
Lesbian 1% 1% 1%
Other * * 1%
Not Sure * * *
Decline to answer 2% 2% 2%
*<1%

Profile of Respondents – Total Respondents, continued
385
Full- & Part-time
N=6372Full-time
N=4390Part-time
N=1982
Amount in Current Employer’s Retirement Plan(Those with qualified plans currently offered to them)
(N=4084) (N=3247) (N=837)
None 9% 7% 20%
$1 to less than $5,000 10% 9% 17%
$5,000 to less than $10,000 6% 6% 7%
$10,000 to less than $25,000 9% 9% 8%
$25,000 to less than $50,000 9% 10% 8%
$50,000 to less than $100,000 12% 13% 8%
$100,000 to less than $250,000 13% 14% 7%
$250,000 or more 20% 22% 10%
Not sure 7% 6% 10%
Decline to answer 5% 4% 5%
MEAN $164.8 $174.4 $100.5
MEDIAN $41.0 $49.1 $6.7
Company's Primary BusinessProfessional services 23% 25% 15%Service industries 18% 14% 33%Manufacturing 12% 14% 5%Transportation/Comm./Utilities 7% 8% 4%Agriculture/Mining/Construction 4% 4% 4%Some other type of business 36% 35% 39%
Number of Employees
5-499 (NET) 50% 50% 51%
5 to 9 9% 8% 13%
10 to 24 10% 9% 13%
25 to 99 17% 17% 15%
100 to 499 15% 16% 9%
500+ (NET) 50% 50% 49%
500 to 999 7% 6% 7%
1,000 or more 43% 43% 43%
MEAN 753 758.6 731.2
MEDIAN 293 295 282
Full- & Part-time
N=6372Full-time
N=4390Part-time
N=1982
HH Income
Less than $25,000 8% 5% 18%
$25,000 to less than $50,000 19% 18% 23%
$50,000 to less than $75,000 19% 20% 18%
$75,000 to less than $100,000 16% 17% 14%
$100,000 to less than $150,000 21% 23% 14%
$150,000 or more 12% 14% 6%Not sure 0% 0% 0%
Decline to answer 5% 3% 7%
MEAN $81.9 $86.4 $63.6
MEDIAN $64.8 $69.9 $45.2
HH Amount Saved for Retirement (N=4875) (N=3525) (N=1350)
None 4% 3% 8%
$1 to less than $5,000 6% 6% 8%
$5,000 to less than $10,000 7% 7% 6%
$10,000 to less than $25,000 8% 8% 8%
$25,000 to less than $50,000 9% 9% 8%
$50,000 to less than $100,000 12% 13% 10%
$100,000 to less than $250,000 13% 13% 10%
$250,000 or more 30% 32% 22%Not sure 8% 7% 13%Decline to answer 3% 2% 7%MEAN $260.0 $269.9 $217.2MEDIAN $70.7 $77.3 $45.2
Occupation
Professional/Medical/Technical 17% 19% 11%
Managerial or business owner 17% 20% 4%
Clerical/ Service/Administration 29% 26% 37%
Blue-Collar/Production 9% 10% 6%
Sales 11% 9% 17%
Teacher/Education 1% 1% 1%
Some Other Occupation 16% 15% 24%
*<1%
Michelle Black
Olga Bronshteyn
Kent Callahan
Heidi Cho
Wonjoon Cho
Catherine Collinson
Jeanne de Cervens
Hector De La Torre
Phil Eckman
Steve Eichmann
Jaime Greco
David Hopewell
David Krane
Bryan Mayaen
Mark Mullin
Matan Neuman
386
Acknowledgements
Cindy Nodorft
Jay Orlandi
Maurice Perkins
Julie Quinlan
Gabe Rozenwasser
David Schultz
Laura Scully
Frank Sottosanti
Julie Tschida Brown
Patti Vogt Rowey
Steven Weinberg
Helane Wilbourne
Hank Williams
Alex Wynaendts
Harrison Yue
