annual survey report 2011 - hays · 2 resourcing and talent management in turbulent times 20 ......
TRANSCRIPT

2011RESOURCING AND TALENT PLANNING
Annual survey report 2011
in partnership with
RESO
UR
CIN
G A
ND
TALE
NT P
LAN
NIN
G 2
011
1
2011
CONTENTS
Foreword 2
Summary of key findings 4
1 Recruiting employees 7
2 Resourcing and talent management in turbulent times 20
3 Diversity 27
4 Managing labour turnover 29
Conclusions 33
Background to the survey 35
Further sources of information 38
Acknowledgements 39
Footnotes 40
cipd
cou
k2011resou
rcing
and
talentp
lann
ing
survey
2
RESOURCING AND TALENT PLANNING
fOREwORD
Welcome to the fifteenth edition of our annual
Resourcing and Talent Planning survey report As
in previous years we provide useful benchmarking
data for organisations on resourcing trends costs
and turnover This year we have included new topical
sections ndash which we hope you will find useful ndash
examining the employment of younger workers the
length of the recruitment process the nature of job
vacancies relationships with recruitment partners and
the use of strengths-based approaches to recruitment
The headlines from this yearrsquos findings are that
recruitment activity remains low yet organisations
are experiencing recruitment difficulties in spite of
more people in the labour market The top reason
for the recruitment difficulties is a lack of necessary
specialist or technical skills
Strategies employed by some to try to fill
skills shortages include increasing their use of
apprenticeships interns and considering sponsoring
students through universities Employers however
need to think more holistically and long term when
it comes to skills shortages such as linking up with
educational establishments to ensure the curriculum
is preparing students well for the world of work and
developing their internal talent pipelines around
skills shortage areas
We feature a case study in this report from the
Association of Greater Manchester Authorities
(AGMA) This real-life example helps to bring the
findings to life and provide some practical evidence
of how organisations are reconfiguring their
resourcing and talent strategies for maximum effect
in difficult times
Claire McCartney
Adviser Resourcing and Talent Planning
CIPD
Despite continued high unemployment many
UK organisations continue to face difficulties
in attracting professionals with the right skills
and experience Hays has observed an increasing
tendency for organisations regardless of size or
sector to become more rigid with regards to the
people they wish to recruit Employers are less
likely to compromise than they have been in the
past and will delay recruitment until they find
someone with exactly the right skills qualifications
and experience At the same time job roles are
becoming increasingly niche which only adds to the
recruitment difficulties employers face today
This research suggests these problems look set to
continue and will only get worse long term due to
the rising number of young people not in training
education or employment if organisations fail to
address underlying problems Added to this many
of the challenges that organisations have always
faced still remain current such as a shortage of
professionals with specialist or technical skills and
the poor image associated with certain professions
This highlights the need for UK organisations to
invest in designing a creative resourcing and talent
attraction strategy now more than ever before
Julie Waddicor
Managing Director Hays Human Resources the
leading recruiting expert
RESO
UR
CIN
G A
ND
TALE
NT P
LAN
NIN
G 2
011
3
2011
ABOUT US Chartered Institute of Personnel and Development
The Chartered Institute of Personnel and
Development (CIPD) is Europersquos largest HR and
development professional body As a globally
recognised brand with over 135000 members we
pride ourselves on supporting and developing those
responsible for the management and development of
people within organisations
Our aim is to drive sustained organisation
performance through HR shaping thinking leading
practice and building HR capability within the
profession Our topical research and public policy
activities set the vision provide a voice for the
profession and promote new and improved HR and
management practices
We know what good HR looks like and what HR
professionals need to know do and deliver at
different stages of their career be they specialists or
generalists working in the UK or internationally
We offer
bull membership
bull professional development including
qualifications and training
bull networking opportunities and world-class
events
bull expertise in HR capability-building and
consultancy services
bull topical insights and analysis
bull a wealth of resources and a voice for HR
cipdcouk
Hays
Hays is the worldrsquos leading recruiting expert in
qualified professional and skilled work It employs
over 7000 staff in 257 offices across 30 countries Last
year Hays placed around 50000 people in permanent
jobs and nearly 180000 in temporary positions
Hays works across 17 specialist areas from healthcare
to telecoms banking to construction and education
to IT It operates across the private public and not-forshy
profit sectors
Its recruiting experts deal with 150000 CVs every
month and more than 50000 live jobs globally at any
one time The depth and breadth of their expertise
ensures that Hays understand the impact the right
individual can have on a business and how the right
job can transform a personrsquos life
wwwhayscouk
cipd
cou
k2011resou
rcing
and
talentp
lann
ing
survey
4
RESOURCING AND TALENT PLANNING
SUmmARy Of kEy fINDINGS
The CIPDrsquos 2011 Resourcing and Talent Planning survey report produced in partnership with Hays contains valuable information on current and emerging trends in people resourcing practice This annual benchmarking survey is based on 626 respondent organisations from the UK The survey examines organisationsrsquo resourcing and talent planning strategies and practices and the key challenges and issues they face New question areas this year examine the employment of younger workers the length of the recruitment process the nature of job vacancies relationships with recruitment partners and the use of strengths-based approaches to recruitment
Resourcing strategies and objectives bull Just over half of survey participants report
having a formal resourcing strategy
bull Larger organisations are most likely to have a
resourcing strategy
The number and nature of vacancies bull On average the number of vacancies
organisations attempted to fill in 2010 remains
as low as in 2009 during the recession
bull The number of vacancies in very large
organisations particularly in the public sector
has dramatically reduced over the past three
years
bull Three-quarters of permanent vacancies were
filled with external candidates
bull Three-fifths of organisations require candidates
to have specific sector experience
bull Twice as many public sector organisations
(48) expect they will recruit fewer people as
a consequence of the abolition of the Default
Retirement Age (23 overall)
Graduate recruitment bull Two-fifths of organisations are concerned that
the increase in university tuition fees will have
an impact on the number of graduates in the
marketplace
bull One in ten organisations are considering
sponsoring students through university (20
of manufacturing and production) 22
increasing their use of internships and 30
increasing apprenticeship schemes (48 of
manufacturing and production)
bull Just over a quarter of organisations operate a
structured graduate recruitment programme
(35 of manufacturing and production)
bull Few organisations have closed graduate
recruitment programmes over the past
12 months however half of public sector
organisations had reduced their intake (50
compared with 20 in the private and not-forshy
profit sectors)
RESO
UR
CIN
G A
ND
TALE
NT P
LAN
NIN
G 2
011
5
2011 Recruitment difficulties bull One in three organisations report the length of
their recruitment process has led to the loss of
potential recruits
bull Three-quarters of organisations experienced
recruitment difficulties in the past few months
bull Managers and professionals and technical
positions are the most difficult vacancies to fill
bull As in previous years the main reason for
recruitment difficulties is a lack of necessary
specialist or technical skills
bull Nearly three-quarters of organisations had made
efforts to improve their employee brand over
the last year most commonly through employee
surveys and developing online career sites
Attracting and selecting candidates bull While the effectiveness of methods to attract
applicants varies according to organisation sector
and size the most effective method overall
is reported to be through organisationsrsquo own
corporate websites as was the case last year
bull The private sector particularly manufacturing
and production organisations are three times
more likely than public sector organisations to
include recruitment agencies among their most
effective methods for attracting candidates
bull Overall a third of organisations report they
have reduced their use of recruitment partners
however one in five report they have formed
a closer business partnership with them over
the past year and one in ten that they consider
them integral to attracting top talent
bull Competency-based interviews (70) interviews
following the contents of CVsapplication forms
(63) and structured interviews (56) are as
last year the most common methods used to
select applicants
bull Two-fifths of organisations report they use
a strengths-based approach to recruitment
although it is less commonly used in the public
sector (26)
bull The median recruitment cost of filling a vacancy
is pound7500 for senior managersdirectors and pound2500
for other employees (adjusting for accuracy)
showing reductions compared with last year
Resourcing in turbulent times bull Half of the organisations surveyed report the
economic climate has had a negative impact
on their organisationsrsquo resourcing budgets for
2011ndash12 This year it is the public sector that is
most severely hit with four out of five (82)
reporting their resourcing budgets will be
reduced (up from 59 last year)
bull Changes in resourcing and talent practices in
2011 compared with 2010 reflect a stronger
focus on costs and reductions in budgets More
organisations anticipate they will be focusing
on developing talent in-house retaining rather
than recruiting talent and reducing their
reliance on recruitment agencies and external
consultants for resourcing and development
bull Nearly half of public sector organisations will
be implementing a recruitment freeze in 2011
compared with one-fifth of organisations
overall Two-thirds of public sector
organisations and 29 of private organisations
will be reducing the number of new recruits
they hire
bull The volume of applicants for vacancies has
increased reflecting the high unemployment
rate Three-quarters of organisations have
noticed an increase in the number of
unsuitable applicants and a third report that
there are too many suitable candidates to
choose from Despite high unemployment
over the last two years more than half (52)
believe that competition for talent is even
greater as the pool of available talent to hire
has fallen sharply (2010 41 2009 20)
bull Most organisations remain focused on
managing talent despite increased attention
on reducing costs with only 4 reporting
that their focus on talent has decreased
Nevertheless 18 of organisations (32 of the
public sector) have reduced their overall talent
management spend as a consequence of the
economic downturn
cipd
cou
k2011resou
rcing
and
talentp
lann
ing
survey
6
RESOURCING AND TALENT PLANNING
Diversity bull Overall in little change from previous years
just over half of organisations have a diversity
strategy rising to 90 of public sector
organisations
bull Our figures indicate a reduction in the use of
several methods to address diversity issues this
year particularly in the public sector which has
traditionally led the way in diversity practice
Labour turnover bull The median labour turnover rate has decreased
over the past few years (2011 125 2010
135 2009 157 2008 173)
bull Smaller organisations are most likely to report
that their labour turnover has increased and
larger organisations that it has decreased
bull As in previous years the majority of turnover
is attributed to employees leaving voluntarily
The rate of voluntary leavers has increased
slightly in the private sector compared with last
year but decreased in the voluntary and public
services sector reflecting the growthcuts in the
respective sectors
bull The proportion of organisations making ten
or more redundancies over the past year has
reduced from 33 in 2009 to 12 in 2010
Employee retention bull Only two-fifths (42) of organisations
experienced no difficulties in retaining staff
during 2010 a similar figure to the previous
year Managers and professionalsspecialists and
technical employees remain the most difficult
categories of staff to retain
bull Most organisations have taken one or more
steps to address staff retention however nearly
one in four organisations (a similar proportion
to the previous year) report that no specific
retention initiatives were undertaken in 2010
bull The most frequently cited actions taken by
employers to address retention ndash improving
the people management skills of line managers
and increased learning and development
opportunities ndash are the methods most
commonly rated most effective Improving the
induction process is also commonly used to
address retention but views on its effectiveness
are more mixed
2011
1 RECRUITING EmPLOyEES
This section explores trends and developments in recruitment strategies and activity within UK organisations during 2010 It examines the adoption of formal resourcing strategies changes in the number of job vacancies organisations attempted to fill the extent and nature of recruitment difficulties over the past year and the strategies employers use to overcome these challenges It also includes developments in graduate recruitment the most effective approaches for attracting applicants and the methods used for selection For the first time we explore the nature of job vacancies the length of the recruitment process the employment of younger workers changing relationships with recruitment partners and efforts to improve the employer brand Finally the costs associated with recruitment are discussed
Resourcing strategies Just over half of respondents surveyed report their
organisation has a formal resourcing strategy
in place a similar proportion to last year (2011
Table 1 Organisations with formal resourcing strategies in place by size ()
Size ndash number of employees in UK 54 2010 56 2009 58) The likelihood of
organisations having a formal strategy in place
increases with organisational size as was the case
last year (Table 1)1 There are no significant sector
differences
Fewer than 10 26
10ndash49 38
50ndash249 46
250ndash999 55
1000ndash4999 68
More than 5000 85
RESO
UR
CIN
G A
ND
TALE
NT P
LAN
NIN
G 2
011
Base 604
7
8
RESOURCING AND TALENT PLANNING
The number and nature of job vacancies There is considerable variation in the number
of vacancies respondentsrsquo organisations tried
to fill in 2010 partly because the number of
vacancies is strongly related to organisation size
(Table 2)2 Overall the median number of vacancies
has fallen from 30 in 2008 to 20 over the past two
years as the recession affected increasing numbers
of organisations (Table 2)
While there is no overall change from last year
in the median number of vacancies organisations
tried to fill there has been a substantial fall in the
proportion of vacancies very large organisations
(5000+ UK employees) attempted to fill from
a median of 550 in 2009 to 200 in 2010 (800 in
2008) The reduction in vacancies in very large
organisations is striking in the private and public
sectors but particularly in the latter where
the median number of vacancies organisations
attempted to fill in 2010 was less than a third than
in 2009 This reflects the sluggish growth in the
private sector and in particular the significant
cuts in public sector budgets
Table 2 Median number of vacancies respondents tried to fill by size of organisation and sector
2011 survey 2010 survey 2009 survey
No of permanent staff employed in UK All Private
sector Public
services All Private sector
Public services All Private
sector Public
services
Median Median Median Median Median Median Median Median Median
1ndash49 3 3 1 3 3 2
50ndash249 12 12 10 12 10 14 10 10 8
250ndash999 45 50 30 46 45 50 60 52 70
1000ndash4999 110 150 55 100 100 100 300 300 300
More than 5000 200 500 150 550 850 500 800 800 550
All organisations 20 20 30 20 20 80 30 20 100 Base 577 (2011) 442 (2010) 683 (2009)
The categories for number of permanent staff employed in the UK differed slightly in the 2009 survey (250 or fewer 251ndash500
501ndash1000 1001ndash5000 5001ndash10000 10001+) 2009 categories have been combined where appropriate and otherwise matched with
the best corresponding category of 20112010
cipd
cou
k2011resou
rcing
and
talentp
lann
ing
survey
2011 Overall nearly three-quarters (73) of permanent
vacancies were filled with external candidates
Larger organisations with a wide range of
talent to choose from are more likely to recruit
internally than smaller organisations3 Public sector
organisations particularly those with more than
1000 UK employees are more likely to recruit
internally than the private sector (Table 3)4
Organisations are divided in their use of temporary
contracts More than a quarter (28) have
employed more people on temporary contracts
in 2010 compared with the previous year while
a similar proportion (27) have employed fewer
people on temporary contracts (45 remain
the same) Manufacturing and production
organisations are most likely to have increased
their use of temporary contracts and the public
services the least perhaps reflecting their reduced
recruitment generally (Figure 1)5
Table 3 Average percentage of job vacancies filled internally
Voluntary No of permanent staff community and not-employed in UK Private sector Public services for-profit All
Mean Mean Mean Mean
1ndash49 15 17 7 13
50ndash249 20 28 23 21
250ndash999 24 29 24 24
1000ndash4999 35 58 12 39
More than 5000 47 62 33 53
All organisations 25 45 19 27 Base 533
figure 1 Use of temporary contracts by sector in 2010 compared with the previous year ()
Manufacturing and production
Private sector services
Public services
Voluntary community and not-for-profit
More Same Less
Base 610
25
27
37
22
3837
50
32
50
23
31
28
RESO
UR
CIN
G A
ND
TALE
NT P
LAN
NIN
G 2
011
9
10
RESOURCING AND TALENT PLANNING
Sector-specific experience is an essential
requirement of candidates in three-fifths (60) of
organisations overall While our figures suggest
it is less commonly required in the public sector
(48 compared with 59 of the voluntary
community and not-for-profit sector and 63
of the private sector)6 there are also substantial
differences within sectors For example specific
sector experience is essential for the majority
of organisations operating in the chemical
construction or mining industries and professional
services but not for those in general manufacturing
or retail and wholesale Similarly within the public
sector it is deemed particularly essential for health
and education organisations but less so for those in
central or local government
Employing younger workers Figures from the Office for National Statistics
show that while total unemployment fell during
the three months to February 2011 youth
unemployment rose to a record level of almost 1
million equating to one in five economically active
16ndash24-year-olds out of work Moreover concerns
have been raised as to whether high youth
unemployment will be further compounded by the
abolition of the Default Retirement Age later this
year and the increase in university tuition fees This
year we included new questions in the survey to
explore these issues
One in six organisations (17) report they are
employing more 16ndash24-year-olds compared with
one year ago this compares with less than one
in eight (12) who are employing fewer young
people (72 are employing the same number) The
employment of younger workers has reduced most
in the public sector where one in four reports a
decrease compared with one in ten who reports an
increase (Table 4)7 This is likely to reflect a general
reduction in recruitment in this sector
Overall one-quarter of organisations expect the
abolition of the Default Retirement Age will mean
they recruit fewer people however the figure
rises to nearly half of public sector organisations
It does not appear however that the abolition of
the Default Retirement Age will have a particular
impact on the recruitment of young people with
only one in ten organisations reporting it will result
in fewer 16ndash24-year-olds being recruited (Table 4)
cipd
cou
k2011resou
rcing
and
talentp
lann
ing
survey
Table 4 The employment of younger workers ()
Voluntary Manufacturing community
All and Private sector and respondents production services Public services not-for-profit
Percentage employing fewer 16ndash24-year-olds than one year ago
Percentage agreeing the abolition of the Default Retirement Age means they will recruit fewer 16ndash24-year-olds
Percentage agreeing the abolition of the Default Retirement Age means they will recruit fewer people
12 10 9 25 10
11 18 6 17 9
23 25 15 48 22
Base 605
2011 Graduate recruitment Two-fifths of organisations (39) are concerned
that the increase in university tuition fees will
have an impact on the number of graduates in
the marketplace Public sector organisations are
particularly concerned (49 compared with 34
of private sector services 42 of not-for-profits
and 43 of manufacturing and production
organisations)8
Perhaps in order to address this deficit or in
response to additional government support to
boost apprenticeship schemes a third of public
sector organisations nearly half of manufacturing
and production and about a quarter of private
sector services and not-for-profit organisations
are considering increasing apprenticeship schemes
(Table 5) About a quarter of organisations overall
are considering increasing their use of internships
although the proportion is markedly lower in the
public sector Overall one in ten organisations are
considering sponsoring students through university
but the proportion doubles in manufacturing and
production where the lack of appropriate skills is
a common cause of recruitment difficulties (Table
5 see also Tables 8 and 9) Larger organisations are
also more likely to consider sponsoring students
through university (19 of those with more than
5000 employees)9
Overall just over a quarter of organisations
operate a structured graduate recruitment
programme (Table 6) The operation of
these programmes is significantly related to
organisation size (Figure 2)10 They also appear
to be most common in the manufacturing
and production sector as last year when a
step increase in their use was noted (Table 6)
It appears that this sector is investing in the
development of skills to address their deficit
in the workforce generally As in previous
years voluntary community and not-for-profit
organisations are least likely to operate a
structured graduate recruitment programme11
Table 5 Activities organisations are considering ()
Voluntary Manufacturing community
All and Private sector and respondents production services Public services not-for-profit
Increasing apprenticeship schemes 30 48 24 33 27
Increasing your use of internships 22 27 23 12 27
Sponsoring students through university 10 20 8 12 1
Base 615
Table 6 Organisations operating a structured graduate recruitment programme by sector ()
2011 2010 2009 2008
All 27 34 22 23
Sector
Manufacturing and production 35 35 23 24
Private sector services 29 37 24 27
Voluntary community and not-for-profit 6 18 5 7
Public services 26 33 23 24
RESO
UR
CIN
G A
ND
TALE
NT P
LAN
NIN
G 2
011
Base 614 (2011) 472 (2010) 752 (2009)
11
cipd
cou
k2011resou
rcing
and
talentp
lann
ing
survey
12
RESOURCING AND TALENT PLANNING
The majority of respondents from organisations
without a recruitment programme for graduates
report that their organisation has never had such
a programme or not had one for some time (97)
Even in the cash-strapped public sector only 3
report they have closed their graduate recruitment
programme in the last 12 months
Nearly a third (31) of organisations who have a
graduate recruitment programme have increased
their intake over the past year while a quarter
have reduced their intake (24) This shows an
improvement on the previous year at the height of
the recession when 43 had reduced their intake
The impact of the budget cuts in the public sector
are however clearly apparent as more than twice
as many organisations in this sector (50 compared
with 20 in the private and not-for-profit sectors)
have reduced their graduate intake
Length of recruitment process One in three (31) organisations report that the
length of their recruitment process has led to the
loss of potential recruits This issue appears to be
exacerbated by organisation size Nearly half of
organisations with more than 5000 employees
report that the length of their recruitment process
has led to the loss of potential recruits compared
with 38 of those in organisations of 250ndash999
employees and just 15 of organisations with
fewer than 50 employees12 There are no significant
sector differences
Recruitment difficulties Three-quarters of organisations with vacancies
report difficulties in filling at least some over the
past few months (75) This is an increase on last
year (2010 68) and may reflect the decrease in
unemployment in the first few months of 2011
It is less however than in previous years perhaps
because organisations were attempting to fill fewer
vacancies (2009 81 2008 86)
figure 2 Organisations operating a structured graduate recruitment programme by size ()
Number of UK employees
39
42
9Fewer than 50
17
1650ndash249
21
29 250ndash999
1000ndash4999 47
61 More than 5000
62
10 40 50 60 70 80
2011
0 3020 Percentage
2010
Base 609 (2011) 466 (2010)
2011 The private sector particularly manufacturing and
production organisations are most likely to have
difficulties filling vacancies (Table 7)13 Table 8
shows that over half of organisations in this sector
have difficulty filling technical vacancies and this
may reflect specific skills shortages in the UK The
most difficult category of staff to recruit in other
sectors is managers and professionalsspecialists
as was the case last year In general there is little
change in the categories of vacancies that are most
difficult to recruit for compared with last year
As would be expected given the cuts to
public sector budgets one in ten public sector
organisations report they did not have any
vacancies to fill twice as many as last year There is
little change in this regard in the other sectors
Table 9 shows the reasons respondents cite for their
recruitment difficulties The findings are similar
to previous years Lack of necessary specialist or
technical skills remains by far the most frequently
cited cause of difficulties reported by nearly
three-quarters of respondents (2011 72 2010
67 2009 73 2008 70) This is particularly
an issue for the manufacturing and production
sector and the public services sector where there
is a particularly high demand for such skills Lack
of formal qualifications is far less of an issue
These findings support arguments for greater
collaboration between industry and academic
institutions and more vocational training in order
to meet organisationsrsquo skill requirements
Higher pay expectations than the organisation
could offer and lack of experience are the next
most frequently cited causes of recruitment
problems (46 and 40 respectively) Interestingly
these are less of an issue in the public sector
perhaps because public sector applicants have
different expectations of pay or because some pay
scales are set at a national level Lack of experience
may be less of an issue than the necessary skills or
qualifications required in many public sector roles
The proportion reporting their recruitment
problems are due to potential candidatesrsquo
reluctance to move in the current economic climate
has decreased from just over a quarter in 2010 to
19 this year Economic growth albeit slow is
likely to be responsible for this reduction but the
lsquohangoverrsquo of the recession is highlighted as one in
five organisations still blame the economic climate
for their recruitment problems Despite high
unemployment 15 of respondents report they
have experienced problems due to no applicants In
line with last yearrsquos findings this is particularly an
issue for the public sector (22) which is also more
likely to report the image of their sectoroccupation
is a problem (22)
Table 7 Organisations experiencing difficulties recruiting for one or more category of vacancy by organisation size ( of those that have had vacancies to fill)
Voluntary Manufacturing community
and Private sector and All 2011 production services Public services not-for-profit
Difficulty filling one or 75 88 77 66 62more vacancies
No difficulties experienced 25 12 23 34 38
Base 561
RESO
UR
CIN
G A
ND
TALE
NT P
LAN
NIN
G 2
011
13
14
RESOURCING AND TALENT PLANNING
Table 8 Categories of vacancy that proved particularly difficult to fill ( of respondents)
Voluntary community
Manufacturing Private and and sector Public not-for-
All 2011 production services services profit All 2010
Other managers and professionalsspecialists
34 41 33 27 34 37
Technical 30 53 29 20 16 28
Senior managers directors
14 13 16 10 16 16
Services (customer personal protective 7 6 8 3 5 5 and sales)
Administrative secretarial
4 3 4 4 4 3
Manualcraft workers 4 11 3 1 0 2
Other 6 5 3 10 11 4
No difficulties experienced
23 12 22 30 38 25
No vacancies to fill 6 3 7 10 1 6 Base 597 (2011) 468 (2010)
Voluntary community
Manufacturing Private and All and sector Public not-for- All
2011 production services services profit 2010
Table 9 Reasons for recruitment difficulties ()
cipd
cou
k2011resou
rcing
and
talentp
lann
ing
survey
Lack of necessary specialist or technical skills 72 82 69 80 59 67
Look for more pay than you could offer 46 47 48 34 52 39
Lack of experience 40 42 43 27 41 36
Reluctance to move in current economic climate 19 24 18 17 15 26
Lack of interpersonal skills 16 9 19 10 20 12
No applicants 15 9 16 22 20 15
Image of sector occupationorganisation 13 7 12 22 11 12
Relocation difficulties 9 19 6 10 7 8
Lack of formal qualifications 7 7 7 5 7 4
The impact of the immigration cap 3 2 4 3 4
Other 4 3 3 8 7 7
Base 427 (2011) 330 (2010)
new item introduced in 2011
2011 Improving the employer brand Nearly three-quarters of organisations have made
efforts to improve their employer brand over the
past year (Table 10) The larger the organisation
the more likely it is to have undertaken one or
more activities to improve its brand Two-fifths of
small organisations with fewer than 50 employees
report they have taken no action to improve their
employer brand compared with one-quarter of
organisations with 250ndash999 employees and one-
sixth of those with more than 5000 employees
There are no significant sector differences
The most popular approaches to improving
employer brand are employee surveys and
developing online careers sites with larger
organisations most likely to have adopted these
methods14 The public sector is most likely to
have introduced or extended flexible working
homeworking15 whereas the private sector is
more likely to have made efforts to improve its
brand through working with charities or corporate
sponsorship16 Voluntary community and not-forshy
profit organisations are most likely to have used
placement students to improve their brand17
Attracting candidates The effectiveness of methods to attract applicants
varies according to sector and organisation size
(Table 11) Overall the most effective method is
through organisationsrsquo own corporate websites
as was the case last year The effectiveness of this
method increases with organisation size probably
due to the increased brand awareness and
perhaps because larger organisations have more
advanced websites18
The private sector particularly manufacturing
and production organisations is three times
more likely than public sector organisations to
report recruitment agencies among their most
effective methods and twice as likely as voluntary
sector organisations (regardless of size) Search
consultants and employee referral schemes are also
notably more popular in the private sector than in
the public or voluntary sectors
In contrast the public and voluntary sectors are
more likely to find the press effective for attracting
applicants including local and national newspaper
advertisements and specialist journalstrade press
Secondments are also deemed to be more effective
in these sectors than in the private sector
Table 10 Work undertaken over last year to improve employer brand ()
Voluntary community
All Private Public and 2011 sector services not-for-profit
Employee surveys 39 39 38 43
Developing online careers site 30 33 23 29
Introducingextending flexible working homeworking 24 20 39 29
Placement students 23 21 19 35
Graduate careers fairs 15 17 11 8
Working with charities 14 16 8 6
Corporate sponsorship 11 13 2 8
Introducing sabbaticals 3 4 1 5
Other 7 6 6 10
No action taken to improve employer brand 27 28 29 22
RESO
UR
CIN
G A
ND
TALE
NT P
LAN
NIN
G 2
011
Base 601
15
16
RESOURCING AND TALENT PLANNING
Table 11 Most effective methods for attracting applications by industry sector ()
Sector 2011 Number of UK employees 2011
All
2010
All
2011
Man
ufa
ctu
rin
gan
d p
rod
uct
ion
Priv
ate
sect
or
serv
ices
Pub
lic s
ervi
ces
Vo
lun
tary
co
mm
un
ity
and
no
t-fo
r-p
rofi
t
1ndash49
50ndash2
49
250ndash
999
100
0ndash4
999
Mo
re t
han
500
0
Own corporate website 63 59 44 57 77 66 42 55 57 77 79
Recruitment agencies 60 54 77 62 22 30 39 59 66 51 41
Local newspaper advertisements 36 32 38 23 41 51 28 35 35 29 29
Employee referral scheme 35 29 33 38 5 14 20 33 27 32 29
Commercial job boards 33 27 33 29 14 29 21 27 25 42 26
Specialist journalstrade press 31 27 24 23 30 43 26 23 32 32 24
Encourage speculative applicationsword of mouth 24 25 30 29 9 23 27 31 23 19 19
Jobcentre Plus 23 25 24 24 22 34 16 29 21 25 32
Professional networking (such as LinkedIn) 14 16 11 23 5 9 28 13 13 18 17
Search consultants 22 15 24 17 5 4 14 11 17 18 15
Links with schoolscollegesuniversities 18 13 16 13 9 17 12 13 11 18 15
Apprenticeships 12 11 19 9 13 9 10 10 11 12 17
National newspaper advertisements 16 11 4 6 23 29 10 9 15 10 15
Secondments 11 11 7 8 21 12 2 9 13 11 19
Links with other local organisations making redundancies 7 13 5 7 9 6 5 9 11 8
Alumni (previous employees) 5 5 6 7 2 1 7 2 6 11 3
Social networking sites (such as Facebook) 3 4 4 5 3 4 3 2 2 8 12
Local Employment Partnership (LEP) 6 3 1 4 2 5 1 2 3 4 9
Other 5 5 2 3 12 6 8 3 4 4 5
cipd
cou
k2011resou
rcing
and
talentp
lann
ing
survey
Base 604 (2011) 464 (2010)
new item introduced in 2011
Despite the popularity of social networking
sites such as Facebook they are not seen to be
particularly effective for attracting candidates
Professional networking sites such as LinkedIn are
more popular particularly in the private services
sector although there has only been a small
percentage increase in their reported effectiveness
compared with last year
2011 Recruitment partners A new question this year asked respondents if their
attitude to and relationships with recruitment
partners has changed over the past 12 months Just
over a third report things have not changed
(Table 12) A similar proportion report they have
reduced their use of recruitment partners and 6
that they have stopped using them altogether
with one in ten considering them an unaffordable
expense (one in five in the not-for-profit sector)
and a similar proportion an unnecessary expense
In contrast one in five (predominantly private
sector organisations) report they have formed
a closer business partnership with recruitment
partners over the past year and one in ten (again
predominantly private sector organisations) report
they consider them integral to attracting top talent
Selecting candidates There has been little change in the methods used
to select candidates over the past few years with
the exception of a drop in the use of general
ability tests compared with 2009 (Table 13)
Interviews remain the most common selection
method with competency-based interviews
being most popular overall Interviews following
the contents of CVsapplication forms are also
particularly popular in the private sector (70
compared with 41 in the public sector and 57
in the not-for-profit sector) whereas the public
and not-for-profit sectors favour structured (panel)
interviews (82 and 79 respectively compared
with 45 in the private sector)
Tests for specific job-related skills are more popular
in the public and not-for-profit sectors (61 and
62 respectively compared with 43 in the private
sector) whereas telephone interviews are more
popular in the private sector (52 compared with
12 in the public sector and 26 in the not-forshy
profit sector)
Table 12 Changes in attitudes to and relationships with recruitment partners over the past 12 months ()
Voluntary community
All Private Public and 2011 sector services not-for-profit
Not changed 36 34 40 39
Reduced use of recruitment partners 32 34 32 26
Formed a closer business partnership with them 19 23 8 12
Consider them an unnecessary expense 12 11 13 16
Consider them an unaffordable expense 11 10 11 22
Consider them integral to attracting top talent 9 11 2 4
Stopped using recruitment partners 6 5 8 5
Other 3 3 3 3 Base 604
RESO
UR
CIN
G A
ND
TALE
NT P
LAN
NIN
G 2
011
17
18
RESOURCING AND TALENT PLANNING
Table 13 Methods used to select applicants ()
2011 2010 2009 survey survey survey
Competency-based interviews 70 78 69
Interviews following contents of CVapplication form 63 64 68
Structured interviews (panel) 56 61 59
Tests for specific job-related skills 49 48 50
Telephone interviews 43 47 38
Literacy andor numeracy tests 38 43 39
Personalityaptitudepsychometric questionnaires 35 44 35
Assessment centres 35 42 35
Pre-application eliminationprogression question(s) 25 32 NA
General ability tests 23 27 44
Group exercises (for example role-playing) 21 30 26
Pre-interview references (academic or employment) 9 16 19
Video CVs 0 1 NA
Other 3 4 6
cipd
cou
k2011resou
rcing
and
talentp
lann
ing
survey
Base 605 (2011) 473 (2010) 754 (2009)
Strengths-based recruitment Two-fifths of organisations (40) report they use a
strengths-based approach to recruitment although
it is less commonly used in the public sector (26)19
In all sectors smaller organisations are most likely
to report they use a strengths-based approach
(60 of organisations with 1ndash49 employees use it
compared with 34 of organisations with 250ndash999
employees and 24 of organisations with more
than 5000 employees)20
Most of those who use a strengths-based approach
to recruitment are neutral about how easy it is to
administer in practice regardless of sector or size
Nearly a third (32) find it easy or very easy and
only one in ten (11) find it difficult
Over three-quarters of those who use a strengths-
based approach to recruitment believe it
brings benefits in terms of increased individual
performance (78) Two-thirds believe it improves
retention (67) and increases engagement (63)
Two-fifths (39) report it results in greater diversity
of skills in the workplace
Many organisations that use a strengths-based
approach to recruitment also use a strengths-based
approach for other people processes More than
half use it for performance management processes
(59) succession planning (55) and learning and
development (53) Two-fifths use it for talent
management (42) and a third use it for workforce
planning (32) Just under three in ten (29) also
use it for redeployment
Recruitment costs Last year we noted an increase in the proportion
of organisations that calculate their recruitment
costs (2010 65 2009 53 2008 51) This year
the proportion is back in line with previous years
(52) The increase last year may have been due
to sampling differences or a consequence of an
increased focus on costs during the recession that
has not continued
Four-fifths (79) of organisations that calculate
recruitment costs provided cost estimates per
hire There is considerable variance in the amount
organisations spend (at least partly due to our
2011 findings that organisations include different costs
in their calculations see Table 14) In general
the median figures (Table 15) are lower than last
year for both senior managerdirectors and other
employees
In order to explore the validity of estimates this
year we also asked respondents to indicate how
accurate their cost estimates were Half (51) of
estimates for costs of recruiting senior managers
directors were accurate to plus or minus 10 and
83 to plus or minus 20 Two-fifths of estimates
for other employees were accurate to plus or minus
10 and 74 to plus or minus 20 Table 16
shows the median figures for estimates that were
believed to be accurate to up to plus or minus 20
The figures indicate as we found last year that
organisations spend considerably more on senior
appointments than on other employees This
reflects the value attached to good leadership and
perhaps the additional challenges of attracting
the best candidates for senior positions This is
particularly the case in the private sector where
considerably more is spent on the recruitment of
senior managersdirectors than in the public or not-
for-profit sectors
Table 14 Criteria included in cost per hire calculations ()
Size ndash number of employees in UK
Advertising costs
Agencysearch costs
Employee referrals
Travel expenses
Relocation expenses
Fixed costs of resourcing team
Opportunity costs of hiring managers time
Other
Dont know Base 299
81
75
35
30
17
24
24
3
4
Table 15 Estimated total costs (advertising costs agency or search fees) per hire (pound)
Median 2011 Median 2010 (no of (no of
Occupational group respondents) Minimum Maximum respondents)
Senior managersdirectors 7000 (219) 251 55000 8333 (234)
Other employees 2000 (246) 150 32000 2930 (262) Number of respondents shown in brackets
Table 16 Median total costs (advertising costs agency or search fees) per hire for estimates accurate to plus or minus 20 (pound)
Voluntary
Median 2011 Manufacturing
and Private Public
community and not-for-
Occupational group production sector services profit
RESO
UR
CIN
G A
ND
TALE
NT P
LAN
NIN
G 2
011
Senior managersdirectors 7500 8000 9000 5000 3500
Other employees 2500 3400 2000 3000 1500 Base 150
19
cipd
cou
k2011resou
rcing
and
talentp
lann
ing
survey
20
RESOURCING AND TALENT PLANNING
2 RESOURCING AND TALENT mANAGEmENT IN TURBULENT TImES
In January 2010 the UK officially emerged from the recession however the economic environment remains uncertain for many organisations The environmental disasters in Japan the uprisings and wars in the Middle East rising oil prices and European debt highlight the volatility of global markets In the UK economic growth remains sluggish and there are concerns regarding the impact of the VAT increases high inflation and the austerity measures of the Coalition Government This section examines the impact of the economic environment on resourcing budgets strategies and activities in 2010 It looks at changes in views on the employment market and the implications for managing talent
The impact of the economic climate on resourcing Overall half of organisations report that the
economic climate has had a negative impact on
their organisationsrsquo resourcing budgets for 2011ndash12
(Table 17) This year however it is the public
sector that is most severely hit with four-fifths
(82) reporting their resourcing budgets will be
reduced (up from 59 last year) In contrast fewer
private and not-for-profit sector organisations
face reductions this year compared with last
although more are still reducing their budgets than
increasing them
Changes in resourcing and talent practices in
2011 compared with 2010 reflect a stronger
focus on costs and reductions in budgets (Figure
3) Two-thirds plan to develop more talent inshy
house (compared with one-third in 2010) and
more organisations plan to reduce reliance on
recruitment agencies and external consultants for
resourcing and development The proportion of
organisations planning to focus more on retaining
rather than recruiting talent has increased to 51
in 2011 from 28 in 2010
2011 Changes in recruitment practices are also
anticipated More organisations plan to make use
of new mediatechnology to recruit which may
be a cost-cutting strategy but can also improve
the efficiency and effectiveness of the recruitment
process On a positive note more organisations plan
to invest more time and effort in the quality of
candidates they hire and will be taking actions to
improve ways of identifying quality candidates
Public sector organisations are more than twice
as likely to be implementing a recruitment freeze
in 2011 (46 compared with 22 overall)
Nevertheless this is an improvement on 2010 when
58 of public sector organisations implemented a
recruitment freeze The situation is also somewhat
brighter for many private sector organisations
with 15 reporting they will be implementing a
recruitment freeze in 2011 compared with 26
in 2010 Nevertheless the economic recovery
remains slow for many with 29 of private
sector organisations and 66 of public sector
organisations reporting they will be reducing the
number of new recruits they hire in 2011 similar
proportions to 2010 Inevitably more public than
private sector organisations report they will be
reducing their headcount in 2011 and losing key
talent (33 compared with 9 in the private
sector) and redeploying people into new roles (66
compared with 37 in the private sector)
Table 17 Impact of the current economic climate on organisationsrsquo resourcing budgets ()
Private Public Voluntary community All sector services and not-for-profit
2011 2010 2011 2010 2011 2010 2011 2010
Reduced 49 53 41 51 82 59 51 61
Stayed about the same 36 37 39 40 14 36 40 34
Increased 8 7 11 4 1 5 4 5
Dont know 7 3 8 5 3 5 Base 615 (2011) 475 (2010)
RESO
UR
CIN
G A
ND
TALE
NT P
LAN
NIN
G 2
011
21
cipd
cou
k2011resou
rcing
and
talentp
lann
ing
survey
22
RESOURCING AND TALENT PLANNING
figure 3 Resourcing and talent practices implemented in 2011 and 2010 ( of respondents)
Developing more talent in-house
Continuing to recruit key talentniche areas
Focusing more on retaining rather than recruiting talent
Reducing reliance on recruitment agencies
Use of new mediatechnology to recruit
Investing more time and effort in the quality of candidates we hire
Redeploying people into new roles
Reducing the number of new recruits we hire
Taking actions to improve ways of identifying quality candidates
Increasing the number of interimcontract staff recruited
Reducing our use of external consultants for resourcing and development
Increased recruitment of apprenticesinterns
Implementing a recruitment freeze
Reducing our headcount but preserving key talent
Recruiting talent discarded by competitors
Reducing our headcount and losing key talent
Offering sabbaticals career breaks additional holidays
Reducing employees working hours to avoid making people redundant
8Reducing graduate recruitment 8
6Suspending graduate recruitment 7
36
28
36
28
26
30
35 35
35 15
29 23
28 19
24 12
22 30
22 16
18 11
13 12 12
10
12 10
66
59 46
51
47
46
45
44
0 10 20 30 40 50 60 70 80 Percentage of respondents
2011 2010
Base 582
RESO
UR
CIN
G A
ND
TALE
NT P
LAN
NIN
G 2
011
23
2011 Views on the employment market In little change to last year three-quarters of
organisations report they have noticed an increase
in the number of unsuitable applicants as they have
fewer roles to fill (Figure 4) Far fewer (34) report
that there are too many suitable candidates to
choose from and despite high unemployment over
the past two years more than half (52) believe that
competition for talent is even greater as the pool of
available talent to hire has fallen sharply (2010 41
2009 20) For many organisations there appears a
clear mismatch between the skills they require and
those available in the labour market
Competition for talent appears to be particularly
keen in the private sector Two-thirds (64) of
manufacturing and production organisations
and 55 of private services organisations agree
that competition for talent is even greater now
compared with 39 of the public sector and 34
of not-for-profits21 In contrast the public sector
and not-for-profits are more likely to agree they
have too many suitable candidates to choose
from (61 and 47 respectively compared with
23 of manufacturing and production and 27
of private sector services)22
Three-fifths (62) of respondents agree that the
demand for temporary and contract workers will
increase as employers will be reluctant to take
on permanent staff during uncertain times while
44 agree that part-time workers will become
more appealing to employers who are looking to
cut costs
figure 4 Views on the employment market ( agreeing or strongly agreeing)
With fewer roles to fill we have noticed an increase in the number
of unsuitable applicants
The demand for temporary and contract workers will increase as employers will be reluctant to
take on permanent staff during uncertain times
Employers will use the economic downturn as an opportunity to get rid of poor performers
and bring about culture change
Competition for talent is even greater now as the pool of available talent to hire has
fallen sharply
Part-time workers will become more appealing to employers who are looking to cut costs
Employers are acting too hastily in making people redundant and as a result they will lose too
many employees with valuable knowledge and skills
With fewer roles to fill there are now too many suitable candidates to choose between
The abolition of the Default Retirement Age will mean we recruit fewer people
Employers will look to make older workers over the age of 65 redundant before their younger workers
73 76
54
62 66 66
55 63
72
52 41
20
44 45
52
44 48
53
34 32
23
19 22
27
0 10 20 30 40 50 60 70 80 Percentage of respondents
2011 2010 2009
Base 607 (2011) 475 (2010) 746 (2009)
item added 20102011
24
RESOURCING AND TALENT PLANNING
More than half of respondents (55) across
all sectors believe that employers will use the
economic downturn as an opportunity to get rid of
poor performers and bring about culture change
While high this shows a downward trend on the
past two years (2010 63 2009 72 agree or
strongly agree) perhaps reflecting a slowing in
the number of redundancies Similarly there is
a gradual downward trend in the proportion of
respondents who express concern that employers
are acting too hastily in making people redundant
and as a result they will lose too many employees
with valuable knowledge and skills or that
employers will look to make older workers over the
age of 65 redundant before their younger workers
Nearly a quarter (23) of respondents believe
that the abolition of the Default Retirement Age
will mean they recruit fewer people (48 in the
public sector)23
Implications for talent management The value of effective talent management has
not been lost in the recent attention on reducing
costs Two-fifths (41) of organisations report
that the current economic situation has led
to an increased focus on talent management
(43 in 2010) and only 4 that it has led to a
decreased focus (7 in 2010) with no significant
differences across sectors Unsurprisingly however
the public sector are about twice as likely this
year to report they have reduced their overall
talent management spend due to the downturn
compared with other sectors (Table 18)24
The proportion of organisations that report
the economic downturn has had an impact on
approaches to reward across the business has
slightly reduced compared with last year (54
compared with 61 in 2010) As last year it
appears that organisations across all sectors
are being more selective in who they reward A
smaller proportion of organisations report their
approach to reward for individuals identified as
talent has been affected by the downturn (42)
than report their approach to reward across the
business has been affected (54)
Table 18 Has your overall talent management spend been reduced due to the economic downturn ()
cipd
cou
k2011resou
rcing
and
talentp
lann
ing
survey
Voluntary All community and All
2011 Private sector Public sector not-for-profit 2010
Yes 18 17 32 13 23
No 38 43 16 32 41
NA (no talent management spend) 44 40 52 55 36
Base 617 (2011) 471 (2010)
RESO
UR
CIN
G A
ND
TALE
NT P
LAN
NIN
G 2
011
25
2011
Case study Innovative recruitment and cost saving in the Association of Greater Manchester Authorities
The Association of Greater Manchester Authorities (AGMA) represents the ten local authorities in
Greater Manchester and works in partnership with a wider group of associate councils and public
sector organisations AGMA chief executives and council leaders work together on a range of key
strategic and policy issues which impact on Greater Manchester including resourcing strategies
and recruitment and retention issues
The AGMA initiative in cost reduction in the area of resourcing has been described as lsquoa truly
pioneering example of collaboration between a number of local authoritiesrsquo and is already
delivering against a range of objectives
The initial aim was to make a significant saving on the pound5ndash6 million annual cost of external
media advertising reported in 2008ndash09 and to create a more efficient and effective recruitment
system A shared portal was commissioned to offer a front-end website (wwwyourcounciljobs
couk) with a lsquoback-officersquo e-recruitment system which would give a standardised shared-service
approach for job applicants across councils Some of the benefits for applicants include the ability
to go to one place to register their interest to be able to look in specific categories for jobs
of particular relevance to them to be able to amend an existing application form in order to
apply for a further post and to receive email alerts when new jobs relevant to their interests are
posted In addition communications to job-seekers are now standardised for every council
This approach has seen real benefits across each of the local authorities workflows are now
standardised as every HR team runs identical systems and there is consistency in reporting within
all councils enabling them to benchmark their processes more clearly The councils use this
benchmarking data to make additional improvements and efficiencies
Jayne Whitehead AGMA Category Procurement Manager has project-managed the initiative
with managers represented from each participating authority and describes the process as one
of lsquotrue collaborationrsquo with lsquo100 commitmentrsquo from all the councils involved The benefits
are clear annual media costs are dramatically reduced to approximately pound250000 across ten
partner organisations and there has been a reduction in time-to-hire of 13 days This has had
the knock-on effect of reducing expenditure on agency staff The average cost of a recruitment
advertisement per role was previously pound97400 it is now pound15200 There have also been benefits
outside the original intention including doubling the number of online applications for council
posts with administrative cost savings in HR of approximately pound250000 across the consortium
More than 61000 registered users are now on the system and the councils are successfully filling
their own talent pools of prospective job-seekers Overall the project team is now celebrating a
pound17 million reduction in recruitment expenditure over the past 12 months
(continued)
cipd
cou
k2011resou
rcing
and
talentp
lann
ing
survey
26
RESOURCING AND TALENT PLANNING
There were some challenges in the implementation of this new way of working All the councils
had to be convinced about the benefits of the changes With the implementation of a new IT
system having its own set of challenges the project has taken 12 months to introduce longer
than first anticipated Implementing the changes during a period of radical restructuring in all
councils also proved particularly challenging However Jayne describes how both the need to
make efficiencies and feedback from job-seekers meant that lsquowe had to find a different way of
doing thingsrsquo Jayne also recognises how the neutrality of her own role (each council pays a tenth
of her salary) has been essential in ensuring that the project has been fair to all its participants
offering a centralised shared resource to manage the project
The project is now set to develop yet further with the aim of becoming entirely self-funding
within the next year by accepting advertising from other organisations Two new websites are
planned for recruitment into schools and social care jobs bringing even less reliance on media
and agencies AGMA will also be further building its own talent pool
Jayne describes the initiative as lsquoa true example of what you can do if you collaborate across
authoritiesrsquo Not only the separate councils but also diverse teams and functions including HR IT
procurement communications and marketing have worked together to deliver this innovative
and inspiring project
Information provided by Jayne Whitehead AGMA Category Procurement Manager
2011
3 DIVERSITy
This section examines organisationsrsquo approaches to diversity including the use of formal diversity strategies and the methods used to address diversity issues
Just over half of organisations report they have with just under two-thirds of not-for-profit
a formal diversity strategy showing little change organisations and just two-fifths of private sector
over the past four years (2011 52 2010 55 companies (Table 19)25 Diversity strategies are also
2009 60 2008 55) Consistent with previous more common in larger organisations (regardless
yearsrsquo findings most public sector organisations of sector)26
(90) have a formal diversity strategy compared
Table 19 Does your organisation have a formal diversity strategy ()
Yes No Dont know
All 52 41 7
Sector
Private sector 41 50 8
Public services 90 9 1
Voluntary community and not-for-profit 63 33 4
Number of UK employees
Fewer than 50 45 50 5
50ndash249 43 51 6
250ndash999 48 44 7
1000ndash4999 65 31 4
More than 5000 80 9 11 Base 613
RESO
UR
CIN
G A
ND
TALE
NT P
LAN
NIN
G 2
011
27
28
RESOURCING AND TALENT PLANNING
As was the case last year over three-quarters
of organisations with a formal diversity policy
attempt to address diversity issues through
monitoring recruitment andor staffing
information to obtain data on gender ethnicity
disability age and so on (Table 20) Less than
three-fifths train interviewers to understand what
diversity is about and the impact of stereotypes
Other diversity-focused initiatives are even
less common moreover the figures indicate a
reduction in the use of several methods compared
with previous years The pressures of the recession
may have led to a reduced focus on diversity
Given the links between diversity in the workforce
and productivity organisations that fail to give
this issue the attention it requires may find
themselves at a disadvantage in the future
Traditionally the public sector has tended to lead
the way in terms of diversity practices Again this
year they are significantly more likely to address
diversity issues through monitoring recruitment
andor staffing information through providing
recruitment documents in other formats through
advertising vacancies in different sources to
attract under-represented groups and through
setting recruitment targets to correct a workforce
imbalance Nevertheless they are less likely than
other sectors to actively try to attract talent of all
ages (Table 20) Moreover our figures indicate that
the reduction in the use of several diversity methods
compared with previous years is particularly
pronounced in the public sector The change of
government and budget reduction measures have
led to significant change programmes in many
public sector organisations which may have resulted
in a reduced focus on diversity issues
Table 20 Methods used to address diversity issues in organisations ( with formal diversity strategy)
Voluntary community
Private Public and not-sector services for-profit
2011 2010 2009 2008 2011 2011 2011 survey survey survey survey (2010) (2010) (2010)
Monitoring recruitment andor staffing information to obtain data on gender 78 79 84 83 70 (71) 88 (96) 88 (76) ethnicity disability age any other categories
cipd
cou
k2011resou
rcing
and
talentp
lann
ing
survey
Training interviewers to understand what diversity is about and the impact of stereotypes
57 68 68 60 53 (66) 64 (73) 57 (72)
Actively trying to attract talent of all ages 45 53 32 43
Operating policies that go beyond basic legislative requirements on age gender race disability sexual orientation religion and belief
39 49 52 48 34 (44) 47 (63) 47 (40)
Providing recruitment documents in other 39 41 37 31 24 (22) 64 (77) 47 (52)formats (online large-print audio and so on)
Checking that any tests used are valid reliable and culture-free and were tested on diverse norm groups
36 42 47 34 39 (44) 35 (45) 27 (16)
Advertising vacancies in different sources to 31 37 51 48 22 (30) 44 (53) 41 (32)attract under-represented groups
Using specific imageswords in your recruitment advertising to appeal to a wider audience 29 38 42 42 25 (30) 36 (52) 33 (40)
Making attempts to employ the long-term 19 19 13 29unemployed
Setting recruitment targets to correct a workforce imbalance 9 15 14 12 4 (8) 18 (31) 8 (16)
Base 312 (2011) 253 (2010) 419 (2009) new item added in 2011
RESO
UR
CIN
G A
ND
TALE
NT P
LAN
NIN
G 2
011
29
2011
4 mANAGING LABOUR TURNOVER
Figures from the Office for National Statistics show that UK unemployment rose by 27000 in the three months to the end of January 2011 to 253 million the highest since 1994 When unemployment is high the number of employees leaving organisations voluntarily is expected to decrease Here we examine whether this is happening and how organisations are tackling the issue of employee retention
Among organisations that are able to supply
turnover data the median labour turnover rate
has decreased over the past few years (Table 21)
The median figure however hides differences
across organisations Slightly more organisations
report their turnover has increased in 2010
compared with 2009 (38) than has decreased
(33) while for nearly a third (29) it remained
the same Smaller organisations are more likely
to report their labour turnover has increased and
larger organisations that it has decreased27
As in previous years the majority of turnover (53)
is still attributed to employees leaving voluntarily
(Table 22) As the economy has improved the
median proportion of turnover due to redundancies
has reduced Only 12 of organisations that
provided reasons for leaving made more than ten
redundancies in the previous year compared with
33 in 2010 26 in 2009 and 22 in 2008 A third
(34) of organisations that made redundancies
offered career transition services
While median turnover rates have reduced
across all sectors Table 23 shows that the rate
of voluntary leavers has increased slightly in
the private sector compared with last year but
decreased in the voluntary and public services
sector This reflects improvements in the economic
outlook for the private sector and the widespread
cuts in the public sector which also have a direct
impact on many not-for-profit organisations that
provide services for the public sector
Cost of labour turnover While just over half of organisations calculate
their recruitment costs only 13 calculate the
cost of their labour turnover (2010 14) The
majority of organisations report they do not
calculate these costs (79) while 7 donrsquot know
if they are calculated or not
Nearly half (46) of those who calculate their
turnover costs want to maintain their current
turnover rate while one-fifth (38) want to
reduce turnover during 2011 and 15 want to
increase it
Retaining employees The steps organisations take to retain employees
in their workforce can have a significant impact
on organisational efficiency and success through
30
RESOURCING AND TALENT PLANNING
Table 21 Median rate of labour turnover ()
2011 2010 survey 2009 survey 2008 survey 2007 survey 2006 survey
125 135 157 173 181 183
Base 175 (2011)
Table 22 Median labour turnover rates by reason for leaving ()
2011 survey 2010 survey 2009 survey
Voluntary redundancies 0 0 0
Compulsory redundancies 0 10 05
Dismissedleft involuntarily (including death in service)
07 09 14
Fixed-short-term contracts 0 0 07
Retired 0 04 07
Left voluntarily 66 84 90
Base 154 (2011)
Table 23 Median labour turnover rates by industry sector ()
cipd
cou
k2011resou
rcing
and
talentp
lann
ing
survey
Sector All leavers Voluntary leavers
2011 survey
2010 survey
2009 survey
2011 survey
2010 survey
2009 survey
Manufacturing and production 93 (38) 124 (44) 153 (80) 37 (35) 27 (42) 77 (75)
Private sector services 138 (96) 146 (77) 168 (150) 87 (82) 74 (71) 104 (129)
Public services 85 (28) 86 (19) 126 (52) 34 (10) 58 (15) 76 (45)
Voluntary community not-for-profit 131 (11) 159 (15) 164 (38) 70 (24) 102 (18) 110 (35) Number of respondents shown in brackets
decreasing employee turnover loss of talent and
recruitment and training costs while having a
positive impact on motivation job satisfaction and
the employer brand
Only two-fifths (42) of organisations
experienced no difficulties in retaining staff
during 2010 This figure is similar to last year
(45) but higher than the findings for 2008
when 31 reported they had no retention
difficulties These findings reflect the increased
caution of employees regarding leaving their
jobs during times of economic uncertainty and
high unemployment Supporting this are our
findings that the public (49) and not-for-profit
sectors (49) are more likely to report they had
no difficulties in retaining staff during 2010
compared with the private sector (38)
As in previous years organisations most
commonly have difficulty retaining managers
and professionalsspecialists (Table 24) The
manufacturing and production sector are most
likely to report difficulties retaining technical
2011 staff and the private services sector that they have
most difficulty retaining services staff This may
reflect the higher demand for these categories of
employees in these sectors
While most organisations have taken one or more
steps to address staff retention nearly one in four
organisations (23) report that no specific retention
initiatives were undertaken This is a similar
proportion to last year although substantially higher
than in previous years when retention difficulties
were more common due to a tighter labour market
(Table 25) Public sector organisations are twice
as likely not to have taken any steps to address
retention as those in the private or not for-profit
sectors (39 compared with 20 of private sector
and 16 of not-for-profits)28
The most common methods used to address
retention in 2010 used by nearly two-fifths of
organisations are to improve line managersrsquo
people skills improve learning and development
opportunities and improve the induction process
Improving line managersrsquo people skills and
learning and development opportunities are also
most commonly rated among the top three most
effective retention methods The effectiveness of
improving induction processes is more varied with
22 rating it among the top three most effective
methods and 12 among the top three least
effective methods Views are also mixed regarding
the effectiveness of improved pay It is likely that
employees are motivated by different factors
Employers need to provide a healthy working
environment where employees are treated with
respect and make efforts to match their retention
initiatives with what staff want
Table 24 Retention difficulties by occupational category ()
Voluntary community
Private and All Manufacturing sector Public not-for- All
2011 and production services services profit 2010
Managers and professionals specialists 28 26 29 25 29 27
Technical 21 37 19 17 13 20
Services (customer personal protective and sales) 13 7 21 4 4 12
Administrative secretarial 9 5 8 15 13 7
Senior managersdirectors 7 5 8 10 6 9
Manualcraft workers 6 11 6 3 4 4 Base 601 (2011) 451 (2010)
RESO
UR
CIN
G A
ND
TALE
NT P
LAN
NIN
G 2
011
31
32
RESOURCING AND TALENT PLANNING
Table 25 Steps taken specifically to address staff retention ()
Used in Least Most Used in Used in Used in 2010 effective effective 2009 2008 2007
Improved line managers people skills 39 7 31 42 39 37
Increased learning and development opportunities 38 5 34 35 47 46
Improved induction process 38 12 22 31 45 45
Improved employee involvement 34 8 24 32 35 29
Improved selection techniques 30 7 25 31 42 46
Improved pay 27 11 23 22 42 53
Offered coachingmentoring buddy systems 24 8 14 20 24 22
Improved benefits 21 8 14 19 32 36
Better promotion to employees of the employer brand 18 10 5 15 21 16
Created clearer career paths 18 6 2 21 18 17
Revised the way staff are rewarded so their efforts are 18 4 13 14 19 19 better recognised
Made changes to improve workndash life balance 17 5 13 19 31 30
Improved physical working conditions 15 8 7 13 19 12
Redesigned jobs to make them more satisfying 11 4 8 13 18 14
Increased our use of countershyoffers 4 4 14
No specific initiatives undertaken 23 3 1 27 13 9 Base 559 (2011 survey) 431 (2010 survey) 695 (2009 survey) 710 (2008 survey)
new item added in 2011
cipd
cou
k2011resou
rcing
and
talentp
lann
ing
survey
RESO
UR
CIN
G A
ND
TALE
NT P
LAN
NIN
G 2
011
33
2011
CONCLUSIONS
Looking forward In January 2010 the UK officially emerged from
the longest recession since the 1930s Economic
growth however remains sluggish and the public
sector has embarked on a four-year programme of
the biggest government spending cuts in decades
to address the fiscal deficit
In the labour market unemployment remained
high throughout 2010 Figures from the Office
for National Statistics (ONS) show that UK
unemployment rose by 27000 in the three months
to the end of January 2011 to 253 million the
highest since 1994 While recent months have seen
signs of improvement there are concerns that the
slow growth in the private sector will be unable
to fully compensate for the increasing job losses in
the public sector that will result from the budget
cuts This is supported by the findings from the
CIPDrsquos spring 2011 Labour Market Outlook which
shows the impact on the overall labour market of a
slight rise in private sector recruitment is still being
cancelled out by large-scale public sector job losses
The findings of the CIPDrsquos 2011 Resourcing and
Talent Planning survey reflect the challenges
of the economic environment Organisations
generally have increased their focus on costs On
average organisations spent less on filling each
vacancy and a fifth have reduced their resourcing
budgets and talent management spend In the
public sector the focus on costs and budget
reductions was particularly apparent
The end of the recession has meant fewer
redundancies in 2010 Nevertheless over a third
of public sector and one-fifth of private sector
organisations reduced their headcount The
number of vacancies on offer by organisations
remained as low as in 2009 overall and continued
to decrease in very large organisations particularly
in the public sector
Looking forward private sector growth is expected
to remain slow and the full impact of public
sector budget cuts is still to come Resourcing and
talent management budgets will be further hit
in 2011ndash12 and many public sector organisations
will implement recruitment freezes and reduce
graduate intake and recruitment generally
Resourcing and talent practices are changing to
reflect the stronger focus on costs and reductions
in budgets Particularly in the public sector but
also in the private sector trends indicate a greater
focus on developing talent in-house retaining
rather than recruiting talent and reducing reliance
on recruitment agencies and external consultants
for resourcing and development
Our findings do not present a positive outlook
for the vast number of unemployed A substantial
proportion of organisations reports that the
already low number of vacancies available to them
is likely to be further affected by the abolition
of the Default Retirement Age Yet despite the
high unemployment rate most organisations
reported difficulties in filling vacancies mostly due
to skill shortages We have also seen an increase
in the proportion of organisations reporting
that competition for talent is even greater as the
pool of available talent to hire has fallen sharply
For many organisations there appears a clear
mismatch between the skills they require and
those available in the labour market Some are
concerned this will be exacerbated by the increase
in university tuition fees Some are responding
cipd
cou
k2011resou
rcing
and
talentp
lann
ing
survey
34
RESOURCING AND TALENT PLANNING
by increasing apprenticeship schemes internships
and sponsoring students through university Such
schemes may be aided by the Governmentrsquos recently
announced pound60 million commitment to help boost
youth employment and provide extra support for
apprenticeships and changes to vocational training
and education How far this will go towards meeting
organisationsrsquo skill requirements remains to be seen
On a positive note our findings indicate that talent
management is viewed as more not less important
in difficult times although with reduced budgets
organisations will have to be innovative with
their approach and strategies In order to survive
organisations will need to make certain they focus
beyond the cost-cutting required in the current
environment to ensuring their talent strategies are
aligned to long-term business success
The CIPDrsquos Shaping the Future and Next Generation
HR flagship projects have both explored the
important issues of sustainability Shaping the Future
in particular warns against the dangers of lsquotalent
tunnel visionrsquo taking a short-sighted view on talent
strategies which are solely focused on the needs of
the here and now
Often organisations pay too little attention to
identifying and developing the capabilities that
individuals will need in the long term This implies a
leadershiptalent management capability gap with
too much focus on the operational needs of today
rather than the organisational imperatives
of tomorrow
Itrsquos never too late to start equipping your people
with the skills and knowledge they need to meet
both present and future challenges So what practical
recommendations can we make for resourcing and
talent professionals drawn from our Shaping the
Future evidence
Audit your organisationrsquos current skills and future capabilities If you havenrsquot done so already conduct a thorough
inventory of your organisationrsquos current skills and map
those against the capabilities you are likely to need
in the future Hold forecasting sessions which look at
macro and micro trends how these will impact your
way of working and the changes that will be required
for future success
Build your talent and succession pipeline You also need to be proactively building up your
talent pipelines (horizontally and vertically) so that
you are developing people with future-fit skills and
capabilities A silver lining from the current economic
climate is that more organisations are focusing on
developing internal talent and fully utilising the
skills of their existing workforce Fresh talent is
still important but recruitment strategies should
complement internal pipelines
Maintain a continuous focus on capability-building Capability-building should be part of a continuous
process embedded into policies and practices Across
our case study organisations managers talked about the
need to embed development and skills training as part
of business as usual rather than as a one-off activity
Develop a creative approach to skills and capability development Even when budgets are tight it is essential that
staff get the development they need to ensure they
have the capabilities for their current job role as well
as starting to build those that the organisation will
need in the future Our case study organisations were
focusing strongly on knowledge-sharing enabling
people to learn from others across the organisation
Many of you are already considering alternative
solutions for specialist skill development such as
apprenticeships internal management schemes
summer placements and internships It is also
important to work with universities to ensure that
graduates are developing skills and knowledge which
will help them to succeed in the workplace
RESO
UR
CIN
G A
ND
TALE
NT P
LAN
NIN
G 2
011
35
2011
BACkGROUND TO ThE SURVEy
This survey was conducted in March and April 2011 It was sent to a sample of UK-based HR professionals in the public private and voluntary sectors In total 626 people responded to the survey
This is the fifteenth annual CIPD Resourcing
and Talent Planning survey (formerly known as
the CIPDrsquos Recruitment Retention and Turnover
survey) The survey examines organisationsrsquo
resourcing and talent planning strategies and
practices and the key challenges and issues
they face The survey consists of 45 questions
completed through an online self-completion
questionnaire
The majority of questions remain the same as
previous years to provide useful benchmark
data on topics including recruitment practices
difficulties and costs selection methods diversity
strategies the impact of the economic climate on
resourcing and talent planning practices labour
turnover and retention strategies New question
areas this year examine the employment of
younger workers the length of the recruitment
process the nature of job vacancies relationships
with recruitment partners and the use of
strengths-based approaches to recruitment
A small number of respondents took part in follow-
up telephone interviews to produce mini case
studies on a selection of topics These are presented
in the coloured boxes throughout the report
Sample profile Respondents predominantly work for private
sector organisations with professional services
being particularly well represented but other
sectors are represented in similar proportions to
last year (Table A1)
36
RESOURCING AND TALENT PLANNING
Table A1 Breakdown of respondent organisations by industrial sector Number of respondents
Manufacturing and production 113 19
Agriculture and forestry 1 0
Chemicals oils and pharmaceuticals 9 1
Construction 8 1
Electricity gas and water 4 1
Engineering electronics and metals 38 6
Food drink and tobacco 18 3
General manufacturing 6 1
Mining and quarrying 4 1
Paper and printing 6 1
Textiles 2 0
Other manufacturingproduction 17 3
Private sector services 319 52
Professional services (accountancy advertising consultancy legal etc) 78 13
Finance insurance and real estate 33 5
Hotels catering and leisure 26 4
IT services 26 4
Call centres 3 0
Media (broadcasting and publishing etc) 7 1
Retail and wholesale 40 7
Transport distribution and storage 23 4
Communications 6 1
Other private services 77 13
Public services 100 16
Central government 14 2
Education 12 2
Health 23 4
Local government 22 4
Other public services 29 5
Non-profit organisations 78 13
Care services 9 1
Charity services 32 5
Housing association 17 3
Other voluntary 20 3 Base 610
cipd
cou
k2011resou
rcing
and
talentp
lann
ing
survey
2011 Most respondents work in small to medium-sized
organisations in terms of the number of UK-
based employees but larger organisations are
also represented in similar proportions to last year
(Table A2)
Respondents reported on organisations based
across the UK Three in ten responded for the
whole of the UK while others responded for a
particular regioncountry (see Table A3)
Table A2 Breakdown of sample by organisation size ndash permanent employees in the UK
Fewer than 10 5
10ndash49 12
50ndash249 33
250ndash999 25
1000ndash4999 12
More than 5000 13 Base 610
Table A3 Main region covered by the reply
East Anglia 5
East Midlands 3
West Midlands 5
North-east of England 3
North-west of England 7
South-west of England 6
Yorkshire and Humberside 5
South-east of England (excluding London)
12
London 12
Scotland 6
Wales 3
Northern Ireland 3
Ireland 0
Whole of UK 29 Base 602
Labour turnover A total of 175 survey respondents were able to
supply all the information necessary for us to
calculate labour turnover on a whole-organisation
basis
This report uses the standard lsquocrude wastagersquo
method to calculate the rate of turnover This
method is calculated as follows
Labour turnover =
Number of leavers in a set period
______________________________________ x 100
Average number employed in the same period
(Leavers include those leaving the organisation
by way of voluntary or involuntary severance
redundancies or retirements but does not include
internal transfers)
Readers should be aware that this method has
some shortcomings For example it takes no
account of the characteristics of the workforce or
the length of service of the leaver
Note on statistics and figures used Some respondents did not answer all questions so
where percentages are reported in tables or figures
the respondent lsquobasersquo for that question is given
lsquoAveragersquo in the report is used to refer to the
statistical mean where the data is normally
distributed However the median is used in cases
where the distribution is significantly skewed
When the median is used it is noted
With the exception of labour turnover rates all
figures in tables have been rounded to the nearest
percentage point Due to rounding percentages
may not always total 100
Chi-square (χ2) tests are used to examine whether
differences between groups such as industrial
sectors are significant or likely to be due to
chance Spearmanrsquos Rho correlation (Rho) is used
to examine relationships between variables We
report on statistics at the generally accepted level
of significance plt005
RESO
UR
CIN
G A
ND
TALE
NT P
LAN
NIN
G 2
011
37
38
RESOURCING AND TALENT PLANNING
fURThER SOURCES Of INfORmATION
We produce a range of free factsheets surveys
guides and research reports which are available on
the CIPD website at cipdcoukhrresources
Read our factsheets on Employer Brand
Employee Turnover and Retention
Induction
Outlook series Our quarterly reports Labour Market Outlook
and Employee Outlook look at the employer and
employee perspectives on the labour market and
on workplace issues and trends while HR Outlook
explores priorities and emerging trends for the HR
profession and function
View these reports at
cipdcoukresearchoutlook-series
Talent management Two reports look at talent issues in a recession
difficult economic climate
The War on Talent Talent management under
threat in uncertain times (2009)
Fighting Back through Talent Innovation (2010)
Opening up Talent for Business Success (2010)
looks at the importance of integrating talent
management and diversity
The Talent Perspective What does it feel like to
be talent-managed (2010) looks at the employee
view of talent management
Workforce planning Our guide Workforce Planning Right people right
time right skills (2010) gives advice on developing
workforce planning processes
Diversity Two survey reports and a guide provide practical
advice and information on trends
Diversity in Business A focus for progress (2007)
Managing an Ageing Workforce How employers
are adapting to an older labour market (2010)
Managing Age New edition 2011
Two further reports are available to order from
cipdcoukbookstore
Managing Diversity in Practice Supporting
business goals (2007)
Managing Diversity and the Business Case (2008)
Sign up to receive our e-newsletter at
cipdcoukcipdupdate
cipd
cou
k2011resou
rcing
and
talentp
lann
ing
survey
RESO
UR
CIN
G A
ND
TALE
NT P
LAN
NIN
G 2
011
39
2011
ACkNOwLEDGEmENTS
The CIPD is very grateful to those organisations and
individuals who gave their time to take part in this
research They include
bull Annette Sinclair Senior Researcher at Roffey
Park for analysing the findings and writing this
comprehensive report
bull Members of the Recruitment Forum Steering
Committee for their input into the survey
design and assistance in piloting the
questionnaire
bull Hays for their support and commitment at
every stage of the research
bull All those who shared examples of their
organisationrsquos practices
We hope that you find the research useful when
considering your own recruitment and retention
practices Please contact us if you have any
questions or ideas based on our findings
(researchcipdcouk)
RESOURCING AND TALENT PLANNING
fOOTNOTES 1 Chi Square = 573 df = 5 p lt 0001 n = 604 2 Rho = 073 p lt 0001 n = 577 3 Rho = 045 p lt 0001 n = 533 4 F = 250 df = 2 p lt 0001 n = 533 5 Chi Square = 180 df = 6 p lt 001 n = 535 6 Chi Square = 71 df = 2 p lt 005 n = 603 7 Chi Square = 230 df = 6 p lt 001 n = 600 8 Chi Square = 91 df = 3 p lt 005 n = 598 9 Chi Square = 129 df = 4 p lt 005 n = 610
10 Rho = 034 p lt 0001 n = 609 11 Chi square = 217 df = 3 p lt 0001 n = 609 12 Chi Square = 609 df = 8 p lt 0001 n = 607 13 Chi Square = 208 df = 3 p lt 0001 n = 560 14 Size of organisation and developing online
careers site Rho = 025 p lt 0001 n = 599 Size of
organisation and employee surveys Rho = 019
p lt 0001 n = 599 15 Chi Square = 167 df = 2 p lt 0001 n = 599
16 Working with charities Chi Square = 80 df = 2 p
lt 005 n = 599 corporate sponsorship Chi Square
= 116 df = 2 p lt 001 n = 599 17 Chi Square = 76 df = 2 p lt 005 n = 599 18 Table 11 also shows that this method is deemed
most effective by public sector organisations but
this effect is due to a greater proportion of
large public sector organisations in our
sample whereas private sector organisations are
more evenly distributed in size 19 Chi square = 109 df = 2 p lt 001 n = 610 20 Chi Square = 279 df = 4 p lt 0001 n = 610 21 Chi Square = 259 df = 6 p lt 0001 n = 598 22 Chi Square = 515 df = 6 p lt 0001 n = 597 22 Chi Square = 177 df = 8 p lt 005 n = 600 22 Chi Square = 339 df = 4 p lt 0001 n = 610 22 Chi Square = 820 df = 4 p lt 0001 n = 610 22 Chi Square = 522 df = 8 p lt 0001 n = 610 22 Rho = 024 p lt 0001 n = 195 22 Chi Square = 166 df = 2 p lt 0001 n = 544
cipd
cou
k2011resou
rcing
and
talentp
lann
ing
survey
40
2011
OTHER TITLES IN THIS SERIES
ABSENCE MANAGEMENT The annual Absence Management survey has been running for eleven years providing useful benchmarking data on absence levels the cost and causes of absence and how organisations are managing absence The latest report is brought to you in partnership with Simplyhealth
EMPLOYEE ATTITUDES TO PAY The annual Employee Attitudes to Pay survey investigates employee attitudes and expectations towards pay and bonuses Now in its third year this survey is carried out by YouGov and focuses on employees in the UK
REWARD MANAGEMENT The annual Reward Management survey has been running for ten years and provides practical insights into current trends practices and issues affecting reward management in the UK It examines strategic reward base and variable pay bonuses incentives pensions reward measurement and total reward issues This report was brought to you in partnership with Benefex
LEARNING AND TALENT DEvELOPMENT The annual Learning and Talent Development survey is now in its thirteenth year and provides valuable commentary on current and future issues and trends It explores employer support for learning talent management employee skills managing and evaluating coaching and training spend
Issu
ed J
une
2011
Ref
eren
ce 5
552
copy C
hart
ered
Inst
itute
of
Pers
onne
l and
Dev
elop
men
t 20
11
Chartered Institute of Personnel and Development
151 The Broadway London SW19 1JQ
Tel 020 8612 6200 Fax 020 8612 6201
Email cipdcipdcouk Website cipdcouk
Incorporated by Royal Charter Registered charity no1079797

RESO
UR
CIN
G A
ND
TALE
NT P
LAN
NIN
G 2
011
1
2011
CONTENTS
Foreword 2
Summary of key findings 4
1 Recruiting employees 7
2 Resourcing and talent management in turbulent times 20
3 Diversity 27
4 Managing labour turnover 29
Conclusions 33
Background to the survey 35
Further sources of information 38
Acknowledgements 39
Footnotes 40
cipd
cou
k2011resou
rcing
and
talentp
lann
ing
survey
2
RESOURCING AND TALENT PLANNING
fOREwORD
Welcome to the fifteenth edition of our annual
Resourcing and Talent Planning survey report As
in previous years we provide useful benchmarking
data for organisations on resourcing trends costs
and turnover This year we have included new topical
sections ndash which we hope you will find useful ndash
examining the employment of younger workers the
length of the recruitment process the nature of job
vacancies relationships with recruitment partners and
the use of strengths-based approaches to recruitment
The headlines from this yearrsquos findings are that
recruitment activity remains low yet organisations
are experiencing recruitment difficulties in spite of
more people in the labour market The top reason
for the recruitment difficulties is a lack of necessary
specialist or technical skills
Strategies employed by some to try to fill
skills shortages include increasing their use of
apprenticeships interns and considering sponsoring
students through universities Employers however
need to think more holistically and long term when
it comes to skills shortages such as linking up with
educational establishments to ensure the curriculum
is preparing students well for the world of work and
developing their internal talent pipelines around
skills shortage areas
We feature a case study in this report from the
Association of Greater Manchester Authorities
(AGMA) This real-life example helps to bring the
findings to life and provide some practical evidence
of how organisations are reconfiguring their
resourcing and talent strategies for maximum effect
in difficult times
Claire McCartney
Adviser Resourcing and Talent Planning
CIPD
Despite continued high unemployment many
UK organisations continue to face difficulties
in attracting professionals with the right skills
and experience Hays has observed an increasing
tendency for organisations regardless of size or
sector to become more rigid with regards to the
people they wish to recruit Employers are less
likely to compromise than they have been in the
past and will delay recruitment until they find
someone with exactly the right skills qualifications
and experience At the same time job roles are
becoming increasingly niche which only adds to the
recruitment difficulties employers face today
This research suggests these problems look set to
continue and will only get worse long term due to
the rising number of young people not in training
education or employment if organisations fail to
address underlying problems Added to this many
of the challenges that organisations have always
faced still remain current such as a shortage of
professionals with specialist or technical skills and
the poor image associated with certain professions
This highlights the need for UK organisations to
invest in designing a creative resourcing and talent
attraction strategy now more than ever before
Julie Waddicor
Managing Director Hays Human Resources the
leading recruiting expert
RESO
UR
CIN
G A
ND
TALE
NT P
LAN
NIN
G 2
011
3
2011
ABOUT US Chartered Institute of Personnel and Development
The Chartered Institute of Personnel and
Development (CIPD) is Europersquos largest HR and
development professional body As a globally
recognised brand with over 135000 members we
pride ourselves on supporting and developing those
responsible for the management and development of
people within organisations
Our aim is to drive sustained organisation
performance through HR shaping thinking leading
practice and building HR capability within the
profession Our topical research and public policy
activities set the vision provide a voice for the
profession and promote new and improved HR and
management practices
We know what good HR looks like and what HR
professionals need to know do and deliver at
different stages of their career be they specialists or
generalists working in the UK or internationally
We offer
bull membership
bull professional development including
qualifications and training
bull networking opportunities and world-class
events
bull expertise in HR capability-building and
consultancy services
bull topical insights and analysis
bull a wealth of resources and a voice for HR
cipdcouk
Hays
Hays is the worldrsquos leading recruiting expert in
qualified professional and skilled work It employs
over 7000 staff in 257 offices across 30 countries Last
year Hays placed around 50000 people in permanent
jobs and nearly 180000 in temporary positions
Hays works across 17 specialist areas from healthcare
to telecoms banking to construction and education
to IT It operates across the private public and not-forshy
profit sectors
Its recruiting experts deal with 150000 CVs every
month and more than 50000 live jobs globally at any
one time The depth and breadth of their expertise
ensures that Hays understand the impact the right
individual can have on a business and how the right
job can transform a personrsquos life
wwwhayscouk
cipd
cou
k2011resou
rcing
and
talentp
lann
ing
survey
4
RESOURCING AND TALENT PLANNING
SUmmARy Of kEy fINDINGS
The CIPDrsquos 2011 Resourcing and Talent Planning survey report produced in partnership with Hays contains valuable information on current and emerging trends in people resourcing practice This annual benchmarking survey is based on 626 respondent organisations from the UK The survey examines organisationsrsquo resourcing and talent planning strategies and practices and the key challenges and issues they face New question areas this year examine the employment of younger workers the length of the recruitment process the nature of job vacancies relationships with recruitment partners and the use of strengths-based approaches to recruitment
Resourcing strategies and objectives bull Just over half of survey participants report
having a formal resourcing strategy
bull Larger organisations are most likely to have a
resourcing strategy
The number and nature of vacancies bull On average the number of vacancies
organisations attempted to fill in 2010 remains
as low as in 2009 during the recession
bull The number of vacancies in very large
organisations particularly in the public sector
has dramatically reduced over the past three
years
bull Three-quarters of permanent vacancies were
filled with external candidates
bull Three-fifths of organisations require candidates
to have specific sector experience
bull Twice as many public sector organisations
(48) expect they will recruit fewer people as
a consequence of the abolition of the Default
Retirement Age (23 overall)
Graduate recruitment bull Two-fifths of organisations are concerned that
the increase in university tuition fees will have
an impact on the number of graduates in the
marketplace
bull One in ten organisations are considering
sponsoring students through university (20
of manufacturing and production) 22
increasing their use of internships and 30
increasing apprenticeship schemes (48 of
manufacturing and production)
bull Just over a quarter of organisations operate a
structured graduate recruitment programme
(35 of manufacturing and production)
bull Few organisations have closed graduate
recruitment programmes over the past
12 months however half of public sector
organisations had reduced their intake (50
compared with 20 in the private and not-forshy
profit sectors)
RESO
UR
CIN
G A
ND
TALE
NT P
LAN
NIN
G 2
011
5
2011 Recruitment difficulties bull One in three organisations report the length of
their recruitment process has led to the loss of
potential recruits
bull Three-quarters of organisations experienced
recruitment difficulties in the past few months
bull Managers and professionals and technical
positions are the most difficult vacancies to fill
bull As in previous years the main reason for
recruitment difficulties is a lack of necessary
specialist or technical skills
bull Nearly three-quarters of organisations had made
efforts to improve their employee brand over
the last year most commonly through employee
surveys and developing online career sites
Attracting and selecting candidates bull While the effectiveness of methods to attract
applicants varies according to organisation sector
and size the most effective method overall
is reported to be through organisationsrsquo own
corporate websites as was the case last year
bull The private sector particularly manufacturing
and production organisations are three times
more likely than public sector organisations to
include recruitment agencies among their most
effective methods for attracting candidates
bull Overall a third of organisations report they
have reduced their use of recruitment partners
however one in five report they have formed
a closer business partnership with them over
the past year and one in ten that they consider
them integral to attracting top talent
bull Competency-based interviews (70) interviews
following the contents of CVsapplication forms
(63) and structured interviews (56) are as
last year the most common methods used to
select applicants
bull Two-fifths of organisations report they use
a strengths-based approach to recruitment
although it is less commonly used in the public
sector (26)
bull The median recruitment cost of filling a vacancy
is pound7500 for senior managersdirectors and pound2500
for other employees (adjusting for accuracy)
showing reductions compared with last year
Resourcing in turbulent times bull Half of the organisations surveyed report the
economic climate has had a negative impact
on their organisationsrsquo resourcing budgets for
2011ndash12 This year it is the public sector that is
most severely hit with four out of five (82)
reporting their resourcing budgets will be
reduced (up from 59 last year)
bull Changes in resourcing and talent practices in
2011 compared with 2010 reflect a stronger
focus on costs and reductions in budgets More
organisations anticipate they will be focusing
on developing talent in-house retaining rather
than recruiting talent and reducing their
reliance on recruitment agencies and external
consultants for resourcing and development
bull Nearly half of public sector organisations will
be implementing a recruitment freeze in 2011
compared with one-fifth of organisations
overall Two-thirds of public sector
organisations and 29 of private organisations
will be reducing the number of new recruits
they hire
bull The volume of applicants for vacancies has
increased reflecting the high unemployment
rate Three-quarters of organisations have
noticed an increase in the number of
unsuitable applicants and a third report that
there are too many suitable candidates to
choose from Despite high unemployment
over the last two years more than half (52)
believe that competition for talent is even
greater as the pool of available talent to hire
has fallen sharply (2010 41 2009 20)
bull Most organisations remain focused on
managing talent despite increased attention
on reducing costs with only 4 reporting
that their focus on talent has decreased
Nevertheless 18 of organisations (32 of the
public sector) have reduced their overall talent
management spend as a consequence of the
economic downturn
cipd
cou
k2011resou
rcing
and
talentp
lann
ing
survey
6
RESOURCING AND TALENT PLANNING
Diversity bull Overall in little change from previous years
just over half of organisations have a diversity
strategy rising to 90 of public sector
organisations
bull Our figures indicate a reduction in the use of
several methods to address diversity issues this
year particularly in the public sector which has
traditionally led the way in diversity practice
Labour turnover bull The median labour turnover rate has decreased
over the past few years (2011 125 2010
135 2009 157 2008 173)
bull Smaller organisations are most likely to report
that their labour turnover has increased and
larger organisations that it has decreased
bull As in previous years the majority of turnover
is attributed to employees leaving voluntarily
The rate of voluntary leavers has increased
slightly in the private sector compared with last
year but decreased in the voluntary and public
services sector reflecting the growthcuts in the
respective sectors
bull The proportion of organisations making ten
or more redundancies over the past year has
reduced from 33 in 2009 to 12 in 2010
Employee retention bull Only two-fifths (42) of organisations
experienced no difficulties in retaining staff
during 2010 a similar figure to the previous
year Managers and professionalsspecialists and
technical employees remain the most difficult
categories of staff to retain
bull Most organisations have taken one or more
steps to address staff retention however nearly
one in four organisations (a similar proportion
to the previous year) report that no specific
retention initiatives were undertaken in 2010
bull The most frequently cited actions taken by
employers to address retention ndash improving
the people management skills of line managers
and increased learning and development
opportunities ndash are the methods most
commonly rated most effective Improving the
induction process is also commonly used to
address retention but views on its effectiveness
are more mixed
2011
1 RECRUITING EmPLOyEES
This section explores trends and developments in recruitment strategies and activity within UK organisations during 2010 It examines the adoption of formal resourcing strategies changes in the number of job vacancies organisations attempted to fill the extent and nature of recruitment difficulties over the past year and the strategies employers use to overcome these challenges It also includes developments in graduate recruitment the most effective approaches for attracting applicants and the methods used for selection For the first time we explore the nature of job vacancies the length of the recruitment process the employment of younger workers changing relationships with recruitment partners and efforts to improve the employer brand Finally the costs associated with recruitment are discussed
Resourcing strategies Just over half of respondents surveyed report their
organisation has a formal resourcing strategy
in place a similar proportion to last year (2011
Table 1 Organisations with formal resourcing strategies in place by size ()
Size ndash number of employees in UK 54 2010 56 2009 58) The likelihood of
organisations having a formal strategy in place
increases with organisational size as was the case
last year (Table 1)1 There are no significant sector
differences
Fewer than 10 26
10ndash49 38
50ndash249 46
250ndash999 55
1000ndash4999 68
More than 5000 85
RESO
UR
CIN
G A
ND
TALE
NT P
LAN
NIN
G 2
011
Base 604
7
8
RESOURCING AND TALENT PLANNING
The number and nature of job vacancies There is considerable variation in the number
of vacancies respondentsrsquo organisations tried
to fill in 2010 partly because the number of
vacancies is strongly related to organisation size
(Table 2)2 Overall the median number of vacancies
has fallen from 30 in 2008 to 20 over the past two
years as the recession affected increasing numbers
of organisations (Table 2)
While there is no overall change from last year
in the median number of vacancies organisations
tried to fill there has been a substantial fall in the
proportion of vacancies very large organisations
(5000+ UK employees) attempted to fill from
a median of 550 in 2009 to 200 in 2010 (800 in
2008) The reduction in vacancies in very large
organisations is striking in the private and public
sectors but particularly in the latter where
the median number of vacancies organisations
attempted to fill in 2010 was less than a third than
in 2009 This reflects the sluggish growth in the
private sector and in particular the significant
cuts in public sector budgets
Table 2 Median number of vacancies respondents tried to fill by size of organisation and sector
2011 survey 2010 survey 2009 survey
No of permanent staff employed in UK All Private
sector Public
services All Private sector
Public services All Private
sector Public
services
Median Median Median Median Median Median Median Median Median
1ndash49 3 3 1 3 3 2
50ndash249 12 12 10 12 10 14 10 10 8
250ndash999 45 50 30 46 45 50 60 52 70
1000ndash4999 110 150 55 100 100 100 300 300 300
More than 5000 200 500 150 550 850 500 800 800 550
All organisations 20 20 30 20 20 80 30 20 100 Base 577 (2011) 442 (2010) 683 (2009)
The categories for number of permanent staff employed in the UK differed slightly in the 2009 survey (250 or fewer 251ndash500
501ndash1000 1001ndash5000 5001ndash10000 10001+) 2009 categories have been combined where appropriate and otherwise matched with
the best corresponding category of 20112010
cipd
cou
k2011resou
rcing
and
talentp
lann
ing
survey
2011 Overall nearly three-quarters (73) of permanent
vacancies were filled with external candidates
Larger organisations with a wide range of
talent to choose from are more likely to recruit
internally than smaller organisations3 Public sector
organisations particularly those with more than
1000 UK employees are more likely to recruit
internally than the private sector (Table 3)4
Organisations are divided in their use of temporary
contracts More than a quarter (28) have
employed more people on temporary contracts
in 2010 compared with the previous year while
a similar proportion (27) have employed fewer
people on temporary contracts (45 remain
the same) Manufacturing and production
organisations are most likely to have increased
their use of temporary contracts and the public
services the least perhaps reflecting their reduced
recruitment generally (Figure 1)5
Table 3 Average percentage of job vacancies filled internally
Voluntary No of permanent staff community and not-employed in UK Private sector Public services for-profit All
Mean Mean Mean Mean
1ndash49 15 17 7 13
50ndash249 20 28 23 21
250ndash999 24 29 24 24
1000ndash4999 35 58 12 39
More than 5000 47 62 33 53
All organisations 25 45 19 27 Base 533
figure 1 Use of temporary contracts by sector in 2010 compared with the previous year ()
Manufacturing and production
Private sector services
Public services
Voluntary community and not-for-profit
More Same Less
Base 610
25
27
37
22
3837
50
32
50
23
31
28
RESO
UR
CIN
G A
ND
TALE
NT P
LAN
NIN
G 2
011
9
10
RESOURCING AND TALENT PLANNING
Sector-specific experience is an essential
requirement of candidates in three-fifths (60) of
organisations overall While our figures suggest
it is less commonly required in the public sector
(48 compared with 59 of the voluntary
community and not-for-profit sector and 63
of the private sector)6 there are also substantial
differences within sectors For example specific
sector experience is essential for the majority
of organisations operating in the chemical
construction or mining industries and professional
services but not for those in general manufacturing
or retail and wholesale Similarly within the public
sector it is deemed particularly essential for health
and education organisations but less so for those in
central or local government
Employing younger workers Figures from the Office for National Statistics
show that while total unemployment fell during
the three months to February 2011 youth
unemployment rose to a record level of almost 1
million equating to one in five economically active
16ndash24-year-olds out of work Moreover concerns
have been raised as to whether high youth
unemployment will be further compounded by the
abolition of the Default Retirement Age later this
year and the increase in university tuition fees This
year we included new questions in the survey to
explore these issues
One in six organisations (17) report they are
employing more 16ndash24-year-olds compared with
one year ago this compares with less than one
in eight (12) who are employing fewer young
people (72 are employing the same number) The
employment of younger workers has reduced most
in the public sector where one in four reports a
decrease compared with one in ten who reports an
increase (Table 4)7 This is likely to reflect a general
reduction in recruitment in this sector
Overall one-quarter of organisations expect the
abolition of the Default Retirement Age will mean
they recruit fewer people however the figure
rises to nearly half of public sector organisations
It does not appear however that the abolition of
the Default Retirement Age will have a particular
impact on the recruitment of young people with
only one in ten organisations reporting it will result
in fewer 16ndash24-year-olds being recruited (Table 4)
cipd
cou
k2011resou
rcing
and
talentp
lann
ing
survey
Table 4 The employment of younger workers ()
Voluntary Manufacturing community
All and Private sector and respondents production services Public services not-for-profit
Percentage employing fewer 16ndash24-year-olds than one year ago
Percentage agreeing the abolition of the Default Retirement Age means they will recruit fewer 16ndash24-year-olds
Percentage agreeing the abolition of the Default Retirement Age means they will recruit fewer people
12 10 9 25 10
11 18 6 17 9
23 25 15 48 22
Base 605
2011 Graduate recruitment Two-fifths of organisations (39) are concerned
that the increase in university tuition fees will
have an impact on the number of graduates in
the marketplace Public sector organisations are
particularly concerned (49 compared with 34
of private sector services 42 of not-for-profits
and 43 of manufacturing and production
organisations)8
Perhaps in order to address this deficit or in
response to additional government support to
boost apprenticeship schemes a third of public
sector organisations nearly half of manufacturing
and production and about a quarter of private
sector services and not-for-profit organisations
are considering increasing apprenticeship schemes
(Table 5) About a quarter of organisations overall
are considering increasing their use of internships
although the proportion is markedly lower in the
public sector Overall one in ten organisations are
considering sponsoring students through university
but the proportion doubles in manufacturing and
production where the lack of appropriate skills is
a common cause of recruitment difficulties (Table
5 see also Tables 8 and 9) Larger organisations are
also more likely to consider sponsoring students
through university (19 of those with more than
5000 employees)9
Overall just over a quarter of organisations
operate a structured graduate recruitment
programme (Table 6) The operation of
these programmes is significantly related to
organisation size (Figure 2)10 They also appear
to be most common in the manufacturing
and production sector as last year when a
step increase in their use was noted (Table 6)
It appears that this sector is investing in the
development of skills to address their deficit
in the workforce generally As in previous
years voluntary community and not-for-profit
organisations are least likely to operate a
structured graduate recruitment programme11
Table 5 Activities organisations are considering ()
Voluntary Manufacturing community
All and Private sector and respondents production services Public services not-for-profit
Increasing apprenticeship schemes 30 48 24 33 27
Increasing your use of internships 22 27 23 12 27
Sponsoring students through university 10 20 8 12 1
Base 615
Table 6 Organisations operating a structured graduate recruitment programme by sector ()
2011 2010 2009 2008
All 27 34 22 23
Sector
Manufacturing and production 35 35 23 24
Private sector services 29 37 24 27
Voluntary community and not-for-profit 6 18 5 7
Public services 26 33 23 24
RESO
UR
CIN
G A
ND
TALE
NT P
LAN
NIN
G 2
011
Base 614 (2011) 472 (2010) 752 (2009)
11
cipd
cou
k2011resou
rcing
and
talentp
lann
ing
survey
12
RESOURCING AND TALENT PLANNING
The majority of respondents from organisations
without a recruitment programme for graduates
report that their organisation has never had such
a programme or not had one for some time (97)
Even in the cash-strapped public sector only 3
report they have closed their graduate recruitment
programme in the last 12 months
Nearly a third (31) of organisations who have a
graduate recruitment programme have increased
their intake over the past year while a quarter
have reduced their intake (24) This shows an
improvement on the previous year at the height of
the recession when 43 had reduced their intake
The impact of the budget cuts in the public sector
are however clearly apparent as more than twice
as many organisations in this sector (50 compared
with 20 in the private and not-for-profit sectors)
have reduced their graduate intake
Length of recruitment process One in three (31) organisations report that the
length of their recruitment process has led to the
loss of potential recruits This issue appears to be
exacerbated by organisation size Nearly half of
organisations with more than 5000 employees
report that the length of their recruitment process
has led to the loss of potential recruits compared
with 38 of those in organisations of 250ndash999
employees and just 15 of organisations with
fewer than 50 employees12 There are no significant
sector differences
Recruitment difficulties Three-quarters of organisations with vacancies
report difficulties in filling at least some over the
past few months (75) This is an increase on last
year (2010 68) and may reflect the decrease in
unemployment in the first few months of 2011
It is less however than in previous years perhaps
because organisations were attempting to fill fewer
vacancies (2009 81 2008 86)
figure 2 Organisations operating a structured graduate recruitment programme by size ()
Number of UK employees
39
42
9Fewer than 50
17
1650ndash249
21
29 250ndash999
1000ndash4999 47
61 More than 5000
62
10 40 50 60 70 80
2011
0 3020 Percentage
2010
Base 609 (2011) 466 (2010)
2011 The private sector particularly manufacturing and
production organisations are most likely to have
difficulties filling vacancies (Table 7)13 Table 8
shows that over half of organisations in this sector
have difficulty filling technical vacancies and this
may reflect specific skills shortages in the UK The
most difficult category of staff to recruit in other
sectors is managers and professionalsspecialists
as was the case last year In general there is little
change in the categories of vacancies that are most
difficult to recruit for compared with last year
As would be expected given the cuts to
public sector budgets one in ten public sector
organisations report they did not have any
vacancies to fill twice as many as last year There is
little change in this regard in the other sectors
Table 9 shows the reasons respondents cite for their
recruitment difficulties The findings are similar
to previous years Lack of necessary specialist or
technical skills remains by far the most frequently
cited cause of difficulties reported by nearly
three-quarters of respondents (2011 72 2010
67 2009 73 2008 70) This is particularly
an issue for the manufacturing and production
sector and the public services sector where there
is a particularly high demand for such skills Lack
of formal qualifications is far less of an issue
These findings support arguments for greater
collaboration between industry and academic
institutions and more vocational training in order
to meet organisationsrsquo skill requirements
Higher pay expectations than the organisation
could offer and lack of experience are the next
most frequently cited causes of recruitment
problems (46 and 40 respectively) Interestingly
these are less of an issue in the public sector
perhaps because public sector applicants have
different expectations of pay or because some pay
scales are set at a national level Lack of experience
may be less of an issue than the necessary skills or
qualifications required in many public sector roles
The proportion reporting their recruitment
problems are due to potential candidatesrsquo
reluctance to move in the current economic climate
has decreased from just over a quarter in 2010 to
19 this year Economic growth albeit slow is
likely to be responsible for this reduction but the
lsquohangoverrsquo of the recession is highlighted as one in
five organisations still blame the economic climate
for their recruitment problems Despite high
unemployment 15 of respondents report they
have experienced problems due to no applicants In
line with last yearrsquos findings this is particularly an
issue for the public sector (22) which is also more
likely to report the image of their sectoroccupation
is a problem (22)
Table 7 Organisations experiencing difficulties recruiting for one or more category of vacancy by organisation size ( of those that have had vacancies to fill)
Voluntary Manufacturing community
and Private sector and All 2011 production services Public services not-for-profit
Difficulty filling one or 75 88 77 66 62more vacancies
No difficulties experienced 25 12 23 34 38
Base 561
RESO
UR
CIN
G A
ND
TALE
NT P
LAN
NIN
G 2
011
13
14
RESOURCING AND TALENT PLANNING
Table 8 Categories of vacancy that proved particularly difficult to fill ( of respondents)
Voluntary community
Manufacturing Private and and sector Public not-for-
All 2011 production services services profit All 2010
Other managers and professionalsspecialists
34 41 33 27 34 37
Technical 30 53 29 20 16 28
Senior managers directors
14 13 16 10 16 16
Services (customer personal protective 7 6 8 3 5 5 and sales)
Administrative secretarial
4 3 4 4 4 3
Manualcraft workers 4 11 3 1 0 2
Other 6 5 3 10 11 4
No difficulties experienced
23 12 22 30 38 25
No vacancies to fill 6 3 7 10 1 6 Base 597 (2011) 468 (2010)
Voluntary community
Manufacturing Private and All and sector Public not-for- All
2011 production services services profit 2010
Table 9 Reasons for recruitment difficulties ()
cipd
cou
k2011resou
rcing
and
talentp
lann
ing
survey
Lack of necessary specialist or technical skills 72 82 69 80 59 67
Look for more pay than you could offer 46 47 48 34 52 39
Lack of experience 40 42 43 27 41 36
Reluctance to move in current economic climate 19 24 18 17 15 26
Lack of interpersonal skills 16 9 19 10 20 12
No applicants 15 9 16 22 20 15
Image of sector occupationorganisation 13 7 12 22 11 12
Relocation difficulties 9 19 6 10 7 8
Lack of formal qualifications 7 7 7 5 7 4
The impact of the immigration cap 3 2 4 3 4
Other 4 3 3 8 7 7
Base 427 (2011) 330 (2010)
new item introduced in 2011
2011 Improving the employer brand Nearly three-quarters of organisations have made
efforts to improve their employer brand over the
past year (Table 10) The larger the organisation
the more likely it is to have undertaken one or
more activities to improve its brand Two-fifths of
small organisations with fewer than 50 employees
report they have taken no action to improve their
employer brand compared with one-quarter of
organisations with 250ndash999 employees and one-
sixth of those with more than 5000 employees
There are no significant sector differences
The most popular approaches to improving
employer brand are employee surveys and
developing online careers sites with larger
organisations most likely to have adopted these
methods14 The public sector is most likely to
have introduced or extended flexible working
homeworking15 whereas the private sector is
more likely to have made efforts to improve its
brand through working with charities or corporate
sponsorship16 Voluntary community and not-forshy
profit organisations are most likely to have used
placement students to improve their brand17
Attracting candidates The effectiveness of methods to attract applicants
varies according to sector and organisation size
(Table 11) Overall the most effective method is
through organisationsrsquo own corporate websites
as was the case last year The effectiveness of this
method increases with organisation size probably
due to the increased brand awareness and
perhaps because larger organisations have more
advanced websites18
The private sector particularly manufacturing
and production organisations is three times
more likely than public sector organisations to
report recruitment agencies among their most
effective methods and twice as likely as voluntary
sector organisations (regardless of size) Search
consultants and employee referral schemes are also
notably more popular in the private sector than in
the public or voluntary sectors
In contrast the public and voluntary sectors are
more likely to find the press effective for attracting
applicants including local and national newspaper
advertisements and specialist journalstrade press
Secondments are also deemed to be more effective
in these sectors than in the private sector
Table 10 Work undertaken over last year to improve employer brand ()
Voluntary community
All Private Public and 2011 sector services not-for-profit
Employee surveys 39 39 38 43
Developing online careers site 30 33 23 29
Introducingextending flexible working homeworking 24 20 39 29
Placement students 23 21 19 35
Graduate careers fairs 15 17 11 8
Working with charities 14 16 8 6
Corporate sponsorship 11 13 2 8
Introducing sabbaticals 3 4 1 5
Other 7 6 6 10
No action taken to improve employer brand 27 28 29 22
RESO
UR
CIN
G A
ND
TALE
NT P
LAN
NIN
G 2
011
Base 601
15
16
RESOURCING AND TALENT PLANNING
Table 11 Most effective methods for attracting applications by industry sector ()
Sector 2011 Number of UK employees 2011
All
2010
All
2011
Man
ufa
ctu
rin
gan
d p
rod
uct
ion
Priv
ate
sect
or
serv
ices
Pub
lic s
ervi
ces
Vo
lun
tary
co
mm
un
ity
and
no
t-fo
r-p
rofi
t
1ndash49
50ndash2
49
250ndash
999
100
0ndash4
999
Mo
re t
han
500
0
Own corporate website 63 59 44 57 77 66 42 55 57 77 79
Recruitment agencies 60 54 77 62 22 30 39 59 66 51 41
Local newspaper advertisements 36 32 38 23 41 51 28 35 35 29 29
Employee referral scheme 35 29 33 38 5 14 20 33 27 32 29
Commercial job boards 33 27 33 29 14 29 21 27 25 42 26
Specialist journalstrade press 31 27 24 23 30 43 26 23 32 32 24
Encourage speculative applicationsword of mouth 24 25 30 29 9 23 27 31 23 19 19
Jobcentre Plus 23 25 24 24 22 34 16 29 21 25 32
Professional networking (such as LinkedIn) 14 16 11 23 5 9 28 13 13 18 17
Search consultants 22 15 24 17 5 4 14 11 17 18 15
Links with schoolscollegesuniversities 18 13 16 13 9 17 12 13 11 18 15
Apprenticeships 12 11 19 9 13 9 10 10 11 12 17
National newspaper advertisements 16 11 4 6 23 29 10 9 15 10 15
Secondments 11 11 7 8 21 12 2 9 13 11 19
Links with other local organisations making redundancies 7 13 5 7 9 6 5 9 11 8
Alumni (previous employees) 5 5 6 7 2 1 7 2 6 11 3
Social networking sites (such as Facebook) 3 4 4 5 3 4 3 2 2 8 12
Local Employment Partnership (LEP) 6 3 1 4 2 5 1 2 3 4 9
Other 5 5 2 3 12 6 8 3 4 4 5
cipd
cou
k2011resou
rcing
and
talentp
lann
ing
survey
Base 604 (2011) 464 (2010)
new item introduced in 2011
Despite the popularity of social networking
sites such as Facebook they are not seen to be
particularly effective for attracting candidates
Professional networking sites such as LinkedIn are
more popular particularly in the private services
sector although there has only been a small
percentage increase in their reported effectiveness
compared with last year
2011 Recruitment partners A new question this year asked respondents if their
attitude to and relationships with recruitment
partners has changed over the past 12 months Just
over a third report things have not changed
(Table 12) A similar proportion report they have
reduced their use of recruitment partners and 6
that they have stopped using them altogether
with one in ten considering them an unaffordable
expense (one in five in the not-for-profit sector)
and a similar proportion an unnecessary expense
In contrast one in five (predominantly private
sector organisations) report they have formed
a closer business partnership with recruitment
partners over the past year and one in ten (again
predominantly private sector organisations) report
they consider them integral to attracting top talent
Selecting candidates There has been little change in the methods used
to select candidates over the past few years with
the exception of a drop in the use of general
ability tests compared with 2009 (Table 13)
Interviews remain the most common selection
method with competency-based interviews
being most popular overall Interviews following
the contents of CVsapplication forms are also
particularly popular in the private sector (70
compared with 41 in the public sector and 57
in the not-for-profit sector) whereas the public
and not-for-profit sectors favour structured (panel)
interviews (82 and 79 respectively compared
with 45 in the private sector)
Tests for specific job-related skills are more popular
in the public and not-for-profit sectors (61 and
62 respectively compared with 43 in the private
sector) whereas telephone interviews are more
popular in the private sector (52 compared with
12 in the public sector and 26 in the not-forshy
profit sector)
Table 12 Changes in attitudes to and relationships with recruitment partners over the past 12 months ()
Voluntary community
All Private Public and 2011 sector services not-for-profit
Not changed 36 34 40 39
Reduced use of recruitment partners 32 34 32 26
Formed a closer business partnership with them 19 23 8 12
Consider them an unnecessary expense 12 11 13 16
Consider them an unaffordable expense 11 10 11 22
Consider them integral to attracting top talent 9 11 2 4
Stopped using recruitment partners 6 5 8 5
Other 3 3 3 3 Base 604
RESO
UR
CIN
G A
ND
TALE
NT P
LAN
NIN
G 2
011
17
18
RESOURCING AND TALENT PLANNING
Table 13 Methods used to select applicants ()
2011 2010 2009 survey survey survey
Competency-based interviews 70 78 69
Interviews following contents of CVapplication form 63 64 68
Structured interviews (panel) 56 61 59
Tests for specific job-related skills 49 48 50
Telephone interviews 43 47 38
Literacy andor numeracy tests 38 43 39
Personalityaptitudepsychometric questionnaires 35 44 35
Assessment centres 35 42 35
Pre-application eliminationprogression question(s) 25 32 NA
General ability tests 23 27 44
Group exercises (for example role-playing) 21 30 26
Pre-interview references (academic or employment) 9 16 19
Video CVs 0 1 NA
Other 3 4 6
cipd
cou
k2011resou
rcing
and
talentp
lann
ing
survey
Base 605 (2011) 473 (2010) 754 (2009)
Strengths-based recruitment Two-fifths of organisations (40) report they use a
strengths-based approach to recruitment although
it is less commonly used in the public sector (26)19
In all sectors smaller organisations are most likely
to report they use a strengths-based approach
(60 of organisations with 1ndash49 employees use it
compared with 34 of organisations with 250ndash999
employees and 24 of organisations with more
than 5000 employees)20
Most of those who use a strengths-based approach
to recruitment are neutral about how easy it is to
administer in practice regardless of sector or size
Nearly a third (32) find it easy or very easy and
only one in ten (11) find it difficult
Over three-quarters of those who use a strengths-
based approach to recruitment believe it
brings benefits in terms of increased individual
performance (78) Two-thirds believe it improves
retention (67) and increases engagement (63)
Two-fifths (39) report it results in greater diversity
of skills in the workplace
Many organisations that use a strengths-based
approach to recruitment also use a strengths-based
approach for other people processes More than
half use it for performance management processes
(59) succession planning (55) and learning and
development (53) Two-fifths use it for talent
management (42) and a third use it for workforce
planning (32) Just under three in ten (29) also
use it for redeployment
Recruitment costs Last year we noted an increase in the proportion
of organisations that calculate their recruitment
costs (2010 65 2009 53 2008 51) This year
the proportion is back in line with previous years
(52) The increase last year may have been due
to sampling differences or a consequence of an
increased focus on costs during the recession that
has not continued
Four-fifths (79) of organisations that calculate
recruitment costs provided cost estimates per
hire There is considerable variance in the amount
organisations spend (at least partly due to our
2011 findings that organisations include different costs
in their calculations see Table 14) In general
the median figures (Table 15) are lower than last
year for both senior managerdirectors and other
employees
In order to explore the validity of estimates this
year we also asked respondents to indicate how
accurate their cost estimates were Half (51) of
estimates for costs of recruiting senior managers
directors were accurate to plus or minus 10 and
83 to plus or minus 20 Two-fifths of estimates
for other employees were accurate to plus or minus
10 and 74 to plus or minus 20 Table 16
shows the median figures for estimates that were
believed to be accurate to up to plus or minus 20
The figures indicate as we found last year that
organisations spend considerably more on senior
appointments than on other employees This
reflects the value attached to good leadership and
perhaps the additional challenges of attracting
the best candidates for senior positions This is
particularly the case in the private sector where
considerably more is spent on the recruitment of
senior managersdirectors than in the public or not-
for-profit sectors
Table 14 Criteria included in cost per hire calculations ()
Size ndash number of employees in UK
Advertising costs
Agencysearch costs
Employee referrals
Travel expenses
Relocation expenses
Fixed costs of resourcing team
Opportunity costs of hiring managers time
Other
Dont know Base 299
81
75
35
30
17
24
24
3
4
Table 15 Estimated total costs (advertising costs agency or search fees) per hire (pound)
Median 2011 Median 2010 (no of (no of
Occupational group respondents) Minimum Maximum respondents)
Senior managersdirectors 7000 (219) 251 55000 8333 (234)
Other employees 2000 (246) 150 32000 2930 (262) Number of respondents shown in brackets
Table 16 Median total costs (advertising costs agency or search fees) per hire for estimates accurate to plus or minus 20 (pound)
Voluntary
Median 2011 Manufacturing
and Private Public
community and not-for-
Occupational group production sector services profit
RESO
UR
CIN
G A
ND
TALE
NT P
LAN
NIN
G 2
011
Senior managersdirectors 7500 8000 9000 5000 3500
Other employees 2500 3400 2000 3000 1500 Base 150
19
cipd
cou
k2011resou
rcing
and
talentp
lann
ing
survey
20
RESOURCING AND TALENT PLANNING
2 RESOURCING AND TALENT mANAGEmENT IN TURBULENT TImES
In January 2010 the UK officially emerged from the recession however the economic environment remains uncertain for many organisations The environmental disasters in Japan the uprisings and wars in the Middle East rising oil prices and European debt highlight the volatility of global markets In the UK economic growth remains sluggish and there are concerns regarding the impact of the VAT increases high inflation and the austerity measures of the Coalition Government This section examines the impact of the economic environment on resourcing budgets strategies and activities in 2010 It looks at changes in views on the employment market and the implications for managing talent
The impact of the economic climate on resourcing Overall half of organisations report that the
economic climate has had a negative impact on
their organisationsrsquo resourcing budgets for 2011ndash12
(Table 17) This year however it is the public
sector that is most severely hit with four-fifths
(82) reporting their resourcing budgets will be
reduced (up from 59 last year) In contrast fewer
private and not-for-profit sector organisations
face reductions this year compared with last
although more are still reducing their budgets than
increasing them
Changes in resourcing and talent practices in
2011 compared with 2010 reflect a stronger
focus on costs and reductions in budgets (Figure
3) Two-thirds plan to develop more talent inshy
house (compared with one-third in 2010) and
more organisations plan to reduce reliance on
recruitment agencies and external consultants for
resourcing and development The proportion of
organisations planning to focus more on retaining
rather than recruiting talent has increased to 51
in 2011 from 28 in 2010
2011 Changes in recruitment practices are also
anticipated More organisations plan to make use
of new mediatechnology to recruit which may
be a cost-cutting strategy but can also improve
the efficiency and effectiveness of the recruitment
process On a positive note more organisations plan
to invest more time and effort in the quality of
candidates they hire and will be taking actions to
improve ways of identifying quality candidates
Public sector organisations are more than twice
as likely to be implementing a recruitment freeze
in 2011 (46 compared with 22 overall)
Nevertheless this is an improvement on 2010 when
58 of public sector organisations implemented a
recruitment freeze The situation is also somewhat
brighter for many private sector organisations
with 15 reporting they will be implementing a
recruitment freeze in 2011 compared with 26
in 2010 Nevertheless the economic recovery
remains slow for many with 29 of private
sector organisations and 66 of public sector
organisations reporting they will be reducing the
number of new recruits they hire in 2011 similar
proportions to 2010 Inevitably more public than
private sector organisations report they will be
reducing their headcount in 2011 and losing key
talent (33 compared with 9 in the private
sector) and redeploying people into new roles (66
compared with 37 in the private sector)
Table 17 Impact of the current economic climate on organisationsrsquo resourcing budgets ()
Private Public Voluntary community All sector services and not-for-profit
2011 2010 2011 2010 2011 2010 2011 2010
Reduced 49 53 41 51 82 59 51 61
Stayed about the same 36 37 39 40 14 36 40 34
Increased 8 7 11 4 1 5 4 5
Dont know 7 3 8 5 3 5 Base 615 (2011) 475 (2010)
RESO
UR
CIN
G A
ND
TALE
NT P
LAN
NIN
G 2
011
21
cipd
cou
k2011resou
rcing
and
talentp
lann
ing
survey
22
RESOURCING AND TALENT PLANNING
figure 3 Resourcing and talent practices implemented in 2011 and 2010 ( of respondents)
Developing more talent in-house
Continuing to recruit key talentniche areas
Focusing more on retaining rather than recruiting talent
Reducing reliance on recruitment agencies
Use of new mediatechnology to recruit
Investing more time and effort in the quality of candidates we hire
Redeploying people into new roles
Reducing the number of new recruits we hire
Taking actions to improve ways of identifying quality candidates
Increasing the number of interimcontract staff recruited
Reducing our use of external consultants for resourcing and development
Increased recruitment of apprenticesinterns
Implementing a recruitment freeze
Reducing our headcount but preserving key talent
Recruiting talent discarded by competitors
Reducing our headcount and losing key talent
Offering sabbaticals career breaks additional holidays
Reducing employees working hours to avoid making people redundant
8Reducing graduate recruitment 8
6Suspending graduate recruitment 7
36
28
36
28
26
30
35 35
35 15
29 23
28 19
24 12
22 30
22 16
18 11
13 12 12
10
12 10
66
59 46
51
47
46
45
44
0 10 20 30 40 50 60 70 80 Percentage of respondents
2011 2010
Base 582
RESO
UR
CIN
G A
ND
TALE
NT P
LAN
NIN
G 2
011
23
2011 Views on the employment market In little change to last year three-quarters of
organisations report they have noticed an increase
in the number of unsuitable applicants as they have
fewer roles to fill (Figure 4) Far fewer (34) report
that there are too many suitable candidates to
choose from and despite high unemployment over
the past two years more than half (52) believe that
competition for talent is even greater as the pool of
available talent to hire has fallen sharply (2010 41
2009 20) For many organisations there appears a
clear mismatch between the skills they require and
those available in the labour market
Competition for talent appears to be particularly
keen in the private sector Two-thirds (64) of
manufacturing and production organisations
and 55 of private services organisations agree
that competition for talent is even greater now
compared with 39 of the public sector and 34
of not-for-profits21 In contrast the public sector
and not-for-profits are more likely to agree they
have too many suitable candidates to choose
from (61 and 47 respectively compared with
23 of manufacturing and production and 27
of private sector services)22
Three-fifths (62) of respondents agree that the
demand for temporary and contract workers will
increase as employers will be reluctant to take
on permanent staff during uncertain times while
44 agree that part-time workers will become
more appealing to employers who are looking to
cut costs
figure 4 Views on the employment market ( agreeing or strongly agreeing)
With fewer roles to fill we have noticed an increase in the number
of unsuitable applicants
The demand for temporary and contract workers will increase as employers will be reluctant to
take on permanent staff during uncertain times
Employers will use the economic downturn as an opportunity to get rid of poor performers
and bring about culture change
Competition for talent is even greater now as the pool of available talent to hire has
fallen sharply
Part-time workers will become more appealing to employers who are looking to cut costs
Employers are acting too hastily in making people redundant and as a result they will lose too
many employees with valuable knowledge and skills
With fewer roles to fill there are now too many suitable candidates to choose between
The abolition of the Default Retirement Age will mean we recruit fewer people
Employers will look to make older workers over the age of 65 redundant before their younger workers
73 76
54
62 66 66
55 63
72
52 41
20
44 45
52
44 48
53
34 32
23
19 22
27
0 10 20 30 40 50 60 70 80 Percentage of respondents
2011 2010 2009
Base 607 (2011) 475 (2010) 746 (2009)
item added 20102011
24
RESOURCING AND TALENT PLANNING
More than half of respondents (55) across
all sectors believe that employers will use the
economic downturn as an opportunity to get rid of
poor performers and bring about culture change
While high this shows a downward trend on the
past two years (2010 63 2009 72 agree or
strongly agree) perhaps reflecting a slowing in
the number of redundancies Similarly there is
a gradual downward trend in the proportion of
respondents who express concern that employers
are acting too hastily in making people redundant
and as a result they will lose too many employees
with valuable knowledge and skills or that
employers will look to make older workers over the
age of 65 redundant before their younger workers
Nearly a quarter (23) of respondents believe
that the abolition of the Default Retirement Age
will mean they recruit fewer people (48 in the
public sector)23
Implications for talent management The value of effective talent management has
not been lost in the recent attention on reducing
costs Two-fifths (41) of organisations report
that the current economic situation has led
to an increased focus on talent management
(43 in 2010) and only 4 that it has led to a
decreased focus (7 in 2010) with no significant
differences across sectors Unsurprisingly however
the public sector are about twice as likely this
year to report they have reduced their overall
talent management spend due to the downturn
compared with other sectors (Table 18)24
The proportion of organisations that report
the economic downturn has had an impact on
approaches to reward across the business has
slightly reduced compared with last year (54
compared with 61 in 2010) As last year it
appears that organisations across all sectors
are being more selective in who they reward A
smaller proportion of organisations report their
approach to reward for individuals identified as
talent has been affected by the downturn (42)
than report their approach to reward across the
business has been affected (54)
Table 18 Has your overall talent management spend been reduced due to the economic downturn ()
cipd
cou
k2011resou
rcing
and
talentp
lann
ing
survey
Voluntary All community and All
2011 Private sector Public sector not-for-profit 2010
Yes 18 17 32 13 23
No 38 43 16 32 41
NA (no talent management spend) 44 40 52 55 36
Base 617 (2011) 471 (2010)
RESO
UR
CIN
G A
ND
TALE
NT P
LAN
NIN
G 2
011
25
2011
Case study Innovative recruitment and cost saving in the Association of Greater Manchester Authorities
The Association of Greater Manchester Authorities (AGMA) represents the ten local authorities in
Greater Manchester and works in partnership with a wider group of associate councils and public
sector organisations AGMA chief executives and council leaders work together on a range of key
strategic and policy issues which impact on Greater Manchester including resourcing strategies
and recruitment and retention issues
The AGMA initiative in cost reduction in the area of resourcing has been described as lsquoa truly
pioneering example of collaboration between a number of local authoritiesrsquo and is already
delivering against a range of objectives
The initial aim was to make a significant saving on the pound5ndash6 million annual cost of external
media advertising reported in 2008ndash09 and to create a more efficient and effective recruitment
system A shared portal was commissioned to offer a front-end website (wwwyourcounciljobs
couk) with a lsquoback-officersquo e-recruitment system which would give a standardised shared-service
approach for job applicants across councils Some of the benefits for applicants include the ability
to go to one place to register their interest to be able to look in specific categories for jobs
of particular relevance to them to be able to amend an existing application form in order to
apply for a further post and to receive email alerts when new jobs relevant to their interests are
posted In addition communications to job-seekers are now standardised for every council
This approach has seen real benefits across each of the local authorities workflows are now
standardised as every HR team runs identical systems and there is consistency in reporting within
all councils enabling them to benchmark their processes more clearly The councils use this
benchmarking data to make additional improvements and efficiencies
Jayne Whitehead AGMA Category Procurement Manager has project-managed the initiative
with managers represented from each participating authority and describes the process as one
of lsquotrue collaborationrsquo with lsquo100 commitmentrsquo from all the councils involved The benefits
are clear annual media costs are dramatically reduced to approximately pound250000 across ten
partner organisations and there has been a reduction in time-to-hire of 13 days This has had
the knock-on effect of reducing expenditure on agency staff The average cost of a recruitment
advertisement per role was previously pound97400 it is now pound15200 There have also been benefits
outside the original intention including doubling the number of online applications for council
posts with administrative cost savings in HR of approximately pound250000 across the consortium
More than 61000 registered users are now on the system and the councils are successfully filling
their own talent pools of prospective job-seekers Overall the project team is now celebrating a
pound17 million reduction in recruitment expenditure over the past 12 months
(continued)
cipd
cou
k2011resou
rcing
and
talentp
lann
ing
survey
26
RESOURCING AND TALENT PLANNING
There were some challenges in the implementation of this new way of working All the councils
had to be convinced about the benefits of the changes With the implementation of a new IT
system having its own set of challenges the project has taken 12 months to introduce longer
than first anticipated Implementing the changes during a period of radical restructuring in all
councils also proved particularly challenging However Jayne describes how both the need to
make efficiencies and feedback from job-seekers meant that lsquowe had to find a different way of
doing thingsrsquo Jayne also recognises how the neutrality of her own role (each council pays a tenth
of her salary) has been essential in ensuring that the project has been fair to all its participants
offering a centralised shared resource to manage the project
The project is now set to develop yet further with the aim of becoming entirely self-funding
within the next year by accepting advertising from other organisations Two new websites are
planned for recruitment into schools and social care jobs bringing even less reliance on media
and agencies AGMA will also be further building its own talent pool
Jayne describes the initiative as lsquoa true example of what you can do if you collaborate across
authoritiesrsquo Not only the separate councils but also diverse teams and functions including HR IT
procurement communications and marketing have worked together to deliver this innovative
and inspiring project
Information provided by Jayne Whitehead AGMA Category Procurement Manager
2011
3 DIVERSITy
This section examines organisationsrsquo approaches to diversity including the use of formal diversity strategies and the methods used to address diversity issues
Just over half of organisations report they have with just under two-thirds of not-for-profit
a formal diversity strategy showing little change organisations and just two-fifths of private sector
over the past four years (2011 52 2010 55 companies (Table 19)25 Diversity strategies are also
2009 60 2008 55) Consistent with previous more common in larger organisations (regardless
yearsrsquo findings most public sector organisations of sector)26
(90) have a formal diversity strategy compared
Table 19 Does your organisation have a formal diversity strategy ()
Yes No Dont know
All 52 41 7
Sector
Private sector 41 50 8
Public services 90 9 1
Voluntary community and not-for-profit 63 33 4
Number of UK employees
Fewer than 50 45 50 5
50ndash249 43 51 6
250ndash999 48 44 7
1000ndash4999 65 31 4
More than 5000 80 9 11 Base 613
RESO
UR
CIN
G A
ND
TALE
NT P
LAN
NIN
G 2
011
27
28
RESOURCING AND TALENT PLANNING
As was the case last year over three-quarters
of organisations with a formal diversity policy
attempt to address diversity issues through
monitoring recruitment andor staffing
information to obtain data on gender ethnicity
disability age and so on (Table 20) Less than
three-fifths train interviewers to understand what
diversity is about and the impact of stereotypes
Other diversity-focused initiatives are even
less common moreover the figures indicate a
reduction in the use of several methods compared
with previous years The pressures of the recession
may have led to a reduced focus on diversity
Given the links between diversity in the workforce
and productivity organisations that fail to give
this issue the attention it requires may find
themselves at a disadvantage in the future
Traditionally the public sector has tended to lead
the way in terms of diversity practices Again this
year they are significantly more likely to address
diversity issues through monitoring recruitment
andor staffing information through providing
recruitment documents in other formats through
advertising vacancies in different sources to
attract under-represented groups and through
setting recruitment targets to correct a workforce
imbalance Nevertheless they are less likely than
other sectors to actively try to attract talent of all
ages (Table 20) Moreover our figures indicate that
the reduction in the use of several diversity methods
compared with previous years is particularly
pronounced in the public sector The change of
government and budget reduction measures have
led to significant change programmes in many
public sector organisations which may have resulted
in a reduced focus on diversity issues
Table 20 Methods used to address diversity issues in organisations ( with formal diversity strategy)
Voluntary community
Private Public and not-sector services for-profit
2011 2010 2009 2008 2011 2011 2011 survey survey survey survey (2010) (2010) (2010)
Monitoring recruitment andor staffing information to obtain data on gender 78 79 84 83 70 (71) 88 (96) 88 (76) ethnicity disability age any other categories
cipd
cou
k2011resou
rcing
and
talentp
lann
ing
survey
Training interviewers to understand what diversity is about and the impact of stereotypes
57 68 68 60 53 (66) 64 (73) 57 (72)
Actively trying to attract talent of all ages 45 53 32 43
Operating policies that go beyond basic legislative requirements on age gender race disability sexual orientation religion and belief
39 49 52 48 34 (44) 47 (63) 47 (40)
Providing recruitment documents in other 39 41 37 31 24 (22) 64 (77) 47 (52)formats (online large-print audio and so on)
Checking that any tests used are valid reliable and culture-free and were tested on diverse norm groups
36 42 47 34 39 (44) 35 (45) 27 (16)
Advertising vacancies in different sources to 31 37 51 48 22 (30) 44 (53) 41 (32)attract under-represented groups
Using specific imageswords in your recruitment advertising to appeal to a wider audience 29 38 42 42 25 (30) 36 (52) 33 (40)
Making attempts to employ the long-term 19 19 13 29unemployed
Setting recruitment targets to correct a workforce imbalance 9 15 14 12 4 (8) 18 (31) 8 (16)
Base 312 (2011) 253 (2010) 419 (2009) new item added in 2011
RESO
UR
CIN
G A
ND
TALE
NT P
LAN
NIN
G 2
011
29
2011
4 mANAGING LABOUR TURNOVER
Figures from the Office for National Statistics show that UK unemployment rose by 27000 in the three months to the end of January 2011 to 253 million the highest since 1994 When unemployment is high the number of employees leaving organisations voluntarily is expected to decrease Here we examine whether this is happening and how organisations are tackling the issue of employee retention
Among organisations that are able to supply
turnover data the median labour turnover rate
has decreased over the past few years (Table 21)
The median figure however hides differences
across organisations Slightly more organisations
report their turnover has increased in 2010
compared with 2009 (38) than has decreased
(33) while for nearly a third (29) it remained
the same Smaller organisations are more likely
to report their labour turnover has increased and
larger organisations that it has decreased27
As in previous years the majority of turnover (53)
is still attributed to employees leaving voluntarily
(Table 22) As the economy has improved the
median proportion of turnover due to redundancies
has reduced Only 12 of organisations that
provided reasons for leaving made more than ten
redundancies in the previous year compared with
33 in 2010 26 in 2009 and 22 in 2008 A third
(34) of organisations that made redundancies
offered career transition services
While median turnover rates have reduced
across all sectors Table 23 shows that the rate
of voluntary leavers has increased slightly in
the private sector compared with last year but
decreased in the voluntary and public services
sector This reflects improvements in the economic
outlook for the private sector and the widespread
cuts in the public sector which also have a direct
impact on many not-for-profit organisations that
provide services for the public sector
Cost of labour turnover While just over half of organisations calculate
their recruitment costs only 13 calculate the
cost of their labour turnover (2010 14) The
majority of organisations report they do not
calculate these costs (79) while 7 donrsquot know
if they are calculated or not
Nearly half (46) of those who calculate their
turnover costs want to maintain their current
turnover rate while one-fifth (38) want to
reduce turnover during 2011 and 15 want to
increase it
Retaining employees The steps organisations take to retain employees
in their workforce can have a significant impact
on organisational efficiency and success through
30
RESOURCING AND TALENT PLANNING
Table 21 Median rate of labour turnover ()
2011 2010 survey 2009 survey 2008 survey 2007 survey 2006 survey
125 135 157 173 181 183
Base 175 (2011)
Table 22 Median labour turnover rates by reason for leaving ()
2011 survey 2010 survey 2009 survey
Voluntary redundancies 0 0 0
Compulsory redundancies 0 10 05
Dismissedleft involuntarily (including death in service)
07 09 14
Fixed-short-term contracts 0 0 07
Retired 0 04 07
Left voluntarily 66 84 90
Base 154 (2011)
Table 23 Median labour turnover rates by industry sector ()
cipd
cou
k2011resou
rcing
and
talentp
lann
ing
survey
Sector All leavers Voluntary leavers
2011 survey
2010 survey
2009 survey
2011 survey
2010 survey
2009 survey
Manufacturing and production 93 (38) 124 (44) 153 (80) 37 (35) 27 (42) 77 (75)
Private sector services 138 (96) 146 (77) 168 (150) 87 (82) 74 (71) 104 (129)
Public services 85 (28) 86 (19) 126 (52) 34 (10) 58 (15) 76 (45)
Voluntary community not-for-profit 131 (11) 159 (15) 164 (38) 70 (24) 102 (18) 110 (35) Number of respondents shown in brackets
decreasing employee turnover loss of talent and
recruitment and training costs while having a
positive impact on motivation job satisfaction and
the employer brand
Only two-fifths (42) of organisations
experienced no difficulties in retaining staff
during 2010 This figure is similar to last year
(45) but higher than the findings for 2008
when 31 reported they had no retention
difficulties These findings reflect the increased
caution of employees regarding leaving their
jobs during times of economic uncertainty and
high unemployment Supporting this are our
findings that the public (49) and not-for-profit
sectors (49) are more likely to report they had
no difficulties in retaining staff during 2010
compared with the private sector (38)
As in previous years organisations most
commonly have difficulty retaining managers
and professionalsspecialists (Table 24) The
manufacturing and production sector are most
likely to report difficulties retaining technical
2011 staff and the private services sector that they have
most difficulty retaining services staff This may
reflect the higher demand for these categories of
employees in these sectors
While most organisations have taken one or more
steps to address staff retention nearly one in four
organisations (23) report that no specific retention
initiatives were undertaken This is a similar
proportion to last year although substantially higher
than in previous years when retention difficulties
were more common due to a tighter labour market
(Table 25) Public sector organisations are twice
as likely not to have taken any steps to address
retention as those in the private or not for-profit
sectors (39 compared with 20 of private sector
and 16 of not-for-profits)28
The most common methods used to address
retention in 2010 used by nearly two-fifths of
organisations are to improve line managersrsquo
people skills improve learning and development
opportunities and improve the induction process
Improving line managersrsquo people skills and
learning and development opportunities are also
most commonly rated among the top three most
effective retention methods The effectiveness of
improving induction processes is more varied with
22 rating it among the top three most effective
methods and 12 among the top three least
effective methods Views are also mixed regarding
the effectiveness of improved pay It is likely that
employees are motivated by different factors
Employers need to provide a healthy working
environment where employees are treated with
respect and make efforts to match their retention
initiatives with what staff want
Table 24 Retention difficulties by occupational category ()
Voluntary community
Private and All Manufacturing sector Public not-for- All
2011 and production services services profit 2010
Managers and professionals specialists 28 26 29 25 29 27
Technical 21 37 19 17 13 20
Services (customer personal protective and sales) 13 7 21 4 4 12
Administrative secretarial 9 5 8 15 13 7
Senior managersdirectors 7 5 8 10 6 9
Manualcraft workers 6 11 6 3 4 4 Base 601 (2011) 451 (2010)
RESO
UR
CIN
G A
ND
TALE
NT P
LAN
NIN
G 2
011
31
32
RESOURCING AND TALENT PLANNING
Table 25 Steps taken specifically to address staff retention ()
Used in Least Most Used in Used in Used in 2010 effective effective 2009 2008 2007
Improved line managers people skills 39 7 31 42 39 37
Increased learning and development opportunities 38 5 34 35 47 46
Improved induction process 38 12 22 31 45 45
Improved employee involvement 34 8 24 32 35 29
Improved selection techniques 30 7 25 31 42 46
Improved pay 27 11 23 22 42 53
Offered coachingmentoring buddy systems 24 8 14 20 24 22
Improved benefits 21 8 14 19 32 36
Better promotion to employees of the employer brand 18 10 5 15 21 16
Created clearer career paths 18 6 2 21 18 17
Revised the way staff are rewarded so their efforts are 18 4 13 14 19 19 better recognised
Made changes to improve workndash life balance 17 5 13 19 31 30
Improved physical working conditions 15 8 7 13 19 12
Redesigned jobs to make them more satisfying 11 4 8 13 18 14
Increased our use of countershyoffers 4 4 14
No specific initiatives undertaken 23 3 1 27 13 9 Base 559 (2011 survey) 431 (2010 survey) 695 (2009 survey) 710 (2008 survey)
new item added in 2011
cipd
cou
k2011resou
rcing
and
talentp
lann
ing
survey
RESO
UR
CIN
G A
ND
TALE
NT P
LAN
NIN
G 2
011
33
2011
CONCLUSIONS
Looking forward In January 2010 the UK officially emerged from
the longest recession since the 1930s Economic
growth however remains sluggish and the public
sector has embarked on a four-year programme of
the biggest government spending cuts in decades
to address the fiscal deficit
In the labour market unemployment remained
high throughout 2010 Figures from the Office
for National Statistics (ONS) show that UK
unemployment rose by 27000 in the three months
to the end of January 2011 to 253 million the
highest since 1994 While recent months have seen
signs of improvement there are concerns that the
slow growth in the private sector will be unable
to fully compensate for the increasing job losses in
the public sector that will result from the budget
cuts This is supported by the findings from the
CIPDrsquos spring 2011 Labour Market Outlook which
shows the impact on the overall labour market of a
slight rise in private sector recruitment is still being
cancelled out by large-scale public sector job losses
The findings of the CIPDrsquos 2011 Resourcing and
Talent Planning survey reflect the challenges
of the economic environment Organisations
generally have increased their focus on costs On
average organisations spent less on filling each
vacancy and a fifth have reduced their resourcing
budgets and talent management spend In the
public sector the focus on costs and budget
reductions was particularly apparent
The end of the recession has meant fewer
redundancies in 2010 Nevertheless over a third
of public sector and one-fifth of private sector
organisations reduced their headcount The
number of vacancies on offer by organisations
remained as low as in 2009 overall and continued
to decrease in very large organisations particularly
in the public sector
Looking forward private sector growth is expected
to remain slow and the full impact of public
sector budget cuts is still to come Resourcing and
talent management budgets will be further hit
in 2011ndash12 and many public sector organisations
will implement recruitment freezes and reduce
graduate intake and recruitment generally
Resourcing and talent practices are changing to
reflect the stronger focus on costs and reductions
in budgets Particularly in the public sector but
also in the private sector trends indicate a greater
focus on developing talent in-house retaining
rather than recruiting talent and reducing reliance
on recruitment agencies and external consultants
for resourcing and development
Our findings do not present a positive outlook
for the vast number of unemployed A substantial
proportion of organisations reports that the
already low number of vacancies available to them
is likely to be further affected by the abolition
of the Default Retirement Age Yet despite the
high unemployment rate most organisations
reported difficulties in filling vacancies mostly due
to skill shortages We have also seen an increase
in the proportion of organisations reporting
that competition for talent is even greater as the
pool of available talent to hire has fallen sharply
For many organisations there appears a clear
mismatch between the skills they require and
those available in the labour market Some are
concerned this will be exacerbated by the increase
in university tuition fees Some are responding
cipd
cou
k2011resou
rcing
and
talentp
lann
ing
survey
34
RESOURCING AND TALENT PLANNING
by increasing apprenticeship schemes internships
and sponsoring students through university Such
schemes may be aided by the Governmentrsquos recently
announced pound60 million commitment to help boost
youth employment and provide extra support for
apprenticeships and changes to vocational training
and education How far this will go towards meeting
organisationsrsquo skill requirements remains to be seen
On a positive note our findings indicate that talent
management is viewed as more not less important
in difficult times although with reduced budgets
organisations will have to be innovative with
their approach and strategies In order to survive
organisations will need to make certain they focus
beyond the cost-cutting required in the current
environment to ensuring their talent strategies are
aligned to long-term business success
The CIPDrsquos Shaping the Future and Next Generation
HR flagship projects have both explored the
important issues of sustainability Shaping the Future
in particular warns against the dangers of lsquotalent
tunnel visionrsquo taking a short-sighted view on talent
strategies which are solely focused on the needs of
the here and now
Often organisations pay too little attention to
identifying and developing the capabilities that
individuals will need in the long term This implies a
leadershiptalent management capability gap with
too much focus on the operational needs of today
rather than the organisational imperatives
of tomorrow
Itrsquos never too late to start equipping your people
with the skills and knowledge they need to meet
both present and future challenges So what practical
recommendations can we make for resourcing and
talent professionals drawn from our Shaping the
Future evidence
Audit your organisationrsquos current skills and future capabilities If you havenrsquot done so already conduct a thorough
inventory of your organisationrsquos current skills and map
those against the capabilities you are likely to need
in the future Hold forecasting sessions which look at
macro and micro trends how these will impact your
way of working and the changes that will be required
for future success
Build your talent and succession pipeline You also need to be proactively building up your
talent pipelines (horizontally and vertically) so that
you are developing people with future-fit skills and
capabilities A silver lining from the current economic
climate is that more organisations are focusing on
developing internal talent and fully utilising the
skills of their existing workforce Fresh talent is
still important but recruitment strategies should
complement internal pipelines
Maintain a continuous focus on capability-building Capability-building should be part of a continuous
process embedded into policies and practices Across
our case study organisations managers talked about the
need to embed development and skills training as part
of business as usual rather than as a one-off activity
Develop a creative approach to skills and capability development Even when budgets are tight it is essential that
staff get the development they need to ensure they
have the capabilities for their current job role as well
as starting to build those that the organisation will
need in the future Our case study organisations were
focusing strongly on knowledge-sharing enabling
people to learn from others across the organisation
Many of you are already considering alternative
solutions for specialist skill development such as
apprenticeships internal management schemes
summer placements and internships It is also
important to work with universities to ensure that
graduates are developing skills and knowledge which
will help them to succeed in the workplace
RESO
UR
CIN
G A
ND
TALE
NT P
LAN
NIN
G 2
011
35
2011
BACkGROUND TO ThE SURVEy
This survey was conducted in March and April 2011 It was sent to a sample of UK-based HR professionals in the public private and voluntary sectors In total 626 people responded to the survey
This is the fifteenth annual CIPD Resourcing
and Talent Planning survey (formerly known as
the CIPDrsquos Recruitment Retention and Turnover
survey) The survey examines organisationsrsquo
resourcing and talent planning strategies and
practices and the key challenges and issues
they face The survey consists of 45 questions
completed through an online self-completion
questionnaire
The majority of questions remain the same as
previous years to provide useful benchmark
data on topics including recruitment practices
difficulties and costs selection methods diversity
strategies the impact of the economic climate on
resourcing and talent planning practices labour
turnover and retention strategies New question
areas this year examine the employment of
younger workers the length of the recruitment
process the nature of job vacancies relationships
with recruitment partners and the use of
strengths-based approaches to recruitment
A small number of respondents took part in follow-
up telephone interviews to produce mini case
studies on a selection of topics These are presented
in the coloured boxes throughout the report
Sample profile Respondents predominantly work for private
sector organisations with professional services
being particularly well represented but other
sectors are represented in similar proportions to
last year (Table A1)
36
RESOURCING AND TALENT PLANNING
Table A1 Breakdown of respondent organisations by industrial sector Number of respondents
Manufacturing and production 113 19
Agriculture and forestry 1 0
Chemicals oils and pharmaceuticals 9 1
Construction 8 1
Electricity gas and water 4 1
Engineering electronics and metals 38 6
Food drink and tobacco 18 3
General manufacturing 6 1
Mining and quarrying 4 1
Paper and printing 6 1
Textiles 2 0
Other manufacturingproduction 17 3
Private sector services 319 52
Professional services (accountancy advertising consultancy legal etc) 78 13
Finance insurance and real estate 33 5
Hotels catering and leisure 26 4
IT services 26 4
Call centres 3 0
Media (broadcasting and publishing etc) 7 1
Retail and wholesale 40 7
Transport distribution and storage 23 4
Communications 6 1
Other private services 77 13
Public services 100 16
Central government 14 2
Education 12 2
Health 23 4
Local government 22 4
Other public services 29 5
Non-profit organisations 78 13
Care services 9 1
Charity services 32 5
Housing association 17 3
Other voluntary 20 3 Base 610
cipd
cou
k2011resou
rcing
and
talentp
lann
ing
survey
2011 Most respondents work in small to medium-sized
organisations in terms of the number of UK-
based employees but larger organisations are
also represented in similar proportions to last year
(Table A2)
Respondents reported on organisations based
across the UK Three in ten responded for the
whole of the UK while others responded for a
particular regioncountry (see Table A3)
Table A2 Breakdown of sample by organisation size ndash permanent employees in the UK
Fewer than 10 5
10ndash49 12
50ndash249 33
250ndash999 25
1000ndash4999 12
More than 5000 13 Base 610
Table A3 Main region covered by the reply
East Anglia 5
East Midlands 3
West Midlands 5
North-east of England 3
North-west of England 7
South-west of England 6
Yorkshire and Humberside 5
South-east of England (excluding London)
12
London 12
Scotland 6
Wales 3
Northern Ireland 3
Ireland 0
Whole of UK 29 Base 602
Labour turnover A total of 175 survey respondents were able to
supply all the information necessary for us to
calculate labour turnover on a whole-organisation
basis
This report uses the standard lsquocrude wastagersquo
method to calculate the rate of turnover This
method is calculated as follows
Labour turnover =
Number of leavers in a set period
______________________________________ x 100
Average number employed in the same period
(Leavers include those leaving the organisation
by way of voluntary or involuntary severance
redundancies or retirements but does not include
internal transfers)
Readers should be aware that this method has
some shortcomings For example it takes no
account of the characteristics of the workforce or
the length of service of the leaver
Note on statistics and figures used Some respondents did not answer all questions so
where percentages are reported in tables or figures
the respondent lsquobasersquo for that question is given
lsquoAveragersquo in the report is used to refer to the
statistical mean where the data is normally
distributed However the median is used in cases
where the distribution is significantly skewed
When the median is used it is noted
With the exception of labour turnover rates all
figures in tables have been rounded to the nearest
percentage point Due to rounding percentages
may not always total 100
Chi-square (χ2) tests are used to examine whether
differences between groups such as industrial
sectors are significant or likely to be due to
chance Spearmanrsquos Rho correlation (Rho) is used
to examine relationships between variables We
report on statistics at the generally accepted level
of significance plt005
RESO
UR
CIN
G A
ND
TALE
NT P
LAN
NIN
G 2
011
37
38
RESOURCING AND TALENT PLANNING
fURThER SOURCES Of INfORmATION
We produce a range of free factsheets surveys
guides and research reports which are available on
the CIPD website at cipdcoukhrresources
Read our factsheets on Employer Brand
Employee Turnover and Retention
Induction
Outlook series Our quarterly reports Labour Market Outlook
and Employee Outlook look at the employer and
employee perspectives on the labour market and
on workplace issues and trends while HR Outlook
explores priorities and emerging trends for the HR
profession and function
View these reports at
cipdcoukresearchoutlook-series
Talent management Two reports look at talent issues in a recession
difficult economic climate
The War on Talent Talent management under
threat in uncertain times (2009)
Fighting Back through Talent Innovation (2010)
Opening up Talent for Business Success (2010)
looks at the importance of integrating talent
management and diversity
The Talent Perspective What does it feel like to
be talent-managed (2010) looks at the employee
view of talent management
Workforce planning Our guide Workforce Planning Right people right
time right skills (2010) gives advice on developing
workforce planning processes
Diversity Two survey reports and a guide provide practical
advice and information on trends
Diversity in Business A focus for progress (2007)
Managing an Ageing Workforce How employers
are adapting to an older labour market (2010)
Managing Age New edition 2011
Two further reports are available to order from
cipdcoukbookstore
Managing Diversity in Practice Supporting
business goals (2007)
Managing Diversity and the Business Case (2008)
Sign up to receive our e-newsletter at
cipdcoukcipdupdate
cipd
cou
k2011resou
rcing
and
talentp
lann
ing
survey
RESO
UR
CIN
G A
ND
TALE
NT P
LAN
NIN
G 2
011
39
2011
ACkNOwLEDGEmENTS
The CIPD is very grateful to those organisations and
individuals who gave their time to take part in this
research They include
bull Annette Sinclair Senior Researcher at Roffey
Park for analysing the findings and writing this
comprehensive report
bull Members of the Recruitment Forum Steering
Committee for their input into the survey
design and assistance in piloting the
questionnaire
bull Hays for their support and commitment at
every stage of the research
bull All those who shared examples of their
organisationrsquos practices
We hope that you find the research useful when
considering your own recruitment and retention
practices Please contact us if you have any
questions or ideas based on our findings
(researchcipdcouk)
RESOURCING AND TALENT PLANNING
fOOTNOTES 1 Chi Square = 573 df = 5 p lt 0001 n = 604 2 Rho = 073 p lt 0001 n = 577 3 Rho = 045 p lt 0001 n = 533 4 F = 250 df = 2 p lt 0001 n = 533 5 Chi Square = 180 df = 6 p lt 001 n = 535 6 Chi Square = 71 df = 2 p lt 005 n = 603 7 Chi Square = 230 df = 6 p lt 001 n = 600 8 Chi Square = 91 df = 3 p lt 005 n = 598 9 Chi Square = 129 df = 4 p lt 005 n = 610
10 Rho = 034 p lt 0001 n = 609 11 Chi square = 217 df = 3 p lt 0001 n = 609 12 Chi Square = 609 df = 8 p lt 0001 n = 607 13 Chi Square = 208 df = 3 p lt 0001 n = 560 14 Size of organisation and developing online
careers site Rho = 025 p lt 0001 n = 599 Size of
organisation and employee surveys Rho = 019
p lt 0001 n = 599 15 Chi Square = 167 df = 2 p lt 0001 n = 599
16 Working with charities Chi Square = 80 df = 2 p
lt 005 n = 599 corporate sponsorship Chi Square
= 116 df = 2 p lt 001 n = 599 17 Chi Square = 76 df = 2 p lt 005 n = 599 18 Table 11 also shows that this method is deemed
most effective by public sector organisations but
this effect is due to a greater proportion of
large public sector organisations in our
sample whereas private sector organisations are
more evenly distributed in size 19 Chi square = 109 df = 2 p lt 001 n = 610 20 Chi Square = 279 df = 4 p lt 0001 n = 610 21 Chi Square = 259 df = 6 p lt 0001 n = 598 22 Chi Square = 515 df = 6 p lt 0001 n = 597 22 Chi Square = 177 df = 8 p lt 005 n = 600 22 Chi Square = 339 df = 4 p lt 0001 n = 610 22 Chi Square = 820 df = 4 p lt 0001 n = 610 22 Chi Square = 522 df = 8 p lt 0001 n = 610 22 Rho = 024 p lt 0001 n = 195 22 Chi Square = 166 df = 2 p lt 0001 n = 544
cipd
cou
k2011resou
rcing
and
talentp
lann
ing
survey
40
2011
OTHER TITLES IN THIS SERIES
ABSENCE MANAGEMENT The annual Absence Management survey has been running for eleven years providing useful benchmarking data on absence levels the cost and causes of absence and how organisations are managing absence The latest report is brought to you in partnership with Simplyhealth
EMPLOYEE ATTITUDES TO PAY The annual Employee Attitudes to Pay survey investigates employee attitudes and expectations towards pay and bonuses Now in its third year this survey is carried out by YouGov and focuses on employees in the UK
REWARD MANAGEMENT The annual Reward Management survey has been running for ten years and provides practical insights into current trends practices and issues affecting reward management in the UK It examines strategic reward base and variable pay bonuses incentives pensions reward measurement and total reward issues This report was brought to you in partnership with Benefex
LEARNING AND TALENT DEvELOPMENT The annual Learning and Talent Development survey is now in its thirteenth year and provides valuable commentary on current and future issues and trends It explores employer support for learning talent management employee skills managing and evaluating coaching and training spend
Issu
ed J
une
2011
Ref
eren
ce 5
552
copy C
hart
ered
Inst
itute
of
Pers
onne
l and
Dev
elop
men
t 20
11
Chartered Institute of Personnel and Development
151 The Broadway London SW19 1JQ
Tel 020 8612 6200 Fax 020 8612 6201
Email cipdcipdcouk Website cipdcouk
Incorporated by Royal Charter Registered charity no1079797

cipd
cou
k2011resou
rcing
and
talentp
lann
ing
survey
2
RESOURCING AND TALENT PLANNING
fOREwORD
Welcome to the fifteenth edition of our annual
Resourcing and Talent Planning survey report As
in previous years we provide useful benchmarking
data for organisations on resourcing trends costs
and turnover This year we have included new topical
sections ndash which we hope you will find useful ndash
examining the employment of younger workers the
length of the recruitment process the nature of job
vacancies relationships with recruitment partners and
the use of strengths-based approaches to recruitment
The headlines from this yearrsquos findings are that
recruitment activity remains low yet organisations
are experiencing recruitment difficulties in spite of
more people in the labour market The top reason
for the recruitment difficulties is a lack of necessary
specialist or technical skills
Strategies employed by some to try to fill
skills shortages include increasing their use of
apprenticeships interns and considering sponsoring
students through universities Employers however
need to think more holistically and long term when
it comes to skills shortages such as linking up with
educational establishments to ensure the curriculum
is preparing students well for the world of work and
developing their internal talent pipelines around
skills shortage areas
We feature a case study in this report from the
Association of Greater Manchester Authorities
(AGMA) This real-life example helps to bring the
findings to life and provide some practical evidence
of how organisations are reconfiguring their
resourcing and talent strategies for maximum effect
in difficult times
Claire McCartney
Adviser Resourcing and Talent Planning
CIPD
Despite continued high unemployment many
UK organisations continue to face difficulties
in attracting professionals with the right skills
and experience Hays has observed an increasing
tendency for organisations regardless of size or
sector to become more rigid with regards to the
people they wish to recruit Employers are less
likely to compromise than they have been in the
past and will delay recruitment until they find
someone with exactly the right skills qualifications
and experience At the same time job roles are
becoming increasingly niche which only adds to the
recruitment difficulties employers face today
This research suggests these problems look set to
continue and will only get worse long term due to
the rising number of young people not in training
education or employment if organisations fail to
address underlying problems Added to this many
of the challenges that organisations have always
faced still remain current such as a shortage of
professionals with specialist or technical skills and
the poor image associated with certain professions
This highlights the need for UK organisations to
invest in designing a creative resourcing and talent
attraction strategy now more than ever before
Julie Waddicor
Managing Director Hays Human Resources the
leading recruiting expert
RESO
UR
CIN
G A
ND
TALE
NT P
LAN
NIN
G 2
011
3
2011
ABOUT US Chartered Institute of Personnel and Development
The Chartered Institute of Personnel and
Development (CIPD) is Europersquos largest HR and
development professional body As a globally
recognised brand with over 135000 members we
pride ourselves on supporting and developing those
responsible for the management and development of
people within organisations
Our aim is to drive sustained organisation
performance through HR shaping thinking leading
practice and building HR capability within the
profession Our topical research and public policy
activities set the vision provide a voice for the
profession and promote new and improved HR and
management practices
We know what good HR looks like and what HR
professionals need to know do and deliver at
different stages of their career be they specialists or
generalists working in the UK or internationally
We offer
bull membership
bull professional development including
qualifications and training
bull networking opportunities and world-class
events
bull expertise in HR capability-building and
consultancy services
bull topical insights and analysis
bull a wealth of resources and a voice for HR
cipdcouk
Hays
Hays is the worldrsquos leading recruiting expert in
qualified professional and skilled work It employs
over 7000 staff in 257 offices across 30 countries Last
year Hays placed around 50000 people in permanent
jobs and nearly 180000 in temporary positions
Hays works across 17 specialist areas from healthcare
to telecoms banking to construction and education
to IT It operates across the private public and not-forshy
profit sectors
Its recruiting experts deal with 150000 CVs every
month and more than 50000 live jobs globally at any
one time The depth and breadth of their expertise
ensures that Hays understand the impact the right
individual can have on a business and how the right
job can transform a personrsquos life
wwwhayscouk
cipd
cou
k2011resou
rcing
and
talentp
lann
ing
survey
4
RESOURCING AND TALENT PLANNING
SUmmARy Of kEy fINDINGS
The CIPDrsquos 2011 Resourcing and Talent Planning survey report produced in partnership with Hays contains valuable information on current and emerging trends in people resourcing practice This annual benchmarking survey is based on 626 respondent organisations from the UK The survey examines organisationsrsquo resourcing and talent planning strategies and practices and the key challenges and issues they face New question areas this year examine the employment of younger workers the length of the recruitment process the nature of job vacancies relationships with recruitment partners and the use of strengths-based approaches to recruitment
Resourcing strategies and objectives bull Just over half of survey participants report
having a formal resourcing strategy
bull Larger organisations are most likely to have a
resourcing strategy
The number and nature of vacancies bull On average the number of vacancies
organisations attempted to fill in 2010 remains
as low as in 2009 during the recession
bull The number of vacancies in very large
organisations particularly in the public sector
has dramatically reduced over the past three
years
bull Three-quarters of permanent vacancies were
filled with external candidates
bull Three-fifths of organisations require candidates
to have specific sector experience
bull Twice as many public sector organisations
(48) expect they will recruit fewer people as
a consequence of the abolition of the Default
Retirement Age (23 overall)
Graduate recruitment bull Two-fifths of organisations are concerned that
the increase in university tuition fees will have
an impact on the number of graduates in the
marketplace
bull One in ten organisations are considering
sponsoring students through university (20
of manufacturing and production) 22
increasing their use of internships and 30
increasing apprenticeship schemes (48 of
manufacturing and production)
bull Just over a quarter of organisations operate a
structured graduate recruitment programme
(35 of manufacturing and production)
bull Few organisations have closed graduate
recruitment programmes over the past
12 months however half of public sector
organisations had reduced their intake (50
compared with 20 in the private and not-forshy
profit sectors)
RESO
UR
CIN
G A
ND
TALE
NT P
LAN
NIN
G 2
011
5
2011 Recruitment difficulties bull One in three organisations report the length of
their recruitment process has led to the loss of
potential recruits
bull Three-quarters of organisations experienced
recruitment difficulties in the past few months
bull Managers and professionals and technical
positions are the most difficult vacancies to fill
bull As in previous years the main reason for
recruitment difficulties is a lack of necessary
specialist or technical skills
bull Nearly three-quarters of organisations had made
efforts to improve their employee brand over
the last year most commonly through employee
surveys and developing online career sites
Attracting and selecting candidates bull While the effectiveness of methods to attract
applicants varies according to organisation sector
and size the most effective method overall
is reported to be through organisationsrsquo own
corporate websites as was the case last year
bull The private sector particularly manufacturing
and production organisations are three times
more likely than public sector organisations to
include recruitment agencies among their most
effective methods for attracting candidates
bull Overall a third of organisations report they
have reduced their use of recruitment partners
however one in five report they have formed
a closer business partnership with them over
the past year and one in ten that they consider
them integral to attracting top talent
bull Competency-based interviews (70) interviews
following the contents of CVsapplication forms
(63) and structured interviews (56) are as
last year the most common methods used to
select applicants
bull Two-fifths of organisations report they use
a strengths-based approach to recruitment
although it is less commonly used in the public
sector (26)
bull The median recruitment cost of filling a vacancy
is pound7500 for senior managersdirectors and pound2500
for other employees (adjusting for accuracy)
showing reductions compared with last year
Resourcing in turbulent times bull Half of the organisations surveyed report the
economic climate has had a negative impact
on their organisationsrsquo resourcing budgets for
2011ndash12 This year it is the public sector that is
most severely hit with four out of five (82)
reporting their resourcing budgets will be
reduced (up from 59 last year)
bull Changes in resourcing and talent practices in
2011 compared with 2010 reflect a stronger
focus on costs and reductions in budgets More
organisations anticipate they will be focusing
on developing talent in-house retaining rather
than recruiting talent and reducing their
reliance on recruitment agencies and external
consultants for resourcing and development
bull Nearly half of public sector organisations will
be implementing a recruitment freeze in 2011
compared with one-fifth of organisations
overall Two-thirds of public sector
organisations and 29 of private organisations
will be reducing the number of new recruits
they hire
bull The volume of applicants for vacancies has
increased reflecting the high unemployment
rate Three-quarters of organisations have
noticed an increase in the number of
unsuitable applicants and a third report that
there are too many suitable candidates to
choose from Despite high unemployment
over the last two years more than half (52)
believe that competition for talent is even
greater as the pool of available talent to hire
has fallen sharply (2010 41 2009 20)
bull Most organisations remain focused on
managing talent despite increased attention
on reducing costs with only 4 reporting
that their focus on talent has decreased
Nevertheless 18 of organisations (32 of the
public sector) have reduced their overall talent
management spend as a consequence of the
economic downturn
cipd
cou
k2011resou
rcing
and
talentp
lann
ing
survey
6
RESOURCING AND TALENT PLANNING
Diversity bull Overall in little change from previous years
just over half of organisations have a diversity
strategy rising to 90 of public sector
organisations
bull Our figures indicate a reduction in the use of
several methods to address diversity issues this
year particularly in the public sector which has
traditionally led the way in diversity practice
Labour turnover bull The median labour turnover rate has decreased
over the past few years (2011 125 2010
135 2009 157 2008 173)
bull Smaller organisations are most likely to report
that their labour turnover has increased and
larger organisations that it has decreased
bull As in previous years the majority of turnover
is attributed to employees leaving voluntarily
The rate of voluntary leavers has increased
slightly in the private sector compared with last
year but decreased in the voluntary and public
services sector reflecting the growthcuts in the
respective sectors
bull The proportion of organisations making ten
or more redundancies over the past year has
reduced from 33 in 2009 to 12 in 2010
Employee retention bull Only two-fifths (42) of organisations
experienced no difficulties in retaining staff
during 2010 a similar figure to the previous
year Managers and professionalsspecialists and
technical employees remain the most difficult
categories of staff to retain
bull Most organisations have taken one or more
steps to address staff retention however nearly
one in four organisations (a similar proportion
to the previous year) report that no specific
retention initiatives were undertaken in 2010
bull The most frequently cited actions taken by
employers to address retention ndash improving
the people management skills of line managers
and increased learning and development
opportunities ndash are the methods most
commonly rated most effective Improving the
induction process is also commonly used to
address retention but views on its effectiveness
are more mixed
2011
1 RECRUITING EmPLOyEES
This section explores trends and developments in recruitment strategies and activity within UK organisations during 2010 It examines the adoption of formal resourcing strategies changes in the number of job vacancies organisations attempted to fill the extent and nature of recruitment difficulties over the past year and the strategies employers use to overcome these challenges It also includes developments in graduate recruitment the most effective approaches for attracting applicants and the methods used for selection For the first time we explore the nature of job vacancies the length of the recruitment process the employment of younger workers changing relationships with recruitment partners and efforts to improve the employer brand Finally the costs associated with recruitment are discussed
Resourcing strategies Just over half of respondents surveyed report their
organisation has a formal resourcing strategy
in place a similar proportion to last year (2011
Table 1 Organisations with formal resourcing strategies in place by size ()
Size ndash number of employees in UK 54 2010 56 2009 58) The likelihood of
organisations having a formal strategy in place
increases with organisational size as was the case
last year (Table 1)1 There are no significant sector
differences
Fewer than 10 26
10ndash49 38
50ndash249 46
250ndash999 55
1000ndash4999 68
More than 5000 85
RESO
UR
CIN
G A
ND
TALE
NT P
LAN
NIN
G 2
011
Base 604
7
8
RESOURCING AND TALENT PLANNING
The number and nature of job vacancies There is considerable variation in the number
of vacancies respondentsrsquo organisations tried
to fill in 2010 partly because the number of
vacancies is strongly related to organisation size
(Table 2)2 Overall the median number of vacancies
has fallen from 30 in 2008 to 20 over the past two
years as the recession affected increasing numbers
of organisations (Table 2)
While there is no overall change from last year
in the median number of vacancies organisations
tried to fill there has been a substantial fall in the
proportion of vacancies very large organisations
(5000+ UK employees) attempted to fill from
a median of 550 in 2009 to 200 in 2010 (800 in
2008) The reduction in vacancies in very large
organisations is striking in the private and public
sectors but particularly in the latter where
the median number of vacancies organisations
attempted to fill in 2010 was less than a third than
in 2009 This reflects the sluggish growth in the
private sector and in particular the significant
cuts in public sector budgets
Table 2 Median number of vacancies respondents tried to fill by size of organisation and sector
2011 survey 2010 survey 2009 survey
No of permanent staff employed in UK All Private
sector Public
services All Private sector
Public services All Private
sector Public
services
Median Median Median Median Median Median Median Median Median
1ndash49 3 3 1 3 3 2
50ndash249 12 12 10 12 10 14 10 10 8
250ndash999 45 50 30 46 45 50 60 52 70
1000ndash4999 110 150 55 100 100 100 300 300 300
More than 5000 200 500 150 550 850 500 800 800 550
All organisations 20 20 30 20 20 80 30 20 100 Base 577 (2011) 442 (2010) 683 (2009)
The categories for number of permanent staff employed in the UK differed slightly in the 2009 survey (250 or fewer 251ndash500
501ndash1000 1001ndash5000 5001ndash10000 10001+) 2009 categories have been combined where appropriate and otherwise matched with
the best corresponding category of 20112010
cipd
cou
k2011resou
rcing
and
talentp
lann
ing
survey
2011 Overall nearly three-quarters (73) of permanent
vacancies were filled with external candidates
Larger organisations with a wide range of
talent to choose from are more likely to recruit
internally than smaller organisations3 Public sector
organisations particularly those with more than
1000 UK employees are more likely to recruit
internally than the private sector (Table 3)4
Organisations are divided in their use of temporary
contracts More than a quarter (28) have
employed more people on temporary contracts
in 2010 compared with the previous year while
a similar proportion (27) have employed fewer
people on temporary contracts (45 remain
the same) Manufacturing and production
organisations are most likely to have increased
their use of temporary contracts and the public
services the least perhaps reflecting their reduced
recruitment generally (Figure 1)5
Table 3 Average percentage of job vacancies filled internally
Voluntary No of permanent staff community and not-employed in UK Private sector Public services for-profit All
Mean Mean Mean Mean
1ndash49 15 17 7 13
50ndash249 20 28 23 21
250ndash999 24 29 24 24
1000ndash4999 35 58 12 39
More than 5000 47 62 33 53
All organisations 25 45 19 27 Base 533
figure 1 Use of temporary contracts by sector in 2010 compared with the previous year ()
Manufacturing and production
Private sector services
Public services
Voluntary community and not-for-profit
More Same Less
Base 610
25
27
37
22
3837
50
32
50
23
31
28
RESO
UR
CIN
G A
ND
TALE
NT P
LAN
NIN
G 2
011
9
10
RESOURCING AND TALENT PLANNING
Sector-specific experience is an essential
requirement of candidates in three-fifths (60) of
organisations overall While our figures suggest
it is less commonly required in the public sector
(48 compared with 59 of the voluntary
community and not-for-profit sector and 63
of the private sector)6 there are also substantial
differences within sectors For example specific
sector experience is essential for the majority
of organisations operating in the chemical
construction or mining industries and professional
services but not for those in general manufacturing
or retail and wholesale Similarly within the public
sector it is deemed particularly essential for health
and education organisations but less so for those in
central or local government
Employing younger workers Figures from the Office for National Statistics
show that while total unemployment fell during
the three months to February 2011 youth
unemployment rose to a record level of almost 1
million equating to one in five economically active
16ndash24-year-olds out of work Moreover concerns
have been raised as to whether high youth
unemployment will be further compounded by the
abolition of the Default Retirement Age later this
year and the increase in university tuition fees This
year we included new questions in the survey to
explore these issues
One in six organisations (17) report they are
employing more 16ndash24-year-olds compared with
one year ago this compares with less than one
in eight (12) who are employing fewer young
people (72 are employing the same number) The
employment of younger workers has reduced most
in the public sector where one in four reports a
decrease compared with one in ten who reports an
increase (Table 4)7 This is likely to reflect a general
reduction in recruitment in this sector
Overall one-quarter of organisations expect the
abolition of the Default Retirement Age will mean
they recruit fewer people however the figure
rises to nearly half of public sector organisations
It does not appear however that the abolition of
the Default Retirement Age will have a particular
impact on the recruitment of young people with
only one in ten organisations reporting it will result
in fewer 16ndash24-year-olds being recruited (Table 4)
cipd
cou
k2011resou
rcing
and
talentp
lann
ing
survey
Table 4 The employment of younger workers ()
Voluntary Manufacturing community
All and Private sector and respondents production services Public services not-for-profit
Percentage employing fewer 16ndash24-year-olds than one year ago
Percentage agreeing the abolition of the Default Retirement Age means they will recruit fewer 16ndash24-year-olds
Percentage agreeing the abolition of the Default Retirement Age means they will recruit fewer people
12 10 9 25 10
11 18 6 17 9
23 25 15 48 22
Base 605
2011 Graduate recruitment Two-fifths of organisations (39) are concerned
that the increase in university tuition fees will
have an impact on the number of graduates in
the marketplace Public sector organisations are
particularly concerned (49 compared with 34
of private sector services 42 of not-for-profits
and 43 of manufacturing and production
organisations)8
Perhaps in order to address this deficit or in
response to additional government support to
boost apprenticeship schemes a third of public
sector organisations nearly half of manufacturing
and production and about a quarter of private
sector services and not-for-profit organisations
are considering increasing apprenticeship schemes
(Table 5) About a quarter of organisations overall
are considering increasing their use of internships
although the proportion is markedly lower in the
public sector Overall one in ten organisations are
considering sponsoring students through university
but the proportion doubles in manufacturing and
production where the lack of appropriate skills is
a common cause of recruitment difficulties (Table
5 see also Tables 8 and 9) Larger organisations are
also more likely to consider sponsoring students
through university (19 of those with more than
5000 employees)9
Overall just over a quarter of organisations
operate a structured graduate recruitment
programme (Table 6) The operation of
these programmes is significantly related to
organisation size (Figure 2)10 They also appear
to be most common in the manufacturing
and production sector as last year when a
step increase in their use was noted (Table 6)
It appears that this sector is investing in the
development of skills to address their deficit
in the workforce generally As in previous
years voluntary community and not-for-profit
organisations are least likely to operate a
structured graduate recruitment programme11
Table 5 Activities organisations are considering ()
Voluntary Manufacturing community
All and Private sector and respondents production services Public services not-for-profit
Increasing apprenticeship schemes 30 48 24 33 27
Increasing your use of internships 22 27 23 12 27
Sponsoring students through university 10 20 8 12 1
Base 615
Table 6 Organisations operating a structured graduate recruitment programme by sector ()
2011 2010 2009 2008
All 27 34 22 23
Sector
Manufacturing and production 35 35 23 24
Private sector services 29 37 24 27
Voluntary community and not-for-profit 6 18 5 7
Public services 26 33 23 24
RESO
UR
CIN
G A
ND
TALE
NT P
LAN
NIN
G 2
011
Base 614 (2011) 472 (2010) 752 (2009)
11
cipd
cou
k2011resou
rcing
and
talentp
lann
ing
survey
12
RESOURCING AND TALENT PLANNING
The majority of respondents from organisations
without a recruitment programme for graduates
report that their organisation has never had such
a programme or not had one for some time (97)
Even in the cash-strapped public sector only 3
report they have closed their graduate recruitment
programme in the last 12 months
Nearly a third (31) of organisations who have a
graduate recruitment programme have increased
their intake over the past year while a quarter
have reduced their intake (24) This shows an
improvement on the previous year at the height of
the recession when 43 had reduced their intake
The impact of the budget cuts in the public sector
are however clearly apparent as more than twice
as many organisations in this sector (50 compared
with 20 in the private and not-for-profit sectors)
have reduced their graduate intake
Length of recruitment process One in three (31) organisations report that the
length of their recruitment process has led to the
loss of potential recruits This issue appears to be
exacerbated by organisation size Nearly half of
organisations with more than 5000 employees
report that the length of their recruitment process
has led to the loss of potential recruits compared
with 38 of those in organisations of 250ndash999
employees and just 15 of organisations with
fewer than 50 employees12 There are no significant
sector differences
Recruitment difficulties Three-quarters of organisations with vacancies
report difficulties in filling at least some over the
past few months (75) This is an increase on last
year (2010 68) and may reflect the decrease in
unemployment in the first few months of 2011
It is less however than in previous years perhaps
because organisations were attempting to fill fewer
vacancies (2009 81 2008 86)
figure 2 Organisations operating a structured graduate recruitment programme by size ()
Number of UK employees
39
42
9Fewer than 50
17
1650ndash249
21
29 250ndash999
1000ndash4999 47
61 More than 5000
62
10 40 50 60 70 80
2011
0 3020 Percentage
2010
Base 609 (2011) 466 (2010)
2011 The private sector particularly manufacturing and
production organisations are most likely to have
difficulties filling vacancies (Table 7)13 Table 8
shows that over half of organisations in this sector
have difficulty filling technical vacancies and this
may reflect specific skills shortages in the UK The
most difficult category of staff to recruit in other
sectors is managers and professionalsspecialists
as was the case last year In general there is little
change in the categories of vacancies that are most
difficult to recruit for compared with last year
As would be expected given the cuts to
public sector budgets one in ten public sector
organisations report they did not have any
vacancies to fill twice as many as last year There is
little change in this regard in the other sectors
Table 9 shows the reasons respondents cite for their
recruitment difficulties The findings are similar
to previous years Lack of necessary specialist or
technical skills remains by far the most frequently
cited cause of difficulties reported by nearly
three-quarters of respondents (2011 72 2010
67 2009 73 2008 70) This is particularly
an issue for the manufacturing and production
sector and the public services sector where there
is a particularly high demand for such skills Lack
of formal qualifications is far less of an issue
These findings support arguments for greater
collaboration between industry and academic
institutions and more vocational training in order
to meet organisationsrsquo skill requirements
Higher pay expectations than the organisation
could offer and lack of experience are the next
most frequently cited causes of recruitment
problems (46 and 40 respectively) Interestingly
these are less of an issue in the public sector
perhaps because public sector applicants have
different expectations of pay or because some pay
scales are set at a national level Lack of experience
may be less of an issue than the necessary skills or
qualifications required in many public sector roles
The proportion reporting their recruitment
problems are due to potential candidatesrsquo
reluctance to move in the current economic climate
has decreased from just over a quarter in 2010 to
19 this year Economic growth albeit slow is
likely to be responsible for this reduction but the
lsquohangoverrsquo of the recession is highlighted as one in
five organisations still blame the economic climate
for their recruitment problems Despite high
unemployment 15 of respondents report they
have experienced problems due to no applicants In
line with last yearrsquos findings this is particularly an
issue for the public sector (22) which is also more
likely to report the image of their sectoroccupation
is a problem (22)
Table 7 Organisations experiencing difficulties recruiting for one or more category of vacancy by organisation size ( of those that have had vacancies to fill)
Voluntary Manufacturing community
and Private sector and All 2011 production services Public services not-for-profit
Difficulty filling one or 75 88 77 66 62more vacancies
No difficulties experienced 25 12 23 34 38
Base 561
RESO
UR
CIN
G A
ND
TALE
NT P
LAN
NIN
G 2
011
13
14
RESOURCING AND TALENT PLANNING
Table 8 Categories of vacancy that proved particularly difficult to fill ( of respondents)
Voluntary community
Manufacturing Private and and sector Public not-for-
All 2011 production services services profit All 2010
Other managers and professionalsspecialists
34 41 33 27 34 37
Technical 30 53 29 20 16 28
Senior managers directors
14 13 16 10 16 16
Services (customer personal protective 7 6 8 3 5 5 and sales)
Administrative secretarial
4 3 4 4 4 3
Manualcraft workers 4 11 3 1 0 2
Other 6 5 3 10 11 4
No difficulties experienced
23 12 22 30 38 25
No vacancies to fill 6 3 7 10 1 6 Base 597 (2011) 468 (2010)
Voluntary community
Manufacturing Private and All and sector Public not-for- All
2011 production services services profit 2010
Table 9 Reasons for recruitment difficulties ()
cipd
cou
k2011resou
rcing
and
talentp
lann
ing
survey
Lack of necessary specialist or technical skills 72 82 69 80 59 67
Look for more pay than you could offer 46 47 48 34 52 39
Lack of experience 40 42 43 27 41 36
Reluctance to move in current economic climate 19 24 18 17 15 26
Lack of interpersonal skills 16 9 19 10 20 12
No applicants 15 9 16 22 20 15
Image of sector occupationorganisation 13 7 12 22 11 12
Relocation difficulties 9 19 6 10 7 8
Lack of formal qualifications 7 7 7 5 7 4
The impact of the immigration cap 3 2 4 3 4
Other 4 3 3 8 7 7
Base 427 (2011) 330 (2010)
new item introduced in 2011
2011 Improving the employer brand Nearly three-quarters of organisations have made
efforts to improve their employer brand over the
past year (Table 10) The larger the organisation
the more likely it is to have undertaken one or
more activities to improve its brand Two-fifths of
small organisations with fewer than 50 employees
report they have taken no action to improve their
employer brand compared with one-quarter of
organisations with 250ndash999 employees and one-
sixth of those with more than 5000 employees
There are no significant sector differences
The most popular approaches to improving
employer brand are employee surveys and
developing online careers sites with larger
organisations most likely to have adopted these
methods14 The public sector is most likely to
have introduced or extended flexible working
homeworking15 whereas the private sector is
more likely to have made efforts to improve its
brand through working with charities or corporate
sponsorship16 Voluntary community and not-forshy
profit organisations are most likely to have used
placement students to improve their brand17
Attracting candidates The effectiveness of methods to attract applicants
varies according to sector and organisation size
(Table 11) Overall the most effective method is
through organisationsrsquo own corporate websites
as was the case last year The effectiveness of this
method increases with organisation size probably
due to the increased brand awareness and
perhaps because larger organisations have more
advanced websites18
The private sector particularly manufacturing
and production organisations is three times
more likely than public sector organisations to
report recruitment agencies among their most
effective methods and twice as likely as voluntary
sector organisations (regardless of size) Search
consultants and employee referral schemes are also
notably more popular in the private sector than in
the public or voluntary sectors
In contrast the public and voluntary sectors are
more likely to find the press effective for attracting
applicants including local and national newspaper
advertisements and specialist journalstrade press
Secondments are also deemed to be more effective
in these sectors than in the private sector
Table 10 Work undertaken over last year to improve employer brand ()
Voluntary community
All Private Public and 2011 sector services not-for-profit
Employee surveys 39 39 38 43
Developing online careers site 30 33 23 29
Introducingextending flexible working homeworking 24 20 39 29
Placement students 23 21 19 35
Graduate careers fairs 15 17 11 8
Working with charities 14 16 8 6
Corporate sponsorship 11 13 2 8
Introducing sabbaticals 3 4 1 5
Other 7 6 6 10
No action taken to improve employer brand 27 28 29 22
RESO
UR
CIN
G A
ND
TALE
NT P
LAN
NIN
G 2
011
Base 601
15
16
RESOURCING AND TALENT PLANNING
Table 11 Most effective methods for attracting applications by industry sector ()
Sector 2011 Number of UK employees 2011
All
2010
All
2011
Man
ufa
ctu
rin
gan
d p
rod
uct
ion
Priv
ate
sect
or
serv
ices
Pub
lic s
ervi
ces
Vo
lun
tary
co
mm
un
ity
and
no
t-fo
r-p
rofi
t
1ndash49
50ndash2
49
250ndash
999
100
0ndash4
999
Mo
re t
han
500
0
Own corporate website 63 59 44 57 77 66 42 55 57 77 79
Recruitment agencies 60 54 77 62 22 30 39 59 66 51 41
Local newspaper advertisements 36 32 38 23 41 51 28 35 35 29 29
Employee referral scheme 35 29 33 38 5 14 20 33 27 32 29
Commercial job boards 33 27 33 29 14 29 21 27 25 42 26
Specialist journalstrade press 31 27 24 23 30 43 26 23 32 32 24
Encourage speculative applicationsword of mouth 24 25 30 29 9 23 27 31 23 19 19
Jobcentre Plus 23 25 24 24 22 34 16 29 21 25 32
Professional networking (such as LinkedIn) 14 16 11 23 5 9 28 13 13 18 17
Search consultants 22 15 24 17 5 4 14 11 17 18 15
Links with schoolscollegesuniversities 18 13 16 13 9 17 12 13 11 18 15
Apprenticeships 12 11 19 9 13 9 10 10 11 12 17
National newspaper advertisements 16 11 4 6 23 29 10 9 15 10 15
Secondments 11 11 7 8 21 12 2 9 13 11 19
Links with other local organisations making redundancies 7 13 5 7 9 6 5 9 11 8
Alumni (previous employees) 5 5 6 7 2 1 7 2 6 11 3
Social networking sites (such as Facebook) 3 4 4 5 3 4 3 2 2 8 12
Local Employment Partnership (LEP) 6 3 1 4 2 5 1 2 3 4 9
Other 5 5 2 3 12 6 8 3 4 4 5
cipd
cou
k2011resou
rcing
and
talentp
lann
ing
survey
Base 604 (2011) 464 (2010)
new item introduced in 2011
Despite the popularity of social networking
sites such as Facebook they are not seen to be
particularly effective for attracting candidates
Professional networking sites such as LinkedIn are
more popular particularly in the private services
sector although there has only been a small
percentage increase in their reported effectiveness
compared with last year
2011 Recruitment partners A new question this year asked respondents if their
attitude to and relationships with recruitment
partners has changed over the past 12 months Just
over a third report things have not changed
(Table 12) A similar proportion report they have
reduced their use of recruitment partners and 6
that they have stopped using them altogether
with one in ten considering them an unaffordable
expense (one in five in the not-for-profit sector)
and a similar proportion an unnecessary expense
In contrast one in five (predominantly private
sector organisations) report they have formed
a closer business partnership with recruitment
partners over the past year and one in ten (again
predominantly private sector organisations) report
they consider them integral to attracting top talent
Selecting candidates There has been little change in the methods used
to select candidates over the past few years with
the exception of a drop in the use of general
ability tests compared with 2009 (Table 13)
Interviews remain the most common selection
method with competency-based interviews
being most popular overall Interviews following
the contents of CVsapplication forms are also
particularly popular in the private sector (70
compared with 41 in the public sector and 57
in the not-for-profit sector) whereas the public
and not-for-profit sectors favour structured (panel)
interviews (82 and 79 respectively compared
with 45 in the private sector)
Tests for specific job-related skills are more popular
in the public and not-for-profit sectors (61 and
62 respectively compared with 43 in the private
sector) whereas telephone interviews are more
popular in the private sector (52 compared with
12 in the public sector and 26 in the not-forshy
profit sector)
Table 12 Changes in attitudes to and relationships with recruitment partners over the past 12 months ()
Voluntary community
All Private Public and 2011 sector services not-for-profit
Not changed 36 34 40 39
Reduced use of recruitment partners 32 34 32 26
Formed a closer business partnership with them 19 23 8 12
Consider them an unnecessary expense 12 11 13 16
Consider them an unaffordable expense 11 10 11 22
Consider them integral to attracting top talent 9 11 2 4
Stopped using recruitment partners 6 5 8 5
Other 3 3 3 3 Base 604
RESO
UR
CIN
G A
ND
TALE
NT P
LAN
NIN
G 2
011
17
18
RESOURCING AND TALENT PLANNING
Table 13 Methods used to select applicants ()
2011 2010 2009 survey survey survey
Competency-based interviews 70 78 69
Interviews following contents of CVapplication form 63 64 68
Structured interviews (panel) 56 61 59
Tests for specific job-related skills 49 48 50
Telephone interviews 43 47 38
Literacy andor numeracy tests 38 43 39
Personalityaptitudepsychometric questionnaires 35 44 35
Assessment centres 35 42 35
Pre-application eliminationprogression question(s) 25 32 NA
General ability tests 23 27 44
Group exercises (for example role-playing) 21 30 26
Pre-interview references (academic or employment) 9 16 19
Video CVs 0 1 NA
Other 3 4 6
cipd
cou
k2011resou
rcing
and
talentp
lann
ing
survey
Base 605 (2011) 473 (2010) 754 (2009)
Strengths-based recruitment Two-fifths of organisations (40) report they use a
strengths-based approach to recruitment although
it is less commonly used in the public sector (26)19
In all sectors smaller organisations are most likely
to report they use a strengths-based approach
(60 of organisations with 1ndash49 employees use it
compared with 34 of organisations with 250ndash999
employees and 24 of organisations with more
than 5000 employees)20
Most of those who use a strengths-based approach
to recruitment are neutral about how easy it is to
administer in practice regardless of sector or size
Nearly a third (32) find it easy or very easy and
only one in ten (11) find it difficult
Over three-quarters of those who use a strengths-
based approach to recruitment believe it
brings benefits in terms of increased individual
performance (78) Two-thirds believe it improves
retention (67) and increases engagement (63)
Two-fifths (39) report it results in greater diversity
of skills in the workplace
Many organisations that use a strengths-based
approach to recruitment also use a strengths-based
approach for other people processes More than
half use it for performance management processes
(59) succession planning (55) and learning and
development (53) Two-fifths use it for talent
management (42) and a third use it for workforce
planning (32) Just under three in ten (29) also
use it for redeployment
Recruitment costs Last year we noted an increase in the proportion
of organisations that calculate their recruitment
costs (2010 65 2009 53 2008 51) This year
the proportion is back in line with previous years
(52) The increase last year may have been due
to sampling differences or a consequence of an
increased focus on costs during the recession that
has not continued
Four-fifths (79) of organisations that calculate
recruitment costs provided cost estimates per
hire There is considerable variance in the amount
organisations spend (at least partly due to our
2011 findings that organisations include different costs
in their calculations see Table 14) In general
the median figures (Table 15) are lower than last
year for both senior managerdirectors and other
employees
In order to explore the validity of estimates this
year we also asked respondents to indicate how
accurate their cost estimates were Half (51) of
estimates for costs of recruiting senior managers
directors were accurate to plus or minus 10 and
83 to plus or minus 20 Two-fifths of estimates
for other employees were accurate to plus or minus
10 and 74 to plus or minus 20 Table 16
shows the median figures for estimates that were
believed to be accurate to up to plus or minus 20
The figures indicate as we found last year that
organisations spend considerably more on senior
appointments than on other employees This
reflects the value attached to good leadership and
perhaps the additional challenges of attracting
the best candidates for senior positions This is
particularly the case in the private sector where
considerably more is spent on the recruitment of
senior managersdirectors than in the public or not-
for-profit sectors
Table 14 Criteria included in cost per hire calculations ()
Size ndash number of employees in UK
Advertising costs
Agencysearch costs
Employee referrals
Travel expenses
Relocation expenses
Fixed costs of resourcing team
Opportunity costs of hiring managers time
Other
Dont know Base 299
81
75
35
30
17
24
24
3
4
Table 15 Estimated total costs (advertising costs agency or search fees) per hire (pound)
Median 2011 Median 2010 (no of (no of
Occupational group respondents) Minimum Maximum respondents)
Senior managersdirectors 7000 (219) 251 55000 8333 (234)
Other employees 2000 (246) 150 32000 2930 (262) Number of respondents shown in brackets
Table 16 Median total costs (advertising costs agency or search fees) per hire for estimates accurate to plus or minus 20 (pound)
Voluntary
Median 2011 Manufacturing
and Private Public
community and not-for-
Occupational group production sector services profit
RESO
UR
CIN
G A
ND
TALE
NT P
LAN
NIN
G 2
011
Senior managersdirectors 7500 8000 9000 5000 3500
Other employees 2500 3400 2000 3000 1500 Base 150
19
cipd
cou
k2011resou
rcing
and
talentp
lann
ing
survey
20
RESOURCING AND TALENT PLANNING
2 RESOURCING AND TALENT mANAGEmENT IN TURBULENT TImES
In January 2010 the UK officially emerged from the recession however the economic environment remains uncertain for many organisations The environmental disasters in Japan the uprisings and wars in the Middle East rising oil prices and European debt highlight the volatility of global markets In the UK economic growth remains sluggish and there are concerns regarding the impact of the VAT increases high inflation and the austerity measures of the Coalition Government This section examines the impact of the economic environment on resourcing budgets strategies and activities in 2010 It looks at changes in views on the employment market and the implications for managing talent
The impact of the economic climate on resourcing Overall half of organisations report that the
economic climate has had a negative impact on
their organisationsrsquo resourcing budgets for 2011ndash12
(Table 17) This year however it is the public
sector that is most severely hit with four-fifths
(82) reporting their resourcing budgets will be
reduced (up from 59 last year) In contrast fewer
private and not-for-profit sector organisations
face reductions this year compared with last
although more are still reducing their budgets than
increasing them
Changes in resourcing and talent practices in
2011 compared with 2010 reflect a stronger
focus on costs and reductions in budgets (Figure
3) Two-thirds plan to develop more talent inshy
house (compared with one-third in 2010) and
more organisations plan to reduce reliance on
recruitment agencies and external consultants for
resourcing and development The proportion of
organisations planning to focus more on retaining
rather than recruiting talent has increased to 51
in 2011 from 28 in 2010
2011 Changes in recruitment practices are also
anticipated More organisations plan to make use
of new mediatechnology to recruit which may
be a cost-cutting strategy but can also improve
the efficiency and effectiveness of the recruitment
process On a positive note more organisations plan
to invest more time and effort in the quality of
candidates they hire and will be taking actions to
improve ways of identifying quality candidates
Public sector organisations are more than twice
as likely to be implementing a recruitment freeze
in 2011 (46 compared with 22 overall)
Nevertheless this is an improvement on 2010 when
58 of public sector organisations implemented a
recruitment freeze The situation is also somewhat
brighter for many private sector organisations
with 15 reporting they will be implementing a
recruitment freeze in 2011 compared with 26
in 2010 Nevertheless the economic recovery
remains slow for many with 29 of private
sector organisations and 66 of public sector
organisations reporting they will be reducing the
number of new recruits they hire in 2011 similar
proportions to 2010 Inevitably more public than
private sector organisations report they will be
reducing their headcount in 2011 and losing key
talent (33 compared with 9 in the private
sector) and redeploying people into new roles (66
compared with 37 in the private sector)
Table 17 Impact of the current economic climate on organisationsrsquo resourcing budgets ()
Private Public Voluntary community All sector services and not-for-profit
2011 2010 2011 2010 2011 2010 2011 2010
Reduced 49 53 41 51 82 59 51 61
Stayed about the same 36 37 39 40 14 36 40 34
Increased 8 7 11 4 1 5 4 5
Dont know 7 3 8 5 3 5 Base 615 (2011) 475 (2010)
RESO
UR
CIN
G A
ND
TALE
NT P
LAN
NIN
G 2
011
21
cipd
cou
k2011resou
rcing
and
talentp
lann
ing
survey
22
RESOURCING AND TALENT PLANNING
figure 3 Resourcing and talent practices implemented in 2011 and 2010 ( of respondents)
Developing more talent in-house
Continuing to recruit key talentniche areas
Focusing more on retaining rather than recruiting talent
Reducing reliance on recruitment agencies
Use of new mediatechnology to recruit
Investing more time and effort in the quality of candidates we hire
Redeploying people into new roles
Reducing the number of new recruits we hire
Taking actions to improve ways of identifying quality candidates
Increasing the number of interimcontract staff recruited
Reducing our use of external consultants for resourcing and development
Increased recruitment of apprenticesinterns
Implementing a recruitment freeze
Reducing our headcount but preserving key talent
Recruiting talent discarded by competitors
Reducing our headcount and losing key talent
Offering sabbaticals career breaks additional holidays
Reducing employees working hours to avoid making people redundant
8Reducing graduate recruitment 8
6Suspending graduate recruitment 7
36
28
36
28
26
30
35 35
35 15
29 23
28 19
24 12
22 30
22 16
18 11
13 12 12
10
12 10
66
59 46
51
47
46
45
44
0 10 20 30 40 50 60 70 80 Percentage of respondents
2011 2010
Base 582
RESO
UR
CIN
G A
ND
TALE
NT P
LAN
NIN
G 2
011
23
2011 Views on the employment market In little change to last year three-quarters of
organisations report they have noticed an increase
in the number of unsuitable applicants as they have
fewer roles to fill (Figure 4) Far fewer (34) report
that there are too many suitable candidates to
choose from and despite high unemployment over
the past two years more than half (52) believe that
competition for talent is even greater as the pool of
available talent to hire has fallen sharply (2010 41
2009 20) For many organisations there appears a
clear mismatch between the skills they require and
those available in the labour market
Competition for talent appears to be particularly
keen in the private sector Two-thirds (64) of
manufacturing and production organisations
and 55 of private services organisations agree
that competition for talent is even greater now
compared with 39 of the public sector and 34
of not-for-profits21 In contrast the public sector
and not-for-profits are more likely to agree they
have too many suitable candidates to choose
from (61 and 47 respectively compared with
23 of manufacturing and production and 27
of private sector services)22
Three-fifths (62) of respondents agree that the
demand for temporary and contract workers will
increase as employers will be reluctant to take
on permanent staff during uncertain times while
44 agree that part-time workers will become
more appealing to employers who are looking to
cut costs
figure 4 Views on the employment market ( agreeing or strongly agreeing)
With fewer roles to fill we have noticed an increase in the number
of unsuitable applicants
The demand for temporary and contract workers will increase as employers will be reluctant to
take on permanent staff during uncertain times
Employers will use the economic downturn as an opportunity to get rid of poor performers
and bring about culture change
Competition for talent is even greater now as the pool of available talent to hire has
fallen sharply
Part-time workers will become more appealing to employers who are looking to cut costs
Employers are acting too hastily in making people redundant and as a result they will lose too
many employees with valuable knowledge and skills
With fewer roles to fill there are now too many suitable candidates to choose between
The abolition of the Default Retirement Age will mean we recruit fewer people
Employers will look to make older workers over the age of 65 redundant before their younger workers
73 76
54
62 66 66
55 63
72
52 41
20
44 45
52
44 48
53
34 32
23
19 22
27
0 10 20 30 40 50 60 70 80 Percentage of respondents
2011 2010 2009
Base 607 (2011) 475 (2010) 746 (2009)
item added 20102011
24
RESOURCING AND TALENT PLANNING
More than half of respondents (55) across
all sectors believe that employers will use the
economic downturn as an opportunity to get rid of
poor performers and bring about culture change
While high this shows a downward trend on the
past two years (2010 63 2009 72 agree or
strongly agree) perhaps reflecting a slowing in
the number of redundancies Similarly there is
a gradual downward trend in the proportion of
respondents who express concern that employers
are acting too hastily in making people redundant
and as a result they will lose too many employees
with valuable knowledge and skills or that
employers will look to make older workers over the
age of 65 redundant before their younger workers
Nearly a quarter (23) of respondents believe
that the abolition of the Default Retirement Age
will mean they recruit fewer people (48 in the
public sector)23
Implications for talent management The value of effective talent management has
not been lost in the recent attention on reducing
costs Two-fifths (41) of organisations report
that the current economic situation has led
to an increased focus on talent management
(43 in 2010) and only 4 that it has led to a
decreased focus (7 in 2010) with no significant
differences across sectors Unsurprisingly however
the public sector are about twice as likely this
year to report they have reduced their overall
talent management spend due to the downturn
compared with other sectors (Table 18)24
The proportion of organisations that report
the economic downturn has had an impact on
approaches to reward across the business has
slightly reduced compared with last year (54
compared with 61 in 2010) As last year it
appears that organisations across all sectors
are being more selective in who they reward A
smaller proportion of organisations report their
approach to reward for individuals identified as
talent has been affected by the downturn (42)
than report their approach to reward across the
business has been affected (54)
Table 18 Has your overall talent management spend been reduced due to the economic downturn ()
cipd
cou
k2011resou
rcing
and
talentp
lann
ing
survey
Voluntary All community and All
2011 Private sector Public sector not-for-profit 2010
Yes 18 17 32 13 23
No 38 43 16 32 41
NA (no talent management spend) 44 40 52 55 36
Base 617 (2011) 471 (2010)
RESO
UR
CIN
G A
ND
TALE
NT P
LAN
NIN
G 2
011
25
2011
Case study Innovative recruitment and cost saving in the Association of Greater Manchester Authorities
The Association of Greater Manchester Authorities (AGMA) represents the ten local authorities in
Greater Manchester and works in partnership with a wider group of associate councils and public
sector organisations AGMA chief executives and council leaders work together on a range of key
strategic and policy issues which impact on Greater Manchester including resourcing strategies
and recruitment and retention issues
The AGMA initiative in cost reduction in the area of resourcing has been described as lsquoa truly
pioneering example of collaboration between a number of local authoritiesrsquo and is already
delivering against a range of objectives
The initial aim was to make a significant saving on the pound5ndash6 million annual cost of external
media advertising reported in 2008ndash09 and to create a more efficient and effective recruitment
system A shared portal was commissioned to offer a front-end website (wwwyourcounciljobs
couk) with a lsquoback-officersquo e-recruitment system which would give a standardised shared-service
approach for job applicants across councils Some of the benefits for applicants include the ability
to go to one place to register their interest to be able to look in specific categories for jobs
of particular relevance to them to be able to amend an existing application form in order to
apply for a further post and to receive email alerts when new jobs relevant to their interests are
posted In addition communications to job-seekers are now standardised for every council
This approach has seen real benefits across each of the local authorities workflows are now
standardised as every HR team runs identical systems and there is consistency in reporting within
all councils enabling them to benchmark their processes more clearly The councils use this
benchmarking data to make additional improvements and efficiencies
Jayne Whitehead AGMA Category Procurement Manager has project-managed the initiative
with managers represented from each participating authority and describes the process as one
of lsquotrue collaborationrsquo with lsquo100 commitmentrsquo from all the councils involved The benefits
are clear annual media costs are dramatically reduced to approximately pound250000 across ten
partner organisations and there has been a reduction in time-to-hire of 13 days This has had
the knock-on effect of reducing expenditure on agency staff The average cost of a recruitment
advertisement per role was previously pound97400 it is now pound15200 There have also been benefits
outside the original intention including doubling the number of online applications for council
posts with administrative cost savings in HR of approximately pound250000 across the consortium
More than 61000 registered users are now on the system and the councils are successfully filling
their own talent pools of prospective job-seekers Overall the project team is now celebrating a
pound17 million reduction in recruitment expenditure over the past 12 months
(continued)
cipd
cou
k2011resou
rcing
and
talentp
lann
ing
survey
26
RESOURCING AND TALENT PLANNING
There were some challenges in the implementation of this new way of working All the councils
had to be convinced about the benefits of the changes With the implementation of a new IT
system having its own set of challenges the project has taken 12 months to introduce longer
than first anticipated Implementing the changes during a period of radical restructuring in all
councils also proved particularly challenging However Jayne describes how both the need to
make efficiencies and feedback from job-seekers meant that lsquowe had to find a different way of
doing thingsrsquo Jayne also recognises how the neutrality of her own role (each council pays a tenth
of her salary) has been essential in ensuring that the project has been fair to all its participants
offering a centralised shared resource to manage the project
The project is now set to develop yet further with the aim of becoming entirely self-funding
within the next year by accepting advertising from other organisations Two new websites are
planned for recruitment into schools and social care jobs bringing even less reliance on media
and agencies AGMA will also be further building its own talent pool
Jayne describes the initiative as lsquoa true example of what you can do if you collaborate across
authoritiesrsquo Not only the separate councils but also diverse teams and functions including HR IT
procurement communications and marketing have worked together to deliver this innovative
and inspiring project
Information provided by Jayne Whitehead AGMA Category Procurement Manager
2011
3 DIVERSITy
This section examines organisationsrsquo approaches to diversity including the use of formal diversity strategies and the methods used to address diversity issues
Just over half of organisations report they have with just under two-thirds of not-for-profit
a formal diversity strategy showing little change organisations and just two-fifths of private sector
over the past four years (2011 52 2010 55 companies (Table 19)25 Diversity strategies are also
2009 60 2008 55) Consistent with previous more common in larger organisations (regardless
yearsrsquo findings most public sector organisations of sector)26
(90) have a formal diversity strategy compared
Table 19 Does your organisation have a formal diversity strategy ()
Yes No Dont know
All 52 41 7
Sector
Private sector 41 50 8
Public services 90 9 1
Voluntary community and not-for-profit 63 33 4
Number of UK employees
Fewer than 50 45 50 5
50ndash249 43 51 6
250ndash999 48 44 7
1000ndash4999 65 31 4
More than 5000 80 9 11 Base 613
RESO
UR
CIN
G A
ND
TALE
NT P
LAN
NIN
G 2
011
27
28
RESOURCING AND TALENT PLANNING
As was the case last year over three-quarters
of organisations with a formal diversity policy
attempt to address diversity issues through
monitoring recruitment andor staffing
information to obtain data on gender ethnicity
disability age and so on (Table 20) Less than
three-fifths train interviewers to understand what
diversity is about and the impact of stereotypes
Other diversity-focused initiatives are even
less common moreover the figures indicate a
reduction in the use of several methods compared
with previous years The pressures of the recession
may have led to a reduced focus on diversity
Given the links between diversity in the workforce
and productivity organisations that fail to give
this issue the attention it requires may find
themselves at a disadvantage in the future
Traditionally the public sector has tended to lead
the way in terms of diversity practices Again this
year they are significantly more likely to address
diversity issues through monitoring recruitment
andor staffing information through providing
recruitment documents in other formats through
advertising vacancies in different sources to
attract under-represented groups and through
setting recruitment targets to correct a workforce
imbalance Nevertheless they are less likely than
other sectors to actively try to attract talent of all
ages (Table 20) Moreover our figures indicate that
the reduction in the use of several diversity methods
compared with previous years is particularly
pronounced in the public sector The change of
government and budget reduction measures have
led to significant change programmes in many
public sector organisations which may have resulted
in a reduced focus on diversity issues
Table 20 Methods used to address diversity issues in organisations ( with formal diversity strategy)
Voluntary community
Private Public and not-sector services for-profit
2011 2010 2009 2008 2011 2011 2011 survey survey survey survey (2010) (2010) (2010)
Monitoring recruitment andor staffing information to obtain data on gender 78 79 84 83 70 (71) 88 (96) 88 (76) ethnicity disability age any other categories
cipd
cou
k2011resou
rcing
and
talentp
lann
ing
survey
Training interviewers to understand what diversity is about and the impact of stereotypes
57 68 68 60 53 (66) 64 (73) 57 (72)
Actively trying to attract talent of all ages 45 53 32 43
Operating policies that go beyond basic legislative requirements on age gender race disability sexual orientation religion and belief
39 49 52 48 34 (44) 47 (63) 47 (40)
Providing recruitment documents in other 39 41 37 31 24 (22) 64 (77) 47 (52)formats (online large-print audio and so on)
Checking that any tests used are valid reliable and culture-free and were tested on diverse norm groups
36 42 47 34 39 (44) 35 (45) 27 (16)
Advertising vacancies in different sources to 31 37 51 48 22 (30) 44 (53) 41 (32)attract under-represented groups
Using specific imageswords in your recruitment advertising to appeal to a wider audience 29 38 42 42 25 (30) 36 (52) 33 (40)
Making attempts to employ the long-term 19 19 13 29unemployed
Setting recruitment targets to correct a workforce imbalance 9 15 14 12 4 (8) 18 (31) 8 (16)
Base 312 (2011) 253 (2010) 419 (2009) new item added in 2011
RESO
UR
CIN
G A
ND
TALE
NT P
LAN
NIN
G 2
011
29
2011
4 mANAGING LABOUR TURNOVER
Figures from the Office for National Statistics show that UK unemployment rose by 27000 in the three months to the end of January 2011 to 253 million the highest since 1994 When unemployment is high the number of employees leaving organisations voluntarily is expected to decrease Here we examine whether this is happening and how organisations are tackling the issue of employee retention
Among organisations that are able to supply
turnover data the median labour turnover rate
has decreased over the past few years (Table 21)
The median figure however hides differences
across organisations Slightly more organisations
report their turnover has increased in 2010
compared with 2009 (38) than has decreased
(33) while for nearly a third (29) it remained
the same Smaller organisations are more likely
to report their labour turnover has increased and
larger organisations that it has decreased27
As in previous years the majority of turnover (53)
is still attributed to employees leaving voluntarily
(Table 22) As the economy has improved the
median proportion of turnover due to redundancies
has reduced Only 12 of organisations that
provided reasons for leaving made more than ten
redundancies in the previous year compared with
33 in 2010 26 in 2009 and 22 in 2008 A third
(34) of organisations that made redundancies
offered career transition services
While median turnover rates have reduced
across all sectors Table 23 shows that the rate
of voluntary leavers has increased slightly in
the private sector compared with last year but
decreased in the voluntary and public services
sector This reflects improvements in the economic
outlook for the private sector and the widespread
cuts in the public sector which also have a direct
impact on many not-for-profit organisations that
provide services for the public sector
Cost of labour turnover While just over half of organisations calculate
their recruitment costs only 13 calculate the
cost of their labour turnover (2010 14) The
majority of organisations report they do not
calculate these costs (79) while 7 donrsquot know
if they are calculated or not
Nearly half (46) of those who calculate their
turnover costs want to maintain their current
turnover rate while one-fifth (38) want to
reduce turnover during 2011 and 15 want to
increase it
Retaining employees The steps organisations take to retain employees
in their workforce can have a significant impact
on organisational efficiency and success through
30
RESOURCING AND TALENT PLANNING
Table 21 Median rate of labour turnover ()
2011 2010 survey 2009 survey 2008 survey 2007 survey 2006 survey
125 135 157 173 181 183
Base 175 (2011)
Table 22 Median labour turnover rates by reason for leaving ()
2011 survey 2010 survey 2009 survey
Voluntary redundancies 0 0 0
Compulsory redundancies 0 10 05
Dismissedleft involuntarily (including death in service)
07 09 14
Fixed-short-term contracts 0 0 07
Retired 0 04 07
Left voluntarily 66 84 90
Base 154 (2011)
Table 23 Median labour turnover rates by industry sector ()
cipd
cou
k2011resou
rcing
and
talentp
lann
ing
survey
Sector All leavers Voluntary leavers
2011 survey
2010 survey
2009 survey
2011 survey
2010 survey
2009 survey
Manufacturing and production 93 (38) 124 (44) 153 (80) 37 (35) 27 (42) 77 (75)
Private sector services 138 (96) 146 (77) 168 (150) 87 (82) 74 (71) 104 (129)
Public services 85 (28) 86 (19) 126 (52) 34 (10) 58 (15) 76 (45)
Voluntary community not-for-profit 131 (11) 159 (15) 164 (38) 70 (24) 102 (18) 110 (35) Number of respondents shown in brackets
decreasing employee turnover loss of talent and
recruitment and training costs while having a
positive impact on motivation job satisfaction and
the employer brand
Only two-fifths (42) of organisations
experienced no difficulties in retaining staff
during 2010 This figure is similar to last year
(45) but higher than the findings for 2008
when 31 reported they had no retention
difficulties These findings reflect the increased
caution of employees regarding leaving their
jobs during times of economic uncertainty and
high unemployment Supporting this are our
findings that the public (49) and not-for-profit
sectors (49) are more likely to report they had
no difficulties in retaining staff during 2010
compared with the private sector (38)
As in previous years organisations most
commonly have difficulty retaining managers
and professionalsspecialists (Table 24) The
manufacturing and production sector are most
likely to report difficulties retaining technical
2011 staff and the private services sector that they have
most difficulty retaining services staff This may
reflect the higher demand for these categories of
employees in these sectors
While most organisations have taken one or more
steps to address staff retention nearly one in four
organisations (23) report that no specific retention
initiatives were undertaken This is a similar
proportion to last year although substantially higher
than in previous years when retention difficulties
were more common due to a tighter labour market
(Table 25) Public sector organisations are twice
as likely not to have taken any steps to address
retention as those in the private or not for-profit
sectors (39 compared with 20 of private sector
and 16 of not-for-profits)28
The most common methods used to address
retention in 2010 used by nearly two-fifths of
organisations are to improve line managersrsquo
people skills improve learning and development
opportunities and improve the induction process
Improving line managersrsquo people skills and
learning and development opportunities are also
most commonly rated among the top three most
effective retention methods The effectiveness of
improving induction processes is more varied with
22 rating it among the top three most effective
methods and 12 among the top three least
effective methods Views are also mixed regarding
the effectiveness of improved pay It is likely that
employees are motivated by different factors
Employers need to provide a healthy working
environment where employees are treated with
respect and make efforts to match their retention
initiatives with what staff want
Table 24 Retention difficulties by occupational category ()
Voluntary community
Private and All Manufacturing sector Public not-for- All
2011 and production services services profit 2010
Managers and professionals specialists 28 26 29 25 29 27
Technical 21 37 19 17 13 20
Services (customer personal protective and sales) 13 7 21 4 4 12
Administrative secretarial 9 5 8 15 13 7
Senior managersdirectors 7 5 8 10 6 9
Manualcraft workers 6 11 6 3 4 4 Base 601 (2011) 451 (2010)
RESO
UR
CIN
G A
ND
TALE
NT P
LAN
NIN
G 2
011
31
32
RESOURCING AND TALENT PLANNING
Table 25 Steps taken specifically to address staff retention ()
Used in Least Most Used in Used in Used in 2010 effective effective 2009 2008 2007
Improved line managers people skills 39 7 31 42 39 37
Increased learning and development opportunities 38 5 34 35 47 46
Improved induction process 38 12 22 31 45 45
Improved employee involvement 34 8 24 32 35 29
Improved selection techniques 30 7 25 31 42 46
Improved pay 27 11 23 22 42 53
Offered coachingmentoring buddy systems 24 8 14 20 24 22
Improved benefits 21 8 14 19 32 36
Better promotion to employees of the employer brand 18 10 5 15 21 16
Created clearer career paths 18 6 2 21 18 17
Revised the way staff are rewarded so their efforts are 18 4 13 14 19 19 better recognised
Made changes to improve workndash life balance 17 5 13 19 31 30
Improved physical working conditions 15 8 7 13 19 12
Redesigned jobs to make them more satisfying 11 4 8 13 18 14
Increased our use of countershyoffers 4 4 14
No specific initiatives undertaken 23 3 1 27 13 9 Base 559 (2011 survey) 431 (2010 survey) 695 (2009 survey) 710 (2008 survey)
new item added in 2011
cipd
cou
k2011resou
rcing
and
talentp
lann
ing
survey
RESO
UR
CIN
G A
ND
TALE
NT P
LAN
NIN
G 2
011
33
2011
CONCLUSIONS
Looking forward In January 2010 the UK officially emerged from
the longest recession since the 1930s Economic
growth however remains sluggish and the public
sector has embarked on a four-year programme of
the biggest government spending cuts in decades
to address the fiscal deficit
In the labour market unemployment remained
high throughout 2010 Figures from the Office
for National Statistics (ONS) show that UK
unemployment rose by 27000 in the three months
to the end of January 2011 to 253 million the
highest since 1994 While recent months have seen
signs of improvement there are concerns that the
slow growth in the private sector will be unable
to fully compensate for the increasing job losses in
the public sector that will result from the budget
cuts This is supported by the findings from the
CIPDrsquos spring 2011 Labour Market Outlook which
shows the impact on the overall labour market of a
slight rise in private sector recruitment is still being
cancelled out by large-scale public sector job losses
The findings of the CIPDrsquos 2011 Resourcing and
Talent Planning survey reflect the challenges
of the economic environment Organisations
generally have increased their focus on costs On
average organisations spent less on filling each
vacancy and a fifth have reduced their resourcing
budgets and talent management spend In the
public sector the focus on costs and budget
reductions was particularly apparent
The end of the recession has meant fewer
redundancies in 2010 Nevertheless over a third
of public sector and one-fifth of private sector
organisations reduced their headcount The
number of vacancies on offer by organisations
remained as low as in 2009 overall and continued
to decrease in very large organisations particularly
in the public sector
Looking forward private sector growth is expected
to remain slow and the full impact of public
sector budget cuts is still to come Resourcing and
talent management budgets will be further hit
in 2011ndash12 and many public sector organisations
will implement recruitment freezes and reduce
graduate intake and recruitment generally
Resourcing and talent practices are changing to
reflect the stronger focus on costs and reductions
in budgets Particularly in the public sector but
also in the private sector trends indicate a greater
focus on developing talent in-house retaining
rather than recruiting talent and reducing reliance
on recruitment agencies and external consultants
for resourcing and development
Our findings do not present a positive outlook
for the vast number of unemployed A substantial
proportion of organisations reports that the
already low number of vacancies available to them
is likely to be further affected by the abolition
of the Default Retirement Age Yet despite the
high unemployment rate most organisations
reported difficulties in filling vacancies mostly due
to skill shortages We have also seen an increase
in the proportion of organisations reporting
that competition for talent is even greater as the
pool of available talent to hire has fallen sharply
For many organisations there appears a clear
mismatch between the skills they require and
those available in the labour market Some are
concerned this will be exacerbated by the increase
in university tuition fees Some are responding
cipd
cou
k2011resou
rcing
and
talentp
lann
ing
survey
34
RESOURCING AND TALENT PLANNING
by increasing apprenticeship schemes internships
and sponsoring students through university Such
schemes may be aided by the Governmentrsquos recently
announced pound60 million commitment to help boost
youth employment and provide extra support for
apprenticeships and changes to vocational training
and education How far this will go towards meeting
organisationsrsquo skill requirements remains to be seen
On a positive note our findings indicate that talent
management is viewed as more not less important
in difficult times although with reduced budgets
organisations will have to be innovative with
their approach and strategies In order to survive
organisations will need to make certain they focus
beyond the cost-cutting required in the current
environment to ensuring their talent strategies are
aligned to long-term business success
The CIPDrsquos Shaping the Future and Next Generation
HR flagship projects have both explored the
important issues of sustainability Shaping the Future
in particular warns against the dangers of lsquotalent
tunnel visionrsquo taking a short-sighted view on talent
strategies which are solely focused on the needs of
the here and now
Often organisations pay too little attention to
identifying and developing the capabilities that
individuals will need in the long term This implies a
leadershiptalent management capability gap with
too much focus on the operational needs of today
rather than the organisational imperatives
of tomorrow
Itrsquos never too late to start equipping your people
with the skills and knowledge they need to meet
both present and future challenges So what practical
recommendations can we make for resourcing and
talent professionals drawn from our Shaping the
Future evidence
Audit your organisationrsquos current skills and future capabilities If you havenrsquot done so already conduct a thorough
inventory of your organisationrsquos current skills and map
those against the capabilities you are likely to need
in the future Hold forecasting sessions which look at
macro and micro trends how these will impact your
way of working and the changes that will be required
for future success
Build your talent and succession pipeline You also need to be proactively building up your
talent pipelines (horizontally and vertically) so that
you are developing people with future-fit skills and
capabilities A silver lining from the current economic
climate is that more organisations are focusing on
developing internal talent and fully utilising the
skills of their existing workforce Fresh talent is
still important but recruitment strategies should
complement internal pipelines
Maintain a continuous focus on capability-building Capability-building should be part of a continuous
process embedded into policies and practices Across
our case study organisations managers talked about the
need to embed development and skills training as part
of business as usual rather than as a one-off activity
Develop a creative approach to skills and capability development Even when budgets are tight it is essential that
staff get the development they need to ensure they
have the capabilities for their current job role as well
as starting to build those that the organisation will
need in the future Our case study organisations were
focusing strongly on knowledge-sharing enabling
people to learn from others across the organisation
Many of you are already considering alternative
solutions for specialist skill development such as
apprenticeships internal management schemes
summer placements and internships It is also
important to work with universities to ensure that
graduates are developing skills and knowledge which
will help them to succeed in the workplace
RESO
UR
CIN
G A
ND
TALE
NT P
LAN
NIN
G 2
011
35
2011
BACkGROUND TO ThE SURVEy
This survey was conducted in March and April 2011 It was sent to a sample of UK-based HR professionals in the public private and voluntary sectors In total 626 people responded to the survey
This is the fifteenth annual CIPD Resourcing
and Talent Planning survey (formerly known as
the CIPDrsquos Recruitment Retention and Turnover
survey) The survey examines organisationsrsquo
resourcing and talent planning strategies and
practices and the key challenges and issues
they face The survey consists of 45 questions
completed through an online self-completion
questionnaire
The majority of questions remain the same as
previous years to provide useful benchmark
data on topics including recruitment practices
difficulties and costs selection methods diversity
strategies the impact of the economic climate on
resourcing and talent planning practices labour
turnover and retention strategies New question
areas this year examine the employment of
younger workers the length of the recruitment
process the nature of job vacancies relationships
with recruitment partners and the use of
strengths-based approaches to recruitment
A small number of respondents took part in follow-
up telephone interviews to produce mini case
studies on a selection of topics These are presented
in the coloured boxes throughout the report
Sample profile Respondents predominantly work for private
sector organisations with professional services
being particularly well represented but other
sectors are represented in similar proportions to
last year (Table A1)
36
RESOURCING AND TALENT PLANNING
Table A1 Breakdown of respondent organisations by industrial sector Number of respondents
Manufacturing and production 113 19
Agriculture and forestry 1 0
Chemicals oils and pharmaceuticals 9 1
Construction 8 1
Electricity gas and water 4 1
Engineering electronics and metals 38 6
Food drink and tobacco 18 3
General manufacturing 6 1
Mining and quarrying 4 1
Paper and printing 6 1
Textiles 2 0
Other manufacturingproduction 17 3
Private sector services 319 52
Professional services (accountancy advertising consultancy legal etc) 78 13
Finance insurance and real estate 33 5
Hotels catering and leisure 26 4
IT services 26 4
Call centres 3 0
Media (broadcasting and publishing etc) 7 1
Retail and wholesale 40 7
Transport distribution and storage 23 4
Communications 6 1
Other private services 77 13
Public services 100 16
Central government 14 2
Education 12 2
Health 23 4
Local government 22 4
Other public services 29 5
Non-profit organisations 78 13
Care services 9 1
Charity services 32 5
Housing association 17 3
Other voluntary 20 3 Base 610
cipd
cou
k2011resou
rcing
and
talentp
lann
ing
survey
2011 Most respondents work in small to medium-sized
organisations in terms of the number of UK-
based employees but larger organisations are
also represented in similar proportions to last year
(Table A2)
Respondents reported on organisations based
across the UK Three in ten responded for the
whole of the UK while others responded for a
particular regioncountry (see Table A3)
Table A2 Breakdown of sample by organisation size ndash permanent employees in the UK
Fewer than 10 5
10ndash49 12
50ndash249 33
250ndash999 25
1000ndash4999 12
More than 5000 13 Base 610
Table A3 Main region covered by the reply
East Anglia 5
East Midlands 3
West Midlands 5
North-east of England 3
North-west of England 7
South-west of England 6
Yorkshire and Humberside 5
South-east of England (excluding London)
12
London 12
Scotland 6
Wales 3
Northern Ireland 3
Ireland 0
Whole of UK 29 Base 602
Labour turnover A total of 175 survey respondents were able to
supply all the information necessary for us to
calculate labour turnover on a whole-organisation
basis
This report uses the standard lsquocrude wastagersquo
method to calculate the rate of turnover This
method is calculated as follows
Labour turnover =
Number of leavers in a set period
______________________________________ x 100
Average number employed in the same period
(Leavers include those leaving the organisation
by way of voluntary or involuntary severance
redundancies or retirements but does not include
internal transfers)
Readers should be aware that this method has
some shortcomings For example it takes no
account of the characteristics of the workforce or
the length of service of the leaver
Note on statistics and figures used Some respondents did not answer all questions so
where percentages are reported in tables or figures
the respondent lsquobasersquo for that question is given
lsquoAveragersquo in the report is used to refer to the
statistical mean where the data is normally
distributed However the median is used in cases
where the distribution is significantly skewed
When the median is used it is noted
With the exception of labour turnover rates all
figures in tables have been rounded to the nearest
percentage point Due to rounding percentages
may not always total 100
Chi-square (χ2) tests are used to examine whether
differences between groups such as industrial
sectors are significant or likely to be due to
chance Spearmanrsquos Rho correlation (Rho) is used
to examine relationships between variables We
report on statistics at the generally accepted level
of significance plt005
RESO
UR
CIN
G A
ND
TALE
NT P
LAN
NIN
G 2
011
37
38
RESOURCING AND TALENT PLANNING
fURThER SOURCES Of INfORmATION
We produce a range of free factsheets surveys
guides and research reports which are available on
the CIPD website at cipdcoukhrresources
Read our factsheets on Employer Brand
Employee Turnover and Retention
Induction
Outlook series Our quarterly reports Labour Market Outlook
and Employee Outlook look at the employer and
employee perspectives on the labour market and
on workplace issues and trends while HR Outlook
explores priorities and emerging trends for the HR
profession and function
View these reports at
cipdcoukresearchoutlook-series
Talent management Two reports look at talent issues in a recession
difficult economic climate
The War on Talent Talent management under
threat in uncertain times (2009)
Fighting Back through Talent Innovation (2010)
Opening up Talent for Business Success (2010)
looks at the importance of integrating talent
management and diversity
The Talent Perspective What does it feel like to
be talent-managed (2010) looks at the employee
view of talent management
Workforce planning Our guide Workforce Planning Right people right
time right skills (2010) gives advice on developing
workforce planning processes
Diversity Two survey reports and a guide provide practical
advice and information on trends
Diversity in Business A focus for progress (2007)
Managing an Ageing Workforce How employers
are adapting to an older labour market (2010)
Managing Age New edition 2011
Two further reports are available to order from
cipdcoukbookstore
Managing Diversity in Practice Supporting
business goals (2007)
Managing Diversity and the Business Case (2008)
Sign up to receive our e-newsletter at
cipdcoukcipdupdate
cipd
cou
k2011resou
rcing
and
talentp
lann
ing
survey
RESO
UR
CIN
G A
ND
TALE
NT P
LAN
NIN
G 2
011
39
2011
ACkNOwLEDGEmENTS
The CIPD is very grateful to those organisations and
individuals who gave their time to take part in this
research They include
bull Annette Sinclair Senior Researcher at Roffey
Park for analysing the findings and writing this
comprehensive report
bull Members of the Recruitment Forum Steering
Committee for their input into the survey
design and assistance in piloting the
questionnaire
bull Hays for their support and commitment at
every stage of the research
bull All those who shared examples of their
organisationrsquos practices
We hope that you find the research useful when
considering your own recruitment and retention
practices Please contact us if you have any
questions or ideas based on our findings
(researchcipdcouk)
RESOURCING AND TALENT PLANNING
fOOTNOTES 1 Chi Square = 573 df = 5 p lt 0001 n = 604 2 Rho = 073 p lt 0001 n = 577 3 Rho = 045 p lt 0001 n = 533 4 F = 250 df = 2 p lt 0001 n = 533 5 Chi Square = 180 df = 6 p lt 001 n = 535 6 Chi Square = 71 df = 2 p lt 005 n = 603 7 Chi Square = 230 df = 6 p lt 001 n = 600 8 Chi Square = 91 df = 3 p lt 005 n = 598 9 Chi Square = 129 df = 4 p lt 005 n = 610
10 Rho = 034 p lt 0001 n = 609 11 Chi square = 217 df = 3 p lt 0001 n = 609 12 Chi Square = 609 df = 8 p lt 0001 n = 607 13 Chi Square = 208 df = 3 p lt 0001 n = 560 14 Size of organisation and developing online
careers site Rho = 025 p lt 0001 n = 599 Size of
organisation and employee surveys Rho = 019
p lt 0001 n = 599 15 Chi Square = 167 df = 2 p lt 0001 n = 599
16 Working with charities Chi Square = 80 df = 2 p
lt 005 n = 599 corporate sponsorship Chi Square
= 116 df = 2 p lt 001 n = 599 17 Chi Square = 76 df = 2 p lt 005 n = 599 18 Table 11 also shows that this method is deemed
most effective by public sector organisations but
this effect is due to a greater proportion of
large public sector organisations in our
sample whereas private sector organisations are
more evenly distributed in size 19 Chi square = 109 df = 2 p lt 001 n = 610 20 Chi Square = 279 df = 4 p lt 0001 n = 610 21 Chi Square = 259 df = 6 p lt 0001 n = 598 22 Chi Square = 515 df = 6 p lt 0001 n = 597 22 Chi Square = 177 df = 8 p lt 005 n = 600 22 Chi Square = 339 df = 4 p lt 0001 n = 610 22 Chi Square = 820 df = 4 p lt 0001 n = 610 22 Chi Square = 522 df = 8 p lt 0001 n = 610 22 Rho = 024 p lt 0001 n = 195 22 Chi Square = 166 df = 2 p lt 0001 n = 544
cipd
cou
k2011resou
rcing
and
talentp
lann
ing
survey
40
2011
OTHER TITLES IN THIS SERIES
ABSENCE MANAGEMENT The annual Absence Management survey has been running for eleven years providing useful benchmarking data on absence levels the cost and causes of absence and how organisations are managing absence The latest report is brought to you in partnership with Simplyhealth
EMPLOYEE ATTITUDES TO PAY The annual Employee Attitudes to Pay survey investigates employee attitudes and expectations towards pay and bonuses Now in its third year this survey is carried out by YouGov and focuses on employees in the UK
REWARD MANAGEMENT The annual Reward Management survey has been running for ten years and provides practical insights into current trends practices and issues affecting reward management in the UK It examines strategic reward base and variable pay bonuses incentives pensions reward measurement and total reward issues This report was brought to you in partnership with Benefex
LEARNING AND TALENT DEvELOPMENT The annual Learning and Talent Development survey is now in its thirteenth year and provides valuable commentary on current and future issues and trends It explores employer support for learning talent management employee skills managing and evaluating coaching and training spend
Issu
ed J
une
2011
Ref
eren
ce 5
552
copy C
hart
ered
Inst
itute
of
Pers
onne
l and
Dev
elop
men
t 20
11
Chartered Institute of Personnel and Development
151 The Broadway London SW19 1JQ
Tel 020 8612 6200 Fax 020 8612 6201
Email cipdcipdcouk Website cipdcouk
Incorporated by Royal Charter Registered charity no1079797

RESO
UR
CIN
G A
ND
TALE
NT P
LAN
NIN
G 2
011
3
2011
ABOUT US Chartered Institute of Personnel and Development
The Chartered Institute of Personnel and
Development (CIPD) is Europersquos largest HR and
development professional body As a globally
recognised brand with over 135000 members we
pride ourselves on supporting and developing those
responsible for the management and development of
people within organisations
Our aim is to drive sustained organisation
performance through HR shaping thinking leading
practice and building HR capability within the
profession Our topical research and public policy
activities set the vision provide a voice for the
profession and promote new and improved HR and
management practices
We know what good HR looks like and what HR
professionals need to know do and deliver at
different stages of their career be they specialists or
generalists working in the UK or internationally
We offer
bull membership
bull professional development including
qualifications and training
bull networking opportunities and world-class
events
bull expertise in HR capability-building and
consultancy services
bull topical insights and analysis
bull a wealth of resources and a voice for HR
cipdcouk
Hays
Hays is the worldrsquos leading recruiting expert in
qualified professional and skilled work It employs
over 7000 staff in 257 offices across 30 countries Last
year Hays placed around 50000 people in permanent
jobs and nearly 180000 in temporary positions
Hays works across 17 specialist areas from healthcare
to telecoms banking to construction and education
to IT It operates across the private public and not-forshy
profit sectors
Its recruiting experts deal with 150000 CVs every
month and more than 50000 live jobs globally at any
one time The depth and breadth of their expertise
ensures that Hays understand the impact the right
individual can have on a business and how the right
job can transform a personrsquos life
wwwhayscouk
cipd
cou
k2011resou
rcing
and
talentp
lann
ing
survey
4
RESOURCING AND TALENT PLANNING
SUmmARy Of kEy fINDINGS
The CIPDrsquos 2011 Resourcing and Talent Planning survey report produced in partnership with Hays contains valuable information on current and emerging trends in people resourcing practice This annual benchmarking survey is based on 626 respondent organisations from the UK The survey examines organisationsrsquo resourcing and talent planning strategies and practices and the key challenges and issues they face New question areas this year examine the employment of younger workers the length of the recruitment process the nature of job vacancies relationships with recruitment partners and the use of strengths-based approaches to recruitment
Resourcing strategies and objectives bull Just over half of survey participants report
having a formal resourcing strategy
bull Larger organisations are most likely to have a
resourcing strategy
The number and nature of vacancies bull On average the number of vacancies
organisations attempted to fill in 2010 remains
as low as in 2009 during the recession
bull The number of vacancies in very large
organisations particularly in the public sector
has dramatically reduced over the past three
years
bull Three-quarters of permanent vacancies were
filled with external candidates
bull Three-fifths of organisations require candidates
to have specific sector experience
bull Twice as many public sector organisations
(48) expect they will recruit fewer people as
a consequence of the abolition of the Default
Retirement Age (23 overall)
Graduate recruitment bull Two-fifths of organisations are concerned that
the increase in university tuition fees will have
an impact on the number of graduates in the
marketplace
bull One in ten organisations are considering
sponsoring students through university (20
of manufacturing and production) 22
increasing their use of internships and 30
increasing apprenticeship schemes (48 of
manufacturing and production)
bull Just over a quarter of organisations operate a
structured graduate recruitment programme
(35 of manufacturing and production)
bull Few organisations have closed graduate
recruitment programmes over the past
12 months however half of public sector
organisations had reduced their intake (50
compared with 20 in the private and not-forshy
profit sectors)
RESO
UR
CIN
G A
ND
TALE
NT P
LAN
NIN
G 2
011
5
2011 Recruitment difficulties bull One in three organisations report the length of
their recruitment process has led to the loss of
potential recruits
bull Three-quarters of organisations experienced
recruitment difficulties in the past few months
bull Managers and professionals and technical
positions are the most difficult vacancies to fill
bull As in previous years the main reason for
recruitment difficulties is a lack of necessary
specialist or technical skills
bull Nearly three-quarters of organisations had made
efforts to improve their employee brand over
the last year most commonly through employee
surveys and developing online career sites
Attracting and selecting candidates bull While the effectiveness of methods to attract
applicants varies according to organisation sector
and size the most effective method overall
is reported to be through organisationsrsquo own
corporate websites as was the case last year
bull The private sector particularly manufacturing
and production organisations are three times
more likely than public sector organisations to
include recruitment agencies among their most
effective methods for attracting candidates
bull Overall a third of organisations report they
have reduced their use of recruitment partners
however one in five report they have formed
a closer business partnership with them over
the past year and one in ten that they consider
them integral to attracting top talent
bull Competency-based interviews (70) interviews
following the contents of CVsapplication forms
(63) and structured interviews (56) are as
last year the most common methods used to
select applicants
bull Two-fifths of organisations report they use
a strengths-based approach to recruitment
although it is less commonly used in the public
sector (26)
bull The median recruitment cost of filling a vacancy
is pound7500 for senior managersdirectors and pound2500
for other employees (adjusting for accuracy)
showing reductions compared with last year
Resourcing in turbulent times bull Half of the organisations surveyed report the
economic climate has had a negative impact
on their organisationsrsquo resourcing budgets for
2011ndash12 This year it is the public sector that is
most severely hit with four out of five (82)
reporting their resourcing budgets will be
reduced (up from 59 last year)
bull Changes in resourcing and talent practices in
2011 compared with 2010 reflect a stronger
focus on costs and reductions in budgets More
organisations anticipate they will be focusing
on developing talent in-house retaining rather
than recruiting talent and reducing their
reliance on recruitment agencies and external
consultants for resourcing and development
bull Nearly half of public sector organisations will
be implementing a recruitment freeze in 2011
compared with one-fifth of organisations
overall Two-thirds of public sector
organisations and 29 of private organisations
will be reducing the number of new recruits
they hire
bull The volume of applicants for vacancies has
increased reflecting the high unemployment
rate Three-quarters of organisations have
noticed an increase in the number of
unsuitable applicants and a third report that
there are too many suitable candidates to
choose from Despite high unemployment
over the last two years more than half (52)
believe that competition for talent is even
greater as the pool of available talent to hire
has fallen sharply (2010 41 2009 20)
bull Most organisations remain focused on
managing talent despite increased attention
on reducing costs with only 4 reporting
that their focus on talent has decreased
Nevertheless 18 of organisations (32 of the
public sector) have reduced their overall talent
management spend as a consequence of the
economic downturn
cipd
cou
k2011resou
rcing
and
talentp
lann
ing
survey
6
RESOURCING AND TALENT PLANNING
Diversity bull Overall in little change from previous years
just over half of organisations have a diversity
strategy rising to 90 of public sector
organisations
bull Our figures indicate a reduction in the use of
several methods to address diversity issues this
year particularly in the public sector which has
traditionally led the way in diversity practice
Labour turnover bull The median labour turnover rate has decreased
over the past few years (2011 125 2010
135 2009 157 2008 173)
bull Smaller organisations are most likely to report
that their labour turnover has increased and
larger organisations that it has decreased
bull As in previous years the majority of turnover
is attributed to employees leaving voluntarily
The rate of voluntary leavers has increased
slightly in the private sector compared with last
year but decreased in the voluntary and public
services sector reflecting the growthcuts in the
respective sectors
bull The proportion of organisations making ten
or more redundancies over the past year has
reduced from 33 in 2009 to 12 in 2010
Employee retention bull Only two-fifths (42) of organisations
experienced no difficulties in retaining staff
during 2010 a similar figure to the previous
year Managers and professionalsspecialists and
technical employees remain the most difficult
categories of staff to retain
bull Most organisations have taken one or more
steps to address staff retention however nearly
one in four organisations (a similar proportion
to the previous year) report that no specific
retention initiatives were undertaken in 2010
bull The most frequently cited actions taken by
employers to address retention ndash improving
the people management skills of line managers
and increased learning and development
opportunities ndash are the methods most
commonly rated most effective Improving the
induction process is also commonly used to
address retention but views on its effectiveness
are more mixed
2011
1 RECRUITING EmPLOyEES
This section explores trends and developments in recruitment strategies and activity within UK organisations during 2010 It examines the adoption of formal resourcing strategies changes in the number of job vacancies organisations attempted to fill the extent and nature of recruitment difficulties over the past year and the strategies employers use to overcome these challenges It also includes developments in graduate recruitment the most effective approaches for attracting applicants and the methods used for selection For the first time we explore the nature of job vacancies the length of the recruitment process the employment of younger workers changing relationships with recruitment partners and efforts to improve the employer brand Finally the costs associated with recruitment are discussed
Resourcing strategies Just over half of respondents surveyed report their
organisation has a formal resourcing strategy
in place a similar proportion to last year (2011
Table 1 Organisations with formal resourcing strategies in place by size ()
Size ndash number of employees in UK 54 2010 56 2009 58) The likelihood of
organisations having a formal strategy in place
increases with organisational size as was the case
last year (Table 1)1 There are no significant sector
differences
Fewer than 10 26
10ndash49 38
50ndash249 46
250ndash999 55
1000ndash4999 68
More than 5000 85
RESO
UR
CIN
G A
ND
TALE
NT P
LAN
NIN
G 2
011
Base 604
7
8
RESOURCING AND TALENT PLANNING
The number and nature of job vacancies There is considerable variation in the number
of vacancies respondentsrsquo organisations tried
to fill in 2010 partly because the number of
vacancies is strongly related to organisation size
(Table 2)2 Overall the median number of vacancies
has fallen from 30 in 2008 to 20 over the past two
years as the recession affected increasing numbers
of organisations (Table 2)
While there is no overall change from last year
in the median number of vacancies organisations
tried to fill there has been a substantial fall in the
proportion of vacancies very large organisations
(5000+ UK employees) attempted to fill from
a median of 550 in 2009 to 200 in 2010 (800 in
2008) The reduction in vacancies in very large
organisations is striking in the private and public
sectors but particularly in the latter where
the median number of vacancies organisations
attempted to fill in 2010 was less than a third than
in 2009 This reflects the sluggish growth in the
private sector and in particular the significant
cuts in public sector budgets
Table 2 Median number of vacancies respondents tried to fill by size of organisation and sector
2011 survey 2010 survey 2009 survey
No of permanent staff employed in UK All Private
sector Public
services All Private sector
Public services All Private
sector Public
services
Median Median Median Median Median Median Median Median Median
1ndash49 3 3 1 3 3 2
50ndash249 12 12 10 12 10 14 10 10 8
250ndash999 45 50 30 46 45 50 60 52 70
1000ndash4999 110 150 55 100 100 100 300 300 300
More than 5000 200 500 150 550 850 500 800 800 550
All organisations 20 20 30 20 20 80 30 20 100 Base 577 (2011) 442 (2010) 683 (2009)
The categories for number of permanent staff employed in the UK differed slightly in the 2009 survey (250 or fewer 251ndash500
501ndash1000 1001ndash5000 5001ndash10000 10001+) 2009 categories have been combined where appropriate and otherwise matched with
the best corresponding category of 20112010
cipd
cou
k2011resou
rcing
and
talentp
lann
ing
survey
2011 Overall nearly three-quarters (73) of permanent
vacancies were filled with external candidates
Larger organisations with a wide range of
talent to choose from are more likely to recruit
internally than smaller organisations3 Public sector
organisations particularly those with more than
1000 UK employees are more likely to recruit
internally than the private sector (Table 3)4
Organisations are divided in their use of temporary
contracts More than a quarter (28) have
employed more people on temporary contracts
in 2010 compared with the previous year while
a similar proportion (27) have employed fewer
people on temporary contracts (45 remain
the same) Manufacturing and production
organisations are most likely to have increased
their use of temporary contracts and the public
services the least perhaps reflecting their reduced
recruitment generally (Figure 1)5
Table 3 Average percentage of job vacancies filled internally
Voluntary No of permanent staff community and not-employed in UK Private sector Public services for-profit All
Mean Mean Mean Mean
1ndash49 15 17 7 13
50ndash249 20 28 23 21
250ndash999 24 29 24 24
1000ndash4999 35 58 12 39
More than 5000 47 62 33 53
All organisations 25 45 19 27 Base 533
figure 1 Use of temporary contracts by sector in 2010 compared with the previous year ()
Manufacturing and production
Private sector services
Public services
Voluntary community and not-for-profit
More Same Less
Base 610
25
27
37
22
3837
50
32
50
23
31
28
RESO
UR
CIN
G A
ND
TALE
NT P
LAN
NIN
G 2
011
9
10
RESOURCING AND TALENT PLANNING
Sector-specific experience is an essential
requirement of candidates in three-fifths (60) of
organisations overall While our figures suggest
it is less commonly required in the public sector
(48 compared with 59 of the voluntary
community and not-for-profit sector and 63
of the private sector)6 there are also substantial
differences within sectors For example specific
sector experience is essential for the majority
of organisations operating in the chemical
construction or mining industries and professional
services but not for those in general manufacturing
or retail and wholesale Similarly within the public
sector it is deemed particularly essential for health
and education organisations but less so for those in
central or local government
Employing younger workers Figures from the Office for National Statistics
show that while total unemployment fell during
the three months to February 2011 youth
unemployment rose to a record level of almost 1
million equating to one in five economically active
16ndash24-year-olds out of work Moreover concerns
have been raised as to whether high youth
unemployment will be further compounded by the
abolition of the Default Retirement Age later this
year and the increase in university tuition fees This
year we included new questions in the survey to
explore these issues
One in six organisations (17) report they are
employing more 16ndash24-year-olds compared with
one year ago this compares with less than one
in eight (12) who are employing fewer young
people (72 are employing the same number) The
employment of younger workers has reduced most
in the public sector where one in four reports a
decrease compared with one in ten who reports an
increase (Table 4)7 This is likely to reflect a general
reduction in recruitment in this sector
Overall one-quarter of organisations expect the
abolition of the Default Retirement Age will mean
they recruit fewer people however the figure
rises to nearly half of public sector organisations
It does not appear however that the abolition of
the Default Retirement Age will have a particular
impact on the recruitment of young people with
only one in ten organisations reporting it will result
in fewer 16ndash24-year-olds being recruited (Table 4)
cipd
cou
k2011resou
rcing
and
talentp
lann
ing
survey
Table 4 The employment of younger workers ()
Voluntary Manufacturing community
All and Private sector and respondents production services Public services not-for-profit
Percentage employing fewer 16ndash24-year-olds than one year ago
Percentage agreeing the abolition of the Default Retirement Age means they will recruit fewer 16ndash24-year-olds
Percentage agreeing the abolition of the Default Retirement Age means they will recruit fewer people
12 10 9 25 10
11 18 6 17 9
23 25 15 48 22
Base 605
2011 Graduate recruitment Two-fifths of organisations (39) are concerned
that the increase in university tuition fees will
have an impact on the number of graduates in
the marketplace Public sector organisations are
particularly concerned (49 compared with 34
of private sector services 42 of not-for-profits
and 43 of manufacturing and production
organisations)8
Perhaps in order to address this deficit or in
response to additional government support to
boost apprenticeship schemes a third of public
sector organisations nearly half of manufacturing
and production and about a quarter of private
sector services and not-for-profit organisations
are considering increasing apprenticeship schemes
(Table 5) About a quarter of organisations overall
are considering increasing their use of internships
although the proportion is markedly lower in the
public sector Overall one in ten organisations are
considering sponsoring students through university
but the proportion doubles in manufacturing and
production where the lack of appropriate skills is
a common cause of recruitment difficulties (Table
5 see also Tables 8 and 9) Larger organisations are
also more likely to consider sponsoring students
through university (19 of those with more than
5000 employees)9
Overall just over a quarter of organisations
operate a structured graduate recruitment
programme (Table 6) The operation of
these programmes is significantly related to
organisation size (Figure 2)10 They also appear
to be most common in the manufacturing
and production sector as last year when a
step increase in their use was noted (Table 6)
It appears that this sector is investing in the
development of skills to address their deficit
in the workforce generally As in previous
years voluntary community and not-for-profit
organisations are least likely to operate a
structured graduate recruitment programme11
Table 5 Activities organisations are considering ()
Voluntary Manufacturing community
All and Private sector and respondents production services Public services not-for-profit
Increasing apprenticeship schemes 30 48 24 33 27
Increasing your use of internships 22 27 23 12 27
Sponsoring students through university 10 20 8 12 1
Base 615
Table 6 Organisations operating a structured graduate recruitment programme by sector ()
2011 2010 2009 2008
All 27 34 22 23
Sector
Manufacturing and production 35 35 23 24
Private sector services 29 37 24 27
Voluntary community and not-for-profit 6 18 5 7
Public services 26 33 23 24
RESO
UR
CIN
G A
ND
TALE
NT P
LAN
NIN
G 2
011
Base 614 (2011) 472 (2010) 752 (2009)
11
cipd
cou
k2011resou
rcing
and
talentp
lann
ing
survey
12
RESOURCING AND TALENT PLANNING
The majority of respondents from organisations
without a recruitment programme for graduates
report that their organisation has never had such
a programme or not had one for some time (97)
Even in the cash-strapped public sector only 3
report they have closed their graduate recruitment
programme in the last 12 months
Nearly a third (31) of organisations who have a
graduate recruitment programme have increased
their intake over the past year while a quarter
have reduced their intake (24) This shows an
improvement on the previous year at the height of
the recession when 43 had reduced their intake
The impact of the budget cuts in the public sector
are however clearly apparent as more than twice
as many organisations in this sector (50 compared
with 20 in the private and not-for-profit sectors)
have reduced their graduate intake
Length of recruitment process One in three (31) organisations report that the
length of their recruitment process has led to the
loss of potential recruits This issue appears to be
exacerbated by organisation size Nearly half of
organisations with more than 5000 employees
report that the length of their recruitment process
has led to the loss of potential recruits compared
with 38 of those in organisations of 250ndash999
employees and just 15 of organisations with
fewer than 50 employees12 There are no significant
sector differences
Recruitment difficulties Three-quarters of organisations with vacancies
report difficulties in filling at least some over the
past few months (75) This is an increase on last
year (2010 68) and may reflect the decrease in
unemployment in the first few months of 2011
It is less however than in previous years perhaps
because organisations were attempting to fill fewer
vacancies (2009 81 2008 86)
figure 2 Organisations operating a structured graduate recruitment programme by size ()
Number of UK employees
39
42
9Fewer than 50
17
1650ndash249
21
29 250ndash999
1000ndash4999 47
61 More than 5000
62
10 40 50 60 70 80
2011
0 3020 Percentage
2010
Base 609 (2011) 466 (2010)
2011 The private sector particularly manufacturing and
production organisations are most likely to have
difficulties filling vacancies (Table 7)13 Table 8
shows that over half of organisations in this sector
have difficulty filling technical vacancies and this
may reflect specific skills shortages in the UK The
most difficult category of staff to recruit in other
sectors is managers and professionalsspecialists
as was the case last year In general there is little
change in the categories of vacancies that are most
difficult to recruit for compared with last year
As would be expected given the cuts to
public sector budgets one in ten public sector
organisations report they did not have any
vacancies to fill twice as many as last year There is
little change in this regard in the other sectors
Table 9 shows the reasons respondents cite for their
recruitment difficulties The findings are similar
to previous years Lack of necessary specialist or
technical skills remains by far the most frequently
cited cause of difficulties reported by nearly
three-quarters of respondents (2011 72 2010
67 2009 73 2008 70) This is particularly
an issue for the manufacturing and production
sector and the public services sector where there
is a particularly high demand for such skills Lack
of formal qualifications is far less of an issue
These findings support arguments for greater
collaboration between industry and academic
institutions and more vocational training in order
to meet organisationsrsquo skill requirements
Higher pay expectations than the organisation
could offer and lack of experience are the next
most frequently cited causes of recruitment
problems (46 and 40 respectively) Interestingly
these are less of an issue in the public sector
perhaps because public sector applicants have
different expectations of pay or because some pay
scales are set at a national level Lack of experience
may be less of an issue than the necessary skills or
qualifications required in many public sector roles
The proportion reporting their recruitment
problems are due to potential candidatesrsquo
reluctance to move in the current economic climate
has decreased from just over a quarter in 2010 to
19 this year Economic growth albeit slow is
likely to be responsible for this reduction but the
lsquohangoverrsquo of the recession is highlighted as one in
five organisations still blame the economic climate
for their recruitment problems Despite high
unemployment 15 of respondents report they
have experienced problems due to no applicants In
line with last yearrsquos findings this is particularly an
issue for the public sector (22) which is also more
likely to report the image of their sectoroccupation
is a problem (22)
Table 7 Organisations experiencing difficulties recruiting for one or more category of vacancy by organisation size ( of those that have had vacancies to fill)
Voluntary Manufacturing community
and Private sector and All 2011 production services Public services not-for-profit
Difficulty filling one or 75 88 77 66 62more vacancies
No difficulties experienced 25 12 23 34 38
Base 561
RESO
UR
CIN
G A
ND
TALE
NT P
LAN
NIN
G 2
011
13
14
RESOURCING AND TALENT PLANNING
Table 8 Categories of vacancy that proved particularly difficult to fill ( of respondents)
Voluntary community
Manufacturing Private and and sector Public not-for-
All 2011 production services services profit All 2010
Other managers and professionalsspecialists
34 41 33 27 34 37
Technical 30 53 29 20 16 28
Senior managers directors
14 13 16 10 16 16
Services (customer personal protective 7 6 8 3 5 5 and sales)
Administrative secretarial
4 3 4 4 4 3
Manualcraft workers 4 11 3 1 0 2
Other 6 5 3 10 11 4
No difficulties experienced
23 12 22 30 38 25
No vacancies to fill 6 3 7 10 1 6 Base 597 (2011) 468 (2010)
Voluntary community
Manufacturing Private and All and sector Public not-for- All
2011 production services services profit 2010
Table 9 Reasons for recruitment difficulties ()
cipd
cou
k2011resou
rcing
and
talentp
lann
ing
survey
Lack of necessary specialist or technical skills 72 82 69 80 59 67
Look for more pay than you could offer 46 47 48 34 52 39
Lack of experience 40 42 43 27 41 36
Reluctance to move in current economic climate 19 24 18 17 15 26
Lack of interpersonal skills 16 9 19 10 20 12
No applicants 15 9 16 22 20 15
Image of sector occupationorganisation 13 7 12 22 11 12
Relocation difficulties 9 19 6 10 7 8
Lack of formal qualifications 7 7 7 5 7 4
The impact of the immigration cap 3 2 4 3 4
Other 4 3 3 8 7 7
Base 427 (2011) 330 (2010)
new item introduced in 2011
2011 Improving the employer brand Nearly three-quarters of organisations have made
efforts to improve their employer brand over the
past year (Table 10) The larger the organisation
the more likely it is to have undertaken one or
more activities to improve its brand Two-fifths of
small organisations with fewer than 50 employees
report they have taken no action to improve their
employer brand compared with one-quarter of
organisations with 250ndash999 employees and one-
sixth of those with more than 5000 employees
There are no significant sector differences
The most popular approaches to improving
employer brand are employee surveys and
developing online careers sites with larger
organisations most likely to have adopted these
methods14 The public sector is most likely to
have introduced or extended flexible working
homeworking15 whereas the private sector is
more likely to have made efforts to improve its
brand through working with charities or corporate
sponsorship16 Voluntary community and not-forshy
profit organisations are most likely to have used
placement students to improve their brand17
Attracting candidates The effectiveness of methods to attract applicants
varies according to sector and organisation size
(Table 11) Overall the most effective method is
through organisationsrsquo own corporate websites
as was the case last year The effectiveness of this
method increases with organisation size probably
due to the increased brand awareness and
perhaps because larger organisations have more
advanced websites18
The private sector particularly manufacturing
and production organisations is three times
more likely than public sector organisations to
report recruitment agencies among their most
effective methods and twice as likely as voluntary
sector organisations (regardless of size) Search
consultants and employee referral schemes are also
notably more popular in the private sector than in
the public or voluntary sectors
In contrast the public and voluntary sectors are
more likely to find the press effective for attracting
applicants including local and national newspaper
advertisements and specialist journalstrade press
Secondments are also deemed to be more effective
in these sectors than in the private sector
Table 10 Work undertaken over last year to improve employer brand ()
Voluntary community
All Private Public and 2011 sector services not-for-profit
Employee surveys 39 39 38 43
Developing online careers site 30 33 23 29
Introducingextending flexible working homeworking 24 20 39 29
Placement students 23 21 19 35
Graduate careers fairs 15 17 11 8
Working with charities 14 16 8 6
Corporate sponsorship 11 13 2 8
Introducing sabbaticals 3 4 1 5
Other 7 6 6 10
No action taken to improve employer brand 27 28 29 22
RESO
UR
CIN
G A
ND
TALE
NT P
LAN
NIN
G 2
011
Base 601
15
16
RESOURCING AND TALENT PLANNING
Table 11 Most effective methods for attracting applications by industry sector ()
Sector 2011 Number of UK employees 2011
All
2010
All
2011
Man
ufa
ctu
rin
gan
d p
rod
uct
ion
Priv
ate
sect
or
serv
ices
Pub
lic s
ervi
ces
Vo
lun
tary
co
mm
un
ity
and
no
t-fo
r-p
rofi
t
1ndash49
50ndash2
49
250ndash
999
100
0ndash4
999
Mo
re t
han
500
0
Own corporate website 63 59 44 57 77 66 42 55 57 77 79
Recruitment agencies 60 54 77 62 22 30 39 59 66 51 41
Local newspaper advertisements 36 32 38 23 41 51 28 35 35 29 29
Employee referral scheme 35 29 33 38 5 14 20 33 27 32 29
Commercial job boards 33 27 33 29 14 29 21 27 25 42 26
Specialist journalstrade press 31 27 24 23 30 43 26 23 32 32 24
Encourage speculative applicationsword of mouth 24 25 30 29 9 23 27 31 23 19 19
Jobcentre Plus 23 25 24 24 22 34 16 29 21 25 32
Professional networking (such as LinkedIn) 14 16 11 23 5 9 28 13 13 18 17
Search consultants 22 15 24 17 5 4 14 11 17 18 15
Links with schoolscollegesuniversities 18 13 16 13 9 17 12 13 11 18 15
Apprenticeships 12 11 19 9 13 9 10 10 11 12 17
National newspaper advertisements 16 11 4 6 23 29 10 9 15 10 15
Secondments 11 11 7 8 21 12 2 9 13 11 19
Links with other local organisations making redundancies 7 13 5 7 9 6 5 9 11 8
Alumni (previous employees) 5 5 6 7 2 1 7 2 6 11 3
Social networking sites (such as Facebook) 3 4 4 5 3 4 3 2 2 8 12
Local Employment Partnership (LEP) 6 3 1 4 2 5 1 2 3 4 9
Other 5 5 2 3 12 6 8 3 4 4 5
cipd
cou
k2011resou
rcing
and
talentp
lann
ing
survey
Base 604 (2011) 464 (2010)
new item introduced in 2011
Despite the popularity of social networking
sites such as Facebook they are not seen to be
particularly effective for attracting candidates
Professional networking sites such as LinkedIn are
more popular particularly in the private services
sector although there has only been a small
percentage increase in their reported effectiveness
compared with last year
2011 Recruitment partners A new question this year asked respondents if their
attitude to and relationships with recruitment
partners has changed over the past 12 months Just
over a third report things have not changed
(Table 12) A similar proportion report they have
reduced their use of recruitment partners and 6
that they have stopped using them altogether
with one in ten considering them an unaffordable
expense (one in five in the not-for-profit sector)
and a similar proportion an unnecessary expense
In contrast one in five (predominantly private
sector organisations) report they have formed
a closer business partnership with recruitment
partners over the past year and one in ten (again
predominantly private sector organisations) report
they consider them integral to attracting top talent
Selecting candidates There has been little change in the methods used
to select candidates over the past few years with
the exception of a drop in the use of general
ability tests compared with 2009 (Table 13)
Interviews remain the most common selection
method with competency-based interviews
being most popular overall Interviews following
the contents of CVsapplication forms are also
particularly popular in the private sector (70
compared with 41 in the public sector and 57
in the not-for-profit sector) whereas the public
and not-for-profit sectors favour structured (panel)
interviews (82 and 79 respectively compared
with 45 in the private sector)
Tests for specific job-related skills are more popular
in the public and not-for-profit sectors (61 and
62 respectively compared with 43 in the private
sector) whereas telephone interviews are more
popular in the private sector (52 compared with
12 in the public sector and 26 in the not-forshy
profit sector)
Table 12 Changes in attitudes to and relationships with recruitment partners over the past 12 months ()
Voluntary community
All Private Public and 2011 sector services not-for-profit
Not changed 36 34 40 39
Reduced use of recruitment partners 32 34 32 26
Formed a closer business partnership with them 19 23 8 12
Consider them an unnecessary expense 12 11 13 16
Consider them an unaffordable expense 11 10 11 22
Consider them integral to attracting top talent 9 11 2 4
Stopped using recruitment partners 6 5 8 5
Other 3 3 3 3 Base 604
RESO
UR
CIN
G A
ND
TALE
NT P
LAN
NIN
G 2
011
17
18
RESOURCING AND TALENT PLANNING
Table 13 Methods used to select applicants ()
2011 2010 2009 survey survey survey
Competency-based interviews 70 78 69
Interviews following contents of CVapplication form 63 64 68
Structured interviews (panel) 56 61 59
Tests for specific job-related skills 49 48 50
Telephone interviews 43 47 38
Literacy andor numeracy tests 38 43 39
Personalityaptitudepsychometric questionnaires 35 44 35
Assessment centres 35 42 35
Pre-application eliminationprogression question(s) 25 32 NA
General ability tests 23 27 44
Group exercises (for example role-playing) 21 30 26
Pre-interview references (academic or employment) 9 16 19
Video CVs 0 1 NA
Other 3 4 6
cipd
cou
k2011resou
rcing
and
talentp
lann
ing
survey
Base 605 (2011) 473 (2010) 754 (2009)
Strengths-based recruitment Two-fifths of organisations (40) report they use a
strengths-based approach to recruitment although
it is less commonly used in the public sector (26)19
In all sectors smaller organisations are most likely
to report they use a strengths-based approach
(60 of organisations with 1ndash49 employees use it
compared with 34 of organisations with 250ndash999
employees and 24 of organisations with more
than 5000 employees)20
Most of those who use a strengths-based approach
to recruitment are neutral about how easy it is to
administer in practice regardless of sector or size
Nearly a third (32) find it easy or very easy and
only one in ten (11) find it difficult
Over three-quarters of those who use a strengths-
based approach to recruitment believe it
brings benefits in terms of increased individual
performance (78) Two-thirds believe it improves
retention (67) and increases engagement (63)
Two-fifths (39) report it results in greater diversity
of skills in the workplace
Many organisations that use a strengths-based
approach to recruitment also use a strengths-based
approach for other people processes More than
half use it for performance management processes
(59) succession planning (55) and learning and
development (53) Two-fifths use it for talent
management (42) and a third use it for workforce
planning (32) Just under three in ten (29) also
use it for redeployment
Recruitment costs Last year we noted an increase in the proportion
of organisations that calculate their recruitment
costs (2010 65 2009 53 2008 51) This year
the proportion is back in line with previous years
(52) The increase last year may have been due
to sampling differences or a consequence of an
increased focus on costs during the recession that
has not continued
Four-fifths (79) of organisations that calculate
recruitment costs provided cost estimates per
hire There is considerable variance in the amount
organisations spend (at least partly due to our
2011 findings that organisations include different costs
in their calculations see Table 14) In general
the median figures (Table 15) are lower than last
year for both senior managerdirectors and other
employees
In order to explore the validity of estimates this
year we also asked respondents to indicate how
accurate their cost estimates were Half (51) of
estimates for costs of recruiting senior managers
directors were accurate to plus or minus 10 and
83 to plus or minus 20 Two-fifths of estimates
for other employees were accurate to plus or minus
10 and 74 to plus or minus 20 Table 16
shows the median figures for estimates that were
believed to be accurate to up to plus or minus 20
The figures indicate as we found last year that
organisations spend considerably more on senior
appointments than on other employees This
reflects the value attached to good leadership and
perhaps the additional challenges of attracting
the best candidates for senior positions This is
particularly the case in the private sector where
considerably more is spent on the recruitment of
senior managersdirectors than in the public or not-
for-profit sectors
Table 14 Criteria included in cost per hire calculations ()
Size ndash number of employees in UK
Advertising costs
Agencysearch costs
Employee referrals
Travel expenses
Relocation expenses
Fixed costs of resourcing team
Opportunity costs of hiring managers time
Other
Dont know Base 299
81
75
35
30
17
24
24
3
4
Table 15 Estimated total costs (advertising costs agency or search fees) per hire (pound)
Median 2011 Median 2010 (no of (no of
Occupational group respondents) Minimum Maximum respondents)
Senior managersdirectors 7000 (219) 251 55000 8333 (234)
Other employees 2000 (246) 150 32000 2930 (262) Number of respondents shown in brackets
Table 16 Median total costs (advertising costs agency or search fees) per hire for estimates accurate to plus or minus 20 (pound)
Voluntary
Median 2011 Manufacturing
and Private Public
community and not-for-
Occupational group production sector services profit
RESO
UR
CIN
G A
ND
TALE
NT P
LAN
NIN
G 2
011
Senior managersdirectors 7500 8000 9000 5000 3500
Other employees 2500 3400 2000 3000 1500 Base 150
19
cipd
cou
k2011resou
rcing
and
talentp
lann
ing
survey
20
RESOURCING AND TALENT PLANNING
2 RESOURCING AND TALENT mANAGEmENT IN TURBULENT TImES
In January 2010 the UK officially emerged from the recession however the economic environment remains uncertain for many organisations The environmental disasters in Japan the uprisings and wars in the Middle East rising oil prices and European debt highlight the volatility of global markets In the UK economic growth remains sluggish and there are concerns regarding the impact of the VAT increases high inflation and the austerity measures of the Coalition Government This section examines the impact of the economic environment on resourcing budgets strategies and activities in 2010 It looks at changes in views on the employment market and the implications for managing talent
The impact of the economic climate on resourcing Overall half of organisations report that the
economic climate has had a negative impact on
their organisationsrsquo resourcing budgets for 2011ndash12
(Table 17) This year however it is the public
sector that is most severely hit with four-fifths
(82) reporting their resourcing budgets will be
reduced (up from 59 last year) In contrast fewer
private and not-for-profit sector organisations
face reductions this year compared with last
although more are still reducing their budgets than
increasing them
Changes in resourcing and talent practices in
2011 compared with 2010 reflect a stronger
focus on costs and reductions in budgets (Figure
3) Two-thirds plan to develop more talent inshy
house (compared with one-third in 2010) and
more organisations plan to reduce reliance on
recruitment agencies and external consultants for
resourcing and development The proportion of
organisations planning to focus more on retaining
rather than recruiting talent has increased to 51
in 2011 from 28 in 2010
2011 Changes in recruitment practices are also
anticipated More organisations plan to make use
of new mediatechnology to recruit which may
be a cost-cutting strategy but can also improve
the efficiency and effectiveness of the recruitment
process On a positive note more organisations plan
to invest more time and effort in the quality of
candidates they hire and will be taking actions to
improve ways of identifying quality candidates
Public sector organisations are more than twice
as likely to be implementing a recruitment freeze
in 2011 (46 compared with 22 overall)
Nevertheless this is an improvement on 2010 when
58 of public sector organisations implemented a
recruitment freeze The situation is also somewhat
brighter for many private sector organisations
with 15 reporting they will be implementing a
recruitment freeze in 2011 compared with 26
in 2010 Nevertheless the economic recovery
remains slow for many with 29 of private
sector organisations and 66 of public sector
organisations reporting they will be reducing the
number of new recruits they hire in 2011 similar
proportions to 2010 Inevitably more public than
private sector organisations report they will be
reducing their headcount in 2011 and losing key
talent (33 compared with 9 in the private
sector) and redeploying people into new roles (66
compared with 37 in the private sector)
Table 17 Impact of the current economic climate on organisationsrsquo resourcing budgets ()
Private Public Voluntary community All sector services and not-for-profit
2011 2010 2011 2010 2011 2010 2011 2010
Reduced 49 53 41 51 82 59 51 61
Stayed about the same 36 37 39 40 14 36 40 34
Increased 8 7 11 4 1 5 4 5
Dont know 7 3 8 5 3 5 Base 615 (2011) 475 (2010)
RESO
UR
CIN
G A
ND
TALE
NT P
LAN
NIN
G 2
011
21
cipd
cou
k2011resou
rcing
and
talentp
lann
ing
survey
22
RESOURCING AND TALENT PLANNING
figure 3 Resourcing and talent practices implemented in 2011 and 2010 ( of respondents)
Developing more talent in-house
Continuing to recruit key talentniche areas
Focusing more on retaining rather than recruiting talent
Reducing reliance on recruitment agencies
Use of new mediatechnology to recruit
Investing more time and effort in the quality of candidates we hire
Redeploying people into new roles
Reducing the number of new recruits we hire
Taking actions to improve ways of identifying quality candidates
Increasing the number of interimcontract staff recruited
Reducing our use of external consultants for resourcing and development
Increased recruitment of apprenticesinterns
Implementing a recruitment freeze
Reducing our headcount but preserving key talent
Recruiting talent discarded by competitors
Reducing our headcount and losing key talent
Offering sabbaticals career breaks additional holidays
Reducing employees working hours to avoid making people redundant
8Reducing graduate recruitment 8
6Suspending graduate recruitment 7
36
28
36
28
26
30
35 35
35 15
29 23
28 19
24 12
22 30
22 16
18 11
13 12 12
10
12 10
66
59 46
51
47
46
45
44
0 10 20 30 40 50 60 70 80 Percentage of respondents
2011 2010
Base 582
RESO
UR
CIN
G A
ND
TALE
NT P
LAN
NIN
G 2
011
23
2011 Views on the employment market In little change to last year three-quarters of
organisations report they have noticed an increase
in the number of unsuitable applicants as they have
fewer roles to fill (Figure 4) Far fewer (34) report
that there are too many suitable candidates to
choose from and despite high unemployment over
the past two years more than half (52) believe that
competition for talent is even greater as the pool of
available talent to hire has fallen sharply (2010 41
2009 20) For many organisations there appears a
clear mismatch between the skills they require and
those available in the labour market
Competition for talent appears to be particularly
keen in the private sector Two-thirds (64) of
manufacturing and production organisations
and 55 of private services organisations agree
that competition for talent is even greater now
compared with 39 of the public sector and 34
of not-for-profits21 In contrast the public sector
and not-for-profits are more likely to agree they
have too many suitable candidates to choose
from (61 and 47 respectively compared with
23 of manufacturing and production and 27
of private sector services)22
Three-fifths (62) of respondents agree that the
demand for temporary and contract workers will
increase as employers will be reluctant to take
on permanent staff during uncertain times while
44 agree that part-time workers will become
more appealing to employers who are looking to
cut costs
figure 4 Views on the employment market ( agreeing or strongly agreeing)
With fewer roles to fill we have noticed an increase in the number
of unsuitable applicants
The demand for temporary and contract workers will increase as employers will be reluctant to
take on permanent staff during uncertain times
Employers will use the economic downturn as an opportunity to get rid of poor performers
and bring about culture change
Competition for talent is even greater now as the pool of available talent to hire has
fallen sharply
Part-time workers will become more appealing to employers who are looking to cut costs
Employers are acting too hastily in making people redundant and as a result they will lose too
many employees with valuable knowledge and skills
With fewer roles to fill there are now too many suitable candidates to choose between
The abolition of the Default Retirement Age will mean we recruit fewer people
Employers will look to make older workers over the age of 65 redundant before their younger workers
73 76
54
62 66 66
55 63
72
52 41
20
44 45
52
44 48
53
34 32
23
19 22
27
0 10 20 30 40 50 60 70 80 Percentage of respondents
2011 2010 2009
Base 607 (2011) 475 (2010) 746 (2009)
item added 20102011
24
RESOURCING AND TALENT PLANNING
More than half of respondents (55) across
all sectors believe that employers will use the
economic downturn as an opportunity to get rid of
poor performers and bring about culture change
While high this shows a downward trend on the
past two years (2010 63 2009 72 agree or
strongly agree) perhaps reflecting a slowing in
the number of redundancies Similarly there is
a gradual downward trend in the proportion of
respondents who express concern that employers
are acting too hastily in making people redundant
and as a result they will lose too many employees
with valuable knowledge and skills or that
employers will look to make older workers over the
age of 65 redundant before their younger workers
Nearly a quarter (23) of respondents believe
that the abolition of the Default Retirement Age
will mean they recruit fewer people (48 in the
public sector)23
Implications for talent management The value of effective talent management has
not been lost in the recent attention on reducing
costs Two-fifths (41) of organisations report
that the current economic situation has led
to an increased focus on talent management
(43 in 2010) and only 4 that it has led to a
decreased focus (7 in 2010) with no significant
differences across sectors Unsurprisingly however
the public sector are about twice as likely this
year to report they have reduced their overall
talent management spend due to the downturn
compared with other sectors (Table 18)24
The proportion of organisations that report
the economic downturn has had an impact on
approaches to reward across the business has
slightly reduced compared with last year (54
compared with 61 in 2010) As last year it
appears that organisations across all sectors
are being more selective in who they reward A
smaller proportion of organisations report their
approach to reward for individuals identified as
talent has been affected by the downturn (42)
than report their approach to reward across the
business has been affected (54)
Table 18 Has your overall talent management spend been reduced due to the economic downturn ()
cipd
cou
k2011resou
rcing
and
talentp
lann
ing
survey
Voluntary All community and All
2011 Private sector Public sector not-for-profit 2010
Yes 18 17 32 13 23
No 38 43 16 32 41
NA (no talent management spend) 44 40 52 55 36
Base 617 (2011) 471 (2010)
RESO
UR
CIN
G A
ND
TALE
NT P
LAN
NIN
G 2
011
25
2011
Case study Innovative recruitment and cost saving in the Association of Greater Manchester Authorities
The Association of Greater Manchester Authorities (AGMA) represents the ten local authorities in
Greater Manchester and works in partnership with a wider group of associate councils and public
sector organisations AGMA chief executives and council leaders work together on a range of key
strategic and policy issues which impact on Greater Manchester including resourcing strategies
and recruitment and retention issues
The AGMA initiative in cost reduction in the area of resourcing has been described as lsquoa truly
pioneering example of collaboration between a number of local authoritiesrsquo and is already
delivering against a range of objectives
The initial aim was to make a significant saving on the pound5ndash6 million annual cost of external
media advertising reported in 2008ndash09 and to create a more efficient and effective recruitment
system A shared portal was commissioned to offer a front-end website (wwwyourcounciljobs
couk) with a lsquoback-officersquo e-recruitment system which would give a standardised shared-service
approach for job applicants across councils Some of the benefits for applicants include the ability
to go to one place to register their interest to be able to look in specific categories for jobs
of particular relevance to them to be able to amend an existing application form in order to
apply for a further post and to receive email alerts when new jobs relevant to their interests are
posted In addition communications to job-seekers are now standardised for every council
This approach has seen real benefits across each of the local authorities workflows are now
standardised as every HR team runs identical systems and there is consistency in reporting within
all councils enabling them to benchmark their processes more clearly The councils use this
benchmarking data to make additional improvements and efficiencies
Jayne Whitehead AGMA Category Procurement Manager has project-managed the initiative
with managers represented from each participating authority and describes the process as one
of lsquotrue collaborationrsquo with lsquo100 commitmentrsquo from all the councils involved The benefits
are clear annual media costs are dramatically reduced to approximately pound250000 across ten
partner organisations and there has been a reduction in time-to-hire of 13 days This has had
the knock-on effect of reducing expenditure on agency staff The average cost of a recruitment
advertisement per role was previously pound97400 it is now pound15200 There have also been benefits
outside the original intention including doubling the number of online applications for council
posts with administrative cost savings in HR of approximately pound250000 across the consortium
More than 61000 registered users are now on the system and the councils are successfully filling
their own talent pools of prospective job-seekers Overall the project team is now celebrating a
pound17 million reduction in recruitment expenditure over the past 12 months
(continued)
cipd
cou
k2011resou
rcing
and
talentp
lann
ing
survey
26
RESOURCING AND TALENT PLANNING
There were some challenges in the implementation of this new way of working All the councils
had to be convinced about the benefits of the changes With the implementation of a new IT
system having its own set of challenges the project has taken 12 months to introduce longer
than first anticipated Implementing the changes during a period of radical restructuring in all
councils also proved particularly challenging However Jayne describes how both the need to
make efficiencies and feedback from job-seekers meant that lsquowe had to find a different way of
doing thingsrsquo Jayne also recognises how the neutrality of her own role (each council pays a tenth
of her salary) has been essential in ensuring that the project has been fair to all its participants
offering a centralised shared resource to manage the project
The project is now set to develop yet further with the aim of becoming entirely self-funding
within the next year by accepting advertising from other organisations Two new websites are
planned for recruitment into schools and social care jobs bringing even less reliance on media
and agencies AGMA will also be further building its own talent pool
Jayne describes the initiative as lsquoa true example of what you can do if you collaborate across
authoritiesrsquo Not only the separate councils but also diverse teams and functions including HR IT
procurement communications and marketing have worked together to deliver this innovative
and inspiring project
Information provided by Jayne Whitehead AGMA Category Procurement Manager
2011
3 DIVERSITy
This section examines organisationsrsquo approaches to diversity including the use of formal diversity strategies and the methods used to address diversity issues
Just over half of organisations report they have with just under two-thirds of not-for-profit
a formal diversity strategy showing little change organisations and just two-fifths of private sector
over the past four years (2011 52 2010 55 companies (Table 19)25 Diversity strategies are also
2009 60 2008 55) Consistent with previous more common in larger organisations (regardless
yearsrsquo findings most public sector organisations of sector)26
(90) have a formal diversity strategy compared
Table 19 Does your organisation have a formal diversity strategy ()
Yes No Dont know
All 52 41 7
Sector
Private sector 41 50 8
Public services 90 9 1
Voluntary community and not-for-profit 63 33 4
Number of UK employees
Fewer than 50 45 50 5
50ndash249 43 51 6
250ndash999 48 44 7
1000ndash4999 65 31 4
More than 5000 80 9 11 Base 613
RESO
UR
CIN
G A
ND
TALE
NT P
LAN
NIN
G 2
011
27
28
RESOURCING AND TALENT PLANNING
As was the case last year over three-quarters
of organisations with a formal diversity policy
attempt to address diversity issues through
monitoring recruitment andor staffing
information to obtain data on gender ethnicity
disability age and so on (Table 20) Less than
three-fifths train interviewers to understand what
diversity is about and the impact of stereotypes
Other diversity-focused initiatives are even
less common moreover the figures indicate a
reduction in the use of several methods compared
with previous years The pressures of the recession
may have led to a reduced focus on diversity
Given the links between diversity in the workforce
and productivity organisations that fail to give
this issue the attention it requires may find
themselves at a disadvantage in the future
Traditionally the public sector has tended to lead
the way in terms of diversity practices Again this
year they are significantly more likely to address
diversity issues through monitoring recruitment
andor staffing information through providing
recruitment documents in other formats through
advertising vacancies in different sources to
attract under-represented groups and through
setting recruitment targets to correct a workforce
imbalance Nevertheless they are less likely than
other sectors to actively try to attract talent of all
ages (Table 20) Moreover our figures indicate that
the reduction in the use of several diversity methods
compared with previous years is particularly
pronounced in the public sector The change of
government and budget reduction measures have
led to significant change programmes in many
public sector organisations which may have resulted
in a reduced focus on diversity issues
Table 20 Methods used to address diversity issues in organisations ( with formal diversity strategy)
Voluntary community
Private Public and not-sector services for-profit
2011 2010 2009 2008 2011 2011 2011 survey survey survey survey (2010) (2010) (2010)
Monitoring recruitment andor staffing information to obtain data on gender 78 79 84 83 70 (71) 88 (96) 88 (76) ethnicity disability age any other categories
cipd
cou
k2011resou
rcing
and
talentp
lann
ing
survey
Training interviewers to understand what diversity is about and the impact of stereotypes
57 68 68 60 53 (66) 64 (73) 57 (72)
Actively trying to attract talent of all ages 45 53 32 43
Operating policies that go beyond basic legislative requirements on age gender race disability sexual orientation religion and belief
39 49 52 48 34 (44) 47 (63) 47 (40)
Providing recruitment documents in other 39 41 37 31 24 (22) 64 (77) 47 (52)formats (online large-print audio and so on)
Checking that any tests used are valid reliable and culture-free and were tested on diverse norm groups
36 42 47 34 39 (44) 35 (45) 27 (16)
Advertising vacancies in different sources to 31 37 51 48 22 (30) 44 (53) 41 (32)attract under-represented groups
Using specific imageswords in your recruitment advertising to appeal to a wider audience 29 38 42 42 25 (30) 36 (52) 33 (40)
Making attempts to employ the long-term 19 19 13 29unemployed
Setting recruitment targets to correct a workforce imbalance 9 15 14 12 4 (8) 18 (31) 8 (16)
Base 312 (2011) 253 (2010) 419 (2009) new item added in 2011
RESO
UR
CIN
G A
ND
TALE
NT P
LAN
NIN
G 2
011
29
2011
4 mANAGING LABOUR TURNOVER
Figures from the Office for National Statistics show that UK unemployment rose by 27000 in the three months to the end of January 2011 to 253 million the highest since 1994 When unemployment is high the number of employees leaving organisations voluntarily is expected to decrease Here we examine whether this is happening and how organisations are tackling the issue of employee retention
Among organisations that are able to supply
turnover data the median labour turnover rate
has decreased over the past few years (Table 21)
The median figure however hides differences
across organisations Slightly more organisations
report their turnover has increased in 2010
compared with 2009 (38) than has decreased
(33) while for nearly a third (29) it remained
the same Smaller organisations are more likely
to report their labour turnover has increased and
larger organisations that it has decreased27
As in previous years the majority of turnover (53)
is still attributed to employees leaving voluntarily
(Table 22) As the economy has improved the
median proportion of turnover due to redundancies
has reduced Only 12 of organisations that
provided reasons for leaving made more than ten
redundancies in the previous year compared with
33 in 2010 26 in 2009 and 22 in 2008 A third
(34) of organisations that made redundancies
offered career transition services
While median turnover rates have reduced
across all sectors Table 23 shows that the rate
of voluntary leavers has increased slightly in
the private sector compared with last year but
decreased in the voluntary and public services
sector This reflects improvements in the economic
outlook for the private sector and the widespread
cuts in the public sector which also have a direct
impact on many not-for-profit organisations that
provide services for the public sector
Cost of labour turnover While just over half of organisations calculate
their recruitment costs only 13 calculate the
cost of their labour turnover (2010 14) The
majority of organisations report they do not
calculate these costs (79) while 7 donrsquot know
if they are calculated or not
Nearly half (46) of those who calculate their
turnover costs want to maintain their current
turnover rate while one-fifth (38) want to
reduce turnover during 2011 and 15 want to
increase it
Retaining employees The steps organisations take to retain employees
in their workforce can have a significant impact
on organisational efficiency and success through
30
RESOURCING AND TALENT PLANNING
Table 21 Median rate of labour turnover ()
2011 2010 survey 2009 survey 2008 survey 2007 survey 2006 survey
125 135 157 173 181 183
Base 175 (2011)
Table 22 Median labour turnover rates by reason for leaving ()
2011 survey 2010 survey 2009 survey
Voluntary redundancies 0 0 0
Compulsory redundancies 0 10 05
Dismissedleft involuntarily (including death in service)
07 09 14
Fixed-short-term contracts 0 0 07
Retired 0 04 07
Left voluntarily 66 84 90
Base 154 (2011)
Table 23 Median labour turnover rates by industry sector ()
cipd
cou
k2011resou
rcing
and
talentp
lann
ing
survey
Sector All leavers Voluntary leavers
2011 survey
2010 survey
2009 survey
2011 survey
2010 survey
2009 survey
Manufacturing and production 93 (38) 124 (44) 153 (80) 37 (35) 27 (42) 77 (75)
Private sector services 138 (96) 146 (77) 168 (150) 87 (82) 74 (71) 104 (129)
Public services 85 (28) 86 (19) 126 (52) 34 (10) 58 (15) 76 (45)
Voluntary community not-for-profit 131 (11) 159 (15) 164 (38) 70 (24) 102 (18) 110 (35) Number of respondents shown in brackets
decreasing employee turnover loss of talent and
recruitment and training costs while having a
positive impact on motivation job satisfaction and
the employer brand
Only two-fifths (42) of organisations
experienced no difficulties in retaining staff
during 2010 This figure is similar to last year
(45) but higher than the findings for 2008
when 31 reported they had no retention
difficulties These findings reflect the increased
caution of employees regarding leaving their
jobs during times of economic uncertainty and
high unemployment Supporting this are our
findings that the public (49) and not-for-profit
sectors (49) are more likely to report they had
no difficulties in retaining staff during 2010
compared with the private sector (38)
As in previous years organisations most
commonly have difficulty retaining managers
and professionalsspecialists (Table 24) The
manufacturing and production sector are most
likely to report difficulties retaining technical
2011 staff and the private services sector that they have
most difficulty retaining services staff This may
reflect the higher demand for these categories of
employees in these sectors
While most organisations have taken one or more
steps to address staff retention nearly one in four
organisations (23) report that no specific retention
initiatives were undertaken This is a similar
proportion to last year although substantially higher
than in previous years when retention difficulties
were more common due to a tighter labour market
(Table 25) Public sector organisations are twice
as likely not to have taken any steps to address
retention as those in the private or not for-profit
sectors (39 compared with 20 of private sector
and 16 of not-for-profits)28
The most common methods used to address
retention in 2010 used by nearly two-fifths of
organisations are to improve line managersrsquo
people skills improve learning and development
opportunities and improve the induction process
Improving line managersrsquo people skills and
learning and development opportunities are also
most commonly rated among the top three most
effective retention methods The effectiveness of
improving induction processes is more varied with
22 rating it among the top three most effective
methods and 12 among the top three least
effective methods Views are also mixed regarding
the effectiveness of improved pay It is likely that
employees are motivated by different factors
Employers need to provide a healthy working
environment where employees are treated with
respect and make efforts to match their retention
initiatives with what staff want
Table 24 Retention difficulties by occupational category ()
Voluntary community
Private and All Manufacturing sector Public not-for- All
2011 and production services services profit 2010
Managers and professionals specialists 28 26 29 25 29 27
Technical 21 37 19 17 13 20
Services (customer personal protective and sales) 13 7 21 4 4 12
Administrative secretarial 9 5 8 15 13 7
Senior managersdirectors 7 5 8 10 6 9
Manualcraft workers 6 11 6 3 4 4 Base 601 (2011) 451 (2010)
RESO
UR
CIN
G A
ND
TALE
NT P
LAN
NIN
G 2
011
31
32
RESOURCING AND TALENT PLANNING
Table 25 Steps taken specifically to address staff retention ()
Used in Least Most Used in Used in Used in 2010 effective effective 2009 2008 2007
Improved line managers people skills 39 7 31 42 39 37
Increased learning and development opportunities 38 5 34 35 47 46
Improved induction process 38 12 22 31 45 45
Improved employee involvement 34 8 24 32 35 29
Improved selection techniques 30 7 25 31 42 46
Improved pay 27 11 23 22 42 53
Offered coachingmentoring buddy systems 24 8 14 20 24 22
Improved benefits 21 8 14 19 32 36
Better promotion to employees of the employer brand 18 10 5 15 21 16
Created clearer career paths 18 6 2 21 18 17
Revised the way staff are rewarded so their efforts are 18 4 13 14 19 19 better recognised
Made changes to improve workndash life balance 17 5 13 19 31 30
Improved physical working conditions 15 8 7 13 19 12
Redesigned jobs to make them more satisfying 11 4 8 13 18 14
Increased our use of countershyoffers 4 4 14
No specific initiatives undertaken 23 3 1 27 13 9 Base 559 (2011 survey) 431 (2010 survey) 695 (2009 survey) 710 (2008 survey)
new item added in 2011
cipd
cou
k2011resou
rcing
and
talentp
lann
ing
survey
RESO
UR
CIN
G A
ND
TALE
NT P
LAN
NIN
G 2
011
33
2011
CONCLUSIONS
Looking forward In January 2010 the UK officially emerged from
the longest recession since the 1930s Economic
growth however remains sluggish and the public
sector has embarked on a four-year programme of
the biggest government spending cuts in decades
to address the fiscal deficit
In the labour market unemployment remained
high throughout 2010 Figures from the Office
for National Statistics (ONS) show that UK
unemployment rose by 27000 in the three months
to the end of January 2011 to 253 million the
highest since 1994 While recent months have seen
signs of improvement there are concerns that the
slow growth in the private sector will be unable
to fully compensate for the increasing job losses in
the public sector that will result from the budget
cuts This is supported by the findings from the
CIPDrsquos spring 2011 Labour Market Outlook which
shows the impact on the overall labour market of a
slight rise in private sector recruitment is still being
cancelled out by large-scale public sector job losses
The findings of the CIPDrsquos 2011 Resourcing and
Talent Planning survey reflect the challenges
of the economic environment Organisations
generally have increased their focus on costs On
average organisations spent less on filling each
vacancy and a fifth have reduced their resourcing
budgets and talent management spend In the
public sector the focus on costs and budget
reductions was particularly apparent
The end of the recession has meant fewer
redundancies in 2010 Nevertheless over a third
of public sector and one-fifth of private sector
organisations reduced their headcount The
number of vacancies on offer by organisations
remained as low as in 2009 overall and continued
to decrease in very large organisations particularly
in the public sector
Looking forward private sector growth is expected
to remain slow and the full impact of public
sector budget cuts is still to come Resourcing and
talent management budgets will be further hit
in 2011ndash12 and many public sector organisations
will implement recruitment freezes and reduce
graduate intake and recruitment generally
Resourcing and talent practices are changing to
reflect the stronger focus on costs and reductions
in budgets Particularly in the public sector but
also in the private sector trends indicate a greater
focus on developing talent in-house retaining
rather than recruiting talent and reducing reliance
on recruitment agencies and external consultants
for resourcing and development
Our findings do not present a positive outlook
for the vast number of unemployed A substantial
proportion of organisations reports that the
already low number of vacancies available to them
is likely to be further affected by the abolition
of the Default Retirement Age Yet despite the
high unemployment rate most organisations
reported difficulties in filling vacancies mostly due
to skill shortages We have also seen an increase
in the proportion of organisations reporting
that competition for talent is even greater as the
pool of available talent to hire has fallen sharply
For many organisations there appears a clear
mismatch between the skills they require and
those available in the labour market Some are
concerned this will be exacerbated by the increase
in university tuition fees Some are responding
cipd
cou
k2011resou
rcing
and
talentp
lann
ing
survey
34
RESOURCING AND TALENT PLANNING
by increasing apprenticeship schemes internships
and sponsoring students through university Such
schemes may be aided by the Governmentrsquos recently
announced pound60 million commitment to help boost
youth employment and provide extra support for
apprenticeships and changes to vocational training
and education How far this will go towards meeting
organisationsrsquo skill requirements remains to be seen
On a positive note our findings indicate that talent
management is viewed as more not less important
in difficult times although with reduced budgets
organisations will have to be innovative with
their approach and strategies In order to survive
organisations will need to make certain they focus
beyond the cost-cutting required in the current
environment to ensuring their talent strategies are
aligned to long-term business success
The CIPDrsquos Shaping the Future and Next Generation
HR flagship projects have both explored the
important issues of sustainability Shaping the Future
in particular warns against the dangers of lsquotalent
tunnel visionrsquo taking a short-sighted view on talent
strategies which are solely focused on the needs of
the here and now
Often organisations pay too little attention to
identifying and developing the capabilities that
individuals will need in the long term This implies a
leadershiptalent management capability gap with
too much focus on the operational needs of today
rather than the organisational imperatives
of tomorrow
Itrsquos never too late to start equipping your people
with the skills and knowledge they need to meet
both present and future challenges So what practical
recommendations can we make for resourcing and
talent professionals drawn from our Shaping the
Future evidence
Audit your organisationrsquos current skills and future capabilities If you havenrsquot done so already conduct a thorough
inventory of your organisationrsquos current skills and map
those against the capabilities you are likely to need
in the future Hold forecasting sessions which look at
macro and micro trends how these will impact your
way of working and the changes that will be required
for future success
Build your talent and succession pipeline You also need to be proactively building up your
talent pipelines (horizontally and vertically) so that
you are developing people with future-fit skills and
capabilities A silver lining from the current economic
climate is that more organisations are focusing on
developing internal talent and fully utilising the
skills of their existing workforce Fresh talent is
still important but recruitment strategies should
complement internal pipelines
Maintain a continuous focus on capability-building Capability-building should be part of a continuous
process embedded into policies and practices Across
our case study organisations managers talked about the
need to embed development and skills training as part
of business as usual rather than as a one-off activity
Develop a creative approach to skills and capability development Even when budgets are tight it is essential that
staff get the development they need to ensure they
have the capabilities for their current job role as well
as starting to build those that the organisation will
need in the future Our case study organisations were
focusing strongly on knowledge-sharing enabling
people to learn from others across the organisation
Many of you are already considering alternative
solutions for specialist skill development such as
apprenticeships internal management schemes
summer placements and internships It is also
important to work with universities to ensure that
graduates are developing skills and knowledge which
will help them to succeed in the workplace
RESO
UR
CIN
G A
ND
TALE
NT P
LAN
NIN
G 2
011
35
2011
BACkGROUND TO ThE SURVEy
This survey was conducted in March and April 2011 It was sent to a sample of UK-based HR professionals in the public private and voluntary sectors In total 626 people responded to the survey
This is the fifteenth annual CIPD Resourcing
and Talent Planning survey (formerly known as
the CIPDrsquos Recruitment Retention and Turnover
survey) The survey examines organisationsrsquo
resourcing and talent planning strategies and
practices and the key challenges and issues
they face The survey consists of 45 questions
completed through an online self-completion
questionnaire
The majority of questions remain the same as
previous years to provide useful benchmark
data on topics including recruitment practices
difficulties and costs selection methods diversity
strategies the impact of the economic climate on
resourcing and talent planning practices labour
turnover and retention strategies New question
areas this year examine the employment of
younger workers the length of the recruitment
process the nature of job vacancies relationships
with recruitment partners and the use of
strengths-based approaches to recruitment
A small number of respondents took part in follow-
up telephone interviews to produce mini case
studies on a selection of topics These are presented
in the coloured boxes throughout the report
Sample profile Respondents predominantly work for private
sector organisations with professional services
being particularly well represented but other
sectors are represented in similar proportions to
last year (Table A1)
36
RESOURCING AND TALENT PLANNING
Table A1 Breakdown of respondent organisations by industrial sector Number of respondents
Manufacturing and production 113 19
Agriculture and forestry 1 0
Chemicals oils and pharmaceuticals 9 1
Construction 8 1
Electricity gas and water 4 1
Engineering electronics and metals 38 6
Food drink and tobacco 18 3
General manufacturing 6 1
Mining and quarrying 4 1
Paper and printing 6 1
Textiles 2 0
Other manufacturingproduction 17 3
Private sector services 319 52
Professional services (accountancy advertising consultancy legal etc) 78 13
Finance insurance and real estate 33 5
Hotels catering and leisure 26 4
IT services 26 4
Call centres 3 0
Media (broadcasting and publishing etc) 7 1
Retail and wholesale 40 7
Transport distribution and storage 23 4
Communications 6 1
Other private services 77 13
Public services 100 16
Central government 14 2
Education 12 2
Health 23 4
Local government 22 4
Other public services 29 5
Non-profit organisations 78 13
Care services 9 1
Charity services 32 5
Housing association 17 3
Other voluntary 20 3 Base 610
cipd
cou
k2011resou
rcing
and
talentp
lann
ing
survey
2011 Most respondents work in small to medium-sized
organisations in terms of the number of UK-
based employees but larger organisations are
also represented in similar proportions to last year
(Table A2)
Respondents reported on organisations based
across the UK Three in ten responded for the
whole of the UK while others responded for a
particular regioncountry (see Table A3)
Table A2 Breakdown of sample by organisation size ndash permanent employees in the UK
Fewer than 10 5
10ndash49 12
50ndash249 33
250ndash999 25
1000ndash4999 12
More than 5000 13 Base 610
Table A3 Main region covered by the reply
East Anglia 5
East Midlands 3
West Midlands 5
North-east of England 3
North-west of England 7
South-west of England 6
Yorkshire and Humberside 5
South-east of England (excluding London)
12
London 12
Scotland 6
Wales 3
Northern Ireland 3
Ireland 0
Whole of UK 29 Base 602
Labour turnover A total of 175 survey respondents were able to
supply all the information necessary for us to
calculate labour turnover on a whole-organisation
basis
This report uses the standard lsquocrude wastagersquo
method to calculate the rate of turnover This
method is calculated as follows
Labour turnover =
Number of leavers in a set period
______________________________________ x 100
Average number employed in the same period
(Leavers include those leaving the organisation
by way of voluntary or involuntary severance
redundancies or retirements but does not include
internal transfers)
Readers should be aware that this method has
some shortcomings For example it takes no
account of the characteristics of the workforce or
the length of service of the leaver
Note on statistics and figures used Some respondents did not answer all questions so
where percentages are reported in tables or figures
the respondent lsquobasersquo for that question is given
lsquoAveragersquo in the report is used to refer to the
statistical mean where the data is normally
distributed However the median is used in cases
where the distribution is significantly skewed
When the median is used it is noted
With the exception of labour turnover rates all
figures in tables have been rounded to the nearest
percentage point Due to rounding percentages
may not always total 100
Chi-square (χ2) tests are used to examine whether
differences between groups such as industrial
sectors are significant or likely to be due to
chance Spearmanrsquos Rho correlation (Rho) is used
to examine relationships between variables We
report on statistics at the generally accepted level
of significance plt005
RESO
UR
CIN
G A
ND
TALE
NT P
LAN
NIN
G 2
011
37
38
RESOURCING AND TALENT PLANNING
fURThER SOURCES Of INfORmATION
We produce a range of free factsheets surveys
guides and research reports which are available on
the CIPD website at cipdcoukhrresources
Read our factsheets on Employer Brand
Employee Turnover and Retention
Induction
Outlook series Our quarterly reports Labour Market Outlook
and Employee Outlook look at the employer and
employee perspectives on the labour market and
on workplace issues and trends while HR Outlook
explores priorities and emerging trends for the HR
profession and function
View these reports at
cipdcoukresearchoutlook-series
Talent management Two reports look at talent issues in a recession
difficult economic climate
The War on Talent Talent management under
threat in uncertain times (2009)
Fighting Back through Talent Innovation (2010)
Opening up Talent for Business Success (2010)
looks at the importance of integrating talent
management and diversity
The Talent Perspective What does it feel like to
be talent-managed (2010) looks at the employee
view of talent management
Workforce planning Our guide Workforce Planning Right people right
time right skills (2010) gives advice on developing
workforce planning processes
Diversity Two survey reports and a guide provide practical
advice and information on trends
Diversity in Business A focus for progress (2007)
Managing an Ageing Workforce How employers
are adapting to an older labour market (2010)
Managing Age New edition 2011
Two further reports are available to order from
cipdcoukbookstore
Managing Diversity in Practice Supporting
business goals (2007)
Managing Diversity and the Business Case (2008)
Sign up to receive our e-newsletter at
cipdcoukcipdupdate
cipd
cou
k2011resou
rcing
and
talentp
lann
ing
survey
RESO
UR
CIN
G A
ND
TALE
NT P
LAN
NIN
G 2
011
39
2011
ACkNOwLEDGEmENTS
The CIPD is very grateful to those organisations and
individuals who gave their time to take part in this
research They include
bull Annette Sinclair Senior Researcher at Roffey
Park for analysing the findings and writing this
comprehensive report
bull Members of the Recruitment Forum Steering
Committee for their input into the survey
design and assistance in piloting the
questionnaire
bull Hays for their support and commitment at
every stage of the research
bull All those who shared examples of their
organisationrsquos practices
We hope that you find the research useful when
considering your own recruitment and retention
practices Please contact us if you have any
questions or ideas based on our findings
(researchcipdcouk)
RESOURCING AND TALENT PLANNING
fOOTNOTES 1 Chi Square = 573 df = 5 p lt 0001 n = 604 2 Rho = 073 p lt 0001 n = 577 3 Rho = 045 p lt 0001 n = 533 4 F = 250 df = 2 p lt 0001 n = 533 5 Chi Square = 180 df = 6 p lt 001 n = 535 6 Chi Square = 71 df = 2 p lt 005 n = 603 7 Chi Square = 230 df = 6 p lt 001 n = 600 8 Chi Square = 91 df = 3 p lt 005 n = 598 9 Chi Square = 129 df = 4 p lt 005 n = 610
10 Rho = 034 p lt 0001 n = 609 11 Chi square = 217 df = 3 p lt 0001 n = 609 12 Chi Square = 609 df = 8 p lt 0001 n = 607 13 Chi Square = 208 df = 3 p lt 0001 n = 560 14 Size of organisation and developing online
careers site Rho = 025 p lt 0001 n = 599 Size of
organisation and employee surveys Rho = 019
p lt 0001 n = 599 15 Chi Square = 167 df = 2 p lt 0001 n = 599
16 Working with charities Chi Square = 80 df = 2 p
lt 005 n = 599 corporate sponsorship Chi Square
= 116 df = 2 p lt 001 n = 599 17 Chi Square = 76 df = 2 p lt 005 n = 599 18 Table 11 also shows that this method is deemed
most effective by public sector organisations but
this effect is due to a greater proportion of
large public sector organisations in our
sample whereas private sector organisations are
more evenly distributed in size 19 Chi square = 109 df = 2 p lt 001 n = 610 20 Chi Square = 279 df = 4 p lt 0001 n = 610 21 Chi Square = 259 df = 6 p lt 0001 n = 598 22 Chi Square = 515 df = 6 p lt 0001 n = 597 22 Chi Square = 177 df = 8 p lt 005 n = 600 22 Chi Square = 339 df = 4 p lt 0001 n = 610 22 Chi Square = 820 df = 4 p lt 0001 n = 610 22 Chi Square = 522 df = 8 p lt 0001 n = 610 22 Rho = 024 p lt 0001 n = 195 22 Chi Square = 166 df = 2 p lt 0001 n = 544
cipd
cou
k2011resou
rcing
and
talentp
lann
ing
survey
40
2011
OTHER TITLES IN THIS SERIES
ABSENCE MANAGEMENT The annual Absence Management survey has been running for eleven years providing useful benchmarking data on absence levels the cost and causes of absence and how organisations are managing absence The latest report is brought to you in partnership with Simplyhealth
EMPLOYEE ATTITUDES TO PAY The annual Employee Attitudes to Pay survey investigates employee attitudes and expectations towards pay and bonuses Now in its third year this survey is carried out by YouGov and focuses on employees in the UK
REWARD MANAGEMENT The annual Reward Management survey has been running for ten years and provides practical insights into current trends practices and issues affecting reward management in the UK It examines strategic reward base and variable pay bonuses incentives pensions reward measurement and total reward issues This report was brought to you in partnership with Benefex
LEARNING AND TALENT DEvELOPMENT The annual Learning and Talent Development survey is now in its thirteenth year and provides valuable commentary on current and future issues and trends It explores employer support for learning talent management employee skills managing and evaluating coaching and training spend
Issu
ed J
une
2011
Ref
eren
ce 5
552
copy C
hart
ered
Inst
itute
of
Pers
onne
l and
Dev
elop
men
t 20
11
Chartered Institute of Personnel and Development
151 The Broadway London SW19 1JQ
Tel 020 8612 6200 Fax 020 8612 6201
Email cipdcipdcouk Website cipdcouk
Incorporated by Royal Charter Registered charity no1079797

cipd
cou
k2011resou
rcing
and
talentp
lann
ing
survey
4
RESOURCING AND TALENT PLANNING
SUmmARy Of kEy fINDINGS
The CIPDrsquos 2011 Resourcing and Talent Planning survey report produced in partnership with Hays contains valuable information on current and emerging trends in people resourcing practice This annual benchmarking survey is based on 626 respondent organisations from the UK The survey examines organisationsrsquo resourcing and talent planning strategies and practices and the key challenges and issues they face New question areas this year examine the employment of younger workers the length of the recruitment process the nature of job vacancies relationships with recruitment partners and the use of strengths-based approaches to recruitment
Resourcing strategies and objectives bull Just over half of survey participants report
having a formal resourcing strategy
bull Larger organisations are most likely to have a
resourcing strategy
The number and nature of vacancies bull On average the number of vacancies
organisations attempted to fill in 2010 remains
as low as in 2009 during the recession
bull The number of vacancies in very large
organisations particularly in the public sector
has dramatically reduced over the past three
years
bull Three-quarters of permanent vacancies were
filled with external candidates
bull Three-fifths of organisations require candidates
to have specific sector experience
bull Twice as many public sector organisations
(48) expect they will recruit fewer people as
a consequence of the abolition of the Default
Retirement Age (23 overall)
Graduate recruitment bull Two-fifths of organisations are concerned that
the increase in university tuition fees will have
an impact on the number of graduates in the
marketplace
bull One in ten organisations are considering
sponsoring students through university (20
of manufacturing and production) 22
increasing their use of internships and 30
increasing apprenticeship schemes (48 of
manufacturing and production)
bull Just over a quarter of organisations operate a
structured graduate recruitment programme
(35 of manufacturing and production)
bull Few organisations have closed graduate
recruitment programmes over the past
12 months however half of public sector
organisations had reduced their intake (50
compared with 20 in the private and not-forshy
profit sectors)
RESO
UR
CIN
G A
ND
TALE
NT P
LAN
NIN
G 2
011
5
2011 Recruitment difficulties bull One in three organisations report the length of
their recruitment process has led to the loss of
potential recruits
bull Three-quarters of organisations experienced
recruitment difficulties in the past few months
bull Managers and professionals and technical
positions are the most difficult vacancies to fill
bull As in previous years the main reason for
recruitment difficulties is a lack of necessary
specialist or technical skills
bull Nearly three-quarters of organisations had made
efforts to improve their employee brand over
the last year most commonly through employee
surveys and developing online career sites
Attracting and selecting candidates bull While the effectiveness of methods to attract
applicants varies according to organisation sector
and size the most effective method overall
is reported to be through organisationsrsquo own
corporate websites as was the case last year
bull The private sector particularly manufacturing
and production organisations are three times
more likely than public sector organisations to
include recruitment agencies among their most
effective methods for attracting candidates
bull Overall a third of organisations report they
have reduced their use of recruitment partners
however one in five report they have formed
a closer business partnership with them over
the past year and one in ten that they consider
them integral to attracting top talent
bull Competency-based interviews (70) interviews
following the contents of CVsapplication forms
(63) and structured interviews (56) are as
last year the most common methods used to
select applicants
bull Two-fifths of organisations report they use
a strengths-based approach to recruitment
although it is less commonly used in the public
sector (26)
bull The median recruitment cost of filling a vacancy
is pound7500 for senior managersdirectors and pound2500
for other employees (adjusting for accuracy)
showing reductions compared with last year
Resourcing in turbulent times bull Half of the organisations surveyed report the
economic climate has had a negative impact
on their organisationsrsquo resourcing budgets for
2011ndash12 This year it is the public sector that is
most severely hit with four out of five (82)
reporting their resourcing budgets will be
reduced (up from 59 last year)
bull Changes in resourcing and talent practices in
2011 compared with 2010 reflect a stronger
focus on costs and reductions in budgets More
organisations anticipate they will be focusing
on developing talent in-house retaining rather
than recruiting talent and reducing their
reliance on recruitment agencies and external
consultants for resourcing and development
bull Nearly half of public sector organisations will
be implementing a recruitment freeze in 2011
compared with one-fifth of organisations
overall Two-thirds of public sector
organisations and 29 of private organisations
will be reducing the number of new recruits
they hire
bull The volume of applicants for vacancies has
increased reflecting the high unemployment
rate Three-quarters of organisations have
noticed an increase in the number of
unsuitable applicants and a third report that
there are too many suitable candidates to
choose from Despite high unemployment
over the last two years more than half (52)
believe that competition for talent is even
greater as the pool of available talent to hire
has fallen sharply (2010 41 2009 20)
bull Most organisations remain focused on
managing talent despite increased attention
on reducing costs with only 4 reporting
that their focus on talent has decreased
Nevertheless 18 of organisations (32 of the
public sector) have reduced their overall talent
management spend as a consequence of the
economic downturn
cipd
cou
k2011resou
rcing
and
talentp
lann
ing
survey
6
RESOURCING AND TALENT PLANNING
Diversity bull Overall in little change from previous years
just over half of organisations have a diversity
strategy rising to 90 of public sector
organisations
bull Our figures indicate a reduction in the use of
several methods to address diversity issues this
year particularly in the public sector which has
traditionally led the way in diversity practice
Labour turnover bull The median labour turnover rate has decreased
over the past few years (2011 125 2010
135 2009 157 2008 173)
bull Smaller organisations are most likely to report
that their labour turnover has increased and
larger organisations that it has decreased
bull As in previous years the majority of turnover
is attributed to employees leaving voluntarily
The rate of voluntary leavers has increased
slightly in the private sector compared with last
year but decreased in the voluntary and public
services sector reflecting the growthcuts in the
respective sectors
bull The proportion of organisations making ten
or more redundancies over the past year has
reduced from 33 in 2009 to 12 in 2010
Employee retention bull Only two-fifths (42) of organisations
experienced no difficulties in retaining staff
during 2010 a similar figure to the previous
year Managers and professionalsspecialists and
technical employees remain the most difficult
categories of staff to retain
bull Most organisations have taken one or more
steps to address staff retention however nearly
one in four organisations (a similar proportion
to the previous year) report that no specific
retention initiatives were undertaken in 2010
bull The most frequently cited actions taken by
employers to address retention ndash improving
the people management skills of line managers
and increased learning and development
opportunities ndash are the methods most
commonly rated most effective Improving the
induction process is also commonly used to
address retention but views on its effectiveness
are more mixed
2011
1 RECRUITING EmPLOyEES
This section explores trends and developments in recruitment strategies and activity within UK organisations during 2010 It examines the adoption of formal resourcing strategies changes in the number of job vacancies organisations attempted to fill the extent and nature of recruitment difficulties over the past year and the strategies employers use to overcome these challenges It also includes developments in graduate recruitment the most effective approaches for attracting applicants and the methods used for selection For the first time we explore the nature of job vacancies the length of the recruitment process the employment of younger workers changing relationships with recruitment partners and efforts to improve the employer brand Finally the costs associated with recruitment are discussed
Resourcing strategies Just over half of respondents surveyed report their
organisation has a formal resourcing strategy
in place a similar proportion to last year (2011
Table 1 Organisations with formal resourcing strategies in place by size ()
Size ndash number of employees in UK 54 2010 56 2009 58) The likelihood of
organisations having a formal strategy in place
increases with organisational size as was the case
last year (Table 1)1 There are no significant sector
differences
Fewer than 10 26
10ndash49 38
50ndash249 46
250ndash999 55
1000ndash4999 68
More than 5000 85
RESO
UR
CIN
G A
ND
TALE
NT P
LAN
NIN
G 2
011
Base 604
7
8
RESOURCING AND TALENT PLANNING
The number and nature of job vacancies There is considerable variation in the number
of vacancies respondentsrsquo organisations tried
to fill in 2010 partly because the number of
vacancies is strongly related to organisation size
(Table 2)2 Overall the median number of vacancies
has fallen from 30 in 2008 to 20 over the past two
years as the recession affected increasing numbers
of organisations (Table 2)
While there is no overall change from last year
in the median number of vacancies organisations
tried to fill there has been a substantial fall in the
proportion of vacancies very large organisations
(5000+ UK employees) attempted to fill from
a median of 550 in 2009 to 200 in 2010 (800 in
2008) The reduction in vacancies in very large
organisations is striking in the private and public
sectors but particularly in the latter where
the median number of vacancies organisations
attempted to fill in 2010 was less than a third than
in 2009 This reflects the sluggish growth in the
private sector and in particular the significant
cuts in public sector budgets
Table 2 Median number of vacancies respondents tried to fill by size of organisation and sector
2011 survey 2010 survey 2009 survey
No of permanent staff employed in UK All Private
sector Public
services All Private sector
Public services All Private
sector Public
services
Median Median Median Median Median Median Median Median Median
1ndash49 3 3 1 3 3 2
50ndash249 12 12 10 12 10 14 10 10 8
250ndash999 45 50 30 46 45 50 60 52 70
1000ndash4999 110 150 55 100 100 100 300 300 300
More than 5000 200 500 150 550 850 500 800 800 550
All organisations 20 20 30 20 20 80 30 20 100 Base 577 (2011) 442 (2010) 683 (2009)
The categories for number of permanent staff employed in the UK differed slightly in the 2009 survey (250 or fewer 251ndash500
501ndash1000 1001ndash5000 5001ndash10000 10001+) 2009 categories have been combined where appropriate and otherwise matched with
the best corresponding category of 20112010
cipd
cou
k2011resou
rcing
and
talentp
lann
ing
survey
2011 Overall nearly three-quarters (73) of permanent
vacancies were filled with external candidates
Larger organisations with a wide range of
talent to choose from are more likely to recruit
internally than smaller organisations3 Public sector
organisations particularly those with more than
1000 UK employees are more likely to recruit
internally than the private sector (Table 3)4
Organisations are divided in their use of temporary
contracts More than a quarter (28) have
employed more people on temporary contracts
in 2010 compared with the previous year while
a similar proportion (27) have employed fewer
people on temporary contracts (45 remain
the same) Manufacturing and production
organisations are most likely to have increased
their use of temporary contracts and the public
services the least perhaps reflecting their reduced
recruitment generally (Figure 1)5
Table 3 Average percentage of job vacancies filled internally
Voluntary No of permanent staff community and not-employed in UK Private sector Public services for-profit All
Mean Mean Mean Mean
1ndash49 15 17 7 13
50ndash249 20 28 23 21
250ndash999 24 29 24 24
1000ndash4999 35 58 12 39
More than 5000 47 62 33 53
All organisations 25 45 19 27 Base 533
figure 1 Use of temporary contracts by sector in 2010 compared with the previous year ()
Manufacturing and production
Private sector services
Public services
Voluntary community and not-for-profit
More Same Less
Base 610
25
27
37
22
3837
50
32
50
23
31
28
RESO
UR
CIN
G A
ND
TALE
NT P
LAN
NIN
G 2
011
9
10
RESOURCING AND TALENT PLANNING
Sector-specific experience is an essential
requirement of candidates in three-fifths (60) of
organisations overall While our figures suggest
it is less commonly required in the public sector
(48 compared with 59 of the voluntary
community and not-for-profit sector and 63
of the private sector)6 there are also substantial
differences within sectors For example specific
sector experience is essential for the majority
of organisations operating in the chemical
construction or mining industries and professional
services but not for those in general manufacturing
or retail and wholesale Similarly within the public
sector it is deemed particularly essential for health
and education organisations but less so for those in
central or local government
Employing younger workers Figures from the Office for National Statistics
show that while total unemployment fell during
the three months to February 2011 youth
unemployment rose to a record level of almost 1
million equating to one in five economically active
16ndash24-year-olds out of work Moreover concerns
have been raised as to whether high youth
unemployment will be further compounded by the
abolition of the Default Retirement Age later this
year and the increase in university tuition fees This
year we included new questions in the survey to
explore these issues
One in six organisations (17) report they are
employing more 16ndash24-year-olds compared with
one year ago this compares with less than one
in eight (12) who are employing fewer young
people (72 are employing the same number) The
employment of younger workers has reduced most
in the public sector where one in four reports a
decrease compared with one in ten who reports an
increase (Table 4)7 This is likely to reflect a general
reduction in recruitment in this sector
Overall one-quarter of organisations expect the
abolition of the Default Retirement Age will mean
they recruit fewer people however the figure
rises to nearly half of public sector organisations
It does not appear however that the abolition of
the Default Retirement Age will have a particular
impact on the recruitment of young people with
only one in ten organisations reporting it will result
in fewer 16ndash24-year-olds being recruited (Table 4)
cipd
cou
k2011resou
rcing
and
talentp
lann
ing
survey
Table 4 The employment of younger workers ()
Voluntary Manufacturing community
All and Private sector and respondents production services Public services not-for-profit
Percentage employing fewer 16ndash24-year-olds than one year ago
Percentage agreeing the abolition of the Default Retirement Age means they will recruit fewer 16ndash24-year-olds
Percentage agreeing the abolition of the Default Retirement Age means they will recruit fewer people
12 10 9 25 10
11 18 6 17 9
23 25 15 48 22
Base 605
2011 Graduate recruitment Two-fifths of organisations (39) are concerned
that the increase in university tuition fees will
have an impact on the number of graduates in
the marketplace Public sector organisations are
particularly concerned (49 compared with 34
of private sector services 42 of not-for-profits
and 43 of manufacturing and production
organisations)8
Perhaps in order to address this deficit or in
response to additional government support to
boost apprenticeship schemes a third of public
sector organisations nearly half of manufacturing
and production and about a quarter of private
sector services and not-for-profit organisations
are considering increasing apprenticeship schemes
(Table 5) About a quarter of organisations overall
are considering increasing their use of internships
although the proportion is markedly lower in the
public sector Overall one in ten organisations are
considering sponsoring students through university
but the proportion doubles in manufacturing and
production where the lack of appropriate skills is
a common cause of recruitment difficulties (Table
5 see also Tables 8 and 9) Larger organisations are
also more likely to consider sponsoring students
through university (19 of those with more than
5000 employees)9
Overall just over a quarter of organisations
operate a structured graduate recruitment
programme (Table 6) The operation of
these programmes is significantly related to
organisation size (Figure 2)10 They also appear
to be most common in the manufacturing
and production sector as last year when a
step increase in their use was noted (Table 6)
It appears that this sector is investing in the
development of skills to address their deficit
in the workforce generally As in previous
years voluntary community and not-for-profit
organisations are least likely to operate a
structured graduate recruitment programme11
Table 5 Activities organisations are considering ()
Voluntary Manufacturing community
All and Private sector and respondents production services Public services not-for-profit
Increasing apprenticeship schemes 30 48 24 33 27
Increasing your use of internships 22 27 23 12 27
Sponsoring students through university 10 20 8 12 1
Base 615
Table 6 Organisations operating a structured graduate recruitment programme by sector ()
2011 2010 2009 2008
All 27 34 22 23
Sector
Manufacturing and production 35 35 23 24
Private sector services 29 37 24 27
Voluntary community and not-for-profit 6 18 5 7
Public services 26 33 23 24
RESO
UR
CIN
G A
ND
TALE
NT P
LAN
NIN
G 2
011
Base 614 (2011) 472 (2010) 752 (2009)
11
cipd
cou
k2011resou
rcing
and
talentp
lann
ing
survey
12
RESOURCING AND TALENT PLANNING
The majority of respondents from organisations
without a recruitment programme for graduates
report that their organisation has never had such
a programme or not had one for some time (97)
Even in the cash-strapped public sector only 3
report they have closed their graduate recruitment
programme in the last 12 months
Nearly a third (31) of organisations who have a
graduate recruitment programme have increased
their intake over the past year while a quarter
have reduced their intake (24) This shows an
improvement on the previous year at the height of
the recession when 43 had reduced their intake
The impact of the budget cuts in the public sector
are however clearly apparent as more than twice
as many organisations in this sector (50 compared
with 20 in the private and not-for-profit sectors)
have reduced their graduate intake
Length of recruitment process One in three (31) organisations report that the
length of their recruitment process has led to the
loss of potential recruits This issue appears to be
exacerbated by organisation size Nearly half of
organisations with more than 5000 employees
report that the length of their recruitment process
has led to the loss of potential recruits compared
with 38 of those in organisations of 250ndash999
employees and just 15 of organisations with
fewer than 50 employees12 There are no significant
sector differences
Recruitment difficulties Three-quarters of organisations with vacancies
report difficulties in filling at least some over the
past few months (75) This is an increase on last
year (2010 68) and may reflect the decrease in
unemployment in the first few months of 2011
It is less however than in previous years perhaps
because organisations were attempting to fill fewer
vacancies (2009 81 2008 86)
figure 2 Organisations operating a structured graduate recruitment programme by size ()
Number of UK employees
39
42
9Fewer than 50
17
1650ndash249
21
29 250ndash999
1000ndash4999 47
61 More than 5000
62
10 40 50 60 70 80
2011
0 3020 Percentage
2010
Base 609 (2011) 466 (2010)
2011 The private sector particularly manufacturing and
production organisations are most likely to have
difficulties filling vacancies (Table 7)13 Table 8
shows that over half of organisations in this sector
have difficulty filling technical vacancies and this
may reflect specific skills shortages in the UK The
most difficult category of staff to recruit in other
sectors is managers and professionalsspecialists
as was the case last year In general there is little
change in the categories of vacancies that are most
difficult to recruit for compared with last year
As would be expected given the cuts to
public sector budgets one in ten public sector
organisations report they did not have any
vacancies to fill twice as many as last year There is
little change in this regard in the other sectors
Table 9 shows the reasons respondents cite for their
recruitment difficulties The findings are similar
to previous years Lack of necessary specialist or
technical skills remains by far the most frequently
cited cause of difficulties reported by nearly
three-quarters of respondents (2011 72 2010
67 2009 73 2008 70) This is particularly
an issue for the manufacturing and production
sector and the public services sector where there
is a particularly high demand for such skills Lack
of formal qualifications is far less of an issue
These findings support arguments for greater
collaboration between industry and academic
institutions and more vocational training in order
to meet organisationsrsquo skill requirements
Higher pay expectations than the organisation
could offer and lack of experience are the next
most frequently cited causes of recruitment
problems (46 and 40 respectively) Interestingly
these are less of an issue in the public sector
perhaps because public sector applicants have
different expectations of pay or because some pay
scales are set at a national level Lack of experience
may be less of an issue than the necessary skills or
qualifications required in many public sector roles
The proportion reporting their recruitment
problems are due to potential candidatesrsquo
reluctance to move in the current economic climate
has decreased from just over a quarter in 2010 to
19 this year Economic growth albeit slow is
likely to be responsible for this reduction but the
lsquohangoverrsquo of the recession is highlighted as one in
five organisations still blame the economic climate
for their recruitment problems Despite high
unemployment 15 of respondents report they
have experienced problems due to no applicants In
line with last yearrsquos findings this is particularly an
issue for the public sector (22) which is also more
likely to report the image of their sectoroccupation
is a problem (22)
Table 7 Organisations experiencing difficulties recruiting for one or more category of vacancy by organisation size ( of those that have had vacancies to fill)
Voluntary Manufacturing community
and Private sector and All 2011 production services Public services not-for-profit
Difficulty filling one or 75 88 77 66 62more vacancies
No difficulties experienced 25 12 23 34 38
Base 561
RESO
UR
CIN
G A
ND
TALE
NT P
LAN
NIN
G 2
011
13
14
RESOURCING AND TALENT PLANNING
Table 8 Categories of vacancy that proved particularly difficult to fill ( of respondents)
Voluntary community
Manufacturing Private and and sector Public not-for-
All 2011 production services services profit All 2010
Other managers and professionalsspecialists
34 41 33 27 34 37
Technical 30 53 29 20 16 28
Senior managers directors
14 13 16 10 16 16
Services (customer personal protective 7 6 8 3 5 5 and sales)
Administrative secretarial
4 3 4 4 4 3
Manualcraft workers 4 11 3 1 0 2
Other 6 5 3 10 11 4
No difficulties experienced
23 12 22 30 38 25
No vacancies to fill 6 3 7 10 1 6 Base 597 (2011) 468 (2010)
Voluntary community
Manufacturing Private and All and sector Public not-for- All
2011 production services services profit 2010
Table 9 Reasons for recruitment difficulties ()
cipd
cou
k2011resou
rcing
and
talentp
lann
ing
survey
Lack of necessary specialist or technical skills 72 82 69 80 59 67
Look for more pay than you could offer 46 47 48 34 52 39
Lack of experience 40 42 43 27 41 36
Reluctance to move in current economic climate 19 24 18 17 15 26
Lack of interpersonal skills 16 9 19 10 20 12
No applicants 15 9 16 22 20 15
Image of sector occupationorganisation 13 7 12 22 11 12
Relocation difficulties 9 19 6 10 7 8
Lack of formal qualifications 7 7 7 5 7 4
The impact of the immigration cap 3 2 4 3 4
Other 4 3 3 8 7 7
Base 427 (2011) 330 (2010)
new item introduced in 2011
2011 Improving the employer brand Nearly three-quarters of organisations have made
efforts to improve their employer brand over the
past year (Table 10) The larger the organisation
the more likely it is to have undertaken one or
more activities to improve its brand Two-fifths of
small organisations with fewer than 50 employees
report they have taken no action to improve their
employer brand compared with one-quarter of
organisations with 250ndash999 employees and one-
sixth of those with more than 5000 employees
There are no significant sector differences
The most popular approaches to improving
employer brand are employee surveys and
developing online careers sites with larger
organisations most likely to have adopted these
methods14 The public sector is most likely to
have introduced or extended flexible working
homeworking15 whereas the private sector is
more likely to have made efforts to improve its
brand through working with charities or corporate
sponsorship16 Voluntary community and not-forshy
profit organisations are most likely to have used
placement students to improve their brand17
Attracting candidates The effectiveness of methods to attract applicants
varies according to sector and organisation size
(Table 11) Overall the most effective method is
through organisationsrsquo own corporate websites
as was the case last year The effectiveness of this
method increases with organisation size probably
due to the increased brand awareness and
perhaps because larger organisations have more
advanced websites18
The private sector particularly manufacturing
and production organisations is three times
more likely than public sector organisations to
report recruitment agencies among their most
effective methods and twice as likely as voluntary
sector organisations (regardless of size) Search
consultants and employee referral schemes are also
notably more popular in the private sector than in
the public or voluntary sectors
In contrast the public and voluntary sectors are
more likely to find the press effective for attracting
applicants including local and national newspaper
advertisements and specialist journalstrade press
Secondments are also deemed to be more effective
in these sectors than in the private sector
Table 10 Work undertaken over last year to improve employer brand ()
Voluntary community
All Private Public and 2011 sector services not-for-profit
Employee surveys 39 39 38 43
Developing online careers site 30 33 23 29
Introducingextending flexible working homeworking 24 20 39 29
Placement students 23 21 19 35
Graduate careers fairs 15 17 11 8
Working with charities 14 16 8 6
Corporate sponsorship 11 13 2 8
Introducing sabbaticals 3 4 1 5
Other 7 6 6 10
No action taken to improve employer brand 27 28 29 22
RESO
UR
CIN
G A
ND
TALE
NT P
LAN
NIN
G 2
011
Base 601
15
16
RESOURCING AND TALENT PLANNING
Table 11 Most effective methods for attracting applications by industry sector ()
Sector 2011 Number of UK employees 2011
All
2010
All
2011
Man
ufa
ctu
rin
gan
d p
rod
uct
ion
Priv
ate
sect
or
serv
ices
Pub
lic s
ervi
ces
Vo
lun
tary
co
mm
un
ity
and
no
t-fo
r-p
rofi
t
1ndash49
50ndash2
49
250ndash
999
100
0ndash4
999
Mo
re t
han
500
0
Own corporate website 63 59 44 57 77 66 42 55 57 77 79
Recruitment agencies 60 54 77 62 22 30 39 59 66 51 41
Local newspaper advertisements 36 32 38 23 41 51 28 35 35 29 29
Employee referral scheme 35 29 33 38 5 14 20 33 27 32 29
Commercial job boards 33 27 33 29 14 29 21 27 25 42 26
Specialist journalstrade press 31 27 24 23 30 43 26 23 32 32 24
Encourage speculative applicationsword of mouth 24 25 30 29 9 23 27 31 23 19 19
Jobcentre Plus 23 25 24 24 22 34 16 29 21 25 32
Professional networking (such as LinkedIn) 14 16 11 23 5 9 28 13 13 18 17
Search consultants 22 15 24 17 5 4 14 11 17 18 15
Links with schoolscollegesuniversities 18 13 16 13 9 17 12 13 11 18 15
Apprenticeships 12 11 19 9 13 9 10 10 11 12 17
National newspaper advertisements 16 11 4 6 23 29 10 9 15 10 15
Secondments 11 11 7 8 21 12 2 9 13 11 19
Links with other local organisations making redundancies 7 13 5 7 9 6 5 9 11 8
Alumni (previous employees) 5 5 6 7 2 1 7 2 6 11 3
Social networking sites (such as Facebook) 3 4 4 5 3 4 3 2 2 8 12
Local Employment Partnership (LEP) 6 3 1 4 2 5 1 2 3 4 9
Other 5 5 2 3 12 6 8 3 4 4 5
cipd
cou
k2011resou
rcing
and
talentp
lann
ing
survey
Base 604 (2011) 464 (2010)
new item introduced in 2011
Despite the popularity of social networking
sites such as Facebook they are not seen to be
particularly effective for attracting candidates
Professional networking sites such as LinkedIn are
more popular particularly in the private services
sector although there has only been a small
percentage increase in their reported effectiveness
compared with last year
2011 Recruitment partners A new question this year asked respondents if their
attitude to and relationships with recruitment
partners has changed over the past 12 months Just
over a third report things have not changed
(Table 12) A similar proportion report they have
reduced their use of recruitment partners and 6
that they have stopped using them altogether
with one in ten considering them an unaffordable
expense (one in five in the not-for-profit sector)
and a similar proportion an unnecessary expense
In contrast one in five (predominantly private
sector organisations) report they have formed
a closer business partnership with recruitment
partners over the past year and one in ten (again
predominantly private sector organisations) report
they consider them integral to attracting top talent
Selecting candidates There has been little change in the methods used
to select candidates over the past few years with
the exception of a drop in the use of general
ability tests compared with 2009 (Table 13)
Interviews remain the most common selection
method with competency-based interviews
being most popular overall Interviews following
the contents of CVsapplication forms are also
particularly popular in the private sector (70
compared with 41 in the public sector and 57
in the not-for-profit sector) whereas the public
and not-for-profit sectors favour structured (panel)
interviews (82 and 79 respectively compared
with 45 in the private sector)
Tests for specific job-related skills are more popular
in the public and not-for-profit sectors (61 and
62 respectively compared with 43 in the private
sector) whereas telephone interviews are more
popular in the private sector (52 compared with
12 in the public sector and 26 in the not-forshy
profit sector)
Table 12 Changes in attitudes to and relationships with recruitment partners over the past 12 months ()
Voluntary community
All Private Public and 2011 sector services not-for-profit
Not changed 36 34 40 39
Reduced use of recruitment partners 32 34 32 26
Formed a closer business partnership with them 19 23 8 12
Consider them an unnecessary expense 12 11 13 16
Consider them an unaffordable expense 11 10 11 22
Consider them integral to attracting top talent 9 11 2 4
Stopped using recruitment partners 6 5 8 5
Other 3 3 3 3 Base 604
RESO
UR
CIN
G A
ND
TALE
NT P
LAN
NIN
G 2
011
17
18
RESOURCING AND TALENT PLANNING
Table 13 Methods used to select applicants ()
2011 2010 2009 survey survey survey
Competency-based interviews 70 78 69
Interviews following contents of CVapplication form 63 64 68
Structured interviews (panel) 56 61 59
Tests for specific job-related skills 49 48 50
Telephone interviews 43 47 38
Literacy andor numeracy tests 38 43 39
Personalityaptitudepsychometric questionnaires 35 44 35
Assessment centres 35 42 35
Pre-application eliminationprogression question(s) 25 32 NA
General ability tests 23 27 44
Group exercises (for example role-playing) 21 30 26
Pre-interview references (academic or employment) 9 16 19
Video CVs 0 1 NA
Other 3 4 6
cipd
cou
k2011resou
rcing
and
talentp
lann
ing
survey
Base 605 (2011) 473 (2010) 754 (2009)
Strengths-based recruitment Two-fifths of organisations (40) report they use a
strengths-based approach to recruitment although
it is less commonly used in the public sector (26)19
In all sectors smaller organisations are most likely
to report they use a strengths-based approach
(60 of organisations with 1ndash49 employees use it
compared with 34 of organisations with 250ndash999
employees and 24 of organisations with more
than 5000 employees)20
Most of those who use a strengths-based approach
to recruitment are neutral about how easy it is to
administer in practice regardless of sector or size
Nearly a third (32) find it easy or very easy and
only one in ten (11) find it difficult
Over three-quarters of those who use a strengths-
based approach to recruitment believe it
brings benefits in terms of increased individual
performance (78) Two-thirds believe it improves
retention (67) and increases engagement (63)
Two-fifths (39) report it results in greater diversity
of skills in the workplace
Many organisations that use a strengths-based
approach to recruitment also use a strengths-based
approach for other people processes More than
half use it for performance management processes
(59) succession planning (55) and learning and
development (53) Two-fifths use it for talent
management (42) and a third use it for workforce
planning (32) Just under three in ten (29) also
use it for redeployment
Recruitment costs Last year we noted an increase in the proportion
of organisations that calculate their recruitment
costs (2010 65 2009 53 2008 51) This year
the proportion is back in line with previous years
(52) The increase last year may have been due
to sampling differences or a consequence of an
increased focus on costs during the recession that
has not continued
Four-fifths (79) of organisations that calculate
recruitment costs provided cost estimates per
hire There is considerable variance in the amount
organisations spend (at least partly due to our
2011 findings that organisations include different costs
in their calculations see Table 14) In general
the median figures (Table 15) are lower than last
year for both senior managerdirectors and other
employees
In order to explore the validity of estimates this
year we also asked respondents to indicate how
accurate their cost estimates were Half (51) of
estimates for costs of recruiting senior managers
directors were accurate to plus or minus 10 and
83 to plus or minus 20 Two-fifths of estimates
for other employees were accurate to plus or minus
10 and 74 to plus or minus 20 Table 16
shows the median figures for estimates that were
believed to be accurate to up to plus or minus 20
The figures indicate as we found last year that
organisations spend considerably more on senior
appointments than on other employees This
reflects the value attached to good leadership and
perhaps the additional challenges of attracting
the best candidates for senior positions This is
particularly the case in the private sector where
considerably more is spent on the recruitment of
senior managersdirectors than in the public or not-
for-profit sectors
Table 14 Criteria included in cost per hire calculations ()
Size ndash number of employees in UK
Advertising costs
Agencysearch costs
Employee referrals
Travel expenses
Relocation expenses
Fixed costs of resourcing team
Opportunity costs of hiring managers time
Other
Dont know Base 299
81
75
35
30
17
24
24
3
4
Table 15 Estimated total costs (advertising costs agency or search fees) per hire (pound)
Median 2011 Median 2010 (no of (no of
Occupational group respondents) Minimum Maximum respondents)
Senior managersdirectors 7000 (219) 251 55000 8333 (234)
Other employees 2000 (246) 150 32000 2930 (262) Number of respondents shown in brackets
Table 16 Median total costs (advertising costs agency or search fees) per hire for estimates accurate to plus or minus 20 (pound)
Voluntary
Median 2011 Manufacturing
and Private Public
community and not-for-
Occupational group production sector services profit
RESO
UR
CIN
G A
ND
TALE
NT P
LAN
NIN
G 2
011
Senior managersdirectors 7500 8000 9000 5000 3500
Other employees 2500 3400 2000 3000 1500 Base 150
19
cipd
cou
k2011resou
rcing
and
talentp
lann
ing
survey
20
RESOURCING AND TALENT PLANNING
2 RESOURCING AND TALENT mANAGEmENT IN TURBULENT TImES
In January 2010 the UK officially emerged from the recession however the economic environment remains uncertain for many organisations The environmental disasters in Japan the uprisings and wars in the Middle East rising oil prices and European debt highlight the volatility of global markets In the UK economic growth remains sluggish and there are concerns regarding the impact of the VAT increases high inflation and the austerity measures of the Coalition Government This section examines the impact of the economic environment on resourcing budgets strategies and activities in 2010 It looks at changes in views on the employment market and the implications for managing talent
The impact of the economic climate on resourcing Overall half of organisations report that the
economic climate has had a negative impact on
their organisationsrsquo resourcing budgets for 2011ndash12
(Table 17) This year however it is the public
sector that is most severely hit with four-fifths
(82) reporting their resourcing budgets will be
reduced (up from 59 last year) In contrast fewer
private and not-for-profit sector organisations
face reductions this year compared with last
although more are still reducing their budgets than
increasing them
Changes in resourcing and talent practices in
2011 compared with 2010 reflect a stronger
focus on costs and reductions in budgets (Figure
3) Two-thirds plan to develop more talent inshy
house (compared with one-third in 2010) and
more organisations plan to reduce reliance on
recruitment agencies and external consultants for
resourcing and development The proportion of
organisations planning to focus more on retaining
rather than recruiting talent has increased to 51
in 2011 from 28 in 2010
2011 Changes in recruitment practices are also
anticipated More organisations plan to make use
of new mediatechnology to recruit which may
be a cost-cutting strategy but can also improve
the efficiency and effectiveness of the recruitment
process On a positive note more organisations plan
to invest more time and effort in the quality of
candidates they hire and will be taking actions to
improve ways of identifying quality candidates
Public sector organisations are more than twice
as likely to be implementing a recruitment freeze
in 2011 (46 compared with 22 overall)
Nevertheless this is an improvement on 2010 when
58 of public sector organisations implemented a
recruitment freeze The situation is also somewhat
brighter for many private sector organisations
with 15 reporting they will be implementing a
recruitment freeze in 2011 compared with 26
in 2010 Nevertheless the economic recovery
remains slow for many with 29 of private
sector organisations and 66 of public sector
organisations reporting they will be reducing the
number of new recruits they hire in 2011 similar
proportions to 2010 Inevitably more public than
private sector organisations report they will be
reducing their headcount in 2011 and losing key
talent (33 compared with 9 in the private
sector) and redeploying people into new roles (66
compared with 37 in the private sector)
Table 17 Impact of the current economic climate on organisationsrsquo resourcing budgets ()
Private Public Voluntary community All sector services and not-for-profit
2011 2010 2011 2010 2011 2010 2011 2010
Reduced 49 53 41 51 82 59 51 61
Stayed about the same 36 37 39 40 14 36 40 34
Increased 8 7 11 4 1 5 4 5
Dont know 7 3 8 5 3 5 Base 615 (2011) 475 (2010)
RESO
UR
CIN
G A
ND
TALE
NT P
LAN
NIN
G 2
011
21
cipd
cou
k2011resou
rcing
and
talentp
lann
ing
survey
22
RESOURCING AND TALENT PLANNING
figure 3 Resourcing and talent practices implemented in 2011 and 2010 ( of respondents)
Developing more talent in-house
Continuing to recruit key talentniche areas
Focusing more on retaining rather than recruiting talent
Reducing reliance on recruitment agencies
Use of new mediatechnology to recruit
Investing more time and effort in the quality of candidates we hire
Redeploying people into new roles
Reducing the number of new recruits we hire
Taking actions to improve ways of identifying quality candidates
Increasing the number of interimcontract staff recruited
Reducing our use of external consultants for resourcing and development
Increased recruitment of apprenticesinterns
Implementing a recruitment freeze
Reducing our headcount but preserving key talent
Recruiting talent discarded by competitors
Reducing our headcount and losing key talent
Offering sabbaticals career breaks additional holidays
Reducing employees working hours to avoid making people redundant
8Reducing graduate recruitment 8
6Suspending graduate recruitment 7
36
28
36
28
26
30
35 35
35 15
29 23
28 19
24 12
22 30
22 16
18 11
13 12 12
10
12 10
66
59 46
51
47
46
45
44
0 10 20 30 40 50 60 70 80 Percentage of respondents
2011 2010
Base 582
RESO
UR
CIN
G A
ND
TALE
NT P
LAN
NIN
G 2
011
23
2011 Views on the employment market In little change to last year three-quarters of
organisations report they have noticed an increase
in the number of unsuitable applicants as they have
fewer roles to fill (Figure 4) Far fewer (34) report
that there are too many suitable candidates to
choose from and despite high unemployment over
the past two years more than half (52) believe that
competition for talent is even greater as the pool of
available talent to hire has fallen sharply (2010 41
2009 20) For many organisations there appears a
clear mismatch between the skills they require and
those available in the labour market
Competition for talent appears to be particularly
keen in the private sector Two-thirds (64) of
manufacturing and production organisations
and 55 of private services organisations agree
that competition for talent is even greater now
compared with 39 of the public sector and 34
of not-for-profits21 In contrast the public sector
and not-for-profits are more likely to agree they
have too many suitable candidates to choose
from (61 and 47 respectively compared with
23 of manufacturing and production and 27
of private sector services)22
Three-fifths (62) of respondents agree that the
demand for temporary and contract workers will
increase as employers will be reluctant to take
on permanent staff during uncertain times while
44 agree that part-time workers will become
more appealing to employers who are looking to
cut costs
figure 4 Views on the employment market ( agreeing or strongly agreeing)
With fewer roles to fill we have noticed an increase in the number
of unsuitable applicants
The demand for temporary and contract workers will increase as employers will be reluctant to
take on permanent staff during uncertain times
Employers will use the economic downturn as an opportunity to get rid of poor performers
and bring about culture change
Competition for talent is even greater now as the pool of available talent to hire has
fallen sharply
Part-time workers will become more appealing to employers who are looking to cut costs
Employers are acting too hastily in making people redundant and as a result they will lose too
many employees with valuable knowledge and skills
With fewer roles to fill there are now too many suitable candidates to choose between
The abolition of the Default Retirement Age will mean we recruit fewer people
Employers will look to make older workers over the age of 65 redundant before their younger workers
73 76
54
62 66 66
55 63
72
52 41
20
44 45
52
44 48
53
34 32
23
19 22
27
0 10 20 30 40 50 60 70 80 Percentage of respondents
2011 2010 2009
Base 607 (2011) 475 (2010) 746 (2009)
item added 20102011
24
RESOURCING AND TALENT PLANNING
More than half of respondents (55) across
all sectors believe that employers will use the
economic downturn as an opportunity to get rid of
poor performers and bring about culture change
While high this shows a downward trend on the
past two years (2010 63 2009 72 agree or
strongly agree) perhaps reflecting a slowing in
the number of redundancies Similarly there is
a gradual downward trend in the proportion of
respondents who express concern that employers
are acting too hastily in making people redundant
and as a result they will lose too many employees
with valuable knowledge and skills or that
employers will look to make older workers over the
age of 65 redundant before their younger workers
Nearly a quarter (23) of respondents believe
that the abolition of the Default Retirement Age
will mean they recruit fewer people (48 in the
public sector)23
Implications for talent management The value of effective talent management has
not been lost in the recent attention on reducing
costs Two-fifths (41) of organisations report
that the current economic situation has led
to an increased focus on talent management
(43 in 2010) and only 4 that it has led to a
decreased focus (7 in 2010) with no significant
differences across sectors Unsurprisingly however
the public sector are about twice as likely this
year to report they have reduced their overall
talent management spend due to the downturn
compared with other sectors (Table 18)24
The proportion of organisations that report
the economic downturn has had an impact on
approaches to reward across the business has
slightly reduced compared with last year (54
compared with 61 in 2010) As last year it
appears that organisations across all sectors
are being more selective in who they reward A
smaller proportion of organisations report their
approach to reward for individuals identified as
talent has been affected by the downturn (42)
than report their approach to reward across the
business has been affected (54)
Table 18 Has your overall talent management spend been reduced due to the economic downturn ()
cipd
cou
k2011resou
rcing
and
talentp
lann
ing
survey
Voluntary All community and All
2011 Private sector Public sector not-for-profit 2010
Yes 18 17 32 13 23
No 38 43 16 32 41
NA (no talent management spend) 44 40 52 55 36
Base 617 (2011) 471 (2010)
RESO
UR
CIN
G A
ND
TALE
NT P
LAN
NIN
G 2
011
25
2011
Case study Innovative recruitment and cost saving in the Association of Greater Manchester Authorities
The Association of Greater Manchester Authorities (AGMA) represents the ten local authorities in
Greater Manchester and works in partnership with a wider group of associate councils and public
sector organisations AGMA chief executives and council leaders work together on a range of key
strategic and policy issues which impact on Greater Manchester including resourcing strategies
and recruitment and retention issues
The AGMA initiative in cost reduction in the area of resourcing has been described as lsquoa truly
pioneering example of collaboration between a number of local authoritiesrsquo and is already
delivering against a range of objectives
The initial aim was to make a significant saving on the pound5ndash6 million annual cost of external
media advertising reported in 2008ndash09 and to create a more efficient and effective recruitment
system A shared portal was commissioned to offer a front-end website (wwwyourcounciljobs
couk) with a lsquoback-officersquo e-recruitment system which would give a standardised shared-service
approach for job applicants across councils Some of the benefits for applicants include the ability
to go to one place to register their interest to be able to look in specific categories for jobs
of particular relevance to them to be able to amend an existing application form in order to
apply for a further post and to receive email alerts when new jobs relevant to their interests are
posted In addition communications to job-seekers are now standardised for every council
This approach has seen real benefits across each of the local authorities workflows are now
standardised as every HR team runs identical systems and there is consistency in reporting within
all councils enabling them to benchmark their processes more clearly The councils use this
benchmarking data to make additional improvements and efficiencies
Jayne Whitehead AGMA Category Procurement Manager has project-managed the initiative
with managers represented from each participating authority and describes the process as one
of lsquotrue collaborationrsquo with lsquo100 commitmentrsquo from all the councils involved The benefits
are clear annual media costs are dramatically reduced to approximately pound250000 across ten
partner organisations and there has been a reduction in time-to-hire of 13 days This has had
the knock-on effect of reducing expenditure on agency staff The average cost of a recruitment
advertisement per role was previously pound97400 it is now pound15200 There have also been benefits
outside the original intention including doubling the number of online applications for council
posts with administrative cost savings in HR of approximately pound250000 across the consortium
More than 61000 registered users are now on the system and the councils are successfully filling
their own talent pools of prospective job-seekers Overall the project team is now celebrating a
pound17 million reduction in recruitment expenditure over the past 12 months
(continued)
cipd
cou
k2011resou
rcing
and
talentp
lann
ing
survey
26
RESOURCING AND TALENT PLANNING
There were some challenges in the implementation of this new way of working All the councils
had to be convinced about the benefits of the changes With the implementation of a new IT
system having its own set of challenges the project has taken 12 months to introduce longer
than first anticipated Implementing the changes during a period of radical restructuring in all
councils also proved particularly challenging However Jayne describes how both the need to
make efficiencies and feedback from job-seekers meant that lsquowe had to find a different way of
doing thingsrsquo Jayne also recognises how the neutrality of her own role (each council pays a tenth
of her salary) has been essential in ensuring that the project has been fair to all its participants
offering a centralised shared resource to manage the project
The project is now set to develop yet further with the aim of becoming entirely self-funding
within the next year by accepting advertising from other organisations Two new websites are
planned for recruitment into schools and social care jobs bringing even less reliance on media
and agencies AGMA will also be further building its own talent pool
Jayne describes the initiative as lsquoa true example of what you can do if you collaborate across
authoritiesrsquo Not only the separate councils but also diverse teams and functions including HR IT
procurement communications and marketing have worked together to deliver this innovative
and inspiring project
Information provided by Jayne Whitehead AGMA Category Procurement Manager
2011
3 DIVERSITy
This section examines organisationsrsquo approaches to diversity including the use of formal diversity strategies and the methods used to address diversity issues
Just over half of organisations report they have with just under two-thirds of not-for-profit
a formal diversity strategy showing little change organisations and just two-fifths of private sector
over the past four years (2011 52 2010 55 companies (Table 19)25 Diversity strategies are also
2009 60 2008 55) Consistent with previous more common in larger organisations (regardless
yearsrsquo findings most public sector organisations of sector)26
(90) have a formal diversity strategy compared
Table 19 Does your organisation have a formal diversity strategy ()
Yes No Dont know
All 52 41 7
Sector
Private sector 41 50 8
Public services 90 9 1
Voluntary community and not-for-profit 63 33 4
Number of UK employees
Fewer than 50 45 50 5
50ndash249 43 51 6
250ndash999 48 44 7
1000ndash4999 65 31 4
More than 5000 80 9 11 Base 613
RESO
UR
CIN
G A
ND
TALE
NT P
LAN
NIN
G 2
011
27
28
RESOURCING AND TALENT PLANNING
As was the case last year over three-quarters
of organisations with a formal diversity policy
attempt to address diversity issues through
monitoring recruitment andor staffing
information to obtain data on gender ethnicity
disability age and so on (Table 20) Less than
three-fifths train interviewers to understand what
diversity is about and the impact of stereotypes
Other diversity-focused initiatives are even
less common moreover the figures indicate a
reduction in the use of several methods compared
with previous years The pressures of the recession
may have led to a reduced focus on diversity
Given the links between diversity in the workforce
and productivity organisations that fail to give
this issue the attention it requires may find
themselves at a disadvantage in the future
Traditionally the public sector has tended to lead
the way in terms of diversity practices Again this
year they are significantly more likely to address
diversity issues through monitoring recruitment
andor staffing information through providing
recruitment documents in other formats through
advertising vacancies in different sources to
attract under-represented groups and through
setting recruitment targets to correct a workforce
imbalance Nevertheless they are less likely than
other sectors to actively try to attract talent of all
ages (Table 20) Moreover our figures indicate that
the reduction in the use of several diversity methods
compared with previous years is particularly
pronounced in the public sector The change of
government and budget reduction measures have
led to significant change programmes in many
public sector organisations which may have resulted
in a reduced focus on diversity issues
Table 20 Methods used to address diversity issues in organisations ( with formal diversity strategy)
Voluntary community
Private Public and not-sector services for-profit
2011 2010 2009 2008 2011 2011 2011 survey survey survey survey (2010) (2010) (2010)
Monitoring recruitment andor staffing information to obtain data on gender 78 79 84 83 70 (71) 88 (96) 88 (76) ethnicity disability age any other categories
cipd
cou
k2011resou
rcing
and
talentp
lann
ing
survey
Training interviewers to understand what diversity is about and the impact of stereotypes
57 68 68 60 53 (66) 64 (73) 57 (72)
Actively trying to attract talent of all ages 45 53 32 43
Operating policies that go beyond basic legislative requirements on age gender race disability sexual orientation religion and belief
39 49 52 48 34 (44) 47 (63) 47 (40)
Providing recruitment documents in other 39 41 37 31 24 (22) 64 (77) 47 (52)formats (online large-print audio and so on)
Checking that any tests used are valid reliable and culture-free and were tested on diverse norm groups
36 42 47 34 39 (44) 35 (45) 27 (16)
Advertising vacancies in different sources to 31 37 51 48 22 (30) 44 (53) 41 (32)attract under-represented groups
Using specific imageswords in your recruitment advertising to appeal to a wider audience 29 38 42 42 25 (30) 36 (52) 33 (40)
Making attempts to employ the long-term 19 19 13 29unemployed
Setting recruitment targets to correct a workforce imbalance 9 15 14 12 4 (8) 18 (31) 8 (16)
Base 312 (2011) 253 (2010) 419 (2009) new item added in 2011
RESO
UR
CIN
G A
ND
TALE
NT P
LAN
NIN
G 2
011
29
2011
4 mANAGING LABOUR TURNOVER
Figures from the Office for National Statistics show that UK unemployment rose by 27000 in the three months to the end of January 2011 to 253 million the highest since 1994 When unemployment is high the number of employees leaving organisations voluntarily is expected to decrease Here we examine whether this is happening and how organisations are tackling the issue of employee retention
Among organisations that are able to supply
turnover data the median labour turnover rate
has decreased over the past few years (Table 21)
The median figure however hides differences
across organisations Slightly more organisations
report their turnover has increased in 2010
compared with 2009 (38) than has decreased
(33) while for nearly a third (29) it remained
the same Smaller organisations are more likely
to report their labour turnover has increased and
larger organisations that it has decreased27
As in previous years the majority of turnover (53)
is still attributed to employees leaving voluntarily
(Table 22) As the economy has improved the
median proportion of turnover due to redundancies
has reduced Only 12 of organisations that
provided reasons for leaving made more than ten
redundancies in the previous year compared with
33 in 2010 26 in 2009 and 22 in 2008 A third
(34) of organisations that made redundancies
offered career transition services
While median turnover rates have reduced
across all sectors Table 23 shows that the rate
of voluntary leavers has increased slightly in
the private sector compared with last year but
decreased in the voluntary and public services
sector This reflects improvements in the economic
outlook for the private sector and the widespread
cuts in the public sector which also have a direct
impact on many not-for-profit organisations that
provide services for the public sector
Cost of labour turnover While just over half of organisations calculate
their recruitment costs only 13 calculate the
cost of their labour turnover (2010 14) The
majority of organisations report they do not
calculate these costs (79) while 7 donrsquot know
if they are calculated or not
Nearly half (46) of those who calculate their
turnover costs want to maintain their current
turnover rate while one-fifth (38) want to
reduce turnover during 2011 and 15 want to
increase it
Retaining employees The steps organisations take to retain employees
in their workforce can have a significant impact
on organisational efficiency and success through
30
RESOURCING AND TALENT PLANNING
Table 21 Median rate of labour turnover ()
2011 2010 survey 2009 survey 2008 survey 2007 survey 2006 survey
125 135 157 173 181 183
Base 175 (2011)
Table 22 Median labour turnover rates by reason for leaving ()
2011 survey 2010 survey 2009 survey
Voluntary redundancies 0 0 0
Compulsory redundancies 0 10 05
Dismissedleft involuntarily (including death in service)
07 09 14
Fixed-short-term contracts 0 0 07
Retired 0 04 07
Left voluntarily 66 84 90
Base 154 (2011)
Table 23 Median labour turnover rates by industry sector ()
cipd
cou
k2011resou
rcing
and
talentp
lann
ing
survey
Sector All leavers Voluntary leavers
2011 survey
2010 survey
2009 survey
2011 survey
2010 survey
2009 survey
Manufacturing and production 93 (38) 124 (44) 153 (80) 37 (35) 27 (42) 77 (75)
Private sector services 138 (96) 146 (77) 168 (150) 87 (82) 74 (71) 104 (129)
Public services 85 (28) 86 (19) 126 (52) 34 (10) 58 (15) 76 (45)
Voluntary community not-for-profit 131 (11) 159 (15) 164 (38) 70 (24) 102 (18) 110 (35) Number of respondents shown in brackets
decreasing employee turnover loss of talent and
recruitment and training costs while having a
positive impact on motivation job satisfaction and
the employer brand
Only two-fifths (42) of organisations
experienced no difficulties in retaining staff
during 2010 This figure is similar to last year
(45) but higher than the findings for 2008
when 31 reported they had no retention
difficulties These findings reflect the increased
caution of employees regarding leaving their
jobs during times of economic uncertainty and
high unemployment Supporting this are our
findings that the public (49) and not-for-profit
sectors (49) are more likely to report they had
no difficulties in retaining staff during 2010
compared with the private sector (38)
As in previous years organisations most
commonly have difficulty retaining managers
and professionalsspecialists (Table 24) The
manufacturing and production sector are most
likely to report difficulties retaining technical
2011 staff and the private services sector that they have
most difficulty retaining services staff This may
reflect the higher demand for these categories of
employees in these sectors
While most organisations have taken one or more
steps to address staff retention nearly one in four
organisations (23) report that no specific retention
initiatives were undertaken This is a similar
proportion to last year although substantially higher
than in previous years when retention difficulties
were more common due to a tighter labour market
(Table 25) Public sector organisations are twice
as likely not to have taken any steps to address
retention as those in the private or not for-profit
sectors (39 compared with 20 of private sector
and 16 of not-for-profits)28
The most common methods used to address
retention in 2010 used by nearly two-fifths of
organisations are to improve line managersrsquo
people skills improve learning and development
opportunities and improve the induction process
Improving line managersrsquo people skills and
learning and development opportunities are also
most commonly rated among the top three most
effective retention methods The effectiveness of
improving induction processes is more varied with
22 rating it among the top three most effective
methods and 12 among the top three least
effective methods Views are also mixed regarding
the effectiveness of improved pay It is likely that
employees are motivated by different factors
Employers need to provide a healthy working
environment where employees are treated with
respect and make efforts to match their retention
initiatives with what staff want
Table 24 Retention difficulties by occupational category ()
Voluntary community
Private and All Manufacturing sector Public not-for- All
2011 and production services services profit 2010
Managers and professionals specialists 28 26 29 25 29 27
Technical 21 37 19 17 13 20
Services (customer personal protective and sales) 13 7 21 4 4 12
Administrative secretarial 9 5 8 15 13 7
Senior managersdirectors 7 5 8 10 6 9
Manualcraft workers 6 11 6 3 4 4 Base 601 (2011) 451 (2010)
RESO
UR
CIN
G A
ND
TALE
NT P
LAN
NIN
G 2
011
31
32
RESOURCING AND TALENT PLANNING
Table 25 Steps taken specifically to address staff retention ()
Used in Least Most Used in Used in Used in 2010 effective effective 2009 2008 2007
Improved line managers people skills 39 7 31 42 39 37
Increased learning and development opportunities 38 5 34 35 47 46
Improved induction process 38 12 22 31 45 45
Improved employee involvement 34 8 24 32 35 29
Improved selection techniques 30 7 25 31 42 46
Improved pay 27 11 23 22 42 53
Offered coachingmentoring buddy systems 24 8 14 20 24 22
Improved benefits 21 8 14 19 32 36
Better promotion to employees of the employer brand 18 10 5 15 21 16
Created clearer career paths 18 6 2 21 18 17
Revised the way staff are rewarded so their efforts are 18 4 13 14 19 19 better recognised
Made changes to improve workndash life balance 17 5 13 19 31 30
Improved physical working conditions 15 8 7 13 19 12
Redesigned jobs to make them more satisfying 11 4 8 13 18 14
Increased our use of countershyoffers 4 4 14
No specific initiatives undertaken 23 3 1 27 13 9 Base 559 (2011 survey) 431 (2010 survey) 695 (2009 survey) 710 (2008 survey)
new item added in 2011
cipd
cou
k2011resou
rcing
and
talentp
lann
ing
survey
RESO
UR
CIN
G A
ND
TALE
NT P
LAN
NIN
G 2
011
33
2011
CONCLUSIONS
Looking forward In January 2010 the UK officially emerged from
the longest recession since the 1930s Economic
growth however remains sluggish and the public
sector has embarked on a four-year programme of
the biggest government spending cuts in decades
to address the fiscal deficit
In the labour market unemployment remained
high throughout 2010 Figures from the Office
for National Statistics (ONS) show that UK
unemployment rose by 27000 in the three months
to the end of January 2011 to 253 million the
highest since 1994 While recent months have seen
signs of improvement there are concerns that the
slow growth in the private sector will be unable
to fully compensate for the increasing job losses in
the public sector that will result from the budget
cuts This is supported by the findings from the
CIPDrsquos spring 2011 Labour Market Outlook which
shows the impact on the overall labour market of a
slight rise in private sector recruitment is still being
cancelled out by large-scale public sector job losses
The findings of the CIPDrsquos 2011 Resourcing and
Talent Planning survey reflect the challenges
of the economic environment Organisations
generally have increased their focus on costs On
average organisations spent less on filling each
vacancy and a fifth have reduced their resourcing
budgets and talent management spend In the
public sector the focus on costs and budget
reductions was particularly apparent
The end of the recession has meant fewer
redundancies in 2010 Nevertheless over a third
of public sector and one-fifth of private sector
organisations reduced their headcount The
number of vacancies on offer by organisations
remained as low as in 2009 overall and continued
to decrease in very large organisations particularly
in the public sector
Looking forward private sector growth is expected
to remain slow and the full impact of public
sector budget cuts is still to come Resourcing and
talent management budgets will be further hit
in 2011ndash12 and many public sector organisations
will implement recruitment freezes and reduce
graduate intake and recruitment generally
Resourcing and talent practices are changing to
reflect the stronger focus on costs and reductions
in budgets Particularly in the public sector but
also in the private sector trends indicate a greater
focus on developing talent in-house retaining
rather than recruiting talent and reducing reliance
on recruitment agencies and external consultants
for resourcing and development
Our findings do not present a positive outlook
for the vast number of unemployed A substantial
proportion of organisations reports that the
already low number of vacancies available to them
is likely to be further affected by the abolition
of the Default Retirement Age Yet despite the
high unemployment rate most organisations
reported difficulties in filling vacancies mostly due
to skill shortages We have also seen an increase
in the proportion of organisations reporting
that competition for talent is even greater as the
pool of available talent to hire has fallen sharply
For many organisations there appears a clear
mismatch between the skills they require and
those available in the labour market Some are
concerned this will be exacerbated by the increase
in university tuition fees Some are responding
cipd
cou
k2011resou
rcing
and
talentp
lann
ing
survey
34
RESOURCING AND TALENT PLANNING
by increasing apprenticeship schemes internships
and sponsoring students through university Such
schemes may be aided by the Governmentrsquos recently
announced pound60 million commitment to help boost
youth employment and provide extra support for
apprenticeships and changes to vocational training
and education How far this will go towards meeting
organisationsrsquo skill requirements remains to be seen
On a positive note our findings indicate that talent
management is viewed as more not less important
in difficult times although with reduced budgets
organisations will have to be innovative with
their approach and strategies In order to survive
organisations will need to make certain they focus
beyond the cost-cutting required in the current
environment to ensuring their talent strategies are
aligned to long-term business success
The CIPDrsquos Shaping the Future and Next Generation
HR flagship projects have both explored the
important issues of sustainability Shaping the Future
in particular warns against the dangers of lsquotalent
tunnel visionrsquo taking a short-sighted view on talent
strategies which are solely focused on the needs of
the here and now
Often organisations pay too little attention to
identifying and developing the capabilities that
individuals will need in the long term This implies a
leadershiptalent management capability gap with
too much focus on the operational needs of today
rather than the organisational imperatives
of tomorrow
Itrsquos never too late to start equipping your people
with the skills and knowledge they need to meet
both present and future challenges So what practical
recommendations can we make for resourcing and
talent professionals drawn from our Shaping the
Future evidence
Audit your organisationrsquos current skills and future capabilities If you havenrsquot done so already conduct a thorough
inventory of your organisationrsquos current skills and map
those against the capabilities you are likely to need
in the future Hold forecasting sessions which look at
macro and micro trends how these will impact your
way of working and the changes that will be required
for future success
Build your talent and succession pipeline You also need to be proactively building up your
talent pipelines (horizontally and vertically) so that
you are developing people with future-fit skills and
capabilities A silver lining from the current economic
climate is that more organisations are focusing on
developing internal talent and fully utilising the
skills of their existing workforce Fresh talent is
still important but recruitment strategies should
complement internal pipelines
Maintain a continuous focus on capability-building Capability-building should be part of a continuous
process embedded into policies and practices Across
our case study organisations managers talked about the
need to embed development and skills training as part
of business as usual rather than as a one-off activity
Develop a creative approach to skills and capability development Even when budgets are tight it is essential that
staff get the development they need to ensure they
have the capabilities for their current job role as well
as starting to build those that the organisation will
need in the future Our case study organisations were
focusing strongly on knowledge-sharing enabling
people to learn from others across the organisation
Many of you are already considering alternative
solutions for specialist skill development such as
apprenticeships internal management schemes
summer placements and internships It is also
important to work with universities to ensure that
graduates are developing skills and knowledge which
will help them to succeed in the workplace
RESO
UR
CIN
G A
ND
TALE
NT P
LAN
NIN
G 2
011
35
2011
BACkGROUND TO ThE SURVEy
This survey was conducted in March and April 2011 It was sent to a sample of UK-based HR professionals in the public private and voluntary sectors In total 626 people responded to the survey
This is the fifteenth annual CIPD Resourcing
and Talent Planning survey (formerly known as
the CIPDrsquos Recruitment Retention and Turnover
survey) The survey examines organisationsrsquo
resourcing and talent planning strategies and
practices and the key challenges and issues
they face The survey consists of 45 questions
completed through an online self-completion
questionnaire
The majority of questions remain the same as
previous years to provide useful benchmark
data on topics including recruitment practices
difficulties and costs selection methods diversity
strategies the impact of the economic climate on
resourcing and talent planning practices labour
turnover and retention strategies New question
areas this year examine the employment of
younger workers the length of the recruitment
process the nature of job vacancies relationships
with recruitment partners and the use of
strengths-based approaches to recruitment
A small number of respondents took part in follow-
up telephone interviews to produce mini case
studies on a selection of topics These are presented
in the coloured boxes throughout the report
Sample profile Respondents predominantly work for private
sector organisations with professional services
being particularly well represented but other
sectors are represented in similar proportions to
last year (Table A1)
36
RESOURCING AND TALENT PLANNING
Table A1 Breakdown of respondent organisations by industrial sector Number of respondents
Manufacturing and production 113 19
Agriculture and forestry 1 0
Chemicals oils and pharmaceuticals 9 1
Construction 8 1
Electricity gas and water 4 1
Engineering electronics and metals 38 6
Food drink and tobacco 18 3
General manufacturing 6 1
Mining and quarrying 4 1
Paper and printing 6 1
Textiles 2 0
Other manufacturingproduction 17 3
Private sector services 319 52
Professional services (accountancy advertising consultancy legal etc) 78 13
Finance insurance and real estate 33 5
Hotels catering and leisure 26 4
IT services 26 4
Call centres 3 0
Media (broadcasting and publishing etc) 7 1
Retail and wholesale 40 7
Transport distribution and storage 23 4
Communications 6 1
Other private services 77 13
Public services 100 16
Central government 14 2
Education 12 2
Health 23 4
Local government 22 4
Other public services 29 5
Non-profit organisations 78 13
Care services 9 1
Charity services 32 5
Housing association 17 3
Other voluntary 20 3 Base 610
cipd
cou
k2011resou
rcing
and
talentp
lann
ing
survey
2011 Most respondents work in small to medium-sized
organisations in terms of the number of UK-
based employees but larger organisations are
also represented in similar proportions to last year
(Table A2)
Respondents reported on organisations based
across the UK Three in ten responded for the
whole of the UK while others responded for a
particular regioncountry (see Table A3)
Table A2 Breakdown of sample by organisation size ndash permanent employees in the UK
Fewer than 10 5
10ndash49 12
50ndash249 33
250ndash999 25
1000ndash4999 12
More than 5000 13 Base 610
Table A3 Main region covered by the reply
East Anglia 5
East Midlands 3
West Midlands 5
North-east of England 3
North-west of England 7
South-west of England 6
Yorkshire and Humberside 5
South-east of England (excluding London)
12
London 12
Scotland 6
Wales 3
Northern Ireland 3
Ireland 0
Whole of UK 29 Base 602
Labour turnover A total of 175 survey respondents were able to
supply all the information necessary for us to
calculate labour turnover on a whole-organisation
basis
This report uses the standard lsquocrude wastagersquo
method to calculate the rate of turnover This
method is calculated as follows
Labour turnover =
Number of leavers in a set period
______________________________________ x 100
Average number employed in the same period
(Leavers include those leaving the organisation
by way of voluntary or involuntary severance
redundancies or retirements but does not include
internal transfers)
Readers should be aware that this method has
some shortcomings For example it takes no
account of the characteristics of the workforce or
the length of service of the leaver
Note on statistics and figures used Some respondents did not answer all questions so
where percentages are reported in tables or figures
the respondent lsquobasersquo for that question is given
lsquoAveragersquo in the report is used to refer to the
statistical mean where the data is normally
distributed However the median is used in cases
where the distribution is significantly skewed
When the median is used it is noted
With the exception of labour turnover rates all
figures in tables have been rounded to the nearest
percentage point Due to rounding percentages
may not always total 100
Chi-square (χ2) tests are used to examine whether
differences between groups such as industrial
sectors are significant or likely to be due to
chance Spearmanrsquos Rho correlation (Rho) is used
to examine relationships between variables We
report on statistics at the generally accepted level
of significance plt005
RESO
UR
CIN
G A
ND
TALE
NT P
LAN
NIN
G 2
011
37
38
RESOURCING AND TALENT PLANNING
fURThER SOURCES Of INfORmATION
We produce a range of free factsheets surveys
guides and research reports which are available on
the CIPD website at cipdcoukhrresources
Read our factsheets on Employer Brand
Employee Turnover and Retention
Induction
Outlook series Our quarterly reports Labour Market Outlook
and Employee Outlook look at the employer and
employee perspectives on the labour market and
on workplace issues and trends while HR Outlook
explores priorities and emerging trends for the HR
profession and function
View these reports at
cipdcoukresearchoutlook-series
Talent management Two reports look at talent issues in a recession
difficult economic climate
The War on Talent Talent management under
threat in uncertain times (2009)
Fighting Back through Talent Innovation (2010)
Opening up Talent for Business Success (2010)
looks at the importance of integrating talent
management and diversity
The Talent Perspective What does it feel like to
be talent-managed (2010) looks at the employee
view of talent management
Workforce planning Our guide Workforce Planning Right people right
time right skills (2010) gives advice on developing
workforce planning processes
Diversity Two survey reports and a guide provide practical
advice and information on trends
Diversity in Business A focus for progress (2007)
Managing an Ageing Workforce How employers
are adapting to an older labour market (2010)
Managing Age New edition 2011
Two further reports are available to order from
cipdcoukbookstore
Managing Diversity in Practice Supporting
business goals (2007)
Managing Diversity and the Business Case (2008)
Sign up to receive our e-newsletter at
cipdcoukcipdupdate
cipd
cou
k2011resou
rcing
and
talentp
lann
ing
survey
RESO
UR
CIN
G A
ND
TALE
NT P
LAN
NIN
G 2
011
39
2011
ACkNOwLEDGEmENTS
The CIPD is very grateful to those organisations and
individuals who gave their time to take part in this
research They include
bull Annette Sinclair Senior Researcher at Roffey
Park for analysing the findings and writing this
comprehensive report
bull Members of the Recruitment Forum Steering
Committee for their input into the survey
design and assistance in piloting the
questionnaire
bull Hays for their support and commitment at
every stage of the research
bull All those who shared examples of their
organisationrsquos practices
We hope that you find the research useful when
considering your own recruitment and retention
practices Please contact us if you have any
questions or ideas based on our findings
(researchcipdcouk)
RESOURCING AND TALENT PLANNING
fOOTNOTES 1 Chi Square = 573 df = 5 p lt 0001 n = 604 2 Rho = 073 p lt 0001 n = 577 3 Rho = 045 p lt 0001 n = 533 4 F = 250 df = 2 p lt 0001 n = 533 5 Chi Square = 180 df = 6 p lt 001 n = 535 6 Chi Square = 71 df = 2 p lt 005 n = 603 7 Chi Square = 230 df = 6 p lt 001 n = 600 8 Chi Square = 91 df = 3 p lt 005 n = 598 9 Chi Square = 129 df = 4 p lt 005 n = 610
10 Rho = 034 p lt 0001 n = 609 11 Chi square = 217 df = 3 p lt 0001 n = 609 12 Chi Square = 609 df = 8 p lt 0001 n = 607 13 Chi Square = 208 df = 3 p lt 0001 n = 560 14 Size of organisation and developing online
careers site Rho = 025 p lt 0001 n = 599 Size of
organisation and employee surveys Rho = 019
p lt 0001 n = 599 15 Chi Square = 167 df = 2 p lt 0001 n = 599
16 Working with charities Chi Square = 80 df = 2 p
lt 005 n = 599 corporate sponsorship Chi Square
= 116 df = 2 p lt 001 n = 599 17 Chi Square = 76 df = 2 p lt 005 n = 599 18 Table 11 also shows that this method is deemed
most effective by public sector organisations but
this effect is due to a greater proportion of
large public sector organisations in our
sample whereas private sector organisations are
more evenly distributed in size 19 Chi square = 109 df = 2 p lt 001 n = 610 20 Chi Square = 279 df = 4 p lt 0001 n = 610 21 Chi Square = 259 df = 6 p lt 0001 n = 598 22 Chi Square = 515 df = 6 p lt 0001 n = 597 22 Chi Square = 177 df = 8 p lt 005 n = 600 22 Chi Square = 339 df = 4 p lt 0001 n = 610 22 Chi Square = 820 df = 4 p lt 0001 n = 610 22 Chi Square = 522 df = 8 p lt 0001 n = 610 22 Rho = 024 p lt 0001 n = 195 22 Chi Square = 166 df = 2 p lt 0001 n = 544
cipd
cou
k2011resou
rcing
and
talentp
lann
ing
survey
40
2011
OTHER TITLES IN THIS SERIES
ABSENCE MANAGEMENT The annual Absence Management survey has been running for eleven years providing useful benchmarking data on absence levels the cost and causes of absence and how organisations are managing absence The latest report is brought to you in partnership with Simplyhealth
EMPLOYEE ATTITUDES TO PAY The annual Employee Attitudes to Pay survey investigates employee attitudes and expectations towards pay and bonuses Now in its third year this survey is carried out by YouGov and focuses on employees in the UK
REWARD MANAGEMENT The annual Reward Management survey has been running for ten years and provides practical insights into current trends practices and issues affecting reward management in the UK It examines strategic reward base and variable pay bonuses incentives pensions reward measurement and total reward issues This report was brought to you in partnership with Benefex
LEARNING AND TALENT DEvELOPMENT The annual Learning and Talent Development survey is now in its thirteenth year and provides valuable commentary on current and future issues and trends It explores employer support for learning talent management employee skills managing and evaluating coaching and training spend
Issu
ed J
une
2011
Ref
eren
ce 5
552
copy C
hart
ered
Inst
itute
of
Pers
onne
l and
Dev
elop
men
t 20
11
Chartered Institute of Personnel and Development
151 The Broadway London SW19 1JQ
Tel 020 8612 6200 Fax 020 8612 6201
Email cipdcipdcouk Website cipdcouk
Incorporated by Royal Charter Registered charity no1079797

RESO
UR
CIN
G A
ND
TALE
NT P
LAN
NIN
G 2
011
5
2011 Recruitment difficulties bull One in three organisations report the length of
their recruitment process has led to the loss of
potential recruits
bull Three-quarters of organisations experienced
recruitment difficulties in the past few months
bull Managers and professionals and technical
positions are the most difficult vacancies to fill
bull As in previous years the main reason for
recruitment difficulties is a lack of necessary
specialist or technical skills
bull Nearly three-quarters of organisations had made
efforts to improve their employee brand over
the last year most commonly through employee
surveys and developing online career sites
Attracting and selecting candidates bull While the effectiveness of methods to attract
applicants varies according to organisation sector
and size the most effective method overall
is reported to be through organisationsrsquo own
corporate websites as was the case last year
bull The private sector particularly manufacturing
and production organisations are three times
more likely than public sector organisations to
include recruitment agencies among their most
effective methods for attracting candidates
bull Overall a third of organisations report they
have reduced their use of recruitment partners
however one in five report they have formed
a closer business partnership with them over
the past year and one in ten that they consider
them integral to attracting top talent
bull Competency-based interviews (70) interviews
following the contents of CVsapplication forms
(63) and structured interviews (56) are as
last year the most common methods used to
select applicants
bull Two-fifths of organisations report they use
a strengths-based approach to recruitment
although it is less commonly used in the public
sector (26)
bull The median recruitment cost of filling a vacancy
is pound7500 for senior managersdirectors and pound2500
for other employees (adjusting for accuracy)
showing reductions compared with last year
Resourcing in turbulent times bull Half of the organisations surveyed report the
economic climate has had a negative impact
on their organisationsrsquo resourcing budgets for
2011ndash12 This year it is the public sector that is
most severely hit with four out of five (82)
reporting their resourcing budgets will be
reduced (up from 59 last year)
bull Changes in resourcing and talent practices in
2011 compared with 2010 reflect a stronger
focus on costs and reductions in budgets More
organisations anticipate they will be focusing
on developing talent in-house retaining rather
than recruiting talent and reducing their
reliance on recruitment agencies and external
consultants for resourcing and development
bull Nearly half of public sector organisations will
be implementing a recruitment freeze in 2011
compared with one-fifth of organisations
overall Two-thirds of public sector
organisations and 29 of private organisations
will be reducing the number of new recruits
they hire
bull The volume of applicants for vacancies has
increased reflecting the high unemployment
rate Three-quarters of organisations have
noticed an increase in the number of
unsuitable applicants and a third report that
there are too many suitable candidates to
choose from Despite high unemployment
over the last two years more than half (52)
believe that competition for talent is even
greater as the pool of available talent to hire
has fallen sharply (2010 41 2009 20)
bull Most organisations remain focused on
managing talent despite increased attention
on reducing costs with only 4 reporting
that their focus on talent has decreased
Nevertheless 18 of organisations (32 of the
public sector) have reduced their overall talent
management spend as a consequence of the
economic downturn
cipd
cou
k2011resou
rcing
and
talentp
lann
ing
survey
6
RESOURCING AND TALENT PLANNING
Diversity bull Overall in little change from previous years
just over half of organisations have a diversity
strategy rising to 90 of public sector
organisations
bull Our figures indicate a reduction in the use of
several methods to address diversity issues this
year particularly in the public sector which has
traditionally led the way in diversity practice
Labour turnover bull The median labour turnover rate has decreased
over the past few years (2011 125 2010
135 2009 157 2008 173)
bull Smaller organisations are most likely to report
that their labour turnover has increased and
larger organisations that it has decreased
bull As in previous years the majority of turnover
is attributed to employees leaving voluntarily
The rate of voluntary leavers has increased
slightly in the private sector compared with last
year but decreased in the voluntary and public
services sector reflecting the growthcuts in the
respective sectors
bull The proportion of organisations making ten
or more redundancies over the past year has
reduced from 33 in 2009 to 12 in 2010
Employee retention bull Only two-fifths (42) of organisations
experienced no difficulties in retaining staff
during 2010 a similar figure to the previous
year Managers and professionalsspecialists and
technical employees remain the most difficult
categories of staff to retain
bull Most organisations have taken one or more
steps to address staff retention however nearly
one in four organisations (a similar proportion
to the previous year) report that no specific
retention initiatives were undertaken in 2010
bull The most frequently cited actions taken by
employers to address retention ndash improving
the people management skills of line managers
and increased learning and development
opportunities ndash are the methods most
commonly rated most effective Improving the
induction process is also commonly used to
address retention but views on its effectiveness
are more mixed
2011
1 RECRUITING EmPLOyEES
This section explores trends and developments in recruitment strategies and activity within UK organisations during 2010 It examines the adoption of formal resourcing strategies changes in the number of job vacancies organisations attempted to fill the extent and nature of recruitment difficulties over the past year and the strategies employers use to overcome these challenges It also includes developments in graduate recruitment the most effective approaches for attracting applicants and the methods used for selection For the first time we explore the nature of job vacancies the length of the recruitment process the employment of younger workers changing relationships with recruitment partners and efforts to improve the employer brand Finally the costs associated with recruitment are discussed
Resourcing strategies Just over half of respondents surveyed report their
organisation has a formal resourcing strategy
in place a similar proportion to last year (2011
Table 1 Organisations with formal resourcing strategies in place by size ()
Size ndash number of employees in UK 54 2010 56 2009 58) The likelihood of
organisations having a formal strategy in place
increases with organisational size as was the case
last year (Table 1)1 There are no significant sector
differences
Fewer than 10 26
10ndash49 38
50ndash249 46
250ndash999 55
1000ndash4999 68
More than 5000 85
RESO
UR
CIN
G A
ND
TALE
NT P
LAN
NIN
G 2
011
Base 604
7
8
RESOURCING AND TALENT PLANNING
The number and nature of job vacancies There is considerable variation in the number
of vacancies respondentsrsquo organisations tried
to fill in 2010 partly because the number of
vacancies is strongly related to organisation size
(Table 2)2 Overall the median number of vacancies
has fallen from 30 in 2008 to 20 over the past two
years as the recession affected increasing numbers
of organisations (Table 2)
While there is no overall change from last year
in the median number of vacancies organisations
tried to fill there has been a substantial fall in the
proportion of vacancies very large organisations
(5000+ UK employees) attempted to fill from
a median of 550 in 2009 to 200 in 2010 (800 in
2008) The reduction in vacancies in very large
organisations is striking in the private and public
sectors but particularly in the latter where
the median number of vacancies organisations
attempted to fill in 2010 was less than a third than
in 2009 This reflects the sluggish growth in the
private sector and in particular the significant
cuts in public sector budgets
Table 2 Median number of vacancies respondents tried to fill by size of organisation and sector
2011 survey 2010 survey 2009 survey
No of permanent staff employed in UK All Private
sector Public
services All Private sector
Public services All Private
sector Public
services
Median Median Median Median Median Median Median Median Median
1ndash49 3 3 1 3 3 2
50ndash249 12 12 10 12 10 14 10 10 8
250ndash999 45 50 30 46 45 50 60 52 70
1000ndash4999 110 150 55 100 100 100 300 300 300
More than 5000 200 500 150 550 850 500 800 800 550
All organisations 20 20 30 20 20 80 30 20 100 Base 577 (2011) 442 (2010) 683 (2009)
The categories for number of permanent staff employed in the UK differed slightly in the 2009 survey (250 or fewer 251ndash500
501ndash1000 1001ndash5000 5001ndash10000 10001+) 2009 categories have been combined where appropriate and otherwise matched with
the best corresponding category of 20112010
cipd
cou
k2011resou
rcing
and
talentp
lann
ing
survey
2011 Overall nearly three-quarters (73) of permanent
vacancies were filled with external candidates
Larger organisations with a wide range of
talent to choose from are more likely to recruit
internally than smaller organisations3 Public sector
organisations particularly those with more than
1000 UK employees are more likely to recruit
internally than the private sector (Table 3)4
Organisations are divided in their use of temporary
contracts More than a quarter (28) have
employed more people on temporary contracts
in 2010 compared with the previous year while
a similar proportion (27) have employed fewer
people on temporary contracts (45 remain
the same) Manufacturing and production
organisations are most likely to have increased
their use of temporary contracts and the public
services the least perhaps reflecting their reduced
recruitment generally (Figure 1)5
Table 3 Average percentage of job vacancies filled internally
Voluntary No of permanent staff community and not-employed in UK Private sector Public services for-profit All
Mean Mean Mean Mean
1ndash49 15 17 7 13
50ndash249 20 28 23 21
250ndash999 24 29 24 24
1000ndash4999 35 58 12 39
More than 5000 47 62 33 53
All organisations 25 45 19 27 Base 533
figure 1 Use of temporary contracts by sector in 2010 compared with the previous year ()
Manufacturing and production
Private sector services
Public services
Voluntary community and not-for-profit
More Same Less
Base 610
25
27
37
22
3837
50
32
50
23
31
28
RESO
UR
CIN
G A
ND
TALE
NT P
LAN
NIN
G 2
011
9
10
RESOURCING AND TALENT PLANNING
Sector-specific experience is an essential
requirement of candidates in three-fifths (60) of
organisations overall While our figures suggest
it is less commonly required in the public sector
(48 compared with 59 of the voluntary
community and not-for-profit sector and 63
of the private sector)6 there are also substantial
differences within sectors For example specific
sector experience is essential for the majority
of organisations operating in the chemical
construction or mining industries and professional
services but not for those in general manufacturing
or retail and wholesale Similarly within the public
sector it is deemed particularly essential for health
and education organisations but less so for those in
central or local government
Employing younger workers Figures from the Office for National Statistics
show that while total unemployment fell during
the three months to February 2011 youth
unemployment rose to a record level of almost 1
million equating to one in five economically active
16ndash24-year-olds out of work Moreover concerns
have been raised as to whether high youth
unemployment will be further compounded by the
abolition of the Default Retirement Age later this
year and the increase in university tuition fees This
year we included new questions in the survey to
explore these issues
One in six organisations (17) report they are
employing more 16ndash24-year-olds compared with
one year ago this compares with less than one
in eight (12) who are employing fewer young
people (72 are employing the same number) The
employment of younger workers has reduced most
in the public sector where one in four reports a
decrease compared with one in ten who reports an
increase (Table 4)7 This is likely to reflect a general
reduction in recruitment in this sector
Overall one-quarter of organisations expect the
abolition of the Default Retirement Age will mean
they recruit fewer people however the figure
rises to nearly half of public sector organisations
It does not appear however that the abolition of
the Default Retirement Age will have a particular
impact on the recruitment of young people with
only one in ten organisations reporting it will result
in fewer 16ndash24-year-olds being recruited (Table 4)
cipd
cou
k2011resou
rcing
and
talentp
lann
ing
survey
Table 4 The employment of younger workers ()
Voluntary Manufacturing community
All and Private sector and respondents production services Public services not-for-profit
Percentage employing fewer 16ndash24-year-olds than one year ago
Percentage agreeing the abolition of the Default Retirement Age means they will recruit fewer 16ndash24-year-olds
Percentage agreeing the abolition of the Default Retirement Age means they will recruit fewer people
12 10 9 25 10
11 18 6 17 9
23 25 15 48 22
Base 605
2011 Graduate recruitment Two-fifths of organisations (39) are concerned
that the increase in university tuition fees will
have an impact on the number of graduates in
the marketplace Public sector organisations are
particularly concerned (49 compared with 34
of private sector services 42 of not-for-profits
and 43 of manufacturing and production
organisations)8
Perhaps in order to address this deficit or in
response to additional government support to
boost apprenticeship schemes a third of public
sector organisations nearly half of manufacturing
and production and about a quarter of private
sector services and not-for-profit organisations
are considering increasing apprenticeship schemes
(Table 5) About a quarter of organisations overall
are considering increasing their use of internships
although the proportion is markedly lower in the
public sector Overall one in ten organisations are
considering sponsoring students through university
but the proportion doubles in manufacturing and
production where the lack of appropriate skills is
a common cause of recruitment difficulties (Table
5 see also Tables 8 and 9) Larger organisations are
also more likely to consider sponsoring students
through university (19 of those with more than
5000 employees)9
Overall just over a quarter of organisations
operate a structured graduate recruitment
programme (Table 6) The operation of
these programmes is significantly related to
organisation size (Figure 2)10 They also appear
to be most common in the manufacturing
and production sector as last year when a
step increase in their use was noted (Table 6)
It appears that this sector is investing in the
development of skills to address their deficit
in the workforce generally As in previous
years voluntary community and not-for-profit
organisations are least likely to operate a
structured graduate recruitment programme11
Table 5 Activities organisations are considering ()
Voluntary Manufacturing community
All and Private sector and respondents production services Public services not-for-profit
Increasing apprenticeship schemes 30 48 24 33 27
Increasing your use of internships 22 27 23 12 27
Sponsoring students through university 10 20 8 12 1
Base 615
Table 6 Organisations operating a structured graduate recruitment programme by sector ()
2011 2010 2009 2008
All 27 34 22 23
Sector
Manufacturing and production 35 35 23 24
Private sector services 29 37 24 27
Voluntary community and not-for-profit 6 18 5 7
Public services 26 33 23 24
RESO
UR
CIN
G A
ND
TALE
NT P
LAN
NIN
G 2
011
Base 614 (2011) 472 (2010) 752 (2009)
11
cipd
cou
k2011resou
rcing
and
talentp
lann
ing
survey
12
RESOURCING AND TALENT PLANNING
The majority of respondents from organisations
without a recruitment programme for graduates
report that their organisation has never had such
a programme or not had one for some time (97)
Even in the cash-strapped public sector only 3
report they have closed their graduate recruitment
programme in the last 12 months
Nearly a third (31) of organisations who have a
graduate recruitment programme have increased
their intake over the past year while a quarter
have reduced their intake (24) This shows an
improvement on the previous year at the height of
the recession when 43 had reduced their intake
The impact of the budget cuts in the public sector
are however clearly apparent as more than twice
as many organisations in this sector (50 compared
with 20 in the private and not-for-profit sectors)
have reduced their graduate intake
Length of recruitment process One in three (31) organisations report that the
length of their recruitment process has led to the
loss of potential recruits This issue appears to be
exacerbated by organisation size Nearly half of
organisations with more than 5000 employees
report that the length of their recruitment process
has led to the loss of potential recruits compared
with 38 of those in organisations of 250ndash999
employees and just 15 of organisations with
fewer than 50 employees12 There are no significant
sector differences
Recruitment difficulties Three-quarters of organisations with vacancies
report difficulties in filling at least some over the
past few months (75) This is an increase on last
year (2010 68) and may reflect the decrease in
unemployment in the first few months of 2011
It is less however than in previous years perhaps
because organisations were attempting to fill fewer
vacancies (2009 81 2008 86)
figure 2 Organisations operating a structured graduate recruitment programme by size ()
Number of UK employees
39
42
9Fewer than 50
17
1650ndash249
21
29 250ndash999
1000ndash4999 47
61 More than 5000
62
10 40 50 60 70 80
2011
0 3020 Percentage
2010
Base 609 (2011) 466 (2010)
2011 The private sector particularly manufacturing and
production organisations are most likely to have
difficulties filling vacancies (Table 7)13 Table 8
shows that over half of organisations in this sector
have difficulty filling technical vacancies and this
may reflect specific skills shortages in the UK The
most difficult category of staff to recruit in other
sectors is managers and professionalsspecialists
as was the case last year In general there is little
change in the categories of vacancies that are most
difficult to recruit for compared with last year
As would be expected given the cuts to
public sector budgets one in ten public sector
organisations report they did not have any
vacancies to fill twice as many as last year There is
little change in this regard in the other sectors
Table 9 shows the reasons respondents cite for their
recruitment difficulties The findings are similar
to previous years Lack of necessary specialist or
technical skills remains by far the most frequently
cited cause of difficulties reported by nearly
three-quarters of respondents (2011 72 2010
67 2009 73 2008 70) This is particularly
an issue for the manufacturing and production
sector and the public services sector where there
is a particularly high demand for such skills Lack
of formal qualifications is far less of an issue
These findings support arguments for greater
collaboration between industry and academic
institutions and more vocational training in order
to meet organisationsrsquo skill requirements
Higher pay expectations than the organisation
could offer and lack of experience are the next
most frequently cited causes of recruitment
problems (46 and 40 respectively) Interestingly
these are less of an issue in the public sector
perhaps because public sector applicants have
different expectations of pay or because some pay
scales are set at a national level Lack of experience
may be less of an issue than the necessary skills or
qualifications required in many public sector roles
The proportion reporting their recruitment
problems are due to potential candidatesrsquo
reluctance to move in the current economic climate
has decreased from just over a quarter in 2010 to
19 this year Economic growth albeit slow is
likely to be responsible for this reduction but the
lsquohangoverrsquo of the recession is highlighted as one in
five organisations still blame the economic climate
for their recruitment problems Despite high
unemployment 15 of respondents report they
have experienced problems due to no applicants In
line with last yearrsquos findings this is particularly an
issue for the public sector (22) which is also more
likely to report the image of their sectoroccupation
is a problem (22)
Table 7 Organisations experiencing difficulties recruiting for one or more category of vacancy by organisation size ( of those that have had vacancies to fill)
Voluntary Manufacturing community
and Private sector and All 2011 production services Public services not-for-profit
Difficulty filling one or 75 88 77 66 62more vacancies
No difficulties experienced 25 12 23 34 38
Base 561
RESO
UR
CIN
G A
ND
TALE
NT P
LAN
NIN
G 2
011
13
14
RESOURCING AND TALENT PLANNING
Table 8 Categories of vacancy that proved particularly difficult to fill ( of respondents)
Voluntary community
Manufacturing Private and and sector Public not-for-
All 2011 production services services profit All 2010
Other managers and professionalsspecialists
34 41 33 27 34 37
Technical 30 53 29 20 16 28
Senior managers directors
14 13 16 10 16 16
Services (customer personal protective 7 6 8 3 5 5 and sales)
Administrative secretarial
4 3 4 4 4 3
Manualcraft workers 4 11 3 1 0 2
Other 6 5 3 10 11 4
No difficulties experienced
23 12 22 30 38 25
No vacancies to fill 6 3 7 10 1 6 Base 597 (2011) 468 (2010)
Voluntary community
Manufacturing Private and All and sector Public not-for- All
2011 production services services profit 2010
Table 9 Reasons for recruitment difficulties ()
cipd
cou
k2011resou
rcing
and
talentp
lann
ing
survey
Lack of necessary specialist or technical skills 72 82 69 80 59 67
Look for more pay than you could offer 46 47 48 34 52 39
Lack of experience 40 42 43 27 41 36
Reluctance to move in current economic climate 19 24 18 17 15 26
Lack of interpersonal skills 16 9 19 10 20 12
No applicants 15 9 16 22 20 15
Image of sector occupationorganisation 13 7 12 22 11 12
Relocation difficulties 9 19 6 10 7 8
Lack of formal qualifications 7 7 7 5 7 4
The impact of the immigration cap 3 2 4 3 4
Other 4 3 3 8 7 7
Base 427 (2011) 330 (2010)
new item introduced in 2011
2011 Improving the employer brand Nearly three-quarters of organisations have made
efforts to improve their employer brand over the
past year (Table 10) The larger the organisation
the more likely it is to have undertaken one or
more activities to improve its brand Two-fifths of
small organisations with fewer than 50 employees
report they have taken no action to improve their
employer brand compared with one-quarter of
organisations with 250ndash999 employees and one-
sixth of those with more than 5000 employees
There are no significant sector differences
The most popular approaches to improving
employer brand are employee surveys and
developing online careers sites with larger
organisations most likely to have adopted these
methods14 The public sector is most likely to
have introduced or extended flexible working
homeworking15 whereas the private sector is
more likely to have made efforts to improve its
brand through working with charities or corporate
sponsorship16 Voluntary community and not-forshy
profit organisations are most likely to have used
placement students to improve their brand17
Attracting candidates The effectiveness of methods to attract applicants
varies according to sector and organisation size
(Table 11) Overall the most effective method is
through organisationsrsquo own corporate websites
as was the case last year The effectiveness of this
method increases with organisation size probably
due to the increased brand awareness and
perhaps because larger organisations have more
advanced websites18
The private sector particularly manufacturing
and production organisations is three times
more likely than public sector organisations to
report recruitment agencies among their most
effective methods and twice as likely as voluntary
sector organisations (regardless of size) Search
consultants and employee referral schemes are also
notably more popular in the private sector than in
the public or voluntary sectors
In contrast the public and voluntary sectors are
more likely to find the press effective for attracting
applicants including local and national newspaper
advertisements and specialist journalstrade press
Secondments are also deemed to be more effective
in these sectors than in the private sector
Table 10 Work undertaken over last year to improve employer brand ()
Voluntary community
All Private Public and 2011 sector services not-for-profit
Employee surveys 39 39 38 43
Developing online careers site 30 33 23 29
Introducingextending flexible working homeworking 24 20 39 29
Placement students 23 21 19 35
Graduate careers fairs 15 17 11 8
Working with charities 14 16 8 6
Corporate sponsorship 11 13 2 8
Introducing sabbaticals 3 4 1 5
Other 7 6 6 10
No action taken to improve employer brand 27 28 29 22
RESO
UR
CIN
G A
ND
TALE
NT P
LAN
NIN
G 2
011
Base 601
15
16
RESOURCING AND TALENT PLANNING
Table 11 Most effective methods for attracting applications by industry sector ()
Sector 2011 Number of UK employees 2011
All
2010
All
2011
Man
ufa
ctu
rin
gan
d p
rod
uct
ion
Priv
ate
sect
or
serv
ices
Pub
lic s
ervi
ces
Vo
lun
tary
co
mm
un
ity
and
no
t-fo
r-p
rofi
t
1ndash49
50ndash2
49
250ndash
999
100
0ndash4
999
Mo
re t
han
500
0
Own corporate website 63 59 44 57 77 66 42 55 57 77 79
Recruitment agencies 60 54 77 62 22 30 39 59 66 51 41
Local newspaper advertisements 36 32 38 23 41 51 28 35 35 29 29
Employee referral scheme 35 29 33 38 5 14 20 33 27 32 29
Commercial job boards 33 27 33 29 14 29 21 27 25 42 26
Specialist journalstrade press 31 27 24 23 30 43 26 23 32 32 24
Encourage speculative applicationsword of mouth 24 25 30 29 9 23 27 31 23 19 19
Jobcentre Plus 23 25 24 24 22 34 16 29 21 25 32
Professional networking (such as LinkedIn) 14 16 11 23 5 9 28 13 13 18 17
Search consultants 22 15 24 17 5 4 14 11 17 18 15
Links with schoolscollegesuniversities 18 13 16 13 9 17 12 13 11 18 15
Apprenticeships 12 11 19 9 13 9 10 10 11 12 17
National newspaper advertisements 16 11 4 6 23 29 10 9 15 10 15
Secondments 11 11 7 8 21 12 2 9 13 11 19
Links with other local organisations making redundancies 7 13 5 7 9 6 5 9 11 8
Alumni (previous employees) 5 5 6 7 2 1 7 2 6 11 3
Social networking sites (such as Facebook) 3 4 4 5 3 4 3 2 2 8 12
Local Employment Partnership (LEP) 6 3 1 4 2 5 1 2 3 4 9
Other 5 5 2 3 12 6 8 3 4 4 5
cipd
cou
k2011resou
rcing
and
talentp
lann
ing
survey
Base 604 (2011) 464 (2010)
new item introduced in 2011
Despite the popularity of social networking
sites such as Facebook they are not seen to be
particularly effective for attracting candidates
Professional networking sites such as LinkedIn are
more popular particularly in the private services
sector although there has only been a small
percentage increase in their reported effectiveness
compared with last year
2011 Recruitment partners A new question this year asked respondents if their
attitude to and relationships with recruitment
partners has changed over the past 12 months Just
over a third report things have not changed
(Table 12) A similar proportion report they have
reduced their use of recruitment partners and 6
that they have stopped using them altogether
with one in ten considering them an unaffordable
expense (one in five in the not-for-profit sector)
and a similar proportion an unnecessary expense
In contrast one in five (predominantly private
sector organisations) report they have formed
a closer business partnership with recruitment
partners over the past year and one in ten (again
predominantly private sector organisations) report
they consider them integral to attracting top talent
Selecting candidates There has been little change in the methods used
to select candidates over the past few years with
the exception of a drop in the use of general
ability tests compared with 2009 (Table 13)
Interviews remain the most common selection
method with competency-based interviews
being most popular overall Interviews following
the contents of CVsapplication forms are also
particularly popular in the private sector (70
compared with 41 in the public sector and 57
in the not-for-profit sector) whereas the public
and not-for-profit sectors favour structured (panel)
interviews (82 and 79 respectively compared
with 45 in the private sector)
Tests for specific job-related skills are more popular
in the public and not-for-profit sectors (61 and
62 respectively compared with 43 in the private
sector) whereas telephone interviews are more
popular in the private sector (52 compared with
12 in the public sector and 26 in the not-forshy
profit sector)
Table 12 Changes in attitudes to and relationships with recruitment partners over the past 12 months ()
Voluntary community
All Private Public and 2011 sector services not-for-profit
Not changed 36 34 40 39
Reduced use of recruitment partners 32 34 32 26
Formed a closer business partnership with them 19 23 8 12
Consider them an unnecessary expense 12 11 13 16
Consider them an unaffordable expense 11 10 11 22
Consider them integral to attracting top talent 9 11 2 4
Stopped using recruitment partners 6 5 8 5
Other 3 3 3 3 Base 604
RESO
UR
CIN
G A
ND
TALE
NT P
LAN
NIN
G 2
011
17
18
RESOURCING AND TALENT PLANNING
Table 13 Methods used to select applicants ()
2011 2010 2009 survey survey survey
Competency-based interviews 70 78 69
Interviews following contents of CVapplication form 63 64 68
Structured interviews (panel) 56 61 59
Tests for specific job-related skills 49 48 50
Telephone interviews 43 47 38
Literacy andor numeracy tests 38 43 39
Personalityaptitudepsychometric questionnaires 35 44 35
Assessment centres 35 42 35
Pre-application eliminationprogression question(s) 25 32 NA
General ability tests 23 27 44
Group exercises (for example role-playing) 21 30 26
Pre-interview references (academic or employment) 9 16 19
Video CVs 0 1 NA
Other 3 4 6
cipd
cou
k2011resou
rcing
and
talentp
lann
ing
survey
Base 605 (2011) 473 (2010) 754 (2009)
Strengths-based recruitment Two-fifths of organisations (40) report they use a
strengths-based approach to recruitment although
it is less commonly used in the public sector (26)19
In all sectors smaller organisations are most likely
to report they use a strengths-based approach
(60 of organisations with 1ndash49 employees use it
compared with 34 of organisations with 250ndash999
employees and 24 of organisations with more
than 5000 employees)20
Most of those who use a strengths-based approach
to recruitment are neutral about how easy it is to
administer in practice regardless of sector or size
Nearly a third (32) find it easy or very easy and
only one in ten (11) find it difficult
Over three-quarters of those who use a strengths-
based approach to recruitment believe it
brings benefits in terms of increased individual
performance (78) Two-thirds believe it improves
retention (67) and increases engagement (63)
Two-fifths (39) report it results in greater diversity
of skills in the workplace
Many organisations that use a strengths-based
approach to recruitment also use a strengths-based
approach for other people processes More than
half use it for performance management processes
(59) succession planning (55) and learning and
development (53) Two-fifths use it for talent
management (42) and a third use it for workforce
planning (32) Just under three in ten (29) also
use it for redeployment
Recruitment costs Last year we noted an increase in the proportion
of organisations that calculate their recruitment
costs (2010 65 2009 53 2008 51) This year
the proportion is back in line with previous years
(52) The increase last year may have been due
to sampling differences or a consequence of an
increased focus on costs during the recession that
has not continued
Four-fifths (79) of organisations that calculate
recruitment costs provided cost estimates per
hire There is considerable variance in the amount
organisations spend (at least partly due to our
2011 findings that organisations include different costs
in their calculations see Table 14) In general
the median figures (Table 15) are lower than last
year for both senior managerdirectors and other
employees
In order to explore the validity of estimates this
year we also asked respondents to indicate how
accurate their cost estimates were Half (51) of
estimates for costs of recruiting senior managers
directors were accurate to plus or minus 10 and
83 to plus or minus 20 Two-fifths of estimates
for other employees were accurate to plus or minus
10 and 74 to plus or minus 20 Table 16
shows the median figures for estimates that were
believed to be accurate to up to plus or minus 20
The figures indicate as we found last year that
organisations spend considerably more on senior
appointments than on other employees This
reflects the value attached to good leadership and
perhaps the additional challenges of attracting
the best candidates for senior positions This is
particularly the case in the private sector where
considerably more is spent on the recruitment of
senior managersdirectors than in the public or not-
for-profit sectors
Table 14 Criteria included in cost per hire calculations ()
Size ndash number of employees in UK
Advertising costs
Agencysearch costs
Employee referrals
Travel expenses
Relocation expenses
Fixed costs of resourcing team
Opportunity costs of hiring managers time
Other
Dont know Base 299
81
75
35
30
17
24
24
3
4
Table 15 Estimated total costs (advertising costs agency or search fees) per hire (pound)
Median 2011 Median 2010 (no of (no of
Occupational group respondents) Minimum Maximum respondents)
Senior managersdirectors 7000 (219) 251 55000 8333 (234)
Other employees 2000 (246) 150 32000 2930 (262) Number of respondents shown in brackets
Table 16 Median total costs (advertising costs agency or search fees) per hire for estimates accurate to plus or minus 20 (pound)
Voluntary
Median 2011 Manufacturing
and Private Public
community and not-for-
Occupational group production sector services profit
RESO
UR
CIN
G A
ND
TALE
NT P
LAN
NIN
G 2
011
Senior managersdirectors 7500 8000 9000 5000 3500
Other employees 2500 3400 2000 3000 1500 Base 150
19
cipd
cou
k2011resou
rcing
and
talentp
lann
ing
survey
20
RESOURCING AND TALENT PLANNING
2 RESOURCING AND TALENT mANAGEmENT IN TURBULENT TImES
In January 2010 the UK officially emerged from the recession however the economic environment remains uncertain for many organisations The environmental disasters in Japan the uprisings and wars in the Middle East rising oil prices and European debt highlight the volatility of global markets In the UK economic growth remains sluggish and there are concerns regarding the impact of the VAT increases high inflation and the austerity measures of the Coalition Government This section examines the impact of the economic environment on resourcing budgets strategies and activities in 2010 It looks at changes in views on the employment market and the implications for managing talent
The impact of the economic climate on resourcing Overall half of organisations report that the
economic climate has had a negative impact on
their organisationsrsquo resourcing budgets for 2011ndash12
(Table 17) This year however it is the public
sector that is most severely hit with four-fifths
(82) reporting their resourcing budgets will be
reduced (up from 59 last year) In contrast fewer
private and not-for-profit sector organisations
face reductions this year compared with last
although more are still reducing their budgets than
increasing them
Changes in resourcing and talent practices in
2011 compared with 2010 reflect a stronger
focus on costs and reductions in budgets (Figure
3) Two-thirds plan to develop more talent inshy
house (compared with one-third in 2010) and
more organisations plan to reduce reliance on
recruitment agencies and external consultants for
resourcing and development The proportion of
organisations planning to focus more on retaining
rather than recruiting talent has increased to 51
in 2011 from 28 in 2010
2011 Changes in recruitment practices are also
anticipated More organisations plan to make use
of new mediatechnology to recruit which may
be a cost-cutting strategy but can also improve
the efficiency and effectiveness of the recruitment
process On a positive note more organisations plan
to invest more time and effort in the quality of
candidates they hire and will be taking actions to
improve ways of identifying quality candidates
Public sector organisations are more than twice
as likely to be implementing a recruitment freeze
in 2011 (46 compared with 22 overall)
Nevertheless this is an improvement on 2010 when
58 of public sector organisations implemented a
recruitment freeze The situation is also somewhat
brighter for many private sector organisations
with 15 reporting they will be implementing a
recruitment freeze in 2011 compared with 26
in 2010 Nevertheless the economic recovery
remains slow for many with 29 of private
sector organisations and 66 of public sector
organisations reporting they will be reducing the
number of new recruits they hire in 2011 similar
proportions to 2010 Inevitably more public than
private sector organisations report they will be
reducing their headcount in 2011 and losing key
talent (33 compared with 9 in the private
sector) and redeploying people into new roles (66
compared with 37 in the private sector)
Table 17 Impact of the current economic climate on organisationsrsquo resourcing budgets ()
Private Public Voluntary community All sector services and not-for-profit
2011 2010 2011 2010 2011 2010 2011 2010
Reduced 49 53 41 51 82 59 51 61
Stayed about the same 36 37 39 40 14 36 40 34
Increased 8 7 11 4 1 5 4 5
Dont know 7 3 8 5 3 5 Base 615 (2011) 475 (2010)
RESO
UR
CIN
G A
ND
TALE
NT P
LAN
NIN
G 2
011
21
cipd
cou
k2011resou
rcing
and
talentp
lann
ing
survey
22
RESOURCING AND TALENT PLANNING
figure 3 Resourcing and talent practices implemented in 2011 and 2010 ( of respondents)
Developing more talent in-house
Continuing to recruit key talentniche areas
Focusing more on retaining rather than recruiting talent
Reducing reliance on recruitment agencies
Use of new mediatechnology to recruit
Investing more time and effort in the quality of candidates we hire
Redeploying people into new roles
Reducing the number of new recruits we hire
Taking actions to improve ways of identifying quality candidates
Increasing the number of interimcontract staff recruited
Reducing our use of external consultants for resourcing and development
Increased recruitment of apprenticesinterns
Implementing a recruitment freeze
Reducing our headcount but preserving key talent
Recruiting talent discarded by competitors
Reducing our headcount and losing key talent
Offering sabbaticals career breaks additional holidays
Reducing employees working hours to avoid making people redundant
8Reducing graduate recruitment 8
6Suspending graduate recruitment 7
36
28
36
28
26
30
35 35
35 15
29 23
28 19
24 12
22 30
22 16
18 11
13 12 12
10
12 10
66
59 46
51
47
46
45
44
0 10 20 30 40 50 60 70 80 Percentage of respondents
2011 2010
Base 582
RESO
UR
CIN
G A
ND
TALE
NT P
LAN
NIN
G 2
011
23
2011 Views on the employment market In little change to last year three-quarters of
organisations report they have noticed an increase
in the number of unsuitable applicants as they have
fewer roles to fill (Figure 4) Far fewer (34) report
that there are too many suitable candidates to
choose from and despite high unemployment over
the past two years more than half (52) believe that
competition for talent is even greater as the pool of
available talent to hire has fallen sharply (2010 41
2009 20) For many organisations there appears a
clear mismatch between the skills they require and
those available in the labour market
Competition for talent appears to be particularly
keen in the private sector Two-thirds (64) of
manufacturing and production organisations
and 55 of private services organisations agree
that competition for talent is even greater now
compared with 39 of the public sector and 34
of not-for-profits21 In contrast the public sector
and not-for-profits are more likely to agree they
have too many suitable candidates to choose
from (61 and 47 respectively compared with
23 of manufacturing and production and 27
of private sector services)22
Three-fifths (62) of respondents agree that the
demand for temporary and contract workers will
increase as employers will be reluctant to take
on permanent staff during uncertain times while
44 agree that part-time workers will become
more appealing to employers who are looking to
cut costs
figure 4 Views on the employment market ( agreeing or strongly agreeing)
With fewer roles to fill we have noticed an increase in the number
of unsuitable applicants
The demand for temporary and contract workers will increase as employers will be reluctant to
take on permanent staff during uncertain times
Employers will use the economic downturn as an opportunity to get rid of poor performers
and bring about culture change
Competition for talent is even greater now as the pool of available talent to hire has
fallen sharply
Part-time workers will become more appealing to employers who are looking to cut costs
Employers are acting too hastily in making people redundant and as a result they will lose too
many employees with valuable knowledge and skills
With fewer roles to fill there are now too many suitable candidates to choose between
The abolition of the Default Retirement Age will mean we recruit fewer people
Employers will look to make older workers over the age of 65 redundant before their younger workers
73 76
54
62 66 66
55 63
72
52 41
20
44 45
52
44 48
53
34 32
23
19 22
27
0 10 20 30 40 50 60 70 80 Percentage of respondents
2011 2010 2009
Base 607 (2011) 475 (2010) 746 (2009)
item added 20102011
24
RESOURCING AND TALENT PLANNING
More than half of respondents (55) across
all sectors believe that employers will use the
economic downturn as an opportunity to get rid of
poor performers and bring about culture change
While high this shows a downward trend on the
past two years (2010 63 2009 72 agree or
strongly agree) perhaps reflecting a slowing in
the number of redundancies Similarly there is
a gradual downward trend in the proportion of
respondents who express concern that employers
are acting too hastily in making people redundant
and as a result they will lose too many employees
with valuable knowledge and skills or that
employers will look to make older workers over the
age of 65 redundant before their younger workers
Nearly a quarter (23) of respondents believe
that the abolition of the Default Retirement Age
will mean they recruit fewer people (48 in the
public sector)23
Implications for talent management The value of effective talent management has
not been lost in the recent attention on reducing
costs Two-fifths (41) of organisations report
that the current economic situation has led
to an increased focus on talent management
(43 in 2010) and only 4 that it has led to a
decreased focus (7 in 2010) with no significant
differences across sectors Unsurprisingly however
the public sector are about twice as likely this
year to report they have reduced their overall
talent management spend due to the downturn
compared with other sectors (Table 18)24
The proportion of organisations that report
the economic downturn has had an impact on
approaches to reward across the business has
slightly reduced compared with last year (54
compared with 61 in 2010) As last year it
appears that organisations across all sectors
are being more selective in who they reward A
smaller proportion of organisations report their
approach to reward for individuals identified as
talent has been affected by the downturn (42)
than report their approach to reward across the
business has been affected (54)
Table 18 Has your overall talent management spend been reduced due to the economic downturn ()
cipd
cou
k2011resou
rcing
and
talentp
lann
ing
survey
Voluntary All community and All
2011 Private sector Public sector not-for-profit 2010
Yes 18 17 32 13 23
No 38 43 16 32 41
NA (no talent management spend) 44 40 52 55 36
Base 617 (2011) 471 (2010)
RESO
UR
CIN
G A
ND
TALE
NT P
LAN
NIN
G 2
011
25
2011
Case study Innovative recruitment and cost saving in the Association of Greater Manchester Authorities
The Association of Greater Manchester Authorities (AGMA) represents the ten local authorities in
Greater Manchester and works in partnership with a wider group of associate councils and public
sector organisations AGMA chief executives and council leaders work together on a range of key
strategic and policy issues which impact on Greater Manchester including resourcing strategies
and recruitment and retention issues
The AGMA initiative in cost reduction in the area of resourcing has been described as lsquoa truly
pioneering example of collaboration between a number of local authoritiesrsquo and is already
delivering against a range of objectives
The initial aim was to make a significant saving on the pound5ndash6 million annual cost of external
media advertising reported in 2008ndash09 and to create a more efficient and effective recruitment
system A shared portal was commissioned to offer a front-end website (wwwyourcounciljobs
couk) with a lsquoback-officersquo e-recruitment system which would give a standardised shared-service
approach for job applicants across councils Some of the benefits for applicants include the ability
to go to one place to register their interest to be able to look in specific categories for jobs
of particular relevance to them to be able to amend an existing application form in order to
apply for a further post and to receive email alerts when new jobs relevant to their interests are
posted In addition communications to job-seekers are now standardised for every council
This approach has seen real benefits across each of the local authorities workflows are now
standardised as every HR team runs identical systems and there is consistency in reporting within
all councils enabling them to benchmark their processes more clearly The councils use this
benchmarking data to make additional improvements and efficiencies
Jayne Whitehead AGMA Category Procurement Manager has project-managed the initiative
with managers represented from each participating authority and describes the process as one
of lsquotrue collaborationrsquo with lsquo100 commitmentrsquo from all the councils involved The benefits
are clear annual media costs are dramatically reduced to approximately pound250000 across ten
partner organisations and there has been a reduction in time-to-hire of 13 days This has had
the knock-on effect of reducing expenditure on agency staff The average cost of a recruitment
advertisement per role was previously pound97400 it is now pound15200 There have also been benefits
outside the original intention including doubling the number of online applications for council
posts with administrative cost savings in HR of approximately pound250000 across the consortium
More than 61000 registered users are now on the system and the councils are successfully filling
their own talent pools of prospective job-seekers Overall the project team is now celebrating a
pound17 million reduction in recruitment expenditure over the past 12 months
(continued)
cipd
cou
k2011resou
rcing
and
talentp
lann
ing
survey
26
RESOURCING AND TALENT PLANNING
There were some challenges in the implementation of this new way of working All the councils
had to be convinced about the benefits of the changes With the implementation of a new IT
system having its own set of challenges the project has taken 12 months to introduce longer
than first anticipated Implementing the changes during a period of radical restructuring in all
councils also proved particularly challenging However Jayne describes how both the need to
make efficiencies and feedback from job-seekers meant that lsquowe had to find a different way of
doing thingsrsquo Jayne also recognises how the neutrality of her own role (each council pays a tenth
of her salary) has been essential in ensuring that the project has been fair to all its participants
offering a centralised shared resource to manage the project
The project is now set to develop yet further with the aim of becoming entirely self-funding
within the next year by accepting advertising from other organisations Two new websites are
planned for recruitment into schools and social care jobs bringing even less reliance on media
and agencies AGMA will also be further building its own talent pool
Jayne describes the initiative as lsquoa true example of what you can do if you collaborate across
authoritiesrsquo Not only the separate councils but also diverse teams and functions including HR IT
procurement communications and marketing have worked together to deliver this innovative
and inspiring project
Information provided by Jayne Whitehead AGMA Category Procurement Manager
2011
3 DIVERSITy
This section examines organisationsrsquo approaches to diversity including the use of formal diversity strategies and the methods used to address diversity issues
Just over half of organisations report they have with just under two-thirds of not-for-profit
a formal diversity strategy showing little change organisations and just two-fifths of private sector
over the past four years (2011 52 2010 55 companies (Table 19)25 Diversity strategies are also
2009 60 2008 55) Consistent with previous more common in larger organisations (regardless
yearsrsquo findings most public sector organisations of sector)26
(90) have a formal diversity strategy compared
Table 19 Does your organisation have a formal diversity strategy ()
Yes No Dont know
All 52 41 7
Sector
Private sector 41 50 8
Public services 90 9 1
Voluntary community and not-for-profit 63 33 4
Number of UK employees
Fewer than 50 45 50 5
50ndash249 43 51 6
250ndash999 48 44 7
1000ndash4999 65 31 4
More than 5000 80 9 11 Base 613
RESO
UR
CIN
G A
ND
TALE
NT P
LAN
NIN
G 2
011
27
28
RESOURCING AND TALENT PLANNING
As was the case last year over three-quarters
of organisations with a formal diversity policy
attempt to address diversity issues through
monitoring recruitment andor staffing
information to obtain data on gender ethnicity
disability age and so on (Table 20) Less than
three-fifths train interviewers to understand what
diversity is about and the impact of stereotypes
Other diversity-focused initiatives are even
less common moreover the figures indicate a
reduction in the use of several methods compared
with previous years The pressures of the recession
may have led to a reduced focus on diversity
Given the links between diversity in the workforce
and productivity organisations that fail to give
this issue the attention it requires may find
themselves at a disadvantage in the future
Traditionally the public sector has tended to lead
the way in terms of diversity practices Again this
year they are significantly more likely to address
diversity issues through monitoring recruitment
andor staffing information through providing
recruitment documents in other formats through
advertising vacancies in different sources to
attract under-represented groups and through
setting recruitment targets to correct a workforce
imbalance Nevertheless they are less likely than
other sectors to actively try to attract talent of all
ages (Table 20) Moreover our figures indicate that
the reduction in the use of several diversity methods
compared with previous years is particularly
pronounced in the public sector The change of
government and budget reduction measures have
led to significant change programmes in many
public sector organisations which may have resulted
in a reduced focus on diversity issues
Table 20 Methods used to address diversity issues in organisations ( with formal diversity strategy)
Voluntary community
Private Public and not-sector services for-profit
2011 2010 2009 2008 2011 2011 2011 survey survey survey survey (2010) (2010) (2010)
Monitoring recruitment andor staffing information to obtain data on gender 78 79 84 83 70 (71) 88 (96) 88 (76) ethnicity disability age any other categories
cipd
cou
k2011resou
rcing
and
talentp
lann
ing
survey
Training interviewers to understand what diversity is about and the impact of stereotypes
57 68 68 60 53 (66) 64 (73) 57 (72)
Actively trying to attract talent of all ages 45 53 32 43
Operating policies that go beyond basic legislative requirements on age gender race disability sexual orientation religion and belief
39 49 52 48 34 (44) 47 (63) 47 (40)
Providing recruitment documents in other 39 41 37 31 24 (22) 64 (77) 47 (52)formats (online large-print audio and so on)
Checking that any tests used are valid reliable and culture-free and were tested on diverse norm groups
36 42 47 34 39 (44) 35 (45) 27 (16)
Advertising vacancies in different sources to 31 37 51 48 22 (30) 44 (53) 41 (32)attract under-represented groups
Using specific imageswords in your recruitment advertising to appeal to a wider audience 29 38 42 42 25 (30) 36 (52) 33 (40)
Making attempts to employ the long-term 19 19 13 29unemployed
Setting recruitment targets to correct a workforce imbalance 9 15 14 12 4 (8) 18 (31) 8 (16)
Base 312 (2011) 253 (2010) 419 (2009) new item added in 2011
RESO
UR
CIN
G A
ND
TALE
NT P
LAN
NIN
G 2
011
29
2011
4 mANAGING LABOUR TURNOVER
Figures from the Office for National Statistics show that UK unemployment rose by 27000 in the three months to the end of January 2011 to 253 million the highest since 1994 When unemployment is high the number of employees leaving organisations voluntarily is expected to decrease Here we examine whether this is happening and how organisations are tackling the issue of employee retention
Among organisations that are able to supply
turnover data the median labour turnover rate
has decreased over the past few years (Table 21)
The median figure however hides differences
across organisations Slightly more organisations
report their turnover has increased in 2010
compared with 2009 (38) than has decreased
(33) while for nearly a third (29) it remained
the same Smaller organisations are more likely
to report their labour turnover has increased and
larger organisations that it has decreased27
As in previous years the majority of turnover (53)
is still attributed to employees leaving voluntarily
(Table 22) As the economy has improved the
median proportion of turnover due to redundancies
has reduced Only 12 of organisations that
provided reasons for leaving made more than ten
redundancies in the previous year compared with
33 in 2010 26 in 2009 and 22 in 2008 A third
(34) of organisations that made redundancies
offered career transition services
While median turnover rates have reduced
across all sectors Table 23 shows that the rate
of voluntary leavers has increased slightly in
the private sector compared with last year but
decreased in the voluntary and public services
sector This reflects improvements in the economic
outlook for the private sector and the widespread
cuts in the public sector which also have a direct
impact on many not-for-profit organisations that
provide services for the public sector
Cost of labour turnover While just over half of organisations calculate
their recruitment costs only 13 calculate the
cost of their labour turnover (2010 14) The
majority of organisations report they do not
calculate these costs (79) while 7 donrsquot know
if they are calculated or not
Nearly half (46) of those who calculate their
turnover costs want to maintain their current
turnover rate while one-fifth (38) want to
reduce turnover during 2011 and 15 want to
increase it
Retaining employees The steps organisations take to retain employees
in their workforce can have a significant impact
on organisational efficiency and success through
30
RESOURCING AND TALENT PLANNING
Table 21 Median rate of labour turnover ()
2011 2010 survey 2009 survey 2008 survey 2007 survey 2006 survey
125 135 157 173 181 183
Base 175 (2011)
Table 22 Median labour turnover rates by reason for leaving ()
2011 survey 2010 survey 2009 survey
Voluntary redundancies 0 0 0
Compulsory redundancies 0 10 05
Dismissedleft involuntarily (including death in service)
07 09 14
Fixed-short-term contracts 0 0 07
Retired 0 04 07
Left voluntarily 66 84 90
Base 154 (2011)
Table 23 Median labour turnover rates by industry sector ()
cipd
cou
k2011resou
rcing
and
talentp
lann
ing
survey
Sector All leavers Voluntary leavers
2011 survey
2010 survey
2009 survey
2011 survey
2010 survey
2009 survey
Manufacturing and production 93 (38) 124 (44) 153 (80) 37 (35) 27 (42) 77 (75)
Private sector services 138 (96) 146 (77) 168 (150) 87 (82) 74 (71) 104 (129)
Public services 85 (28) 86 (19) 126 (52) 34 (10) 58 (15) 76 (45)
Voluntary community not-for-profit 131 (11) 159 (15) 164 (38) 70 (24) 102 (18) 110 (35) Number of respondents shown in brackets
decreasing employee turnover loss of talent and
recruitment and training costs while having a
positive impact on motivation job satisfaction and
the employer brand
Only two-fifths (42) of organisations
experienced no difficulties in retaining staff
during 2010 This figure is similar to last year
(45) but higher than the findings for 2008
when 31 reported they had no retention
difficulties These findings reflect the increased
caution of employees regarding leaving their
jobs during times of economic uncertainty and
high unemployment Supporting this are our
findings that the public (49) and not-for-profit
sectors (49) are more likely to report they had
no difficulties in retaining staff during 2010
compared with the private sector (38)
As in previous years organisations most
commonly have difficulty retaining managers
and professionalsspecialists (Table 24) The
manufacturing and production sector are most
likely to report difficulties retaining technical
2011 staff and the private services sector that they have
most difficulty retaining services staff This may
reflect the higher demand for these categories of
employees in these sectors
While most organisations have taken one or more
steps to address staff retention nearly one in four
organisations (23) report that no specific retention
initiatives were undertaken This is a similar
proportion to last year although substantially higher
than in previous years when retention difficulties
were more common due to a tighter labour market
(Table 25) Public sector organisations are twice
as likely not to have taken any steps to address
retention as those in the private or not for-profit
sectors (39 compared with 20 of private sector
and 16 of not-for-profits)28
The most common methods used to address
retention in 2010 used by nearly two-fifths of
organisations are to improve line managersrsquo
people skills improve learning and development
opportunities and improve the induction process
Improving line managersrsquo people skills and
learning and development opportunities are also
most commonly rated among the top three most
effective retention methods The effectiveness of
improving induction processes is more varied with
22 rating it among the top three most effective
methods and 12 among the top three least
effective methods Views are also mixed regarding
the effectiveness of improved pay It is likely that
employees are motivated by different factors
Employers need to provide a healthy working
environment where employees are treated with
respect and make efforts to match their retention
initiatives with what staff want
Table 24 Retention difficulties by occupational category ()
Voluntary community
Private and All Manufacturing sector Public not-for- All
2011 and production services services profit 2010
Managers and professionals specialists 28 26 29 25 29 27
Technical 21 37 19 17 13 20
Services (customer personal protective and sales) 13 7 21 4 4 12
Administrative secretarial 9 5 8 15 13 7
Senior managersdirectors 7 5 8 10 6 9
Manualcraft workers 6 11 6 3 4 4 Base 601 (2011) 451 (2010)
RESO
UR
CIN
G A
ND
TALE
NT P
LAN
NIN
G 2
011
31
32
RESOURCING AND TALENT PLANNING
Table 25 Steps taken specifically to address staff retention ()
Used in Least Most Used in Used in Used in 2010 effective effective 2009 2008 2007
Improved line managers people skills 39 7 31 42 39 37
Increased learning and development opportunities 38 5 34 35 47 46
Improved induction process 38 12 22 31 45 45
Improved employee involvement 34 8 24 32 35 29
Improved selection techniques 30 7 25 31 42 46
Improved pay 27 11 23 22 42 53
Offered coachingmentoring buddy systems 24 8 14 20 24 22
Improved benefits 21 8 14 19 32 36
Better promotion to employees of the employer brand 18 10 5 15 21 16
Created clearer career paths 18 6 2 21 18 17
Revised the way staff are rewarded so their efforts are 18 4 13 14 19 19 better recognised
Made changes to improve workndash life balance 17 5 13 19 31 30
Improved physical working conditions 15 8 7 13 19 12
Redesigned jobs to make them more satisfying 11 4 8 13 18 14
Increased our use of countershyoffers 4 4 14
No specific initiatives undertaken 23 3 1 27 13 9 Base 559 (2011 survey) 431 (2010 survey) 695 (2009 survey) 710 (2008 survey)
new item added in 2011
cipd
cou
k2011resou
rcing
and
talentp
lann
ing
survey
RESO
UR
CIN
G A
ND
TALE
NT P
LAN
NIN
G 2
011
33
2011
CONCLUSIONS
Looking forward In January 2010 the UK officially emerged from
the longest recession since the 1930s Economic
growth however remains sluggish and the public
sector has embarked on a four-year programme of
the biggest government spending cuts in decades
to address the fiscal deficit
In the labour market unemployment remained
high throughout 2010 Figures from the Office
for National Statistics (ONS) show that UK
unemployment rose by 27000 in the three months
to the end of January 2011 to 253 million the
highest since 1994 While recent months have seen
signs of improvement there are concerns that the
slow growth in the private sector will be unable
to fully compensate for the increasing job losses in
the public sector that will result from the budget
cuts This is supported by the findings from the
CIPDrsquos spring 2011 Labour Market Outlook which
shows the impact on the overall labour market of a
slight rise in private sector recruitment is still being
cancelled out by large-scale public sector job losses
The findings of the CIPDrsquos 2011 Resourcing and
Talent Planning survey reflect the challenges
of the economic environment Organisations
generally have increased their focus on costs On
average organisations spent less on filling each
vacancy and a fifth have reduced their resourcing
budgets and talent management spend In the
public sector the focus on costs and budget
reductions was particularly apparent
The end of the recession has meant fewer
redundancies in 2010 Nevertheless over a third
of public sector and one-fifth of private sector
organisations reduced their headcount The
number of vacancies on offer by organisations
remained as low as in 2009 overall and continued
to decrease in very large organisations particularly
in the public sector
Looking forward private sector growth is expected
to remain slow and the full impact of public
sector budget cuts is still to come Resourcing and
talent management budgets will be further hit
in 2011ndash12 and many public sector organisations
will implement recruitment freezes and reduce
graduate intake and recruitment generally
Resourcing and talent practices are changing to
reflect the stronger focus on costs and reductions
in budgets Particularly in the public sector but
also in the private sector trends indicate a greater
focus on developing talent in-house retaining
rather than recruiting talent and reducing reliance
on recruitment agencies and external consultants
for resourcing and development
Our findings do not present a positive outlook
for the vast number of unemployed A substantial
proportion of organisations reports that the
already low number of vacancies available to them
is likely to be further affected by the abolition
of the Default Retirement Age Yet despite the
high unemployment rate most organisations
reported difficulties in filling vacancies mostly due
to skill shortages We have also seen an increase
in the proportion of organisations reporting
that competition for talent is even greater as the
pool of available talent to hire has fallen sharply
For many organisations there appears a clear
mismatch between the skills they require and
those available in the labour market Some are
concerned this will be exacerbated by the increase
in university tuition fees Some are responding
cipd
cou
k2011resou
rcing
and
talentp
lann
ing
survey
34
RESOURCING AND TALENT PLANNING
by increasing apprenticeship schemes internships
and sponsoring students through university Such
schemes may be aided by the Governmentrsquos recently
announced pound60 million commitment to help boost
youth employment and provide extra support for
apprenticeships and changes to vocational training
and education How far this will go towards meeting
organisationsrsquo skill requirements remains to be seen
On a positive note our findings indicate that talent
management is viewed as more not less important
in difficult times although with reduced budgets
organisations will have to be innovative with
their approach and strategies In order to survive
organisations will need to make certain they focus
beyond the cost-cutting required in the current
environment to ensuring their talent strategies are
aligned to long-term business success
The CIPDrsquos Shaping the Future and Next Generation
HR flagship projects have both explored the
important issues of sustainability Shaping the Future
in particular warns against the dangers of lsquotalent
tunnel visionrsquo taking a short-sighted view on talent
strategies which are solely focused on the needs of
the here and now
Often organisations pay too little attention to
identifying and developing the capabilities that
individuals will need in the long term This implies a
leadershiptalent management capability gap with
too much focus on the operational needs of today
rather than the organisational imperatives
of tomorrow
Itrsquos never too late to start equipping your people
with the skills and knowledge they need to meet
both present and future challenges So what practical
recommendations can we make for resourcing and
talent professionals drawn from our Shaping the
Future evidence
Audit your organisationrsquos current skills and future capabilities If you havenrsquot done so already conduct a thorough
inventory of your organisationrsquos current skills and map
those against the capabilities you are likely to need
in the future Hold forecasting sessions which look at
macro and micro trends how these will impact your
way of working and the changes that will be required
for future success
Build your talent and succession pipeline You also need to be proactively building up your
talent pipelines (horizontally and vertically) so that
you are developing people with future-fit skills and
capabilities A silver lining from the current economic
climate is that more organisations are focusing on
developing internal talent and fully utilising the
skills of their existing workforce Fresh talent is
still important but recruitment strategies should
complement internal pipelines
Maintain a continuous focus on capability-building Capability-building should be part of a continuous
process embedded into policies and practices Across
our case study organisations managers talked about the
need to embed development and skills training as part
of business as usual rather than as a one-off activity
Develop a creative approach to skills and capability development Even when budgets are tight it is essential that
staff get the development they need to ensure they
have the capabilities for their current job role as well
as starting to build those that the organisation will
need in the future Our case study organisations were
focusing strongly on knowledge-sharing enabling
people to learn from others across the organisation
Many of you are already considering alternative
solutions for specialist skill development such as
apprenticeships internal management schemes
summer placements and internships It is also
important to work with universities to ensure that
graduates are developing skills and knowledge which
will help them to succeed in the workplace
RESO
UR
CIN
G A
ND
TALE
NT P
LAN
NIN
G 2
011
35
2011
BACkGROUND TO ThE SURVEy
This survey was conducted in March and April 2011 It was sent to a sample of UK-based HR professionals in the public private and voluntary sectors In total 626 people responded to the survey
This is the fifteenth annual CIPD Resourcing
and Talent Planning survey (formerly known as
the CIPDrsquos Recruitment Retention and Turnover
survey) The survey examines organisationsrsquo
resourcing and talent planning strategies and
practices and the key challenges and issues
they face The survey consists of 45 questions
completed through an online self-completion
questionnaire
The majority of questions remain the same as
previous years to provide useful benchmark
data on topics including recruitment practices
difficulties and costs selection methods diversity
strategies the impact of the economic climate on
resourcing and talent planning practices labour
turnover and retention strategies New question
areas this year examine the employment of
younger workers the length of the recruitment
process the nature of job vacancies relationships
with recruitment partners and the use of
strengths-based approaches to recruitment
A small number of respondents took part in follow-
up telephone interviews to produce mini case
studies on a selection of topics These are presented
in the coloured boxes throughout the report
Sample profile Respondents predominantly work for private
sector organisations with professional services
being particularly well represented but other
sectors are represented in similar proportions to
last year (Table A1)
36
RESOURCING AND TALENT PLANNING
Table A1 Breakdown of respondent organisations by industrial sector Number of respondents
Manufacturing and production 113 19
Agriculture and forestry 1 0
Chemicals oils and pharmaceuticals 9 1
Construction 8 1
Electricity gas and water 4 1
Engineering electronics and metals 38 6
Food drink and tobacco 18 3
General manufacturing 6 1
Mining and quarrying 4 1
Paper and printing 6 1
Textiles 2 0
Other manufacturingproduction 17 3
Private sector services 319 52
Professional services (accountancy advertising consultancy legal etc) 78 13
Finance insurance and real estate 33 5
Hotels catering and leisure 26 4
IT services 26 4
Call centres 3 0
Media (broadcasting and publishing etc) 7 1
Retail and wholesale 40 7
Transport distribution and storage 23 4
Communications 6 1
Other private services 77 13
Public services 100 16
Central government 14 2
Education 12 2
Health 23 4
Local government 22 4
Other public services 29 5
Non-profit organisations 78 13
Care services 9 1
Charity services 32 5
Housing association 17 3
Other voluntary 20 3 Base 610
cipd
cou
k2011resou
rcing
and
talentp
lann
ing
survey
2011 Most respondents work in small to medium-sized
organisations in terms of the number of UK-
based employees but larger organisations are
also represented in similar proportions to last year
(Table A2)
Respondents reported on organisations based
across the UK Three in ten responded for the
whole of the UK while others responded for a
particular regioncountry (see Table A3)
Table A2 Breakdown of sample by organisation size ndash permanent employees in the UK
Fewer than 10 5
10ndash49 12
50ndash249 33
250ndash999 25
1000ndash4999 12
More than 5000 13 Base 610
Table A3 Main region covered by the reply
East Anglia 5
East Midlands 3
West Midlands 5
North-east of England 3
North-west of England 7
South-west of England 6
Yorkshire and Humberside 5
South-east of England (excluding London)
12
London 12
Scotland 6
Wales 3
Northern Ireland 3
Ireland 0
Whole of UK 29 Base 602
Labour turnover A total of 175 survey respondents were able to
supply all the information necessary for us to
calculate labour turnover on a whole-organisation
basis
This report uses the standard lsquocrude wastagersquo
method to calculate the rate of turnover This
method is calculated as follows
Labour turnover =
Number of leavers in a set period
______________________________________ x 100
Average number employed in the same period
(Leavers include those leaving the organisation
by way of voluntary or involuntary severance
redundancies or retirements but does not include
internal transfers)
Readers should be aware that this method has
some shortcomings For example it takes no
account of the characteristics of the workforce or
the length of service of the leaver
Note on statistics and figures used Some respondents did not answer all questions so
where percentages are reported in tables or figures
the respondent lsquobasersquo for that question is given
lsquoAveragersquo in the report is used to refer to the
statistical mean where the data is normally
distributed However the median is used in cases
where the distribution is significantly skewed
When the median is used it is noted
With the exception of labour turnover rates all
figures in tables have been rounded to the nearest
percentage point Due to rounding percentages
may not always total 100
Chi-square (χ2) tests are used to examine whether
differences between groups such as industrial
sectors are significant or likely to be due to
chance Spearmanrsquos Rho correlation (Rho) is used
to examine relationships between variables We
report on statistics at the generally accepted level
of significance plt005
RESO
UR
CIN
G A
ND
TALE
NT P
LAN
NIN
G 2
011
37
38
RESOURCING AND TALENT PLANNING
fURThER SOURCES Of INfORmATION
We produce a range of free factsheets surveys
guides and research reports which are available on
the CIPD website at cipdcoukhrresources
Read our factsheets on Employer Brand
Employee Turnover and Retention
Induction
Outlook series Our quarterly reports Labour Market Outlook
and Employee Outlook look at the employer and
employee perspectives on the labour market and
on workplace issues and trends while HR Outlook
explores priorities and emerging trends for the HR
profession and function
View these reports at
cipdcoukresearchoutlook-series
Talent management Two reports look at talent issues in a recession
difficult economic climate
The War on Talent Talent management under
threat in uncertain times (2009)
Fighting Back through Talent Innovation (2010)
Opening up Talent for Business Success (2010)
looks at the importance of integrating talent
management and diversity
The Talent Perspective What does it feel like to
be talent-managed (2010) looks at the employee
view of talent management
Workforce planning Our guide Workforce Planning Right people right
time right skills (2010) gives advice on developing
workforce planning processes
Diversity Two survey reports and a guide provide practical
advice and information on trends
Diversity in Business A focus for progress (2007)
Managing an Ageing Workforce How employers
are adapting to an older labour market (2010)
Managing Age New edition 2011
Two further reports are available to order from
cipdcoukbookstore
Managing Diversity in Practice Supporting
business goals (2007)
Managing Diversity and the Business Case (2008)
Sign up to receive our e-newsletter at
cipdcoukcipdupdate
cipd
cou
k2011resou
rcing
and
talentp
lann
ing
survey
RESO
UR
CIN
G A
ND
TALE
NT P
LAN
NIN
G 2
011
39
2011
ACkNOwLEDGEmENTS
The CIPD is very grateful to those organisations and
individuals who gave their time to take part in this
research They include
bull Annette Sinclair Senior Researcher at Roffey
Park for analysing the findings and writing this
comprehensive report
bull Members of the Recruitment Forum Steering
Committee for their input into the survey
design and assistance in piloting the
questionnaire
bull Hays for their support and commitment at
every stage of the research
bull All those who shared examples of their
organisationrsquos practices
We hope that you find the research useful when
considering your own recruitment and retention
practices Please contact us if you have any
questions or ideas based on our findings
(researchcipdcouk)
RESOURCING AND TALENT PLANNING
fOOTNOTES 1 Chi Square = 573 df = 5 p lt 0001 n = 604 2 Rho = 073 p lt 0001 n = 577 3 Rho = 045 p lt 0001 n = 533 4 F = 250 df = 2 p lt 0001 n = 533 5 Chi Square = 180 df = 6 p lt 001 n = 535 6 Chi Square = 71 df = 2 p lt 005 n = 603 7 Chi Square = 230 df = 6 p lt 001 n = 600 8 Chi Square = 91 df = 3 p lt 005 n = 598 9 Chi Square = 129 df = 4 p lt 005 n = 610
10 Rho = 034 p lt 0001 n = 609 11 Chi square = 217 df = 3 p lt 0001 n = 609 12 Chi Square = 609 df = 8 p lt 0001 n = 607 13 Chi Square = 208 df = 3 p lt 0001 n = 560 14 Size of organisation and developing online
careers site Rho = 025 p lt 0001 n = 599 Size of
organisation and employee surveys Rho = 019
p lt 0001 n = 599 15 Chi Square = 167 df = 2 p lt 0001 n = 599
16 Working with charities Chi Square = 80 df = 2 p
lt 005 n = 599 corporate sponsorship Chi Square
= 116 df = 2 p lt 001 n = 599 17 Chi Square = 76 df = 2 p lt 005 n = 599 18 Table 11 also shows that this method is deemed
most effective by public sector organisations but
this effect is due to a greater proportion of
large public sector organisations in our
sample whereas private sector organisations are
more evenly distributed in size 19 Chi square = 109 df = 2 p lt 001 n = 610 20 Chi Square = 279 df = 4 p lt 0001 n = 610 21 Chi Square = 259 df = 6 p lt 0001 n = 598 22 Chi Square = 515 df = 6 p lt 0001 n = 597 22 Chi Square = 177 df = 8 p lt 005 n = 600 22 Chi Square = 339 df = 4 p lt 0001 n = 610 22 Chi Square = 820 df = 4 p lt 0001 n = 610 22 Chi Square = 522 df = 8 p lt 0001 n = 610 22 Rho = 024 p lt 0001 n = 195 22 Chi Square = 166 df = 2 p lt 0001 n = 544
cipd
cou
k2011resou
rcing
and
talentp
lann
ing
survey
40
2011
OTHER TITLES IN THIS SERIES
ABSENCE MANAGEMENT The annual Absence Management survey has been running for eleven years providing useful benchmarking data on absence levels the cost and causes of absence and how organisations are managing absence The latest report is brought to you in partnership with Simplyhealth
EMPLOYEE ATTITUDES TO PAY The annual Employee Attitudes to Pay survey investigates employee attitudes and expectations towards pay and bonuses Now in its third year this survey is carried out by YouGov and focuses on employees in the UK
REWARD MANAGEMENT The annual Reward Management survey has been running for ten years and provides practical insights into current trends practices and issues affecting reward management in the UK It examines strategic reward base and variable pay bonuses incentives pensions reward measurement and total reward issues This report was brought to you in partnership with Benefex
LEARNING AND TALENT DEvELOPMENT The annual Learning and Talent Development survey is now in its thirteenth year and provides valuable commentary on current and future issues and trends It explores employer support for learning talent management employee skills managing and evaluating coaching and training spend
Issu
ed J
une
2011
Ref
eren
ce 5
552
copy C
hart
ered
Inst
itute
of
Pers
onne
l and
Dev
elop
men
t 20
11
Chartered Institute of Personnel and Development
151 The Broadway London SW19 1JQ
Tel 020 8612 6200 Fax 020 8612 6201
Email cipdcipdcouk Website cipdcouk
Incorporated by Royal Charter Registered charity no1079797
cipd
cou
k2011resou
rcing
and
talentp
lann
ing
survey
6
RESOURCING AND TALENT PLANNING
Diversity bull Overall in little change from previous years
just over half of organisations have a diversity
strategy rising to 90 of public sector
organisations
bull Our figures indicate a reduction in the use of
several methods to address diversity issues this
year particularly in the public sector which has
traditionally led the way in diversity practice
Labour turnover bull The median labour turnover rate has decreased
over the past few years (2011 125 2010
135 2009 157 2008 173)
bull Smaller organisations are most likely to report
that their labour turnover has increased and
larger organisations that it has decreased
bull As in previous years the majority of turnover
is attributed to employees leaving voluntarily
The rate of voluntary leavers has increased
slightly in the private sector compared with last
year but decreased in the voluntary and public
services sector reflecting the growthcuts in the
respective sectors
bull The proportion of organisations making ten
or more redundancies over the past year has
reduced from 33 in 2009 to 12 in 2010
Employee retention bull Only two-fifths (42) of organisations
experienced no difficulties in retaining staff
during 2010 a similar figure to the previous
year Managers and professionalsspecialists and
technical employees remain the most difficult
categories of staff to retain
bull Most organisations have taken one or more
steps to address staff retention however nearly
one in four organisations (a similar proportion
to the previous year) report that no specific
retention initiatives were undertaken in 2010
bull The most frequently cited actions taken by
employers to address retention ndash improving
the people management skills of line managers
and increased learning and development
opportunities ndash are the methods most
commonly rated most effective Improving the
induction process is also commonly used to
address retention but views on its effectiveness
are more mixed
2011
1 RECRUITING EmPLOyEES
This section explores trends and developments in recruitment strategies and activity within UK organisations during 2010 It examines the adoption of formal resourcing strategies changes in the number of job vacancies organisations attempted to fill the extent and nature of recruitment difficulties over the past year and the strategies employers use to overcome these challenges It also includes developments in graduate recruitment the most effective approaches for attracting applicants and the methods used for selection For the first time we explore the nature of job vacancies the length of the recruitment process the employment of younger workers changing relationships with recruitment partners and efforts to improve the employer brand Finally the costs associated with recruitment are discussed
Resourcing strategies Just over half of respondents surveyed report their
organisation has a formal resourcing strategy
in place a similar proportion to last year (2011
Table 1 Organisations with formal resourcing strategies in place by size ()
Size ndash number of employees in UK 54 2010 56 2009 58) The likelihood of
organisations having a formal strategy in place
increases with organisational size as was the case
last year (Table 1)1 There are no significant sector
differences
Fewer than 10 26
10ndash49 38
50ndash249 46
250ndash999 55
1000ndash4999 68
More than 5000 85
RESO
UR
CIN
G A
ND
TALE
NT P
LAN
NIN
G 2
011
Base 604
7
8
RESOURCING AND TALENT PLANNING
The number and nature of job vacancies There is considerable variation in the number
of vacancies respondentsrsquo organisations tried
to fill in 2010 partly because the number of
vacancies is strongly related to organisation size
(Table 2)2 Overall the median number of vacancies
has fallen from 30 in 2008 to 20 over the past two
years as the recession affected increasing numbers
of organisations (Table 2)
While there is no overall change from last year
in the median number of vacancies organisations
tried to fill there has been a substantial fall in the
proportion of vacancies very large organisations
(5000+ UK employees) attempted to fill from
a median of 550 in 2009 to 200 in 2010 (800 in
2008) The reduction in vacancies in very large
organisations is striking in the private and public
sectors but particularly in the latter where
the median number of vacancies organisations
attempted to fill in 2010 was less than a third than
in 2009 This reflects the sluggish growth in the
private sector and in particular the significant
cuts in public sector budgets
Table 2 Median number of vacancies respondents tried to fill by size of organisation and sector
2011 survey 2010 survey 2009 survey
No of permanent staff employed in UK All Private
sector Public
services All Private sector
Public services All Private
sector Public
services
Median Median Median Median Median Median Median Median Median
1ndash49 3 3 1 3 3 2
50ndash249 12 12 10 12 10 14 10 10 8
250ndash999 45 50 30 46 45 50 60 52 70
1000ndash4999 110 150 55 100 100 100 300 300 300
More than 5000 200 500 150 550 850 500 800 800 550
All organisations 20 20 30 20 20 80 30 20 100 Base 577 (2011) 442 (2010) 683 (2009)
The categories for number of permanent staff employed in the UK differed slightly in the 2009 survey (250 or fewer 251ndash500
501ndash1000 1001ndash5000 5001ndash10000 10001+) 2009 categories have been combined where appropriate and otherwise matched with
the best corresponding category of 20112010
cipd
cou
k2011resou
rcing
and
talentp
lann
ing
survey
2011 Overall nearly three-quarters (73) of permanent
vacancies were filled with external candidates
Larger organisations with a wide range of
talent to choose from are more likely to recruit
internally than smaller organisations3 Public sector
organisations particularly those with more than
1000 UK employees are more likely to recruit
internally than the private sector (Table 3)4
Organisations are divided in their use of temporary
contracts More than a quarter (28) have
employed more people on temporary contracts
in 2010 compared with the previous year while
a similar proportion (27) have employed fewer
people on temporary contracts (45 remain
the same) Manufacturing and production
organisations are most likely to have increased
their use of temporary contracts and the public
services the least perhaps reflecting their reduced
recruitment generally (Figure 1)5
Table 3 Average percentage of job vacancies filled internally
Voluntary No of permanent staff community and not-employed in UK Private sector Public services for-profit All
Mean Mean Mean Mean
1ndash49 15 17 7 13
50ndash249 20 28 23 21
250ndash999 24 29 24 24
1000ndash4999 35 58 12 39
More than 5000 47 62 33 53
All organisations 25 45 19 27 Base 533
figure 1 Use of temporary contracts by sector in 2010 compared with the previous year ()
Manufacturing and production
Private sector services
Public services
Voluntary community and not-for-profit
More Same Less
Base 610
25
27
37
22
3837
50
32
50
23
31
28
RESO
UR
CIN
G A
ND
TALE
NT P
LAN
NIN
G 2
011
9
10
RESOURCING AND TALENT PLANNING
Sector-specific experience is an essential
requirement of candidates in three-fifths (60) of
organisations overall While our figures suggest
it is less commonly required in the public sector
(48 compared with 59 of the voluntary
community and not-for-profit sector and 63
of the private sector)6 there are also substantial
differences within sectors For example specific
sector experience is essential for the majority
of organisations operating in the chemical
construction or mining industries and professional
services but not for those in general manufacturing
or retail and wholesale Similarly within the public
sector it is deemed particularly essential for health
and education organisations but less so for those in
central or local government
Employing younger workers Figures from the Office for National Statistics
show that while total unemployment fell during
the three months to February 2011 youth
unemployment rose to a record level of almost 1
million equating to one in five economically active
16ndash24-year-olds out of work Moreover concerns
have been raised as to whether high youth
unemployment will be further compounded by the
abolition of the Default Retirement Age later this
year and the increase in university tuition fees This
year we included new questions in the survey to
explore these issues
One in six organisations (17) report they are
employing more 16ndash24-year-olds compared with
one year ago this compares with less than one
in eight (12) who are employing fewer young
people (72 are employing the same number) The
employment of younger workers has reduced most
in the public sector where one in four reports a
decrease compared with one in ten who reports an
increase (Table 4)7 This is likely to reflect a general
reduction in recruitment in this sector
Overall one-quarter of organisations expect the
abolition of the Default Retirement Age will mean
they recruit fewer people however the figure
rises to nearly half of public sector organisations
It does not appear however that the abolition of
the Default Retirement Age will have a particular
impact on the recruitment of young people with
only one in ten organisations reporting it will result
in fewer 16ndash24-year-olds being recruited (Table 4)
cipd
cou
k2011resou
rcing
and
talentp
lann
ing
survey
Table 4 The employment of younger workers ()
Voluntary Manufacturing community
All and Private sector and respondents production services Public services not-for-profit
Percentage employing fewer 16ndash24-year-olds than one year ago
Percentage agreeing the abolition of the Default Retirement Age means they will recruit fewer 16ndash24-year-olds
Percentage agreeing the abolition of the Default Retirement Age means they will recruit fewer people
12 10 9 25 10
11 18 6 17 9
23 25 15 48 22
Base 605
2011 Graduate recruitment Two-fifths of organisations (39) are concerned
that the increase in university tuition fees will
have an impact on the number of graduates in
the marketplace Public sector organisations are
particularly concerned (49 compared with 34
of private sector services 42 of not-for-profits
and 43 of manufacturing and production
organisations)8
Perhaps in order to address this deficit or in
response to additional government support to
boost apprenticeship schemes a third of public
sector organisations nearly half of manufacturing
and production and about a quarter of private
sector services and not-for-profit organisations
are considering increasing apprenticeship schemes
(Table 5) About a quarter of organisations overall
are considering increasing their use of internships
although the proportion is markedly lower in the
public sector Overall one in ten organisations are
considering sponsoring students through university
but the proportion doubles in manufacturing and
production where the lack of appropriate skills is
a common cause of recruitment difficulties (Table
5 see also Tables 8 and 9) Larger organisations are
also more likely to consider sponsoring students
through university (19 of those with more than
5000 employees)9
Overall just over a quarter of organisations
operate a structured graduate recruitment
programme (Table 6) The operation of
these programmes is significantly related to
organisation size (Figure 2)10 They also appear
to be most common in the manufacturing
and production sector as last year when a
step increase in their use was noted (Table 6)
It appears that this sector is investing in the
development of skills to address their deficit
in the workforce generally As in previous
years voluntary community and not-for-profit
organisations are least likely to operate a
structured graduate recruitment programme11
Table 5 Activities organisations are considering ()
Voluntary Manufacturing community
All and Private sector and respondents production services Public services not-for-profit
Increasing apprenticeship schemes 30 48 24 33 27
Increasing your use of internships 22 27 23 12 27
Sponsoring students through university 10 20 8 12 1
Base 615
Table 6 Organisations operating a structured graduate recruitment programme by sector ()
2011 2010 2009 2008
All 27 34 22 23
Sector
Manufacturing and production 35 35 23 24
Private sector services 29 37 24 27
Voluntary community and not-for-profit 6 18 5 7
Public services 26 33 23 24
RESO
UR
CIN
G A
ND
TALE
NT P
LAN
NIN
G 2
011
Base 614 (2011) 472 (2010) 752 (2009)
11
cipd
cou
k2011resou
rcing
and
talentp
lann
ing
survey
12
RESOURCING AND TALENT PLANNING
The majority of respondents from organisations
without a recruitment programme for graduates
report that their organisation has never had such
a programme or not had one for some time (97)
Even in the cash-strapped public sector only 3
report they have closed their graduate recruitment
programme in the last 12 months
Nearly a third (31) of organisations who have a
graduate recruitment programme have increased
their intake over the past year while a quarter
have reduced their intake (24) This shows an
improvement on the previous year at the height of
the recession when 43 had reduced their intake
The impact of the budget cuts in the public sector
are however clearly apparent as more than twice
as many organisations in this sector (50 compared
with 20 in the private and not-for-profit sectors)
have reduced their graduate intake
Length of recruitment process One in three (31) organisations report that the
length of their recruitment process has led to the
loss of potential recruits This issue appears to be
exacerbated by organisation size Nearly half of
organisations with more than 5000 employees
report that the length of their recruitment process
has led to the loss of potential recruits compared
with 38 of those in organisations of 250ndash999
employees and just 15 of organisations with
fewer than 50 employees12 There are no significant
sector differences
Recruitment difficulties Three-quarters of organisations with vacancies
report difficulties in filling at least some over the
past few months (75) This is an increase on last
year (2010 68) and may reflect the decrease in
unemployment in the first few months of 2011
It is less however than in previous years perhaps
because organisations were attempting to fill fewer
vacancies (2009 81 2008 86)
figure 2 Organisations operating a structured graduate recruitment programme by size ()
Number of UK employees
39
42
9Fewer than 50
17
1650ndash249
21
29 250ndash999
1000ndash4999 47
61 More than 5000
62
10 40 50 60 70 80
2011
0 3020 Percentage
2010
Base 609 (2011) 466 (2010)
2011 The private sector particularly manufacturing and
production organisations are most likely to have
difficulties filling vacancies (Table 7)13 Table 8
shows that over half of organisations in this sector
have difficulty filling technical vacancies and this
may reflect specific skills shortages in the UK The
most difficult category of staff to recruit in other
sectors is managers and professionalsspecialists
as was the case last year In general there is little
change in the categories of vacancies that are most
difficult to recruit for compared with last year
As would be expected given the cuts to
public sector budgets one in ten public sector
organisations report they did not have any
vacancies to fill twice as many as last year There is
little change in this regard in the other sectors
Table 9 shows the reasons respondents cite for their
recruitment difficulties The findings are similar
to previous years Lack of necessary specialist or
technical skills remains by far the most frequently
cited cause of difficulties reported by nearly
three-quarters of respondents (2011 72 2010
67 2009 73 2008 70) This is particularly
an issue for the manufacturing and production
sector and the public services sector where there
is a particularly high demand for such skills Lack
of formal qualifications is far less of an issue
These findings support arguments for greater
collaboration between industry and academic
institutions and more vocational training in order
to meet organisationsrsquo skill requirements
Higher pay expectations than the organisation
could offer and lack of experience are the next
most frequently cited causes of recruitment
problems (46 and 40 respectively) Interestingly
these are less of an issue in the public sector
perhaps because public sector applicants have
different expectations of pay or because some pay
scales are set at a national level Lack of experience
may be less of an issue than the necessary skills or
qualifications required in many public sector roles
The proportion reporting their recruitment
problems are due to potential candidatesrsquo
reluctance to move in the current economic climate
has decreased from just over a quarter in 2010 to
19 this year Economic growth albeit slow is
likely to be responsible for this reduction but the
lsquohangoverrsquo of the recession is highlighted as one in
five organisations still blame the economic climate
for their recruitment problems Despite high
unemployment 15 of respondents report they
have experienced problems due to no applicants In
line with last yearrsquos findings this is particularly an
issue for the public sector (22) which is also more
likely to report the image of their sectoroccupation
is a problem (22)
Table 7 Organisations experiencing difficulties recruiting for one or more category of vacancy by organisation size ( of those that have had vacancies to fill)
Voluntary Manufacturing community
and Private sector and All 2011 production services Public services not-for-profit
Difficulty filling one or 75 88 77 66 62more vacancies
No difficulties experienced 25 12 23 34 38
Base 561
RESO
UR
CIN
G A
ND
TALE
NT P
LAN
NIN
G 2
011
13
14
RESOURCING AND TALENT PLANNING
Table 8 Categories of vacancy that proved particularly difficult to fill ( of respondents)
Voluntary community
Manufacturing Private and and sector Public not-for-
All 2011 production services services profit All 2010
Other managers and professionalsspecialists
34 41 33 27 34 37
Technical 30 53 29 20 16 28
Senior managers directors
14 13 16 10 16 16
Services (customer personal protective 7 6 8 3 5 5 and sales)
Administrative secretarial
4 3 4 4 4 3
Manualcraft workers 4 11 3 1 0 2
Other 6 5 3 10 11 4
No difficulties experienced
23 12 22 30 38 25
No vacancies to fill 6 3 7 10 1 6 Base 597 (2011) 468 (2010)
Voluntary community
Manufacturing Private and All and sector Public not-for- All
2011 production services services profit 2010
Table 9 Reasons for recruitment difficulties ()
cipd
cou
k2011resou
rcing
and
talentp
lann
ing
survey
Lack of necessary specialist or technical skills 72 82 69 80 59 67
Look for more pay than you could offer 46 47 48 34 52 39
Lack of experience 40 42 43 27 41 36
Reluctance to move in current economic climate 19 24 18 17 15 26
Lack of interpersonal skills 16 9 19 10 20 12
No applicants 15 9 16 22 20 15
Image of sector occupationorganisation 13 7 12 22 11 12
Relocation difficulties 9 19 6 10 7 8
Lack of formal qualifications 7 7 7 5 7 4
The impact of the immigration cap 3 2 4 3 4
Other 4 3 3 8 7 7
Base 427 (2011) 330 (2010)
new item introduced in 2011
2011 Improving the employer brand Nearly three-quarters of organisations have made
efforts to improve their employer brand over the
past year (Table 10) The larger the organisation
the more likely it is to have undertaken one or
more activities to improve its brand Two-fifths of
small organisations with fewer than 50 employees
report they have taken no action to improve their
employer brand compared with one-quarter of
organisations with 250ndash999 employees and one-
sixth of those with more than 5000 employees
There are no significant sector differences
The most popular approaches to improving
employer brand are employee surveys and
developing online careers sites with larger
organisations most likely to have adopted these
methods14 The public sector is most likely to
have introduced or extended flexible working
homeworking15 whereas the private sector is
more likely to have made efforts to improve its
brand through working with charities or corporate
sponsorship16 Voluntary community and not-forshy
profit organisations are most likely to have used
placement students to improve their brand17
Attracting candidates The effectiveness of methods to attract applicants
varies according to sector and organisation size
(Table 11) Overall the most effective method is
through organisationsrsquo own corporate websites
as was the case last year The effectiveness of this
method increases with organisation size probably
due to the increased brand awareness and
perhaps because larger organisations have more
advanced websites18
The private sector particularly manufacturing
and production organisations is three times
more likely than public sector organisations to
report recruitment agencies among their most
effective methods and twice as likely as voluntary
sector organisations (regardless of size) Search
consultants and employee referral schemes are also
notably more popular in the private sector than in
the public or voluntary sectors
In contrast the public and voluntary sectors are
more likely to find the press effective for attracting
applicants including local and national newspaper
advertisements and specialist journalstrade press
Secondments are also deemed to be more effective
in these sectors than in the private sector
Table 10 Work undertaken over last year to improve employer brand ()
Voluntary community
All Private Public and 2011 sector services not-for-profit
Employee surveys 39 39 38 43
Developing online careers site 30 33 23 29
Introducingextending flexible working homeworking 24 20 39 29
Placement students 23 21 19 35
Graduate careers fairs 15 17 11 8
Working with charities 14 16 8 6
Corporate sponsorship 11 13 2 8
Introducing sabbaticals 3 4 1 5
Other 7 6 6 10
No action taken to improve employer brand 27 28 29 22
RESO
UR
CIN
G A
ND
TALE
NT P
LAN
NIN
G 2
011
Base 601
15
16
RESOURCING AND TALENT PLANNING
Table 11 Most effective methods for attracting applications by industry sector ()
Sector 2011 Number of UK employees 2011
All
2010
All
2011
Man
ufa
ctu
rin
gan
d p
rod
uct
ion
Priv
ate
sect
or
serv
ices
Pub
lic s
ervi
ces
Vo
lun
tary
co
mm
un
ity
and
no
t-fo
r-p
rofi
t
1ndash49
50ndash2
49
250ndash
999
100
0ndash4
999
Mo
re t
han
500
0
Own corporate website 63 59 44 57 77 66 42 55 57 77 79
Recruitment agencies 60 54 77 62 22 30 39 59 66 51 41
Local newspaper advertisements 36 32 38 23 41 51 28 35 35 29 29
Employee referral scheme 35 29 33 38 5 14 20 33 27 32 29
Commercial job boards 33 27 33 29 14 29 21 27 25 42 26
Specialist journalstrade press 31 27 24 23 30 43 26 23 32 32 24
Encourage speculative applicationsword of mouth 24 25 30 29 9 23 27 31 23 19 19
Jobcentre Plus 23 25 24 24 22 34 16 29 21 25 32
Professional networking (such as LinkedIn) 14 16 11 23 5 9 28 13 13 18 17
Search consultants 22 15 24 17 5 4 14 11 17 18 15
Links with schoolscollegesuniversities 18 13 16 13 9 17 12 13 11 18 15
Apprenticeships 12 11 19 9 13 9 10 10 11 12 17
National newspaper advertisements 16 11 4 6 23 29 10 9 15 10 15
Secondments 11 11 7 8 21 12 2 9 13 11 19
Links with other local organisations making redundancies 7 13 5 7 9 6 5 9 11 8
Alumni (previous employees) 5 5 6 7 2 1 7 2 6 11 3
Social networking sites (such as Facebook) 3 4 4 5 3 4 3 2 2 8 12
Local Employment Partnership (LEP) 6 3 1 4 2 5 1 2 3 4 9
Other 5 5 2 3 12 6 8 3 4 4 5
cipd
cou
k2011resou
rcing
and
talentp
lann
ing
survey
Base 604 (2011) 464 (2010)
new item introduced in 2011
Despite the popularity of social networking
sites such as Facebook they are not seen to be
particularly effective for attracting candidates
Professional networking sites such as LinkedIn are
more popular particularly in the private services
sector although there has only been a small
percentage increase in their reported effectiveness
compared with last year
2011 Recruitment partners A new question this year asked respondents if their
attitude to and relationships with recruitment
partners has changed over the past 12 months Just
over a third report things have not changed
(Table 12) A similar proportion report they have
reduced their use of recruitment partners and 6
that they have stopped using them altogether
with one in ten considering them an unaffordable
expense (one in five in the not-for-profit sector)
and a similar proportion an unnecessary expense
In contrast one in five (predominantly private
sector organisations) report they have formed
a closer business partnership with recruitment
partners over the past year and one in ten (again
predominantly private sector organisations) report
they consider them integral to attracting top talent
Selecting candidates There has been little change in the methods used
to select candidates over the past few years with
the exception of a drop in the use of general
ability tests compared with 2009 (Table 13)
Interviews remain the most common selection
method with competency-based interviews
being most popular overall Interviews following
the contents of CVsapplication forms are also
particularly popular in the private sector (70
compared with 41 in the public sector and 57
in the not-for-profit sector) whereas the public
and not-for-profit sectors favour structured (panel)
interviews (82 and 79 respectively compared
with 45 in the private sector)
Tests for specific job-related skills are more popular
in the public and not-for-profit sectors (61 and
62 respectively compared with 43 in the private
sector) whereas telephone interviews are more
popular in the private sector (52 compared with
12 in the public sector and 26 in the not-forshy
profit sector)
Table 12 Changes in attitudes to and relationships with recruitment partners over the past 12 months ()
Voluntary community
All Private Public and 2011 sector services not-for-profit
Not changed 36 34 40 39
Reduced use of recruitment partners 32 34 32 26
Formed a closer business partnership with them 19 23 8 12
Consider them an unnecessary expense 12 11 13 16
Consider them an unaffordable expense 11 10 11 22
Consider them integral to attracting top talent 9 11 2 4
Stopped using recruitment partners 6 5 8 5
Other 3 3 3 3 Base 604
RESO
UR
CIN
G A
ND
TALE
NT P
LAN
NIN
G 2
011
17
18
RESOURCING AND TALENT PLANNING
Table 13 Methods used to select applicants ()
2011 2010 2009 survey survey survey
Competency-based interviews 70 78 69
Interviews following contents of CVapplication form 63 64 68
Structured interviews (panel) 56 61 59
Tests for specific job-related skills 49 48 50
Telephone interviews 43 47 38
Literacy andor numeracy tests 38 43 39
Personalityaptitudepsychometric questionnaires 35 44 35
Assessment centres 35 42 35
Pre-application eliminationprogression question(s) 25 32 NA
General ability tests 23 27 44
Group exercises (for example role-playing) 21 30 26
Pre-interview references (academic or employment) 9 16 19
Video CVs 0 1 NA
Other 3 4 6
cipd
cou
k2011resou
rcing
and
talentp
lann
ing
survey
Base 605 (2011) 473 (2010) 754 (2009)
Strengths-based recruitment Two-fifths of organisations (40) report they use a
strengths-based approach to recruitment although
it is less commonly used in the public sector (26)19
In all sectors smaller organisations are most likely
to report they use a strengths-based approach
(60 of organisations with 1ndash49 employees use it
compared with 34 of organisations with 250ndash999
employees and 24 of organisations with more
than 5000 employees)20
Most of those who use a strengths-based approach
to recruitment are neutral about how easy it is to
administer in practice regardless of sector or size
Nearly a third (32) find it easy or very easy and
only one in ten (11) find it difficult
Over three-quarters of those who use a strengths-
based approach to recruitment believe it
brings benefits in terms of increased individual
performance (78) Two-thirds believe it improves
retention (67) and increases engagement (63)
Two-fifths (39) report it results in greater diversity
of skills in the workplace
Many organisations that use a strengths-based
approach to recruitment also use a strengths-based
approach for other people processes More than
half use it for performance management processes
(59) succession planning (55) and learning and
development (53) Two-fifths use it for talent
management (42) and a third use it for workforce
planning (32) Just under three in ten (29) also
use it for redeployment
Recruitment costs Last year we noted an increase in the proportion
of organisations that calculate their recruitment
costs (2010 65 2009 53 2008 51) This year
the proportion is back in line with previous years
(52) The increase last year may have been due
to sampling differences or a consequence of an
increased focus on costs during the recession that
has not continued
Four-fifths (79) of organisations that calculate
recruitment costs provided cost estimates per
hire There is considerable variance in the amount
organisations spend (at least partly due to our
2011 findings that organisations include different costs
in their calculations see Table 14) In general
the median figures (Table 15) are lower than last
year for both senior managerdirectors and other
employees
In order to explore the validity of estimates this
year we also asked respondents to indicate how
accurate their cost estimates were Half (51) of
estimates for costs of recruiting senior managers
directors were accurate to plus or minus 10 and
83 to plus or minus 20 Two-fifths of estimates
for other employees were accurate to plus or minus
10 and 74 to plus or minus 20 Table 16
shows the median figures for estimates that were
believed to be accurate to up to plus or minus 20
The figures indicate as we found last year that
organisations spend considerably more on senior
appointments than on other employees This
reflects the value attached to good leadership and
perhaps the additional challenges of attracting
the best candidates for senior positions This is
particularly the case in the private sector where
considerably more is spent on the recruitment of
senior managersdirectors than in the public or not-
for-profit sectors
Table 14 Criteria included in cost per hire calculations ()
Size ndash number of employees in UK
Advertising costs
Agencysearch costs
Employee referrals
Travel expenses
Relocation expenses
Fixed costs of resourcing team
Opportunity costs of hiring managers time
Other
Dont know Base 299
81
75
35
30
17
24
24
3
4
Table 15 Estimated total costs (advertising costs agency or search fees) per hire (pound)
Median 2011 Median 2010 (no of (no of
Occupational group respondents) Minimum Maximum respondents)
Senior managersdirectors 7000 (219) 251 55000 8333 (234)
Other employees 2000 (246) 150 32000 2930 (262) Number of respondents shown in brackets
Table 16 Median total costs (advertising costs agency or search fees) per hire for estimates accurate to plus or minus 20 (pound)
Voluntary
Median 2011 Manufacturing
and Private Public
community and not-for-
Occupational group production sector services profit
RESO
UR
CIN
G A
ND
TALE
NT P
LAN
NIN
G 2
011
Senior managersdirectors 7500 8000 9000 5000 3500
Other employees 2500 3400 2000 3000 1500 Base 150
19
cipd
cou
k2011resou
rcing
and
talentp
lann
ing
survey
20
RESOURCING AND TALENT PLANNING
2 RESOURCING AND TALENT mANAGEmENT IN TURBULENT TImES
In January 2010 the UK officially emerged from the recession however the economic environment remains uncertain for many organisations The environmental disasters in Japan the uprisings and wars in the Middle East rising oil prices and European debt highlight the volatility of global markets In the UK economic growth remains sluggish and there are concerns regarding the impact of the VAT increases high inflation and the austerity measures of the Coalition Government This section examines the impact of the economic environment on resourcing budgets strategies and activities in 2010 It looks at changes in views on the employment market and the implications for managing talent
The impact of the economic climate on resourcing Overall half of organisations report that the
economic climate has had a negative impact on
their organisationsrsquo resourcing budgets for 2011ndash12
(Table 17) This year however it is the public
sector that is most severely hit with four-fifths
(82) reporting their resourcing budgets will be
reduced (up from 59 last year) In contrast fewer
private and not-for-profit sector organisations
face reductions this year compared with last
although more are still reducing their budgets than
increasing them
Changes in resourcing and talent practices in
2011 compared with 2010 reflect a stronger
focus on costs and reductions in budgets (Figure
3) Two-thirds plan to develop more talent inshy
house (compared with one-third in 2010) and
more organisations plan to reduce reliance on
recruitment agencies and external consultants for
resourcing and development The proportion of
organisations planning to focus more on retaining
rather than recruiting talent has increased to 51
in 2011 from 28 in 2010
2011 Changes in recruitment practices are also
anticipated More organisations plan to make use
of new mediatechnology to recruit which may
be a cost-cutting strategy but can also improve
the efficiency and effectiveness of the recruitment
process On a positive note more organisations plan
to invest more time and effort in the quality of
candidates they hire and will be taking actions to
improve ways of identifying quality candidates
Public sector organisations are more than twice
as likely to be implementing a recruitment freeze
in 2011 (46 compared with 22 overall)
Nevertheless this is an improvement on 2010 when
58 of public sector organisations implemented a
recruitment freeze The situation is also somewhat
brighter for many private sector organisations
with 15 reporting they will be implementing a
recruitment freeze in 2011 compared with 26
in 2010 Nevertheless the economic recovery
remains slow for many with 29 of private
sector organisations and 66 of public sector
organisations reporting they will be reducing the
number of new recruits they hire in 2011 similar
proportions to 2010 Inevitably more public than
private sector organisations report they will be
reducing their headcount in 2011 and losing key
talent (33 compared with 9 in the private
sector) and redeploying people into new roles (66
compared with 37 in the private sector)
Table 17 Impact of the current economic climate on organisationsrsquo resourcing budgets ()
Private Public Voluntary community All sector services and not-for-profit
2011 2010 2011 2010 2011 2010 2011 2010
Reduced 49 53 41 51 82 59 51 61
Stayed about the same 36 37 39 40 14 36 40 34
Increased 8 7 11 4 1 5 4 5
Dont know 7 3 8 5 3 5 Base 615 (2011) 475 (2010)
RESO
UR
CIN
G A
ND
TALE
NT P
LAN
NIN
G 2
011
21
cipd
cou
k2011resou
rcing
and
talentp
lann
ing
survey
22
RESOURCING AND TALENT PLANNING
figure 3 Resourcing and talent practices implemented in 2011 and 2010 ( of respondents)
Developing more talent in-house
Continuing to recruit key talentniche areas
Focusing more on retaining rather than recruiting talent
Reducing reliance on recruitment agencies
Use of new mediatechnology to recruit
Investing more time and effort in the quality of candidates we hire
Redeploying people into new roles
Reducing the number of new recruits we hire
Taking actions to improve ways of identifying quality candidates
Increasing the number of interimcontract staff recruited
Reducing our use of external consultants for resourcing and development
Increased recruitment of apprenticesinterns
Implementing a recruitment freeze
Reducing our headcount but preserving key talent
Recruiting talent discarded by competitors
Reducing our headcount and losing key talent
Offering sabbaticals career breaks additional holidays
Reducing employees working hours to avoid making people redundant
8Reducing graduate recruitment 8
6Suspending graduate recruitment 7
36
28
36
28
26
30
35 35
35 15
29 23
28 19
24 12
22 30
22 16
18 11
13 12 12
10
12 10
66
59 46
51
47
46
45
44
0 10 20 30 40 50 60 70 80 Percentage of respondents
2011 2010
Base 582
RESO
UR
CIN
G A
ND
TALE
NT P
LAN
NIN
G 2
011
23
2011 Views on the employment market In little change to last year three-quarters of
organisations report they have noticed an increase
in the number of unsuitable applicants as they have
fewer roles to fill (Figure 4) Far fewer (34) report
that there are too many suitable candidates to
choose from and despite high unemployment over
the past two years more than half (52) believe that
competition for talent is even greater as the pool of
available talent to hire has fallen sharply (2010 41
2009 20) For many organisations there appears a
clear mismatch between the skills they require and
those available in the labour market
Competition for talent appears to be particularly
keen in the private sector Two-thirds (64) of
manufacturing and production organisations
and 55 of private services organisations agree
that competition for talent is even greater now
compared with 39 of the public sector and 34
of not-for-profits21 In contrast the public sector
and not-for-profits are more likely to agree they
have too many suitable candidates to choose
from (61 and 47 respectively compared with
23 of manufacturing and production and 27
of private sector services)22
Three-fifths (62) of respondents agree that the
demand for temporary and contract workers will
increase as employers will be reluctant to take
on permanent staff during uncertain times while
44 agree that part-time workers will become
more appealing to employers who are looking to
cut costs
figure 4 Views on the employment market ( agreeing or strongly agreeing)
With fewer roles to fill we have noticed an increase in the number
of unsuitable applicants
The demand for temporary and contract workers will increase as employers will be reluctant to
take on permanent staff during uncertain times
Employers will use the economic downturn as an opportunity to get rid of poor performers
and bring about culture change
Competition for talent is even greater now as the pool of available talent to hire has
fallen sharply
Part-time workers will become more appealing to employers who are looking to cut costs
Employers are acting too hastily in making people redundant and as a result they will lose too
many employees with valuable knowledge and skills
With fewer roles to fill there are now too many suitable candidates to choose between
The abolition of the Default Retirement Age will mean we recruit fewer people
Employers will look to make older workers over the age of 65 redundant before their younger workers
73 76
54
62 66 66
55 63
72
52 41
20
44 45
52
44 48
53
34 32
23
19 22
27
0 10 20 30 40 50 60 70 80 Percentage of respondents
2011 2010 2009
Base 607 (2011) 475 (2010) 746 (2009)
item added 20102011
24
RESOURCING AND TALENT PLANNING
More than half of respondents (55) across
all sectors believe that employers will use the
economic downturn as an opportunity to get rid of
poor performers and bring about culture change
While high this shows a downward trend on the
past two years (2010 63 2009 72 agree or
strongly agree) perhaps reflecting a slowing in
the number of redundancies Similarly there is
a gradual downward trend in the proportion of
respondents who express concern that employers
are acting too hastily in making people redundant
and as a result they will lose too many employees
with valuable knowledge and skills or that
employers will look to make older workers over the
age of 65 redundant before their younger workers
Nearly a quarter (23) of respondents believe
that the abolition of the Default Retirement Age
will mean they recruit fewer people (48 in the
public sector)23
Implications for talent management The value of effective talent management has
not been lost in the recent attention on reducing
costs Two-fifths (41) of organisations report
that the current economic situation has led
to an increased focus on talent management
(43 in 2010) and only 4 that it has led to a
decreased focus (7 in 2010) with no significant
differences across sectors Unsurprisingly however
the public sector are about twice as likely this
year to report they have reduced their overall
talent management spend due to the downturn
compared with other sectors (Table 18)24
The proportion of organisations that report
the economic downturn has had an impact on
approaches to reward across the business has
slightly reduced compared with last year (54
compared with 61 in 2010) As last year it
appears that organisations across all sectors
are being more selective in who they reward A
smaller proportion of organisations report their
approach to reward for individuals identified as
talent has been affected by the downturn (42)
than report their approach to reward across the
business has been affected (54)
Table 18 Has your overall talent management spend been reduced due to the economic downturn ()
cipd
cou
k2011resou
rcing
and
talentp
lann
ing
survey
Voluntary All community and All
2011 Private sector Public sector not-for-profit 2010
Yes 18 17 32 13 23
No 38 43 16 32 41
NA (no talent management spend) 44 40 52 55 36
Base 617 (2011) 471 (2010)
RESO
UR
CIN
G A
ND
TALE
NT P
LAN
NIN
G 2
011
25
2011
Case study Innovative recruitment and cost saving in the Association of Greater Manchester Authorities
The Association of Greater Manchester Authorities (AGMA) represents the ten local authorities in
Greater Manchester and works in partnership with a wider group of associate councils and public
sector organisations AGMA chief executives and council leaders work together on a range of key
strategic and policy issues which impact on Greater Manchester including resourcing strategies
and recruitment and retention issues
The AGMA initiative in cost reduction in the area of resourcing has been described as lsquoa truly
pioneering example of collaboration between a number of local authoritiesrsquo and is already
delivering against a range of objectives
The initial aim was to make a significant saving on the pound5ndash6 million annual cost of external
media advertising reported in 2008ndash09 and to create a more efficient and effective recruitment
system A shared portal was commissioned to offer a front-end website (wwwyourcounciljobs
couk) with a lsquoback-officersquo e-recruitment system which would give a standardised shared-service
approach for job applicants across councils Some of the benefits for applicants include the ability
to go to one place to register their interest to be able to look in specific categories for jobs
of particular relevance to them to be able to amend an existing application form in order to
apply for a further post and to receive email alerts when new jobs relevant to their interests are
posted In addition communications to job-seekers are now standardised for every council
This approach has seen real benefits across each of the local authorities workflows are now
standardised as every HR team runs identical systems and there is consistency in reporting within
all councils enabling them to benchmark their processes more clearly The councils use this
benchmarking data to make additional improvements and efficiencies
Jayne Whitehead AGMA Category Procurement Manager has project-managed the initiative
with managers represented from each participating authority and describes the process as one
of lsquotrue collaborationrsquo with lsquo100 commitmentrsquo from all the councils involved The benefits
are clear annual media costs are dramatically reduced to approximately pound250000 across ten
partner organisations and there has been a reduction in time-to-hire of 13 days This has had
the knock-on effect of reducing expenditure on agency staff The average cost of a recruitment
advertisement per role was previously pound97400 it is now pound15200 There have also been benefits
outside the original intention including doubling the number of online applications for council
posts with administrative cost savings in HR of approximately pound250000 across the consortium
More than 61000 registered users are now on the system and the councils are successfully filling
their own talent pools of prospective job-seekers Overall the project team is now celebrating a
pound17 million reduction in recruitment expenditure over the past 12 months
(continued)
cipd
cou
k2011resou
rcing
and
talentp
lann
ing
survey
26
RESOURCING AND TALENT PLANNING
There were some challenges in the implementation of this new way of working All the councils
had to be convinced about the benefits of the changes With the implementation of a new IT
system having its own set of challenges the project has taken 12 months to introduce longer
than first anticipated Implementing the changes during a period of radical restructuring in all
councils also proved particularly challenging However Jayne describes how both the need to
make efficiencies and feedback from job-seekers meant that lsquowe had to find a different way of
doing thingsrsquo Jayne also recognises how the neutrality of her own role (each council pays a tenth
of her salary) has been essential in ensuring that the project has been fair to all its participants
offering a centralised shared resource to manage the project
The project is now set to develop yet further with the aim of becoming entirely self-funding
within the next year by accepting advertising from other organisations Two new websites are
planned for recruitment into schools and social care jobs bringing even less reliance on media
and agencies AGMA will also be further building its own talent pool
Jayne describes the initiative as lsquoa true example of what you can do if you collaborate across
authoritiesrsquo Not only the separate councils but also diverse teams and functions including HR IT
procurement communications and marketing have worked together to deliver this innovative
and inspiring project
Information provided by Jayne Whitehead AGMA Category Procurement Manager
2011
3 DIVERSITy
This section examines organisationsrsquo approaches to diversity including the use of formal diversity strategies and the methods used to address diversity issues
Just over half of organisations report they have with just under two-thirds of not-for-profit
a formal diversity strategy showing little change organisations and just two-fifths of private sector
over the past four years (2011 52 2010 55 companies (Table 19)25 Diversity strategies are also
2009 60 2008 55) Consistent with previous more common in larger organisations (regardless
yearsrsquo findings most public sector organisations of sector)26
(90) have a formal diversity strategy compared
Table 19 Does your organisation have a formal diversity strategy ()
Yes No Dont know
All 52 41 7
Sector
Private sector 41 50 8
Public services 90 9 1
Voluntary community and not-for-profit 63 33 4
Number of UK employees
Fewer than 50 45 50 5
50ndash249 43 51 6
250ndash999 48 44 7
1000ndash4999 65 31 4
More than 5000 80 9 11 Base 613
RESO
UR
CIN
G A
ND
TALE
NT P
LAN
NIN
G 2
011
27
28
RESOURCING AND TALENT PLANNING
As was the case last year over three-quarters
of organisations with a formal diversity policy
attempt to address diversity issues through
monitoring recruitment andor staffing
information to obtain data on gender ethnicity
disability age and so on (Table 20) Less than
three-fifths train interviewers to understand what
diversity is about and the impact of stereotypes
Other diversity-focused initiatives are even
less common moreover the figures indicate a
reduction in the use of several methods compared
with previous years The pressures of the recession
may have led to a reduced focus on diversity
Given the links between diversity in the workforce
and productivity organisations that fail to give
this issue the attention it requires may find
themselves at a disadvantage in the future
Traditionally the public sector has tended to lead
the way in terms of diversity practices Again this
year they are significantly more likely to address
diversity issues through monitoring recruitment
andor staffing information through providing
recruitment documents in other formats through
advertising vacancies in different sources to
attract under-represented groups and through
setting recruitment targets to correct a workforce
imbalance Nevertheless they are less likely than
other sectors to actively try to attract talent of all
ages (Table 20) Moreover our figures indicate that
the reduction in the use of several diversity methods
compared with previous years is particularly
pronounced in the public sector The change of
government and budget reduction measures have
led to significant change programmes in many
public sector organisations which may have resulted
in a reduced focus on diversity issues
Table 20 Methods used to address diversity issues in organisations ( with formal diversity strategy)
Voluntary community
Private Public and not-sector services for-profit
2011 2010 2009 2008 2011 2011 2011 survey survey survey survey (2010) (2010) (2010)
Monitoring recruitment andor staffing information to obtain data on gender 78 79 84 83 70 (71) 88 (96) 88 (76) ethnicity disability age any other categories
cipd
cou
k2011resou
rcing
and
talentp
lann
ing
survey
Training interviewers to understand what diversity is about and the impact of stereotypes
57 68 68 60 53 (66) 64 (73) 57 (72)
Actively trying to attract talent of all ages 45 53 32 43
Operating policies that go beyond basic legislative requirements on age gender race disability sexual orientation religion and belief
39 49 52 48 34 (44) 47 (63) 47 (40)
Providing recruitment documents in other 39 41 37 31 24 (22) 64 (77) 47 (52)formats (online large-print audio and so on)
Checking that any tests used are valid reliable and culture-free and were tested on diverse norm groups
36 42 47 34 39 (44) 35 (45) 27 (16)
Advertising vacancies in different sources to 31 37 51 48 22 (30) 44 (53) 41 (32)attract under-represented groups
Using specific imageswords in your recruitment advertising to appeal to a wider audience 29 38 42 42 25 (30) 36 (52) 33 (40)
Making attempts to employ the long-term 19 19 13 29unemployed
Setting recruitment targets to correct a workforce imbalance 9 15 14 12 4 (8) 18 (31) 8 (16)
Base 312 (2011) 253 (2010) 419 (2009) new item added in 2011
RESO
UR
CIN
G A
ND
TALE
NT P
LAN
NIN
G 2
011
29
2011
4 mANAGING LABOUR TURNOVER
Figures from the Office for National Statistics show that UK unemployment rose by 27000 in the three months to the end of January 2011 to 253 million the highest since 1994 When unemployment is high the number of employees leaving organisations voluntarily is expected to decrease Here we examine whether this is happening and how organisations are tackling the issue of employee retention
Among organisations that are able to supply
turnover data the median labour turnover rate
has decreased over the past few years (Table 21)
The median figure however hides differences
across organisations Slightly more organisations
report their turnover has increased in 2010
compared with 2009 (38) than has decreased
(33) while for nearly a third (29) it remained
the same Smaller organisations are more likely
to report their labour turnover has increased and
larger organisations that it has decreased27
As in previous years the majority of turnover (53)
is still attributed to employees leaving voluntarily
(Table 22) As the economy has improved the
median proportion of turnover due to redundancies
has reduced Only 12 of organisations that
provided reasons for leaving made more than ten
redundancies in the previous year compared with
33 in 2010 26 in 2009 and 22 in 2008 A third
(34) of organisations that made redundancies
offered career transition services
While median turnover rates have reduced
across all sectors Table 23 shows that the rate
of voluntary leavers has increased slightly in
the private sector compared with last year but
decreased in the voluntary and public services
sector This reflects improvements in the economic
outlook for the private sector and the widespread
cuts in the public sector which also have a direct
impact on many not-for-profit organisations that
provide services for the public sector
Cost of labour turnover While just over half of organisations calculate
their recruitment costs only 13 calculate the
cost of their labour turnover (2010 14) The
majority of organisations report they do not
calculate these costs (79) while 7 donrsquot know
if they are calculated or not
Nearly half (46) of those who calculate their
turnover costs want to maintain their current
turnover rate while one-fifth (38) want to
reduce turnover during 2011 and 15 want to
increase it
Retaining employees The steps organisations take to retain employees
in their workforce can have a significant impact
on organisational efficiency and success through
30
RESOURCING AND TALENT PLANNING
Table 21 Median rate of labour turnover ()
2011 2010 survey 2009 survey 2008 survey 2007 survey 2006 survey
125 135 157 173 181 183
Base 175 (2011)
Table 22 Median labour turnover rates by reason for leaving ()
2011 survey 2010 survey 2009 survey
Voluntary redundancies 0 0 0
Compulsory redundancies 0 10 05
Dismissedleft involuntarily (including death in service)
07 09 14
Fixed-short-term contracts 0 0 07
Retired 0 04 07
Left voluntarily 66 84 90
Base 154 (2011)
Table 23 Median labour turnover rates by industry sector ()
cipd
cou
k2011resou
rcing
and
talentp
lann
ing
survey
Sector All leavers Voluntary leavers
2011 survey
2010 survey
2009 survey
2011 survey
2010 survey
2009 survey
Manufacturing and production 93 (38) 124 (44) 153 (80) 37 (35) 27 (42) 77 (75)
Private sector services 138 (96) 146 (77) 168 (150) 87 (82) 74 (71) 104 (129)
Public services 85 (28) 86 (19) 126 (52) 34 (10) 58 (15) 76 (45)
Voluntary community not-for-profit 131 (11) 159 (15) 164 (38) 70 (24) 102 (18) 110 (35) Number of respondents shown in brackets
decreasing employee turnover loss of talent and
recruitment and training costs while having a
positive impact on motivation job satisfaction and
the employer brand
Only two-fifths (42) of organisations
experienced no difficulties in retaining staff
during 2010 This figure is similar to last year
(45) but higher than the findings for 2008
when 31 reported they had no retention
difficulties These findings reflect the increased
caution of employees regarding leaving their
jobs during times of economic uncertainty and
high unemployment Supporting this are our
findings that the public (49) and not-for-profit
sectors (49) are more likely to report they had
no difficulties in retaining staff during 2010
compared with the private sector (38)
As in previous years organisations most
commonly have difficulty retaining managers
and professionalsspecialists (Table 24) The
manufacturing and production sector are most
likely to report difficulties retaining technical
2011 staff and the private services sector that they have
most difficulty retaining services staff This may
reflect the higher demand for these categories of
employees in these sectors
While most organisations have taken one or more
steps to address staff retention nearly one in four
organisations (23) report that no specific retention
initiatives were undertaken This is a similar
proportion to last year although substantially higher
than in previous years when retention difficulties
were more common due to a tighter labour market
(Table 25) Public sector organisations are twice
as likely not to have taken any steps to address
retention as those in the private or not for-profit
sectors (39 compared with 20 of private sector
and 16 of not-for-profits)28
The most common methods used to address
retention in 2010 used by nearly two-fifths of
organisations are to improve line managersrsquo
people skills improve learning and development
opportunities and improve the induction process
Improving line managersrsquo people skills and
learning and development opportunities are also
most commonly rated among the top three most
effective retention methods The effectiveness of
improving induction processes is more varied with
22 rating it among the top three most effective
methods and 12 among the top three least
effective methods Views are also mixed regarding
the effectiveness of improved pay It is likely that
employees are motivated by different factors
Employers need to provide a healthy working
environment where employees are treated with
respect and make efforts to match their retention
initiatives with what staff want
Table 24 Retention difficulties by occupational category ()
Voluntary community
Private and All Manufacturing sector Public not-for- All
2011 and production services services profit 2010
Managers and professionals specialists 28 26 29 25 29 27
Technical 21 37 19 17 13 20
Services (customer personal protective and sales) 13 7 21 4 4 12
Administrative secretarial 9 5 8 15 13 7
Senior managersdirectors 7 5 8 10 6 9
Manualcraft workers 6 11 6 3 4 4 Base 601 (2011) 451 (2010)
RESO
UR
CIN
G A
ND
TALE
NT P
LAN
NIN
G 2
011
31
32
RESOURCING AND TALENT PLANNING
Table 25 Steps taken specifically to address staff retention ()
Used in Least Most Used in Used in Used in 2010 effective effective 2009 2008 2007
Improved line managers people skills 39 7 31 42 39 37
Increased learning and development opportunities 38 5 34 35 47 46
Improved induction process 38 12 22 31 45 45
Improved employee involvement 34 8 24 32 35 29
Improved selection techniques 30 7 25 31 42 46
Improved pay 27 11 23 22 42 53
Offered coachingmentoring buddy systems 24 8 14 20 24 22
Improved benefits 21 8 14 19 32 36
Better promotion to employees of the employer brand 18 10 5 15 21 16
Created clearer career paths 18 6 2 21 18 17
Revised the way staff are rewarded so their efforts are 18 4 13 14 19 19 better recognised
Made changes to improve workndash life balance 17 5 13 19 31 30
Improved physical working conditions 15 8 7 13 19 12
Redesigned jobs to make them more satisfying 11 4 8 13 18 14
Increased our use of countershyoffers 4 4 14
No specific initiatives undertaken 23 3 1 27 13 9 Base 559 (2011 survey) 431 (2010 survey) 695 (2009 survey) 710 (2008 survey)
new item added in 2011
cipd
cou
k2011resou
rcing
and
talentp
lann
ing
survey
RESO
UR
CIN
G A
ND
TALE
NT P
LAN
NIN
G 2
011
33
2011
CONCLUSIONS
Looking forward In January 2010 the UK officially emerged from
the longest recession since the 1930s Economic
growth however remains sluggish and the public
sector has embarked on a four-year programme of
the biggest government spending cuts in decades
to address the fiscal deficit
In the labour market unemployment remained
high throughout 2010 Figures from the Office
for National Statistics (ONS) show that UK
unemployment rose by 27000 in the three months
to the end of January 2011 to 253 million the
highest since 1994 While recent months have seen
signs of improvement there are concerns that the
slow growth in the private sector will be unable
to fully compensate for the increasing job losses in
the public sector that will result from the budget
cuts This is supported by the findings from the
CIPDrsquos spring 2011 Labour Market Outlook which
shows the impact on the overall labour market of a
slight rise in private sector recruitment is still being
cancelled out by large-scale public sector job losses
The findings of the CIPDrsquos 2011 Resourcing and
Talent Planning survey reflect the challenges
of the economic environment Organisations
generally have increased their focus on costs On
average organisations spent less on filling each
vacancy and a fifth have reduced their resourcing
budgets and talent management spend In the
public sector the focus on costs and budget
reductions was particularly apparent
The end of the recession has meant fewer
redundancies in 2010 Nevertheless over a third
of public sector and one-fifth of private sector
organisations reduced their headcount The
number of vacancies on offer by organisations
remained as low as in 2009 overall and continued
to decrease in very large organisations particularly
in the public sector
Looking forward private sector growth is expected
to remain slow and the full impact of public
sector budget cuts is still to come Resourcing and
talent management budgets will be further hit
in 2011ndash12 and many public sector organisations
will implement recruitment freezes and reduce
graduate intake and recruitment generally
Resourcing and talent practices are changing to
reflect the stronger focus on costs and reductions
in budgets Particularly in the public sector but
also in the private sector trends indicate a greater
focus on developing talent in-house retaining
rather than recruiting talent and reducing reliance
on recruitment agencies and external consultants
for resourcing and development
Our findings do not present a positive outlook
for the vast number of unemployed A substantial
proportion of organisations reports that the
already low number of vacancies available to them
is likely to be further affected by the abolition
of the Default Retirement Age Yet despite the
high unemployment rate most organisations
reported difficulties in filling vacancies mostly due
to skill shortages We have also seen an increase
in the proportion of organisations reporting
that competition for talent is even greater as the
pool of available talent to hire has fallen sharply
For many organisations there appears a clear
mismatch between the skills they require and
those available in the labour market Some are
concerned this will be exacerbated by the increase
in university tuition fees Some are responding
cipd
cou
k2011resou
rcing
and
talentp
lann
ing
survey
34
RESOURCING AND TALENT PLANNING
by increasing apprenticeship schemes internships
and sponsoring students through university Such
schemes may be aided by the Governmentrsquos recently
announced pound60 million commitment to help boost
youth employment and provide extra support for
apprenticeships and changes to vocational training
and education How far this will go towards meeting
organisationsrsquo skill requirements remains to be seen
On a positive note our findings indicate that talent
management is viewed as more not less important
in difficult times although with reduced budgets
organisations will have to be innovative with
their approach and strategies In order to survive
organisations will need to make certain they focus
beyond the cost-cutting required in the current
environment to ensuring their talent strategies are
aligned to long-term business success
The CIPDrsquos Shaping the Future and Next Generation
HR flagship projects have both explored the
important issues of sustainability Shaping the Future
in particular warns against the dangers of lsquotalent
tunnel visionrsquo taking a short-sighted view on talent
strategies which are solely focused on the needs of
the here and now
Often organisations pay too little attention to
identifying and developing the capabilities that
individuals will need in the long term This implies a
leadershiptalent management capability gap with
too much focus on the operational needs of today
rather than the organisational imperatives
of tomorrow
Itrsquos never too late to start equipping your people
with the skills and knowledge they need to meet
both present and future challenges So what practical
recommendations can we make for resourcing and
talent professionals drawn from our Shaping the
Future evidence
Audit your organisationrsquos current skills and future capabilities If you havenrsquot done so already conduct a thorough
inventory of your organisationrsquos current skills and map
those against the capabilities you are likely to need
in the future Hold forecasting sessions which look at
macro and micro trends how these will impact your
way of working and the changes that will be required
for future success
Build your talent and succession pipeline You also need to be proactively building up your
talent pipelines (horizontally and vertically) so that
you are developing people with future-fit skills and
capabilities A silver lining from the current economic
climate is that more organisations are focusing on
developing internal talent and fully utilising the
skills of their existing workforce Fresh talent is
still important but recruitment strategies should
complement internal pipelines
Maintain a continuous focus on capability-building Capability-building should be part of a continuous
process embedded into policies and practices Across
our case study organisations managers talked about the
need to embed development and skills training as part
of business as usual rather than as a one-off activity
Develop a creative approach to skills and capability development Even when budgets are tight it is essential that
staff get the development they need to ensure they
have the capabilities for their current job role as well
as starting to build those that the organisation will
need in the future Our case study organisations were
focusing strongly on knowledge-sharing enabling
people to learn from others across the organisation
Many of you are already considering alternative
solutions for specialist skill development such as
apprenticeships internal management schemes
summer placements and internships It is also
important to work with universities to ensure that
graduates are developing skills and knowledge which
will help them to succeed in the workplace
RESO
UR
CIN
G A
ND
TALE
NT P
LAN
NIN
G 2
011
35
2011
BACkGROUND TO ThE SURVEy
This survey was conducted in March and April 2011 It was sent to a sample of UK-based HR professionals in the public private and voluntary sectors In total 626 people responded to the survey
This is the fifteenth annual CIPD Resourcing
and Talent Planning survey (formerly known as
the CIPDrsquos Recruitment Retention and Turnover
survey) The survey examines organisationsrsquo
resourcing and talent planning strategies and
practices and the key challenges and issues
they face The survey consists of 45 questions
completed through an online self-completion
questionnaire
The majority of questions remain the same as
previous years to provide useful benchmark
data on topics including recruitment practices
difficulties and costs selection methods diversity
strategies the impact of the economic climate on
resourcing and talent planning practices labour
turnover and retention strategies New question
areas this year examine the employment of
younger workers the length of the recruitment
process the nature of job vacancies relationships
with recruitment partners and the use of
strengths-based approaches to recruitment
A small number of respondents took part in follow-
up telephone interviews to produce mini case
studies on a selection of topics These are presented
in the coloured boxes throughout the report
Sample profile Respondents predominantly work for private
sector organisations with professional services
being particularly well represented but other
sectors are represented in similar proportions to
last year (Table A1)
36
RESOURCING AND TALENT PLANNING
Table A1 Breakdown of respondent organisations by industrial sector Number of respondents
Manufacturing and production 113 19
Agriculture and forestry 1 0
Chemicals oils and pharmaceuticals 9 1
Construction 8 1
Electricity gas and water 4 1
Engineering electronics and metals 38 6
Food drink and tobacco 18 3
General manufacturing 6 1
Mining and quarrying 4 1
Paper and printing 6 1
Textiles 2 0
Other manufacturingproduction 17 3
Private sector services 319 52
Professional services (accountancy advertising consultancy legal etc) 78 13
Finance insurance and real estate 33 5
Hotels catering and leisure 26 4
IT services 26 4
Call centres 3 0
Media (broadcasting and publishing etc) 7 1
Retail and wholesale 40 7
Transport distribution and storage 23 4
Communications 6 1
Other private services 77 13
Public services 100 16
Central government 14 2
Education 12 2
Health 23 4
Local government 22 4
Other public services 29 5
Non-profit organisations 78 13
Care services 9 1
Charity services 32 5
Housing association 17 3
Other voluntary 20 3 Base 610
cipd
cou
k2011resou
rcing
and
talentp
lann
ing
survey
2011 Most respondents work in small to medium-sized
organisations in terms of the number of UK-
based employees but larger organisations are
also represented in similar proportions to last year
(Table A2)
Respondents reported on organisations based
across the UK Three in ten responded for the
whole of the UK while others responded for a
particular regioncountry (see Table A3)
Table A2 Breakdown of sample by organisation size ndash permanent employees in the UK
Fewer than 10 5
10ndash49 12
50ndash249 33
250ndash999 25
1000ndash4999 12
More than 5000 13 Base 610
Table A3 Main region covered by the reply
East Anglia 5
East Midlands 3
West Midlands 5
North-east of England 3
North-west of England 7
South-west of England 6
Yorkshire and Humberside 5
South-east of England (excluding London)
12
London 12
Scotland 6
Wales 3
Northern Ireland 3
Ireland 0
Whole of UK 29 Base 602
Labour turnover A total of 175 survey respondents were able to
supply all the information necessary for us to
calculate labour turnover on a whole-organisation
basis
This report uses the standard lsquocrude wastagersquo
method to calculate the rate of turnover This
method is calculated as follows
Labour turnover =
Number of leavers in a set period
______________________________________ x 100
Average number employed in the same period
(Leavers include those leaving the organisation
by way of voluntary or involuntary severance
redundancies or retirements but does not include
internal transfers)
Readers should be aware that this method has
some shortcomings For example it takes no
account of the characteristics of the workforce or
the length of service of the leaver
Note on statistics and figures used Some respondents did not answer all questions so
where percentages are reported in tables or figures
the respondent lsquobasersquo for that question is given
lsquoAveragersquo in the report is used to refer to the
statistical mean where the data is normally
distributed However the median is used in cases
where the distribution is significantly skewed
When the median is used it is noted
With the exception of labour turnover rates all
figures in tables have been rounded to the nearest
percentage point Due to rounding percentages
may not always total 100
Chi-square (χ2) tests are used to examine whether
differences between groups such as industrial
sectors are significant or likely to be due to
chance Spearmanrsquos Rho correlation (Rho) is used
to examine relationships between variables We
report on statistics at the generally accepted level
of significance plt005
RESO
UR
CIN
G A
ND
TALE
NT P
LAN
NIN
G 2
011
37
38
RESOURCING AND TALENT PLANNING
fURThER SOURCES Of INfORmATION
We produce a range of free factsheets surveys
guides and research reports which are available on
the CIPD website at cipdcoukhrresources
Read our factsheets on Employer Brand
Employee Turnover and Retention
Induction
Outlook series Our quarterly reports Labour Market Outlook
and Employee Outlook look at the employer and
employee perspectives on the labour market and
on workplace issues and trends while HR Outlook
explores priorities and emerging trends for the HR
profession and function
View these reports at
cipdcoukresearchoutlook-series
Talent management Two reports look at talent issues in a recession
difficult economic climate
The War on Talent Talent management under
threat in uncertain times (2009)
Fighting Back through Talent Innovation (2010)
Opening up Talent for Business Success (2010)
looks at the importance of integrating talent
management and diversity
The Talent Perspective What does it feel like to
be talent-managed (2010) looks at the employee
view of talent management
Workforce planning Our guide Workforce Planning Right people right
time right skills (2010) gives advice on developing
workforce planning processes
Diversity Two survey reports and a guide provide practical
advice and information on trends
Diversity in Business A focus for progress (2007)
Managing an Ageing Workforce How employers
are adapting to an older labour market (2010)
Managing Age New edition 2011
Two further reports are available to order from
cipdcoukbookstore
Managing Diversity in Practice Supporting
business goals (2007)
Managing Diversity and the Business Case (2008)
Sign up to receive our e-newsletter at
cipdcoukcipdupdate
cipd
cou
k2011resou
rcing
and
talentp
lann
ing
survey
RESO
UR
CIN
G A
ND
TALE
NT P
LAN
NIN
G 2
011
39
2011
ACkNOwLEDGEmENTS
The CIPD is very grateful to those organisations and
individuals who gave their time to take part in this
research They include
bull Annette Sinclair Senior Researcher at Roffey
Park for analysing the findings and writing this
comprehensive report
bull Members of the Recruitment Forum Steering
Committee for their input into the survey
design and assistance in piloting the
questionnaire
bull Hays for their support and commitment at
every stage of the research
bull All those who shared examples of their
organisationrsquos practices
We hope that you find the research useful when
considering your own recruitment and retention
practices Please contact us if you have any
questions or ideas based on our findings
(researchcipdcouk)
RESOURCING AND TALENT PLANNING
fOOTNOTES 1 Chi Square = 573 df = 5 p lt 0001 n = 604 2 Rho = 073 p lt 0001 n = 577 3 Rho = 045 p lt 0001 n = 533 4 F = 250 df = 2 p lt 0001 n = 533 5 Chi Square = 180 df = 6 p lt 001 n = 535 6 Chi Square = 71 df = 2 p lt 005 n = 603 7 Chi Square = 230 df = 6 p lt 001 n = 600 8 Chi Square = 91 df = 3 p lt 005 n = 598 9 Chi Square = 129 df = 4 p lt 005 n = 610
10 Rho = 034 p lt 0001 n = 609 11 Chi square = 217 df = 3 p lt 0001 n = 609 12 Chi Square = 609 df = 8 p lt 0001 n = 607 13 Chi Square = 208 df = 3 p lt 0001 n = 560 14 Size of organisation and developing online
careers site Rho = 025 p lt 0001 n = 599 Size of
organisation and employee surveys Rho = 019
p lt 0001 n = 599 15 Chi Square = 167 df = 2 p lt 0001 n = 599
16 Working with charities Chi Square = 80 df = 2 p
lt 005 n = 599 corporate sponsorship Chi Square
= 116 df = 2 p lt 001 n = 599 17 Chi Square = 76 df = 2 p lt 005 n = 599 18 Table 11 also shows that this method is deemed
most effective by public sector organisations but
this effect is due to a greater proportion of
large public sector organisations in our
sample whereas private sector organisations are
more evenly distributed in size 19 Chi square = 109 df = 2 p lt 001 n = 610 20 Chi Square = 279 df = 4 p lt 0001 n = 610 21 Chi Square = 259 df = 6 p lt 0001 n = 598 22 Chi Square = 515 df = 6 p lt 0001 n = 597 22 Chi Square = 177 df = 8 p lt 005 n = 600 22 Chi Square = 339 df = 4 p lt 0001 n = 610 22 Chi Square = 820 df = 4 p lt 0001 n = 610 22 Chi Square = 522 df = 8 p lt 0001 n = 610 22 Rho = 024 p lt 0001 n = 195 22 Chi Square = 166 df = 2 p lt 0001 n = 544
cipd
cou
k2011resou
rcing
and
talentp
lann
ing
survey
40
2011
OTHER TITLES IN THIS SERIES
ABSENCE MANAGEMENT The annual Absence Management survey has been running for eleven years providing useful benchmarking data on absence levels the cost and causes of absence and how organisations are managing absence The latest report is brought to you in partnership with Simplyhealth
EMPLOYEE ATTITUDES TO PAY The annual Employee Attitudes to Pay survey investigates employee attitudes and expectations towards pay and bonuses Now in its third year this survey is carried out by YouGov and focuses on employees in the UK
REWARD MANAGEMENT The annual Reward Management survey has been running for ten years and provides practical insights into current trends practices and issues affecting reward management in the UK It examines strategic reward base and variable pay bonuses incentives pensions reward measurement and total reward issues This report was brought to you in partnership with Benefex
LEARNING AND TALENT DEvELOPMENT The annual Learning and Talent Development survey is now in its thirteenth year and provides valuable commentary on current and future issues and trends It explores employer support for learning talent management employee skills managing and evaluating coaching and training spend
Issu
ed J
une
2011
Ref
eren
ce 5
552
copy C
hart
ered
Inst
itute
of
Pers
onne
l and
Dev
elop
men
t 20
11
Chartered Institute of Personnel and Development
151 The Broadway London SW19 1JQ
Tel 020 8612 6200 Fax 020 8612 6201
Email cipdcipdcouk Website cipdcouk
Incorporated by Royal Charter Registered charity no1079797
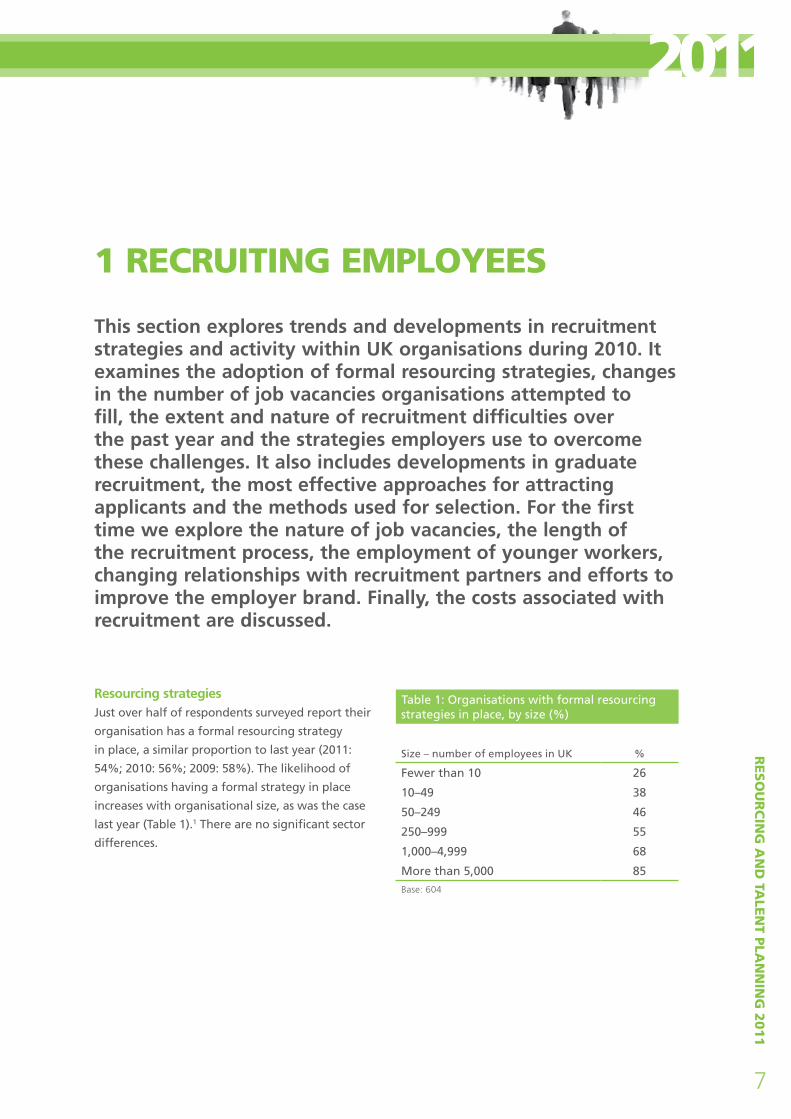
2011
1 RECRUITING EmPLOyEES
This section explores trends and developments in recruitment strategies and activity within UK organisations during 2010 It examines the adoption of formal resourcing strategies changes in the number of job vacancies organisations attempted to fill the extent and nature of recruitment difficulties over the past year and the strategies employers use to overcome these challenges It also includes developments in graduate recruitment the most effective approaches for attracting applicants and the methods used for selection For the first time we explore the nature of job vacancies the length of the recruitment process the employment of younger workers changing relationships with recruitment partners and efforts to improve the employer brand Finally the costs associated with recruitment are discussed
Resourcing strategies Just over half of respondents surveyed report their
organisation has a formal resourcing strategy
in place a similar proportion to last year (2011
Table 1 Organisations with formal resourcing strategies in place by size ()
Size ndash number of employees in UK 54 2010 56 2009 58) The likelihood of
organisations having a formal strategy in place
increases with organisational size as was the case
last year (Table 1)1 There are no significant sector
differences
Fewer than 10 26
10ndash49 38
50ndash249 46
250ndash999 55
1000ndash4999 68
More than 5000 85
RESO
UR
CIN
G A
ND
TALE
NT P
LAN
NIN
G 2
011
Base 604
7
8
RESOURCING AND TALENT PLANNING
The number and nature of job vacancies There is considerable variation in the number
of vacancies respondentsrsquo organisations tried
to fill in 2010 partly because the number of
vacancies is strongly related to organisation size
(Table 2)2 Overall the median number of vacancies
has fallen from 30 in 2008 to 20 over the past two
years as the recession affected increasing numbers
of organisations (Table 2)
While there is no overall change from last year
in the median number of vacancies organisations
tried to fill there has been a substantial fall in the
proportion of vacancies very large organisations
(5000+ UK employees) attempted to fill from
a median of 550 in 2009 to 200 in 2010 (800 in
2008) The reduction in vacancies in very large
organisations is striking in the private and public
sectors but particularly in the latter where
the median number of vacancies organisations
attempted to fill in 2010 was less than a third than
in 2009 This reflects the sluggish growth in the
private sector and in particular the significant
cuts in public sector budgets
Table 2 Median number of vacancies respondents tried to fill by size of organisation and sector
2011 survey 2010 survey 2009 survey
No of permanent staff employed in UK All Private
sector Public
services All Private sector
Public services All Private
sector Public
services
Median Median Median Median Median Median Median Median Median
1ndash49 3 3 1 3 3 2
50ndash249 12 12 10 12 10 14 10 10 8
250ndash999 45 50 30 46 45 50 60 52 70
1000ndash4999 110 150 55 100 100 100 300 300 300
More than 5000 200 500 150 550 850 500 800 800 550
All organisations 20 20 30 20 20 80 30 20 100 Base 577 (2011) 442 (2010) 683 (2009)
The categories for number of permanent staff employed in the UK differed slightly in the 2009 survey (250 or fewer 251ndash500
501ndash1000 1001ndash5000 5001ndash10000 10001+) 2009 categories have been combined where appropriate and otherwise matched with
the best corresponding category of 20112010
cipd
cou
k2011resou
rcing
and
talentp
lann
ing
survey
2011 Overall nearly three-quarters (73) of permanent
vacancies were filled with external candidates
Larger organisations with a wide range of
talent to choose from are more likely to recruit
internally than smaller organisations3 Public sector
organisations particularly those with more than
1000 UK employees are more likely to recruit
internally than the private sector (Table 3)4
Organisations are divided in their use of temporary
contracts More than a quarter (28) have
employed more people on temporary contracts
in 2010 compared with the previous year while
a similar proportion (27) have employed fewer
people on temporary contracts (45 remain
the same) Manufacturing and production
organisations are most likely to have increased
their use of temporary contracts and the public
services the least perhaps reflecting their reduced
recruitment generally (Figure 1)5
Table 3 Average percentage of job vacancies filled internally
Voluntary No of permanent staff community and not-employed in UK Private sector Public services for-profit All
Mean Mean Mean Mean
1ndash49 15 17 7 13
50ndash249 20 28 23 21
250ndash999 24 29 24 24
1000ndash4999 35 58 12 39
More than 5000 47 62 33 53
All organisations 25 45 19 27 Base 533
figure 1 Use of temporary contracts by sector in 2010 compared with the previous year ()
Manufacturing and production
Private sector services
Public services
Voluntary community and not-for-profit
More Same Less
Base 610
25
27
37
22
3837
50
32
50
23
31
28
RESO
UR
CIN
G A
ND
TALE
NT P
LAN
NIN
G 2
011
9
10
RESOURCING AND TALENT PLANNING
Sector-specific experience is an essential
requirement of candidates in three-fifths (60) of
organisations overall While our figures suggest
it is less commonly required in the public sector
(48 compared with 59 of the voluntary
community and not-for-profit sector and 63
of the private sector)6 there are also substantial
differences within sectors For example specific
sector experience is essential for the majority
of organisations operating in the chemical
construction or mining industries and professional
services but not for those in general manufacturing
or retail and wholesale Similarly within the public
sector it is deemed particularly essential for health
and education organisations but less so for those in
central or local government
Employing younger workers Figures from the Office for National Statistics
show that while total unemployment fell during
the three months to February 2011 youth
unemployment rose to a record level of almost 1
million equating to one in five economically active
16ndash24-year-olds out of work Moreover concerns
have been raised as to whether high youth
unemployment will be further compounded by the
abolition of the Default Retirement Age later this
year and the increase in university tuition fees This
year we included new questions in the survey to
explore these issues
One in six organisations (17) report they are
employing more 16ndash24-year-olds compared with
one year ago this compares with less than one
in eight (12) who are employing fewer young
people (72 are employing the same number) The
employment of younger workers has reduced most
in the public sector where one in four reports a
decrease compared with one in ten who reports an
increase (Table 4)7 This is likely to reflect a general
reduction in recruitment in this sector
Overall one-quarter of organisations expect the
abolition of the Default Retirement Age will mean
they recruit fewer people however the figure
rises to nearly half of public sector organisations
It does not appear however that the abolition of
the Default Retirement Age will have a particular
impact on the recruitment of young people with
only one in ten organisations reporting it will result
in fewer 16ndash24-year-olds being recruited (Table 4)
cipd
cou
k2011resou
rcing
and
talentp
lann
ing
survey
Table 4 The employment of younger workers ()
Voluntary Manufacturing community
All and Private sector and respondents production services Public services not-for-profit
Percentage employing fewer 16ndash24-year-olds than one year ago
Percentage agreeing the abolition of the Default Retirement Age means they will recruit fewer 16ndash24-year-olds
Percentage agreeing the abolition of the Default Retirement Age means they will recruit fewer people
12 10 9 25 10
11 18 6 17 9
23 25 15 48 22
Base 605
2011 Graduate recruitment Two-fifths of organisations (39) are concerned
that the increase in university tuition fees will
have an impact on the number of graduates in
the marketplace Public sector organisations are
particularly concerned (49 compared with 34
of private sector services 42 of not-for-profits
and 43 of manufacturing and production
organisations)8
Perhaps in order to address this deficit or in
response to additional government support to
boost apprenticeship schemes a third of public
sector organisations nearly half of manufacturing
and production and about a quarter of private
sector services and not-for-profit organisations
are considering increasing apprenticeship schemes
(Table 5) About a quarter of organisations overall
are considering increasing their use of internships
although the proportion is markedly lower in the
public sector Overall one in ten organisations are
considering sponsoring students through university
but the proportion doubles in manufacturing and
production where the lack of appropriate skills is
a common cause of recruitment difficulties (Table
5 see also Tables 8 and 9) Larger organisations are
also more likely to consider sponsoring students
through university (19 of those with more than
5000 employees)9
Overall just over a quarter of organisations
operate a structured graduate recruitment
programme (Table 6) The operation of
these programmes is significantly related to
organisation size (Figure 2)10 They also appear
to be most common in the manufacturing
and production sector as last year when a
step increase in their use was noted (Table 6)
It appears that this sector is investing in the
development of skills to address their deficit
in the workforce generally As in previous
years voluntary community and not-for-profit
organisations are least likely to operate a
structured graduate recruitment programme11
Table 5 Activities organisations are considering ()
Voluntary Manufacturing community
All and Private sector and respondents production services Public services not-for-profit
Increasing apprenticeship schemes 30 48 24 33 27
Increasing your use of internships 22 27 23 12 27
Sponsoring students through university 10 20 8 12 1
Base 615
Table 6 Organisations operating a structured graduate recruitment programme by sector ()
2011 2010 2009 2008
All 27 34 22 23
Sector
Manufacturing and production 35 35 23 24
Private sector services 29 37 24 27
Voluntary community and not-for-profit 6 18 5 7
Public services 26 33 23 24
RESO
UR
CIN
G A
ND
TALE
NT P
LAN
NIN
G 2
011
Base 614 (2011) 472 (2010) 752 (2009)
11
cipd
cou
k2011resou
rcing
and
talentp
lann
ing
survey
12
RESOURCING AND TALENT PLANNING
The majority of respondents from organisations
without a recruitment programme for graduates
report that their organisation has never had such
a programme or not had one for some time (97)
Even in the cash-strapped public sector only 3
report they have closed their graduate recruitment
programme in the last 12 months
Nearly a third (31) of organisations who have a
graduate recruitment programme have increased
their intake over the past year while a quarter
have reduced their intake (24) This shows an
improvement on the previous year at the height of
the recession when 43 had reduced their intake
The impact of the budget cuts in the public sector
are however clearly apparent as more than twice
as many organisations in this sector (50 compared
with 20 in the private and not-for-profit sectors)
have reduced their graduate intake
Length of recruitment process One in three (31) organisations report that the
length of their recruitment process has led to the
loss of potential recruits This issue appears to be
exacerbated by organisation size Nearly half of
organisations with more than 5000 employees
report that the length of their recruitment process
has led to the loss of potential recruits compared
with 38 of those in organisations of 250ndash999
employees and just 15 of organisations with
fewer than 50 employees12 There are no significant
sector differences
Recruitment difficulties Three-quarters of organisations with vacancies
report difficulties in filling at least some over the
past few months (75) This is an increase on last
year (2010 68) and may reflect the decrease in
unemployment in the first few months of 2011
It is less however than in previous years perhaps
because organisations were attempting to fill fewer
vacancies (2009 81 2008 86)
figure 2 Organisations operating a structured graduate recruitment programme by size ()
Number of UK employees
39
42
9Fewer than 50
17
1650ndash249
21
29 250ndash999
1000ndash4999 47
61 More than 5000
62
10 40 50 60 70 80
2011
0 3020 Percentage
2010
Base 609 (2011) 466 (2010)
2011 The private sector particularly manufacturing and
production organisations are most likely to have
difficulties filling vacancies (Table 7)13 Table 8
shows that over half of organisations in this sector
have difficulty filling technical vacancies and this
may reflect specific skills shortages in the UK The
most difficult category of staff to recruit in other
sectors is managers and professionalsspecialists
as was the case last year In general there is little
change in the categories of vacancies that are most
difficult to recruit for compared with last year
As would be expected given the cuts to
public sector budgets one in ten public sector
organisations report they did not have any
vacancies to fill twice as many as last year There is
little change in this regard in the other sectors
Table 9 shows the reasons respondents cite for their
recruitment difficulties The findings are similar
to previous years Lack of necessary specialist or
technical skills remains by far the most frequently
cited cause of difficulties reported by nearly
three-quarters of respondents (2011 72 2010
67 2009 73 2008 70) This is particularly
an issue for the manufacturing and production
sector and the public services sector where there
is a particularly high demand for such skills Lack
of formal qualifications is far less of an issue
These findings support arguments for greater
collaboration between industry and academic
institutions and more vocational training in order
to meet organisationsrsquo skill requirements
Higher pay expectations than the organisation
could offer and lack of experience are the next
most frequently cited causes of recruitment
problems (46 and 40 respectively) Interestingly
these are less of an issue in the public sector
perhaps because public sector applicants have
different expectations of pay or because some pay
scales are set at a national level Lack of experience
may be less of an issue than the necessary skills or
qualifications required in many public sector roles
The proportion reporting their recruitment
problems are due to potential candidatesrsquo
reluctance to move in the current economic climate
has decreased from just over a quarter in 2010 to
19 this year Economic growth albeit slow is
likely to be responsible for this reduction but the
lsquohangoverrsquo of the recession is highlighted as one in
five organisations still blame the economic climate
for their recruitment problems Despite high
unemployment 15 of respondents report they
have experienced problems due to no applicants In
line with last yearrsquos findings this is particularly an
issue for the public sector (22) which is also more
likely to report the image of their sectoroccupation
is a problem (22)
Table 7 Organisations experiencing difficulties recruiting for one or more category of vacancy by organisation size ( of those that have had vacancies to fill)
Voluntary Manufacturing community
and Private sector and All 2011 production services Public services not-for-profit
Difficulty filling one or 75 88 77 66 62more vacancies
No difficulties experienced 25 12 23 34 38
Base 561
RESO
UR
CIN
G A
ND
TALE
NT P
LAN
NIN
G 2
011
13
14
RESOURCING AND TALENT PLANNING
Table 8 Categories of vacancy that proved particularly difficult to fill ( of respondents)
Voluntary community
Manufacturing Private and and sector Public not-for-
All 2011 production services services profit All 2010
Other managers and professionalsspecialists
34 41 33 27 34 37
Technical 30 53 29 20 16 28
Senior managers directors
14 13 16 10 16 16
Services (customer personal protective 7 6 8 3 5 5 and sales)
Administrative secretarial
4 3 4 4 4 3
Manualcraft workers 4 11 3 1 0 2
Other 6 5 3 10 11 4
No difficulties experienced
23 12 22 30 38 25
No vacancies to fill 6 3 7 10 1 6 Base 597 (2011) 468 (2010)
Voluntary community
Manufacturing Private and All and sector Public not-for- All
2011 production services services profit 2010
Table 9 Reasons for recruitment difficulties ()
cipd
cou
k2011resou
rcing
and
talentp
lann
ing
survey
Lack of necessary specialist or technical skills 72 82 69 80 59 67
Look for more pay than you could offer 46 47 48 34 52 39
Lack of experience 40 42 43 27 41 36
Reluctance to move in current economic climate 19 24 18 17 15 26
Lack of interpersonal skills 16 9 19 10 20 12
No applicants 15 9 16 22 20 15
Image of sector occupationorganisation 13 7 12 22 11 12
Relocation difficulties 9 19 6 10 7 8
Lack of formal qualifications 7 7 7 5 7 4
The impact of the immigration cap 3 2 4 3 4
Other 4 3 3 8 7 7
Base 427 (2011) 330 (2010)
new item introduced in 2011
2011 Improving the employer brand Nearly three-quarters of organisations have made
efforts to improve their employer brand over the
past year (Table 10) The larger the organisation
the more likely it is to have undertaken one or
more activities to improve its brand Two-fifths of
small organisations with fewer than 50 employees
report they have taken no action to improve their
employer brand compared with one-quarter of
organisations with 250ndash999 employees and one-
sixth of those with more than 5000 employees
There are no significant sector differences
The most popular approaches to improving
employer brand are employee surveys and
developing online careers sites with larger
organisations most likely to have adopted these
methods14 The public sector is most likely to
have introduced or extended flexible working
homeworking15 whereas the private sector is
more likely to have made efforts to improve its
brand through working with charities or corporate
sponsorship16 Voluntary community and not-forshy
profit organisations are most likely to have used
placement students to improve their brand17
Attracting candidates The effectiveness of methods to attract applicants
varies according to sector and organisation size
(Table 11) Overall the most effective method is
through organisationsrsquo own corporate websites
as was the case last year The effectiveness of this
method increases with organisation size probably
due to the increased brand awareness and
perhaps because larger organisations have more
advanced websites18
The private sector particularly manufacturing
and production organisations is three times
more likely than public sector organisations to
report recruitment agencies among their most
effective methods and twice as likely as voluntary
sector organisations (regardless of size) Search
consultants and employee referral schemes are also
notably more popular in the private sector than in
the public or voluntary sectors
In contrast the public and voluntary sectors are
more likely to find the press effective for attracting
applicants including local and national newspaper
advertisements and specialist journalstrade press
Secondments are also deemed to be more effective
in these sectors than in the private sector
Table 10 Work undertaken over last year to improve employer brand ()
Voluntary community
All Private Public and 2011 sector services not-for-profit
Employee surveys 39 39 38 43
Developing online careers site 30 33 23 29
Introducingextending flexible working homeworking 24 20 39 29
Placement students 23 21 19 35
Graduate careers fairs 15 17 11 8
Working with charities 14 16 8 6
Corporate sponsorship 11 13 2 8
Introducing sabbaticals 3 4 1 5
Other 7 6 6 10
No action taken to improve employer brand 27 28 29 22
RESO
UR
CIN
G A
ND
TALE
NT P
LAN
NIN
G 2
011
Base 601
15
16
RESOURCING AND TALENT PLANNING
Table 11 Most effective methods for attracting applications by industry sector ()
Sector 2011 Number of UK employees 2011
All
2010
All
2011
Man
ufa
ctu
rin
gan
d p
rod
uct
ion
Priv
ate
sect
or
serv
ices
Pub
lic s
ervi
ces
Vo
lun
tary
co
mm
un
ity
and
no
t-fo
r-p
rofi
t
1ndash49
50ndash2
49
250ndash
999
100
0ndash4
999
Mo
re t
han
500
0
Own corporate website 63 59 44 57 77 66 42 55 57 77 79
Recruitment agencies 60 54 77 62 22 30 39 59 66 51 41
Local newspaper advertisements 36 32 38 23 41 51 28 35 35 29 29
Employee referral scheme 35 29 33 38 5 14 20 33 27 32 29
Commercial job boards 33 27 33 29 14 29 21 27 25 42 26
Specialist journalstrade press 31 27 24 23 30 43 26 23 32 32 24
Encourage speculative applicationsword of mouth 24 25 30 29 9 23 27 31 23 19 19
Jobcentre Plus 23 25 24 24 22 34 16 29 21 25 32
Professional networking (such as LinkedIn) 14 16 11 23 5 9 28 13 13 18 17
Search consultants 22 15 24 17 5 4 14 11 17 18 15
Links with schoolscollegesuniversities 18 13 16 13 9 17 12 13 11 18 15
Apprenticeships 12 11 19 9 13 9 10 10 11 12 17
National newspaper advertisements 16 11 4 6 23 29 10 9 15 10 15
Secondments 11 11 7 8 21 12 2 9 13 11 19
Links with other local organisations making redundancies 7 13 5 7 9 6 5 9 11 8
Alumni (previous employees) 5 5 6 7 2 1 7 2 6 11 3
Social networking sites (such as Facebook) 3 4 4 5 3 4 3 2 2 8 12
Local Employment Partnership (LEP) 6 3 1 4 2 5 1 2 3 4 9
Other 5 5 2 3 12 6 8 3 4 4 5
cipd
cou
k2011resou
rcing
and
talentp
lann
ing
survey
Base 604 (2011) 464 (2010)
new item introduced in 2011
Despite the popularity of social networking
sites such as Facebook they are not seen to be
particularly effective for attracting candidates
Professional networking sites such as LinkedIn are
more popular particularly in the private services
sector although there has only been a small
percentage increase in their reported effectiveness
compared with last year
2011 Recruitment partners A new question this year asked respondents if their
attitude to and relationships with recruitment
partners has changed over the past 12 months Just
over a third report things have not changed
(Table 12) A similar proportion report they have
reduced their use of recruitment partners and 6
that they have stopped using them altogether
with one in ten considering them an unaffordable
expense (one in five in the not-for-profit sector)
and a similar proportion an unnecessary expense
In contrast one in five (predominantly private
sector organisations) report they have formed
a closer business partnership with recruitment
partners over the past year and one in ten (again
predominantly private sector organisations) report
they consider them integral to attracting top talent
Selecting candidates There has been little change in the methods used
to select candidates over the past few years with
the exception of a drop in the use of general
ability tests compared with 2009 (Table 13)
Interviews remain the most common selection
method with competency-based interviews
being most popular overall Interviews following
the contents of CVsapplication forms are also
particularly popular in the private sector (70
compared with 41 in the public sector and 57
in the not-for-profit sector) whereas the public
and not-for-profit sectors favour structured (panel)
interviews (82 and 79 respectively compared
with 45 in the private sector)
Tests for specific job-related skills are more popular
in the public and not-for-profit sectors (61 and
62 respectively compared with 43 in the private
sector) whereas telephone interviews are more
popular in the private sector (52 compared with
12 in the public sector and 26 in the not-forshy
profit sector)
Table 12 Changes in attitudes to and relationships with recruitment partners over the past 12 months ()
Voluntary community
All Private Public and 2011 sector services not-for-profit
Not changed 36 34 40 39
Reduced use of recruitment partners 32 34 32 26
Formed a closer business partnership with them 19 23 8 12
Consider them an unnecessary expense 12 11 13 16
Consider them an unaffordable expense 11 10 11 22
Consider them integral to attracting top talent 9 11 2 4
Stopped using recruitment partners 6 5 8 5
Other 3 3 3 3 Base 604
RESO
UR
CIN
G A
ND
TALE
NT P
LAN
NIN
G 2
011
17
18
RESOURCING AND TALENT PLANNING
Table 13 Methods used to select applicants ()
2011 2010 2009 survey survey survey
Competency-based interviews 70 78 69
Interviews following contents of CVapplication form 63 64 68
Structured interviews (panel) 56 61 59
Tests for specific job-related skills 49 48 50
Telephone interviews 43 47 38
Literacy andor numeracy tests 38 43 39
Personalityaptitudepsychometric questionnaires 35 44 35
Assessment centres 35 42 35
Pre-application eliminationprogression question(s) 25 32 NA
General ability tests 23 27 44
Group exercises (for example role-playing) 21 30 26
Pre-interview references (academic or employment) 9 16 19
Video CVs 0 1 NA
Other 3 4 6
cipd
cou
k2011resou
rcing
and
talentp
lann
ing
survey
Base 605 (2011) 473 (2010) 754 (2009)
Strengths-based recruitment Two-fifths of organisations (40) report they use a
strengths-based approach to recruitment although
it is less commonly used in the public sector (26)19
In all sectors smaller organisations are most likely
to report they use a strengths-based approach
(60 of organisations with 1ndash49 employees use it
compared with 34 of organisations with 250ndash999
employees and 24 of organisations with more
than 5000 employees)20
Most of those who use a strengths-based approach
to recruitment are neutral about how easy it is to
administer in practice regardless of sector or size
Nearly a third (32) find it easy or very easy and
only one in ten (11) find it difficult
Over three-quarters of those who use a strengths-
based approach to recruitment believe it
brings benefits in terms of increased individual
performance (78) Two-thirds believe it improves
retention (67) and increases engagement (63)
Two-fifths (39) report it results in greater diversity
of skills in the workplace
Many organisations that use a strengths-based
approach to recruitment also use a strengths-based
approach for other people processes More than
half use it for performance management processes
(59) succession planning (55) and learning and
development (53) Two-fifths use it for talent
management (42) and a third use it for workforce
planning (32) Just under three in ten (29) also
use it for redeployment
Recruitment costs Last year we noted an increase in the proportion
of organisations that calculate their recruitment
costs (2010 65 2009 53 2008 51) This year
the proportion is back in line with previous years
(52) The increase last year may have been due
to sampling differences or a consequence of an
increased focus on costs during the recession that
has not continued
Four-fifths (79) of organisations that calculate
recruitment costs provided cost estimates per
hire There is considerable variance in the amount
organisations spend (at least partly due to our
2011 findings that organisations include different costs
in their calculations see Table 14) In general
the median figures (Table 15) are lower than last
year for both senior managerdirectors and other
employees
In order to explore the validity of estimates this
year we also asked respondents to indicate how
accurate their cost estimates were Half (51) of
estimates for costs of recruiting senior managers
directors were accurate to plus or minus 10 and
83 to plus or minus 20 Two-fifths of estimates
for other employees were accurate to plus or minus
10 and 74 to plus or minus 20 Table 16
shows the median figures for estimates that were
believed to be accurate to up to plus or minus 20
The figures indicate as we found last year that
organisations spend considerably more on senior
appointments than on other employees This
reflects the value attached to good leadership and
perhaps the additional challenges of attracting
the best candidates for senior positions This is
particularly the case in the private sector where
considerably more is spent on the recruitment of
senior managersdirectors than in the public or not-
for-profit sectors
Table 14 Criteria included in cost per hire calculations ()
Size ndash number of employees in UK
Advertising costs
Agencysearch costs
Employee referrals
Travel expenses
Relocation expenses
Fixed costs of resourcing team
Opportunity costs of hiring managers time
Other
Dont know Base 299
81
75
35
30
17
24
24
3
4
Table 15 Estimated total costs (advertising costs agency or search fees) per hire (pound)
Median 2011 Median 2010 (no of (no of
Occupational group respondents) Minimum Maximum respondents)
Senior managersdirectors 7000 (219) 251 55000 8333 (234)
Other employees 2000 (246) 150 32000 2930 (262) Number of respondents shown in brackets
Table 16 Median total costs (advertising costs agency or search fees) per hire for estimates accurate to plus or minus 20 (pound)
Voluntary
Median 2011 Manufacturing
and Private Public
community and not-for-
Occupational group production sector services profit
RESO
UR
CIN
G A
ND
TALE
NT P
LAN
NIN
G 2
011
Senior managersdirectors 7500 8000 9000 5000 3500
Other employees 2500 3400 2000 3000 1500 Base 150
19
cipd
cou
k2011resou
rcing
and
talentp
lann
ing
survey
20
RESOURCING AND TALENT PLANNING
2 RESOURCING AND TALENT mANAGEmENT IN TURBULENT TImES
In January 2010 the UK officially emerged from the recession however the economic environment remains uncertain for many organisations The environmental disasters in Japan the uprisings and wars in the Middle East rising oil prices and European debt highlight the volatility of global markets In the UK economic growth remains sluggish and there are concerns regarding the impact of the VAT increases high inflation and the austerity measures of the Coalition Government This section examines the impact of the economic environment on resourcing budgets strategies and activities in 2010 It looks at changes in views on the employment market and the implications for managing talent
The impact of the economic climate on resourcing Overall half of organisations report that the
economic climate has had a negative impact on
their organisationsrsquo resourcing budgets for 2011ndash12
(Table 17) This year however it is the public
sector that is most severely hit with four-fifths
(82) reporting their resourcing budgets will be
reduced (up from 59 last year) In contrast fewer
private and not-for-profit sector organisations
face reductions this year compared with last
although more are still reducing their budgets than
increasing them
Changes in resourcing and talent practices in
2011 compared with 2010 reflect a stronger
focus on costs and reductions in budgets (Figure
3) Two-thirds plan to develop more talent inshy
house (compared with one-third in 2010) and
more organisations plan to reduce reliance on
recruitment agencies and external consultants for
resourcing and development The proportion of
organisations planning to focus more on retaining
rather than recruiting talent has increased to 51
in 2011 from 28 in 2010
2011 Changes in recruitment practices are also
anticipated More organisations plan to make use
of new mediatechnology to recruit which may
be a cost-cutting strategy but can also improve
the efficiency and effectiveness of the recruitment
process On a positive note more organisations plan
to invest more time and effort in the quality of
candidates they hire and will be taking actions to
improve ways of identifying quality candidates
Public sector organisations are more than twice
as likely to be implementing a recruitment freeze
in 2011 (46 compared with 22 overall)
Nevertheless this is an improvement on 2010 when
58 of public sector organisations implemented a
recruitment freeze The situation is also somewhat
brighter for many private sector organisations
with 15 reporting they will be implementing a
recruitment freeze in 2011 compared with 26
in 2010 Nevertheless the economic recovery
remains slow for many with 29 of private
sector organisations and 66 of public sector
organisations reporting they will be reducing the
number of new recruits they hire in 2011 similar
proportions to 2010 Inevitably more public than
private sector organisations report they will be
reducing their headcount in 2011 and losing key
talent (33 compared with 9 in the private
sector) and redeploying people into new roles (66
compared with 37 in the private sector)
Table 17 Impact of the current economic climate on organisationsrsquo resourcing budgets ()
Private Public Voluntary community All sector services and not-for-profit
2011 2010 2011 2010 2011 2010 2011 2010
Reduced 49 53 41 51 82 59 51 61
Stayed about the same 36 37 39 40 14 36 40 34
Increased 8 7 11 4 1 5 4 5
Dont know 7 3 8 5 3 5 Base 615 (2011) 475 (2010)
RESO
UR
CIN
G A
ND
TALE
NT P
LAN
NIN
G 2
011
21
cipd
cou
k2011resou
rcing
and
talentp
lann
ing
survey
22
RESOURCING AND TALENT PLANNING
figure 3 Resourcing and talent practices implemented in 2011 and 2010 ( of respondents)
Developing more talent in-house
Continuing to recruit key talentniche areas
Focusing more on retaining rather than recruiting talent
Reducing reliance on recruitment agencies
Use of new mediatechnology to recruit
Investing more time and effort in the quality of candidates we hire
Redeploying people into new roles
Reducing the number of new recruits we hire
Taking actions to improve ways of identifying quality candidates
Increasing the number of interimcontract staff recruited
Reducing our use of external consultants for resourcing and development
Increased recruitment of apprenticesinterns
Implementing a recruitment freeze
Reducing our headcount but preserving key talent
Recruiting talent discarded by competitors
Reducing our headcount and losing key talent
Offering sabbaticals career breaks additional holidays
Reducing employees working hours to avoid making people redundant
8Reducing graduate recruitment 8
6Suspending graduate recruitment 7
36
28
36
28
26
30
35 35
35 15
29 23
28 19
24 12
22 30
22 16
18 11
13 12 12
10
12 10
66
59 46
51
47
46
45
44
0 10 20 30 40 50 60 70 80 Percentage of respondents
2011 2010
Base 582
RESO
UR
CIN
G A
ND
TALE
NT P
LAN
NIN
G 2
011
23
2011 Views on the employment market In little change to last year three-quarters of
organisations report they have noticed an increase
in the number of unsuitable applicants as they have
fewer roles to fill (Figure 4) Far fewer (34) report
that there are too many suitable candidates to
choose from and despite high unemployment over
the past two years more than half (52) believe that
competition for talent is even greater as the pool of
available talent to hire has fallen sharply (2010 41
2009 20) For many organisations there appears a
clear mismatch between the skills they require and
those available in the labour market
Competition for talent appears to be particularly
keen in the private sector Two-thirds (64) of
manufacturing and production organisations
and 55 of private services organisations agree
that competition for talent is even greater now
compared with 39 of the public sector and 34
of not-for-profits21 In contrast the public sector
and not-for-profits are more likely to agree they
have too many suitable candidates to choose
from (61 and 47 respectively compared with
23 of manufacturing and production and 27
of private sector services)22
Three-fifths (62) of respondents agree that the
demand for temporary and contract workers will
increase as employers will be reluctant to take
on permanent staff during uncertain times while
44 agree that part-time workers will become
more appealing to employers who are looking to
cut costs
figure 4 Views on the employment market ( agreeing or strongly agreeing)
With fewer roles to fill we have noticed an increase in the number
of unsuitable applicants
The demand for temporary and contract workers will increase as employers will be reluctant to
take on permanent staff during uncertain times
Employers will use the economic downturn as an opportunity to get rid of poor performers
and bring about culture change
Competition for talent is even greater now as the pool of available talent to hire has
fallen sharply
Part-time workers will become more appealing to employers who are looking to cut costs
Employers are acting too hastily in making people redundant and as a result they will lose too
many employees with valuable knowledge and skills
With fewer roles to fill there are now too many suitable candidates to choose between
The abolition of the Default Retirement Age will mean we recruit fewer people
Employers will look to make older workers over the age of 65 redundant before their younger workers
73 76
54
62 66 66
55 63
72
52 41
20
44 45
52
44 48
53
34 32
23
19 22
27
0 10 20 30 40 50 60 70 80 Percentage of respondents
2011 2010 2009
Base 607 (2011) 475 (2010) 746 (2009)
item added 20102011
24
RESOURCING AND TALENT PLANNING
More than half of respondents (55) across
all sectors believe that employers will use the
economic downturn as an opportunity to get rid of
poor performers and bring about culture change
While high this shows a downward trend on the
past two years (2010 63 2009 72 agree or
strongly agree) perhaps reflecting a slowing in
the number of redundancies Similarly there is
a gradual downward trend in the proportion of
respondents who express concern that employers
are acting too hastily in making people redundant
and as a result they will lose too many employees
with valuable knowledge and skills or that
employers will look to make older workers over the
age of 65 redundant before their younger workers
Nearly a quarter (23) of respondents believe
that the abolition of the Default Retirement Age
will mean they recruit fewer people (48 in the
public sector)23
Implications for talent management The value of effective talent management has
not been lost in the recent attention on reducing
costs Two-fifths (41) of organisations report
that the current economic situation has led
to an increased focus on talent management
(43 in 2010) and only 4 that it has led to a
decreased focus (7 in 2010) with no significant
differences across sectors Unsurprisingly however
the public sector are about twice as likely this
year to report they have reduced their overall
talent management spend due to the downturn
compared with other sectors (Table 18)24
The proportion of organisations that report
the economic downturn has had an impact on
approaches to reward across the business has
slightly reduced compared with last year (54
compared with 61 in 2010) As last year it
appears that organisations across all sectors
are being more selective in who they reward A
smaller proportion of organisations report their
approach to reward for individuals identified as
talent has been affected by the downturn (42)
than report their approach to reward across the
business has been affected (54)
Table 18 Has your overall talent management spend been reduced due to the economic downturn ()
cipd
cou
k2011resou
rcing
and
talentp
lann
ing
survey
Voluntary All community and All
2011 Private sector Public sector not-for-profit 2010
Yes 18 17 32 13 23
No 38 43 16 32 41
NA (no talent management spend) 44 40 52 55 36
Base 617 (2011) 471 (2010)
RESO
UR
CIN
G A
ND
TALE
NT P
LAN
NIN
G 2
011
25
2011
Case study Innovative recruitment and cost saving in the Association of Greater Manchester Authorities
The Association of Greater Manchester Authorities (AGMA) represents the ten local authorities in
Greater Manchester and works in partnership with a wider group of associate councils and public
sector organisations AGMA chief executives and council leaders work together on a range of key
strategic and policy issues which impact on Greater Manchester including resourcing strategies
and recruitment and retention issues
The AGMA initiative in cost reduction in the area of resourcing has been described as lsquoa truly
pioneering example of collaboration between a number of local authoritiesrsquo and is already
delivering against a range of objectives
The initial aim was to make a significant saving on the pound5ndash6 million annual cost of external
media advertising reported in 2008ndash09 and to create a more efficient and effective recruitment
system A shared portal was commissioned to offer a front-end website (wwwyourcounciljobs
couk) with a lsquoback-officersquo e-recruitment system which would give a standardised shared-service
approach for job applicants across councils Some of the benefits for applicants include the ability
to go to one place to register their interest to be able to look in specific categories for jobs
of particular relevance to them to be able to amend an existing application form in order to
apply for a further post and to receive email alerts when new jobs relevant to their interests are
posted In addition communications to job-seekers are now standardised for every council
This approach has seen real benefits across each of the local authorities workflows are now
standardised as every HR team runs identical systems and there is consistency in reporting within
all councils enabling them to benchmark their processes more clearly The councils use this
benchmarking data to make additional improvements and efficiencies
Jayne Whitehead AGMA Category Procurement Manager has project-managed the initiative
with managers represented from each participating authority and describes the process as one
of lsquotrue collaborationrsquo with lsquo100 commitmentrsquo from all the councils involved The benefits
are clear annual media costs are dramatically reduced to approximately pound250000 across ten
partner organisations and there has been a reduction in time-to-hire of 13 days This has had
the knock-on effect of reducing expenditure on agency staff The average cost of a recruitment
advertisement per role was previously pound97400 it is now pound15200 There have also been benefits
outside the original intention including doubling the number of online applications for council
posts with administrative cost savings in HR of approximately pound250000 across the consortium
More than 61000 registered users are now on the system and the councils are successfully filling
their own talent pools of prospective job-seekers Overall the project team is now celebrating a
pound17 million reduction in recruitment expenditure over the past 12 months
(continued)
cipd
cou
k2011resou
rcing
and
talentp
lann
ing
survey
26
RESOURCING AND TALENT PLANNING
There were some challenges in the implementation of this new way of working All the councils
had to be convinced about the benefits of the changes With the implementation of a new IT
system having its own set of challenges the project has taken 12 months to introduce longer
than first anticipated Implementing the changes during a period of radical restructuring in all
councils also proved particularly challenging However Jayne describes how both the need to
make efficiencies and feedback from job-seekers meant that lsquowe had to find a different way of
doing thingsrsquo Jayne also recognises how the neutrality of her own role (each council pays a tenth
of her salary) has been essential in ensuring that the project has been fair to all its participants
offering a centralised shared resource to manage the project
The project is now set to develop yet further with the aim of becoming entirely self-funding
within the next year by accepting advertising from other organisations Two new websites are
planned for recruitment into schools and social care jobs bringing even less reliance on media
and agencies AGMA will also be further building its own talent pool
Jayne describes the initiative as lsquoa true example of what you can do if you collaborate across
authoritiesrsquo Not only the separate councils but also diverse teams and functions including HR IT
procurement communications and marketing have worked together to deliver this innovative
and inspiring project
Information provided by Jayne Whitehead AGMA Category Procurement Manager
2011
3 DIVERSITy
This section examines organisationsrsquo approaches to diversity including the use of formal diversity strategies and the methods used to address diversity issues
Just over half of organisations report they have with just under two-thirds of not-for-profit
a formal diversity strategy showing little change organisations and just two-fifths of private sector
over the past four years (2011 52 2010 55 companies (Table 19)25 Diversity strategies are also
2009 60 2008 55) Consistent with previous more common in larger organisations (regardless
yearsrsquo findings most public sector organisations of sector)26
(90) have a formal diversity strategy compared
Table 19 Does your organisation have a formal diversity strategy ()
Yes No Dont know
All 52 41 7
Sector
Private sector 41 50 8
Public services 90 9 1
Voluntary community and not-for-profit 63 33 4
Number of UK employees
Fewer than 50 45 50 5
50ndash249 43 51 6
250ndash999 48 44 7
1000ndash4999 65 31 4
More than 5000 80 9 11 Base 613
RESO
UR
CIN
G A
ND
TALE
NT P
LAN
NIN
G 2
011
27
28
RESOURCING AND TALENT PLANNING
As was the case last year over three-quarters
of organisations with a formal diversity policy
attempt to address diversity issues through
monitoring recruitment andor staffing
information to obtain data on gender ethnicity
disability age and so on (Table 20) Less than
three-fifths train interviewers to understand what
diversity is about and the impact of stereotypes
Other diversity-focused initiatives are even
less common moreover the figures indicate a
reduction in the use of several methods compared
with previous years The pressures of the recession
may have led to a reduced focus on diversity
Given the links between diversity in the workforce
and productivity organisations that fail to give
this issue the attention it requires may find
themselves at a disadvantage in the future
Traditionally the public sector has tended to lead
the way in terms of diversity practices Again this
year they are significantly more likely to address
diversity issues through monitoring recruitment
andor staffing information through providing
recruitment documents in other formats through
advertising vacancies in different sources to
attract under-represented groups and through
setting recruitment targets to correct a workforce
imbalance Nevertheless they are less likely than
other sectors to actively try to attract talent of all
ages (Table 20) Moreover our figures indicate that
the reduction in the use of several diversity methods
compared with previous years is particularly
pronounced in the public sector The change of
government and budget reduction measures have
led to significant change programmes in many
public sector organisations which may have resulted
in a reduced focus on diversity issues
Table 20 Methods used to address diversity issues in organisations ( with formal diversity strategy)
Voluntary community
Private Public and not-sector services for-profit
2011 2010 2009 2008 2011 2011 2011 survey survey survey survey (2010) (2010) (2010)
Monitoring recruitment andor staffing information to obtain data on gender 78 79 84 83 70 (71) 88 (96) 88 (76) ethnicity disability age any other categories
cipd
cou
k2011resou
rcing
and
talentp
lann
ing
survey
Training interviewers to understand what diversity is about and the impact of stereotypes
57 68 68 60 53 (66) 64 (73) 57 (72)
Actively trying to attract talent of all ages 45 53 32 43
Operating policies that go beyond basic legislative requirements on age gender race disability sexual orientation religion and belief
39 49 52 48 34 (44) 47 (63) 47 (40)
Providing recruitment documents in other 39 41 37 31 24 (22) 64 (77) 47 (52)formats (online large-print audio and so on)
Checking that any tests used are valid reliable and culture-free and were tested on diverse norm groups
36 42 47 34 39 (44) 35 (45) 27 (16)
Advertising vacancies in different sources to 31 37 51 48 22 (30) 44 (53) 41 (32)attract under-represented groups
Using specific imageswords in your recruitment advertising to appeal to a wider audience 29 38 42 42 25 (30) 36 (52) 33 (40)
Making attempts to employ the long-term 19 19 13 29unemployed
Setting recruitment targets to correct a workforce imbalance 9 15 14 12 4 (8) 18 (31) 8 (16)
Base 312 (2011) 253 (2010) 419 (2009) new item added in 2011
RESO
UR
CIN
G A
ND
TALE
NT P
LAN
NIN
G 2
011
29
2011
4 mANAGING LABOUR TURNOVER
Figures from the Office for National Statistics show that UK unemployment rose by 27000 in the three months to the end of January 2011 to 253 million the highest since 1994 When unemployment is high the number of employees leaving organisations voluntarily is expected to decrease Here we examine whether this is happening and how organisations are tackling the issue of employee retention
Among organisations that are able to supply
turnover data the median labour turnover rate
has decreased over the past few years (Table 21)
The median figure however hides differences
across organisations Slightly more organisations
report their turnover has increased in 2010
compared with 2009 (38) than has decreased
(33) while for nearly a third (29) it remained
the same Smaller organisations are more likely
to report their labour turnover has increased and
larger organisations that it has decreased27
As in previous years the majority of turnover (53)
is still attributed to employees leaving voluntarily
(Table 22) As the economy has improved the
median proportion of turnover due to redundancies
has reduced Only 12 of organisations that
provided reasons for leaving made more than ten
redundancies in the previous year compared with
33 in 2010 26 in 2009 and 22 in 2008 A third
(34) of organisations that made redundancies
offered career transition services
While median turnover rates have reduced
across all sectors Table 23 shows that the rate
of voluntary leavers has increased slightly in
the private sector compared with last year but
decreased in the voluntary and public services
sector This reflects improvements in the economic
outlook for the private sector and the widespread
cuts in the public sector which also have a direct
impact on many not-for-profit organisations that
provide services for the public sector
Cost of labour turnover While just over half of organisations calculate
their recruitment costs only 13 calculate the
cost of their labour turnover (2010 14) The
majority of organisations report they do not
calculate these costs (79) while 7 donrsquot know
if they are calculated or not
Nearly half (46) of those who calculate their
turnover costs want to maintain their current
turnover rate while one-fifth (38) want to
reduce turnover during 2011 and 15 want to
increase it
Retaining employees The steps organisations take to retain employees
in their workforce can have a significant impact
on organisational efficiency and success through
30
RESOURCING AND TALENT PLANNING
Table 21 Median rate of labour turnover ()
2011 2010 survey 2009 survey 2008 survey 2007 survey 2006 survey
125 135 157 173 181 183
Base 175 (2011)
Table 22 Median labour turnover rates by reason for leaving ()
2011 survey 2010 survey 2009 survey
Voluntary redundancies 0 0 0
Compulsory redundancies 0 10 05
Dismissedleft involuntarily (including death in service)
07 09 14
Fixed-short-term contracts 0 0 07
Retired 0 04 07
Left voluntarily 66 84 90
Base 154 (2011)
Table 23 Median labour turnover rates by industry sector ()
cipd
cou
k2011resou
rcing
and
talentp
lann
ing
survey
Sector All leavers Voluntary leavers
2011 survey
2010 survey
2009 survey
2011 survey
2010 survey
2009 survey
Manufacturing and production 93 (38) 124 (44) 153 (80) 37 (35) 27 (42) 77 (75)
Private sector services 138 (96) 146 (77) 168 (150) 87 (82) 74 (71) 104 (129)
Public services 85 (28) 86 (19) 126 (52) 34 (10) 58 (15) 76 (45)
Voluntary community not-for-profit 131 (11) 159 (15) 164 (38) 70 (24) 102 (18) 110 (35) Number of respondents shown in brackets
decreasing employee turnover loss of talent and
recruitment and training costs while having a
positive impact on motivation job satisfaction and
the employer brand
Only two-fifths (42) of organisations
experienced no difficulties in retaining staff
during 2010 This figure is similar to last year
(45) but higher than the findings for 2008
when 31 reported they had no retention
difficulties These findings reflect the increased
caution of employees regarding leaving their
jobs during times of economic uncertainty and
high unemployment Supporting this are our
findings that the public (49) and not-for-profit
sectors (49) are more likely to report they had
no difficulties in retaining staff during 2010
compared with the private sector (38)
As in previous years organisations most
commonly have difficulty retaining managers
and professionalsspecialists (Table 24) The
manufacturing and production sector are most
likely to report difficulties retaining technical
2011 staff and the private services sector that they have
most difficulty retaining services staff This may
reflect the higher demand for these categories of
employees in these sectors
While most organisations have taken one or more
steps to address staff retention nearly one in four
organisations (23) report that no specific retention
initiatives were undertaken This is a similar
proportion to last year although substantially higher
than in previous years when retention difficulties
were more common due to a tighter labour market
(Table 25) Public sector organisations are twice
as likely not to have taken any steps to address
retention as those in the private or not for-profit
sectors (39 compared with 20 of private sector
and 16 of not-for-profits)28
The most common methods used to address
retention in 2010 used by nearly two-fifths of
organisations are to improve line managersrsquo
people skills improve learning and development
opportunities and improve the induction process
Improving line managersrsquo people skills and
learning and development opportunities are also
most commonly rated among the top three most
effective retention methods The effectiveness of
improving induction processes is more varied with
22 rating it among the top three most effective
methods and 12 among the top three least
effective methods Views are also mixed regarding
the effectiveness of improved pay It is likely that
employees are motivated by different factors
Employers need to provide a healthy working
environment where employees are treated with
respect and make efforts to match their retention
initiatives with what staff want
Table 24 Retention difficulties by occupational category ()
Voluntary community
Private and All Manufacturing sector Public not-for- All
2011 and production services services profit 2010
Managers and professionals specialists 28 26 29 25 29 27
Technical 21 37 19 17 13 20
Services (customer personal protective and sales) 13 7 21 4 4 12
Administrative secretarial 9 5 8 15 13 7
Senior managersdirectors 7 5 8 10 6 9
Manualcraft workers 6 11 6 3 4 4 Base 601 (2011) 451 (2010)
RESO
UR
CIN
G A
ND
TALE
NT P
LAN
NIN
G 2
011
31
32
RESOURCING AND TALENT PLANNING
Table 25 Steps taken specifically to address staff retention ()
Used in Least Most Used in Used in Used in 2010 effective effective 2009 2008 2007
Improved line managers people skills 39 7 31 42 39 37
Increased learning and development opportunities 38 5 34 35 47 46
Improved induction process 38 12 22 31 45 45
Improved employee involvement 34 8 24 32 35 29
Improved selection techniques 30 7 25 31 42 46
Improved pay 27 11 23 22 42 53
Offered coachingmentoring buddy systems 24 8 14 20 24 22
Improved benefits 21 8 14 19 32 36
Better promotion to employees of the employer brand 18 10 5 15 21 16
Created clearer career paths 18 6 2 21 18 17
Revised the way staff are rewarded so their efforts are 18 4 13 14 19 19 better recognised
Made changes to improve workndash life balance 17 5 13 19 31 30
Improved physical working conditions 15 8 7 13 19 12
Redesigned jobs to make them more satisfying 11 4 8 13 18 14
Increased our use of countershyoffers 4 4 14
No specific initiatives undertaken 23 3 1 27 13 9 Base 559 (2011 survey) 431 (2010 survey) 695 (2009 survey) 710 (2008 survey)
new item added in 2011
cipd
cou
k2011resou
rcing
and
talentp
lann
ing
survey
RESO
UR
CIN
G A
ND
TALE
NT P
LAN
NIN
G 2
011
33
2011
CONCLUSIONS
Looking forward In January 2010 the UK officially emerged from
the longest recession since the 1930s Economic
growth however remains sluggish and the public
sector has embarked on a four-year programme of
the biggest government spending cuts in decades
to address the fiscal deficit
In the labour market unemployment remained
high throughout 2010 Figures from the Office
for National Statistics (ONS) show that UK
unemployment rose by 27000 in the three months
to the end of January 2011 to 253 million the
highest since 1994 While recent months have seen
signs of improvement there are concerns that the
slow growth in the private sector will be unable
to fully compensate for the increasing job losses in
the public sector that will result from the budget
cuts This is supported by the findings from the
CIPDrsquos spring 2011 Labour Market Outlook which
shows the impact on the overall labour market of a
slight rise in private sector recruitment is still being
cancelled out by large-scale public sector job losses
The findings of the CIPDrsquos 2011 Resourcing and
Talent Planning survey reflect the challenges
of the economic environment Organisations
generally have increased their focus on costs On
average organisations spent less on filling each
vacancy and a fifth have reduced their resourcing
budgets and talent management spend In the
public sector the focus on costs and budget
reductions was particularly apparent
The end of the recession has meant fewer
redundancies in 2010 Nevertheless over a third
of public sector and one-fifth of private sector
organisations reduced their headcount The
number of vacancies on offer by organisations
remained as low as in 2009 overall and continued
to decrease in very large organisations particularly
in the public sector
Looking forward private sector growth is expected
to remain slow and the full impact of public
sector budget cuts is still to come Resourcing and
talent management budgets will be further hit
in 2011ndash12 and many public sector organisations
will implement recruitment freezes and reduce
graduate intake and recruitment generally
Resourcing and talent practices are changing to
reflect the stronger focus on costs and reductions
in budgets Particularly in the public sector but
also in the private sector trends indicate a greater
focus on developing talent in-house retaining
rather than recruiting talent and reducing reliance
on recruitment agencies and external consultants
for resourcing and development
Our findings do not present a positive outlook
for the vast number of unemployed A substantial
proportion of organisations reports that the
already low number of vacancies available to them
is likely to be further affected by the abolition
of the Default Retirement Age Yet despite the
high unemployment rate most organisations
reported difficulties in filling vacancies mostly due
to skill shortages We have also seen an increase
in the proportion of organisations reporting
that competition for talent is even greater as the
pool of available talent to hire has fallen sharply
For many organisations there appears a clear
mismatch between the skills they require and
those available in the labour market Some are
concerned this will be exacerbated by the increase
in university tuition fees Some are responding
cipd
cou
k2011resou
rcing
and
talentp
lann
ing
survey
34
RESOURCING AND TALENT PLANNING
by increasing apprenticeship schemes internships
and sponsoring students through university Such
schemes may be aided by the Governmentrsquos recently
announced pound60 million commitment to help boost
youth employment and provide extra support for
apprenticeships and changes to vocational training
and education How far this will go towards meeting
organisationsrsquo skill requirements remains to be seen
On a positive note our findings indicate that talent
management is viewed as more not less important
in difficult times although with reduced budgets
organisations will have to be innovative with
their approach and strategies In order to survive
organisations will need to make certain they focus
beyond the cost-cutting required in the current
environment to ensuring their talent strategies are
aligned to long-term business success
The CIPDrsquos Shaping the Future and Next Generation
HR flagship projects have both explored the
important issues of sustainability Shaping the Future
in particular warns against the dangers of lsquotalent
tunnel visionrsquo taking a short-sighted view on talent
strategies which are solely focused on the needs of
the here and now
Often organisations pay too little attention to
identifying and developing the capabilities that
individuals will need in the long term This implies a
leadershiptalent management capability gap with
too much focus on the operational needs of today
rather than the organisational imperatives
of tomorrow
Itrsquos never too late to start equipping your people
with the skills and knowledge they need to meet
both present and future challenges So what practical
recommendations can we make for resourcing and
talent professionals drawn from our Shaping the
Future evidence
Audit your organisationrsquos current skills and future capabilities If you havenrsquot done so already conduct a thorough
inventory of your organisationrsquos current skills and map
those against the capabilities you are likely to need
in the future Hold forecasting sessions which look at
macro and micro trends how these will impact your
way of working and the changes that will be required
for future success
Build your talent and succession pipeline You also need to be proactively building up your
talent pipelines (horizontally and vertically) so that
you are developing people with future-fit skills and
capabilities A silver lining from the current economic
climate is that more organisations are focusing on
developing internal talent and fully utilising the
skills of their existing workforce Fresh talent is
still important but recruitment strategies should
complement internal pipelines
Maintain a continuous focus on capability-building Capability-building should be part of a continuous
process embedded into policies and practices Across
our case study organisations managers talked about the
need to embed development and skills training as part
of business as usual rather than as a one-off activity
Develop a creative approach to skills and capability development Even when budgets are tight it is essential that
staff get the development they need to ensure they
have the capabilities for their current job role as well
as starting to build those that the organisation will
need in the future Our case study organisations were
focusing strongly on knowledge-sharing enabling
people to learn from others across the organisation
Many of you are already considering alternative
solutions for specialist skill development such as
apprenticeships internal management schemes
summer placements and internships It is also
important to work with universities to ensure that
graduates are developing skills and knowledge which
will help them to succeed in the workplace
RESO
UR
CIN
G A
ND
TALE
NT P
LAN
NIN
G 2
011
35
2011
BACkGROUND TO ThE SURVEy
This survey was conducted in March and April 2011 It was sent to a sample of UK-based HR professionals in the public private and voluntary sectors In total 626 people responded to the survey
This is the fifteenth annual CIPD Resourcing
and Talent Planning survey (formerly known as
the CIPDrsquos Recruitment Retention and Turnover
survey) The survey examines organisationsrsquo
resourcing and talent planning strategies and
practices and the key challenges and issues
they face The survey consists of 45 questions
completed through an online self-completion
questionnaire
The majority of questions remain the same as
previous years to provide useful benchmark
data on topics including recruitment practices
difficulties and costs selection methods diversity
strategies the impact of the economic climate on
resourcing and talent planning practices labour
turnover and retention strategies New question
areas this year examine the employment of
younger workers the length of the recruitment
process the nature of job vacancies relationships
with recruitment partners and the use of
strengths-based approaches to recruitment
A small number of respondents took part in follow-
up telephone interviews to produce mini case
studies on a selection of topics These are presented
in the coloured boxes throughout the report
Sample profile Respondents predominantly work for private
sector organisations with professional services
being particularly well represented but other
sectors are represented in similar proportions to
last year (Table A1)
36
RESOURCING AND TALENT PLANNING
Table A1 Breakdown of respondent organisations by industrial sector Number of respondents
Manufacturing and production 113 19
Agriculture and forestry 1 0
Chemicals oils and pharmaceuticals 9 1
Construction 8 1
Electricity gas and water 4 1
Engineering electronics and metals 38 6
Food drink and tobacco 18 3
General manufacturing 6 1
Mining and quarrying 4 1
Paper and printing 6 1
Textiles 2 0
Other manufacturingproduction 17 3
Private sector services 319 52
Professional services (accountancy advertising consultancy legal etc) 78 13
Finance insurance and real estate 33 5
Hotels catering and leisure 26 4
IT services 26 4
Call centres 3 0
Media (broadcasting and publishing etc) 7 1
Retail and wholesale 40 7
Transport distribution and storage 23 4
Communications 6 1
Other private services 77 13
Public services 100 16
Central government 14 2
Education 12 2
Health 23 4
Local government 22 4
Other public services 29 5
Non-profit organisations 78 13
Care services 9 1
Charity services 32 5
Housing association 17 3
Other voluntary 20 3 Base 610
cipd
cou
k2011resou
rcing
and
talentp
lann
ing
survey
2011 Most respondents work in small to medium-sized
organisations in terms of the number of UK-
based employees but larger organisations are
also represented in similar proportions to last year
(Table A2)
Respondents reported on organisations based
across the UK Three in ten responded for the
whole of the UK while others responded for a
particular regioncountry (see Table A3)
Table A2 Breakdown of sample by organisation size ndash permanent employees in the UK
Fewer than 10 5
10ndash49 12
50ndash249 33
250ndash999 25
1000ndash4999 12
More than 5000 13 Base 610
Table A3 Main region covered by the reply
East Anglia 5
East Midlands 3
West Midlands 5
North-east of England 3
North-west of England 7
South-west of England 6
Yorkshire and Humberside 5
South-east of England (excluding London)
12
London 12
Scotland 6
Wales 3
Northern Ireland 3
Ireland 0
Whole of UK 29 Base 602
Labour turnover A total of 175 survey respondents were able to
supply all the information necessary for us to
calculate labour turnover on a whole-organisation
basis
This report uses the standard lsquocrude wastagersquo
method to calculate the rate of turnover This
method is calculated as follows
Labour turnover =
Number of leavers in a set period
______________________________________ x 100
Average number employed in the same period
(Leavers include those leaving the organisation
by way of voluntary or involuntary severance
redundancies or retirements but does not include
internal transfers)
Readers should be aware that this method has
some shortcomings For example it takes no
account of the characteristics of the workforce or
the length of service of the leaver
Note on statistics and figures used Some respondents did not answer all questions so
where percentages are reported in tables or figures
the respondent lsquobasersquo for that question is given
lsquoAveragersquo in the report is used to refer to the
statistical mean where the data is normally
distributed However the median is used in cases
where the distribution is significantly skewed
When the median is used it is noted
With the exception of labour turnover rates all
figures in tables have been rounded to the nearest
percentage point Due to rounding percentages
may not always total 100
Chi-square (χ2) tests are used to examine whether
differences between groups such as industrial
sectors are significant or likely to be due to
chance Spearmanrsquos Rho correlation (Rho) is used
to examine relationships between variables We
report on statistics at the generally accepted level
of significance plt005
RESO
UR
CIN
G A
ND
TALE
NT P
LAN
NIN
G 2
011
37
38
RESOURCING AND TALENT PLANNING
fURThER SOURCES Of INfORmATION
We produce a range of free factsheets surveys
guides and research reports which are available on
the CIPD website at cipdcoukhrresources
Read our factsheets on Employer Brand
Employee Turnover and Retention
Induction
Outlook series Our quarterly reports Labour Market Outlook
and Employee Outlook look at the employer and
employee perspectives on the labour market and
on workplace issues and trends while HR Outlook
explores priorities and emerging trends for the HR
profession and function
View these reports at
cipdcoukresearchoutlook-series
Talent management Two reports look at talent issues in a recession
difficult economic climate
The War on Talent Talent management under
threat in uncertain times (2009)
Fighting Back through Talent Innovation (2010)
Opening up Talent for Business Success (2010)
looks at the importance of integrating talent
management and diversity
The Talent Perspective What does it feel like to
be talent-managed (2010) looks at the employee
view of talent management
Workforce planning Our guide Workforce Planning Right people right
time right skills (2010) gives advice on developing
workforce planning processes
Diversity Two survey reports and a guide provide practical
advice and information on trends
Diversity in Business A focus for progress (2007)
Managing an Ageing Workforce How employers
are adapting to an older labour market (2010)
Managing Age New edition 2011
Two further reports are available to order from
cipdcoukbookstore
Managing Diversity in Practice Supporting
business goals (2007)
Managing Diversity and the Business Case (2008)
Sign up to receive our e-newsletter at
cipdcoukcipdupdate
cipd
cou
k2011resou
rcing
and
talentp
lann
ing
survey
RESO
UR
CIN
G A
ND
TALE
NT P
LAN
NIN
G 2
011
39
2011
ACkNOwLEDGEmENTS
The CIPD is very grateful to those organisations and
individuals who gave their time to take part in this
research They include
bull Annette Sinclair Senior Researcher at Roffey
Park for analysing the findings and writing this
comprehensive report
bull Members of the Recruitment Forum Steering
Committee for their input into the survey
design and assistance in piloting the
questionnaire
bull Hays for their support and commitment at
every stage of the research
bull All those who shared examples of their
organisationrsquos practices
We hope that you find the research useful when
considering your own recruitment and retention
practices Please contact us if you have any
questions or ideas based on our findings
(researchcipdcouk)
RESOURCING AND TALENT PLANNING
fOOTNOTES 1 Chi Square = 573 df = 5 p lt 0001 n = 604 2 Rho = 073 p lt 0001 n = 577 3 Rho = 045 p lt 0001 n = 533 4 F = 250 df = 2 p lt 0001 n = 533 5 Chi Square = 180 df = 6 p lt 001 n = 535 6 Chi Square = 71 df = 2 p lt 005 n = 603 7 Chi Square = 230 df = 6 p lt 001 n = 600 8 Chi Square = 91 df = 3 p lt 005 n = 598 9 Chi Square = 129 df = 4 p lt 005 n = 610
10 Rho = 034 p lt 0001 n = 609 11 Chi square = 217 df = 3 p lt 0001 n = 609 12 Chi Square = 609 df = 8 p lt 0001 n = 607 13 Chi Square = 208 df = 3 p lt 0001 n = 560 14 Size of organisation and developing online
careers site Rho = 025 p lt 0001 n = 599 Size of
organisation and employee surveys Rho = 019
p lt 0001 n = 599 15 Chi Square = 167 df = 2 p lt 0001 n = 599
16 Working with charities Chi Square = 80 df = 2 p
lt 005 n = 599 corporate sponsorship Chi Square
= 116 df = 2 p lt 001 n = 599 17 Chi Square = 76 df = 2 p lt 005 n = 599 18 Table 11 also shows that this method is deemed
most effective by public sector organisations but
this effect is due to a greater proportion of
large public sector organisations in our
sample whereas private sector organisations are
more evenly distributed in size 19 Chi square = 109 df = 2 p lt 001 n = 610 20 Chi Square = 279 df = 4 p lt 0001 n = 610 21 Chi Square = 259 df = 6 p lt 0001 n = 598 22 Chi Square = 515 df = 6 p lt 0001 n = 597 22 Chi Square = 177 df = 8 p lt 005 n = 600 22 Chi Square = 339 df = 4 p lt 0001 n = 610 22 Chi Square = 820 df = 4 p lt 0001 n = 610 22 Chi Square = 522 df = 8 p lt 0001 n = 610 22 Rho = 024 p lt 0001 n = 195 22 Chi Square = 166 df = 2 p lt 0001 n = 544
cipd
cou
k2011resou
rcing
and
talentp
lann
ing
survey
40
2011
OTHER TITLES IN THIS SERIES
ABSENCE MANAGEMENT The annual Absence Management survey has been running for eleven years providing useful benchmarking data on absence levels the cost and causes of absence and how organisations are managing absence The latest report is brought to you in partnership with Simplyhealth
EMPLOYEE ATTITUDES TO PAY The annual Employee Attitudes to Pay survey investigates employee attitudes and expectations towards pay and bonuses Now in its third year this survey is carried out by YouGov and focuses on employees in the UK
REWARD MANAGEMENT The annual Reward Management survey has been running for ten years and provides practical insights into current trends practices and issues affecting reward management in the UK It examines strategic reward base and variable pay bonuses incentives pensions reward measurement and total reward issues This report was brought to you in partnership with Benefex
LEARNING AND TALENT DEvELOPMENT The annual Learning and Talent Development survey is now in its thirteenth year and provides valuable commentary on current and future issues and trends It explores employer support for learning talent management employee skills managing and evaluating coaching and training spend
Issu
ed J
une
2011
Ref
eren
ce 5
552
copy C
hart
ered
Inst
itute
of
Pers
onne
l and
Dev
elop
men
t 20
11
Chartered Institute of Personnel and Development
151 The Broadway London SW19 1JQ
Tel 020 8612 6200 Fax 020 8612 6201
Email cipdcipdcouk Website cipdcouk
Incorporated by Royal Charter Registered charity no1079797
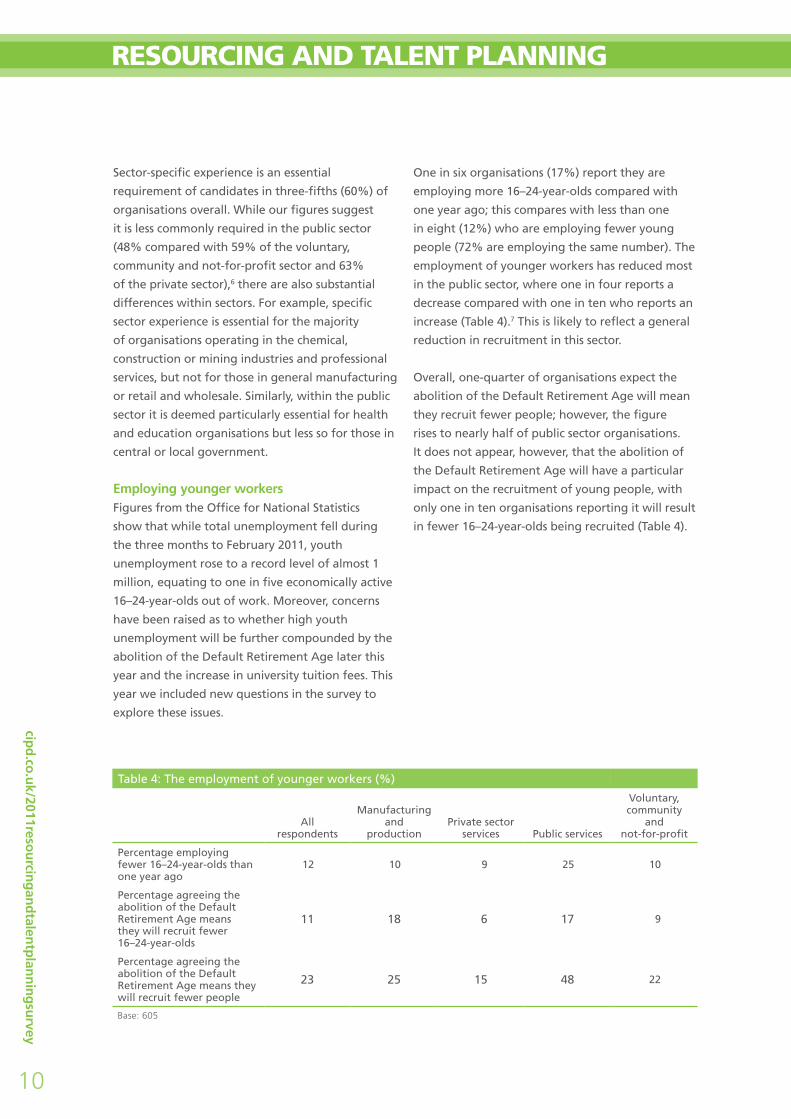
10
RESOURCING AND TALENT PLANNING
Sector-specific experience is an essential
requirement of candidates in three-fifths (60) of
organisations overall While our figures suggest
it is less commonly required in the public sector
(48 compared with 59 of the voluntary
community and not-for-profit sector and 63
of the private sector)6 there are also substantial
differences within sectors For example specific
sector experience is essential for the majority
of organisations operating in the chemical
construction or mining industries and professional
services but not for those in general manufacturing
or retail and wholesale Similarly within the public
sector it is deemed particularly essential for health
and education organisations but less so for those in
central or local government
Employing younger workers Figures from the Office for National Statistics
show that while total unemployment fell during
the three months to February 2011 youth
unemployment rose to a record level of almost 1
million equating to one in five economically active
16ndash24-year-olds out of work Moreover concerns
have been raised as to whether high youth
unemployment will be further compounded by the
abolition of the Default Retirement Age later this
year and the increase in university tuition fees This
year we included new questions in the survey to
explore these issues
One in six organisations (17) report they are
employing more 16ndash24-year-olds compared with
one year ago this compares with less than one
in eight (12) who are employing fewer young
people (72 are employing the same number) The
employment of younger workers has reduced most
in the public sector where one in four reports a
decrease compared with one in ten who reports an
increase (Table 4)7 This is likely to reflect a general
reduction in recruitment in this sector
Overall one-quarter of organisations expect the
abolition of the Default Retirement Age will mean
they recruit fewer people however the figure
rises to nearly half of public sector organisations
It does not appear however that the abolition of
the Default Retirement Age will have a particular
impact on the recruitment of young people with
only one in ten organisations reporting it will result
in fewer 16ndash24-year-olds being recruited (Table 4)
cipd
cou
k2011resou
rcing
and
talentp
lann
ing
survey
Table 4 The employment of younger workers ()
Voluntary Manufacturing community
All and Private sector and respondents production services Public services not-for-profit
Percentage employing fewer 16ndash24-year-olds than one year ago
Percentage agreeing the abolition of the Default Retirement Age means they will recruit fewer 16ndash24-year-olds
Percentage agreeing the abolition of the Default Retirement Age means they will recruit fewer people
12 10 9 25 10
11 18 6 17 9
23 25 15 48 22
Base 605
2011 Graduate recruitment Two-fifths of organisations (39) are concerned
that the increase in university tuition fees will
have an impact on the number of graduates in
the marketplace Public sector organisations are
particularly concerned (49 compared with 34
of private sector services 42 of not-for-profits
and 43 of manufacturing and production
organisations)8
Perhaps in order to address this deficit or in
response to additional government support to
boost apprenticeship schemes a third of public
sector organisations nearly half of manufacturing
and production and about a quarter of private
sector services and not-for-profit organisations
are considering increasing apprenticeship schemes
(Table 5) About a quarter of organisations overall
are considering increasing their use of internships
although the proportion is markedly lower in the
public sector Overall one in ten organisations are
considering sponsoring students through university
but the proportion doubles in manufacturing and
production where the lack of appropriate skills is
a common cause of recruitment difficulties (Table
5 see also Tables 8 and 9) Larger organisations are
also more likely to consider sponsoring students
through university (19 of those with more than
5000 employees)9
Overall just over a quarter of organisations
operate a structured graduate recruitment
programme (Table 6) The operation of
these programmes is significantly related to
organisation size (Figure 2)10 They also appear
to be most common in the manufacturing
and production sector as last year when a
step increase in their use was noted (Table 6)
It appears that this sector is investing in the
development of skills to address their deficit
in the workforce generally As in previous
years voluntary community and not-for-profit
organisations are least likely to operate a
structured graduate recruitment programme11
Table 5 Activities organisations are considering ()
Voluntary Manufacturing community
All and Private sector and respondents production services Public services not-for-profit
Increasing apprenticeship schemes 30 48 24 33 27
Increasing your use of internships 22 27 23 12 27
Sponsoring students through university 10 20 8 12 1
Base 615
Table 6 Organisations operating a structured graduate recruitment programme by sector ()
2011 2010 2009 2008
All 27 34 22 23
Sector
Manufacturing and production 35 35 23 24
Private sector services 29 37 24 27
Voluntary community and not-for-profit 6 18 5 7
Public services 26 33 23 24
RESO
UR
CIN
G A
ND
TALE
NT P
LAN
NIN
G 2
011
Base 614 (2011) 472 (2010) 752 (2009)
11
cipd
cou
k2011resou
rcing
and
talentp
lann
ing
survey
12
RESOURCING AND TALENT PLANNING
The majority of respondents from organisations
without a recruitment programme for graduates
report that their organisation has never had such
a programme or not had one for some time (97)
Even in the cash-strapped public sector only 3
report they have closed their graduate recruitment
programme in the last 12 months
Nearly a third (31) of organisations who have a
graduate recruitment programme have increased
their intake over the past year while a quarter
have reduced their intake (24) This shows an
improvement on the previous year at the height of
the recession when 43 had reduced their intake
The impact of the budget cuts in the public sector
are however clearly apparent as more than twice
as many organisations in this sector (50 compared
with 20 in the private and not-for-profit sectors)
have reduced their graduate intake
Length of recruitment process One in three (31) organisations report that the
length of their recruitment process has led to the
loss of potential recruits This issue appears to be
exacerbated by organisation size Nearly half of
organisations with more than 5000 employees
report that the length of their recruitment process
has led to the loss of potential recruits compared
with 38 of those in organisations of 250ndash999
employees and just 15 of organisations with
fewer than 50 employees12 There are no significant
sector differences
Recruitment difficulties Three-quarters of organisations with vacancies
report difficulties in filling at least some over the
past few months (75) This is an increase on last
year (2010 68) and may reflect the decrease in
unemployment in the first few months of 2011
It is less however than in previous years perhaps
because organisations were attempting to fill fewer
vacancies (2009 81 2008 86)
figure 2 Organisations operating a structured graduate recruitment programme by size ()
Number of UK employees
39
42
9Fewer than 50
17
1650ndash249
21
29 250ndash999
1000ndash4999 47
61 More than 5000
62
10 40 50 60 70 80
2011
0 3020 Percentage
2010
Base 609 (2011) 466 (2010)
2011 The private sector particularly manufacturing and
production organisations are most likely to have
difficulties filling vacancies (Table 7)13 Table 8
shows that over half of organisations in this sector
have difficulty filling technical vacancies and this
may reflect specific skills shortages in the UK The
most difficult category of staff to recruit in other
sectors is managers and professionalsspecialists
as was the case last year In general there is little
change in the categories of vacancies that are most
difficult to recruit for compared with last year
As would be expected given the cuts to
public sector budgets one in ten public sector
organisations report they did not have any
vacancies to fill twice as many as last year There is
little change in this regard in the other sectors
Table 9 shows the reasons respondents cite for their
recruitment difficulties The findings are similar
to previous years Lack of necessary specialist or
technical skills remains by far the most frequently
cited cause of difficulties reported by nearly
three-quarters of respondents (2011 72 2010
67 2009 73 2008 70) This is particularly
an issue for the manufacturing and production
sector and the public services sector where there
is a particularly high demand for such skills Lack
of formal qualifications is far less of an issue
These findings support arguments for greater
collaboration between industry and academic
institutions and more vocational training in order
to meet organisationsrsquo skill requirements
Higher pay expectations than the organisation
could offer and lack of experience are the next
most frequently cited causes of recruitment
problems (46 and 40 respectively) Interestingly
these are less of an issue in the public sector
perhaps because public sector applicants have
different expectations of pay or because some pay
scales are set at a national level Lack of experience
may be less of an issue than the necessary skills or
qualifications required in many public sector roles
The proportion reporting their recruitment
problems are due to potential candidatesrsquo
reluctance to move in the current economic climate
has decreased from just over a quarter in 2010 to
19 this year Economic growth albeit slow is
likely to be responsible for this reduction but the
lsquohangoverrsquo of the recession is highlighted as one in
five organisations still blame the economic climate
for their recruitment problems Despite high
unemployment 15 of respondents report they
have experienced problems due to no applicants In
line with last yearrsquos findings this is particularly an
issue for the public sector (22) which is also more
likely to report the image of their sectoroccupation
is a problem (22)
Table 7 Organisations experiencing difficulties recruiting for one or more category of vacancy by organisation size ( of those that have had vacancies to fill)
Voluntary Manufacturing community
and Private sector and All 2011 production services Public services not-for-profit
Difficulty filling one or 75 88 77 66 62more vacancies
No difficulties experienced 25 12 23 34 38
Base 561
RESO
UR
CIN
G A
ND
TALE
NT P
LAN
NIN
G 2
011
13
14
RESOURCING AND TALENT PLANNING
Table 8 Categories of vacancy that proved particularly difficult to fill ( of respondents)
Voluntary community
Manufacturing Private and and sector Public not-for-
All 2011 production services services profit All 2010
Other managers and professionalsspecialists
34 41 33 27 34 37
Technical 30 53 29 20 16 28
Senior managers directors
14 13 16 10 16 16
Services (customer personal protective 7 6 8 3 5 5 and sales)
Administrative secretarial
4 3 4 4 4 3
Manualcraft workers 4 11 3 1 0 2
Other 6 5 3 10 11 4
No difficulties experienced
23 12 22 30 38 25
No vacancies to fill 6 3 7 10 1 6 Base 597 (2011) 468 (2010)
Voluntary community
Manufacturing Private and All and sector Public not-for- All
2011 production services services profit 2010
Table 9 Reasons for recruitment difficulties ()
cipd
cou
k2011resou
rcing
and
talentp
lann
ing
survey
Lack of necessary specialist or technical skills 72 82 69 80 59 67
Look for more pay than you could offer 46 47 48 34 52 39
Lack of experience 40 42 43 27 41 36
Reluctance to move in current economic climate 19 24 18 17 15 26
Lack of interpersonal skills 16 9 19 10 20 12
No applicants 15 9 16 22 20 15
Image of sector occupationorganisation 13 7 12 22 11 12
Relocation difficulties 9 19 6 10 7 8
Lack of formal qualifications 7 7 7 5 7 4
The impact of the immigration cap 3 2 4 3 4
Other 4 3 3 8 7 7
Base 427 (2011) 330 (2010)
new item introduced in 2011
2011 Improving the employer brand Nearly three-quarters of organisations have made
efforts to improve their employer brand over the
past year (Table 10) The larger the organisation
the more likely it is to have undertaken one or
more activities to improve its brand Two-fifths of
small organisations with fewer than 50 employees
report they have taken no action to improve their
employer brand compared with one-quarter of
organisations with 250ndash999 employees and one-
sixth of those with more than 5000 employees
There are no significant sector differences
The most popular approaches to improving
employer brand are employee surveys and
developing online careers sites with larger
organisations most likely to have adopted these
methods14 The public sector is most likely to
have introduced or extended flexible working
homeworking15 whereas the private sector is
more likely to have made efforts to improve its
brand through working with charities or corporate
sponsorship16 Voluntary community and not-forshy
profit organisations are most likely to have used
placement students to improve their brand17
Attracting candidates The effectiveness of methods to attract applicants
varies according to sector and organisation size
(Table 11) Overall the most effective method is
through organisationsrsquo own corporate websites
as was the case last year The effectiveness of this
method increases with organisation size probably
due to the increased brand awareness and
perhaps because larger organisations have more
advanced websites18
The private sector particularly manufacturing
and production organisations is three times
more likely than public sector organisations to
report recruitment agencies among their most
effective methods and twice as likely as voluntary
sector organisations (regardless of size) Search
consultants and employee referral schemes are also
notably more popular in the private sector than in
the public or voluntary sectors
In contrast the public and voluntary sectors are
more likely to find the press effective for attracting
applicants including local and national newspaper
advertisements and specialist journalstrade press
Secondments are also deemed to be more effective
in these sectors than in the private sector
Table 10 Work undertaken over last year to improve employer brand ()
Voluntary community
All Private Public and 2011 sector services not-for-profit
Employee surveys 39 39 38 43
Developing online careers site 30 33 23 29
Introducingextending flexible working homeworking 24 20 39 29
Placement students 23 21 19 35
Graduate careers fairs 15 17 11 8
Working with charities 14 16 8 6
Corporate sponsorship 11 13 2 8
Introducing sabbaticals 3 4 1 5
Other 7 6 6 10
No action taken to improve employer brand 27 28 29 22
RESO
UR
CIN
G A
ND
TALE
NT P
LAN
NIN
G 2
011
Base 601
15
16
RESOURCING AND TALENT PLANNING
Table 11 Most effective methods for attracting applications by industry sector ()
Sector 2011 Number of UK employees 2011
All
2010
All
2011
Man
ufa
ctu
rin
gan
d p
rod
uct
ion
Priv
ate
sect
or
serv
ices
Pub
lic s
ervi
ces
Vo
lun
tary
co
mm
un
ity
and
no
t-fo
r-p
rofi
t
1ndash49
50ndash2
49
250ndash
999
100
0ndash4
999
Mo
re t
han
500
0
Own corporate website 63 59 44 57 77 66 42 55 57 77 79
Recruitment agencies 60 54 77 62 22 30 39 59 66 51 41
Local newspaper advertisements 36 32 38 23 41 51 28 35 35 29 29
Employee referral scheme 35 29 33 38 5 14 20 33 27 32 29
Commercial job boards 33 27 33 29 14 29 21 27 25 42 26
Specialist journalstrade press 31 27 24 23 30 43 26 23 32 32 24
Encourage speculative applicationsword of mouth 24 25 30 29 9 23 27 31 23 19 19
Jobcentre Plus 23 25 24 24 22 34 16 29 21 25 32
Professional networking (such as LinkedIn) 14 16 11 23 5 9 28 13 13 18 17
Search consultants 22 15 24 17 5 4 14 11 17 18 15
Links with schoolscollegesuniversities 18 13 16 13 9 17 12 13 11 18 15
Apprenticeships 12 11 19 9 13 9 10 10 11 12 17
National newspaper advertisements 16 11 4 6 23 29 10 9 15 10 15
Secondments 11 11 7 8 21 12 2 9 13 11 19
Links with other local organisations making redundancies 7 13 5 7 9 6 5 9 11 8
Alumni (previous employees) 5 5 6 7 2 1 7 2 6 11 3
Social networking sites (such as Facebook) 3 4 4 5 3 4 3 2 2 8 12
Local Employment Partnership (LEP) 6 3 1 4 2 5 1 2 3 4 9
Other 5 5 2 3 12 6 8 3 4 4 5
cipd
cou
k2011resou
rcing
and
talentp
lann
ing
survey
Base 604 (2011) 464 (2010)
new item introduced in 2011
Despite the popularity of social networking
sites such as Facebook they are not seen to be
particularly effective for attracting candidates
Professional networking sites such as LinkedIn are
more popular particularly in the private services
sector although there has only been a small
percentage increase in their reported effectiveness
compared with last year
2011 Recruitment partners A new question this year asked respondents if their
attitude to and relationships with recruitment
partners has changed over the past 12 months Just
over a third report things have not changed
(Table 12) A similar proportion report they have
reduced their use of recruitment partners and 6
that they have stopped using them altogether
with one in ten considering them an unaffordable
expense (one in five in the not-for-profit sector)
and a similar proportion an unnecessary expense
In contrast one in five (predominantly private
sector organisations) report they have formed
a closer business partnership with recruitment
partners over the past year and one in ten (again
predominantly private sector organisations) report
they consider them integral to attracting top talent
Selecting candidates There has been little change in the methods used
to select candidates over the past few years with
the exception of a drop in the use of general
ability tests compared with 2009 (Table 13)
Interviews remain the most common selection
method with competency-based interviews
being most popular overall Interviews following
the contents of CVsapplication forms are also
particularly popular in the private sector (70
compared with 41 in the public sector and 57
in the not-for-profit sector) whereas the public
and not-for-profit sectors favour structured (panel)
interviews (82 and 79 respectively compared
with 45 in the private sector)
Tests for specific job-related skills are more popular
in the public and not-for-profit sectors (61 and
62 respectively compared with 43 in the private
sector) whereas telephone interviews are more
popular in the private sector (52 compared with
12 in the public sector and 26 in the not-forshy
profit sector)
Table 12 Changes in attitudes to and relationships with recruitment partners over the past 12 months ()
Voluntary community
All Private Public and 2011 sector services not-for-profit
Not changed 36 34 40 39
Reduced use of recruitment partners 32 34 32 26
Formed a closer business partnership with them 19 23 8 12
Consider them an unnecessary expense 12 11 13 16
Consider them an unaffordable expense 11 10 11 22
Consider them integral to attracting top talent 9 11 2 4
Stopped using recruitment partners 6 5 8 5
Other 3 3 3 3 Base 604
RESO
UR
CIN
G A
ND
TALE
NT P
LAN
NIN
G 2
011
17
18
RESOURCING AND TALENT PLANNING
Table 13 Methods used to select applicants ()
2011 2010 2009 survey survey survey
Competency-based interviews 70 78 69
Interviews following contents of CVapplication form 63 64 68
Structured interviews (panel) 56 61 59
Tests for specific job-related skills 49 48 50
Telephone interviews 43 47 38
Literacy andor numeracy tests 38 43 39
Personalityaptitudepsychometric questionnaires 35 44 35
Assessment centres 35 42 35
Pre-application eliminationprogression question(s) 25 32 NA
General ability tests 23 27 44
Group exercises (for example role-playing) 21 30 26
Pre-interview references (academic or employment) 9 16 19
Video CVs 0 1 NA
Other 3 4 6
cipd
cou
k2011resou
rcing
and
talentp
lann
ing
survey
Base 605 (2011) 473 (2010) 754 (2009)
Strengths-based recruitment Two-fifths of organisations (40) report they use a
strengths-based approach to recruitment although
it is less commonly used in the public sector (26)19
In all sectors smaller organisations are most likely
to report they use a strengths-based approach
(60 of organisations with 1ndash49 employees use it
compared with 34 of organisations with 250ndash999
employees and 24 of organisations with more
than 5000 employees)20
Most of those who use a strengths-based approach
to recruitment are neutral about how easy it is to
administer in practice regardless of sector or size
Nearly a third (32) find it easy or very easy and
only one in ten (11) find it difficult
Over three-quarters of those who use a strengths-
based approach to recruitment believe it
brings benefits in terms of increased individual
performance (78) Two-thirds believe it improves
retention (67) and increases engagement (63)
Two-fifths (39) report it results in greater diversity
of skills in the workplace
Many organisations that use a strengths-based
approach to recruitment also use a strengths-based
approach for other people processes More than
half use it for performance management processes
(59) succession planning (55) and learning and
development (53) Two-fifths use it for talent
management (42) and a third use it for workforce
planning (32) Just under three in ten (29) also
use it for redeployment
Recruitment costs Last year we noted an increase in the proportion
of organisations that calculate their recruitment
costs (2010 65 2009 53 2008 51) This year
the proportion is back in line with previous years
(52) The increase last year may have been due
to sampling differences or a consequence of an
increased focus on costs during the recession that
has not continued
Four-fifths (79) of organisations that calculate
recruitment costs provided cost estimates per
hire There is considerable variance in the amount
organisations spend (at least partly due to our
2011 findings that organisations include different costs
in their calculations see Table 14) In general
the median figures (Table 15) are lower than last
year for both senior managerdirectors and other
employees
In order to explore the validity of estimates this
year we also asked respondents to indicate how
accurate their cost estimates were Half (51) of
estimates for costs of recruiting senior managers
directors were accurate to plus or minus 10 and
83 to plus or minus 20 Two-fifths of estimates
for other employees were accurate to plus or minus
10 and 74 to plus or minus 20 Table 16
shows the median figures for estimates that were
believed to be accurate to up to plus or minus 20
The figures indicate as we found last year that
organisations spend considerably more on senior
appointments than on other employees This
reflects the value attached to good leadership and
perhaps the additional challenges of attracting
the best candidates for senior positions This is
particularly the case in the private sector where
considerably more is spent on the recruitment of
senior managersdirectors than in the public or not-
for-profit sectors
Table 14 Criteria included in cost per hire calculations ()
Size ndash number of employees in UK
Advertising costs
Agencysearch costs
Employee referrals
Travel expenses
Relocation expenses
Fixed costs of resourcing team
Opportunity costs of hiring managers time
Other
Dont know Base 299
81
75
35
30
17
24
24
3
4
Table 15 Estimated total costs (advertising costs agency or search fees) per hire (pound)
Median 2011 Median 2010 (no of (no of
Occupational group respondents) Minimum Maximum respondents)
Senior managersdirectors 7000 (219) 251 55000 8333 (234)
Other employees 2000 (246) 150 32000 2930 (262) Number of respondents shown in brackets
Table 16 Median total costs (advertising costs agency or search fees) per hire for estimates accurate to plus or minus 20 (pound)
Voluntary
Median 2011 Manufacturing
and Private Public
community and not-for-
Occupational group production sector services profit
RESO
UR
CIN
G A
ND
TALE
NT P
LAN
NIN
G 2
011
Senior managersdirectors 7500 8000 9000 5000 3500
Other employees 2500 3400 2000 3000 1500 Base 150
19
cipd
cou
k2011resou
rcing
and
talentp
lann
ing
survey
20
RESOURCING AND TALENT PLANNING
2 RESOURCING AND TALENT mANAGEmENT IN TURBULENT TImES
In January 2010 the UK officially emerged from the recession however the economic environment remains uncertain for many organisations The environmental disasters in Japan the uprisings and wars in the Middle East rising oil prices and European debt highlight the volatility of global markets In the UK economic growth remains sluggish and there are concerns regarding the impact of the VAT increases high inflation and the austerity measures of the Coalition Government This section examines the impact of the economic environment on resourcing budgets strategies and activities in 2010 It looks at changes in views on the employment market and the implications for managing talent
The impact of the economic climate on resourcing Overall half of organisations report that the
economic climate has had a negative impact on
their organisationsrsquo resourcing budgets for 2011ndash12
(Table 17) This year however it is the public
sector that is most severely hit with four-fifths
(82) reporting their resourcing budgets will be
reduced (up from 59 last year) In contrast fewer
private and not-for-profit sector organisations
face reductions this year compared with last
although more are still reducing their budgets than
increasing them
Changes in resourcing and talent practices in
2011 compared with 2010 reflect a stronger
focus on costs and reductions in budgets (Figure
3) Two-thirds plan to develop more talent inshy
house (compared with one-third in 2010) and
more organisations plan to reduce reliance on
recruitment agencies and external consultants for
resourcing and development The proportion of
organisations planning to focus more on retaining
rather than recruiting talent has increased to 51
in 2011 from 28 in 2010
2011 Changes in recruitment practices are also
anticipated More organisations plan to make use
of new mediatechnology to recruit which may
be a cost-cutting strategy but can also improve
the efficiency and effectiveness of the recruitment
process On a positive note more organisations plan
to invest more time and effort in the quality of
candidates they hire and will be taking actions to
improve ways of identifying quality candidates
Public sector organisations are more than twice
as likely to be implementing a recruitment freeze
in 2011 (46 compared with 22 overall)
Nevertheless this is an improvement on 2010 when
58 of public sector organisations implemented a
recruitment freeze The situation is also somewhat
brighter for many private sector organisations
with 15 reporting they will be implementing a
recruitment freeze in 2011 compared with 26
in 2010 Nevertheless the economic recovery
remains slow for many with 29 of private
sector organisations and 66 of public sector
organisations reporting they will be reducing the
number of new recruits they hire in 2011 similar
proportions to 2010 Inevitably more public than
private sector organisations report they will be
reducing their headcount in 2011 and losing key
talent (33 compared with 9 in the private
sector) and redeploying people into new roles (66
compared with 37 in the private sector)
Table 17 Impact of the current economic climate on organisationsrsquo resourcing budgets ()
Private Public Voluntary community All sector services and not-for-profit
2011 2010 2011 2010 2011 2010 2011 2010
Reduced 49 53 41 51 82 59 51 61
Stayed about the same 36 37 39 40 14 36 40 34
Increased 8 7 11 4 1 5 4 5
Dont know 7 3 8 5 3 5 Base 615 (2011) 475 (2010)
RESO
UR
CIN
G A
ND
TALE
NT P
LAN
NIN
G 2
011
21
cipd
cou
k2011resou
rcing
and
talentp
lann
ing
survey
22
RESOURCING AND TALENT PLANNING
figure 3 Resourcing and talent practices implemented in 2011 and 2010 ( of respondents)
Developing more talent in-house
Continuing to recruit key talentniche areas
Focusing more on retaining rather than recruiting talent
Reducing reliance on recruitment agencies
Use of new mediatechnology to recruit
Investing more time and effort in the quality of candidates we hire
Redeploying people into new roles
Reducing the number of new recruits we hire
Taking actions to improve ways of identifying quality candidates
Increasing the number of interimcontract staff recruited
Reducing our use of external consultants for resourcing and development
Increased recruitment of apprenticesinterns
Implementing a recruitment freeze
Reducing our headcount but preserving key talent
Recruiting talent discarded by competitors
Reducing our headcount and losing key talent
Offering sabbaticals career breaks additional holidays
Reducing employees working hours to avoid making people redundant
8Reducing graduate recruitment 8
6Suspending graduate recruitment 7
36
28
36
28
26
30
35 35
35 15
29 23
28 19
24 12
22 30
22 16
18 11
13 12 12
10
12 10
66
59 46
51
47
46
45
44
0 10 20 30 40 50 60 70 80 Percentage of respondents
2011 2010
Base 582
RESO
UR
CIN
G A
ND
TALE
NT P
LAN
NIN
G 2
011
23
2011 Views on the employment market In little change to last year three-quarters of
organisations report they have noticed an increase
in the number of unsuitable applicants as they have
fewer roles to fill (Figure 4) Far fewer (34) report
that there are too many suitable candidates to
choose from and despite high unemployment over
the past two years more than half (52) believe that
competition for talent is even greater as the pool of
available talent to hire has fallen sharply (2010 41
2009 20) For many organisations there appears a
clear mismatch between the skills they require and
those available in the labour market
Competition for talent appears to be particularly
keen in the private sector Two-thirds (64) of
manufacturing and production organisations
and 55 of private services organisations agree
that competition for talent is even greater now
compared with 39 of the public sector and 34
of not-for-profits21 In contrast the public sector
and not-for-profits are more likely to agree they
have too many suitable candidates to choose
from (61 and 47 respectively compared with
23 of manufacturing and production and 27
of private sector services)22
Three-fifths (62) of respondents agree that the
demand for temporary and contract workers will
increase as employers will be reluctant to take
on permanent staff during uncertain times while
44 agree that part-time workers will become
more appealing to employers who are looking to
cut costs
figure 4 Views on the employment market ( agreeing or strongly agreeing)
With fewer roles to fill we have noticed an increase in the number
of unsuitable applicants
The demand for temporary and contract workers will increase as employers will be reluctant to
take on permanent staff during uncertain times
Employers will use the economic downturn as an opportunity to get rid of poor performers
and bring about culture change
Competition for talent is even greater now as the pool of available talent to hire has
fallen sharply
Part-time workers will become more appealing to employers who are looking to cut costs
Employers are acting too hastily in making people redundant and as a result they will lose too
many employees with valuable knowledge and skills
With fewer roles to fill there are now too many suitable candidates to choose between
The abolition of the Default Retirement Age will mean we recruit fewer people
Employers will look to make older workers over the age of 65 redundant before their younger workers
73 76
54
62 66 66
55 63
72
52 41
20
44 45
52
44 48
53
34 32
23
19 22
27
0 10 20 30 40 50 60 70 80 Percentage of respondents
2011 2010 2009
Base 607 (2011) 475 (2010) 746 (2009)
item added 20102011
24
RESOURCING AND TALENT PLANNING
More than half of respondents (55) across
all sectors believe that employers will use the
economic downturn as an opportunity to get rid of
poor performers and bring about culture change
While high this shows a downward trend on the
past two years (2010 63 2009 72 agree or
strongly agree) perhaps reflecting a slowing in
the number of redundancies Similarly there is
a gradual downward trend in the proportion of
respondents who express concern that employers
are acting too hastily in making people redundant
and as a result they will lose too many employees
with valuable knowledge and skills or that
employers will look to make older workers over the
age of 65 redundant before their younger workers
Nearly a quarter (23) of respondents believe
that the abolition of the Default Retirement Age
will mean they recruit fewer people (48 in the
public sector)23
Implications for talent management The value of effective talent management has
not been lost in the recent attention on reducing
costs Two-fifths (41) of organisations report
that the current economic situation has led
to an increased focus on talent management
(43 in 2010) and only 4 that it has led to a
decreased focus (7 in 2010) with no significant
differences across sectors Unsurprisingly however
the public sector are about twice as likely this
year to report they have reduced their overall
talent management spend due to the downturn
compared with other sectors (Table 18)24
The proportion of organisations that report
the economic downturn has had an impact on
approaches to reward across the business has
slightly reduced compared with last year (54
compared with 61 in 2010) As last year it
appears that organisations across all sectors
are being more selective in who they reward A
smaller proportion of organisations report their
approach to reward for individuals identified as
talent has been affected by the downturn (42)
than report their approach to reward across the
business has been affected (54)
Table 18 Has your overall talent management spend been reduced due to the economic downturn ()
cipd
cou
k2011resou
rcing
and
talentp
lann
ing
survey
Voluntary All community and All
2011 Private sector Public sector not-for-profit 2010
Yes 18 17 32 13 23
No 38 43 16 32 41
NA (no talent management spend) 44 40 52 55 36
Base 617 (2011) 471 (2010)
RESO
UR
CIN
G A
ND
TALE
NT P
LAN
NIN
G 2
011
25
2011
Case study Innovative recruitment and cost saving in the Association of Greater Manchester Authorities
The Association of Greater Manchester Authorities (AGMA) represents the ten local authorities in
Greater Manchester and works in partnership with a wider group of associate councils and public
sector organisations AGMA chief executives and council leaders work together on a range of key
strategic and policy issues which impact on Greater Manchester including resourcing strategies
and recruitment and retention issues
The AGMA initiative in cost reduction in the area of resourcing has been described as lsquoa truly
pioneering example of collaboration between a number of local authoritiesrsquo and is already
delivering against a range of objectives
The initial aim was to make a significant saving on the pound5ndash6 million annual cost of external
media advertising reported in 2008ndash09 and to create a more efficient and effective recruitment
system A shared portal was commissioned to offer a front-end website (wwwyourcounciljobs
couk) with a lsquoback-officersquo e-recruitment system which would give a standardised shared-service
approach for job applicants across councils Some of the benefits for applicants include the ability
to go to one place to register their interest to be able to look in specific categories for jobs
of particular relevance to them to be able to amend an existing application form in order to
apply for a further post and to receive email alerts when new jobs relevant to their interests are
posted In addition communications to job-seekers are now standardised for every council
This approach has seen real benefits across each of the local authorities workflows are now
standardised as every HR team runs identical systems and there is consistency in reporting within
all councils enabling them to benchmark their processes more clearly The councils use this
benchmarking data to make additional improvements and efficiencies
Jayne Whitehead AGMA Category Procurement Manager has project-managed the initiative
with managers represented from each participating authority and describes the process as one
of lsquotrue collaborationrsquo with lsquo100 commitmentrsquo from all the councils involved The benefits
are clear annual media costs are dramatically reduced to approximately pound250000 across ten
partner organisations and there has been a reduction in time-to-hire of 13 days This has had
the knock-on effect of reducing expenditure on agency staff The average cost of a recruitment
advertisement per role was previously pound97400 it is now pound15200 There have also been benefits
outside the original intention including doubling the number of online applications for council
posts with administrative cost savings in HR of approximately pound250000 across the consortium
More than 61000 registered users are now on the system and the councils are successfully filling
their own talent pools of prospective job-seekers Overall the project team is now celebrating a
pound17 million reduction in recruitment expenditure over the past 12 months
(continued)
cipd
cou
k2011resou
rcing
and
talentp
lann
ing
survey
26
RESOURCING AND TALENT PLANNING
There were some challenges in the implementation of this new way of working All the councils
had to be convinced about the benefits of the changes With the implementation of a new IT
system having its own set of challenges the project has taken 12 months to introduce longer
than first anticipated Implementing the changes during a period of radical restructuring in all
councils also proved particularly challenging However Jayne describes how both the need to
make efficiencies and feedback from job-seekers meant that lsquowe had to find a different way of
doing thingsrsquo Jayne also recognises how the neutrality of her own role (each council pays a tenth
of her salary) has been essential in ensuring that the project has been fair to all its participants
offering a centralised shared resource to manage the project
The project is now set to develop yet further with the aim of becoming entirely self-funding
within the next year by accepting advertising from other organisations Two new websites are
planned for recruitment into schools and social care jobs bringing even less reliance on media
and agencies AGMA will also be further building its own talent pool
Jayne describes the initiative as lsquoa true example of what you can do if you collaborate across
authoritiesrsquo Not only the separate councils but also diverse teams and functions including HR IT
procurement communications and marketing have worked together to deliver this innovative
and inspiring project
Information provided by Jayne Whitehead AGMA Category Procurement Manager
2011
3 DIVERSITy
This section examines organisationsrsquo approaches to diversity including the use of formal diversity strategies and the methods used to address diversity issues
Just over half of organisations report they have with just under two-thirds of not-for-profit
a formal diversity strategy showing little change organisations and just two-fifths of private sector
over the past four years (2011 52 2010 55 companies (Table 19)25 Diversity strategies are also
2009 60 2008 55) Consistent with previous more common in larger organisations (regardless
yearsrsquo findings most public sector organisations of sector)26
(90) have a formal diversity strategy compared
Table 19 Does your organisation have a formal diversity strategy ()
Yes No Dont know
All 52 41 7
Sector
Private sector 41 50 8
Public services 90 9 1
Voluntary community and not-for-profit 63 33 4
Number of UK employees
Fewer than 50 45 50 5
50ndash249 43 51 6
250ndash999 48 44 7
1000ndash4999 65 31 4
More than 5000 80 9 11 Base 613
RESO
UR
CIN
G A
ND
TALE
NT P
LAN
NIN
G 2
011
27
28
RESOURCING AND TALENT PLANNING
As was the case last year over three-quarters
of organisations with a formal diversity policy
attempt to address diversity issues through
monitoring recruitment andor staffing
information to obtain data on gender ethnicity
disability age and so on (Table 20) Less than
three-fifths train interviewers to understand what
diversity is about and the impact of stereotypes
Other diversity-focused initiatives are even
less common moreover the figures indicate a
reduction in the use of several methods compared
with previous years The pressures of the recession
may have led to a reduced focus on diversity
Given the links between diversity in the workforce
and productivity organisations that fail to give
this issue the attention it requires may find
themselves at a disadvantage in the future
Traditionally the public sector has tended to lead
the way in terms of diversity practices Again this
year they are significantly more likely to address
diversity issues through monitoring recruitment
andor staffing information through providing
recruitment documents in other formats through
advertising vacancies in different sources to
attract under-represented groups and through
setting recruitment targets to correct a workforce
imbalance Nevertheless they are less likely than
other sectors to actively try to attract talent of all
ages (Table 20) Moreover our figures indicate that
the reduction in the use of several diversity methods
compared with previous years is particularly
pronounced in the public sector The change of
government and budget reduction measures have
led to significant change programmes in many
public sector organisations which may have resulted
in a reduced focus on diversity issues
Table 20 Methods used to address diversity issues in organisations ( with formal diversity strategy)
Voluntary community
Private Public and not-sector services for-profit
2011 2010 2009 2008 2011 2011 2011 survey survey survey survey (2010) (2010) (2010)
Monitoring recruitment andor staffing information to obtain data on gender 78 79 84 83 70 (71) 88 (96) 88 (76) ethnicity disability age any other categories
cipd
cou
k2011resou
rcing
and
talentp
lann
ing
survey
Training interviewers to understand what diversity is about and the impact of stereotypes
57 68 68 60 53 (66) 64 (73) 57 (72)
Actively trying to attract talent of all ages 45 53 32 43
Operating policies that go beyond basic legislative requirements on age gender race disability sexual orientation religion and belief
39 49 52 48 34 (44) 47 (63) 47 (40)
Providing recruitment documents in other 39 41 37 31 24 (22) 64 (77) 47 (52)formats (online large-print audio and so on)
Checking that any tests used are valid reliable and culture-free and were tested on diverse norm groups
36 42 47 34 39 (44) 35 (45) 27 (16)
Advertising vacancies in different sources to 31 37 51 48 22 (30) 44 (53) 41 (32)attract under-represented groups
Using specific imageswords in your recruitment advertising to appeal to a wider audience 29 38 42 42 25 (30) 36 (52) 33 (40)
Making attempts to employ the long-term 19 19 13 29unemployed
Setting recruitment targets to correct a workforce imbalance 9 15 14 12 4 (8) 18 (31) 8 (16)
Base 312 (2011) 253 (2010) 419 (2009) new item added in 2011
RESO
UR
CIN
G A
ND
TALE
NT P
LAN
NIN
G 2
011
29
2011
4 mANAGING LABOUR TURNOVER
Figures from the Office for National Statistics show that UK unemployment rose by 27000 in the three months to the end of January 2011 to 253 million the highest since 1994 When unemployment is high the number of employees leaving organisations voluntarily is expected to decrease Here we examine whether this is happening and how organisations are tackling the issue of employee retention
Among organisations that are able to supply
turnover data the median labour turnover rate
has decreased over the past few years (Table 21)
The median figure however hides differences
across organisations Slightly more organisations
report their turnover has increased in 2010
compared with 2009 (38) than has decreased
(33) while for nearly a third (29) it remained
the same Smaller organisations are more likely
to report their labour turnover has increased and
larger organisations that it has decreased27
As in previous years the majority of turnover (53)
is still attributed to employees leaving voluntarily
(Table 22) As the economy has improved the
median proportion of turnover due to redundancies
has reduced Only 12 of organisations that
provided reasons for leaving made more than ten
redundancies in the previous year compared with
33 in 2010 26 in 2009 and 22 in 2008 A third
(34) of organisations that made redundancies
offered career transition services
While median turnover rates have reduced
across all sectors Table 23 shows that the rate
of voluntary leavers has increased slightly in
the private sector compared with last year but
decreased in the voluntary and public services
sector This reflects improvements in the economic
outlook for the private sector and the widespread
cuts in the public sector which also have a direct
impact on many not-for-profit organisations that
provide services for the public sector
Cost of labour turnover While just over half of organisations calculate
their recruitment costs only 13 calculate the
cost of their labour turnover (2010 14) The
majority of organisations report they do not
calculate these costs (79) while 7 donrsquot know
if they are calculated or not
Nearly half (46) of those who calculate their
turnover costs want to maintain their current
turnover rate while one-fifth (38) want to
reduce turnover during 2011 and 15 want to
increase it
Retaining employees The steps organisations take to retain employees
in their workforce can have a significant impact
on organisational efficiency and success through
30
RESOURCING AND TALENT PLANNING
Table 21 Median rate of labour turnover ()
2011 2010 survey 2009 survey 2008 survey 2007 survey 2006 survey
125 135 157 173 181 183
Base 175 (2011)
Table 22 Median labour turnover rates by reason for leaving ()
2011 survey 2010 survey 2009 survey
Voluntary redundancies 0 0 0
Compulsory redundancies 0 10 05
Dismissedleft involuntarily (including death in service)
07 09 14
Fixed-short-term contracts 0 0 07
Retired 0 04 07
Left voluntarily 66 84 90
Base 154 (2011)
Table 23 Median labour turnover rates by industry sector ()
cipd
cou
k2011resou
rcing
and
talentp
lann
ing
survey
Sector All leavers Voluntary leavers
2011 survey
2010 survey
2009 survey
2011 survey
2010 survey
2009 survey
Manufacturing and production 93 (38) 124 (44) 153 (80) 37 (35) 27 (42) 77 (75)
Private sector services 138 (96) 146 (77) 168 (150) 87 (82) 74 (71) 104 (129)
Public services 85 (28) 86 (19) 126 (52) 34 (10) 58 (15) 76 (45)
Voluntary community not-for-profit 131 (11) 159 (15) 164 (38) 70 (24) 102 (18) 110 (35) Number of respondents shown in brackets
decreasing employee turnover loss of talent and
recruitment and training costs while having a
positive impact on motivation job satisfaction and
the employer brand
Only two-fifths (42) of organisations
experienced no difficulties in retaining staff
during 2010 This figure is similar to last year
(45) but higher than the findings for 2008
when 31 reported they had no retention
difficulties These findings reflect the increased
caution of employees regarding leaving their
jobs during times of economic uncertainty and
high unemployment Supporting this are our
findings that the public (49) and not-for-profit
sectors (49) are more likely to report they had
no difficulties in retaining staff during 2010
compared with the private sector (38)
As in previous years organisations most
commonly have difficulty retaining managers
and professionalsspecialists (Table 24) The
manufacturing and production sector are most
likely to report difficulties retaining technical
2011 staff and the private services sector that they have
most difficulty retaining services staff This may
reflect the higher demand for these categories of
employees in these sectors
While most organisations have taken one or more
steps to address staff retention nearly one in four
organisations (23) report that no specific retention
initiatives were undertaken This is a similar
proportion to last year although substantially higher
than in previous years when retention difficulties
were more common due to a tighter labour market
(Table 25) Public sector organisations are twice
as likely not to have taken any steps to address
retention as those in the private or not for-profit
sectors (39 compared with 20 of private sector
and 16 of not-for-profits)28
The most common methods used to address
retention in 2010 used by nearly two-fifths of
organisations are to improve line managersrsquo
people skills improve learning and development
opportunities and improve the induction process
Improving line managersrsquo people skills and
learning and development opportunities are also
most commonly rated among the top three most
effective retention methods The effectiveness of
improving induction processes is more varied with
22 rating it among the top three most effective
methods and 12 among the top three least
effective methods Views are also mixed regarding
the effectiveness of improved pay It is likely that
employees are motivated by different factors
Employers need to provide a healthy working
environment where employees are treated with
respect and make efforts to match their retention
initiatives with what staff want
Table 24 Retention difficulties by occupational category ()
Voluntary community
Private and All Manufacturing sector Public not-for- All
2011 and production services services profit 2010
Managers and professionals specialists 28 26 29 25 29 27
Technical 21 37 19 17 13 20
Services (customer personal protective and sales) 13 7 21 4 4 12
Administrative secretarial 9 5 8 15 13 7
Senior managersdirectors 7 5 8 10 6 9
Manualcraft workers 6 11 6 3 4 4 Base 601 (2011) 451 (2010)
RESO
UR
CIN
G A
ND
TALE
NT P
LAN
NIN
G 2
011
31
32
RESOURCING AND TALENT PLANNING
Table 25 Steps taken specifically to address staff retention ()
Used in Least Most Used in Used in Used in 2010 effective effective 2009 2008 2007
Improved line managers people skills 39 7 31 42 39 37
Increased learning and development opportunities 38 5 34 35 47 46
Improved induction process 38 12 22 31 45 45
Improved employee involvement 34 8 24 32 35 29
Improved selection techniques 30 7 25 31 42 46
Improved pay 27 11 23 22 42 53
Offered coachingmentoring buddy systems 24 8 14 20 24 22
Improved benefits 21 8 14 19 32 36
Better promotion to employees of the employer brand 18 10 5 15 21 16
Created clearer career paths 18 6 2 21 18 17
Revised the way staff are rewarded so their efforts are 18 4 13 14 19 19 better recognised
Made changes to improve workndash life balance 17 5 13 19 31 30
Improved physical working conditions 15 8 7 13 19 12
Redesigned jobs to make them more satisfying 11 4 8 13 18 14
Increased our use of countershyoffers 4 4 14
No specific initiatives undertaken 23 3 1 27 13 9 Base 559 (2011 survey) 431 (2010 survey) 695 (2009 survey) 710 (2008 survey)
new item added in 2011
cipd
cou
k2011resou
rcing
and
talentp
lann
ing
survey
RESO
UR
CIN
G A
ND
TALE
NT P
LAN
NIN
G 2
011
33
2011
CONCLUSIONS
Looking forward In January 2010 the UK officially emerged from
the longest recession since the 1930s Economic
growth however remains sluggish and the public
sector has embarked on a four-year programme of
the biggest government spending cuts in decades
to address the fiscal deficit
In the labour market unemployment remained
high throughout 2010 Figures from the Office
for National Statistics (ONS) show that UK
unemployment rose by 27000 in the three months
to the end of January 2011 to 253 million the
highest since 1994 While recent months have seen
signs of improvement there are concerns that the
slow growth in the private sector will be unable
to fully compensate for the increasing job losses in
the public sector that will result from the budget
cuts This is supported by the findings from the
CIPDrsquos spring 2011 Labour Market Outlook which
shows the impact on the overall labour market of a
slight rise in private sector recruitment is still being
cancelled out by large-scale public sector job losses
The findings of the CIPDrsquos 2011 Resourcing and
Talent Planning survey reflect the challenges
of the economic environment Organisations
generally have increased their focus on costs On
average organisations spent less on filling each
vacancy and a fifth have reduced their resourcing
budgets and talent management spend In the
public sector the focus on costs and budget
reductions was particularly apparent
The end of the recession has meant fewer
redundancies in 2010 Nevertheless over a third
of public sector and one-fifth of private sector
organisations reduced their headcount The
number of vacancies on offer by organisations
remained as low as in 2009 overall and continued
to decrease in very large organisations particularly
in the public sector
Looking forward private sector growth is expected
to remain slow and the full impact of public
sector budget cuts is still to come Resourcing and
talent management budgets will be further hit
in 2011ndash12 and many public sector organisations
will implement recruitment freezes and reduce
graduate intake and recruitment generally
Resourcing and talent practices are changing to
reflect the stronger focus on costs and reductions
in budgets Particularly in the public sector but
also in the private sector trends indicate a greater
focus on developing talent in-house retaining
rather than recruiting talent and reducing reliance
on recruitment agencies and external consultants
for resourcing and development
Our findings do not present a positive outlook
for the vast number of unemployed A substantial
proportion of organisations reports that the
already low number of vacancies available to them
is likely to be further affected by the abolition
of the Default Retirement Age Yet despite the
high unemployment rate most organisations
reported difficulties in filling vacancies mostly due
to skill shortages We have also seen an increase
in the proportion of organisations reporting
that competition for talent is even greater as the
pool of available talent to hire has fallen sharply
For many organisations there appears a clear
mismatch between the skills they require and
those available in the labour market Some are
concerned this will be exacerbated by the increase
in university tuition fees Some are responding
cipd
cou
k2011resou
rcing
and
talentp
lann
ing
survey
34
RESOURCING AND TALENT PLANNING
by increasing apprenticeship schemes internships
and sponsoring students through university Such
schemes may be aided by the Governmentrsquos recently
announced pound60 million commitment to help boost
youth employment and provide extra support for
apprenticeships and changes to vocational training
and education How far this will go towards meeting
organisationsrsquo skill requirements remains to be seen
On a positive note our findings indicate that talent
management is viewed as more not less important
in difficult times although with reduced budgets
organisations will have to be innovative with
their approach and strategies In order to survive
organisations will need to make certain they focus
beyond the cost-cutting required in the current
environment to ensuring their talent strategies are
aligned to long-term business success
The CIPDrsquos Shaping the Future and Next Generation
HR flagship projects have both explored the
important issues of sustainability Shaping the Future
in particular warns against the dangers of lsquotalent
tunnel visionrsquo taking a short-sighted view on talent
strategies which are solely focused on the needs of
the here and now
Often organisations pay too little attention to
identifying and developing the capabilities that
individuals will need in the long term This implies a
leadershiptalent management capability gap with
too much focus on the operational needs of today
rather than the organisational imperatives
of tomorrow
Itrsquos never too late to start equipping your people
with the skills and knowledge they need to meet
both present and future challenges So what practical
recommendations can we make for resourcing and
talent professionals drawn from our Shaping the
Future evidence
Audit your organisationrsquos current skills and future capabilities If you havenrsquot done so already conduct a thorough
inventory of your organisationrsquos current skills and map
those against the capabilities you are likely to need
in the future Hold forecasting sessions which look at
macro and micro trends how these will impact your
way of working and the changes that will be required
for future success
Build your talent and succession pipeline You also need to be proactively building up your
talent pipelines (horizontally and vertically) so that
you are developing people with future-fit skills and
capabilities A silver lining from the current economic
climate is that more organisations are focusing on
developing internal talent and fully utilising the
skills of their existing workforce Fresh talent is
still important but recruitment strategies should
complement internal pipelines
Maintain a continuous focus on capability-building Capability-building should be part of a continuous
process embedded into policies and practices Across
our case study organisations managers talked about the
need to embed development and skills training as part
of business as usual rather than as a one-off activity
Develop a creative approach to skills and capability development Even when budgets are tight it is essential that
staff get the development they need to ensure they
have the capabilities for their current job role as well
as starting to build those that the organisation will
need in the future Our case study organisations were
focusing strongly on knowledge-sharing enabling
people to learn from others across the organisation
Many of you are already considering alternative
solutions for specialist skill development such as
apprenticeships internal management schemes
summer placements and internships It is also
important to work with universities to ensure that
graduates are developing skills and knowledge which
will help them to succeed in the workplace
RESO
UR
CIN
G A
ND
TALE
NT P
LAN
NIN
G 2
011
35
2011
BACkGROUND TO ThE SURVEy
This survey was conducted in March and April 2011 It was sent to a sample of UK-based HR professionals in the public private and voluntary sectors In total 626 people responded to the survey
This is the fifteenth annual CIPD Resourcing
and Talent Planning survey (formerly known as
the CIPDrsquos Recruitment Retention and Turnover
survey) The survey examines organisationsrsquo
resourcing and talent planning strategies and
practices and the key challenges and issues
they face The survey consists of 45 questions
completed through an online self-completion
questionnaire
The majority of questions remain the same as
previous years to provide useful benchmark
data on topics including recruitment practices
difficulties and costs selection methods diversity
strategies the impact of the economic climate on
resourcing and talent planning practices labour
turnover and retention strategies New question
areas this year examine the employment of
younger workers the length of the recruitment
process the nature of job vacancies relationships
with recruitment partners and the use of
strengths-based approaches to recruitment
A small number of respondents took part in follow-
up telephone interviews to produce mini case
studies on a selection of topics These are presented
in the coloured boxes throughout the report
Sample profile Respondents predominantly work for private
sector organisations with professional services
being particularly well represented but other
sectors are represented in similar proportions to
last year (Table A1)
36
RESOURCING AND TALENT PLANNING
Table A1 Breakdown of respondent organisations by industrial sector Number of respondents
Manufacturing and production 113 19
Agriculture and forestry 1 0
Chemicals oils and pharmaceuticals 9 1
Construction 8 1
Electricity gas and water 4 1
Engineering electronics and metals 38 6
Food drink and tobacco 18 3
General manufacturing 6 1
Mining and quarrying 4 1
Paper and printing 6 1
Textiles 2 0
Other manufacturingproduction 17 3
Private sector services 319 52
Professional services (accountancy advertising consultancy legal etc) 78 13
Finance insurance and real estate 33 5
Hotels catering and leisure 26 4
IT services 26 4
Call centres 3 0
Media (broadcasting and publishing etc) 7 1
Retail and wholesale 40 7
Transport distribution and storage 23 4
Communications 6 1
Other private services 77 13
Public services 100 16
Central government 14 2
Education 12 2
Health 23 4
Local government 22 4
Other public services 29 5
Non-profit organisations 78 13
Care services 9 1
Charity services 32 5
Housing association 17 3
Other voluntary 20 3 Base 610
cipd
cou
k2011resou
rcing
and
talentp
lann
ing
survey
2011 Most respondents work in small to medium-sized
organisations in terms of the number of UK-
based employees but larger organisations are
also represented in similar proportions to last year
(Table A2)
Respondents reported on organisations based
across the UK Three in ten responded for the
whole of the UK while others responded for a
particular regioncountry (see Table A3)
Table A2 Breakdown of sample by organisation size ndash permanent employees in the UK
Fewer than 10 5
10ndash49 12
50ndash249 33
250ndash999 25
1000ndash4999 12
More than 5000 13 Base 610
Table A3 Main region covered by the reply
East Anglia 5
East Midlands 3
West Midlands 5
North-east of England 3
North-west of England 7
South-west of England 6
Yorkshire and Humberside 5
South-east of England (excluding London)
12
London 12
Scotland 6
Wales 3
Northern Ireland 3
Ireland 0
Whole of UK 29 Base 602
Labour turnover A total of 175 survey respondents were able to
supply all the information necessary for us to
calculate labour turnover on a whole-organisation
basis
This report uses the standard lsquocrude wastagersquo
method to calculate the rate of turnover This
method is calculated as follows
Labour turnover =
Number of leavers in a set period
______________________________________ x 100
Average number employed in the same period
(Leavers include those leaving the organisation
by way of voluntary or involuntary severance
redundancies or retirements but does not include
internal transfers)
Readers should be aware that this method has
some shortcomings For example it takes no
account of the characteristics of the workforce or
the length of service of the leaver
Note on statistics and figures used Some respondents did not answer all questions so
where percentages are reported in tables or figures
the respondent lsquobasersquo for that question is given
lsquoAveragersquo in the report is used to refer to the
statistical mean where the data is normally
distributed However the median is used in cases
where the distribution is significantly skewed
When the median is used it is noted
With the exception of labour turnover rates all
figures in tables have been rounded to the nearest
percentage point Due to rounding percentages
may not always total 100
Chi-square (χ2) tests are used to examine whether
differences between groups such as industrial
sectors are significant or likely to be due to
chance Spearmanrsquos Rho correlation (Rho) is used
to examine relationships between variables We
report on statistics at the generally accepted level
of significance plt005
RESO
UR
CIN
G A
ND
TALE
NT P
LAN
NIN
G 2
011
37
38
RESOURCING AND TALENT PLANNING
fURThER SOURCES Of INfORmATION
We produce a range of free factsheets surveys
guides and research reports which are available on
the CIPD website at cipdcoukhrresources
Read our factsheets on Employer Brand
Employee Turnover and Retention
Induction
Outlook series Our quarterly reports Labour Market Outlook
and Employee Outlook look at the employer and
employee perspectives on the labour market and
on workplace issues and trends while HR Outlook
explores priorities and emerging trends for the HR
profession and function
View these reports at
cipdcoukresearchoutlook-series
Talent management Two reports look at talent issues in a recession
difficult economic climate
The War on Talent Talent management under
threat in uncertain times (2009)
Fighting Back through Talent Innovation (2010)
Opening up Talent for Business Success (2010)
looks at the importance of integrating talent
management and diversity
The Talent Perspective What does it feel like to
be talent-managed (2010) looks at the employee
view of talent management
Workforce planning Our guide Workforce Planning Right people right
time right skills (2010) gives advice on developing
workforce planning processes
Diversity Two survey reports and a guide provide practical
advice and information on trends
Diversity in Business A focus for progress (2007)
Managing an Ageing Workforce How employers
are adapting to an older labour market (2010)
Managing Age New edition 2011
Two further reports are available to order from
cipdcoukbookstore
Managing Diversity in Practice Supporting
business goals (2007)
Managing Diversity and the Business Case (2008)
Sign up to receive our e-newsletter at
cipdcoukcipdupdate
cipd
cou
k2011resou
rcing
and
talentp
lann
ing
survey
RESO
UR
CIN
G A
ND
TALE
NT P
LAN
NIN
G 2
011
39
2011
ACkNOwLEDGEmENTS
The CIPD is very grateful to those organisations and
individuals who gave their time to take part in this
research They include
bull Annette Sinclair Senior Researcher at Roffey
Park for analysing the findings and writing this
comprehensive report
bull Members of the Recruitment Forum Steering
Committee for their input into the survey
design and assistance in piloting the
questionnaire
bull Hays for their support and commitment at
every stage of the research
bull All those who shared examples of their
organisationrsquos practices
We hope that you find the research useful when
considering your own recruitment and retention
practices Please contact us if you have any
questions or ideas based on our findings
(researchcipdcouk)
RESOURCING AND TALENT PLANNING
fOOTNOTES 1 Chi Square = 573 df = 5 p lt 0001 n = 604 2 Rho = 073 p lt 0001 n = 577 3 Rho = 045 p lt 0001 n = 533 4 F = 250 df = 2 p lt 0001 n = 533 5 Chi Square = 180 df = 6 p lt 001 n = 535 6 Chi Square = 71 df = 2 p lt 005 n = 603 7 Chi Square = 230 df = 6 p lt 001 n = 600 8 Chi Square = 91 df = 3 p lt 005 n = 598 9 Chi Square = 129 df = 4 p lt 005 n = 610
10 Rho = 034 p lt 0001 n = 609 11 Chi square = 217 df = 3 p lt 0001 n = 609 12 Chi Square = 609 df = 8 p lt 0001 n = 607 13 Chi Square = 208 df = 3 p lt 0001 n = 560 14 Size of organisation and developing online
careers site Rho = 025 p lt 0001 n = 599 Size of
organisation and employee surveys Rho = 019
p lt 0001 n = 599 15 Chi Square = 167 df = 2 p lt 0001 n = 599
16 Working with charities Chi Square = 80 df = 2 p
lt 005 n = 599 corporate sponsorship Chi Square
= 116 df = 2 p lt 001 n = 599 17 Chi Square = 76 df = 2 p lt 005 n = 599 18 Table 11 also shows that this method is deemed
most effective by public sector organisations but
this effect is due to a greater proportion of
large public sector organisations in our
sample whereas private sector organisations are
more evenly distributed in size 19 Chi square = 109 df = 2 p lt 001 n = 610 20 Chi Square = 279 df = 4 p lt 0001 n = 610 21 Chi Square = 259 df = 6 p lt 0001 n = 598 22 Chi Square = 515 df = 6 p lt 0001 n = 597 22 Chi Square = 177 df = 8 p lt 005 n = 600 22 Chi Square = 339 df = 4 p lt 0001 n = 610 22 Chi Square = 820 df = 4 p lt 0001 n = 610 22 Chi Square = 522 df = 8 p lt 0001 n = 610 22 Rho = 024 p lt 0001 n = 195 22 Chi Square = 166 df = 2 p lt 0001 n = 544
cipd
cou
k2011resou
rcing
and
talentp
lann
ing
survey
40
2011
OTHER TITLES IN THIS SERIES
ABSENCE MANAGEMENT The annual Absence Management survey has been running for eleven years providing useful benchmarking data on absence levels the cost and causes of absence and how organisations are managing absence The latest report is brought to you in partnership with Simplyhealth
EMPLOYEE ATTITUDES TO PAY The annual Employee Attitudes to Pay survey investigates employee attitudes and expectations towards pay and bonuses Now in its third year this survey is carried out by YouGov and focuses on employees in the UK
REWARD MANAGEMENT The annual Reward Management survey has been running for ten years and provides practical insights into current trends practices and issues affecting reward management in the UK It examines strategic reward base and variable pay bonuses incentives pensions reward measurement and total reward issues This report was brought to you in partnership with Benefex
LEARNING AND TALENT DEvELOPMENT The annual Learning and Talent Development survey is now in its thirteenth year and provides valuable commentary on current and future issues and trends It explores employer support for learning talent management employee skills managing and evaluating coaching and training spend
Issu
ed J
une
2011
Ref
eren
ce 5
552
copy C
hart
ered
Inst
itute
of
Pers
onne
l and
Dev
elop
men
t 20
11
Chartered Institute of Personnel and Development
151 The Broadway London SW19 1JQ
Tel 020 8612 6200 Fax 020 8612 6201
Email cipdcipdcouk Website cipdcouk
Incorporated by Royal Charter Registered charity no1079797

cipd
cou
k2011resou
rcing
and
talentp
lann
ing
survey
12
RESOURCING AND TALENT PLANNING
The majority of respondents from organisations
without a recruitment programme for graduates
report that their organisation has never had such
a programme or not had one for some time (97)
Even in the cash-strapped public sector only 3
report they have closed their graduate recruitment
programme in the last 12 months
Nearly a third (31) of organisations who have a
graduate recruitment programme have increased
their intake over the past year while a quarter
have reduced their intake (24) This shows an
improvement on the previous year at the height of
the recession when 43 had reduced their intake
The impact of the budget cuts in the public sector
are however clearly apparent as more than twice
as many organisations in this sector (50 compared
with 20 in the private and not-for-profit sectors)
have reduced their graduate intake
Length of recruitment process One in three (31) organisations report that the
length of their recruitment process has led to the
loss of potential recruits This issue appears to be
exacerbated by organisation size Nearly half of
organisations with more than 5000 employees
report that the length of their recruitment process
has led to the loss of potential recruits compared
with 38 of those in organisations of 250ndash999
employees and just 15 of organisations with
fewer than 50 employees12 There are no significant
sector differences
Recruitment difficulties Three-quarters of organisations with vacancies
report difficulties in filling at least some over the
past few months (75) This is an increase on last
year (2010 68) and may reflect the decrease in
unemployment in the first few months of 2011
It is less however than in previous years perhaps
because organisations were attempting to fill fewer
vacancies (2009 81 2008 86)
figure 2 Organisations operating a structured graduate recruitment programme by size ()
Number of UK employees
39
42
9Fewer than 50
17
1650ndash249
21
29 250ndash999
1000ndash4999 47
61 More than 5000
62
10 40 50 60 70 80
2011
0 3020 Percentage
2010
Base 609 (2011) 466 (2010)
2011 The private sector particularly manufacturing and
production organisations are most likely to have
difficulties filling vacancies (Table 7)13 Table 8
shows that over half of organisations in this sector
have difficulty filling technical vacancies and this
may reflect specific skills shortages in the UK The
most difficult category of staff to recruit in other
sectors is managers and professionalsspecialists
as was the case last year In general there is little
change in the categories of vacancies that are most
difficult to recruit for compared with last year
As would be expected given the cuts to
public sector budgets one in ten public sector
organisations report they did not have any
vacancies to fill twice as many as last year There is
little change in this regard in the other sectors
Table 9 shows the reasons respondents cite for their
recruitment difficulties The findings are similar
to previous years Lack of necessary specialist or
technical skills remains by far the most frequently
cited cause of difficulties reported by nearly
three-quarters of respondents (2011 72 2010
67 2009 73 2008 70) This is particularly
an issue for the manufacturing and production
sector and the public services sector where there
is a particularly high demand for such skills Lack
of formal qualifications is far less of an issue
These findings support arguments for greater
collaboration between industry and academic
institutions and more vocational training in order
to meet organisationsrsquo skill requirements
Higher pay expectations than the organisation
could offer and lack of experience are the next
most frequently cited causes of recruitment
problems (46 and 40 respectively) Interestingly
these are less of an issue in the public sector
perhaps because public sector applicants have
different expectations of pay or because some pay
scales are set at a national level Lack of experience
may be less of an issue than the necessary skills or
qualifications required in many public sector roles
The proportion reporting their recruitment
problems are due to potential candidatesrsquo
reluctance to move in the current economic climate
has decreased from just over a quarter in 2010 to
19 this year Economic growth albeit slow is
likely to be responsible for this reduction but the
lsquohangoverrsquo of the recession is highlighted as one in
five organisations still blame the economic climate
for their recruitment problems Despite high
unemployment 15 of respondents report they
have experienced problems due to no applicants In
line with last yearrsquos findings this is particularly an
issue for the public sector (22) which is also more
likely to report the image of their sectoroccupation
is a problem (22)
Table 7 Organisations experiencing difficulties recruiting for one or more category of vacancy by organisation size ( of those that have had vacancies to fill)
Voluntary Manufacturing community
and Private sector and All 2011 production services Public services not-for-profit
Difficulty filling one or 75 88 77 66 62more vacancies
No difficulties experienced 25 12 23 34 38
Base 561
RESO
UR
CIN
G A
ND
TALE
NT P
LAN
NIN
G 2
011
13
14
RESOURCING AND TALENT PLANNING
Table 8 Categories of vacancy that proved particularly difficult to fill ( of respondents)
Voluntary community
Manufacturing Private and and sector Public not-for-
All 2011 production services services profit All 2010
Other managers and professionalsspecialists
34 41 33 27 34 37
Technical 30 53 29 20 16 28
Senior managers directors
14 13 16 10 16 16
Services (customer personal protective 7 6 8 3 5 5 and sales)
Administrative secretarial
4 3 4 4 4 3
Manualcraft workers 4 11 3 1 0 2
Other 6 5 3 10 11 4
No difficulties experienced
23 12 22 30 38 25
No vacancies to fill 6 3 7 10 1 6 Base 597 (2011) 468 (2010)
Voluntary community
Manufacturing Private and All and sector Public not-for- All
2011 production services services profit 2010
Table 9 Reasons for recruitment difficulties ()
cipd
cou
k2011resou
rcing
and
talentp
lann
ing
survey
Lack of necessary specialist or technical skills 72 82 69 80 59 67
Look for more pay than you could offer 46 47 48 34 52 39
Lack of experience 40 42 43 27 41 36
Reluctance to move in current economic climate 19 24 18 17 15 26
Lack of interpersonal skills 16 9 19 10 20 12
No applicants 15 9 16 22 20 15
Image of sector occupationorganisation 13 7 12 22 11 12
Relocation difficulties 9 19 6 10 7 8
Lack of formal qualifications 7 7 7 5 7 4
The impact of the immigration cap 3 2 4 3 4
Other 4 3 3 8 7 7
Base 427 (2011) 330 (2010)
new item introduced in 2011
2011 Improving the employer brand Nearly three-quarters of organisations have made
efforts to improve their employer brand over the
past year (Table 10) The larger the organisation
the more likely it is to have undertaken one or
more activities to improve its brand Two-fifths of
small organisations with fewer than 50 employees
report they have taken no action to improve their
employer brand compared with one-quarter of
organisations with 250ndash999 employees and one-
sixth of those with more than 5000 employees
There are no significant sector differences
The most popular approaches to improving
employer brand are employee surveys and
developing online careers sites with larger
organisations most likely to have adopted these
methods14 The public sector is most likely to
have introduced or extended flexible working
homeworking15 whereas the private sector is
more likely to have made efforts to improve its
brand through working with charities or corporate
sponsorship16 Voluntary community and not-forshy
profit organisations are most likely to have used
placement students to improve their brand17
Attracting candidates The effectiveness of methods to attract applicants
varies according to sector and organisation size
(Table 11) Overall the most effective method is
through organisationsrsquo own corporate websites
as was the case last year The effectiveness of this
method increases with organisation size probably
due to the increased brand awareness and
perhaps because larger organisations have more
advanced websites18
The private sector particularly manufacturing
and production organisations is three times
more likely than public sector organisations to
report recruitment agencies among their most
effective methods and twice as likely as voluntary
sector organisations (regardless of size) Search
consultants and employee referral schemes are also
notably more popular in the private sector than in
the public or voluntary sectors
In contrast the public and voluntary sectors are
more likely to find the press effective for attracting
applicants including local and national newspaper
advertisements and specialist journalstrade press
Secondments are also deemed to be more effective
in these sectors than in the private sector
Table 10 Work undertaken over last year to improve employer brand ()
Voluntary community
All Private Public and 2011 sector services not-for-profit
Employee surveys 39 39 38 43
Developing online careers site 30 33 23 29
Introducingextending flexible working homeworking 24 20 39 29
Placement students 23 21 19 35
Graduate careers fairs 15 17 11 8
Working with charities 14 16 8 6
Corporate sponsorship 11 13 2 8
Introducing sabbaticals 3 4 1 5
Other 7 6 6 10
No action taken to improve employer brand 27 28 29 22
RESO
UR
CIN
G A
ND
TALE
NT P
LAN
NIN
G 2
011
Base 601
15
16
RESOURCING AND TALENT PLANNING
Table 11 Most effective methods for attracting applications by industry sector ()
Sector 2011 Number of UK employees 2011
All
2010
All
2011
Man
ufa
ctu
rin
gan
d p
rod
uct
ion
Priv
ate
sect
or
serv
ices
Pub
lic s
ervi
ces
Vo
lun
tary
co
mm
un
ity
and
no
t-fo
r-p
rofi
t
1ndash49
50ndash2
49
250ndash
999
100
0ndash4
999
Mo
re t
han
500
0
Own corporate website 63 59 44 57 77 66 42 55 57 77 79
Recruitment agencies 60 54 77 62 22 30 39 59 66 51 41
Local newspaper advertisements 36 32 38 23 41 51 28 35 35 29 29
Employee referral scheme 35 29 33 38 5 14 20 33 27 32 29
Commercial job boards 33 27 33 29 14 29 21 27 25 42 26
Specialist journalstrade press 31 27 24 23 30 43 26 23 32 32 24
Encourage speculative applicationsword of mouth 24 25 30 29 9 23 27 31 23 19 19
Jobcentre Plus 23 25 24 24 22 34 16 29 21 25 32
Professional networking (such as LinkedIn) 14 16 11 23 5 9 28 13 13 18 17
Search consultants 22 15 24 17 5 4 14 11 17 18 15
Links with schoolscollegesuniversities 18 13 16 13 9 17 12 13 11 18 15
Apprenticeships 12 11 19 9 13 9 10 10 11 12 17
National newspaper advertisements 16 11 4 6 23 29 10 9 15 10 15
Secondments 11 11 7 8 21 12 2 9 13 11 19
Links with other local organisations making redundancies 7 13 5 7 9 6 5 9 11 8
Alumni (previous employees) 5 5 6 7 2 1 7 2 6 11 3
Social networking sites (such as Facebook) 3 4 4 5 3 4 3 2 2 8 12
Local Employment Partnership (LEP) 6 3 1 4 2 5 1 2 3 4 9
Other 5 5 2 3 12 6 8 3 4 4 5
cipd
cou
k2011resou
rcing
and
talentp
lann
ing
survey
Base 604 (2011) 464 (2010)
new item introduced in 2011
Despite the popularity of social networking
sites such as Facebook they are not seen to be
particularly effective for attracting candidates
Professional networking sites such as LinkedIn are
more popular particularly in the private services
sector although there has only been a small
percentage increase in their reported effectiveness
compared with last year
2011 Recruitment partners A new question this year asked respondents if their
attitude to and relationships with recruitment
partners has changed over the past 12 months Just
over a third report things have not changed
(Table 12) A similar proportion report they have
reduced their use of recruitment partners and 6
that they have stopped using them altogether
with one in ten considering them an unaffordable
expense (one in five in the not-for-profit sector)
and a similar proportion an unnecessary expense
In contrast one in five (predominantly private
sector organisations) report they have formed
a closer business partnership with recruitment
partners over the past year and one in ten (again
predominantly private sector organisations) report
they consider them integral to attracting top talent
Selecting candidates There has been little change in the methods used
to select candidates over the past few years with
the exception of a drop in the use of general
ability tests compared with 2009 (Table 13)
Interviews remain the most common selection
method with competency-based interviews
being most popular overall Interviews following
the contents of CVsapplication forms are also
particularly popular in the private sector (70
compared with 41 in the public sector and 57
in the not-for-profit sector) whereas the public
and not-for-profit sectors favour structured (panel)
interviews (82 and 79 respectively compared
with 45 in the private sector)
Tests for specific job-related skills are more popular
in the public and not-for-profit sectors (61 and
62 respectively compared with 43 in the private
sector) whereas telephone interviews are more
popular in the private sector (52 compared with
12 in the public sector and 26 in the not-forshy
profit sector)
Table 12 Changes in attitudes to and relationships with recruitment partners over the past 12 months ()
Voluntary community
All Private Public and 2011 sector services not-for-profit
Not changed 36 34 40 39
Reduced use of recruitment partners 32 34 32 26
Formed a closer business partnership with them 19 23 8 12
Consider them an unnecessary expense 12 11 13 16
Consider them an unaffordable expense 11 10 11 22
Consider them integral to attracting top talent 9 11 2 4
Stopped using recruitment partners 6 5 8 5
Other 3 3 3 3 Base 604
RESO
UR
CIN
G A
ND
TALE
NT P
LAN
NIN
G 2
011
17
18
RESOURCING AND TALENT PLANNING
Table 13 Methods used to select applicants ()
2011 2010 2009 survey survey survey
Competency-based interviews 70 78 69
Interviews following contents of CVapplication form 63 64 68
Structured interviews (panel) 56 61 59
Tests for specific job-related skills 49 48 50
Telephone interviews 43 47 38
Literacy andor numeracy tests 38 43 39
Personalityaptitudepsychometric questionnaires 35 44 35
Assessment centres 35 42 35
Pre-application eliminationprogression question(s) 25 32 NA
General ability tests 23 27 44
Group exercises (for example role-playing) 21 30 26
Pre-interview references (academic or employment) 9 16 19
Video CVs 0 1 NA
Other 3 4 6
cipd
cou
k2011resou
rcing
and
talentp
lann
ing
survey
Base 605 (2011) 473 (2010) 754 (2009)
Strengths-based recruitment Two-fifths of organisations (40) report they use a
strengths-based approach to recruitment although
it is less commonly used in the public sector (26)19
In all sectors smaller organisations are most likely
to report they use a strengths-based approach
(60 of organisations with 1ndash49 employees use it
compared with 34 of organisations with 250ndash999
employees and 24 of organisations with more
than 5000 employees)20
Most of those who use a strengths-based approach
to recruitment are neutral about how easy it is to
administer in practice regardless of sector or size
Nearly a third (32) find it easy or very easy and
only one in ten (11) find it difficult
Over three-quarters of those who use a strengths-
based approach to recruitment believe it
brings benefits in terms of increased individual
performance (78) Two-thirds believe it improves
retention (67) and increases engagement (63)
Two-fifths (39) report it results in greater diversity
of skills in the workplace
Many organisations that use a strengths-based
approach to recruitment also use a strengths-based
approach for other people processes More than
half use it for performance management processes
(59) succession planning (55) and learning and
development (53) Two-fifths use it for talent
management (42) and a third use it for workforce
planning (32) Just under three in ten (29) also
use it for redeployment
Recruitment costs Last year we noted an increase in the proportion
of organisations that calculate their recruitment
costs (2010 65 2009 53 2008 51) This year
the proportion is back in line with previous years
(52) The increase last year may have been due
to sampling differences or a consequence of an
increased focus on costs during the recession that
has not continued
Four-fifths (79) of organisations that calculate
recruitment costs provided cost estimates per
hire There is considerable variance in the amount
organisations spend (at least partly due to our
2011 findings that organisations include different costs
in their calculations see Table 14) In general
the median figures (Table 15) are lower than last
year for both senior managerdirectors and other
employees
In order to explore the validity of estimates this
year we also asked respondents to indicate how
accurate their cost estimates were Half (51) of
estimates for costs of recruiting senior managers
directors were accurate to plus or minus 10 and
83 to plus or minus 20 Two-fifths of estimates
for other employees were accurate to plus or minus
10 and 74 to plus or minus 20 Table 16
shows the median figures for estimates that were
believed to be accurate to up to plus or minus 20
The figures indicate as we found last year that
organisations spend considerably more on senior
appointments than on other employees This
reflects the value attached to good leadership and
perhaps the additional challenges of attracting
the best candidates for senior positions This is
particularly the case in the private sector where
considerably more is spent on the recruitment of
senior managersdirectors than in the public or not-
for-profit sectors
Table 14 Criteria included in cost per hire calculations ()
Size ndash number of employees in UK
Advertising costs
Agencysearch costs
Employee referrals
Travel expenses
Relocation expenses
Fixed costs of resourcing team
Opportunity costs of hiring managers time
Other
Dont know Base 299
81
75
35
30
17
24
24
3
4
Table 15 Estimated total costs (advertising costs agency or search fees) per hire (pound)
Median 2011 Median 2010 (no of (no of
Occupational group respondents) Minimum Maximum respondents)
Senior managersdirectors 7000 (219) 251 55000 8333 (234)
Other employees 2000 (246) 150 32000 2930 (262) Number of respondents shown in brackets
Table 16 Median total costs (advertising costs agency or search fees) per hire for estimates accurate to plus or minus 20 (pound)
Voluntary
Median 2011 Manufacturing
and Private Public
community and not-for-
Occupational group production sector services profit
RESO
UR
CIN
G A
ND
TALE
NT P
LAN
NIN
G 2
011
Senior managersdirectors 7500 8000 9000 5000 3500
Other employees 2500 3400 2000 3000 1500 Base 150
19
cipd
cou
k2011resou
rcing
and
talentp
lann
ing
survey
20
RESOURCING AND TALENT PLANNING
2 RESOURCING AND TALENT mANAGEmENT IN TURBULENT TImES
In January 2010 the UK officially emerged from the recession however the economic environment remains uncertain for many organisations The environmental disasters in Japan the uprisings and wars in the Middle East rising oil prices and European debt highlight the volatility of global markets In the UK economic growth remains sluggish and there are concerns regarding the impact of the VAT increases high inflation and the austerity measures of the Coalition Government This section examines the impact of the economic environment on resourcing budgets strategies and activities in 2010 It looks at changes in views on the employment market and the implications for managing talent
The impact of the economic climate on resourcing Overall half of organisations report that the
economic climate has had a negative impact on
their organisationsrsquo resourcing budgets for 2011ndash12
(Table 17) This year however it is the public
sector that is most severely hit with four-fifths
(82) reporting their resourcing budgets will be
reduced (up from 59 last year) In contrast fewer
private and not-for-profit sector organisations
face reductions this year compared with last
although more are still reducing their budgets than
increasing them
Changes in resourcing and talent practices in
2011 compared with 2010 reflect a stronger
focus on costs and reductions in budgets (Figure
3) Two-thirds plan to develop more talent inshy
house (compared with one-third in 2010) and
more organisations plan to reduce reliance on
recruitment agencies and external consultants for
resourcing and development The proportion of
organisations planning to focus more on retaining
rather than recruiting talent has increased to 51
in 2011 from 28 in 2010
2011 Changes in recruitment practices are also
anticipated More organisations plan to make use
of new mediatechnology to recruit which may
be a cost-cutting strategy but can also improve
the efficiency and effectiveness of the recruitment
process On a positive note more organisations plan
to invest more time and effort in the quality of
candidates they hire and will be taking actions to
improve ways of identifying quality candidates
Public sector organisations are more than twice
as likely to be implementing a recruitment freeze
in 2011 (46 compared with 22 overall)
Nevertheless this is an improvement on 2010 when
58 of public sector organisations implemented a
recruitment freeze The situation is also somewhat
brighter for many private sector organisations
with 15 reporting they will be implementing a
recruitment freeze in 2011 compared with 26
in 2010 Nevertheless the economic recovery
remains slow for many with 29 of private
sector organisations and 66 of public sector
organisations reporting they will be reducing the
number of new recruits they hire in 2011 similar
proportions to 2010 Inevitably more public than
private sector organisations report they will be
reducing their headcount in 2011 and losing key
talent (33 compared with 9 in the private
sector) and redeploying people into new roles (66
compared with 37 in the private sector)
Table 17 Impact of the current economic climate on organisationsrsquo resourcing budgets ()
Private Public Voluntary community All sector services and not-for-profit
2011 2010 2011 2010 2011 2010 2011 2010
Reduced 49 53 41 51 82 59 51 61
Stayed about the same 36 37 39 40 14 36 40 34
Increased 8 7 11 4 1 5 4 5
Dont know 7 3 8 5 3 5 Base 615 (2011) 475 (2010)
RESO
UR
CIN
G A
ND
TALE
NT P
LAN
NIN
G 2
011
21
cipd
cou
k2011resou
rcing
and
talentp
lann
ing
survey
22
RESOURCING AND TALENT PLANNING
figure 3 Resourcing and talent practices implemented in 2011 and 2010 ( of respondents)
Developing more talent in-house
Continuing to recruit key talentniche areas
Focusing more on retaining rather than recruiting talent
Reducing reliance on recruitment agencies
Use of new mediatechnology to recruit
Investing more time and effort in the quality of candidates we hire
Redeploying people into new roles
Reducing the number of new recruits we hire
Taking actions to improve ways of identifying quality candidates
Increasing the number of interimcontract staff recruited
Reducing our use of external consultants for resourcing and development
Increased recruitment of apprenticesinterns
Implementing a recruitment freeze
Reducing our headcount but preserving key talent
Recruiting talent discarded by competitors
Reducing our headcount and losing key talent
Offering sabbaticals career breaks additional holidays
Reducing employees working hours to avoid making people redundant
8Reducing graduate recruitment 8
6Suspending graduate recruitment 7
36
28
36
28
26
30
35 35
35 15
29 23
28 19
24 12
22 30
22 16
18 11
13 12 12
10
12 10
66
59 46
51
47
46
45
44
0 10 20 30 40 50 60 70 80 Percentage of respondents
2011 2010
Base 582
RESO
UR
CIN
G A
ND
TALE
NT P
LAN
NIN
G 2
011
23
2011 Views on the employment market In little change to last year three-quarters of
organisations report they have noticed an increase
in the number of unsuitable applicants as they have
fewer roles to fill (Figure 4) Far fewer (34) report
that there are too many suitable candidates to
choose from and despite high unemployment over
the past two years more than half (52) believe that
competition for talent is even greater as the pool of
available talent to hire has fallen sharply (2010 41
2009 20) For many organisations there appears a
clear mismatch between the skills they require and
those available in the labour market
Competition for talent appears to be particularly
keen in the private sector Two-thirds (64) of
manufacturing and production organisations
and 55 of private services organisations agree
that competition for talent is even greater now
compared with 39 of the public sector and 34
of not-for-profits21 In contrast the public sector
and not-for-profits are more likely to agree they
have too many suitable candidates to choose
from (61 and 47 respectively compared with
23 of manufacturing and production and 27
of private sector services)22
Three-fifths (62) of respondents agree that the
demand for temporary and contract workers will
increase as employers will be reluctant to take
on permanent staff during uncertain times while
44 agree that part-time workers will become
more appealing to employers who are looking to
cut costs
figure 4 Views on the employment market ( agreeing or strongly agreeing)
With fewer roles to fill we have noticed an increase in the number
of unsuitable applicants
The demand for temporary and contract workers will increase as employers will be reluctant to
take on permanent staff during uncertain times
Employers will use the economic downturn as an opportunity to get rid of poor performers
and bring about culture change
Competition for talent is even greater now as the pool of available talent to hire has
fallen sharply
Part-time workers will become more appealing to employers who are looking to cut costs
Employers are acting too hastily in making people redundant and as a result they will lose too
many employees with valuable knowledge and skills
With fewer roles to fill there are now too many suitable candidates to choose between
The abolition of the Default Retirement Age will mean we recruit fewer people
Employers will look to make older workers over the age of 65 redundant before their younger workers
73 76
54
62 66 66
55 63
72
52 41
20
44 45
52
44 48
53
34 32
23
19 22
27
0 10 20 30 40 50 60 70 80 Percentage of respondents
2011 2010 2009
Base 607 (2011) 475 (2010) 746 (2009)
item added 20102011
24
RESOURCING AND TALENT PLANNING
More than half of respondents (55) across
all sectors believe that employers will use the
economic downturn as an opportunity to get rid of
poor performers and bring about culture change
While high this shows a downward trend on the
past two years (2010 63 2009 72 agree or
strongly agree) perhaps reflecting a slowing in
the number of redundancies Similarly there is
a gradual downward trend in the proportion of
respondents who express concern that employers
are acting too hastily in making people redundant
and as a result they will lose too many employees
with valuable knowledge and skills or that
employers will look to make older workers over the
age of 65 redundant before their younger workers
Nearly a quarter (23) of respondents believe
that the abolition of the Default Retirement Age
will mean they recruit fewer people (48 in the
public sector)23
Implications for talent management The value of effective talent management has
not been lost in the recent attention on reducing
costs Two-fifths (41) of organisations report
that the current economic situation has led
to an increased focus on talent management
(43 in 2010) and only 4 that it has led to a
decreased focus (7 in 2010) with no significant
differences across sectors Unsurprisingly however
the public sector are about twice as likely this
year to report they have reduced their overall
talent management spend due to the downturn
compared with other sectors (Table 18)24
The proportion of organisations that report
the economic downturn has had an impact on
approaches to reward across the business has
slightly reduced compared with last year (54
compared with 61 in 2010) As last year it
appears that organisations across all sectors
are being more selective in who they reward A
smaller proportion of organisations report their
approach to reward for individuals identified as
talent has been affected by the downturn (42)
than report their approach to reward across the
business has been affected (54)
Table 18 Has your overall talent management spend been reduced due to the economic downturn ()
cipd
cou
k2011resou
rcing
and
talentp
lann
ing
survey
Voluntary All community and All
2011 Private sector Public sector not-for-profit 2010
Yes 18 17 32 13 23
No 38 43 16 32 41
NA (no talent management spend) 44 40 52 55 36
Base 617 (2011) 471 (2010)
RESO
UR
CIN
G A
ND
TALE
NT P
LAN
NIN
G 2
011
25
2011
Case study Innovative recruitment and cost saving in the Association of Greater Manchester Authorities
The Association of Greater Manchester Authorities (AGMA) represents the ten local authorities in
Greater Manchester and works in partnership with a wider group of associate councils and public
sector organisations AGMA chief executives and council leaders work together on a range of key
strategic and policy issues which impact on Greater Manchester including resourcing strategies
and recruitment and retention issues
The AGMA initiative in cost reduction in the area of resourcing has been described as lsquoa truly
pioneering example of collaboration between a number of local authoritiesrsquo and is already
delivering against a range of objectives
The initial aim was to make a significant saving on the pound5ndash6 million annual cost of external
media advertising reported in 2008ndash09 and to create a more efficient and effective recruitment
system A shared portal was commissioned to offer a front-end website (wwwyourcounciljobs
couk) with a lsquoback-officersquo e-recruitment system which would give a standardised shared-service
approach for job applicants across councils Some of the benefits for applicants include the ability
to go to one place to register their interest to be able to look in specific categories for jobs
of particular relevance to them to be able to amend an existing application form in order to
apply for a further post and to receive email alerts when new jobs relevant to their interests are
posted In addition communications to job-seekers are now standardised for every council
This approach has seen real benefits across each of the local authorities workflows are now
standardised as every HR team runs identical systems and there is consistency in reporting within
all councils enabling them to benchmark their processes more clearly The councils use this
benchmarking data to make additional improvements and efficiencies
Jayne Whitehead AGMA Category Procurement Manager has project-managed the initiative
with managers represented from each participating authority and describes the process as one
of lsquotrue collaborationrsquo with lsquo100 commitmentrsquo from all the councils involved The benefits
are clear annual media costs are dramatically reduced to approximately pound250000 across ten
partner organisations and there has been a reduction in time-to-hire of 13 days This has had
the knock-on effect of reducing expenditure on agency staff The average cost of a recruitment
advertisement per role was previously pound97400 it is now pound15200 There have also been benefits
outside the original intention including doubling the number of online applications for council
posts with administrative cost savings in HR of approximately pound250000 across the consortium
More than 61000 registered users are now on the system and the councils are successfully filling
their own talent pools of prospective job-seekers Overall the project team is now celebrating a
pound17 million reduction in recruitment expenditure over the past 12 months
(continued)
cipd
cou
k2011resou
rcing
and
talentp
lann
ing
survey
26
RESOURCING AND TALENT PLANNING
There were some challenges in the implementation of this new way of working All the councils
had to be convinced about the benefits of the changes With the implementation of a new IT
system having its own set of challenges the project has taken 12 months to introduce longer
than first anticipated Implementing the changes during a period of radical restructuring in all
councils also proved particularly challenging However Jayne describes how both the need to
make efficiencies and feedback from job-seekers meant that lsquowe had to find a different way of
doing thingsrsquo Jayne also recognises how the neutrality of her own role (each council pays a tenth
of her salary) has been essential in ensuring that the project has been fair to all its participants
offering a centralised shared resource to manage the project
The project is now set to develop yet further with the aim of becoming entirely self-funding
within the next year by accepting advertising from other organisations Two new websites are
planned for recruitment into schools and social care jobs bringing even less reliance on media
and agencies AGMA will also be further building its own talent pool
Jayne describes the initiative as lsquoa true example of what you can do if you collaborate across
authoritiesrsquo Not only the separate councils but also diverse teams and functions including HR IT
procurement communications and marketing have worked together to deliver this innovative
and inspiring project
Information provided by Jayne Whitehead AGMA Category Procurement Manager
2011
3 DIVERSITy
This section examines organisationsrsquo approaches to diversity including the use of formal diversity strategies and the methods used to address diversity issues
Just over half of organisations report they have with just under two-thirds of not-for-profit
a formal diversity strategy showing little change organisations and just two-fifths of private sector
over the past four years (2011 52 2010 55 companies (Table 19)25 Diversity strategies are also
2009 60 2008 55) Consistent with previous more common in larger organisations (regardless
yearsrsquo findings most public sector organisations of sector)26
(90) have a formal diversity strategy compared
Table 19 Does your organisation have a formal diversity strategy ()
Yes No Dont know
All 52 41 7
Sector
Private sector 41 50 8
Public services 90 9 1
Voluntary community and not-for-profit 63 33 4
Number of UK employees
Fewer than 50 45 50 5
50ndash249 43 51 6
250ndash999 48 44 7
1000ndash4999 65 31 4
More than 5000 80 9 11 Base 613
RESO
UR
CIN
G A
ND
TALE
NT P
LAN
NIN
G 2
011
27
28
RESOURCING AND TALENT PLANNING
As was the case last year over three-quarters
of organisations with a formal diversity policy
attempt to address diversity issues through
monitoring recruitment andor staffing
information to obtain data on gender ethnicity
disability age and so on (Table 20) Less than
three-fifths train interviewers to understand what
diversity is about and the impact of stereotypes
Other diversity-focused initiatives are even
less common moreover the figures indicate a
reduction in the use of several methods compared
with previous years The pressures of the recession
may have led to a reduced focus on diversity
Given the links between diversity in the workforce
and productivity organisations that fail to give
this issue the attention it requires may find
themselves at a disadvantage in the future
Traditionally the public sector has tended to lead
the way in terms of diversity practices Again this
year they are significantly more likely to address
diversity issues through monitoring recruitment
andor staffing information through providing
recruitment documents in other formats through
advertising vacancies in different sources to
attract under-represented groups and through
setting recruitment targets to correct a workforce
imbalance Nevertheless they are less likely than
other sectors to actively try to attract talent of all
ages (Table 20) Moreover our figures indicate that
the reduction in the use of several diversity methods
compared with previous years is particularly
pronounced in the public sector The change of
government and budget reduction measures have
led to significant change programmes in many
public sector organisations which may have resulted
in a reduced focus on diversity issues
Table 20 Methods used to address diversity issues in organisations ( with formal diversity strategy)
Voluntary community
Private Public and not-sector services for-profit
2011 2010 2009 2008 2011 2011 2011 survey survey survey survey (2010) (2010) (2010)
Monitoring recruitment andor staffing information to obtain data on gender 78 79 84 83 70 (71) 88 (96) 88 (76) ethnicity disability age any other categories
cipd
cou
k2011resou
rcing
and
talentp
lann
ing
survey
Training interviewers to understand what diversity is about and the impact of stereotypes
57 68 68 60 53 (66) 64 (73) 57 (72)
Actively trying to attract talent of all ages 45 53 32 43
Operating policies that go beyond basic legislative requirements on age gender race disability sexual orientation religion and belief
39 49 52 48 34 (44) 47 (63) 47 (40)
Providing recruitment documents in other 39 41 37 31 24 (22) 64 (77) 47 (52)formats (online large-print audio and so on)
Checking that any tests used are valid reliable and culture-free and were tested on diverse norm groups
36 42 47 34 39 (44) 35 (45) 27 (16)
Advertising vacancies in different sources to 31 37 51 48 22 (30) 44 (53) 41 (32)attract under-represented groups
Using specific imageswords in your recruitment advertising to appeal to a wider audience 29 38 42 42 25 (30) 36 (52) 33 (40)
Making attempts to employ the long-term 19 19 13 29unemployed
Setting recruitment targets to correct a workforce imbalance 9 15 14 12 4 (8) 18 (31) 8 (16)
Base 312 (2011) 253 (2010) 419 (2009) new item added in 2011
RESO
UR
CIN
G A
ND
TALE
NT P
LAN
NIN
G 2
011
29
2011
4 mANAGING LABOUR TURNOVER
Figures from the Office for National Statistics show that UK unemployment rose by 27000 in the three months to the end of January 2011 to 253 million the highest since 1994 When unemployment is high the number of employees leaving organisations voluntarily is expected to decrease Here we examine whether this is happening and how organisations are tackling the issue of employee retention
Among organisations that are able to supply
turnover data the median labour turnover rate
has decreased over the past few years (Table 21)
The median figure however hides differences
across organisations Slightly more organisations
report their turnover has increased in 2010
compared with 2009 (38) than has decreased
(33) while for nearly a third (29) it remained
the same Smaller organisations are more likely
to report their labour turnover has increased and
larger organisations that it has decreased27
As in previous years the majority of turnover (53)
is still attributed to employees leaving voluntarily
(Table 22) As the economy has improved the
median proportion of turnover due to redundancies
has reduced Only 12 of organisations that
provided reasons for leaving made more than ten
redundancies in the previous year compared with
33 in 2010 26 in 2009 and 22 in 2008 A third
(34) of organisations that made redundancies
offered career transition services
While median turnover rates have reduced
across all sectors Table 23 shows that the rate
of voluntary leavers has increased slightly in
the private sector compared with last year but
decreased in the voluntary and public services
sector This reflects improvements in the economic
outlook for the private sector and the widespread
cuts in the public sector which also have a direct
impact on many not-for-profit organisations that
provide services for the public sector
Cost of labour turnover While just over half of organisations calculate
their recruitment costs only 13 calculate the
cost of their labour turnover (2010 14) The
majority of organisations report they do not
calculate these costs (79) while 7 donrsquot know
if they are calculated or not
Nearly half (46) of those who calculate their
turnover costs want to maintain their current
turnover rate while one-fifth (38) want to
reduce turnover during 2011 and 15 want to
increase it
Retaining employees The steps organisations take to retain employees
in their workforce can have a significant impact
on organisational efficiency and success through
30
RESOURCING AND TALENT PLANNING
Table 21 Median rate of labour turnover ()
2011 2010 survey 2009 survey 2008 survey 2007 survey 2006 survey
125 135 157 173 181 183
Base 175 (2011)
Table 22 Median labour turnover rates by reason for leaving ()
2011 survey 2010 survey 2009 survey
Voluntary redundancies 0 0 0
Compulsory redundancies 0 10 05
Dismissedleft involuntarily (including death in service)
07 09 14
Fixed-short-term contracts 0 0 07
Retired 0 04 07
Left voluntarily 66 84 90
Base 154 (2011)
Table 23 Median labour turnover rates by industry sector ()
cipd
cou
k2011resou
rcing
and
talentp
lann
ing
survey
Sector All leavers Voluntary leavers
2011 survey
2010 survey
2009 survey
2011 survey
2010 survey
2009 survey
Manufacturing and production 93 (38) 124 (44) 153 (80) 37 (35) 27 (42) 77 (75)
Private sector services 138 (96) 146 (77) 168 (150) 87 (82) 74 (71) 104 (129)
Public services 85 (28) 86 (19) 126 (52) 34 (10) 58 (15) 76 (45)
Voluntary community not-for-profit 131 (11) 159 (15) 164 (38) 70 (24) 102 (18) 110 (35) Number of respondents shown in brackets
decreasing employee turnover loss of talent and
recruitment and training costs while having a
positive impact on motivation job satisfaction and
the employer brand
Only two-fifths (42) of organisations
experienced no difficulties in retaining staff
during 2010 This figure is similar to last year
(45) but higher than the findings for 2008
when 31 reported they had no retention
difficulties These findings reflect the increased
caution of employees regarding leaving their
jobs during times of economic uncertainty and
high unemployment Supporting this are our
findings that the public (49) and not-for-profit
sectors (49) are more likely to report they had
no difficulties in retaining staff during 2010
compared with the private sector (38)
As in previous years organisations most
commonly have difficulty retaining managers
and professionalsspecialists (Table 24) The
manufacturing and production sector are most
likely to report difficulties retaining technical
2011 staff and the private services sector that they have
most difficulty retaining services staff This may
reflect the higher demand for these categories of
employees in these sectors
While most organisations have taken one or more
steps to address staff retention nearly one in four
organisations (23) report that no specific retention
initiatives were undertaken This is a similar
proportion to last year although substantially higher
than in previous years when retention difficulties
were more common due to a tighter labour market
(Table 25) Public sector organisations are twice
as likely not to have taken any steps to address
retention as those in the private or not for-profit
sectors (39 compared with 20 of private sector
and 16 of not-for-profits)28
The most common methods used to address
retention in 2010 used by nearly two-fifths of
organisations are to improve line managersrsquo
people skills improve learning and development
opportunities and improve the induction process
Improving line managersrsquo people skills and
learning and development opportunities are also
most commonly rated among the top three most
effective retention methods The effectiveness of
improving induction processes is more varied with
22 rating it among the top three most effective
methods and 12 among the top three least
effective methods Views are also mixed regarding
the effectiveness of improved pay It is likely that
employees are motivated by different factors
Employers need to provide a healthy working
environment where employees are treated with
respect and make efforts to match their retention
initiatives with what staff want
Table 24 Retention difficulties by occupational category ()
Voluntary community
Private and All Manufacturing sector Public not-for- All
2011 and production services services profit 2010
Managers and professionals specialists 28 26 29 25 29 27
Technical 21 37 19 17 13 20
Services (customer personal protective and sales) 13 7 21 4 4 12
Administrative secretarial 9 5 8 15 13 7
Senior managersdirectors 7 5 8 10 6 9
Manualcraft workers 6 11 6 3 4 4 Base 601 (2011) 451 (2010)
RESO
UR
CIN
G A
ND
TALE
NT P
LAN
NIN
G 2
011
31
32
RESOURCING AND TALENT PLANNING
Table 25 Steps taken specifically to address staff retention ()
Used in Least Most Used in Used in Used in 2010 effective effective 2009 2008 2007
Improved line managers people skills 39 7 31 42 39 37
Increased learning and development opportunities 38 5 34 35 47 46
Improved induction process 38 12 22 31 45 45
Improved employee involvement 34 8 24 32 35 29
Improved selection techniques 30 7 25 31 42 46
Improved pay 27 11 23 22 42 53
Offered coachingmentoring buddy systems 24 8 14 20 24 22
Improved benefits 21 8 14 19 32 36
Better promotion to employees of the employer brand 18 10 5 15 21 16
Created clearer career paths 18 6 2 21 18 17
Revised the way staff are rewarded so their efforts are 18 4 13 14 19 19 better recognised
Made changes to improve workndash life balance 17 5 13 19 31 30
Improved physical working conditions 15 8 7 13 19 12
Redesigned jobs to make them more satisfying 11 4 8 13 18 14
Increased our use of countershyoffers 4 4 14
No specific initiatives undertaken 23 3 1 27 13 9 Base 559 (2011 survey) 431 (2010 survey) 695 (2009 survey) 710 (2008 survey)
new item added in 2011
cipd
cou
k2011resou
rcing
and
talentp
lann
ing
survey
RESO
UR
CIN
G A
ND
TALE
NT P
LAN
NIN
G 2
011
33
2011
CONCLUSIONS
Looking forward In January 2010 the UK officially emerged from
the longest recession since the 1930s Economic
growth however remains sluggish and the public
sector has embarked on a four-year programme of
the biggest government spending cuts in decades
to address the fiscal deficit
In the labour market unemployment remained
high throughout 2010 Figures from the Office
for National Statistics (ONS) show that UK
unemployment rose by 27000 in the three months
to the end of January 2011 to 253 million the
highest since 1994 While recent months have seen
signs of improvement there are concerns that the
slow growth in the private sector will be unable
to fully compensate for the increasing job losses in
the public sector that will result from the budget
cuts This is supported by the findings from the
CIPDrsquos spring 2011 Labour Market Outlook which
shows the impact on the overall labour market of a
slight rise in private sector recruitment is still being
cancelled out by large-scale public sector job losses
The findings of the CIPDrsquos 2011 Resourcing and
Talent Planning survey reflect the challenges
of the economic environment Organisations
generally have increased their focus on costs On
average organisations spent less on filling each
vacancy and a fifth have reduced their resourcing
budgets and talent management spend In the
public sector the focus on costs and budget
reductions was particularly apparent
The end of the recession has meant fewer
redundancies in 2010 Nevertheless over a third
of public sector and one-fifth of private sector
organisations reduced their headcount The
number of vacancies on offer by organisations
remained as low as in 2009 overall and continued
to decrease in very large organisations particularly
in the public sector
Looking forward private sector growth is expected
to remain slow and the full impact of public
sector budget cuts is still to come Resourcing and
talent management budgets will be further hit
in 2011ndash12 and many public sector organisations
will implement recruitment freezes and reduce
graduate intake and recruitment generally
Resourcing and talent practices are changing to
reflect the stronger focus on costs and reductions
in budgets Particularly in the public sector but
also in the private sector trends indicate a greater
focus on developing talent in-house retaining
rather than recruiting talent and reducing reliance
on recruitment agencies and external consultants
for resourcing and development
Our findings do not present a positive outlook
for the vast number of unemployed A substantial
proportion of organisations reports that the
already low number of vacancies available to them
is likely to be further affected by the abolition
of the Default Retirement Age Yet despite the
high unemployment rate most organisations
reported difficulties in filling vacancies mostly due
to skill shortages We have also seen an increase
in the proportion of organisations reporting
that competition for talent is even greater as the
pool of available talent to hire has fallen sharply
For many organisations there appears a clear
mismatch between the skills they require and
those available in the labour market Some are
concerned this will be exacerbated by the increase
in university tuition fees Some are responding
cipd
cou
k2011resou
rcing
and
talentp
lann
ing
survey
34
RESOURCING AND TALENT PLANNING
by increasing apprenticeship schemes internships
and sponsoring students through university Such
schemes may be aided by the Governmentrsquos recently
announced pound60 million commitment to help boost
youth employment and provide extra support for
apprenticeships and changes to vocational training
and education How far this will go towards meeting
organisationsrsquo skill requirements remains to be seen
On a positive note our findings indicate that talent
management is viewed as more not less important
in difficult times although with reduced budgets
organisations will have to be innovative with
their approach and strategies In order to survive
organisations will need to make certain they focus
beyond the cost-cutting required in the current
environment to ensuring their talent strategies are
aligned to long-term business success
The CIPDrsquos Shaping the Future and Next Generation
HR flagship projects have both explored the
important issues of sustainability Shaping the Future
in particular warns against the dangers of lsquotalent
tunnel visionrsquo taking a short-sighted view on talent
strategies which are solely focused on the needs of
the here and now
Often organisations pay too little attention to
identifying and developing the capabilities that
individuals will need in the long term This implies a
leadershiptalent management capability gap with
too much focus on the operational needs of today
rather than the organisational imperatives
of tomorrow
Itrsquos never too late to start equipping your people
with the skills and knowledge they need to meet
both present and future challenges So what practical
recommendations can we make for resourcing and
talent professionals drawn from our Shaping the
Future evidence
Audit your organisationrsquos current skills and future capabilities If you havenrsquot done so already conduct a thorough
inventory of your organisationrsquos current skills and map
those against the capabilities you are likely to need
in the future Hold forecasting sessions which look at
macro and micro trends how these will impact your
way of working and the changes that will be required
for future success
Build your talent and succession pipeline You also need to be proactively building up your
talent pipelines (horizontally and vertically) so that
you are developing people with future-fit skills and
capabilities A silver lining from the current economic
climate is that more organisations are focusing on
developing internal talent and fully utilising the
skills of their existing workforce Fresh talent is
still important but recruitment strategies should
complement internal pipelines
Maintain a continuous focus on capability-building Capability-building should be part of a continuous
process embedded into policies and practices Across
our case study organisations managers talked about the
need to embed development and skills training as part
of business as usual rather than as a one-off activity
Develop a creative approach to skills and capability development Even when budgets are tight it is essential that
staff get the development they need to ensure they
have the capabilities for their current job role as well
as starting to build those that the organisation will
need in the future Our case study organisations were
focusing strongly on knowledge-sharing enabling
people to learn from others across the organisation
Many of you are already considering alternative
solutions for specialist skill development such as
apprenticeships internal management schemes
summer placements and internships It is also
important to work with universities to ensure that
graduates are developing skills and knowledge which
will help them to succeed in the workplace
RESO
UR
CIN
G A
ND
TALE
NT P
LAN
NIN
G 2
011
35
2011
BACkGROUND TO ThE SURVEy
This survey was conducted in March and April 2011 It was sent to a sample of UK-based HR professionals in the public private and voluntary sectors In total 626 people responded to the survey
This is the fifteenth annual CIPD Resourcing
and Talent Planning survey (formerly known as
the CIPDrsquos Recruitment Retention and Turnover
survey) The survey examines organisationsrsquo
resourcing and talent planning strategies and
practices and the key challenges and issues
they face The survey consists of 45 questions
completed through an online self-completion
questionnaire
The majority of questions remain the same as
previous years to provide useful benchmark
data on topics including recruitment practices
difficulties and costs selection methods diversity
strategies the impact of the economic climate on
resourcing and talent planning practices labour
turnover and retention strategies New question
areas this year examine the employment of
younger workers the length of the recruitment
process the nature of job vacancies relationships
with recruitment partners and the use of
strengths-based approaches to recruitment
A small number of respondents took part in follow-
up telephone interviews to produce mini case
studies on a selection of topics These are presented
in the coloured boxes throughout the report
Sample profile Respondents predominantly work for private
sector organisations with professional services
being particularly well represented but other
sectors are represented in similar proportions to
last year (Table A1)
36
RESOURCING AND TALENT PLANNING
Table A1 Breakdown of respondent organisations by industrial sector Number of respondents
Manufacturing and production 113 19
Agriculture and forestry 1 0
Chemicals oils and pharmaceuticals 9 1
Construction 8 1
Electricity gas and water 4 1
Engineering electronics and metals 38 6
Food drink and tobacco 18 3
General manufacturing 6 1
Mining and quarrying 4 1
Paper and printing 6 1
Textiles 2 0
Other manufacturingproduction 17 3
Private sector services 319 52
Professional services (accountancy advertising consultancy legal etc) 78 13
Finance insurance and real estate 33 5
Hotels catering and leisure 26 4
IT services 26 4
Call centres 3 0
Media (broadcasting and publishing etc) 7 1
Retail and wholesale 40 7
Transport distribution and storage 23 4
Communications 6 1
Other private services 77 13
Public services 100 16
Central government 14 2
Education 12 2
Health 23 4
Local government 22 4
Other public services 29 5
Non-profit organisations 78 13
Care services 9 1
Charity services 32 5
Housing association 17 3
Other voluntary 20 3 Base 610
cipd
cou
k2011resou
rcing
and
talentp
lann
ing
survey
2011 Most respondents work in small to medium-sized
organisations in terms of the number of UK-
based employees but larger organisations are
also represented in similar proportions to last year
(Table A2)
Respondents reported on organisations based
across the UK Three in ten responded for the
whole of the UK while others responded for a
particular regioncountry (see Table A3)
Table A2 Breakdown of sample by organisation size ndash permanent employees in the UK
Fewer than 10 5
10ndash49 12
50ndash249 33
250ndash999 25
1000ndash4999 12
More than 5000 13 Base 610
Table A3 Main region covered by the reply
East Anglia 5
East Midlands 3
West Midlands 5
North-east of England 3
North-west of England 7
South-west of England 6
Yorkshire and Humberside 5
South-east of England (excluding London)
12
London 12
Scotland 6
Wales 3
Northern Ireland 3
Ireland 0
Whole of UK 29 Base 602
Labour turnover A total of 175 survey respondents were able to
supply all the information necessary for us to
calculate labour turnover on a whole-organisation
basis
This report uses the standard lsquocrude wastagersquo
method to calculate the rate of turnover This
method is calculated as follows
Labour turnover =
Number of leavers in a set period
______________________________________ x 100
Average number employed in the same period
(Leavers include those leaving the organisation
by way of voluntary or involuntary severance
redundancies or retirements but does not include
internal transfers)
Readers should be aware that this method has
some shortcomings For example it takes no
account of the characteristics of the workforce or
the length of service of the leaver
Note on statistics and figures used Some respondents did not answer all questions so
where percentages are reported in tables or figures
the respondent lsquobasersquo for that question is given
lsquoAveragersquo in the report is used to refer to the
statistical mean where the data is normally
distributed However the median is used in cases
where the distribution is significantly skewed
When the median is used it is noted
With the exception of labour turnover rates all
figures in tables have been rounded to the nearest
percentage point Due to rounding percentages
may not always total 100
Chi-square (χ2) tests are used to examine whether
differences between groups such as industrial
sectors are significant or likely to be due to
chance Spearmanrsquos Rho correlation (Rho) is used
to examine relationships between variables We
report on statistics at the generally accepted level
of significance plt005
RESO
UR
CIN
G A
ND
TALE
NT P
LAN
NIN
G 2
011
37
38
RESOURCING AND TALENT PLANNING
fURThER SOURCES Of INfORmATION
We produce a range of free factsheets surveys
guides and research reports which are available on
the CIPD website at cipdcoukhrresources
Read our factsheets on Employer Brand
Employee Turnover and Retention
Induction
Outlook series Our quarterly reports Labour Market Outlook
and Employee Outlook look at the employer and
employee perspectives on the labour market and
on workplace issues and trends while HR Outlook
explores priorities and emerging trends for the HR
profession and function
View these reports at
cipdcoukresearchoutlook-series
Talent management Two reports look at talent issues in a recession
difficult economic climate
The War on Talent Talent management under
threat in uncertain times (2009)
Fighting Back through Talent Innovation (2010)
Opening up Talent for Business Success (2010)
looks at the importance of integrating talent
management and diversity
The Talent Perspective What does it feel like to
be talent-managed (2010) looks at the employee
view of talent management
Workforce planning Our guide Workforce Planning Right people right
time right skills (2010) gives advice on developing
workforce planning processes
Diversity Two survey reports and a guide provide practical
advice and information on trends
Diversity in Business A focus for progress (2007)
Managing an Ageing Workforce How employers
are adapting to an older labour market (2010)
Managing Age New edition 2011
Two further reports are available to order from
cipdcoukbookstore
Managing Diversity in Practice Supporting
business goals (2007)
Managing Diversity and the Business Case (2008)
Sign up to receive our e-newsletter at
cipdcoukcipdupdate
cipd
cou
k2011resou
rcing
and
talentp
lann
ing
survey
RESO
UR
CIN
G A
ND
TALE
NT P
LAN
NIN
G 2
011
39
2011
ACkNOwLEDGEmENTS
The CIPD is very grateful to those organisations and
individuals who gave their time to take part in this
research They include
bull Annette Sinclair Senior Researcher at Roffey
Park for analysing the findings and writing this
comprehensive report
bull Members of the Recruitment Forum Steering
Committee for their input into the survey
design and assistance in piloting the
questionnaire
bull Hays for their support and commitment at
every stage of the research
bull All those who shared examples of their
organisationrsquos practices
We hope that you find the research useful when
considering your own recruitment and retention
practices Please contact us if you have any
questions or ideas based on our findings
(researchcipdcouk)
RESOURCING AND TALENT PLANNING
fOOTNOTES 1 Chi Square = 573 df = 5 p lt 0001 n = 604 2 Rho = 073 p lt 0001 n = 577 3 Rho = 045 p lt 0001 n = 533 4 F = 250 df = 2 p lt 0001 n = 533 5 Chi Square = 180 df = 6 p lt 001 n = 535 6 Chi Square = 71 df = 2 p lt 005 n = 603 7 Chi Square = 230 df = 6 p lt 001 n = 600 8 Chi Square = 91 df = 3 p lt 005 n = 598 9 Chi Square = 129 df = 4 p lt 005 n = 610
10 Rho = 034 p lt 0001 n = 609 11 Chi square = 217 df = 3 p lt 0001 n = 609 12 Chi Square = 609 df = 8 p lt 0001 n = 607 13 Chi Square = 208 df = 3 p lt 0001 n = 560 14 Size of organisation and developing online
careers site Rho = 025 p lt 0001 n = 599 Size of
organisation and employee surveys Rho = 019
p lt 0001 n = 599 15 Chi Square = 167 df = 2 p lt 0001 n = 599
16 Working with charities Chi Square = 80 df = 2 p
lt 005 n = 599 corporate sponsorship Chi Square
= 116 df = 2 p lt 001 n = 599 17 Chi Square = 76 df = 2 p lt 005 n = 599 18 Table 11 also shows that this method is deemed
most effective by public sector organisations but
this effect is due to a greater proportion of
large public sector organisations in our
sample whereas private sector organisations are
more evenly distributed in size 19 Chi square = 109 df = 2 p lt 001 n = 610 20 Chi Square = 279 df = 4 p lt 0001 n = 610 21 Chi Square = 259 df = 6 p lt 0001 n = 598 22 Chi Square = 515 df = 6 p lt 0001 n = 597 22 Chi Square = 177 df = 8 p lt 005 n = 600 22 Chi Square = 339 df = 4 p lt 0001 n = 610 22 Chi Square = 820 df = 4 p lt 0001 n = 610 22 Chi Square = 522 df = 8 p lt 0001 n = 610 22 Rho = 024 p lt 0001 n = 195 22 Chi Square = 166 df = 2 p lt 0001 n = 544
cipd
cou
k2011resou
rcing
and
talentp
lann
ing
survey
40
2011
OTHER TITLES IN THIS SERIES
ABSENCE MANAGEMENT The annual Absence Management survey has been running for eleven years providing useful benchmarking data on absence levels the cost and causes of absence and how organisations are managing absence The latest report is brought to you in partnership with Simplyhealth
EMPLOYEE ATTITUDES TO PAY The annual Employee Attitudes to Pay survey investigates employee attitudes and expectations towards pay and bonuses Now in its third year this survey is carried out by YouGov and focuses on employees in the UK
REWARD MANAGEMENT The annual Reward Management survey has been running for ten years and provides practical insights into current trends practices and issues affecting reward management in the UK It examines strategic reward base and variable pay bonuses incentives pensions reward measurement and total reward issues This report was brought to you in partnership with Benefex
LEARNING AND TALENT DEvELOPMENT The annual Learning and Talent Development survey is now in its thirteenth year and provides valuable commentary on current and future issues and trends It explores employer support for learning talent management employee skills managing and evaluating coaching and training spend
Issu
ed J
une
2011
Ref
eren
ce 5
552
copy C
hart
ered
Inst
itute
of
Pers
onne
l and
Dev
elop
men
t 20
11
Chartered Institute of Personnel and Development
151 The Broadway London SW19 1JQ
Tel 020 8612 6200 Fax 020 8612 6201
Email cipdcipdcouk Website cipdcouk
Incorporated by Royal Charter Registered charity no1079797
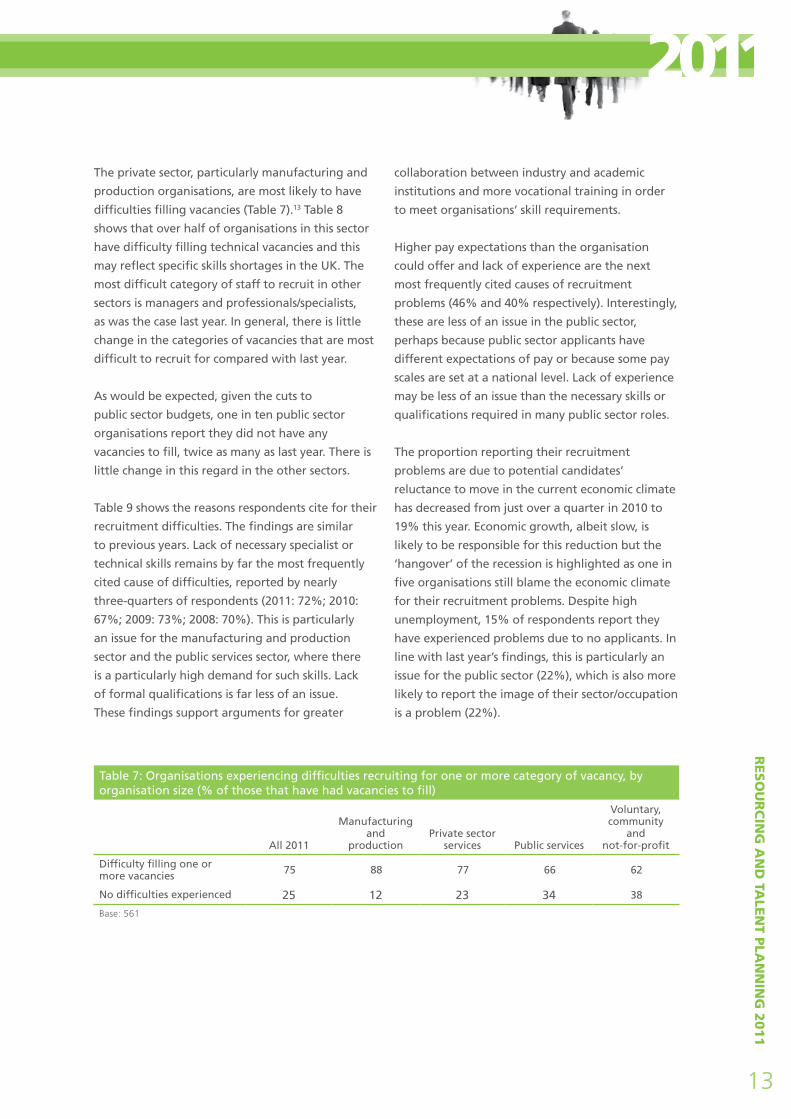
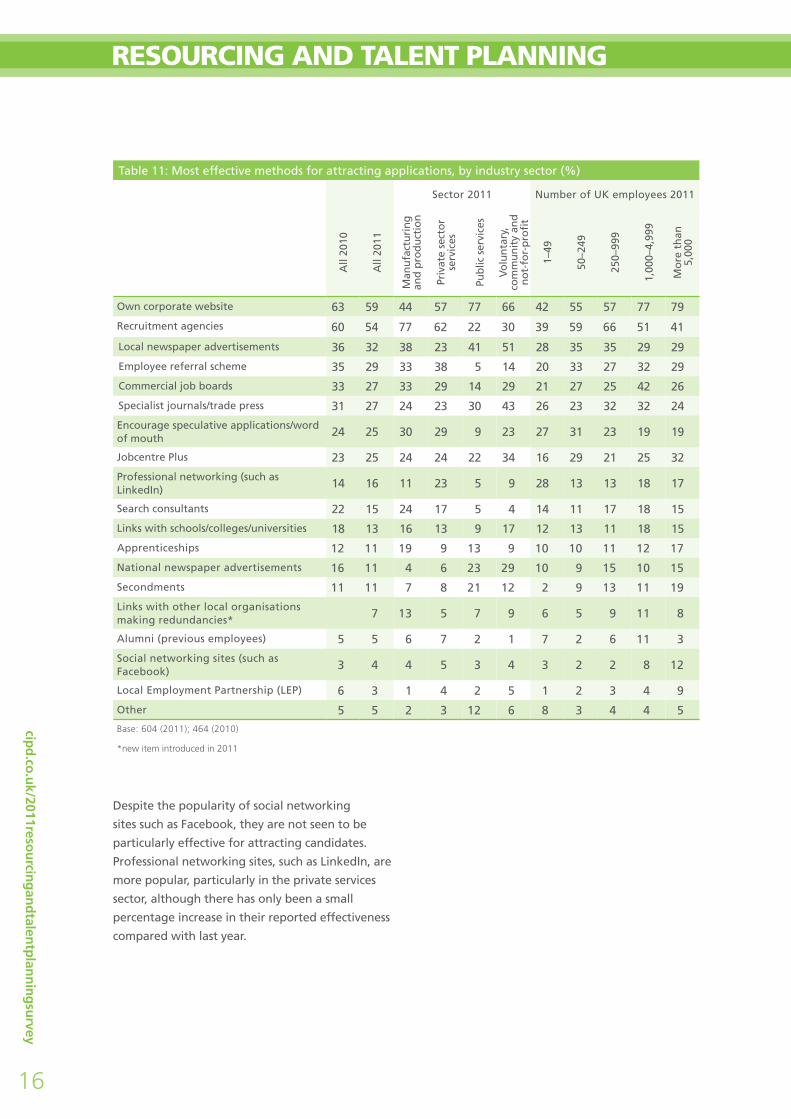
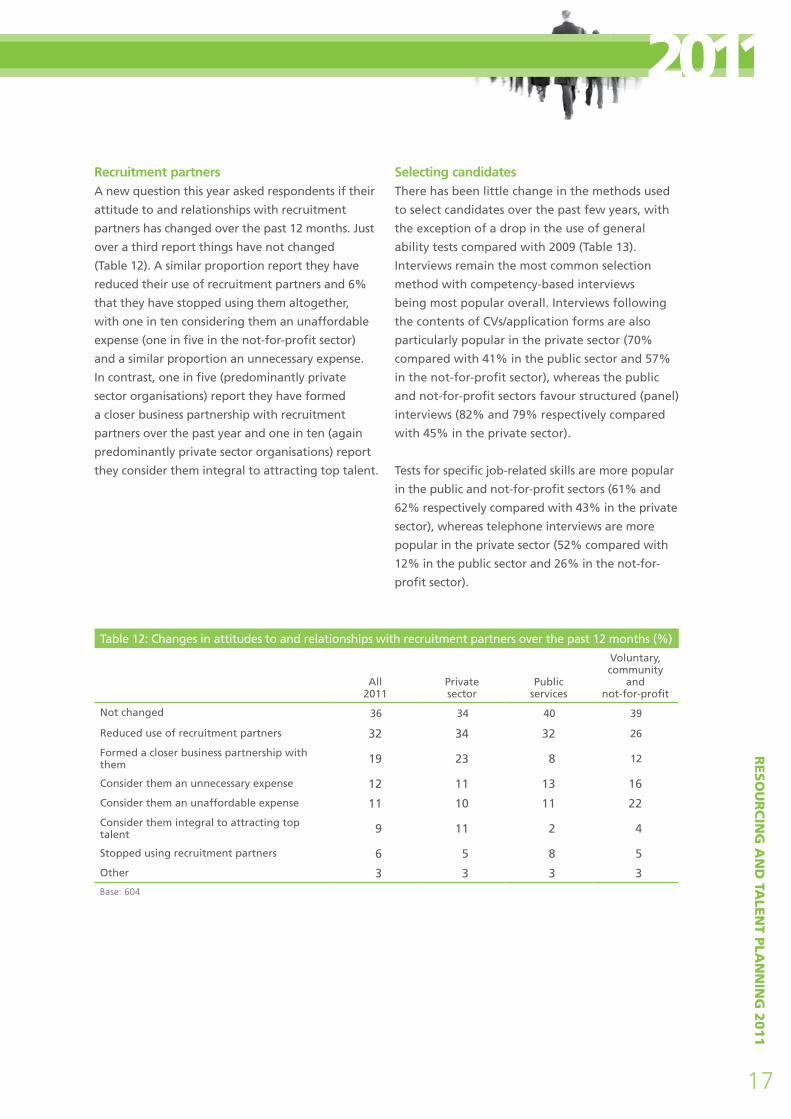

cipd
cou
k2011resou
rcing
and
talentp
lann
ing
survey
20
RESOURCING AND TALENT PLANNING
2 RESOURCING AND TALENT mANAGEmENT IN TURBULENT TImES
In January 2010 the UK officially emerged from the recession however the economic environment remains uncertain for many organisations The environmental disasters in Japan the uprisings and wars in the Middle East rising oil prices and European debt highlight the volatility of global markets In the UK economic growth remains sluggish and there are concerns regarding the impact of the VAT increases high inflation and the austerity measures of the Coalition Government This section examines the impact of the economic environment on resourcing budgets strategies and activities in 2010 It looks at changes in views on the employment market and the implications for managing talent
The impact of the economic climate on resourcing Overall half of organisations report that the
economic climate has had a negative impact on
their organisationsrsquo resourcing budgets for 2011ndash12
(Table 17) This year however it is the public
sector that is most severely hit with four-fifths
(82) reporting their resourcing budgets will be
reduced (up from 59 last year) In contrast fewer
private and not-for-profit sector organisations
face reductions this year compared with last
although more are still reducing their budgets than
increasing them
Changes in resourcing and talent practices in
2011 compared with 2010 reflect a stronger
focus on costs and reductions in budgets (Figure
3) Two-thirds plan to develop more talent inshy
house (compared with one-third in 2010) and
more organisations plan to reduce reliance on
recruitment agencies and external consultants for
resourcing and development The proportion of
organisations planning to focus more on retaining
rather than recruiting talent has increased to 51
in 2011 from 28 in 2010
2011 Changes in recruitment practices are also
anticipated More organisations plan to make use
of new mediatechnology to recruit which may
be a cost-cutting strategy but can also improve
the efficiency and effectiveness of the recruitment
process On a positive note more organisations plan
to invest more time and effort in the quality of
candidates they hire and will be taking actions to
improve ways of identifying quality candidates
Public sector organisations are more than twice
as likely to be implementing a recruitment freeze
in 2011 (46 compared with 22 overall)
Nevertheless this is an improvement on 2010 when
58 of public sector organisations implemented a
recruitment freeze The situation is also somewhat
brighter for many private sector organisations
with 15 reporting they will be implementing a
recruitment freeze in 2011 compared with 26
in 2010 Nevertheless the economic recovery
remains slow for many with 29 of private
sector organisations and 66 of public sector
organisations reporting they will be reducing the
number of new recruits they hire in 2011 similar
proportions to 2010 Inevitably more public than
private sector organisations report they will be
reducing their headcount in 2011 and losing key
talent (33 compared with 9 in the private
sector) and redeploying people into new roles (66
compared with 37 in the private sector)
Table 17 Impact of the current economic climate on organisationsrsquo resourcing budgets ()
Private Public Voluntary community All sector services and not-for-profit
2011 2010 2011 2010 2011 2010 2011 2010
Reduced 49 53 41 51 82 59 51 61
Stayed about the same 36 37 39 40 14 36 40 34
Increased 8 7 11 4 1 5 4 5
Dont know 7 3 8 5 3 5 Base 615 (2011) 475 (2010)
RESO
UR
CIN
G A
ND
TALE
NT P
LAN
NIN
G 2
011
21
cipd
cou
k2011resou
rcing
and
talentp
lann
ing
survey
22
RESOURCING AND TALENT PLANNING
figure 3 Resourcing and talent practices implemented in 2011 and 2010 ( of respondents)
Developing more talent in-house
Continuing to recruit key talentniche areas
Focusing more on retaining rather than recruiting talent
Reducing reliance on recruitment agencies
Use of new mediatechnology to recruit
Investing more time and effort in the quality of candidates we hire
Redeploying people into new roles
Reducing the number of new recruits we hire
Taking actions to improve ways of identifying quality candidates
Increasing the number of interimcontract staff recruited
Reducing our use of external consultants for resourcing and development
Increased recruitment of apprenticesinterns
Implementing a recruitment freeze
Reducing our headcount but preserving key talent
Recruiting talent discarded by competitors
Reducing our headcount and losing key talent
Offering sabbaticals career breaks additional holidays
Reducing employees working hours to avoid making people redundant
8Reducing graduate recruitment 8
6Suspending graduate recruitment 7
36
28
36
28
26
30
35 35
35 15
29 23
28 19
24 12
22 30
22 16
18 11
13 12 12
10
12 10
66
59 46
51
47
46
45
44
0 10 20 30 40 50 60 70 80 Percentage of respondents
2011 2010
Base 582
RESO
UR
CIN
G A
ND
TALE
NT P
LAN
NIN
G 2
011
23
2011 Views on the employment market In little change to last year three-quarters of
organisations report they have noticed an increase
in the number of unsuitable applicants as they have
fewer roles to fill (Figure 4) Far fewer (34) report
that there are too many suitable candidates to
choose from and despite high unemployment over
the past two years more than half (52) believe that
competition for talent is even greater as the pool of
available talent to hire has fallen sharply (2010 41
2009 20) For many organisations there appears a
clear mismatch between the skills they require and
those available in the labour market
Competition for talent appears to be particularly
keen in the private sector Two-thirds (64) of
manufacturing and production organisations
and 55 of private services organisations agree
that competition for talent is even greater now
compared with 39 of the public sector and 34
of not-for-profits21 In contrast the public sector
and not-for-profits are more likely to agree they
have too many suitable candidates to choose
from (61 and 47 respectively compared with
23 of manufacturing and production and 27
of private sector services)22
Three-fifths (62) of respondents agree that the
demand for temporary and contract workers will
increase as employers will be reluctant to take
on permanent staff during uncertain times while
44 agree that part-time workers will become
more appealing to employers who are looking to
cut costs
figure 4 Views on the employment market ( agreeing or strongly agreeing)
With fewer roles to fill we have noticed an increase in the number
of unsuitable applicants
The demand for temporary and contract workers will increase as employers will be reluctant to
take on permanent staff during uncertain times
Employers will use the economic downturn as an opportunity to get rid of poor performers
and bring about culture change
Competition for talent is even greater now as the pool of available talent to hire has
fallen sharply
Part-time workers will become more appealing to employers who are looking to cut costs
Employers are acting too hastily in making people redundant and as a result they will lose too
many employees with valuable knowledge and skills
With fewer roles to fill there are now too many suitable candidates to choose between
The abolition of the Default Retirement Age will mean we recruit fewer people
Employers will look to make older workers over the age of 65 redundant before their younger workers
73 76
54
62 66 66
55 63
72
52 41
20
44 45
52
44 48
53
34 32
23
19 22
27
0 10 20 30 40 50 60 70 80 Percentage of respondents
2011 2010 2009
Base 607 (2011) 475 (2010) 746 (2009)
item added 20102011
24
RESOURCING AND TALENT PLANNING
More than half of respondents (55) across
all sectors believe that employers will use the
economic downturn as an opportunity to get rid of
poor performers and bring about culture change
While high this shows a downward trend on the
past two years (2010 63 2009 72 agree or
strongly agree) perhaps reflecting a slowing in
the number of redundancies Similarly there is
a gradual downward trend in the proportion of
respondents who express concern that employers
are acting too hastily in making people redundant
and as a result they will lose too many employees
with valuable knowledge and skills or that
employers will look to make older workers over the
age of 65 redundant before their younger workers
Nearly a quarter (23) of respondents believe
that the abolition of the Default Retirement Age
will mean they recruit fewer people (48 in the
public sector)23
Implications for talent management The value of effective talent management has
not been lost in the recent attention on reducing
costs Two-fifths (41) of organisations report
that the current economic situation has led
to an increased focus on talent management
(43 in 2010) and only 4 that it has led to a
decreased focus (7 in 2010) with no significant
differences across sectors Unsurprisingly however
the public sector are about twice as likely this
year to report they have reduced their overall
talent management spend due to the downturn
compared with other sectors (Table 18)24
The proportion of organisations that report
the economic downturn has had an impact on
approaches to reward across the business has
slightly reduced compared with last year (54
compared with 61 in 2010) As last year it
appears that organisations across all sectors
are being more selective in who they reward A
smaller proportion of organisations report their
approach to reward for individuals identified as
talent has been affected by the downturn (42)
than report their approach to reward across the
business has been affected (54)
Table 18 Has your overall talent management spend been reduced due to the economic downturn ()
cipd
cou
k2011resou
rcing
and
talentp
lann
ing
survey
Voluntary All community and All
2011 Private sector Public sector not-for-profit 2010
Yes 18 17 32 13 23
No 38 43 16 32 41
NA (no talent management spend) 44 40 52 55 36
Base 617 (2011) 471 (2010)
RESO
UR
CIN
G A
ND
TALE
NT P
LAN
NIN
G 2
011
25
2011
Case study Innovative recruitment and cost saving in the Association of Greater Manchester Authorities
The Association of Greater Manchester Authorities (AGMA) represents the ten local authorities in
Greater Manchester and works in partnership with a wider group of associate councils and public
sector organisations AGMA chief executives and council leaders work together on a range of key
strategic and policy issues which impact on Greater Manchester including resourcing strategies
and recruitment and retention issues
The AGMA initiative in cost reduction in the area of resourcing has been described as lsquoa truly
pioneering example of collaboration between a number of local authoritiesrsquo and is already
delivering against a range of objectives
The initial aim was to make a significant saving on the pound5ndash6 million annual cost of external
media advertising reported in 2008ndash09 and to create a more efficient and effective recruitment
system A shared portal was commissioned to offer a front-end website (wwwyourcounciljobs
couk) with a lsquoback-officersquo e-recruitment system which would give a standardised shared-service
approach for job applicants across councils Some of the benefits for applicants include the ability
to go to one place to register their interest to be able to look in specific categories for jobs
of particular relevance to them to be able to amend an existing application form in order to
apply for a further post and to receive email alerts when new jobs relevant to their interests are
posted In addition communications to job-seekers are now standardised for every council
This approach has seen real benefits across each of the local authorities workflows are now
standardised as every HR team runs identical systems and there is consistency in reporting within
all councils enabling them to benchmark their processes more clearly The councils use this
benchmarking data to make additional improvements and efficiencies
Jayne Whitehead AGMA Category Procurement Manager has project-managed the initiative
with managers represented from each participating authority and describes the process as one
of lsquotrue collaborationrsquo with lsquo100 commitmentrsquo from all the councils involved The benefits
are clear annual media costs are dramatically reduced to approximately pound250000 across ten
partner organisations and there has been a reduction in time-to-hire of 13 days This has had
the knock-on effect of reducing expenditure on agency staff The average cost of a recruitment
advertisement per role was previously pound97400 it is now pound15200 There have also been benefits
outside the original intention including doubling the number of online applications for council
posts with administrative cost savings in HR of approximately pound250000 across the consortium
More than 61000 registered users are now on the system and the councils are successfully filling
their own talent pools of prospective job-seekers Overall the project team is now celebrating a
pound17 million reduction in recruitment expenditure over the past 12 months
(continued)
cipd
cou
k2011resou
rcing
and
talentp
lann
ing
survey
26
RESOURCING AND TALENT PLANNING
There were some challenges in the implementation of this new way of working All the councils
had to be convinced about the benefits of the changes With the implementation of a new IT
system having its own set of challenges the project has taken 12 months to introduce longer
than first anticipated Implementing the changes during a period of radical restructuring in all
councils also proved particularly challenging However Jayne describes how both the need to
make efficiencies and feedback from job-seekers meant that lsquowe had to find a different way of
doing thingsrsquo Jayne also recognises how the neutrality of her own role (each council pays a tenth
of her salary) has been essential in ensuring that the project has been fair to all its participants
offering a centralised shared resource to manage the project
The project is now set to develop yet further with the aim of becoming entirely self-funding
within the next year by accepting advertising from other organisations Two new websites are
planned for recruitment into schools and social care jobs bringing even less reliance on media
and agencies AGMA will also be further building its own talent pool
Jayne describes the initiative as lsquoa true example of what you can do if you collaborate across
authoritiesrsquo Not only the separate councils but also diverse teams and functions including HR IT
procurement communications and marketing have worked together to deliver this innovative
and inspiring project
Information provided by Jayne Whitehead AGMA Category Procurement Manager
2011
3 DIVERSITy
This section examines organisationsrsquo approaches to diversity including the use of formal diversity strategies and the methods used to address diversity issues
Just over half of organisations report they have with just under two-thirds of not-for-profit
a formal diversity strategy showing little change organisations and just two-fifths of private sector
over the past four years (2011 52 2010 55 companies (Table 19)25 Diversity strategies are also
2009 60 2008 55) Consistent with previous more common in larger organisations (regardless
yearsrsquo findings most public sector organisations of sector)26
(90) have a formal diversity strategy compared
Table 19 Does your organisation have a formal diversity strategy ()
Yes No Dont know
All 52 41 7
Sector
Private sector 41 50 8
Public services 90 9 1
Voluntary community and not-for-profit 63 33 4
Number of UK employees
Fewer than 50 45 50 5
50ndash249 43 51 6
250ndash999 48 44 7
1000ndash4999 65 31 4
More than 5000 80 9 11 Base 613
RESO
UR
CIN
G A
ND
TALE
NT P
LAN
NIN
G 2
011
27
28
RESOURCING AND TALENT PLANNING
As was the case last year over three-quarters
of organisations with a formal diversity policy
attempt to address diversity issues through
monitoring recruitment andor staffing
information to obtain data on gender ethnicity
disability age and so on (Table 20) Less than
three-fifths train interviewers to understand what
diversity is about and the impact of stereotypes
Other diversity-focused initiatives are even
less common moreover the figures indicate a
reduction in the use of several methods compared
with previous years The pressures of the recession
may have led to a reduced focus on diversity
Given the links between diversity in the workforce
and productivity organisations that fail to give
this issue the attention it requires may find
themselves at a disadvantage in the future
Traditionally the public sector has tended to lead
the way in terms of diversity practices Again this
year they are significantly more likely to address
diversity issues through monitoring recruitment
andor staffing information through providing
recruitment documents in other formats through
advertising vacancies in different sources to
attract under-represented groups and through
setting recruitment targets to correct a workforce
imbalance Nevertheless they are less likely than
other sectors to actively try to attract talent of all
ages (Table 20) Moreover our figures indicate that
the reduction in the use of several diversity methods
compared with previous years is particularly
pronounced in the public sector The change of
government and budget reduction measures have
led to significant change programmes in many
public sector organisations which may have resulted
in a reduced focus on diversity issues
Table 20 Methods used to address diversity issues in organisations ( with formal diversity strategy)
Voluntary community
Private Public and not-sector services for-profit
2011 2010 2009 2008 2011 2011 2011 survey survey survey survey (2010) (2010) (2010)
Monitoring recruitment andor staffing information to obtain data on gender 78 79 84 83 70 (71) 88 (96) 88 (76) ethnicity disability age any other categories
cipd
cou
k2011resou
rcing
and
talentp
lann
ing
survey
Training interviewers to understand what diversity is about and the impact of stereotypes
57 68 68 60 53 (66) 64 (73) 57 (72)
Actively trying to attract talent of all ages 45 53 32 43
Operating policies that go beyond basic legislative requirements on age gender race disability sexual orientation religion and belief
39 49 52 48 34 (44) 47 (63) 47 (40)
Providing recruitment documents in other 39 41 37 31 24 (22) 64 (77) 47 (52)formats (online large-print audio and so on)
Checking that any tests used are valid reliable and culture-free and were tested on diverse norm groups
36 42 47 34 39 (44) 35 (45) 27 (16)
Advertising vacancies in different sources to 31 37 51 48 22 (30) 44 (53) 41 (32)attract under-represented groups
Using specific imageswords in your recruitment advertising to appeal to a wider audience 29 38 42 42 25 (30) 36 (52) 33 (40)
Making attempts to employ the long-term 19 19 13 29unemployed
Setting recruitment targets to correct a workforce imbalance 9 15 14 12 4 (8) 18 (31) 8 (16)
Base 312 (2011) 253 (2010) 419 (2009) new item added in 2011
RESO
UR
CIN
G A
ND
TALE
NT P
LAN
NIN
G 2
011
29
2011
4 mANAGING LABOUR TURNOVER
Figures from the Office for National Statistics show that UK unemployment rose by 27000 in the three months to the end of January 2011 to 253 million the highest since 1994 When unemployment is high the number of employees leaving organisations voluntarily is expected to decrease Here we examine whether this is happening and how organisations are tackling the issue of employee retention
Among organisations that are able to supply
turnover data the median labour turnover rate
has decreased over the past few years (Table 21)
The median figure however hides differences
across organisations Slightly more organisations
report their turnover has increased in 2010
compared with 2009 (38) than has decreased
(33) while for nearly a third (29) it remained
the same Smaller organisations are more likely
to report their labour turnover has increased and
larger organisations that it has decreased27
As in previous years the majority of turnover (53)
is still attributed to employees leaving voluntarily
(Table 22) As the economy has improved the
median proportion of turnover due to redundancies
has reduced Only 12 of organisations that
provided reasons for leaving made more than ten
redundancies in the previous year compared with
33 in 2010 26 in 2009 and 22 in 2008 A third
(34) of organisations that made redundancies
offered career transition services
While median turnover rates have reduced
across all sectors Table 23 shows that the rate
of voluntary leavers has increased slightly in
the private sector compared with last year but
decreased in the voluntary and public services
sector This reflects improvements in the economic
outlook for the private sector and the widespread
cuts in the public sector which also have a direct
impact on many not-for-profit organisations that
provide services for the public sector
Cost of labour turnover While just over half of organisations calculate
their recruitment costs only 13 calculate the
cost of their labour turnover (2010 14) The
majority of organisations report they do not
calculate these costs (79) while 7 donrsquot know
if they are calculated or not
Nearly half (46) of those who calculate their
turnover costs want to maintain their current
turnover rate while one-fifth (38) want to
reduce turnover during 2011 and 15 want to
increase it
Retaining employees The steps organisations take to retain employees
in their workforce can have a significant impact
on organisational efficiency and success through
30
RESOURCING AND TALENT PLANNING
Table 21 Median rate of labour turnover ()
2011 2010 survey 2009 survey 2008 survey 2007 survey 2006 survey
125 135 157 173 181 183
Base 175 (2011)
Table 22 Median labour turnover rates by reason for leaving ()
2011 survey 2010 survey 2009 survey
Voluntary redundancies 0 0 0
Compulsory redundancies 0 10 05
Dismissedleft involuntarily (including death in service)
07 09 14
Fixed-short-term contracts 0 0 07
Retired 0 04 07
Left voluntarily 66 84 90
Base 154 (2011)
Table 23 Median labour turnover rates by industry sector ()
cipd
cou
k2011resou
rcing
and
talentp
lann
ing
survey
Sector All leavers Voluntary leavers
2011 survey
2010 survey
2009 survey
2011 survey
2010 survey
2009 survey
Manufacturing and production 93 (38) 124 (44) 153 (80) 37 (35) 27 (42) 77 (75)
Private sector services 138 (96) 146 (77) 168 (150) 87 (82) 74 (71) 104 (129)
Public services 85 (28) 86 (19) 126 (52) 34 (10) 58 (15) 76 (45)
Voluntary community not-for-profit 131 (11) 159 (15) 164 (38) 70 (24) 102 (18) 110 (35) Number of respondents shown in brackets
decreasing employee turnover loss of talent and
recruitment and training costs while having a
positive impact on motivation job satisfaction and
the employer brand
Only two-fifths (42) of organisations
experienced no difficulties in retaining staff
during 2010 This figure is similar to last year
(45) but higher than the findings for 2008
when 31 reported they had no retention
difficulties These findings reflect the increased
caution of employees regarding leaving their
jobs during times of economic uncertainty and
high unemployment Supporting this are our
findings that the public (49) and not-for-profit
sectors (49) are more likely to report they had
no difficulties in retaining staff during 2010
compared with the private sector (38)
As in previous years organisations most
commonly have difficulty retaining managers
and professionalsspecialists (Table 24) The
manufacturing and production sector are most
likely to report difficulties retaining technical
2011 staff and the private services sector that they have
most difficulty retaining services staff This may
reflect the higher demand for these categories of
employees in these sectors
While most organisations have taken one or more
steps to address staff retention nearly one in four
organisations (23) report that no specific retention
initiatives were undertaken This is a similar
proportion to last year although substantially higher
than in previous years when retention difficulties
were more common due to a tighter labour market
(Table 25) Public sector organisations are twice
as likely not to have taken any steps to address
retention as those in the private or not for-profit
sectors (39 compared with 20 of private sector
and 16 of not-for-profits)28
The most common methods used to address
retention in 2010 used by nearly two-fifths of
organisations are to improve line managersrsquo
people skills improve learning and development
opportunities and improve the induction process
Improving line managersrsquo people skills and
learning and development opportunities are also
most commonly rated among the top three most
effective retention methods The effectiveness of
improving induction processes is more varied with
22 rating it among the top three most effective
methods and 12 among the top three least
effective methods Views are also mixed regarding
the effectiveness of improved pay It is likely that
employees are motivated by different factors
Employers need to provide a healthy working
environment where employees are treated with
respect and make efforts to match their retention
initiatives with what staff want
Table 24 Retention difficulties by occupational category ()
Voluntary community
Private and All Manufacturing sector Public not-for- All
2011 and production services services profit 2010
Managers and professionals specialists 28 26 29 25 29 27
Technical 21 37 19 17 13 20
Services (customer personal protective and sales) 13 7 21 4 4 12
Administrative secretarial 9 5 8 15 13 7
Senior managersdirectors 7 5 8 10 6 9
Manualcraft workers 6 11 6 3 4 4 Base 601 (2011) 451 (2010)
RESO
UR
CIN
G A
ND
TALE
NT P
LAN
NIN
G 2
011
31
32
RESOURCING AND TALENT PLANNING
Table 25 Steps taken specifically to address staff retention ()
Used in Least Most Used in Used in Used in 2010 effective effective 2009 2008 2007
Improved line managers people skills 39 7 31 42 39 37
Increased learning and development opportunities 38 5 34 35 47 46
Improved induction process 38 12 22 31 45 45
Improved employee involvement 34 8 24 32 35 29
Improved selection techniques 30 7 25 31 42 46
Improved pay 27 11 23 22 42 53
Offered coachingmentoring buddy systems 24 8 14 20 24 22
Improved benefits 21 8 14 19 32 36
Better promotion to employees of the employer brand 18 10 5 15 21 16
Created clearer career paths 18 6 2 21 18 17
Revised the way staff are rewarded so their efforts are 18 4 13 14 19 19 better recognised
Made changes to improve workndash life balance 17 5 13 19 31 30
Improved physical working conditions 15 8 7 13 19 12
Redesigned jobs to make them more satisfying 11 4 8 13 18 14
Increased our use of countershyoffers 4 4 14
No specific initiatives undertaken 23 3 1 27 13 9 Base 559 (2011 survey) 431 (2010 survey) 695 (2009 survey) 710 (2008 survey)
new item added in 2011
cipd
cou
k2011resou
rcing
and
talentp
lann
ing
survey
RESO
UR
CIN
G A
ND
TALE
NT P
LAN
NIN
G 2
011
33
2011
CONCLUSIONS
Looking forward In January 2010 the UK officially emerged from
the longest recession since the 1930s Economic
growth however remains sluggish and the public
sector has embarked on a four-year programme of
the biggest government spending cuts in decades
to address the fiscal deficit
In the labour market unemployment remained
high throughout 2010 Figures from the Office
for National Statistics (ONS) show that UK
unemployment rose by 27000 in the three months
to the end of January 2011 to 253 million the
highest since 1994 While recent months have seen
signs of improvement there are concerns that the
slow growth in the private sector will be unable
to fully compensate for the increasing job losses in
the public sector that will result from the budget
cuts This is supported by the findings from the
CIPDrsquos spring 2011 Labour Market Outlook which
shows the impact on the overall labour market of a
slight rise in private sector recruitment is still being
cancelled out by large-scale public sector job losses
The findings of the CIPDrsquos 2011 Resourcing and
Talent Planning survey reflect the challenges
of the economic environment Organisations
generally have increased their focus on costs On
average organisations spent less on filling each
vacancy and a fifth have reduced their resourcing
budgets and talent management spend In the
public sector the focus on costs and budget
reductions was particularly apparent
The end of the recession has meant fewer
redundancies in 2010 Nevertheless over a third
of public sector and one-fifth of private sector
organisations reduced their headcount The
number of vacancies on offer by organisations
remained as low as in 2009 overall and continued
to decrease in very large organisations particularly
in the public sector
Looking forward private sector growth is expected
to remain slow and the full impact of public
sector budget cuts is still to come Resourcing and
talent management budgets will be further hit
in 2011ndash12 and many public sector organisations
will implement recruitment freezes and reduce
graduate intake and recruitment generally
Resourcing and talent practices are changing to
reflect the stronger focus on costs and reductions
in budgets Particularly in the public sector but
also in the private sector trends indicate a greater
focus on developing talent in-house retaining
rather than recruiting talent and reducing reliance
on recruitment agencies and external consultants
for resourcing and development
Our findings do not present a positive outlook
for the vast number of unemployed A substantial
proportion of organisations reports that the
already low number of vacancies available to them
is likely to be further affected by the abolition
of the Default Retirement Age Yet despite the
high unemployment rate most organisations
reported difficulties in filling vacancies mostly due
to skill shortages We have also seen an increase
in the proportion of organisations reporting
that competition for talent is even greater as the
pool of available talent to hire has fallen sharply
For many organisations there appears a clear
mismatch between the skills they require and
those available in the labour market Some are
concerned this will be exacerbated by the increase
in university tuition fees Some are responding
cipd
cou
k2011resou
rcing
and
talentp
lann
ing
survey
34
RESOURCING AND TALENT PLANNING
by increasing apprenticeship schemes internships
and sponsoring students through university Such
schemes may be aided by the Governmentrsquos recently
announced pound60 million commitment to help boost
youth employment and provide extra support for
apprenticeships and changes to vocational training
and education How far this will go towards meeting
organisationsrsquo skill requirements remains to be seen
On a positive note our findings indicate that talent
management is viewed as more not less important
in difficult times although with reduced budgets
organisations will have to be innovative with
their approach and strategies In order to survive
organisations will need to make certain they focus
beyond the cost-cutting required in the current
environment to ensuring their talent strategies are
aligned to long-term business success
The CIPDrsquos Shaping the Future and Next Generation
HR flagship projects have both explored the
important issues of sustainability Shaping the Future
in particular warns against the dangers of lsquotalent
tunnel visionrsquo taking a short-sighted view on talent
strategies which are solely focused on the needs of
the here and now
Often organisations pay too little attention to
identifying and developing the capabilities that
individuals will need in the long term This implies a
leadershiptalent management capability gap with
too much focus on the operational needs of today
rather than the organisational imperatives
of tomorrow
Itrsquos never too late to start equipping your people
with the skills and knowledge they need to meet
both present and future challenges So what practical
recommendations can we make for resourcing and
talent professionals drawn from our Shaping the
Future evidence
Audit your organisationrsquos current skills and future capabilities If you havenrsquot done so already conduct a thorough
inventory of your organisationrsquos current skills and map
those against the capabilities you are likely to need
in the future Hold forecasting sessions which look at
macro and micro trends how these will impact your
way of working and the changes that will be required
for future success
Build your talent and succession pipeline You also need to be proactively building up your
talent pipelines (horizontally and vertically) so that
you are developing people with future-fit skills and
capabilities A silver lining from the current economic
climate is that more organisations are focusing on
developing internal talent and fully utilising the
skills of their existing workforce Fresh talent is
still important but recruitment strategies should
complement internal pipelines
Maintain a continuous focus on capability-building Capability-building should be part of a continuous
process embedded into policies and practices Across
our case study organisations managers talked about the
need to embed development and skills training as part
of business as usual rather than as a one-off activity
Develop a creative approach to skills and capability development Even when budgets are tight it is essential that
staff get the development they need to ensure they
have the capabilities for their current job role as well
as starting to build those that the organisation will
need in the future Our case study organisations were
focusing strongly on knowledge-sharing enabling
people to learn from others across the organisation
Many of you are already considering alternative
solutions for specialist skill development such as
apprenticeships internal management schemes
summer placements and internships It is also
important to work with universities to ensure that
graduates are developing skills and knowledge which
will help them to succeed in the workplace
RESO
UR
CIN
G A
ND
TALE
NT P
LAN
NIN
G 2
011
35
2011
BACkGROUND TO ThE SURVEy
This survey was conducted in March and April 2011 It was sent to a sample of UK-based HR professionals in the public private and voluntary sectors In total 626 people responded to the survey
This is the fifteenth annual CIPD Resourcing
and Talent Planning survey (formerly known as
the CIPDrsquos Recruitment Retention and Turnover
survey) The survey examines organisationsrsquo
resourcing and talent planning strategies and
practices and the key challenges and issues
they face The survey consists of 45 questions
completed through an online self-completion
questionnaire
The majority of questions remain the same as
previous years to provide useful benchmark
data on topics including recruitment practices
difficulties and costs selection methods diversity
strategies the impact of the economic climate on
resourcing and talent planning practices labour
turnover and retention strategies New question
areas this year examine the employment of
younger workers the length of the recruitment
process the nature of job vacancies relationships
with recruitment partners and the use of
strengths-based approaches to recruitment
A small number of respondents took part in follow-
up telephone interviews to produce mini case
studies on a selection of topics These are presented
in the coloured boxes throughout the report
Sample profile Respondents predominantly work for private
sector organisations with professional services
being particularly well represented but other
sectors are represented in similar proportions to
last year (Table A1)
36
RESOURCING AND TALENT PLANNING
Table A1 Breakdown of respondent organisations by industrial sector Number of respondents
Manufacturing and production 113 19
Agriculture and forestry 1 0
Chemicals oils and pharmaceuticals 9 1
Construction 8 1
Electricity gas and water 4 1
Engineering electronics and metals 38 6
Food drink and tobacco 18 3
General manufacturing 6 1
Mining and quarrying 4 1
Paper and printing 6 1
Textiles 2 0
Other manufacturingproduction 17 3
Private sector services 319 52
Professional services (accountancy advertising consultancy legal etc) 78 13
Finance insurance and real estate 33 5
Hotels catering and leisure 26 4
IT services 26 4
Call centres 3 0
Media (broadcasting and publishing etc) 7 1
Retail and wholesale 40 7
Transport distribution and storage 23 4
Communications 6 1
Other private services 77 13
Public services 100 16
Central government 14 2
Education 12 2
Health 23 4
Local government 22 4
Other public services 29 5
Non-profit organisations 78 13
Care services 9 1
Charity services 32 5
Housing association 17 3
Other voluntary 20 3 Base 610
cipd
cou
k2011resou
rcing
and
talentp
lann
ing
survey
2011 Most respondents work in small to medium-sized
organisations in terms of the number of UK-
based employees but larger organisations are
also represented in similar proportions to last year
(Table A2)
Respondents reported on organisations based
across the UK Three in ten responded for the
whole of the UK while others responded for a
particular regioncountry (see Table A3)
Table A2 Breakdown of sample by organisation size ndash permanent employees in the UK
Fewer than 10 5
10ndash49 12
50ndash249 33
250ndash999 25
1000ndash4999 12
More than 5000 13 Base 610
Table A3 Main region covered by the reply
East Anglia 5
East Midlands 3
West Midlands 5
North-east of England 3
North-west of England 7
South-west of England 6
Yorkshire and Humberside 5
South-east of England (excluding London)
12
London 12
Scotland 6
Wales 3
Northern Ireland 3
Ireland 0
Whole of UK 29 Base 602
Labour turnover A total of 175 survey respondents were able to
supply all the information necessary for us to
calculate labour turnover on a whole-organisation
basis
This report uses the standard lsquocrude wastagersquo
method to calculate the rate of turnover This
method is calculated as follows
Labour turnover =
Number of leavers in a set period
______________________________________ x 100
Average number employed in the same period
(Leavers include those leaving the organisation
by way of voluntary or involuntary severance
redundancies or retirements but does not include
internal transfers)
Readers should be aware that this method has
some shortcomings For example it takes no
account of the characteristics of the workforce or
the length of service of the leaver
Note on statistics and figures used Some respondents did not answer all questions so
where percentages are reported in tables or figures
the respondent lsquobasersquo for that question is given
lsquoAveragersquo in the report is used to refer to the
statistical mean where the data is normally
distributed However the median is used in cases
where the distribution is significantly skewed
When the median is used it is noted
With the exception of labour turnover rates all
figures in tables have been rounded to the nearest
percentage point Due to rounding percentages
may not always total 100
Chi-square (χ2) tests are used to examine whether
differences between groups such as industrial
sectors are significant or likely to be due to
chance Spearmanrsquos Rho correlation (Rho) is used
to examine relationships between variables We
report on statistics at the generally accepted level
of significance plt005
RESO
UR
CIN
G A
ND
TALE
NT P
LAN
NIN
G 2
011
37
38
RESOURCING AND TALENT PLANNING
fURThER SOURCES Of INfORmATION
We produce a range of free factsheets surveys
guides and research reports which are available on
the CIPD website at cipdcoukhrresources
Read our factsheets on Employer Brand
Employee Turnover and Retention
Induction
Outlook series Our quarterly reports Labour Market Outlook
and Employee Outlook look at the employer and
employee perspectives on the labour market and
on workplace issues and trends while HR Outlook
explores priorities and emerging trends for the HR
profession and function
View these reports at
cipdcoukresearchoutlook-series
Talent management Two reports look at talent issues in a recession
difficult economic climate
The War on Talent Talent management under
threat in uncertain times (2009)
Fighting Back through Talent Innovation (2010)
Opening up Talent for Business Success (2010)
looks at the importance of integrating talent
management and diversity
The Talent Perspective What does it feel like to
be talent-managed (2010) looks at the employee
view of talent management
Workforce planning Our guide Workforce Planning Right people right
time right skills (2010) gives advice on developing
workforce planning processes
Diversity Two survey reports and a guide provide practical
advice and information on trends
Diversity in Business A focus for progress (2007)
Managing an Ageing Workforce How employers
are adapting to an older labour market (2010)
Managing Age New edition 2011
Two further reports are available to order from
cipdcoukbookstore
Managing Diversity in Practice Supporting
business goals (2007)
Managing Diversity and the Business Case (2008)
Sign up to receive our e-newsletter at
cipdcoukcipdupdate
cipd
cou
k2011resou
rcing
and
talentp
lann
ing
survey
RESO
UR
CIN
G A
ND
TALE
NT P
LAN
NIN
G 2
011
39
2011
ACkNOwLEDGEmENTS
The CIPD is very grateful to those organisations and
individuals who gave their time to take part in this
research They include
bull Annette Sinclair Senior Researcher at Roffey
Park for analysing the findings and writing this
comprehensive report
bull Members of the Recruitment Forum Steering
Committee for their input into the survey
design and assistance in piloting the
questionnaire
bull Hays for their support and commitment at
every stage of the research
bull All those who shared examples of their
organisationrsquos practices
We hope that you find the research useful when
considering your own recruitment and retention
practices Please contact us if you have any
questions or ideas based on our findings
(researchcipdcouk)
RESOURCING AND TALENT PLANNING
fOOTNOTES 1 Chi Square = 573 df = 5 p lt 0001 n = 604 2 Rho = 073 p lt 0001 n = 577 3 Rho = 045 p lt 0001 n = 533 4 F = 250 df = 2 p lt 0001 n = 533 5 Chi Square = 180 df = 6 p lt 001 n = 535 6 Chi Square = 71 df = 2 p lt 005 n = 603 7 Chi Square = 230 df = 6 p lt 001 n = 600 8 Chi Square = 91 df = 3 p lt 005 n = 598 9 Chi Square = 129 df = 4 p lt 005 n = 610
10 Rho = 034 p lt 0001 n = 609 11 Chi square = 217 df = 3 p lt 0001 n = 609 12 Chi Square = 609 df = 8 p lt 0001 n = 607 13 Chi Square = 208 df = 3 p lt 0001 n = 560 14 Size of organisation and developing online
careers site Rho = 025 p lt 0001 n = 599 Size of
organisation and employee surveys Rho = 019
p lt 0001 n = 599 15 Chi Square = 167 df = 2 p lt 0001 n = 599
16 Working with charities Chi Square = 80 df = 2 p
lt 005 n = 599 corporate sponsorship Chi Square
= 116 df = 2 p lt 001 n = 599 17 Chi Square = 76 df = 2 p lt 005 n = 599 18 Table 11 also shows that this method is deemed
most effective by public sector organisations but
this effect is due to a greater proportion of
large public sector organisations in our
sample whereas private sector organisations are
more evenly distributed in size 19 Chi square = 109 df = 2 p lt 001 n = 610 20 Chi Square = 279 df = 4 p lt 0001 n = 610 21 Chi Square = 259 df = 6 p lt 0001 n = 598 22 Chi Square = 515 df = 6 p lt 0001 n = 597 22 Chi Square = 177 df = 8 p lt 005 n = 600 22 Chi Square = 339 df = 4 p lt 0001 n = 610 22 Chi Square = 820 df = 4 p lt 0001 n = 610 22 Chi Square = 522 df = 8 p lt 0001 n = 610 22 Rho = 024 p lt 0001 n = 195 22 Chi Square = 166 df = 2 p lt 0001 n = 544
cipd
cou
k2011resou
rcing
and
talentp
lann
ing
survey
40
2011
OTHER TITLES IN THIS SERIES
ABSENCE MANAGEMENT The annual Absence Management survey has been running for eleven years providing useful benchmarking data on absence levels the cost and causes of absence and how organisations are managing absence The latest report is brought to you in partnership with Simplyhealth
EMPLOYEE ATTITUDES TO PAY The annual Employee Attitudes to Pay survey investigates employee attitudes and expectations towards pay and bonuses Now in its third year this survey is carried out by YouGov and focuses on employees in the UK
REWARD MANAGEMENT The annual Reward Management survey has been running for ten years and provides practical insights into current trends practices and issues affecting reward management in the UK It examines strategic reward base and variable pay bonuses incentives pensions reward measurement and total reward issues This report was brought to you in partnership with Benefex
LEARNING AND TALENT DEvELOPMENT The annual Learning and Talent Development survey is now in its thirteenth year and provides valuable commentary on current and future issues and trends It explores employer support for learning talent management employee skills managing and evaluating coaching and training spend
Issu
ed J
une
2011
Ref
eren
ce 5
552
copy C
hart
ered
Inst
itute
of
Pers
onne
l and
Dev
elop
men
t 20
11
Chartered Institute of Personnel and Development
151 The Broadway London SW19 1JQ
Tel 020 8612 6200 Fax 020 8612 6201
Email cipdcipdcouk Website cipdcouk
Incorporated by Royal Charter Registered charity no1079797

cipd
cou
k2011resou
rcing
and
talentp
lann
ing
survey
22
RESOURCING AND TALENT PLANNING
figure 3 Resourcing and talent practices implemented in 2011 and 2010 ( of respondents)
Developing more talent in-house
Continuing to recruit key talentniche areas
Focusing more on retaining rather than recruiting talent
Reducing reliance on recruitment agencies
Use of new mediatechnology to recruit
Investing more time and effort in the quality of candidates we hire
Redeploying people into new roles
Reducing the number of new recruits we hire
Taking actions to improve ways of identifying quality candidates
Increasing the number of interimcontract staff recruited
Reducing our use of external consultants for resourcing and development
Increased recruitment of apprenticesinterns
Implementing a recruitment freeze
Reducing our headcount but preserving key talent
Recruiting talent discarded by competitors
Reducing our headcount and losing key talent
Offering sabbaticals career breaks additional holidays
Reducing employees working hours to avoid making people redundant
8Reducing graduate recruitment 8
6Suspending graduate recruitment 7
36
28
36
28
26
30
35 35
35 15
29 23
28 19
24 12
22 30
22 16
18 11
13 12 12
10
12 10
66
59 46
51
47
46
45
44
0 10 20 30 40 50 60 70 80 Percentage of respondents
2011 2010
Base 582
RESO
UR
CIN
G A
ND
TALE
NT P
LAN
NIN
G 2
011
23
2011 Views on the employment market In little change to last year three-quarters of
organisations report they have noticed an increase
in the number of unsuitable applicants as they have
fewer roles to fill (Figure 4) Far fewer (34) report
that there are too many suitable candidates to
choose from and despite high unemployment over
the past two years more than half (52) believe that
competition for talent is even greater as the pool of
available talent to hire has fallen sharply (2010 41
2009 20) For many organisations there appears a
clear mismatch between the skills they require and
those available in the labour market
Competition for talent appears to be particularly
keen in the private sector Two-thirds (64) of
manufacturing and production organisations
and 55 of private services organisations agree
that competition for talent is even greater now
compared with 39 of the public sector and 34
of not-for-profits21 In contrast the public sector
and not-for-profits are more likely to agree they
have too many suitable candidates to choose
from (61 and 47 respectively compared with
23 of manufacturing and production and 27
of private sector services)22
Three-fifths (62) of respondents agree that the
demand for temporary and contract workers will
increase as employers will be reluctant to take
on permanent staff during uncertain times while
44 agree that part-time workers will become
more appealing to employers who are looking to
cut costs
figure 4 Views on the employment market ( agreeing or strongly agreeing)
With fewer roles to fill we have noticed an increase in the number
of unsuitable applicants
The demand for temporary and contract workers will increase as employers will be reluctant to
take on permanent staff during uncertain times
Employers will use the economic downturn as an opportunity to get rid of poor performers
and bring about culture change
Competition for talent is even greater now as the pool of available talent to hire has
fallen sharply
Part-time workers will become more appealing to employers who are looking to cut costs
Employers are acting too hastily in making people redundant and as a result they will lose too
many employees with valuable knowledge and skills
With fewer roles to fill there are now too many suitable candidates to choose between
The abolition of the Default Retirement Age will mean we recruit fewer people
Employers will look to make older workers over the age of 65 redundant before their younger workers
73 76
54
62 66 66
55 63
72
52 41
20
44 45
52
44 48
53
34 32
23
19 22
27
0 10 20 30 40 50 60 70 80 Percentage of respondents
2011 2010 2009
Base 607 (2011) 475 (2010) 746 (2009)
item added 20102011
24
RESOURCING AND TALENT PLANNING
More than half of respondents (55) across
all sectors believe that employers will use the
economic downturn as an opportunity to get rid of
poor performers and bring about culture change
While high this shows a downward trend on the
past two years (2010 63 2009 72 agree or
strongly agree) perhaps reflecting a slowing in
the number of redundancies Similarly there is
a gradual downward trend in the proportion of
respondents who express concern that employers
are acting too hastily in making people redundant
and as a result they will lose too many employees
with valuable knowledge and skills or that
employers will look to make older workers over the
age of 65 redundant before their younger workers
Nearly a quarter (23) of respondents believe
that the abolition of the Default Retirement Age
will mean they recruit fewer people (48 in the
public sector)23
Implications for talent management The value of effective talent management has
not been lost in the recent attention on reducing
costs Two-fifths (41) of organisations report
that the current economic situation has led
to an increased focus on talent management
(43 in 2010) and only 4 that it has led to a
decreased focus (7 in 2010) with no significant
differences across sectors Unsurprisingly however
the public sector are about twice as likely this
year to report they have reduced their overall
talent management spend due to the downturn
compared with other sectors (Table 18)24
The proportion of organisations that report
the economic downturn has had an impact on
approaches to reward across the business has
slightly reduced compared with last year (54
compared with 61 in 2010) As last year it
appears that organisations across all sectors
are being more selective in who they reward A
smaller proportion of organisations report their
approach to reward for individuals identified as
talent has been affected by the downturn (42)
than report their approach to reward across the
business has been affected (54)
Table 18 Has your overall talent management spend been reduced due to the economic downturn ()
cipd
cou
k2011resou
rcing
and
talentp
lann
ing
survey
Voluntary All community and All
2011 Private sector Public sector not-for-profit 2010
Yes 18 17 32 13 23
No 38 43 16 32 41
NA (no talent management spend) 44 40 52 55 36
Base 617 (2011) 471 (2010)
RESO
UR
CIN
G A
ND
TALE
NT P
LAN
NIN
G 2
011
25
2011
Case study Innovative recruitment and cost saving in the Association of Greater Manchester Authorities
The Association of Greater Manchester Authorities (AGMA) represents the ten local authorities in
Greater Manchester and works in partnership with a wider group of associate councils and public
sector organisations AGMA chief executives and council leaders work together on a range of key
strategic and policy issues which impact on Greater Manchester including resourcing strategies
and recruitment and retention issues
The AGMA initiative in cost reduction in the area of resourcing has been described as lsquoa truly
pioneering example of collaboration between a number of local authoritiesrsquo and is already
delivering against a range of objectives
The initial aim was to make a significant saving on the pound5ndash6 million annual cost of external
media advertising reported in 2008ndash09 and to create a more efficient and effective recruitment
system A shared portal was commissioned to offer a front-end website (wwwyourcounciljobs
couk) with a lsquoback-officersquo e-recruitment system which would give a standardised shared-service
approach for job applicants across councils Some of the benefits for applicants include the ability
to go to one place to register their interest to be able to look in specific categories for jobs
of particular relevance to them to be able to amend an existing application form in order to
apply for a further post and to receive email alerts when new jobs relevant to their interests are
posted In addition communications to job-seekers are now standardised for every council
This approach has seen real benefits across each of the local authorities workflows are now
standardised as every HR team runs identical systems and there is consistency in reporting within
all councils enabling them to benchmark their processes more clearly The councils use this
benchmarking data to make additional improvements and efficiencies
Jayne Whitehead AGMA Category Procurement Manager has project-managed the initiative
with managers represented from each participating authority and describes the process as one
of lsquotrue collaborationrsquo with lsquo100 commitmentrsquo from all the councils involved The benefits
are clear annual media costs are dramatically reduced to approximately pound250000 across ten
partner organisations and there has been a reduction in time-to-hire of 13 days This has had
the knock-on effect of reducing expenditure on agency staff The average cost of a recruitment
advertisement per role was previously pound97400 it is now pound15200 There have also been benefits
outside the original intention including doubling the number of online applications for council
posts with administrative cost savings in HR of approximately pound250000 across the consortium
More than 61000 registered users are now on the system and the councils are successfully filling
their own talent pools of prospective job-seekers Overall the project team is now celebrating a
pound17 million reduction in recruitment expenditure over the past 12 months
(continued)
cipd
cou
k2011resou
rcing
and
talentp
lann
ing
survey
26
RESOURCING AND TALENT PLANNING
There were some challenges in the implementation of this new way of working All the councils
had to be convinced about the benefits of the changes With the implementation of a new IT
system having its own set of challenges the project has taken 12 months to introduce longer
than first anticipated Implementing the changes during a period of radical restructuring in all
councils also proved particularly challenging However Jayne describes how both the need to
make efficiencies and feedback from job-seekers meant that lsquowe had to find a different way of
doing thingsrsquo Jayne also recognises how the neutrality of her own role (each council pays a tenth
of her salary) has been essential in ensuring that the project has been fair to all its participants
offering a centralised shared resource to manage the project
The project is now set to develop yet further with the aim of becoming entirely self-funding
within the next year by accepting advertising from other organisations Two new websites are
planned for recruitment into schools and social care jobs bringing even less reliance on media
and agencies AGMA will also be further building its own talent pool
Jayne describes the initiative as lsquoa true example of what you can do if you collaborate across
authoritiesrsquo Not only the separate councils but also diverse teams and functions including HR IT
procurement communications and marketing have worked together to deliver this innovative
and inspiring project
Information provided by Jayne Whitehead AGMA Category Procurement Manager
2011
3 DIVERSITy
This section examines organisationsrsquo approaches to diversity including the use of formal diversity strategies and the methods used to address diversity issues
Just over half of organisations report they have with just under two-thirds of not-for-profit
a formal diversity strategy showing little change organisations and just two-fifths of private sector
over the past four years (2011 52 2010 55 companies (Table 19)25 Diversity strategies are also
2009 60 2008 55) Consistent with previous more common in larger organisations (regardless
yearsrsquo findings most public sector organisations of sector)26
(90) have a formal diversity strategy compared
Table 19 Does your organisation have a formal diversity strategy ()
Yes No Dont know
All 52 41 7
Sector
Private sector 41 50 8
Public services 90 9 1
Voluntary community and not-for-profit 63 33 4
Number of UK employees
Fewer than 50 45 50 5
50ndash249 43 51 6
250ndash999 48 44 7
1000ndash4999 65 31 4
More than 5000 80 9 11 Base 613
RESO
UR
CIN
G A
ND
TALE
NT P
LAN
NIN
G 2
011
27
28
RESOURCING AND TALENT PLANNING
As was the case last year over three-quarters
of organisations with a formal diversity policy
attempt to address diversity issues through
monitoring recruitment andor staffing
information to obtain data on gender ethnicity
disability age and so on (Table 20) Less than
three-fifths train interviewers to understand what
diversity is about and the impact of stereotypes
Other diversity-focused initiatives are even
less common moreover the figures indicate a
reduction in the use of several methods compared
with previous years The pressures of the recession
may have led to a reduced focus on diversity
Given the links between diversity in the workforce
and productivity organisations that fail to give
this issue the attention it requires may find
themselves at a disadvantage in the future
Traditionally the public sector has tended to lead
the way in terms of diversity practices Again this
year they are significantly more likely to address
diversity issues through monitoring recruitment
andor staffing information through providing
recruitment documents in other formats through
advertising vacancies in different sources to
attract under-represented groups and through
setting recruitment targets to correct a workforce
imbalance Nevertheless they are less likely than
other sectors to actively try to attract talent of all
ages (Table 20) Moreover our figures indicate that
the reduction in the use of several diversity methods
compared with previous years is particularly
pronounced in the public sector The change of
government and budget reduction measures have
led to significant change programmes in many
public sector organisations which may have resulted
in a reduced focus on diversity issues
Table 20 Methods used to address diversity issues in organisations ( with formal diversity strategy)
Voluntary community
Private Public and not-sector services for-profit
2011 2010 2009 2008 2011 2011 2011 survey survey survey survey (2010) (2010) (2010)
Monitoring recruitment andor staffing information to obtain data on gender 78 79 84 83 70 (71) 88 (96) 88 (76) ethnicity disability age any other categories
cipd
cou
k2011resou
rcing
and
talentp
lann
ing
survey
Training interviewers to understand what diversity is about and the impact of stereotypes
57 68 68 60 53 (66) 64 (73) 57 (72)
Actively trying to attract talent of all ages 45 53 32 43
Operating policies that go beyond basic legislative requirements on age gender race disability sexual orientation religion and belief
39 49 52 48 34 (44) 47 (63) 47 (40)
Providing recruitment documents in other 39 41 37 31 24 (22) 64 (77) 47 (52)formats (online large-print audio and so on)
Checking that any tests used are valid reliable and culture-free and were tested on diverse norm groups
36 42 47 34 39 (44) 35 (45) 27 (16)
Advertising vacancies in different sources to 31 37 51 48 22 (30) 44 (53) 41 (32)attract under-represented groups
Using specific imageswords in your recruitment advertising to appeal to a wider audience 29 38 42 42 25 (30) 36 (52) 33 (40)
Making attempts to employ the long-term 19 19 13 29unemployed
Setting recruitment targets to correct a workforce imbalance 9 15 14 12 4 (8) 18 (31) 8 (16)
Base 312 (2011) 253 (2010) 419 (2009) new item added in 2011
RESO
UR
CIN
G A
ND
TALE
NT P
LAN
NIN
G 2
011
29
2011
4 mANAGING LABOUR TURNOVER
Figures from the Office for National Statistics show that UK unemployment rose by 27000 in the three months to the end of January 2011 to 253 million the highest since 1994 When unemployment is high the number of employees leaving organisations voluntarily is expected to decrease Here we examine whether this is happening and how organisations are tackling the issue of employee retention
Among organisations that are able to supply
turnover data the median labour turnover rate
has decreased over the past few years (Table 21)
The median figure however hides differences
across organisations Slightly more organisations
report their turnover has increased in 2010
compared with 2009 (38) than has decreased
(33) while for nearly a third (29) it remained
the same Smaller organisations are more likely
to report their labour turnover has increased and
larger organisations that it has decreased27
As in previous years the majority of turnover (53)
is still attributed to employees leaving voluntarily
(Table 22) As the economy has improved the
median proportion of turnover due to redundancies
has reduced Only 12 of organisations that
provided reasons for leaving made more than ten
redundancies in the previous year compared with
33 in 2010 26 in 2009 and 22 in 2008 A third
(34) of organisations that made redundancies
offered career transition services
While median turnover rates have reduced
across all sectors Table 23 shows that the rate
of voluntary leavers has increased slightly in
the private sector compared with last year but
decreased in the voluntary and public services
sector This reflects improvements in the economic
outlook for the private sector and the widespread
cuts in the public sector which also have a direct
impact on many not-for-profit organisations that
provide services for the public sector
Cost of labour turnover While just over half of organisations calculate
their recruitment costs only 13 calculate the
cost of their labour turnover (2010 14) The
majority of organisations report they do not
calculate these costs (79) while 7 donrsquot know
if they are calculated or not
Nearly half (46) of those who calculate their
turnover costs want to maintain their current
turnover rate while one-fifth (38) want to
reduce turnover during 2011 and 15 want to
increase it
Retaining employees The steps organisations take to retain employees
in their workforce can have a significant impact
on organisational efficiency and success through
30
RESOURCING AND TALENT PLANNING
Table 21 Median rate of labour turnover ()
2011 2010 survey 2009 survey 2008 survey 2007 survey 2006 survey
125 135 157 173 181 183
Base 175 (2011)
Table 22 Median labour turnover rates by reason for leaving ()
2011 survey 2010 survey 2009 survey
Voluntary redundancies 0 0 0
Compulsory redundancies 0 10 05
Dismissedleft involuntarily (including death in service)
07 09 14
Fixed-short-term contracts 0 0 07
Retired 0 04 07
Left voluntarily 66 84 90
Base 154 (2011)
Table 23 Median labour turnover rates by industry sector ()
cipd
cou
k2011resou
rcing
and
talentp
lann
ing
survey
Sector All leavers Voluntary leavers
2011 survey
2010 survey
2009 survey
2011 survey
2010 survey
2009 survey
Manufacturing and production 93 (38) 124 (44) 153 (80) 37 (35) 27 (42) 77 (75)
Private sector services 138 (96) 146 (77) 168 (150) 87 (82) 74 (71) 104 (129)
Public services 85 (28) 86 (19) 126 (52) 34 (10) 58 (15) 76 (45)
Voluntary community not-for-profit 131 (11) 159 (15) 164 (38) 70 (24) 102 (18) 110 (35) Number of respondents shown in brackets
decreasing employee turnover loss of talent and
recruitment and training costs while having a
positive impact on motivation job satisfaction and
the employer brand
Only two-fifths (42) of organisations
experienced no difficulties in retaining staff
during 2010 This figure is similar to last year
(45) but higher than the findings for 2008
when 31 reported they had no retention
difficulties These findings reflect the increased
caution of employees regarding leaving their
jobs during times of economic uncertainty and
high unemployment Supporting this are our
findings that the public (49) and not-for-profit
sectors (49) are more likely to report they had
no difficulties in retaining staff during 2010
compared with the private sector (38)
As in previous years organisations most
commonly have difficulty retaining managers
and professionalsspecialists (Table 24) The
manufacturing and production sector are most
likely to report difficulties retaining technical
2011 staff and the private services sector that they have
most difficulty retaining services staff This may
reflect the higher demand for these categories of
employees in these sectors
While most organisations have taken one or more
steps to address staff retention nearly one in four
organisations (23) report that no specific retention
initiatives were undertaken This is a similar
proportion to last year although substantially higher
than in previous years when retention difficulties
were more common due to a tighter labour market
(Table 25) Public sector organisations are twice
as likely not to have taken any steps to address
retention as those in the private or not for-profit
sectors (39 compared with 20 of private sector
and 16 of not-for-profits)28
The most common methods used to address
retention in 2010 used by nearly two-fifths of
organisations are to improve line managersrsquo
people skills improve learning and development
opportunities and improve the induction process
Improving line managersrsquo people skills and
learning and development opportunities are also
most commonly rated among the top three most
effective retention methods The effectiveness of
improving induction processes is more varied with
22 rating it among the top three most effective
methods and 12 among the top three least
effective methods Views are also mixed regarding
the effectiveness of improved pay It is likely that
employees are motivated by different factors
Employers need to provide a healthy working
environment where employees are treated with
respect and make efforts to match their retention
initiatives with what staff want
Table 24 Retention difficulties by occupational category ()
Voluntary community
Private and All Manufacturing sector Public not-for- All
2011 and production services services profit 2010
Managers and professionals specialists 28 26 29 25 29 27
Technical 21 37 19 17 13 20
Services (customer personal protective and sales) 13 7 21 4 4 12
Administrative secretarial 9 5 8 15 13 7
Senior managersdirectors 7 5 8 10 6 9
Manualcraft workers 6 11 6 3 4 4 Base 601 (2011) 451 (2010)
RESO
UR
CIN
G A
ND
TALE
NT P
LAN
NIN
G 2
011
31
32
RESOURCING AND TALENT PLANNING
Table 25 Steps taken specifically to address staff retention ()
Used in Least Most Used in Used in Used in 2010 effective effective 2009 2008 2007
Improved line managers people skills 39 7 31 42 39 37
Increased learning and development opportunities 38 5 34 35 47 46
Improved induction process 38 12 22 31 45 45
Improved employee involvement 34 8 24 32 35 29
Improved selection techniques 30 7 25 31 42 46
Improved pay 27 11 23 22 42 53
Offered coachingmentoring buddy systems 24 8 14 20 24 22
Improved benefits 21 8 14 19 32 36
Better promotion to employees of the employer brand 18 10 5 15 21 16
Created clearer career paths 18 6 2 21 18 17
Revised the way staff are rewarded so their efforts are 18 4 13 14 19 19 better recognised
Made changes to improve workndash life balance 17 5 13 19 31 30
Improved physical working conditions 15 8 7 13 19 12
Redesigned jobs to make them more satisfying 11 4 8 13 18 14
Increased our use of countershyoffers 4 4 14
No specific initiatives undertaken 23 3 1 27 13 9 Base 559 (2011 survey) 431 (2010 survey) 695 (2009 survey) 710 (2008 survey)
new item added in 2011
cipd
cou
k2011resou
rcing
and
talentp
lann
ing
survey
RESO
UR
CIN
G A
ND
TALE
NT P
LAN
NIN
G 2
011
33
2011
CONCLUSIONS
Looking forward In January 2010 the UK officially emerged from
the longest recession since the 1930s Economic
growth however remains sluggish and the public
sector has embarked on a four-year programme of
the biggest government spending cuts in decades
to address the fiscal deficit
In the labour market unemployment remained
high throughout 2010 Figures from the Office
for National Statistics (ONS) show that UK
unemployment rose by 27000 in the three months
to the end of January 2011 to 253 million the
highest since 1994 While recent months have seen
signs of improvement there are concerns that the
slow growth in the private sector will be unable
to fully compensate for the increasing job losses in
the public sector that will result from the budget
cuts This is supported by the findings from the
CIPDrsquos spring 2011 Labour Market Outlook which
shows the impact on the overall labour market of a
slight rise in private sector recruitment is still being
cancelled out by large-scale public sector job losses
The findings of the CIPDrsquos 2011 Resourcing and
Talent Planning survey reflect the challenges
of the economic environment Organisations
generally have increased their focus on costs On
average organisations spent less on filling each
vacancy and a fifth have reduced their resourcing
budgets and talent management spend In the
public sector the focus on costs and budget
reductions was particularly apparent
The end of the recession has meant fewer
redundancies in 2010 Nevertheless over a third
of public sector and one-fifth of private sector
organisations reduced their headcount The
number of vacancies on offer by organisations
remained as low as in 2009 overall and continued
to decrease in very large organisations particularly
in the public sector
Looking forward private sector growth is expected
to remain slow and the full impact of public
sector budget cuts is still to come Resourcing and
talent management budgets will be further hit
in 2011ndash12 and many public sector organisations
will implement recruitment freezes and reduce
graduate intake and recruitment generally
Resourcing and talent practices are changing to
reflect the stronger focus on costs and reductions
in budgets Particularly in the public sector but
also in the private sector trends indicate a greater
focus on developing talent in-house retaining
rather than recruiting talent and reducing reliance
on recruitment agencies and external consultants
for resourcing and development
Our findings do not present a positive outlook
for the vast number of unemployed A substantial
proportion of organisations reports that the
already low number of vacancies available to them
is likely to be further affected by the abolition
of the Default Retirement Age Yet despite the
high unemployment rate most organisations
reported difficulties in filling vacancies mostly due
to skill shortages We have also seen an increase
in the proportion of organisations reporting
that competition for talent is even greater as the
pool of available talent to hire has fallen sharply
For many organisations there appears a clear
mismatch between the skills they require and
those available in the labour market Some are
concerned this will be exacerbated by the increase
in university tuition fees Some are responding
cipd
cou
k2011resou
rcing
and
talentp
lann
ing
survey
34
RESOURCING AND TALENT PLANNING
by increasing apprenticeship schemes internships
and sponsoring students through university Such
schemes may be aided by the Governmentrsquos recently
announced pound60 million commitment to help boost
youth employment and provide extra support for
apprenticeships and changes to vocational training
and education How far this will go towards meeting
organisationsrsquo skill requirements remains to be seen
On a positive note our findings indicate that talent
management is viewed as more not less important
in difficult times although with reduced budgets
organisations will have to be innovative with
their approach and strategies In order to survive
organisations will need to make certain they focus
beyond the cost-cutting required in the current
environment to ensuring their talent strategies are
aligned to long-term business success
The CIPDrsquos Shaping the Future and Next Generation
HR flagship projects have both explored the
important issues of sustainability Shaping the Future
in particular warns against the dangers of lsquotalent
tunnel visionrsquo taking a short-sighted view on talent
strategies which are solely focused on the needs of
the here and now
Often organisations pay too little attention to
identifying and developing the capabilities that
individuals will need in the long term This implies a
leadershiptalent management capability gap with
too much focus on the operational needs of today
rather than the organisational imperatives
of tomorrow
Itrsquos never too late to start equipping your people
with the skills and knowledge they need to meet
both present and future challenges So what practical
recommendations can we make for resourcing and
talent professionals drawn from our Shaping the
Future evidence
Audit your organisationrsquos current skills and future capabilities If you havenrsquot done so already conduct a thorough
inventory of your organisationrsquos current skills and map
those against the capabilities you are likely to need
in the future Hold forecasting sessions which look at
macro and micro trends how these will impact your
way of working and the changes that will be required
for future success
Build your talent and succession pipeline You also need to be proactively building up your
talent pipelines (horizontally and vertically) so that
you are developing people with future-fit skills and
capabilities A silver lining from the current economic
climate is that more organisations are focusing on
developing internal talent and fully utilising the
skills of their existing workforce Fresh talent is
still important but recruitment strategies should
complement internal pipelines
Maintain a continuous focus on capability-building Capability-building should be part of a continuous
process embedded into policies and practices Across
our case study organisations managers talked about the
need to embed development and skills training as part
of business as usual rather than as a one-off activity
Develop a creative approach to skills and capability development Even when budgets are tight it is essential that
staff get the development they need to ensure they
have the capabilities for their current job role as well
as starting to build those that the organisation will
need in the future Our case study organisations were
focusing strongly on knowledge-sharing enabling
people to learn from others across the organisation
Many of you are already considering alternative
solutions for specialist skill development such as
apprenticeships internal management schemes
summer placements and internships It is also
important to work with universities to ensure that
graduates are developing skills and knowledge which
will help them to succeed in the workplace
RESO
UR
CIN
G A
ND
TALE
NT P
LAN
NIN
G 2
011
35
2011
BACkGROUND TO ThE SURVEy
This survey was conducted in March and April 2011 It was sent to a sample of UK-based HR professionals in the public private and voluntary sectors In total 626 people responded to the survey
This is the fifteenth annual CIPD Resourcing
and Talent Planning survey (formerly known as
the CIPDrsquos Recruitment Retention and Turnover
survey) The survey examines organisationsrsquo
resourcing and talent planning strategies and
practices and the key challenges and issues
they face The survey consists of 45 questions
completed through an online self-completion
questionnaire
The majority of questions remain the same as
previous years to provide useful benchmark
data on topics including recruitment practices
difficulties and costs selection methods diversity
strategies the impact of the economic climate on
resourcing and talent planning practices labour
turnover and retention strategies New question
areas this year examine the employment of
younger workers the length of the recruitment
process the nature of job vacancies relationships
with recruitment partners and the use of
strengths-based approaches to recruitment
A small number of respondents took part in follow-
up telephone interviews to produce mini case
studies on a selection of topics These are presented
in the coloured boxes throughout the report
Sample profile Respondents predominantly work for private
sector organisations with professional services
being particularly well represented but other
sectors are represented in similar proportions to
last year (Table A1)
36
RESOURCING AND TALENT PLANNING
Table A1 Breakdown of respondent organisations by industrial sector Number of respondents
Manufacturing and production 113 19
Agriculture and forestry 1 0
Chemicals oils and pharmaceuticals 9 1
Construction 8 1
Electricity gas and water 4 1
Engineering electronics and metals 38 6
Food drink and tobacco 18 3
General manufacturing 6 1
Mining and quarrying 4 1
Paper and printing 6 1
Textiles 2 0
Other manufacturingproduction 17 3
Private sector services 319 52
Professional services (accountancy advertising consultancy legal etc) 78 13
Finance insurance and real estate 33 5
Hotels catering and leisure 26 4
IT services 26 4
Call centres 3 0
Media (broadcasting and publishing etc) 7 1
Retail and wholesale 40 7
Transport distribution and storage 23 4
Communications 6 1
Other private services 77 13
Public services 100 16
Central government 14 2
Education 12 2
Health 23 4
Local government 22 4
Other public services 29 5
Non-profit organisations 78 13
Care services 9 1
Charity services 32 5
Housing association 17 3
Other voluntary 20 3 Base 610
cipd
cou
k2011resou
rcing
and
talentp
lann
ing
survey
2011 Most respondents work in small to medium-sized
organisations in terms of the number of UK-
based employees but larger organisations are
also represented in similar proportions to last year
(Table A2)
Respondents reported on organisations based
across the UK Three in ten responded for the
whole of the UK while others responded for a
particular regioncountry (see Table A3)
Table A2 Breakdown of sample by organisation size ndash permanent employees in the UK
Fewer than 10 5
10ndash49 12
50ndash249 33
250ndash999 25
1000ndash4999 12
More than 5000 13 Base 610
Table A3 Main region covered by the reply
East Anglia 5
East Midlands 3
West Midlands 5
North-east of England 3
North-west of England 7
South-west of England 6
Yorkshire and Humberside 5
South-east of England (excluding London)
12
London 12
Scotland 6
Wales 3
Northern Ireland 3
Ireland 0
Whole of UK 29 Base 602
Labour turnover A total of 175 survey respondents were able to
supply all the information necessary for us to
calculate labour turnover on a whole-organisation
basis
This report uses the standard lsquocrude wastagersquo
method to calculate the rate of turnover This
method is calculated as follows
Labour turnover =
Number of leavers in a set period
______________________________________ x 100
Average number employed in the same period
(Leavers include those leaving the organisation
by way of voluntary or involuntary severance
redundancies or retirements but does not include
internal transfers)
Readers should be aware that this method has
some shortcomings For example it takes no
account of the characteristics of the workforce or
the length of service of the leaver
Note on statistics and figures used Some respondents did not answer all questions so
where percentages are reported in tables or figures
the respondent lsquobasersquo for that question is given
lsquoAveragersquo in the report is used to refer to the
statistical mean where the data is normally
distributed However the median is used in cases
where the distribution is significantly skewed
When the median is used it is noted
With the exception of labour turnover rates all
figures in tables have been rounded to the nearest
percentage point Due to rounding percentages
may not always total 100
Chi-square (χ2) tests are used to examine whether
differences between groups such as industrial
sectors are significant or likely to be due to
chance Spearmanrsquos Rho correlation (Rho) is used
to examine relationships between variables We
report on statistics at the generally accepted level
of significance plt005
RESO
UR
CIN
G A
ND
TALE
NT P
LAN
NIN
G 2
011
37
38
RESOURCING AND TALENT PLANNING
fURThER SOURCES Of INfORmATION
We produce a range of free factsheets surveys
guides and research reports which are available on
the CIPD website at cipdcoukhrresources
Read our factsheets on Employer Brand
Employee Turnover and Retention
Induction
Outlook series Our quarterly reports Labour Market Outlook
and Employee Outlook look at the employer and
employee perspectives on the labour market and
on workplace issues and trends while HR Outlook
explores priorities and emerging trends for the HR
profession and function
View these reports at
cipdcoukresearchoutlook-series
Talent management Two reports look at talent issues in a recession
difficult economic climate
The War on Talent Talent management under
threat in uncertain times (2009)
Fighting Back through Talent Innovation (2010)
Opening up Talent for Business Success (2010)
looks at the importance of integrating talent
management and diversity
The Talent Perspective What does it feel like to
be talent-managed (2010) looks at the employee
view of talent management
Workforce planning Our guide Workforce Planning Right people right
time right skills (2010) gives advice on developing
workforce planning processes
Diversity Two survey reports and a guide provide practical
advice and information on trends
Diversity in Business A focus for progress (2007)
Managing an Ageing Workforce How employers
are adapting to an older labour market (2010)
Managing Age New edition 2011
Two further reports are available to order from
cipdcoukbookstore
Managing Diversity in Practice Supporting
business goals (2007)
Managing Diversity and the Business Case (2008)
Sign up to receive our e-newsletter at
cipdcoukcipdupdate
cipd
cou
k2011resou
rcing
and
talentp
lann
ing
survey
RESO
UR
CIN
G A
ND
TALE
NT P
LAN
NIN
G 2
011
39
2011
ACkNOwLEDGEmENTS
The CIPD is very grateful to those organisations and
individuals who gave their time to take part in this
research They include
bull Annette Sinclair Senior Researcher at Roffey
Park for analysing the findings and writing this
comprehensive report
bull Members of the Recruitment Forum Steering
Committee for their input into the survey
design and assistance in piloting the
questionnaire
bull Hays for their support and commitment at
every stage of the research
bull All those who shared examples of their
organisationrsquos practices
We hope that you find the research useful when
considering your own recruitment and retention
practices Please contact us if you have any
questions or ideas based on our findings
(researchcipdcouk)
RESOURCING AND TALENT PLANNING
fOOTNOTES 1 Chi Square = 573 df = 5 p lt 0001 n = 604 2 Rho = 073 p lt 0001 n = 577 3 Rho = 045 p lt 0001 n = 533 4 F = 250 df = 2 p lt 0001 n = 533 5 Chi Square = 180 df = 6 p lt 001 n = 535 6 Chi Square = 71 df = 2 p lt 005 n = 603 7 Chi Square = 230 df = 6 p lt 001 n = 600 8 Chi Square = 91 df = 3 p lt 005 n = 598 9 Chi Square = 129 df = 4 p lt 005 n = 610
10 Rho = 034 p lt 0001 n = 609 11 Chi square = 217 df = 3 p lt 0001 n = 609 12 Chi Square = 609 df = 8 p lt 0001 n = 607 13 Chi Square = 208 df = 3 p lt 0001 n = 560 14 Size of organisation and developing online
careers site Rho = 025 p lt 0001 n = 599 Size of
organisation and employee surveys Rho = 019
p lt 0001 n = 599 15 Chi Square = 167 df = 2 p lt 0001 n = 599
16 Working with charities Chi Square = 80 df = 2 p
lt 005 n = 599 corporate sponsorship Chi Square
= 116 df = 2 p lt 001 n = 599 17 Chi Square = 76 df = 2 p lt 005 n = 599 18 Table 11 also shows that this method is deemed
most effective by public sector organisations but
this effect is due to a greater proportion of
large public sector organisations in our
sample whereas private sector organisations are
more evenly distributed in size 19 Chi square = 109 df = 2 p lt 001 n = 610 20 Chi Square = 279 df = 4 p lt 0001 n = 610 21 Chi Square = 259 df = 6 p lt 0001 n = 598 22 Chi Square = 515 df = 6 p lt 0001 n = 597 22 Chi Square = 177 df = 8 p lt 005 n = 600 22 Chi Square = 339 df = 4 p lt 0001 n = 610 22 Chi Square = 820 df = 4 p lt 0001 n = 610 22 Chi Square = 522 df = 8 p lt 0001 n = 610 22 Rho = 024 p lt 0001 n = 195 22 Chi Square = 166 df = 2 p lt 0001 n = 544
cipd
cou
k2011resou
rcing
and
talentp
lann
ing
survey
40
2011
OTHER TITLES IN THIS SERIES
ABSENCE MANAGEMENT The annual Absence Management survey has been running for eleven years providing useful benchmarking data on absence levels the cost and causes of absence and how organisations are managing absence The latest report is brought to you in partnership with Simplyhealth
EMPLOYEE ATTITUDES TO PAY The annual Employee Attitudes to Pay survey investigates employee attitudes and expectations towards pay and bonuses Now in its third year this survey is carried out by YouGov and focuses on employees in the UK
REWARD MANAGEMENT The annual Reward Management survey has been running for ten years and provides practical insights into current trends practices and issues affecting reward management in the UK It examines strategic reward base and variable pay bonuses incentives pensions reward measurement and total reward issues This report was brought to you in partnership with Benefex
LEARNING AND TALENT DEvELOPMENT The annual Learning and Talent Development survey is now in its thirteenth year and provides valuable commentary on current and future issues and trends It explores employer support for learning talent management employee skills managing and evaluating coaching and training spend
Issu
ed J
une
2011
Ref
eren
ce 5
552
copy C
hart
ered
Inst
itute
of
Pers
onne
l and
Dev
elop
men
t 20
11
Chartered Institute of Personnel and Development
151 The Broadway London SW19 1JQ
Tel 020 8612 6200 Fax 020 8612 6201
Email cipdcipdcouk Website cipdcouk
Incorporated by Royal Charter Registered charity no1079797

RESO
UR
CIN
G A
ND
TALE
NT P
LAN
NIN
G 2
011
23
2011 Views on the employment market In little change to last year three-quarters of
organisations report they have noticed an increase
in the number of unsuitable applicants as they have
fewer roles to fill (Figure 4) Far fewer (34) report
that there are too many suitable candidates to
choose from and despite high unemployment over
the past two years more than half (52) believe that
competition for talent is even greater as the pool of
available talent to hire has fallen sharply (2010 41
2009 20) For many organisations there appears a
clear mismatch between the skills they require and
those available in the labour market
Competition for talent appears to be particularly
keen in the private sector Two-thirds (64) of
manufacturing and production organisations
and 55 of private services organisations agree
that competition for talent is even greater now
compared with 39 of the public sector and 34
of not-for-profits21 In contrast the public sector
and not-for-profits are more likely to agree they
have too many suitable candidates to choose
from (61 and 47 respectively compared with
23 of manufacturing and production and 27
of private sector services)22
Three-fifths (62) of respondents agree that the
demand for temporary and contract workers will
increase as employers will be reluctant to take
on permanent staff during uncertain times while
44 agree that part-time workers will become
more appealing to employers who are looking to
cut costs
figure 4 Views on the employment market ( agreeing or strongly agreeing)
With fewer roles to fill we have noticed an increase in the number
of unsuitable applicants
The demand for temporary and contract workers will increase as employers will be reluctant to
take on permanent staff during uncertain times
Employers will use the economic downturn as an opportunity to get rid of poor performers
and bring about culture change
Competition for talent is even greater now as the pool of available talent to hire has
fallen sharply
Part-time workers will become more appealing to employers who are looking to cut costs
Employers are acting too hastily in making people redundant and as a result they will lose too
many employees with valuable knowledge and skills
With fewer roles to fill there are now too many suitable candidates to choose between
The abolition of the Default Retirement Age will mean we recruit fewer people
Employers will look to make older workers over the age of 65 redundant before their younger workers
73 76
54
62 66 66
55 63
72
52 41
20
44 45
52
44 48
53
34 32
23
19 22
27
0 10 20 30 40 50 60 70 80 Percentage of respondents
2011 2010 2009
Base 607 (2011) 475 (2010) 746 (2009)
item added 20102011
24
RESOURCING AND TALENT PLANNING
More than half of respondents (55) across
all sectors believe that employers will use the
economic downturn as an opportunity to get rid of
poor performers and bring about culture change
While high this shows a downward trend on the
past two years (2010 63 2009 72 agree or
strongly agree) perhaps reflecting a slowing in
the number of redundancies Similarly there is
a gradual downward trend in the proportion of
respondents who express concern that employers
are acting too hastily in making people redundant
and as a result they will lose too many employees
with valuable knowledge and skills or that
employers will look to make older workers over the
age of 65 redundant before their younger workers
Nearly a quarter (23) of respondents believe
that the abolition of the Default Retirement Age
will mean they recruit fewer people (48 in the
public sector)23
Implications for talent management The value of effective talent management has
not been lost in the recent attention on reducing
costs Two-fifths (41) of organisations report
that the current economic situation has led
to an increased focus on talent management
(43 in 2010) and only 4 that it has led to a
decreased focus (7 in 2010) with no significant
differences across sectors Unsurprisingly however
the public sector are about twice as likely this
year to report they have reduced their overall
talent management spend due to the downturn
compared with other sectors (Table 18)24
The proportion of organisations that report
the economic downturn has had an impact on
approaches to reward across the business has
slightly reduced compared with last year (54
compared with 61 in 2010) As last year it
appears that organisations across all sectors
are being more selective in who they reward A
smaller proportion of organisations report their
approach to reward for individuals identified as
talent has been affected by the downturn (42)
than report their approach to reward across the
business has been affected (54)
Table 18 Has your overall talent management spend been reduced due to the economic downturn ()
cipd
cou
k2011resou
rcing
and
talentp
lann
ing
survey
Voluntary All community and All
2011 Private sector Public sector not-for-profit 2010
Yes 18 17 32 13 23
No 38 43 16 32 41
NA (no talent management spend) 44 40 52 55 36
Base 617 (2011) 471 (2010)
RESO
UR
CIN
G A
ND
TALE
NT P
LAN
NIN
G 2
011
25
2011
Case study Innovative recruitment and cost saving in the Association of Greater Manchester Authorities
The Association of Greater Manchester Authorities (AGMA) represents the ten local authorities in
Greater Manchester and works in partnership with a wider group of associate councils and public
sector organisations AGMA chief executives and council leaders work together on a range of key
strategic and policy issues which impact on Greater Manchester including resourcing strategies
and recruitment and retention issues
The AGMA initiative in cost reduction in the area of resourcing has been described as lsquoa truly
pioneering example of collaboration between a number of local authoritiesrsquo and is already
delivering against a range of objectives
The initial aim was to make a significant saving on the pound5ndash6 million annual cost of external
media advertising reported in 2008ndash09 and to create a more efficient and effective recruitment
system A shared portal was commissioned to offer a front-end website (wwwyourcounciljobs
couk) with a lsquoback-officersquo e-recruitment system which would give a standardised shared-service
approach for job applicants across councils Some of the benefits for applicants include the ability
to go to one place to register their interest to be able to look in specific categories for jobs
of particular relevance to them to be able to amend an existing application form in order to
apply for a further post and to receive email alerts when new jobs relevant to their interests are
posted In addition communications to job-seekers are now standardised for every council
This approach has seen real benefits across each of the local authorities workflows are now
standardised as every HR team runs identical systems and there is consistency in reporting within
all councils enabling them to benchmark their processes more clearly The councils use this
benchmarking data to make additional improvements and efficiencies
Jayne Whitehead AGMA Category Procurement Manager has project-managed the initiative
with managers represented from each participating authority and describes the process as one
of lsquotrue collaborationrsquo with lsquo100 commitmentrsquo from all the councils involved The benefits
are clear annual media costs are dramatically reduced to approximately pound250000 across ten
partner organisations and there has been a reduction in time-to-hire of 13 days This has had
the knock-on effect of reducing expenditure on agency staff The average cost of a recruitment
advertisement per role was previously pound97400 it is now pound15200 There have also been benefits
outside the original intention including doubling the number of online applications for council
posts with administrative cost savings in HR of approximately pound250000 across the consortium
More than 61000 registered users are now on the system and the councils are successfully filling
their own talent pools of prospective job-seekers Overall the project team is now celebrating a
pound17 million reduction in recruitment expenditure over the past 12 months
(continued)
cipd
cou
k2011resou
rcing
and
talentp
lann
ing
survey
26
RESOURCING AND TALENT PLANNING
There were some challenges in the implementation of this new way of working All the councils
had to be convinced about the benefits of the changes With the implementation of a new IT
system having its own set of challenges the project has taken 12 months to introduce longer
than first anticipated Implementing the changes during a period of radical restructuring in all
councils also proved particularly challenging However Jayne describes how both the need to
make efficiencies and feedback from job-seekers meant that lsquowe had to find a different way of
doing thingsrsquo Jayne also recognises how the neutrality of her own role (each council pays a tenth
of her salary) has been essential in ensuring that the project has been fair to all its participants
offering a centralised shared resource to manage the project
The project is now set to develop yet further with the aim of becoming entirely self-funding
within the next year by accepting advertising from other organisations Two new websites are
planned for recruitment into schools and social care jobs bringing even less reliance on media
and agencies AGMA will also be further building its own talent pool
Jayne describes the initiative as lsquoa true example of what you can do if you collaborate across
authoritiesrsquo Not only the separate councils but also diverse teams and functions including HR IT
procurement communications and marketing have worked together to deliver this innovative
and inspiring project
Information provided by Jayne Whitehead AGMA Category Procurement Manager
2011
3 DIVERSITy
This section examines organisationsrsquo approaches to diversity including the use of formal diversity strategies and the methods used to address diversity issues
Just over half of organisations report they have with just under two-thirds of not-for-profit
a formal diversity strategy showing little change organisations and just two-fifths of private sector
over the past four years (2011 52 2010 55 companies (Table 19)25 Diversity strategies are also
2009 60 2008 55) Consistent with previous more common in larger organisations (regardless
yearsrsquo findings most public sector organisations of sector)26
(90) have a formal diversity strategy compared
Table 19 Does your organisation have a formal diversity strategy ()
Yes No Dont know
All 52 41 7
Sector
Private sector 41 50 8
Public services 90 9 1
Voluntary community and not-for-profit 63 33 4
Number of UK employees
Fewer than 50 45 50 5
50ndash249 43 51 6
250ndash999 48 44 7
1000ndash4999 65 31 4
More than 5000 80 9 11 Base 613
RESO
UR
CIN
G A
ND
TALE
NT P
LAN
NIN
G 2
011
27
28
RESOURCING AND TALENT PLANNING
As was the case last year over three-quarters
of organisations with a formal diversity policy
attempt to address diversity issues through
monitoring recruitment andor staffing
information to obtain data on gender ethnicity
disability age and so on (Table 20) Less than
three-fifths train interviewers to understand what
diversity is about and the impact of stereotypes
Other diversity-focused initiatives are even
less common moreover the figures indicate a
reduction in the use of several methods compared
with previous years The pressures of the recession
may have led to a reduced focus on diversity
Given the links between diversity in the workforce
and productivity organisations that fail to give
this issue the attention it requires may find
themselves at a disadvantage in the future
Traditionally the public sector has tended to lead
the way in terms of diversity practices Again this
year they are significantly more likely to address
diversity issues through monitoring recruitment
andor staffing information through providing
recruitment documents in other formats through
advertising vacancies in different sources to
attract under-represented groups and through
setting recruitment targets to correct a workforce
imbalance Nevertheless they are less likely than
other sectors to actively try to attract talent of all
ages (Table 20) Moreover our figures indicate that
the reduction in the use of several diversity methods
compared with previous years is particularly
pronounced in the public sector The change of
government and budget reduction measures have
led to significant change programmes in many
public sector organisations which may have resulted
in a reduced focus on diversity issues
Table 20 Methods used to address diversity issues in organisations ( with formal diversity strategy)
Voluntary community
Private Public and not-sector services for-profit
2011 2010 2009 2008 2011 2011 2011 survey survey survey survey (2010) (2010) (2010)
Monitoring recruitment andor staffing information to obtain data on gender 78 79 84 83 70 (71) 88 (96) 88 (76) ethnicity disability age any other categories
cipd
cou
k2011resou
rcing
and
talentp
lann
ing
survey
Training interviewers to understand what diversity is about and the impact of stereotypes
57 68 68 60 53 (66) 64 (73) 57 (72)
Actively trying to attract talent of all ages 45 53 32 43
Operating policies that go beyond basic legislative requirements on age gender race disability sexual orientation religion and belief
39 49 52 48 34 (44) 47 (63) 47 (40)
Providing recruitment documents in other 39 41 37 31 24 (22) 64 (77) 47 (52)formats (online large-print audio and so on)
Checking that any tests used are valid reliable and culture-free and were tested on diverse norm groups
36 42 47 34 39 (44) 35 (45) 27 (16)
Advertising vacancies in different sources to 31 37 51 48 22 (30) 44 (53) 41 (32)attract under-represented groups
Using specific imageswords in your recruitment advertising to appeal to a wider audience 29 38 42 42 25 (30) 36 (52) 33 (40)
Making attempts to employ the long-term 19 19 13 29unemployed
Setting recruitment targets to correct a workforce imbalance 9 15 14 12 4 (8) 18 (31) 8 (16)
Base 312 (2011) 253 (2010) 419 (2009) new item added in 2011
RESO
UR
CIN
G A
ND
TALE
NT P
LAN
NIN
G 2
011
29
2011
4 mANAGING LABOUR TURNOVER
Figures from the Office for National Statistics show that UK unemployment rose by 27000 in the three months to the end of January 2011 to 253 million the highest since 1994 When unemployment is high the number of employees leaving organisations voluntarily is expected to decrease Here we examine whether this is happening and how organisations are tackling the issue of employee retention
Among organisations that are able to supply
turnover data the median labour turnover rate
has decreased over the past few years (Table 21)
The median figure however hides differences
across organisations Slightly more organisations
report their turnover has increased in 2010
compared with 2009 (38) than has decreased
(33) while for nearly a third (29) it remained
the same Smaller organisations are more likely
to report their labour turnover has increased and
larger organisations that it has decreased27
As in previous years the majority of turnover (53)
is still attributed to employees leaving voluntarily
(Table 22) As the economy has improved the
median proportion of turnover due to redundancies
has reduced Only 12 of organisations that
provided reasons for leaving made more than ten
redundancies in the previous year compared with
33 in 2010 26 in 2009 and 22 in 2008 A third
(34) of organisations that made redundancies
offered career transition services
While median turnover rates have reduced
across all sectors Table 23 shows that the rate
of voluntary leavers has increased slightly in
the private sector compared with last year but
decreased in the voluntary and public services
sector This reflects improvements in the economic
outlook for the private sector and the widespread
cuts in the public sector which also have a direct
impact on many not-for-profit organisations that
provide services for the public sector
Cost of labour turnover While just over half of organisations calculate
their recruitment costs only 13 calculate the
cost of their labour turnover (2010 14) The
majority of organisations report they do not
calculate these costs (79) while 7 donrsquot know
if they are calculated or not
Nearly half (46) of those who calculate their
turnover costs want to maintain their current
turnover rate while one-fifth (38) want to
reduce turnover during 2011 and 15 want to
increase it
Retaining employees The steps organisations take to retain employees
in their workforce can have a significant impact
on organisational efficiency and success through
30
RESOURCING AND TALENT PLANNING
Table 21 Median rate of labour turnover ()
2011 2010 survey 2009 survey 2008 survey 2007 survey 2006 survey
125 135 157 173 181 183
Base 175 (2011)
Table 22 Median labour turnover rates by reason for leaving ()
2011 survey 2010 survey 2009 survey
Voluntary redundancies 0 0 0
Compulsory redundancies 0 10 05
Dismissedleft involuntarily (including death in service)
07 09 14
Fixed-short-term contracts 0 0 07
Retired 0 04 07
Left voluntarily 66 84 90
Base 154 (2011)
Table 23 Median labour turnover rates by industry sector ()
cipd
cou
k2011resou
rcing
and
talentp
lann
ing
survey
Sector All leavers Voluntary leavers
2011 survey
2010 survey
2009 survey
2011 survey
2010 survey
2009 survey
Manufacturing and production 93 (38) 124 (44) 153 (80) 37 (35) 27 (42) 77 (75)
Private sector services 138 (96) 146 (77) 168 (150) 87 (82) 74 (71) 104 (129)
Public services 85 (28) 86 (19) 126 (52) 34 (10) 58 (15) 76 (45)
Voluntary community not-for-profit 131 (11) 159 (15) 164 (38) 70 (24) 102 (18) 110 (35) Number of respondents shown in brackets
decreasing employee turnover loss of talent and
recruitment and training costs while having a
positive impact on motivation job satisfaction and
the employer brand
Only two-fifths (42) of organisations
experienced no difficulties in retaining staff
during 2010 This figure is similar to last year
(45) but higher than the findings for 2008
when 31 reported they had no retention
difficulties These findings reflect the increased
caution of employees regarding leaving their
jobs during times of economic uncertainty and
high unemployment Supporting this are our
findings that the public (49) and not-for-profit
sectors (49) are more likely to report they had
no difficulties in retaining staff during 2010
compared with the private sector (38)
As in previous years organisations most
commonly have difficulty retaining managers
and professionalsspecialists (Table 24) The
manufacturing and production sector are most
likely to report difficulties retaining technical
2011 staff and the private services sector that they have
most difficulty retaining services staff This may
reflect the higher demand for these categories of
employees in these sectors
While most organisations have taken one or more
steps to address staff retention nearly one in four
organisations (23) report that no specific retention
initiatives were undertaken This is a similar
proportion to last year although substantially higher
than in previous years when retention difficulties
were more common due to a tighter labour market
(Table 25) Public sector organisations are twice
as likely not to have taken any steps to address
retention as those in the private or not for-profit
sectors (39 compared with 20 of private sector
and 16 of not-for-profits)28
The most common methods used to address
retention in 2010 used by nearly two-fifths of
organisations are to improve line managersrsquo
people skills improve learning and development
opportunities and improve the induction process
Improving line managersrsquo people skills and
learning and development opportunities are also
most commonly rated among the top three most
effective retention methods The effectiveness of
improving induction processes is more varied with
22 rating it among the top three most effective
methods and 12 among the top three least
effective methods Views are also mixed regarding
the effectiveness of improved pay It is likely that
employees are motivated by different factors
Employers need to provide a healthy working
environment where employees are treated with
respect and make efforts to match their retention
initiatives with what staff want
Table 24 Retention difficulties by occupational category ()
Voluntary community
Private and All Manufacturing sector Public not-for- All
2011 and production services services profit 2010
Managers and professionals specialists 28 26 29 25 29 27
Technical 21 37 19 17 13 20
Services (customer personal protective and sales) 13 7 21 4 4 12
Administrative secretarial 9 5 8 15 13 7
Senior managersdirectors 7 5 8 10 6 9
Manualcraft workers 6 11 6 3 4 4 Base 601 (2011) 451 (2010)
RESO
UR
CIN
G A
ND
TALE
NT P
LAN
NIN
G 2
011
31
32
RESOURCING AND TALENT PLANNING
Table 25 Steps taken specifically to address staff retention ()
Used in Least Most Used in Used in Used in 2010 effective effective 2009 2008 2007
Improved line managers people skills 39 7 31 42 39 37
Increased learning and development opportunities 38 5 34 35 47 46
Improved induction process 38 12 22 31 45 45
Improved employee involvement 34 8 24 32 35 29
Improved selection techniques 30 7 25 31 42 46
Improved pay 27 11 23 22 42 53
Offered coachingmentoring buddy systems 24 8 14 20 24 22
Improved benefits 21 8 14 19 32 36
Better promotion to employees of the employer brand 18 10 5 15 21 16
Created clearer career paths 18 6 2 21 18 17
Revised the way staff are rewarded so their efforts are 18 4 13 14 19 19 better recognised
Made changes to improve workndash life balance 17 5 13 19 31 30
Improved physical working conditions 15 8 7 13 19 12
Redesigned jobs to make them more satisfying 11 4 8 13 18 14
Increased our use of countershyoffers 4 4 14
No specific initiatives undertaken 23 3 1 27 13 9 Base 559 (2011 survey) 431 (2010 survey) 695 (2009 survey) 710 (2008 survey)
new item added in 2011
cipd
cou
k2011resou
rcing
and
talentp
lann
ing
survey
RESO
UR
CIN
G A
ND
TALE
NT P
LAN
NIN
G 2
011
33
2011
CONCLUSIONS
Looking forward In January 2010 the UK officially emerged from
the longest recession since the 1930s Economic
growth however remains sluggish and the public
sector has embarked on a four-year programme of
the biggest government spending cuts in decades
to address the fiscal deficit
In the labour market unemployment remained
high throughout 2010 Figures from the Office
for National Statistics (ONS) show that UK
unemployment rose by 27000 in the three months
to the end of January 2011 to 253 million the
highest since 1994 While recent months have seen
signs of improvement there are concerns that the
slow growth in the private sector will be unable
to fully compensate for the increasing job losses in
the public sector that will result from the budget
cuts This is supported by the findings from the
CIPDrsquos spring 2011 Labour Market Outlook which
shows the impact on the overall labour market of a
slight rise in private sector recruitment is still being
cancelled out by large-scale public sector job losses
The findings of the CIPDrsquos 2011 Resourcing and
Talent Planning survey reflect the challenges
of the economic environment Organisations
generally have increased their focus on costs On
average organisations spent less on filling each
vacancy and a fifth have reduced their resourcing
budgets and talent management spend In the
public sector the focus on costs and budget
reductions was particularly apparent
The end of the recession has meant fewer
redundancies in 2010 Nevertheless over a third
of public sector and one-fifth of private sector
organisations reduced their headcount The
number of vacancies on offer by organisations
remained as low as in 2009 overall and continued
to decrease in very large organisations particularly
in the public sector
Looking forward private sector growth is expected
to remain slow and the full impact of public
sector budget cuts is still to come Resourcing and
talent management budgets will be further hit
in 2011ndash12 and many public sector organisations
will implement recruitment freezes and reduce
graduate intake and recruitment generally
Resourcing and talent practices are changing to
reflect the stronger focus on costs and reductions
in budgets Particularly in the public sector but
also in the private sector trends indicate a greater
focus on developing talent in-house retaining
rather than recruiting talent and reducing reliance
on recruitment agencies and external consultants
for resourcing and development
Our findings do not present a positive outlook
for the vast number of unemployed A substantial
proportion of organisations reports that the
already low number of vacancies available to them
is likely to be further affected by the abolition
of the Default Retirement Age Yet despite the
high unemployment rate most organisations
reported difficulties in filling vacancies mostly due
to skill shortages We have also seen an increase
in the proportion of organisations reporting
that competition for talent is even greater as the
pool of available talent to hire has fallen sharply
For many organisations there appears a clear
mismatch between the skills they require and
those available in the labour market Some are
concerned this will be exacerbated by the increase
in university tuition fees Some are responding
cipd
cou
k2011resou
rcing
and
talentp
lann
ing
survey
34
RESOURCING AND TALENT PLANNING
by increasing apprenticeship schemes internships
and sponsoring students through university Such
schemes may be aided by the Governmentrsquos recently
announced pound60 million commitment to help boost
youth employment and provide extra support for
apprenticeships and changes to vocational training
and education How far this will go towards meeting
organisationsrsquo skill requirements remains to be seen
On a positive note our findings indicate that talent
management is viewed as more not less important
in difficult times although with reduced budgets
organisations will have to be innovative with
their approach and strategies In order to survive
organisations will need to make certain they focus
beyond the cost-cutting required in the current
environment to ensuring their talent strategies are
aligned to long-term business success
The CIPDrsquos Shaping the Future and Next Generation
HR flagship projects have both explored the
important issues of sustainability Shaping the Future
in particular warns against the dangers of lsquotalent
tunnel visionrsquo taking a short-sighted view on talent
strategies which are solely focused on the needs of
the here and now
Often organisations pay too little attention to
identifying and developing the capabilities that
individuals will need in the long term This implies a
leadershiptalent management capability gap with
too much focus on the operational needs of today
rather than the organisational imperatives
of tomorrow
Itrsquos never too late to start equipping your people
with the skills and knowledge they need to meet
both present and future challenges So what practical
recommendations can we make for resourcing and
talent professionals drawn from our Shaping the
Future evidence
Audit your organisationrsquos current skills and future capabilities If you havenrsquot done so already conduct a thorough
inventory of your organisationrsquos current skills and map
those against the capabilities you are likely to need
in the future Hold forecasting sessions which look at
macro and micro trends how these will impact your
way of working and the changes that will be required
for future success
Build your talent and succession pipeline You also need to be proactively building up your
talent pipelines (horizontally and vertically) so that
you are developing people with future-fit skills and
capabilities A silver lining from the current economic
climate is that more organisations are focusing on
developing internal talent and fully utilising the
skills of their existing workforce Fresh talent is
still important but recruitment strategies should
complement internal pipelines
Maintain a continuous focus on capability-building Capability-building should be part of a continuous
process embedded into policies and practices Across
our case study organisations managers talked about the
need to embed development and skills training as part
of business as usual rather than as a one-off activity
Develop a creative approach to skills and capability development Even when budgets are tight it is essential that
staff get the development they need to ensure they
have the capabilities for their current job role as well
as starting to build those that the organisation will
need in the future Our case study organisations were
focusing strongly on knowledge-sharing enabling
people to learn from others across the organisation
Many of you are already considering alternative
solutions for specialist skill development such as
apprenticeships internal management schemes
summer placements and internships It is also
important to work with universities to ensure that
graduates are developing skills and knowledge which
will help them to succeed in the workplace
RESO
UR
CIN
G A
ND
TALE
NT P
LAN
NIN
G 2
011
35
2011
BACkGROUND TO ThE SURVEy
This survey was conducted in March and April 2011 It was sent to a sample of UK-based HR professionals in the public private and voluntary sectors In total 626 people responded to the survey
This is the fifteenth annual CIPD Resourcing
and Talent Planning survey (formerly known as
the CIPDrsquos Recruitment Retention and Turnover
survey) The survey examines organisationsrsquo
resourcing and talent planning strategies and
practices and the key challenges and issues
they face The survey consists of 45 questions
completed through an online self-completion
questionnaire
The majority of questions remain the same as
previous years to provide useful benchmark
data on topics including recruitment practices
difficulties and costs selection methods diversity
strategies the impact of the economic climate on
resourcing and talent planning practices labour
turnover and retention strategies New question
areas this year examine the employment of
younger workers the length of the recruitment
process the nature of job vacancies relationships
with recruitment partners and the use of
strengths-based approaches to recruitment
A small number of respondents took part in follow-
up telephone interviews to produce mini case
studies on a selection of topics These are presented
in the coloured boxes throughout the report
Sample profile Respondents predominantly work for private
sector organisations with professional services
being particularly well represented but other
sectors are represented in similar proportions to
last year (Table A1)
36
RESOURCING AND TALENT PLANNING
Table A1 Breakdown of respondent organisations by industrial sector Number of respondents
Manufacturing and production 113 19
Agriculture and forestry 1 0
Chemicals oils and pharmaceuticals 9 1
Construction 8 1
Electricity gas and water 4 1
Engineering electronics and metals 38 6
Food drink and tobacco 18 3
General manufacturing 6 1
Mining and quarrying 4 1
Paper and printing 6 1
Textiles 2 0
Other manufacturingproduction 17 3
Private sector services 319 52
Professional services (accountancy advertising consultancy legal etc) 78 13
Finance insurance and real estate 33 5
Hotels catering and leisure 26 4
IT services 26 4
Call centres 3 0
Media (broadcasting and publishing etc) 7 1
Retail and wholesale 40 7
Transport distribution and storage 23 4
Communications 6 1
Other private services 77 13
Public services 100 16
Central government 14 2
Education 12 2
Health 23 4
Local government 22 4
Other public services 29 5
Non-profit organisations 78 13
Care services 9 1
Charity services 32 5
Housing association 17 3
Other voluntary 20 3 Base 610
cipd
cou
k2011resou
rcing
and
talentp
lann
ing
survey
2011 Most respondents work in small to medium-sized
organisations in terms of the number of UK-
based employees but larger organisations are
also represented in similar proportions to last year
(Table A2)
Respondents reported on organisations based
across the UK Three in ten responded for the
whole of the UK while others responded for a
particular regioncountry (see Table A3)
Table A2 Breakdown of sample by organisation size ndash permanent employees in the UK
Fewer than 10 5
10ndash49 12
50ndash249 33
250ndash999 25
1000ndash4999 12
More than 5000 13 Base 610
Table A3 Main region covered by the reply
East Anglia 5
East Midlands 3
West Midlands 5
North-east of England 3
North-west of England 7
South-west of England 6
Yorkshire and Humberside 5
South-east of England (excluding London)
12
London 12
Scotland 6
Wales 3
Northern Ireland 3
Ireland 0
Whole of UK 29 Base 602
Labour turnover A total of 175 survey respondents were able to
supply all the information necessary for us to
calculate labour turnover on a whole-organisation
basis
This report uses the standard lsquocrude wastagersquo
method to calculate the rate of turnover This
method is calculated as follows
Labour turnover =
Number of leavers in a set period
______________________________________ x 100
Average number employed in the same period
(Leavers include those leaving the organisation
by way of voluntary or involuntary severance
redundancies or retirements but does not include
internal transfers)
Readers should be aware that this method has
some shortcomings For example it takes no
account of the characteristics of the workforce or
the length of service of the leaver
Note on statistics and figures used Some respondents did not answer all questions so
where percentages are reported in tables or figures
the respondent lsquobasersquo for that question is given
lsquoAveragersquo in the report is used to refer to the
statistical mean where the data is normally
distributed However the median is used in cases
where the distribution is significantly skewed
When the median is used it is noted
With the exception of labour turnover rates all
figures in tables have been rounded to the nearest
percentage point Due to rounding percentages
may not always total 100
Chi-square (χ2) tests are used to examine whether
differences between groups such as industrial
sectors are significant or likely to be due to
chance Spearmanrsquos Rho correlation (Rho) is used
to examine relationships between variables We
report on statistics at the generally accepted level
of significance plt005
RESO
UR
CIN
G A
ND
TALE
NT P
LAN
NIN
G 2
011
37
38
RESOURCING AND TALENT PLANNING
fURThER SOURCES Of INfORmATION
We produce a range of free factsheets surveys
guides and research reports which are available on
the CIPD website at cipdcoukhrresources
Read our factsheets on Employer Brand
Employee Turnover and Retention
Induction
Outlook series Our quarterly reports Labour Market Outlook
and Employee Outlook look at the employer and
employee perspectives on the labour market and
on workplace issues and trends while HR Outlook
explores priorities and emerging trends for the HR
profession and function
View these reports at
cipdcoukresearchoutlook-series
Talent management Two reports look at talent issues in a recession
difficult economic climate
The War on Talent Talent management under
threat in uncertain times (2009)
Fighting Back through Talent Innovation (2010)
Opening up Talent for Business Success (2010)
looks at the importance of integrating talent
management and diversity
The Talent Perspective What does it feel like to
be talent-managed (2010) looks at the employee
view of talent management
Workforce planning Our guide Workforce Planning Right people right
time right skills (2010) gives advice on developing
workforce planning processes
Diversity Two survey reports and a guide provide practical
advice and information on trends
Diversity in Business A focus for progress (2007)
Managing an Ageing Workforce How employers
are adapting to an older labour market (2010)
Managing Age New edition 2011
Two further reports are available to order from
cipdcoukbookstore
Managing Diversity in Practice Supporting
business goals (2007)
Managing Diversity and the Business Case (2008)
Sign up to receive our e-newsletter at
cipdcoukcipdupdate
cipd
cou
k2011resou
rcing
and
talentp
lann
ing
survey
RESO
UR
CIN
G A
ND
TALE
NT P
LAN
NIN
G 2
011
39
2011
ACkNOwLEDGEmENTS
The CIPD is very grateful to those organisations and
individuals who gave their time to take part in this
research They include
bull Annette Sinclair Senior Researcher at Roffey
Park for analysing the findings and writing this
comprehensive report
bull Members of the Recruitment Forum Steering
Committee for their input into the survey
design and assistance in piloting the
questionnaire
bull Hays for their support and commitment at
every stage of the research
bull All those who shared examples of their
organisationrsquos practices
We hope that you find the research useful when
considering your own recruitment and retention
practices Please contact us if you have any
questions or ideas based on our findings
(researchcipdcouk)
RESOURCING AND TALENT PLANNING
fOOTNOTES 1 Chi Square = 573 df = 5 p lt 0001 n = 604 2 Rho = 073 p lt 0001 n = 577 3 Rho = 045 p lt 0001 n = 533 4 F = 250 df = 2 p lt 0001 n = 533 5 Chi Square = 180 df = 6 p lt 001 n = 535 6 Chi Square = 71 df = 2 p lt 005 n = 603 7 Chi Square = 230 df = 6 p lt 001 n = 600 8 Chi Square = 91 df = 3 p lt 005 n = 598 9 Chi Square = 129 df = 4 p lt 005 n = 610
10 Rho = 034 p lt 0001 n = 609 11 Chi square = 217 df = 3 p lt 0001 n = 609 12 Chi Square = 609 df = 8 p lt 0001 n = 607 13 Chi Square = 208 df = 3 p lt 0001 n = 560 14 Size of organisation and developing online
careers site Rho = 025 p lt 0001 n = 599 Size of
organisation and employee surveys Rho = 019
p lt 0001 n = 599 15 Chi Square = 167 df = 2 p lt 0001 n = 599
16 Working with charities Chi Square = 80 df = 2 p
lt 005 n = 599 corporate sponsorship Chi Square
= 116 df = 2 p lt 001 n = 599 17 Chi Square = 76 df = 2 p lt 005 n = 599 18 Table 11 also shows that this method is deemed
most effective by public sector organisations but
this effect is due to a greater proportion of
large public sector organisations in our
sample whereas private sector organisations are
more evenly distributed in size 19 Chi square = 109 df = 2 p lt 001 n = 610 20 Chi Square = 279 df = 4 p lt 0001 n = 610 21 Chi Square = 259 df = 6 p lt 0001 n = 598 22 Chi Square = 515 df = 6 p lt 0001 n = 597 22 Chi Square = 177 df = 8 p lt 005 n = 600 22 Chi Square = 339 df = 4 p lt 0001 n = 610 22 Chi Square = 820 df = 4 p lt 0001 n = 610 22 Chi Square = 522 df = 8 p lt 0001 n = 610 22 Rho = 024 p lt 0001 n = 195 22 Chi Square = 166 df = 2 p lt 0001 n = 544
cipd
cou
k2011resou
rcing
and
talentp
lann
ing
survey
40
2011
OTHER TITLES IN THIS SERIES
ABSENCE MANAGEMENT The annual Absence Management survey has been running for eleven years providing useful benchmarking data on absence levels the cost and causes of absence and how organisations are managing absence The latest report is brought to you in partnership with Simplyhealth
EMPLOYEE ATTITUDES TO PAY The annual Employee Attitudes to Pay survey investigates employee attitudes and expectations towards pay and bonuses Now in its third year this survey is carried out by YouGov and focuses on employees in the UK
REWARD MANAGEMENT The annual Reward Management survey has been running for ten years and provides practical insights into current trends practices and issues affecting reward management in the UK It examines strategic reward base and variable pay bonuses incentives pensions reward measurement and total reward issues This report was brought to you in partnership with Benefex
LEARNING AND TALENT DEvELOPMENT The annual Learning and Talent Development survey is now in its thirteenth year and provides valuable commentary on current and future issues and trends It explores employer support for learning talent management employee skills managing and evaluating coaching and training spend
Issu
ed J
une
2011
Ref
eren
ce 5
552
copy C
hart
ered
Inst
itute
of
Pers
onne
l and
Dev
elop
men
t 20
11
Chartered Institute of Personnel and Development
151 The Broadway London SW19 1JQ
Tel 020 8612 6200 Fax 020 8612 6201
Email cipdcipdcouk Website cipdcouk
Incorporated by Royal Charter Registered charity no1079797

RESO
UR
CIN
G A
ND
TALE
NT P
LAN
NIN
G 2
011
25
2011
Case study Innovative recruitment and cost saving in the Association of Greater Manchester Authorities
The Association of Greater Manchester Authorities (AGMA) represents the ten local authorities in
Greater Manchester and works in partnership with a wider group of associate councils and public
sector organisations AGMA chief executives and council leaders work together on a range of key
strategic and policy issues which impact on Greater Manchester including resourcing strategies
and recruitment and retention issues
The AGMA initiative in cost reduction in the area of resourcing has been described as lsquoa truly
pioneering example of collaboration between a number of local authoritiesrsquo and is already
delivering against a range of objectives
The initial aim was to make a significant saving on the pound5ndash6 million annual cost of external
media advertising reported in 2008ndash09 and to create a more efficient and effective recruitment
system A shared portal was commissioned to offer a front-end website (wwwyourcounciljobs
couk) with a lsquoback-officersquo e-recruitment system which would give a standardised shared-service
approach for job applicants across councils Some of the benefits for applicants include the ability
to go to one place to register their interest to be able to look in specific categories for jobs
of particular relevance to them to be able to amend an existing application form in order to
apply for a further post and to receive email alerts when new jobs relevant to their interests are
posted In addition communications to job-seekers are now standardised for every council
This approach has seen real benefits across each of the local authorities workflows are now
standardised as every HR team runs identical systems and there is consistency in reporting within
all councils enabling them to benchmark their processes more clearly The councils use this
benchmarking data to make additional improvements and efficiencies
Jayne Whitehead AGMA Category Procurement Manager has project-managed the initiative
with managers represented from each participating authority and describes the process as one
of lsquotrue collaborationrsquo with lsquo100 commitmentrsquo from all the councils involved The benefits
are clear annual media costs are dramatically reduced to approximately pound250000 across ten
partner organisations and there has been a reduction in time-to-hire of 13 days This has had
the knock-on effect of reducing expenditure on agency staff The average cost of a recruitment
advertisement per role was previously pound97400 it is now pound15200 There have also been benefits
outside the original intention including doubling the number of online applications for council
posts with administrative cost savings in HR of approximately pound250000 across the consortium
More than 61000 registered users are now on the system and the councils are successfully filling
their own talent pools of prospective job-seekers Overall the project team is now celebrating a
pound17 million reduction in recruitment expenditure over the past 12 months
(continued)
cipd
cou
k2011resou
rcing
and
talentp
lann
ing
survey
26
RESOURCING AND TALENT PLANNING
There were some challenges in the implementation of this new way of working All the councils
had to be convinced about the benefits of the changes With the implementation of a new IT
system having its own set of challenges the project has taken 12 months to introduce longer
than first anticipated Implementing the changes during a period of radical restructuring in all
councils also proved particularly challenging However Jayne describes how both the need to
make efficiencies and feedback from job-seekers meant that lsquowe had to find a different way of
doing thingsrsquo Jayne also recognises how the neutrality of her own role (each council pays a tenth
of her salary) has been essential in ensuring that the project has been fair to all its participants
offering a centralised shared resource to manage the project
The project is now set to develop yet further with the aim of becoming entirely self-funding
within the next year by accepting advertising from other organisations Two new websites are
planned for recruitment into schools and social care jobs bringing even less reliance on media
and agencies AGMA will also be further building its own talent pool
Jayne describes the initiative as lsquoa true example of what you can do if you collaborate across
authoritiesrsquo Not only the separate councils but also diverse teams and functions including HR IT
procurement communications and marketing have worked together to deliver this innovative
and inspiring project
Information provided by Jayne Whitehead AGMA Category Procurement Manager
2011
3 DIVERSITy
This section examines organisationsrsquo approaches to diversity including the use of formal diversity strategies and the methods used to address diversity issues
Just over half of organisations report they have with just under two-thirds of not-for-profit
a formal diversity strategy showing little change organisations and just two-fifths of private sector
over the past four years (2011 52 2010 55 companies (Table 19)25 Diversity strategies are also
2009 60 2008 55) Consistent with previous more common in larger organisations (regardless
yearsrsquo findings most public sector organisations of sector)26
(90) have a formal diversity strategy compared
Table 19 Does your organisation have a formal diversity strategy ()
Yes No Dont know
All 52 41 7
Sector
Private sector 41 50 8
Public services 90 9 1
Voluntary community and not-for-profit 63 33 4
Number of UK employees
Fewer than 50 45 50 5
50ndash249 43 51 6
250ndash999 48 44 7
1000ndash4999 65 31 4
More than 5000 80 9 11 Base 613
RESO
UR
CIN
G A
ND
TALE
NT P
LAN
NIN
G 2
011
27
28
RESOURCING AND TALENT PLANNING
As was the case last year over three-quarters
of organisations with a formal diversity policy
attempt to address diversity issues through
monitoring recruitment andor staffing
information to obtain data on gender ethnicity
disability age and so on (Table 20) Less than
three-fifths train interviewers to understand what
diversity is about and the impact of stereotypes
Other diversity-focused initiatives are even
less common moreover the figures indicate a
reduction in the use of several methods compared
with previous years The pressures of the recession
may have led to a reduced focus on diversity
Given the links between diversity in the workforce
and productivity organisations that fail to give
this issue the attention it requires may find
themselves at a disadvantage in the future
Traditionally the public sector has tended to lead
the way in terms of diversity practices Again this
year they are significantly more likely to address
diversity issues through monitoring recruitment
andor staffing information through providing
recruitment documents in other formats through
advertising vacancies in different sources to
attract under-represented groups and through
setting recruitment targets to correct a workforce
imbalance Nevertheless they are less likely than
other sectors to actively try to attract talent of all
ages (Table 20) Moreover our figures indicate that
the reduction in the use of several diversity methods
compared with previous years is particularly
pronounced in the public sector The change of
government and budget reduction measures have
led to significant change programmes in many
public sector organisations which may have resulted
in a reduced focus on diversity issues
Table 20 Methods used to address diversity issues in organisations ( with formal diversity strategy)
Voluntary community
Private Public and not-sector services for-profit
2011 2010 2009 2008 2011 2011 2011 survey survey survey survey (2010) (2010) (2010)
Monitoring recruitment andor staffing information to obtain data on gender 78 79 84 83 70 (71) 88 (96) 88 (76) ethnicity disability age any other categories
cipd
cou
k2011resou
rcing
and
talentp
lann
ing
survey
Training interviewers to understand what diversity is about and the impact of stereotypes
57 68 68 60 53 (66) 64 (73) 57 (72)
Actively trying to attract talent of all ages 45 53 32 43
Operating policies that go beyond basic legislative requirements on age gender race disability sexual orientation religion and belief
39 49 52 48 34 (44) 47 (63) 47 (40)
Providing recruitment documents in other 39 41 37 31 24 (22) 64 (77) 47 (52)formats (online large-print audio and so on)
Checking that any tests used are valid reliable and culture-free and were tested on diverse norm groups
36 42 47 34 39 (44) 35 (45) 27 (16)
Advertising vacancies in different sources to 31 37 51 48 22 (30) 44 (53) 41 (32)attract under-represented groups
Using specific imageswords in your recruitment advertising to appeal to a wider audience 29 38 42 42 25 (30) 36 (52) 33 (40)
Making attempts to employ the long-term 19 19 13 29unemployed
Setting recruitment targets to correct a workforce imbalance 9 15 14 12 4 (8) 18 (31) 8 (16)
Base 312 (2011) 253 (2010) 419 (2009) new item added in 2011
RESO
UR
CIN
G A
ND
TALE
NT P
LAN
NIN
G 2
011
29
2011
4 mANAGING LABOUR TURNOVER
Figures from the Office for National Statistics show that UK unemployment rose by 27000 in the three months to the end of January 2011 to 253 million the highest since 1994 When unemployment is high the number of employees leaving organisations voluntarily is expected to decrease Here we examine whether this is happening and how organisations are tackling the issue of employee retention
Among organisations that are able to supply
turnover data the median labour turnover rate
has decreased over the past few years (Table 21)
The median figure however hides differences
across organisations Slightly more organisations
report their turnover has increased in 2010
compared with 2009 (38) than has decreased
(33) while for nearly a third (29) it remained
the same Smaller organisations are more likely
to report their labour turnover has increased and
larger organisations that it has decreased27
As in previous years the majority of turnover (53)
is still attributed to employees leaving voluntarily
(Table 22) As the economy has improved the
median proportion of turnover due to redundancies
has reduced Only 12 of organisations that
provided reasons for leaving made more than ten
redundancies in the previous year compared with
33 in 2010 26 in 2009 and 22 in 2008 A third
(34) of organisations that made redundancies
offered career transition services
While median turnover rates have reduced
across all sectors Table 23 shows that the rate
of voluntary leavers has increased slightly in
the private sector compared with last year but
decreased in the voluntary and public services
sector This reflects improvements in the economic
outlook for the private sector and the widespread
cuts in the public sector which also have a direct
impact on many not-for-profit organisations that
provide services for the public sector
Cost of labour turnover While just over half of organisations calculate
their recruitment costs only 13 calculate the
cost of their labour turnover (2010 14) The
majority of organisations report they do not
calculate these costs (79) while 7 donrsquot know
if they are calculated or not
Nearly half (46) of those who calculate their
turnover costs want to maintain their current
turnover rate while one-fifth (38) want to
reduce turnover during 2011 and 15 want to
increase it
Retaining employees The steps organisations take to retain employees
in their workforce can have a significant impact
on organisational efficiency and success through
30
RESOURCING AND TALENT PLANNING
Table 21 Median rate of labour turnover ()
2011 2010 survey 2009 survey 2008 survey 2007 survey 2006 survey
125 135 157 173 181 183
Base 175 (2011)
Table 22 Median labour turnover rates by reason for leaving ()
2011 survey 2010 survey 2009 survey
Voluntary redundancies 0 0 0
Compulsory redundancies 0 10 05
Dismissedleft involuntarily (including death in service)
07 09 14
Fixed-short-term contracts 0 0 07
Retired 0 04 07
Left voluntarily 66 84 90
Base 154 (2011)
Table 23 Median labour turnover rates by industry sector ()
cipd
cou
k2011resou
rcing
and
talentp
lann
ing
survey
Sector All leavers Voluntary leavers
2011 survey
2010 survey
2009 survey
2011 survey
2010 survey
2009 survey
Manufacturing and production 93 (38) 124 (44) 153 (80) 37 (35) 27 (42) 77 (75)
Private sector services 138 (96) 146 (77) 168 (150) 87 (82) 74 (71) 104 (129)
Public services 85 (28) 86 (19) 126 (52) 34 (10) 58 (15) 76 (45)
Voluntary community not-for-profit 131 (11) 159 (15) 164 (38) 70 (24) 102 (18) 110 (35) Number of respondents shown in brackets
decreasing employee turnover loss of talent and
recruitment and training costs while having a
positive impact on motivation job satisfaction and
the employer brand
Only two-fifths (42) of organisations
experienced no difficulties in retaining staff
during 2010 This figure is similar to last year
(45) but higher than the findings for 2008
when 31 reported they had no retention
difficulties These findings reflect the increased
caution of employees regarding leaving their
jobs during times of economic uncertainty and
high unemployment Supporting this are our
findings that the public (49) and not-for-profit
sectors (49) are more likely to report they had
no difficulties in retaining staff during 2010
compared with the private sector (38)
As in previous years organisations most
commonly have difficulty retaining managers
and professionalsspecialists (Table 24) The
manufacturing and production sector are most
likely to report difficulties retaining technical
2011 staff and the private services sector that they have
most difficulty retaining services staff This may
reflect the higher demand for these categories of
employees in these sectors
While most organisations have taken one or more
steps to address staff retention nearly one in four
organisations (23) report that no specific retention
initiatives were undertaken This is a similar
proportion to last year although substantially higher
than in previous years when retention difficulties
were more common due to a tighter labour market
(Table 25) Public sector organisations are twice
as likely not to have taken any steps to address
retention as those in the private or not for-profit
sectors (39 compared with 20 of private sector
and 16 of not-for-profits)28
The most common methods used to address
retention in 2010 used by nearly two-fifths of
organisations are to improve line managersrsquo
people skills improve learning and development
opportunities and improve the induction process
Improving line managersrsquo people skills and
learning and development opportunities are also
most commonly rated among the top three most
effective retention methods The effectiveness of
improving induction processes is more varied with
22 rating it among the top three most effective
methods and 12 among the top three least
effective methods Views are also mixed regarding
the effectiveness of improved pay It is likely that
employees are motivated by different factors
Employers need to provide a healthy working
environment where employees are treated with
respect and make efforts to match their retention
initiatives with what staff want
Table 24 Retention difficulties by occupational category ()
Voluntary community
Private and All Manufacturing sector Public not-for- All
2011 and production services services profit 2010
Managers and professionals specialists 28 26 29 25 29 27
Technical 21 37 19 17 13 20
Services (customer personal protective and sales) 13 7 21 4 4 12
Administrative secretarial 9 5 8 15 13 7
Senior managersdirectors 7 5 8 10 6 9
Manualcraft workers 6 11 6 3 4 4 Base 601 (2011) 451 (2010)
RESO
UR
CIN
G A
ND
TALE
NT P
LAN
NIN
G 2
011
31
32
RESOURCING AND TALENT PLANNING
Table 25 Steps taken specifically to address staff retention ()
Used in Least Most Used in Used in Used in 2010 effective effective 2009 2008 2007
Improved line managers people skills 39 7 31 42 39 37
Increased learning and development opportunities 38 5 34 35 47 46
Improved induction process 38 12 22 31 45 45
Improved employee involvement 34 8 24 32 35 29
Improved selection techniques 30 7 25 31 42 46
Improved pay 27 11 23 22 42 53
Offered coachingmentoring buddy systems 24 8 14 20 24 22
Improved benefits 21 8 14 19 32 36
Better promotion to employees of the employer brand 18 10 5 15 21 16
Created clearer career paths 18 6 2 21 18 17
Revised the way staff are rewarded so their efforts are 18 4 13 14 19 19 better recognised
Made changes to improve workndash life balance 17 5 13 19 31 30
Improved physical working conditions 15 8 7 13 19 12
Redesigned jobs to make them more satisfying 11 4 8 13 18 14
Increased our use of countershyoffers 4 4 14
No specific initiatives undertaken 23 3 1 27 13 9 Base 559 (2011 survey) 431 (2010 survey) 695 (2009 survey) 710 (2008 survey)
new item added in 2011
cipd
cou
k2011resou
rcing
and
talentp
lann
ing
survey
RESO
UR
CIN
G A
ND
TALE
NT P
LAN
NIN
G 2
011
33
2011
CONCLUSIONS
Looking forward In January 2010 the UK officially emerged from
the longest recession since the 1930s Economic
growth however remains sluggish and the public
sector has embarked on a four-year programme of
the biggest government spending cuts in decades
to address the fiscal deficit
In the labour market unemployment remained
high throughout 2010 Figures from the Office
for National Statistics (ONS) show that UK
unemployment rose by 27000 in the three months
to the end of January 2011 to 253 million the
highest since 1994 While recent months have seen
signs of improvement there are concerns that the
slow growth in the private sector will be unable
to fully compensate for the increasing job losses in
the public sector that will result from the budget
cuts This is supported by the findings from the
CIPDrsquos spring 2011 Labour Market Outlook which
shows the impact on the overall labour market of a
slight rise in private sector recruitment is still being
cancelled out by large-scale public sector job losses
The findings of the CIPDrsquos 2011 Resourcing and
Talent Planning survey reflect the challenges
of the economic environment Organisations
generally have increased their focus on costs On
average organisations spent less on filling each
vacancy and a fifth have reduced their resourcing
budgets and talent management spend In the
public sector the focus on costs and budget
reductions was particularly apparent
The end of the recession has meant fewer
redundancies in 2010 Nevertheless over a third
of public sector and one-fifth of private sector
organisations reduced their headcount The
number of vacancies on offer by organisations
remained as low as in 2009 overall and continued
to decrease in very large organisations particularly
in the public sector
Looking forward private sector growth is expected
to remain slow and the full impact of public
sector budget cuts is still to come Resourcing and
talent management budgets will be further hit
in 2011ndash12 and many public sector organisations
will implement recruitment freezes and reduce
graduate intake and recruitment generally
Resourcing and talent practices are changing to
reflect the stronger focus on costs and reductions
in budgets Particularly in the public sector but
also in the private sector trends indicate a greater
focus on developing talent in-house retaining
rather than recruiting talent and reducing reliance
on recruitment agencies and external consultants
for resourcing and development
Our findings do not present a positive outlook
for the vast number of unemployed A substantial
proportion of organisations reports that the
already low number of vacancies available to them
is likely to be further affected by the abolition
of the Default Retirement Age Yet despite the
high unemployment rate most organisations
reported difficulties in filling vacancies mostly due
to skill shortages We have also seen an increase
in the proportion of organisations reporting
that competition for talent is even greater as the
pool of available talent to hire has fallen sharply
For many organisations there appears a clear
mismatch between the skills they require and
those available in the labour market Some are
concerned this will be exacerbated by the increase
in university tuition fees Some are responding
cipd
cou
k2011resou
rcing
and
talentp
lann
ing
survey
34
RESOURCING AND TALENT PLANNING
by increasing apprenticeship schemes internships
and sponsoring students through university Such
schemes may be aided by the Governmentrsquos recently
announced pound60 million commitment to help boost
youth employment and provide extra support for
apprenticeships and changes to vocational training
and education How far this will go towards meeting
organisationsrsquo skill requirements remains to be seen
On a positive note our findings indicate that talent
management is viewed as more not less important
in difficult times although with reduced budgets
organisations will have to be innovative with
their approach and strategies In order to survive
organisations will need to make certain they focus
beyond the cost-cutting required in the current
environment to ensuring their talent strategies are
aligned to long-term business success
The CIPDrsquos Shaping the Future and Next Generation
HR flagship projects have both explored the
important issues of sustainability Shaping the Future
in particular warns against the dangers of lsquotalent
tunnel visionrsquo taking a short-sighted view on talent
strategies which are solely focused on the needs of
the here and now
Often organisations pay too little attention to
identifying and developing the capabilities that
individuals will need in the long term This implies a
leadershiptalent management capability gap with
too much focus on the operational needs of today
rather than the organisational imperatives
of tomorrow
Itrsquos never too late to start equipping your people
with the skills and knowledge they need to meet
both present and future challenges So what practical
recommendations can we make for resourcing and
talent professionals drawn from our Shaping the
Future evidence
Audit your organisationrsquos current skills and future capabilities If you havenrsquot done so already conduct a thorough
inventory of your organisationrsquos current skills and map
those against the capabilities you are likely to need
in the future Hold forecasting sessions which look at
macro and micro trends how these will impact your
way of working and the changes that will be required
for future success
Build your talent and succession pipeline You also need to be proactively building up your
talent pipelines (horizontally and vertically) so that
you are developing people with future-fit skills and
capabilities A silver lining from the current economic
climate is that more organisations are focusing on
developing internal talent and fully utilising the
skills of their existing workforce Fresh talent is
still important but recruitment strategies should
complement internal pipelines
Maintain a continuous focus on capability-building Capability-building should be part of a continuous
process embedded into policies and practices Across
our case study organisations managers talked about the
need to embed development and skills training as part
of business as usual rather than as a one-off activity
Develop a creative approach to skills and capability development Even when budgets are tight it is essential that
staff get the development they need to ensure they
have the capabilities for their current job role as well
as starting to build those that the organisation will
need in the future Our case study organisations were
focusing strongly on knowledge-sharing enabling
people to learn from others across the organisation
Many of you are already considering alternative
solutions for specialist skill development such as
apprenticeships internal management schemes
summer placements and internships It is also
important to work with universities to ensure that
graduates are developing skills and knowledge which
will help them to succeed in the workplace
RESO
UR
CIN
G A
ND
TALE
NT P
LAN
NIN
G 2
011
35
2011
BACkGROUND TO ThE SURVEy
This survey was conducted in March and April 2011 It was sent to a sample of UK-based HR professionals in the public private and voluntary sectors In total 626 people responded to the survey
This is the fifteenth annual CIPD Resourcing
and Talent Planning survey (formerly known as
the CIPDrsquos Recruitment Retention and Turnover
survey) The survey examines organisationsrsquo
resourcing and talent planning strategies and
practices and the key challenges and issues
they face The survey consists of 45 questions
completed through an online self-completion
questionnaire
The majority of questions remain the same as
previous years to provide useful benchmark
data on topics including recruitment practices
difficulties and costs selection methods diversity
strategies the impact of the economic climate on
resourcing and talent planning practices labour
turnover and retention strategies New question
areas this year examine the employment of
younger workers the length of the recruitment
process the nature of job vacancies relationships
with recruitment partners and the use of
strengths-based approaches to recruitment
A small number of respondents took part in follow-
up telephone interviews to produce mini case
studies on a selection of topics These are presented
in the coloured boxes throughout the report
Sample profile Respondents predominantly work for private
sector organisations with professional services
being particularly well represented but other
sectors are represented in similar proportions to
last year (Table A1)
36
RESOURCING AND TALENT PLANNING
Table A1 Breakdown of respondent organisations by industrial sector Number of respondents
Manufacturing and production 113 19
Agriculture and forestry 1 0
Chemicals oils and pharmaceuticals 9 1
Construction 8 1
Electricity gas and water 4 1
Engineering electronics and metals 38 6
Food drink and tobacco 18 3
General manufacturing 6 1
Mining and quarrying 4 1
Paper and printing 6 1
Textiles 2 0
Other manufacturingproduction 17 3
Private sector services 319 52
Professional services (accountancy advertising consultancy legal etc) 78 13
Finance insurance and real estate 33 5
Hotels catering and leisure 26 4
IT services 26 4
Call centres 3 0
Media (broadcasting and publishing etc) 7 1
Retail and wholesale 40 7
Transport distribution and storage 23 4
Communications 6 1
Other private services 77 13
Public services 100 16
Central government 14 2
Education 12 2
Health 23 4
Local government 22 4
Other public services 29 5
Non-profit organisations 78 13
Care services 9 1
Charity services 32 5
Housing association 17 3
Other voluntary 20 3 Base 610
cipd
cou
k2011resou
rcing
and
talentp
lann
ing
survey
2011 Most respondents work in small to medium-sized
organisations in terms of the number of UK-
based employees but larger organisations are
also represented in similar proportions to last year
(Table A2)
Respondents reported on organisations based
across the UK Three in ten responded for the
whole of the UK while others responded for a
particular regioncountry (see Table A3)
Table A2 Breakdown of sample by organisation size ndash permanent employees in the UK
Fewer than 10 5
10ndash49 12
50ndash249 33
250ndash999 25
1000ndash4999 12
More than 5000 13 Base 610
Table A3 Main region covered by the reply
East Anglia 5
East Midlands 3
West Midlands 5
North-east of England 3
North-west of England 7
South-west of England 6
Yorkshire and Humberside 5
South-east of England (excluding London)
12
London 12
Scotland 6
Wales 3
Northern Ireland 3
Ireland 0
Whole of UK 29 Base 602
Labour turnover A total of 175 survey respondents were able to
supply all the information necessary for us to
calculate labour turnover on a whole-organisation
basis
This report uses the standard lsquocrude wastagersquo
method to calculate the rate of turnover This
method is calculated as follows
Labour turnover =
Number of leavers in a set period
______________________________________ x 100
Average number employed in the same period
(Leavers include those leaving the organisation
by way of voluntary or involuntary severance
redundancies or retirements but does not include
internal transfers)
Readers should be aware that this method has
some shortcomings For example it takes no
account of the characteristics of the workforce or
the length of service of the leaver
Note on statistics and figures used Some respondents did not answer all questions so
where percentages are reported in tables or figures
the respondent lsquobasersquo for that question is given
lsquoAveragersquo in the report is used to refer to the
statistical mean where the data is normally
distributed However the median is used in cases
where the distribution is significantly skewed
When the median is used it is noted
With the exception of labour turnover rates all
figures in tables have been rounded to the nearest
percentage point Due to rounding percentages
may not always total 100
Chi-square (χ2) tests are used to examine whether
differences between groups such as industrial
sectors are significant or likely to be due to
chance Spearmanrsquos Rho correlation (Rho) is used
to examine relationships between variables We
report on statistics at the generally accepted level
of significance plt005
RESO
UR
CIN
G A
ND
TALE
NT P
LAN
NIN
G 2
011
37
38
RESOURCING AND TALENT PLANNING
fURThER SOURCES Of INfORmATION
We produce a range of free factsheets surveys
guides and research reports which are available on
the CIPD website at cipdcoukhrresources
Read our factsheets on Employer Brand
Employee Turnover and Retention
Induction
Outlook series Our quarterly reports Labour Market Outlook
and Employee Outlook look at the employer and
employee perspectives on the labour market and
on workplace issues and trends while HR Outlook
explores priorities and emerging trends for the HR
profession and function
View these reports at
cipdcoukresearchoutlook-series
Talent management Two reports look at talent issues in a recession
difficult economic climate
The War on Talent Talent management under
threat in uncertain times (2009)
Fighting Back through Talent Innovation (2010)
Opening up Talent for Business Success (2010)
looks at the importance of integrating talent
management and diversity
The Talent Perspective What does it feel like to
be talent-managed (2010) looks at the employee
view of talent management
Workforce planning Our guide Workforce Planning Right people right
time right skills (2010) gives advice on developing
workforce planning processes
Diversity Two survey reports and a guide provide practical
advice and information on trends
Diversity in Business A focus for progress (2007)
Managing an Ageing Workforce How employers
are adapting to an older labour market (2010)
Managing Age New edition 2011
Two further reports are available to order from
cipdcoukbookstore
Managing Diversity in Practice Supporting
business goals (2007)
Managing Diversity and the Business Case (2008)
Sign up to receive our e-newsletter at
cipdcoukcipdupdate
cipd
cou
k2011resou
rcing
and
talentp
lann
ing
survey
RESO
UR
CIN
G A
ND
TALE
NT P
LAN
NIN
G 2
011
39
2011
ACkNOwLEDGEmENTS
The CIPD is very grateful to those organisations and
individuals who gave their time to take part in this
research They include
bull Annette Sinclair Senior Researcher at Roffey
Park for analysing the findings and writing this
comprehensive report
bull Members of the Recruitment Forum Steering
Committee for their input into the survey
design and assistance in piloting the
questionnaire
bull Hays for their support and commitment at
every stage of the research
bull All those who shared examples of their
organisationrsquos practices
We hope that you find the research useful when
considering your own recruitment and retention
practices Please contact us if you have any
questions or ideas based on our findings
(researchcipdcouk)
RESOURCING AND TALENT PLANNING
fOOTNOTES 1 Chi Square = 573 df = 5 p lt 0001 n = 604 2 Rho = 073 p lt 0001 n = 577 3 Rho = 045 p lt 0001 n = 533 4 F = 250 df = 2 p lt 0001 n = 533 5 Chi Square = 180 df = 6 p lt 001 n = 535 6 Chi Square = 71 df = 2 p lt 005 n = 603 7 Chi Square = 230 df = 6 p lt 001 n = 600 8 Chi Square = 91 df = 3 p lt 005 n = 598 9 Chi Square = 129 df = 4 p lt 005 n = 610
10 Rho = 034 p lt 0001 n = 609 11 Chi square = 217 df = 3 p lt 0001 n = 609 12 Chi Square = 609 df = 8 p lt 0001 n = 607 13 Chi Square = 208 df = 3 p lt 0001 n = 560 14 Size of organisation and developing online
careers site Rho = 025 p lt 0001 n = 599 Size of
organisation and employee surveys Rho = 019
p lt 0001 n = 599 15 Chi Square = 167 df = 2 p lt 0001 n = 599
16 Working with charities Chi Square = 80 df = 2 p
lt 005 n = 599 corporate sponsorship Chi Square
= 116 df = 2 p lt 001 n = 599 17 Chi Square = 76 df = 2 p lt 005 n = 599 18 Table 11 also shows that this method is deemed
most effective by public sector organisations but
this effect is due to a greater proportion of
large public sector organisations in our
sample whereas private sector organisations are
more evenly distributed in size 19 Chi square = 109 df = 2 p lt 001 n = 610 20 Chi Square = 279 df = 4 p lt 0001 n = 610 21 Chi Square = 259 df = 6 p lt 0001 n = 598 22 Chi Square = 515 df = 6 p lt 0001 n = 597 22 Chi Square = 177 df = 8 p lt 005 n = 600 22 Chi Square = 339 df = 4 p lt 0001 n = 610 22 Chi Square = 820 df = 4 p lt 0001 n = 610 22 Chi Square = 522 df = 8 p lt 0001 n = 610 22 Rho = 024 p lt 0001 n = 195 22 Chi Square = 166 df = 2 p lt 0001 n = 544
cipd
cou
k2011resou
rcing
and
talentp
lann
ing
survey
40
2011
OTHER TITLES IN THIS SERIES
ABSENCE MANAGEMENT The annual Absence Management survey has been running for eleven years providing useful benchmarking data on absence levels the cost and causes of absence and how organisations are managing absence The latest report is brought to you in partnership with Simplyhealth
EMPLOYEE ATTITUDES TO PAY The annual Employee Attitudes to Pay survey investigates employee attitudes and expectations towards pay and bonuses Now in its third year this survey is carried out by YouGov and focuses on employees in the UK
REWARD MANAGEMENT The annual Reward Management survey has been running for ten years and provides practical insights into current trends practices and issues affecting reward management in the UK It examines strategic reward base and variable pay bonuses incentives pensions reward measurement and total reward issues This report was brought to you in partnership with Benefex
LEARNING AND TALENT DEvELOPMENT The annual Learning and Talent Development survey is now in its thirteenth year and provides valuable commentary on current and future issues and trends It explores employer support for learning talent management employee skills managing and evaluating coaching and training spend
Issu
ed J
une
2011
Ref
eren
ce 5
552
copy C
hart
ered
Inst
itute
of
Pers
onne
l and
Dev
elop
men
t 20
11
Chartered Institute of Personnel and Development
151 The Broadway London SW19 1JQ
Tel 020 8612 6200 Fax 020 8612 6201
Email cipdcipdcouk Website cipdcouk
Incorporated by Royal Charter Registered charity no1079797

cipd
cou
k2011resou
rcing
and
talentp
lann
ing
survey
26
RESOURCING AND TALENT PLANNING
There were some challenges in the implementation of this new way of working All the councils
had to be convinced about the benefits of the changes With the implementation of a new IT
system having its own set of challenges the project has taken 12 months to introduce longer
than first anticipated Implementing the changes during a period of radical restructuring in all
councils also proved particularly challenging However Jayne describes how both the need to
make efficiencies and feedback from job-seekers meant that lsquowe had to find a different way of
doing thingsrsquo Jayne also recognises how the neutrality of her own role (each council pays a tenth
of her salary) has been essential in ensuring that the project has been fair to all its participants
offering a centralised shared resource to manage the project
The project is now set to develop yet further with the aim of becoming entirely self-funding
within the next year by accepting advertising from other organisations Two new websites are
planned for recruitment into schools and social care jobs bringing even less reliance on media
and agencies AGMA will also be further building its own talent pool
Jayne describes the initiative as lsquoa true example of what you can do if you collaborate across
authoritiesrsquo Not only the separate councils but also diverse teams and functions including HR IT
procurement communications and marketing have worked together to deliver this innovative
and inspiring project
Information provided by Jayne Whitehead AGMA Category Procurement Manager
2011
3 DIVERSITy
This section examines organisationsrsquo approaches to diversity including the use of formal diversity strategies and the methods used to address diversity issues
Just over half of organisations report they have with just under two-thirds of not-for-profit
a formal diversity strategy showing little change organisations and just two-fifths of private sector
over the past four years (2011 52 2010 55 companies (Table 19)25 Diversity strategies are also
2009 60 2008 55) Consistent with previous more common in larger organisations (regardless
yearsrsquo findings most public sector organisations of sector)26
(90) have a formal diversity strategy compared
Table 19 Does your organisation have a formal diversity strategy ()
Yes No Dont know
All 52 41 7
Sector
Private sector 41 50 8
Public services 90 9 1
Voluntary community and not-for-profit 63 33 4
Number of UK employees
Fewer than 50 45 50 5
50ndash249 43 51 6
250ndash999 48 44 7
1000ndash4999 65 31 4
More than 5000 80 9 11 Base 613
RESO
UR
CIN
G A
ND
TALE
NT P
LAN
NIN
G 2
011
27
28
RESOURCING AND TALENT PLANNING
As was the case last year over three-quarters
of organisations with a formal diversity policy
attempt to address diversity issues through
monitoring recruitment andor staffing
information to obtain data on gender ethnicity
disability age and so on (Table 20) Less than
three-fifths train interviewers to understand what
diversity is about and the impact of stereotypes
Other diversity-focused initiatives are even
less common moreover the figures indicate a
reduction in the use of several methods compared
with previous years The pressures of the recession
may have led to a reduced focus on diversity
Given the links between diversity in the workforce
and productivity organisations that fail to give
this issue the attention it requires may find
themselves at a disadvantage in the future
Traditionally the public sector has tended to lead
the way in terms of diversity practices Again this
year they are significantly more likely to address
diversity issues through monitoring recruitment
andor staffing information through providing
recruitment documents in other formats through
advertising vacancies in different sources to
attract under-represented groups and through
setting recruitment targets to correct a workforce
imbalance Nevertheless they are less likely than
other sectors to actively try to attract talent of all
ages (Table 20) Moreover our figures indicate that
the reduction in the use of several diversity methods
compared with previous years is particularly
pronounced in the public sector The change of
government and budget reduction measures have
led to significant change programmes in many
public sector organisations which may have resulted
in a reduced focus on diversity issues
Table 20 Methods used to address diversity issues in organisations ( with formal diversity strategy)
Voluntary community
Private Public and not-sector services for-profit
2011 2010 2009 2008 2011 2011 2011 survey survey survey survey (2010) (2010) (2010)
Monitoring recruitment andor staffing information to obtain data on gender 78 79 84 83 70 (71) 88 (96) 88 (76) ethnicity disability age any other categories
cipd
cou
k2011resou
rcing
and
talentp
lann
ing
survey
Training interviewers to understand what diversity is about and the impact of stereotypes
57 68 68 60 53 (66) 64 (73) 57 (72)
Actively trying to attract talent of all ages 45 53 32 43
Operating policies that go beyond basic legislative requirements on age gender race disability sexual orientation religion and belief
39 49 52 48 34 (44) 47 (63) 47 (40)
Providing recruitment documents in other 39 41 37 31 24 (22) 64 (77) 47 (52)formats (online large-print audio and so on)
Checking that any tests used are valid reliable and culture-free and were tested on diverse norm groups
36 42 47 34 39 (44) 35 (45) 27 (16)
Advertising vacancies in different sources to 31 37 51 48 22 (30) 44 (53) 41 (32)attract under-represented groups
Using specific imageswords in your recruitment advertising to appeal to a wider audience 29 38 42 42 25 (30) 36 (52) 33 (40)
Making attempts to employ the long-term 19 19 13 29unemployed
Setting recruitment targets to correct a workforce imbalance 9 15 14 12 4 (8) 18 (31) 8 (16)
Base 312 (2011) 253 (2010) 419 (2009) new item added in 2011
RESO
UR
CIN
G A
ND
TALE
NT P
LAN
NIN
G 2
011
29
2011
4 mANAGING LABOUR TURNOVER
Figures from the Office for National Statistics show that UK unemployment rose by 27000 in the three months to the end of January 2011 to 253 million the highest since 1994 When unemployment is high the number of employees leaving organisations voluntarily is expected to decrease Here we examine whether this is happening and how organisations are tackling the issue of employee retention
Among organisations that are able to supply
turnover data the median labour turnover rate
has decreased over the past few years (Table 21)
The median figure however hides differences
across organisations Slightly more organisations
report their turnover has increased in 2010
compared with 2009 (38) than has decreased
(33) while for nearly a third (29) it remained
the same Smaller organisations are more likely
to report their labour turnover has increased and
larger organisations that it has decreased27
As in previous years the majority of turnover (53)
is still attributed to employees leaving voluntarily
(Table 22) As the economy has improved the
median proportion of turnover due to redundancies
has reduced Only 12 of organisations that
provided reasons for leaving made more than ten
redundancies in the previous year compared with
33 in 2010 26 in 2009 and 22 in 2008 A third
(34) of organisations that made redundancies
offered career transition services
While median turnover rates have reduced
across all sectors Table 23 shows that the rate
of voluntary leavers has increased slightly in
the private sector compared with last year but
decreased in the voluntary and public services
sector This reflects improvements in the economic
outlook for the private sector and the widespread
cuts in the public sector which also have a direct
impact on many not-for-profit organisations that
provide services for the public sector
Cost of labour turnover While just over half of organisations calculate
their recruitment costs only 13 calculate the
cost of their labour turnover (2010 14) The
majority of organisations report they do not
calculate these costs (79) while 7 donrsquot know
if they are calculated or not
Nearly half (46) of those who calculate their
turnover costs want to maintain their current
turnover rate while one-fifth (38) want to
reduce turnover during 2011 and 15 want to
increase it
Retaining employees The steps organisations take to retain employees
in their workforce can have a significant impact
on organisational efficiency and success through
30
RESOURCING AND TALENT PLANNING
Table 21 Median rate of labour turnover ()
2011 2010 survey 2009 survey 2008 survey 2007 survey 2006 survey
125 135 157 173 181 183
Base 175 (2011)
Table 22 Median labour turnover rates by reason for leaving ()
2011 survey 2010 survey 2009 survey
Voluntary redundancies 0 0 0
Compulsory redundancies 0 10 05
Dismissedleft involuntarily (including death in service)
07 09 14
Fixed-short-term contracts 0 0 07
Retired 0 04 07
Left voluntarily 66 84 90
Base 154 (2011)
Table 23 Median labour turnover rates by industry sector ()
cipd
cou
k2011resou
rcing
and
talentp
lann
ing
survey
Sector All leavers Voluntary leavers
2011 survey
2010 survey
2009 survey
2011 survey
2010 survey
2009 survey
Manufacturing and production 93 (38) 124 (44) 153 (80) 37 (35) 27 (42) 77 (75)
Private sector services 138 (96) 146 (77) 168 (150) 87 (82) 74 (71) 104 (129)
Public services 85 (28) 86 (19) 126 (52) 34 (10) 58 (15) 76 (45)
Voluntary community not-for-profit 131 (11) 159 (15) 164 (38) 70 (24) 102 (18) 110 (35) Number of respondents shown in brackets
decreasing employee turnover loss of talent and
recruitment and training costs while having a
positive impact on motivation job satisfaction and
the employer brand
Only two-fifths (42) of organisations
experienced no difficulties in retaining staff
during 2010 This figure is similar to last year
(45) but higher than the findings for 2008
when 31 reported they had no retention
difficulties These findings reflect the increased
caution of employees regarding leaving their
jobs during times of economic uncertainty and
high unemployment Supporting this are our
findings that the public (49) and not-for-profit
sectors (49) are more likely to report they had
no difficulties in retaining staff during 2010
compared with the private sector (38)
As in previous years organisations most
commonly have difficulty retaining managers
and professionalsspecialists (Table 24) The
manufacturing and production sector are most
likely to report difficulties retaining technical
2011 staff and the private services sector that they have
most difficulty retaining services staff This may
reflect the higher demand for these categories of
employees in these sectors
While most organisations have taken one or more
steps to address staff retention nearly one in four
organisations (23) report that no specific retention
initiatives were undertaken This is a similar
proportion to last year although substantially higher
than in previous years when retention difficulties
were more common due to a tighter labour market
(Table 25) Public sector organisations are twice
as likely not to have taken any steps to address
retention as those in the private or not for-profit
sectors (39 compared with 20 of private sector
and 16 of not-for-profits)28
The most common methods used to address
retention in 2010 used by nearly two-fifths of
organisations are to improve line managersrsquo
people skills improve learning and development
opportunities and improve the induction process
Improving line managersrsquo people skills and
learning and development opportunities are also
most commonly rated among the top three most
effective retention methods The effectiveness of
improving induction processes is more varied with
22 rating it among the top three most effective
methods and 12 among the top three least
effective methods Views are also mixed regarding
the effectiveness of improved pay It is likely that
employees are motivated by different factors
Employers need to provide a healthy working
environment where employees are treated with
respect and make efforts to match their retention
initiatives with what staff want
Table 24 Retention difficulties by occupational category ()
Voluntary community
Private and All Manufacturing sector Public not-for- All
2011 and production services services profit 2010
Managers and professionals specialists 28 26 29 25 29 27
Technical 21 37 19 17 13 20
Services (customer personal protective and sales) 13 7 21 4 4 12
Administrative secretarial 9 5 8 15 13 7
Senior managersdirectors 7 5 8 10 6 9
Manualcraft workers 6 11 6 3 4 4 Base 601 (2011) 451 (2010)
RESO
UR
CIN
G A
ND
TALE
NT P
LAN
NIN
G 2
011
31
32
RESOURCING AND TALENT PLANNING
Table 25 Steps taken specifically to address staff retention ()
Used in Least Most Used in Used in Used in 2010 effective effective 2009 2008 2007
Improved line managers people skills 39 7 31 42 39 37
Increased learning and development opportunities 38 5 34 35 47 46
Improved induction process 38 12 22 31 45 45
Improved employee involvement 34 8 24 32 35 29
Improved selection techniques 30 7 25 31 42 46
Improved pay 27 11 23 22 42 53
Offered coachingmentoring buddy systems 24 8 14 20 24 22
Improved benefits 21 8 14 19 32 36
Better promotion to employees of the employer brand 18 10 5 15 21 16
Created clearer career paths 18 6 2 21 18 17
Revised the way staff are rewarded so their efforts are 18 4 13 14 19 19 better recognised
Made changes to improve workndash life balance 17 5 13 19 31 30
Improved physical working conditions 15 8 7 13 19 12
Redesigned jobs to make them more satisfying 11 4 8 13 18 14
Increased our use of countershyoffers 4 4 14
No specific initiatives undertaken 23 3 1 27 13 9 Base 559 (2011 survey) 431 (2010 survey) 695 (2009 survey) 710 (2008 survey)
new item added in 2011
cipd
cou
k2011resou
rcing
and
talentp
lann
ing
survey
RESO
UR
CIN
G A
ND
TALE
NT P
LAN
NIN
G 2
011
33
2011
CONCLUSIONS
Looking forward In January 2010 the UK officially emerged from
the longest recession since the 1930s Economic
growth however remains sluggish and the public
sector has embarked on a four-year programme of
the biggest government spending cuts in decades
to address the fiscal deficit
In the labour market unemployment remained
high throughout 2010 Figures from the Office
for National Statistics (ONS) show that UK
unemployment rose by 27000 in the three months
to the end of January 2011 to 253 million the
highest since 1994 While recent months have seen
signs of improvement there are concerns that the
slow growth in the private sector will be unable
to fully compensate for the increasing job losses in
the public sector that will result from the budget
cuts This is supported by the findings from the
CIPDrsquos spring 2011 Labour Market Outlook which
shows the impact on the overall labour market of a
slight rise in private sector recruitment is still being
cancelled out by large-scale public sector job losses
The findings of the CIPDrsquos 2011 Resourcing and
Talent Planning survey reflect the challenges
of the economic environment Organisations
generally have increased their focus on costs On
average organisations spent less on filling each
vacancy and a fifth have reduced their resourcing
budgets and talent management spend In the
public sector the focus on costs and budget
reductions was particularly apparent
The end of the recession has meant fewer
redundancies in 2010 Nevertheless over a third
of public sector and one-fifth of private sector
organisations reduced their headcount The
number of vacancies on offer by organisations
remained as low as in 2009 overall and continued
to decrease in very large organisations particularly
in the public sector
Looking forward private sector growth is expected
to remain slow and the full impact of public
sector budget cuts is still to come Resourcing and
talent management budgets will be further hit
in 2011ndash12 and many public sector organisations
will implement recruitment freezes and reduce
graduate intake and recruitment generally
Resourcing and talent practices are changing to
reflect the stronger focus on costs and reductions
in budgets Particularly in the public sector but
also in the private sector trends indicate a greater
focus on developing talent in-house retaining
rather than recruiting talent and reducing reliance
on recruitment agencies and external consultants
for resourcing and development
Our findings do not present a positive outlook
for the vast number of unemployed A substantial
proportion of organisations reports that the
already low number of vacancies available to them
is likely to be further affected by the abolition
of the Default Retirement Age Yet despite the
high unemployment rate most organisations
reported difficulties in filling vacancies mostly due
to skill shortages We have also seen an increase
in the proportion of organisations reporting
that competition for talent is even greater as the
pool of available talent to hire has fallen sharply
For many organisations there appears a clear
mismatch between the skills they require and
those available in the labour market Some are
concerned this will be exacerbated by the increase
in university tuition fees Some are responding
cipd
cou
k2011resou
rcing
and
talentp
lann
ing
survey
34
RESOURCING AND TALENT PLANNING
by increasing apprenticeship schemes internships
and sponsoring students through university Such
schemes may be aided by the Governmentrsquos recently
announced pound60 million commitment to help boost
youth employment and provide extra support for
apprenticeships and changes to vocational training
and education How far this will go towards meeting
organisationsrsquo skill requirements remains to be seen
On a positive note our findings indicate that talent
management is viewed as more not less important
in difficult times although with reduced budgets
organisations will have to be innovative with
their approach and strategies In order to survive
organisations will need to make certain they focus
beyond the cost-cutting required in the current
environment to ensuring their talent strategies are
aligned to long-term business success
The CIPDrsquos Shaping the Future and Next Generation
HR flagship projects have both explored the
important issues of sustainability Shaping the Future
in particular warns against the dangers of lsquotalent
tunnel visionrsquo taking a short-sighted view on talent
strategies which are solely focused on the needs of
the here and now
Often organisations pay too little attention to
identifying and developing the capabilities that
individuals will need in the long term This implies a
leadershiptalent management capability gap with
too much focus on the operational needs of today
rather than the organisational imperatives
of tomorrow
Itrsquos never too late to start equipping your people
with the skills and knowledge they need to meet
both present and future challenges So what practical
recommendations can we make for resourcing and
talent professionals drawn from our Shaping the
Future evidence
Audit your organisationrsquos current skills and future capabilities If you havenrsquot done so already conduct a thorough
inventory of your organisationrsquos current skills and map
those against the capabilities you are likely to need
in the future Hold forecasting sessions which look at
macro and micro trends how these will impact your
way of working and the changes that will be required
for future success
Build your talent and succession pipeline You also need to be proactively building up your
talent pipelines (horizontally and vertically) so that
you are developing people with future-fit skills and
capabilities A silver lining from the current economic
climate is that more organisations are focusing on
developing internal talent and fully utilising the
skills of their existing workforce Fresh talent is
still important but recruitment strategies should
complement internal pipelines
Maintain a continuous focus on capability-building Capability-building should be part of a continuous
process embedded into policies and practices Across
our case study organisations managers talked about the
need to embed development and skills training as part
of business as usual rather than as a one-off activity
Develop a creative approach to skills and capability development Even when budgets are tight it is essential that
staff get the development they need to ensure they
have the capabilities for their current job role as well
as starting to build those that the organisation will
need in the future Our case study organisations were
focusing strongly on knowledge-sharing enabling
people to learn from others across the organisation
Many of you are already considering alternative
solutions for specialist skill development such as
apprenticeships internal management schemes
summer placements and internships It is also
important to work with universities to ensure that
graduates are developing skills and knowledge which
will help them to succeed in the workplace
RESO
UR
CIN
G A
ND
TALE
NT P
LAN
NIN
G 2
011
35
2011
BACkGROUND TO ThE SURVEy
This survey was conducted in March and April 2011 It was sent to a sample of UK-based HR professionals in the public private and voluntary sectors In total 626 people responded to the survey
This is the fifteenth annual CIPD Resourcing
and Talent Planning survey (formerly known as
the CIPDrsquos Recruitment Retention and Turnover
survey) The survey examines organisationsrsquo
resourcing and talent planning strategies and
practices and the key challenges and issues
they face The survey consists of 45 questions
completed through an online self-completion
questionnaire
The majority of questions remain the same as
previous years to provide useful benchmark
data on topics including recruitment practices
difficulties and costs selection methods diversity
strategies the impact of the economic climate on
resourcing and talent planning practices labour
turnover and retention strategies New question
areas this year examine the employment of
younger workers the length of the recruitment
process the nature of job vacancies relationships
with recruitment partners and the use of
strengths-based approaches to recruitment
A small number of respondents took part in follow-
up telephone interviews to produce mini case
studies on a selection of topics These are presented
in the coloured boxes throughout the report
Sample profile Respondents predominantly work for private
sector organisations with professional services
being particularly well represented but other
sectors are represented in similar proportions to
last year (Table A1)
36
RESOURCING AND TALENT PLANNING
Table A1 Breakdown of respondent organisations by industrial sector Number of respondents
Manufacturing and production 113 19
Agriculture and forestry 1 0
Chemicals oils and pharmaceuticals 9 1
Construction 8 1
Electricity gas and water 4 1
Engineering electronics and metals 38 6
Food drink and tobacco 18 3
General manufacturing 6 1
Mining and quarrying 4 1
Paper and printing 6 1
Textiles 2 0
Other manufacturingproduction 17 3
Private sector services 319 52
Professional services (accountancy advertising consultancy legal etc) 78 13
Finance insurance and real estate 33 5
Hotels catering and leisure 26 4
IT services 26 4
Call centres 3 0
Media (broadcasting and publishing etc) 7 1
Retail and wholesale 40 7
Transport distribution and storage 23 4
Communications 6 1
Other private services 77 13
Public services 100 16
Central government 14 2
Education 12 2
Health 23 4
Local government 22 4
Other public services 29 5
Non-profit organisations 78 13
Care services 9 1
Charity services 32 5
Housing association 17 3
Other voluntary 20 3 Base 610
cipd
cou
k2011resou
rcing
and
talentp
lann
ing
survey
2011 Most respondents work in small to medium-sized
organisations in terms of the number of UK-
based employees but larger organisations are
also represented in similar proportions to last year
(Table A2)
Respondents reported on organisations based
across the UK Three in ten responded for the
whole of the UK while others responded for a
particular regioncountry (see Table A3)
Table A2 Breakdown of sample by organisation size ndash permanent employees in the UK
Fewer than 10 5
10ndash49 12
50ndash249 33
250ndash999 25
1000ndash4999 12
More than 5000 13 Base 610
Table A3 Main region covered by the reply
East Anglia 5
East Midlands 3
West Midlands 5
North-east of England 3
North-west of England 7
South-west of England 6
Yorkshire and Humberside 5
South-east of England (excluding London)
12
London 12
Scotland 6
Wales 3
Northern Ireland 3
Ireland 0
Whole of UK 29 Base 602
Labour turnover A total of 175 survey respondents were able to
supply all the information necessary for us to
calculate labour turnover on a whole-organisation
basis
This report uses the standard lsquocrude wastagersquo
method to calculate the rate of turnover This
method is calculated as follows
Labour turnover =
Number of leavers in a set period
______________________________________ x 100
Average number employed in the same period
(Leavers include those leaving the organisation
by way of voluntary or involuntary severance
redundancies or retirements but does not include
internal transfers)
Readers should be aware that this method has
some shortcomings For example it takes no
account of the characteristics of the workforce or
the length of service of the leaver
Note on statistics and figures used Some respondents did not answer all questions so
where percentages are reported in tables or figures
the respondent lsquobasersquo for that question is given
lsquoAveragersquo in the report is used to refer to the
statistical mean where the data is normally
distributed However the median is used in cases
where the distribution is significantly skewed
When the median is used it is noted
With the exception of labour turnover rates all
figures in tables have been rounded to the nearest
percentage point Due to rounding percentages
may not always total 100
Chi-square (χ2) tests are used to examine whether
differences between groups such as industrial
sectors are significant or likely to be due to
chance Spearmanrsquos Rho correlation (Rho) is used
to examine relationships between variables We
report on statistics at the generally accepted level
of significance plt005
RESO
UR
CIN
G A
ND
TALE
NT P
LAN
NIN
G 2
011
37
38
RESOURCING AND TALENT PLANNING
fURThER SOURCES Of INfORmATION
We produce a range of free factsheets surveys
guides and research reports which are available on
the CIPD website at cipdcoukhrresources
Read our factsheets on Employer Brand
Employee Turnover and Retention
Induction
Outlook series Our quarterly reports Labour Market Outlook
and Employee Outlook look at the employer and
employee perspectives on the labour market and
on workplace issues and trends while HR Outlook
explores priorities and emerging trends for the HR
profession and function
View these reports at
cipdcoukresearchoutlook-series
Talent management Two reports look at talent issues in a recession
difficult economic climate
The War on Talent Talent management under
threat in uncertain times (2009)
Fighting Back through Talent Innovation (2010)
Opening up Talent for Business Success (2010)
looks at the importance of integrating talent
management and diversity
The Talent Perspective What does it feel like to
be talent-managed (2010) looks at the employee
view of talent management
Workforce planning Our guide Workforce Planning Right people right
time right skills (2010) gives advice on developing
workforce planning processes
Diversity Two survey reports and a guide provide practical
advice and information on trends
Diversity in Business A focus for progress (2007)
Managing an Ageing Workforce How employers
are adapting to an older labour market (2010)
Managing Age New edition 2011
Two further reports are available to order from
cipdcoukbookstore
Managing Diversity in Practice Supporting
business goals (2007)
Managing Diversity and the Business Case (2008)
Sign up to receive our e-newsletter at
cipdcoukcipdupdate
cipd
cou
k2011resou
rcing
and
talentp
lann
ing
survey
RESO
UR
CIN
G A
ND
TALE
NT P
LAN
NIN
G 2
011
39
2011
ACkNOwLEDGEmENTS
The CIPD is very grateful to those organisations and
individuals who gave their time to take part in this
research They include
bull Annette Sinclair Senior Researcher at Roffey
Park for analysing the findings and writing this
comprehensive report
bull Members of the Recruitment Forum Steering
Committee for their input into the survey
design and assistance in piloting the
questionnaire
bull Hays for their support and commitment at
every stage of the research
bull All those who shared examples of their
organisationrsquos practices
We hope that you find the research useful when
considering your own recruitment and retention
practices Please contact us if you have any
questions or ideas based on our findings
(researchcipdcouk)
RESOURCING AND TALENT PLANNING
fOOTNOTES 1 Chi Square = 573 df = 5 p lt 0001 n = 604 2 Rho = 073 p lt 0001 n = 577 3 Rho = 045 p lt 0001 n = 533 4 F = 250 df = 2 p lt 0001 n = 533 5 Chi Square = 180 df = 6 p lt 001 n = 535 6 Chi Square = 71 df = 2 p lt 005 n = 603 7 Chi Square = 230 df = 6 p lt 001 n = 600 8 Chi Square = 91 df = 3 p lt 005 n = 598 9 Chi Square = 129 df = 4 p lt 005 n = 610
10 Rho = 034 p lt 0001 n = 609 11 Chi square = 217 df = 3 p lt 0001 n = 609 12 Chi Square = 609 df = 8 p lt 0001 n = 607 13 Chi Square = 208 df = 3 p lt 0001 n = 560 14 Size of organisation and developing online
careers site Rho = 025 p lt 0001 n = 599 Size of
organisation and employee surveys Rho = 019
p lt 0001 n = 599 15 Chi Square = 167 df = 2 p lt 0001 n = 599
16 Working with charities Chi Square = 80 df = 2 p
lt 005 n = 599 corporate sponsorship Chi Square
= 116 df = 2 p lt 001 n = 599 17 Chi Square = 76 df = 2 p lt 005 n = 599 18 Table 11 also shows that this method is deemed
most effective by public sector organisations but
this effect is due to a greater proportion of
large public sector organisations in our
sample whereas private sector organisations are
more evenly distributed in size 19 Chi square = 109 df = 2 p lt 001 n = 610 20 Chi Square = 279 df = 4 p lt 0001 n = 610 21 Chi Square = 259 df = 6 p lt 0001 n = 598 22 Chi Square = 515 df = 6 p lt 0001 n = 597 22 Chi Square = 177 df = 8 p lt 005 n = 600 22 Chi Square = 339 df = 4 p lt 0001 n = 610 22 Chi Square = 820 df = 4 p lt 0001 n = 610 22 Chi Square = 522 df = 8 p lt 0001 n = 610 22 Rho = 024 p lt 0001 n = 195 22 Chi Square = 166 df = 2 p lt 0001 n = 544
cipd
cou
k2011resou
rcing
and
talentp
lann
ing
survey
40
2011
OTHER TITLES IN THIS SERIES
ABSENCE MANAGEMENT The annual Absence Management survey has been running for eleven years providing useful benchmarking data on absence levels the cost and causes of absence and how organisations are managing absence The latest report is brought to you in partnership with Simplyhealth
EMPLOYEE ATTITUDES TO PAY The annual Employee Attitudes to Pay survey investigates employee attitudes and expectations towards pay and bonuses Now in its third year this survey is carried out by YouGov and focuses on employees in the UK
REWARD MANAGEMENT The annual Reward Management survey has been running for ten years and provides practical insights into current trends practices and issues affecting reward management in the UK It examines strategic reward base and variable pay bonuses incentives pensions reward measurement and total reward issues This report was brought to you in partnership with Benefex
LEARNING AND TALENT DEvELOPMENT The annual Learning and Talent Development survey is now in its thirteenth year and provides valuable commentary on current and future issues and trends It explores employer support for learning talent management employee skills managing and evaluating coaching and training spend
Issu
ed J
une
2011
Ref
eren
ce 5
552
copy C
hart
ered
Inst
itute
of
Pers
onne
l and
Dev
elop
men
t 20
11
Chartered Institute of Personnel and Development
151 The Broadway London SW19 1JQ
Tel 020 8612 6200 Fax 020 8612 6201
Email cipdcipdcouk Website cipdcouk
Incorporated by Royal Charter Registered charity no1079797

2011
3 DIVERSITy
This section examines organisationsrsquo approaches to diversity including the use of formal diversity strategies and the methods used to address diversity issues
Just over half of organisations report they have with just under two-thirds of not-for-profit
a formal diversity strategy showing little change organisations and just two-fifths of private sector
over the past four years (2011 52 2010 55 companies (Table 19)25 Diversity strategies are also
2009 60 2008 55) Consistent with previous more common in larger organisations (regardless
yearsrsquo findings most public sector organisations of sector)26
(90) have a formal diversity strategy compared
Table 19 Does your organisation have a formal diversity strategy ()
Yes No Dont know
All 52 41 7
Sector
Private sector 41 50 8
Public services 90 9 1
Voluntary community and not-for-profit 63 33 4
Number of UK employees
Fewer than 50 45 50 5
50ndash249 43 51 6
250ndash999 48 44 7
1000ndash4999 65 31 4
More than 5000 80 9 11 Base 613
RESO
UR
CIN
G A
ND
TALE
NT P
LAN
NIN
G 2
011
27
28
RESOURCING AND TALENT PLANNING
As was the case last year over three-quarters
of organisations with a formal diversity policy
attempt to address diversity issues through
monitoring recruitment andor staffing
information to obtain data on gender ethnicity
disability age and so on (Table 20) Less than
three-fifths train interviewers to understand what
diversity is about and the impact of stereotypes
Other diversity-focused initiatives are even
less common moreover the figures indicate a
reduction in the use of several methods compared
with previous years The pressures of the recession
may have led to a reduced focus on diversity
Given the links between diversity in the workforce
and productivity organisations that fail to give
this issue the attention it requires may find
themselves at a disadvantage in the future
Traditionally the public sector has tended to lead
the way in terms of diversity practices Again this
year they are significantly more likely to address
diversity issues through monitoring recruitment
andor staffing information through providing
recruitment documents in other formats through
advertising vacancies in different sources to
attract under-represented groups and through
setting recruitment targets to correct a workforce
imbalance Nevertheless they are less likely than
other sectors to actively try to attract talent of all
ages (Table 20) Moreover our figures indicate that
the reduction in the use of several diversity methods
compared with previous years is particularly
pronounced in the public sector The change of
government and budget reduction measures have
led to significant change programmes in many
public sector organisations which may have resulted
in a reduced focus on diversity issues
Table 20 Methods used to address diversity issues in organisations ( with formal diversity strategy)
Voluntary community
Private Public and not-sector services for-profit
2011 2010 2009 2008 2011 2011 2011 survey survey survey survey (2010) (2010) (2010)
Monitoring recruitment andor staffing information to obtain data on gender 78 79 84 83 70 (71) 88 (96) 88 (76) ethnicity disability age any other categories
cipd
cou
k2011resou
rcing
and
talentp
lann
ing
survey
Training interviewers to understand what diversity is about and the impact of stereotypes
57 68 68 60 53 (66) 64 (73) 57 (72)
Actively trying to attract talent of all ages 45 53 32 43
Operating policies that go beyond basic legislative requirements on age gender race disability sexual orientation religion and belief
39 49 52 48 34 (44) 47 (63) 47 (40)
Providing recruitment documents in other 39 41 37 31 24 (22) 64 (77) 47 (52)formats (online large-print audio and so on)
Checking that any tests used are valid reliable and culture-free and were tested on diverse norm groups
36 42 47 34 39 (44) 35 (45) 27 (16)
Advertising vacancies in different sources to 31 37 51 48 22 (30) 44 (53) 41 (32)attract under-represented groups
Using specific imageswords in your recruitment advertising to appeal to a wider audience 29 38 42 42 25 (30) 36 (52) 33 (40)
Making attempts to employ the long-term 19 19 13 29unemployed
Setting recruitment targets to correct a workforce imbalance 9 15 14 12 4 (8) 18 (31) 8 (16)
Base 312 (2011) 253 (2010) 419 (2009) new item added in 2011
RESO
UR
CIN
G A
ND
TALE
NT P
LAN
NIN
G 2
011
29
2011
4 mANAGING LABOUR TURNOVER
Figures from the Office for National Statistics show that UK unemployment rose by 27000 in the three months to the end of January 2011 to 253 million the highest since 1994 When unemployment is high the number of employees leaving organisations voluntarily is expected to decrease Here we examine whether this is happening and how organisations are tackling the issue of employee retention
Among organisations that are able to supply
turnover data the median labour turnover rate
has decreased over the past few years (Table 21)
The median figure however hides differences
across organisations Slightly more organisations
report their turnover has increased in 2010
compared with 2009 (38) than has decreased
(33) while for nearly a third (29) it remained
the same Smaller organisations are more likely
to report their labour turnover has increased and
larger organisations that it has decreased27
As in previous years the majority of turnover (53)
is still attributed to employees leaving voluntarily
(Table 22) As the economy has improved the
median proportion of turnover due to redundancies
has reduced Only 12 of organisations that
provided reasons for leaving made more than ten
redundancies in the previous year compared with
33 in 2010 26 in 2009 and 22 in 2008 A third
(34) of organisations that made redundancies
offered career transition services
While median turnover rates have reduced
across all sectors Table 23 shows that the rate
of voluntary leavers has increased slightly in
the private sector compared with last year but
decreased in the voluntary and public services
sector This reflects improvements in the economic
outlook for the private sector and the widespread
cuts in the public sector which also have a direct
impact on many not-for-profit organisations that
provide services for the public sector
Cost of labour turnover While just over half of organisations calculate
their recruitment costs only 13 calculate the
cost of their labour turnover (2010 14) The
majority of organisations report they do not
calculate these costs (79) while 7 donrsquot know
if they are calculated or not
Nearly half (46) of those who calculate their
turnover costs want to maintain their current
turnover rate while one-fifth (38) want to
reduce turnover during 2011 and 15 want to
increase it
Retaining employees The steps organisations take to retain employees
in their workforce can have a significant impact
on organisational efficiency and success through
30
RESOURCING AND TALENT PLANNING
Table 21 Median rate of labour turnover ()
2011 2010 survey 2009 survey 2008 survey 2007 survey 2006 survey
125 135 157 173 181 183
Base 175 (2011)
Table 22 Median labour turnover rates by reason for leaving ()
2011 survey 2010 survey 2009 survey
Voluntary redundancies 0 0 0
Compulsory redundancies 0 10 05
Dismissedleft involuntarily (including death in service)
07 09 14
Fixed-short-term contracts 0 0 07
Retired 0 04 07
Left voluntarily 66 84 90
Base 154 (2011)
Table 23 Median labour turnover rates by industry sector ()
cipd
cou
k2011resou
rcing
and
talentp
lann
ing
survey
Sector All leavers Voluntary leavers
2011 survey
2010 survey
2009 survey
2011 survey
2010 survey
2009 survey
Manufacturing and production 93 (38) 124 (44) 153 (80) 37 (35) 27 (42) 77 (75)
Private sector services 138 (96) 146 (77) 168 (150) 87 (82) 74 (71) 104 (129)
Public services 85 (28) 86 (19) 126 (52) 34 (10) 58 (15) 76 (45)
Voluntary community not-for-profit 131 (11) 159 (15) 164 (38) 70 (24) 102 (18) 110 (35) Number of respondents shown in brackets
decreasing employee turnover loss of talent and
recruitment and training costs while having a
positive impact on motivation job satisfaction and
the employer brand
Only two-fifths (42) of organisations
experienced no difficulties in retaining staff
during 2010 This figure is similar to last year
(45) but higher than the findings for 2008
when 31 reported they had no retention
difficulties These findings reflect the increased
caution of employees regarding leaving their
jobs during times of economic uncertainty and
high unemployment Supporting this are our
findings that the public (49) and not-for-profit
sectors (49) are more likely to report they had
no difficulties in retaining staff during 2010
compared with the private sector (38)
As in previous years organisations most
commonly have difficulty retaining managers
and professionalsspecialists (Table 24) The
manufacturing and production sector are most
likely to report difficulties retaining technical
2011 staff and the private services sector that they have
most difficulty retaining services staff This may
reflect the higher demand for these categories of
employees in these sectors
While most organisations have taken one or more
steps to address staff retention nearly one in four
organisations (23) report that no specific retention
initiatives were undertaken This is a similar
proportion to last year although substantially higher
than in previous years when retention difficulties
were more common due to a tighter labour market
(Table 25) Public sector organisations are twice
as likely not to have taken any steps to address
retention as those in the private or not for-profit
sectors (39 compared with 20 of private sector
and 16 of not-for-profits)28
The most common methods used to address
retention in 2010 used by nearly two-fifths of
organisations are to improve line managersrsquo
people skills improve learning and development
opportunities and improve the induction process
Improving line managersrsquo people skills and
learning and development opportunities are also
most commonly rated among the top three most
effective retention methods The effectiveness of
improving induction processes is more varied with
22 rating it among the top three most effective
methods and 12 among the top three least
effective methods Views are also mixed regarding
the effectiveness of improved pay It is likely that
employees are motivated by different factors
Employers need to provide a healthy working
environment where employees are treated with
respect and make efforts to match their retention
initiatives with what staff want
Table 24 Retention difficulties by occupational category ()
Voluntary community
Private and All Manufacturing sector Public not-for- All
2011 and production services services profit 2010
Managers and professionals specialists 28 26 29 25 29 27
Technical 21 37 19 17 13 20
Services (customer personal protective and sales) 13 7 21 4 4 12
Administrative secretarial 9 5 8 15 13 7
Senior managersdirectors 7 5 8 10 6 9
Manualcraft workers 6 11 6 3 4 4 Base 601 (2011) 451 (2010)
RESO
UR
CIN
G A
ND
TALE
NT P
LAN
NIN
G 2
011
31
32
RESOURCING AND TALENT PLANNING
Table 25 Steps taken specifically to address staff retention ()
Used in Least Most Used in Used in Used in 2010 effective effective 2009 2008 2007
Improved line managers people skills 39 7 31 42 39 37
Increased learning and development opportunities 38 5 34 35 47 46
Improved induction process 38 12 22 31 45 45
Improved employee involvement 34 8 24 32 35 29
Improved selection techniques 30 7 25 31 42 46
Improved pay 27 11 23 22 42 53
Offered coachingmentoring buddy systems 24 8 14 20 24 22
Improved benefits 21 8 14 19 32 36
Better promotion to employees of the employer brand 18 10 5 15 21 16
Created clearer career paths 18 6 2 21 18 17
Revised the way staff are rewarded so their efforts are 18 4 13 14 19 19 better recognised
Made changes to improve workndash life balance 17 5 13 19 31 30
Improved physical working conditions 15 8 7 13 19 12
Redesigned jobs to make them more satisfying 11 4 8 13 18 14
Increased our use of countershyoffers 4 4 14
No specific initiatives undertaken 23 3 1 27 13 9 Base 559 (2011 survey) 431 (2010 survey) 695 (2009 survey) 710 (2008 survey)
new item added in 2011
cipd
cou
k2011resou
rcing
and
talentp
lann
ing
survey
RESO
UR
CIN
G A
ND
TALE
NT P
LAN
NIN
G 2
011
33
2011
CONCLUSIONS
Looking forward In January 2010 the UK officially emerged from
the longest recession since the 1930s Economic
growth however remains sluggish and the public
sector has embarked on a four-year programme of
the biggest government spending cuts in decades
to address the fiscal deficit
In the labour market unemployment remained
high throughout 2010 Figures from the Office
for National Statistics (ONS) show that UK
unemployment rose by 27000 in the three months
to the end of January 2011 to 253 million the
highest since 1994 While recent months have seen
signs of improvement there are concerns that the
slow growth in the private sector will be unable
to fully compensate for the increasing job losses in
the public sector that will result from the budget
cuts This is supported by the findings from the
CIPDrsquos spring 2011 Labour Market Outlook which
shows the impact on the overall labour market of a
slight rise in private sector recruitment is still being
cancelled out by large-scale public sector job losses
The findings of the CIPDrsquos 2011 Resourcing and
Talent Planning survey reflect the challenges
of the economic environment Organisations
generally have increased their focus on costs On
average organisations spent less on filling each
vacancy and a fifth have reduced their resourcing
budgets and talent management spend In the
public sector the focus on costs and budget
reductions was particularly apparent
The end of the recession has meant fewer
redundancies in 2010 Nevertheless over a third
of public sector and one-fifth of private sector
organisations reduced their headcount The
number of vacancies on offer by organisations
remained as low as in 2009 overall and continued
to decrease in very large organisations particularly
in the public sector
Looking forward private sector growth is expected
to remain slow and the full impact of public
sector budget cuts is still to come Resourcing and
talent management budgets will be further hit
in 2011ndash12 and many public sector organisations
will implement recruitment freezes and reduce
graduate intake and recruitment generally
Resourcing and talent practices are changing to
reflect the stronger focus on costs and reductions
in budgets Particularly in the public sector but
also in the private sector trends indicate a greater
focus on developing talent in-house retaining
rather than recruiting talent and reducing reliance
on recruitment agencies and external consultants
for resourcing and development
Our findings do not present a positive outlook
for the vast number of unemployed A substantial
proportion of organisations reports that the
already low number of vacancies available to them
is likely to be further affected by the abolition
of the Default Retirement Age Yet despite the
high unemployment rate most organisations
reported difficulties in filling vacancies mostly due
to skill shortages We have also seen an increase
in the proportion of organisations reporting
that competition for talent is even greater as the
pool of available talent to hire has fallen sharply
For many organisations there appears a clear
mismatch between the skills they require and
those available in the labour market Some are
concerned this will be exacerbated by the increase
in university tuition fees Some are responding
cipd
cou
k2011resou
rcing
and
talentp
lann
ing
survey
34
RESOURCING AND TALENT PLANNING
by increasing apprenticeship schemes internships
and sponsoring students through university Such
schemes may be aided by the Governmentrsquos recently
announced pound60 million commitment to help boost
youth employment and provide extra support for
apprenticeships and changes to vocational training
and education How far this will go towards meeting
organisationsrsquo skill requirements remains to be seen
On a positive note our findings indicate that talent
management is viewed as more not less important
in difficult times although with reduced budgets
organisations will have to be innovative with
their approach and strategies In order to survive
organisations will need to make certain they focus
beyond the cost-cutting required in the current
environment to ensuring their talent strategies are
aligned to long-term business success
The CIPDrsquos Shaping the Future and Next Generation
HR flagship projects have both explored the
important issues of sustainability Shaping the Future
in particular warns against the dangers of lsquotalent
tunnel visionrsquo taking a short-sighted view on talent
strategies which are solely focused on the needs of
the here and now
Often organisations pay too little attention to
identifying and developing the capabilities that
individuals will need in the long term This implies a
leadershiptalent management capability gap with
too much focus on the operational needs of today
rather than the organisational imperatives
of tomorrow
Itrsquos never too late to start equipping your people
with the skills and knowledge they need to meet
both present and future challenges So what practical
recommendations can we make for resourcing and
talent professionals drawn from our Shaping the
Future evidence
Audit your organisationrsquos current skills and future capabilities If you havenrsquot done so already conduct a thorough
inventory of your organisationrsquos current skills and map
those against the capabilities you are likely to need
in the future Hold forecasting sessions which look at
macro and micro trends how these will impact your
way of working and the changes that will be required
for future success
Build your talent and succession pipeline You also need to be proactively building up your
talent pipelines (horizontally and vertically) so that
you are developing people with future-fit skills and
capabilities A silver lining from the current economic
climate is that more organisations are focusing on
developing internal talent and fully utilising the
skills of their existing workforce Fresh talent is
still important but recruitment strategies should
complement internal pipelines
Maintain a continuous focus on capability-building Capability-building should be part of a continuous
process embedded into policies and practices Across
our case study organisations managers talked about the
need to embed development and skills training as part
of business as usual rather than as a one-off activity
Develop a creative approach to skills and capability development Even when budgets are tight it is essential that
staff get the development they need to ensure they
have the capabilities for their current job role as well
as starting to build those that the organisation will
need in the future Our case study organisations were
focusing strongly on knowledge-sharing enabling
people to learn from others across the organisation
Many of you are already considering alternative
solutions for specialist skill development such as
apprenticeships internal management schemes
summer placements and internships It is also
important to work with universities to ensure that
graduates are developing skills and knowledge which
will help them to succeed in the workplace
RESO
UR
CIN
G A
ND
TALE
NT P
LAN
NIN
G 2
011
35
2011
BACkGROUND TO ThE SURVEy
This survey was conducted in March and April 2011 It was sent to a sample of UK-based HR professionals in the public private and voluntary sectors In total 626 people responded to the survey
This is the fifteenth annual CIPD Resourcing
and Talent Planning survey (formerly known as
the CIPDrsquos Recruitment Retention and Turnover
survey) The survey examines organisationsrsquo
resourcing and talent planning strategies and
practices and the key challenges and issues
they face The survey consists of 45 questions
completed through an online self-completion
questionnaire
The majority of questions remain the same as
previous years to provide useful benchmark
data on topics including recruitment practices
difficulties and costs selection methods diversity
strategies the impact of the economic climate on
resourcing and talent planning practices labour
turnover and retention strategies New question
areas this year examine the employment of
younger workers the length of the recruitment
process the nature of job vacancies relationships
with recruitment partners and the use of
strengths-based approaches to recruitment
A small number of respondents took part in follow-
up telephone interviews to produce mini case
studies on a selection of topics These are presented
in the coloured boxes throughout the report
Sample profile Respondents predominantly work for private
sector organisations with professional services
being particularly well represented but other
sectors are represented in similar proportions to
last year (Table A1)
36
RESOURCING AND TALENT PLANNING
Table A1 Breakdown of respondent organisations by industrial sector Number of respondents
Manufacturing and production 113 19
Agriculture and forestry 1 0
Chemicals oils and pharmaceuticals 9 1
Construction 8 1
Electricity gas and water 4 1
Engineering electronics and metals 38 6
Food drink and tobacco 18 3
General manufacturing 6 1
Mining and quarrying 4 1
Paper and printing 6 1
Textiles 2 0
Other manufacturingproduction 17 3
Private sector services 319 52
Professional services (accountancy advertising consultancy legal etc) 78 13
Finance insurance and real estate 33 5
Hotels catering and leisure 26 4
IT services 26 4
Call centres 3 0
Media (broadcasting and publishing etc) 7 1
Retail and wholesale 40 7
Transport distribution and storage 23 4
Communications 6 1
Other private services 77 13
Public services 100 16
Central government 14 2
Education 12 2
Health 23 4
Local government 22 4
Other public services 29 5
Non-profit organisations 78 13
Care services 9 1
Charity services 32 5
Housing association 17 3
Other voluntary 20 3 Base 610
cipd
cou
k2011resou
rcing
and
talentp
lann
ing
survey
2011 Most respondents work in small to medium-sized
organisations in terms of the number of UK-
based employees but larger organisations are
also represented in similar proportions to last year
(Table A2)
Respondents reported on organisations based
across the UK Three in ten responded for the
whole of the UK while others responded for a
particular regioncountry (see Table A3)
Table A2 Breakdown of sample by organisation size ndash permanent employees in the UK
Fewer than 10 5
10ndash49 12
50ndash249 33
250ndash999 25
1000ndash4999 12
More than 5000 13 Base 610
Table A3 Main region covered by the reply
East Anglia 5
East Midlands 3
West Midlands 5
North-east of England 3
North-west of England 7
South-west of England 6
Yorkshire and Humberside 5
South-east of England (excluding London)
12
London 12
Scotland 6
Wales 3
Northern Ireland 3
Ireland 0
Whole of UK 29 Base 602
Labour turnover A total of 175 survey respondents were able to
supply all the information necessary for us to
calculate labour turnover on a whole-organisation
basis
This report uses the standard lsquocrude wastagersquo
method to calculate the rate of turnover This
method is calculated as follows
Labour turnover =
Number of leavers in a set period
______________________________________ x 100
Average number employed in the same period
(Leavers include those leaving the organisation
by way of voluntary or involuntary severance
redundancies or retirements but does not include
internal transfers)
Readers should be aware that this method has
some shortcomings For example it takes no
account of the characteristics of the workforce or
the length of service of the leaver
Note on statistics and figures used Some respondents did not answer all questions so
where percentages are reported in tables or figures
the respondent lsquobasersquo for that question is given
lsquoAveragersquo in the report is used to refer to the
statistical mean where the data is normally
distributed However the median is used in cases
where the distribution is significantly skewed
When the median is used it is noted
With the exception of labour turnover rates all
figures in tables have been rounded to the nearest
percentage point Due to rounding percentages
may not always total 100
Chi-square (χ2) tests are used to examine whether
differences between groups such as industrial
sectors are significant or likely to be due to
chance Spearmanrsquos Rho correlation (Rho) is used
to examine relationships between variables We
report on statistics at the generally accepted level
of significance plt005
RESO
UR
CIN
G A
ND
TALE
NT P
LAN
NIN
G 2
011
37
38
RESOURCING AND TALENT PLANNING
fURThER SOURCES Of INfORmATION
We produce a range of free factsheets surveys
guides and research reports which are available on
the CIPD website at cipdcoukhrresources
Read our factsheets on Employer Brand
Employee Turnover and Retention
Induction
Outlook series Our quarterly reports Labour Market Outlook
and Employee Outlook look at the employer and
employee perspectives on the labour market and
on workplace issues and trends while HR Outlook
explores priorities and emerging trends for the HR
profession and function
View these reports at
cipdcoukresearchoutlook-series
Talent management Two reports look at talent issues in a recession
difficult economic climate
The War on Talent Talent management under
threat in uncertain times (2009)
Fighting Back through Talent Innovation (2010)
Opening up Talent for Business Success (2010)
looks at the importance of integrating talent
management and diversity
The Talent Perspective What does it feel like to
be talent-managed (2010) looks at the employee
view of talent management
Workforce planning Our guide Workforce Planning Right people right
time right skills (2010) gives advice on developing
workforce planning processes
Diversity Two survey reports and a guide provide practical
advice and information on trends
Diversity in Business A focus for progress (2007)
Managing an Ageing Workforce How employers
are adapting to an older labour market (2010)
Managing Age New edition 2011
Two further reports are available to order from
cipdcoukbookstore
Managing Diversity in Practice Supporting
business goals (2007)
Managing Diversity and the Business Case (2008)
Sign up to receive our e-newsletter at
cipdcoukcipdupdate
cipd
cou
k2011resou
rcing
and
talentp
lann
ing
survey
RESO
UR
CIN
G A
ND
TALE
NT P
LAN
NIN
G 2
011
39
2011
ACkNOwLEDGEmENTS
The CIPD is very grateful to those organisations and
individuals who gave their time to take part in this
research They include
bull Annette Sinclair Senior Researcher at Roffey
Park for analysing the findings and writing this
comprehensive report
bull Members of the Recruitment Forum Steering
Committee for their input into the survey
design and assistance in piloting the
questionnaire
bull Hays for their support and commitment at
every stage of the research
bull All those who shared examples of their
organisationrsquos practices
We hope that you find the research useful when
considering your own recruitment and retention
practices Please contact us if you have any
questions or ideas based on our findings
(researchcipdcouk)
RESOURCING AND TALENT PLANNING
fOOTNOTES 1 Chi Square = 573 df = 5 p lt 0001 n = 604 2 Rho = 073 p lt 0001 n = 577 3 Rho = 045 p lt 0001 n = 533 4 F = 250 df = 2 p lt 0001 n = 533 5 Chi Square = 180 df = 6 p lt 001 n = 535 6 Chi Square = 71 df = 2 p lt 005 n = 603 7 Chi Square = 230 df = 6 p lt 001 n = 600 8 Chi Square = 91 df = 3 p lt 005 n = 598 9 Chi Square = 129 df = 4 p lt 005 n = 610
10 Rho = 034 p lt 0001 n = 609 11 Chi square = 217 df = 3 p lt 0001 n = 609 12 Chi Square = 609 df = 8 p lt 0001 n = 607 13 Chi Square = 208 df = 3 p lt 0001 n = 560 14 Size of organisation and developing online
careers site Rho = 025 p lt 0001 n = 599 Size of
organisation and employee surveys Rho = 019
p lt 0001 n = 599 15 Chi Square = 167 df = 2 p lt 0001 n = 599
16 Working with charities Chi Square = 80 df = 2 p
lt 005 n = 599 corporate sponsorship Chi Square
= 116 df = 2 p lt 001 n = 599 17 Chi Square = 76 df = 2 p lt 005 n = 599 18 Table 11 also shows that this method is deemed
most effective by public sector organisations but
this effect is due to a greater proportion of
large public sector organisations in our
sample whereas private sector organisations are
more evenly distributed in size 19 Chi square = 109 df = 2 p lt 001 n = 610 20 Chi Square = 279 df = 4 p lt 0001 n = 610 21 Chi Square = 259 df = 6 p lt 0001 n = 598 22 Chi Square = 515 df = 6 p lt 0001 n = 597 22 Chi Square = 177 df = 8 p lt 005 n = 600 22 Chi Square = 339 df = 4 p lt 0001 n = 610 22 Chi Square = 820 df = 4 p lt 0001 n = 610 22 Chi Square = 522 df = 8 p lt 0001 n = 610 22 Rho = 024 p lt 0001 n = 195 22 Chi Square = 166 df = 2 p lt 0001 n = 544
cipd
cou
k2011resou
rcing
and
talentp
lann
ing
survey
40
2011
OTHER TITLES IN THIS SERIES
ABSENCE MANAGEMENT The annual Absence Management survey has been running for eleven years providing useful benchmarking data on absence levels the cost and causes of absence and how organisations are managing absence The latest report is brought to you in partnership with Simplyhealth
EMPLOYEE ATTITUDES TO PAY The annual Employee Attitudes to Pay survey investigates employee attitudes and expectations towards pay and bonuses Now in its third year this survey is carried out by YouGov and focuses on employees in the UK
REWARD MANAGEMENT The annual Reward Management survey has been running for ten years and provides practical insights into current trends practices and issues affecting reward management in the UK It examines strategic reward base and variable pay bonuses incentives pensions reward measurement and total reward issues This report was brought to you in partnership with Benefex
LEARNING AND TALENT DEvELOPMENT The annual Learning and Talent Development survey is now in its thirteenth year and provides valuable commentary on current and future issues and trends It explores employer support for learning talent management employee skills managing and evaluating coaching and training spend
Issu
ed J
une
2011
Ref
eren
ce 5
552
copy C
hart
ered
Inst
itute
of
Pers
onne
l and
Dev
elop
men
t 20
11
Chartered Institute of Personnel and Development
151 The Broadway London SW19 1JQ
Tel 020 8612 6200 Fax 020 8612 6201
Email cipdcipdcouk Website cipdcouk
Incorporated by Royal Charter Registered charity no1079797

RESO
UR
CIN
G A
ND
TALE
NT P
LAN
NIN
G 2
011
29
2011
4 mANAGING LABOUR TURNOVER
Figures from the Office for National Statistics show that UK unemployment rose by 27000 in the three months to the end of January 2011 to 253 million the highest since 1994 When unemployment is high the number of employees leaving organisations voluntarily is expected to decrease Here we examine whether this is happening and how organisations are tackling the issue of employee retention
Among organisations that are able to supply
turnover data the median labour turnover rate
has decreased over the past few years (Table 21)
The median figure however hides differences
across organisations Slightly more organisations
report their turnover has increased in 2010
compared with 2009 (38) than has decreased
(33) while for nearly a third (29) it remained
the same Smaller organisations are more likely
to report their labour turnover has increased and
larger organisations that it has decreased27
As in previous years the majority of turnover (53)
is still attributed to employees leaving voluntarily
(Table 22) As the economy has improved the
median proportion of turnover due to redundancies
has reduced Only 12 of organisations that
provided reasons for leaving made more than ten
redundancies in the previous year compared with
33 in 2010 26 in 2009 and 22 in 2008 A third
(34) of organisations that made redundancies
offered career transition services
While median turnover rates have reduced
across all sectors Table 23 shows that the rate
of voluntary leavers has increased slightly in
the private sector compared with last year but
decreased in the voluntary and public services
sector This reflects improvements in the economic
outlook for the private sector and the widespread
cuts in the public sector which also have a direct
impact on many not-for-profit organisations that
provide services for the public sector
Cost of labour turnover While just over half of organisations calculate
their recruitment costs only 13 calculate the
cost of their labour turnover (2010 14) The
majority of organisations report they do not
calculate these costs (79) while 7 donrsquot know
if they are calculated or not
Nearly half (46) of those who calculate their
turnover costs want to maintain their current
turnover rate while one-fifth (38) want to
reduce turnover during 2011 and 15 want to
increase it
Retaining employees The steps organisations take to retain employees
in their workforce can have a significant impact
on organisational efficiency and success through
30
RESOURCING AND TALENT PLANNING
Table 21 Median rate of labour turnover ()
2011 2010 survey 2009 survey 2008 survey 2007 survey 2006 survey
125 135 157 173 181 183
Base 175 (2011)
Table 22 Median labour turnover rates by reason for leaving ()
2011 survey 2010 survey 2009 survey
Voluntary redundancies 0 0 0
Compulsory redundancies 0 10 05
Dismissedleft involuntarily (including death in service)
07 09 14
Fixed-short-term contracts 0 0 07
Retired 0 04 07
Left voluntarily 66 84 90
Base 154 (2011)
Table 23 Median labour turnover rates by industry sector ()
cipd
cou
k2011resou
rcing
and
talentp
lann
ing
survey
Sector All leavers Voluntary leavers
2011 survey
2010 survey
2009 survey
2011 survey
2010 survey
2009 survey
Manufacturing and production 93 (38) 124 (44) 153 (80) 37 (35) 27 (42) 77 (75)
Private sector services 138 (96) 146 (77) 168 (150) 87 (82) 74 (71) 104 (129)
Public services 85 (28) 86 (19) 126 (52) 34 (10) 58 (15) 76 (45)
Voluntary community not-for-profit 131 (11) 159 (15) 164 (38) 70 (24) 102 (18) 110 (35) Number of respondents shown in brackets
decreasing employee turnover loss of talent and
recruitment and training costs while having a
positive impact on motivation job satisfaction and
the employer brand
Only two-fifths (42) of organisations
experienced no difficulties in retaining staff
during 2010 This figure is similar to last year
(45) but higher than the findings for 2008
when 31 reported they had no retention
difficulties These findings reflect the increased
caution of employees regarding leaving their
jobs during times of economic uncertainty and
high unemployment Supporting this are our
findings that the public (49) and not-for-profit
sectors (49) are more likely to report they had
no difficulties in retaining staff during 2010
compared with the private sector (38)
As in previous years organisations most
commonly have difficulty retaining managers
and professionalsspecialists (Table 24) The
manufacturing and production sector are most
likely to report difficulties retaining technical
2011 staff and the private services sector that they have
most difficulty retaining services staff This may
reflect the higher demand for these categories of
employees in these sectors
While most organisations have taken one or more
steps to address staff retention nearly one in four
organisations (23) report that no specific retention
initiatives were undertaken This is a similar
proportion to last year although substantially higher
than in previous years when retention difficulties
were more common due to a tighter labour market
(Table 25) Public sector organisations are twice
as likely not to have taken any steps to address
retention as those in the private or not for-profit
sectors (39 compared with 20 of private sector
and 16 of not-for-profits)28
The most common methods used to address
retention in 2010 used by nearly two-fifths of
organisations are to improve line managersrsquo
people skills improve learning and development
opportunities and improve the induction process
Improving line managersrsquo people skills and
learning and development opportunities are also
most commonly rated among the top three most
effective retention methods The effectiveness of
improving induction processes is more varied with
22 rating it among the top three most effective
methods and 12 among the top three least
effective methods Views are also mixed regarding
the effectiveness of improved pay It is likely that
employees are motivated by different factors
Employers need to provide a healthy working
environment where employees are treated with
respect and make efforts to match their retention
initiatives with what staff want
Table 24 Retention difficulties by occupational category ()
Voluntary community
Private and All Manufacturing sector Public not-for- All
2011 and production services services profit 2010
Managers and professionals specialists 28 26 29 25 29 27
Technical 21 37 19 17 13 20
Services (customer personal protective and sales) 13 7 21 4 4 12
Administrative secretarial 9 5 8 15 13 7
Senior managersdirectors 7 5 8 10 6 9
Manualcraft workers 6 11 6 3 4 4 Base 601 (2011) 451 (2010)
RESO
UR
CIN
G A
ND
TALE
NT P
LAN
NIN
G 2
011
31
32
RESOURCING AND TALENT PLANNING
Table 25 Steps taken specifically to address staff retention ()
Used in Least Most Used in Used in Used in 2010 effective effective 2009 2008 2007
Improved line managers people skills 39 7 31 42 39 37
Increased learning and development opportunities 38 5 34 35 47 46
Improved induction process 38 12 22 31 45 45
Improved employee involvement 34 8 24 32 35 29
Improved selection techniques 30 7 25 31 42 46
Improved pay 27 11 23 22 42 53
Offered coachingmentoring buddy systems 24 8 14 20 24 22
Improved benefits 21 8 14 19 32 36
Better promotion to employees of the employer brand 18 10 5 15 21 16
Created clearer career paths 18 6 2 21 18 17
Revised the way staff are rewarded so their efforts are 18 4 13 14 19 19 better recognised
Made changes to improve workndash life balance 17 5 13 19 31 30
Improved physical working conditions 15 8 7 13 19 12
Redesigned jobs to make them more satisfying 11 4 8 13 18 14
Increased our use of countershyoffers 4 4 14
No specific initiatives undertaken 23 3 1 27 13 9 Base 559 (2011 survey) 431 (2010 survey) 695 (2009 survey) 710 (2008 survey)
new item added in 2011
cipd
cou
k2011resou
rcing
and
talentp
lann
ing
survey
RESO
UR
CIN
G A
ND
TALE
NT P
LAN
NIN
G 2
011
33
2011
CONCLUSIONS
Looking forward In January 2010 the UK officially emerged from
the longest recession since the 1930s Economic
growth however remains sluggish and the public
sector has embarked on a four-year programme of
the biggest government spending cuts in decades
to address the fiscal deficit
In the labour market unemployment remained
high throughout 2010 Figures from the Office
for National Statistics (ONS) show that UK
unemployment rose by 27000 in the three months
to the end of January 2011 to 253 million the
highest since 1994 While recent months have seen
signs of improvement there are concerns that the
slow growth in the private sector will be unable
to fully compensate for the increasing job losses in
the public sector that will result from the budget
cuts This is supported by the findings from the
CIPDrsquos spring 2011 Labour Market Outlook which
shows the impact on the overall labour market of a
slight rise in private sector recruitment is still being
cancelled out by large-scale public sector job losses
The findings of the CIPDrsquos 2011 Resourcing and
Talent Planning survey reflect the challenges
of the economic environment Organisations
generally have increased their focus on costs On
average organisations spent less on filling each
vacancy and a fifth have reduced their resourcing
budgets and talent management spend In the
public sector the focus on costs and budget
reductions was particularly apparent
The end of the recession has meant fewer
redundancies in 2010 Nevertheless over a third
of public sector and one-fifth of private sector
organisations reduced their headcount The
number of vacancies on offer by organisations
remained as low as in 2009 overall and continued
to decrease in very large organisations particularly
in the public sector
Looking forward private sector growth is expected
to remain slow and the full impact of public
sector budget cuts is still to come Resourcing and
talent management budgets will be further hit
in 2011ndash12 and many public sector organisations
will implement recruitment freezes and reduce
graduate intake and recruitment generally
Resourcing and talent practices are changing to
reflect the stronger focus on costs and reductions
in budgets Particularly in the public sector but
also in the private sector trends indicate a greater
focus on developing talent in-house retaining
rather than recruiting talent and reducing reliance
on recruitment agencies and external consultants
for resourcing and development
Our findings do not present a positive outlook
for the vast number of unemployed A substantial
proportion of organisations reports that the
already low number of vacancies available to them
is likely to be further affected by the abolition
of the Default Retirement Age Yet despite the
high unemployment rate most organisations
reported difficulties in filling vacancies mostly due
to skill shortages We have also seen an increase
in the proportion of organisations reporting
that competition for talent is even greater as the
pool of available talent to hire has fallen sharply
For many organisations there appears a clear
mismatch between the skills they require and
those available in the labour market Some are
concerned this will be exacerbated by the increase
in university tuition fees Some are responding
cipd
cou
k2011resou
rcing
and
talentp
lann
ing
survey
34
RESOURCING AND TALENT PLANNING
by increasing apprenticeship schemes internships
and sponsoring students through university Such
schemes may be aided by the Governmentrsquos recently
announced pound60 million commitment to help boost
youth employment and provide extra support for
apprenticeships and changes to vocational training
and education How far this will go towards meeting
organisationsrsquo skill requirements remains to be seen
On a positive note our findings indicate that talent
management is viewed as more not less important
in difficult times although with reduced budgets
organisations will have to be innovative with
their approach and strategies In order to survive
organisations will need to make certain they focus
beyond the cost-cutting required in the current
environment to ensuring their talent strategies are
aligned to long-term business success
The CIPDrsquos Shaping the Future and Next Generation
HR flagship projects have both explored the
important issues of sustainability Shaping the Future
in particular warns against the dangers of lsquotalent
tunnel visionrsquo taking a short-sighted view on talent
strategies which are solely focused on the needs of
the here and now
Often organisations pay too little attention to
identifying and developing the capabilities that
individuals will need in the long term This implies a
leadershiptalent management capability gap with
too much focus on the operational needs of today
rather than the organisational imperatives
of tomorrow
Itrsquos never too late to start equipping your people
with the skills and knowledge they need to meet
both present and future challenges So what practical
recommendations can we make for resourcing and
talent professionals drawn from our Shaping the
Future evidence
Audit your organisationrsquos current skills and future capabilities If you havenrsquot done so already conduct a thorough
inventory of your organisationrsquos current skills and map
those against the capabilities you are likely to need
in the future Hold forecasting sessions which look at
macro and micro trends how these will impact your
way of working and the changes that will be required
for future success
Build your talent and succession pipeline You also need to be proactively building up your
talent pipelines (horizontally and vertically) so that
you are developing people with future-fit skills and
capabilities A silver lining from the current economic
climate is that more organisations are focusing on
developing internal talent and fully utilising the
skills of their existing workforce Fresh talent is
still important but recruitment strategies should
complement internal pipelines
Maintain a continuous focus on capability-building Capability-building should be part of a continuous
process embedded into policies and practices Across
our case study organisations managers talked about the
need to embed development and skills training as part
of business as usual rather than as a one-off activity
Develop a creative approach to skills and capability development Even when budgets are tight it is essential that
staff get the development they need to ensure they
have the capabilities for their current job role as well
as starting to build those that the organisation will
need in the future Our case study organisations were
focusing strongly on knowledge-sharing enabling
people to learn from others across the organisation
Many of you are already considering alternative
solutions for specialist skill development such as
apprenticeships internal management schemes
summer placements and internships It is also
important to work with universities to ensure that
graduates are developing skills and knowledge which
will help them to succeed in the workplace
RESO
UR
CIN
G A
ND
TALE
NT P
LAN
NIN
G 2
011
35
2011
BACkGROUND TO ThE SURVEy
This survey was conducted in March and April 2011 It was sent to a sample of UK-based HR professionals in the public private and voluntary sectors In total 626 people responded to the survey
This is the fifteenth annual CIPD Resourcing
and Talent Planning survey (formerly known as
the CIPDrsquos Recruitment Retention and Turnover
survey) The survey examines organisationsrsquo
resourcing and talent planning strategies and
practices and the key challenges and issues
they face The survey consists of 45 questions
completed through an online self-completion
questionnaire
The majority of questions remain the same as
previous years to provide useful benchmark
data on topics including recruitment practices
difficulties and costs selection methods diversity
strategies the impact of the economic climate on
resourcing and talent planning practices labour
turnover and retention strategies New question
areas this year examine the employment of
younger workers the length of the recruitment
process the nature of job vacancies relationships
with recruitment partners and the use of
strengths-based approaches to recruitment
A small number of respondents took part in follow-
up telephone interviews to produce mini case
studies on a selection of topics These are presented
in the coloured boxes throughout the report
Sample profile Respondents predominantly work for private
sector organisations with professional services
being particularly well represented but other
sectors are represented in similar proportions to
last year (Table A1)
36
RESOURCING AND TALENT PLANNING
Table A1 Breakdown of respondent organisations by industrial sector Number of respondents
Manufacturing and production 113 19
Agriculture and forestry 1 0
Chemicals oils and pharmaceuticals 9 1
Construction 8 1
Electricity gas and water 4 1
Engineering electronics and metals 38 6
Food drink and tobacco 18 3
General manufacturing 6 1
Mining and quarrying 4 1
Paper and printing 6 1
Textiles 2 0
Other manufacturingproduction 17 3
Private sector services 319 52
Professional services (accountancy advertising consultancy legal etc) 78 13
Finance insurance and real estate 33 5
Hotels catering and leisure 26 4
IT services 26 4
Call centres 3 0
Media (broadcasting and publishing etc) 7 1
Retail and wholesale 40 7
Transport distribution and storage 23 4
Communications 6 1
Other private services 77 13
Public services 100 16
Central government 14 2
Education 12 2
Health 23 4
Local government 22 4
Other public services 29 5
Non-profit organisations 78 13
Care services 9 1
Charity services 32 5
Housing association 17 3
Other voluntary 20 3 Base 610
cipd
cou
k2011resou
rcing
and
talentp
lann
ing
survey
2011 Most respondents work in small to medium-sized
organisations in terms of the number of UK-
based employees but larger organisations are
also represented in similar proportions to last year
(Table A2)
Respondents reported on organisations based
across the UK Three in ten responded for the
whole of the UK while others responded for a
particular regioncountry (see Table A3)
Table A2 Breakdown of sample by organisation size ndash permanent employees in the UK
Fewer than 10 5
10ndash49 12
50ndash249 33
250ndash999 25
1000ndash4999 12
More than 5000 13 Base 610
Table A3 Main region covered by the reply
East Anglia 5
East Midlands 3
West Midlands 5
North-east of England 3
North-west of England 7
South-west of England 6
Yorkshire and Humberside 5
South-east of England (excluding London)
12
London 12
Scotland 6
Wales 3
Northern Ireland 3
Ireland 0
Whole of UK 29 Base 602
Labour turnover A total of 175 survey respondents were able to
supply all the information necessary for us to
calculate labour turnover on a whole-organisation
basis
This report uses the standard lsquocrude wastagersquo
method to calculate the rate of turnover This
method is calculated as follows
Labour turnover =
Number of leavers in a set period
______________________________________ x 100
Average number employed in the same period
(Leavers include those leaving the organisation
by way of voluntary or involuntary severance
redundancies or retirements but does not include
internal transfers)
Readers should be aware that this method has
some shortcomings For example it takes no
account of the characteristics of the workforce or
the length of service of the leaver
Note on statistics and figures used Some respondents did not answer all questions so
where percentages are reported in tables or figures
the respondent lsquobasersquo for that question is given
lsquoAveragersquo in the report is used to refer to the
statistical mean where the data is normally
distributed However the median is used in cases
where the distribution is significantly skewed
When the median is used it is noted
With the exception of labour turnover rates all
figures in tables have been rounded to the nearest
percentage point Due to rounding percentages
may not always total 100
Chi-square (χ2) tests are used to examine whether
differences between groups such as industrial
sectors are significant or likely to be due to
chance Spearmanrsquos Rho correlation (Rho) is used
to examine relationships between variables We
report on statistics at the generally accepted level
of significance plt005
RESO
UR
CIN
G A
ND
TALE
NT P
LAN
NIN
G 2
011
37
38
RESOURCING AND TALENT PLANNING
fURThER SOURCES Of INfORmATION
We produce a range of free factsheets surveys
guides and research reports which are available on
the CIPD website at cipdcoukhrresources
Read our factsheets on Employer Brand
Employee Turnover and Retention
Induction
Outlook series Our quarterly reports Labour Market Outlook
and Employee Outlook look at the employer and
employee perspectives on the labour market and
on workplace issues and trends while HR Outlook
explores priorities and emerging trends for the HR
profession and function
View these reports at
cipdcoukresearchoutlook-series
Talent management Two reports look at talent issues in a recession
difficult economic climate
The War on Talent Talent management under
threat in uncertain times (2009)
Fighting Back through Talent Innovation (2010)
Opening up Talent for Business Success (2010)
looks at the importance of integrating talent
management and diversity
The Talent Perspective What does it feel like to
be talent-managed (2010) looks at the employee
view of talent management
Workforce planning Our guide Workforce Planning Right people right
time right skills (2010) gives advice on developing
workforce planning processes
Diversity Two survey reports and a guide provide practical
advice and information on trends
Diversity in Business A focus for progress (2007)
Managing an Ageing Workforce How employers
are adapting to an older labour market (2010)
Managing Age New edition 2011
Two further reports are available to order from
cipdcoukbookstore
Managing Diversity in Practice Supporting
business goals (2007)
Managing Diversity and the Business Case (2008)
Sign up to receive our e-newsletter at
cipdcoukcipdupdate
cipd
cou
k2011resou
rcing
and
talentp
lann
ing
survey
RESO
UR
CIN
G A
ND
TALE
NT P
LAN
NIN
G 2
011
39
2011
ACkNOwLEDGEmENTS
The CIPD is very grateful to those organisations and
individuals who gave their time to take part in this
research They include
bull Annette Sinclair Senior Researcher at Roffey
Park for analysing the findings and writing this
comprehensive report
bull Members of the Recruitment Forum Steering
Committee for their input into the survey
design and assistance in piloting the
questionnaire
bull Hays for their support and commitment at
every stage of the research
bull All those who shared examples of their
organisationrsquos practices
We hope that you find the research useful when
considering your own recruitment and retention
practices Please contact us if you have any
questions or ideas based on our findings
(researchcipdcouk)
RESOURCING AND TALENT PLANNING
fOOTNOTES 1 Chi Square = 573 df = 5 p lt 0001 n = 604 2 Rho = 073 p lt 0001 n = 577 3 Rho = 045 p lt 0001 n = 533 4 F = 250 df = 2 p lt 0001 n = 533 5 Chi Square = 180 df = 6 p lt 001 n = 535 6 Chi Square = 71 df = 2 p lt 005 n = 603 7 Chi Square = 230 df = 6 p lt 001 n = 600 8 Chi Square = 91 df = 3 p lt 005 n = 598 9 Chi Square = 129 df = 4 p lt 005 n = 610
10 Rho = 034 p lt 0001 n = 609 11 Chi square = 217 df = 3 p lt 0001 n = 609 12 Chi Square = 609 df = 8 p lt 0001 n = 607 13 Chi Square = 208 df = 3 p lt 0001 n = 560 14 Size of organisation and developing online
careers site Rho = 025 p lt 0001 n = 599 Size of
organisation and employee surveys Rho = 019
p lt 0001 n = 599 15 Chi Square = 167 df = 2 p lt 0001 n = 599
16 Working with charities Chi Square = 80 df = 2 p
lt 005 n = 599 corporate sponsorship Chi Square
= 116 df = 2 p lt 001 n = 599 17 Chi Square = 76 df = 2 p lt 005 n = 599 18 Table 11 also shows that this method is deemed
most effective by public sector organisations but
this effect is due to a greater proportion of
large public sector organisations in our
sample whereas private sector organisations are
more evenly distributed in size 19 Chi square = 109 df = 2 p lt 001 n = 610 20 Chi Square = 279 df = 4 p lt 0001 n = 610 21 Chi Square = 259 df = 6 p lt 0001 n = 598 22 Chi Square = 515 df = 6 p lt 0001 n = 597 22 Chi Square = 177 df = 8 p lt 005 n = 600 22 Chi Square = 339 df = 4 p lt 0001 n = 610 22 Chi Square = 820 df = 4 p lt 0001 n = 610 22 Chi Square = 522 df = 8 p lt 0001 n = 610 22 Rho = 024 p lt 0001 n = 195 22 Chi Square = 166 df = 2 p lt 0001 n = 544
cipd
cou
k2011resou
rcing
and
talentp
lann
ing
survey
40
2011
OTHER TITLES IN THIS SERIES
ABSENCE MANAGEMENT The annual Absence Management survey has been running for eleven years providing useful benchmarking data on absence levels the cost and causes of absence and how organisations are managing absence The latest report is brought to you in partnership with Simplyhealth
EMPLOYEE ATTITUDES TO PAY The annual Employee Attitudes to Pay survey investigates employee attitudes and expectations towards pay and bonuses Now in its third year this survey is carried out by YouGov and focuses on employees in the UK
REWARD MANAGEMENT The annual Reward Management survey has been running for ten years and provides practical insights into current trends practices and issues affecting reward management in the UK It examines strategic reward base and variable pay bonuses incentives pensions reward measurement and total reward issues This report was brought to you in partnership with Benefex
LEARNING AND TALENT DEvELOPMENT The annual Learning and Talent Development survey is now in its thirteenth year and provides valuable commentary on current and future issues and trends It explores employer support for learning talent management employee skills managing and evaluating coaching and training spend
Issu
ed J
une
2011
Ref
eren
ce 5
552
copy C
hart
ered
Inst
itute
of
Pers
onne
l and
Dev
elop
men
t 20
11
Chartered Institute of Personnel and Development
151 The Broadway London SW19 1JQ
Tel 020 8612 6200 Fax 020 8612 6201
Email cipdcipdcouk Website cipdcouk
Incorporated by Royal Charter Registered charity no1079797
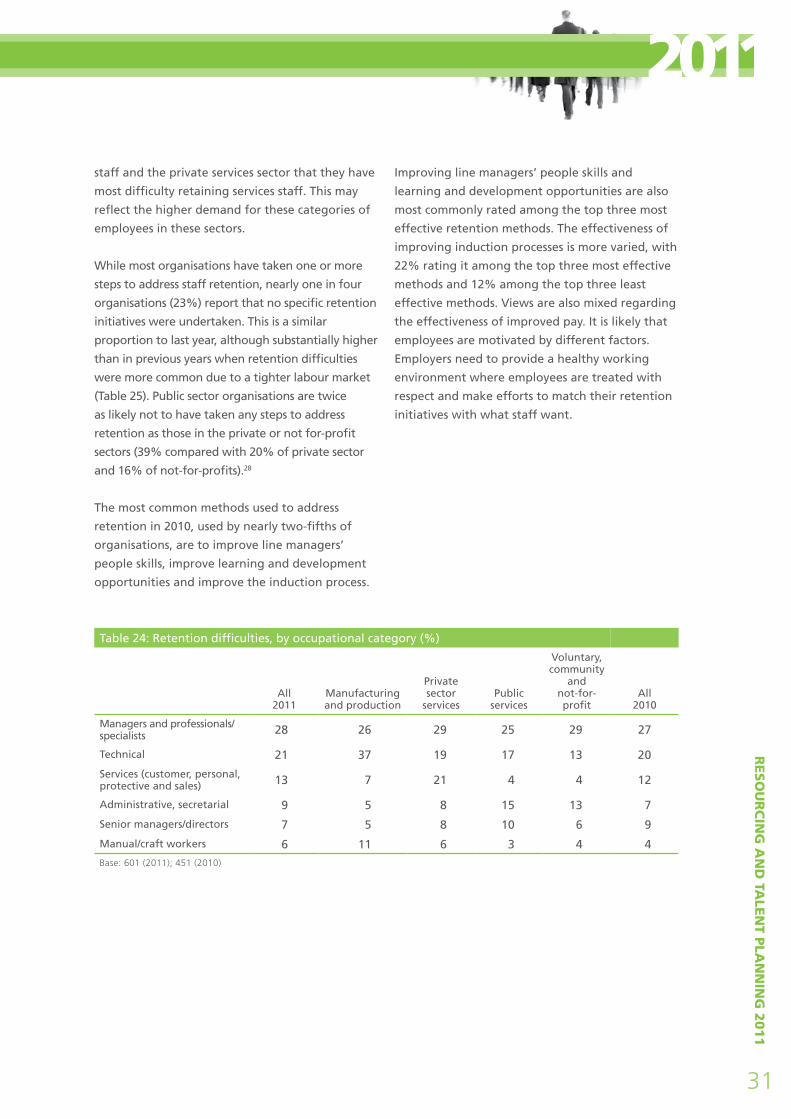
RESO
UR
CIN
G A
ND
TALE
NT P
LAN
NIN
G 2
011
33
2011
CONCLUSIONS
Looking forward In January 2010 the UK officially emerged from
the longest recession since the 1930s Economic
growth however remains sluggish and the public
sector has embarked on a four-year programme of
the biggest government spending cuts in decades
to address the fiscal deficit
In the labour market unemployment remained
high throughout 2010 Figures from the Office
for National Statistics (ONS) show that UK
unemployment rose by 27000 in the three months
to the end of January 2011 to 253 million the
highest since 1994 While recent months have seen
signs of improvement there are concerns that the
slow growth in the private sector will be unable
to fully compensate for the increasing job losses in
the public sector that will result from the budget
cuts This is supported by the findings from the
CIPDrsquos spring 2011 Labour Market Outlook which
shows the impact on the overall labour market of a
slight rise in private sector recruitment is still being
cancelled out by large-scale public sector job losses
The findings of the CIPDrsquos 2011 Resourcing and
Talent Planning survey reflect the challenges
of the economic environment Organisations
generally have increased their focus on costs On
average organisations spent less on filling each
vacancy and a fifth have reduced their resourcing
budgets and talent management spend In the
public sector the focus on costs and budget
reductions was particularly apparent
The end of the recession has meant fewer
redundancies in 2010 Nevertheless over a third
of public sector and one-fifth of private sector
organisations reduced their headcount The
number of vacancies on offer by organisations
remained as low as in 2009 overall and continued
to decrease in very large organisations particularly
in the public sector
Looking forward private sector growth is expected
to remain slow and the full impact of public
sector budget cuts is still to come Resourcing and
talent management budgets will be further hit
in 2011ndash12 and many public sector organisations
will implement recruitment freezes and reduce
graduate intake and recruitment generally
Resourcing and talent practices are changing to
reflect the stronger focus on costs and reductions
in budgets Particularly in the public sector but
also in the private sector trends indicate a greater
focus on developing talent in-house retaining
rather than recruiting talent and reducing reliance
on recruitment agencies and external consultants
for resourcing and development
Our findings do not present a positive outlook
for the vast number of unemployed A substantial
proportion of organisations reports that the
already low number of vacancies available to them
is likely to be further affected by the abolition
of the Default Retirement Age Yet despite the
high unemployment rate most organisations
reported difficulties in filling vacancies mostly due
to skill shortages We have also seen an increase
in the proportion of organisations reporting
that competition for talent is even greater as the
pool of available talent to hire has fallen sharply
For many organisations there appears a clear
mismatch between the skills they require and
those available in the labour market Some are
concerned this will be exacerbated by the increase
in university tuition fees Some are responding
cipd
cou
k2011resou
rcing
and
talentp
lann
ing
survey
34
RESOURCING AND TALENT PLANNING
by increasing apprenticeship schemes internships
and sponsoring students through university Such
schemes may be aided by the Governmentrsquos recently
announced pound60 million commitment to help boost
youth employment and provide extra support for
apprenticeships and changes to vocational training
and education How far this will go towards meeting
organisationsrsquo skill requirements remains to be seen
On a positive note our findings indicate that talent
management is viewed as more not less important
in difficult times although with reduced budgets
organisations will have to be innovative with
their approach and strategies In order to survive
organisations will need to make certain they focus
beyond the cost-cutting required in the current
environment to ensuring their talent strategies are
aligned to long-term business success
The CIPDrsquos Shaping the Future and Next Generation
HR flagship projects have both explored the
important issues of sustainability Shaping the Future
in particular warns against the dangers of lsquotalent
tunnel visionrsquo taking a short-sighted view on talent
strategies which are solely focused on the needs of
the here and now
Often organisations pay too little attention to
identifying and developing the capabilities that
individuals will need in the long term This implies a
leadershiptalent management capability gap with
too much focus on the operational needs of today
rather than the organisational imperatives
of tomorrow
Itrsquos never too late to start equipping your people
with the skills and knowledge they need to meet
both present and future challenges So what practical
recommendations can we make for resourcing and
talent professionals drawn from our Shaping the
Future evidence
Audit your organisationrsquos current skills and future capabilities If you havenrsquot done so already conduct a thorough
inventory of your organisationrsquos current skills and map
those against the capabilities you are likely to need
in the future Hold forecasting sessions which look at
macro and micro trends how these will impact your
way of working and the changes that will be required
for future success
Build your talent and succession pipeline You also need to be proactively building up your
talent pipelines (horizontally and vertically) so that
you are developing people with future-fit skills and
capabilities A silver lining from the current economic
climate is that more organisations are focusing on
developing internal talent and fully utilising the
skills of their existing workforce Fresh talent is
still important but recruitment strategies should
complement internal pipelines
Maintain a continuous focus on capability-building Capability-building should be part of a continuous
process embedded into policies and practices Across
our case study organisations managers talked about the
need to embed development and skills training as part
of business as usual rather than as a one-off activity
Develop a creative approach to skills and capability development Even when budgets are tight it is essential that
staff get the development they need to ensure they
have the capabilities for their current job role as well
as starting to build those that the organisation will
need in the future Our case study organisations were
focusing strongly on knowledge-sharing enabling
people to learn from others across the organisation
Many of you are already considering alternative
solutions for specialist skill development such as
apprenticeships internal management schemes
summer placements and internships It is also
important to work with universities to ensure that
graduates are developing skills and knowledge which
will help them to succeed in the workplace
RESO
UR
CIN
G A
ND
TALE
NT P
LAN
NIN
G 2
011
35
2011
BACkGROUND TO ThE SURVEy
This survey was conducted in March and April 2011 It was sent to a sample of UK-based HR professionals in the public private and voluntary sectors In total 626 people responded to the survey
This is the fifteenth annual CIPD Resourcing
and Talent Planning survey (formerly known as
the CIPDrsquos Recruitment Retention and Turnover
survey) The survey examines organisationsrsquo
resourcing and talent planning strategies and
practices and the key challenges and issues
they face The survey consists of 45 questions
completed through an online self-completion
questionnaire
The majority of questions remain the same as
previous years to provide useful benchmark
data on topics including recruitment practices
difficulties and costs selection methods diversity
strategies the impact of the economic climate on
resourcing and talent planning practices labour
turnover and retention strategies New question
areas this year examine the employment of
younger workers the length of the recruitment
process the nature of job vacancies relationships
with recruitment partners and the use of
strengths-based approaches to recruitment
A small number of respondents took part in follow-
up telephone interviews to produce mini case
studies on a selection of topics These are presented
in the coloured boxes throughout the report
Sample profile Respondents predominantly work for private
sector organisations with professional services
being particularly well represented but other
sectors are represented in similar proportions to
last year (Table A1)
36
RESOURCING AND TALENT PLANNING
Table A1 Breakdown of respondent organisations by industrial sector Number of respondents
Manufacturing and production 113 19
Agriculture and forestry 1 0
Chemicals oils and pharmaceuticals 9 1
Construction 8 1
Electricity gas and water 4 1
Engineering electronics and metals 38 6
Food drink and tobacco 18 3
General manufacturing 6 1
Mining and quarrying 4 1
Paper and printing 6 1
Textiles 2 0
Other manufacturingproduction 17 3
Private sector services 319 52
Professional services (accountancy advertising consultancy legal etc) 78 13
Finance insurance and real estate 33 5
Hotels catering and leisure 26 4
IT services 26 4
Call centres 3 0
Media (broadcasting and publishing etc) 7 1
Retail and wholesale 40 7
Transport distribution and storage 23 4
Communications 6 1
Other private services 77 13
Public services 100 16
Central government 14 2
Education 12 2
Health 23 4
Local government 22 4
Other public services 29 5
Non-profit organisations 78 13
Care services 9 1
Charity services 32 5
Housing association 17 3
Other voluntary 20 3 Base 610
cipd
cou
k2011resou
rcing
and
talentp
lann
ing
survey
2011 Most respondents work in small to medium-sized
organisations in terms of the number of UK-
based employees but larger organisations are
also represented in similar proportions to last year
(Table A2)
Respondents reported on organisations based
across the UK Three in ten responded for the
whole of the UK while others responded for a
particular regioncountry (see Table A3)
Table A2 Breakdown of sample by organisation size ndash permanent employees in the UK
Fewer than 10 5
10ndash49 12
50ndash249 33
250ndash999 25
1000ndash4999 12
More than 5000 13 Base 610
Table A3 Main region covered by the reply
East Anglia 5
East Midlands 3
West Midlands 5
North-east of England 3
North-west of England 7
South-west of England 6
Yorkshire and Humberside 5
South-east of England (excluding London)
12
London 12
Scotland 6
Wales 3
Northern Ireland 3
Ireland 0
Whole of UK 29 Base 602
Labour turnover A total of 175 survey respondents were able to
supply all the information necessary for us to
calculate labour turnover on a whole-organisation
basis
This report uses the standard lsquocrude wastagersquo
method to calculate the rate of turnover This
method is calculated as follows
Labour turnover =
Number of leavers in a set period
______________________________________ x 100
Average number employed in the same period
(Leavers include those leaving the organisation
by way of voluntary or involuntary severance
redundancies or retirements but does not include
internal transfers)
Readers should be aware that this method has
some shortcomings For example it takes no
account of the characteristics of the workforce or
the length of service of the leaver
Note on statistics and figures used Some respondents did not answer all questions so
where percentages are reported in tables or figures
the respondent lsquobasersquo for that question is given
lsquoAveragersquo in the report is used to refer to the
statistical mean where the data is normally
distributed However the median is used in cases
where the distribution is significantly skewed
When the median is used it is noted
With the exception of labour turnover rates all
figures in tables have been rounded to the nearest
percentage point Due to rounding percentages
may not always total 100
Chi-square (χ2) tests are used to examine whether
differences between groups such as industrial
sectors are significant or likely to be due to
chance Spearmanrsquos Rho correlation (Rho) is used
to examine relationships between variables We
report on statistics at the generally accepted level
of significance plt005
RESO
UR
CIN
G A
ND
TALE
NT P
LAN
NIN
G 2
011
37
38
RESOURCING AND TALENT PLANNING
fURThER SOURCES Of INfORmATION
We produce a range of free factsheets surveys
guides and research reports which are available on
the CIPD website at cipdcoukhrresources
Read our factsheets on Employer Brand
Employee Turnover and Retention
Induction
Outlook series Our quarterly reports Labour Market Outlook
and Employee Outlook look at the employer and
employee perspectives on the labour market and
on workplace issues and trends while HR Outlook
explores priorities and emerging trends for the HR
profession and function
View these reports at
cipdcoukresearchoutlook-series
Talent management Two reports look at talent issues in a recession
difficult economic climate
The War on Talent Talent management under
threat in uncertain times (2009)
Fighting Back through Talent Innovation (2010)
Opening up Talent for Business Success (2010)
looks at the importance of integrating talent
management and diversity
The Talent Perspective What does it feel like to
be talent-managed (2010) looks at the employee
view of talent management
Workforce planning Our guide Workforce Planning Right people right
time right skills (2010) gives advice on developing
workforce planning processes
Diversity Two survey reports and a guide provide practical
advice and information on trends
Diversity in Business A focus for progress (2007)
Managing an Ageing Workforce How employers
are adapting to an older labour market (2010)
Managing Age New edition 2011
Two further reports are available to order from
cipdcoukbookstore
Managing Diversity in Practice Supporting
business goals (2007)
Managing Diversity and the Business Case (2008)
Sign up to receive our e-newsletter at
cipdcoukcipdupdate
cipd
cou
k2011resou
rcing
and
talentp
lann
ing
survey
RESO
UR
CIN
G A
ND
TALE
NT P
LAN
NIN
G 2
011
39
2011
ACkNOwLEDGEmENTS
The CIPD is very grateful to those organisations and
individuals who gave their time to take part in this
research They include
bull Annette Sinclair Senior Researcher at Roffey
Park for analysing the findings and writing this
comprehensive report
bull Members of the Recruitment Forum Steering
Committee for their input into the survey
design and assistance in piloting the
questionnaire
bull Hays for their support and commitment at
every stage of the research
bull All those who shared examples of their
organisationrsquos practices
We hope that you find the research useful when
considering your own recruitment and retention
practices Please contact us if you have any
questions or ideas based on our findings
(researchcipdcouk)
RESOURCING AND TALENT PLANNING
fOOTNOTES 1 Chi Square = 573 df = 5 p lt 0001 n = 604 2 Rho = 073 p lt 0001 n = 577 3 Rho = 045 p lt 0001 n = 533 4 F = 250 df = 2 p lt 0001 n = 533 5 Chi Square = 180 df = 6 p lt 001 n = 535 6 Chi Square = 71 df = 2 p lt 005 n = 603 7 Chi Square = 230 df = 6 p lt 001 n = 600 8 Chi Square = 91 df = 3 p lt 005 n = 598 9 Chi Square = 129 df = 4 p lt 005 n = 610
10 Rho = 034 p lt 0001 n = 609 11 Chi square = 217 df = 3 p lt 0001 n = 609 12 Chi Square = 609 df = 8 p lt 0001 n = 607 13 Chi Square = 208 df = 3 p lt 0001 n = 560 14 Size of organisation and developing online
careers site Rho = 025 p lt 0001 n = 599 Size of
organisation and employee surveys Rho = 019
p lt 0001 n = 599 15 Chi Square = 167 df = 2 p lt 0001 n = 599
16 Working with charities Chi Square = 80 df = 2 p
lt 005 n = 599 corporate sponsorship Chi Square
= 116 df = 2 p lt 001 n = 599 17 Chi Square = 76 df = 2 p lt 005 n = 599 18 Table 11 also shows that this method is deemed
most effective by public sector organisations but
this effect is due to a greater proportion of
large public sector organisations in our
sample whereas private sector organisations are
more evenly distributed in size 19 Chi square = 109 df = 2 p lt 001 n = 610 20 Chi Square = 279 df = 4 p lt 0001 n = 610 21 Chi Square = 259 df = 6 p lt 0001 n = 598 22 Chi Square = 515 df = 6 p lt 0001 n = 597 22 Chi Square = 177 df = 8 p lt 005 n = 600 22 Chi Square = 339 df = 4 p lt 0001 n = 610 22 Chi Square = 820 df = 4 p lt 0001 n = 610 22 Chi Square = 522 df = 8 p lt 0001 n = 610 22 Rho = 024 p lt 0001 n = 195 22 Chi Square = 166 df = 2 p lt 0001 n = 544
cipd
cou
k2011resou
rcing
and
talentp
lann
ing
survey
40
2011
OTHER TITLES IN THIS SERIES
ABSENCE MANAGEMENT The annual Absence Management survey has been running for eleven years providing useful benchmarking data on absence levels the cost and causes of absence and how organisations are managing absence The latest report is brought to you in partnership with Simplyhealth
EMPLOYEE ATTITUDES TO PAY The annual Employee Attitudes to Pay survey investigates employee attitudes and expectations towards pay and bonuses Now in its third year this survey is carried out by YouGov and focuses on employees in the UK
REWARD MANAGEMENT The annual Reward Management survey has been running for ten years and provides practical insights into current trends practices and issues affecting reward management in the UK It examines strategic reward base and variable pay bonuses incentives pensions reward measurement and total reward issues This report was brought to you in partnership with Benefex
LEARNING AND TALENT DEvELOPMENT The annual Learning and Talent Development survey is now in its thirteenth year and provides valuable commentary on current and future issues and trends It explores employer support for learning talent management employee skills managing and evaluating coaching and training spend
Issu
ed J
une
2011
Ref
eren
ce 5
552
copy C
hart
ered
Inst
itute
of
Pers
onne
l and
Dev
elop
men
t 20
11
Chartered Institute of Personnel and Development
151 The Broadway London SW19 1JQ
Tel 020 8612 6200 Fax 020 8612 6201
Email cipdcipdcouk Website cipdcouk
Incorporated by Royal Charter Registered charity no1079797

cipd
cou
k2011resou
rcing
and
talentp
lann
ing
survey
34
RESOURCING AND TALENT PLANNING
by increasing apprenticeship schemes internships
and sponsoring students through university Such
schemes may be aided by the Governmentrsquos recently
announced pound60 million commitment to help boost
youth employment and provide extra support for
apprenticeships and changes to vocational training
and education How far this will go towards meeting
organisationsrsquo skill requirements remains to be seen
On a positive note our findings indicate that talent
management is viewed as more not less important
in difficult times although with reduced budgets
organisations will have to be innovative with
their approach and strategies In order to survive
organisations will need to make certain they focus
beyond the cost-cutting required in the current
environment to ensuring their talent strategies are
aligned to long-term business success
The CIPDrsquos Shaping the Future and Next Generation
HR flagship projects have both explored the
important issues of sustainability Shaping the Future
in particular warns against the dangers of lsquotalent
tunnel visionrsquo taking a short-sighted view on talent
strategies which are solely focused on the needs of
the here and now
Often organisations pay too little attention to
identifying and developing the capabilities that
individuals will need in the long term This implies a
leadershiptalent management capability gap with
too much focus on the operational needs of today
rather than the organisational imperatives
of tomorrow
Itrsquos never too late to start equipping your people
with the skills and knowledge they need to meet
both present and future challenges So what practical
recommendations can we make for resourcing and
talent professionals drawn from our Shaping the
Future evidence
Audit your organisationrsquos current skills and future capabilities If you havenrsquot done so already conduct a thorough
inventory of your organisationrsquos current skills and map
those against the capabilities you are likely to need
in the future Hold forecasting sessions which look at
macro and micro trends how these will impact your
way of working and the changes that will be required
for future success
Build your talent and succession pipeline You also need to be proactively building up your
talent pipelines (horizontally and vertically) so that
you are developing people with future-fit skills and
capabilities A silver lining from the current economic
climate is that more organisations are focusing on
developing internal talent and fully utilising the
skills of their existing workforce Fresh talent is
still important but recruitment strategies should
complement internal pipelines
Maintain a continuous focus on capability-building Capability-building should be part of a continuous
process embedded into policies and practices Across
our case study organisations managers talked about the
need to embed development and skills training as part
of business as usual rather than as a one-off activity
Develop a creative approach to skills and capability development Even when budgets are tight it is essential that
staff get the development they need to ensure they
have the capabilities for their current job role as well
as starting to build those that the organisation will
need in the future Our case study organisations were
focusing strongly on knowledge-sharing enabling
people to learn from others across the organisation
Many of you are already considering alternative
solutions for specialist skill development such as
apprenticeships internal management schemes
summer placements and internships It is also
important to work with universities to ensure that
graduates are developing skills and knowledge which
will help them to succeed in the workplace
RESO
UR
CIN
G A
ND
TALE
NT P
LAN
NIN
G 2
011
35
2011
BACkGROUND TO ThE SURVEy
This survey was conducted in March and April 2011 It was sent to a sample of UK-based HR professionals in the public private and voluntary sectors In total 626 people responded to the survey
This is the fifteenth annual CIPD Resourcing
and Talent Planning survey (formerly known as
the CIPDrsquos Recruitment Retention and Turnover
survey) The survey examines organisationsrsquo
resourcing and talent planning strategies and
practices and the key challenges and issues
they face The survey consists of 45 questions
completed through an online self-completion
questionnaire
The majority of questions remain the same as
previous years to provide useful benchmark
data on topics including recruitment practices
difficulties and costs selection methods diversity
strategies the impact of the economic climate on
resourcing and talent planning practices labour
turnover and retention strategies New question
areas this year examine the employment of
younger workers the length of the recruitment
process the nature of job vacancies relationships
with recruitment partners and the use of
strengths-based approaches to recruitment
A small number of respondents took part in follow-
up telephone interviews to produce mini case
studies on a selection of topics These are presented
in the coloured boxes throughout the report
Sample profile Respondents predominantly work for private
sector organisations with professional services
being particularly well represented but other
sectors are represented in similar proportions to
last year (Table A1)
36
RESOURCING AND TALENT PLANNING
Table A1 Breakdown of respondent organisations by industrial sector Number of respondents
Manufacturing and production 113 19
Agriculture and forestry 1 0
Chemicals oils and pharmaceuticals 9 1
Construction 8 1
Electricity gas and water 4 1
Engineering electronics and metals 38 6
Food drink and tobacco 18 3
General manufacturing 6 1
Mining and quarrying 4 1
Paper and printing 6 1
Textiles 2 0
Other manufacturingproduction 17 3
Private sector services 319 52
Professional services (accountancy advertising consultancy legal etc) 78 13
Finance insurance and real estate 33 5
Hotels catering and leisure 26 4
IT services 26 4
Call centres 3 0
Media (broadcasting and publishing etc) 7 1
Retail and wholesale 40 7
Transport distribution and storage 23 4
Communications 6 1
Other private services 77 13
Public services 100 16
Central government 14 2
Education 12 2
Health 23 4
Local government 22 4
Other public services 29 5
Non-profit organisations 78 13
Care services 9 1
Charity services 32 5
Housing association 17 3
Other voluntary 20 3 Base 610
cipd
cou
k2011resou
rcing
and
talentp
lann
ing
survey
2011 Most respondents work in small to medium-sized
organisations in terms of the number of UK-
based employees but larger organisations are
also represented in similar proportions to last year
(Table A2)
Respondents reported on organisations based
across the UK Three in ten responded for the
whole of the UK while others responded for a
particular regioncountry (see Table A3)
Table A2 Breakdown of sample by organisation size ndash permanent employees in the UK
Fewer than 10 5
10ndash49 12
50ndash249 33
250ndash999 25
1000ndash4999 12
More than 5000 13 Base 610
Table A3 Main region covered by the reply
East Anglia 5
East Midlands 3
West Midlands 5
North-east of England 3
North-west of England 7
South-west of England 6
Yorkshire and Humberside 5
South-east of England (excluding London)
12
London 12
Scotland 6
Wales 3
Northern Ireland 3
Ireland 0
Whole of UK 29 Base 602
Labour turnover A total of 175 survey respondents were able to
supply all the information necessary for us to
calculate labour turnover on a whole-organisation
basis
This report uses the standard lsquocrude wastagersquo
method to calculate the rate of turnover This
method is calculated as follows
Labour turnover =
Number of leavers in a set period
______________________________________ x 100
Average number employed in the same period
(Leavers include those leaving the organisation
by way of voluntary or involuntary severance
redundancies or retirements but does not include
internal transfers)
Readers should be aware that this method has
some shortcomings For example it takes no
account of the characteristics of the workforce or
the length of service of the leaver
Note on statistics and figures used Some respondents did not answer all questions so
where percentages are reported in tables or figures
the respondent lsquobasersquo for that question is given
lsquoAveragersquo in the report is used to refer to the
statistical mean where the data is normally
distributed However the median is used in cases
where the distribution is significantly skewed
When the median is used it is noted
With the exception of labour turnover rates all
figures in tables have been rounded to the nearest
percentage point Due to rounding percentages
may not always total 100
Chi-square (χ2) tests are used to examine whether
differences between groups such as industrial
sectors are significant or likely to be due to
chance Spearmanrsquos Rho correlation (Rho) is used
to examine relationships between variables We
report on statistics at the generally accepted level
of significance plt005
RESO
UR
CIN
G A
ND
TALE
NT P
LAN
NIN
G 2
011
37
38
RESOURCING AND TALENT PLANNING
fURThER SOURCES Of INfORmATION
We produce a range of free factsheets surveys
guides and research reports which are available on
the CIPD website at cipdcoukhrresources
Read our factsheets on Employer Brand
Employee Turnover and Retention
Induction
Outlook series Our quarterly reports Labour Market Outlook
and Employee Outlook look at the employer and
employee perspectives on the labour market and
on workplace issues and trends while HR Outlook
explores priorities and emerging trends for the HR
profession and function
View these reports at
cipdcoukresearchoutlook-series
Talent management Two reports look at talent issues in a recession
difficult economic climate
The War on Talent Talent management under
threat in uncertain times (2009)
Fighting Back through Talent Innovation (2010)
Opening up Talent for Business Success (2010)
looks at the importance of integrating talent
management and diversity
The Talent Perspective What does it feel like to
be talent-managed (2010) looks at the employee
view of talent management
Workforce planning Our guide Workforce Planning Right people right
time right skills (2010) gives advice on developing
workforce planning processes
Diversity Two survey reports and a guide provide practical
advice and information on trends
Diversity in Business A focus for progress (2007)
Managing an Ageing Workforce How employers
are adapting to an older labour market (2010)
Managing Age New edition 2011
Two further reports are available to order from
cipdcoukbookstore
Managing Diversity in Practice Supporting
business goals (2007)
Managing Diversity and the Business Case (2008)
Sign up to receive our e-newsletter at
cipdcoukcipdupdate
cipd
cou
k2011resou
rcing
and
talentp
lann
ing
survey
RESO
UR
CIN
G A
ND
TALE
NT P
LAN
NIN
G 2
011
39
2011
ACkNOwLEDGEmENTS
The CIPD is very grateful to those organisations and
individuals who gave their time to take part in this
research They include
bull Annette Sinclair Senior Researcher at Roffey
Park for analysing the findings and writing this
comprehensive report
bull Members of the Recruitment Forum Steering
Committee for their input into the survey
design and assistance in piloting the
questionnaire
bull Hays for their support and commitment at
every stage of the research
bull All those who shared examples of their
organisationrsquos practices
We hope that you find the research useful when
considering your own recruitment and retention
practices Please contact us if you have any
questions or ideas based on our findings
(researchcipdcouk)
RESOURCING AND TALENT PLANNING
fOOTNOTES 1 Chi Square = 573 df = 5 p lt 0001 n = 604 2 Rho = 073 p lt 0001 n = 577 3 Rho = 045 p lt 0001 n = 533 4 F = 250 df = 2 p lt 0001 n = 533 5 Chi Square = 180 df = 6 p lt 001 n = 535 6 Chi Square = 71 df = 2 p lt 005 n = 603 7 Chi Square = 230 df = 6 p lt 001 n = 600 8 Chi Square = 91 df = 3 p lt 005 n = 598 9 Chi Square = 129 df = 4 p lt 005 n = 610
10 Rho = 034 p lt 0001 n = 609 11 Chi square = 217 df = 3 p lt 0001 n = 609 12 Chi Square = 609 df = 8 p lt 0001 n = 607 13 Chi Square = 208 df = 3 p lt 0001 n = 560 14 Size of organisation and developing online
careers site Rho = 025 p lt 0001 n = 599 Size of
organisation and employee surveys Rho = 019
p lt 0001 n = 599 15 Chi Square = 167 df = 2 p lt 0001 n = 599
16 Working with charities Chi Square = 80 df = 2 p
lt 005 n = 599 corporate sponsorship Chi Square
= 116 df = 2 p lt 001 n = 599 17 Chi Square = 76 df = 2 p lt 005 n = 599 18 Table 11 also shows that this method is deemed
most effective by public sector organisations but
this effect is due to a greater proportion of
large public sector organisations in our
sample whereas private sector organisations are
more evenly distributed in size 19 Chi square = 109 df = 2 p lt 001 n = 610 20 Chi Square = 279 df = 4 p lt 0001 n = 610 21 Chi Square = 259 df = 6 p lt 0001 n = 598 22 Chi Square = 515 df = 6 p lt 0001 n = 597 22 Chi Square = 177 df = 8 p lt 005 n = 600 22 Chi Square = 339 df = 4 p lt 0001 n = 610 22 Chi Square = 820 df = 4 p lt 0001 n = 610 22 Chi Square = 522 df = 8 p lt 0001 n = 610 22 Rho = 024 p lt 0001 n = 195 22 Chi Square = 166 df = 2 p lt 0001 n = 544
cipd
cou
k2011resou
rcing
and
talentp
lann
ing
survey
40
2011
OTHER TITLES IN THIS SERIES
ABSENCE MANAGEMENT The annual Absence Management survey has been running for eleven years providing useful benchmarking data on absence levels the cost and causes of absence and how organisations are managing absence The latest report is brought to you in partnership with Simplyhealth
EMPLOYEE ATTITUDES TO PAY The annual Employee Attitudes to Pay survey investigates employee attitudes and expectations towards pay and bonuses Now in its third year this survey is carried out by YouGov and focuses on employees in the UK
REWARD MANAGEMENT The annual Reward Management survey has been running for ten years and provides practical insights into current trends practices and issues affecting reward management in the UK It examines strategic reward base and variable pay bonuses incentives pensions reward measurement and total reward issues This report was brought to you in partnership with Benefex
LEARNING AND TALENT DEvELOPMENT The annual Learning and Talent Development survey is now in its thirteenth year and provides valuable commentary on current and future issues and trends It explores employer support for learning talent management employee skills managing and evaluating coaching and training spend
Issu
ed J
une
2011
Ref
eren
ce 5
552
copy C
hart
ered
Inst
itute
of
Pers
onne
l and
Dev
elop
men
t 20
11
Chartered Institute of Personnel and Development
151 The Broadway London SW19 1JQ
Tel 020 8612 6200 Fax 020 8612 6201
Email cipdcipdcouk Website cipdcouk
Incorporated by Royal Charter Registered charity no1079797

RESO
UR
CIN
G A
ND
TALE
NT P
LAN
NIN
G 2
011
35
2011
BACkGROUND TO ThE SURVEy
This survey was conducted in March and April 2011 It was sent to a sample of UK-based HR professionals in the public private and voluntary sectors In total 626 people responded to the survey
This is the fifteenth annual CIPD Resourcing
and Talent Planning survey (formerly known as
the CIPDrsquos Recruitment Retention and Turnover
survey) The survey examines organisationsrsquo
resourcing and talent planning strategies and
practices and the key challenges and issues
they face The survey consists of 45 questions
completed through an online self-completion
questionnaire
The majority of questions remain the same as
previous years to provide useful benchmark
data on topics including recruitment practices
difficulties and costs selection methods diversity
strategies the impact of the economic climate on
resourcing and talent planning practices labour
turnover and retention strategies New question
areas this year examine the employment of
younger workers the length of the recruitment
process the nature of job vacancies relationships
with recruitment partners and the use of
strengths-based approaches to recruitment
A small number of respondents took part in follow-
up telephone interviews to produce mini case
studies on a selection of topics These are presented
in the coloured boxes throughout the report
Sample profile Respondents predominantly work for private
sector organisations with professional services
being particularly well represented but other
sectors are represented in similar proportions to
last year (Table A1)
36
RESOURCING AND TALENT PLANNING
Table A1 Breakdown of respondent organisations by industrial sector Number of respondents
Manufacturing and production 113 19
Agriculture and forestry 1 0
Chemicals oils and pharmaceuticals 9 1
Construction 8 1
Electricity gas and water 4 1
Engineering electronics and metals 38 6
Food drink and tobacco 18 3
General manufacturing 6 1
Mining and quarrying 4 1
Paper and printing 6 1
Textiles 2 0
Other manufacturingproduction 17 3
Private sector services 319 52
Professional services (accountancy advertising consultancy legal etc) 78 13
Finance insurance and real estate 33 5
Hotels catering and leisure 26 4
IT services 26 4
Call centres 3 0
Media (broadcasting and publishing etc) 7 1
Retail and wholesale 40 7
Transport distribution and storage 23 4
Communications 6 1
Other private services 77 13
Public services 100 16
Central government 14 2
Education 12 2
Health 23 4
Local government 22 4
Other public services 29 5
Non-profit organisations 78 13
Care services 9 1
Charity services 32 5
Housing association 17 3
Other voluntary 20 3 Base 610
cipd
cou
k2011resou
rcing
and
talentp
lann
ing
survey
2011 Most respondents work in small to medium-sized
organisations in terms of the number of UK-
based employees but larger organisations are
also represented in similar proportions to last year
(Table A2)
Respondents reported on organisations based
across the UK Three in ten responded for the
whole of the UK while others responded for a
particular regioncountry (see Table A3)
Table A2 Breakdown of sample by organisation size ndash permanent employees in the UK
Fewer than 10 5
10ndash49 12
50ndash249 33
250ndash999 25
1000ndash4999 12
More than 5000 13 Base 610
Table A3 Main region covered by the reply
East Anglia 5
East Midlands 3
West Midlands 5
North-east of England 3
North-west of England 7
South-west of England 6
Yorkshire and Humberside 5
South-east of England (excluding London)
12
London 12
Scotland 6
Wales 3
Northern Ireland 3
Ireland 0
Whole of UK 29 Base 602
Labour turnover A total of 175 survey respondents were able to
supply all the information necessary for us to
calculate labour turnover on a whole-organisation
basis
This report uses the standard lsquocrude wastagersquo
method to calculate the rate of turnover This
method is calculated as follows
Labour turnover =
Number of leavers in a set period
______________________________________ x 100
Average number employed in the same period
(Leavers include those leaving the organisation
by way of voluntary or involuntary severance
redundancies or retirements but does not include
internal transfers)
Readers should be aware that this method has
some shortcomings For example it takes no
account of the characteristics of the workforce or
the length of service of the leaver
Note on statistics and figures used Some respondents did not answer all questions so
where percentages are reported in tables or figures
the respondent lsquobasersquo for that question is given
lsquoAveragersquo in the report is used to refer to the
statistical mean where the data is normally
distributed However the median is used in cases
where the distribution is significantly skewed
When the median is used it is noted
With the exception of labour turnover rates all
figures in tables have been rounded to the nearest
percentage point Due to rounding percentages
may not always total 100
Chi-square (χ2) tests are used to examine whether
differences between groups such as industrial
sectors are significant or likely to be due to
chance Spearmanrsquos Rho correlation (Rho) is used
to examine relationships between variables We
report on statistics at the generally accepted level
of significance plt005
RESO
UR
CIN
G A
ND
TALE
NT P
LAN
NIN
G 2
011
37
38
RESOURCING AND TALENT PLANNING
fURThER SOURCES Of INfORmATION
We produce a range of free factsheets surveys
guides and research reports which are available on
the CIPD website at cipdcoukhrresources
Read our factsheets on Employer Brand
Employee Turnover and Retention
Induction
Outlook series Our quarterly reports Labour Market Outlook
and Employee Outlook look at the employer and
employee perspectives on the labour market and
on workplace issues and trends while HR Outlook
explores priorities and emerging trends for the HR
profession and function
View these reports at
cipdcoukresearchoutlook-series
Talent management Two reports look at talent issues in a recession
difficult economic climate
The War on Talent Talent management under
threat in uncertain times (2009)
Fighting Back through Talent Innovation (2010)
Opening up Talent for Business Success (2010)
looks at the importance of integrating talent
management and diversity
The Talent Perspective What does it feel like to
be talent-managed (2010) looks at the employee
view of talent management
Workforce planning Our guide Workforce Planning Right people right
time right skills (2010) gives advice on developing
workforce planning processes
Diversity Two survey reports and a guide provide practical
advice and information on trends
Diversity in Business A focus for progress (2007)
Managing an Ageing Workforce How employers
are adapting to an older labour market (2010)
Managing Age New edition 2011
Two further reports are available to order from
cipdcoukbookstore
Managing Diversity in Practice Supporting
business goals (2007)
Managing Diversity and the Business Case (2008)
Sign up to receive our e-newsletter at
cipdcoukcipdupdate
cipd
cou
k2011resou
rcing
and
talentp
lann
ing
survey
RESO
UR
CIN
G A
ND
TALE
NT P
LAN
NIN
G 2
011
39
2011
ACkNOwLEDGEmENTS
The CIPD is very grateful to those organisations and
individuals who gave their time to take part in this
research They include
bull Annette Sinclair Senior Researcher at Roffey
Park for analysing the findings and writing this
comprehensive report
bull Members of the Recruitment Forum Steering
Committee for their input into the survey
design and assistance in piloting the
questionnaire
bull Hays for their support and commitment at
every stage of the research
bull All those who shared examples of their
organisationrsquos practices
We hope that you find the research useful when
considering your own recruitment and retention
practices Please contact us if you have any
questions or ideas based on our findings
(researchcipdcouk)
RESOURCING AND TALENT PLANNING
fOOTNOTES 1 Chi Square = 573 df = 5 p lt 0001 n = 604 2 Rho = 073 p lt 0001 n = 577 3 Rho = 045 p lt 0001 n = 533 4 F = 250 df = 2 p lt 0001 n = 533 5 Chi Square = 180 df = 6 p lt 001 n = 535 6 Chi Square = 71 df = 2 p lt 005 n = 603 7 Chi Square = 230 df = 6 p lt 001 n = 600 8 Chi Square = 91 df = 3 p lt 005 n = 598 9 Chi Square = 129 df = 4 p lt 005 n = 610
10 Rho = 034 p lt 0001 n = 609 11 Chi square = 217 df = 3 p lt 0001 n = 609 12 Chi Square = 609 df = 8 p lt 0001 n = 607 13 Chi Square = 208 df = 3 p lt 0001 n = 560 14 Size of organisation and developing online
careers site Rho = 025 p lt 0001 n = 599 Size of
organisation and employee surveys Rho = 019
p lt 0001 n = 599 15 Chi Square = 167 df = 2 p lt 0001 n = 599
16 Working with charities Chi Square = 80 df = 2 p
lt 005 n = 599 corporate sponsorship Chi Square
= 116 df = 2 p lt 001 n = 599 17 Chi Square = 76 df = 2 p lt 005 n = 599 18 Table 11 also shows that this method is deemed
most effective by public sector organisations but
this effect is due to a greater proportion of
large public sector organisations in our
sample whereas private sector organisations are
more evenly distributed in size 19 Chi square = 109 df = 2 p lt 001 n = 610 20 Chi Square = 279 df = 4 p lt 0001 n = 610 21 Chi Square = 259 df = 6 p lt 0001 n = 598 22 Chi Square = 515 df = 6 p lt 0001 n = 597 22 Chi Square = 177 df = 8 p lt 005 n = 600 22 Chi Square = 339 df = 4 p lt 0001 n = 610 22 Chi Square = 820 df = 4 p lt 0001 n = 610 22 Chi Square = 522 df = 8 p lt 0001 n = 610 22 Rho = 024 p lt 0001 n = 195 22 Chi Square = 166 df = 2 p lt 0001 n = 544
cipd
cou
k2011resou
rcing
and
talentp
lann
ing
survey
40
2011
OTHER TITLES IN THIS SERIES
ABSENCE MANAGEMENT The annual Absence Management survey has been running for eleven years providing useful benchmarking data on absence levels the cost and causes of absence and how organisations are managing absence The latest report is brought to you in partnership with Simplyhealth
EMPLOYEE ATTITUDES TO PAY The annual Employee Attitudes to Pay survey investigates employee attitudes and expectations towards pay and bonuses Now in its third year this survey is carried out by YouGov and focuses on employees in the UK
REWARD MANAGEMENT The annual Reward Management survey has been running for ten years and provides practical insights into current trends practices and issues affecting reward management in the UK It examines strategic reward base and variable pay bonuses incentives pensions reward measurement and total reward issues This report was brought to you in partnership with Benefex
LEARNING AND TALENT DEvELOPMENT The annual Learning and Talent Development survey is now in its thirteenth year and provides valuable commentary on current and future issues and trends It explores employer support for learning talent management employee skills managing and evaluating coaching and training spend
Issu
ed J
une
2011
Ref
eren
ce 5
552
copy C
hart
ered
Inst
itute
of
Pers
onne
l and
Dev
elop
men
t 20
11
Chartered Institute of Personnel and Development
151 The Broadway London SW19 1JQ
Tel 020 8612 6200 Fax 020 8612 6201
Email cipdcipdcouk Website cipdcouk
Incorporated by Royal Charter Registered charity no1079797

2011
OTHER TITLES IN THIS SERIES
ABSENCE MANAGEMENT The annual Absence Management survey has been running for eleven years providing useful benchmarking data on absence levels the cost and causes of absence and how organisations are managing absence The latest report is brought to you in partnership with Simplyhealth
EMPLOYEE ATTITUDES TO PAY The annual Employee Attitudes to Pay survey investigates employee attitudes and expectations towards pay and bonuses Now in its third year this survey is carried out by YouGov and focuses on employees in the UK
REWARD MANAGEMENT The annual Reward Management survey has been running for ten years and provides practical insights into current trends practices and issues affecting reward management in the UK It examines strategic reward base and variable pay bonuses incentives pensions reward measurement and total reward issues This report was brought to you in partnership with Benefex
LEARNING AND TALENT DEvELOPMENT The annual Learning and Talent Development survey is now in its thirteenth year and provides valuable commentary on current and future issues and trends It explores employer support for learning talent management employee skills managing and evaluating coaching and training spend
Issu
ed J
une
2011
Ref
eren
ce 5
552
copy C
hart
ered
Inst
itute
of
Pers
onne
l and
Dev
elop
men
t 20
11
Chartered Institute of Personnel and Development
151 The Broadway London SW19 1JQ
Tel 020 8612 6200 Fax 020 8612 6201
Email cipdcipdcouk Website cipdcouk
Incorporated by Royal Charter Registered charity no1079797