annual summary of oil and hazardous substance spills · pdf filediesel fuel and lube oil on...
TRANSCRIPT

M/V Golden SeasEarly in the morning of December 3, 2010, the crew of the M/V Golden Seas reported to the US Coast Guard (USCG) that the turbocharger on the vessel’s only propulsion engine had failed and the vessel was adrift north of Adak Island in the Aleutian chain. The 738-foot-long bulk freighter, en route from Vancouver, BC, to the United Arab Emirates with a cargo of rapeseed, had a combined volume of more than 473,000 gallons of intermediate fuel oil, diesel fuel and lube oil on board. The USCG notified ADEC of the incident at 8:05 AM, and the agencies quickly established a Unified Command (UC) with representatives of the ship’s Greek operator, Allseas Marine, SA. Initially, the vessel was unable to hold its position or make headway against the severe weather in the Bering Sea, and it drifted toward Atka Island. As the storm abated around 4:00 PM, the vessel was able to begin moving slowly to the northeast, away from shore. The responsible party (RP) contracted the ocean-going tug Tor Viking II (stationed in Dutch Harbor to support Shell Exploration) to assist the Golden Seas. The tug left port around 5:00 PM with ADEC's 10-inch Emergency Towing System (ETS) on board to tow the stricken vessel.Shortly after 8:00 PM on December 4,
Annual Summary ofOil and Hazardous Substance SpillsFiscal Year 2011 (July 1, 2010-June 30, 2011)
Alaska Department of Environmental Conservation Division of Spill Prevention and Response January 2012
The Golden Seas in tow with the ADEC Emergency Towing System. (Photo courtesy of USCG)
north of Atka Island, the crews of the Tor Viking II and Golden Seas succeeded in securing a towline between the vessels. The vessels transited south through Amukta Pass (between Seguam and Amukta Islands) to the lee side of the islands to gain protection from high wind and waves in the Bering Sea. After a tow of more than 500 miles, the Golden Seas dropped anchor in Broad Bay in Unalaska Bay early in the afternoon of December 7. The UC had determined through the Potential Places of Refuge decision-making process (which included consultation with marine pilots, local governments, tribes, Native corporations, and state and federal resource trustees) that this was the most favorable anchorage for making repairs to the vessel. Following USCG approval of the completed engine repairs, the Golden Seas completed sea trials on the morning of December 13 and departed Dutch Harbor for her original destination.The ADEC ETS deployed during this incident was cleaned and inspected by a Dutch Harbor contractor, who determined that the cargo net and chafing gear needed to be replaced. Once those replacements were made, the ETS was repacked and restaged at Dutch Harbor for future use.
Pump Station 1 Booster Pump Piping IncidentOn January 8, 2011, Alyeska Pipeline Service Company (APSC) employees discovered a spill of crude oil inside the basement of the booster pump building at Pump Station 1. Approximately 12,927 gallons of crude oil leaked from a 26-inch, concrete-encased discharge pipe, leading to a winter shutdown of the Trans Alaska Pipeline System (TAPS). North Slope oil producers significantly reduced oil production and initiated freeze protec-tion procedures for wells, pipelines and other infrastructure during the shutdown. TAPS was restarted temporarily while
Significant Responses FY 2011 Summary
Top 5 Products
Product Spills GallonsDiesel 499 49,136
Aviation Fuel 60 27,134 Crude 40 15,039 Process Water 20 11,608 Ethylene Glycol 105 8,361
Top 5 Facility Types
Facility Type Spills GallonsOil Production 258 33,283
Non-Crude Terminal 16 23,497 Mining Operation 407 20,334 Vessel 183 15,235 Other 190 9,069
Top 5 Causes
Cause Spills GallonsHuman Error 258 60,649
Equipment Failure 309 20,879
Corrosion 9 18,318
Line Failure 277 7,115
Gauge/Site Glass Failure 12 7,071
continued on page 7

page 2 Alaska Department of Environmental Conservationpage 2 Alaska Department of Environmental Conservation
Volume Released by Cause
Volume Released by Facility Type
16
-Year
Tre
nd
Number of Spills by Fiscal Year Total Volume by Fiscal Year*
Volume Released by Size Class
Volume Released by Product
Number of Spills Reported 1,767Total Gallons 159,115
shortFY11_pie.xlsx/SizeDetail_ALL_gal
<10 gal2%
10 to 99 gal8%
100+ gal90%
shortFY11_pie.xlsx/ProductDetail_ALL_gal
Diesel31%
Aviation Fuel17%
Crude10%
Process Water7%Ethylene Glycol
(Antifreeze)5%
Drilling Muds5%
Methyl Alcohol (Methanol)
3.3%Kerosene
3.2%Hydraulic Oil
3%Other16%
For graphing purposes, 'Other' includes product categories comprising 3% or less of the total volume released.
shortFY11_pie.xlsx/FacDetail_ALL gal
Oil Production21%
Non-Crude Terminal
15%
Mining Operation
13%
Vessel10% Refinery
Operation5%
Residence5%
Vehicle4.3%
School4.04%
Other23%
For graphing purposes, 'Other' includes facility categories comprising 4% or less of the total volume released.
shortFY11_pie.xlsx/CauseDetail_ALL_gal
Human Error38%
Equipment Failure
13%Corrosion
12%Line Failure
4%
Gauge/Site Glass Failure
4%
Grounding4%
Overfill4%
Other21%
For graphing purposes, 'Other' includes cause categories comprising 3% or less of the total volume released.
TR_ALLct
- 500
1,000 1,500 2,000 2,500 3,000
1996
1998
2000
2002
2004
2006
2008
2010
Num
ber o
f Spi
lls
Fiscal Year
16-YR Average Total Count
TR_ALLgal
-
1,000,000
2,000,000
3,000,000
4,000,000
5,000,000
1996
1998
2000
2002
2004
2006
2008
2010
Gal
lons
Fiscal Year
16-YR Average Total Volume
All Products - FY 2011
*Notes: 1/25/1997 (FY 1997) - a barge capsized and lost 3,125,000 gal of Urea (Solid). 3/17/1997 (FY 1997) - 995,400 gal of Seawater released at ARCO DS-14 in Prudhoe Bay
Annual Summary of Oil and Hazardous Substance Releases (July 1, 2010-June 3, 2011) page 3Annual Summary of Oil and Hazardous Substance Releases (July 1, 2010-June 3, 2011) page 3
16
-Year
Tre
nd
Number of Spills by Fiscal Year Total Volume by Fiscal Year*
Volume Released by Cause
Volume Released by Facility Type
Volume Released by Size Class
Annual Summary of Oil and Hazardous Substance Releases (July 1, 2010-June 3, 2011) page 3Annual Summary of Oil and Hazardous Substance Releases (July 1, 2010-June 3, 2011) page 3
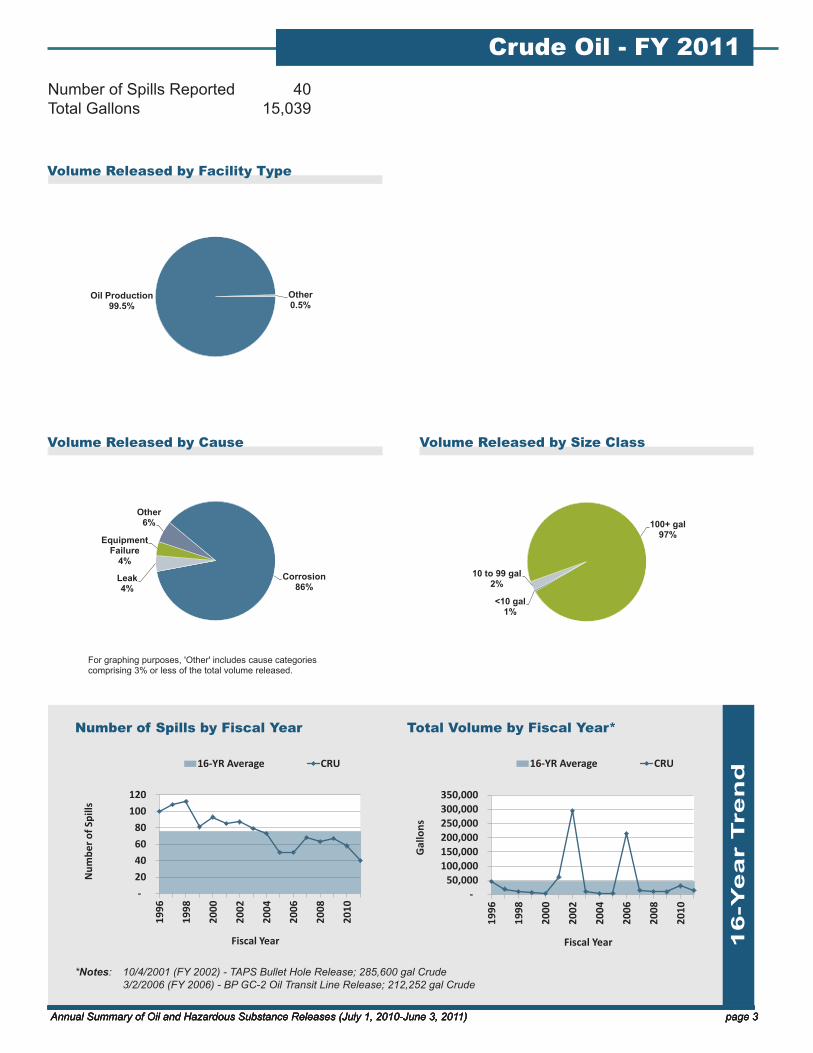
Number of Spills Reported 40Total Gallons 15,039
shortFY11_pie.xlsx/SizeDetail_CRU_gal
<10 gal1%
10 to 99 gal2%
100+ gal97%
shortFY11_pie.xlsx/CauseDetail_CRU_gal
Corrosion86%
Leak4%
Equipment Failure
4%
Other6%
For graphing purposes, 'Other' includes cause categories comprising 3% or less of the total volume released.
shortFY11_pie.xlsx/FacDetail_CRU gal
Oil Production99.5%
Other0.5%
Crude Oil - FY 2011
TR_CRUct
- 20 40 60 80
100 120
1996
1998
2000
2002
2004
2006
2008
2010
Num
ber o
f Spi
lls
Fiscal Year
16-YR Average CRU
TR_CRUgal
- 50,000
100,000 150,000 200,000 250,000 300,000 350,000
1996
1998
2000
2002
2004
2006
2008
2010
Gal
lons
Fiscal Year
16-YR Average CRU
*Notes: 10/4/2001 (FY 2002) - TAPS Bullet Hole Release; 285,600 gal Crude 3/2/2006 (FY 2006) - BP GC-2 Oil Transit Line Release; 212,252 gal Crude

page 4 Alaska Department of Environmental Conservationpage 4 Alaska Department of Environmental Conservation
Volume Released by Cause
Volume Released by Facility Type
16
-Year
Tre
nd
Number of Spills by Fiscal Year Total Volume by Fiscal Year*
Volume Released by Size Class
Volume Released by Product
Number of Spills Reported 1,318Total Gallons 96,523
shortFY11_pie.xlsx/SizeDetail_REF_gal
<10 gal2%
10 to 99 gal10%
100+ gal88%
shortFY11_pie.xlsx/FacDetail_REF gal
Non-Crude Terminal
24%
Vessel16%
Refinery Operation
8%
Residence8% Vehicle
7% Mining Operation
7%Power
Generation6%
School6%
Air Transportation
5%Other13%
For graphing purposes, 'Other' includes facility categories comprising 4% or less of the total volume released.
shortFY11_pie.xlsx/CauseDetail_REF_gal
Human Error46%
Equipment Failure
10%Grounding
6%Line Failure
6%Corrosion
6%
Overfill5%
Other21%
For graphing purposes, 'Other' includes cause categories comprising 3% or less of the total volume released.
shortFY11_pie.xlsx/ProductDetail_REF_gal
Diesel51%
Aviation Fuel28%
Kerosene5%
Hydraulic Oil5%
Engine Lube Oil
2.7%Other
8%
For graphing purposes, 'Other' includes product categories comprising 2% or less of the total volume released.
TR_NCct
-
500
1,000
1,500
2,000
2,500
1996
1998
2000
2002
2004
2006
2008
2010
Num
ber o
f Spi
lls
Fiscal Year
16-YR Average NC
TR_NCgal
- 100,000 200,000 300,000 400,000 500,000 600,000
1996
1998
2000
2002
2004
2006
2008
2010
Gal
lons
Fiscal Year
16-YR Average NC
Non-crude Oil - FY 2011
*Notes: 12/8/2004 (FY 2005) - the M/V Selendang Ayu broke apart, releasing 321,052 gal of IFO 380 and 4,680 gal of Diesel

Annual Summary of Oil and Hazardous Substance Releases (July 1, 2010-June 3, 2011) page 5Annual Summary of Oil and Hazardous Substance Releases (July 1, 2010-June 3, 2011) page 5
16
-Year
Tre
nd
Number of Spills by Fiscal Year Total Volume by Fiscal Year*
Volume Released by Product
Volume Released by Cause
Volume Released by Facility Type
Volume Released by Size Class
Number of Spills 380Total Gallons 32,559
shortFY11_pie.xlsx/SizeDetail_HS_gal
<10 gal1%
10 to 99 gal8%
100+ gal91%
shortFY11_pie.xlsx/CauseDetail_HS_gal
Equipment Failure
25%
Gauge/Site Glass Failure
20%
Human Error19%
Seal Failure10%
Containment Overflow
5%Valve Failure
4%Leak4%
Other13%
For graphing purposes, 'Other' includes cause categories comprising 3% or less of the total volume released.
shortFY11_pie.xlsx/FacDetail_HS gal
Oil Production40%
Crude Oil Terminal
18%
Mining Operation
10%
Oil Exploration8%
Other24%
For graphing purposes, 'Other' includes facility categories comprising 4% or less of the total volume released.
shortFY11_pie.xlsx/ProductDetail_HS_gal
Ethylene Glycol
(Antifreeze)26%
Drilling Muds21%
Methyl Alcohol (Methanol)
16%
Glycol, Other14%
Corrosion Inhibitor
8%
Mill Slurry6%
Propylene Glycol
4%Other
5%
For graphing purposes, 'Other' includes product categories comprising 2% or less of the total volume released.
Hazardous Substances - FY 2011
TR_HSct
- 100 200 300 400 500 600
1996
1998
2000
2002
2004
2006
2008
2010
Num
ber o
f Spi
lls
Fiscal Year
16-YR Average HS
TR_HSgal
- 500,000
1,000,000 1,500,000 2,000,000 2,500,000 3,000,000 3,500,000
1996
1998
2000
2002
2004
2006
2008
2010
Gal
lons
Fiscal Year
16-YR Average HS
*Notes: 1/25/1997 (FY 1997) - a barge capsized and lost 3,125,000 gal of Urea (Solid).

page 6 Alaska Department of Environmental Conservationpage 6 Alaska Department of Environmental Conservation
Volume Released by Cause
Volume Released by Facility Type
16
-Year
Tre
nd
Number of Spills by Fiscal Year Total Volume by Fiscal Year*
Volume Released by Size Class
Volume Released by Product
Number of Spills Reported 29Total Gallons 14,994
shortFY11_pie.xlsx/SizeDetail_PW_gal
<10 gal0.21%
10 to 99 gal2%
100+ gal98%
shortFY11_pie.xlsx/FacDetail_PW gal
Mining Operation
71%Oil Production
22%
Refinery Operation
6%
Other1%
For graphing purposes, 'Other' includes facility categories comprising 4% or less of the total volume released.
Process Water - FY 2011
shortFY11_pie.xlsx/ProductDetail_PW_gal
Process Water77%
Produced Water
2%
Seawater21%
shortFY11_pie.xlsx/CauseDetail_PW_gal
Human Error64%
Equipment Failure
18%
Containment Overflow
7%
Crack6%
Other5%
For graphing purposes, 'Other' includes cause categories comprising 3% or less of the total volume released.
TR_PWct
- 20 40 60 80
100 120
1996
1998
2000
2002
2004
2006
2008
2010
Num
ber o
f Spi
lls
Fiscal Year
16-YR Average PW
TR_PWgal
- 200,000 400,000 600,000 800,000
1,000,000 1,200,000
1996
1998
2000
2002
2004
2006
2008
2010
Gal
lons
Fiscal Year
16-YR Average PW
*Notes: 3/17/1997 (FY 1997) - 995,400 gal of Seawater released at ARCO DS-14 in Prudhoe Bay

Annual Summary of Oil and Hazardous Substance Releases (July 1, 2010-June 3, 2011) page 7Annual Summary of Oil and Hazardous Substance Releases (July 1, 2010-June 3, 2011) page 7
APSC crews designed and fabricated a pipe to bypass the damaged discharge pipe. TAPS was shutdown a second time for installation of the bypass before resuming normal operation on January 17. Based on lessons learned from the incident, APSC managers reevaluated “cold restart” procedures for a TAPS winter shutdown, installed pump station oil recirculation pipe loops that add heat to oil in transit, and reassessed out-of-service infrastructure. Oil production resumed without incident after the bypass was installed, and no infrastructure damage resulted from the winter shutdown. No oil was discovered on the gravel pad and subsequent testing confirmed that the release was entirely confined to the pump building.
Crooked Creek FloodingIn May 2011, the Kuskokwim River flooded the villages of Crooked Creek and Red Devil. The flood caused significant property damage in Crooked Creek, including the destruction of nearly one fourth of the homes in the village. ADEC coordinated oil and hazardous material emergency response with the Division of Homeland Security and Emergency Management and contracted Emerald Alaska Inc. to remove approximately six tons of contaminated soil and hazardous materials from the village.
Process Water (Oil Exploration and Production Operations): Process water includes seawater (and occasionally freshwater), produced water and commingled or mixed water. Seawater is typically from the Beaufort Sea that has undergone primary treatment at the Seawater Treatment Plant. Produced Water is produced with the primary reservoir three-phase production after passing through the separation and treatment.Commingled or mixed water is typically a mix of seawater and produced water, although other combinations exist in the operations on the North Slope.The percentage of crude oil occurring in process water can vary somewhat based on the source of the spill.Process Water (Mining Operations): Process water for mining operations includes water taken from tailing ponds for the milling process (reclaim water), water that has been through the water treatment plant but not the sand filter (process water), water that has been through both the water treatment and sand filter (discharge water), water mixed with ground ore materials (slurry) or water used in the milling and product recovery process (process solution water).Spill: a discharge or release of oil or a hazardous sub-stance to the lands, waters or air of the State of Alaska as defined in Alaska Statutes 46.03.826(9).
DISCLAIMERThe data presented and summarized in this report is provisional only due to ongoing quality assurance/quality control on the part of data entry staff and primary users. Additional on-going reviews will further refine the accuracy of the data.
Glossary and Notes
Significant Responses - continued from page 1
NOTES: • Some spill incidents involve releases of multiple
substances. In FY 2011, there were 1,718 spill incidents, resulting in 1,767 oil and hazardous substance releases.
• Some releases (such as gases and solids) are reported in pounds rather than gallons. In FY 2011, twenty-nine (29) releases totalling 2,985 pounds were reported to DEC. For graphing purposes, spill quantities reported in pounds were converted to gallons using a conversion factor of 8 pounds per gallon.
The 24-inch bypass line, under construction, enters the metering building at PS 1. (Photo courtesy of ADEC)

page 8 Alaska Department of Environmental Conservationpage 8 Alaska Department of Environmental Conservation
Map Key Spill Date Spill Name Product Gallons
03/08/2011 Crowley Aniak Tank Farm (to containment) Aviation Fuel 23,000
01/08/2011 Alyeska PS1 Booster Pump Leak (see note) Crude 12,927
04/23/2011 Greens Creek Mine, Pond A Process Water 7,000
09/25/2010 Tuluksak School Tank Farm Diesel 5,000
02/17/2011 Valdez Marine Terminal Powerhouse A Boiler Ethylene Glycol (Antifreeze) 5,000
06/14/2011 Point MacIntyre Drill Site 1 Methyl Alcohol (Methanol) 5,000
{ 02/11/2011 F/V Midnite Sun Grounding, Afognak Island Diesel 4,500
11/04/2010 Big State Logistics Tractor Trailer, Honolulu Creek Diesel 3,040
07/26/2010 F/V Cape Cross, Prince William Sound Diesel 3,000
12/22/2010 Fort Wainwright, RBK 05 Propylene Glycol 3,000
NOTE: No oil was discovered on the gravel pad and subsequent testing confirmed that the release was entirely confined to the pump building.
Top 10 Releases During FY 2011
10,000 to 19,999 gal
5,000 to 9,999 gal
<5,000 gal
>20,000 gal
NS
IN
CI PW
SE
NW
WE
BB
KI
AL
Total Spill Volume by Subarea
SubAreaName GallonsBristol Bay (BB) 979
Kodiak Island (KI) 5,839
Aleutian (AL) 8,173 Northwest Arctic (NW) 8,943
Prince William Sound (PW) 12,918 Southeast Alaska (SE) 13,131 Cook Inlet (CI) 21,010 Interior Alaska (IN) 22,068 Western Alaska (WE) 29,570 North Slope (NS) 36,485
Total Volume by Subarea