annual reports 2015 - julius · pdf filecorporate profile julius berger nigeria plc is a...
TRANSCRIPT

Annual Reports 2015and Financial Statements


Contents
Highlights
Corporate Information
Corporate Profile
Results at a Glance
Notice of Annual General Meeting
Notes
Chairman’s Statement
Board of Directors
Directors’ Profiles
Reports to Shareholders
Directors’ Report
Corporate Governance
Risk Management
Financial Information
Statement of Directors’ Responsibilities
Certification of Financial Statements
Report of the Audit Committee
Report of the Independent Auditors
Statement of Financial Position
Statement of Profit or Loss and Other Comprehensive Income
Statement of Changes in Equity
Statement of Cash Flows
Notes to the Financial Statements
General Information
Application of IFRS Standards
Significant Accounting Policies
Explanatory Notes
Additional Information
Statement of Value Added
Four-Year Financial Summary
Share Capital History
Glossary
Shareholder Information
2
3
4
6
7
8
12
14
18
28
36
40
41
42
43
44
46
48
50
54
55
60
79
118
120
122
123
124
1
Julius Berger Nigeria Plc AR & FS 2015 | Contents

Corporate Information
Directors
▪ AVM (Dr.) Mohammed Nurudeen Imam, CFR, Chairman
▪ Engr. Heinz Stockhausen (German), Vice Chairman
▪ HRH Igwe Peter Nwokike Anugwu, JP, OFR, Independent Director
▪ Engr. Jafaru Damulak ▪ Dr. Ernest Nnaemeka Azudialu-Obiejesi ▪ Mr. Mutiu Sunmonu, CON ▪ Engr. Wolfgang Goetsch (Austrian) ▪ Mr. George Marks (German), Acting Managing Director*
▪ Mr. Wolfgang Kollermann (German), Financial Director
▪ Alhaji Zubairu Ibrahim Bayi, Director Administration
▪ Mr. David Herron (Australian), Director Operations
* appointed Acting Managing Director on December 10, 2015
Company Secretary
Mrs. Cecilia Ekanem Madueke
Registration Number
6852
Registered Office
10 Shettima A. Munguno Crescent Utako 900 108 FCT Abuja
Auditors
Nexia Agbo Abel & Co.Chartered Accountants 43 Anthony Enahoro Street,Utako 900 001FCT Abuja
Registrars
GTL Registrars Ltd. (formerly Union Registrars Ltd.)274 Muritala Muhammed WayEbute Metta 101 212Lagos
Bankers
▪ Access Bank Plc ▪ Diamond Bank Plc ▪ First City Monument Bank Plc ▪ Guaranty Trust Bank Plc ▪ Union Bank of Nigeria Plc ▪ United Bank for Africa Plc ▪ Zenith Bank Plc
2

Corporate Profile
Julius Berger Nigeria Plc is a leading con-struction company offering integrated construction solutions and related services. Since its pioneer project in 1965, Julius Berger Nigeria Plc has played a pivotal role in the development of Nigeria. The Compa-ny specialises in executing complex works requiring the highest level of technical expertise and Nigeria-specific knowhow.
State-of-the-art methods and technologies ensure that quality and innovation are pri-oritised for the benefit of clients. Subsidi-aries and additional facilities make it pos-sible to realise multifaceted projects at the highest level of performance. This structure allows Julius Berger Nigeria Plc to effectively manage and fulfil construction projects, start-ing from the initial idea, through to planning, design, engineering, construction, opera-tion and maintenance.
Subsidiaries include: Julius Berger Interna-tional GmbH, in Germany, a key provider of planning, design and engineering, in addi-tion to logistical support for the businesses in Nigeria; Julius Berger Services Nigeria Ltd., a multipurpose terminal operator at the Warri Port, which contributes to the Group’s logistics chain; Julius Berger Medi-cal Services Ltd., a medical service provider for the Group’s large workforce, supporting efficient operations; Julius Berger Free Zone Enterprise, which facilitates opportunities to participate in projects within the Free Trade Zones across Nigeria; Abumet Nigeria Ltd., a leading aluminium manufacturer in Nige-ria, which strengthens the Group’s ability to provide turnkey building solutions; Prime-Tech Design and Engineering Nigeria Ltd.,
which houses the Group’s design and engi-neering resources in Nigeria.
Julius Berger Nigeria Plc, together with its subsidiaries, is guided by a value system, which has, over time, defined and differenti-ated its business, thereby setting a bench-mark in the Nigerian construction industry. The Group’s competitive edge is solidified through adherence to internationally spe-cified standards and through its focus on efficient and value-driven project planning and execution. Unwavering reliability, an unmatched breadth and depth of expertise as well as strong supply chains provide par-ticular assurance for clients and guarantee project success.
3
Julius Berger Nigeria Plc AR & FS 2015 | Corporate Profile
Back to Contents

Results at a Glance
8.00
7.00
6.00
5.00
4.00
3.00
2.00
₦ 2011 2012 2013 2014 2015₦ 2011 2012 2013 2014
₦ million 2011 2012 2013 2014 2015
Earnings per ShareDividend per Share
Turnover and Profit Before Tax
Group 3.68 6.83 6.72 6.13 1.33
Company 3.68 6.48 3.99 4.92 2.01Company 2.40 2.50 2.70 2.70
Turnover Group 169,413 201,565 212,737 196,809 133,808
Turnover Company 167,399 196,955 184,212 179,979 119,243
PBT Group 9,933 12,341 16,221 13,135 6,500
PBT Company 9,874 11,545 10,976 10,029 6,234
3.50
3.00
2.50
2.00
1.50
1.00
0.50
250,000
200,000
150,000
100,000
16,000
14,000
12,000
10,000
8,000
6,000
2.70 2.702.40 2.50
4
Julius Berger Nigeria Plc AR & FS 2015 | Results at a Glance

Group 2015
₦ 000
Group 2014
₦ 000
Change
%
Company 2015
₦ 000
Company 2014
₦ 000
Change
%
Revenue 133,807,574 196,808,632 (32.1) 119,242,541 179,978,707 (33.8)
Profit before taxation 6,499,973 13,134,896 (50.5) 6,234,338 10,028,524 (37.8)
Profit for the year 2,440,140 8,239,979 (70.4) 2,836,672 6,730,117 (57.9)
Other comprehensive income (680,028) 22,936 (3,064.90) (180,372) (234,303) (23.0)
Total comprehen-sive income 1,760,112 8,262,915 (78.7) 2,656,300 6,495,814 (59.1)
Non-controlling interest (225) (174,120) (99.9) – – –
Profit attributable to equity holders of the parent
1,759,887 8,088,795 (78.2) 2,656,300 6,495,814 (59.1)
Retained earnings 22,729,580 23,420,332 (3.0) 17,573,012 18,480,712 (4.9)
Share capital 660,000 660,000 – 660,000 660,000 –
Shareholders’ funds 24,291,955 26,095,843 (6.9) 18,658,452 19,566,152 (4.6)
Per share dataBased on 1.32 billion (2014: 1.32 billion) ordinary shares of 50 Kobo each
Group 2015
₦
Group 2014
₦
Change
%
Company 2015
₦
Company 2014
₦
Change
%
Earnings per share
– Basic 1.33 6.13 (78.2) 2.01 4.92 (59.1)
– Diluted 1.33 6.13 (78.2) 2.01 4.92 (59.1)
Net assets per share
– Basic 18.40 19.77 (6.9) 14.14 14.82 (4.7)
– Diluted / Adjusted 18.40 19.77 (6.9) 14.14 14.82 (4.7)
Stock Exchange quotation at December 31 42.00 60.66 (30.8) 42.00 60.66 (30.8)
Number of employees 10,887 17,829 (38.9) 9,277 15,998 (42.0)
5
Julius Berger Nigeria Plc AR & FS 2015 | Results at a Glance
Back to Contents

Notice is hereby given that the 46th Annu-al General Meeting (AGM) of Julius Berg-er Nigeria Plc will be held at the Shehu Musa Yar’Adua Centre, 1 Memorial Drive, FCT Abuja, on Thursday, June 16, 2016, at 11:00 a.m., to transact the following busi-ness:
Ordinary business
1. To lay before the Company in General Meeting, the Consolidated Group Fi-nancial Statements for the period end-ed December 31, 2015, the Reports of the Auditors, the Directors and the Audit Committee.
2. To declare a dividend.
3. To elect / re-elect Directors.
4. To authorise the Directors to fix the remuneration of the External Auditors.
5. To constitute the Statutory Audit Com-mittee.
Special business
6. To consider and if thought fit, pass the following resolution as ordinary resolu-tion:
“That the Directors’ fees payable to each Director, save Executive Directors, until further notice, be and is hereby fixed at the sum of ₦ 3.1 million (three million one hundred thousand Naira) for each Non-Executive Director save the Chairman, whose fees shall be fixed at the sum of ₦ 5.2 million (five million two hundred thousand Naira), such pay-ments to be made effective from Janu-ary 1, 2016.
By order of the Board,
Mrs. Cecilia Ekanem Madueke Company Secretary
10 Shettima A. Munguno CrescentUtako 900 108 | FCT Abuja
May 12, 2016
Notice of
Annual General Meeting
6
Julius Berger Nigeria Plc AR & FS 2015 | Notice of Annual General Meeting

Notes
Proxy
A member of the Company, entitled to at-tend and vote, is entitled to appoint a proxy to attend and vote in his stead. A proxy needs not be a member of the Company. The Proxy Form provided with this An-nual Reports and Financial Statements (AR & FS), to be valid for the purpose of the Meeting, must be completed, duly stamped at the office of the Commissioner for Stamp Duties and deposited at the office of the Registrars, GTL Registrars Ltd., (Former-ly Union Registrars Ltd.), not later than 48 hours before the time appointed for holding the Meeting.
Closure of Register of Members and Transfer Books
The Register of Members and the Transfer Books will be closed from May 31, 2016 to June 2, 2016, both dates inclusive, for the purpose of dividend and scrip.
Appointment of members of the Statu-tory Audit Committee of the Company
Any member may nominate a shareholder as a member of the Statutory Audit Committee of the Company, by giving notice in writing of such nomination to the Company Secretary, at least 21 days before the date of the AGM.
Right to ask questions
Members have a right to ask questions on their observations or concerns arising from the AR & FS 2015 not only at the Meeting but also in writing prior to the Meeting, provided
that such questions in writing are submitted no later than June 6, 2016. The AR & FS 2015 can be downloaded from the website of the Company at www.julius-berger.com.
Dividend warrants
If the dividend recommended by the Directors is approved by the members, the dividend warrants will be issued on June 17, 2016, to those members whose names appear in the Register of Members, as at the close of busi-ness on May 30, 2016 (“Qualification date”).
Unclaimed share certificates and divi-dend warrants
The Company notes that some share cer-tificates have been returned marked “un-claimed”. The Company notes further that some dividend warrants sent to sharehold-ers are yet to be presented for payment. Therefore, all shareholders with “unclaimed share certificates” or “unclaimed dividends” should address their claim(s) to the Regis-trars, GTL Registrars Ltd., 274 Muritala Mu-hammed Way, Ebute Metta 101 212, Lagos or to the Company Secretary at the address of the registered office. Members are being urged to avail themselves of the use of the forms provided to update their information, particularly as it relates to share certificates and warrants, as well as mandate their divi-dend(s), and use the CSCS.
7
Julius Berger Nigeria Plc AR & FS 2015 | Notes Julius Berger Nigeria Plc AR & FS 2015 | Notes
Back to Contents

Chairman’s Statement
Distinguished Ladies and Gentlemen, valued Shareholders,
As you are all aware, 2015 was a year filled with tremendous challenges for our coun-try Nigeria, which also severely impacted on the entire construction industry. While Nigeria saw a generally smoother and more credible electoral process, resulting in the successful transition to the new Presidential Administration of His Excellency President Muhammadu Buhari, the nation faced diffi-culties due to persisting economic challeng-es. Low crude oil prices, higher interest rates, devaluation of the Naira and stringent fis-cal policies were ongoing daily realities that contributed to an extremely volatile business
environment and ultimately resulted in an overall hiatus of key developments and major investments. More specifically, in the public sector, lower crude oil prices had a detri-mental effect on the ability of government, at all tiers, to meet its contractual obligations and fund capital expenditure. In the private sector, the macro-economic slowdown and foreign exchange scarcity also triggered a downward review of capital expenditure.
To alleviate the effects of the economic downturn and mitigate potential adverse consequences on our Group, proactive measures were put in place and imme-diate action was taken to adjust Group operations to the realities of exigent envi-
Completed works
▪ Centenary City, Grading Works Phase I, Abuja
▪ Edo Cement Plant, Okpella ▪ Marine Control Building NLNG, Bonny Island
▪ Second River Niger Bridge Early Works Phase II & III, Asaba –Onitsha
8
Julius Berger Nigeria Plc AR & FS 2015 | Chairman’s Statement

ronment and the consequent financial situ-ation of our clients. The strategic reduction of overheads and adjustment of perfor-mance planning and resources was carried out to ensure Julius Berger Nigeria Plc and its subsidiaries remained fit to successful-ly navigate the enormous challenges being faced. This included the very unfortunate and painful requirement to retrench a signif-icant number of our well-trained and capa-ble staff. Furthermore, the Group increased its focus on expanding third party business and suspended works on sites experienc-ing poor payment performance. Efforts to optimise structures and procedures in order to deliver improvements in efficiency and allocation of resources continued to
be implemented. While many tough de-cisions had to be made, the results were positive. The Group achieved a much lean-er organisational structure, higher efficien-cy across operations and an overall lower overhead profile. These achievements con-tinue to support the ability of Julius Berger Nigeria Plc and its subsidiaries to success-fully sustain operations during the time needed to bridge present realities with the expected future economic recovery and industry- related opportunities we remain hopeful for.
Nonetheless, due to the lingering unfavor-able economic climate thus far detailed, the entire construction industry remains in crisis
Highlighted Projects
Ongoing works
▪ Permanent Site of the National Insti-tute for Legislative Studies, Abuja
▪ New Residences for Presiding Officers of the National Assembly, Abuja
▪ Rehabilitation & Extension of Airport Expressway, Abuja
▪ Nestoil Office Tower, Lagos ▪ Rehabilitation of Badia Roads, Lagos ▪ Lagos–Badagry Expressway, Lagos ▪ Lagos–Ibadan Dual Carriageway, Section 1, Lagos–Shagamu
▪ Uyo–Ikot Ekpene Road Phase I, II & III, Akwa Ibom
▪ Uyo–Abak Road, Akwa Ibom ▪ Uyo Ring Road, Akwa Ibom ▪ Akwa Ibom Stadium Complex, Maintenance, Akwa Ibom
▪ Dualisation Etegwe–Issac Boro–Ox-Bow Lake–Sani Abacha Road, Yenagoa
▪ Azura–Edo Independent Power Plant, Benin City
▪ Project Emerald, GE, Calabar FTZ
New awards
▪ Asokoro Conference Centre, Abuja ▪ Dangote Jetty Apapa, Lagos ▪ Uyo–Etinan Road, Akwa Ibom ▪ Upgrade of NLNG MOF Jetty, Bonny Island
▪ Dualisation Oil Mill Elelenwo Akpajo Road, Port Harcourt
▪ No Potholes Programme, Port Harcourt
9
Julius Berger Nigeria Plc AR & FS 2015 | Chairman’s Statement
Back to Contents

mode until today. Moreover, the additional issue of foreign exchange scarcity and depreciation of the Naira have further exaggerated difficulties. The sourcing of foreign currency at a bearable rate of exchange has become of paramount importance. Although the Company and its subsidiaries are fully engaged in domestic manufacturing, our production capabilities require raw and miscellaneous materials, not available locally, to maintain production.
Such tough realities negatively affected the Group’s projected planning targets in 2015, resulting in a considerable decline com-pared with the previous reporting year. The Board of Directors is therefore of the opin-ion that the present circumstances do not allow to maintain the same dividend level as in previous years. The Board of Directors is proposing a dividend of ₦ 1.50 per ordinary share, resulting in a total gross dividend pay-out of ₦ 1.98 billion.
Apart from the proactive measure taken to suspend works on a significant number of active projects experiencing critical levels of payment default, we achieved several positive milestones that have brightened the outlook for the immediate future. The 450-megawatt Azura-Edo Independent Power Plant near Benin City reached Finan-cial Close and works on site already com-menced in the fourth quarter of 2015. This was a major achievement for our business in the power sector. The Company now aims to strengthen its presence in the sector by enhancing its position as an Engineering, Procurement and Construction Contractor of choice for the sector. We are confident
in our capabilities to provide a range of services required for the successful devel-opment of power plants. Accordingly, we are monitoring the ongoing privatisation of the sector diligently, in order to identify op-portunities that match our skills and actively tender for such projects.
Beyond the power sector, the Company aims to identify and explore opportunities in new business areas. This goal continues to be vigorously pursued through our business development activities. Negotiations are proceeding on a number of major projects that have been targeted to contribute sig-nificantly to future performance. Additionally, in 2015 the Company was able to sustain its business through the award of several projects in both the public and private sec-tors, including: the Dangote Jetty in Apapa, Lagos, the Asokoro Conference Centre in Abuja, upgrade of Nigeria Liquefied Natural Gas Company (NLNG) Material Offloading Facilities (MOF) Jetty on Bonny Island and the Dualisation of the Uyo – Etinan Road in Akwa Ibom, not to mention several road projects in Port Harcourt.
While it is certain that project progress is restricted to clients’ financial capacities, I can confidently report that the Compa-ny remains focused on providing efficient and value-driven planning and execution of projects. This commitment, coupled with a continued emphasis on quality manage-ment to ensure ongoing improvement in the effectiveness of key business processes, guarantees that Julius Berger Nigeria Plc is well equipped to consistently meet clients’ demand for superior quality and reliable
“Julius Berger Nigeria Plc and its subsidiaries remain focused on providing efficient and value-driven planning and execution of projects”
10
Julius Berger Nigeria Plc AR & FS 2015 | Chairman’s Statement

funding and clients’ financial capacities. Focus on sustainable profitability over growth along with a stabilisation of cash flow and debt recovery will remain para-mount.
Although Nigeria currently faces tough eco-nomic times, our country retains enormous potential. Julius Berger Nigeria Plc and its subsidiaries shall continuously ensure our core strengths are maintained and reinforce our ability to respond swiftly to the oppor-tunities and challenges of the environment. The Group remains well equipped and uniquely positioned to offer clients integrat-ed and holistic solutions, at an unmatched level. This position continues to attract both public and private clients across all sectors.
Esteemed shareholders, be assured that Julius Berger’s Board of Directors, Man-agement and staff are steadily working to ensure that we continue to create value for both our clients and our shareholders. With the continued shared commitment of each and every one of you, it is without question that Julius Berger Nigeria Plc and its sub-sidiaries have a strong foundation for con-tinued success.
AVM (Dr.) Mohammed Nurudeen Imam, CFR ChairmanFRC / 2014 / NSE / 00000006483
delivery, long-standing hallmarks of the Julius Berger brand. The Company will continue to implement its long-term strate-gy of diversification with regards to business segments and client mix. Emphasis will continue to be placed on further increas-ing share of private sector clients within our portfolio and our holistic approach to client servicing remains a key competitive edge in this regard. Furthermore, Julius Berger Nigeria Plc continues to monitor the pro-jects on hold and we are able to restart work quickly once funding becomes available.
In 2015, Julius Berger Group remained dedicated to its mission of providing inte-grated construction solutions. Subsidiaries maintained their level of performance with stronger focus on increasing market share for the future. The Group also expanded, with the addition of Julius Berger Free Zone Enterprise, thereby facilitating opportunities to participate in projects within the Free Trade Zones across Nigeria. In this regard, the Group continued to perform positively and further develop its ability to offer clients a broad range of products and services within the construction industry in Nigeria.
Considering the economic indicators from the global oil market as well as the current financial climate in Nigeria, it is expected that present challenges within Nigeria’s economy and the resulting adverse influences on the business environment will persist well into the 2016 fiscal year, contin-uing to expose the Group to considerable difficulties. Looking forward, performance planning and resources have therefore been adjusted to meet forecasts for project
11
Julius Berger Nigeria Plc AR & FS 2015 | Chairman’s Statement
Back to Contents

12
Board of Directors
Engr. Jafaru Damulak
Mr. David Herron Director Operations
Engr. Heinz Stockhausen Vice Chairman
Alhaji Zubairu I. Bayi Director Administration
Mr. Wolfgang KollermannFinancial Director
Mr. Mutiu Sunmonu, CON
Julius Berger Nigeria Plc AR & FS 2015 | Board of Directors

13
Engr. Wolfgang GoetschMr. George MarksActing Managing Director
Engr. Heinz Stockhausen Vice Chairman
Dr. Ernest N. Azudialu-ObiejesiHRH Igwe Peter N. Anugwu, JP, OFRIndependent Director
AVM (Dr.) M. Nurudeen Imam, CFR Chairman
Julius Berger Nigeria Plc AR & FS 2015 | Board of Directors
Back to Contents

AVM (Dr.) Mohammed Nurudeen Imam, CFRpsc, usawc, FSS, LLD (HC) ▪ Appointed Chairman on September 2, 2008
▪ Appointed Director on January 11, 1999 Member of the Nigerian Society of Engi-neers | Chairman of the Boards of Directors of the Monument Group of Companies Ltd. and Bayero University Kano Development Board | Member of the Boards of Gover-nors of Dowen College, Lagos and Prime College, Kano
Engr. Heinz Stockhausen (German)Diplom-Ingenieur (Graduate Civil Engineer) ▪ Appointed Vice Chairman on December 8, 2009
▪ Appointed Director on September 5, 2008
HRH Igwe Peter Nwokike Anugwu, JP, OFR Diploma in Agricultural Engineering ▪ Independent Director ▪ Appointed Director on May 2, 1996Justice of the Peace and traditional ruler of the ancient Mbaukwu Kingdom in Anam-bra State | Chairman of the Board of Direc-tors of Julius Berger Services Nigeria Ltd. | Director of Interfact Beverages Ltd. and Orient Petroleum Ltd.
Engr. Jafaru Damulak BSc (Civil Engineering) ▪ Appointed Director on October 12, 2007Member of the Nigerian Society of Engineers and the Council for the Regulation of Engineering in Nigeria | Chairman of the Board of Directors of PrimeTech Design and Engineering Nigeria Ltd. | Managing Director of Elm Properties and Estate Development Company Ltd. | Director of NETCOM Africa Ltd.
Dr. Ernest Nnaemeka Azudialu-ObiejesiBSc (Accountancy), DBA (HC) ▪ Appointed Director on March 22, 2012Group Managing Director of Nestoil Plc | Director of Watertown Energy Ltd., B&Q Dredging Ltd., Energy Works Techno logy Ltd., Royaloak Hydrocarbon Ltd., and others
Mr. Mutiu Sunmonu, CONBSc (First Class Honours Mathematics & Computer Sciences) ▪ Appointed Director with effect from Janu-ary 1, 2015
Chairman of the Boards of Directors of Imperial Homes Mortgage Ltd. and Julius Berger Investments Ltd.
Directors’ Profiles
14
Julius Berger Nigeria Plc AR & FS 2015 | Directors’ Profiles

Mr. George Marks (German)BBA, DSc (HC) ▪ Appointed Acting Managing Director on December 10, 2015
▪ Appointed Director with effect from Janu-ary 1, 2013
Member of the Association of National Accountants of Nigeria | Managing Director of Julius Berger International GmbH (Germany) | Director of Centenary City Plc
Mr. Wolfgang Kollermann (German)Diploma in Business Administration and Accounting ▪ Appointed Director and Financial Director with effect from September 22, 2010
▪ Joined the Company on September 1, 2000
Member of the Association of National Accountants of Nigeria | Chairman of the Board of Directors of Julius Berger Medical Services Ltd. | Director of Abumet Nigeria Ltd., Julius Berger Services Nigeria Ltd., PrimeTech Design and Engineering Nigeria Ltd. and Julius Berger Free Zone Enterprise
Alhaji Zubairu Ibrahim BayiBSc (Buildings) ▪ Appointed Director and Director Adminis-tration with effect from January 1, 2013
▪ Joined the Company on February 2, 1984Director of Julius Berger Services Nigeria Ltd.
Mr. David Herron (Australian)BE (Civil Engineering) ▪ Appointed Director and Director Opera-tions with effect from January 1, 2013
▪ Joined the Company on January 3, 2007
Engr. Wolfgang Goetsch (Austrian)Diplom-Ingenieur (Graduate Civil Engineer) ▪ Appointed Non-Executive Director on June 18, 2014
Member of the Nigerian Society of Engi-neers and the Council for the Regulation of Engineering in Nigeria | Managing Di-rector of Julius Berger International GmbH (Germany) | Director of Julius Berger Invest-ments Ltd. and Second Niger Bridge Devel-opment Company Ltd.
15
Julius Berger Nigeria Plc AR & FS 2015 | Directors’ Profiles
Back to Contents

PrimeTech Design and Engineering Nigeria Ltd.
PrimeTech Design and Engineering Nigeria Ltd. provides technically advanced and val-ue-driven design and engineering solutions for the construction of buildings, industries, civil structures and infrastructure. The com-pany’s portfolio covers all design and engi-neering phases from research, to drafts and concepts, to detailed construction design, as well as master planning. Furthermore, the company has in-depth knowhow re-garding specialised requirements of the oil and gas sector, and works in compliance with the Nigerian Oil and Gas Industry Local Content Development Act.

1717
Reports to Shareholders
for the Year Ended December 31, 2015
Back to Contents

Subsidiary Principal activities and business Date of incorporation
Percentage holding
Abumet Nigeria Ltd.
Manufacturers and dealers in aluminium, steel, iron or other structural products of such nature
June 15, 1990
90.0 %
Julius Berger Services Nigeria Ltd.
Providers of ports services, stevedores, cargo superintendents, port management, warehousemen, agents and proprietors of warehouses
August 30, 2006
100.0 %
Julius Berger Medical Services Ltd.
Health care providers for the operation of medical service institutions and all form of medical and health care services
August 22, 2011
100.0 %
PrimeTech Design and Engineering Nigeria Ltd.
Engineers, planning, design, development, construction and maintenance of engineer-ing works and products of all description
August 22, 2011
100.0 %
Julius Berger Investments Ltd.
Investment company and managers June 1, 2012
100.0 %
Julius Berger International GmbH
Providers of logistical and technical support on an international level
June 24, 2008
100.0 %
Julius Berger Free Zone Enterprise
Planning and construction of all kinds and aspects of civil engineering works and related activities as well as maintenance of buildings and facilities in free trade zones
March 24, 2015
100.0 %
The financial results of all the subsidiaries have been consolidated in these Financial Statements.
Directors’ Report
The Directors are pleased to present to the members of Julius Berger Nigeria Plc at the 46th AGM their report on the business of the Group for the year ended December 31, 2015.
1. Legal form
The Company was incorporated in Nigeria under the Companies Act 1968, now CAMA, as a private limited liability compa-ny on February 18, 1970. The Company
subsequently converted to a public limited liability company and its shares became listed on the Nigerian Stock Exchange (NSE) on September 20, 1991.
2. Principal activities
The principal activities of the Company are the business of planning and construction of all kinds of civil engineering works. The Company has seven subsidiaries, with their principal activities stated as follows:
18
Julius Berger Nigeria Plc AR & FS 2015 | Directors’ Report

3. Results for the year
Comparative highlights of the operational results of the Group for the years ended December 31, 2015 and 2014 are as stated in the table above.
4. Review of business development
In the year under review, the Group, in the opinion of the Directors, performed satis-factorily.
Save as herein disclosed, no other events have occurred since the year ended December 31, 2015, which would affect the Financial Statements.
5. Dividends
5.1 Dividend
The Directors are pleased to recommend to the members at the 46th AGM, a final dividend for the year ended December 31, 2015, in the sum of N 1.98 billion represent-ing ₦ 1.50 per 50 Kobo share, held in the equity of the Company which dividend shall be subject to withholding tax at the appro-priate rate at the time of payment.
5.2 Unclaimed dividends and share certificates
The lists of shareholders who have either unclaimed dividends or share certificates have been compiled and are attached with this document. Shareholders who find their names on the lists and have claimed their dividend(s) or share certificate(s) since December 31, 2015, should kindly ignore the attached lists. However, sharehold-ers who are yet to claim their unclaimed dividend(s) or share certificate(s) should contact the Company Secretary or the Registrars, GTL Registrars Ltd.
Group results 2015₦ 000
2014₦ 000
Turnover 133,807,574 196,808,632
Profit attributable to Group activities 1,760,112 8,262,915
Retained earnings 22,729,580 23,420,332
19
Julius Berger Nigeria Plc AR & FS 2015 | Directors’ Report
Back to Contents

6. Directors and directors’ interest and shareholding
6.1 Board of Directors in 2015
The Directors who served on the Board of the Company for the year ended December 31, 2015, were as follows:
▪ AVM (Dr.) Mohammed Nurudeen Imam, CFR
▪ Engr. Heinz Stockhausen (German) ▪ HRH Igwe Peter Nwokike Anugwu, JP, OFR ▪ Engr. Jafaru Damulak ▪ Mr. Macdonald Olarinde Tubi ▪ Mr. Harold Samuel Tsumba, Esq. ▪ Dr. Ernest Nnaemeka Azudialu-Obiejesi ▪ Mr. George Marks (German) ▪ Engr. Wolfgang Goetsch (Austrian) ▪ Mr. Mutiu Sunmonu, CON ▪ Engr. Detlev Lubasch (German) ▪ Mr. Wolfgang Kollermann (German) ▪ Alhaji Zubairu Ibrahim Bayi ▪ Mr. David Herron (Australian)
6.2 Changes to the Board
During the period under review, Mr. Macdon-ald Olarinde Tubi passed away on February 17, 2015, Engr. Detlev Lubasch resigned his appointment as Director and Managing Director of the Company with effect from December 9, 2015. Mr. George Marks was appointed Acting Managing Director on December 10, 2015. Mr. Harold Samuel Tsumba, Esq. resigned his appointment as a Non-Executive Director of the Company with effect from December 31, 2015.
6.3 Directors for re-election
Engr. Heinz Stockhausen and Dr. Ernest Nnaemeka Azudialu-Obiejesi are the Di-rectors retiring by rotation, in accordance with the provisions of S259 of CAMA and the Articles of Association. Engr. Heinz Stockhausen and Dr. Ernest Nnaemeka Azudialu-Obiejesi all being eligible, offer themselves for re-election.
6.4 Directors’ interest
For the purposes of S 275, 276 and 277 of CAMA and in compliance with the listing requirement of the NSE: ▪ some Directors gave notices of dis-closable direct and / or indirect interests in some contracts and assets of the Com-pany; and
▪ the Directors’ interest in the issued share capital of the Company as recorded in the Register of Members and in the Register of Directors’ holdings and contracts as notified by them are as stated in the table on page 21.
20
Julius Berger Nigeria Plc AR & FS 2015 | Directors’ Report

Number of Directors’ direct and indirect holdings as at
March 17, 2016
December 31, 2015
December 31, 2014
AVM (Dr.) Mohammed Nurudeen Imam, CFR 897,387 897,387 782,383
Engr. Heinz Stockhausen – – –
HRH Igwe Peter Nwokike Anugwu, JP, OFR 88,000 88,000 88,000
Engr. Jafaru Damulak 1,980,849 1,980,849 1,980,849
Mr. Macdonald Olarinde Tubi – – –
Mr. Harold Samuel Tsumba, Esq. 41,800 41,800 41,800
Dr. Ernest Nnaemeka Azudialu-Obiejesi – Indirect * 165,127,597 165,127,597 163,127,597
Mr. George Marks – – –
Engr. Wolfgang Goetsch – – –
Mr. Mutiu Sunmonu, CON 1,000,000 1,000,000 1,000,000
Engr. Detlev Lubasch – – –
Mr. Wolfgang Kollermann – – –
Alhaji Zubairu Ibrahim Bayi 465,619 465,619 417,119
Mr. David Herron – – – * Watertown Energy Ltd., BOJ-ESL NOMINEE (Continental Acquisitions Ltd.) and AAD ESL Nominee
7. Share capital and shareholding
The Company did not purchase its own shares during the year.
7.1 Authorised share capital
The authorised share capital of the Compa-ny is ₦ 800 million made up of 1.6 billion ordinary shares of 50 Kobo each.
7.2 Issued and fully paid share capital
The issued and paid-up share capital of the Company currently is ₦ 660 million made up of 1.3 billion ordinary shares of 50 Kobo each.
The share capital history of the Company is stated on page 122.
21
Julius Berger Nigeria Plc AR & FS 2015 | Directors’ Report
Back to Contents

7.3 Beneficial ownership
The issued and paid-up share capital of the Company, as at December 31, 2015, and March 17, 2016, when the Financial State-ments were approved, were beneficially held as stated in the table above.
7.4 Free float
The free float analysis of the issued and paid-up share capital of the Company, as at December 31, 2015, and March 17, 2016, when the Financial Statements were approved, is as stated on page 23:
Beneficial ownership
Number of ordinary shares
held as at March 17,
2016
Percentage holdings
as at March 17,
2016
Number of ordinary shares
held as at December 31,
2015
Percentage holdings
as at December 31,
2015
Percentage holdings
as at December 31,
2014
Bilfinger SE 217,800,000 16.5 % 217,800,000 16.5 % 30.3 %
Watertown Energy Ltd. 132,000,000 10.0 % 132,000,000 10.0 % 10.0 %
Goldstone Estates Ltd. 262,262,079 19.9 % 262,262,079 19.9 % 9.6 %
Ibile Holdings Ltd. 72,600,000 5.5 % 72,600,000 5.5 % 5.5 %
Other Nigerian Citizens, Associations and Governments
635,337,921 48.1 % 635,337,921 48.1 % 44.6 %
Total 1,320,000,000 100.0 % 1,320,000,000 100.0 % 100.0 %
22
Julius Berger Nigeria Plc AR & FS 2015 | Directors’ Report

Free float Number of ordinary shares
held as at March 17,
2016
Percentage holdings
as at March 17,
2016
Number of ordinary shares
held as at December 31,
2015
Percentage holdings
as at December 31,
2015
Percentage holdings
as at December 31,
2014
Strategic shareholding 851,248,984 64.5 % 851,248,984 64.5 % 62.9 %
Directors’ direct shareholding 4,473,655 0.3 % 4,473,655 0.3 % 0.3 %
Staff schemes – – – – –
Free float 464,277,361 35.2 % 464,277,361 35.2 % 36.8 %
Total 1,320,000,000 100.0 % 1,320,000,000 100.0 % 100.0 %
Share range as at December 31, 2015 Number of shareholders
Percentage of shareholders
Number of units held
Percentage shareholding
1 – 500 2,069 19.4 % 407,700 0.0 %
501 – 1000 1,048 9.9 % 763,444 0.1 %
1,001 – 5,000 3,497 32.9 % 8,916,788 0.7 %
5,001 – 10,000 1,687 15.9 % 11,955,201 0.9 %
10,001 – 25,000 1,217 11.4 % 18,891,583 1.4 %
25,001 – 100,000 831 7.8 % 38,405,379 2.9 %
100,001 – 500,000 208 2.0 % 42,068,584 3.2 %
500,001 – 1,000,000 29 0.3 % 20,594,132 1.6 %
1,000,001 – and above 45 0.4 % 1,177,997,189 89.2 %
Total 10,631 100.0 % 1,320,000,000 100.0 %
7.5 Share range analysis
23
Julius Berger Nigeria Plc AR & FS 2015 | Directors’ Report
Back to Contents

8. Property, plant and equipment
Significant movements in properties, plants and equipments constituting the PPE of the Group during the year are indicated in Note 14 on pages 90 to 91. In the opinion of the Directors, the market value of the prop-erties, plants and equipments is not less than the value shown in the accounts.
9. Donations and CSR initiatives
During the year 2015, the Company undertook Corporate Social Responsibility (CSR) initiatives shown in the table above and made donations shown in the table on page 25 valued at ₦ 6.5 million (2014: ₦ 19.7 million).
These figures do not take into account the value and costs of resources when the Company responds in critical emergency situations.
In compliance with S 38(2) of CAMA no do-nation was made to any political party, polit-ical association or for any political purpose.
10. Research and Development
Research, development and deployment of leading edge construction and engineering technologies, design and methodologies are key to Julius Berger Nigeria Plc and its subsidiaries. The Group would continue to invest in research and development in order to enhance its design, planning, execution, construction and local engineering capabil-ities to deliver on client requirements inno-vatively.
11. Technical service and knowhow agreement
Technical services agreements executed between components in the Group and Julius Berger International GmbH, are regis-tered with the National Office for Technolo-gy / Acquisition and Promotion (NOTAP).
Corporate Social Responsibility ₦
Education 13,570,590
Health 4,062,500
Youth Sports 10,850,000
Community Development 100,074,245
Total 128,557,335
24
Julius Berger Nigeria Plc AR & FS 2015 | Directors’ Report

Donations ₦
IBB Golf and Country Club Ladies Golf Championship 350,000
Lagos Grassroots Soccer 1,000,000
IBB Golf and Country Club Captains Cup 350,000
Association of National Accountants of Nigeria 1,250,000
Embassy of Greece 200,000
Federation of the Construction Industry 750,000
Student Book Launch 200,000
Institute of Chartered Accounts of Nigeria 500,000
Chartered Institute of Taxation of Nigeria 250,000
IBB Golf and Country Club Independence Cup 250,000
Patrick Speech Centre 450,000
IBB Golf and Country Club Youth Cup 350,000
Financial Reporting Council of Nigeria 500,000
Various minor donations 135,000
Total 6,535,000
25
Julius Berger Nigeria Plc AR & FS 2015 | Directors’ Report
Back to Contents

12. Suppliers
The significant suppliers to the Company domestically and internationally are:
▪ Julius Berger International GmbH ▪ Lafarge Africa Plc ▪ Mantrac Nigeria Ltd. ▪ Abumet Nigeria Ltd. ▪ Dangote Cement Industries Ltd. ▪ Samofaz Nigeria Ltd. ▪ Tabson Nigeria Ltd. ▪ Federated Steel Mills Ltd. ▪ Apex Paint Ltd. ▪ Ringardas Nigeria Ltd. ▪ Peri Formwork + Scaffolding Nig. Ltd. ▪ Forte Oil Plc
13. Post year end events
Save as disclosed, there were no significant post year end events that could have had a material effect on the Financial Statements for the year ended December 31, 2015, which has not been adequately provided for.
14. Human capital management
Employee relations were stable and cordial in the year under review.
14.1 Employment of physically challenged persons
It is the policy of the Group that there should be no unfair discrimination in consider-ing applications for employment including those from physically challenged persons. All employees whether or not physically challenged are given equal opportunities to develop their experience and know ledge and to qualify for promotion in further-ance of their careers. As at December 31, 2015, there were 36 physically challenged persons employed by the Group.
14.2 Health and safety at work and welfare of employees
The nature of Group activities demand that a high priority is placed on the health, safety and welfare of employees as well as all visi-tors in all aspects of Group operations.
To this end, there is a strict observance of health and safety policies, regulations and structures. Further, medical facilities are provided to all staff and their immedi-ate families, comprising a spouse and four children, in accordance with the welfare schedule agreed with the operating domes-tic workers unions as well as the provisions of the National Health Insurance Scheme Act CAP N 42, Laws of the Federation of Nigeria 2004.
In the Group, there is full compliance with the provisions of the Pensions Reform Act of 2014.
26
Julius Berger Nigeria Plc AR & FS 2015 | Directors’ Report

14.3 Involvement and training
The consultation machinery for the dissem-ination of information and involvement in matters concerning the staff and corporate affairs was engaged by all components within the Group.
Training and education are key to the reten-tion of skills and expertise within the Group. The Group is committed to investments in ensuring the required skills set for its business and operation.
15. Audit Committee
The members of the Statutory Audit Com-mittee, appointed at the AGM held on June 17, 2015, in accordance with S 359 (3) of CAMA were:
▪ Chief Timothy Ayobami Adesiyan, Chairman
▪ HRH Igwe Peter Nwokike Anugwu, JP, OFR, Member
▪ Sir Sunday Nnamdi Nwosu, KSS, Member ▪ Mr. Wolfgang Kollermann, Member ▪ Brig. Gen. Emmanuel Ebije Ikwue, GCON, Member
▪ Mr. Harold Samuel Tsumba, Esq., Member
The Committee met in accordance with the provisions of S 359 of CAMA and will present its report.
16. Auditors
The Auditors, Messrs. Nexia-Agbo Abel & Co. have indicated their willingness to contin-ue in office. A resolution will be proposed authorising the Directors to determine their remuneration.
17. Compliance with regulatory requirements
The Directors confirm that they have reviewed the structures and activities of the Company in view of the Code and the regulations of the NSE and the Securities and Exchange Commission (SEC), the Regulators. The Directors confirm that, to the best of their knowledge and as at the date of this report, the Company has been and is in substantial compliance with the provisions of the Code and the regulatory requirements of the Regulators.
By order of the Board,
Mrs. Cecilia Ekanem Madueke Company Secretary
10 Shettima A. Munguno CrescentUtako 900 108 | FCT Abuja
March 17, 2016
27
Julius Berger Nigeria Plc AR & FS 2015 | Directors’ Report
Back to Contents

Corporate Governance
The Board and Management of Julius Berger Nigeria Plc have put in place struc-tures, procedures and systems to ensure substantial compliance with CAMA, its Memorandum and Articles of Associa-tion, the Code and the requirements of all Regulators.
The Corporate Governance structures, procedures and systems are premised on dynamism.
1. The Board of Directors
As at December 31, 2015, the Board comprised of eleven members, seven of whom were Non-Executive Directors, one of whom is the Chairman and another the Independent Director, and four Execu-tive Directors. Profiles of the Directors, in particular the Directors standing for election and re- election, are stated on pages 14 and 15 in this document.
The Board meets at least once every quar-ter as the needs of the Company may de-termine. There is provision in the Articles of Association for meetings of the Board or its Committees by electronic communica-tions as well as decisions of the Board or Committees by resolutions in writing.
The Board met four times in the financial year 2015. Attendance by the Directors was as stated on page 29.
Apart from the legal and regulatory require-ments, there are no specific requirements for qualification for board membership. However, the Company strives to ensure
the right mix that is necessary to effectively discharge board functions. Directors are appointed to the Board by the shareholders in General Meeting.
The Board reserves to itself certain powers, duties and responsibilities and has dele-gated authority and responsibility for the day to day running of the Company to the Managing Director ably assisted by the Ex-ecutive Management.
In line with global best practice, the roles of the Chairman and Managing Director are separate and clearly defined. The Chair-man is responsible for board leadership whilst the Managing Director is responsible for the day to day running of the Company, on behalf of the Board.
In discharging its oversight responsibilities, the Board makes use of various commit-tees, standing and ad-hoc. Each commit-tee has an in-depth focus on a particu-lar area of the Board’s responsibility and provides informed feedback and advice to the Board. The activities of each of the board committees relate to the affairs of the Group and are guided by the various objectives and stated terms of references of the committees.
The Board has access to the advice and services of the Company Secretary who provides a point of reference and support for all Directors and, if required, the ad-vice and services of other professionals where such advice will improve the qual-ity of their contribution to Board decision making.
28
Julius Berger Nigeria Plc AR & FS 2015 | Corporate Governance

Director
Designation March 18, 2015
June 16, 2015
September 29, 2015
December 10, 2015
AVM (Dr.) Mohammed Nurudeen Imam, CFR Chairman ▪ ▪ ▪ ▪
Engr. Heinz Stockhausen Vice Chairman ▪ ▪ ▪ ▪
HRH Igwe Peter Nwokike Anugwu, JP, OFR Independent Director ▪ ▪ ▪ ▪
Engr. Jafaru Damulak Director ▪ ▪ ▪ ▪
Mr. Macdonald Olarinde Tubi Director × × × ×
Mr. Harold Samuel Tsumba, Esq. Director ▪ ▪ ▪ ▪
Dr. Ernest Nnaemeka Azudialu-Obiejesi Director ▪ ▪ ▪ –
Mr. George Marks Acting Managing Director ▪ ▪ ▪ ▪
Mr. Mutiu Sunmonu, CON Director ▪ ▪ ▪ ▪
Engr. Detlev Lubasch Managing Director ▪ ▪ ▪ R
Engr. Wolfgang Goetsch Director ▪ ▪ ▪ ▪
Mr. Wolfgang Kollermann Financial Director ▪ ▪ ▪ ▪
Alhaji Zubairu Ibrahim Bayi Director Administration ▪ ▪ ▪ ▪
Mr. David Herron Director Operations ▪ ▪ ▪ ▪
Key: ▪ Present – Absent with apologies × Mr. Macdonald Olarinde Tubi passed away on February 17, 2015 R Resigned
The following standing committees which are tailored to the Company’s businesses have been established:
1.1 Risk and Asset Management Com-mittee (Formerly Project Review and Logistics Committee)
This committee is responsible for:
▪ The review and evaluation of real estate needs of the Group
▪ The review and evaluation of the financing needs of the Group
▪ The review and evaluation of investment made by the Group
▪ Evaluation and approval of third party arrangements
▪ Approval of projects and the underlying proposals
This committee met five times in the finan-cial year ended December 31, 2015. The membership of the committee and the attendance by members at meetings were as follows on page 30:
29
Julius Berger Nigeria Plc AR & FS 2015 | Corporate Governance
Back to Contents

1.2 Board Audit Committee
This committee is responsible for:
▪ The review and integrity of financial state-ments of the Company, including the annual, half-year and quarterly reports and accounts
▪ The review and implementation of the Company’s internal control and financial control systems and approved policies
▪ Ensuring that the internal audit function of the Company is established and objective
▪ Overseeing the risk management systems ▪ The review of the whistle blowing struc-tures and policies of the Company
▪ The review and approval of the Company’s CSR obligations
▪ The oversight of related party disclosures
Risk and Asset Management Committee
Designation February 5, 2015
March 17, 2015
June 16, 2015
September 28, 2015
December 9, 2015
Mr. Macdonald Olarinde Tubi – Chairman of the commit-tee until February 17, 2015
Chairman ▪ × × × ×
Mr. Mutiu Sunmonu, CON – appointed Chairman of the committee on September 28, 2015
Chairman / / / ▪ ▪
Mr. George Marks Member ▪ ▪ ▪ ▪ ▪
Engr. Wolfgang Goetsch Member ▪ ▪ ▪ ▪ ▪
Engr. Detlev Lubasch Member / / ▪ ▪ ▪
Mr. Wolfgang Kollermann Member ▪ ▪ ▪ ▪ ▪
Key: • Present × Mr. Macdonald Olarinde Tubi passed away on February 17, 2015 / Not yet appointed
This committee met four times in the finan-cial year ended December 31, 2015. The membership of the committee and the at-tendance by members at meetings were as stated on page 31.
Members of Management are invited to attend to brief the committee on agenda items related to their areas of responsibili-ties from time to time.
30
Julius Berger Nigeria Plc AR & FS 2015 | Corporate Governance

This committee met three times in the financial year ended December 31, 2015. The membership of the committee and the attendance by members at meetings were as stated above.
The Remuneration Committee of the Board is comprised only of Non-Executive Direc-tors.
Risk and Asset Management Committee
Designation February 5, 2015
March 17, 2015
June 16, 2015
September 28, 2015
December 9, 2015
Mr. Macdonald Olarinde Tubi – Chairman of the commit-tee until February 17, 2015
Chairman ▪ × × × ×
Mr. Mutiu Sunmonu, CON – appointed Chairman of the committee on September 28, 2015
Chairman / / / ▪ ▪
Mr. George Marks Member ▪ ▪ ▪ ▪ ▪
Engr. Wolfgang Goetsch Member ▪ ▪ ▪ ▪ ▪
Engr. Detlev Lubasch Member / / ▪ ▪ ▪
Mr. Wolfgang Kollermann Member ▪ ▪ ▪ ▪ ▪
Key: • Present × Mr. Macdonald Olarinde Tubi passed away on February 17, 2015 / Not yet appointed
Board Audit Committee
Designation January 27, 2015
April 28, 2015
July 23, 2015
October 28, 2015
HRH Igwe Peter Nwokike Anugwu, JP, OFR Chairman ▪ ▪ ▪ ▪
Engr. Jafaru Damulak Member ▪ ▪ ▪ ▪
Mr. Harold Samuel Tsumba, Esq. Member ▪ ▪ ▪ ▪
Key: ▪ Present
Remuneration Committee
Designation March 18, 2015
September 29, 2015
December 8, 2015
Engr. Heinz Stockhausen Chairman ▪ ▪ ▪
Engr. Jafaru Damulak Member ▪ ▪ ▪
Key: ▪ Present
1.3 Remuneration Committee
This committee is responsible for:
▪ Top level establishment issues particular-ly on selection, appraisal, compensation and corporate succession planning, mat-ters relating to board(s) nominations and appointments, composition, performance and appraisal
▪ Remuneration and reward-based budget-ing and strategies
▪ Review and establishment of human relations policies
31
Julius Berger Nigeria Plc AR & FS 2015 | Corporate Governance
Back to Contents

2. Statutory Audit Committee
This committee is a statutory creation, es-tablished in strict compliance with S 359 (3) of CAMA and whose role has been expand-ed by the expectations of the Code.
The committee’s responsibilities are also stated in S 359 of CAMA.
Membership of the committee is comprised of three shareholders and three directors who were appointed for the financial year 2015 at the AGM held on June 17, 2015.
This committee met three times in the financial year ended December 31, 2015. The mem-bership of the committee and the attend-ance by members in the financial year ended December 31, 2015, were as stated above.
The chairman of this committee is always a shareholder.
Members of Management are invited to attend to brief the committee on agenda items related to their areas of responsibili-ties from time to time.
All the committees report directly to the Board regarding committee activities, issues and related recommendations and decisions, while the Audit Committee is fur-ther required to issue a report to the share-holders in the terms specified by CAMA.
Save for the Statutory Audit Committee, the Board has the sole responsibility for deter-mining the responsibility, membership and chair of these committees.
Statutory Audit Committee Designation
March 17, 2015
July 22, 2015
December 9, 2015
Brig. Gen. Emmanuel Ebije Ikwue, GCON – Chairman of the committee until July 22, 2015
Chairman / Member ▪ ▪ ▪
Chief Timothy Ayobami Adesiyan – Appointed Chairman of the committee on July 22, 2015
Chairman ▪ ▪ ▪
Sir Sunday Nnamdi Nwosu, KSS Member ▪ ▪ ▪
HRH Igwe Peter Nwokike Anugwu, JP, OFR Member ▪ ▪ ▪
Mr. Macdonald Olarinde Tubi Member × × ×
Mr. Wolfgang Kollermann Member ▪ ▪ ▪
Mr. Harold Samuel Tsumba, Esq. Member / ▪ ▪
Key: ▪ Present × Mr. Macdonald Olarinde Tubi passed away on February 17, 2015 / Not yet appointed
32
Julius Berger Nigeria Plc AR & FS 2015 | Corporate Governance

3. The shareholders
The Board of Directors is accountable to shareholders for its performance and that of the Company.
Shareholders have the opportunity at Mem-bers General Meetings, duly convened according to the requirements of the CAMA, and other informal fora, to review the activi-ties of both the Company and the Directors and express their opinion thereon.
Attendance of Directors at Shareholder Meeting June 17, 2015
AVM (Dr.) Mohammed Nurudeen Imam, CFR ▪
Engr. Heinz Stockhausen ▪
HRH Igwe Peter Nwokike Anugwu, JP, OFR ▪
Engr. Jafaru Damulak ▪
Mr. Macdonald Olarinde Tubi ×
Mr. Harold Samuel Tsumba, Esq. ▪
Dr. Ernest Nnaemeka Azudialu-Obiejesi –
Mr. George Marks ▪
Engr. Wolfgang Goetsch ▪
Mr. Mutiu Sunmonu, CON ▪
Engr. Detlev Lubasch ▪
Mr. Wolfgang Kollermann ▪
Alhaji Zubairu Ibrahim Bayi ▪
Mr. David Herron ▪
Key: ▪ Present – Absent with apologies × Mr. Macdonald Olarinde Tubi passed away on February 17, 2015
In the financial year 2015, the mem-bers met in Annual General Meeting on June 17, 2015. 231 shareholders, 30 prox-ies and 201 observers, representatives of Regulators and members of the Press were present at the Meeting. Attendance by the Directors was as stated above.
33
Julius Berger Nigeria Plc AR & FS 2015 | Corporate Governance
Back to Contents

4. The Management
Management is responsible for the day to day management of the Company and is accountable to the Board for its perfor-mance and implementation of strategy and policies.
Management consists of four Executive Di-rectors, as well as the Heads of Divisions and Departments. Management executes its responsibilities within the limits set for it by the Board, which periodically reviews its performance.
5. Subsidiary governance
Through the establishment of systems and processes, all companies in the Group reflect the same values, ethics, controls and processes while remaining independent in the conduct of business and compliance with extant regulations.
6. Specific disclosure requirements of the Regulators
6.1 Insider trading and price sensitive information
In relation to dealings in the shares of the Company, Julius Berger Nigeria Plc has a Securities Trading Policy approved by the Board on March 18, 2015 regarding securities transactions by its employees and Directors and their connected persons as well as those in possession of market sensitive information on terms no less exacting than the required standards set out in the Rules of the NSE. The Directors and employees, in the financial year 2015, complied with the required standard set out in the Rules and in the Securities Trading Policy.
6.2 Complaints management frame-work
In compliance with the rules and regula-tions of the SEC and NSE, the Company, Julius Berger Nigeria Plc, has in place a Complaints Management Policy approved by the Board on September 29, 2015 which establishes procedures for the complaints management process in the Group.
Both documents are published on and can be downloaded from the website of the Company at www.julius-berger.com.
34
Julius Berger Nigeria Plc AR & FS 2015 | Corporate Governance

35 Back to Contents

Risk Management
Julius Berger Nigeria Plc and its subsidiar-ies’ Risk Management System provides a flexible framework for proactive identifica-tion, documentation assessment and con-trol of risk exposure. The system includes analysis and monitoring mechanisms to support prudent decisions regarding risks and is minimising potential negative impact on the Group’s business. Identified risks, which pose the most threat, in terms of both likelihood and consequence, are as follows:
Market risk
Julius Berger Nigeria Plc and the majori-ty of its subsidiaries work in Nigeria and for Nigeria. As such, the business of the Group is
largely influenced by the general economic situation and financial framework of the country. As an emerging market, political and social challenges play a major role in the market situation of Nigeria. Macro-economic and global economics also have an influence. Credit and liquidity risks, foreign currency and interest rate risks, along with the developing legal framework of industry specific legislation, ordinances and regulations are market risks that must be addressed with special focus. Such risk exposures are managed and counter-balanced through various financial plan-ning and monitoring instruments, including a high degree of diversification and a medium- low risk predictive portfolio profile.
36
Julius Berger Nigeria Plc AR & FS 2015 | Risk Management
“Julius Berger Nigeria Plc Risk Management System holistically identifies the likelihood of risks, analyses and determines their impacts and supports the development of appropriate management response”
Operational risk
The construction industry is inherently a complex and dynamic environment, in-volving multiple processes, participants and organisations, resulting in high operational risks. Beyond growing competition in the industry, operational risks in the acquisition phase of projects include the selection of clients, the establishment of subsequent conditions such as contractual parame-ters, the project-specific competence and capacity of the Group as well as payment planning and security. In the execution phase, procurement of materials and ma-chinery, logistics and human resources, as well as environmental factors, must be assessed and managed. A project-con-trolling framework has been established to regulate such risks. Contracts are contin-uously subjected to thorough commercial, technical and legal examination throughout the life of the project.
Legal risk
Julius Berger Nigeria Plc and its subsidiaries maintain a high level of awareness to miti-gate and manage legal risks in the Group’s activities. All business activities abide by Ni-gerian law and regulation. Additionally, the Group’s Compliance System has set regu-lations and targets to identify non-compliant events, which are actively confronted and scrutinised. This includes implementation of a Complaints Management and Whistle Blowing Policy, which provide opportunity for all employees and business partners to raise genuine concerns, in good faith, with-out fear of reprisals. This system assures
that all reported irregularities are seriously investigated as appropriate.
Information technology risk
Julius Berger Nigeria Plc and its subsidiar-ies have adopted systems to meet the fun-damental objective of ensuring the security, confidentiality, integrity and availability of its information assets. In order to prevent unauthorised access or data loss and to guarantee the permanent availability of the Group’s systems, resources are allocated to technical installations that protect the Group’s information technology. Information technology structures are largely standard-ised, software products in use are those of leading producers and applicable secu-rity guidelines are regularly adapted to the latest technical developments.
Environmental and reputational risk
Accidents on a project site, damage to the environment, actual or alleged deficits and errors in the Group’s performance as well as compliance violations are risks that could affect the financial situation of Julius Berger Nigeria Plc and its subsid-iaries and / or damage the Group’s rep-utation. Julius Berger Nigeria Plc and its subsidiaries counteract the risk of reputa-tional damage through open communica-tion and cooperation with clients and host communities. Through the implementation and prioritisation of Quality Management Systems and HSE Policies, effective social and environmental risk management prac-tices across all activities, products and ser-vices are maintained.
37
Julius Berger Nigeria Plc AR & FS 2015 | Risk Management
Back to Contents

Julius Berger International GmbH
Julius Berger International GmbH (JBI) is a design and engineering company locat-ed in Wiesbaden, Germany. As a wholly owned subsidiary of Julius Berger Nigeria Plc, JBI provides comprehensive services for construction projects ranging in size and complexity, in the areas of building, infra-structure, and industry, both for the Group’s business in Nigeria and for international third party clients. JBI’s high quality stand-ards, technological expertise, and a 120-year tradition are the keys to its success.

Financial Information for the Year Ended December 31, 2015
39 Back to Contents

Statement of
Directors’ Responsibilities
By the provisions of S 334 and S 335 of CAMA, the Directors are responsible for the preparation of Financial Statements which give a true and fair view of the state of affairs of the Group, and of the profit or loss at the end of each financial year. The Directors are required by the provisions of the Code to issue this statement in connection with the preparation of the Financial Statements for the year ended December 31, 2015.
In compliance with the provisions of CAMA, the Directors must ensure that:
▪ Proper accounting records are maintained. ▪ Applicable accounting standards are fol-lowed.
▪ Suitable accounting policies are adopted and consistently applied.
▪ Judgement and estimates made are reasonable and prudent.
▪ The going concern basis is used, unless it is inappropriate to presume that the Group will continue in business.
▪ Internal control procedures are instituted, which as far as is reasonably possible, are adequate, safeguard the assets and prevent and detect fraud and other irreg-ularities.
The Directors accept responsibility for the preparation of these Financial Statements, which have been prepared in compliance with:
▪ the provisions of CAMA; ▪ the provisions of the Financial Report-ing Council of Nigeria (FRCN), Act No. 6 of 2011;
▪ the published accounting and financial reporting standard issued by the FRCN;
▪ the regulations of the SEC and ▪ the regulations and listing requirements of the NSE.
The Directors have made an assessment of the Group’s ability to continue as a going concern based on the supporting assump-tions stated in the Financial Statements and have every reason to hold that the Group will remain a going concern in the financial year ahead.
Julius Berger Nigeria Plc AR & FS 2015 | Statement of Directors’ Responsibilities
Signed on behalf of the Board of Directors by,
AVM (Dr.) Mohammed Nurudeen Imam, CFR ChairmanFRC / 2014 / NSE / 00000006483
Mr. Wolfgang KollermannFinancial DirectorFRC / 2012 / ANAN / 00000000396
March 17, 2016
Engr. Wolfgang Götsch DirectorFRC / 2014 / NSE / 00000006484
40

Certification of
Financial Statements
Pursuant to Section 7 (2) of the FRCN Act, 2011, we have reviewed the Annual Reports and Financial Statements of Julius Berger Nigeria Plc and its consolidated subsidiar-ies for the year ended December 31, 2015.
Based on our knowledge, our Financial Statements do not contain any untrue statement of a material fact or omit to state a material fact necessary and are not mis-leading with respect to the period covered by the report.
The Code of Ethics and Statement of Busi-ness Practices formulated by the Board has been implemented as part of the cor-porate governance practices of the Group throughout the period of intended reliance, and the Directors and Key Executives of the Group had acted honestly, in good faith and in the best interests of the whole Group.
Our Financial Statements, and other financial information included therein, fairly present in all material respects the financial condition, results of operations and cash flows of the Group as of, and for, the period presented in the Financial Statements.
We are responsible for designing the internal controls and procedures surrounding the financial reporting process and assessing these controls (as required by Section 7 (2) (f) of the FRCN Act, 2011) and have designed such internal controls and procedures, or caused such controls and procedures to be designed under our supervision, to en-sure that material information relating to the Group is made known to us by others within those entities, particularly during the period in which this report is being prepared. The controls, which are properly designed, have been operating effectively in the period of intended reliance.
Based on the foregoing, we, the under-signed, hereby certify that to the best of our knowledge and belief the information contained in the Financial Statements of our Group for the year ended December 31, 2015, appear to be true, correct and up to date.
Julius Berger Nigeria Plc AR & FS 2015 | Certification of Financial Statements
AVM (Dr.) Mohammed Nurudeen Imam, CFR ChairmanFRC / 2014 / NSE / 00000006483
Mr. Wolfgang KollermannFinancial DirectorFRC / 2012 / ANAN / 00000000396
March 17, 2016
Engr. Wolfgang Götsch DirectorFRC / 2014 / NSE / 00000006484
Mr. Wolfgang KollermannFinancial DirectorFRC / 2012 / ANAN / 00000000396
March 17, 2016 41 Back to Contents

In compliance with S 359 (6) of CAMA, we, the members of the Statutory Audit Com-mittee whose names are stated hereunder, have reviewed and considered the Auditor’s Report required to be made in accordance with S 359 (3) of CAMA, the consolidated audited Financial Statements of the Group for the year ended December 31, 2015, and the reports thereon, confirm as follows:
▪ The accounting and reporting policies of the Group are in accordance with legal requirements and agreed ethical practices.
▪ The scope and planning of audit require-ment were in our opinion adequate.
▪ We have reviewed the findings on Man-agement matters, in conjunction with the External Auditors, and are satisfied with the response of Management thereon.
▪ The systems of accounting and internal controls for the Group are adequate.
▪ We have made the recommendations required to be made in respect of the External Auditors.
Members of the Audit Committee
▪ Chief Timothy Ayobami Adesiyan ▪ Brig. Gen. Emmanuel Ebije Ikwue, GCON ▪ Sir Sunday Nnamdi Nwosu, KSS ▪ HRH Igwe Peter Nwokike Anugwu, JP, OFR
▪ Mr. Wolfgang Kollermann ▪ Mr. Harold Samuel Tsumba, Esq.
Signed on behalf of the Committee by,
Chief Timothy Ayobami Adesiyan Chairman of the Statutory Audit CommitteeFRC / 2014 / IODN / 00000003745
March 16, 2016
Report of the
Audit Committee
42
Julius Berger Nigeria Plc AR & FS 2015 | Report of the Audit Committee

Report of the
Independent Auditors
4343
Julius Berger Nigeria Plc AR & FS 2015 | Report of the Independent Auditors
Back to Contents
Note Group 31/12/2015
₦ 000
Group 31/12/2014
₦ 000
Company 31/12/2015
₦ 000
Company 31/12/2014
₦ 000
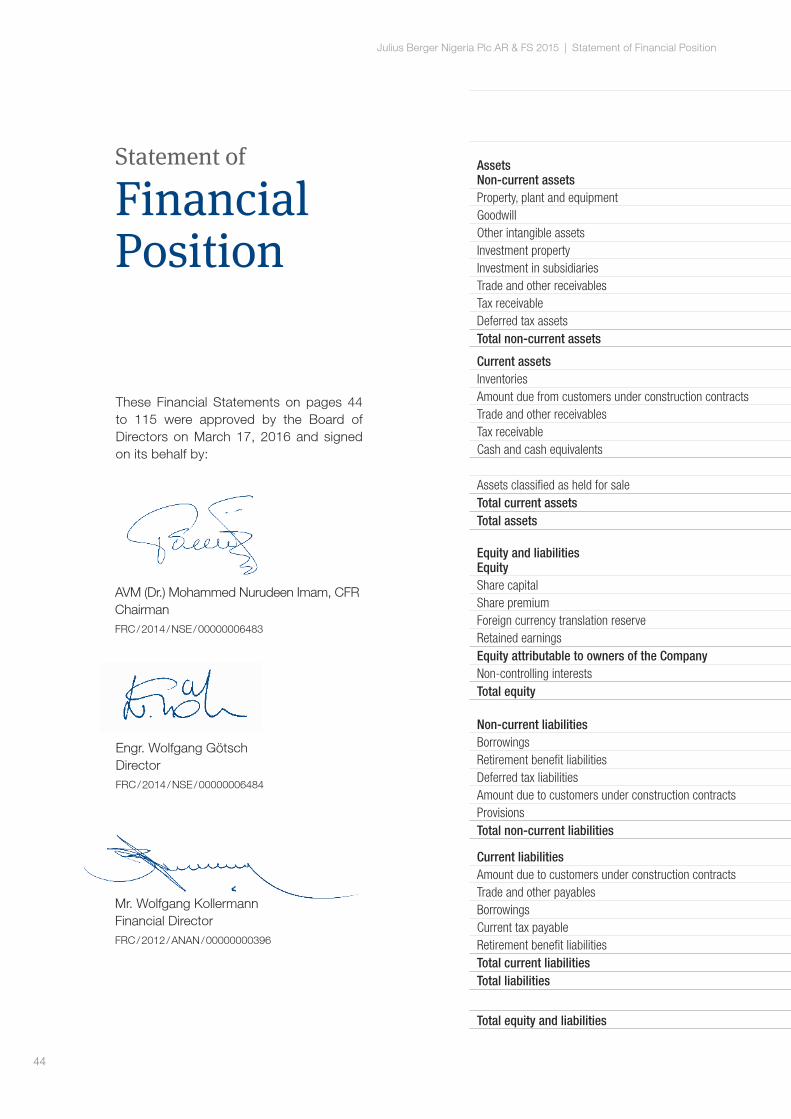
Assets Non-current assetsProperty, plant and equipment 14 58,376,513 68,369,671 55,470,657 66,711,736 Goodwill 16.1 5,041,184 4,606,412 – – Other intangible assets 16.2 32,712 77,402 – – Investment property 17 2,546,436 2,648,412 2,546,436 2,648,412 Investment in subsidiaries 18 – – 15,193,398 13,131,581 Trade and other receivables 21 844,122 2,334,764 844,122 1,622,353 Tax receivable 22 21,039,915 35,060,509 20,273,902 34,272,482 Deferred tax assets 12.3 10,087,301 8,041,407 9,874,831 7,867,780 Total non-current assets 97,968,183 121,138,577 104,203,346 126,254,344
Current assetsInventories 19 11,110,116 12,111,830 8,938,423 9,799,988 Amount due from customers under construction contracts 20 27,228,427 29,122,120 27,204,457 29,122,120 Trade and other receivables 21 88,634,246 63,425,208 90,554,805 66,572,663 Tax receivable 22 5,292,205 5,575,112 5,235,578 5,465,675 Cash and cash equivalents 13,360,038 23,473,159 10,148,623 11,716,041
145,625,032 133,707,429 142,081,886 122,676,487 Assets classified as held for sale 15 1,493,055 1,199,775 1,472,823 1,182,781 Total current assets 147,118,087 134,907,204 143,554,709 123,859,268 Total assets 245,086,270 256,045,781 247,758,055 250,113,612 Equity and liabilities EquityShare capital 23 660,000 660,000 660,000 660,000 Share premium 23 425,440 425,440 425,440 425,440 Foreign currency translation reserve 419,755 919,411 – – Retained earnings 22,729,580 23,420,332 17,573,012 18,480,712 Equity attributable to owners of the Company 24,234,775 25,425,183 18,658,452 19,566,152 Non-controlling interests 57,180 670,660 – – Total equity 24,291,955 26,095,843 18,658,452 19,566,152
Non-current liabilitiesBorrowings 25 – 3,201,710 – 3,201,710 Retirement benefit liabilities 26.2 1,853,781 1,996,506 1,420,945 1,606,929 Deferred tax liabilities 12.3 12,989,322 13,220,121 12,568,459 12,933,842 Amount due to customers under construction contracts 20.1 106,971,355 93,690,330 111,344,506 93,690,330 Provisions 28 404,308 2,135,994 300,000 –Total non-current liabilities 122,218,766 114,244,661 125,633,910 111,432,811
Current liabilitiesAmount due to customers under construction contracts 20.1 32,912,602 35,188,722 28,737,461 33,629,161 Trade and other payables 27 34,596,825 42,138,848 44,125,695 47,792,490 Borrowings 25 24,807,936 34,809,060 24,807,936 34,809,060 Current tax payable 12.2 6,106,748 3,473,353 5,770,100 2,843,786 Retirement benefit liabilities 26.1 151,438 95,294 24,501 40,152 Total current liabilities 98,575,549 115,705,277 103,465,693 119,114,649 Total liabilities 220,794,315 229,949,938 229,099,603 230,547,460
Total equity and liabilities 245,086,270 256,045,781 247,758,055 250,113,612
Statement of
Financial Position
These Financial Statements on pages 44 to 115 were approved by the Board of Directors on March 17, 2016 and signed on its behalf by:
Mr. Wolfgang Kollermann Financial DirectorFRC / 2012 / ANAN / 00000000396
AVM (Dr.) Mohammed Nurudeen Imam, CFR ChairmanFRC / 2014 / NSE / 00000006483
Engr. Wolfgang Götsch DirectorFRC / 2014 / NSE / 00000006484
44
Julius Berger Nigeria Plc AR & FS 2015 | Statement of Financial Position

Note Group 31/12/2015
₦ 000
Group 31/12/2014
₦ 000
Company 31/12/2015
₦ 000
Company 31/12/2014
₦ 000
Assets Non-current assetsProperty, plant and equipment 14 58,376,513 68,369,671 55,470,657 66,711,736 Goodwill 16.1 5,041,184 4,606,412 – – Other intangible assets 16.2 32,712 77,402 – – Investment property 17 2,546,436 2,648,412 2,546,436 2,648,412 Investment in subsidiaries 18 – – 15,193,398 13,131,581 Trade and other receivables 21 844,122 2,334,764 844,122 1,622,353 Tax receivable 22 21,039,915 35,060,509 20,273,902 34,272,482 Deferred tax assets 12.3 10,087,301 8,041,407 9,874,831 7,867,780 Total non-current assets 97,968,183 121,138,577 104,203,346 126,254,344
Current assetsInventories 19 11,110,116 12,111,830 8,938,423 9,799,988 Amount due from customers under construction contracts 20 27,228,427 29,122,120 27,204,457 29,122,120 Trade and other receivables 21 88,634,246 63,425,208 90,554,805 66,572,663 Tax receivable 22 5,292,205 5,575,112 5,235,578 5,465,675 Cash and cash equivalents 13,360,038 23,473,159 10,148,623 11,716,041
145,625,032 133,707,429 142,081,886 122,676,487 Assets classified as held for sale 15 1,493,055 1,199,775 1,472,823 1,182,781 Total current assets 147,118,087 134,907,204 143,554,709 123,859,268 Total assets 245,086,270 256,045,781 247,758,055 250,113,612 Equity and liabilities EquityShare capital 23 660,000 660,000 660,000 660,000 Share premium 23 425,440 425,440 425,440 425,440 Foreign currency translation reserve 419,755 919,411 – – Retained earnings 22,729,580 23,420,332 17,573,012 18,480,712 Equity attributable to owners of the Company 24,234,775 25,425,183 18,658,452 19,566,152 Non-controlling interests 57,180 670,660 – – Total equity 24,291,955 26,095,843 18,658,452 19,566,152
Non-current liabilitiesBorrowings 25 – 3,201,710 – 3,201,710 Retirement benefit liabilities 26.2 1,853,781 1,996,506 1,420,945 1,606,929 Deferred tax liabilities 12.3 12,989,322 13,220,121 12,568,459 12,933,842 Amount due to customers under construction contracts 20.1 106,971,355 93,690,330 111,344,506 93,690,330 Provisions 28 404,308 2,135,994 300,000 –Total non-current liabilities 122,218,766 114,244,661 125,633,910 111,432,811
Current liabilitiesAmount due to customers under construction contracts 20.1 32,912,602 35,188,722 28,737,461 33,629,161 Trade and other payables 27 34,596,825 42,138,848 44,125,695 47,792,490 Borrowings 25 24,807,936 34,809,060 24,807,936 34,809,060 Current tax payable 12.2 6,106,748 3,473,353 5,770,100 2,843,786 Retirement benefit liabilities 26.1 151,438 95,294 24,501 40,152 Total current liabilities 98,575,549 115,705,277 103,465,693 119,114,649 Total liabilities 220,794,315 229,949,938 229,099,603 230,547,460
Total equity and liabilities 245,086,270 256,045,781 247,758,055 250,113,612
45
Julius Berger Nigeria Plc AR & FS 2015 | Statement of Financial Position
Back to Contents

Statement of
Profit or Loss and Other Comprehensive Income
Note Group 31/12/2015
₦ 000
Group 31/12/2014
₦ 000
Company 31/12/2015
₦ 000
Company 31/12/2014
₦ 000
Revenue 6 133,807,574 196,808,632 119,242,541 179,978,707
Cost of sales (100,473,106) (146,313,712) (81,209,011) (141,389,527)
Gross profit 33,334,468 50,494,920 38,033,530 38,589,180
Marketing expenses (75,140) (116,879) (66,355) (116,276)
Administrative expenses (21,445,734) (31,497,145) (30,650,717) (25,463,946)
Operating profit 11,813,594 18,880,896 7,316,458 13,008,958
Investment income 7 139,763 405,811 3,678,068 2,574,339
Other gains and losses 8 695,388 (170,361) 1,388,584 403,872
Finance cost 9 (6,148,772) (5,981,450) (6,148,772) (5,958,645)
Profit before tax 10 6,499,973 13,134,896 6,234,338 10,028,524
Income tax expense 12.1 (4,059,833) (4,894,917) (3,397,666) (3,298,407)
Profit for the year 2,440,140 8,239,979 2,836,672 6,730,117
Other comprehensive income for the year net taxes
Actuarial gains on retirement benefits (180,372) (234,303) (180,372) (234,303)
Irreversible to income statement
Differences on translating foreign operations (499,656) 257,239 – –
Total comprehensive income 1,760,112 8,262,915 2,656,300 6,495,814
Attributable to
Owners of the Company 1,759,887 8,088,795 2,656,300 6,495,814
Non-controlling interests 225 174,120 – –
Total comprehensive income 1,760,112 8,262,915 2,656,300 6,495,814
Earnings per share
Basic earnings per share 13 1.33 6.13 2.01 4.92
Diluted earnings per share 13 1.33 6.13 2.01 4.92
46
Julius Berger Nigeria Plc AR & FS 2015 | Statement of Profit or Loss and Other Comprehensive Income

Note Group 31/12/2015
₦ 000
Group 31/12/2014
₦ 000
Company 31/12/2015
₦ 000
Company 31/12/2014
₦ 000
Revenue 6 133,807,574 196,808,632 119,242,541 179,978,707
Cost of sales (100,473,106) (146,313,712) (81,209,011) (141,389,527)
Gross profit 33,334,468 50,494,920 38,033,530 38,589,180
Marketing expenses (75,140) (116,879) (66,355) (116,276)
Administrative expenses (21,445,734) (31,497,145) (30,650,717) (25,463,946)
Operating profit 11,813,594 18,880,896 7,316,458 13,008,958
Investment income 7 139,763 405,811 3,678,068 2,574,339
Other gains and losses 8 695,388 (170,361) 1,388,584 403,872
Finance cost 9 (6,148,772) (5,981,450) (6,148,772) (5,958,645)
Profit before tax 10 6,499,973 13,134,896 6,234,338 10,028,524
Income tax expense 12.1 (4,059,833) (4,894,917) (3,397,666) (3,298,407)
Profit for the year 2,440,140 8,239,979 2,836,672 6,730,117
Other comprehensive income for the year net taxes
Actuarial gains on retirement benefits (180,372) (234,303) (180,372) (234,303)
Irreversible to income statement
Differences on translating foreign operations (499,656) 257,239 – –
Total comprehensive income 1,760,112 8,262,915 2,656,300 6,495,814
Attributable to
Owners of the Company 1,759,887 8,088,795 2,656,300 6,495,814
Non-controlling interests 225 174,120 – –
Total comprehensive income 1,760,112 8,262,915 2,656,300 6,495,814
Earnings per share
Basic earnings per share 13 1.33 6.13 2.01 4.92
Diluted earnings per share 13 1.33 6.13 2.01 4.92
47
Julius Berger Nigeria Plc AR & FS 2015 | Statement of Profit or Loss and Other Comprehensive Income
Back to Contents

Statement of
Changes in Equity
Group Share capital
₦ 000
Share premium
₦ 000
Foreign currency translation
reserve₦ 000
Retained earnings
₦ 000
Attributable to owners of the
Company₦ 000
Attributable to non-controlling
interest₦ 000
Total equity
₦ 000
Balance at January 1, 2015 660,000 425,440 919,411 23,420,332 25,425,183 670,660 26,095,843
Profit for the year – – – 2,439,915 2,439,915 225 2,440,140
Other comprehensive income (net of tax) – – (499,656) (180,372) (680,028) – (680,028)
Total comprehensive income – – (499,656) 2,259,543 1,759,887 225 1,760,112
Issued share capital – – – – – – –
Issued share capital (subsidiaries – non-controlling interest) – – – 613,705 613,705 (613,705) –
Dividends to shareholders – – – (3,564,000) (3,564,000) – (3,564,000)
Balance at December 31, 2015 660,000 425,440 419,755 22,729,580 24,234,775 57,180 24,291,955
Company Share capital
₦ 000
Share premium
₦ 000
Foreign currency translation
reserve₦ 000
Retained earnings
₦ 000
Attributable to owners of the
Company₦ 000
Attributable to non-controlling
interest₦ 000
Total equity
₦ 000
Balance at January 1, 2015 660,000 425,440 – 18,480,712 19,566,152 – 19,566,152
Profit for the year – – – 2,836,672 2,836,672 – 2,836,672
Other comprehensive income (net of tax) – – – (180,372) (180,372) – (180,372)
Total comprehensive income – – – 2,656,300 2,656,300 – 2,656,300
Issued share capital – – – – – – –
Dividends to shareholders – – – (3,564,000) (3,564,000) – (3,564,000)
Balance at December 31, 2015 660,000 425,440 – 17,573,012 18,658,452 – 18,658,452
48
Julius Berger Nigeria Plc AR & FS 2015 | Statement of Changes in Equity

Group Share capital
₦ 000
Share premium
₦ 000
Foreign currency translation
reserve₦ 000
Retained earnings
₦ 000
Attributable to owners of the
Company₦ 000
Attributable to non-controlling
interest₦ 000
Total equity
₦ 000
Balance at January 1, 2015 660,000 425,440 919,411 23,420,332 25,425,183 670,660 26,095,843
Profit for the year – – – 2,439,915 2,439,915 225 2,440,140
Other comprehensive income (net of tax) – – (499,656) (180,372) (680,028) – (680,028)
Total comprehensive income – – (499,656) 2,259,543 1,759,887 225 1,760,112
Issued share capital – – – – – – –
Issued share capital (subsidiaries – non-controlling interest) – – – 613,705 613,705 (613,705) –
Dividends to shareholders – – – (3,564,000) (3,564,000) – (3,564,000)
Balance at December 31, 2015 660,000 425,440 419,755 22,729,580 24,234,775 57,180 24,291,955
Company Share capital
₦ 000
Share premium
₦ 000
Foreign currency translation
reserve₦ 000
Retained earnings
₦ 000
Attributable to owners of the
Company₦ 000
Attributable to non-controlling
interest₦ 000
Total equity
₦ 000
Balance at January 1, 2015 660,000 425,440 – 18,480,712 19,566,152 – 19,566,152
Profit for the year – – – 2,836,672 2,836,672 – 2,836,672
Other comprehensive income (net of tax) – – – (180,372) (180,372) – (180,372)
Total comprehensive income – – – 2,656,300 2,656,300 – 2,656,300
Issued share capital – – – – – – –
Dividends to shareholders – – – (3,564,000) (3,564,000) – (3,564,000)
Balance at December 31, 2015 660,000 425,440 – 17,573,012 18,658,452 – 18,658,452
49
Julius Berger Nigeria Plc AR & FS 2015 | Statement of Changes in Equity
Back to Contents

Statement of
Cash FlowsNote Group
31/12/2015₦ 000
Group 31/12/2014
₦ 000
Company 31/12/2015
₦ 000
Company 31/12/2014
₦ 000
Cash flows from operating activities
Cash receipts from customers 159,503,327 214,395,243 131,940,871 148,985,178
Cash paid to suppliers and employees (150,117,935) (199,969,910) (116,985,876) (136,005,832)
Cash provided by operating activities 9,385,392 14,425,333 14,954,995 12,979,346
Cash paid for taxes (391,554) (509,473) (378,111) (500,110)
Net cash generated by operating activities 29 8,993,838 13,915,860 14,576,884 12,479,236
Cash flows from investing activities
Purchase of PPE 14 (3,527,214) (15,044,334) (2,036,091) (14,575,702)
Investment in subsidiary – – (2,061,817) (936,374)
Investment property – (1,929,688) – (1,929,688)
Interest received 7 139,763 405,811 139,763 256,600
Dividend received – – 3,538,305 2,317,739
Proceeds from disposal of PPE 3,349,496 2,053,277 3,344,542 2,033,947
Net cash used in investing activities (37,955) (14,514,934) 2,924,702 (12,833,478)
Cash flows from financing activities
Repayment of loans 25.2.1 (2,860,492) (3,303,027) (2,860,492) (3,303,027)
Interest paid 9 (6,148,772) (5,981,450) (6,148,772) (5,958,645)
Dividends paid (2,998,988) (3,103,988) (2,998,988) (3,103,988)
Net cash used in financing activities (12,008,252) (12,388,465) (12,008,252) (12,365,660)
Net (decrease) / increase in cash and cash equivalents (3,052,369) (12,987,539) 5,493,334 (12,719,902)
Cash and cash equivalents at beginning of year (8,395,529) 4,592,010 (20,152,647) (7,432,745)
Cash and cash equivalents at end of year 29.1 (11,447,898) (8,395,529) (14,659,313) (20,152,647)
Cash and cash equivalents consist of
Cash and bank balances 13,360,038 23,473,159 10,148,623 11,716,041
Borrowings (bank overdrafts) (21,526,346) (31,868,688) (21,526,346) (31,868,688)
Term loans (3,281,590) – (3,281,590) –
29.1 (11,447,898) (8,395,529) (14,659,313) (20,152,647)
50
Julius Berger Nigeria Plc AR & FS 2015 | Statement of Cash Flows

Note Group 31/12/2015
₦ 000
Group 31/12/2014
₦ 000
Company 31/12/2015
₦ 000
Company 31/12/2014
₦ 000
Cash flows from operating activities
Cash receipts from customers 159,503,327 214,395,243 131,940,871 148,985,178
Cash paid to suppliers and employees (150,117,935) (199,969,910) (116,985,876) (136,005,832)
Cash provided by operating activities 9,385,392 14,425,333 14,954,995 12,979,346
Cash paid for taxes (391,554) (509,473) (378,111) (500,110)
Net cash generated by operating activities 29 8,993,838 13,915,860 14,576,884 12,479,236
Cash flows from investing activities
Purchase of PPE 14 (3,527,214) (15,044,334) (2,036,091) (14,575,702)
Investment in subsidiary – – (2,061,817) (936,374)
Investment property – (1,929,688) – (1,929,688)
Interest received 7 139,763 405,811 139,763 256,600
Dividend received – – 3,538,305 2,317,739
Proceeds from disposal of PPE 3,349,496 2,053,277 3,344,542 2,033,947
Net cash used in investing activities (37,955) (14,514,934) 2,924,702 (12,833,478)
Cash flows from financing activities
Repayment of loans 25.2.1 (2,860,492) (3,303,027) (2,860,492) (3,303,027)
Interest paid 9 (6,148,772) (5,981,450) (6,148,772) (5,958,645)
Dividends paid (2,998,988) (3,103,988) (2,998,988) (3,103,988)
Net cash used in financing activities (12,008,252) (12,388,465) (12,008,252) (12,365,660)
Net (decrease) / increase in cash and cash equivalents (3,052,369) (12,987,539) 5,493,334 (12,719,902)
Cash and cash equivalents at beginning of year (8,395,529) 4,592,010 (20,152,647) (7,432,745)
Cash and cash equivalents at end of year 29.1 (11,447,898) (8,395,529) (14,659,313) (20,152,647)
Cash and cash equivalents consist of
Cash and bank balances 13,360,038 23,473,159 10,148,623 11,716,041
Borrowings (bank overdrafts) (21,526,346) (31,868,688) (21,526,346) (31,868,688)
Term loans (3,281,590) – (3,281,590) –
29.1 (11,447,898) (8,395,529) (14,659,313) (20,152,647)
51
Julius Berger Nigeria Plc AR & FS 2015 | Statement of Cash Flows
Back to Contents

Julius Berger Services Nigeria Ltd.
Julius Berger Services Nigeria Ltd. is a multi purpose terminal operator at the Warri Port. The company offers comprehensive handling and storage services for various types of cargo including stevedoring, stor-age and custom clearing, shipping services for import as well as export of goods to and from Nigeria. Julius Berger Services Nigeria follows national and international standards for terminal management. The company adheres to strict policies and procedures to increase productivity and guarantee reliable service excellence.

Notes to the
Financial Statements for the Year Ended December 31, 2015
53 Back to Contents
1. General information
Julius Berger Nigeria Plc was incorporated as a private limited liability company on Febru-ary 18, 1970. The Company subsequently converted to a public limited liability company and its shares became listed on the Nigerian Stock Exchange on September 20, 1991. It is registered in Nigeria with registration number 6852. The address of its registered office and principal place of business is disclosed in the introduction to the AR & FS. The principal activities of the Company and its subsidiaries are described in Notes 18 and 31.1 to the Financial Statements.
General Information
54
Julius Berger Nigeria Plc AR & FS 2015 | Notes to the Financial Statements

2. Application of new and revised International Financial Reporting Standards (IFRS)
2.1 Amendments to IFRSs and the new interpretation that are mandatorily effective for the year ended December 31, 2015
The following revisions to accounting standards and pronouncements were issued and effective at the reporting date:
Employee contributions (amendments to International Accounting Standards (IAS) 19) a
The amendments clarify how an entity should account for contributions made by employees or third parties that are linked to services to defined benefit plans, based on whether those contributions are dependent on the number of years of service provided by the employees. For contributions that are independent of the number of years of service, the entity may recognise the contribution as a reduction of the service cost in the period in which the related service is rendered, or attribute them to employees’ period of service either using the plan’s contribution formula or a straight-line basis. Whereas for contributions that are dependent on the number of years of service, the entity is required to attribute them to the employee’s periods of service.
Annual improvements to IFRSs
The annual improvements to IFRSs cycles include a number of amendments to various IFRSs.
Amendments to IFRSs 2010-2012 cycle b include:
▪ Amendments to IFRS 2 Share Based Payments ▪ Amendments to IFRS 3 Business Combinations ▪ Amendments to IFRS 8 Operating Segments ▪ Amendments to IFRS 13 Fair Value Measurement ▪ Amendments to IASs 16 and 38 PPE and Intangible Assets ▪ Amendments to IAS 24 Related Party Disclosure
Amendments to IFRSs 2011-2013 c cycle include:
▪ Amendments to IFRS 3 Business Combination ▪ Amendments to IFRS 13 Fair Value Measurement ▪ Amendments to IFRS 5 Non-current Assets Held for Sale and Discontinued Operations ▪ Amendments to IAS 40 Investment Property
Application of
IFRS Standards
Required to be implemented for periods beginning on or after a July 1, 2014b July 1, 2014c July 1, 2014
55
Julius Berger Nigeria Plc AR & FS 2015 | Notes to the Financial Statements
Back to Contents

The following revisions to accounting standards and pronouncements were issued but not effective at the reporting period (earlier application is permitted in some cases):
2.2 New and revised IFRSs that are not mandatorily effective (but allow early application) for the year ended December 31, 2015
IFRS 9 Financial Instruments d
IFRS 9 Financial Instruments issued in July 2014 is the International Accounting Standards Board’s (IASB) replacement of IAS 39 Financial Instruments: Recognition and Measure-ment. The IASB completed its project to replace IAS 39 in phases, introducing a fair val-ue through other comprehensive income measurement category for certain simple debt instruments. The completed IFRS 9 as revised in 2014 contains the requirements for:
▪ The classification and measurement of financial assets and liabilities ▪ Impairment methodology ▪ General hedge accounting
The version of IFRS 9 issued in 2014 supersedes all previous versions and is mandatorily effective for periods beginning on or after January 1, 2018, with early adoption permitted. For periods beginning before January 1, 2018, previous versions of IFRS 9 may be adopted provided the relevant date of initial application is before February 1, 2015.
IFRS 14 Regulatory Deferral Accounts e
IFRS 14 specifies the accounting for regulatory deferral account balances that arise from rate-regulated activities. The standard is available only to first-time adopters who recognise regulatory deferral account balances under previous Generally Accepted Accounting Prin-ciples (GAAP). IFRS 14 permits eligible first-time adopters of IFRSs to continue their previ-ous GAAP rate-regulated accounting policies, with limited changes and requires separate presentation of regulatory deferral account balances in the Statement of Financial Position and Statement of Profit or Loss and Other Comprehensive Income.
IFRS 15 Revenue from Contract with Customers f
This IFRS establishes a single comprehensive model for entities to use in accounting for revenue arising from contracts with customers. It is intended to supersede the following standards:
▪ IAS 18 Revenue ▪ IAS 11 Construction Contracts ▪ International Financial Reporting Interpretation Committee (IFRIC) 13 Customer Loyalty Programs
▪ IFRIC 15 Agreements for the Construction of Real Estate ▪ IFRIC 18 Transfer of Assets from Customers ▪ Standard Interpretation Committee (SIC) 31 Revenue Barter Transactions Involving Advertising Services
Required to be implemented for periods beginning on or after d January 1, 2018e January 1, 2016f January 1, 2018
56
Julius Berger Nigeria Plc AR & FS 2015 | Notes to the Financial Statements

The new standard introduces a 5-step approach to revenue recognition and measurement with more prescriptive guidance and requirements for extensive disclosures:
Step 1Identify the
contract with a customer
Step 2Identify the
performance obligation
Step 3Determine
the transaction price
Step 4Allocate price
to performance obligations
Step 5Recognise reve-nue if obligation
is satisfied
Accounting for acquisitions of interests in joint operations (amendments to IFRS 11) g
The amendments provide guidance on how to account for the acquisition of an interest in a joint operation in which the activities constitute a business as defined in IFRS 13 Business Combination. Specifically, the amendments state that the relevant principles on account-ing for business combinations in IFRS 13 and other standards (e.g. IAS 36 Impairment of Assets regarding impairment of cash generating unit to which goodwill on acquisition of a joint operation has been allocated) should be applied.
Clarification of acceptable methods of depreciation and amortisation (amendments to IAS 16 and IAS 38) h
Amendments to IAS 16 prohibit entities from using a revenue depreciation method for items of PPE while IAS 38 introduces a rebuttable presumption that revenue is not an appropri-ate basis for amortisation of an intangible asset. The presumption could only be rebutted in only two rare circumstances.
Equity method in separate financial statements (amendments to IAS 27) i
The amendment to IAS 27 is to permit investments in subsidiaries, joint ventures and as-sociates to be optionally accounted for using the equity method in the separate financial statements.
Sale or contribution of assets between an investor and its associate or joint venture (amendments to IFRS 10 and IAS 28) j
Amendments to IFRS 10 and IAS 28 clarify the treatment of the sale or contribution of asset from an investor to its associate or joint venture, as follows:
▪ Full recognition in the investor’s financial statements of gains and losses arising on the sale or contribution of assets that constitute a business (as defined in IFRS 3 Business Combination)
▪ Partial recognition of gains and losses where the assets do not constitute a business, i.e. a gain or loss is recognised only to the extent of the unrelated investors’ interests in that associate or joint venture
These requirements apply regardless of the legal form of transaction, e.g. whether the sale or contribution of assets occurs by an investor transferring shares in a subsidiary that holds the assets (resulting in loss of control of the subsidiary), or by direct sale of the assets themselves.
Required to be implemented for periods beginning on or after g January 1, 2016h January 1, 2016i January 1, 2016j January 1, 2016
57
Julius Berger Nigeria Plc AR & FS 2015 | Notes to the Financial Statements
Back to Contents

Bearer plants (amendments to IAS 16 and IAS 41) k
The amendments define bearer plant and require biological assets that meet the definition of a bearer plant to be accounted for as PPE in accordance with IAS 16, instead of IAS 41. Also, bearer plants can be measured using either cost model or the revaluation models set out in IAS 16.
Disclosure initiative (amendments to IAS 1) l
The amendments seek to address perceived impediments to preparers exercising their judgement in presenting their financial reports by making the following changes:
▪ Clarification that information should not be obscured by aggregating or by providing immaterial information, materiality considerations apply to the all parts of the financial statements, and even when a standard requires a specific disclosure, materiality con-siderations do apply.
▪ Clarification that the list of line items to be presented in these statements can be dis-aggregated and aggregated as relevant and additional guidance on subtotals in these statements, and clarification that an entity’s share of other comprehensive income of equity accounted associates and joint ventures should be presented in aggregate as single line items based on whether or not it will subsequently be reclassified to profit or loss.
▪ Additional examples of possible ways of ordering the notes to clarify that understanda-bility and comparability should be considered when determining the order of the notes, and to demonstrate that the notes need not be presented in the order so far listed in paragraph 114 of IAS 1.
Investment entities: applying the consolidation exception (amendments to IFRS 10, IFRS 12 and IAS 28) m
These amendments to IFRS 10, IFRS 12 and IAS 28 (2011) address issues that have arisen in the context of applying the consolidation exception for investment entities by clarifying the following points:
▪ The exemption from preparing consolidated financial statements for an intermediate parent entity is available to a parent entity that is a subsidiary of an investment entity, even if the investment entity measures all of its subsidiaries at fair value.
▪ A subsidiary that provides services related to the parent’s investment activities should not be consolidated if the subsidiary itself is an investment entity.
▪ When applying the equity method to an associate or a joint venture, a non-investment entity investor in an investment entity may retain the fair value measurement applied by the associate or joint venture to its interests in subsidiaries.
▪ An investment entity measuring all of its subsidiaries at fair value provides the disclosures relating to investment entities required by IFRS 12.
Required to be implemented for periods beginning on or after k January 1, 2016l January 1, 2016m January 1, 2016
58
Julius Berger Nigeria Plc AR & FS 2015 | Notes to the Financial Statements

Annual improvements 2012-2014 cycle n
The annual improvements to IFRSs 2012-2014 cycle includes a number of amendments to various IFRSs. These amendments to IFRS include:
▪ IFRS 5 — adds specific guidance in IFRS 5 for cases in which an entity reclassifies an asset from held-for-sale to held-for-distribution or vice versa and cases in which held-for-distribution accounting is discontinued.
▪ IFRS 7 — additional guidance to clarify whether a servicing contract is continuing involvement in a transferred asset, and clarification on offsetting disclosures in condensed interim financial statements.
▪ IAS 9 — clarify that the high quality corporate bonds used in estimating the discount rate for post-employment benefits should be denominated in the same currency as the benefits to be paid.
▪ IAS 34 — clarify the meaning of elsewhere in the interim report and require a cross- reference.
Required to be implemented for periods beginning on or after n January 1, 2016
59
Julius Berger Nigeria Plc AR & FS 2015 | Notes to the Financial Statements
Back to Contents

3. Significant Accounting Policies
3.1 Statement of compliance
The Consolidated and Separate Financial Statements of the Group have been prepared in accordance with IFRS.
3.2 Basis of preparation
The Consolidated and Separate Financial Statements are prepared on a historical cost. The following are the Significant Accounting Policies adopted by the Group in the preparation of these Financial Statements.
The accompanying Consolidated and Separate Financial Statements in Nigerian Naira (the functional currency of the Group) have been prepared in accordance with IFRS as issued by the IASB and adopted by the FRCN and as applicable, the CAMA.
The preparation of FS in conformity with IFRS requires Management to make estimates and assumptions that affect the reported amounts of assets and liabilities and disclosure of contingent assets and liabilities at the date of the FS and the reported amounts of revenue and expenses during the reporting period.
The estimates and assumptions are reviewed on an ongoing basis. Revisions to accounting estimates are recognised in the period in which the estimate is revised if the revision affects only that period or in the period of the revision and future periods if the revision affects both current and future period.
3.3 Basis of consolidation
The Consolidated Financial Statements incorporate the FS of the Company and entities controlled by the Company (its subsidiaries). Control is achieved when the Company:
▪ has power over the investee; ▪ is exposed, or has right, to variable returns from its involvement with the investee; and ▪ has the ability to use its power to affect its returns.
The Company reassesses whether or not it controls an investee if the facts and circum-stances indicate that there are changes to one or more of the three elements of control listed above.
Significant Accounting Policies
60
Julius Berger Nigeria Plc AR & FS 2015 | Notes to the Financial Statements

When the Company has less than the majority of the voting rights of an investee, it has power over the investee when the voting rights are sufficient to give it the practical ability to direct the relevant activities of the investee unilaterally. The Company considers all relevant facts and circumstances in assessing whether or not the Company’s voting rights in the investee are sufficient to give power, including:
▪ the size of the Company’s holding of the voting rights relative to the size and dispersion of the holding of the other vote holders;
▪ the potential voting rights held by the Company, other holders or other parties; ▪ the rights arising from other contractual arrangements; and ▪ any additional facts and circumstances that indicate that the Company has, or does not have, the current ability to direct the relevant activities at the time that decisions need to be made, including voting patterns at previous shareholders’ meeting.
Consolidation of a subsidiary begins when the Company obtains control over the subsid-iary and ceases when the Company loses control of the subsidiary. Specifically, income and expenses of a subsidiary acquired or disposed off during the year are included in the Consolidated Financial Statements of Profit or Loss and Other Comprehensive Income from the date the Company gains control until the date the Company ceases to control the subsidiary.
Profit or loss and each component of the other comprehensive income are attributed to the owners of the Company and to the non-controlling interests. Total comprehensive income of subsidiaries is attributed to the owners of the Company and to the non-controlling inter-est even if this results in the non-controlling interest is having a deficit balance.
When necessary, adjustments are made to the financial statements of the subsidiaries to bring their accounting policies into line with the Group’s Accounting Policies. All intragroup assets and liabilities, equity, income, expenses and cash flows relating to transactions be-tween members of the Group are eliminated in full on consolidation.
3.3.1 Changes in the Group’s ownership interests in existing subsidiaries
Changes in the Group’s ownership interests in subsidiaries that do not result in the Group losing control over the subsidiaries are accounted for as equity transactions. The carrying amounts of the Group’s interests and the non-controlling interests are adjusted to reflect the changes in their relative interests in the subsidiaries. Any difference between the amount by which the non-controlling interests are adjusted and the fair value of the consideration paid or received is recognised directly in equity and attributed to owners of the Company.
When the Group loses control of a subsidiary, a gain or loss is recognised in profit or loss and is calculated as the difference between the aggregate of the fair value of the consider-ation received and the fair value of any retained interest and the previous carrying amount of the assets (including goodwill), and liabilities of the subsidiary and any non-controlling interests.
When assets of the subsidiary are carried at revalued amounts or fair values and the related cumulative gain or loss has been recognised in other comprehensive income and accumulated in equity, the amounts previously recognised in other comprehensive income
61
Julius Berger Nigeria Plc AR & FS 2015 | Notes to the Financial Statements
Back to Contents

and accumulated in equity are accounted for as if the Group had directly disposed of the relevant assets (i.e. reclassified to profit or loss or transferred directly to retained earnings as specified by applicable IFRSs). The fair value of any investment retained in the former subsidiary at the date when control is lost is regarded as the fair value on initial recognition for subsequent accounting under IAS 39.
3.4 Business combinations
Acquisitions of businesses are accounted for using the acquisition method. The considera-tion transferred in a business combination is measured at fair value, which is calculated as the sum of the acquisition-date fair values of the assets transferred by the Group, liabilities incurred by the Group to the former owners of the acquiree and the equity interests issued by the Group in exchange for control of the acquiree. Acquisition-related costs are gener-ally recognised in profit or loss as incurred. At the acquisition date, the identifiable assets acquired and the liabilities assumed are recognised at their fair value, except that:
▪ deferred tax assets or liabilities, and assets or liabilities related to employee benefit arrangements are recognised and measured in accordance with IAS 12 and IAS 19 respectively;
▪ liabilities or equity instruments related to share-based payment arrangements of the acquiree or share-based payment arrangements of the Group entered into to replace share-based payment arrangements of the acquiree are measured in accordance with IFRS 2 Share-based Payment at the acquisition date; and
▪ assets (or disposal groups) that are classified as held for sale in accordance with IFRS 5 Non-current Assets Held for Sale and Discontinued Operations are measured in accord-ance with that standard.
Goodwill is measured as the excess of the sum of the consideration transferred, the amount of any non-controlling interests in the acquiree, and the fair value of the acquirer’s previously held equity interest in the acquiree (if any) over the net of the acquisition-date amounts of the identifiable assets acquired and the liabilities assumed. If, after reassessment, the net of the acquisition-date amounts of the identifiable assets acquired and liabilities assumed exceeds the sum of the consideration transferred, the amount of any non-controlling inter-ests in the acquiree and the fair value of the acquirer’s previously held interest in the acquiree (if any), the excess is recognised immediately in profit or loss as a bargain purchase gain.
Non-controlling interests that are present ownership interests and entitle their holders to a proportionate share of the entity’s net assets in the event of liquidation may be initially measured either at fair value or at the non-controlling interests’ proportionate share of the recognised amounts of the acquiree’s identifiable net assets. The choice of measurement basis is made on a transaction-by-transaction basis. Other types of non-controlling inter-ests are measured at fair value or, when applicable, on the basis specified in another IFRS.
When the consideration transferred by the Group in a business combination includes as-sets or liabilities resulting from a contingent consideration arrangement, the contingent consideration is measured at its acquisition-date fair value and included as part of the con-sideration transferred in a business combination. Changes in the fair value of the contingent consideration that qualify as measurement period adjustments are adjusted retrospective-ly, with corresponding adjustments against goodwill. Measurement period adjustments are adjustments that arise from additional information obtained during the ‘measurement
62
Julius Berger Nigeria Plc AR & FS 2015 | Notes to the Financial Statements

period’ (which cannot exceed one year from the acquisition date) about facts and circum-stances that existed at the acquisition date.
The subsequent accounting for changes in the fair value of the contingent consideration, that do not qualify as measurement period adjustments, depends on how the contingent consideration is classified. Contingent consideration, that is classified as equity, is not remeasured at subsequent reporting dates and its subsequent settlement is accounted for within equity. Contingent consideration, that is classified as an asset or a liability, is remeasured at subsequent reporting dates in accordance with IAS 39, or IAS 37 Provisions, Contingent Liabilities and Contingent Assets, as appropriate, with the corresponding gain or loss being recognised in profit or loss.
When a business combination is achieved in stages, the Group’s previously held equity interest in the acquiree is remeasured to fair value at the acquisition date (i.e. the date when the Group obtains control) and the resulting gain or loss, if any, is recognised in profit or loss. Amounts arising from interests in the acquiree prior to the acquisition date, that have previously been recognised in other comprehensive income, are reclassified to profit or loss where such treatment would be appropriate if that interest were disposed of.
If the initial accounting for a business combination is incomplete by the end of the reporting period in which the combination occurs, the Group reports provisional amounts for the items for which the accounting is incomplete. Those provisional amounts are adjusted dur-ing the measurement period (see above), or additional assets or liabilities are recognised, to reflect new information obtained about facts and circumstances that existed at the acquisi-tion date that, if known, would have affected the amounts recognised at that date.
3.4.1 Acquisition of interests from non-controlling shareholders
Acquisitions of non-controlling interests are accounted for as transactions within equity. There is no measurement to fair value of net assets acquired that were previously attribut-able to non-controlling shareholders.
3.5 Goodwill
Goodwill arising on an acquisition of a business is carried at cost as established at the date of acquisition of the business less accumulated impairment losses, if any. For the purposes of impairment testing, goodwill is allocated to each of the Group’s cash generating units (or groups of cash generating units) that is expected to benefit from the synergies of the combination. A cash generating unit, to which goodwill has been allocated, is tested for impairment annually, or more frequently, when there is an indication that the unit may be impaired. If the recoverable amount of the cash generating unit is less than its carrying amount, the impairment loss is allocated first to reduce the carrying amount of any goodwill allocated to the unit and then to the other assets of the unit pro rata based on the carrying amount of each asset in the unit. Any impairment loss for goodwill is recognised directly in profit or loss. An impairment loss recognised for goodwill is not reversed in subsequent periods. On disposal of the relevant cash generating unit, the attributable amount of good-will is included in the determination of the profit or loss on disposal.
63
Julius Berger Nigeria Plc AR & FS 2015 | Notes to the Financial Statements
Back to Contents

3.6 Revenue recognition
Revenue is measured at the fair value of the consideration received or receivable. Revenue is reduced with estimated customer returns, rebates and other similar allowances. Reve-nue is recognised when the amount of revenue can be measured reliably and it is probable that the economic benefits associated with the transaction will flow to the entity. However, when an uncertainty arises about the collectability of an amount already included in reve-nue, the uncollectible amount, or the amount in respect of which recovery has ceased to be probable, is recognised as an expense.
3.6.1 Goods and services
Revenue from the sale of goods is recognised when the goods are delivered and titles have passed and the Group retains neither continuing managerial involvement to the degree usually associated with ownership nor effective control over the goods sold. Revenue represents the net invoice value of sales to third parties and it is recognised when significant risks and rewards of ownership of the goods have been transferred to the buyer.
Revenue from rendering of services is recognised in the period the services are rendered. Revenue is recognised only when it is probable that the economic benefits associated with the transaction will flow to the entity.
Revenues from other income generated from refunds and recoveries by insurance compa-nies and other regulatory bodies are recognised when net cash is received.
3.6.2 Construction contracts
When the outcome of a construction contract can be estimated reliably, revenue and costs are recognised by reference to the stage of completion of the contract activity at the re-porting date, measured based on the proportion of work completed to date relative to the estimated total contract amount. Variations in contract work, claims and incentive payments are included to the extent that they can be reliably measured and its receipt is considered probable. Where the outcome of a construction contract cannot be estimated reliably, contract revenue is recognised to the extent of contract costs incurred, which is probable to be recovered. Contract costs are recognised as expenses in the period in which they are incurred. When it is probable that total contract costs will exceed total contract revenue, the expected loss is recognised as an expense immediately.
3.7 Gross amount due from customers
This represents work-in-progress (valued on the basis of engineers’ estimate of the quan-tum of work done but not yet certified) plus recognised profits, less recognised losses. Claims receivable arising on contracts are normally taken to income when agreed. In the case of unprofitable contracts, full provision is made for anticipated future losses after tak-ing into account a prudent estimate of claims arising in respect of such contracts.
64
Julius Berger Nigeria Plc AR & FS 2015 | Notes to the Financial Statements

3.8 Advance payments received
Advanced payments received are amounts received before the related work is performed and are assessed on initial recognition to determine whether it is probable that it will be repaid in cash or another financial asset. In this instance, the advance payment is classified as a non-trading financial liability that is carried at amortised cost. If it is probable that the advance payment will be repaid with goods or services, the liability is carried at historic cost.
3.9 Borrowing costs
Borrowing costs directly attributable to the acquisition, construction or production of quali-fying assets, which are assets that necessarily take a substantial period of time to get ready for their intended use or sale, are added to the cost of those assets, until such time as the assets are substantially ready for their intended use or sale. Investment income earned on the temporary investment of specific borrowings, pending their expenditure on qualifying assets, is deducted from the borrowing costs eligible for capitalisation. All other borrowing costs are recognised in profit or loss in the period in which they are incurred.
3.10 Property, Plant and Equipment
PPE are stated at historical cost less accumulated depreciation and impairment, if any.
Self-produced assets in the course of construction for production, supply or administrative purposes are carried at cost, less any recognised impairment loss. Cost includes direct costs, appropriate allocations of materials and other overheads associated with the pro-duction of the assets, professional fees and, for qualifying assets, borrowing costs capital-ised in accordance with the Group’s accounting policy. Such properties are classified to the appropriate categories of PPE when completed and ready for intended use. Depreciation of these assets, on the same basis as other property assets, commences when the assets are ready for their intended use.
Maintenance, repairs, and renewals are generally charged to expense during the financial period in which they are incurred. However, major renovations are capitalised and included in the carrying amount of the asset when it is probable that future economic benefits, in excess of the originally assessed standard of performance of the existing asset, will flow to the Group. No depreciation to land and capital work in progress applies. Losses or gains on disposals of assets are recognised in the Statement of Profit or Loss and Other Comprehensive Income under ‘other gains and losses’. Depreciation is recognised so as to write-off the cost or valu-ation of assets (other than freehold land and properties under construction) less their residual values over their useful lives, using the straight line method. The estimated useful lives, resid-ual values and depreciation method are reviewed at the end of each reporting period, with the effect of any changes in estimate accounted for on a prospective basis:
Residual values % on cost
Useful lives Years
Building 10 25
Plant & machinery 5 10
Other fixed assets 5 8
65
Julius Berger Nigeria Plc AR & FS 2015 | Notes to the Financial Statements
Back to Contents

An item of PPE is derecognised upon disposal or when no future economic benefits are ex-pected to arise from the continued use of the asset. Any gain or loss arising on the disposal or retirement of an item of PPE is determined as the difference between the sales proceeds and the carrying amount of the asset and is recognised in profit or loss.
3.10.1 Capitalisation
Expenditure related to an acquisition or repair is capitalised only if it extends the useful lives or increases the production capacity of the assets in question. The identification of such expenses is based on a certain criteria identified by Management and / or threshold reviewed from time to time. The criteria as set in the preparation of these FS are as follows:
3.10.1.1 Items to capitalise
▪ Any purchase of a piece of equipment (i.e. office furniture, machinery, equipment, etc.) of not less than ₦ 1.5 million
▪ Expenditures in the nature of repairs of not less than ₦ 1.5 million ▪ Computer and related equipment of not less than ₦ 1.5 million ▪ Expenditure on building of not less than ₦ 1.5 million
3.10.1.2 Items to be expensed
▪ Any item that will not last more than 12 months should be currently expensed when used ▪ Any purchase of a piece of equipment (i.e. office furniture, machinery, equipment, etc.) that is less than ₦ 1.5 million
▪ Expenditures in the nature of repairs can be expensed if less than ₦ 1.5 million ▪ Computers and related equipment that is less than ₦ 1.5 million
3.11 Investment property
All property classified as investment property are measured at cost. Investment property is recognised when it is probable that the Company will enjoy the future economic benefits which are attributable to it, and when the cost or fair value can be reliably measured. Costs include directly attributable expenditure such as legal fees and property transfer taxes.
Transfers to or from investment property is made only when there is a demonstrated “change in use” as a result of a transfer:
▪ From investment property to owner-occupied property, when owner-occupation commences
▪ From investment property to inventories, on commencement of development with a view to sale
▪ From an owner-occupied property to investment property, when owner-occupation ends ▪ Of inventories to investment property, when an operating lease to a third party commences ▪ Of property in the course of development or construction to investment property, at end of the construction or development
An investment property is derecognised on disposal or when it is permanently withdrawn from use and no future economic benefits are expected from its disposal. Any gains or losses arising on the disposal or retirement of an investment property is determined as the
66
Julius Berger Nigeria Plc AR & FS 2015 | Notes to the Financial Statements

difference between the net disposal proceeds and the carrying amount of the asset and is recognised in profit or loss for the period.
Depreciation is recognised so as to write-off the cost of investment properties less their re-sidual values over their useful lives, using the straight line method. Where such investment properties are revalued, depreciation is recognised over the useful life of the asset in a pattern which best reflects the consumption pattern over the estimated useful life of such assets.
3.12 Non-current assets held for sale
Non-current assets and disposal groups are classified as held for sale if their carrying amount will be recovered principally through a sale transaction rather than through contin-uing use. This condition is regarded as met only when the sale is highly probable and the non-current asset (or disposal group) is available for immediate sale in its present condition. Management must be committed to the sale, which should be expected to qualify for rec-ognition as a completed sale within one year from the date of classification.
Non-current assets (and disposal groups) classified as held for sale are measured at the lower of their previous carrying amount and fair value less costs to sell.
3.13 Leasing
Leases are classified as finance leases whenever the terms of the lease transfer substan-tially all the risks and rewards of ownership to the lessee. All other leases are classified as operating leases.
3.13.1 The Group as lessor
Amounts due from lessees under finance leases are recognised as receivables at the amount of the Group’s net investment in the leases. Finance lease income is allocated to accounting periods so as to reflect a constant periodic rate of return on the Group’s net investment outstanding in respect of the leases.
Rental income from operating leases is recognised on a straight-line basis over the term of the relevant lease. Initial direct costs incurred in negotiating and arranging an operating lease are added to the carrying amount of the leased asset and recognised on a straight-line basis over the lease term.
3.13.2 The Group as lessee
Assets held under finance leases are initially recognised as assets of the Group at their fair value at the inception of the lease or, if lower, at the present value of the minimum lease payments. The corresponding liability to the lessor is included in the Consolidated and Separate Statement of Financial Position as a finance lease obligation.
Lease payments are apportioned between finance expenses and reduction of the lease obligation so as to achieve a constant rate of interest on the remaining balance of the liabil-ity. Finance expenses are recognised immediately in profit or loss, unless they are directly attributable to qualifying assets, in which case they are capitalised in accordance with the
67
Julius Berger Nigeria Plc AR & FS 2015 | Notes to the Financial Statements
Back to Contents

Group’s general policy on borrowing costs. Contingent rentals are recognised as expenses in the periods in which they are incurred.
Operating lease payments are recognised as an expense on a straight-line basis over the lease term, except where another systematic basis is more representative of the time pattern in which economic benefits from the leased asset are consumed. Contingent rentals arising under operating leases are recognised as an expense in the period in which they are incurred. In the event that lease incentives are received to enter into operating leases, such incen-tives are recognised as a liability. The aggregate benefit of incentives is recognised as a reduction of rental expense on a straight-line basis, except where another systematic basis is more representative of the time pattern in which economic benefits from the leased asset are consumed.
3.14 Intangible assets
An intangible asset is an identifiable, non-monetary asset that has no physical substance. An intangible asset is recognised when it is identifiable, the Group has control over the asset, it is probable that economic benefits will flow to the Group, and the cost of the asset can be measured reliably.
3.14.1 Intangible assets acquired separately
Intangible assets with finite useful lives that are acquired separately are carried at cost less accumulated amortisation and accumulated impairment losses. Amortisation is rec-ognised on a straight-line basis over their estimated useful lives. The estimated useful life and amortisation method are reviewed at the end of each reporting period, with the effect of any changes in estimate being accounted for on a prospective basis. Intangible assets with indefinite useful lives that are acquired separately are carried at cost less accumulated impairment losses.
3.14.2 Internally-generated intangible assets – research and development expenditure
Expenditure on research activities is recognised as an expense in the period in which it is incurred. An internally-generated intangible asset arising from development (or from the development phase of an internal project) is recognised when all of the following have been demonstrated:
▪ The technical feasibility of completing the intangible asset so that it will be available for use or sale
▪ The intention to complete the intangible asset and use or sell it ▪ The ability to use or sell the intangible asset ▪ How the intangible asset will generate probable future economic benefits ▪ The availability of adequate technical, financial and other resources to complete the devel-opment and to use or sell the intangible asset
▪ The ability to measure reliably the expenditure attributable to the intangible asset during its development
68
Julius Berger Nigeria Plc AR & FS 2015 | Notes to the Financial Statements

The amount initially recognised for internally-generated intangible assets is the sum of the expenditure incurred from the date when the intangible asset first meets the recognition criteria listed above. Where no internally-generated intangible asset can be recognised, development expenditure is recognised in profit or loss in the period in which it is incurred. Subsequent to initial recognition, internally-generated intangible assets are reported at cost less accumulated amortisation and accumulated impairment losses, on the same basis as intangible assets that are acquired separately.
3.14.3 Intangible assets acquired in a business combination
Intangible assets acquired in a business combination and recognised separately from goodwill are initially recognised at their fair value at the acquisition date (which is regarded as their cost). Subsequent to initial recognition, intangible assets acquired in a business combination are reported at cost less accumulated amortisation and accumulated impair-ment losses, on the same basis as intangible assets that are acquired separately.
3.14.4 Derecognition of intangible assets
An intangible asset is derecognised on disposal, or when no future economic benefits are expected from use or disposal. Gains or losses arising from derecognition of an intangible asset, measured as the difference between the net disposal proceeds and the carrying amount of the asset, are recognised in profit or loss when the asset is derecognised.
3.15 Inventories
Inventories are stated at the lower of cost or net realisable value. Net realisable value is the amount that can be realised from the sale of the inventory in the normal course of business after allowing for the costs of realisation.
In addition to the cost of materials and direct labour, an appropriate proportion of produc-tion overhead that have been incurred in bringing the inventories to their present location and condition is included in the inventory values. An allowance is recorded for excess inventory and obsolescence is based on the lower of cost or net realisable value.
Cost is determined using standard cost, which approximates actual cost, on a First-In-First-Out (FIFO) basis.
3.16 Taxation
Taxation represents the sum of income tax payable and deferred tax.
3.16.1 Income and deferred tax for the year
Income and deferred tax are recognised in profit or loss, except when they relate to items that are recognised in other comprehensive income or directly in equity, in which case, the income and deferred tax are also recognised in other comprehensive income or directly in equity. Where income tax or deferred tax arises from the initial accounting for a business combination, the tax effect is included in the accounting for the business combination.
69
Julius Berger Nigeria Plc AR & FS 2015 | Notes to the Financial Statements
Back to Contents

3.16.2 Income tax
Taxable profit differs from profit as reported in the income statement because some items of income or expense are taxable or deductible in different years or may never be taxable or deductible. The Group’s liability for current tax is calculated based on Companies Income Tax Act (CAP C24 LFN 2004) as amended to date and tax rates that have been enacted or substantively enacted by the end of the reporting date.
3.16.3 Deferred taxation
Deferred tax is recognised on temporary differences between the carrying amounts of assets and liabilities in the Consolidated and Separate Financial Statements and the correspond-ing tax bases used in the computation of taxable profit. Deferred tax liabilities are generally recognised for all taxable temporary differences. Deferred tax assets are generally recognised for all deductible temporary differences to the extent that it is probable that taxable profits will be available against which those deductible temporary differences can be utilised. Such deferred tax assets and liabilities are not recognised if the temporary difference arises from goodwill or from the initial recognition (other than in a business combination) of other assets and liabilities in a transaction that affects neither the taxable profit nor the accounting profit.
Provision for deferred taxation is made by the liability method and calculated at the tax rate that applies during the period of reversal on the differences between the net book value of qualifying PPE and their corresponding tax written down values. Also, consideration is given for provision for retirement benefit which have not been paid in the year.
Deferred tax is calculated at the tax rates that are expected to apply in the period when the liability is settled or the asset realised based on the tax rates enacted by the end of the reporting period.
3.17 Foreign currencies
All transactions in foreign currencies are recorded in Naira at the rate of exchange ruling at the dates of the transactions. Monetary items are converted to Naira at the rates of exchange ruling at the reporting date. All differences arising there from are taken to the profit or loss.
Non-monetary items carried at fair value that are denominated in foreign currencies are retranslated at the rates prevailing at the date when the fair value was determined. Non-monetary items that are measured in terms of historical cost in a foreign currency are not retranslated.
For the purposes of presenting Consolidated and Separate Financial Statements, the assets and liabilities of the Group’s foreign operations are translated into currency units using exchange rates prevailing at the end of each reporting period. Income and expense items are translated at the average exchange rates for the period, unless exchange rates fluctuate significantly during that period, in which case the exchange rates at the dates of the transactions are used. Exchange differences arising, if any, are recognised in other comprehensive income and accumulated in equity (attributed to non-controlling interests as appropriate).
70
Julius Berger Nigeria Plc AR & FS 2015 | Notes to the Financial Statements

Goodwill and fair value adjustments on identifiable assets and liabilities acquired arising on the acquisition of a foreign operation are treated as assets and liabilities of the foreign operation and translated at the rate of exchange prevailing at the end of each reporting period. Exchange differences arising are recognised in other comprehensive income and accumulated in equity.
3.18 Dividends
Dividends on ordinary shares to shareholders are recognised in equity in the period in which they are paid or, if earlier, approved by the shareholders at the AGM.
3.18.1 Unclaimed dividend
Segregated accounts are maintained for unclaimed dividends and are recoverable by shareholders within 12 years and actionable only when declared. Any amounts standing to the credit of unclaimed dividend are invested separately while amounts unclaimed after 12 years are taken to retained earnings in line with CAMA.
3.19 Retirement benefits
3.19.1 Defined contribution plan
Payments to defined contribution retirement benefit plans are recognised as an expense when employees have rendered service entitling them to the contributions. Retirement benefit plans for members of staff are structured through a defined contributory pension scheme, which is independent of the Group’s finances and is managed by Pension Fund Administrators. The scheme, which is funded by contributions from both employees and employer at eight per cent and ten per cent respectively, is consistent with the Pension Reform Act 2014.
3.19.2 Defined benefit plan
For defined retirement benefit plans, the cost of providing benefits is determined using the Projected Unit Credit Method, with actuarial valuations being carried out periodically so that a provision for the present value of the estimated cost for liabilities due at the reporting date, in respect of employees’ terminal gratuities based on qualifying years of service and appli-cable emoluments as per operating collective agreement, is being made in the Statement of Financial Position.
3.20 Financial instruments
Financial assets and financial liabilities are recognised when a group entity becomes a party to the contractual provisions of the instrument. Financial assets and financial liabilities are initially measured at fair value. Transaction costs that are directly attributable to the acquisi-tion or issue of financial assets and financial liabilities (other than financial assets and finan-cial liabilities at fair value through profit or loss) are added to or deducted from the fair value of the financial assets or financial liabilities, as appropriate, on initial recognition. Transaction costs directly attributable to the acquisition of financial assets or financial liabilities at fair value through profit or loss are recognised immediately in profit or loss.
71
Julius Berger Nigeria Plc AR & FS 2015 | Notes to the Financial Statements
Back to Contents

3.20.1 Financial assets
All regular way purchases or sales of financial assets are recognised and derecognised on a trade date basis. Regular way purchases or sales are purchases or sales of financial assets that require delivery of assets within the time frame established by regulation or convention in the marketplace.
3.20.1.1 Amortised cost and effective interest method
The effective interest method is a method of calculating the amortised cost of a debt instrument and of allocating interest income over the relevant period. The effective interest rate is the rate that exactly discounts estimated future cash receipts (including all fees and points paid or received that form an integral part of the effective interest rate, transaction costs and other premiums or discounts) through the expected life of the debt instrument, or, where appropriate, a shorter period, to the net carrying amount on initial recognition.
Income is recognised on an effective interest basis for debt instruments measured subse-quently at amortised cost. Interest income is recognised in profit or loss and is included in the “investment income” line item.
3.20.1.2 Classification of financial assets
The Group’s financial assets are classified into the following specified categories: financial assets ‘at fair value through profit or loss’, ‘held-to-maturity’ investments, ‘available-for-sale’ financial assets and ‘loans and receivables’. All recognised financial assets are subsequent-ly measured in their entirety at either amortised cost or fair value, depending on the classi-fication of the financial assets.
Held-to-maturity investments are non-derivative financial assets with fixed or determinable payments and fixed maturity dates that the Group has the positive intent and ability to hold to maturity. Subsequent to initial recognition, held-to-maturity investments are measured at amortised cost using the effective interest method less any impairment.
Loans and receivables are non-derivative financial assets with fixed or determinable pay-ments that are not quoted in an active market. Loans and receivables are measured at amortised cost using the effective interest method, less any impairment. Interest income is recognised by applying the effective interest rate, except for short-term receivables when the effect of discounting is immaterial. The assets in this category include trade and other receivables, contract receivables and retentions, cash and cash equivalents:
▪ Trade and other receivables are initially recognised at fair value, and are subsequently classified as loans and receivables and measured at amortised cost using the effec-tive interest rate method. The provision for impairment of trade and other receivables is established, when there is objective evidence that the Group will not be able to collect all amounts due in accordance with the original terms of the credit given, and includes an assessment of recoverability based on historical trend analyses and events that exist at reporting date. The amount of the provision is the difference between the carrying value and the present value of estimated future cash flows, discounted at the effective interest rate computed at initial recognition.
72
Julius Berger Nigeria Plc AR & FS 2015 | Notes to the Financial Statements

▪ Contract receivables and retentions are initially recognised at fair value, and are subse-quently classified as loans and receivables and measured at amortised cost using the effective interest rate method. Contract receivables and retentions comprise amounts due in respect of certified or approved certificates by the client or consultant at the report-ing date for which payment has not been received, and amounts held as retentions on certified certificates at the reporting date. Contract receivables are stated after deduction of specific allowance for any debt considered doubtful of collection. The allowance for bad and doubtful debts is based on the estimated irrecoverable amount on a specific ba-sis which is determined based on the ageing of the receivable balance, correspondence with the client, economic viability and historical experience. Where a debt is not recov-erable, the amount is written off to the Statement of Comprehensive Income in the year the debt is deemed to become bad using Management’s prudential guidelines reviewed from time to time.
▪ Cash and cash equivalents comprise cash on hand, demand deposits and other short term highly liquid investments that are readily convertible to a known amount of cash and are subject to an insignificant risk of changes in value. Bank overdrafts are not offset against positive bank balances unless a legally enforceable right of offset exists, and there is an intention to settle the overdraft and realise the net cash simultaneously, or to settle on a net basis. All short term cash investments are invested with major financial institu-tions in order to manage credit risk.
3.20.1.3 Foreign exchange gains and losses
The fair value of financial assets denominated in a foreign currency is determined in that foreign currency and translated at the spot rate at the end of each reporting period. The foreign exchange component forms part of its fair value gain or loss. Therefore, for financial assets that are classified as at Fair-Value-Through-Profit and Loss (FVPTL), the foreign exchange component is recognised in profit or loss.
For foreign currency denominated debt instruments measured at amortised cost at the end of each reporting period, the foreign exchange gains and losses are determined based on the amortised cost of the financial assets and are recognised in the ‘other gains and losses’ line item in the Consolidated Statement of Comprehensive Income.
3.20.1.4 Impairment of financial assets
Financial assets that are measured at amortised cost are assessed for impairment at the end of each reporting period. Financial assets are considered to be impaired when there is objective evidence that, as a result of one or more events that occurred after the initial recognition of the financial assets, the estimated future cash flows of the asset have been affected.
Objective evidence of impairment could include:
▪ Significant financial difficulty of the issuer or counterparty ▪ Breach of contract, such as a default or delinquency in interest or principal payments ▪ The probability that the borrower will enter bankruptcy or financial reorganisation ▪ The disappearance of an active market for that financial asset because of financial diffi-culties
73
Julius Berger Nigeria Plc AR & FS 2015 | Notes to the Financial Statements
Back to Contents

For certain categories of financial asset, such as trade receivables, assets that are assessed not to be impaired individually are, in addition, assessed for impairment on a col-lective basis. Objective evidence of impairment for a portfolio of receivables could include the Group’s past experience of collecting payments, an increase in the number of delayed payments in the portfolio past the average credit period of 60 days, as well as observable changes in national or local economic conditions that correlate with default on receivables.
The amount of the impairment loss recognised is the difference between the asset’s carry-ing amount and the present value of estimated future cash flows reflecting the amount of collateral and guarantee, discounted at the financial asset’s original effective interest rate.
The carrying amount of the financial asset is reduced by the impairment loss directly for all financial assets with the exception of trade receivables, where the carrying amount is reduced through the use of an allowance account. When a trade receivable is considered uncollectible, it is written-off against the allowance account.
Subsequent recoveries of amounts previously written-off are credited against the allowance account. Changes in the carrying amount of the allowance account are recognised in profit or loss.
If, in a subsequent period, the amount of the impairment loss decreases and the decrease can be related objectively to an event occurring after the impairment was recognised, the previously recognised impairment loss is reversed through profit or loss to the extent that the carrying amount of the investment at the date the impairment is reversed does not ex-ceed what the amortised cost would have been, had the impairment not been recognised.
3.20.1.5 Derecognition of financial assets
The Group derecognises a financial asset only when the contractual rights to the cash flows from the asset expire, or when it transfers the financial asset and substantially all the risks and rewards of ownership of the asset to another entity. If the Group neither transfers nor retains substantially all the risks and rewards of ownership and continues to control the transferred asset, the Group recognises its retained interest in the asset and an associated liability for amounts it may have to pay. If the Group retains substantially all the risks and rewards of ownership of a transferred financial asset, the Group continues to recognise the financial asset and also recognises a collateralised borrowing for the proceeds received.
On derecognition of a financial asset measured at amortised cost, the difference between the asset’s carrying amount and the sum of the consideration received and receivable is recognised in profit or loss.
On derecognition of a financial asset that is classified as Fair-Value-Through-Other-Com-prehensive-Income (FVTOCI), the cumulative gain or loss previously accumulated in the investments revaluation reserve is not reclassified to profit or loss, but is reclassified to retained earnings.
74
Julius Berger Nigeria Plc AR & FS 2015 | Notes to the Financial Statements

3.20.2 Financial liabilities and equity instruments
3.20.2.1 Classification as debt or equity
Debt and equity instruments issued by a Group entity are classified as either financial liabili-ties or as equity in accordance with the substance of the contractual arrangements and the definitions of a financial liability and an equity instrument.
3.20.2.2 Equity instruments
An equity instrument is any contract that evidences a residual interest in the assets of an entity after deducting all of its liabilities. Equity instruments issued by the Group are recog-nised at the proceeds received, net of direct issue costs.
3.20.2.3 Financial liabilities
Financial liabilities are classified as either financial liabilities ‘at Fair-Value-Through-Profit and Loss (FVTPL)’ or ‘other financial liabilities’. The Group does not have financial liabilities classified as financial liabilities ‘at FVTPL’.
Other financial liabilities (including borrowings and trade and other payables) are subse-quently measured at amortised cost using the effective interest method.
The effective interest method is a method of calculating the amortised cost of a financial liability and of allocating interest expense over the relevant period. The effective interest rate is the rate that exactly discounts estimated future cash payments (including all fees and points, paid or received, that form an integral part of the effective interest rate, transaction costs and other premiums or discounts) through the expected life of the financial liability or (where appropriate) a shorter period, to the net carrying amount on initial recognition.
3.20.2.4 Foreign exchange gains and losses
For financial liabilities that are denominated in a foreign currency and are measured at amortised cost at the end of each reporting period, the foreign exchange gains and losses are determined based on the amortised cost of the instruments and are recognised in the ‘other gains and losses’ line item (Note 8) in the Consolidated Statement of Profit or Loss and Other Comprehensive Income.
The fair value of financial liabilities denominated in a foreign currency is determined in that foreign currency and translated at the spot rate at the end of the reporting period. For finan-cial liabilities that are measured as at FVTPL, the foreign exchange component forms part of the fair value gains or losses and is recognised in profit or loss.
3.20.2.5 Derecognition of financial liabilities
The Group derecognises financial liabilities when, and only when, the Group’s obligations are discharged, cancelled or they expire. The difference between the carrying amount of the financial liability derecognised and the consideration paid and payable, including any non-cash assets transferred or liabilities assumed, is recognised in profit or loss.
75
Julius Berger Nigeria Plc AR & FS 2015 | Notes to the Financial Statements
Back to Contents

3.21 Provisions
Provisions are recognised when the Group has a present obligation, whether legal or con-structive, as a result of a past event for which it is probable that an outflow of resources embodying economic benefits will be required to settle the obligation and a reliable esti-mate can be made of the amount of the obligation. The amount recognised as a provision is the best estimate of the consideration required to settle the present obligation at the end of the reporting period, taking into account the risks and uncertainties surrounding the ob-ligation. When a provision is measured using the cash flows estimated to settle the present obligation, its carrying amount is the present value of those cash flows (where the effect of the time value of money is material).
When some or all of the economic benefits required to settle a provision are expected to be recovered from a third party, a receivable is recognised as an asset if it is virtually certain that reimbursement will be received and the amount of the receivable can be measured reliably.
3.22 Related parties
Parties are considered to be related if one party has the ability to control or jointly control the other party or exercise significant influence over the other party in making financial and operating decisions. Key Management Personnel are also regarded as related parties. Key Management Personnel are those persons having authority and responsibility for planning, directing and controlling the activities of the Group, directly or indirectly, including all Exec-utive and Non-Executive Directors. Related party transactions are those where a transfer of resources or obligations between related parties occur, regardless of whether or not a price is charged.
3.23 Earnings per share
The Group presents basic earnings per share for its ordinary shares. Basic earnings per share are calculated by dividing the profit or loss attributable to ordinary shareholders of the Group by the weighted average number of ordinary shares in issue during the year. Diluted earnings per share are calculated using fully diluted shares outstanding (i.e. includ-ing the impact of stock option grants and convertible bonds).
3.24 Segment reporting
Segment information is presented in respect of the Group’s business segments. The busi-ness segments are determined by Management based on the Group’s internal reporting structure. The determination of the Group’s operating segments is based on the organ-isation units for which information is reported to the Group’s Management. The Group has three segments, Building, Civil and Services. The three segments have separate man-agement and reporting structures and are considered separately reportable operating segments. Certain headquarter activities are reported as “Corporate”. These consist of corporate headquarters, including the corporate executive committee, corporate commu-nication, corporate human resources, corporate finance, including treasury, taxes and pen-sion fund management, corporate legal and corporate safety and environmental services.
A segment is a distinguishable component of the Group that is engaged in providing related products or services (business segment) or in providing products or services within
76
Julius Berger Nigeria Plc AR & FS 2015 | Notes to the Financial Statements

a particular economic environment (geographical segment), which is subject to risk and rewards that are different from those of other segments. Segment results, assets and liabil-ities include items directly attributable to a segment as well as those that can be allocated on a reasonable basis.
Transfer prices between operating segments are set on an arm’s length basis. Operating assets and liabilities consist of PPE, goodwill and intangible assets, trade receivables / paya-bles, inventories and other assets and liabilities, such as provisions, which can be reasonably attributed to the reported operating segments. Non-operating assets and liabilities mainly include current and deferred income tax balances, post-employment benefit assets / liabilities and financial assets / liabilities such as cash, marketable securities, investments and debt.
3.25 Impairment
At the end of each reporting period, the Group reviews the carrying amounts of its tangible and intangible assets to determine whether there is any indication that those assets have suffered an impairment loss. If any such indication exists, the recoverable amount of the asset is esti-mated in order to determine the extent of the impairment loss (if any). Where it is not possible to estimate the recoverable amount of an individual asset, the Group estimates the recovera-ble amount of the cash generating unit to which the asset belongs. Where a reasonable and consistent basis of allocation can be identified, corporate assets are also allocated to individual cash generating units, or otherwise they are allocated to the smallest group of cash generating units for which a reasonable and consistent allocation basis can be identified.
Where an impairment loss subsequently reverses, the carrying amount of the asset (or a cash generating unit) is increased to the revised estimate of its recoverable amount, but so that the increased carrying amount does not exceed the carrying amount that would have been determined had no impairment loss been recognised for the asset (or the cash generating unit) in prior years. A reversal of an impairment loss is recognised immediately in profit or loss, unless the relevant asset is carried at a revalued amount, in which case the reversal of the impairment loss is treated as a revaluation increase.
3.26 Transfer pricing
Transactions between entities in the Group and all connected persons are carried on in a manner consistent with the arm’s length principle using the appropriate transfer pricing method.
3.27 Decommissioning provisions
The provision for decommissioning serves to cover the costs associated with the decom-missioning of assets. Decommissioning costs are provided at the present value of ex-pected costs to settle the obligation using estimated cash flows and are recognised as part of the cost of the particular asset. The estimated future costs of decommissioning are reviewed annually and adjusted as appropriate. Changes in the estimated future costs or in the discount rate applied for existing obligations are added to or deducted from the cost of the asset. Estimated future costs for decommissioning obligations arising after the related asset is brought into use are recognised in the Statement of Profit or Loss and Other Comprehensive Income.
77
Julius Berger Nigeria Plc AR & FS 2015 | Notes to the Financial Statements
Back to Contents

3.28 Financial income and cost
Financial income comprises interest income on funds invested, dividend income, net gains on the disposal of held-for-sale financial assets, net fair value gains on financial assets at fair value through profit or loss, net gains on the remeasurement to fair value of any preexisting available-for-sale interest in an acquiree, and net gains on hedging instruments that are recognised in the Statement of Profit or Loss and Other Comprehensive Income.
Financial costs on the other hand represent interest on loans, overdraft and related facilities.
Interest income and cost is recognised on accrual basis in the Statement of Profit or Loss and Other Comprehensive Income, using the effective interest method. Dividend income is recognised in the Statement of Profit or Loss and Other Comprehensive Income on the date that the Company’s right to receive payment is established, which in the case of quoted securities is normally the ex-dividend date.
78
Julius Berger Nigeria Plc AR & FS 2015 | Notes to the Financial Statements

Explanatory Notes
4. Critical judgements areas and estimation of key sources of estimation uncertainty
In the application of the Group’s Accounting Policies, which are described in Note 3, the Directors are required to make judgements, estimates and assumptions about the carry-ing amounts of assets and liabilities that are not readily apparent from other sources. The estimates and associated assumptions are based on historical experience and other factors that are considered to be relevant. Actual results may differ from these estimates.
The estimates and underlying assumptions are reviewed on an ongoing basis. Revisions to accounting estimates are recognised in the period in which the estimate is revised, if the revision affects only that period, or in the period of the revision and future periods, if the revision affects both current and future periods.
4.1 Critical judgments in applying the Group’s Accounting Policies
The following are the critical judgements, apart from those involving estimations (which are dealt with separately below), that the Directors have made in the process of applying the Group’s Accounting Policies and that have the most significant effect on the amounts rec-ognised in Financial Statements.
4.1.1 Income taxes
The Group is subject to various forms of taxes. Significant judgement is required in deter-mining the provision for income and other related taxes. There are many transactions and calculations for which the ultimate tax determination is uncertain. The Group recognises liabilities for anticipated tax audit issues based on estimates of whether additional taxes will be due. Where the final tax outcome of these matters is different from the amounts that were initially recorded, such differences will impact the current and deferred income tax assets and liabilities in the period in which such determination is made.
4.1.2 Revenue recognition
The Group uses the percentage-of-completion method in accounting for its fixed-price con-tracts to deliver civil, design and engineering services. Use of the percentage-of-completion method requires the Group to estimate the services performed to date as a proportion of the total services to be performed.
79
Julius Berger Nigeria Plc AR & FS 2015 | Notes to the Financial Statements
Back to Contents

4.1.3 Allowance for doubtful debts / receivables
The Group has recognised allowances for credit losses on receivables by assessing the credit quality of individual customers, receivables that are in dispute, financial standing of customers and the willingness of the customers to pay. Management believes that, except for the receivables on which allowance has been made, all other receivables are recovera-ble despite their age, because they are mainly due from various government and govern-ment entities.
4.1.4 Review of the useful lives of tangible assets
The Directors believe that the consumption pattern on items of PPE is such that the book value is spread equally over the useful life of the assets. The judgment exercised is based on past experience with similar assets, technological obsolescence and declining residual values.
4.1.5 Write down of inventories to Net realisable value
Management has written down inventories that are obsolete to a nil value after considering the non-movements of these inventory items for two years. Write-back of previous allow-ances on inventory are effected when the items are subsequently put into use.
4.2 Key sources of estimation uncertainty
The key assumptions concerning the future, and other key sources of estimation uncertain-ty at the financial reporting date, that have a significant risk of causing a material adjustment to the carrying amounts of assets and liabilities within the next financial year, are discussed below.
4.2.1 Provision for gratuity
Within the Group, Julius Berger Nigeria Plc (the Company) operates an unfunded defined benefit scheme which entitles staff, who put in a minimum qualifying working period of five years to gratuity upon leaving the employment of the Company. IAS 19 requires the applica-tion of the Projected Unit Credit Method for actuarial valuations. Actuarial measurements in-volve the making of several demographic projections regarding mortality, rates of employee turnover, and others and financial projections in the area of future salaries and benefit levels, discount rate, inflation and others.
4.2.2 Impairment loss on PPE
Management considered several factors to assess items of PPE for impairment, some of which includes the physical damage caused by accidents, technological obsolescence, decline in value and others. The individual assets carrying values were compared with their recoverable amount and impairment losses have been recognised on those assets. In determining fair value less cost to sell, Management has derived fair value information from the sales proceeds received on similar assets. This is the best information available to reflect the amount that the Group could obtain, at the end of the reporting period, from the disposal of the asset in an arm’s length transaction between knowledgeable, willing parties, after deducting the costs of disposal.
80
Julius Berger Nigeria Plc AR & FS 2015 | Notes to the Financial Statements

5. Segmental analysis
The Management is the Group’s chief operating decision-maker. Management has deter-mined the operating segments based on the information reviewed by the Management for the purposes of allocating resources and assessing performance. The Management assesses the performance of the operating segments based on a measure of adjusted Earnings Before Interest, Taxes, Depreciation and Amortisation (EBITDA). This measure-ment basis excludes investment income, finance costs and taxes. These income and expenditures are not allocated to segments, as this type of activity is driven by the central treasury function, which manages the cash position of the Group.
Julius Berger Nigeria Plc has three segments which offer civil works, building works and services to third parties across Nigeria. Julius Berger Nigeria Plc is organised by segments, each of which is managed separately and considered to be a reportable segment. The Managing Director together with Senior Executive Management are members of the Management and they regularly review the performance of these segments. Details of the services offered by these segments are provided in the business and financial review.
5.1 Principal segment activities
Civil works
The segment is responsible for provision of professional services in the areas of engineering, construction and maintenance of various infrastructures. These activities are evidence in the realisation of the Abuja Master Plan, and developments in the essential traffic network in and around the cities of Lagos and Uyo. At the coastal areas, the works include the con-struction of turnkey harbors, wharfs, jetties, loading installations and warehouses. The seg-ment also builds or refurbishes airports in conformity with strict global aviation regulations. For the oil, gas and energy sector, the segment is responsible for design and construction of auxiliary buildings for factories, oil and gas installations and power stations.
Building works
As a leader in its field, the segment has the specialised knowhow needed to construct buildings that meet the Leadership in Energy and Environmental Design (LEED) standards for certification. The segment is responsible for the designing and building of administration, commercial and industrial buildings, hotels, hospitals, airport terminals, sports facilities and residential districts. Under this segment is a furniture production unit, which supplies high quality furniture and interior fittings.
Services
The segment provides forward looking facility management solutions, which ensure the useful life of a building is extended and maintenance costs are significantly reduced. Avail-able through the segment is a computer assisted facility and resource management, aimed at optimising workflow and process controlling and reducing operating costs.
81
Julius Berger Nigeria Plc AR & FS 2015 | Notes to the Financial Statements
Back to Contents

5.2 Segment revenue
Group 31/12/2015
₦ 000
Group 31/12/2014
₦ 000
Company 31/12/2015
₦ 000
Company 31/12/2014
₦ 000
Class of business
Civil works 75,839,524 109,333,627 72,437,567 109,333,628
Building works 46,644,136 70,386,981 46,633,975 70,386,981
Services 11,323,914 17,088,024 170,999 258,098
Total revenue 133,807,574 196,808,632 119,242,541 179,978,707
5.3 Segment profit / loss and results
Group 31/12/2015
₦ 000
Group 31/12/2014
₦ 000
Company 31/12/2015
₦ 000
Company 31/12/2014
₦ 000
Class of business
Civil works 9,174,164 12,434,115 4,617,302 8,713,376
Building works 2,335,041 5,836,735 2,636,521 4,195,899
Services 304,389 610,047 62,636 99,682
Total profit of segments 11,813,594 18,880,897 7,316,459 13,008,957
Corporate costs 695,388 (170,361) 1,388,584 403,872
EBITA 12,508,982 18,710,536 8,705,043 13,412,829
Finance costs (6,148,772) (5,981,450) (6,148,772) (5,958,645)
Adjusted profit before tax 6,360,210 12,729,086 2,556,271 7,454,184
Other items 139,763 405,811 3,678,067 2,574,340
Profit before income tax 6,499,973 13,134,897 6,234,338 10,028,524
Notes:1. Corporate costs comprise the costs of operating head office functions and certain overheads.2. EBITA is earnings before investment income, finance costs and taxes.3. The accounting policies of the reportable segments are the same as the Group’s Accounting Policies described in Note 3.
Segment profit represents the profit before tax earned by each segment without allocation of central administration costs and Directors’ salaries, investment income, other gains and losses as well as finance costs. This is the measure reported to the Management for the purposes of resource allocation and assessment of segment performance.
5.4 Information about major customers
Included in the revenue reported by Group are two clients whose individual balances of ₦ 32.27 billion (2014: ₦ 70.92 billion) and ₦ 18.77 billion (2014: ₦ 19.70 billion) repre-sent more than 10 % of the total revenue reported by the Group. No other single client contributed 10 % or more to the Group’s revenue for 2015.
Also included in the non-current assets are additions to PPE belonging to the Services segment in the sum of ₦ 2.0 billion (2014: ₦ 24.7 billion).
82
Julius Berger Nigeria Plc AR & FS 2015 | Notes to the Financial Statements

5.5 Segment assets and liabilities
Group Segment assets
31/12/2015₦ 000
Segment liabilities
31/12/2015₦ 000
Segment net assets / liabilities
31/12/2015₦ 000
Segment assets
31/12/2014₦ 000
Segment liabilities
31/12/2014₦ 000
Segment net assets / liabilities
31/12/2014₦ 000
Class of business
Civil works 67,763,997 (70,804,129) (3,040,132) 68,890,597 (70,103,236) (1,212,639)
Building works 40,862,628 (43,744,475) (2,881,847) 41,541,983 (43,311,446) (1,769,463)
Services 106,445,354 (60,336,486) 46,108,868 108,215,045 (59,739,212) 48,475,833
215,071,979 (174,885,090) 40,186,889 218,647,625 (173,153,894) 45,493,731
Net cash 13,360,038 (24,807,936) (11,447,898) 23,473,159 (38,010,769) (14,537,610)
Unallocated assets/(liabilities)
16,654,253 (21,101,289) (4,447,036) 13,924,996 (18,785,274) (4,860,278)
245,086,270 (220,794,315) 24,291,955 256,045,780 (229,949,937) 26,095,843
Company Segment assets
31/12/2015₦ 000
Segment liabilities
31/12/2015₦ 000
Segment net assets / liabilities
31/12/2015₦ 000
Segment assets
31/12/2014₦ 000
Segment liabilities
31/12/2014₦ 000
Segment net assets / liabilities
31/12/2014₦ 000
Class of business
Civil works 67,929,667 (74,046,411) (6,116,744) 68,178,187 (69,388,479) (1,210,292)
Building works 38,387,836 (43,123,321) (4,735,485) 38,528,278 (40,410,624) (1,882,346)
Services 109,109,787 (69,697,225) 39,412,562 109,508,962 (65,312,881) 44,196,081
215,427,290 (186,866,957) 28,560,333 216,215,427 (175,111,984) 41,103,443
Net cash 10,148,623 (24,807,936) (14,659,313) 11,716,041 (38,010,769) (26,294,728)
Unallocated assets /(liabilities)
22,182,142 (17,424,710) 4,757,432 22,182,144 (17,424,707) 4,757,437
247,758,055 (229,099,603) 18,658,452 250,113,612 (230,547,460) 19,566,152
The amounts provided to the Management with respect to total assets are measured in a manner consistent with that of the Financial Statements. These assets are allocated based on the operations of the segment and the physical location of the assets.
Unallocated net assets / (liabilities) principally comprise assets / (liabilities) which are not cat-egorised as part of those of the segments in the Group. These are not directly attributable to the activities of the individual segments.
For the purposes of monitoring segment performance and allocating resources between segments, the Management monitors the tangible and financial assets and liablities attrib-utable to each segment. All assets and liabilities are allocated to reportable segments with the exception of current tax assets and deferred taxation assets, current tax liabilities and retirement benefit. Assets used jointly by reportable segments are allocated on a rational basis after considering the revenues earned by individual reportable segments.
83
Julius Berger Nigeria Plc AR & FS 2015 | Notes to the Financial Statements
Back to Contents

6. Revenue
Group 31/12/2015
₦ 000
Group 31/12/2014
₦ 000
Company 31/12/2015
₦ 000
Company 31/12/2014
₦ 000
Construction contracts 120,981,205 179,978,707 119,242,541 179,978,707
Rendering of services 12,826,369 16,829,925 – –
133,807,574 196,808,632 119,242,541 179,978,707
7. Investment income
Group 31/12/2015
₦ 000
Group 31/12/2014
₦ 000
Company 31/12/2015
₦ 000
Company 31/12/2014
₦ 000
Investment income consists of interest income from
Bank deposits 139,763 405,811 139,763 256,600
Dividend received – – 3,538,305 2,317,739
139,763 405,811 3,678,068 2,574,339
8. Other gains and losses
Group 31/12/2015
₦ 000
Group 31/12/2014
₦ 000
Company 31/12/2015
₦ 000
Company 31/12/2014
₦ 000
Profit from sale of PPE 1,696,628 598,150 1,695,347 599,224
Net foreign exchange losses (367,970) (193,705) (306,763) (195,352)
Sundry income (633,270) (574,806) – –
695,388 (170,361) 1,388,584 403,872
9. Finance costs
Group 31/12/2015
₦ 000
Group 31/12/2014
₦ 000
Company 31/12/2015
₦ 000
Company 31/12/2014
₦ 000
Interest on overdraft 4,306,334 2,776,493 4,306,334 2,776,493
Interest on loan 1,214,931 1,816,994 1,214,931 1,816,994
Other finance charges 627,507 1,387,963 627,507 1,365,158
6,148,772 5,981,450 6,148,772 5,958,645
84
Julius Berger Nigeria Plc AR & FS 2015 | Notes to the Financial Statements

10. Profit for the year
Group 31/12/2015
₦ 000
Group 31/12/2014
₦ 000
Company 31/12/2015
₦ 000
Company 31/12/2014
₦ 000
Profit for the year has been arrived at after charging / (crediting)
Net foreign exchange losses 367,970 193,705 306,763 195,352
Depreciation of PPE 9,744,274 9,760,289 9,499,602 9,533,924
Depreciation of investment property 101,976 61,453 101,976 61,453
Impairment loss 2,128,374 1,508,480 2,128,374 1,508,480
Audit remuneration (see Note 10.1) 88,025 88,025 48,750 48,750
Staff costs (see Note 11) 61,517,529 58,170,908 31,391,299 47,422,600
Gain on disposal of PPE (1,696,628) (598,150) (1,695,347) (599,224)
10.1 Auditors’ remuneration
The total remuneration of the Group’s auditor, Nexia Agbo Abel & Co. and other profession-al firms for services provided to the Group is analysed below:
Group 31/12/2015
₦ 000
Group 31/12/2014
₦ 000
Company 31/12/2015
₦ 000
Company 31/12/2014
₦ 000
Audit fees
Parent 47,250 47,250 47,250 47,250
Subsidiaries auditors (Ernst & Young and Akintola Williams Deloitte)
39,275 39,275 – –
Other audit related fees 1,500 1,500 1,500 1,500
Audit and audit-related fees 88,025 88,025 48,750 48,750
Other fees
Taxation 11,000 11,000 7,000 7,000
Others 350 350 250 250
Total fees 99,375 99,375 56,000 56,000
85
Julius Berger Nigeria Plc AR & FS 2015 | Notes to the Financial Statements
Back to Contents

11. Staff costs and employee numbers
Group 31/12/2015
₦ 000
Group 31/12/2014
₦ 000
Company 31/12/2015
₦ 000
Company 31/12/2014
₦ 000
Wages and salaries 59,970,147 54,698,934 30,109,505 44,401,611
Social security costs 1,832 1,211,930 – 1,211,930
Defined benefit plans 450,529 359,943 407,270 325,215
Defined contribution (pension schemes) 957,908 1,665,798 694,152 1,483,844
61,380,416 57,936,605 31,210,927 47,422,600
Group 31/12/2015
Number
Group 31/12/2014
Number
Company 31/12/2015
Number
Company 31/12/2014
Number
The average number of people employed was as follows:
Civil works 1,122 4,790 922 4,790
Building works 5,600 5,685 4,838 5,685
Services 4,165 7,354 3,517 5,523
10,887 17,829 9,277 15,998
The average number of employees in the services division includes managerial staff as well as Executive Management.
Group 31/12/2015
Number
Group 31/12/2014
Number
Company 31/12/2015
Number
Company 31/12/2014
Number
Managerial staff 115 117 95 97
Senior staff 1,167 776 550 708
Junior staff 9,605 16,936 8,632 15,193
10,887 17,829 9,277 15,998
86
Julius Berger Nigeria Plc AR & FS 2015 | Notes to the Financial Statements

12. Taxation
12.1 Income tax recognised in profit or loss
Group 31/12/2015
₦ 000
Group 31/12/2014
₦ 000
Company 31/12/2015
₦ 000
Company 31/12/2014
₦ 000
Current tax
Current tax expense in respect of the current year
5,566,478 3,041,581 5,235,578 2,465,675
Education tax (2 % of assessable profit) 540,270 391,555 534,522 378,111
Adjustments in relation to the current tax of prior years
229,778 336,460 – 291,725
Deferred tax
Deferred tax (credited) / charged in the current year
(2,276,693) 1,125,321 (2,372,434) 162,896
Total income tax expense recognised in the current year
4,059,833 4,894,917 3,397,666 3,298,407
The income tax expense for the year can be reconciled to the accounting profit as follows:
Profit before tax from operations 6,499,973 13,134,896 6,234,339 10,028,524
Expected income tax expense calculat-ed at 30 % (2014: 30 %)
1,936,080 5,004,125 1,870,302 3,008,558
Education tax expense calculated at 2 % (2014: 2 %) of assessable profit
540,270 391,555 534,522 378,111
Effect of income that is exempt from taxation
(4,900,238) (7,291,324) (5,233,652) (5,814,638)
Effect of expenses that are not deducti-ble in determining taxable profit
10,958,023 5,328,780 10,971,362 5,271,755
Effect of unrecognised and unused tax losses now recognised as deferred tax assets
– – – –
Effect of different tax rates of subsidiar-ies and adjustments
– – – –
Deferred tax expense recognised in the current year
(4,704,080) 1,125,321 (4,744,868) 162,896
Income tax expense recognised in profit or loss
3,830,055 4,558,457 3,397,666 3,006,682
Adjustments recognised in the current year in relation to the current tax of prior years
229,778 336,460 – 291,725
4,059,833 4,894,917 3,397,666 3,298,407
The tax rate used for the 2015 and 2014 reconciliations above is the corporate tax rate of 30 % payable by corporate entities in Nigeria on taxable profits under the Companies Income Tax Act.
87
Julius Berger Nigeria Plc AR & FS 2015 | Notes to the Financial Statements
Back to Contents

12.2 Current tax liabilities
Group 31/12/2015
₦ 000
Group 31/12/2014
₦ 000
Company 31/12/2015
₦ 000
Company 31/12/2014
₦ 000
Income tax payable 5,566,478 3,081,798 5,235,578 2,465,675
Education tax payable 540,270 391,555 534,522 378,111
6,106,748 3,473,353 5,770,100 2,843,786
12.3 Deferred tax assets and liabilities
Deferred tax assets and liabilities are attributable to the following:
Group 31/12/2015
₦ 000
Group 31/12/2014
₦ 000
Company 31/12/2015
₦ 000
Company 31/12/2014
₦ 000
Deferred tax assets 10,087,301 8,041,407 9,874,831 7,867,780
Deferred tax liabilities (12,989,322) (13,220,121) (12,568,459) (12,933,842)
Deferred tax liabilities (net) (2,902,021) (5,178,714) (2,693,628) (5,066,062)
The gross movement in deferred taxation during the year
Balance at beginning of year 5,178,714 4,868,405 5,066,062 4,903,166
Profit or loss charge (2,249,637) 310,309 (2,345,378) 92,605
Tax charge relating to components of other comprehensive income
(27,056) – (27,056) 70,291
Balance at end of year 2,902,021 5,178,714 2,693,628 5,066,062
The movement in deferred tax assets and liabilities during the year without taking into con-sideration the offsetting of balances within the same tax jurisdiction, is as stated on page 89:
88
Julius Berger Nigeria Plc AR & FS 2015 | Notes to the Financial Statements

Deferred tax – Group
Group Accelerated tax depreciation
₦ 000
Adjustments and fair value gains
₦ 000
Others
₦ 000
Total
₦ 000
Deferred tax liabilities
Balance at January 1, 2015 14,018,456 (252,004) (546,331) 13,220,121
Charged to profit or loss (193,768) (37,568) 537 (230,799)
Balance at December 31, 2015 13,824,688 (289,572) (545,794) 12,989,322
Group Retirement benefit obligation
₦ 000
Impairment and tax losses
₦ 000
Provisions and others
₦ 000
Total
₦ 000
Deferred tax assets
Balance at January 1, 2015 (1,043,279) (188,536) (6,809,592) (8,041,407)
Charged to profit or loss 89,702 (826,529) (1,282,011) (2,018,838)
Charged to other comprehensive income (27,056) – – (27,056)
Balance at December 31, 2015 (980,633) (1,015,065) (8,091,603) (10,087,301)
Deferred tax – Company
Company Accelerated tax depreciation
₦ 000
Adjustments and fair value gains
₦ 000
Others
₦ 000
Total
₦ 000
Deferred tax liabilities
Balance at January 1, 2015 12,995,703 (61,861) – 12,933,842
Charged to profit or loss (327,815) (37,568) – (365,383)
Balance at December 31, 2015 12,667,888 (99,429) – 12,568,459
Company Retirement benefit obligation
₦ 000
Impairment and tax losses
₦ 000
Provisions and others
₦ 000
Total
₦ 000
Deferred tax assets
Balance at January 1, 2015 (769,599) (247,725) (6,850,456) (7,867,780)
Charged to profit or loss 54,954 (755,682) (1,279,267) (1,979,995)
Charged to other comprehensive income (27,056) – – (27,056)
Balance at December 31, 2015 (741,702) (1,003,407) (8,129,723) (9,874,831)
89
Julius Berger Nigeria Plc AR & FS 2015 | Notes to the Financial Statements
Back to Contents

13. Earnings per share
Basic and diluted earnings per share are shown on the face of the Statement of Profit or Loss and Other Comprehensive Income. The earnings and weighted average number of or-dinary shares used in the calculation of basic and diluted earnings per share are as follows:
Group 31/12/2015
₦ 000
Group 31/12/2014
₦ 000
Company 31/12/2015
₦ 000
Company 31/12/2014
₦ 000
Earnings
Earnings for the purpose of basic earn-ings and diluted earnings per share being net profit attributable to equity holders of the Company
1,759,887 8,088,795 2,656,300 6,495,814
Number of shares
Weighted average number of ordinary shares for the purpose of basic and diluted earnings per share
1,320,000 1,320,000 1,320,000 1,320,000
Earnings per 50 K share (₦) – basic 1,33 6,13 2,01 4,92
Earnings per 50 K share (₦) – diluted 1,33 6,13 2,01 4,92
14. Property, Plant and Equipment
Group PPE Land
₦ 000
Buildings
₦ 000
Plant andmachinery
₦ 000
Other fixedassets₦ 000
Total
₦ 000
Cost
Balance at January 1, 2015 3,543,188 10,279,456 129,956,336 1,399,298 145,178,278
Additions 1,433,225 1,045,755 1,023,648 24,586 3,527,214
Disposal – – (8,628,624) (1,686) (8,630,310)
Balance at December 31, 2015 4,976,413 11,325,211 122,351,360 1,422,198 140,075,182
Accumulated depreciation and impairment loss
Balance at January 1, 2015 – 3,576,611 72,622,317 609,679 76,808,607
Charge for the year – 269,728 9,415,322 59,224 9,744,274
Eliminated on disposals – – (6,982,585) – (6,982,585)
Impairment loss – – 2,128,374 – 2,128,374
Balance at December 31, 2015
– 3,846,339 77,183,427 668,903 81,698,669
Carrying amount
Balance at December 31, 2015 4,976,413 7,478,872 45,167,933 753,295 58,376,513
Balance at December 31, 2014 3,543,188 6,702,845 57,334,019 789,619 68,369,671
90
Julius Berger Nigeria Plc AR & FS 2015 | Notes to the Financial Statements

Company PPE Land
₦ 000
Buildings
₦ 000
Plant andmachinery
₦ 000
Other fixedassets₦ 000
Total
₦ 000
Cost
Balance at January 1, 2015 3,543,188 9,717,547 129,169,979 235,760 142,666,474
Additions 1,141,300 – 894,791 – 2,036,091
Disposal – – (8,621,918) – (8,621,918)
Balance at December 31, 2015 4,684,488 9,717,547 121,442,852 235,760 136,080,647
Accumulated depreciation and impairment loss:
Balance at January 1, 2015 – 3,455,813 72,274,926 223,999 75,954,738
Charge for the year – 247,316 9,252,286 – 9,499,602
Eliminated on disposals – – (6,972,724) – (6,972,724)
Impairment loss – – 2,128,374 – 2,128,374
Balance at December 31, 2015 – 3,703,129 76,682,862 223,999 80,609,990
Carrying amount
Balance at December 31, 2015 4,684,488 6,014,418 44,759,990 11,761 55,470,657
Balance at December 31, 2014 3,543,188 6,261,734 56,895,053 11,761 66,711,736
14.1 Contractual commitment for capital expenditure
There were no capital commitments for the purchase of PPE in the year.
15. Non-current assets held for sale
At the reporting date, PPE of ₦ 1.5 billion (2014: ₦ 1.2 billion) were reclassified as non-cur-rent assets held for sale. The assets are taken to the sales yard once it has been deter-mined that their value will be realised from sale and not continuous use in the business operation by the Company´s equipment repair centre and sale is expected to be completed within one year.
16. Intangible assets
16.1 Goodwill
Group 31/12/2015
₦ 000
Group 31/12/2014
₦ 000
Company 31/12/2015
₦ 000
Company 31/12/2014
₦ 000
Cost 4,606,412 4,842,708 – –
Exchange difference 434,772 (236,296) – –
5,041,184 4,606,412 – –
The purchased goodwill above exists in the books of Julius Berger International GmbH. It is the Group’s policy to test goodwill for impairment annually and more frequently if there
91
Julius Berger Nigeria Plc AR & FS 2015 | Notes to the Financial Statements
Back to Contents

are indications of impairment. No impairment loss has been recognised as there are no indications that the goodwill is impaired.
16.2 Other intangible assets
Group licenses
₦ 000
Group Total
₦ 000
Company licenses
₦ 000
Company Total
₦ 000
Cost
Balance at January 1, 2015 193,028 193,028 – –
Additions during the year – – – –
Balance at December 31, 2015 193,028 193,028 – –
Accumulated amortisation
Balance at January 1, 2015 115,626 115,626 – –
Charge for the year 44,690 44,690 – –
Balance at December 31, 2015 160,316 160,316 – –
Carrying amount
Balance at December 31, 2015 32,712 32,712 – –
Balance at December 31, 2014 77,402 77,402 – –
The other intangible assets represent software licences acquired as part of the net asset of Julius Berger International GmbH. The amortisation of the useful life of the licenses is three years.
17. Investment property
Group 31/12/2015
₦ 000
Group 31/12/2014
₦ 000
Company 31/12/2015
₦ 000
Company 31/12/2014
₦ 000
Cost
Balance at January 1 2,742,372 812,684 2,742,372 812,684
Additions during the year – 1,929,688 – 1,929,688
Balance at December 31 2,742,372 2,742,372 2,742,372 2,742,372
Accumulated amortisation
Balance at January 1 93,960 32,507 93,960 32,507
Charge for the year 101,976 61,453 101,976 61,453
Balance at December 31 195,936 93,960 195,936 93,960
Carrying amount
Balance at December 31 2,546,436 2,648,412 2,546,436 2,648,412
Investment property is carried at cost and depreciated using the straight line method.
92
Julius Berger Nigeria Plc AR & FS 2015 | Notes to the Financial Statements

The estimated useful life of the investment property is 25 years.
The investment property comprises a number of commercial properties that are leased to related and third parties. The annual rent received from the investment property is approx-imately ₦ 52 million per annum.
18. Investments in subsidiaries
Group 31/12/2015
₦ 000
Group 31/12/2014
₦ 000
Company 31/12/2015
₦ 000
Company 31/12/2014
₦ 000
Balance at January 1 – – 13,131,581 12,195,207
Additions during the year – – 2,061,817 936,374
Disposals – – – –
Balance at December 31 – – 15,193,398 13,131,581
Investments undertakings are recorded at cost which is the fair value of the consideration paid. Details of the parent’s subsidiaries at the end of the reporting period are as follows:
Name of subsidiaries Principal activity Place of incorporation and operation
Proportion of ownership interest and voting power held by the parent 2015 2014
Abumet Nigeria Ltd. Manufacturers and dealers in aluminium, steel, iron or other structural products of such nature
Abuja, Nigeria 90 % 90 %
Julius Berger Services Nigeria Ltd.
Providers of ports services, ste-vedores, cargo superintendents, port management, warehouse-men, agents and proprietors of warehouses
Abuja, Nigeria 100 % 100 %
Julius Berger Medical Services Ltd.
Health care providers for the operation of medical service institutions and all form of medical and health care services
Abuja, Nigeria 100 % 100 %
PrimeTech Design and Engineering Nigeria Ltd.
Engineers, planning, design, development, construction and maintenance of engineering works and products of all description
Abuja, Nigeria 100 % 100 %
Julius Berger Investments Ltd.
Investment company and managers
Abuja, Nigeria 100 % 100 %
Julius Berger International GmbH
Providers of logistical and tech-nical support on an international level
Wiesbaden, Germany
100 % 90 %
Julius Berger Free Zone Enterprise
Planning and construction of all kinds and aspects of civil engineering works and related activities as well as maintanance of buildings and facilities in free trade zones
Abuja, Nigeria 100 % –
93
Julius Berger Nigeria Plc AR & FS 2015 | Notes to the Financial Statements
Back to Contents

19. Inventories
Group 31/12/2015
₦ 000
Group 31/12/2014
₦ 000
Company 31/12/2015
₦ 000
Company 31/12/2014
₦ 000
Construction materials 3,484,269 2,850,488 2,589,532 2,850,488
Consumables 2,401,525 3,738,279 1,481,724 2,026,787
Spares 4,872,969 5,037,120 4,484,729 4,453,449
Others 478,534 628,695 445,486 544,138
11,237,297 12,254,582 9,001,471 9,874,862
Allowances (Note 19.1) (127,181) (142,752) (63,048) (74,874)
11,110,116 12,111,830 8,938,423 9,799,988
19.1 Obsolete inventory
Inventory is stated net of allowances for obsolescence, an analysis of which is as follows:
Group 31/12/2015
₦ 000
Group 31/12/2014
₦ 000
Company 31/12/2015
₦ 000
Company 31/12/2014
₦ 000
Balance at beginning of year 142,752 90,001 74,874 16,831
Amount (written back) / charged to profit or loss
(15,571) 52,751 (11,826) 58,043
Balance at end of year 127,181 142,752 63,048 74,874
19.2 Inventory recognised as expense
The cost of inventories recognised as an expense during the year in respect of operations was ₦ 30.7 billion (December 31, 2014: ₦ 53.5 billion).
19.3 Inventory pledged as securities
Inventories have not been pledged as security for liabilities.
94
Julius Berger Nigeria Plc AR & FS 2015 | Notes to the Financial Statements

20. Amount due from / to customers from construction contract
Group 31/12/2015
₦ 000
Group 31/12/2014
₦ 000
Company 31/12/2015
₦ 000
Company 31/12/2014
₦ 000
Construction costs incurred plus recognised profits less recognised losses to date
770,494,593 694,360,200 770,494,593 694,360,200
Less progress billings (883,150,123) (794,117,132) (883,372,102) (792,557,571)
Less retentions – – – –
(112,655,530) (99,756,932) (112,877,509) (98,197,371)
Recognised and included in the Consolidated and Separate Financial Statements as amounts
Due from customers under construc-tion contracts
27,228,427 29,122,120 27,204,457 29,122,120
Due to customers under construction contracts (Note 20.1)
(139,883,957) (128,879,052) (140,081,967) (127,319,491)
(112,655,530) (99,756,932) (112,877,510) (98,197,371)
20.1 Gross amounts due to customers
Group 31/12/2015
₦ 000
Group 31/12/2014
₦ 000
Company 31/12/2015
₦ 000
Company 31/12/2014
₦ 000
Current portion 32,912,602 35,188,722 28,737,461 33,629,161
Non-current portion 106,971,355 93,690,330 111,344,506 93,690,330
139,883,957 128,879,052 140,081,967 127,319,491
95
Julius Berger Nigeria Plc AR & FS 2015 | Notes to the Financial Statements
Back to Contents

21. Trade and other receivables
Group 31/12/2015
₦ 000
Group 31/12/2014
₦ 000
Company 31/12/2015
₦ 000
Company 31/12/2014
₦ 000
Trade receivables
Contract and retention receivables (Note 21.5)
84,713,910 50,437,397 82,042,749 52,726,992
Receivables from rendering of services – 1,075,506 – –
Less allowance for doubtful debt (Note 21.3)
(10,056,409) (1,303,130) (8,690,857) (1,234,825)
74,657,501 50,209,773 73,351,892 51,492,167
Other receivables
Supplier advances 7,734,403 6,473,267 7,217,163 5,570,011
Amount owed by related entities (Note 31.2)
– – 4,031,346 3,177,823
Amount owed by staff debtors 78,928 78,668 70,916 69,414
Prepayments and accrued income 2,694,527 4,073,463 2,414,601 3,104,795
Other receivables 4,313,009 4,924,801 4,313,009 4,780,806
89,478,368 65,759,972 91,398,927 68,195,016
Analysed as follows:
Current Portion 88,634,246 63,425,208 90,554,805 66,572,663
Non-current Portion 844,122 2,334,764 844,122 1,622,353
89,478,368 65,759,972 91,398,927 68,195,016
Trade receivables expected to be recovered within one year include retentions of ₦ 989 mil-lion (2014: ₦ 3.6 billion) relating to contracts in progress.
Trade and other receivables are classified as loans and receivables.
The Group has recognised an allowance for doubtful debts (see Note 21.3) against all receivables over six years because Management’s continuous efforts to recover these debts is gradually becoming uncertain. Allowances for doubtful debts are recognised against trade receivables based on Management’s assessment of the credit quality of indi-vidual customers, receivables that are in dispute, financial standing of customers and the willingness of the customers to pay.
Trade receivables disclosed above include amounts (see on page 97) that are past due at the end of the reporting period, for which the Group has not recognised an allowance for doubtful debts because there has not been a significant change in credit quality and the amounts are more than three years outstanding, are still considered recoverable.
96
Julius Berger Nigeria Plc AR & FS 2015 | Notes to the Financial Statements

21.1 Age of receivables that are past due but not impaired
Group 31/12/2015
₦ 000
Group 31/12/2014
₦ 000
Company 31/12/2015
₦ 000
Company 31/12/2014
₦ 000
0 – 3 years 78,358,483 60,200,374 81,644,594 62,703,722
Above 3 years 1,063,476 4,256,468 1,063,476 4,256,468
79,421,959 64,456,842 82,708,070 66,960,190
21.2 Age of receivables that are past due but impaired
Group 31/12/2015
₦ 000
Group 31/12/2014
₦ 000
Company 31/12/2015
₦ 000
Company 31/12/2014
₦ 000
0 – 3 years 3,935,400 786,989 3,935,400 786,989
Above 3 years 6,121,009 516,141 4,755,457 447,836
10,056,409 1,303,130 8,690,857 1,234,825
Based on past experience, the Group believes that no material impairment allowance is necessary in respect of trade receivables not past due.
21.3 Allowances for credit losses
Group 31/12/2015
₦ 000
Group 31/12/2014
₦ 000
Company 31/12/2015
₦ 000
Company 31/12/2014
₦ 000
Balance at January 1 1,303,129 1,896,822 1,234,825 1,831,360
Impairment losses recognised on receivables
8,827,600 – 7,530,352 –
Amounts written off during the year as uncollectible
(74,320) (593,692) (74,320) (596,535)
Amounts recovered during the year – – – –
Balance at December 31 10,056,409 1,303,130 8,690,857 1,234,825
In determining the recoverability of trade receivables, the Group considered changes in the credit quality of trade receivables from the date credit was initially granted up to the end of the reporting period, with emphasis on a certificate by certificate basis.
21.4 Information about concentration risk
Trade receivable exposures are typically with the federal and state governments, which are the major customers of the Group and credit risks are greatly minimised through forward funding where achievable.
97
Julius Berger Nigeria Plc AR & FS 2015 | Notes to the Financial Statements
Back to Contents

21.5 Contract and retention receivables
Group 31/12/2015
₦ 000
Group 31/12/2014
₦ 000
Company 31/12/2015
₦ 000
Company 31/12/2014
₦ 000
Balance at January 1 50,437,397 44,619,456 52,726,992 44,682,370
Movements in the year 34,276,513 5,817,941 29,315,757 8,044,622
Balance at December 31 84,713,910 50,437,397 82,042,749 52,726,992
22. Tax receivables
Group 31/12/2015
₦ 000
Group 31/12/2014
₦ 000
Company 31/12/2015
₦ 000
Company 31/12/2014
₦ 000
Balance at January 1 40,635,621 38,506,444 39,738,157 37,690,277
Movements in the year (6,692,932) 5,996,016 (6,725,123) 5,825,340
Utilised as tax offset (2,572,688) (3,144,091) (2,465,675) (3,097,727)
31,370,001 41,358,369 30,547,359 40,417,890
Allowances (5,037,879) (722,748) (5,037,879) (679,733)
Balance at December 31 26,332,122 40,635,621 25,509,480 39,738,157
Made up as follows:
Current portion 5,292,205 5,575,112 5,235,578 5,465,675
Non-current portion 21,039,915 35,060,509 20,273,902 34,272,482
26,332,120 40,635,621 25,509,480 39,738,157
Tax receivable include credit notes confirmed by the Federal Inland Revenue Service (FIRS) of ₦ 5.2 billion (2014: ₦ 4.5 billion) relating to deductions of withholding tax on approved certificates made by various clients and advance payment of Value Added Tax (VAT) on contracts of ₦ 2.7 billion (2014: ₦ 13.0 billion). The remaining balance represents deduc-tions on withholding tax for which the credit notes have not been received and thus not confirmed by the FIRS.
23. Issued capital and dividend
Group 31/12/2015
₦ 000
Group 31/12/2014
₦ 000
Company 31/12/2015
₦ 000
Company 31/12/2014
₦ 000
Share capital (Note 23.1) – – 660,000 660,000
Share premium – – 425,440 425,440
– – 1,085,440 1,085,440
98
Julius Berger Nigeria Plc AR & FS 2015 | Notes to the Financial Statements

The authorised share capital of the Company is ₦ 800 million (2014: ₦ 800 million). This comprises 1.6 million (2014: 1.6 million) ordinary shares of 50 Kobo each. Issued and fully paid share capital consists of 1.3 million (2014: 1.3 million) shares at 50 Kobo each. All the ordinary shares rank parri passu in all respects. To the Company’s knowledge and belief, there are no restrictions on the transfer of shares in the Company or on voting rights be-tween holders of shares.
There was no movement in issued share capital during the period.
The Directors are proposing a final dividend in respect of the financial year ended Decem-ber 31, 2015 of 150 Kobo per share (2014: 270 Kobo), which will absorb an estimated ₦ 1.98 billion (2014: ₦ 3.56 billion) of equity. Subject to approval, it will be paid on June 17, 2016 to shareholders on the register of members as at close of business on May 30, 2016. The dividend has not been provided for and withholding tax will be deducted at the appropriate rate when payment is made.
24. Non-controlling interest
Group 31/12/2015
₦ 000
Group 31/12/2014
₦ 000
Company 31/12/2015
₦ 000
Company 31/12/2014
₦ 000
Balance at beginning of year 670,660 458,040 – –
Share of profit for the year 225 148,396 – –
Share of foreign currency translation reserve
– 25,724 – –
Additional investments in shares – 38,500 – –
Purchase of non-controlling interest (613,705) – – –
Balance at end of year 57,180 670,660 – –
25. Borrowings
Group 31/12/2015
₦ 000
Group 31/12/2014
₦ 000
Company31/12/2015
₦ 000
Company31/12/2014
₦ 000
Bank overdrafts (Note 25.1) 21,526,346 31,868,688 21,526,346 31,868,688
Term loan 3,281,590 6,142,082 3,281,590 6,142,082
24,807,936 38,010,770 24,807,936 38,010,770
Made up as follows:
Current portion 24,807,936 34,809,060 24,807,936 34,809,060
Non-current portion – 3,201,710 – 3,201,710
24,807,936 38,010,770 24,807,936 38,010,770
The borrowing within the Group is represented by only the parent and therefore the same.
99
Julius Berger Nigeria Plc AR & FS 2015 | Notes to the Financial Statements
Back to Contents

25.1 Term loan
This represents a term loan secured from HSBC Bank London. The loan is to finance supply of capital goods and related services with German exporters up to a maximum aggregate amount of € 62,720,000. The loan is with a tenure of four years. Interest is payable half yearly at six months above EURIBOR plus 1.2 margin. 85 % of the loan is secured by Hermes Euler Credit Recovery Insurance. The facility is guaranteed by Zenith Bank Nigeria Plc.
25.1.1 Term loan movement schedule
Group 31/12/2015
₦ 000
Group 31/12/2014
₦ 000
Balance at January 1 6,142,082 9,830,915
Additions in the year – –
Repayment in the year (3,305,978) (3,303,027)
Exchange difference on translation 445,486 (385,806)
Balance at December 31 3,281,590 6,142,082
Made up as follows:
Current portion 3,281,590 2,940,372
Non-current portion – 3,201,710
3,281,590 6,142,082
26. Retirement benefit liabilities
26.1 Defined contribution plan
Retirement benefits for members of staff are structured through a defined contributory pension scheme, which is independent of the Group’s finances and is managed by private pension fund administrators. The scheme, which is funded by contributions from both em-ployees at 8 % and employer at 10 % each of relevant emoluments, is consistent with the Pension Reform Act 2014.
Staff pensions Group 31/12/2015
₦ 000
Group 31/12/2014
₦ 000
Company 31/12/2015
₦ 000
Company 31/12/2014
₦ 000
Balance at January 1 95,294 124,260 40,152 69,598
Provision during the year 1,016,887 1,665,798 694,152 1,483,844
Remittance to pension fund administrators
(960,743) (1,694,764) (709,803) (1,513,290)
Balance at December 31 151,438 95,294 24,501 40,152
The total expense for the defined contribution plans amounted to ₦ 1.0 billion (2014: ₦ 1.7 billion).
100
Julius Berger Nigeria Plc AR & FS 2015 | Notes to the Financial Statements

26.2 Defined benefit plan – Discontinued scheme
Present value of defined benefit obligation is as follows:
Group 31/12/2015
₦ 000
Group 31/12/2014
₦ 000
Company 31/12/2015
₦ 000
Company 31/12/2014
₦ 000
Present value of unfunded defined benefit obligation
1,996,506 1,996,506 1,606,929 1,606,929
Net actuarial losses not recognised (142,725) – (185,984) –
Net liability arising from defined benefit obligation
1,853,781 1,996,506 1,420,945 1,606,929
Movements in the present value of the defined benefit obligation in the current year were as follows:
Group 31/12/2015
₦ 000
Group 31/12/2014
₦ 000
Company 31/12/2015
₦ 000
Company 31/12/2014
₦ 000
Opening defined benefit obligation 1,996,506 2,033,004 1,606,929 1,678,155
Current service cost 129,175 145,381 85,916 110,653
Interest on defined benefit obligation 186,096 214,562 186,096 214,562
Curtailment 135,258 – 135,258 –
Actuarial gains / losses due to experience adjustment
180,372 234,303 180,372 234,303
Payments in the year (773,626) (630,744) (773,626) (630,744)
Closing defined benefit obligation 1,853,781 1,996,506 1,420,945 1,606,929
Liability in the Statement of Financial Position
Group 31/12/2015
₦ 000
Group 31/12/2014
₦ 000
Company 31/12/2015
₦ 000
Company 31/12/2014
₦ 000
Current portion 151,438 95,294 24,501 40,152
Non-current portion 1,853,781 1,996,506 1,420,945 1,606,929
2,005,219 2,091,800 1,445,446 1,647,081
The amount recognised in profit or loss and included within staff costs (Note 11)
450,529 359,943 407,270 325,215
101
Julius Berger Nigeria Plc AR & FS 2015 | Notes to the Financial Statements
Back to Contents

The total amount is recognised in the Statement of Profit or Loss as follows:
Statement of Profit or Loss Group 31/12/2015
₦ 000
Group 31/12/2014
₦ 000
Company 31/12/2015
₦ 000
Company 31/12/2014
₦ 000
Cost of sales 129,175 143,977 85,916 130,086
Administrative expenses 321,354 215,966 321,354 195,129
450,529 359,943 407,270 325,215
Other comprehensive income 180,372 234,303 180,372 234,303
630,901 594,246 587,642 559,518
In the 2012 financial year, an agreement was signed between the Company and the staff union on staff employments benefits pursuant to the termination of the old scheme under the National Joint Industrial Council (NJIC) agreement. The scheme is designed for the benefit of staff member with five years continuous service for ex-gratia and ten years con-tinuous service for severance benefits. There are no planned assets for the scheme as the Group believe that these obligations can be supported in the event they become payable. The present value of the defined benefit obligation, and the related current service cost and past service cost, were performed in-house and measured using the projected unit credit method.
The principal assumptions used for the purposes of the actuarial valuations were as follows:
Valuation at 31/12/2015 Percentage
Valuation at 31/12/2014 Percentage
Discount rate(s) 12.0 % 15.0 %
Expected rate(s) of salary increase 11.0 % 12.0 %
Average rate(s) of inflation 9.0 % 9.0 %
Note: The discount rate used is the average yield on government securities.
The basis of computation is in line with the exit bonus and ex-gratia payments.Other assumptions:
▪ The scheme computation is based on the agreement with the staff unions; ▪ The basis of computation are in line with the exit bonus and ex-gratia payments; and ▪ The death rate is ignorable as a minimal number of staff deaths while in service were recorded.
Group 31/12/2015
₦ 000
Group 31/12/2014
₦ 000
Company 31/12/2015
₦ 000
Company 31/12/2014
₦ 000
Amounts recognised in profit or loss in respect of these defined benefit plans are as follows:
450,529 359,943 407,270 325,215
The expense for the year is included in the ‘employee benefits expense’ in profit or loss.
102
Julius Berger Nigeria Plc AR & FS 2015 | Notes to the Financial Statements

27. Trade and other payables
Group 31/12/2015
₦ 000
Group 31/12/2014
₦ 000
Company 31/12/2015
₦ 000
Company 31/12/2014
₦ 000
Trade payables (Note 27.1) 11,171,712 28,156,413 14,656,566 18,168,787
Other payables
Amount owed to related entities (Note 31.2)
– – 18,870,288 20,134,583
Other taxation and social security costs 3,709,419 3,865,217 3,689,174 3,865,217
Accruals and deferred income 9,329,792 9,001,608 5,497,115 4,660,657
Dividend payable 1,199,227 624,215 1,189,227 624,215
Other payables 9,186,675 491,395 223,325 339,031
Trade and other payables 34,596,825 42,138,848 44,125,695 47,792,490
Trade payables principally comprise amounts outstanding for trade purchases and ongoing costs. For all the suppliers, no interest is charged on the trade payables. The Company has financial risk management policies in place to ensure that all payables are paid within the pre-agreed credit terms.
Other taxation and social security costs represent deductions of VAT on advances and withholding taxes from suppliers and sub-contractors yet to be remitted to the Federal Inland Revenue Service.
The Directors consider that the carrying amount of trade payables approximates to their fair value.
28. Provisions
Group 31/12/2015
₦ 000
Group 31/12/2014
₦ 000
Company 31/12/2015
₦ 000
Company 31/12/2014
₦ 000
Balance at beginning of year 2,135,994 – – –
Provision no longer required (2,135,994) – – –
Provision for the year 404,308 2,135,994 300,000 –
Balance at end of year 404,308 2,135,994 300,000 –
Made up as follows:
Current portion 404,308 2,135,994 300,000 –
Non-current portion – – – –
404,308 2,135,994 300,000 –
103
Julius Berger Nigeria Plc AR & FS 2015 | Notes to the Financial Statements
Back to Contents

29. Reconciliation of profit to net cash provided by operating activities
Group 31/12/2015
₦ 000
Group 31/12/2014
₦ 000
Company 31/12/2015
₦ 000
Company 31/12/2014
₦ 000
Profit for the year 1,760,112 8,262,915 2,656,300 6,495,814
Adjustments for
Investment income (139,763) (405,811) (3,678,069) (2,574,339)
Finance costs 6,148,772 5,981,449 6,148,772 5,958,644
Depreciation of PPE 9,886,440 9,760,289 9,499,602 9,533,924
Impairment loss of PPE 2,125,133 1,508,480 2,128,374 1,508,480
Depreciation of investment property 101,976 61,453 101,976 61,453
Actuarial gains on retirement benefits 180,372 234,303 180,372 234,303
Prior year under provision of tax – 291,725 – 291,725
Gain on disposal of PPE (1,696,628) (598,150) (1,695,347) (599,224)
Increase in share capital – – – 60,000
Provision for VAT written off (6,308,748) – (6,308,748) –
Increase in provisions 2,058,833 (2,400,584) 2,291,733 724,418
Operating cash flows before move-ments in working capital
14,116,498 22,696,069 11,324,964 21,695,198
(Increase) / decrease in inventories 1,001,713 (679,348) 861,566 382,169
Decrease / (increase) in gross amount due from customers
1,673,599 (8,223,462) 1,917,663 (8,467,312)
Increase in trade and other receivables (23,516,271) (11,332,213) (23,203,911) (13,304,546)
Decrease/(increase) in tax receivable 14,160,213 (2,129,177) 14,228,677 (2,047,880)
(Decrease)/increase in retirement benefit liabilities
1,373,133 (65,464) (201,636) (100,672)
(Decrease)/increase in trade and other payables
(3,543,628) 14,055,645 (3,666,795) 13,708,123
Increase in gross amount due to customers
3,371,879 1,124,958 12,762,477 913,589
Cash generated by operations 8,637,135 15,447,008 14,023,004 12,778,669
Movement in taxation 356,702 (1,531,148) 553,880 (299,433)
Net cash from operating activities 8,993,838 13,915,860 14,576,884 12,479,236
104
Julius Berger Nigeria Plc AR & FS 2015 | Notes to the Financial Statements

29.1 Analysis of cash, cash equivalents and net cash
Group Balance at 01/01/2015
₦ 000
Cash flow
₦ 000
Exchange and non-cash
movements₦ 000
Balance at31/12/2015
₦ 000
Cash and bank balances 23,473,159 (10,113,119) – 13,360,040
Cash and cash equivalents 23,473,159 (10,113,119) – 13,360,040
Borrowings (bank overdrafts) (31,868,688) 6,615,263 445,486 (24,807,938)
(8,395,529) (3,497,856) 445,486 (11,447,898)
Company Balance at 01/01/2015
₦ 000
Cash flow
₦ 000
Exchange and non-cash
movements₦ 000
Balance at31/12/2015
₦ 000
Cash and bank balances 11,716,041 (1,567,418) – 10,148,623
Cash and cash equivalents 11,716,041 (1,567,418) – 10,148,623
Borrowings (bank overdrafts) (31,868,688) 7,060,752 – (24,807,936)
(20,152,647) 5,493,334 – (14,659,313)
30. Financial instruments
30.1 Capital risk management
The Group manages its capital to ensure that entities in the Group will be able to continue as a going concern while maximising the return to stakeholders through the optimisation of the debt and equity balance. The Group’s overall strategy is to thrive on quality in offering integrated construction solutions and services while maintaining its core competence and efficient working capital management with low cost for funds.
The capital structure of the Group and Company consists of net debt (which includes the borrowings offset by cash and cash equivalents) and equity attributable to equity holders of the parent, comprising issued capital, reserves and retained earnings as disclosed in the relevant notes in the financial statements.
The Group is not subject to any externally imposed capital requirements.
The management of the Group reviews the capital structure on a frequent basis to ensure that gearing is within acceptable limit.
105
Julius Berger Nigeria Plc AR & FS 2015 | Notes to the Financial Statements
Back to Contents

The gearing ratio at the year end is as follows:
Group 31/12/2015
₦ 000
Group 31/12/2014
₦ 000
Company 31/12/2015
₦ 000
Company 31/12/2014
₦ 000
Debt 24,807,936 38,010,770 24,807,936 38,010,770
Cash and bank balance (13,360,038) (23,473,159) (10,148,623) (11,716,041)
Net debt (i) 11,447,898 14,537,611 14,659,313 26,294,729
Equity (ii) 24,291,955 26,095,843 18,658,452 19,566,152
Net debt to equity ratio 0.47 0.56 0.79 1.34
i. Debt is defined as current and non-current term borrowings as described in the appropriate note.ii. Equity includes all capital and reserves of the Group that are managed as capital.
30.2 Categories of financial instruments
Group 31/12/2015
₦ 000
Group 31/12/2014
₦ 000
Company 31/12/2015
₦ 000
Company 31/12/2014
₦ 000
Financial Assets
Loans and receivables
Trade and other receivables 84,792,838 51,591,571 86,145,011 55,974,229
Tax receivable 26,332,120 41,358,369 25,509,480 40,417,890
Amount due from customers under construction contracts
27,228,427 29,122,120 27,204,457 29,122,120
Cash and bank balances 13,360,038 23,473,159 10,148,623 11,716,041
151,713,423 145,545,219 149,007,571 137,230,280
Financial liabilities
Amortised cost
Borrowings 24,807,936 38,010,769 24,807,936 38,010,769
Retirement benefit liabilities 151,437 95,294 24,501 40,152
Trade and other payables 34,596,825 42,138,848 44,125,695 47,792,490
59,556,198 80,244,911 68,958,132 85,843,411
30.3 Risk management according to IFRS
The Group has an integrated risk management system that identifies and measures the impact of the risks it faces. Further more, it establishes a framework to evaluate and coun-teract such risks through various control and monitoring mechanisms. Such risks include market risk (foreign currency risk and interest rate risk), credit risk and liquidity risk.
106
Julius Berger Nigeria Plc AR & FS 2015 | Notes to the Financial Statements

30.3.1 Market risk management according to IFRS
Market risk exposures are measured using sensitivity analysis and there has been no change to the Group’s exposure to market risks or the manner in which these risks are managed and measured.
30.3.1.1 Interest rate risk management according to IFRS
The Group is exposed to interest rate risk from bank overdraft and term loan from HSBC. Since it is repayable on demand, the carrying amount reflects the fair value and the Group’s exposure to interest risk as at the reporting date.
30.3.1.2 Foreign currency risk management according to IFRS
The Group undertakes transactions denominated in foreign currencies; consequently, ex-posures to exchange rate fluctuations arise. Exchange rate exposures are managed within approved policy parameters utilising forward foreign exchange contracts. The Group uti-lises a currency mix with part agreement in Naira and part in either Euro or US Dollar for contracts that are expected to last for more than one financial year.
The Group publishes its consolidated and separate account in Naira. It conducts business in a range of currencies, including Euro and US Dollar. As a result, the Group is exposed to foreign exchange risks, which will affect transaction costs and the translation results.
Group 31/12/2015
₦ 000
Group 31/12/2014
₦ 000
Company 31/12/2015
₦ 000
Company 31/12/2014
₦ 000
Monetary assets / liabilities denominated in Euro
Cash and bank balances (9,489,086) 11,918,870 (12,024,173) 924,148
Trade receivables 8,698,740 6,251,872 6,725,381 6,238,487
Trade payables (8,119,488) (3,823,177) (3,078,257) (3,331,318)
(8,909,834) 14,347,565 (8,377,049) 3,831,317
Monetary assets / liabilities denominated in Dollars
Cash and bank balances 12,182,869 501,493 12,182,869 495,629
Trade receivables – 177,478 – 65,576
Trade payables (52,990) (899,693) (52,990) (881,663)
12,129,879 (220,722) 12,129,879 (320,458)
12 % is the sensitivity rate used when reporting foreign currency risk internally to Key Man-agement Personnel and represents Management’s assessment of the reasonably possible change in foreign exchange rates. The sensitivity analysis includes only outstanding foreign currency denominated monetary items and adjusts their translation at the period end for a 12 % change in foreign currency rates. Foreign exchange rate risk sensitivity to foreign exchange movements in the above example has been calculated on a symmetric basis. The symmetric basis assumes that a increase or decrease in foreign exchange movement would result in the same amount.
107
Julius Berger Nigeria Plc AR & FS 2015 | Notes to the Financial Statements
Back to Contents

Group 31/12/2015
₦ 000
Group 31/12/2014
₦ 000
Company 31/12/2015
₦ 000
Company 31/12/2014
₦ 000
Naira strengthens by 12% (2014: 12%) against Euro
1,069,180 (1,721,708) 1,005,246 (459,758)
Naira strengthens by 12% (2014: 12%) against US Dollar
(1,455,585) 26,487 (1,455,585) 38,455
Impact on reported profit (386,405) (1,695,221) (450,340) (421,303)
Foreign exchange rate risk sensitivity to foreign exchange movements in the above exam-ple has been calculated on a symmetric basis. The symmetric basis assumes that increase or decrease in foreign exchange movement would result in the same amount.
30.3.2 Credit risk management according to IFRS
Credit risk is the risk that counterparty will not meet its obligations under a financial instru-ment or customer contract, leading to a financial loss. The Group is exposed to credit risk from its investing activities (primarily trade receivables), and from its financing activities; in-cluding deposits with financial institutions and financial guarantees. The Group has adopt-ed a policy of only dealing with creditworthy counterparties and obtaining sufficient collat-eral (in form of advances), where appropriate, as a means of mitigating the risk of financial loss from defaults. The Group transacts with government, government institutions and other top rate entities and individuals that are rated the equivalent of investment grade and above. This information is supplied by independent rating agencies where available and, if not available, the Group uses other publicly available financial information and its own trading records to rate its major customers. The Group’s exposure and the credit ratings of its counterparties are continuously monitored and the aggregate value of transactions con-cluded is spread amongst approved counterparties. Credit exposure is controlled by coun-terparty limits that are reviewed and approved by the risk management committee annually.
30.3.2.1 Trade receivables according to IFRS
Credit risk from balances with banks and financial institutions is managed by the Group’s treasury department in accordance with the Group’s policy. Surplus funds are spread amongst reputable commercial banks and funds must be within credit limits assigned to each counterpart. Counterpart credit limits are reviewed by the Group’s financial controller periodically and may be updated throughout the year. The limits are set to minimise the concentration of risks and therefore mitigate financial loss through potential counterparty’s failure.
30.3.2.2 Deposits with financial institutions according to IFRS
Credit risk from balances with banks and financial institutions is managed by the Group’s treasury department in accordance with the Group’s policy. Surplus funds are spread amongst reputable commercial banks and funds must be within credit limits assigned to each counterpart. Counterpart credit limits are reviewed by the Group’s financial controller periodically and may be updated throughout the year. The limits are set to minimise the concentration of risks and therefore mitigate financial loss through potential counterparty’s failure.
108
Julius Berger Nigeria Plc AR & FS 2015 | Notes to the Financial Statements

30.3.2.3 Exposure to credit risks according to IFRS
The carrying value of the Company’s financial assets represents its maximum exposure to credit risk. The maximum exposure to credit risk at the reporting date was:
Group 31/12/2015
₦ 000
Group 31/12/2014
₦ 000
Company 31/12/2015
₦ 000
Company 31/12/2014
₦ 000
Trade receivables 74,657,501 50,209,773 73,351,892 51,492,167
Cash and bank balances 13,360,038 23,473,159 10,148,623 11,716,041
88,017,539 73,682,932 83,500,515 63,208,208
30.3.2.4 Collateral held as security and other credit enhancements according to IFRS
Except in the form of advances, the Group does not hold any other collateral or other credit enhancements to cover its credit risks associated with its financial assets.
30.3.3 Liquidity risk management according to IFRS
Ultimate responsibility for liquidity risk management rests with the board of directors, which has established an appropriate liquidity risk management framework for the management of the Group’s short, medium and long-term funding and liquidity management require-ments. The Group manages liquidity risk by maintaining adequate reserves, banking facil-ities and reserve borrowing facilities, by continuously monitoring forecast and actual cash flows, and by matching the maturity profiles of financial assets and liabilities.
The maturity profile of the recognised financial instruments are as follows:
Group < 1 year₦ 000
1 – 3 years₦ 000
4–6 years₦ 000
Total₦ 000
Financial assets
Trade and other receivables 84,792,838 – – 84,792,838
Tax receivable 5,292,205 21,039,915 – 26,332,120
Amount due from customers under construction contracts
27,228,427 – – 27,228,427
Cash and bank balances 13,360,038 – – 13,360,038
130,673,508 21,039,915 – 151,713,423
Financial liabilities
Borrowings 24,807,936 – – 24,807,936
Trade and other payables 34,596,825 – – 34,596,825
Retirement benefit liabilities 151,437 – – 151,437
59,556,198 – – 59,556,198
109
Julius Berger Nigeria Plc AR & FS 2015 | Notes to the Financial Statements
Back to Contents

Company < 1 year₦ 000
1 – 3 years₦ 000
4–6 years₦ 000
Total₦ 000
Financial assets
Trade and other receivables 86,145,011 – – 86,145,011
Tax receivable 5,235,578 20,273,902 – 25,509,480
Amount due from customers under construction contracts
27,204,457 – – 27,204,457
Cash and bank balances 10,148,623 – – 10,148,623
128,733,669 20,273,902 – 149,007,571
Financial liabilities
Borrowings 24,807,936 – – 24,807,936
Trade and other payables 44,125,695 – – 44,125,695
Retirement benefit liabilities 24,501 – – 24,501
68,958,132 – – 68,958,132
30.3.4 Fair value of financial instruments
Trade and other receivables / payables, cash and cash equivalents and short term invest-ments are valued at their amortised cost, which are deemed to reflect their value.
31. Related party information
31.1 Identity of related entities
▪ Abumet Nigeria Ltd., subsidiary ▪ Julius Berger Services Nigeria Ltd., subsidiary ▪ PrimeTech Design and Engineering Nigeria Ltd., subsidiary ▪ Julius Berger Medical Services Ltd., subsidiary ▪ Julius Berger International GmbH, subsidiary ▪ Julius Berger Investments Ltd., subsidiary ▪ Julius Berger Free Zone Enterprise, subsidiary ▪ CEC Construction Engineering + Contracting GmbH, sub-subsidiary
Abumet Nigeria Ltd.
This is a 90% owned subsidiary of Julius Berger Nigeria Plc. The Company entered into various transactions with the related party ranging from purchase of goods and services, to expenses incurred by the related company. The outstanding amount is from the various transactions entered with the related party.
Julius Berger Services Nigeria Ltd.
This is a 100% owned subsidiary of Julius Berger Nigeria Plc. The Company entered into various transactions with the related party ranging from stevedoring services, to expenses incurred by the related company. The outstanding amount is from the various transactions entered with the related party.
110
Julius Berger Nigeria Plc AR & FS 2015 | Notes to the Financial Statements

PrimeTech Design and Engineering Nigeria Ltd.
This is a 100 % owned subsidiary of Julius Berger Nigeria Plc. The Company entered into various transactions with the related party ranging from Design and Engineering services, to expenses incurred by the related company. The outstanding amount is from the various transactions entered with the related party.
Julius Berger Medical Services Ltd.
This is a 100 % owned subsidiary of Julius Berger Nigeria Plc. The Company entered into various transactions with the related party ranging from Medical services, to expenses incurred by the related company. The outstanding amount is from the various transactions entered with the related party.
Julius Berger International GmbH
This is a 100 % owned subsidiary of Julius Berger Nigeria Plc. The Company entered into various transactions with the related party ranging from purchase of goods and services, to expenses incurred by the related company. The outstanding amount is from the various transactions entered with the related party.
Julius Berger Investments Ltd.
This is a 100 % owned subsidiary of Julius Berger Nigeria Plc. The Company did not enter into any transactions with the related party in the period.
Julius Berger Free Zone Enterprise
This is a 100 % owned subsidiary of Julius Berger Nigeria Plc. The Company entered into various transactions with the related party ranging from engineering services, to expenses incurred by the related company. The outstanding amount is from the various transactions entered with the related party.
CEC Construction Engineering + Contracting GmbH
This is a wholly owned subsidiary of Julius Berger International GmbH. The Company did not enter into any transactions with the related party in the period.
111
Julius Berger Nigeria Plc AR & FS 2015 | Notes to the Financial Statements
Back to Contents

31.2 Outstanding balances
Group 31/12/2015
₦ 000
Group 31/12/2014
₦ 000
Company 31/12/2015
₦ 000
Company 31/12/2014
₦ 000
Due from related entities
Abumet Nigeria Ltd. – – 1,119,657 922,361
Julius Berger Services Nigeria Ltd. – – 425,090 1,121,032
PrimeTech Design and Engineering Nigeria Ltd.
– – 437,074 219,833
Julius Berger Medical Services Ltd. – – 1,023,964 914,273
Julius Berger International GmbH – – 23 324
Julius Berger Free Zone Enterprise – – 1,025,539 –
– – 4,031,347 3,177,823
Due to related entities
Abumet Nigeria Ltd. – – 218,772 584,925
Julius Berger Services Nigeria Ltd. – – 259,917 627,296
PrimeTech Design and Engineering Nigeria Ltd.
– – 196,836 99,323
Julius Berger Medical Services Ltd. – – 426,964 262,508
Julius Berger International GmbH – – 17,767,799 18,560,531
– – 18,870,288 20,134,583
The outstanding balances due from / to related entities are not secured.
31.3 Related party transactions
During the year the Company traded with related parties on terms similar to such trans-actions entered into with third parties as follows:
Group Sale of goods
& services₦ 000
Group Purchase of
goods & services₦ 000
Company Sale of goods
& services₦ 000
Company Purchase of
goods & services₦ 000
Julius Berger Services Nigeria Ltd. – – 153,536 1,248,912
Abumet Nigeria Ltd. – – 2,041,817 1,386,990
PrimeTech Design and Engineering Nigeria Ltd.
– – 637,704 488,009
Julius Berger Medical Services Ltd. – – 993,112 1,176,693
Julius Berger International GmbH – – 947 15,550,032
Julius Berger Investment Ltd. – – – –
Julius Berger Free Zone Enterprise – – 1,052,187 –
– – 4,879,303 19,850,636
112
Julius Berger Nigeria Plc AR & FS 2015 | Notes to the Financial Statements

31.4 Key Management Personnel
Key Management Personnel are also regarded as related parties. Key Management Per-sonnel are those persons having authority and responsibility for planning, directing and controlling the activities of the Group, directly or indirectly, including all Executive and Non-Executive Directors.
31.4.1 Remuneration of Key Management Personnel
Group 31/12/2015
₦ 000
Group 31/12/2014
₦ 000
Company 31/12/2015
₦ 000
Company 31/12/2014
₦ 000
Short term benefits 460,858 454,630 458,858 454,390
Long term benefits – – – –
Post-employment benefits – – – –
Termination benefits – – – –
460,858 454,630 458,858 454,390
The short term benefits include fees and expenses and other remunerations for Directors.
31.5 Details of loans from / to Key Management Personnel
There were no loans from / to Key Management Personnel during the reporting period.
31.6 Identify the ultimate controlling party of Julius Berger Nigeria Plc
No entity has been identified as the ultimate controlling party for the reporting period.
113
Julius Berger Nigeria Plc AR & FS 2015 | Notes to the Financial Statements
Back to Contents

31.7 Other information on Key Management Personnel
Group 31/12/2015
₦ 000
Group 31/12/2014
₦ 000
Company 31/12/2015
₦ 000
Company 31/12/2014
₦ 000
Emoluments
Chairman 5,200 5,200 5,200 5,200
Other directors 455,658 449,430 453,658 449,190
460,858 454,630 458,858 454,390
Fees 20,700 20,700 20,700 20,700
Other emoluments 440,158 433,930 438,158 433,930
460,858 454,630 458,858 454,630
Highest paid Director 147,433 134,822 147,433 134,822
The number of Directors excluding the Chairman whose emoluments fell within the follow-ing ranges were:
₦ 190,001 – ₦ 3,000,000 8 7 8 7
₦ 3,000,001 and above 7 7 5 5
Number of Directors who had no emoluments
– – – –
No Director’s emoluments other than stated were waived during the year and no payments were made to any Directors, past or present in respect of pension and compensation for loss of office.
32. Guarantees and other financial commitments
32.1 Guarantee, pledge of financial commitments
The Company and its subsidiaries did not guarantee or pledge any financial commitment for liabilities of third parties.
32.2 Contingent liabilities
There were no known contingent liabilities in the ordinary course of business.
32.3 Financial commitments
The Directors are of the opinion that all known liabilities and commitments have been taken into account in the preparation of these Financial Statements.
114
Julius Berger Nigeria Plc AR & FS 2015 | Notes to the Financial Statements

33. Events after the reporting period
There were no material events after the reporting period, which could have had material effect on the state of affairs of the Group, as at December 31, 2015, and the profit for the year then ended date that have not been adequately provided for or recognised in the Financial Statements.
34. Approval of Financial Statements
The Financial Statements were approved by the Board of Directors and authorised for issue on March 17, 2016.
115
Julius Berger Nigeria Plc AR & FS 2015 | Notes to the Financial Statements
Back to Contents

Abumet Nigeria Ltd.Abumet Nigeria Ltd. is a leading solutions provider for the planning, production and installation of aluminium and glass prod-ucts, from single standard windows to so-phisticated facades and large scale design masterpieces. To guarantee high standards in production and support the company’s ability to meet even the most challenging project requirements, Abumet Nigeria Ltd. maintains worldwide partnerships with reputable manufactures and maintains a state-of-the-art production facility, located in FCT Abuja, fully equipped with cutting- edge machinery and technology.
116

Additional
Information for the Year Ended December 31, 2015
117117 Back to Contents

Statement of
Value Added
“Value added” represents the additional wealth which the Company has been able to create by its employees’ efforts. This state-ment shows the allocation of that wealth between employees, shareholders, govern-ment, providers of finance and that retained for the future creation of more wealth.
Group 2015
₦ 000
Group 2015
%
Group 2014
₦ 000
Group 2014
%
Company 2015
₦ 000
Company 2015
%
Company 2014
₦ 000
Company 2014
%
Revenue 133,807,574 196,808,632 119,242,542 179,978,707
Bought in materials and services
Foreign (3,564,510) – (65,668,389) – (33,806,750) – (66,778,048) –
Local (47,047,681) – (44,445,727) – (32,420,549) – (40,491,269) –
Value added 83,195,383 100.0 86,694,516 100.0 53,015,243 100.0 72,709,390 100.0
Applied as follows:
To pay employees’ salaries, wages, and social benefits
Staff costs 61,380,416 73.8 57,936,605 66.9 31,210,927 58.9 47,422,600 65.2
To pay providers of capital
Finance costs 6,148,772 7.4 5,981,450 6.9 6,148,772 11.6 5,958,645 8.2
To pay government
Taxation 6,336,526 7.6 3,769,596 4.3 5,770,100 10.9 3,135,511 4.3
To provide for maintenance and development
Depreciation 9,846,250 11.8 9,618,629 11.1 9,601,578 18.1 9,533,924 13.1
Deferred tax (2,276,693) (2.7) 1,125,321 1.3 (2,372,434) (4.5) 162,896 0.2
Retained earnings 1,759,887 2.1 8,088,795 9.3 2,656,300 5.0 6,495,814 8.9
Non-controlling interest 225 0.0 174,120 0.2 – – – –
Value added 83,195,383 100.0 86,694,516 100.0 53,015,243 100.0 72,709,390 100.0
118
Julius Berger Nigeria Plc AR & FS 2015 | Statement of Value Added

Group 2015
₦ 000
Group 2015
%
Group 2014
₦ 000
Group 2014
%
Company 2015
₦ 000
Company 2015
%
Company 2014
₦ 000
Company 2014
%
Revenue 133,807,574 196,808,632 119,242,542 179,978,707
Bought in materials and services
Foreign (3,564,510) – (65,668,389) – (33,806,750) – (66,778,048) –
Local (47,047,681) – (44,445,727) – (32,420,549) – (40,491,269) –
Value added 83,195,383 100.0 86,694,516 100.0 53,015,243 100.0 72,709,390 100.0
Applied as follows:
To pay employees’ salaries, wages, and social benefits
Staff costs 61,380,416 73.8 57,936,605 66.9 31,210,927 58.9 47,422,600 65.2
To pay providers of capital
Finance costs 6,148,772 7.4 5,981,450 6.9 6,148,772 11.6 5,958,645 8.2
To pay government
Taxation 6,336,526 7.6 3,769,596 4.3 5,770,100 10.9 3,135,511 4.3
To provide for maintenance and development
Depreciation 9,846,250 11.8 9,618,629 11.1 9,601,578 18.1 9,533,924 13.1
Deferred tax (2,276,693) (2.7) 1,125,321 1.3 (2,372,434) (4.5) 162,896 0.2
Retained earnings 1,759,887 2.1 8,088,795 9.3 2,656,300 5.0 6,495,814 8.9
Non-controlling interest 225 0.0 174,120 0.2 – – – –
Value added 83,195,383 100.0 86,694,516 100.0 53,015,243 100.0 72,709,390 100.0
119
Julius Berger Nigeria Plc AR & FS 2015 | Statement of Value Added
Back to Contents
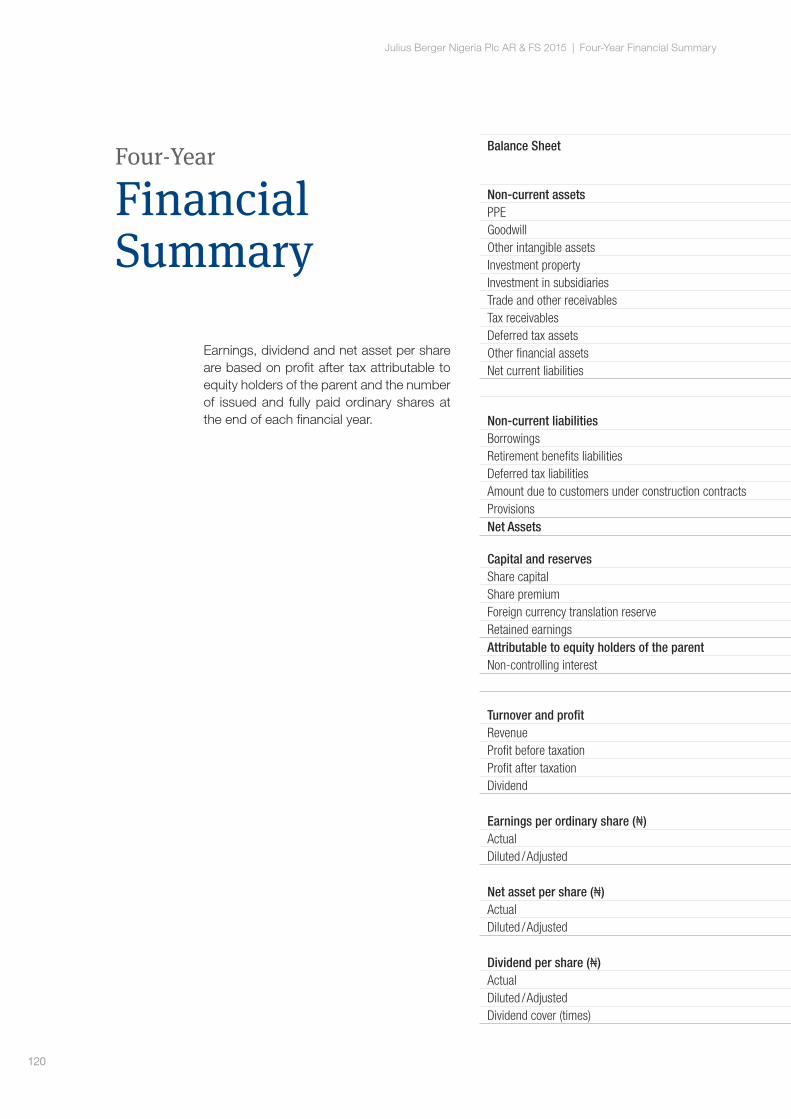
Four-Year
Financial Summary
Earnings, dividend and net asset per share are based on profit after tax attributable to equity holders of the parent and the number of issued and fully paid ordinary shares at the end of each financial year.
Balance Sheet Group 2015
₦ 000
Group 2014
₦ 000
Group 2013
₦ 000
Group 2012
₦ 000
Company 2015
₦ 000
Company 2014
₦ 000
Company 2013
₦ 000
Company 2012
₦ 000
Non-current assetsPPE 58,376,513 68,369,671 67,995,915 57,079,027 55,470,657 66,711,736 66,542,850 56,172,990 Goodwill 5,041,184 4,606,412 4,842,708 4,634,422 – – – – Other intangible assets 32,712 77,402 118,297 127,935 – – – – Investment property 2,546,436 2,648,412 780,177 – 2,546,436 2,648,412 780,177 – Investment in subsidiaries – – – – 15,193,398 13,131,581 12,195,207 11,375,207 Trade and other receivables 844,122 2,334,764 1,469,591 1,706,067 844,122 1,622,353 1,469,591 1,706,063 Tax receivables 21,039,915 35,060,509 31,075,595 25,957,783 20,273,902 34,272,482 30,313,672 25,368,942 Deferred tax assets 10,087,301 8,041,407 7,468,271 3,017,036 9,874,831 7,867,780 7,772,392 2,899,471 Other financial assets – – – 4,125,734 – – – 4,125,734 Net current liabilities 48,542,538 19,201,927 8,303,547 13,574,847 40,089,016 4,744,619 (1,759,845) 7,354,969
146,510,721 140,340,504 122,054,101 110,222,851 144,292,362 130,998,963 117,314,044 109,003,376 Non-current liabilitiesBorrowings – (3,201,710) (6,435,141) – – (3,201,710) (6,435,141) – Retirement benefits liabilities (1,853,781) (1,996,506) (2,033,004) (1,656,643) (1,420,945) (1,606,929) (1,678,155) (1,449,205)Deferred tax liabilities (12,989,322) (13,220,121) (12,336,676) (5,666,877) (12,568,459) (12,933,842) (12,675,558) (5,693,035)Amount due to customers under construction contracts (106,971,355) (93,690,330) (80,214,852) (87,755,151) (111,344,506) (93,690,330) (80,214,852) (87,339,455)Provisions (404,308) (2,135,994) – – (300,000) – – – Net Assets 24,291,955 26,095,843 21,034,428 15,144,180 18,658,452 19,566,152 16,310,338 14,521,681 Capital and reservesShare capital 660,000 660,000 600,000 600,000 660,000 660,000 600,000 600,000 Share premium 425,440 425,440 425,440 425,440 425,440 425,440 425,440 425,440 Foreign currency translation reserve 419,755 919,411 687,896 222,992 – – – – Retained earnings 22,729,580 23,420,332 18,863,052 13,774,577 17,573,012 18,480,712 15,284,898 13,496,241 Attributable to equity holders of the parent 24,234,775 25,425,183 20,576,388 15,023,009 18,658,452 19,566,152 16,310,338 14,521,681 Non-controlling interest 57,180 670,660 458,040 121,171 – – – –
24,291,955 26,095,843 21,034,428 15,144,180 18,658,452 19,566,152 16,310,338 14,521,681 Turnover and profitRevenue 133,807,574 196,808,632 212,737,291 201,565,276 119,242,541 179,978,707 184,212,185 196,954,713 Profit before taxation 6,499,973 13,134,896 16,220,536 12,341,492 6,234,338 10,028,524 10,976,029 13,496,241 Profit after taxation 1,759,887 8,088,795 8,064,235 8,193,543 2,656,300 6,495,814 4,733,213 7,772,055 Dividend – – 3,240,000 3,000,000 – – 3,240,000 3,000,000
Earnings per ordinary share (₦)Actual 1.33 6.13 6.72 6.83 2.01 4.92 3.94 6.48 Diluted / Adjusted 1.33 6.13 6.11 6.21 2.01 4.92 3.59 5.89
Net asset per share (₦)Actual 18.40 19.77 17.53 12.62 14.14 14.82 13.59 12.10 Diluted / Adjusted 18.40 19.77 15.94 11.47 14.14 14.82 12.36 11.00
Dividend per share (₦)Actual – 2.70 2.70 2.50 – 2.70 2.70 2.50 Diluted / Adjusted – 2.70 2.45 2.27 – 2.70 2.45 2.27 Dividend cover (times) – 2.23 2.49 2.73 – 1.82 1.46 2.59
120
Julius Berger Nigeria Plc AR & FS 2015 | Four-Year Financial Summary

Balance Sheet Group 2015
₦ 000
Group 2014
₦ 000
Group 2013
₦ 000
Group 2012
₦ 000
Company 2015
₦ 000
Company 2014
₦ 000
Company 2013
₦ 000
Company 2012
₦ 000
Non-current assetsPPE 58,376,513 68,369,671 67,995,915 57,079,027 55,470,657 66,711,736 66,542,850 56,172,990 Goodwill 5,041,184 4,606,412 4,842,708 4,634,422 – – – – Other intangible assets 32,712 77,402 118,297 127,935 – – – – Investment property 2,546,436 2,648,412 780,177 – 2,546,436 2,648,412 780,177 – Investment in subsidiaries – – – – 15,193,398 13,131,581 12,195,207 11,375,207 Trade and other receivables 844,122 2,334,764 1,469,591 1,706,067 844,122 1,622,353 1,469,591 1,706,063 Tax receivables 21,039,915 35,060,509 31,075,595 25,957,783 20,273,902 34,272,482 30,313,672 25,368,942 Deferred tax assets 10,087,301 8,041,407 7,468,271 3,017,036 9,874,831 7,867,780 7,772,392 2,899,471 Other financial assets – – – 4,125,734 – – – 4,125,734 Net current liabilities 48,542,538 19,201,927 8,303,547 13,574,847 40,089,016 4,744,619 (1,759,845) 7,354,969
146,510,721 140,340,504 122,054,101 110,222,851 144,292,362 130,998,963 117,314,044 109,003,376 Non-current liabilitiesBorrowings – (3,201,710) (6,435,141) – – (3,201,710) (6,435,141) – Retirement benefits liabilities (1,853,781) (1,996,506) (2,033,004) (1,656,643) (1,420,945) (1,606,929) (1,678,155) (1,449,205)Deferred tax liabilities (12,989,322) (13,220,121) (12,336,676) (5,666,877) (12,568,459) (12,933,842) (12,675,558) (5,693,035)Amount due to customers under construction contracts (106,971,355) (93,690,330) (80,214,852) (87,755,151) (111,344,506) (93,690,330) (80,214,852) (87,339,455)Provisions (404,308) (2,135,994) – – (300,000) – – – Net Assets 24,291,955 26,095,843 21,034,428 15,144,180 18,658,452 19,566,152 16,310,338 14,521,681 Capital and reservesShare capital 660,000 660,000 600,000 600,000 660,000 660,000 600,000 600,000 Share premium 425,440 425,440 425,440 425,440 425,440 425,440 425,440 425,440 Foreign currency translation reserve 419,755 919,411 687,896 222,992 – – – – Retained earnings 22,729,580 23,420,332 18,863,052 13,774,577 17,573,012 18,480,712 15,284,898 13,496,241 Attributable to equity holders of the parent 24,234,775 25,425,183 20,576,388 15,023,009 18,658,452 19,566,152 16,310,338 14,521,681 Non-controlling interest 57,180 670,660 458,040 121,171 – – – –
24,291,955 26,095,843 21,034,428 15,144,180 18,658,452 19,566,152 16,310,338 14,521,681 Turnover and profitRevenue 133,807,574 196,808,632 212,737,291 201,565,276 119,242,541 179,978,707 184,212,185 196,954,713 Profit before taxation 6,499,973 13,134,896 16,220,536 12,341,492 6,234,338 10,028,524 10,976,029 13,496,241 Profit after taxation 1,759,887 8,088,795 8,064,235 8,193,543 2,656,300 6,495,814 4,733,213 7,772,055 Dividend – – 3,240,000 3,000,000 – – 3,240,000 3,000,000
Earnings per ordinary share (₦)Actual 1.33 6.13 6.72 6.83 2.01 4.92 3.94 6.48 Diluted / Adjusted 1.33 6.13 6.11 6.21 2.01 4.92 3.59 5.89
Net asset per share (₦)Actual 18.40 19.77 17.53 12.62 14.14 14.82 13.59 12.10 Diluted / Adjusted 18.40 19.77 15.94 11.47 14.14 14.82 12.36 11.00
Dividend per share (₦)Actual – 2.70 2.70 2.50 – 2.70 2.70 2.50 Diluted / Adjusted – 2.70 2.45 2.27 – 2.70 2.45 2.27 Dividend cover (times) – 2.23 2.49 2.73 – 1.82 1.46 2.59
121
Julius Berger Nigeria Plc AR & FS 2015 | Four-Year Financial Summary
Back to Contents

Share Capital History
Note: On May 4, 1979, the authorised share capital of the Company of 60,000 ordinary shares of ₦ 200 each was converted to 24 million ordinary shares of 50 Kobo each. From December 29, 1969 to 1972, shares were denominated in the Nigerian pound but in this schedule, all the shares have been converted and denominated in Naira.
Year Authorised share capital nominal value Issued and paid-up share capital
Number of shares ₦ Number of shares ₦
1970 400,000 200,000 400,000 200,000
1972 1,800,000 900,000 1,793,200 896,600
1974 3,000,000 1,500,000 2,993,200 1,496,600
1976 4,000,000 2,000,000 4,000,000 2,000,000
1977 11,600,000 5,800,000 – –
1978 24,000,000 12,000,000 24,000,000 12,000,000
1990 60,000,000 30,000,000 – –
1991 – – 48,000,000 24,000,000
1992 – – 60,000,000 30,000,000
1993 90,000,000 45,000,000 90,000,000 45,000,000
1996 180,000,000 90,000,000 180,000,000 90,000,000
2000 225,000,000 112,500,000 225,000,000 112,500,000
2001 270,000,000 135,000,000 – –
2005 345,000,000 172,500,000 300,000,000 150,000,000
2008 1,245,000,000 622,500,000 1,200,000,000 600,000,000
2014 1,600,000,000 800,000,000 1,320,000,000 660,000,000
122
Julius Berger Nigeria Plc AR & FS 2015 | Share Capital History

Julius Berger Nigeria Plc AR & FS 2015 | Glossary
Glossary
Term Explanation Term Explanation
AGM . . . . . . . . . . . . . . Annual General MeetingAR & FS . . . . . . . . . Annual Reports and Financial StatementsAVM . . . . . . . . . . . . . . . Air Vice Marshall BBA . . . . . . . . . . . . . . . Bachelor of Business and Administration BE . . . . . . . . . . . . . . . . . . Bachelor of EngineeringBSc . . . . . . . . . . . . . . . . Bachelor of ScienceBrig. Gen. . . . . . . Brigadier GeneralCAMA . . . . . . . . . . . . The Companies and Allied Matters Act, Cap C20,
Laws of the Federation of Nigeria 2004 as amended from time to time.
CBN . . . . . . . . . . . . . . . Central Bank of NigeriaCFR . . . . . . . . . . . . . . . Commander of the Order of the Federal RepublicCON . . . . . . . . . . . . . . Commander of the Order of the NigerCSCS . . . . . . . . . . . . . Central Securities Clearing SystemCSR . . . . . . . . . . . . . . . Corporate Social ResponsibilityDSc . . . . . . . . . . . . . . . Doctor of Science DBA . . . . . . . . . . . . . . . Doctor of Business AdministrationDr. . . . . . . . . . . . . . . . . . DoctorEngr. . . . . . . . . . . . . . . EngineerFCT . . . . . . . . . . . . . . . . Federal Capital TerritoryFIRS . . . . . . . . . . . . . . Federal Inland Revenue ServiceFRC(N) . . . . . . . . . . . Financial Reporting Council (of Nigeria)FS . . . . . . . . . . . . . . . . . Financial StatementsFSS . . . . . . . . . . . . . . . . Forces Service StarGCON . . . . . . . . . . . . Grand Commander of the Order of the Niger GmbH . . . . . . . . . . . . German equivalent to Ltd.HC . . . . . . . . . . . . . . . . . Honoris CausaHRH . . . . . . . . . . . . . . . His Royal HighnessHSE . . . . . . . . . . . . . . . Health, Safety Environmenti.e. . . . . . . . . . . . . . . . . . in exampleIAS . . . . . . . . . . . . . . . . . International Accounting StandardsIASB . . . . . . . . . . . . . . International Accounting Standards BoardIFRIC . . . . . . . . . . . . . International Financial Reporting Interpretation
Committee IFRS . . . . . . . . . . . . . . International Financial Reporting Standards ISO . . . . . . . . . . . . . . . . . International Organisation for StandardisationJP . . . . . . . . . . . . . . . . . . Justice of PeaceKSS . . . . . . . . . . . . . . . . Knight of Saint Silvester
LLD . . . . . . . . . . . . . . . Doctor of Laws (honorary degree)Ltd. . . . . . . . . . . . . . . . . Limited Liability CompanyNJIC . . . . . . . . . . . . . . National Joint Industrial CouncilNo. / Nos. . . . . . . Number / NumbersNOTAP . . . . . . . . . . . . National Office for Technology Acquisition
and PromotionNSE . . . . . . . . . . . . . . . Nigerian Stock ExchangeOFR . . . . . . . . . . . . . . . Officer of the Order of the Federal RepublicPlc . . . . . . . . . . . . . . . . . Public Limited CompanyPPE . . . . . . . . . . . . . . . Property, Plant and Equipmentpsc . . . . . . . . . . . . . . . . passed staff college (Diploma in Military Science)RC No. . . . . . . . . . . . the Company Registration (Incorporation) NumberS . . . . . . . . . . . . . . . . . . . . Sections in statutesSE . . . . . . . . . . . . . . . . . Societas EuropeaSEC . . . . . . . . . . . . . . . Securities and Exchange Commission the Articles . . . . Articles of Association of the Companythe Board . . . . . . The Board of Directors of Julius Berger Nigeria Plcthe Code . . . . . . . . The Code of Corporate Governance in Nigeria,
published in April 2011 by the SECthe Company . . Julius Berger Nigeria Plcthe Group . . . . . . . Julius Berger Nigeria Plc and its subsidiariesthe Directors . . The Directors of Julius Berger Nigeria Plcthe Regulators SEC, NSE and any other body legally charged
with regulatory oversight over the aspects of the Group’s affairs
the Rules . . . . . . . The rules of the NSEusawc . . . . . . . . . . . . Fellow of the USA War College VAT . . . . . . . . . . . . . . . . Value Added Taxwef . . . . . . . . . . . . . . . . with effect from
123 Back to Contents

Julius Berger Nigeria Plc AR & FS 2015 | Shareholder Forms
Shareholder Information
Our Esteemed Shareholders,Several of you, our esteemed shareholders, and indeed the Regulators, have expressed to the Board their concerns about the unclaimed dividend balances as well as the status of unclaimed certificates. After dis-cussing with the Registrars, it was recognised that the Company, the shareholders and Reg-istrars share the burden of ensuring that the balance on the unclaimed dividends account is kept well reduced and evidence of holdings are properly documented.To this end, all shareholders of the Compa-ny with unclaimed dividends and certificates are urged to come forward to claim their divi-dends and certificates.
Shareholders are also encouraged to:1. Inform the Registrars promptly of any
change of address or significant information that may affect their records as sharehold-ers and follow up to ensure rectification.
2. Have their accounts mandated for e-divi-dend payment. Dividends would be cred-ited to the account stated electronically. To forestall a situation where complaints are made of non-payment, the Registrars would, contemporaneously with remit-tance to the various banks for the man-dated account(s) of shareholder(s), for-ward advice slips of payment(s) made to such shareholder(s).
3. Establish CSCS accounts to which shares arising from corporate actions such as bonus, rights and offers for sale or sub-scription would be credited.
An enclosed CD contains the following in-formation, which is also available on the in-vestor relations portal on the Company’s
website, www.julius-berger.com, as well as on the website of the Registrars, GTL Regis-trars Ltd., (formerly Union Registrars Ltd.):1. Julius Berger Nigeria Plc Annual Reports
and Financial Statements 20152. Julius Berger Nigeria Plc Unclaimed Share
Certificates and Dividends 20153. Julius Berger Nigeria Plc Proxy and
Admission Forms for the 46th AGM4. Julius Berger Nigeria Plc Authority to
Mandate and Change of Information Form5. A list of the offices of the Company and
the Registrars nationwide
The Proxy and Admission Forms are also avail-able for your use at all offices of the Compa-ny and the Registrars nationwide. The Proxy and Admission Forms together with the Authority to Mandate and Change of Infor-mation Form duly filled in, should, in accord-ance with instructions thereon, be deposited with any of the listed offices of the Regis-trars or the Company nationwide. We urge you to take advantage of the forms and the opportunity they present to ease sharehold-er management. We would also advise our shareholders that the Board of Directors has approved a Complaints Management Policy and a Security Trading Policy for the Com-pany, and both policies can be found on the Company’s website, www.julius-berger.com, as well as on the CD.
Yours sincerely,
Mrs. Cecilia Ekanem Madueke Company Secretary
124

Nos. Resolutions For
1. To declare a dividend
2. To re-elect Engr. Heinz Stockhausen as a Director
3. To re-elect Dr. Ernest Nnaemeka Azudialu-Obiejesi as a Director
4. To authorise the Directors to fix the remuneration of Auditors
5. To constitute the Statutory Audit Committee
6. To fix the remuneration of Directors
46th Annual General Meeting (AGM) of Julius Berg-er Nigeria Plc to be held at the Shehu Musa Yar’Ad-ua Centre, 1 Memorial Drive, Abuja FCT on Thurs-day June 16, 2016, at 11:00 a.m. in the forenoon. I / We being a member / members of Julius Berger Nigeria Plc hereby appoint the person named be-low or failing him the Chairman of the Meeting as my / our proxy to vote for me / us and on my / our behalf at the 46th AGM of that Company to be held on June 16, 2016 and at every adjournment thereof.
Notes1. Please indicate with an ‘x’ in the appropriate squares
how you wish your votes to be cast on the resolu-tions set out above.
2. A member (shareholder) who is unable to attend the AGM is allowed to vote by proxy. The above proxy form has been prepared to enable you exercise your right to vote in case you cannot personally attend the Meeting. Members wishing to vote by proxy should please ensure that the appropriate stamp duties due on the proxy form are paid. The proxy must produce the “Admission Card”, attached to this form, to obtain entrance to the Meeting.
3. Provision has been made on this form for the Chair-man of the Meeting to act as your proxy. How-ever, if you so wish, you may insert in the space provided on the form the name of any person, whether a member of the Company or not, who will attend the Meeting and vote on your behalf.
4. Please sign the above proxy form and post it so as to reach the Registrars, GTL Registrars Ltd., (formerly Union Registrars Ltd.), 274 Muritala Muhammed Way, Ebute Metta 101 212, Lagos, not later than 48 hours before the appointed time for holding the Meeting. If executed by a corporation, the proxy form must bear the common seal of such corporation.
5. It is a requirement of the law under the Stamp Duties Act Cap 411, Laws of the Federation of Nigeria 1990, that for any instrument of proxy to be valid for voting at the Meeting of shareholders, it must bear the evidence that the required stamp duties have been paid.
Please admit the person named below at the 46th AGM of Julius Berger Nigeria Plc to be held at 11:00 a.m. in the forenoon on Thursday, June 16, 2016, at the Shehu Musa Yar’Adua Centre,1 Memorial Drive, Abuja FCT.
Mrs. Cecilia Ekanem Madueke Company Secretary
Notes1. This Admission Card must be produced by the share-
holder or his / her proxy in order to gain entry to the venue of the AGM.
2. Shareholders of their proxies must sign this authority for admission before attending the Meeting.
Proxy Form
Admission Card
Attendee’s Name
Signature of Attendee
For Registrars / Company Use Only
Shareholder Name
Number of Shares
Shareholder Name
Proxy Name
Date (dd / mm / yyyy)
Shareholder’s Signature
Before posting the above card please tear off this part and retain it.
Caution: To be valid, this form must be stamped accordingly.
Against
Please fold here for posting.
Tear off from here.
The RegistrarsGTL Registrars Ltd.(formerly Union Registrars Ltd.)274 Muritala Muhammed WayEbute Metta 101 212 Lagos
Please affix postage stamp here

Old Address New Address
Other Information
Telephone Number Shareholder Name
Telephone Number Date (dd / mm / yyyy)
Shareholder Signature
Authority to Mandate and Change of Information
Further please note my / our change of address and other information as follows:
Kindly direct all my / our dividend payment(s) and my /our share(s) in respect of my / our holding(s) in Julius Berger Nigeria Plc into my / our account(s) stated below:
Banker Details CSCS Details
Name of Bank and Branch Name of Broker
Sort Code CSCS Account Number
Account Number (Current or Savings)
Stamp of Bank and Signature of Account Schedule Officer
Stamp of Broker and Signature of Account Schedule Officer

Please fold here for posting.
Please fold here for posting.
Please affix postage stamp here
The RegistrarsGTL Registrars Ltd.(formerly Union Registrars Ltd.)274 Muritala Muhammed WayEbute Metta 101 212 Lagos

Julius Berger Nigeria Plc10 Shettima A. Munguno CrescentUtako 900 108 | FCT Abuja RC No. 6852
Phone: +234 803 906 7000Email: [email protected]
© 2016 Julius Berger Nigeria PlcAll rights reserved
