annual reports 2006 - central bank of yemen
TRANSCRIPT
CENTRAL BANK OF YEMEN
ANNUAL REPORT
2006
GENERAL DEPARTMENT OF RESEARCH AND STATISTICS http://www.centralbank.gov.ye
E-mail:[email protected]
The Speaker – House of Representatives The Prime Minister Dear Sirs, Pursuant to Article (57) of Central Bank of Yemen Law, I am pleased to submit the Balance Sheet for the year ending on 31st December 2006, Profit and Loss Account, as certified by the external auditors, and Report of the Board of Directors on the monetary, credit and economic situation in the country. Thank you very much. Ahmed A. Rehman Al-Samawi Governor Chairman of Board of Directors

Board of Directors For the year ending on 31st December 2006
Mr. Ahmed A. Rehman Al-Samawi: Governor and Chairman of the Board of Directors.
Mr. Mohamed Awad Bin Humam: Deputy Governor and Vice Chairman of the Board of Directors.
Mr. Ahmed Ubaid Al-Fadhli - Vice Minister of Finance Mr. Ali Ali Al-Nouseif Mr. Abdul Gabbar Hayel Saeed Mr. Abdul Rahman Mohamed Al-Kuhalli Mr. Munassar Saleh Mohamed
Member Member Member Member Member

CONTENTS Chapter One World and Domestic Economic Developments 1 Chapter Two Production 19 Chapter Three Government Finance 37 Chapter Four Money and Credit 57 Chapter Five Balance of Payments 79 Balance Sheet 103 Statistical Appendices 114 Appendix 1 Money Supply 115 Appendix 2 Changes in Money Supply 116 Appendix 3 Balance Sheet of the Central Bank of Yemen 117 Appendix 4 Balance Sheet of Commercial Banks 118 Appendix 5 Deposits of Commercial Banks 120 Appendix 6 Interest Rates 121 Appendix 7 Currency Issued by Denominations 122 Appendix 8 Structure of Banking System 123 Appendix 9 Balance of Payments 125 Appendix 10 Central Government Finance 127 Appendix 11 National Accounts 129 Appendix 12 Agricultural Production 133 Appendix 13 Industrial Production 136 Appendix 14 Consumer Price Indices 137 Appendix 15 (a) Market Exchange Rate
(b) Exchange Rate of Major Foreign Currencies
138 139
Appendix 16 Trade Balance 141 Appendix 17 (a) Exports by sections of H.S.
(b) Exports by Country 142 147
Appendix 18 (a) Imports by sections of H.S. (b) Imports by Country
152 155
ــــــــــــــــــــــــــــــــــــــــــــــــــــــــــــــــــــــــــــــــــــــــــــــــــــــــــــــــــــــــــــــــــــــــــــــــــــــCHAPTER ONE WORLD ECONOMIC SITUATION 1
CHAPTER ONE
WORLD ECONOMIC SITUATION
AND DOMESTIC ECONOMIC DEVELOPMENTS
(A) WORLD ECONOMIC DEVELOPMENTS
Introduction
The strong performance of the world economy continued in 2006
and in fact economic growth was half-a-percentage point higher
than it was in the preceding year. Most regions in the world
benefited from the fruits of this strong growth. It is no
coincidence that the global economic expansion of 5.4% in 2006
coincided with a retreat of the risk perception of the external
imbalances hanging over the world economy.
In any way the rapid growth was driven by strong consumption,
which was supported by increasing employment and a fall in oil
prices from their peak levels in the second half of the year, in
addition to an expansion in exports and investment in the
emerging economies. On the other hand, the rapid growth in the
emerging markets and the developing world in general was led by
China and India.

ــــــــــــــــــــــــــــــــــــــــــــــــــــــــــــــــــــــــــــــــــــــــــــــــــــــــــــــــــــــــــــــــــــــــــــــــــــــCHAPTER ONE WORLD ECONOMIC SITUATION 2
Inflationary pressures waned in the second half of 2006 largely as
a result of the decline in oil prices, owing, inter alia, to the onset
of mild weather. Inflation was also kept low by means of tight
monetary policies in many parts of the world. On the whole,
inflation was confined to the lower levels realized in the late
nineties, while the prices of oil and metals remained in the higher
levels by historical standards.
Advanced Economies
The advanced economies consist of thirty countries, the most
important of which are the United States, Japan, the Euro
countries, the United Kingdom, Canada and Australia. The group
also includes a number of Asian countries, namely Japan, South
Korea, Taiwan, Hong Kong and Singapore. This group of
countries produces more than half of the world output and it is
responsible for two-thirds of world trade.
Economic growth in the advanced economies strengthened from
2.5% in 2005 to 3.1% in 2006, ranging from a low of 1.3% in
Portugal to a high of 7.9% in Singapore. Unemployment fell to
5.5%, which is its lowest level in six years, but does not reflect
the higher rates experienced in Western Europe.

ــــــــــــــــــــــــــــــــــــــــــــــــــــــــــــــــــــــــــــــــــــــــــــــــــــــــــــــــــــــــــــــــــــــــــــــــــــــCHAPTER ONE WORLD ECONOMIC SITUATION 3
The United States
In 2006, Economic activity in the United States witnessed a
substantial slowdown in the housing sector together with an
easing in corporate investment. Consumption was supported by
rising employment especially in the services sector and the
decline of oil prices from their peak levels in August. The
Federal Reserve maintained its principal interest rate without
change at 5.25% since June 2006. The aim of the Fed was to
balance the risks in the economy by taking into account the
continuing fears of a resurgence in inflation, resulting from a
sudden upsurge in oil prices.
Economic growth in the United States firmed slightly from 3.2%
in 2005 to 3.3% in 2006. The strong growth in Western Europe
helped in weakening the dollar against the Euro and the Sterling
pound. The real effective exchange rate of the dollar fell by 4%
while that of the Euro and Sterling pound increased by 7%. The
non oil trade deficit declined as a ratio of GDP owing to an
increase in exports, while net foreign liabilities fell moderately.
The Federal budget deficit narrowed considerably to 1.9% of
GDP as a result of buoyant revenues, while unemployment
stabilized at a level of 4.5%.
The current account deficit of the United States rose a little from
6.4% of GDP in 2005 to 6.5% in 2006. The other side of the coin
is that Japan, China, the oil exporting countries, the Euro area as

ــــــــــــــــــــــــــــــــــــــــــــــــــــــــــــــــــــــــــــــــــــــــــــــــــــــــــــــــــــــــــــــــــــــــــــــــــــــCHAPTER ONE WORLD ECONOMIC SITUATION 4
well as emerging markets are all registering current account
surpluses benefiting from the U.S. current account deficit and its
policy of encouraging imports. This deficit, which can be
financed by an inflow of foreign capital into the U.S., gives
emerging markets the opportunity to achieve high rates of growth
by means of expanding exports, in addition to building up
reserves of foreign currencies.
The Euro Area
In 2006 Growth in the Euro Area was the fastest since six years,
driven by domestic demand as a result of the improvement in
employment and labour markets. The European Central Bank and
other central banks in Europe maintained their restrictive
monetary policies. Germany regained its status as the locomotive
of growth in Europe. But inflation in the United Kingdom was
higher than the level targeted.
The growth of GDP in the Euro area increased from 1.4% in
2005 to 2.6% in 2006, which was the fastest since 2000. But
growth in France was slower (2%), Italy (1.9%), Portugal(1.3%)
and more dependent on consumption, unlike Germany (2.7%)
where growth was driven by rising exports and strong investment
over and above buoyant consumption.
Unemployment in the Euro Area fell sharply by the end of 2006
to 7.6% its lowest level in fifteen years. The decline of oil prices
ــــــــــــــــــــــــــــــــــــــــــــــــــــــــــــــــــــــــــــــــــــــــــــــــــــــــــــــــــــــــــــــــــــــــــــــــــــــCHAPTER ONE WORLD ECONOMIC SITUATION 5
in August helped in the fall of inflation to less than 2% by the
year end. While inflation seems to be under control in the euro
area, unemployment is still too high in comparison with similar
economies.
It appears that almost all member countries in the area have
reduced their fiscal deficit to less than 3% of GDP. In U.K. the
deficit even fell to 2.5% of GDP. The Euro Area accounts for
15% of world output compared with 20% for the United States
and 6.3% for Japan. The Area’s share of total world exports of
goods and services amounts to 29% compared with 10% for the
U.S. and 5% for Japan. As far as population is concerned, the
Euro Area accounts for 5% of world total, the U.S. 4.7% and
Japan 2%.
Japan
Real GDP growth in Japan firmed from 1.9% in 2005 to 2.2% in
2006 supported by an expansion of private investment and
accelerating exports. What is worrying about Japan is that
domestic consumption remains subdued. The current account
surplus increased to 4% of GDP in 2006 basically as a result of
the strong growth of exports and income from foreign assets. But
this did not prevent the REER of the Yen against the Dollar to
fall and approach the level prevailing twenty years ago. The Yen
also weakened in nominal terms despite the increase of the
ــــــــــــــــــــــــــــــــــــــــــــــــــــــــــــــــــــــــــــــــــــــــــــــــــــــــــــــــــــــــــــــــــــــــــــــــــــــCHAPTER ONE WORLD ECONOMIC SITUATION 6
Japanese current account surplus. Low interest rates on the Yen
encouraged the flow of capital outside the country.
Inflation in Japan is still hovering around the zero level, while the
Bank of Japan kept the interest rate at 0.5% since it abandoned
the zero rate policy in July 2006. An important cause of the fall
of the Yen was the interest differential with the other major
currencies and the outflow of capital abroad. Rising revenues
helped in narrowing the fiscal deficit to 4.3% of GDP in 2006.
But gross and net domestic public debt remained at 185% and
96% of GDP respectively. These are the highest ratios among the
big industrial economies. Similar to the industrial west, Japan
faces the challenge of an aging population, which requires
structural reforms to deal with the problem.
Developing Countries
Economic growth in developing countries as a group rose from
7.5% in 2005 to 7.9% in 2006, which is much higher than what
was achieved in advanced economies. But vulnerabilities still
remain, including the domestic public debt ratios which are very
high in some countries especially in Latin America and the
increase in bank credit and private debt particularly in emerging
Europe and CIS countries.
ــــــــــــــــــــــــــــــــــــــــــــــــــــــــــــــــــــــــــــــــــــــــــــــــــــــــــــــــــــــــــــــــــــــــــــــــــــــCHAPTER ONE WORLD ECONOMIC SITUATION 7
Asian Emerging Markets
Some emerging countries, including China and India, tightened
credit and investment conditions in the face of accelerating
growth and in fear of overheating. Capital flows into emerging
markets were at their highest level, with Asia attracting the lion’s
share. China, India and the other oil importing economies
benefited from the last decline in oil prices. Growth in China and
India exceeded expectations, largely owing to the increasing use
of new information and telecommunication technologies.
Growth in the Asian Emerging countries as a group increased
from 9.2% in 2005 to 9.4% in 2006. In the same year, the Asian-
4 countries registered a growth rate of 5.4% compared with
10.7% for China and 9.2% for India.
The Middle East
The real effective exchange rates of the oil exporting countries in
the Middle East declined moderately, despite the strong growth in
oil exports and high oil prices, which made the current account
surplus of these countries rise to around 21% of GDP in 2006.
Deteriorating security in the Middle East and supply obstacles
may yet lead to another round of increases in oil prices. After
reaching 76 dollars a barrel in August, the price of oil fell sharply
to 55 dollars in October before closing at 60 dollars a barrel in
December 2006. The fall in oil prices reflects a temporary retreat

ــــــــــــــــــــــــــــــــــــــــــــــــــــــــــــــــــــــــــــــــــــــــــــــــــــــــــــــــــــــــــــــــــــــــــــــــــــــCHAPTER ONE WORLD ECONOMIC SITUATION 8
in geopolitical tensions in the Middle East (Lebanon in
particular), the absence of strong hurricanes and the increasing
perception of a slowdown in economic activity and the demand
for oil. In general, growth in the region improved from 5.4% in
2005 to 5.7% in 2006.
Other Developing Countries
Economic growth fell slightly in Africa from 5.6% in 2005 to
5.5% in 2006 while in Central and Eastern Europe it strengthened
from 5.5% to 6.0% during the same period. In the
Commonwealth of Independent States, economic growth also
improved from 6.6% in 2005 to 7.7% in 2006, while in the
Western Hemisphere growth was more or less similar to what
was achieved in Africa during the same period.
Growth in these regions was either driven by high oil prices in
the case of oil exporting countries or by strong food and metal
prices in the case of the other regions. In some countries
restrictive monetary policies were applied to contain inflationary
pressures. In several countries inflation fell moderately, but in
the CIS countries inflation rates remain among the highest in the
world. In conclusion, despite the progress made in Africa, the
continent still suffers from high levels of poverty.
ــــــــــــــــــــــــــــــــــــــــــــــــــــــــــــــــــــــــــــــــــــــــــــــــــــــــــــــــــــــــــــــــــــــــــــــــــــــCHAPTER ONE WORLD ECONOMIC SITUATION 9
(B) DOMESTIC ECONOMIC DEVELOPMENTS
The Economic Situation in 2006
The nominal gross domestic product continued to grow at a
strong pace in 2006, the first year of the Third Development,
Social and Poverty Reduction Plan (2006-2010), owing to the
continuation of the increase in international oil prices, which
gave rise to positive effects on the non-oil sectors of the
economy.
Data published by the Central Statistical Organization indicate
that in 2006 GDP at current prices expanded by 17.1%, while real
GDP grew at a rate of 3.3%, compared with 25.1% for nominal
GDP and 4.6% for real GDP in 2005. On the other hand, real
non-oil GDP increased by 4.9% in 2006 and 5.3% in 2005.
The strong performance of the international oil market led to a
considerable improvement in public finances, particularly in
higher government oil export revenues. In addition to the rising
oil prices since 2003, the Government's share in oil exports
increased to 63.7 million barrels worth about US dollars 4,013
million in 2006. In comparison, in 2005, the Government's oil
exports were 60.5 million barrels bringing in US dollars 3,115
million in revenue. In 2005, Government oil exports fell slightly
in volume by 2.1%, but rose sharply in revenue by 37.8%. The
average price for Yemeni crude oil was US dollars 63 a barrel in
2006 against 51.5 dollars in 2005.
ــــــــــــــــــــــــــــــــــــــــــــــــــــــــــــــــــــــــــــــــــــــــــــــــــــــــــــــــــــــــــــــــــــــــــــــــــــــCHAPTER ONE WORLD ECONOMIC SITUATION 10
In 2006, the government's fiscal position continued to improve,
with the overall balance registering in 2006 a surplus, albeit a
small one, for the first time in several years. Both gross and net
domestic public debt fell as a ratio of GDP from 12.3% and 5.6%
respectively in 2005 to 11.9% and 4% also respectively in 2006.
It is worth mentioning that treasury bills form the principal
instrument for government borrowing in the primary market,
constituting 80% of gross domestic public debt. On the other
hand, external public debt as a ratio of GDP fell from 30.8% in
2005 to 28.7% in 2006, which is one of the lowest external debt
ratios in the Middle East. Moreover, more than half the Yemeni
external debt is concessionary bearing insignificant rates of
interest with protracted maturities and extended grace periods.
Returning to monetary policy, the Central Bank of Yemen
lowered at the end of February 2006 the reserve requirement ratio
on all foreign currency deposits to 20% , which, since June 2005
was 30%. Foreign currency sales by the Central Bank went down
by 2.5% in 2006, as a result of exchange rate stability and the
retreat of dollarization. Reserve requirement on Rial deposits has
been maintained at 10% and the minimum benchmark interest
rate on Rial deposits at 13% both since July 2000. Domestic
liquidity increased by 28.8% in 2006, compared with an increase
of 14.4% in 2005 to a large extent as a result of the accumulation
of net foreign assets by the banking system. On the other hand,
ــــــــــــــــــــــــــــــــــــــــــــــــــــــــــــــــــــــــــــــــــــــــــــــــــــــــــــــــــــــــــــــــــــــــــــــــــــــCHAPTER ONE WORLD ECONOMIC SITUATION 11
bank credit to non-government sectors expanded by YR 43
billion in 2006.
Rising oil export revenues were behind the increase in the surplus
of the balance of payments as well as the foreign exchange
reserves.
Reflecting the improvement in the external position, the Central
Bank of Yemen was able to achieve a high level of exchange rate
stability for the Yemeni Rial, which has been freely floating since
July 1996. The dollar increased only by about 2% against the
Rial at the end of 2006, while the average dollar/Rial rate was 3%
higher in 2006 than it was in the previous year. The dollar itself
retreated across the board against most other major currencies in
2006, falling in by 10% against the Euro, 12% against the
Sterling pound and 5% against the SDR.
As far as prices are concerned, inflation as measured by the CPI
fell from 19.8% in 2005 to 16.5% in 2006, while the GDP
deflator also retreated from 19.7% to 13.3% during the same
period.
Production
While the extractive industries sector contracted by 7.7% in
2006, growth in the manufacturing sector retreated from 8% in
2005 to 5.1% in 2006. The expansion in the electricity water and
gas sector narrowed from 7.2% in 2005 to 6.5% in 2006.

ــــــــــــــــــــــــــــــــــــــــــــــــــــــــــــــــــــــــــــــــــــــــــــــــــــــــــــــــــــــــــــــــــــــــــــــــــــــCHAPTER ONE WORLD ECONOMIC SITUATION 12
However, the increase in agriculture, forestry and hunting sector
strengthened from 2.1% in 2005 to 3.5% in 2006. Growth in the
construction sector also improved from 4.5% in 2005 to 5.4% in
2006.
The expansion in services slowed down from 6.7% in 2005 to
5.2% in 2006. But growth in the finance, insurance, housing and
business services sector strengthened slightly from 4.1% in 2005
to 4.3% in 2006. In the transport, warehousing and
communication sector, growth strengthened further from 9.2% in
2005 to 9.8% in 2006. On the other hand the expansion in
wholesale and retail trade, restaurants and hotels more than
doubled from 3.5% in 2005 to 7.4% in 2006.
In 2006 final consumption grew by about 14.8% and it
constituted 74.9% of GDP. On the other hand, public final
consumption increased by 21% in 2006 compared with 32.8% the
previous year. Likewise, the increase in private final consumption
fell from 19% in 2005 to 13.5% in 2006.
In view of the deficit in net factor income from abroad, gross
national income grew by 20.9% in 2006 compared with a
stronger growth of 25.1% in 2005, while the increase in gross
disposable national income fell from 23.9% in 2005 to 18.2% in
2006, as a result of the retreat of net current transfers from the
rest of the world.
ــــــــــــــــــــــــــــــــــــــــــــــــــــــــــــــــــــــــــــــــــــــــــــــــــــــــــــــــــــــــــــــــــــــــــــــــــــــCHAPTER ONE WORLD ECONOMIC SITUATION 13
Public Finance
Public revenues rose from 34.5% of GDP in 2005 to 38.6% in
2006, as a result of an increase in both oil and non-oil revenues.
Likewise, public expenditure expanded from 36.8% of GDP in
2005 to 37.8% in 2006, owing to the increase in current as well
as development expenditures by 26% and 10% respectively.
External and Domestic Public Debt
In 2006 gross domestic public debt increased by 12.4% to what is
equivalent to 11.9% of GDP, while net domestic public debt
amounted to only 4%, after taking into account government
deposits at the Central Bank. On the other hand, external public
debt increased by 5.8% in 2006 but fell as a ratio of GDP to only
28.7%.
Money and Credit
In 2006, 8 new bank branches were opened, conventional as well
as Islamic. At the end of 2006 the number of automatic teller
machines (ATMs) increased to 142 and the number of bureaux de
change to 465.
Cheque clearing has also intensified in 2006 and the number of
accounts opened at the banks operating in the country rose
considerably. Most banks increased their paid up capital in

ــــــــــــــــــــــــــــــــــــــــــــــــــــــــــــــــــــــــــــــــــــــــــــــــــــــــــــــــــــــــــــــــــــــــــــــــــــــCHAPTER ONE WORLD ECONOMIC SITUATION 14
accordance with and abiding by Decision No. 12/2004 of the
Board of Directors of the Central Bank of Yemen.
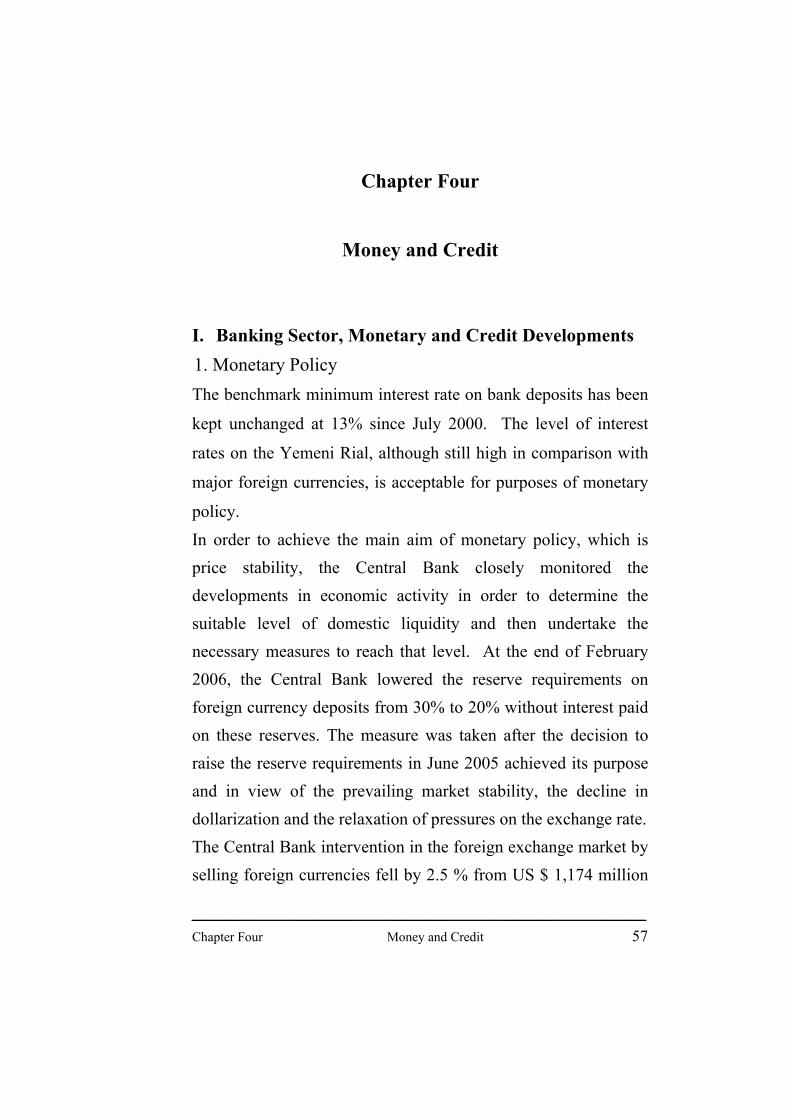
Reviewing the components of domestic liquidity in 2006, M1
increased by YR 116 billion, currency outside banks by YR 82
billion and demand deposits by YR 34 billion. Quasi money
grew by YR 186 billion as a result of an increase of YR 87 billion
in saving, earmarked and time Rial deposits and YR 99 billion in
demand, saving and time foreign currency deposits. Currency in
circulation fell to 46% of Rial broad money, while Rial quasi
money rose from 36% to 38%. Foreign currency deposits
remained unchanged at 34% of broad money.
The balance sheet total of the Central Bank of Yemen increased
by 25% in 2006, compared with a growth of 14% in the previous
year. On the asset side, the increase was concentrated in net
foreign assets, while net claims on government fell as a result of
increasing crude oil revenues. On the liabilities side, the increase
was concentrated in the monetary base.
Foreign currency sales by the Central Bank fell slightly from US
dollars 1,174 million in 2005 to US dollars 1,145 million in 2006.
The main purpose of the sales is to replenish the market with its
needs of foreign exchange as most of it flows into the Central
Bank in the form of oil export revenues. At the end of 2006 the
Yemeni Rial/dollar rate was 198.5 against 195.08 at the end of

ــــــــــــــــــــــــــــــــــــــــــــــــــــــــــــــــــــــــــــــــــــــــــــــــــــــــــــــــــــــــــــــــــــــــــــــــــــــCHAPTER ONE WORLD ECONOMIC SITUATION 15
2005. The average Rial/dollar rate rose from 191.42 in 2005 to
197.05 in 2006.
The balance sheet total of the conventional and Islamic banks
increased by a third in 2006. Bank deposits also increased by a
third. Credit in local currency to the private sector fell from 38%
to 31% of Rial deposits, while foreign currency lending increased
from 46% to 48% of total credit to the private sector. On the
other hand, private sector foreign currency credit fell from 32%
to 30% of foreign currency deposits.
In 2006 banks invested 69% of their assets in foreign assets,
treasury bills, CDs and Central Bank balances, compared with
66% in 2005. Credit to the private sector fell from 28% to 25%
of total assets of the banks. 38% of private sector credit was
allocated for trade finance. Short term loans and advances
constituted 43% of total credit, while medium and long term
credit fell from 4% in 2005 to 2% in 2006.
Balance of Payments
The overall balance of payments surplus rose sharply from US
dollars 584.4 million in 2005 to US dollars 1,446.5 million in
2006. The current account contributed a lot to the surplus in both
years 2005 and 2006 and in building up of the gross own foreign
reserves of the Central Bank of Yemen. Furthermore, the capital
account balance changed from deficit in 2005 to surplus in 2006,

ــــــــــــــــــــــــــــــــــــــــــــــــــــــــــــــــــــــــــــــــــــــــــــــــــــــــــــــــــــــــــــــــــــــــــــــــــــــCHAPTER ONE WORLD ECONOMIC SITUATION 16
as a result of the increase in the investments of the LNG export
project.
The surplus in the current account balance fell from US dollars
633.2 million in 2005 to US dollars 205.7 million in 2006, owing
to the decrease in the surplus in the trade account and net current
transfers as well as the increase in the net services deficit. As
mentioned earlier, the capital account balance changed from a
deficit of US dollars 253.5 million in 2005 to a surplus of US
dollars 1,059.7 million in 2006, as a result of the increase in the
inflow of foreign direct investment. The end product was a sharp
rise in the overall balance surplus, reflecting the increase in the
quantity of crude oil exported as well as the buoyant international
oil prices.
In 2006, net services registered a deficit of US dollars 1,306.2
million, while the deficit in net income reached US dollars
1,234.3 million, directly owing to the high level of payments
made abroad.
ــــــــــــــــــــــــــــــــــــــــــــــــــــــــــــــــــــــــــــــــــــــــــــــــــــــــــــــــــــــــــــــــــــــــــــــــــــــCHAPTER ONE WORLD ECONOMIC SITUATION 17
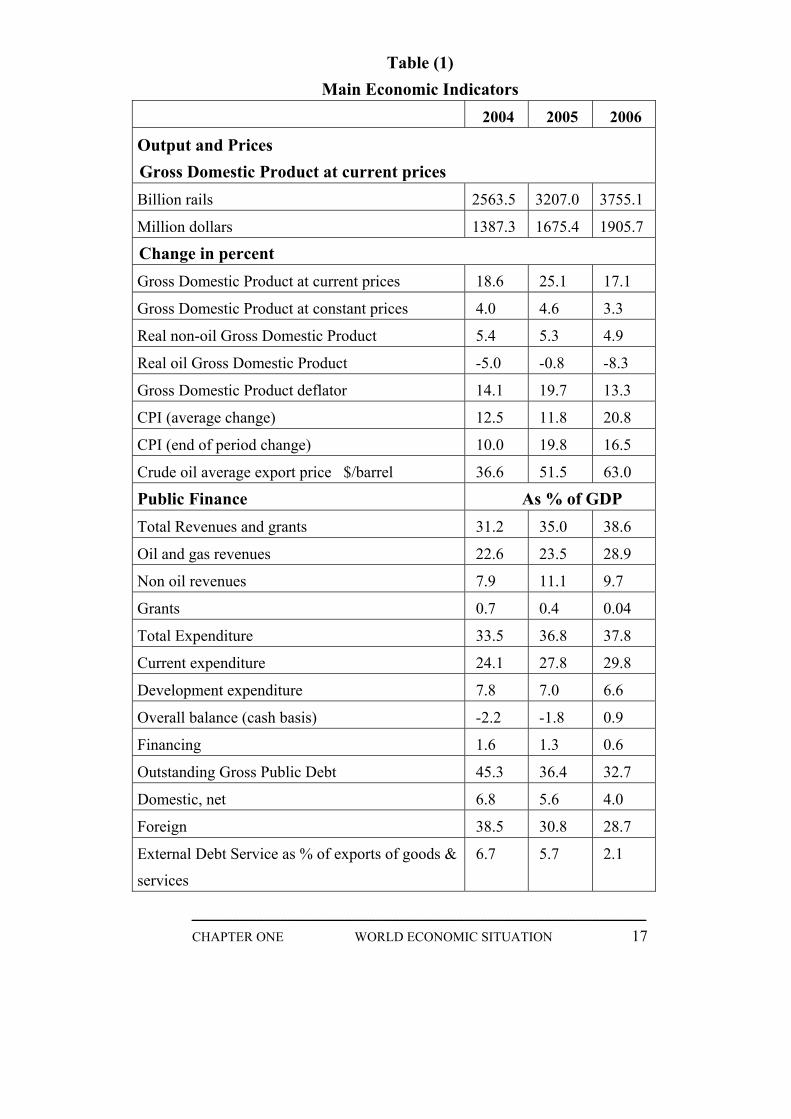
Table (1) Main Economic Indicators
2004 2005 2006
Output and Prices Gross Domestic Product at current prices
Billion rails 2563.5 3207.0 3755.1
Million dollars 1387.3 1675.4 1905.7
Change in percent Gross Domestic Product at current prices 18.6 25.1 17.1
Gross Domestic Product at constant prices 4.0 4.6 3.3
Real non-oil Gross Domestic Product 5.4 5.3 4.9
Real oil Gross Domestic Product 5.0- 0.8- 8.3-
Gross Domestic Product deflator 14.1 19.7 13.3
CPI (average change) 12.5 11.8 20.8
CPI (end of period change) 10.0 19.8 16.5
Crude oil average export price $/barrel 36.6 51.5 63.0
Public Finance As % of GDP Total Revenues and grants 31.2 35.0 38.6
Oil and gas revenues 22.6 23.5 28.9
Non oil revenues 7.9 11.1 9.7
Grants 0.7 0.4 0.04
Total Expenditure 33.5 36.8 37.8
Current expenditure 24.1 27.8 29.8
Development expenditure 7.8 7.0 6.6
Overall balance (cash basis) 2.2- 1.8- 0.9
Financing 1.6 1.3 0.6
Outstanding Gross Public Debt 45.3 36.4 32.7
Domestic, net 6.8 5.6 4.0
Foreign 38.5 30.8 28.7
External Debt Service as % of exports of goods &
services
6.7 5.7 2.1

ــــــــــــــــــــــــــــــــــــــــــــــــــــــــــــــــــــــــــــــــــــــــــــــــــــــــــــــــــــــــــــــــــــــــــــــــــــــCHAPTER ONE WORLD ECONOMIC SITUATION 18
Table (1) Cont'd
Main Economic Indicators
2004 2005 2006
Money and credit Change in percent
Broad Money Supply (M2) 15.0 14.4 28.8
Private sector Credit 33.5 21.3 16.7
Benchmark deposit rate (% per annum) 13.0 13.0 13.0
Velocity of Circulation (non oil GDP/M2) 1.9 2.0 1.8
Foreign Sector Million dollars
Exports (FOB), out of which: 4675.7 6413.2 7316.4
Crude Oil 4303.2 5952.0 6733.4
Imports (FOB) 3858.6- 4712.9- 5926.1-
Services, Income and Transfers (net) 592.6- 1067.1- 1184.5-
Financial & Capital Account including net
errors & omissions
307.7 48.8- 1240.8
Overall Balance 532.3 584.4 1446.5
Gross Foreign Reserves of Central Bank 5690.3 6142.7 7545.0
Own Gross Foreign Reserves of Central
Bank**
5397.3 5645.6 7094.7
In months of imports 14.8 12.6 12.6
Current Account as % of GDP 1.6 3.8 1.1
Exchange rate YR/US$ (end of period) 185.87 195.08 198.50
* Preliminary ** Gross reserves after deducting commercial bank foreign currency deposits with
Central Bank.
ــــــــــــــــــــــــــــــــــــــــــــــــــــــــــــــــــــــــــــــــــــــــــــــــــــــــــــــــــــــــــــــــــــــــــــــــــــــChapter Two Production 19
Chapter Two
Production
(1) GROSS DOMESTIC PRODUCT
The country realized stability coupled with continuation of
policies of economic reform and combating corruption, which
helped to create positive effect on the economic performance of
the Yemeni economy reflected by the data of the national
accounts. In general, the gross domestic product (GDP) at
constant market prices registered a growth of 3.32% in 2006
compared with 4.56% in 2005, earmarked to the regional
developments and the drop of the quantity of oil production.
Real non-oil GDP expanded by 4.9% in 2006, compared with
5.3% in the previous year. As a result of the increase in the GDP
deflator by 13.3%, GDP at current prices expanded by 17.09% in
2006 compared with a rate of 25.1% in 2005.
At constant prices, the personal and social services sector growth
increased from 16.64% in 2005 to 20.42% in 2006. It is still the
highest among all the sectors of the economy. The next highest
growth rate of 12.5% was achieved by non-profit institutions
compared with 6.02% in 2005. The transportation and
communication sector achieved a growth rate of 9.82% in 2006,
ــــــــــــــــــــــــــــــــــــــــــــــــــــــــــــــــــــــــــــــــــــــــــــــــــــــــــــــــــــــــــــــــــــــــــــــــــــــChapter Two Production 20
which is higher than the growth rate of 9.16 % achieved in 2005.
The Trade, restaurants and hotels sector grew by 7.4% in 2006
against 3.53% last year. Despite of the retraction of the
electricity, water and gas from 7.15% in 2005 to 6.5 % in 2006, it
achieved progress in its growth compared with other sectors. The
manufacturing sector growth retracted from 7.97% in2005 to
5.11% in 2006. The construction sector achieved a 5.38 %
growth rate, which is higher than the growth rate in 2005 by
0.87%. The agriculture and fishing sector achieved a growth rate
of 3.47% in2006 against 2.08 % in2005. Growth in the real estate
and financial services sector increased slightly from 4.13% in
2005 to 4.28% in 2006. The government services grew by 3.26%
in 2006 against 6.63% in 2005.. The performance of the
household sector improved slightly from0.62% in 2005 to 0.92%
in 2006. The growth rate in the mining sector retracted further to
-7.68% in2006 compared with-0.58% in 2005 due to the decline
of oil production.
Taking into account that net factor income from abroad registered
a negative figure of YR 24 billion in 2006, gross national product
at current market prices increased by 20.88% in 2006 compared
with 25.06% in 2005. As a result of the retraction in the net
current transfers from the rest of the world by YR9.0 billion or -
3.44% compared to its level in the previous year , disposable
ــــــــــــــــــــــــــــــــــــــــــــــــــــــــــــــــــــــــــــــــــــــــــــــــــــــــــــــــــــــــــــــــــــــــــــــــــــــChapter Two Production 21
gross national income at current prices rose by 18.19% in 2006
compared with 23.92% in the previous year.
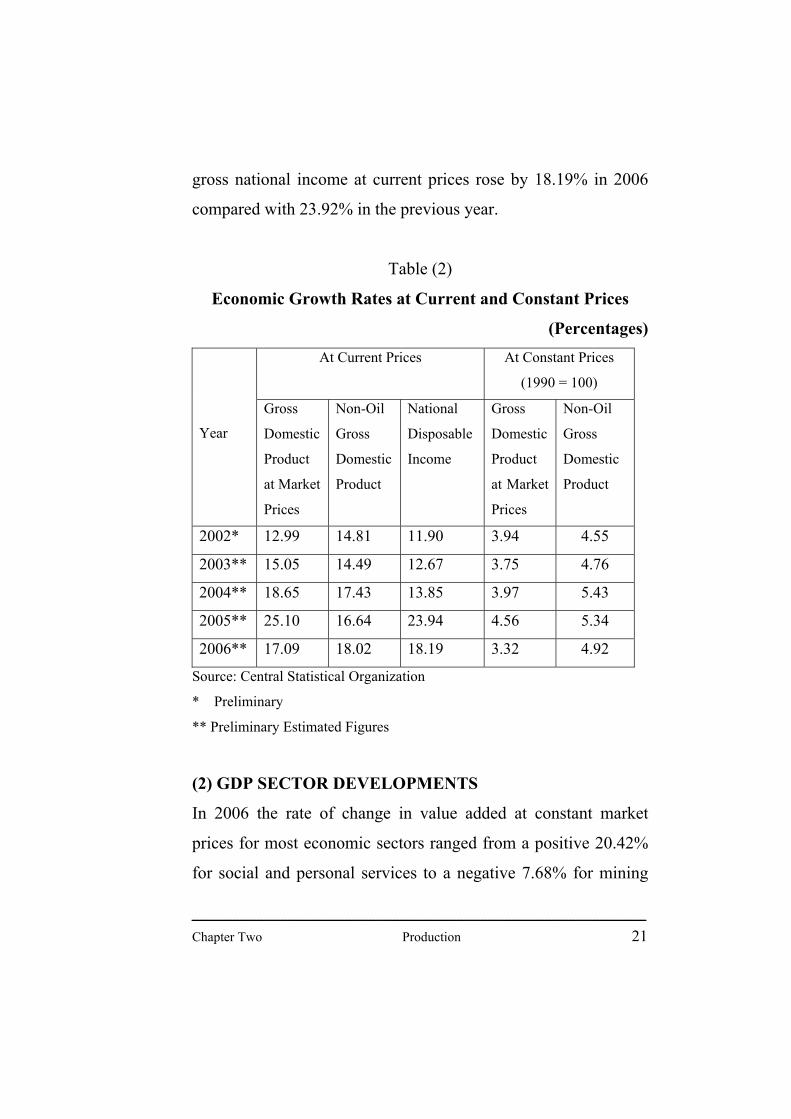
Table (2)
Economic Growth Rates at Current and Constant Prices
(Percentages) At Current Prices At Constant Prices
(1990 = 100)
Year
Gross
Domestic
Product
at Market
Prices
Non-Oil
Gross
Domestic
Product
National
Disposable
Income
Gross
Domestic
Product
at Market
Prices
Non-Oil
Gross
Domestic
Product
2002* 12.99 14.81 11.90 3.94 4.55
2003** 15.05 14.49 12.67 3.75 4.76
2004** 18.65 17.43 13.85 3.97 5.43
2005** 25.10 16.64 23.94 4.56 5.34
2006** 17.09 18.02 18.19 3.32 4.92
Source: Central Statistical Organization
* Preliminary
** Preliminary Estimated Figures
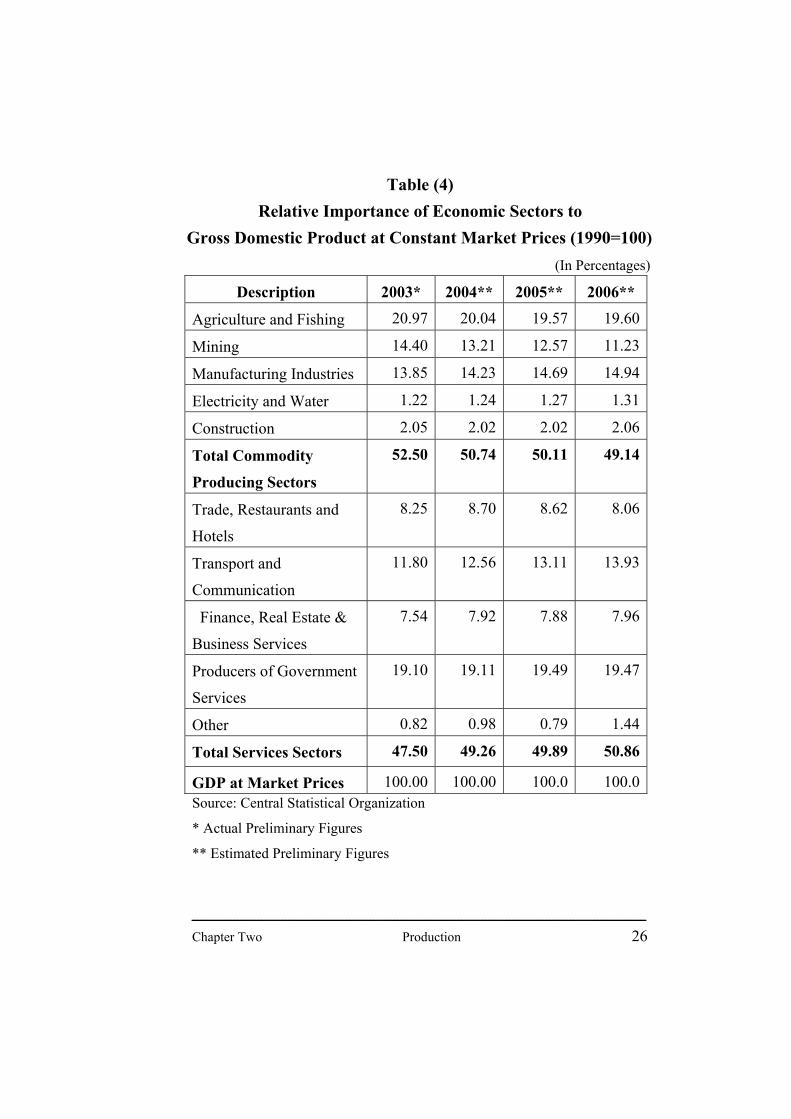
(2) GDP SECTOR DEVELOPMENTS
In 2006 the rate of change in value added at constant market
prices for most economic sectors ranged from a positive 20.42%
for social and personal services to a negative 7.68% for mining

ــــــــــــــــــــــــــــــــــــــــــــــــــــــــــــــــــــــــــــــــــــــــــــــــــــــــــــــــــــــــــــــــــــــــــــــــــــــChapter Two Production 22
sector. As table (3) shows, goods producing sectors grew by
1.31% in 2006 against 0.5% in the previous year. Yet their
contribution to GDP at constant market prices fell by 0.97
percentage points from 2005. The combined services sectors
expanded by 5.22% against 6.66% in 2005.Accordingly, their
contribution to GDP rose from 49.89% in 2005 to 50.86% in
2006.
In the goods producing sectors, electricity and water sector
achieved the highest rate of growth in 2006 by 6.05% from
7.15% in 2005, increasing its contribution to GDP by 0.04%
only. The construction sector achieved a real growth rate of
5.38% in 2006, higher by 0.87% from 2005, increasing its
contribution to GDP by 0.04%. The manufacturing sector
achieved a growth rate of 5.11% in 2006 against 7.97% in2005.
Its contribution to GDP increased slightly to14.94% from14.69%
in 2005. Agriculture and fishing achieved a growth rate of 3.47%
in2006 compared with 2.08% in 2005, while its contribution to
GDP increased to 19.6% attributable to a favorable weather
conditions and improved production methods. Mining and
quarrying sector real growth rate receded further to a negative
7.68%. Accordingly, its contribution to GDP fell from 12.57% in
2005 to 11.23% in 2006.
In the services sectors, social and personal services achieved the
highest growth rate of 20.42% in 2006 i.e. 3.78 percentage points

ــــــــــــــــــــــــــــــــــــــــــــــــــــــــــــــــــــــــــــــــــــــــــــــــــــــــــــــــــــــــــــــــــــــــــــــــــــــChapter Two Production 23
higher than what was achieved in 2005. The performance of non-
profit institutions sector improved achieving 12.5% growth
compared with the 6.02% in 2005. The growth rate of
transportation and communications sector rose from 9.16% in
2005 to 9.82% in 2006, increasing its contribution to GDP by
0.82%. The real growth rate of trade, restaurants and hotels
almost doubled to 7.4% in 2006, while its contribution to GDP
retracted by 0.56%. The real growth rate of government services
receded from 6.63% in 2005 to 3.26 % in 2006,while its
contribution to GDP remained unchanged in 2006 at a rate of
19.5% . The rate of the growth of the household sector improved
slightly from 0.62% in 2005 to 0.92% in 2006.
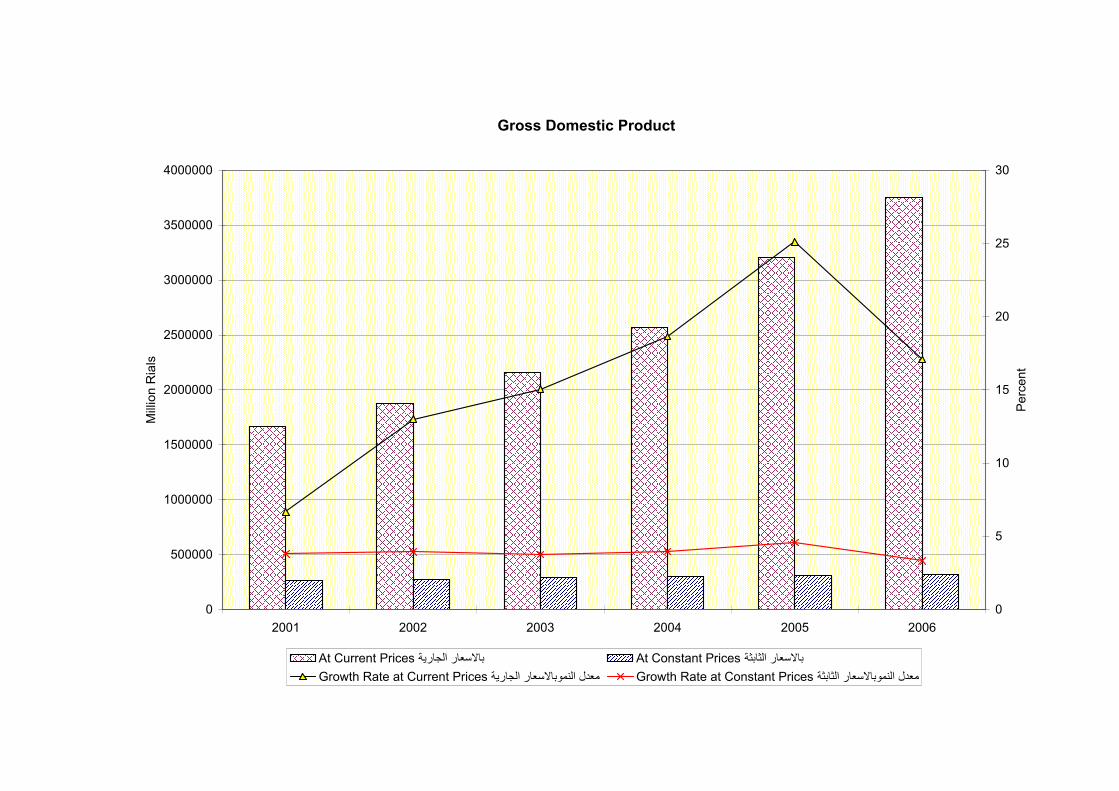
Gross Domestic Product
0
500000
1000000
1500000
2000000
2500000
3000000
3500000
4000000
2001 2002 2003 2004 2005 2006
Mill
ion
Ria
ls
0
5
10
15
20
25
30
Per
cent
At Current Prices بالاسعار الجارية At Constant Prices بالاسعار الثابثةGrowth Rate at Current Prices معدل النموبالاسعار الجارية Growth Rate at Constant Prices معدل النموبالاسعار الثابثة
ــــــــــــــــــــــــــــــــــــــــــــــــــــــــــــــــــــــــــــــــــــــــــــــــــــــــــــــــــــــــــــــــــــــــــــــــــــــChapter Two Production 25
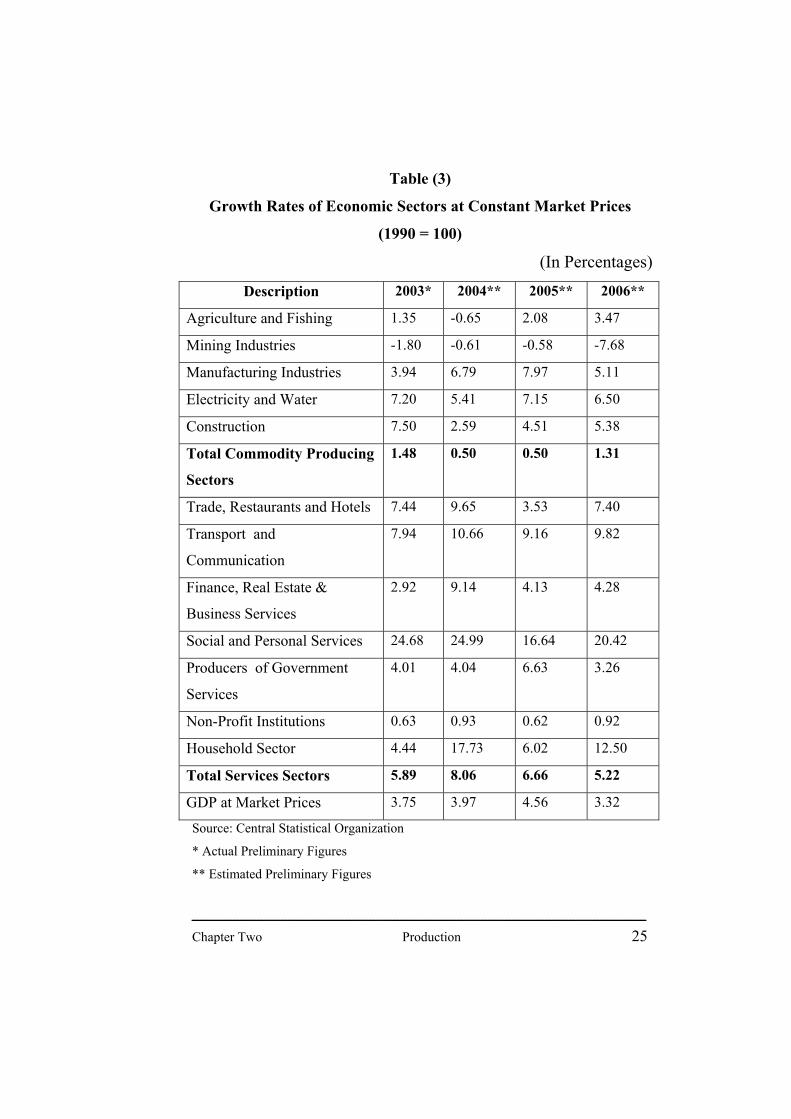
Table (3)
Growth Rates of Economic Sectors at Constant Market Prices
(1990 = 100)
(In Percentages)
Description 2003* 2004** 2005** 2006**
Agriculture and Fishing 1.35 0.65- 2.08 3.47
Mining Industries 1.80- 0.61- 0.58- 7.68-
Manufacturing Industries 3.94 6.79 7.97 5.11
Electricity and Water 7.20 5.41 7.15 6.50
Construction 7.50 2.59 4.51 5.38
Total Commodity Producing
Sectors
1.48 0.50 0.50 1.31
Trade, Restaurants and Hotels 7.44 9.65 3.53 7.40
Transport and
Communication
7.94 10.66 9.16 9.82
Finance, Real Estate &
Business Services
2.92 9.14 4.13 4.28
Social and Personal Services 24.68 24.99 16.64 20.42
Producers of Government
Services
4.01 4.04 6.63 3.26
Non-Profit Institutions 0.63 0.93 0.62 0.92
Household Sector 4.44 17.73 6.02 12.50
Total Services Sectors 5.89 8.06 6.66 5.22
GDP at Market Prices 3.75 3.97 4.56 3.32
Source: Central Statistical Organization
* Actual Preliminary Figures
** Estimated Preliminary Figures
ــــــــــــــــــــــــــــــــــــــــــــــــــــــــــــــــــــــــــــــــــــــــــــــــــــــــــــــــــــــــــــــــــــــــــــــــــــــChapter Two Production 26
Table (4) Relative Importance of Economic Sectors to
Gross Domestic Product at Constant Market Prices (1990=100) (In Percentages)
Description 2003* 2004** 2005** 2006**
Agriculture and Fishing 20.97 20.04 19.57 19.60
Mining 14.40 13.21 12.57 11.23
Manufacturing Industries 13.85 14.23 14.69 14.94
Electricity and Water 1.22 1.24 1.27 1.31
Construction 2.05 2.02 2.02 2.06
Total Commodity
Producing Sectors
52.50 50.74 50.11 49.14
Trade, Restaurants and
Hotels
8.25 8.70 8.62 8.06
Transport and
Communication
11.80 12.56 13.11 13.93
Finance, Real Estate &
Business Services
7.54 7.92 7.88 7.96
Producers of Government
Services
19.10 19.11 19.49 19.47
Other 0.82 0.98 0.79 1.44
Total Services Sectors 47.50 49.26 49.89 50.86
GDP at Market Prices 100.00 100.00 100.0 100.0 Source: Central Statistical Organization
* Actual Preliminary Figures
** Estimated Preliminary Figures
ــــــــــــــــــــــــــــــــــــــــــــــــــــــــــــــــــــــــــــــــــــــــــــــــــــــــــــــــــــــــــــــــــــــــــــــــــــــChapter Two Production 27
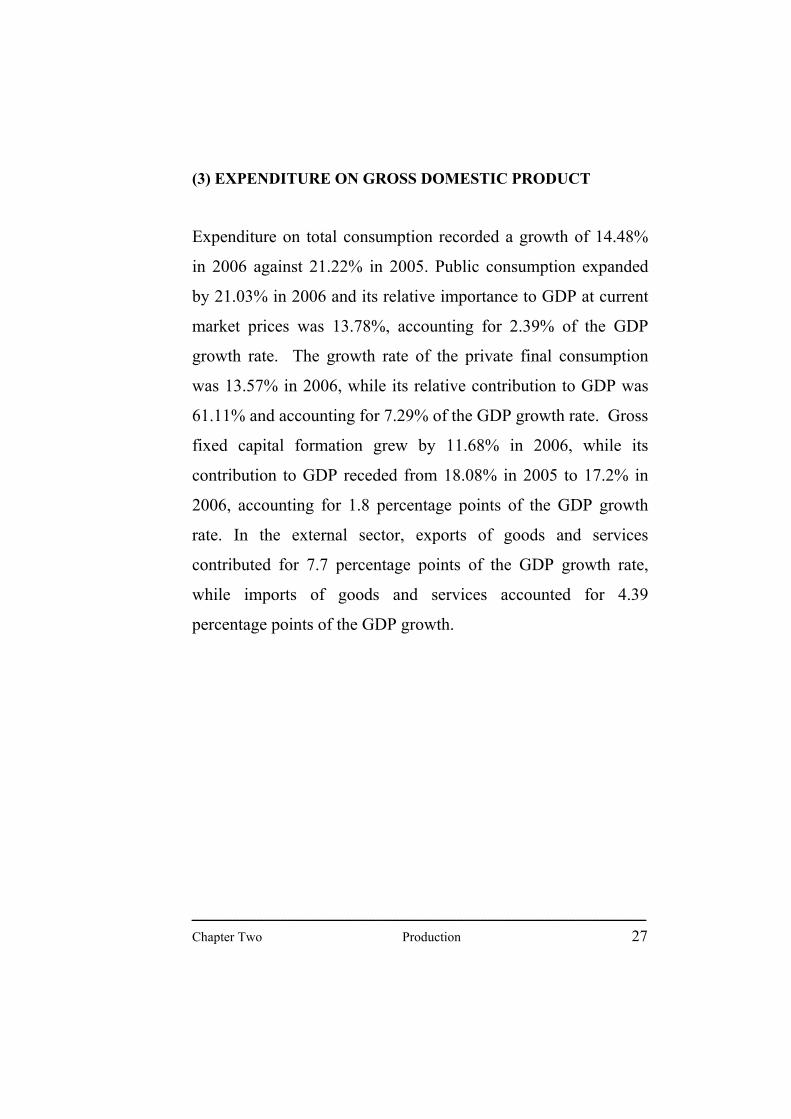
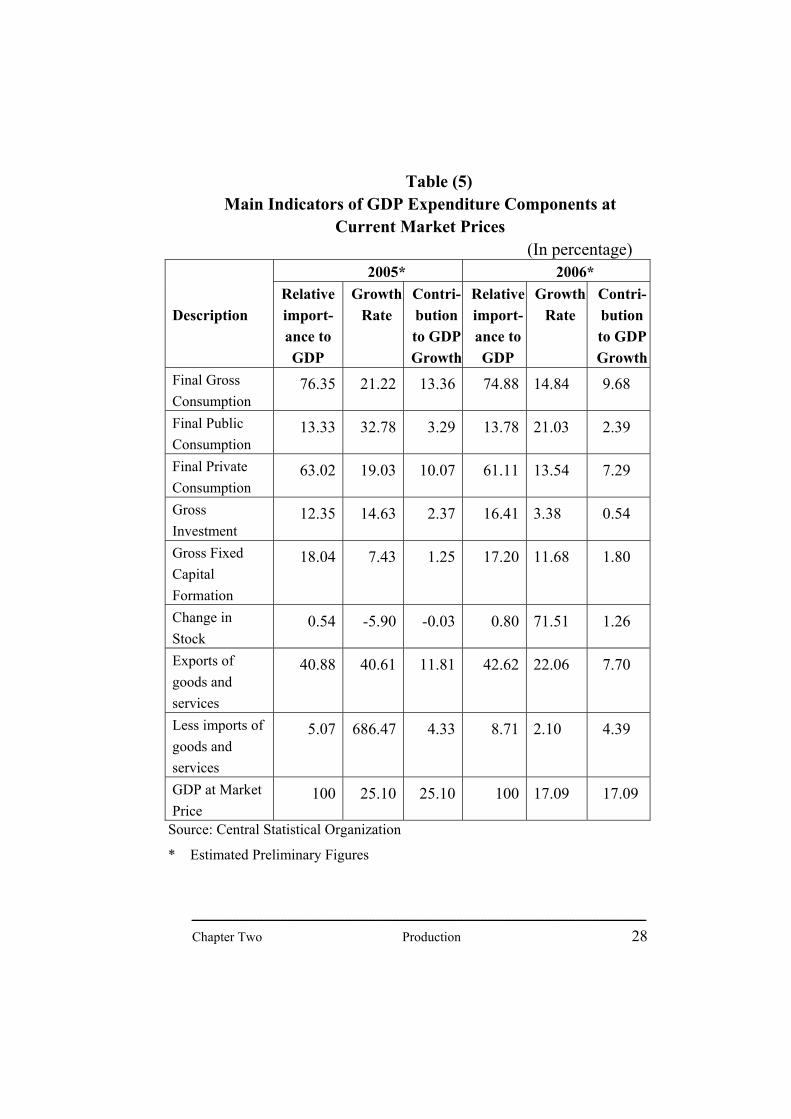
(3) EXPENDITURE ON GROSS DOMESTIC PRODUCT
Expenditure on total consumption recorded a growth of 14.48%
in 2006 against 21.22% in 2005. Public consumption expanded
by 21.03% in 2006 and its relative importance to GDP at current
market prices was 13.78%, accounting for 2.39% of the GDP
growth rate. The growth rate of the private final consumption
was 13.57% in 2006, while its relative contribution to GDP was
61.11% and accounting for 7.29% of the GDP growth rate. Gross
fixed capital formation grew by 11.68% in 2006, while its
contribution to GDP receded from 18.08% in 2005 to 17.2% in
2006, accounting for 1.8 percentage points of the GDP growth
rate. In the external sector, exports of goods and services
contributed for 7.7 percentage points of the GDP growth rate,
while imports of goods and services accounted for 4.39
percentage points of the GDP growth.
ــــــــــــــــــــــــــــــــــــــــــــــــــــــــــــــــــــــــــــــــــــــــــــــــــــــــــــــــــــــــــــــــــــــــــــــــــــــChapter Two Production 28
Table (5) Main Indicators of GDP Expenditure Components at
Current Market Prices (In percentage)
2005* 2006* Description
Relative import-ance to GDP
Growth Rate
Contri-bution to GDP Growth
Relative import-ance to GDP
Growth Rate
Contri-bution to GDP Growth
Final Gross Consumption
76.35 21.22 13.36 74.88 14.84 9.68
Final Public Consumption
13.33 32.78 3.29 13.78 21.03 2.39
Final Private Consumption
63.02 19.03 10.07 61.11 13.54 7.29
Gross Investment
12.35 14.63 2.37 16.41 3.38 0.54
Gross Fixed Capital Formation
18.04 7.43 1.25 17.20 11.68 1.80
Change in Stock
0.54 5.90- 0.03- 0.80 71.51 1.26
Exports of goods and services
40.88 40.61 11.81 42.62 22.06 7.70
Less imports of goods and services
5.07 686.47 4.33 8.71 2.10 4.39
GDP at Market Price
100 25.10 25.10 100 17.09 17.09
Source: Central Statistical Organization
* Estimated Preliminary Figures

ــــــــــــــــــــــــــــــــــــــــــــــــــــــــــــــــــــــــــــــــــــــــــــــــــــــــــــــــــــــــــــــــــــــــــــــــــــــChapter Two Production 29
(4) PRICES
Annual inflation (CPI) declined from 19.8% at the end of 2005 to
16.5% in 2006.The main factors of inflation include the rise of
world prices of food stuffs and the demand increase attributable
to rising of government expenditures especially wages and
salaries. The GDP deflator declined from 19.7% in2005 to 13.3%
in 2006, but the non-oil GDP deflator rose from 10.7% in 2005
12.5% in 2006 .
Table (6) Inflation Rates*
(Changes in %) Description 2003 2004 2005 2006
Consumer Price Index1 (annual average)
All-items 10.8 12.5 11.8 20.8 Core Inflation2 11.9 12.0 14.6 23.5 Consumer price Index (end of period)
All-items 13.6 10.0 19.8 16.5 Core Inflation2 12.1 14.6 20.2 22.0 GDP deflator 10.9 14.1 19.7 13.3 Non-oil GDP deflator 9.3 11.4 10.7 12.5
* Source : Central Statistical Organization 1 November 1999=100 2 Excluding Qat

ــــــــــــــــــــــــــــــــــــــــــــــــــــــــــــــــــــــــــــــــــــــــــــــــــــــــــــــــــــــــــــــــــــــــــــــــــــــChapter Two Production 30
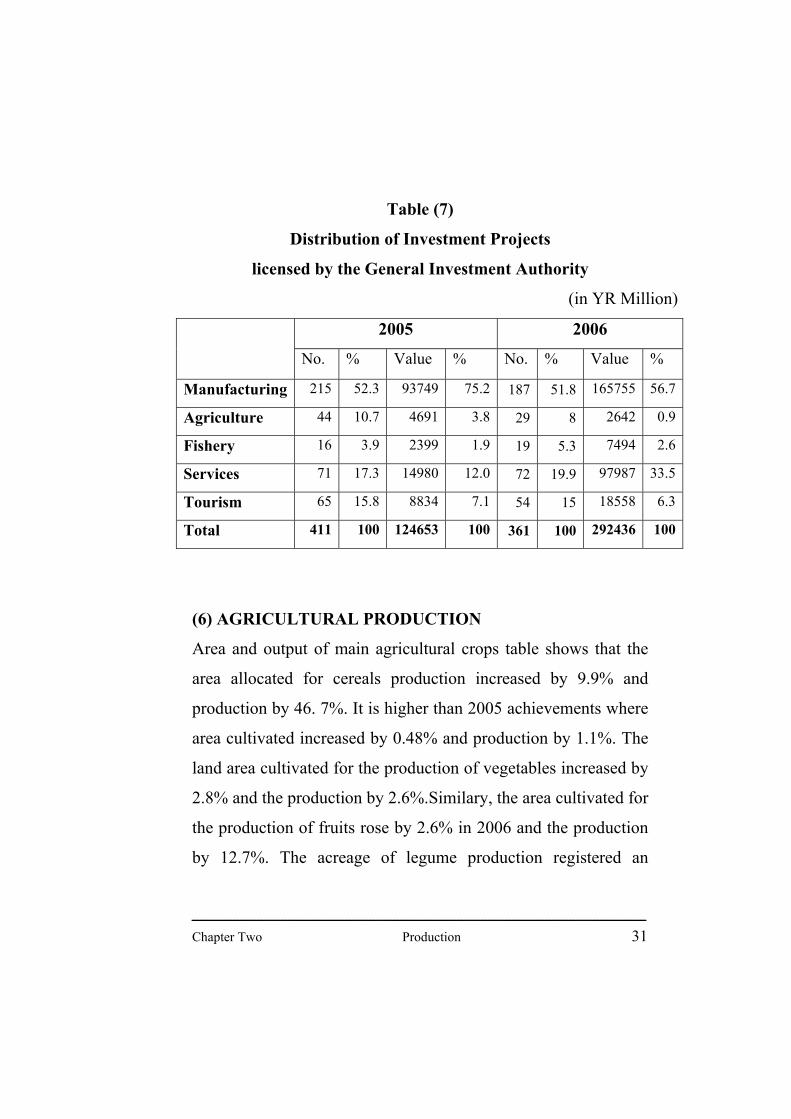
(5) INVESTMENT
The General Investment Authority issued licenses for 361
projects in 2006, lower by 50 projects from the previous year's
level or 12% Yet. Total cost and fixed assets of the projects
amounted to YR 292 billion and YR131 billion respectively.
In 2006 the number of licenses issued for investment projects in
manufacturing were 187 or 51.8% of total projects licensed in
that year. It retracted by 28 projects or 13% from 2005 level,
although its total cost increased by 77%. Licenses for investment
in services were next in number amounting to 72 projects
compared with 71 projects in 2005. Its value was higher by
YR83007 million, an increase of 55.4% compared with 2005.
Investment projects licensed for tourism amounted to 54 projects
accounting for 15% of the total number of licenses and 6.3% of
the total value in 2006. It is 17% lower the number of licenses
and 110% higher the total value of 2005. Licenses were given for
investment projects in agriculture amounting to 29 projects
accounting for 8% of total projects and 0.9% of total value.
Licensed projects in fisheries were 19 projects accounting for
2.6% of total value in 2006 compared with 16 projects
accounting for 1.9% of total value in 2005.
ــــــــــــــــــــــــــــــــــــــــــــــــــــــــــــــــــــــــــــــــــــــــــــــــــــــــــــــــــــــــــــــــــــــــــــــــــــــChapter Two Production 31
Table (7)
Distribution of Investment Projects
licensed by the General Investment Authority
(in YR Million)
2005 2006
No. % Value % No. % Value %
Manufacturing 215 52.3 93749 75.2 187 51.8 165755 56.7
Agriculture 44 10.7 4691 3.8 29 8 2642 0.9
Fishery 16 3.9 2399 1.9 19 5.3 7494 2.6
Services 71 17.3 14980 12.0 72 19.9 97987 33.5
Tourism 65 15.8 8834 7.1 54 15 18558 6.3
Total 411 100 124653 100 361 100 292436 100
(6) AGRICULTURAL PRODUCTION
Area and output of main agricultural crops table shows that the
area allocated for cereals production increased by 9.9% and
production by 46. 7%. It is higher than 2005 achievements where
area cultivated increased by 0.48% and production by 1.1%. The
land area cultivated for the production of vegetables increased by
2.8% and the production by 2.6%.Similary, the area cultivated for
the production of fruits rose by 2.6% in 2006 and the production
by 12.7%. The acreage of legume production registered an
ــــــــــــــــــــــــــــــــــــــــــــــــــــــــــــــــــــــــــــــــــــــــــــــــــــــــــــــــــــــــــــــــــــــــــــــــــــــChapter Two Production 32
increase by 21.5 % and the production by 36.1%. The area
dedicated for the cultivation of cash crops continued its increase
by 9.8% and the production by 20.3%. The rise in acreage of
fodder by 4.1% was accompanied by an increase in the
production by 5.6%.
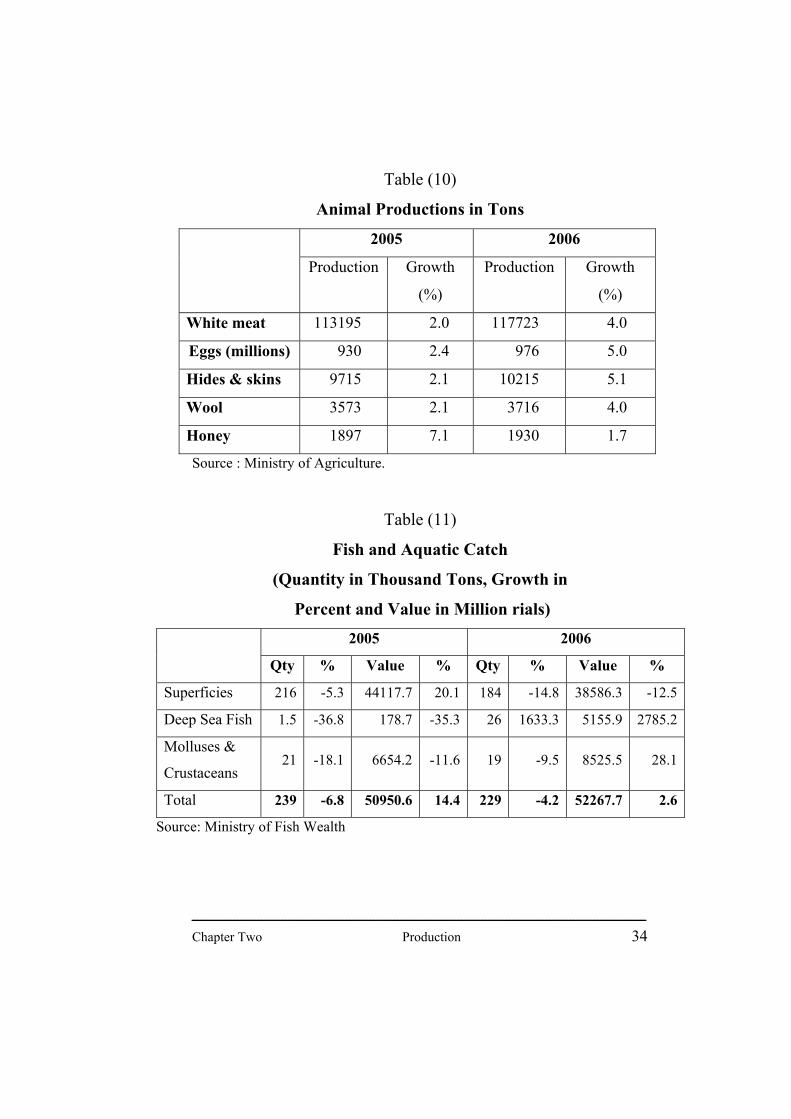
In 2006 the number of goats went up by 2.7%, lamb by 2.3% and
cows by1.2%. The number of camels retracted by 2.8 %. The
production of white meat increased by 4%, eggs by 5%, hides
and skins by 5.1%and wool by 4%. Honey production increased
by 1.7% in 2006 compared with last year.
In 2006, fish real production retracted by 4.2% while production
value increased by 2.6%. The tonnage of superficies fished
receded by 14.8 % from 216 thousand tons in 2005 to 184
thousands tons in 2006. The tonnage of deep sea fish rose from
1547 tons in 2005 to 26 thousand tons in 2006. While the
quantity produced of moll uses and crustaceans declined by
9.5%, their value rose by 28.1% compared with 2005, attributed
to the increase in their prices.

ــــــــــــــــــــــــــــــــــــــــــــــــــــــــــــــــــــــــــــــــــــــــــــــــــــــــــــــــــــــــــــــــــــــــــــــــــــــChapter Two Production 33
Table (8) Area and Output of Main
Agricultural Crops* 2005 2006
Agricultural
Crops
Area1 Grow-
th
Prod.2 Growth Area1 Grow-
th
Prod.2 Grow-
th
Cereals 688752 0.48 495591 1.1 756961 9.9 726927 46.7
Vegetables 73599 1.7 882053 5.8 75686 2.8 904889 2.6
Fruits 82796 2.4 764790 3.0 84944 2.6 861984 12.7
Legumes 38941 8.4 61180 4.3 47314 21.5 83239 36.1
Cash Crops3 197273 1.5 190360 3.4 216543 9.8 228930 20.3
Fodder 122803 0.8 1541288 2.4 127832 4.1 1626911 5.6
Table (9)
Number of Animals 2005 2006
Number (1000)
Growth % Number (1000)
Growth %
Goats 7980 1.0 8197 2.7 Lamb 7864 1.0 8042 2.3 Cows 1447 1.8 1464 1.2 Camels 357 1.1 347 2.8- Source : Ministry of Agriculture.
* Source : Ministry of Agriculture 1 Area in Hectares 2 Production In Tons 3 Coffee, Sesame, Cotton, Tobacco and Qat
ــــــــــــــــــــــــــــــــــــــــــــــــــــــــــــــــــــــــــــــــــــــــــــــــــــــــــــــــــــــــــــــــــــــــــــــــــــــChapter Two Production 34
Table (10)
Animal Productions in Tons
2005 2006
Production Growth
(%)
Production Growth
(%)
White meat 113195 2.0 117723 4.0
Eggs (millions) 930 2.4 976 5.0
Hides & skins 9715 2.1 10215 5.1
Wool 3573 2.1 3716 4.0
Honey 1897 7.1 1930 1.7
Source : Ministry of Agriculture.
Table (11)
Fish and Aquatic Catch
(Quantity in Thousand Tons, Growth in
Percent and Value in Million rials)
2005 2006
Qty % Value % Qty % Value %
Superficies 216 5.3- 44117.7 20.1 184 14.8- 38586.3 12.5-
Deep Sea Fish 1.5 -36.8 178.7 -35.3 26 1633.3 5155.9 2785.2
Molluses &
Crustaceans 21 18.1- 6654.2 -11.6 19 9.5- 8525.5 28.1
Total 239 6.8- 50950.6 14.4 229 -4.2 52267.7 2.6
Source: Ministry of Fish Wealth

ــــــــــــــــــــــــــــــــــــــــــــــــــــــــــــــــــــــــــــــــــــــــــــــــــــــــــــــــــــــــــــــــــــــــــــــــــــــChapter Two Production 35
(7) EDUCATION
The number of students enrolled in the academic year 2005/
2006 reached 4498 thousand, 60% of them were boys and 40%
girls.
With the development of the labor market and the rise in the
demand for skilled technical workers, the government established
a lot of technical and vocational institutes and community
colleges. The number of students enrolled in these institutes and
colleges reached 23571 in the academic year
2006/2007.Moreover, there are numerous other private institutes
which devote their attention to technical education and vocational
training. No reliable statistical data are available on the number
of students enrolled or the number of graduates of such private
institutes.
Many graduates of secondary schools devote themselves to
higher education. The number of graduates of public universities
reached 178 thousand in the academic year 2005/ 2006, 28% of
them were females. The number of graduates of private
universities reached 37 thousand, 24%of them were females.

ــــــــــــــــــــــــــــــــــــــــــــــــــــــــــــــــــــــــــــــــــــــــــــــــــــــــــــــــــــــــــــــــــــــــــــــــــــــChapter Two Production 36
Table (12)
Number of students at various stages
of Education
(In thousands)
2004/2005 2005/2006
Stage Male Female Total Male Female Total
Basic
Education
2450 1622 4072 2364 1608 3972
Secondary
Education
410 185 595 353 173 526
Total 2860 1807 4667 2717 1781 4498
Source: Ministry of Education

ــــــــــــــــــــــــــــــــــــــــــــــــــــــــــــــــــــــــــــــــــــــــــــــــــــــــــــــــــــــــــــــــــــــــــــــــــــــChapter Three Government Finance 37
Chapter Three
Government Finance
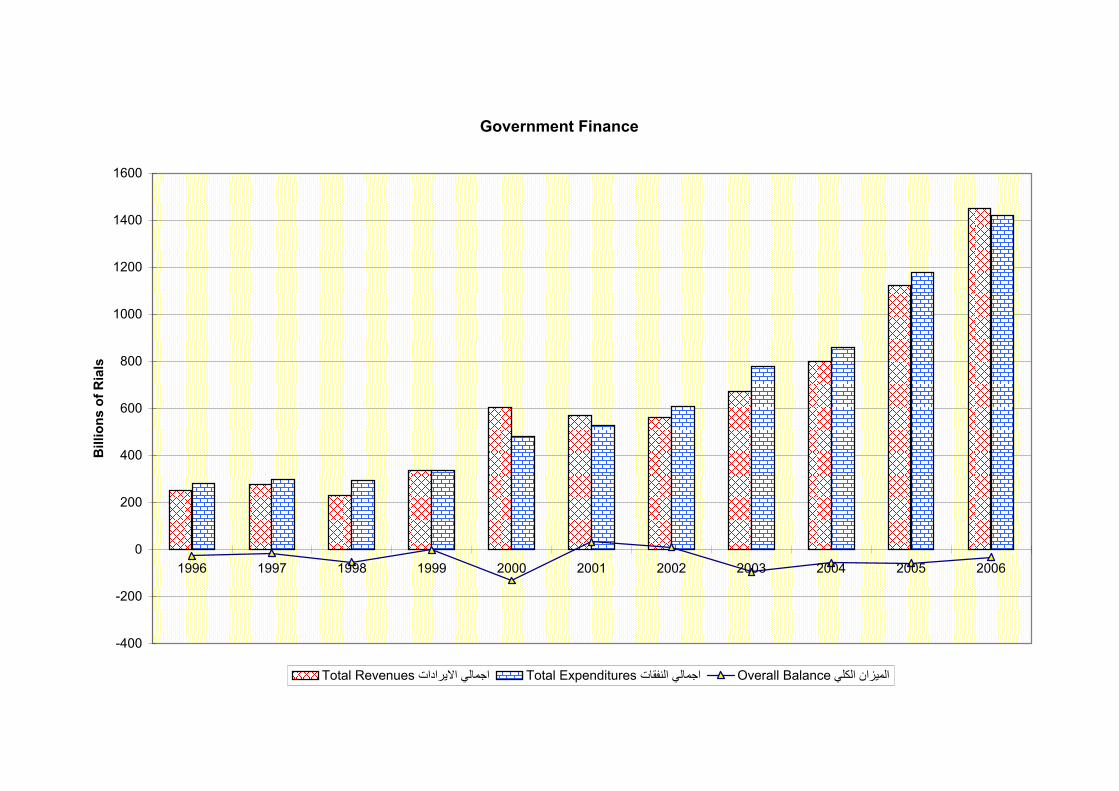
Domestic and foreign financing data of 2006 budget indicates
that a deficit of YR 22.2 billion or 0.6% of GDP was realized,
against a deficit of YR 41.1 billion or 1.3% of GDP in 2006.
I. Public Revenues:
In 2006, public revenues recorded an increase by YR 341.8
billion, or 31.0% of that of last year, whereby they rose from YR
1107.6 billion in 2005 to YR 1449.4 billion in 2006. The increase
concentrated in oil and gas revenues. Revenues from exports of
crude oil recorded an increase of 32.0%, while domestic oil and
gas revenues rose by 65.0%. Additionally, non-oil revenues
(represented by tax and non-tax revenues) grew by 3.0%. The
ratio of public revenues to GDP rose from 34.5% in 2005 to
38.6% in 2006.
1.Oil and Gas Revenues:
In 2006, oil and gas revenues increased by YR 332.5 billion, or
44.0% of that of last year, whereby they rose from YR 752.7
billion in 2005 to YR 1085.2 billion in 2006. Contribution of oil
and gas revenues to total government revenues increased from
68.0% in 2005 to 75.0% in 2006. Their ratio to GDP rose from
ــــــــــــــــــــــــــــــــــــــــــــــــــــــــــــــــــــــــــــــــــــــــــــــــــــــــــــــــــــــــــــــــــــــــــــــــــــــChapter Three Government Finance 38
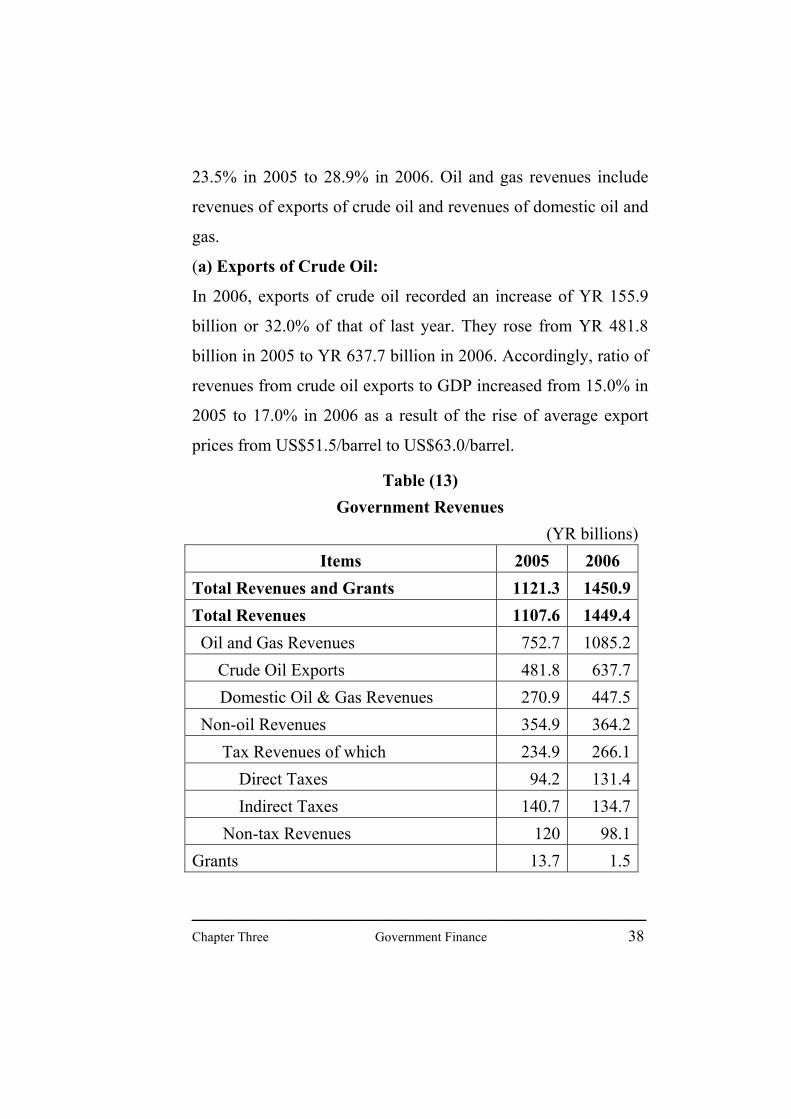
23.5% in 2005 to 28.9% in 2006. Oil and gas revenues include
revenues of exports of crude oil and revenues of domestic oil and
gas.
(a) Exports of Crude Oil:
In 2006, exports of crude oil recorded an increase of YR 155.9
billion or 32.0% of that of last year. They rose from YR 481.8
billion in 2005 to YR 637.7 billion in 2006. Accordingly, ratio of
revenues from crude oil exports to GDP increased from 15.0% in
2005 to 17.0% in 2006 as a result of the rise of average export
prices from US$51.5/barrel to US$63.0/barrel.
Table (13) Government Revenues
(YR billions) Items 2005 2006
Total Revenues and Grants 1121.3 1450.9 Total Revenues 1107.6 1449.4 Oil and Gas Revenues 752.7 1085.2 Crude Oil Exports 481.8 637.7
Domestic Oil & Gas Revenues 270.9 447.5 Non-oil Revenues 354.9 364.2 Tax Revenues of which 234.9 266.1
Direct Taxes 94.2 131.4 Indirect Taxes 140.7 134.7
Non-tax Revenues 120 98.1 Grants 13.7 1.5

Government Revenues
0 200 400 600 800 1000 1200
1996
1997
1998
1999
2000
2001
2002
2003
2004
2005
2006
Billion Rials
Oil Revenues ايرادات نفطية Non-Oil Revenues ايرادات غير نفطية

ــــــــــــــــــــــــــــــــــــــــــــــــــــــــــــــــــــــــــــــــــــــــــــــــــــــــــــــــــــــــــــــــــــــــــــــــــــــChapter Three Government Finance 40
(b) Domestic Oil and Gas Revenues:
In 2006, domestic oil and gas revenues recorded an increase of
YR176.6 billion, or 65.2% than that of last year. They rose from
YR 270.9 billion in 2005 to YR 447.5 billion in 2006.
Accordingly, their ratio to GDP increased from 8.4% in 2005 to
11.9% in 2006, while their contribution to total oil revenues
stepped up from 36.0% to 41.0%. This was basically attributed to
adjustment in oil products prices, which took place in July 2005.
2. Non-oil Revenues:
Non-oil revenues realized an increase of YR 9.3 billion, or 3.0%
over that of 2005. These revenues rose from YR 354.9 billion in
2005 to YR 364.2 billion in 2006. However, their contribution to
total government revenues retracted from 32.0% to 25.0%, and
their ratio to GDP decreased from 11.1% to 9.7%. Non-oil
revenues include tax and non-tax revenues.
(a) Tax revenues:
In the year 2006, tax revenues recorded an increase of YR 31.2
billion, or 13.0% over that of 2005. They grew from YR 234.9
billion in 2005 to YR 266.1 billion in 2006. Their contribution to
total non-oil revenues increased from 66.0% in 2005 to 73.0% in
2006, while their ratio to GDP slightly decreased from 7.3% to
7.1%. Tax revenues include direct and indirect taxes. Direct tax
increased by 39.0% from 94.2 billion in 2005 to YR 131.4 billion
in 2006. Indirect taxes (which include customs duties) decreased
ــــــــــــــــــــــــــــــــــــــــــــــــــــــــــــــــــــــــــــــــــــــــــــــــــــــــــــــــــــــــــــــــــــــــــــــــــــــChapter Three Government Finance 41
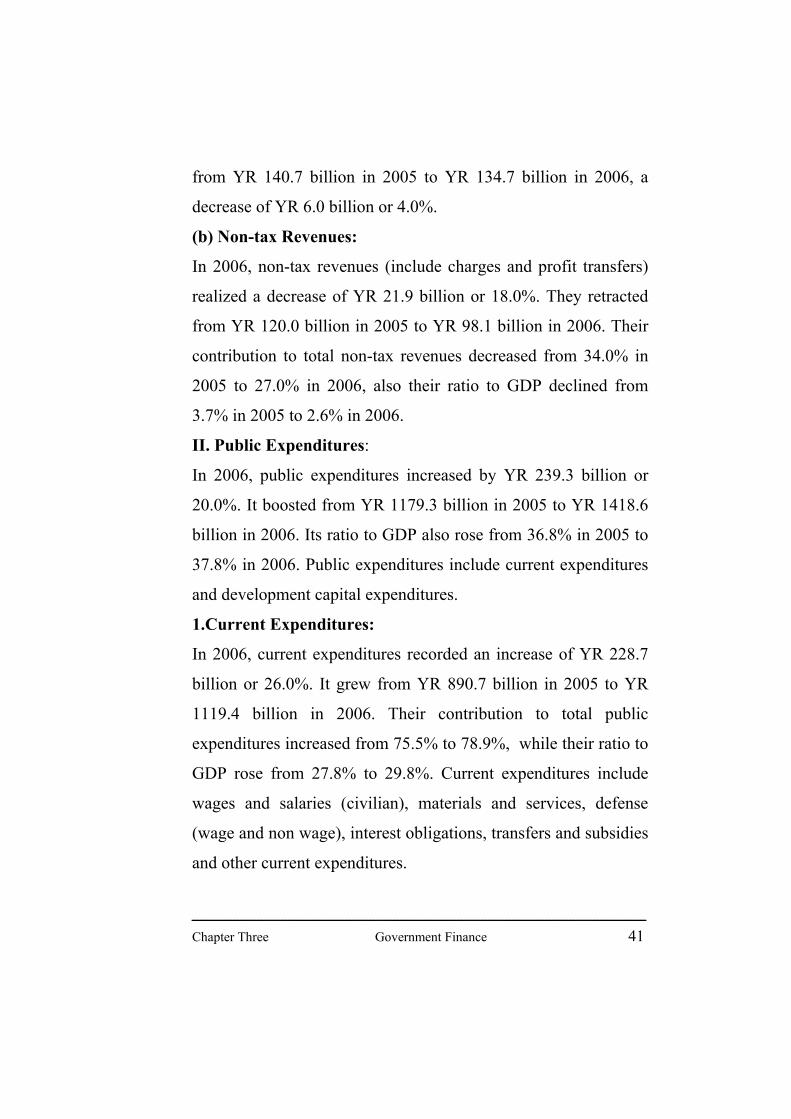
from YR 140.7 billion in 2005 to YR 134.7 billion in 2006, a
decrease of YR 6.0 billion or 4.0%.
(b) Non-tax Revenues:
In 2006, non-tax revenues (include charges and profit transfers)
realized a decrease of YR 21.9 billion or 18.0%. They retracted
from YR 120.0 billion in 2005 to YR 98.1 billion in 2006. Their
contribution to total non-tax revenues decreased from 34.0% in
2005 to 27.0% in 2006, also their ratio to GDP declined from
3.7% in 2005 to 2.6% in 2006.
II. Public Expenditures:
In 2006, public expenditures increased by YR 239.3 billion or
20.0%. It boosted from YR 1179.3 billion in 2005 to YR 1418.6
billion in 2006. Its ratio to GDP also rose from 36.8% in 2005 to
37.8% in 2006. Public expenditures include current expenditures
and development capital expenditures.
1.Current Expenditures:
In 2006, current expenditures recorded an increase of YR 228.7
billion or 26.0%. It grew from YR 890.7 billion in 2005 to YR
1119.4 billion in 2006. Their contribution to total public
expenditures increased from 75.5% to 78.9%, while their ratio to
GDP rose from 27.8% to 29.8%. Current expenditures include
wages and salaries (civilian), materials and services, defense
(wage and non wage), interest obligations, transfers and subsidies
and other current expenditures.
ــــــــــــــــــــــــــــــــــــــــــــــــــــــــــــــــــــــــــــــــــــــــــــــــــــــــــــــــــــــــــــــــــــــــــــــــــــــChapter Three Government Finance 42
(a) Wages and Salaries (Civilian):
In 2006, civilian wages and salaries recorded an increase of YR
70.4 billion or 36.0%. They rose from YR195.9 billion in 2005 to
YR 266.3 billion in 2006, attributable to the increase of wages
and salaries of public sector as a result to the shift in the general
structure of wages and salaries commencing July 2005.
(b) Materials and Services:
Materials and services expenses increased by YR 24.9 billion, or
32.0%. They rose from YR 78.2 billion in 2005 to YR 103.1
billion in 2006. Their contribution to total current expenditures
increased from 8.8% in 2005 to 9.2% in 2006.
(c) Defense (Wage and Non Wage):
Defense expenditures increased by YR 55.0 billion or 35.0%. It
rose from YR 156.2 billion in 2005 to YR 211.2 billion in 2006.
Its contribution to total current expenditures increased from
17.5% in 2005 to 18.9% in 2006. Its ratio to GDP increased from
4.9% in 2005 to 5.6% in 2006 partly as a result of the increase of
wages and salaries.
(d) Interest Obligations:
In 2006, interest obligations recorded an increase of YR 19.8
billion or 29.0%. They rose from YR 69.1 billion in 2005 to YR
88.9 billion in 2006. Their contribution to total current
expenditures rose from 7.8% in 2005 to 7.9% in 2006, while their
ratio to GDP increased from 2.2% in 2005 to 2.4% in 2006.

ــــــــــــــــــــــــــــــــــــــــــــــــــــــــــــــــــــــــــــــــــــــــــــــــــــــــــــــــــــــــــــــــــــــــــــــــــــــChapter Three Government Finance 43
Interest obligations include domestic and foreign interest
obligations. Domestic interest obligations represent 85.9% of the
total interest obligations in the year 2006, against 87.0% in 2005.
They increased from YR 60.1 billion in 2005 to YR 76.4 billion,
or 27.0%. Foreign interest obligations rose by YR 3.5 billion, or
39.0% from YR 9.0 billion in 2005 to YR 12.5 billion in 2006.
Their ratio to total interest obligations rose from 13.0% in 2005
to 14.0% this year.
Table (14) Government Expenditure
(YR billion) Item 2005 2006 Total Government Expenditure 1179.3 1418.6 Current Expenditures: 890.7 1119.4 Wages and Salaries (Civilian) 195.9 266.3 Materials and Services 78.2 103.1 Defense (wage and nonwage) 156.2 211.2 Interest Obligations 69.1 88.9 Domestic (Net) 60.1 76.4 Foreign 9.0 12.5 Transfers & Subsidies 372.8 427.4 Subsidies 286.3 309.0 Current Transfers 86.5 118.4 Other Current Expenses 18.5 22.5 Capital Development Expenditures 225.7 248.1 Net Lending 62.9 51.1

Government Expenditures
0 200 400 600 800 1000 1200
1996
1997
1998
1999
2000
2001
2002
2003
2004
2005
2006
Billions of Rials
Current Expenditures النفقات الجارية Capital Expenditures النفقات الرأسمالية
ــــــــــــــــــــــــــــــــــــــــــــــــــــــــــــــــــــــــــــــــــــــــــــــــــــــــــــــــــــــــــــــــــــــــــــــــــــــChapter Three Government Finance 45
(e) Transfers and Subsidies: Transfers and subsidies expenditures increased by YR 54.6 billion or 15.0% in 2006. They increased from YR 372.8 billion in 2005 to YR 427.4 billion in 2006. However, their ratio to total current expenditures decreased from 41.9% in 2005 to 38.2% in 2006, also their ratio to GDP decreased from 11.6% to 11.4%. Transfers and subsidies expenditures represent amounts of subsidies and current transfers. Amounts of subsidies increased by YR 22.7 billion or 8.0%. They rose from YR 286.3 billion in 2005 to YR 309.0 billion in 2006. This was attributable basically to the rise in international oil prices (despite the price adjustment of some oil products in July 2005). Their ratio to GDP declined from 8.9% in 2005 to 8.2% in 2006. However, current transfers rose by YR 31.9 billion or 37.0% from YR 86.5 billion in 2005 to YR 118.4 billion in 2006. (f) Other Current Expenditures: Other current expenditures recorded an increase of YR 4.0 billion, or 22.0%. It rose from YR 18.5 billion in 2005 to YR 22.5 billion in 2006. However, its ratio to total current expenditures decreased slightly from 2.1% in 2005 to 2.0% in 2006. 2. Development Capital Expenditures: In 2006, development capital expenditures realized an increase of YR 22.4 billion or 10.0%. It increased from YR 225.7 billion in 2005 to YR 248.1 billion in 2006. Its ratio to total public

ــــــــــــــــــــــــــــــــــــــــــــــــــــــــــــــــــــــــــــــــــــــــــــــــــــــــــــــــــــــــــــــــــــــــــــــــــــــChapter Three Government Finance 46
expenditures dropped from 19.0% in 2005 to 17.0% in 2006 while its ratio to GDP decreased slightly from 7.0% to 6.6%. Overall Balance Domestic and foreign financing data of 2006 budget indicates that a deficit of YR 22.2 billion was realized compared with a deficit of YR 41.1 billion in 2005. The deficit realized in 2006 represents 0.6% of GDP, compared with 1.3% of GDP in 2005. Coverage of revenues for expenditures rose from 93.9% in 2005 to 102.2% in 2006.
Table (15) Overall Balance of Government Finance
(YR billion) Item 2005 20061
Total Public Revenues 1107.6 1449.4 Grants 13.7 1.5 Total Public Expenditures 1179.3 1418.6 Overall Balance (on commitment basis) -58.0 32.3 Pending Obligations … …. Overall Balance (on cash basis) -58.0 32.3 Financing 41.1 22.2 External Financing (Net) 34.2 48.6 Domestic Financing (Net): 6.9 -26.4 Banking System -27.0 -53.9 Central Bank of Yemen -48.7 -76.4 Commercial Banks 21.7 22.5 - Non-Banking Financing 33.9 27.5 Discrepency 16.9 -54.5 1 Preliminary
Government Finance
-400
-200
0
200
400
600
800
1000
1200
1400
1600
1996 1997 1998 1999 2000 2001 2002 2003 2004 2005 2006
Bill
ions
of R
ials
Total Revenues اجمالي الايرادات Total Expenditures اجمالي النفقات Overall Balance الميزان الكلي

ــــــــــــــــــــــــــــــــــــــــــــــــــــــــــــــــــــــــــــــــــــــــــــــــــــــــــــــــــــــــــــــــــــــــــــــــــــــChapter Three Government Finance 48
III. Domestic Public Debt:
Under circumstances of rising government expenditures and the
budget deficit realized, gross domestic public debt increased by
YR 49.2 billion in 2006, or 12.4% over that of last year. It rose
from YR 395.8 billion in 2005 to YR 445.0 billion in 2006.
While, its ratio to GDP decreased from 12.3% to 11.9%. This
contributes to the absorption of surpluses of pension funds and
sterilization of excess liquidity in the economy. Treasury bills in
the original auction (primary market) formed the basic tool for
domestic borrowing. At the end of 2006, its share in total
domestic debt amounted to 83.9% compared with 83.0% in 2005.
Purchase value of treasury bills in circulation amounted to YR
373.2 billion at the end of 2006 compared with YR 328.5 billion
at the end of 2005. Re-purchase operations did not record
significant change at the end of 2006 and remained at the level of
2005 at YR 65 billion. Its share in gross domestic public debt
retracted from 16.4% in 2005 to 14.7% this year.
On considering government deposits at the Central Bank of
Yemen, net domestic public debt, at the end of 2006, decreased to
YR 150.2 billion or 4.0% of GDP, compared with YR 179.8
billion at the end of 2005, or 5.6% of GDP. Also, the ratio of net
domestic public debt to total public debt has decreased from
15.1% in 2005 to 12.1% in 2006.
ــــــــــــــــــــــــــــــــــــــــــــــــــــــــــــــــــــــــــــــــــــــــــــــــــــــــــــــــــــــــــــــــــــــــــــــــــــــChapter Three Government Finance 49
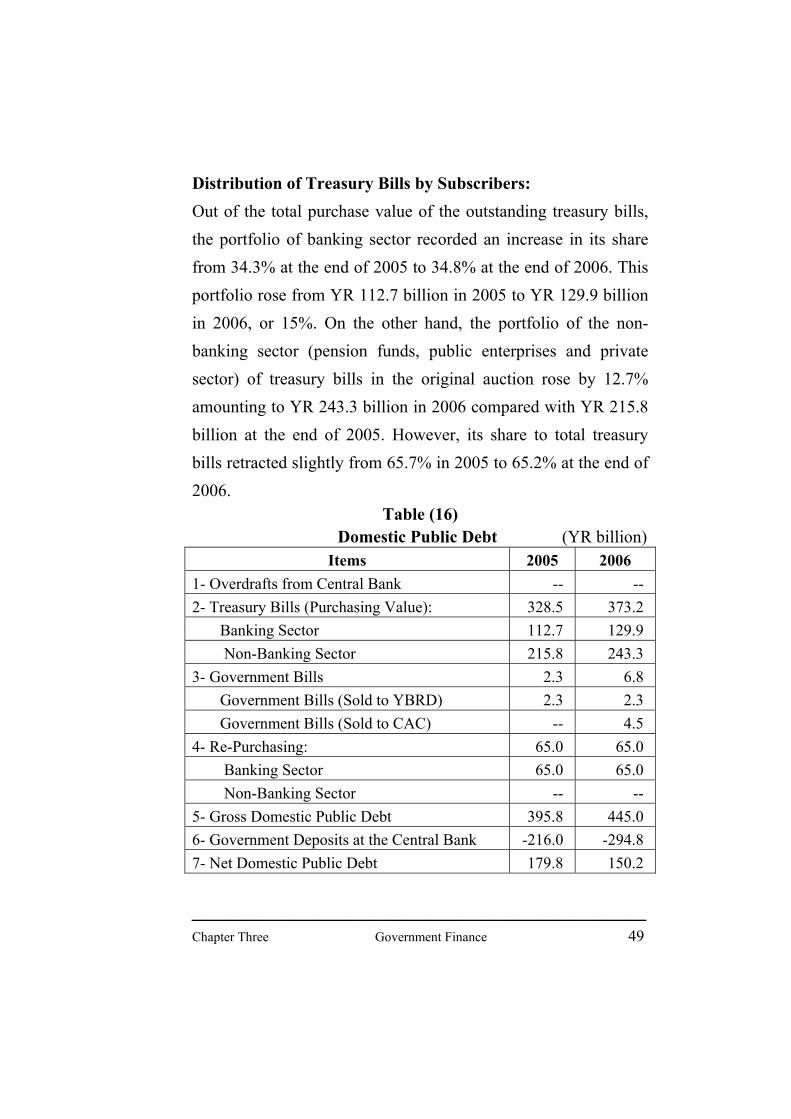
Distribution of Treasury Bills by Subscribers: Out of the total purchase value of the outstanding treasury bills, the portfolio of banking sector recorded an increase in its share from 34.3% at the end of 2005 to 34.8% at the end of 2006. This portfolio rose from YR 112.7 billion in 2005 to YR 129.9 billion in 2006, or 15%. On the other hand, the portfolio of the non-banking sector (pension funds, public enterprises and private sector) of treasury bills in the original auction rose by 12.7% amounting to YR 243.3 billion in 2006 compared with YR 215.8 billion at the end of 2005. However, its share to total treasury bills retracted slightly from 65.7% in 2005 to 65.2% at the end of 2006.
Table (16) Domestic Public Debt (YR billion)
Items 2005 2006 1- Overdrafts from Central Bank -- -- 2- Treasury Bills (Purchasing Value): 328.5 373.2 Banking Sector 112.7 129.9 Non-Banking Sector 215.8 243.3 3- Government Bills 2.3 6.8 Government Bills (Sold to YBRD) 2.3 2.3 Government Bills (Sold to CAC) -- 4.5 4- Re-Purchasing: 65.0 65.0 Banking Sector 65.0 65.0 Non-Banking Sector -- -- 5- Gross Domestic Public Debt 395.8 445.0 6- Government Deposits at the Central Bank -216.0 -294.8 7- Net Domestic Public Debt 179.8 150.2

ــــــــــــــــــــــــــــــــــــــــــــــــــــــــــــــــــــــــــــــــــــــــــــــــــــــــــــــــــــــــــــــــــــــــــــــــــــــChapter Three Government Finance 50
Distribution of Treasury Bills by Terms:
The ratio of 3-month bills to the total purchase value of treasury
bills increased from 43.0% at the end of 2005 to 46.2% at the end
of 2006. Also the share of the 6-month bills increased slightly
from 21.5% to 21.7%. In contrast, the share of one-year bills
retracted from 35.5% to 32.2%.
Table (17)
Distribution of Treasury Bills by Terms (Purchase Value)
Million Rials In Percent
2005 2006 2005 2006
3-months 141100.5 172295.5 43.0 46.2
6-months 70666.0 80901.4 21.5 21.7
12-months 116779.2 120025.8 35.5 32.2
Total 328545.7 373222.7 100.0 100.0
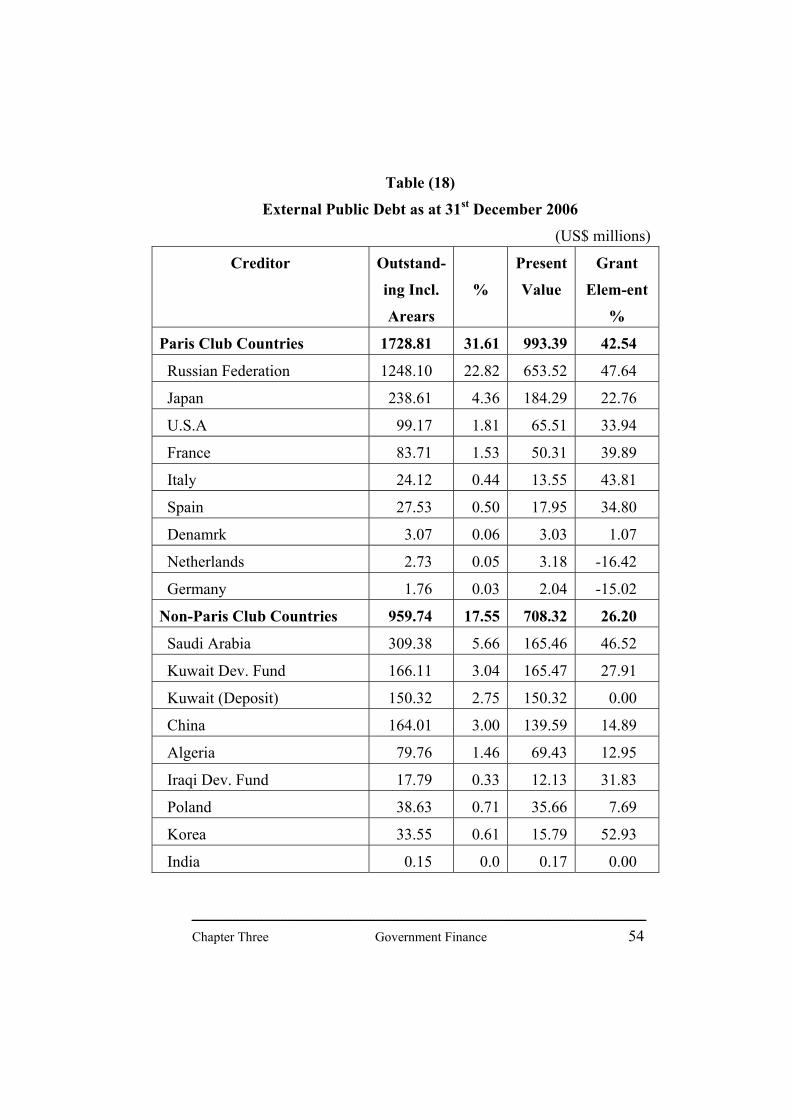
IV. External Public Debt:
Outstanding balance of external public debt amounted to
US$5468.9 million at the end of 2006 against US$5168.4 million
at the end of 2005. It increased by US$300.5 million or 5.8%
over that of last year. The main reasons behind this increase are
the increase of drawings at higher pace than the repayments in
ــــــــــــــــــــــــــــــــــــــــــــــــــــــــــــــــــــــــــــــــــــــــــــــــــــــــــــــــــــــــــــــــــــــــــــــــــــــChapter Three Government Finance 51
addition to the appreciation of exchange rates of currencies of
some main creditors. These figures include in addition to long-
term rescheduled debts, the new loans and credits concluded with
the international and regional institutions after Paris Club
arrangements in the years 1996, 1997 and 2001. Accordingly, the
ratio of outstanding external public debt to GDP declined from
30.8% at the end of 2005 to 28.7% at the end of 2006. This ratio
is considered among the lowest in the Middle East. The share of
external public debt to total public debt represents 87.8% at the
end of 2006, against 84.9% at the end of 2005. Out of the
outstanding external debt, the grant element amounted to 34.8%,
whereby the present value of external debt amounted to
US$3565.4 million at the end of 2006 against US$3371.2 million
at the end of 2005, an increase of US$194.2 million or 5.8%. In
2006, the ratio of external debt service to export of goods and
services amounted to 2.1% against 5.7% in 2005. Among debt
creditors, there are three groups of donors:
1. International Institutions:
Out of total external public debt outstanding at the end of 2006,
international institutions brought together the lion’s share, with
an outstanding debt of US$2780.4 million, or 50.8% of the total
outstanding debt. Loans of international institutions, particularly
IDA, do not bear interest and repaid through long periods with 10
years of grace period.
ــــــــــــــــــــــــــــــــــــــــــــــــــــــــــــــــــــــــــــــــــــــــــــــــــــــــــــــــــــــــــــــــــــــــــــــــــــــChapter Three Government Finance 52
Among this creditor’s group, IDA ranked the first, with a total
debt amounting to US$1889.1 million, forming 34.5% of the total
outstanding balance of utilized loans. The Arab Fund for
Economic and Social Development ranked the second, with a
total amount of US$369.7 million, or 7.3% of the outstanding
balance. The International Monetary Fund (IMF) ranked the
third, with a total amount of US$245.4 million, or 4.5% of the
outstanding balance. Then, comes the International Fund for
Agricultural Development (IFAD), with a total amount of
US$108.2 million, or 2.0% of the total outstanding debt, followed
by the Islamic Bank for Development with a total amount of
US$70.2 million, or 1.3% of the total outstanding debt. Other
agencies within the framework of this group represented by
OPEC Fund, OAPEC Fund, European Union and Arab Cities
Organization with loan balances of US$37.4 million, US$28.4
million, US$4.9 million, and US$0.1 million, respectively.
2. Member countries of Paris Club:
The outstanding debt of Paris Club member countries on
31/12/2006 amounted to US$1728.8 million, or 31.6% of the
total outstanding debt. Among states of this group, Russia ranked
the first with a total debt of US$1248.1 million or 22.8% of the
total outstanding debt, followed by Japan, with an amount of
US$238.6 million, or 4.4% of the total outstanding balance. The
ــــــــــــــــــــــــــــــــــــــــــــــــــــــــــــــــــــــــــــــــــــــــــــــــــــــــــــــــــــــــــــــــــــــــــــــــــــــChapter Three Government Finance 53
USA ranked the third with a balance of US$99.2 million, or 1.8%
of the total outstanding debt, followed by France, in the fourth
grade, with an amount of US$83.7 million, or 1.5% of the total
outstanding debt. Loans extended by Spain, Italy, Denmark,
Netherlands and Germany amounted to US$27.5 million,
US$24.1 million, US$3.1 million, US$2.7 million and US$1.8
million, respectively.
3. Non-Member Countries of Paris Club:
The outstanding debt of non-member countries of Paris Club on
31/12/2006 amounted to US$959.7 million, or 17.6% of the total
outstanding debt. Among donors of this group, the Saudi
Development Fund came in the forefront, with an amount of
US$309.4 million, or 5.7% of the total outstanding debt. The
Kuwaiti Development Fund occupied the second class, with an
amount of US$166.1 million, or 3.0% of the total outstanding
balance. The Kuwaiti deposits ranked the third, with an amount
of US$150.1 million, or 2.8% of the total debt outstanding,
followed by China, with an amount of US$164.0 million, or 3.0%
of the total debt outstanding, followed by Algeria with an amount
of US$79.8 million or 1.5% of the total outstanding debt. Then
Poland, Korea, the Iraqi Development Fund, and India with loan
balance of US$38.6 million, US$33.5 million, US$17.8 million
and US$0.2 million respectively.
ــــــــــــــــــــــــــــــــــــــــــــــــــــــــــــــــــــــــــــــــــــــــــــــــــــــــــــــــــــــــــــــــــــــــــــــــــــــChapter Three Government Finance 54
Table (18)
External Public Debt as at 31st December 2006
(US$ millions)
Creditor Outstand-
ing Incl.
Arears
%
Present
Value
Grant
Elem-ent
%
Paris Club Countries 1728.81 31.61 993.39 42.54
Russian Federation 1248.10 22.82 653.52 47.64
Japan 238.61 4.36 184.29 22.76
U.S.A 99.17 1.81 65.51 33.94
France 83.71 1.53 50.31 39.89
Italy 24.12 0.44 13.55 43.81
Spain 27.53 0.50 17.95 34.80
Denamrk 3.07 0.06 3.03 1.07
Netherlands 2.73 0.05 3.18 -16.42
Germany 1.76 0.03 2.04 -15.02
Non-Paris Club Countries 959.74 17.55 708.32 26.20
Saudi Arabia 309.38 5.66 165.46 46.52
Kuwait Dev. Fund 166.11 3.04 165.47 27.91
Kuwait (Deposit) 150.32 2.75 150.32 0.00
China 164.01 3.00 139.59 14.89
Algeria 79.76 1.46 69.43 12.95
Iraqi Dev. Fund 17.79 0.33 12.13 31.83
Poland 38.63 0.71 35.66 7.69
Korea 33.55 0.61 15.79 52.93
India 0.15 0.0 0.17 0.00

ــــــــــــــــــــــــــــــــــــــــــــــــــــــــــــــــــــــــــــــــــــــــــــــــــــــــــــــــــــــــــــــــــــــــــــــــــــــChapter Three Government Finance 55
Table (18) Cont'd
External Public Debt as at 31st December 2006
(US$ millions)
Creditor Outstand-
ing Incl.
Arears
%
Present
Value
Grant
Elem-ent
%
Int'l & Regional Financing
Institutions
2780.41 50.84 1863.71 32.97
IDA 1889.09 34.54 1072.63 43.22
AFESD 369.75 7.25 380.64 4.06
IMF 245.41 4.49 228.63 6.84
IFAD 108.23 1.98 67.57 37.57
Islamic Dev. Bank 70.20 1.28 50.35 28.29
OPEC 37.38 0.68 32.10 14.12
OAPEC 28.36 0.52 28.36 0.00
EEC 4.88 0.09 3.35 31.34
Arab Cities Org. 0.10 0.0 0.10 1.74
Grand Total 5468.96 100.0 3565.42 34.81
ــــــــــــــــــــــــــــــــــــــــــــــــــــــــــــــــــــــــــــــــــــــــــــــــــــــــــــــــــــــــــــــــــــــــــــــــــــــChapter Four Money and Credit 57
Chapter Four
Money and Credit
I. Banking Sector, Monetary and Credit Developments 1. Monetary Policy The benchmark minimum interest rate on bank deposits has been
kept unchanged at 13% since July 2000. The level of interest
rates on the Yemeni Rial, although still high in comparison with
major foreign currencies, is acceptable for purposes of monetary
policy. In order to achieve the main aim of monetary policy, which is price stability, the Central Bank closely monitored the developments in economic activity in order to determine the suitable level of domestic liquidity and then undertake the necessary measures to reach that level. At the end of February 2006, the Central Bank lowered the reserve requirements on foreign currency deposits from 30% to 20% without interest paid on these reserves. The measure was taken after the decision to raise the reserve requirements in June 2005 achieved its purpose and in view of the prevailing market stability, the decline in dollarization and the relaxation of pressures on the exchange rate. The Central Bank intervention in the foreign exchange market by selling foreign currencies fell by 2.5 % from US $ 1,174 million

ــــــــــــــــــــــــــــــــــــــــــــــــــــــــــــــــــــــــــــــــــــــــــــــــــــــــــــــــــــــــــــــــــــــــــــــــــــــChapter Four Money and Credit 58
in 2005 to US $ 1,145 million in 2006. The aim of this policy is to replenish the market with its needs of foreign currencies as well as to absorb domestic liquidity for the maintenance of price stability. 2. The Exchange Rate
The freely floating exchange rate system has been the regime
adopted by Yemen for more than a decade and the Central Bank
intervenes to influence the direction of the exchange rate only in
the case of short term wide fluctuations in the exchange market,
which are unwarranted by economic fundamentals. This policy
has contributed to the build-up of foreign reserves. The Republic
of Yemen has accepted Article VIII of the IMF Agreement since
December 1996, after which the country has maintained an
exchange rate regime free of controls on current and capital
payments.
The US dollar increased by only 2% against the Yemeni Rial in
2006 from YR 195.08 at the end of 2005 to YR 198.50 at the end
of 2006, compared with an increase of 3% in the average
exchange rate. The reasons behind the strength of the Yemeni
Rial in 2006 were the fall of the dollar against the other major
foreign currencies, the Central Bank sales of foreign currencies,
the improvement in the current account position and the
accumulation of official currency reserves.

ــــــــــــــــــــــــــــــــــــــــــــــــــــــــــــــــــــــــــــــــــــــــــــــــــــــــــــــــــــــــــــــــــــــــــــــــــــــChapter Four Money and Credit 59
The dollar in 2006 fell by 10% against the Euro, 12% against the
Pound Sterling and 5% against the SDR, but it has improved
against the Japanese Yen by about 1%.
3. Bank Branches
In order to spread the banking habit and expand the provision of
bank services, several new bank branches were opened in 2006 as
is shown in the following table:
Table (19) New Branches of Banks in 2006
Bank New branches Date of inauguration
1. Yemen Bank for Recon. and Dev Hayel St. – Sana'a 13/3/2006 2. coop. Agricultural Credit Bank Al- Shehr 26/8/2006 3. Tadamon Islamic Bank Buwaish - Almukala
Tarim - Say’un Al-hasaba - Sana'a
9/ 3 /2006 18/3/2006 29/6/2006
4. Saba Islamic Bank Say’un 22/4/2006 5. Shamil Bank of Yemen and Bahrain
Hadda – Sana'a 5/ 8 /2006
6. National Bank of Yemen Taiz 1/10/2006 7. Yemen Kuwait Bank St. No. 16 - Sana'a 9/ 5 /2006 8. Arab Bank Taiz St. - Sana'a
Al-hasaba - Sana'a Hawdh Al-Ashraf - Taiz
16/4/2006 16/4/2006 22/4/2006

ــــــــــــــــــــــــــــــــــــــــــــــــــــــــــــــــــــــــــــــــــــــــــــــــــــــــــــــــــــــــــــــــــــــــــــــــــــــChapter Four Money and Credit 60
Many ATMs were established in 2006 and the following table
shows the number of these machines as at the end of 2006 and
the names of the Islamic and conventional banks which operate
them.
Table (20)
The Distribution of ATMs by Banks
Bank Number of
ATMs
1.International Bank of Yemen 44
2. Saba Islamic Bank 30
3. Yemen Commercial Bank 26
4. Tadamon Islamic Bank 17
5. Arab Bank 11
6. Yemen Gulf Bank 5
7. Coop. Agricultural Credit Bank 5
8.Shamil Bank of Yemen & Bahrain 4
Total 142
Money Supply
0
200000
400000
600000
800000
1000000
1200000
1400000
1600000
1996 1997 1998 1999 2000 2001 2002 2003 2004 2005 2006
Mill
ions
of R
ials
Money النقود Quasi Money شبه النقود

ــــــــــــــــــــــــــــــــــــــــــــــــــــــــــــــــــــــــــــــــــــــــــــــــــــــــــــــــــــــــــــــــــــــــــــــــــــــChapter Four Money and Credit 62
New licences were issued by the Central Bank for money
changers and bureaux de change all over the country in 2006 and
below is a table showing the number of licences granted in the
various Governorates of the Republic.
Table (21) Number of Licenses granted to Money Changers In 2005
Governorate Number of Licenses granted
1. Sana'a 194
2. Aden 49
3. Taiz 40
4. Ibb 36
5. Hodeidah 31
6. Hajja 26
7. Mukalla 22
8. Say'un 14
9. Shabwa 12
10.Al-Beidha 9
11. Sa'da 9
12. Al-Mahra 7
13. Dhale 5
14. Dhamar 4
15. Amran 3
16. Abyan 3
17. Lahj 1
Total 465
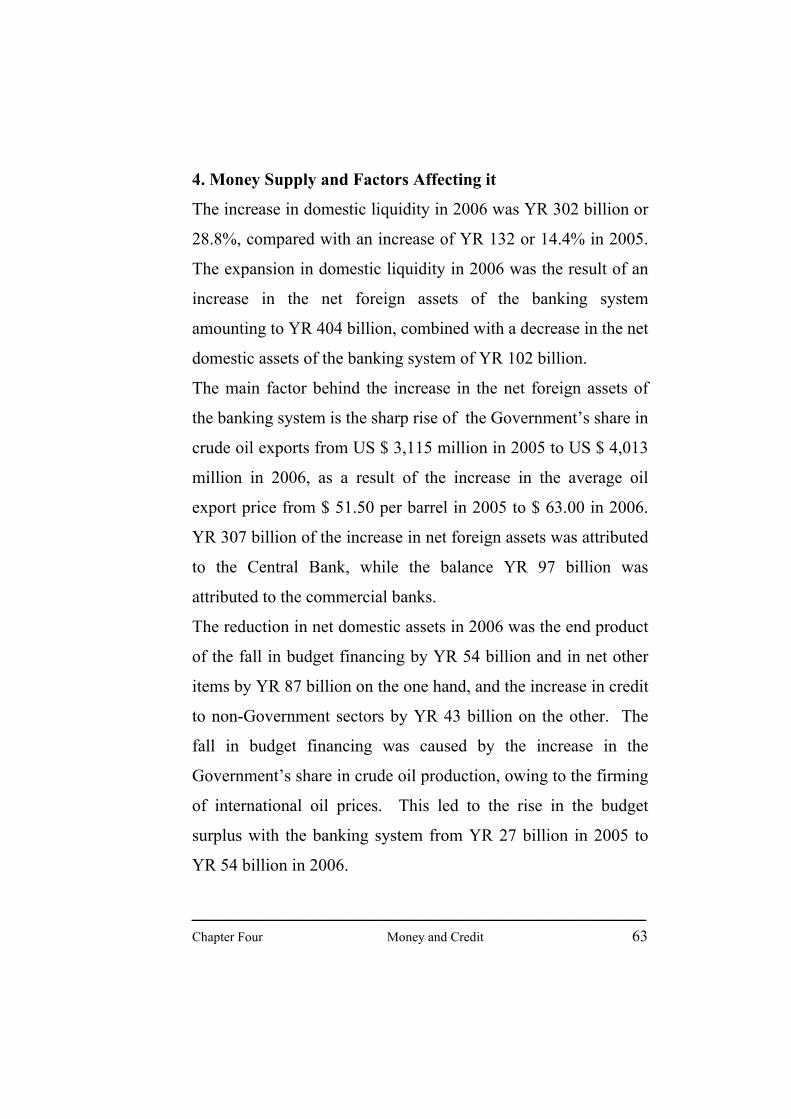
ــــــــــــــــــــــــــــــــــــــــــــــــــــــــــــــــــــــــــــــــــــــــــــــــــــــــــــــــــــــــــــــــــــــــــــــــــــــChapter Four Money and Credit 63
4. Money Supply and Factors Affecting it
The increase in domestic liquidity in 2006 was YR 302 billion or
28.8%, compared with an increase of YR 132 or 14.4% in 2005.
The expansion in domestic liquidity in 2006 was the result of an
increase in the net foreign assets of the banking system
amounting to YR 404 billion, combined with a decrease in the net
domestic assets of the banking system of YR 102 billion.
The main factor behind the increase in the net foreign assets of
the banking system is the sharp rise of the Government’s share in
crude oil exports from US $ 3,115 million in 2005 to US $ 4,013
million in 2006, as a result of the increase in the average oil
export price from $ 51.50 per barrel in 2005 to $ 63.00 in 2006.
YR 307 billion of the increase in net foreign assets was attributed
to the Central Bank, while the balance YR 97 billion was
attributed to the commercial banks.
The reduction in net domestic assets in 2006 was the end product
of the fall in budget financing by YR 54 billion and in net other
items by YR 87 billion on the one hand, and the increase in credit
to non-Government sectors by YR 43 billion on the other. The
fall in budget financing was caused by the increase in the
Government’s share in crude oil production, owing to the firming
of international oil prices. This led to the rise in the budget
surplus with the banking system from YR 27 billion in 2005 to
YR 54 billion in 2006.
ــــــــــــــــــــــــــــــــــــــــــــــــــــــــــــــــــــــــــــــــــــــــــــــــــــــــــــــــــــــــــــــــــــــــــــــــــــــChapter Four Money and Credit 64
Credit to the private sector grew by 17% in 2006 compared with
21% in 2005. The decrease in net other items was in part due to
the increase in the capital of the banking system as a whole, in
addition to movements in exchange valuations.
In 2006 M1 grew by YR 116 billion while quasi-money by YR
186 billion. M1 growth was the result of an increase of YR 82
billion in money in circulation and YR 34 billion in Rial demand
deposits. The growth in quasi money in 2006 was caused by the
increase of YR 87 billion in saving, earmarked and time deposits
and YR 99 billion in foreign currency demand, saving and time
deposits.
Currency in circulation fell a little from 48% of Rial broad
money in 2005 to 46% in 2006, while Rial quasi money rose
from 36% of Rial broad money in 2005 to 38% in 2006. Foreign
currency deposits remained unchanged at 34% of broad money in
both years.

ــــــــــــــــــــــــــــــــــــــــــــــــــــــــــــــــــــــــــــــــــــــــــــــــــــــــــــــــــــــــــــــــــــــــــــــــــــــChapter Four Money and Credit 65
Table (22)
Monetary Survey
2004 2005 2006
End of Period Balances (YR Billion)
Broad money 917.2 1049.5 1351.4
Money 390.5 442.5 558.5
Currency Outside Banks 297.9 330.6 412.5
Demand Deposits 92.6 111.9 145.9
Quasi-Rial Money 239.5 251.5 338.8
Deposits in Foreign Currency 287.2 355.5 454.2
Net Foreign Assets 1117.6 1271.4 1675.1
Central Bank of Yemen 962.2 1112.6 1419.2
Commercial Banks 155.4 158.8 255.9
Net Domestic Assets 200.3- 221.9- 323.6-
Credit to Government (net) 64.8- 92.7- 151.2-
Total budget financing (Net) 7.9- 34.9- 88.8-
Credit to non-Government 185.5 225.8 269.2
Private Sector 183.6 222.6 259.9
Public & mixed enterprises 1.9 3.2 9.3
Other items (Net) 321.0- 355.0- 441.6-
(Changes in % of broad money at beginning of period)
Net Foreign Assets 18.3 16.8 38.5
Net Domestic Assets 3.3- 2.3- 9.7-
Total budget financing (Net) 2.5- 2.9- 5.1-
Credit to private sector 5.8 4.3 3.6
(Changes in percent)
Broad money 15.0 14.4 28.8
Rial broad money 19.6 10.2 29.3
Credit to private sector 33.5 21.3 16.7

ــــــــــــــــــــــــــــــــــــــــــــــــــــــــــــــــــــــــــــــــــــــــــــــــــــــــــــــــــــــــــــــــــــــــــــــــــــــChapter Four Money and Credit 66
II. Central Bank Activities
Central Bank Balance Sheet
The Central Bank Balance sheet total increased by 25% from YR
1,230 billion at the end of 2005 to YR 1,543 billion at the end of
2006, compared with an increase of 14% in 2005.
The Assets
The net foreign assets of the Central Bank increased by 28%
from YR 1,112 billion at the end of 2005 to YR 1,419 billion at
the end of 2006, compared with an increase of 16% the previous
year. The higher increase was owing to a rise in Government
crude oil export revenues from US $ 3,115 million in 2005 to US
$ 4,013 million in 2006, as a result of stronger crude oil export
prices, averaging 63 dollars per barrel in 2006 against 51.5
dollars in 2005, in addition to an expansion in the quantities
exported from 60.46 million barrels in 2005 to 63.71 million in
2006. Gross foreign assets declined a little as a ratio of total
assets from 97.4 % at the end of 2005 to 97.1 % at the end of
2006.
Net claims on Government declined by 35 % in 2006 compared
with a decline of 29 % in 2005, as a result of higher crude oil
export quantities and prices.

ــــــــــــــــــــــــــــــــــــــــــــــــــــــــــــــــــــــــــــــــــــــــــــــــــــــــــــــــــــــــــــــــــــــــــــــــــــــChapter Four Money and Credit 67
The Liabilities
Reserve money (currency outside banks and with banks and bank
balances with the Central Bank) increased by 17 % from YR 488
billion at the end of 2005 to YR 571 billion at the end of 2006,
compared with an increase of 18 % the previous year. The
change in reserve money in 2006 was the end product of an
increase of YR 82 billion in currency issued and YR 1.5 billion in
bank balances with the Central Bank, caused by a rise in bank
deposits both in local and foreign currencies, despite the
lowering of reserve requirements on foreign currency deposits
earlier in the year.
Public sector enterprises’ deposits in foreign currencies rose by 9
% in 2006 against a much higher rise of 76 % in 2005. Pension
fund deposits, mostly in foreign currencies, amounted to YR 62
billion in December 2006 compared with YR 58 billion a year
earlier. These deposits belong to tens of thousands of retired
employees or those who will be retired in the civil service, armed
and security forces as well as the public, mixed and private
sectors.
The certificates of deposit issued by the Central Bank amounted
to YR 98 billion at the end of 2006 compared with YR 17 billion
at the end of 2005. The issue of these certificates was begun in
January 2001 as a temporary measure. They helped in absorbing
excess liquidity, achieving price stability and mopping up foreign
ــــــــــــــــــــــــــــــــــــــــــــــــــــــــــــــــــــــــــــــــــــــــــــــــــــــــــــــــــــــــــــــــــــــــــــــــــــــChapter Four Money and Credit 68
currency inflows. The Central Bank bears the interest burden on
these CDs, which adversely affects the surplus profits it transfers
at the end of the financial year to the Ministry of Finance.
Net other items increased by 22 % in 2006 compared with 3 % in
2005, mainly owing to the increase in foreign currency valuation
account.
Central Bank Net Profits
Central Bank net profits rose sharply by 89 % from YR 27.5
billion in 2005 to YR 51.9 billion in 2006. On the other hand,
revenues increased by 55 % from YR 52.7 billion in 2005 to YR
81.9 billion in 2006, mainly owing to the rise in interest income
on investments abroad from YR 32.3 billion in 2005 to YR 59.7
billion in 2006, as a result of firmer interest rates and the
accumulation of foreign reserves.
Expenditure increased relatively less by 19 % from YR 25.2
billion in 2005 to YR 30 billion in 2006, as interest paid rose
from YR 20.9 billion in 2005 to YR 26.3 billion in 2006. Out of
the interest paid in 2006, CDs accounted for YR 4.8 billion.
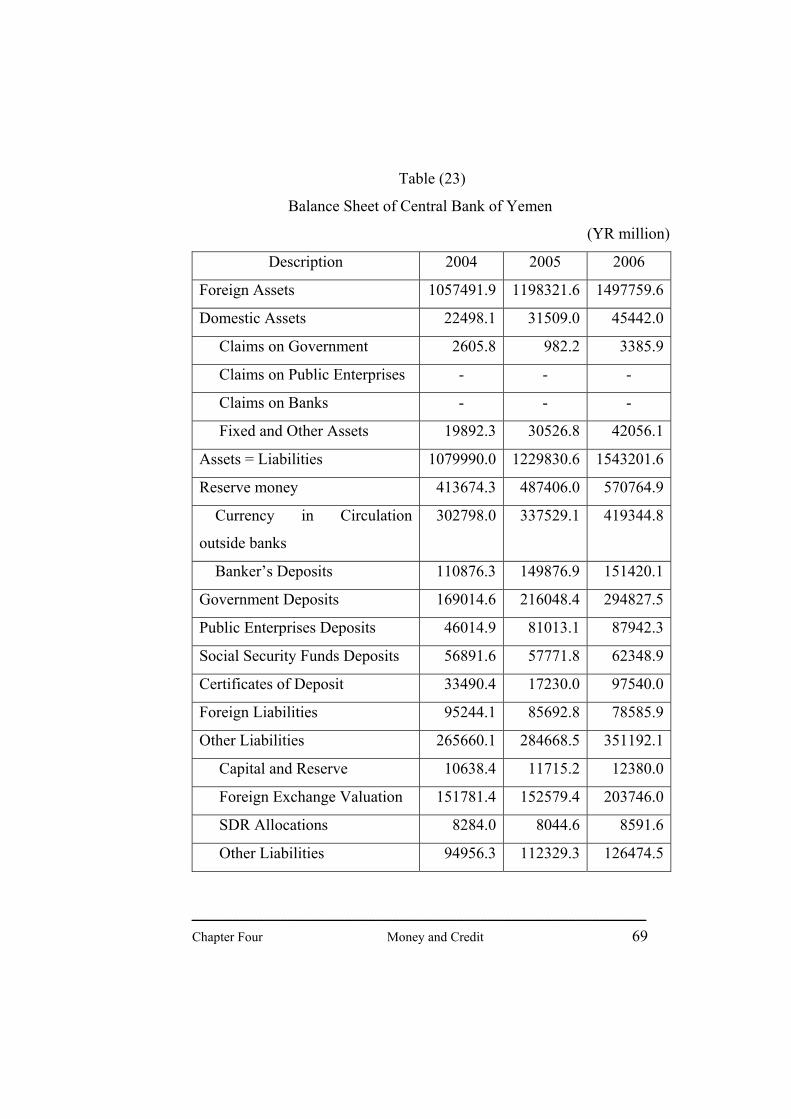
ــــــــــــــــــــــــــــــــــــــــــــــــــــــــــــــــــــــــــــــــــــــــــــــــــــــــــــــــــــــــــــــــــــــــــــــــــــــChapter Four Money and Credit 69
Table (23)
Balance Sheet of Central Bank of Yemen
(YR million)
Description 2004 2005 2006
Foreign Assets 1057491.9 1198321.6 1497759.6
Domestic Assets 22498.1 31509.0 45442.0
Claims on Government 2605.8 982.2 3385.9
Claims on Public Enterprises - - -
Claims on Banks - - -
Fixed and Other Assets 19892.3 30526.8 42056.1
Assets = Liabilities 1079990.0 1229830.6 1543201.6
Reserve money 413674.3 487406.0 570764.9
Currency in Circulation
outside banks
302798.0 337529.1 419344.8
Banker’s Deposits 110876.3 149876.9 151420.1
Government Deposits 169014.6 216048.4 294827.5
Public Enterprises Deposits 46014.9 81013.1 87942.3
Social Security Funds Deposits 56891.6 57771.8 62348.9
Certificates of Deposit 33490.4 17230.0 97540.0
Foreign Liabilities 95244.1 85692.8 78585.9
Other Liabilities 265660.1 284668.5 351192.1
Capital and Reserve 10638.4 11715.2 12380.0
Foreign Exchange Valuation 151781.4 152579.4 203746.0
SDR Allocations 8284.0 8044.6 8591.6
Other Liabilities 94956.3 112329.3 126474.5

ــــــــــــــــــــــــــــــــــــــــــــــــــــــــــــــــــــــــــــــــــــــــــــــــــــــــــــــــــــــــــــــــــــــــــــــــــــــChapter Four Money and Credit 70
Currency Issued
Currency issued amounted to YR 419 billion in 2006, which is 24
% higher than what it was in 2005, while in 2005 it was only 11
% higher than what it was in 2004. Concerning the distribution
by denomination, the YR 1,000 note represented 61 % of the
currency issued in terms of value, followed by the YR 500 note
(24 %), then YR 200 and YR 100 notes (8% and 5%
respectively) and the remaining 2 % for the lower denominations
(YR 50, 20, 10 and 5). The increase in the shares of the YR
1,000 and YR 500 denominations has facilitated the processes of
counting, sorting, transporting and warehousing the banknotes.
The Clearing House
In 2006, the number of cheques cleared and settled at the clearing
rooms of the Central Bank was 646,000 amounting to YR 1,265
billion. These figures were higher than in 2005 by 8 % and 24 %
respectively. Returned cheques were 19,000 amounting to YR 57
billion in 2006, compared with 18,000 cheques amounting to YR
51 billion in 2005. The number of accounts maintained at the
banking sector is roughly one million, equivalent to 4.5 % of the
population, which is relatively very low. By comparison this
ratio is 25 % in Saudi Arabia, 130 % in Australia and 400 % in
Hong Kong .
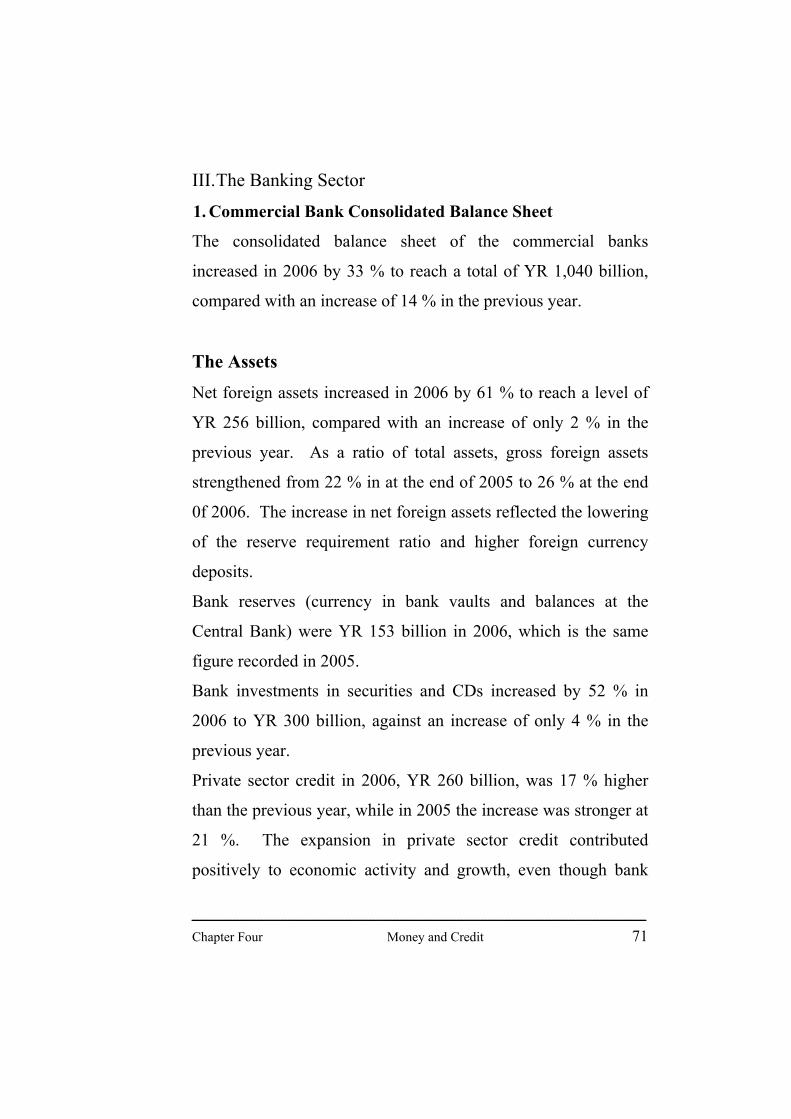
ــــــــــــــــــــــــــــــــــــــــــــــــــــــــــــــــــــــــــــــــــــــــــــــــــــــــــــــــــــــــــــــــــــــــــــــــــــــChapter Four Money and Credit 71
III. The Banking Sector
1. Commercial Bank Consolidated Balance Sheet
The consolidated balance sheet of the commercial banks
increased in 2006 by 33 % to reach a total of YR 1,040 billion,
compared with an increase of 14 % in the previous year.
The Assets
Net foreign assets increased in 2006 by 61 % to reach a level of
YR 256 billion, compared with an increase of only 2 % in the
previous year. As a ratio of total assets, gross foreign assets
strengthened from 22 % in at the end of 2005 to 26 % at the end
0f 2006. The increase in net foreign assets reflected the lowering
of the reserve requirement ratio and higher foreign currency
deposits.
Bank reserves (currency in bank vaults and balances at the
Central Bank) were YR 153 billion in 2006, which is the same
figure recorded in 2005.
Bank investments in securities and CDs increased by 52 % in
2006 to YR 300 billion, against an increase of only 4 % in the
previous year.
Private sector credit in 2006, YR 260 billion, was 17 % higher
than the previous year, while in 2005 the increase was stronger at
21 %. The expansion in private sector credit contributed
positively to economic activity and growth, even though bank

ــــــــــــــــــــــــــــــــــــــــــــــــــــــــــــــــــــــــــــــــــــــــــــــــــــــــــــــــــــــــــــــــــــــــــــــــــــــChapter Four Money and Credit 72
intermediation is still limited in Yemen, as private sector credit
did not exceed 25 % of total assets at the end of 2006, while 69 %
of these assets are placed in risk free investments, consisting of
foreign assets (26 %), securities and CDs (29 %) and Central
Bank balances (14 %).
The Liabilities
Total deposits in 2006 increased by 33 % to YR 851 billion
(excluding non-resident deposits), compared with a growth of 11
% in the previous year. In 2006, Rial demand deposits, Rial
quasi money and foreign currency deposits grew by 44 %, 35 %
and 30 % respectively, reflecting the spread of bank
intermediation.
Net other liabilities increased by 31 % to YR 127 billion in 2006,
against an increase of 37 % the previous year, reflecting, in part,
the efforts of the Central Bank aiming at strengthening the capital
adequacy of banks. Most banks have raised their capital, in
accordance with Central Bank Board of Directors’ Decree No. 12
for the year 2004, relating to the raising of bank capital to YR 6
billion, provided each bank meets each year 20 % of the required
increase in the paid-up capital beginning in 2005 and ending in
2009.

ــــــــــــــــــــــــــــــــــــــــــــــــــــــــــــــــــــــــــــــــــــــــــــــــــــــــــــــــــــــــــــــــــــــــــــــــــــــChapter Four Money and Credit 73
In 1997, the capital adequacy ratio of the banking system as a
whole was 0.6 %. This ratio gradually improved until it reached
at the end of 2005 12 %, which is relatively high, in comparison
to the Basle Committee capital adequacy criterion of 8 %. The
Central Bank categorizes the banks every three months on the
basis of international criteria known by the name “CAMEL”.
1. Deposit Maturities
Time deposits in local currency increased by 26 % in 2006,
compared with an increase of only 2 % in 2005. Saving deposits,
also in Rials, grew by 18 % in 2006, against 8 % in 2005. Rial
Earmarked deposits rose by 58 % in 2006, compared with 15 %
in the previous year. Rial demand deposits also rose by 44 % in
2006, while in 2005 they almost recorded no change.
Foreign currency deposits grew by 30 % in 2006 against a growth
of 20 % in 2005. On the other hand, Yemeni Rial total deposits
increased by 37 % in 2006 against an increase of 4 % only in
2005. This led to the fall of foreign currency deposits as a ratio
of total deposits from 50 % at the end of 2005 to 49 % at the end
of 2006. The reason behind the relative increase in local
currency deposits is the Rial exchange rate stability against the
dollar, in addition to the higher level of interest rates on the
Yemeni Rial than on the dollar.
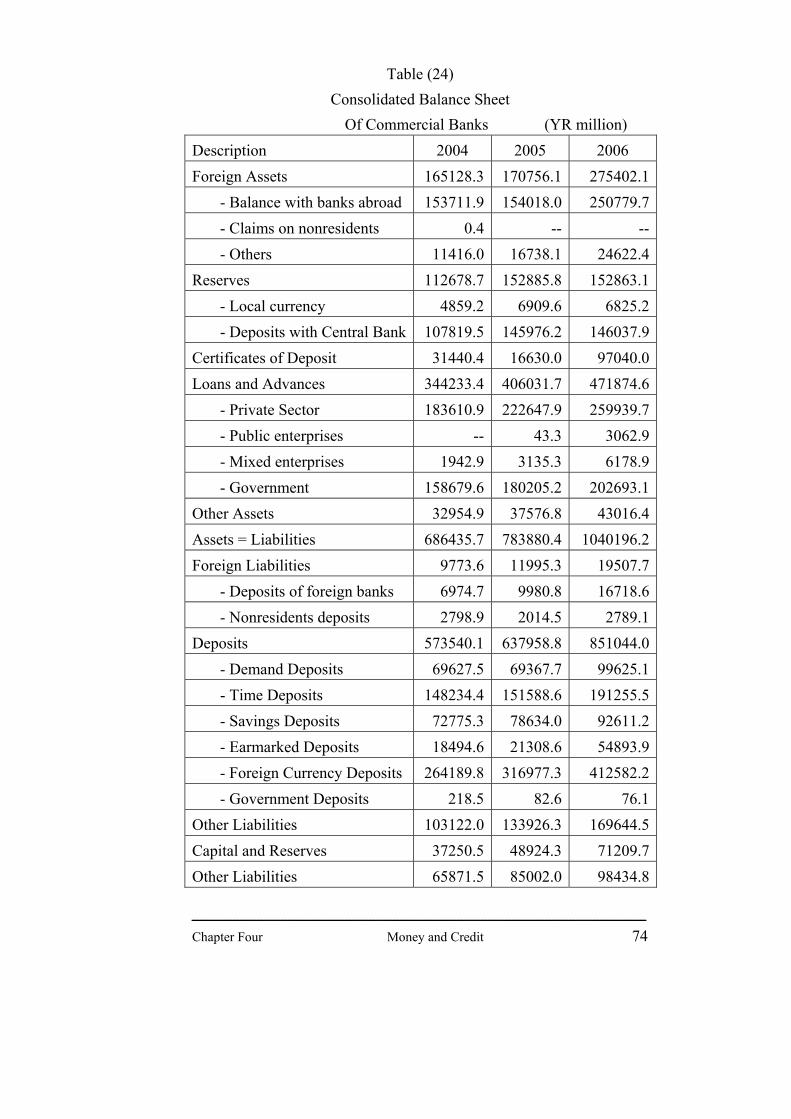
ــــــــــــــــــــــــــــــــــــــــــــــــــــــــــــــــــــــــــــــــــــــــــــــــــــــــــــــــــــــــــــــــــــــــــــــــــــــChapter Four Money and Credit 74
Table (24) Consolidated Balance Sheet
Of Commercial Banks (YR million) Description 2004 2005 2006 Foreign Assets 165128.3 170756.1 275402.1 - Balance with banks abroad 153711.9 154018.0 250779.7 - Claims on nonresidents 0.4 -- -- - Others 11416.0 16738.1 24622.4 Reserves 112678.7 152885.8 152863.1 - Local currency 4859.2 6909.6 6825.2 - Deposits with Central Bank 107819.5 145976.2 146037.9 Certificates of Deposit 31440.4 16630.0 97040.0 Loans and Advances 344233.4 406031.7 471874.6 - Private Sector 183610.9 222647.9 259939.7 - Public enterprises -- 43.3 3062.9 - Mixed enterprises 1942.9 3135.3 6178.9 - Government 158679.6 180205.2 202693.1 Other Assets 32954.9 37576.8 43016.4 Assets = Liabilities 686435.7 783880.4 1040196.2 Foreign Liabilities 9773.6 11995.3 19507.7 - Deposits of foreign banks 6974.7 9980.8 16718.6 - Nonresidents deposits 2798.9 2014.5 2789.1 Deposits 573540.1 637958.8 851044.0 - Demand Deposits 69627.5 69367.7 99625.1 - Time Deposits 148234.4 151588.6 191255.5 - Savings Deposits 72775.3 78634.0 92611.2 - Earmarked Deposits 18494.6 21308.6 54893.9 - Foreign Currency Deposits 264189.8 316977.3 412582.2 - Government Deposits 218.5 82.6 76.1 Other Liabilities 103122.0 133926.3 169644.5 Capital and Reserves 37250.5 48924.3 71209.7 Other Liabilities 65871.5 85002.0 98434.8
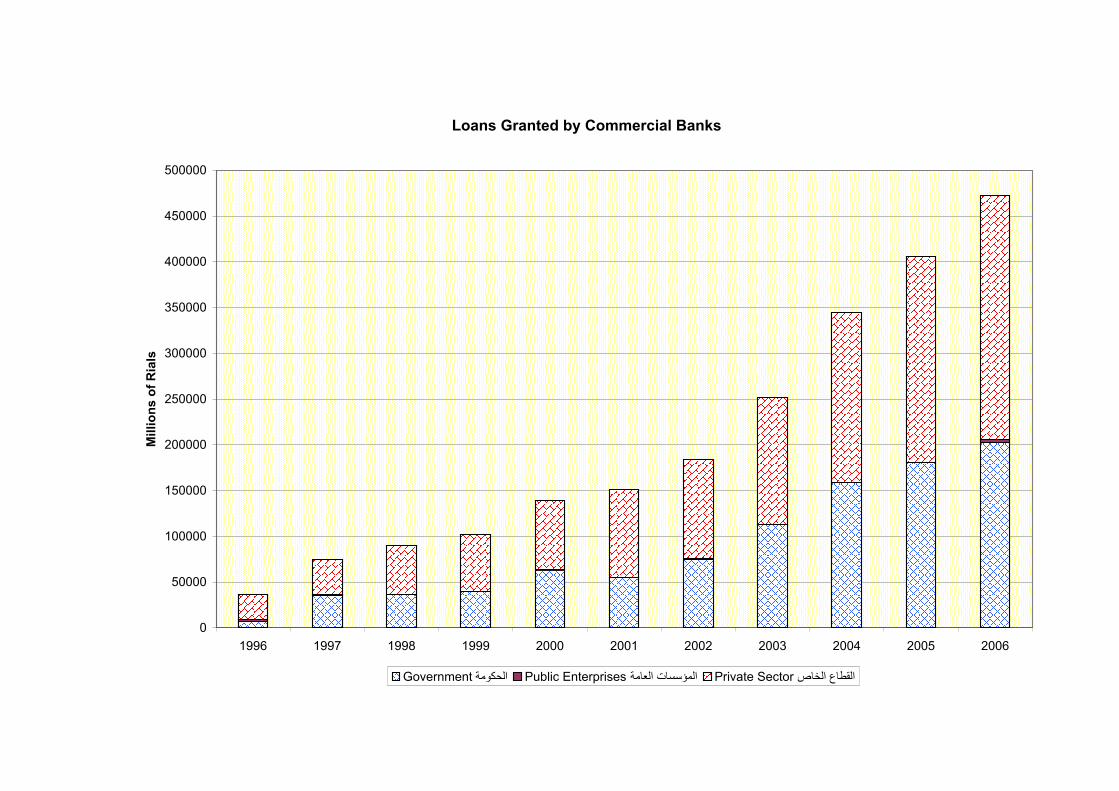
Loans Granted by Commercial Banks
0
50000
100000
150000
200000
250000
300000
350000
400000
450000
500000
1996 1997 1998 1999 2000 2001 2002 2003 2004 2005 2006
Mill
ions
of R
ials
Government الحكومة Public Enterprises المؤسسات العامة Private Sector القطاع الخاص
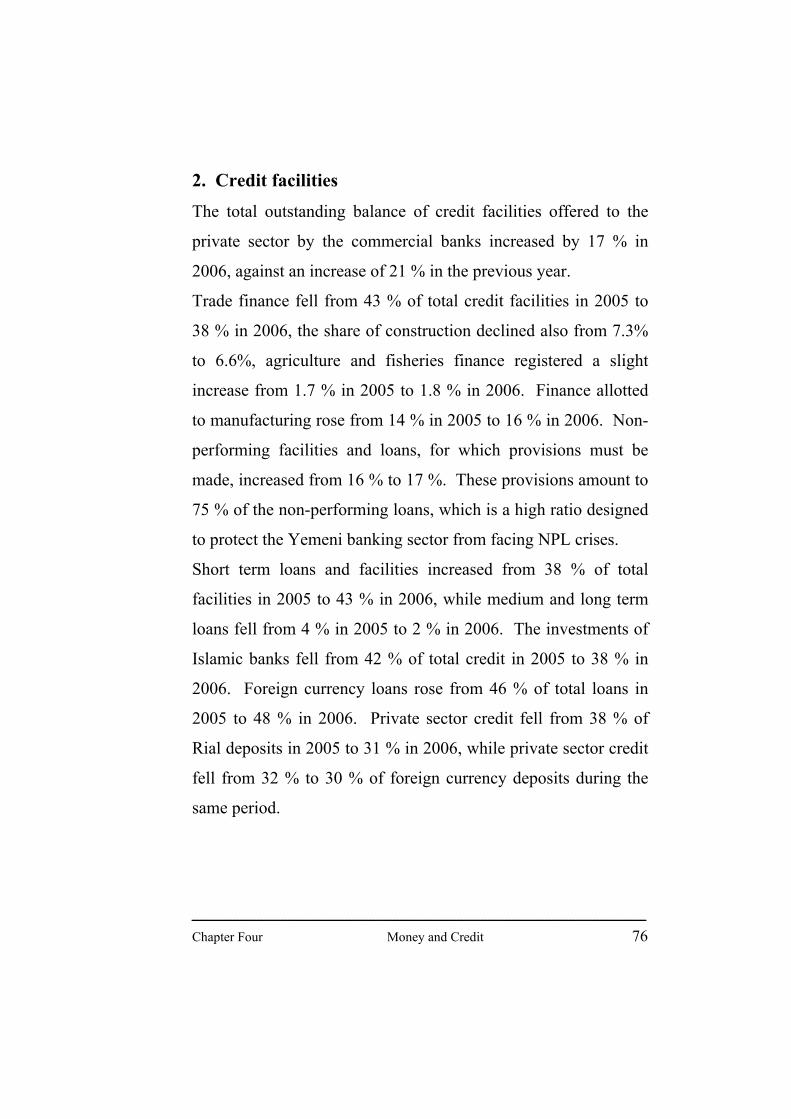
ــــــــــــــــــــــــــــــــــــــــــــــــــــــــــــــــــــــــــــــــــــــــــــــــــــــــــــــــــــــــــــــــــــــــــــــــــــــChapter Four Money and Credit 76
2. Credit facilities
The total outstanding balance of credit facilities offered to the
private sector by the commercial banks increased by 17 % in
2006, against an increase of 21 % in the previous year.
Trade finance fell from 43 % of total credit facilities in 2005 to
38 % in 2006, the share of construction declined also from 7.3%
to 6.6%, agriculture and fisheries finance registered a slight
increase from 1.7 % in 2005 to 1.8 % in 2006. Finance allotted
to manufacturing rose from 14 % in 2005 to 16 % in 2006. Non-
performing facilities and loans, for which provisions must be
made, increased from 16 % to 17 %. These provisions amount to
75 % of the non-performing loans, which is a high ratio designed
to protect the Yemeni banking sector from facing NPL crises.
Short term loans and facilities increased from 38 % of total
facilities in 2005 to 43 % in 2006, while medium and long term
loans fell from 4 % in 2005 to 2 % in 2006. The investments of
Islamic banks fell from 42 % of total credit in 2005 to 38 % in
2006. Foreign currency loans rose from 46 % of total loans in
2005 to 48 % in 2006. Private sector credit fell from 38 % of
Rial deposits in 2005 to 31 % in 2006, while private sector credit
fell from 32 % to 30 % of foreign currency deposits during the
same period.

ــــــــــــــــــــــــــــــــــــــــــــــــــــــــــــــــــــــــــــــــــــــــــــــــــــــــــــــــــــــــــــــــــــــــــــــــــــــChapter Four Money and Credit 77
Table (25)
Loans and Advances of Commercial Banks
To Nongovernment Sectors1
(YR million)
Description 2004 2005 2006
By Sector:
Agriculture and Fishing 2186.2 3876.9 4792.9
Industry 29200.8 30925.7 41496.0
Construction 12175.0 16207.4 17798.6
Trade 74418.6 96369.1 102140.7
Financing of Exports 2142.3 4074.9 4364.5
Financing of Imports 30567.0 45835.3 47833.9
Financing Trade in
manufactured goods
41709.3 46458.9 49942.3
Others 33699.7 38694.1 56622.4
Classified Loans and Advances 31930.9 36618.2 45457.1
Total 183611.2 222691.2 268307.7
By Term:
Short-term Loans and Advances 65152.9 83821.2 114833.6
Medium and Long-term loans 7263.6 8872.4 5057.4
Investments of Islamic Banks 79263.8 93379.6 102959.6
Classified Loans and Advances 31930.9 36618.2 45457.1 1 Excluding capital contributions in mixed enterprises.

Deposits of Commercial Banks
0
100000
200000
300000
400000
500000
600000
700000
800000
900000
1996 1997 1998 1999 2000 2001 2002 2003 2004 2005 2006
Mill
ions
of R
ials
Demand Deposits ودائع تحت الطلب Quasi-Money Deposits ودائع شبه النقد

ــــــــــــــــــــــــــــــــــــــــــــــــــــــــــــــــــــــــــــــــــــــــــــــــــــــــــــــــــــــــــــــــــــــــــــــــــــــChapter Five External Sector 79
Chapter Five
External Sector
I. Balance of Payments
Despite the exposure of our country to many difficulties and
terrorist acts and the limited and scarce resources, Yemen has
accomplished significant achievements that enhance confidence
in the Yemeni economy. This reflected itself, particularly, on
Yemen transactions with the rest of the world during 2006.
Preliminary data of 2006 indicate that the overall balance of
payments realized a surplus of US$1446.5 million, against a
surplus of US$584.4million in 2005. The ratio of the overall
surplus to GDP amounted to 7.6% in 2006, against 3.5% last
year. As a result, gross own foreign reserves of the Central Bank
increased from US$5645.6 million at the end of 2005 to
US$7094.7 million at the end of 2006, covering 13 months of
imports.
The surplus in the Balance of Payments is attributed to the
surplus in the current account, which amounted to US$205.7
million in 2006, against US$633.2 million last year,as well as the
surplus in the capital account ,which amounted to US$
1059.7million in 2006. The ratio of the current account to GDP

ــــــــــــــــــــــــــــــــــــــــــــــــــــــــــــــــــــــــــــــــــــــــــــــــــــــــــــــــــــــــــــــــــــــــــــــــــــــChapter Five External Sector 80
declined from 3.8% to 1.1% during the same period. On the other
hand, surplus in trade balance decreased from US$1700.3 million
in 2005 to US$1390.3 million in 2006, attributed to the increase
in the imports. Deficit in services balance increased by 51.8%
while that in income balance declined by 23.5%. Current
transfers (net) decreased by 3.5%. The capital account moved
from a deficit of US$253.5 million in 2005 to a surplus of
US$1059.7 million in 2006. For more analysis, the main
indicators and items of Balance of Payments shall be discussed
hereunder.
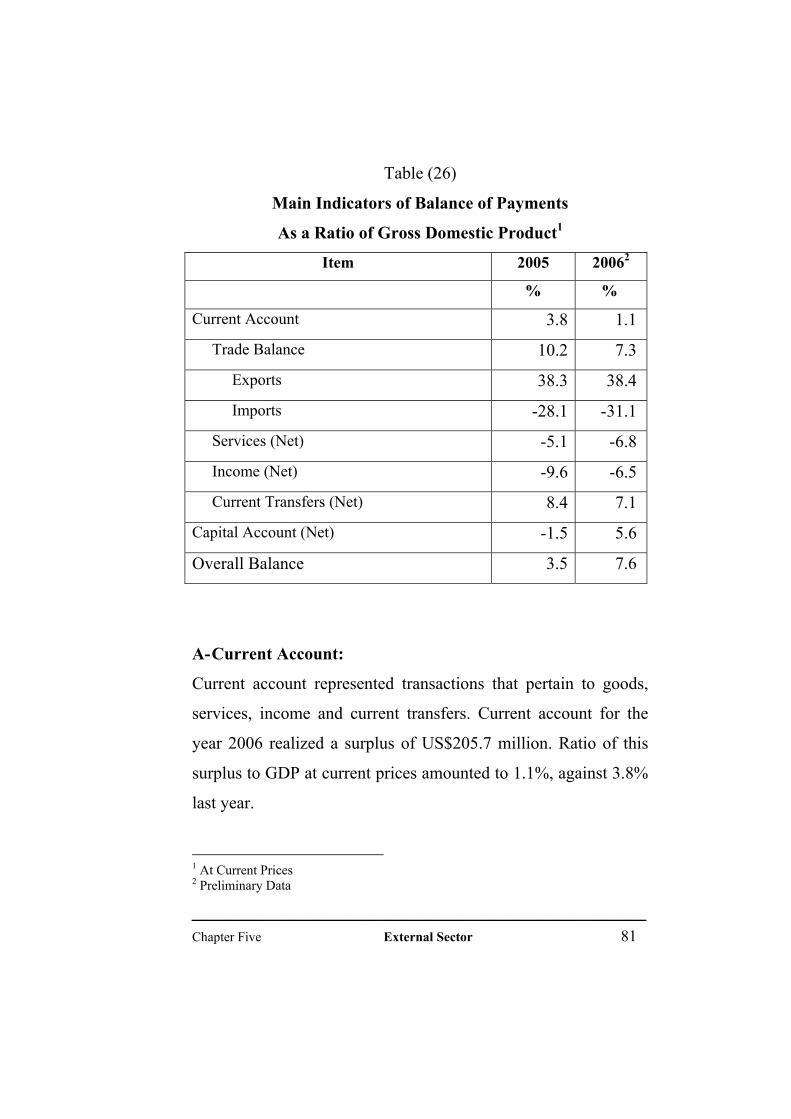
ــــــــــــــــــــــــــــــــــــــــــــــــــــــــــــــــــــــــــــــــــــــــــــــــــــــــــــــــــــــــــــــــــــــــــــــــــــــChapter Five External Sector 81
Table (26)
Main Indicators of Balance of Payments
As a Ratio of Gross Domestic Product1
Item 2005 20062
% %
Current Account 3.8 1.1
Trade Balance 10.2 7.3
Exports 38.3 38.4
Imports 28.1- 31.1-
Services (Net) 5.1- 6.8-
Income (Net) 9.6- 6.5-
Current Transfers (Net) 8.4 7.1
Capital Account (Net) 1.5- 5.6
Overall Balance 3.5 7.6
A- Current Account:
Current account represented transactions that pertain to goods,
services, income and current transfers. Current account for the
year 2006 realized a surplus of US$205.7 million. Ratio of this
surplus to GDP at current prices amounted to 1.1%, against 3.8%
last year.
1 At Current Prices 2 Preliminary Data

ــــــــــــــــــــــــــــــــــــــــــــــــــــــــــــــــــــــــــــــــــــــــــــــــــــــــــــــــــــــــــــــــــــــــــــــــــــــChapter Five External Sector 82
1- Goods and Services:
surplus in goods and services balance declined from US$840
million in 2005 to US$84.1million in 2006, attributed to the
decrease in the trade balance and the increase of the deficit in the
services account.
a- Trade Balance:
In 2006, the trade balance recorded a surplus of US$1390.3
million, against a surplus of US$1700.3 million in
2005,attrributed to the increase of imports. Ratio of this surplus
to GDP during 2006 amounted to about 7.3%.
Exports:
Total value of exports increased from US$6413.2 million in 2005
to US$7316.4 million in 2006, i.e an increase of US$903.2
million, or 14% over that of last year. Ratio of exports to GDP, in
2006, amounted to 38.4% .
Crude Oil Exports:
Total value of crude oil exports in 2006amounted to US$6733.4
million, forming 92 % of the total value of exports. Crude oil
exports increased from US$5952.0 million in 2005 to US$6733.4
million in 2006, i.e an increase of US$781.4 million, or 13.1%
over last year, basically attributed to the increase in international
oil prices. On excluding the share of oil companies,
Government’s share of crude oil increased by 28.8% from
US$3114.9 million in 2005 to US$4013.6 million in 2006,

ــــــــــــــــــــــــــــــــــــــــــــــــــــــــــــــــــــــــــــــــــــــــــــــــــــــــــــــــــــــــــــــــــــــــــــــــــــــChapter Five External Sector 83
attributable to the rise in average export prices from
US$51.5/barrel to US$63.0/barrel, in addittion to the increase of
exported quantities from 166 thousand barrels per day to 175
thousand barrels per day.
Imports:
Imports increased by 25.7%, from US$4712.9 million in 2005 to
US$5926.1 million in 2006, to meet consumption and investment
needs.
2- Services (Net):
Deficit in the services balance increased by US$445.9 million, or
51.8% amounting to US$1306.2 million during 2006 against
US$860.3 million during 2005. This is attributed to the increase
of total payments by US$565.2 million from US$1289.8 million
during 2005 to US$1855.0 million during 2006; while total
receipts increased by US$119.3 million from US$429.5 million
during 2005 to US$548.8 million during 2006.
It is worth mentioning that the ratio of total receipts to net
services in 2006 amounted to 42%, while that of payments to net
services amounted to 142 %. The increase in the deficit of
services balance is attributed to the increase of service payments
of freight, insurance and other business.
3- Income (Net):
Deficit in the income balance decreased by 23.5% from
US$1612.5 million during 2005 to US$1234.3 million during

ــــــــــــــــــــــــــــــــــــــــــــــــــــــــــــــــــــــــــــــــــــــــــــــــــــــــــــــــــــــــــــــــــــــــــــــــــــــChapter Five External Sector 84
2006. This is partially attributed to the decrease of total payments
by US$240.2 million from US$1790.7 million during 2005 to
US$1550.0 million during 2006 as a result of the decline of the
earnings of foreign direct investment remitted to abroad.
Moreover,total recepits rose by US$138 million in 2006.
4- Current Transfers (Net):
Net Current transfers balance surplus recorded a decrease of
US$49.7 million from US$1405.7 million in 2005 to US$1356.0
million in 2006. Receipts decreased by US$56.7 million
compared with a decline of US$34.7 million during 2005,and
payments decreased by US$7.1 million during 2006 ,against an
increase of US$ 3.4 million in 2005 .
Government transfers receipt decreased by US$41 million in
2006, against a decline of US$17.5 million in 2005. Receipts
from transfers of other sectors recorded a decrease of US$8.6
million in 2006.
B- Capital and Financial Account:
This account forms the second component of the balance of
payments and represents the Government and private capital
movements, represented by foreign loans drawings, amortization
payments and movements of Government and private
investments. In 2006, this account has recorded a surplus of
US$1059.7 million, against a deficit of US$253.5 million in
2005. Foreign direct investment realized a surplus of US$1121.0

ــــــــــــــــــــــــــــــــــــــــــــــــــــــــــــــــــــــــــــــــــــــــــــــــــــــــــــــــــــــــــــــــــــــــــــــــــــــChapter Five External Sector 85
million in 2006, against a deficit of US$302.1 million in 2005.
This is attribute to the increase of investments of the LNG
project.As for other investments,the deficit amounted to
US$61.3million in 2006, against a surplus of US$48.5 million in
2005. Ratio of the surplus in the capital and financial account to
GDP in 2006 amounted to approximately 5.6% compared with a
deficit of 1.5% of GDP in 2005. As for drawings from foreign
loans, it amounted to US$347.1 in 2006 and its ratio to GDP
amounted to 1.8%, which is slightly higher than the ratio
recorded in 2005. Amortization obligations in 2006 amounted to
US$110.7 million, and its ratio to GDP amounted 0.6%, against
1.3% in 2005.
C- Overall Balance:
Overall balance recorded a surplus of US$1446.5 million in
2006, and represented about 7.6% of GDP, against 3.5% last
year. As a result of the changes that took place in the current
account and capital and financial account, the monetary sector
balances and their transactions were affected. This increase is
reflected by the increase in net foreign assets of the Central Bank
by US$1456.8million during 2006, against US$764.9 million
during 2005. The increase is basically attributed to the rise in
international oil prices, as well as the increase of exported
quantities.
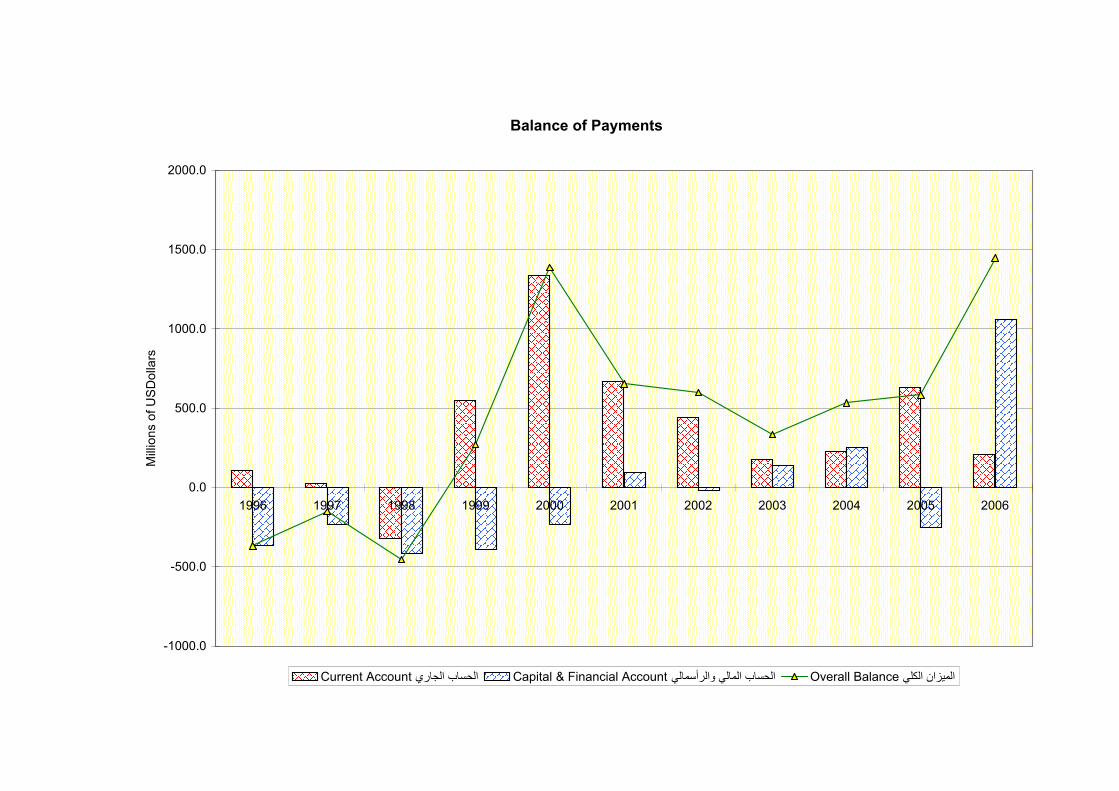
Balance of Payments
-1000.0
-500.0
0.0
500.0
1000.0
1500.0
2000.0
1996 1997 1998 1999 2000 2001 2002 2003 2004 2005 2006
Mill
ions
of U
SD
olla
rs
Current Account الحساب الجاري Capital & Financial Account الحساب المالي والرأسمالي Overall Balance الميزان الكلي
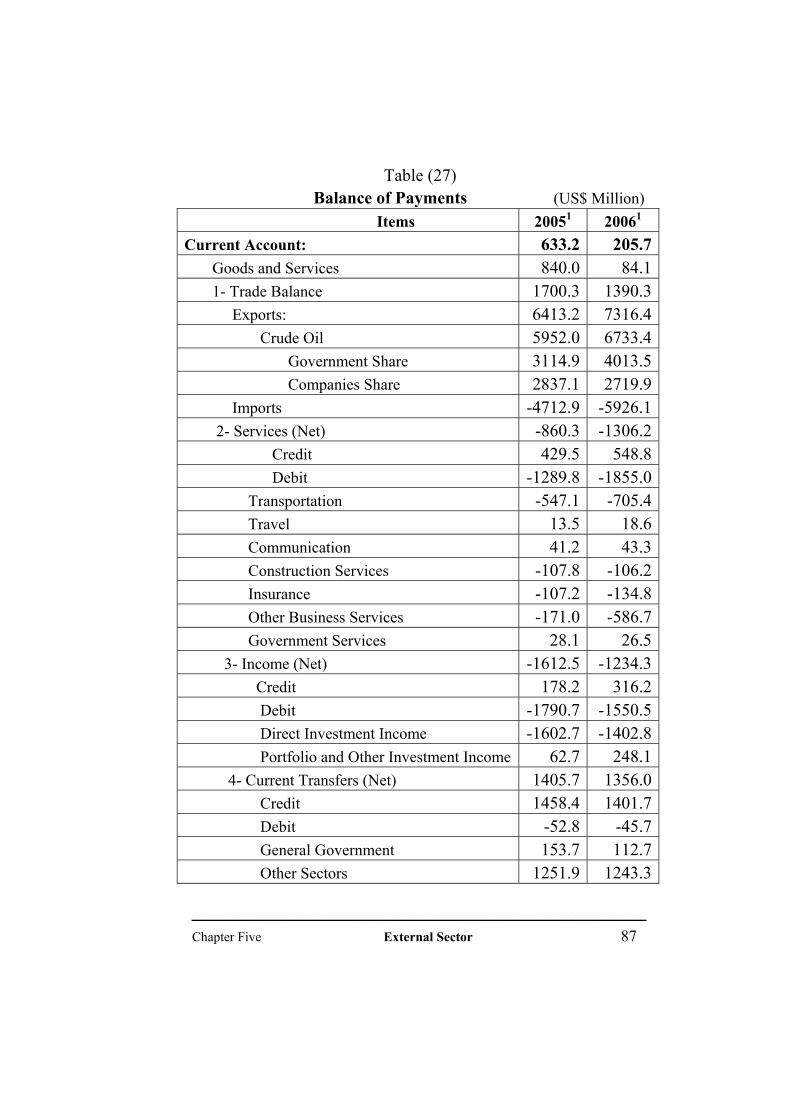
ــــــــــــــــــــــــــــــــــــــــــــــــــــــــــــــــــــــــــــــــــــــــــــــــــــــــــــــــــــــــــــــــــــــــــــــــــــــChapter Five External Sector 87
Table (27) Balance of Payments (US$ Million)
Items 20051 20061 Current Account: 633.2 205.7 Goods and Services 840.0 84.1 1- Trade Balance 1700.3 1390.3 Exports: 6413.2 7316.4 Crude Oil 5952.0 6733.4 Government Share 3114.9 4013.5 Companies Share 2837.1 2719.9 Imports 4712.9- 5926.1- 2- Services (Net) 860.3- 1306.2- Credit 429.5 548.8 Debit 1289.8- 1855.0- Transportation 547.1- 705.4- Travel 13.5 18.6 Communication 41.2 43.3 Construction Services 107.8- 106.2- Insurance 107.2- 134.8- Other Business Services 171.0- 586.7- Government Services 28.1 26.5 3- Income (Net) 1612.5- 1234.3- Credit 178.2 316.2 Debit 1790.7- 1550.5- Direct Investment Income 1602.7- 1402.8- Portfolio and Other Investment Income 62.7 248.1 4- Current Transfers (Net) 1405.7 1356.0 Credit 1458.4 1401.7 Debit 52.8- 45.7- General Government 153.7 112.7 Other Sectors 1251.9 1243.3
ــــــــــــــــــــــــــــــــــــــــــــــــــــــــــــــــــــــــــــــــــــــــــــــــــــــــــــــــــــــــــــــــــــــــــــــــــــــChapter Five External Sector 88
Table (27) (Continued) Balance of Payments
(US$ Million) Items 20051 20061
Capital and Financial Account 253.5- 1059.7 1- Financial Account 253.5- 1059.7 1-1 Direct Investment 302.1- 1121.0 of which : oil companies investment 302.1- 1121.0 Inflows 932.3 2438.1 Outflows 1234.4- 1317.1- 1-2 Other Investment 48.5 61.3- Government Loans (Net) 48.9 236.4 Drawings 271.2 347.1 Amortization Obligation 222.3- 110.7- Trade Credit 109.0- 91.1 Commercial Banks 22.1 475.3- Other Sectors 86.5 86.6 Errors and Omissions 204.7 181.1 Overall Balance 584.4 1446.5 Financing 584.4- 1446.5- a- Net Reserves (Increase -) 764.3- 1456.8- Reserve 713.8- 1402.7- Monetary Authorities Liabilities 50.5- 54.1 International Monetary Fund Loans (Net) 55.9- 59.9- Arab Monetary Fund Loans (Net) 0.0 0.0 Liabilities constituting Reserves of Foreign Monetary Authorities
5.4 5.7
b- Debt Relief and Arrears 179.9 10.3 1 Preliminary

ــــــــــــــــــــــــــــــــــــــــــــــــــــــــــــــــــــــــــــــــــــــــــــــــــــــــــــــــــــــــــــــــــــــــــــــــــــــChapter Five External Sector 89
II – Foreign Trade : Statistics of Foreign Trade between Yemen and the rest of the
world during 2006 showed a positive development despite
regional and international uncertainities. This improvement was
attributed to the policies and measures taken by the government
during this year and the previous years, which enhanced trade
and economic partnership with countries.
A. Trade Balance: Trade balance surplus amounted to YR273078.3 million, i.e. an
increase of YR130128 million during 2006, compared with a
surplus of YR142950.3 million last year. This is attributable to
the increase in exports by higher pace than the imports. Export
proceeds during 2006amounted to YR1316197.7 million
increasing by YR241648.2 million or 22.5% while imports
increase was 12%.
Table (28)
Trade Balance
(In Millions of Rials)
2005 2006
Trade balance 142950.3 273078.3
Exports1 1074549.5 1316197.7
Imports 931599.2 1043119.4 Source: Central Statistical Organization.
1Including Re-Exports
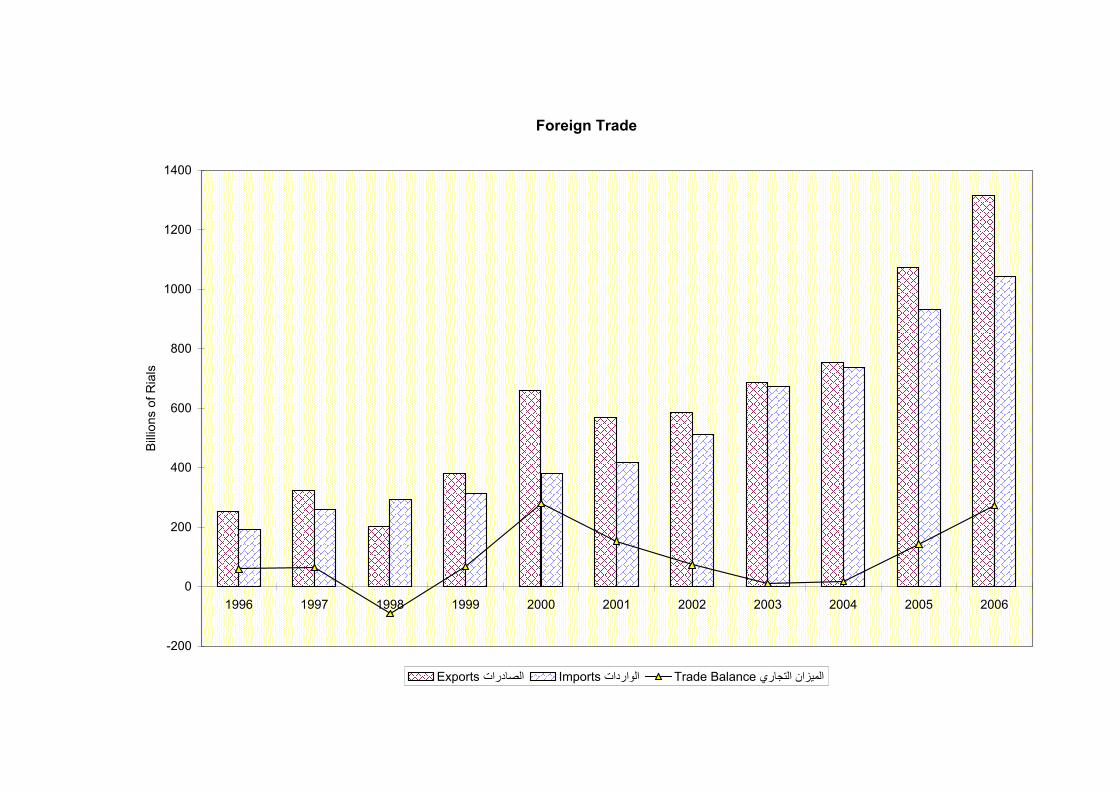
Foreign Trade
-200
0
200
400
600
800
1000
1200
1400
1996 1997 1998 1999 2000 2001 2002 2003 2004 2005 2006
Bill
ions
of R
ials
Exports الصادرات Imports الواردات Trade Balance الميزان التجاري
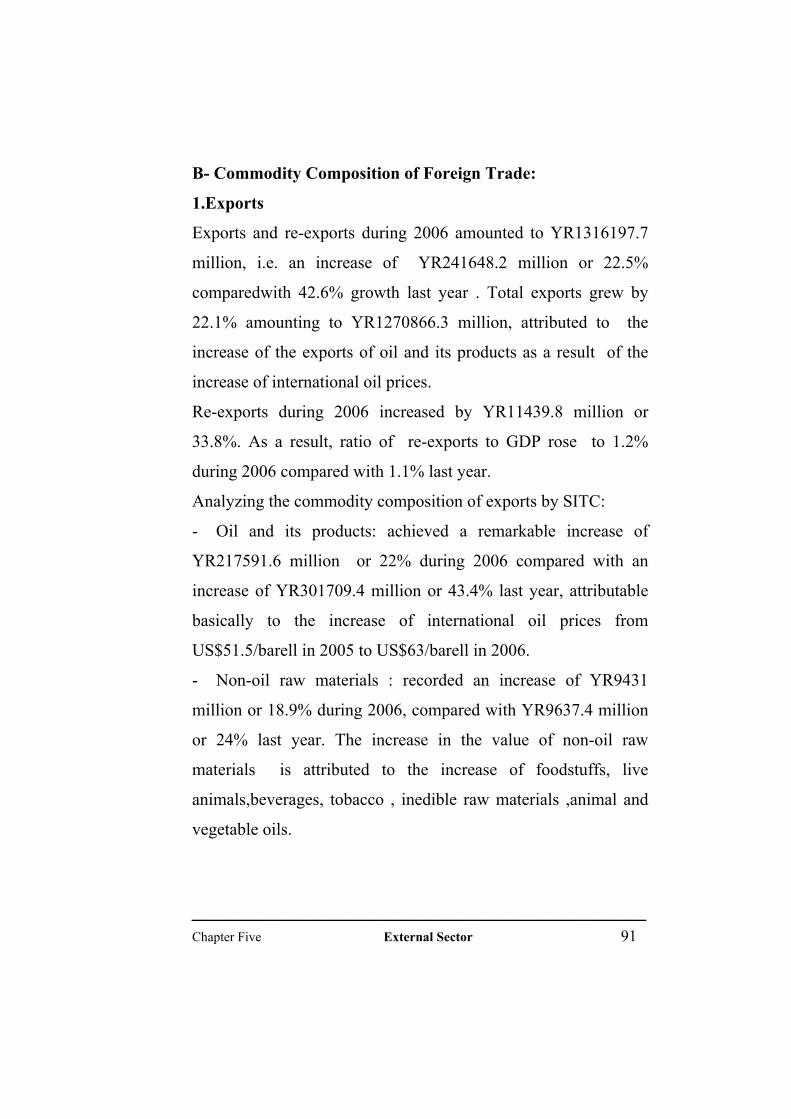
ــــــــــــــــــــــــــــــــــــــــــــــــــــــــــــــــــــــــــــــــــــــــــــــــــــــــــــــــــــــــــــــــــــــــــــــــــــــChapter Five External Sector 91
B- Commodity Composition of Foreign Trade:
1.Exports
Exports and re-exports during 2006 amounted to YR1316197.7
million, i.e. an increase of YR241648.2 million or 22.5%
comparedwith 42.6% growth last year . Total exports grew by
22.1% amounting to YR1270866.3 million, attributed to the
increase of the exports of oil and its products as a result of the
increase of international oil prices.
Re-exports during 2006 increased by YR11439.8 million or
33.8%. As a result, ratio of re-exports to GDP rose to 1.2%
during 2006 compared with 1.1% last year.
Analyzing the commodity composition of exports by SITC:
- Oil and its products: achieved a remarkable increase of
YR217591.6 million or 22% during 2006 compared with an
increase of YR301709.4 million or 43.4% last year, attributable
basically to the increase of international oil prices from
US$51.5/barell in 2005 to US$63/barell in 2006.
- Non-oil raw materials : recorded an increase of YR9431
million or 18.9% during 2006, compared with YR9637.4 million
or 24% last year. The increase in the value of non-oil raw
materials is attributed to the increase of foodstuffs, live
animals,beverages, tobacco , inedible raw materials ,animal and
vegetable oils.

ــــــــــــــــــــــــــــــــــــــــــــــــــــــــــــــــــــــــــــــــــــــــــــــــــــــــــــــــــــــــــــــــــــــــــــــــــــــChapter Five External Sector 92
- Manufactured goods: recorded an increase of YR14625.7 million or 41.8% during 2006, compared with an increase of YR9606.8 million or 37.9% last year. The increase is attributed to the increase of machinery and transport equipment,classified manufactures,and unclassified commodities during 2006.
Table(29) Exports by SITC group1
(In Millions of Rials) 2005 % 2006 % Food & Live Animals 41795.3 3.89 48194.7 3.66Beverages and Tobacco 4555.3 0.42 5645.9 0.43Raw Materials inedible 2461.2 0.23 3882.1 0.29Mineral Fuel and Lub. Oil 989805.2 92.11 1207396.7 91.73Animals & Vegetables Oil 970.0 0.09 1490.1 0.11Chemicals 2942.4 0.27 3685.0 0.28Manufactures Classified by Materials 2002.3 0.19 4494.2 0.34Machinery & Transport Equipment 21119.3 1.97 31559.7 2.40Miscellaneous Man. 2479.7 0.23 2556.3 0.19Commodities not classified elsewhere 6418.8 0.60 7293.0 0.55Total 1074549.5 100 1316197.7 100Remarks: Non-oil raw materials 49781.8 4.63 59212.8 4.50Manufactured goods 34962.5 3.25 49588.2 3.77
Source: Central Stratistical Organization. 1Including Re-exports.

ــــــــــــــــــــــــــــــــــــــــــــــــــــــــــــــــــــــــــــــــــــــــــــــــــــــــــــــــــــــــــــــــــــــــــــــــــــــChapter Five External Sector 93
1.Imports:
Imports during 2006 increased by YR111520.2 million or 12%,
compared with an increase of YR195066.1 million or 26.5%
during 2005.
Analyzing the commodity composition of imports by SITC:
- Oil and its products: recorded an increase of YR59561.3
million, compared with an increase of YR109781.5 million last
year.
- Non-oil raw materials: recorded a decrease of YR8493.6
million or 3.5% during 2006, compared with an increase of
YR15995.8 million or 7.1% during 2005. This decrease is
attributed to the decrease of foodstuffs and live animals imports.
- Manufactured goods: achieved an increase of
YR60452.5million or 12.3% during 2006, compared with an
increase of YR69288.6 million or 16.4% last year. This increase
is attributed to the increase of chemicals and its products from
YR 55029.5 million to YR 62055.5 million,and manufactures
classified by materials from YR141442.2 million to YR168760.1
million, and machinery and transport equipment from
YR2218854.6 million to YR258015.5 millioin.
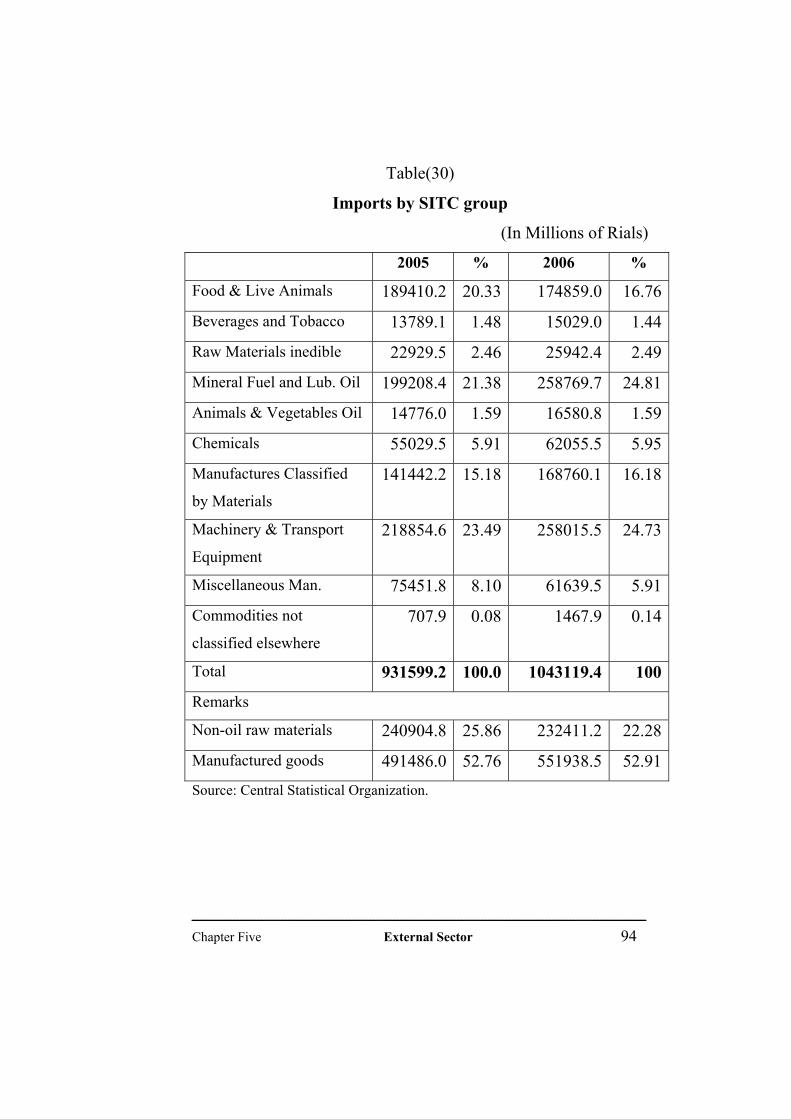
ــــــــــــــــــــــــــــــــــــــــــــــــــــــــــــــــــــــــــــــــــــــــــــــــــــــــــــــــــــــــــــــــــــــــــــــــــــــChapter Five External Sector 94
Table(30)
Imports by SITC group
(In Millions of Rials)
2005 % 2006 %
Food & Live Animals 189410.2 20.33 174859.0 16.76
Beverages and Tobacco 13789.1 1.48 15029.0 1.44
Raw Materials inedible 22929.5 2.46 25942.4 2.49
Mineral Fuel and Lub. Oil 199208.4 21.38 258769.7 24.81
Animals & Vegetables Oil 14776.0 1.59 16580.8 1.59
Chemicals 55029.5 5.91 62055.5 5.95
Manufactures Classified
by Materials
141442.2 15.18 168760.1 16.18
Machinery & Transport
Equipment
218854.6 23.49 258015.5 24.73
Miscellaneous Man. 75451.8 8.10 61639.5 5.91
Commodities not
classified elsewhere
707.9 0.08 1467.9 0.14
Total 931599.2 100.0 1043119.4 100
Remarks
Non-oil raw materials 240904.8 25.86 232411.2 22.28
Manufactured goods 491486.0 52.76 551938.5 52.91Source: Central Statistical Organization.
ــــــــــــــــــــــــــــــــــــــــــــــــــــــــــــــــــــــــــــــــــــــــــــــــــــــــــــــــــــــــــــــــــــــــــــــــــــــChapter Five External Sector 95
C- Foreign Trade by Economic Blocks:
1- Exports:
The main development in the geographical distrribution of
exports is the decrease of the relative share of the Non-Arab
Asian Countries to 69.4% during 2006 , against 77.4% during
2005, despite the increase of exports value from YR831297.5
million to YR913672.6 million, i.e. an increase of YR82375.1
million or 9.9%. Next came Arab Countries with a relative share
increase to 11.8% during 2006, against 10.3% during 2005,
attributed to the increase of export value from YR110637.7
million to YR154775.0 million, i.e. an increase of YR44137.4
million or 39.9%. Exports to European Union Countries
increased from YR9843.3 million to YR95192.5 million, i.e. an
increase of YR85349.2 million. As a result, its relative share
increased from 0.92% to 7.2%. Exports to American Countries
amounted to YR74948.5 million compared with YR35028.0
million last year, an increase of YR39920.0 million with relative
share 5.7%. The relative share of other European Countries
decreased from 5.5% during2005 to 3.6 % during 2006 , as a
result of the decrease of export value by YR11902.8 million or
20.2 % from YR55828.9 million during 2005 to YR46926.1
million this year.

ــــــــــــــــــــــــــــــــــــــــــــــــــــــــــــــــــــــــــــــــــــــــــــــــــــــــــــــــــــــــــــــــــــــــــــــــــــــChapter Five External Sector 96
Table (31)
Exports1 by Economic Blocks
(In Millions of Rials)
2005 % 2006 %
Arab Countries 110637.7 10.30 154775.0 11.76
GCC 90443.4 8.42 133706.4 10.16
Other Arab Countries 20194.2 1.88 21068.6 1.60
Non-Arab Asian Countries 831297.5 77.36 913672.6 69.42
Non-Arab African Countries 3079.7 0.29 12121.5 0.92
EC 9843.3 0.92 95192.5 7.23
Other European Countries 58828.9 5.47 46926.1 3.57
East European Countries 426.1 0.04 89.9 0.01
American Countries 35028.0 3.26 74948.5 5.69
Australia and Pacific 19152.2 1.78 12931.7 0.98
Unspecified 1037.4 0.10 442.4 0.03
Others 5218.6 0.49 5097.5 0.39
Total 1074549.5 100.0 1316197.7 100.0
Source: Central Statistical Organization. 1Including Re-exports.

ــــــــــــــــــــــــــــــــــــــــــــــــــــــــــــــــــــــــــــــــــــــــــــــــــــــــــــــــــــــــــــــــــــــــــــــــــــــChapter Five External Sector 97
2. Imports:
The main development in the geographical distribution of imports
is the increase of imports from Arab Countries amounting to
YR462634.7 million during 2006., compared with YR378384.9
million during 2005, , i.e. an increase of YR84249.8 million or
22.3% mostly imported from from GCC countries. Next came
Non-Arab Asian Countries with imports value of YR242996.2
million during 2006 compared with YR190792.0 million during
2005, an increase of YR52204.2 million or 27.4%. Imports from
EC countries amounted to YR125427.5 million compared with
YR138504.9 million, a decrease of YR13077.4 million or 9.4%.
Imports from other Eurropean Countries amounted to YR96082.2
million compared with YR79280.2 million, an increase of
YR16802 million or 21.2%. Its relative share also increased from
8.5% during 2005 to 9.2% during 2006. The relative share of
American Countries declined from 9.8% during 2005 to 6.6%
during 2006 attributed to the decline of imports from to
YR91508.3 million to YR68845.1 million, a decrease of
YR22663.2 million or 24.8%
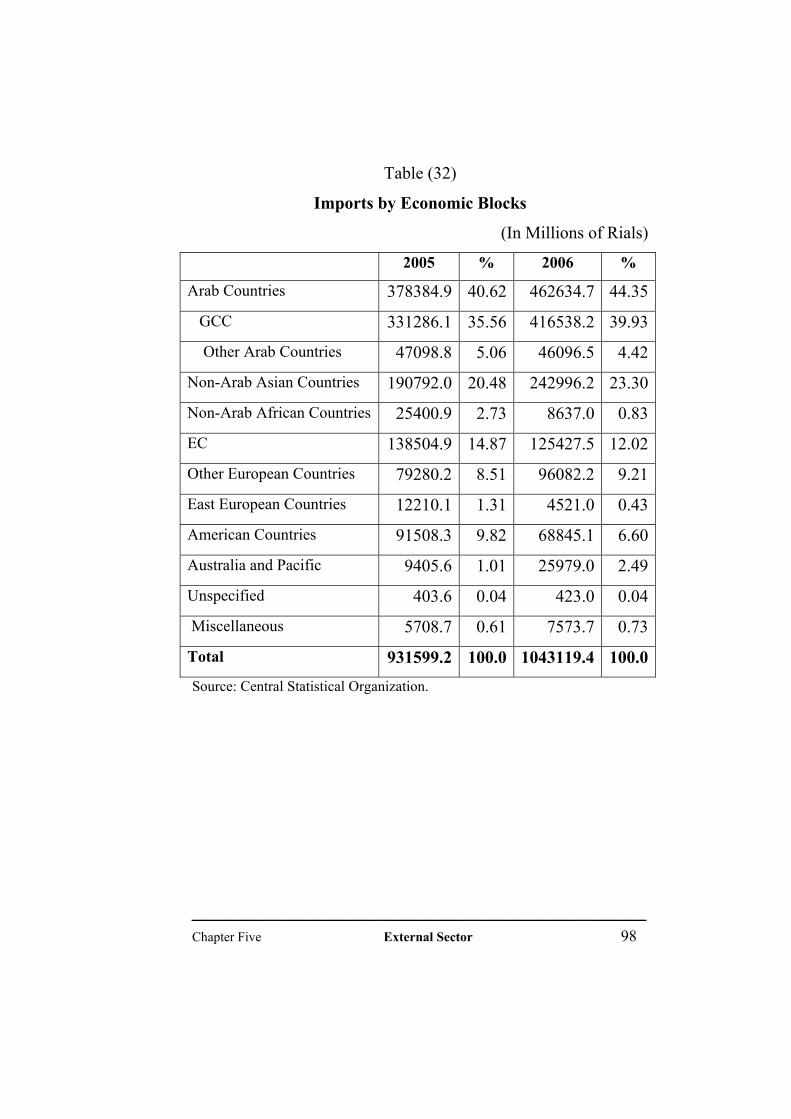
ــــــــــــــــــــــــــــــــــــــــــــــــــــــــــــــــــــــــــــــــــــــــــــــــــــــــــــــــــــــــــــــــــــــــــــــــــــــChapter Five External Sector 98
Table (32)
Imports by Economic Blocks
(In Millions of Rials)
2005 % 2006 %
Arab Countries 378384.9 40.62 462634.7 44.35
GCC 331286.1 35.56 416538.2 39.93
Other Arab Countries 47098.8 5.06 46096.5 4.42
Non-Arab Asian Countries 190792.0 20.48 242996.2 23.30
Non-Arab African Countries 25400.9 2.73 8637.0 0.83
EC 138504.9 14.87 125427.5 12.02
Other European Countries 79280.2 8.51 96082.2 9.21
East European Countries 12210.1 1.31 4521.0 0.43
American Countries 91508.3 9.82 68845.1 6.60
Australia and Pacific 9405.6 1.01 25979.0 2.49
Unspecified 403.6 0.04 423.0 0.04
Miscellaneous 5708.7 0.61 7573.7 0.73
Total 931599.2 100.0 1043119.4 100.0 Source: Central Statistical Organization.

ــــــــــــــــــــــــــــــــــــــــــــــــــــــــــــــــــــــــــــــــــــــــــــــــــــــــــــــــــــــــــــــــــــــــــــــــــــــChapter Five External Sector 99
D- Foreign Trade by Countries:
1-Exports:
The increase of Exports specially Oil exports during 2006, has a
positive effect on the volume trade with some of Yemen’s trade
partners. Exports to India increased from YR174394.9 million to
YR315245.9 million during 2006, an increase of YR 140851.0
million or 80.8% . Its relative share increased from 16.2% during
2005 to 23.9% during 2006 ranking India in the first position of
importers from Yemen.
Year 2006 also witnessed a decline of exports to China from
YR378976.3 million to YR296618.5 million, a decrease of
YR82357.8 million or 21.7%., ranking China in the second
position among importers from Yemen.
Exports to Thailand rose to YR190130.0 million during 2006
compared with YR127603.2 million last year, an increase of
YR62526.8 million or 49%. As a result its relative share
increased from 11.9% to 14.4%.
Exports to U. K. increased by YR76365.1 million from
YR1143.0 million last year toYR77508 million during 2006. As
a result its relative share increased from 0.11% to 5.49%.
Exports to U. S. A increased from YR34934.0 million during
2005 to YR74856.4 million, an increase of YR39922.4 . Its
relative share rose from 3.2% to 5.7% . Exports to U. A. E
increased from YR40768.6 million to YR69512.3 million this

ــــــــــــــــــــــــــــــــــــــــــــــــــــــــــــــــــــــــــــــــــــــــــــــــــــــــــــــــــــــــــــــــــــــــــــــــــــــChapter Five External Sector 100
year, hence, Its relative share increased from 3.8% to 5.3% The
relative share of Switzerland declined from 5.5% to 3.6%, as a
result of the decrease of exports from YR58826.2 million to
YR46910.9 million , a decrease of YR 11915.3 million.
Table (33) Top Ten Importers1
(In Millions of Rials) Country 2005 % 2006 %
India 174394.9 16.23 315245.9 23.95 China 378976.3 35.27 296618.5 22.54 Thailand 127603.2 11.88 190130.0 14.45 United Kingdom 1143.0 0.11 77508.1 5.89 U.S.A. 34934.0 3.25 74856.4 5.69 U.A.E 40768.6 3.79 69512.3 5.28 Switzerland 58826.2 5.47 46910.9 3.56 North Korea 0.0 0.00 42555.3 3.23 South Korea 67532.9 6.28 33867.8 2.57 Kuwait 22431.3 2.09 31557.5 2.40 Others 167939.1 15.63 137435.0 10.44 Total 1074549.5 100.0 1316197.7 100.0 Source : Central Statistical Organization. 1Including Re-exports.
2 - Imports:
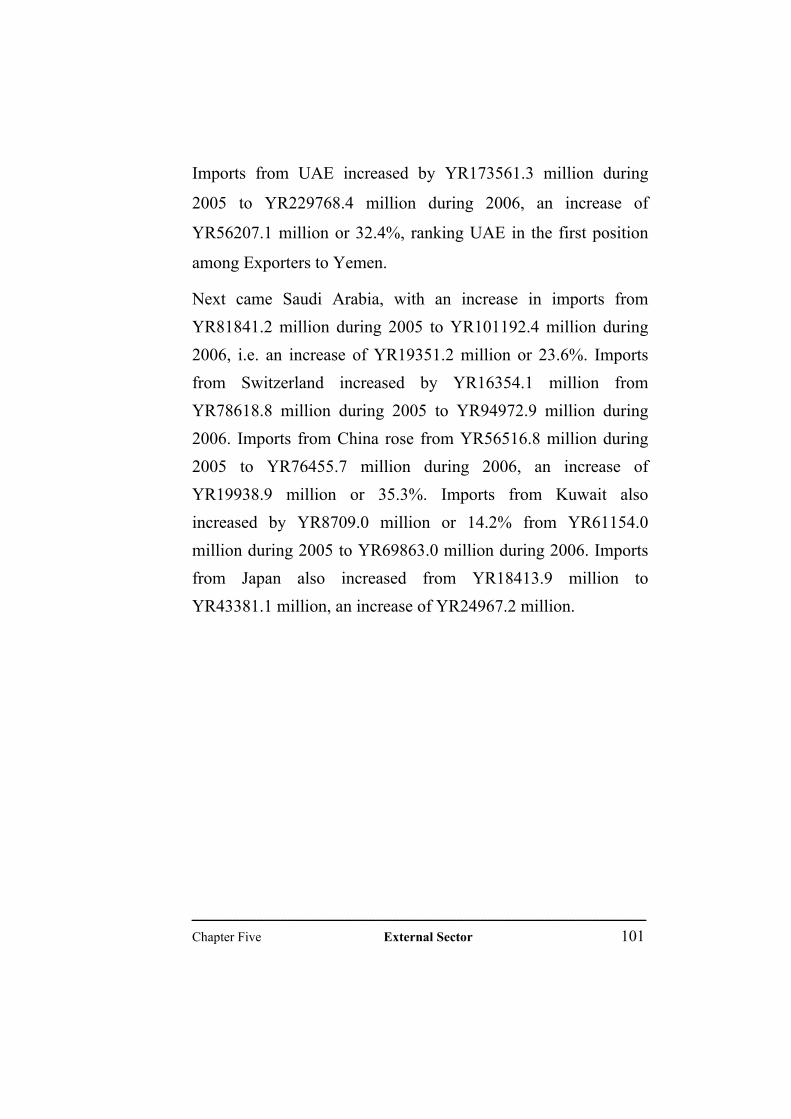
ــــــــــــــــــــــــــــــــــــــــــــــــــــــــــــــــــــــــــــــــــــــــــــــــــــــــــــــــــــــــــــــــــــــــــــــــــــــChapter Five External Sector 101
Imports from UAE increased by YR173561.3 million during
2005 to YR229768.4 million during 2006, an increase of
YR56207.1 million or 32.4%, ranking UAE in the first position
among Exporters to Yemen.
Next came Saudi Arabia, with an increase in imports from YR81841.2 million during 2005 to YR101192.4 million during 2006, i.e. an increase of YR19351.2 million or 23.6%. Imports from Switzerland increased by YR16354.1 million from YR78618.8 million during 2005 to YR94972.9 million during 2006. Imports from China rose from YR56516.8 million during 2005 to YR76455.7 million during 2006, an increase of YR19938.9 million or 35.3%. Imports from Kuwait also increased by YR8709.0 million or 14.2% from YR61154.0 million during 2005 to YR69863.0 million during 2006. Imports from Japan also increased from YR18413.9 million to YR43381.1 million, an increase of YR24967.2 million.

ــــــــــــــــــــــــــــــــــــــــــــــــــــــــــــــــــــــــــــــــــــــــــــــــــــــــــــــــــــــــــــــــــــــــــــــــــــــChapter Five External Sector 102
Table (34) Top Ten Exporters (In Millions of Rials)
Country 2005 % 2006 % U.A.E. 173561.3 18.63 229768.4 22.03 Saudi Arabia 81841.2 8.79 101192.4 9.70 Switzerland 78618.8 8.44 94972.9 9.10 China 56516.8 6.07 76455.7 7.33 Kuwait 61154.0 6.56 69863.0 6.70 Japan 18413.9 1.98 43381.1 4.16 India 26101.3 2.80 33234.7 3.19 Brazil 28729.7 3.08 27603.8 2.65 Germany 26313.9 2.82 26866.7 2.58 United Kingdom 25642.8 2.75 26066.8 2.50 Others 354705.6 38.07 313714.1 30.07 Total 931599.2 100.0 1043119.4 100.0 Source : Central Statistical Organization.

Item/Year 1999 2000 2001 2002 2003 2004 2005 2006
Money 207196.5 247248.4 282683.4 306449.5 347465.4 390541.2 442463.6 558460.7
Currency in circulation outside banks 166923.7 197122.5 212794.8 239329.3 268812.5 297938.8 330619.5 412519.6
Demand Deposits 40272.8 50125.9 69888.6 67120.2 78652.9 92602.4 111844.1 145941.1
Quasi Money 172097.7 227276.7 280366.1 358214.9 449906.4 526734.1 607045.2 792969.1
Time Deposits 30563.9 41781.5 50319.9 78491.5 106947.2 148234.4 151588.6 191255.5
Saving Deposits 25681.2 34651.8 40952.1 51581.5 59572.5 72775.3 78634.0 92611.2
Foreign currency deposits 111667.6 146151.1 184030.3 219108.4 270477.7 287229.8 355514.0 454208.5
Earmarked deposits 4185.0 4692.3 5063.8 9033.5 12909 18494.6 21308.6 54893.9
Money Supply 379294.2 474525.1 563049.5 664664.4 797371.8 917275.3 1049508.8 1351429.8
Factors affecting in money supply
Foreign Assets (Net) 200028.6 487313.3 652083.1 838249.3 971494.3 1117602.5 1271389.6 1675068.1
Claims on Government (Net) 167808.7 -4534.0 -51483.2 -119448.3 -45626.8 -64839.3 -92715.4 -151173.5
Claims on Private sector. 63969.5 76220.9 95991.5 110014.6 138855.9 185553.8 225826.5 269181.5
Other (Net) -52512.7 -84475.1 -133541.9 -164150.7 -267351.6 -321041.7 -354991.9 -441646.3
Ratio of Currency outside Banks to
Money Supply 33.7% 32.5% 31.5% 30.5%
Appendix (1)Money Supply
(YR million)
41.5%44.0% 36.0%37.8%
115

Item/Year 1999 2000 2001 2002 2003 2004 2005 2006
Changes in Money 27269.3 40051.9 35435.0 23766.1 41015.9 43075.8 51922.4 115997.1
Currency outside banks 27255.3 30198.8 15672.3 26534.5 29483.2 29126.3 32680.7 81900.1
Demand deposits 14.0 9853.1 19762.7 -2768.4 11532.7 13949.5 19241.7 34097.0
Changes in Quasi Money 18675.0 55179.0 53089.4 77848.8 91691.5 76827.7 80311.1 185923.9
Time deposits -2477.2 11217.6 8538.4 28171.6 28455.7 41287.2 3354.2 39666.9
Saving deposits 4975.9 8970.6 6300.3 10629.4 7991.0 13202.8 5858.7 13977.2
Foreign currency deposits 15675.5 34483.5 37879.2 35078.1 51369.3 16752.1 68284.2 98694.5
Earmarked deposits 500.8 507.3 371.5 3969.7 3875.5 5585.6 2814.0 33585.3
Changes in Money Supply 45944.3 95230.9 88524.4 101614.9 132707.4 119903.5 132233.5 301921.0
Changes in factors affecting in money supply
Foreign Assets (Net) 87496.3 287284.7 164769.8 186166.2 133245.0 146108.2 153787.1 403678.5
Claims on Government (Net) -46936.7 -172342.7 -46949.2 -67965.1 73821.5 -19212.5 -27876.1 -58458.1
Claims on Private Sector. 8339.7 12251.4 19770.6 14023.1 28841.3 46697.9 40272.7 43355.0
Others (Net) -2955.7 -31962.4 -49066.8 -30608.8 -103200.9 -53690.1 -33950.2 -86654.4
Changes in Money Supply and Factors affecting itAppendix (2)
(YR million)
116
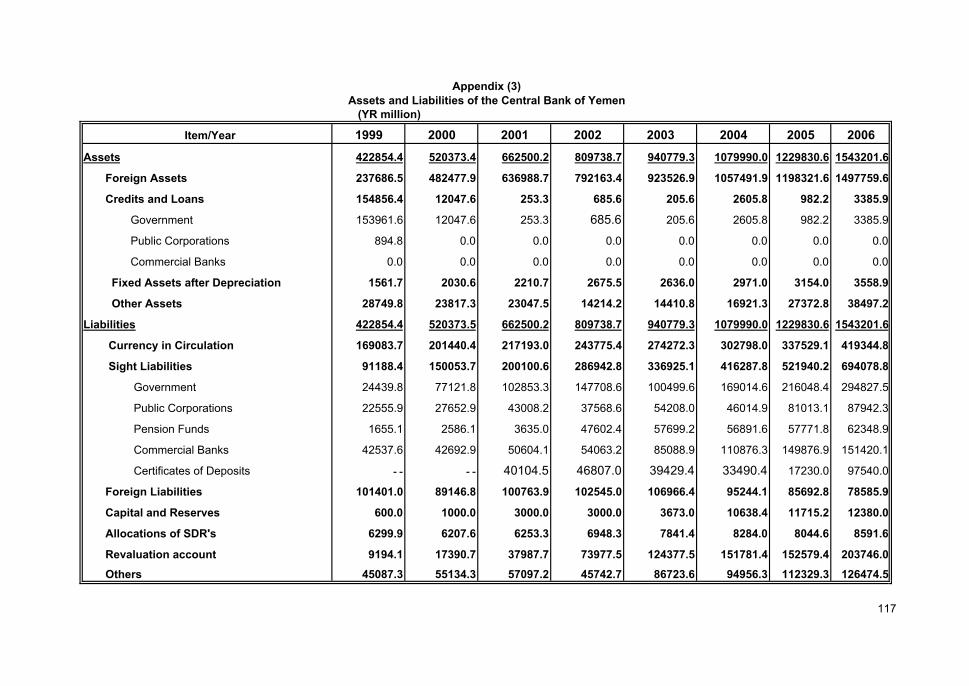
Item/Year 1999 2000 2001 2002 2003 2004 2005 2006
Assets 422854.4 520373.4 662500.2 809738.7 940779.3 1079990.0 1229830.6 1543201.6
Foreign Assets 237686.5 482477.9 636988.7 792163.4 923526.9 1057491.9 1198321.6 1497759.6
Credits and Loans 154856.4 12047.6 253.3 685.6 205.6 2605.8 982.2 3385.9
Government 153961.6 12047.6 253.3 685.6 205.6 2605.8 982.2 3385.9
Public Corporations 894.8 0.0 0.0 0.0 0.0 0.0 0.0 0.0
Commercial Banks 0.0 0.0 0.0 0.0 0.0 0.0 0.0 0.0
Fixed Assets after Depreciation 1561.7 2030.6 2210.7 2675.5 2636.0 2971.0 3154.0 3558.9
Other Assets 28749.8 23817.3 23047.5 14214.2 14410.8 16921.3 27372.8 38497.2
Liabilities 422854.4 520373.5 662500.2 809738.7 940779.3 1079990.0 1229830.6 1543201.6
Currency in Circulation 169083.7 201440.4 217193.0 243775.4 274272.3 302798.0 337529.1 419344.8
Sight Liabilities 91188.4 150053.7 200100.6 286942.8 336925.1 416287.8 521940.2 694078.8
Government 24439.8 77121.8 102853.3 147708.6 100499.6 169014.6 216048.4 294827.5
Public Corporations 22555.9 27652.9 43008.2 37568.6 54208.0 46014.9 81013.1 87942.3
Pension Funds 1655.1 2586.1 3635.0 47602.4 57699.2 56891.6 57771.8 62348.9
Commercial Banks 42537.6 42692.9 50604.1 54063.2 85088.9 110876.3 149876.9 151420.1
Certificates of Deposits ـ ـ ـ ـ 40104.5 46807.0 39429.4 33490.4 17230.0 97540.0
Foreign Liabilities 101401.0 89146.8 100763.9 102545.0 106966.4 95244.1 85692.8 78585.9
Capital and Reserves 600.0 1000.0 3000.0 3000.0 3673.0 10638.4 11715.2 12380.0
Allocations of SDR's 6299.9 6207.6 6253.3 6948.3 7841.4 8284.0 8044.6 8591.6
Revaluation account 9194.1 17390.7 37987.7 73977.5 124377.5 151781.4 152579.4 203746.0
Others 45087.3 55134.3 57097.2 45742.7 86723.6 94956.3 112329.3 126474.5
(YR million)
Appendix (3)Assets and Liabilities of the Central Bank of Yemen
117
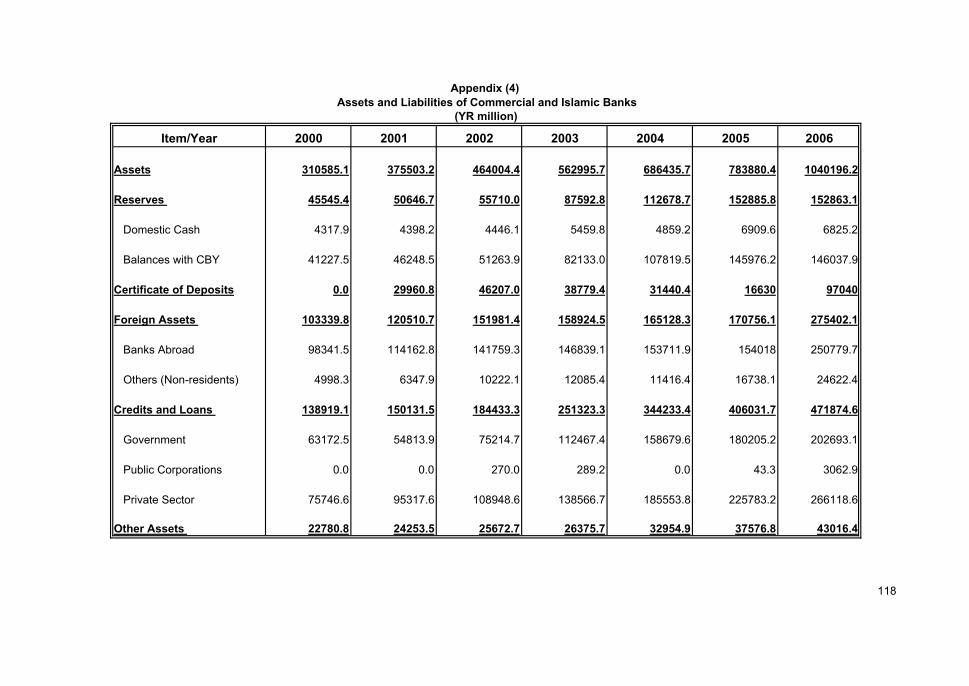
Item/Year 2000 2001 2002 2003 2004 2005 2006
Assets 310585.1 375503.2 464004.4 562995.7 686435.7 783880.4 1040196.2
Reserves 45545.4 50646.7 55710.0 87592.8 112678.7 152885.8 152863.1
Domestic Cash 4317.9 4398.2 4446.1 5459.8 4859.2 6909.6 6825.2
Balances with CBY 41227.5 46248.5 51263.9 82133.0 107819.5 145976.2 146037.9
Certificate of Deposits 0.0 29960.8 46207.0 38779.4 31440.4 16630 97040
Foreign Assets 103339.8 120510.7 151981.4 158924.5 165128.3 170756.1 275402.1
Banks Abroad 98341.5 114162.8 141759.3 146839.1 153711.9 154018 250779.7
Others (Non-residents) 4998.3 6347.9 10222.1 12085.4 11416.4 16738.1 24622.4
Credits and Loans 138919.1 150131.5 184433.3 251323.3 344233.4 406031.7 471874.6
Government 63172.5 54813.9 75214.7 112467.4 158679.6 180205.2 202693.1
Public Corporations 0.0 0.0 270.0 289.2 0.0 43.3 3062.9
Private Sector 75746.6 95317.6 108948.6 138566.7 185553.8 225783.2 266118.6
Other Assets 22780.8 24253.5 25672.7 26375.7 32954.9 37576.8 43016.4
Appendix (4) Assets and Liabilities of Commercial and Islamic Banks
(YR million)
118

Item/Year 2000 2001 2002 2003 2004 2005 2006
Liabilities 310584.8 375503.2 464004.4 562995.7 686435.7 783880.4 1040196.2
Deposits 249795.6 307308.6 387804.6 474452.3 573540.1 637958.8 851044
Government 46.2 62.1 38.1 101.0 218.5 82.6 76.1
Demand 41004.1 48991.9 49818.6 56346.5 69627.5 69367.7 99625.1
Time 41781.5 50319.9 78491.5 106947.2 148234.4 151588.6 191255.5
Savings 34651.5 40952.1 51581.5 59572.5 72775.3 78634 92611.2
In Foeign Currency 127620.0 161918.8 198841.4 238576.1 264189.8 316977.3 412582.2
Earmarked 4692.3 5063.8 9033.5 12909.0 18494.6 21308.6 54893.9
Foreign Liabilities 9357.6 4652.4 3350.5 3990.7 9773.6 11995.3 19507.7
Banks Abroad 8506.0 3861.3 1908.3 2567.6 6974.7 9980.8 16718.6
Non-residents 851.6 791.1 1442.2 1423.1 2798.9 2014.5 2789.1
Loans from CBY 0.0 0.0 0.0 0.0 0.0 287.8 2.1
Capital and Reserves 19454.4 23851.8 27721.0 31010.5 37250.5 48924.3 71209.7
Other Liabilities 31977.2 39690.4 45128.3 53542.2 65871.5 84714.2 98432.7
Appendix (4) (Continued)Assets and Liabilities of Commercial and Islamic Banks
(YR million)
119
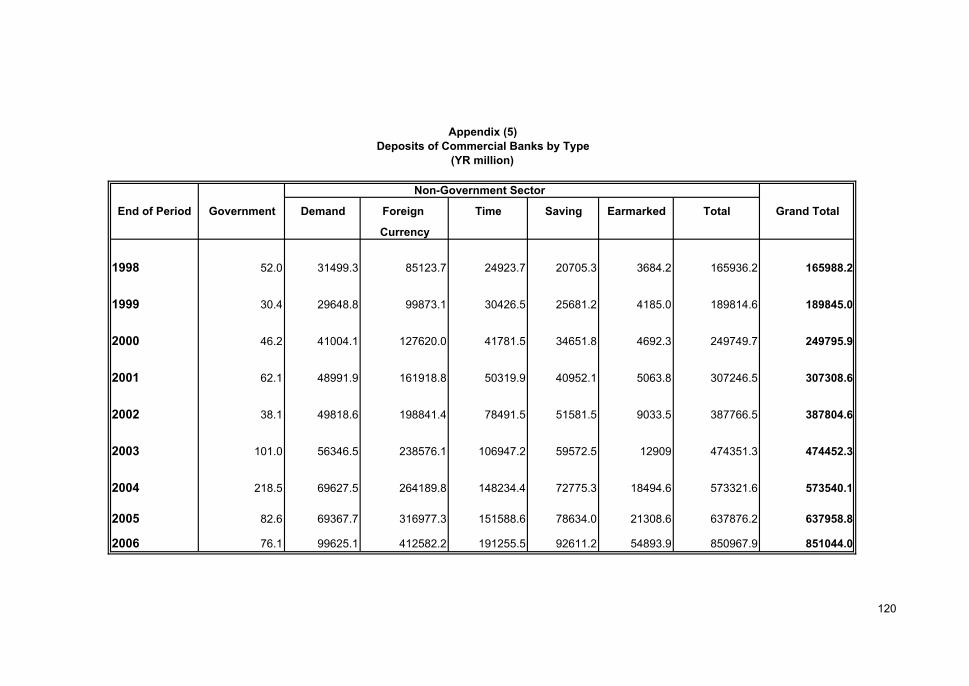
Demand Foreign Time Saving Earmarked Total Grand Total
Currency
1998 52.0 31499.3 85123.7 24923.7 20705.3 3684.2 165936.2 165988.2
1999 30.4 29648.8 99873.1 30426.5 25681.2 4185.0 189814.6 189845.0
2000 46.2 41004.1 127620.0 41781.5 34651.8 4692.3 249749.7 249795.9
2001 62.1 48991.9 161918.8 50319.9 40952.1 5063.8 307246.5 307308.6
2002 38.1 49818.6 198841.4 78491.5 51581.5 9033.5 387766.5 387804.6
2003 101.0 56346.5 238576.1 106947.2 59572.5 12909 474351.3 474452.3
2004 218.5 69627.5 264189.8 148234.4 72775.3 18494.6 573321.6 573540.1
2005 82.6 69367.7 316977.3 151588.6 78634.0 21308.6 637876.2 637958.8
2006 76.1 99625.1 412582.2 191255.5 92611.2 54893.9 850967.9 851044.0
End of Period Government
Appendix (5)
(YR million)Deposits of Commercial Banks by Type
Non-Government Sector
120

End of Period Interest on Loans 3 6 9 12 Savings
Months Months Months Months
1997 15-21 11 11 11 11 11
1998 14-20 15 15 15 15 15
1999 22-28 18 18 18 18 18
2000 15-20 13 13 13 13 13
2001 15-20 13 13 13 13 13
2002 15-20 13 13 13 13 13
2003 15-21 13 13 13 13 13
2004 15-21 13 13 13 13 13
2005 15-21 13 13 13 13 13
2006 15-21 13 13 13 13 13* Minimum deposit interest rates
Interest on Deposits*
Appendix (6)Interest Rates of Commercial Banks
(Percent per annum)
121

Amount % Amount % Amount % Amount % Amount % Amount % Amount % Amount % Amount % Amount %
1997 124 ـ 237 ـ 1111 1 3602 3 31055 24 64204 50 18650 14 10552 8 0 ـ 19 ـ 129556
1998 122 ـ 250 ـ 684 1 2116 1 16285 11 46403 33 36601 25 28691 20 11120 7 19 ـ 142292
1999 123 ـ 247 ـ 649 ـ 1556 1 12842 8 48589 29 40819 24 30469 18 33770 20 19 ـ 169083
2000 123 ـ 289 ـ 679 ـ 1156 1 11492 6 50540 25 43235 21 31439 16 62469 31 19 ـ 201441
2001 123 ـ 327 ـ 807 ـ 1083 ـ 9840 5 49760 23 42287 20 39113 18 72237 34 19 ـ 215596
2002 122 _ 376 ـ 829 ـ 1047 ـ 9155 4 53354 22 40919 17 58802 24 79151 33 19 ـ 243774
2003 124 _ 390 920 ـ 994 ـ 9727 4 53271 19 41618 15 75255 27 91954 34 19 ـ 274272
2004 124 _ 425 ـ 1081 ـ 902 ـ 10134 3 49159 17 39990 13 87782 30 113181 37 19 ـ 302798
2005 127 _ 457 ـ 1165 ـ 908 ـ 6404 2 31083 9 36793 11 100209 30 160359 48 19 ـ 337524
2006 127 _ 474 ـ 1250 ـ 965 ـ 4570 1 21591 5 32897 102518 24 254934 61 19 ـ 419345
YR200
Year
YR1 YR5 YR10
Appendix (7) Currency Issued by Denominations
(YR million)
YR500 YR1000
Total
CoinsYR20 YR50 YR100
122
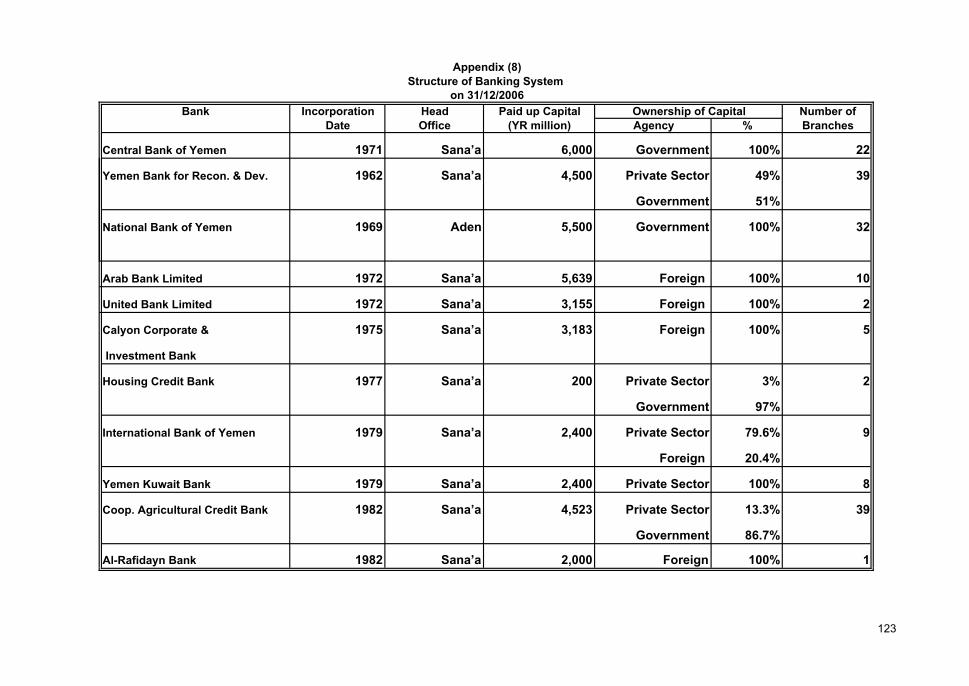
Bank Incorporation Head Paid up Capital Number ofDate Office (YR million) Agency % Branches
Central Bank of Yemen 1971 Sana’a 6,000 Government 100% 22
Yemen Bank for Recon. & Dev. 1962 Sana’a 4,500 Private Sector 49% 39
Government 51%
National Bank of Yemen 1969 Aden 5,500 Government 100% 32
Arab Bank Limited 1972 Sana’a 5,639 Foreign 100% 10
United Bank Limited 1972 Sana’a 3,155 Foreign 100% 2
Calyon Corporate & 1975 Sana’a 3,183 Foreign 100% 5
Investment Bank
Housing Credit Bank 1977 Sana’a 200 Private Sector 3% 2
Government 97%
International Bank of Yemen 1979 Sana’a 2,400 Private Sector 79.6% 9
Foreign 20.4%
Yemen Kuwait Bank 1979 Sana’a 2,400 Private Sector 100% 8
Coop. Agricultural Credit Bank 1982 Sana’a 4,523 Private Sector 13.3% 39
Government 86.7%
Al-Rafidayn Bank 1982 Sana’a 2,000 Foreign 100% 1
Ownership of Capital
Appendix (8)Structure of Banking System
on 31/12/2006
123
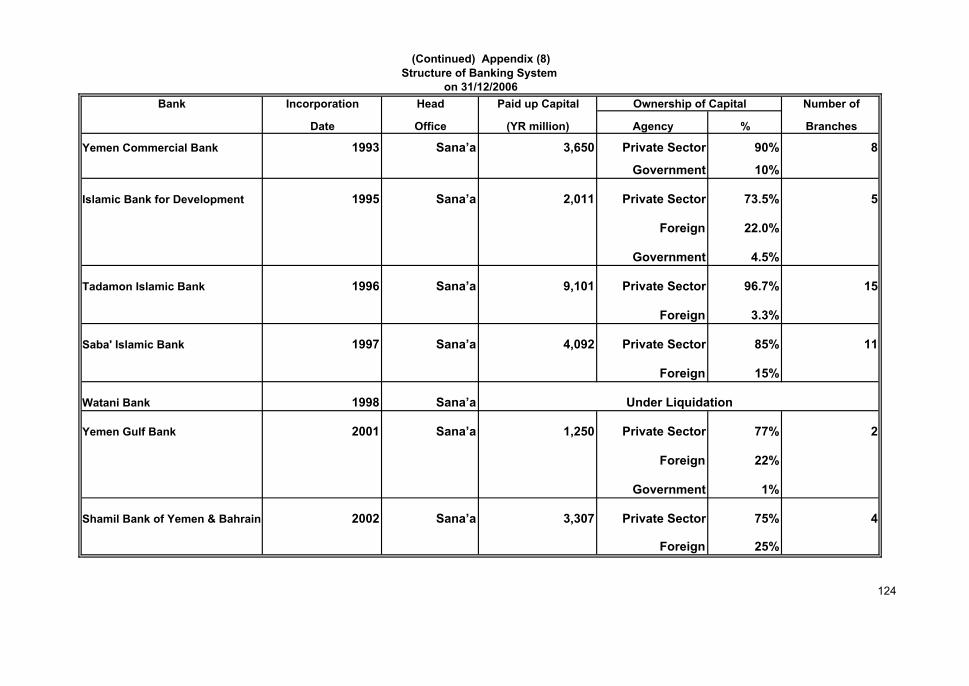
Bank Incorporation Head Paid up Capital Number of
Date Office (YR million) Agency % Branches
Yemen Commercial Bank 1993 Sana’a 3,650 Private Sector 90% 8
Government 10%
Islamic Bank for Development 1995 Sana’a 2,011 Private Sector 73.5% 5
Foreign 22.0%
Government 4.5%
Tadamon Islamic Bank 1996 Sana’a 9,101 Private Sector 96.7% 15
Foreign 3.3%
Saba' Islamic Bank 1997 Sana’a 4,092 Private Sector 85% 11
Foreign 15%
Watani Bank 1998 Sana’a
Yemen Gulf Bank 2001 Sana’a 1,250 Private Sector 77% 2
Foreign 22%
Government 1%
Shamil Bank of Yemen & Bahrain 2002 Sana’a 3,307 Private Sector 75% 4
Foreign 25%
Under Liquidation
Ownership of Capital
(Continued) Appendix (8)Structure of Banking System
on 31/12/2006
124

Appendix (9)Balance of Payments
(In Millions of USDollars )
2006*20052004200320022001200019991998205.7633.2224.6148.7443.4670.91336.6549.7-318.3I- Current Account
1390.31,700.3817.1376.9601.9766.41312.8357.8-785.1 1. Trade Balance7316.46,413.24675.73934.33684.43366.93797.22478.31503.7 Exports of which6733.45,952.04303.23459.13146.62905.13398.82131.21228.7 Crude Oil4013.53,114.92259.21828.41600.01585.41969.0993.0470.7 Government share2719.92,837.12044.01630.71546.61319.71429.81138.2758.0 Oil companies share
-5926.1-4,712.9-3858.6-3557.4-3082.6-2600.4-2484.4-2120.5-2288.8 Imports
-1306.2-860.3-689.8-685.8-679.7-677.6-598.6-535.5-518.5 2. Services balance548.8429.5369.7317.7272.3170.1210.9183.2174.4 Credit
-1855.0-1,289.8-1059.4-1003.6-952.0-847.7-809.4-718.7-692.9 Debit-705.4-547.1-450.0-409.9-341.2-329.2-318.4-243.1-261.7 Transportation
18.613.513.361.927.5-40.72.9-75.4-45.9 Travel43.341.241.236.036.340.245.241.117.8 Communication
-106.2-107.8-107.8-34.3-29.9-38.7-51.0-125.4-94.2 Construction-134.8-107.2-87.8-80.9-70.1-59.1-56.5-48.2-52.1 Insurance-586.7-171.0-111.2-275.5-287.5-233.6-205.0-79.9-79.2 Other business services
26.528.122.616.8-14.8-16.5-15.7-4.5-3.2 Government services, nie
-1234.3-1,612.5-1346.5-909.4-818.4-690.9-777.1-695.6-344.4 3. Income balance316.2178.2103.698.9119.8178.5149.656.769.0 Credit
-1550.5-1,790.7-1450.1-1008.3-938.2-869.4-926.7-752.3-413.4 Debit-1402.8-1,602.7-1289.4-944.7-877.9-799.9-855.4-661.5-321.0 Direct investment income
248.162.715.435.359.5109.078.3-34.1-23.4 Portfolio and other investment income
1356.01,405.71443.71367.11339.61273.01399.51422.91329.7 4. Current transfers balance1401.71,458.41493.11442.11456.81344.41471.91453.61377.4 Credit
-45.7-52.8-49.4-75.0-117.2-71.4-72.4-30.7-47.7 Debit112.7153.7171.2136.6147.741.871.9189.8155.4 General Government
1243.31,251.91272.51230.51191.91231.11327.61233.11174.3 Other sectors
125

Appendix (9)Balance of Payments
(In Millions of USDollars )
2006*200520042003200220012000199919981059.7-253.5255.1119.7-16.596.6-233.7-391.4-415.0II- Capital and Financial account
1059.7-253.5255.1119.7-16.596.6-233.7-391.4-415.0 1. Financial Account
1121.0-302.1143.60.0101.7135.56.4-307.6-219.4 1.1 Direct Investment1121.0-302.1143.6110.8114.3135.56.4-233.9-214.1 of which Oil companies investment2438.1932.3898.1796.8796.8655.2580.8220.1190.0 Inflow
-1317.1-1,234.4-754.5-686.0-682.5-519.7-574.4-454.0-404.1 Outflow
-61.348.5111.5119.7-118.2-38.9-240.1-83.8-195.6 1.2 Other Investments236.448.925.868.139.1-33.1-55.527.1-63.3 1.2.1 Government Loans (net)347.1271.2191.4171.4149.4138.4134.5231.6162.2 Drawings
-110.7-222.3-165.6-103.3-110.3-171.6-190.0-204.5-225.5 Repayments91.1-109.0-5.7-18.9-57.675.6-17.7-119.4-116.5 1.2.2 Trade Credits
-475.322.14.8-10.3-161.6-101.1-166.98.5-15.8 1.2.3 Commercial Banks86.686.586.580.861.919.70.00.00.0 1.2.4 Other Sectors
181.1204.752.6156.3170.5-114.2285.6110.6277.8III- Errors and Ommissions
1446.5584.4532.3424.7597.4653.21388.5268.9-455.5Overall balance
-1446.5-584.4-532.3-335.6-597.4-653.2-1388.5-268.9455.5Financing-1456.8-764.3-618.6-356.4-597.4-703.3-1498.9-407.6309.5A- Net Reserves (increase = -)-1402.7-713.8-531.8-326.3-556.8-762.6-1419.7-508.5238.2 Reserves
-54.1-50.5-86.7-30.1-40.759.3-79.2100.971.3 Monetary Authory Liabilities-59.9-55.9-41.0-19.3-18.270.8-71.1124.674.3 IMF Loan (Net)
0.00.0-50.4-16.4-13.8-15.9-11.825.0-10.2 AMF Loan (Net)
5.75.44.75.5-8.64.43.7-48.77.2 Liabilities - LCFAR10.3179.986.320.80.050.2110.5138.7146.0B- Debt Releif and arears
7.8115.876.85.50.049.5338.91.52.2 Debt forgivness0.061.70.00.00.055.0120.8137.2162.1 Rescheduling of Debt2.52.59.515.30.0-54.4-349.20.0-18.3 Changes in Overdue Obligations
* Preliminary
126

2000 2001 2002 2003 2004 2005 2006(1)
Total Revenues and Grants: 603.8 568.4 560.1 672.9 801.2 1121.3 1450.9
Total Revenues 583.8 563.4 532.1 664.5 782.5 1107.6 1449.4
Oil and Gas 430.1 406.2 391.2 480.2 579.1 752.7 1085.2
Crude Oil Exports 259.2 276.5 266.2 316.4 360.7 481.8 637.7
Oil Domestic Revenues 134.9 129.7 125.0 163.8 218.4 270.9 447.5
Non-Oil Revenues 153.7 157.2 140.9 184.3 203.4 354.9 364.2
Tax 111.0 113.7 112.9 145.3 177.3 234.9 266.1
Direct 40.7 46.9 74.4 68.3 70.3 94.2 131.4
Indirect 70.3 66.8 38.5 77.0 107.0 140.7 134.7
Non-Tax 42.7 43.5 28.0 39.0 26.1 120.0 98.1
Grants 20.0 5.0 28.0 8.3 18.7 13.7 1.5Total Expenditure and Net Lending 397.9 406.0 485.0 581.2 858.0 890.7 1119.4
Current Expenditure 397.9 406 485 581.2 618.5 890.7 1119.4
Civil Wages and salaries 98.2 111.2 134.5 143.2 159.5 195.9 266.3
Materials and Services 34.0 40.3 45.2 51.7 14.2 78.2 103.1
Defense 76.6 91.1 129.5 148.1 135.9 156.2 211.2
Interest Obligations 35.7 34.4 34.7 38.0 54.0 69.1 88.9
Local 29.2 26.8 26.2 29.2 44.9 60.1 76.4
Foreign 6.5 7.6 8.5 8.8 9.1 9.0 12.5
Transfers and Subsidies 138.3 116.0 126.4 177.2 230.6 372.8 427.4
Subsidies 88.3 60.7 57.0 106.9 152.4 286.3 309.0 Current Transfers 50.0 55.3 69.4 70.3 78.2 86.5 118.4
Appendix (10)Central Government Finance
(YR Billion)
127
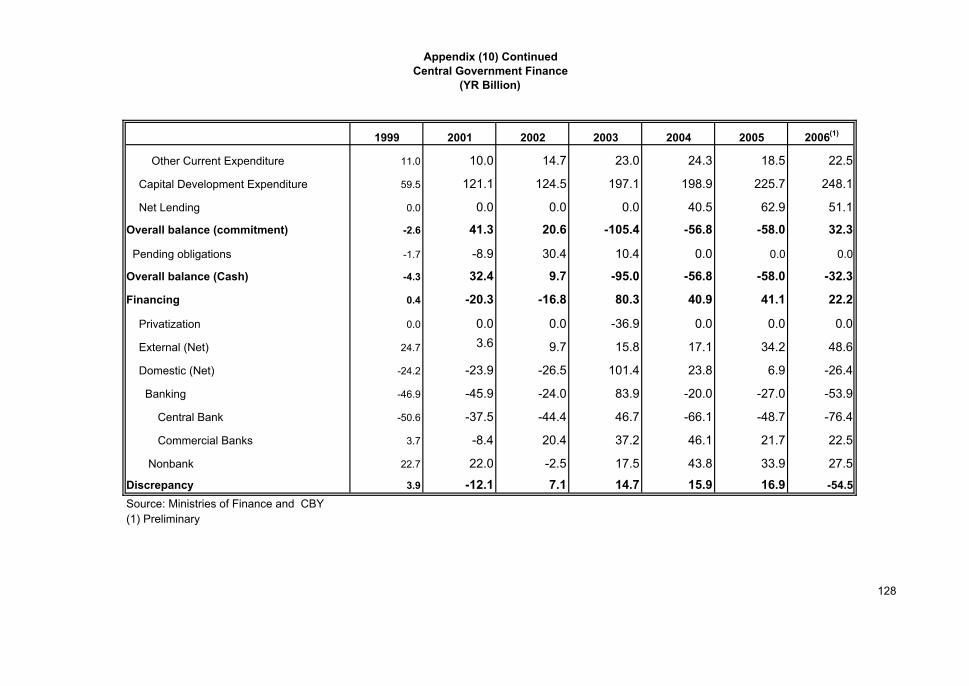
1999 2001 2002 2003 2004 2005 2006(1)
Other Current Expenditure 11.0 10.0 14.7 23.0 24.3 18.5 22.5
Capital Development Expenditure 59.5 121.1 124.5 197.1 198.9 225.7 248.1
Net Lending 0.0 0.0 0.0 0.0 40.5 62.9 51.1
Overall balance (commitment) -2.6 41.3 20.6 -105.4 -56.8 -58.0 32.3
Pending obligations -1.7 -8.9 30.4 10.4 0.0 0.0 0.0
Overall balance (Cash) -4.3 32.4 9.7 -95.0 -56.8 -58.0 -32.3
Financing 0.4 -20.3 -16.8 80.3 40.9 41.1 22.2
Privatization 0.0 0.0 0.0 -36.9 0.0 0.0 0.0
External (Net) 24.7 3.6 9.7 15.8 17.1 34.2 48.6
Domestic (Net) -24.2 -23.9 -26.5 101.4 23.8 6.9 -26.4
Banking -46.9 -45.9 -24.0 83.9 -20.0 -27.0 -53.9
Central Bank -50.6 -37.5 -44.4 46.7 -66.1 -48.7 -76.4
Commercial Banks 3.7 -8.4 20.4 37.2 46.1 21.7 22.5
Nonbank 22.7 22.0 -2.5 17.5 43.8 33.9 27.5
Discrepancy 3.9 -12.1 7.1 14.7 15.9 16.9 -54.5Source: Ministries of Finance and CBY(1) Preliminary
Appendix (10) ContinuedCentral Government Finance
(YR Billion)
128
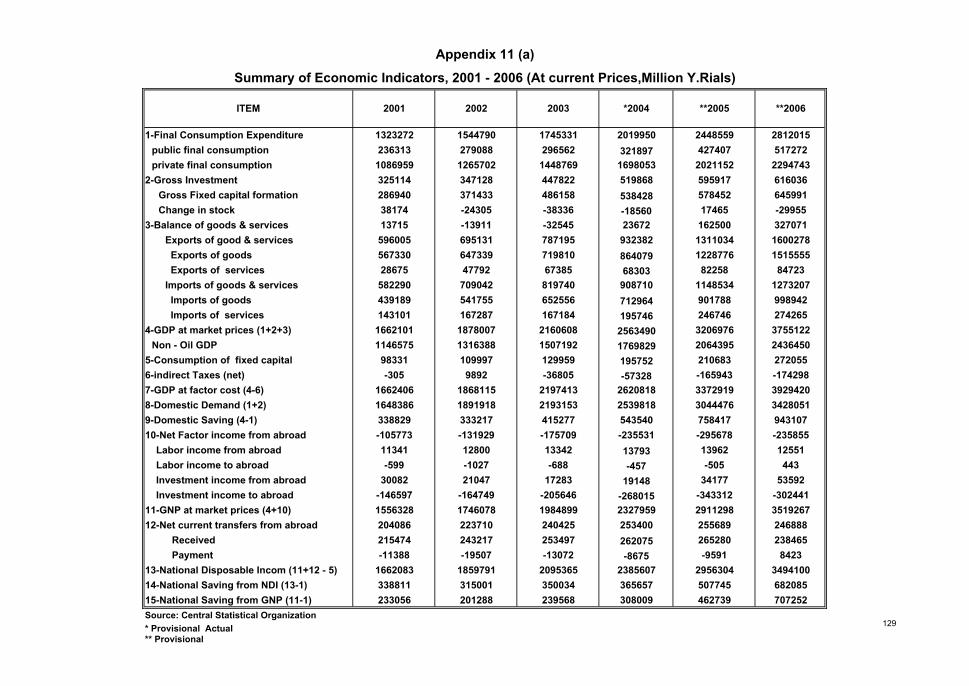
ITEM 2001 2002 2003 *2004 **2005 **2006
1-Final Consumption Expenditure 1323272 1544790 1745331 2019950 2448559 2812015public final consumption 236313 279088 296562 321897 427407 517272private final consumption 1086959 1265702 1448769 1698053 2021152 2294743
2-Gross Investment 325114 347128 447822 519868 595917 616036Gross Fixed capital formation 286940 371433 486158 538428 578452 645991Change in stock 38174 -24305 -38336 -18560 17465 -29955
3-Balance of goods & services 13715 -13911 -32545 23672 162500 327071Exports of good & services 596005 695131 787195 932382 1311034 1600278 Exports of goods 567330 647339 719810 864079 1228776 1515555 Exports of services 28675 47792 67385 68303 82258 84723Imports of goods & services 582290 709042 819740 908710 1148534 1273207 Imports of goods 439189 541755 652556 712964 901788 998942 Imports of services 143101 167287 167184 195746 246746 274265
4-GDP at market prices (1+2+3) 1662101 1878007 2160608 2563490 3206976 3755122Non - Oil GDP 1146575 1316388 1507192 1769829 2064395 2436450
5-Consumption of fixed capital 98331 109997 129959 195752 210683 2720556-indirect Taxes (net) -305 9892 -36805 -57328 -165943 -1742987-GDP at factor cost (4-6) 1662406 1868115 2197413 2620818 3372919 39294208-Domestic Demand (1+2) 1648386 1891918 2193153 2539818 3044476 34280519-Domestic Saving (4-1) 338829 333217 415277 543540 758417 94310710-Net Factor income from abroad -105773 -131929 -175709 -235531 -295678 -235855 Labor income from abroad 11341 12800 13342 13793 13962 12551 Labor income to abroad -599 -1027 -688 -457 -505 443 Investment income from abroad 30082 21047 17283 19148 34177 53592 Investment income to abroad -146597 -164749 -205646 -268015 -343312 -30244111-GNP at market prices (4+10) 1556328 1746078 1984899 2327959 2911298 351926712-Net current transfers from abroad 204086 223710 240425 253400 255689 246888
Received 215474 243217 253497 262075 265280 238465Payment -11388 -19507 -13072 -8675 -9591 8423
13-National Disposable Incom (11+12 - 5) 1662083 1859791 2095365 2385607 2956304 349410014-National Saving from NDI (13-1) 338811 315001 350034 365657 507745 68208515-National Saving from GNP (11-1) 233056 201288 239568 308009 462739 707252Source: Central Statistical Organization* Provisional Actual** Provisional
Appendix 11 (a)
Summary of Economic Indicators, 2001 - 2006 (At current Prices,Million Y.Rials)
129
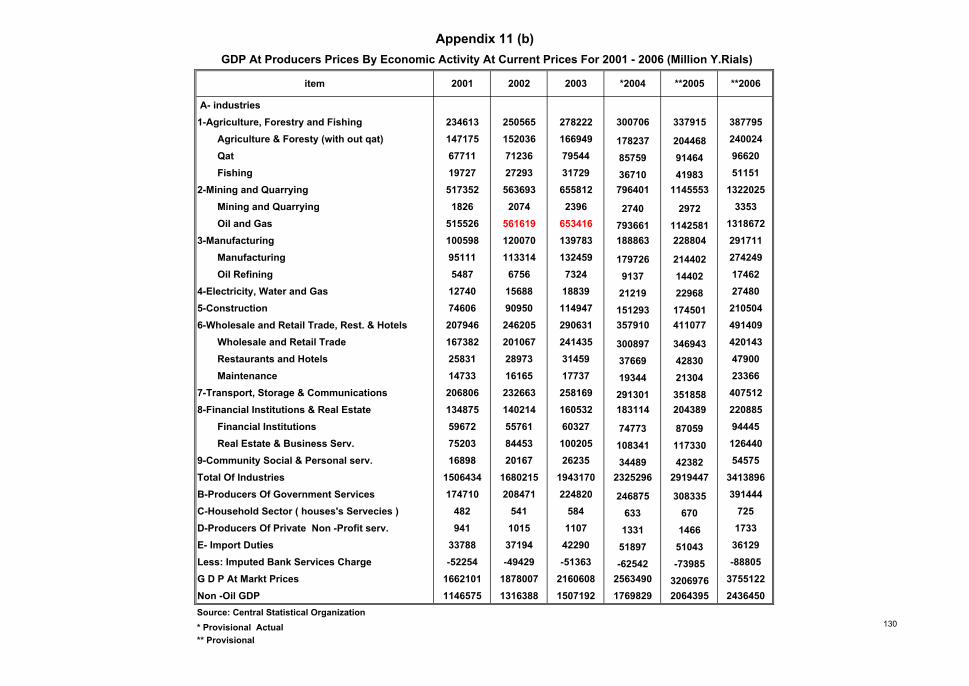
item 2001 2002 2003 *2004 **2005 **2006
A- industries1-Agriculture, Forestry and Fishing 234613 250565 278222 300706 337915 387795
Agriculture & Foresty (with out qat) 147175 152036 166949 178237 204468 240024Qat 67711 71236 79544 85759 91464 96620Fishing 19727 27293 31729 36710 41983 51151
2-Mining and Quarrying 517352 563693 655812 796401 1145553 1322025Mining and Quarrying 1826 2074 2396 2740 2972 3353Oil and Gas 515526 561619 653416 793661 1142581 1318672
3-Manufacturing 100598 120070 139783 188863 228804 291711Manufacturing 95111 113314 132459 179726 214402 274249Oil Refining 5487 6756 7324 9137 14402 17462
4-Electricity, Water and Gas 12740 15688 18839 21219 22968 274805-Construction 74606 90950 114947 151293 174501 2105046-Wholesale and Retail Trade, Rest. & Hotels 207946 246205 290631 357910 411077 491409
Wholesale and Retail Trade 167382 201067 241435 300897 346943 420143Restaurants and Hotels 25831 28973 31459 37669 42830 47900Maintenance 14733 16165 17737 19344 21304 23366
7-Transport, Storage & Communications 206806 232663 258169 291301 351858 4075128-Financial Institutions & Real Estate 134875 140214 160532 183114 204389 220885
Financial Institutions 59672 55761 60327 74773 87059 94445Real Estate & Business Serv. 75203 84453 100205 108341 117330 126440
9-Community Social & Personal serv. 16898 20167 26235 34489 42382 54575Total Of Industries 1506434 1680215 1943170 2325296 2919447 3413896B-Producers Of Government Services 174710 208471 224820 246875 308335 391444C-Household Sector ( houses's Servecies ) 482 541 584 633 670 725D-Producers Of Private Non -Profit serv. 941 1015 1107 1331 1466 1733E- Import Duties 33788 37194 42290 51897 51043 36129Less: Imputed Bank Services Charge -52254 -49429 -51363 -62542 -73985 -88805G D P At Markt Prices 1662101 1878007 2160608 2563490 3206976 3755122Non -Oil GDP 1146575 1316388 1507192 1769829 2064395 2436450Source: Central Statistical Organization* Provisional Actual** Provisional
Appendix 11 (b)GDP At Producers Prices By Economic Activity At Current Prices For 2001 - 2006 (Million Y.Rials)
130
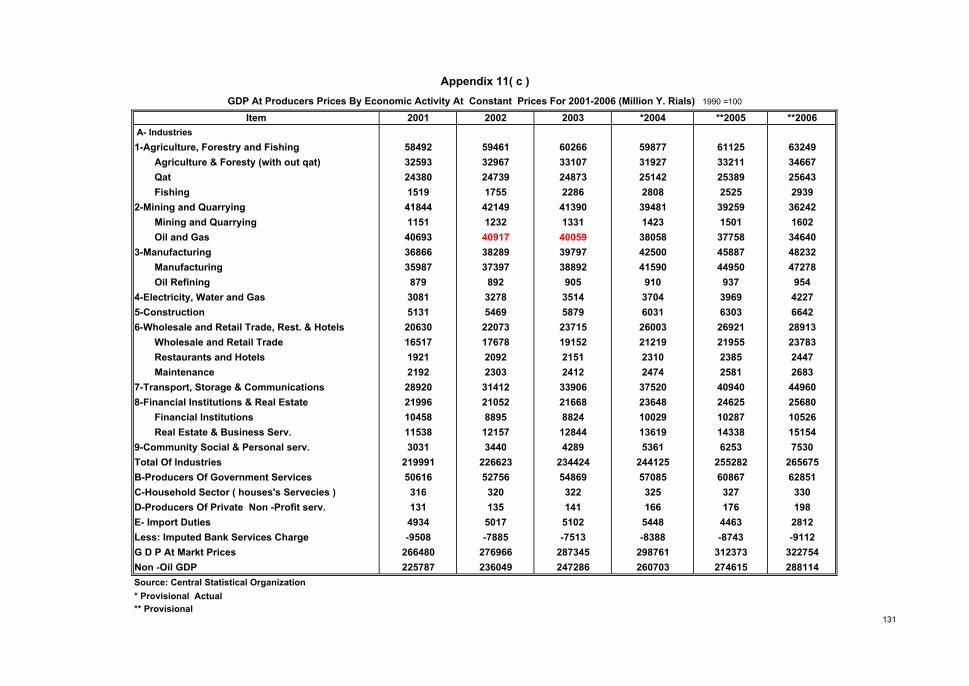
Item 2001 2002 2003 *2004 **2005 **2006 A- Industries1-Agriculture, Forestry and Fishing 58492 59461 60266 59877 61125 63249
Agriculture & Foresty (with out qat) 32593 32967 33107 31927 33211 34667Qat 24380 24739 24873 25142 25389 25643Fishing 1519 1755 2286 2808 2525 2939
2-Mining and Quarrying 41844 42149 41390 39481 39259 36242Mining and Quarrying 1151 1232 1331 1423 1501 1602Oil and Gas 40693 40917 40059 38058 37758 34640
3-Manufacturing 36866 38289 39797 42500 45887 48232Manufacturing 35987 37397 38892 41590 44950 47278Oil Refining 879 892 905 910 937 954
4-Electricity, Water and Gas 3081 3278 3514 3704 3969 42275-Construction 5131 5469 5879 6031 6303 66426-Wholesale and Retail Trade, Rest. & Hotels 20630 22073 23715 26003 26921 28913
Wholesale and Retail Trade 16517 17678 19152 21219 21955 23783Restaurants and Hotels 1921 2092 2151 2310 2385 2447Maintenance 2192 2303 2412 2474 2581 2683
7-Transport, Storage & Communications 28920 31412 33906 37520 40940 449608-Financial Institutions & Real Estate 21996 21052 21668 23648 24625 25680
Financial Institutions 10458 8895 8824 10029 10287 10526Real Estate & Business Serv. 11538 12157 12844 13619 14338 15154
9-Community Social & Personal serv. 3031 3440 4289 5361 6253 7530Total Of Industries 219991 226623 234424 244125 255282 265675B-Producers Of Government Services 50616 52756 54869 57085 60867 62851C-Household Sector ( houses's Servecies ) 316 320 322 325 327 330D-Producers Of Private Non -Profit serv. 131 135 141 166 176 198E- Import Duties 4934 5017 5102 5448 4463 2812Less: Imputed Bank Services Charge -9508 -7885 -7513 -8388 -8743 -9112G D P At Markt Prices 266480 276966 287345 298761 312373 322754Non -Oil GDP 225787 236049 247286 260703 274615 288114Source: Central Statistical Organization* Provisional Actual** Provisional
Appendix 11( c )GDP At Producers Prices By Economic Activity At Constant Prices For 2001-2006 (Million Y. Rials) 1990 =100
131
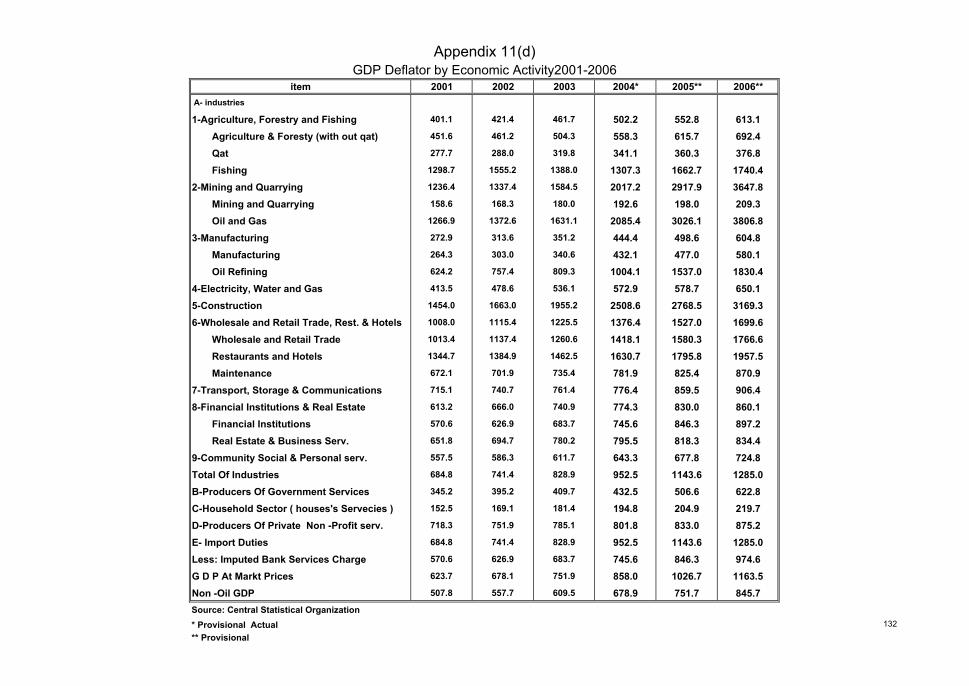
item 2001 2002 2003 2004* 2005** 2006** A- industries
1-Agriculture, Forestry and Fishing 401.1 421.4 461.7 502.2 552.8 613.1Agriculture & Foresty (with out qat) 451.6 461.2 504.3 558.3 615.7 692.4Qat 277.7 288.0 319.8 341.1 360.3 376.8Fishing 1298.7 1555.2 1388.0 1307.3 1662.7 1740.4
2-Mining and Quarrying 1236.4 1337.4 1584.5 2017.2 2917.9 3647.8Mining and Quarrying 158.6 168.3 180.0 192.6 198.0 209.3Oil and Gas 1266.9 1372.6 1631.1 2085.4 3026.1 3806.8
3-Manufacturing 272.9 313.6 351.2 444.4 498.6 604.8Manufacturing 264.3 303.0 340.6 432.1 477.0 580.1Oil Refining 624.2 757.4 809.3 1004.1 1537.0 1830.4
4-Electricity, Water and Gas 413.5 478.6 536.1 572.9 578.7 650.15-Construction 1454.0 1663.0 1955.2 2508.6 2768.5 3169.36-Wholesale and Retail Trade, Rest. & Hotels 1008.0 1115.4 1225.5 1376.4 1527.0 1699.6
Wholesale and Retail Trade 1013.4 1137.4 1260.6 1418.1 1580.3 1766.6Restaurants and Hotels 1344.7 1384.9 1462.5 1630.7 1795.8 1957.5Maintenance 672.1 701.9 735.4 781.9 825.4 870.9
7-Transport, Storage & Communications 715.1 740.7 761.4 776.4 859.5 906.48-Financial Institutions & Real Estate 613.2 666.0 740.9 774.3 830.0 860.1
Financial Institutions 570.6 626.9 683.7 745.6 846.3 897.2Real Estate & Business Serv. 651.8 694.7 780.2 795.5 818.3 834.4
9-Community Social & Personal serv. 557.5 586.3 611.7 643.3 677.8 724.8Total Of Industries 684.8 741.4 828.9 952.5 1143.6 1285.0B-Producers Of Government Services 345.2 395.2 409.7 432.5 506.6 622.8C-Household Sector ( houses's Servecies ) 152.5 169.1 181.4 194.8 204.9 219.7D-Producers Of Private Non -Profit serv. 718.3 751.9 785.1 801.8 833.0 875.2E- Import Duties 684.8 741.4 828.9 952.5 1143.6 1285.0Less: Imputed Bank Services Charge 570.6 626.9 683.7 745.6 846.3 974.6G D P At Markt Prices 623.7 678.1 751.9 858.0 1026.7 1163.5Non -Oil GDP 507.8 557.7 609.5 678.9 751.7 845.7Source: Central Statistical Organization* Provisional Actual** Provisional
Appendix 11(d)GDP Deflator by Economic Activity2001-2006
132
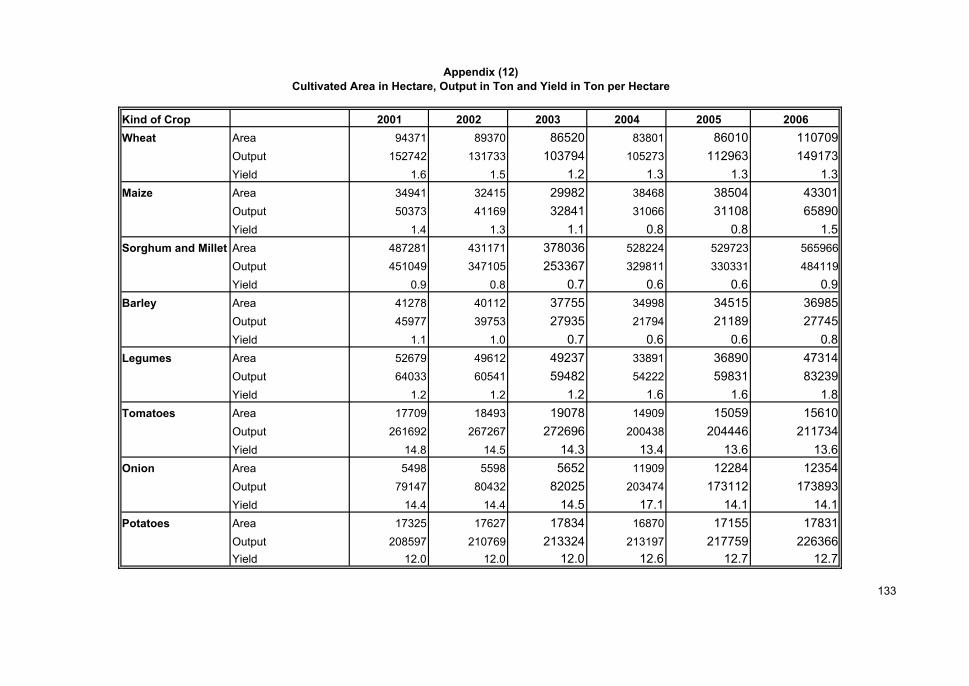
Kind of Crop 2001 2002 2003 2004 2005 2006Wheat Area 94371 89370 86520 83801 86010 110709
Output 152742 131733 103794 105273 112963 149173Yield 1.6 1.5 1.2 1.3 1.3 1.3
Maize Area 34941 32415 29982 38468 38504 43301Output 50373 41169 32841 31066 31108 65890Yield 1.4 1.3 1.1 0.8 0.8 1.5
Sorghum and Millet Area 487281 431171 378036 528224 529723 565966Output 451049 347105 253367 329811 330331 484119Yield 0.9 0.8 0.7 0.6 0.6 0.9
Barley Area 41278 40112 37755 34998 34515 36985Output 45977 39753 27935 21794 21189 27745Yield 1.1 1.0 0.7 0.6 0.6 0.8
Legumes Area 52679 49612 49237 33891 36890 47314Output 64033 60541 59482 54222 59831 83239Yield 1.2 1.2 1.2 1.6 1.6 1.8
Tomatoes Area 17709 18493 19078 14909 15059 15610Output 261692 267267 272696 200438 204446 211734Yield 14.8 14.5 14.3 13.4 13.6 13.6
Onion Area 5498 5598 5652 11909 12284 12354Output 79147 80432 82025 203474 173112 173893Yield 14.4 14.4 14.5 17.1 14.1 14.1
Potatoes Area 17325 17627 17834 16870 17155 17831Output 208597 210769 213324 213197 217759 226366Yield 12.0 12.0 12.0 12.6 12.7 12.7
Appendix (12)Cultivated Area in Hectare, Output in Ton and Yield in Ton per Hectare
133
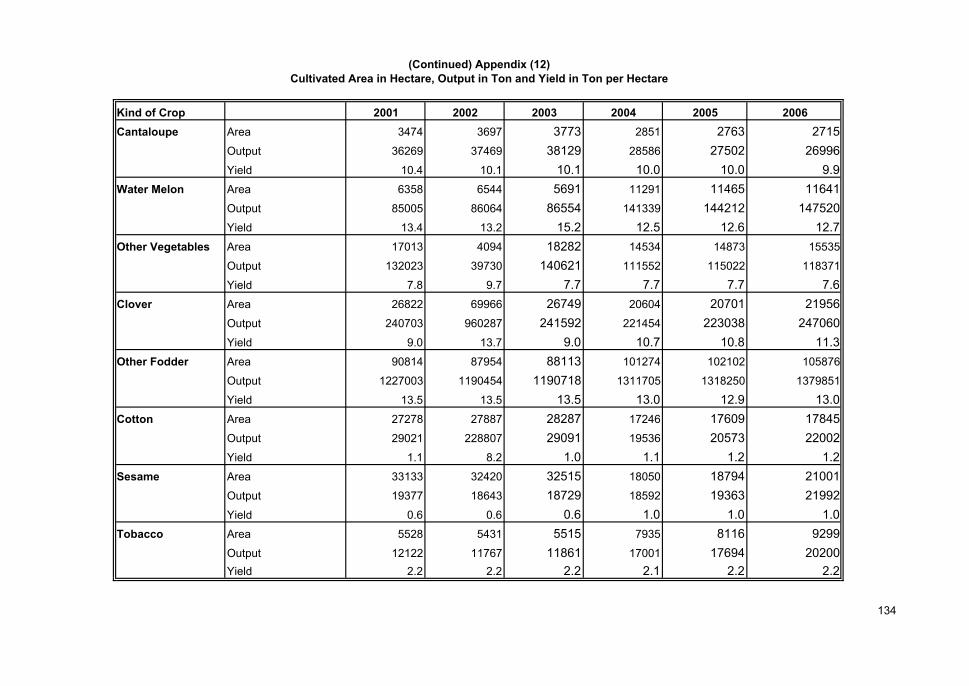
Kind of Crop 2001 2002 2003 2004 2005 2006Cantaloupe Area 3474 3697 3773 2851 2763 2715
Output 36269 37469 38129 28586 27502 26996Yield 10.4 10.1 10.1 10.0 10.0 9.9
Water Melon Area 6358 6544 5691 11291 11465 11641Output 85005 86064 86554 141339 144212 147520Yield 13.4 13.2 15.2 12.5 12.6 12.7
Other Vegetables Area 17013 4094 18282 14534 14873 15535
Output 132023 39730 140621 111552 115022 118371
Yield 7.8 9.7 7.7 7.7 7.7 7.6Clover Area 26822 69966 26749 20604 20701 21956
Output 240703 960287 241592 221454 223038 247060Yield 9.0 13.7 9.0 10.7 10.8 11.3
Other Fodder Area 90814 87954 88113 101274 102102 105876
Output 1227003 1190454 1190718 1311705 1318250 1379851
Yield 13.5 13.5 13.5 13.0 12.9 13.0Cotton Area 27278 27887 28287 17246 17609 17845
Output 29021 228807 29091 19536 20573 22002Yield 1.1 8.2 1.0 1.1 1.2 1.2
Sesame Area 33133 32420 32515 18050 18794 21001Output 19377 18643 18729 18592 19363 21992Yield 0.6 0.6 0.6 1.0 1.0 1.0
Tobacco Area 5528 5431 5515 7935 8116 9299Output 12122 11767 11861 17001 17694 20200Yield 2.2 2.2 2.2 2.1 2.2 2.2
(Continued) Appendix (12)Cultivated Area in Hectare, Output in Ton and Yield in Ton per Hectare
134
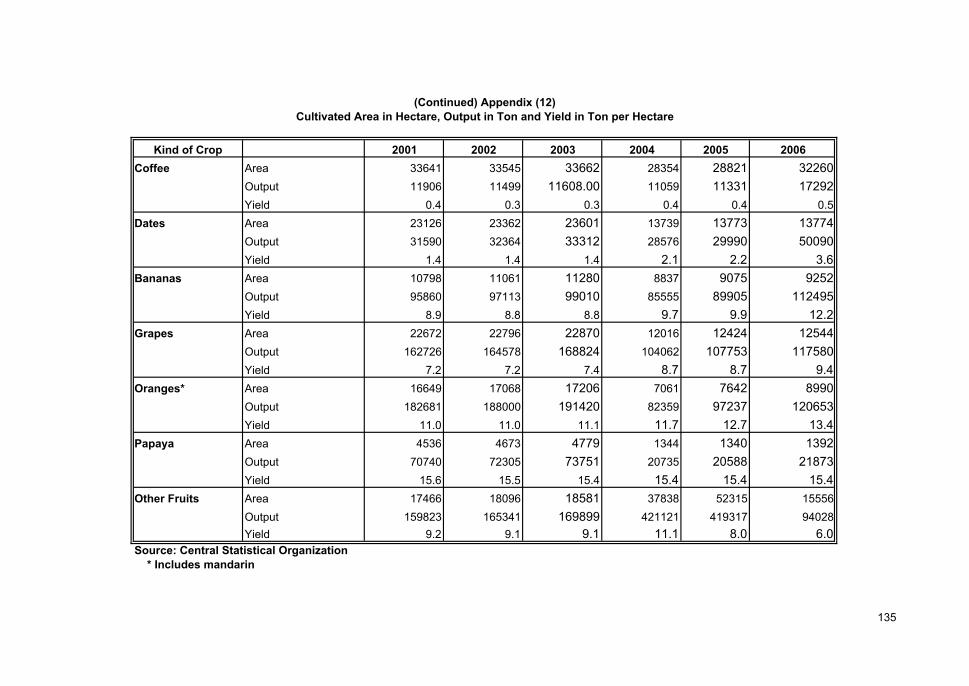
Kind of Crop 2001 2002 2003 2004 2005 2006Coffee Area 33641 33545 33662 28354 28821 32260
Output 11906 11499 11608.00 11059 11331 17292Yield 0.4 0.3 0.3 0.4 0.4 0.5
Dates Area 23126 23362 23601 13739 13773 13774Output 31590 32364 33312 28576 29990 50090Yield 1.4 1.4 1.4 2.1 2.2 3.6
Bananas Area 10798 11061 11280 8837 9075 9252Output 95860 97113 99010 85555 89905 112495Yield 8.9 8.8 8.8 9.7 9.9 12.2
Grapes Area 22672 22796 22870 12016 12424 12544Output 162726 164578 168824 104062 107753 117580Yield 7.2 7.2 7.4 8.7 8.7 9.4
Oranges* Area 16649 17068 17206 7061 7642 8990Output 182681 188000 191420 82359 97237 120653Yield 11.0 11.0 11.1 11.7 12.7 13.4
Papaya Area 4536 4673 4779 1344 1340 1392Output 70740 72305 73751 20735 20588 21873Yield 15.6 15.5 15.4 15.4 15.4 15.4
Other Fruits Area 17466 18096 18581 37838 52315 15556Output 159823 165341 169899 421121 419317 94028Yield 9.2 9.1 9.1 11.1 8.0 6.0
Source: Central Statistical Organization * Includes mandarin
(Continued) Appendix (12)Cultivated Area in Hectare, Output in Ton and Yield in Ton per Hectare
135
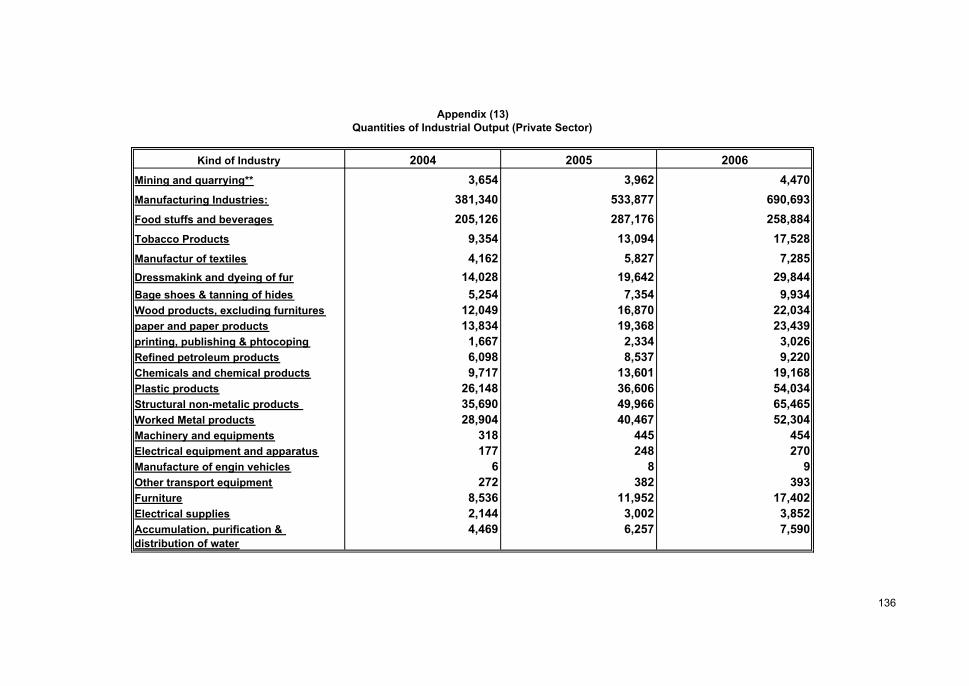
Kind of Industry 2004 2005 2006Mining and quarrying** 3,654 3,962 4,470Manufacturing Industries: 381,340 533,877 690,693Food stuffs and beverages 205,126 287,176 258,884Tobacco Products 9,354 13,094 17,528Manufactur of textiles 4,162 5,827 7,285Dressmakink and dyeing of fur 14,028 19,642 29,844Bage shoes & tanning of hides 5,254 7,354 9,934Wood products, excluding furnitures 12,049 16,870 22,034paper and paper products 13,834 19,368 23,439printing, publishing & phtocoping 1,667 2,334 3,026Refined petroleum products 6,098 8,537 9,220Chemicals and chemical products 9,717 13,601 19,168Plastic products 26,148 36,606 54,034Structural non-metalic products 35,690 49,966 65,465Worked Metal products 28,904 40,467 52,304Machinery and equipments 318 445 454Electrical equipment and apparatus 177 248 270Manufacture of engin vehicles 6 8 9Other transport equipment 272 382 393Furniture 8,536 11,952 17,402Electrical supplies 2,144 3,002 3,852Accumulation, purification & 4,469 6,257 7,590distribution of water
Appendix (13)Quantities of Industrial Output (Private Sector)
136
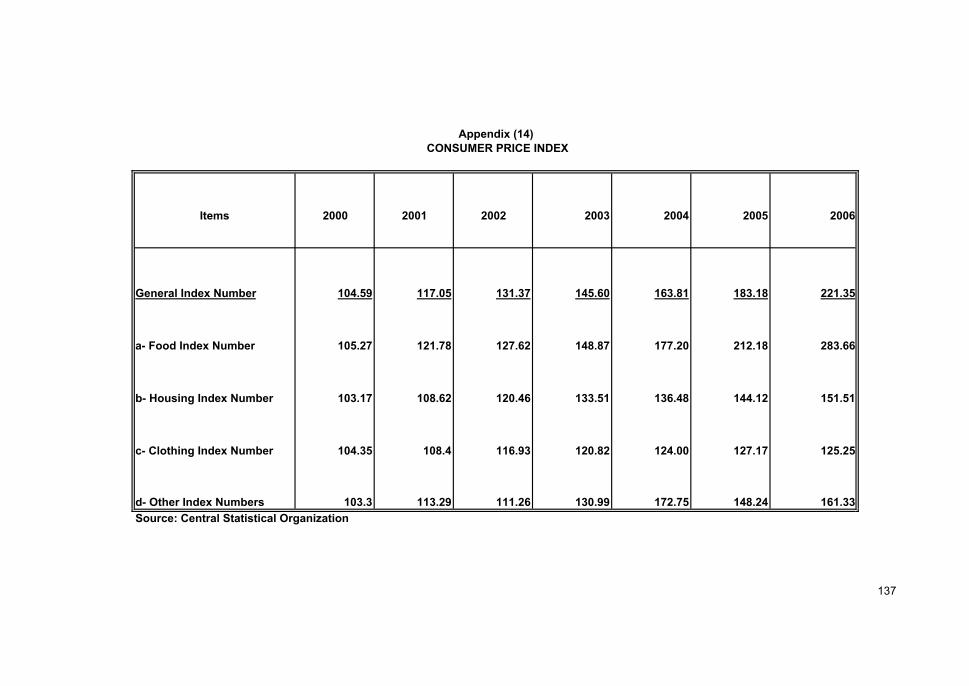
Items 2000 2001 2002 2003 2004 2005 2006
General Index Number 104.59 117.05 131.37 145.60 163.81 183.18 221.35
a- Food Index Number 105.27 121.78 127.62 148.87 177.20 212.18 283.66
b- Housing Index Number 103.17 108.62 120.46 133.51 136.48 144.12 151.51
c- Clothing Index Number 104.35 108.4 116.93 120.82 124.00 127.17 125.25
d- Other Index Numbers 103.3 113.29 111.26 130.99 172.75 148.24 161.33Source: Central Statistical Organization
Appendix (14) CONSUMER PRICE INDEX
137
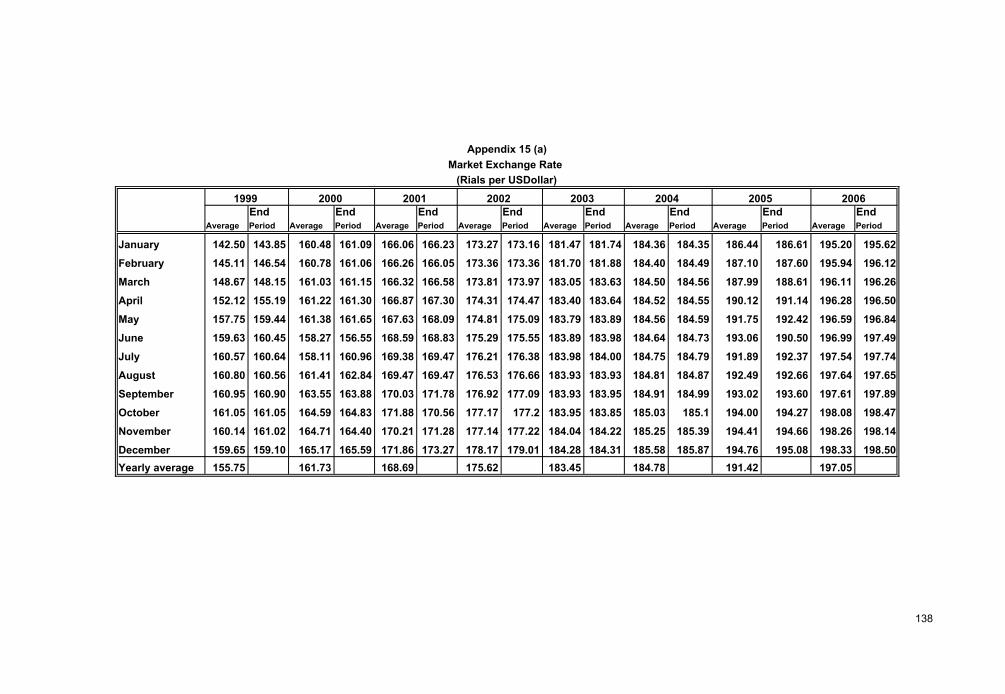
EndEndEndEndEndEndEndEndPeriodAveragePeriodAveragePeriodAveragePeriodAveragePeriodAveragePeriodAveragePeriodAveragePeriodAverage
195.62195.20186.61186.44184.35184.36181.74181.47173.16173.27166.23166.06161.09160.48143.85142.50January
196.12195.94187.60187.10184.49184.40181.88181.70173.36173.36166.05166.26161.06160.78146.54145.11February
196.26196.11188.61187.99184.56184.50183.63183.05173.97173.81166.58166.32161.15161.03148.15148.67March
196.50196.28191.14190.12184.55184.52183.64183.40174.47174.31167.30166.87161.30161.22155.19152.12April
196.84196.59192.42191.75184.59184.56183.89183.79175.09174.81168.09167.63161.65161.38159.44157.75May
197.49196.99190.50193.06184.73184.64183.98183.89175.55175.29168.83168.59156.55158.27160.45159.63June
197.74197.54192.37191.89184.79184.75184.00183.98176.38176.21169.47169.38160.96158.11160.64160.57July
197.65197.64192.66192.49184.87184.81183.93183.93176.66176.53169.47169.47162.84161.41160.56160.80August
197.89197.61193.60193.02184.99184.91183.95183.93177.09176.92171.78170.03163.88163.55160.90160.95September
198.47198.08194.27194.00185.1185.03183.85183.95177.2177.17170.56171.88164.83164.59161.05161.05October
198.14198.26194.66194.41185.39185.25184.22184.04177.22177.14171.28170.21164.40164.71161.02160.14November
198.50198.33195.08194.76185.87185.58184.31184.28179.01178.17173.27171.86165.59165.17159.10159.65December197.05191.42184.78183.45175.62168.69161.73155.75Yearly average
Appendix 15 (a)Market Exchange Rate
(Rials per USDollar)
2005200420032002200120001999 2006
138

20062005200420032002200120001999Currency / PeriodUS Dollar
198.3800194.9400185.7200184.1600178.7600173.1000165.3400156.2291 Buying198.6300195.2100185.8500184.4300178.9900173.4400165.7200156.5558 Selling
Sterling Pound388.6400335.8400358.7000326.8400286.8700251.2500243.5500252.1650 Buying389.1300336.3100359.1400327.3200287.2300251.7500244.1100252.6916 Selling
E.C.U.260.4800231.2900253.4200230.2100186.6300153.2800152.8500166.7333 Buying260.8100231.6100253.7400230.5500186.8700153.5800153.0000166.9455 Selling
D. Mark78.370078.050084.6175 Buying78.520078.230084.7942 Selling
Swiss Franc162.6300148.3600164.2200147.5100128.4100103.4500100.4500103.3700 Buying162.8300148.5700164.4200147.7300128.5800103.6600100.7700103.5866 Selling
French Franc23.370023.270025.2308 Buying23.410023.320025.2833 Selling
Saudi Arabian Rial52.890051.980049.520049.110047.660046.160044.080041.6575 Buying52.960052.050049.580049.180047.730046.250044.190041.7458 Selling
Dutch Guilder69.550069.270075.1008 Buying69.690069.430075.2600 Selling
Kuwaiti Dinar686.1000667.1500630.0100624.7400596.5600563.5700541.3800512.8733 Buying686.9700668.0700630.7900625.6500597.2300564.6800542.6000513.9450 Selling
Belgian Franc3.80003.78004.1016 Buying3.81003.79004.1160 Selling
Appendix 15 (b)Exchange Rate of Major Foreign Currencies
Rails per Unit
139

20062005200420032002200120001999Currency / Period
Appendix 15 (b)Exchange Rate of Major Foreign Currencies
Rails per Unit
100 Japanese Yen166.8881165.4487179.9438172.0719149.0846132.0466144.5774138.8804 Buying167.0985165.6779180.1666172.3242149.2765132.3060144.8396139.1673 Selling
Swedish Krona29.010024.560028.230025.330020.340016.490017.260018.8550 Buying29.050024.590028.260025.370020.360016.520017.300018.8925 Selling
100 Italian Lires7.91628.04748.5474 Buying7.93178.06208.5653 Selling
Jordanian Dinar279.8000275.1600261.9500259.7500251.9500244.2200232.8700219.6475 Buying280.1600275.5500262.2700260.1300252.2800244.7000233.4100220.1066 Selling
UAE Dirhem54.040053.070050.570050.140048.670047.130045.020042.5358 Buying54.110053.150050.630050.210048.730047.220045.120042.6233 Selling
Bahraini Dinar526.2600517.0400492.6300488.5000474.1600459.1600438.5600414.4183 Buying526.9300517.7600493.2400489.2200474.7700460.0700439.5600415.2841 Selling
Qatari Rial54.500053.540051.020050.590049.100047.560045.430042.9200 Buying54.560053.620051.090050.670049.160047.650045.540043.0083 Selling
Omani Rial515.3000506.3600482.3900478.3600464.2900449.6600429.4700405.7942 Buying515.9500507.0700482.9900479.0600464.8800450.5400430.4500406.6416 Selling
Egyptian Pound34.690033.900030.170029.970038.710037.790043.630045.7067 Buying34.740033.950030.210030.010038.760037.870043.730045.8025 Selling
140

Years Exports Re-Exports Total of Export Imports Trade Balance
1991 6,075,948 1,842,203 7,918,151 24,314,326 -16,396,175
1992 3,951,463 1,741,886 5,693,349 31,075,611 -25,382,262
1993 4,494,605 2,838,043 7,332,648 33,883,228 -26,550,580
1994(1) 9,935,696 1,279,907 11,215,603 25,070,230 -13,854,627
1995 74,785,104 4,648,754 79,433,858 64,590,649 14,843,209
1996 225,960,484 25,869,203 251,829,687 191,862,330 59,967,357
1997 298,144,458 25,571,438 323,715,896 260,331,141 63,384,755
1998(2) 179,117,833 24,362,461 203,480,294 294,509,749 -91,029,455
1999 351,624,962 28,385,225 380,010,187 312,749,406 67,260,781
2000 613,937,112 45,671,897 659,609,009 375,782,922 283,826,087
2001 521,629,032 47,378,463 569,007,495 415,899,034 153,108,461
2002 540,732,149 45,213,867 585,946,016 513,025,665 72,920,351
2003 659,476,436 25,431,277 684,907,714 674,128,291 10,779,423
2004 731,781,051 21,814,941 753,595,992 736,533,100 17,062,892
2005 1,040,657,905 33,891,562 1,074,549,467 931,599,248 142,950,219
2006 1,270,866,272 45,331,386 1,316,197,659 1,043,119,407 273,078,251Source :Central Statistical Organization** Oil companies exports of crude oil are not included in the exports for the years1991-1994.(1) 1994 Imports of oil products imported by Yemen Oil Company do not include about 164 million Dollar.(2)The decrease in exports in 1998 is due to fall in international prices of crude oil.
(VALUE BY THOUSAND RIALS)
Appendix (16)TRADE BALANCE FOR THE YEARS 1991 - 2006
141
Export Re-Export Export Re-Export Export Re-ExportLIVE ANIMALS 3414 0 718 0 0 0
MEAT AND EDIBLE MEAT OFFAL 1142 140979 0 3,845 120 35525
FISH AND CRUSTACEANS, MOLLUSCS AND OTHER AQUATIC INVERTEBRATES 16544327 61595 20,382,961 0 25860707 37757MILK AND DAIRY MILKPRODUCTS PRODUCE, BIRDS EGGS, NATURAL HONEY, EDIBLE PRODUCTS FIT FOR FOOD OF ANIMAL ORIGIN, NOT ELSEWHERE 1618205 193352 2,328,810 613,472 2876883 191114
PRODUCTS OF ANIMAL ORIGIN, NOT ELSEWHERE SPECIFIED OR INCLUDED 6857 0 15,623 32 47387 0LIVE TREES AND OTHER PLANTS, BULBS ROOTS AND THE LIKE, CUT FLOWERS AND ORNAMENTAL FOLIAGE 43386 8 61,855 370 62796 2136
EDIBLE VEGETABLES AND CERTAIN ROOTS AND TUBERS FOR FOOD 1506471 76 1,857,862 9,917 1749902 4832
FRUITS AND EDIBLE NUTS, SUITABLE FOR FOOD 3894011 6558 4,927,728 4,150 4588665 17113
COFFEE, TEA, MATE, AND SPICES 2624566 304288 3,911,377 230,269 3231619 180156
CEREALS 368500 4737 1,467,607 56,761 888064 426774
PRODUCTS OF THE MILLING INDUSTRY 575263 226214 1,191,032 577 1100543 29067
OIL SEEDS AND OLEAGINOUS FRUITS 45133 979 18,117 39,366 18707 19883
LAC, GUMS 10643 8280 258 22,845 862 32661VEGETABLE PLAITING MATERIALS, VEGETABLE PRODUCTS NOT ELSEWHERE SPECIFIED OR INCLUDED 172548 0 373,601 540 267322 0
ANIMAL OR VEGETABLE FATS AND OIL AND THEIR CLEAVAGE PRODUCTS. 877215 5206 966,544 3,478 1465477 24635PREPARATIONS OF MEAT, OF FISH , OR OF CRUSTACEANS, MOLLUSCS OR OTHER AQUATIC INVERTEBRATES 1514036 30 857,937 916 2237105 0
SUGARS AND SUGAR CONFECTIONERY 288079 4820 305,158 650,068 546840 532491
COCOA AND COCOA PREPARATIONS 76288 2556 203,571 1,638 59899 0
"PREPARATIONS OF CEREALS AND CEREALS PRODUCTS 929978 4244 786,576 2,957 1312763 21684
PREPARATIONS OF VEGETABLES, FRUIT, NUTS OR OTHER PARTS OF PLANTS. 542952 19843 487,554 79,710 684604 63736
Appendix 17 (a)EXPORTS AND RE_EXPORTS BY SECTIONS OF H.S DURING 2004-2006. ( VALUE IN 000, Y.R)
20062004 HS SECTIONS 2005
142
Appendix 17 (a)EXPORTS AND RE_EXPORTS BY SECTIONS OF H.S DURING 2004-2006. ( VALUE IN 000, Y.R)
Export Re-Export Export Re-Export Export Re-ExportMISCELLANEOUS FOOD PREPARATIONS 59711 11080 130,715 15,908 60124 9896
BEVERAGES, SPIRITS AND VINEGAR 220840 180 533,963 13,307 290323 7373
RESIDUES AND WASTE FROM THE FOOD INDUSTRIES. 920248 0 1,269,895 0 1395924 3417
TOBACCO MANUFACTURED OR UNMANUFACTURED, TOBACCO SUBSTITUTES 2323734 51839 3,755,857 252,146 5333693 14480
SALT. 183490 1800 138,529 61,917 122261 56
ORES, SLAG AND ASH 112000 0 2,039 0 4753 0
MINERAL FUELS, (MINERAL OILS) 688074354 21471 987,559,779 2,245,432 1207265550 131146
INORGANIC CHEMICALS PRODUCTS. 534 2909 563 10,186 9550 4918
ORGANIC CHEMICALS PRODUCTS. 759 1440 23 1,395 31 5353
PHARMACEUTICAL PRODUCTS 103798 124159 89,813 134,405 141587 270851
FERTILISERS 0 0 47,361 0 0 6579
TANNING OR DYEING EXTRACTS. 17193 4797 386,577 1,275 97110 2982ESSENTIAL OILS AND RESINOIDS, PERFUMERY, COSMETIC OR TOILET PREPARATIONS 113505 53631 170,178 60,552 165009 33831
SOAP, ORGANIC SURFACE-ACTIVE AGENTS WASHING PREPARATIONS, LUBRICATING PREPARATIONS, ARTIFICAL WAXES, PREPARED WAXES,
1606807 7466 1,928,536 73,039 2647714 51335
ALBUMINOIDAL SUBSTANCES . 0 50 1,273 278 60 8259EXPLOSIVES, PYROTECHNIC PRODUCTS MATCHES, PYROPHORIC ALLOYS, CERTAIN COMBUSTIBLE PREPARATIONS 0 0 0 0 0 0
PHOTOGRAPHIC OR CINEMATOGRAPHIC GOODS 445 0 0 1,168 2076 3605
MISCELLANEDOUS CHEMICAL PRODUCTS 10116 103740 3,851 33,471 75318 167186
PLASTIC AND PLASTIC MANUFACTURES 87291 70101 359,114 97,795 443187 111286
RUBBER AND RUBBER MANUFACTURES 11257 8552 39,188 47,020 160593 73650
2006 HS SECTIONS 2004 2005
143

Appendix 17 (a)EXPORTS AND RE_EXPORTS BY SECTIONS OF H.S DURING 2004-2006. ( VALUE IN 000, Y.R)
Export Re-Export Export Re-Export Export Re-ExportROW HIDES AND SKINS,TANNED (SKINS NOT TANNED, OTHER THAN FUR SKIN) 2332484 23976 1,660,509 29,490 3028302 0
LEATHER, MANUFACTURES. 20 300 6,578 2,489 4791 1982
FURSKINS, NATURAL OR ARTIFICIAL (IMMITATION) 1817 0 0 0 0 20018
WOOD AND ITS PRODUCTS. 1236 1631 9,641 13,183 9606 8451
CORK AND ITS MANUFACTURES. 0 0 0 0 0 0
ARTICLES, OF STRAW AND PLAITING OR FROM OTHER PLAITING MATERIALS. 868 0 163 0 79 0
WOOD PULP OR OTHER FIBROUS CELLULOSIC MATERIALS 102782 0 92,176 3,238 129992 7
PAPER AND PAPERBOARD. 170360 62 298,224 338,556 203865 4512PRINTED BOOKS, NEWS PAPERS, PICTURES AND OTHER PRINTING AND PUBLISHING PRODUCTS 13934 449637 10,363 34,355 28461 30684
Natural silk 0 0 1,092 0 2170 0
WOOL,FINE OR COARSE ANIMAL HAIR 0 0 66 0 81 0
COTTON. 1389411 0 391,578 0 521451 964
OTHER VEGETABLE TEXTILE FIBRES. 0 0 0 0 0 0
THREAD OF MAN-MADE SYNTHETIC FILAMENTS 15704 6360 1,075 10,627 3396 10922
SYNTHETIC OR ARTIFICIAL STAPLE FIBRES. 1791 1137 583 10,822 50 10795
WADDING AND FELT AND FABRIC NOT WOVEN. 262 1910 399 3,690 2057 5862
CARPETS AND OTHER TEXTILE FLOOR COVERING 31 110 4,332 371 15084 20650
SPECIAL FABRICS 2588 983 552 7,173 125 526
TEXTILE FABRICS IMPREGENATED, COATED, COVERED OR LAMINATED 808 600 6,859 45 560 8205
FABRICS, KNITTED OR CROCHETED . 3119 66 2,149 300 402 189
GARMENTS AND CLOTHING ACCESSORIES,KNITTED OR CROCHETED . 11457 0 19,086 1,456 2328 0
20062005 HS SECTIONS 2004
144

Appendix 17 (a)EXPORTS AND RE_EXPORTS BY SECTIONS OF H.S DURING 2004-2006. ( VALUE IN 000, Y.R)
Export Re-Export Export Re-Export Export Re-ExportGARMENTS AND CLOTHING ACCESSORIES, NOT KNITTED OR CROCHETED. 8448 42134 37,245 30,839 78872 39726
OTHER MADE UP ARTICLES OF FABRICS 4797 124479 46,998 112,253 164102 69207
FOOTWEAR, GAITERS AND SIMILAR ARTICLES 8673 19693 16,366 500 8240 3769
HEADGEAR AND PARTS THEREOF . 0 0 131 0 262 0UMBRELLAS AND SUN UMBRELLAS, WALKING-STICKS, SEAT-STICKS, WHIPS, RIDING CROPS AND ACCESSORIES. 0 0 0 0 3 0
FEATHERS AND DOWN, AND ARTICLES MANUFACTURED FROM. 0 0 0 0 0 1964
ARTICLES OF STONES OR PLASTERS OR CEMENT OR ROCK WOOL (ASBESTOS) OR MICA OR SIMILAR ARTICLES. 12961 354 5,837 103,486 16679 393120
ARTICLES OF CERAMIC . 24265 8045 508,123 2,062 12442 25880
GLASSES AND ARTICLES OF GLASSES . 60 0 2,484 1,955 37571 12207PEARLS, NATURAL OR CULTURED , PRECIOUS OR SEMI-PRECIOUS STONES, PRECIOUS MEATLS , BASE METALS CLAD WITH PRECIOUS METAL AND ARTICLES OF THIS MATERIALS .
108221 4086020 5,982 6,412,824 11771 7281219
IRON AND STEEL . 810672 76799 755,777 38,762 867625 39230
ARTICLES OR IRON AND STEEL . 96345 436342 59,775 436,967 43653 2256337
COPPER AND ARTICLES THEREOF . 1111 40186 37,303 30,103 77325 26987
NICKEL AND ARTICLES THEREOF . 0 0 0 14,034 0 0
ALUMINIUM AND ARTICLES THEREOF . 27339 1754 15,794 14,555 41304 170022
LEAD AND ARTICLES THEREOF . 0 0 0 0 71134 0
ZINK AND ARTICLES THEREOF . 0 0 0 0 197 1192
TIN AND ARTICLES THEREOF . 0 0 0 54 411 815
OTHER METALS AND ARTICLES THEREOF . 0 0 0 0 0 0TOOLS, CUTTING TOOLS,TABLE TOOLS( SPOONS,FORK-SPOON,ETC) OF BASEMETAL . 5054 172211 470 179,871 8647 572749
20062005 HS SECTIONS 2004
145
Appendix 17 (a)EXPORTS AND RE_EXPORTS BY SECTIONS OF H.S DURING 2004-2006. ( VALUE IN 000, Y.R)
Export Re-Export Export Re-Export Export Re-ExportMISCELLANEOUS ARTICLES OF BASE METAL. 127 77259 463 2,151 110 55245NUCLEAR REACTORS, BOILERS, MACHINERY AND MECHANICAL APPLIANCES, PARTS THEREOF 382848 3413237 0 5,270,591 17892 15120928
ELECTRICAL MACHINERY AND EQUIPMENT AND PARTS THEREOF, SOUND RECORDERS AND REPRODUCERS, TELEVISION IMAGE AND SOUND RECORDERS AND REPRODUCERS AND PARTS AND ACCESSORIES OF SUCH ARTICLES.
53648 469781 38,112 1,483,168 125734 1888366
RAIL WAY OR TRAMWAY LOCOMOTIVES, ROLLING- STOCK AND PARTS THEREOF, RAIL WAY OR TRAMWAY TRACK FIXTURES AND FITTINGS, AND PARTS THEREOF, MECHANICAL ( INCLUDING ELECTOR-MECHANICAL). TRAFFIC SIGNALLING EQUIPMENT OF ALL KINDS.
185 45876 0 264,786 0 253586
VEHICLES OTHER THAN RAIL WAY OR TRAMWAY ROLLING-STOCK, AND PARTS AND ACCESSORIES THEREOF. 5336 4247717 0 11,294,186 6316 9572845
AIRCRAFTS, SPACECRAFT, AND PARTS THEREOF. 0 909024 0 424,950 0 1468356
SHIPS, BOATS AND FLOATING STRUCTURES. 4926 3582156 1,710 1,067,620 10396 1337928OPTICAL PHOTOGRAPHIC, CINEMATOGRAPHIC, MEASURING, CHECKING PRECISON, MEDICAL OR SURGICAL INSTRUMENTS AND APPARTSU, PARTS AND ACCESSORIES THEREOF.
400 1739958 0 1,258,011 1506 1742829
CLOCKS AND WATCHES AND PARTS THEREOF 0 0 0 16,104 0 12260MUSICAL INSTRUMENTS, PATS AND ACCESSORIES OF SUCH ARTICALES. 42 0 0 0 0 389WEAPONS 90 0 32 0 324 0FURNITURE, BEDDING, MATTRESSES, MATTRESS SUPPORTS, CUSHONS AND SIMILAR STUFFED FURNSHING, LAMS AND LIGHTING FITTINGS, NOT ELSEWHERE SPECIFED OR INCLUDED, ILLUMINATED SIGNS, ILLUMINATED NAME-PLATES AND THE LIKE, PERFABRICATED BUILDINGS.
684293 293910 48,704 187,666 55622 318469
TOYS, GAMES AND SPORTS REQUISTTES, PARTS AND ACCESSORIES THEREOF. 10 197 2,212 1,718 261 5409
MISCELLANEOUS MANUFACTURED ARTICLES 3435 10569 4,911 16,347 38286 9477WORKS OF ART, COLIECTORS, PIECES AND ANTIQUES 0 83491 1,913 0 1659 1344GRAND TOTAL 731,781,051 21,814,941 1,040,657,905 33,891,562 1,270,866,272 45,331,386Source :Central Statistical Organization
20062005 HS SECTIONS 2004
146

YearsRe-ExportExportRe-ExportExportRe-ExportExportRe-ExportExportCountries35455818119319228236866478695102918660509436082152148909464174219Arab Countries33259928100446470185804037186302916381045335736201978375956027750GCC Countries223330964717917011096318296722351413797559632291848010512519506.87 U.A.E60178701975766058218041876625817002041611038879711215881801 Saudi Arabia28282896191571509417454945365244499191476490575229 Oman19417232360095588153332979007546793670196330 Qatar2884331528651405382239080274562109042262313226814106 Kuwait110107112582356445454602405341907325040777 Bahrain21958901887275851062441508800022794641003459517053358146470Other Arab Countries1817613719445337825884773644178014114606219742 Jordan
9841249898466514945793781970001577222478 Tunisia019326107994726574846147612395124400 Algeria
4009321964675190407161774340788614833243282531167332 Djibouti539986199774232200830660437811819070897210373057 Sudan106473714431262376717000705075581268428162346 Syria416837475766611977234385157173693455988226682451539 Somalia
98748422605641553488661185198261322252321268 Iraq417321616483312210771370132597518560940070 Lebanon5315714600624569518406549396133204 Libya4501935540724381969390340065444217195988146731155840 Egypt
0229030235702020800 Mauritania049103186861218870662608194 Morocco
284999000000 Palestine0140400
32545589104180462840302828457150819831623050652285566551067120 Asian Countries (Non Arabi)10809211324720776638425967605538169955211001474 Malaysia8717532974783267312855229111134494898303925 Pakistan
000000011183736 Philippine7545197705067434976532251172135594794157429277407 Singapore
0116739010356380260158034293 Sri Lanka4622619008378310378127592779133232181793020160978475 Thailand142695221529472334736773009021274204045941500967070788 Japan
2003
Appendix 17 (b)REPUBLIC'S EXPORTS AND RE-EXPORTS BY ECONOMIC BLOCK AND COUNTRIES FOR THE YEARS 2003 - 2006
(VALUE BY THOUSAND RIALS )20062004 2005
147
YearsRe-ExportExportRe-ExportExportRe-ExportExportRe-ExportExportCountries
17196231507394850931417388562076420997503835041468332082.51 India0600565108571093496685317611973760319598 Hong Kong
122670240232414419957464360029122412596451 Indonesia15801475641794361001178673984349966 Iran0626090564111141186559550 Bangladesh
2171372964013549535763780227208766321592633441998213295459 China109249607108113510127467115994056089 Taiwan157973385197076776752523318669241135651173236256813 South Korea610078653722108003512372799672753797325 Turkey
00000000 Myanmar17542555089001712003237 North Korea3953205079659948325009943500 Other Asian Countries
451790116696936751732404562126726223714871749607734287 African Countries (Non Arabi)13175153526725674859290180823342670203376 Eritrea3234922634392459412033427285872366948375799681 Ethiopia235437391312784410258450756019032134514 Kenya308913357128796817445241137003875 Tanzania
0326903421903168019295 Guinea002450190000517 Uganda080006987464377260493896220231321 Ghana00000000 Guinea-Bissau
2822478117018532881312158357209569991067706446596 South Africa003130200000 Nigeria00070290106823078099 Seychelles 000444401223404903 Madagascar0001500000 Central African Rep.00527573210386700 Senegal00000085810 Zimbabwe00000327709422 Congo Democratic01186970423850269402687 Gambia0445142746041401118514362200 Other African Countries
Appendix 17 (b)REPUBLIC'S EXPORTS AND RE-EXPORTS BY ECONOMIC BLOCK AND COUNTRIES FOR THE YEARS 2003 - 2006
(VALUE BY THOUSAND RIALS )2006200520042003
148

YearsRe-ExportExportRe-ExportExportRe-ExportExportRe-ExportExportCountries
3571741916227323045700679759917688156961535239158810511987 European Union698388768097341045493975054669972918801286330286711 United Kingdom10029762303415106195497040539327017016976894582 Germany476762341280117043235604328015631162225607332292 Belgium56606167603594293107099820469511058661218621828863 Italy4318558585308678876346792558495644404268091261996 France41461972025014521282288911195182578021610539 Spain946561779254029531610312255903095270 Greece7602881559137673554788865557763876233870 Netherlands717550352713837600000 Denmark
00000000 Ireland0663240806700544260119862 Portugal00000000 Luxembourg
331951914833043410072507124 Austria00000000 Estonia
483900171095614183404800 Sweden295004642061800 Finland000001646700 Latvia00000000 Lithuania00000001307 Slovenia0000 Malta069953040147044010011190 Poland00000000 Slovac00000007287 Hungary
2006
Appendix 17 (b)REPUBLIC'S EXPORTS AND RE-EXPORTS BY ECONOMIC BLOCK AND COUNTRIES FOR THE YEARS 2003 - 2006
(VALUE BY THOUSAND RIALS )
20042003 2005
149
YearsRe-ExportExportRe-ExportExportRe-ExportExportRe-ExportExport Countries
0220100002763847 Cyprus23150000000 Czech
000000166411817245 European Market Countries2331246902779236648856462439990435955811464411634873Other European Countries1542946895484236450656461689990434368511464411630617 Switzerland
00000000 Norway78836393198275001457900 Andorra
000009970 Gibraltar00000004256 Croatia0000020500 Macedonia00000000 Bosnia090200092 Iceland
75911140214229393166109144005037147011Eastern European Countries6868468100040000 Russian Federation11021041739431667930000 Ukraine
00000050370 Georgia00000000 Belarus0000000147011 Turkmenistan00000000 Kazakhistan00000000 Serbia00000000 Bulgaria
580229341554502984000 Romania0000 Estonia00000000 Albania0000000.000.00 Armenia
8537477409473481796434210044424052844812683800010925947 American Countries7910217406542477986834154092378431838939481768110834142 United States 249936113076802840596203190 Canada37090000000 Bolivia
00600000000 Venzuela337460000000 Brazil
2006
Appendix 17 (b)REPUBLIC'S EXPORTS AND RE-EXPORTS BY ECONOMIC BLOCK AND COUNTRIES FOR THE YEARS 2003 - 2006
(VALUE BY THOUSAND RIALS )2003 2004 2005
150

YearsRe-ExportExportRe-ExportExportRe-ExportExportRe-ExportExport Countries
00000000 Mexico0000020000 Chile00048780000 Panama00000000 Guatemala000001353300 Argentina01532021510002633 Cuba00000000 Ecuador0008260000 Honduras00000000 Peru00000000 Uraguay011518013449039346085848 Dominica
11905765183000300 Columbia159156507522946517216555703024 Other American Countries
446462124852402068919131549295618037979530100Astralia and Pasific (Oceanic)405669754604020432681187505320151530100 Australia
535493786601230993101271580300 New Zealand00000000 Tasmania00000000 Pacific Islands00084530000 Soloman Islands000002025 Vanuatu0005400000 Fiji 0133425775029560 Samoa
402580000000 Tuvalu04272587041651790399266302498978Ship Bunkers00083483109504360158145Aircraft Bunkers
440452194630010370761480131858623769Not Stated75960165264153602032810000Country of Difference origin.
4533339212708662723389156210406579052181494173178105125431277659476436 Grand TotalSource :Central Statistical Organization
2006
REPUBLIC'S EXPORTS AND RE-EXPORTS BY ECONOMIC BLOCK AND COUNTRIES FOR THE YEARS 2003 - 2006(VALUE BY THOUSAND RIALS )
200520042003
Appendix 17 (b)
151
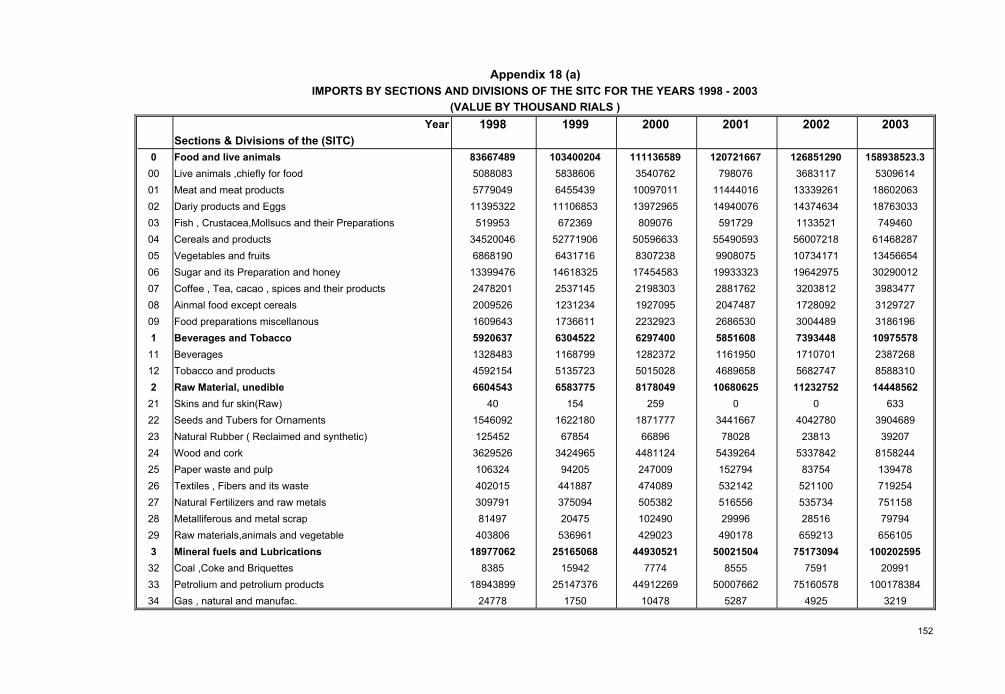
200320022001200019991998YearSections & Divisions of the (SITC)
158938523.312685129012072166711113658910340020483667489Food and live animals053096143683117798076354076258386065088083Live animals ,chiefly for food00
1860206313339261114440161009701164554395779049Meat and meat products01187630331437463414940076139729651110685311395322Dariy products and Eggs02
7494601133521591729809076672369519953Fish , Crustacea,Mollsucs and their Preparations03614682875600721855490593505966335277190634520046Cereals and products0413456654107341719908075830723864317166868190Vegetables and fruits05302900121964297519933323174545831461832513399476Sugar and its Preparation and honey 06398347732038122881762219830325371452478201Coffee , Tea, cacao , spices and their products07312972717280922047487192709512312342009526Ainmal food except cereals08318619630044892686530223292317366111609643Food preparations miscellanous09
1097557873934485851608629740063045225920637Beverages and Tobacco1238726817107011161950128237211687991328483Beverages11858831056827474689658501502851357234592154Tobacco and products12
144485621123275210680625817804965837756604543Raw Material, unedible26330025915440Skins and fur skin(Raw)21
390468940427803441667187177716221801546092Seeds and Tubers for Ornaments223920723813780286689667854125452Natural Rubber ( Reclaimed and synthetic)23
815824453378425439264448112434249653629526Wood and cork241394788375415279424700994205106324Paper waste and pulp25719254521100532142474089441887402015Textiles , Fibers and its waste26751158535734516556505382375094309791Natural Fertilizers and raw metals277979428516299961024902047581497Metalliferous and metal scrap28
656105659213490178429023536961403806Raw materials,animals and vegetable291002025957517309450021504449305212516506818977062Mineral fuels and Lubrications3
20991759185557774159428385Coal ,Coke and Briquettes321001783847516057850007662449122692514737618943899Petrolium and petrolium products33
32194925528710478175024778Gas , natural and manufac.34
Appendix 18 (a)IMPORTS BY SECTIONS AND DIVISIONS OF THE SITC FOR THE YEARS 1998 - 2003
(VALUE BY THOUSAND RIALS )
152

200320022001200019991998YearSections & Divisions of the (SITC)
1277489792006368061785146120811043504411274045ANIMAL AND VEGETABLE OILS AND FATS4173202078649634470ANIMAL OILS AND A FATS41
111031688690432732789613553586948267511139682VEGETABLE OILS AND FATS 4216699965102047131031057999952335133893ANIMAL AND VEGETABLE OILS & FATS &WAX MANUFAC43
529320304444952638378518364067672912337628690140CHEMICAL AND RELATED PRODUCTS51485730115753912594111187047911608905309ORGANIC CHEMICAL PRODUCTS51242268321429811885206219624818217931864331IN - ORGANIC CHEMICAL PRODUCTS52234604119170421801336132605510961501069087DYING , TANNING AND COLOURING MATERIALS53
220247061828236714980064124823231167702912058455MEDICAL AND PHARMACEUTICAL54592776546560084046889402828030264392785675PERFUME MATERIALS TOILET POLISHING AND CLEANIN551197533121340414354991187848948789542056FERTILIZERS , MANUFACTURED 56231175252736273822520162328518136865PYROTE CHMIC ARTICLES (EG. FIRE WORKS) 57
953063984903167917821755266260074325225349PLASTIC MATERIALS AND MANUFACTURED CELLULOSE58776575863371334778470592614233056184103013ARTICLES AND CHEMICAL PRODUCTS N.E.S.59
1083859657763673366828437551902044784813250936859MANUFACTURED GOODS CLASSIFIED BY MATERIAL647331773984301987908146752215051SKINS TANNED AND LEATHER PRODUCTS N.E.S.61
646318755465474486486458578941731154549902RUBBER , MANUFACTURES N.E.S.62454450439655993063016196045612838442527001WOOD AND CORK MANUFACTURED THEREOF63
13861095922660910146603877728568430526600744PAPER &PAPERBOARD AND MANUFACTURES THEREOF64923605776012306434063538765354776075181644TEXTILE YARN , FABRICS AND MADE-UP ARTICLES N.E.65
207006761088566010166944772166459272395987558NON-METALIC MINERAL MANUFACTURES N.E.S.66315588562301816220750023161937571497820715738057NON-METALIC MINERAL MANUFACTURES IRON AND STE67711422356270264447994369459433260183555825NON-METALIC MINERAL MANUFACTURES NON-FERROU68
14860035116885027290289678109856922986581077MANUFACTURES OF METALS N.E.S.69
(VALUE BY THOUSAND RIALS )IMPORTS BY SECTIONS AND DIVISIONS OF THE SITC FOR THE YEARS 1998 - 2003
Appendix 18 (a)
153

200320022001200019991998YearSections & Divisions of the (SITC)
177938681.113483545795243518783320246725094871356983MACHINERY AND TRANSPORT EQUIPMENT717590173118266088455392646559557727108993008POWER GENERATING MACHINERY AND EQUIPMENT71
353105322844166319419789141935181647431113620108MACHINERY AND TRANSPORT EQUIPMENT 72
4086711218606374962243119382313339462Trade With Economic Blocs and Countries 2002 Quantity in ( 733506749019938172130590509777409956693310366774GENERAL INDUSTRIES MACHINERY AND EQUIPMENT N74
233263231593722144393136576118372062096233OFFICE MACHINES AND AUTOMATIC DATA PROCESSING EQUIPMENT75
13959708111279336650693331184848206905242308TELECOMMUNICATION AND RECORDING APPARATUS76310396462530982914849851136434921213392713230658ELECTRICAL MACHINERY APPARATUS AND EQUIPMENT77320913972937004229637646280711411495966514473458ROAD VEHICLES 78101384334443232651742126014113031932994974OTHER TRANSPORT EQUIPMENT79371522722599986019517133168833001652465015541670MISCELLANOUS MANUFACTURED ARTICLES8
783969596763435834584670539876527190SANITARY ,PLUMBING ,HEATING AND FIXTURCFITTINGS81442172420396391481062131810912982491166477FURNITURE AND PARTS THEREOF82
380446239446150808152623145269121307TRAVEL GOODS, SHOPPING BAGS,HAND-BAGS AND SIMILAR CONTAINERS83
671897367551264118833322008128790113516288ARTICLES OF APPAREL CLOTHING ACCESSORIES84333458426167961221900118575910990171514606 FOOTWEARS85
669161347691934456061326476344417623278824PROFESSIONAL SCIENTIFIC AND CONTROLLING INSTUMENTS AND APPARATUS87
850816788994450688418548671688614210PHOTOGRAPHIC APPARATES , EQUIPMENT AND SUPPLIES,OPTICAL AND WATCHES88
1397014781939037201947673874754497784802768MISCELLANEOUS MANUFACTURAL ARTICLES N.E.S.8937918825287159424038159881136921540320COMMODITIES AND TRANSACTIONS937918825287159424038159881136921540320COMMODITIES N.E.S
674128291513025667415899035375782923312749411294509748GRAND TOTALSource :Central Statistical Organization
(VALUE BY THOUSAND RIALS )
Appendix 18 (a)IMPORTS BY SECTIONS AND DIVISIONS OF THE SITC FOR THE YEARS 1998 - 2003
154
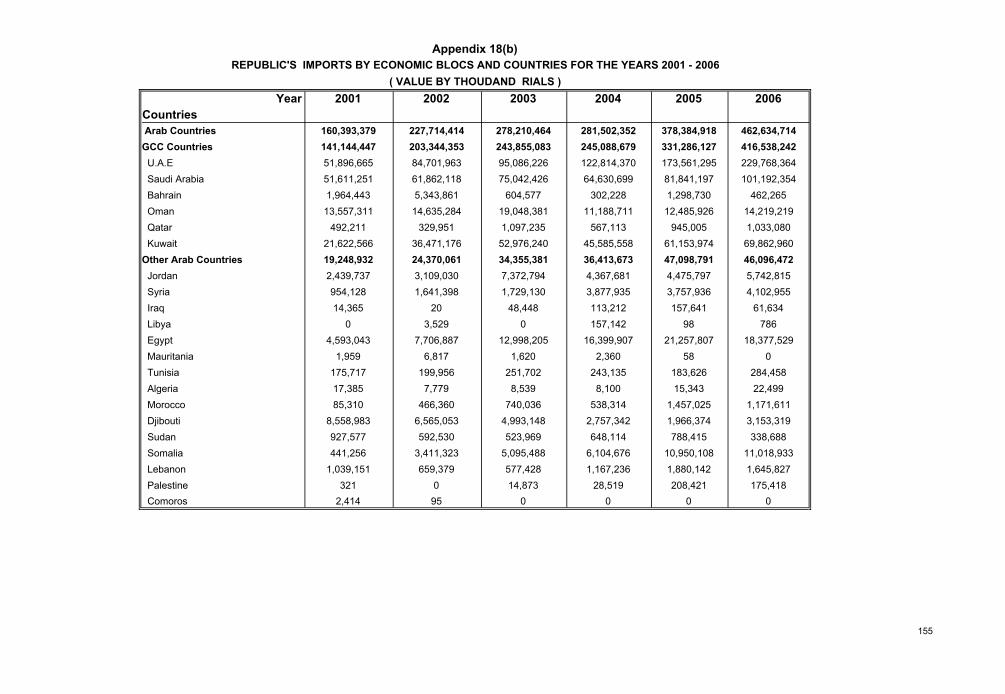
200620052004200320022001 YearCountries
462,634,714378,384,918281,502,352278,210,464227,714,414160,393,379 Arab Countries416,538,242331,286,127245,088,679243,855,083203,344,353141,144,447GCC Countries229,768,364173,561,295122,814,37095,086,22684,701,96351,896,665 U.A.E101,192,35481,841,19764,630,69975,042,42661,862,11851,611,251 Saudi Arabia
462,2651,298,730302,228604,5775,343,8611,964,443 Bahrain14,219,21912,485,92611,188,71119,048,38114,635,28413,557,311 Oman1,033,080945,005567,1131,097,235329,951492,211 Qatar69,862,96061,153,97445,585,55852,976,24036,471,17621,622,566 Kuwait46,096,47247,098,79136,413,67334,355,38124,370,06119,248,932Other Arab Countries5,742,8154,475,7974,367,6817,372,7943,109,0302,439,737 Jordan4,102,9553,757,9363,877,9351,729,1301,641,398954,128 Syria
61,634157,641113,21248,4482014,365 Iraq78698157,14203,5290 Libya
18,377,52921,257,80716,399,90712,998,2057,706,8874,593,043 Egypt0582,3601,6206,8171,959 Mauritania
284,458183,626243,135251,702199,956175,717 Tunisia22,49915,3438,1008,5397,77917,385 Algeria
1,171,6111,457,025538,314740,036466,36085,310 Morocco3,153,3191,966,3742,757,3424,993,1486,565,0538,558,983 Djibouti338,688788,415648,114523,969592,530927,577 Sudan
11,018,93310,950,1086,104,6765,095,4883,411,323441,256 Somalia1,645,8271,880,1421,167,236577,428659,3791,039,151 Lebanon175,418208,42128,51914,8730321 Palestine
0000952,414 Comoros
Appendix 18(b)REPUBLIC'S IMPORTS BY ECONOMIC BLOCS AND COUNTRIES FOR THE YEARS 2001 - 2006
( VALUE BY THOUDAND RIALS )
155
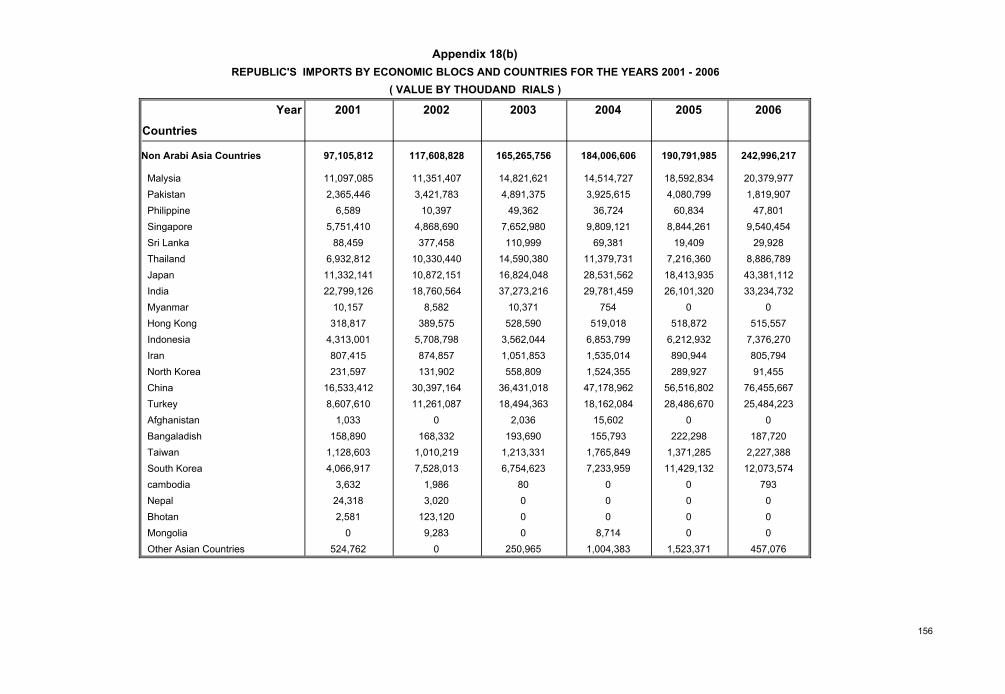
200620052004200320022001 Year
Countries
242,996,217190,791,985184,006,606165,265,756117,608,82897,105,812Non Arabi Asia Countries
20,379,97718,592,83414,514,72714,821,62111,351,40711,097,085 Malysia1,819,9074,080,7993,925,6154,891,3753,421,7832,365,446 Pakistan
47,80160,83436,72449,36210,3976,589 Philippine9,540,4548,844,2619,809,1217,652,9804,868,6905,751,410 Singapore
29,92819,40969,381110,999377,45888,459 Sri Lanka8,886,7897,216,36011,379,73114,590,38010,330,4406,932,812 Thailand43,381,11218,413,93528,531,56216,824,04810,872,15111,332,141 Japan33,234,73226,101,32029,781,45937,273,21618,760,56422,799,126 India
0075410,3718,58210,157 Myanmar515,557518,872519,018528,590389,575318,817 Hong Kong
7,376,2706,212,9326,853,7993,562,0445,708,7984,313,001 Indonesia805,794890,9441,535,0141,051,853874,857807,415 Iran91,455289,9271,524,355558,809131,902231,597 North Korea
76,455,66756,516,80247,178,96236,431,01830,397,16416,533,412 China25,484,22328,486,67018,162,08418,494,36311,261,0878,607,610 Turkey
0015,6022,03601,033 Afghanistan187,720222,298155,793193,690168,332158,890 Bangaladish
2,227,3881,371,2851,765,8491,213,3311,010,2191,128,603 Taiwan12,073,57411,429,1327,233,9596,754,6237,528,0134,066,917 South Korea
79300801,9863,632 cambodia00003,02024,318 Nepal0000123,1202,581 Bhotan008,71409,2830 Mongolia
457,0761,523,3711,004,383250,9650524,762 Other Asian Countries
Appendix 18(b)REPUBLIC'S IMPORTS BY ECONOMIC BLOCS AND COUNTRIES FOR THE YEARS 2001 - 2006
( VALUE BY THOUDAND RIALS )
156
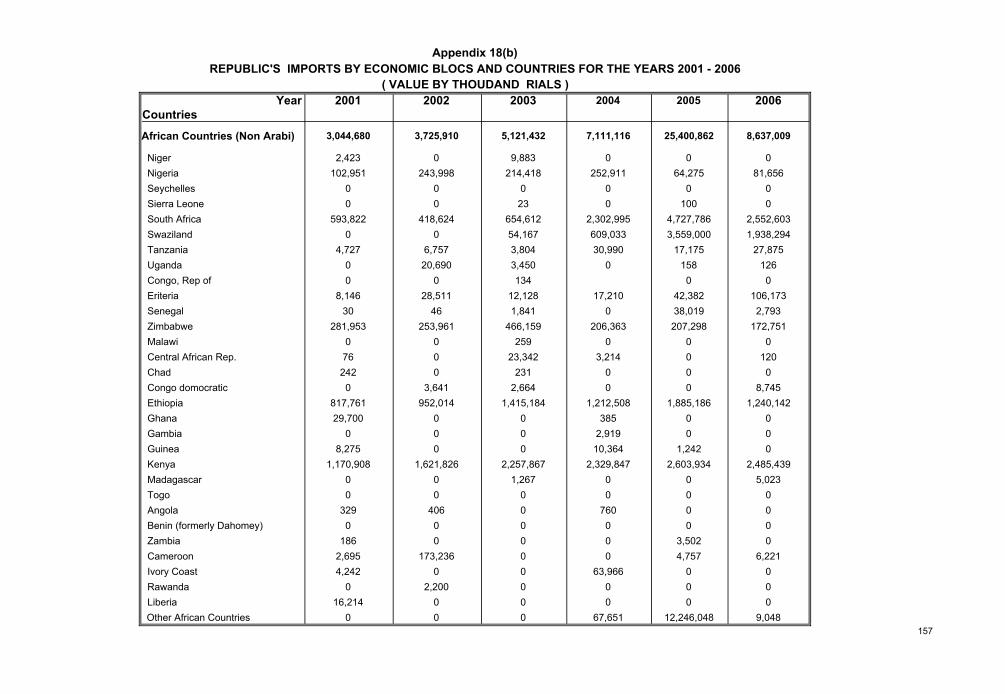
200620052004200320022001 YearCountries
8,637,00925,400,8627,111,1165,121,4323,725,9103,044,680African Countries (Non Arabi)
0009,88302,423 Niger81,65664,275252,911214,418243,998102,951 Nigeria
000000 Seychelles 010002300 Sierra Leone
2,552,6034,727,7862,302,995654,612418,624593,822 South Africa1,938,2943,559,000609,03354,16700 Swaziland
27,87517,17530,9903,8046,7574,727 Tanzania12615803,45020,6900 Uganda0013400 Congo, Rep of
106,17342,38217,21012,12828,5118,146 Eriteria2,79338,01901,8414630 Senegal
172,751207,298206,363466,159253,961281,953 Zimbabwe00025900 Malawi
12003,21423,342076 Central African Rep.0002310242 Chad
8,745002,6643,6410 Congo domocratic1,240,1421,885,1861,212,5081,415,184952,014817,761 Ethiopia
003850029,700 Ghana002,919000 Gambia01,24210,364008,275 Guinea
2,485,4392,603,9342,329,8472,257,8671,621,8261,170,908 Kenya5,023001,26700 Madagascar
000000 Togo 007600406329 Angola000000 Benin (formerly Dahomey)03,502000186 Zambia
6,2214,75700173,2362,695 Cameroon0063,966004,242 Ivory Coast00002,2000 Rawanda0000016,214 Liberia
9,04812,246,04867,651000 Other African Countries
REPUBLIC'S IMPORTS BY ECONOMIC BLOCS AND COUNTRIES FOR THE YEARS 2001 - 2006( VALUE BY THOUDAND RIALS )
Appendix 18(b)
157
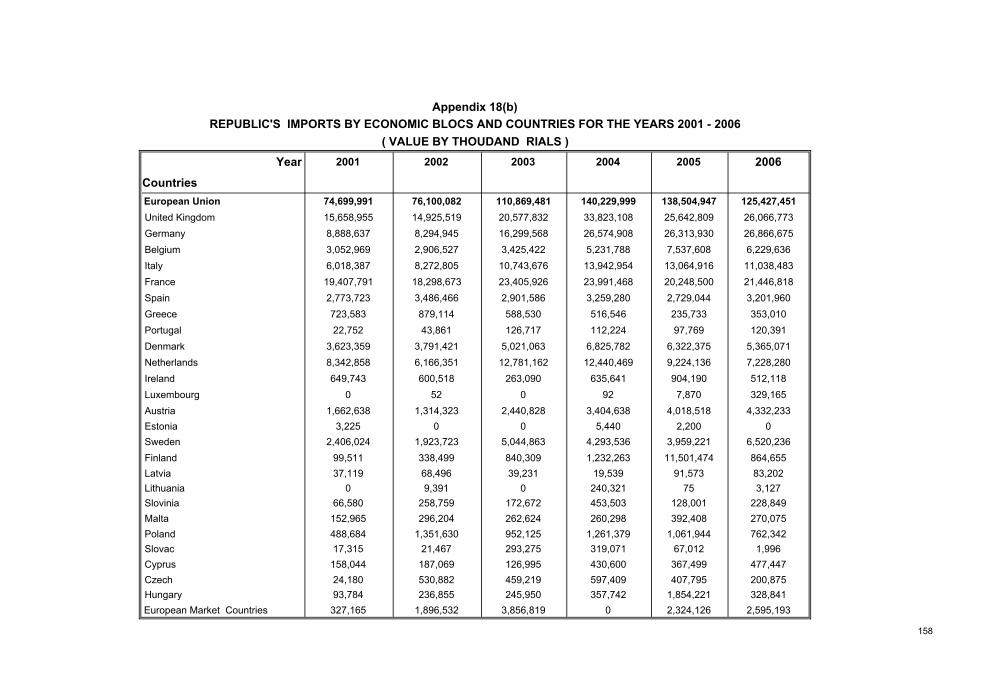
200620052004200320022001 Year
Countries 125,427,451138,504,947140,229,999110,869,48176,100,08274,699,991 European Union26,066,77325,642,80933,823,10820,577,83214,925,51915,658,955 United Kingdom26,866,67526,313,93026,574,90816,299,5688,294,9458,888,637 Germany6,229,6367,537,6085,231,7883,425,4222,906,5273,052,969 Belgium11,038,48313,064,91613,942,95410,743,6768,272,8056,018,387 Italy21,446,81820,248,50023,991,46823,405,92618,298,67319,407,791 France3,201,9602,729,0443,259,2802,901,5863,486,4662,773,723 Spain353,010235,733516,546588,530879,114723,583 Greece120,39197,769112,224126,71743,86122,752 Portugal
5,365,0716,322,3756,825,7825,021,0633,791,4213,623,359 Denmark7,228,2809,224,13612,440,46912,781,1626,166,3518,342,858 Netherlands512,118904,190635,641263,090600,518649,743 Ireland329,1657,870920520 Luxembourg
4,332,2334,018,5183,404,6382,440,8281,314,3231,662,638 Austria02,2005,440003,225 Estonia
6,520,2363,959,2214,293,5365,044,8631,923,7232,406,024 Sweden864,65511,501,4741,232,263840,309338,49999,511 Finland83,20291,57319,53939,23168,49637,119 Latvia3,12775240,32109,3910 Lithuania
228,849128,001453,503172,672258,75966,580 Slovinia270,075392,408260,298262,624296,204152,965 Malta762,3421,061,9441,261,379952,1251,351,630488,684 Poland1,99667,012319,071293,27521,46717,315 Slovac
477,447367,499430,600126,995187,069158,044 Cyprus200,875407,795597,409459,219530,88224,180 Czech328,8411,854,221357,742245,950236,85593,784 Hungary
2,595,1932,324,12603,856,8191,896,532327,165 European Market Countries
REPUBLIC'S IMPORTS BY ECONOMIC BLOCS AND COUNTRIES FOR THE YEARS 2001 - 2006( VALUE BY THOUDAND RIALS )
Appendix 18(b)
158

200620052004200320022001 Year
Countries 96,082,21479,280,23128,934,80527,922,72222,178,1228,198,455Other European Countries
487,771264,640200,37979,14520,98535,651 Norway4,50147,76122,38850,5308,37522,357 Croatia
0107,20811,621542,03400 Bosnia042,78125,516000 Yugoslavia (form.)02,77331,81007,0380 Albania
422,239171,38250,779000 Andorra0030,731000 Fatican City
36,31523,4881,059000 Iceland117046,592000 Liechtensten
94,972,90378,618,75128,513,93027,251,01322,141,7248,140,447 Switzerland158,3681,4470000 Other Est .Eur. Count.
4,520,98512,210,1318,319,6152,396,2261,426,120688,034 Eastern European Countries379,3127,590,6823,251,1111,598,309470,066244,063 Russian Fedration
2,204,8272,263,6924,445,941366,959383,745158,189 Ukraine035,476038,9180580 Georgia00052,3560643 Tajikistan000000 Turkmenistan
REPUBLIC'S IMPORTS BY ECONOMIC BLOCS AND COUNTRIES FOR THE YEARS 2001 - 2006( VALUE BY THOUDAND RIALS )
Appendix 18(b)
159
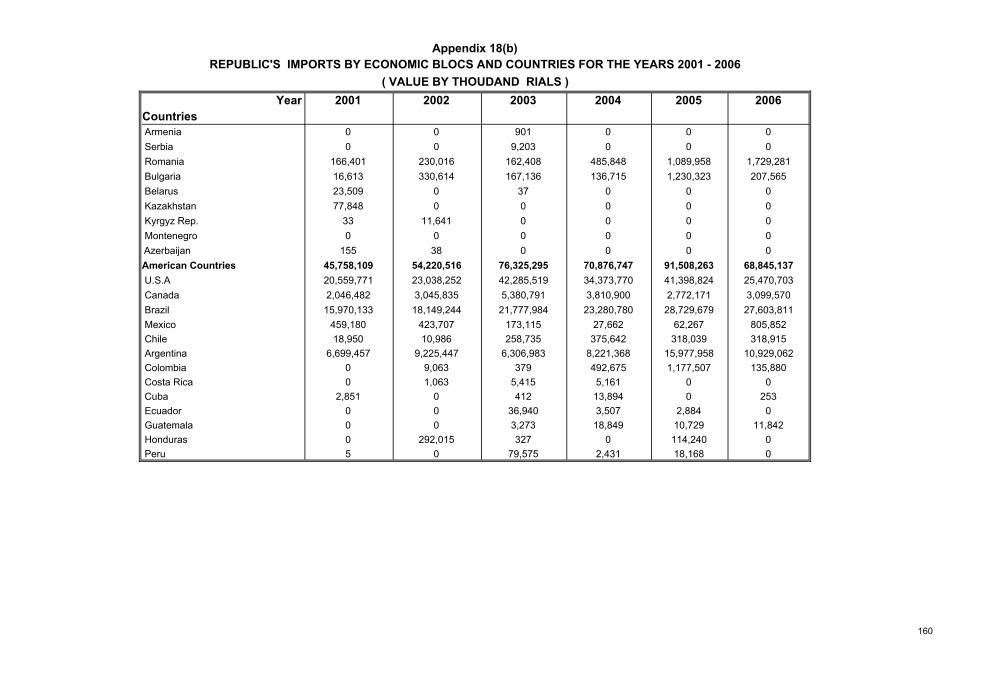
200620052004200320022001 YearCountries
00090100 Armenia0009,20300 Serbia
1,729,2811,089,958485,848162,408230,016166,401 Romania207,5651,230,323136,715167,136330,61416,613 Bulgaria
00037023,509 Belarus0000077,848 Kazakhstan000011,64133 Kyrgyz Rep.000000 Montenegro000038155 Azerbaijan
68,845,13791,508,26370,876,74776,325,29554,220,51645,758,109American Countries25,470,70341,398,82434,373,77042,285,51923,038,25220,559,771 U.S.A3,099,5702,772,1713,810,9005,380,7913,045,8352,046,482 Canada27,603,81128,729,67923,280,78021,777,98418,149,24415,970,133 Brazil
805,85262,26727,662173,115423,707459,180 Mexico318,915318,039375,642258,73510,98618,950 Chile
10,929,06215,977,9588,221,3686,306,9839,225,4476,699,457 Argentina135,8801,177,507492,6753799,0630 Colombia
005,1615,4151,0630 Costa Rica253013,89441202,851 Cuba02,8843,50736,94000 Ecuador
11,84210,72918,8493,27300 Guatemala0114,2400327292,0150 Honduras018,1682,43179,57505 Peru
( VALUE BY THOUDAND RIALS )
Appendix 18(b)REPUBLIC'S IMPORTS BY ECONOMIC BLOCS AND COUNTRIES FOR THE YEARS 2001 - 2006
160
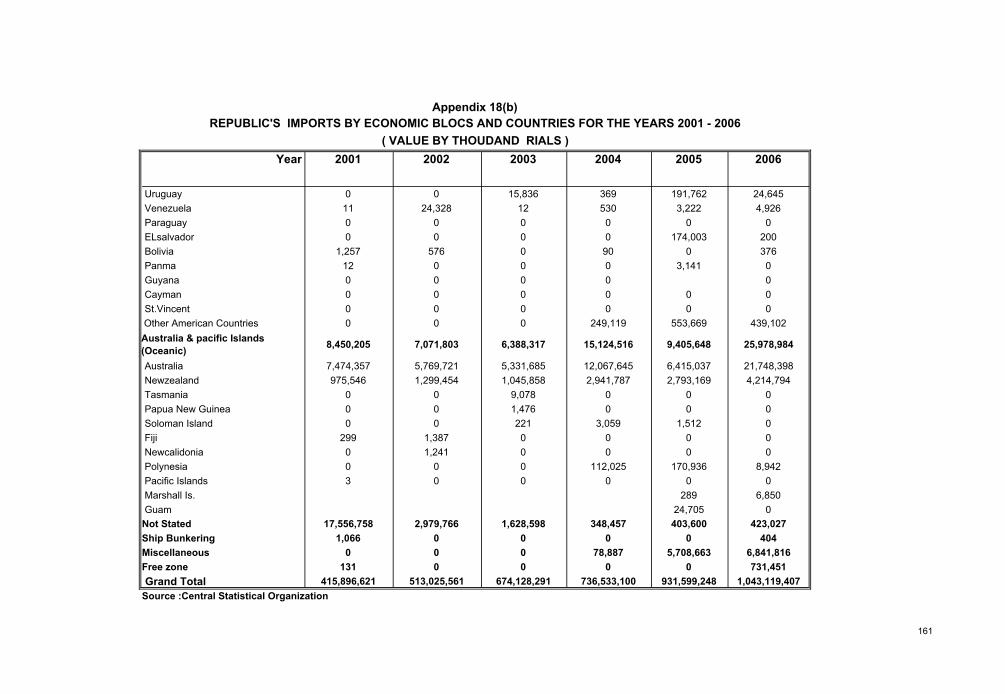
200620052004200320022001 Year
24,645191,76236915,83600 Uruguay4,9263,2225301224,32811 Venezuela
000000 Paraguay200174,0030000 ELsalvador37609005761,257 Bolivia03,14100012 Panma00000 Guyana000000 Cayman000000 St.Vincent
439,102553,669249,119000 Other American Countries
25,978,9849,405,64815,124,5166,388,3177,071,8038,450,205Australia & pacific Islands (Oceanic)
21,748,3986,415,03712,067,6455,331,6855,769,7217,474,357 Australia4,214,7942,793,1692,941,7871,045,8581,299,454975,546 Newzealand
0009,07800 Tasmania0001,47600 Papua New Guinea01,5123,05922100 Soloman Island00001,387299 Fiji 00001,2410 Newcalidonia
8,942170,936112,025000 Polynesia000003 Pacific Islands
6,850289 Marshall Is.024,705 Guam
423,027403,600348,4571,628,5982,979,76617,556,758Not Stated40400001,066Ship Bunkering
6,841,8165,708,66378,887000Miscellaneous731,4510000131Free zone
1,043,119,407931,599,248736,533,100674,128,291513,025,561415,896,621 Grand TotalSource :Central Statistical Organization
( VALUE BY THOUDAND RIALS )
Appendix 18(b)REPUBLIC'S IMPORTS BY ECONOMIC BLOCS AND COUNTRIES FOR THE YEARS 2001 - 2006
161