annual report - wolters kluwer · solutions that engage clinicians, patients, researchers, and the...
TRANSCRIPT

2018 Annual Report2019Annual Report

4 5Wolters Kluwer 2019 Annual Report Wolters Kluwer 2019 Annual Report
Table of Contents | Consolidated Financial Statements | Company Financial Statements
6Message from the CEO
12Report of the Executive Board 12 Improving Lives Today and for the Future 20 Transformative Innovations 23 Embracing People and Society 30 Our Organization 32 Key Figures 34 Operational and Financial Review 45 2020 Full-Year Outlook
89Notes to the Consolidated Financial Statements
8Wolters Kluwer at a Glance in 2019
10Value Creation Model
82Consolidated Financial Statements
46 Corporate Governance and Risk Management 46 Corporate Governance 51 Risk Management 61 Statements by the Executive Board 62 Executive Board and Supervisory Board
178 Company Financial Statements
180 Notes to the Company Financial Statements
64 Report of the Supervisory Board 64 Supervisory Board Report 68 Remuneration Report
187 Other Information on the Financial Statements 187 Independent Auditor’s Report 194 Articles of Association Provisions Governing Profit Appropriation
195 Other Information 195 Report of the Wolters Kluwer Preference Shares Foundation 196 Wolters Kluwer Shares and Bonds 204 Five-Year Key Figures 206 Glossary 207 Contact Information
Table of Contents 2019 Financial Statements

6 7Wolters Kluwer 2019 Annual Report Wolters Kluwer 2019 Annual Report
Table of Contents | Consolidated Financial Statements | Company Financial Statements
Message from the CEO It was a year in which we made significant progress on improving systems and infrastructure to support operational agility. Scaling our expert solutions and adding value to our information products will provide a strong foundation for 2020. We are committed to creating value for our customers, employees, investors, and society, as reflected in our 2019 performance. Our ability to deliver sustainable returns year-after-year illustrates a central aspect of our strategy to enable customers to navigate change. Through our efforts, we are actively shaping the future of work, both within the organizations we serve – via our expert solutions that embed advanced technologies like artificial intelligence – and within our walls at Wolters Kluwer. Our advantage in the markets we operate in, is our ability to combine domain expertise and advanced technology, which maximizes local knowledge within global platforms to provide our customers with solutions.
Grow further as an expert solutions companyOur three-year strategy, Accelerating Our Value, is our roadmap to make deep impact. I’m confident we’re up to the challenge at the start of a new decade. 2019 focused on laying the groundwork to grow our expert solutions, advance our deep domain expertise, and drive operational agility, including the roll out of a new global HR platform. We stepped up investment in our digital information products, such as Ovid and our European legal research solutions, to enhance their content, functionality, and user interface and to add capabilities that leverage artificial intelligence. Investors have recognized our successful
approach to capital allocation, enabling the right levels of investment to keep our current products healthy, while working hard to innovate and launch new products and services. This success has helped fuel the expansion of our dividend and share buyback program in 2019.
Our transformation around expert solutions brings domain expertise together with technology, which comes to life in solutions like UpToDate Advanced, CCH Axcess iQ, OneSumX, and Enablon – some of our most cutting-edge products on the market. Working side-by-side with our customers, furthering our deep domain expertise, and a steadfast approach to innovation is how we intend to create long-term value for all our stakeholders.
Creating an even better place to work The diversity of our teams is the solid foundation on which we can deliver sustained value; it is a driver of innovation and results within Wolters Kluwer. I am constantly inspired by the amount of employee engagement our teams generate every day, as reflected in our increasing engagement score, which is above the norm for high-performing companies. External recognition like 2019 Forbes America’s Best Employer for Women and America’s Best Employers for Diversity validates our efforts to continue fostering an inclusive company culture where we attract, develop, and retain high-performing, productive, and diverse talent.
Commitment to society at largeWe are guided by the principles of the United Nations Global Compact and acknowledge the importance of the Sustainable Development Goals (SDGs) that the United Nations has set for 2030. With millions of customers and thousands of employees around the world, our commitment to the SDGs is brought to life through our efforts to make impact every day. In 2019, we continued to be included in leading sustainability rankings, such as FTSE4Good, STOXX Europe Sustainability, and EURO STOXX ESG Leaders 50, which we are proud of and reflects that commitment.
In the midst of an ever more complex landscape across the globe, I am confident that our mission will continue to fuel our organization. We will charge ahead to make progress in the future, grounded in our commitments to our stakeholders, while staying in lockstep with our customers.
Thank you to our shareholders, customers, partners, and employees, who play an integral role in enabling our organization to deliver impact. We wouldn’t be able to advance without the trust that you all continue to invest in our organization.
Nancy McKinstryCEO and Chairman of the Executive Board Wolters Kluwer
I am pleased to report that we sustained 4% organic revenue growth in 2019. We delivered an improvement in adjusted operating profit margin, overcoming a challenging comparable. Digital & services grew 6% organically, representing 89% of total revenues. Recurring revenues accounted for 78% of total revenues and grew 5% organically.
Digital & services Recurring revenues
89% of total revenues, up 6% organically 78%
of total revenues, up 5% organically

8 9Wolters Kluwer 2019 Annual Report Wolters Kluwer 2019 Annual Report
Table of Contents | Consolidated Financial Statements | Company Financial Statements
19,000employees worldwide
100%of major data center suppliers certified according to ISO/IEC 27001
8%-10%of total revenues invested in new and enhanced products
99%of our employees completed the Annual Compliance Training
260suppliers committed to our Supplier Code of Conduct or equivalent standard
Serving customers in
180+countries. Operations in 40+ countries
Diversity
A rich
183-YEARheritage of strong values, deep domain knowledge, innovation, and a continuous focus on the customer
50% 43% 75%
Digital & services
of total revenues, up 6% organically
Our
PORTFOLIOincludes: UpToDate, Sentri7, TeamMate, CCH Axcess, CT Corporation, OneSumX, Enablon, and eVision
Wolters Kluwer at a Glance in 2019
2019 Financial highlightsTransformation
11.8%
€807 23.6%
4.3% 78%
€4.6
female Executive Board
female Supervisory Board
female division CEOs
89%
In 2019, the share price increased 26%€
billion revenues
recurring revenues,up 5% organically
adjusted operating profit margin
organic revenue growth
return on invested capital
million adjusted free cash flow
services
2003 2014 2016 2019
digital
expertsolutions
20172015 201920182016
70
60
50
40
30
20
10
Wolters Kluwer AEX (rebased) EURO STOXX Media (rebased) MSCI Europe Commercial & Professional Services (rebased)

10 11Wolters Kluwer 2019 Annual Report Wolters Kluwer 2019 Annual Report
Table of Contents | Consolidated Financial Statements | Company Financial Statements
• Efforts and skills of 19,000 employees
• €4.6bn revenues in professional information, software solutions, and services
• Enabling efficient, effective, and accurate decision-making
• 78% recurring
• €195m income tax paid• Protect people's health and prosperity and contribute to a safe and just society
• Community efforts
Human Talent
Financial Capital
Technology & Intellectual Property
Business Partners
Natural Resources
• €2.4bn equity• €3.1bn gross debt
• Total shareholder return 28% over 2019
• €46m net interest paid to financial credit institutions
• €1.9bn in compensation• Developing skills, talent, and careers
• Promoting diversity
Customers
Employees
Investors
Society
• Global brand• Software and content IP
• Actively selected and managed suppliers
• Energy and water consumption at our offices and data centers
Our valuesOur purpose
Focus on customer success
Make it better
Aim high and deliver
Win as a team
Deliver deep impact when it matters most
Value Creation Model
Resources Business activities Impact
Enriching & Fostering Strong Brand
Smart Capital Allocation
Talent Management
Digital Innovation
Operational Excellence
Good Governance
Customer Retention
Innovation-Driven Sustainability
GrowExpert Solutions
AdvanceDeep Domain Expertise
DriveOperational Agility
Table of contents | Consolidated Financial Statements | Company Financial Statements

12 13Wolters Kluwer 2019 Annual Report Wolters Kluwer 2019 Annual Report
Table of Contents | Consolidated Financial Statements | Company Financial Statements
Above all, our expert solutions are tailored to address and navigate change.
Providing knowledge in decisive moments
Wolters Kluwer is a global provider of professional information, software solutions, and services for clinicians, nurses, accountants, lawyers, and tax, finance, audit, risk, compliance, and regulatory sectors. Our customers work in industries which impact the lives of millions of people every single day. Our range of expert solutions combine deep domain knowledge with advanced technology and services. They are all designed to assist and augment our customers’ work on a daily basis. Our priority is to provide timely, actionable insights in an end-to-end digital environment that empowers customers to make informed decisions and deliver impact when it matters most.
Wolters Kluwer has delivered on its commitment to help professionals solve complex problems for the better part of the last two centuries. This is reflected through our market-leading expert solutions which are employed across 90% of U.S. academic medical centers, 100% of the top 100 global law firms, 93% of Fortune 500 companies, 100% of the top U.S. accounting firms, and 90% of the world’s top banks.
Our commitment to innovating our solutions through advanced technology allows us to address tomorrow’s challenges head on. Core assumptions about how we work and what work means for professionals are currently undergoing massive changes. The expectation that advanced technologies, such as artificial intelligence, play a part in every facet of our lives has led to a move
from static to dynamic information. At Wolters Kluwer, we employ technology to engineer highly intelligent and responsive workflows in the workplace, providing even greater value to our customers.
The rise of the gig economy also presents a natural market for our efficiency-enhancing and cost-cutting expert solutions. As our customers are under pressure to do more work in less time, it’s more important than ever for them to ensure a consistent and reliable exchange of information. Data privacy rights and consumer protection are also topics which increasingly occupy our customers’ time and resources.
These changes are driven by a workforce that expects convenient, relevant, and responsive experiences, thanks to our increasingly connected lives. We endeavor to be a trusted partner, working side-by-side with professionals to help them realize their potential while future-proofing their professions.
Expert insights
Our in-house innovation labs and our central technology organization employ advanced technologies to extract actionable insights from data. We work with our teams of industry experts to integrate these insights into seamless digital experiences for our customers for specific areas of interest.
HealthProviding trusted clinical technology and evidence-based solutions that engage clinicians, patients, researchers, and the next generation of healthcare providers in effective decision-making and outcomes across healthcare. We specialize in clinical effectiveness, learning, research, compliance, and data solutions.
Tax and accountingEnabling tax and accounting professionals and businesses of all sizes to boost productivity, navigate change, and deliver better outcomes. With workflows optimized by technology and guided by deep domain expertise, we help organizations grow, manage, and protect their businesses as well as their client’s businesses.
Finance Our solutions for regulated financial departments and institutions help customers meet their obligations to external regulators. We specialize in unifying and optimizing processes to deliver a real-time, accurate view of any organization’s financial position.
LegalServing legal professionals in law firms, general counsel offices, and corporate legal departments with data-driven decision-making tools. We streamline legal and regulatory research, analysis, and workflows to drive value to organizations, ensuring more transparent, just, and safe societies across the globe.
ComplianceWe help organizations ensure adherence with ever-changing regulatory obligations, at the same time managing risk, increasing efficiency, and producing better business outcomes.
Completion of the first year of Accelerating Our Value strategy
89% of Wolters Kluwer’s product offering is digital & services and 78% of our total revenues are recurring. 16 years ago, 31% of the company’s products and services were digital. The increasing rate at which customers were barraged with complex information – lawyers, doctors, accountants, and financial professionals alike – constituted a critical pain point which needed to be addressed.
Our 2019-2021 Accelerating Our Value strategy drives our day-to-day operations and consists of three pillars. These pillars reflect our strategic priorities and form the foundation for executing our strategy across our portfolio.
Grow expert solutions• Drive global scale and expand leading positions;• Extend into adjacencies; and• Develop strategic partnerships.
Advance deep domain knowledge • Enrich domain expertise with advanced technologies
and deliver actionable intelligence into the customer workflow;
• Enhance the customer experience through differentiated user interfaces; and
• Continue to invest eight to ten percent of revenues in new and enhanced products.
Drive operational agility• Leverage global brand and strengthen go-to-market;• Enhance back-office systems, infrastructure, and digital
platforms; and• Attract and develop talent.
Improving Lives Today and for the Future
of our revenues come from expert solutions
Transformation towards an expert solutions company
services
2003 2014 2016 2019
digital
expertsolutions
Report of the Executive Board
50%

14 15Wolters Kluwer 2019 Annual Report Wolters Kluwer 2019 Annual Report
Table of Contents | Consolidated Financial Statements | Company Financial Statements
In 2019, we have completed the first year of our three-year strategy centered around Accelerating Our Value:• Grow expert solutions: We will focus on scaling our expert
solutions by extending these offerings and broadening their distribution through existing and new channels, including strategic partnerships. We will invest to build or acquire positions in adjacent market segments;
• Advance domain expertise: We intend to continue transforming our information products and services by enriching their domain content with advanced technologies to deliver actionable intelligence and deeper integration into customer workflows. We will invest to enhance the user experience of these products through user-centric design and differentiated interfaces; and
• Drive operational agility: We plan to strengthen our global brand, go-to-market, and digital marketing capabilities to support organic growth. We will invest to upgrade our back-office systems and IT infrastructure. By 2021, we expect to complete the modernization of our Human Resources technology to support our efforts to attract and nurture talent.
In the first year of this plan, we made progress on several fronts. We sustained investment in our expert solutions, extending the global reach of products, such as UpToDate, TeamMate, CCH Tagetik, OneSumX, and Enablon, and working to strengthen key distribution partnerships. We extended into the selected adjacencies of contract lifecycle management and barrier-based risk management with the acquisitions of CLM Matrix in May 2019 and CGE Risk Management in February 2020. We divested certain small assets that no longer fit our long-term strategic direction. We stepped up investment in our digital information products, such as Ovid and our European legal research solutions, to enhance their content, functionality, and user interface and to add capabilities that leverage artificial intelligence. We made significant progress on several key
initiatives to drive operational agility: in 2019, we rolled out a new global HR technology platform, greatly improving our ability to attract, retain, and develop talent. We accelerated ongoing investments and programs designed to keep data and systems secure. We made progress on extending the use of standardized technology platforms and components.
In 2020, we will continue to focus on growing our expert solutions, advancing our deep domain expertise, and driving operational agility to further grow our leading market positions and customer relationships.
Driving long-term value creation
We are serving the long-term interests of all our key stakeholders to make sure we make a deep impact with each of them and contribute to shaping a better future for society at large. Our value creation model is at the core of everything we do and guides our work on a day-to-day basis. It shows how our organizational business model uses resources kindly and efficiently as input for our business activities supporting our strategy. The impact of our business activities create value for all our stakeholders and contribute to the SDGs Wolters Kluwer is committed to.
We strive to develop products that help protect people’s health and prosperity and contribute to a safe and just society by providing deep insights and knowledge to professionals. We are continuously focused on improving our impact while also optimizing resource use. As a member of different communities and society at large, Wolters Kluwer maintains regular contact with stakeholders including investors, Environmental, Social, and Governance (ESG) analysts and rating agencies, government offices, the media, Civil Society Organizations (CSOs), and educational and research institutions.
Materiality analysis: identifying economic, social, and environmental challenges
We continuously identify economic, social, and environmental topics that are linked to the interests of our stakeholders and are relevant to our business success. Through our annual materiality analysis, we assess the level of importance of these topics for our stakeholders and Wolters Kluwer, categorizing them as operational, strategic, or material.
We performed a thorough analysis in 2018 through the following steps:• Consultation of external sources and selection of 18
topics;• Survey of stakeholders;• Ranking of 18 topics into a materiality matrix;• Materiality matrix discussed with the Investor Relations
department; and• Materiality matrix approved by the CEO and Chairman of
the Executive Board.
Impo
rtan
ce fo
r sta
keho
lder
s
Importance for Wolters Kluwer
1 Customer focus and relationships2 Employee engagement and talent management3 Smart capital allocation4 Product innovation5 Product impact6 Editorial quality and integrity7 IP and copyright protection8 Targetted transparency9 Data privacy and security
10 Good governance and compliance11 Operational excellence12 Strong brand13 Responsible and well-managed supply chain14 Diversity and inclusion15 Health, safety, and well-being16 Community involvement17 Natural resource protection18 Circular economy
High
Medium
Low
1
2
3
45
67
8
910
11
1213
14
15
16
17
18
StrategicOperational Material
Build a pharmacy
The Mahatma Gandhi Free Medical Center in Kasuva, India, provides healthcare at a children’s home and old age home. Wolters Kluwer partnered with NGO Sevalaya to build a pharmacy and expand medical services in Kasuva, which will benefit 100+ children every day.
Our 2019-2021 strategy sets the course for the organization to become an expert solutions company.
Materiality matrix

16 17Wolters Kluwer 2019 Annual Report Wolters Kluwer 2019 Annual Report
Table of Contents | Consolidated Financial Statements | Company Financial Statements
The results of our materiality analysis highlight the topics that are most important to the company’s business performance or substantially influence the assessments and decisions of its stakeholders, driving value creation. We capture input from customers, business partners, employees, and investors to identify which topics are material according to each of these stakeholders.
Based on these steps, we identified the following material topics around which we aligned our efforts, which form the basis of our business activities: • Customer focus and relationships; • Employee engagement and talent management; • Smart capital allocation; • Product innovation; and • Product impact.
These topics remain material to the long-term success of the business, based on a limited analysis performed in 2019.
Further communications regarding these material topics can be found in the various sections of the Report of the Executive Board and in our 2019 Sustainability Data Report, available on our website.
Commitment to United Nations Sustainable Development Goals
Wolters Kluwer is committed to the United Nations Sustainable Development Goals (SDGs), which address the economic, social, and environmental challenges the world faces. As shown in our value creation model, our focus is to contribute to three SDGs:
We support and contribute to these SDGs through the innovative products and services we deliver, through our engaged employees, through our sustainable returns, and through our impact on society.
SDG 3: Good health and well-beingOur products protect and enhance people’s health by:• Creating better-skilled health professionals;• Improving knowledge and evidence about diseases
including AIDS, cancer, and diabetes;• Providing professionals with ongoing, actionable
information which improves their treatment of patients;• Increasing the knowledge and management of medicines;• Ensuring workplace health and safety to help reduce
deaths and illnesses from chemicals and water and soil pollution;
• Predicting and preventing workplace incidents to reduce injuries and fatalities;
• Facilitating the development and training of health workforces in global growth markets including China, Brazil, and India; and
• Aiding in disaster management by making services available free of charge in disaster zones.
SDG 9: Industry, innovation, and infrastructureInnovation is critical for long-term sustainable growth. Our transformation from paper to digital brings significant value to our customers and improves overall resource efficiency. Some highlights include: • Our digital transformation, 89% of our revenues now
come from digital & services;• We are recognized as the industry leader in the
Environmental, Health & Safety and Operational Risk Management (EHS/ORM) software market;
• A focus on innovation, with 8%-10% of total revenues invested in new and enhanced products;
• Combining predictive analytics, machine learning, natural language processing, and human expertise into our solutions;
• We encourage innovation by our employees through our annual Global Innovation Awards and Code Games;
• We have increased the number of technology and R&D workers through our central technology team, our multinational product development and innovation team;
• Where possible, we use digital co-working software instead of travel to improve resource efficiency; and
• In 2019, several Wolters Kluwer products received external awards for excellence or innovation.
SDG 16: Peace, justice, and strong institutionsOur solutions help promote security and reduce risk, as we:• Promote the rule of law by making information on laws
and regulations available;• Provide solutions that help our customers comply
with regulatory and legal obligations, including anti-corruption and anti-bribery;
• Help enhance public and professional access to legal and tax information;
• Provide information solutions that promote human rights, including non-discrimination and equal opportunity;
• Encourage editorial independence;• Offer solutions to improve the regulation of financial
institutions;• Provide internal training programs on compliance with
legal obligations, covering areas such as corruption and bribery; and
• Leverage artificial intelligence to identify threats and capitalize on opportunities.
Support foundation for human rights
Planting trees
Wolters Kluwer donated the usage of its legal research platform to support operations of the Helsinki Foundation for Human Rights, which supports its employees and volunteers in performing their tasks to help meet human rights goals.
Wolters Kluwer works with several tree-planting organizations to promote sustainable business practices, including American Forests, the Office Nationale des Forêts and Reforestaction in France, and the Swedish tree planting organization Vi-skogen. In total, we have planted 29,210 trees.

18 19Wolters Kluwer 2019 Annual Report Wolters Kluwer 2019 Annual Report
Table of Contents | Consolidated Financial Statements | Company Financial Statements
Recognition for delivering impact
Forbes 2019 America’s Best Employers, Employers for Women, and Best Employer for Diversity list
Dutch CHRO magazine ranked Chief Human Resources Officer, Maryjo Charbonnier, CHRO of the Year 2019 by CHRO.NL
Golden Bridge Awards for its solutions and services across different categories
Fortune's Most Powerful Women International 2019 included CEO Nancy McKinstry
CEO Nancy McKinstry included in Harvard Business Review’s Best-Performing CEOs in the World for 2019
Ranked again in the leading pack on the Transformers 200,a study on the digital transformation readiness of established Dutch firmsInclusion in
sustainability rankings FTSE4Good, STOXX Europe Sustainability, and EURO STOXX ESG Leaders 50
CCH Tagetik, CCH Axcess, CT Corporation, CASH Workflow, ELM Solutions, Lien Solutions, OneSumX, Vanceo Mortgage, and Legal & Regulatory CEO Stacey Caywood won in the 2019 Golden Bridge Awards
UpToDate: Best in KLAS 2019 as the Category Leader for Clinical Decision Support
Enablon and eVision named leaders in the Verdantix ORM Software Green Quadrant
2019 Accounting Today Top 100 Most Influential People in Accounting
The monKEY solution was awarded Best Professional Information Database
Lippincott journal portfolio won 50 awards for editorial and design excellence, including 32 from the American Society of Healthcare Publication Editors
CT Corporation won two Business Innovator Awards
Governance, Risk & Compliance recognized by Corporate Vision Magazine as Best Place to Work Award
Karen Abramson won the prestigious 2019 SIIA CODiE Awards as CEO of the Year
Deep domain knowledge combined with advanced technology
Our expert solutions – a combination of deep domain knowledge with advanced technology and services – deliver better outcomes, analytics, and improved productivity for our customers. We are recognized and valued for helping them realize their potential and deliver impact when it matters most.
UpToDate Advanced includes evidence-based algorithms developed to address clinical variability in over 60 common medical conditions. With UpToDate Pathways and Lab Interpretation, clinicians can arrive at the best decisions for their patients in view of contemporary evidence, clinical experience, and patient-specific factors.
Sentri7 clinical surveillance technology empowers clinicians to surveil the patient population in real time to identify any patients at risk. Advanced analytics and ready-made reports deliver visibility into a spectrum of clinical initiatives focused on improving care and outcomes.
POC Advisor delivers scientifically proven improvements in detecting sepsis. Rapid identification of patients and evidence-based guidance to clinicians at the point of care reduces variation in care and improves financial outcomes. Natural Language Processing technology and intelligent alerts warn front-line clinical staff and provide clinical guidance to ensure timely and effective treatment.
TeamMate is the global internal audit solution used by audit and accounting professionals in corporate and government audit organizations. Customers are finding added value through the popular new cloud-based TeamMate+ solution as it allows for greater mobility, flexibility, and collaboration.
CCH Tagetik Finance Transformation Platform enables finance to spend less time managing and controlling processes and more time focused on driving business results. Supporting all financial functions and simplifying complex processes from planning all the way through disclosure management.
CCH Axcess delivers a set of innovative features designed to make the tax and accounting profession more efficient and profitable, as the accounting profession’s first modular, cloud-based tax preparation, compliance and workflow management solution. It provides professionals with on-demand, mobile services, real-time collaboration with clients, and current regulatory guidance. CCH Axcess iQ allows users to analyze their CCH Axcess Tax data to match potentially impacted clients with tax legislation change triggers.
The OneSumX suite of integrated regulatory compliance solutions provides financial institutions with unparalleled capabilities to analyze, interpret, manage, and address their ever-changing global regulatory reporting and compliance obligations. The OneSumX solution suite is made up of four areas: OneSumX for Regulatory Reporting, OneSumX for Finance, OneSumX for Risk Management, and OneSumX for Compliance Management.
ELM Solutions’ Passport, TyMetrix 360° and LegalVIEW solutions use advanced technology and artificial intelligence to enhance the legal operations workflow. They help corporate legal and insurance claims departments thoroughly and efficiently manage their legal matters and spend to attain better outcomes. LegalVIEW BillAnalyzer is an AI-enabled expert bill review solution that delivers cost savings compared to existing invoice
review processes, plus an increase in billing guideline compliance.
M&A Clause Analytics is a workflow solution that combines artificial intelligence and expert attorney curation to improve quality, efficiency, and ease of preparing M&A agreements. It puts forth a model for each agreement based on a robust, statistically significant sample set of recent documents.
Enablon Risk, Operational Risk and EHS Management software supports hundreds of global industry-leaders and millions of users to increase safety, manage environmental performance, minimize risks, and improve profitability and sustainability. Recognized for its best in class user experience, Enablon supports over 100 EHS and risk workflows.
eVision is a global leader in industrial operational risk management software for high-risk and high-precision industries. Its solution allows customers to improve control over their operational processes, reducing risk, increasing safety, and delivering efficiencies.
Kleos is cloud-based practice management software for lawyers. With 20,000 users and offered in ten countries, Kleos leverages cloud and mobile technologies in a highly secure environment for managing legal documents, cases, and the workflow of the law firm.
The Legisway portfolio combines legal and software expertise to bring real-world intelligence to leading-edge technology solutions. Legisway’s all-in-one legal management solutions empower legal professionals to boost efficiency, increase collaboration across the business, and enable business growth.

20 21Wolters Kluwer 2019 Annual Report Wolters Kluwer 2019 Annual Report
Table of Contents | Consolidated Financial Statements | Company Financial Statements
The increasing rate at which our customers are barraged with complex information constitutes a critical pain point which needs to be addressed. Navigating an era which has also seen the physical and digital worlds merge, Wolters Kluwer has continuously evolved how we safeguard the public’s safety, health, and prosperity through our investment in product development and innovation. We know that digital transformation changes everything about how products are designed and delivered.
Because of advanced technologies, the skills required to perform most jobs will have shifted significantly, by 2022. The World Economic Forum (WEF) predicts that around 30 percent of activities in 60 percent of all occupations could become automated in the future, which means professionals will have to grapple with new skills and get accustomed to increasingly working with machines. Optimizing workflows will become critical to ensure professionals are confident in their work and the information they rely on.
Driving innovation and product development
Customers and employees both play a crucial role in developing new industry-leading solutions. Working alongside our customers, we will continue to apply advanced technologies to address complex problems in society. Our centers of excellence and task forces help us anticipate and respond to market trends relating to customer needs, regulation, and technological changes.
Investing in our culture and engaging employees in creative processes allow us to continually anticipate the needs of physicians, nurses, lawyers, tax professionals, as well as those of finance, legal, regulatory, and compliance professionals.
Our organization’s largest innovation competition, the Global Innovation Awards (GIA), has seen 75 percent of winning ideas go to market. This program contributes to strengthening our company’s culture of innovation, while contributing novel ideas that help accelerate our value and develop our talent. It reflects our commitment to being digital-first and the ongoing shift to global platforms and cloud-based, integrated expert solutions – aligned to our three-year strategy.
Any one of our 19,000 employees can submit an idea in the areas of core business, game-changers, or internal processes. In 2019, we received 260 submissions, all of which put our customer and their pain points front and center to their innovation. All of the finalists' innovations were evaluated against the strictest criteria by the Innovation Board, which is composed of internal stakeholders, headed by CEO Nancy McKinstry, and external innovation luminaries.
Turning customer problems into solutions
Helping customers achieve their ambitions relies on unlocking deep insights into their specific pain points. Uncovering – and solving – customer problems is possible at Wolters Kluwer thanks to four main elements:• Employee expertise: We employ practitioners across
every division, doctors, nurses, health professionals, tax and accounting professionals, lawyers, finance practitioners, and more. In addition, the company’s business units have advisory boards of practitioners, or work directly with practitioners themselves;
• Deep workflow insights: Increasingly, we collaborate with customers to map their workflows in detail to identify all aspects of the work involved, down to the task level;
• Intelligent technology: Through applying any number of specialized technologies and workflow insights to specific tasks, those tasks can often be automated. By taking steps out of the workflow, the company improves customers’ productivity. This helps customers move from doing the work, to advising their clients, thereby strengthening their own value proposition; and
• External partnerships: In health markets, for example, Wolters Kluwer partners with electronic medical records companies and other players in the health ecosystem. The same trend is happening in tax and accounting. These partnerships unlock value not only for Wolters Kluwer, but also for our customers, their clients – and other partners.
Delivering intuitive solutions
Interaction with customers before, during, and after the innovation process helps Wolters Kluwer to adjust and deliver its solutions to their exact needs. Understanding the customer journey allows us to execute a robust enterprise-wide customer experience measurement program in tandem with analytics and data management. As a result, we can amplify the most important insights to inform our product development decisions.
For example, the team behind Enablon 4.0, our next-generation environmental, health, and safety software solution, seeks to make sense of available data in order to understand, predict, and prevent incidents. For every fatality, 300,000 unsafe conditions and behaviors are reported by workers in industries across the board. Leveraging the reported data can truly help to save lives. Using sensor-enabled equipment, cloud computing applications, mobile capabilities, and big data analytics, the Enablon 4.0 team was able to create a fully integrated and automated system to detect risks in real time. The AI-engine they created continuously learns risk and control patterns from the industries it operates in, which allows customers to make data-driven decisions and prevent incidents from happening.
According to Gartner, only ten percent of the vast number of companies that collect customer feedback act on it, and even fewer tell their customers what action they’ve taken as a result of their feedback. Through Beyond the Score, a customer experience measurement program, Wolters Kluwer is able to listen to and understand the customer journey and act on customer feedback. The enterprise-wide customer experience measurement
Our priority is to transform customer interactions across the entire journey into a seamless, customer-focused end-to-end digital experience.
Transformative Innovations
Importance for Wolters Kluwer
260
submissions
9th edition
15
finalists
4
winners
2019 Global Innovations Awards
22 23Wolters Kluwer 2019 Annual Report Wolters Kluwer 2019 Annual Report
Table of Contents | Consolidated Financial Statements | Company Financial Statements
program is being executed in tandem with incorporating analytics and data management to amplify the most important customer insights. As a result, the team is now driving accountable actions, creating more memorable experiences for customers, and influencing millions of existing revenues.
Cyber resilience
Protecting the interests of our customers, employees, and society is our top priority, and so is data security and the safe and reliable delivery of our platforms. As a digital company in an increasingly sophisticated cyber-threat landscape, we will continuously improve our cyber readiness posture to protect our customers and our employees.
In May 2019, Wolters Kluwer detected ransomware in a portion of our IT environment. We proactively took a broad range of customer and internal applications and platforms offline to protect our systems, applications, and customer data. We promptly engaged with a leading cybersecurity technology firm to conduct a forensic investigation of the incident. The firm has confirmed that it has not observed any execution of the ransomware since May 6 or any evidence of data exfiltration from our network.
At Wolters Kluwer, we work hand-in-hand with best-in-class global firms that help us evolve our preparedness, prevention, protection, and response programs in the face of changing cybercrime. Our employees are empowered to develop their security mindset and use good judgment through regular up-to-date training and knowledge-sharing on the characteristics of cyber-attacks. Annually, we take Cybersecurity Awareness Month as an opportunity to roll-out a global campaign to inform employees about how Wolters Kluwer is working to protect our network and data, as well as knowledge and resources to help them do their part in keeping us safe.
In our globally connected society, the purpose of our business is increasingly important and helps us to answer some of the fundamental questions on our role in society. Why do we exist as a company? Where do we fit in society? What value do we create for our employees, customers, and the world? As we move into the next decade, we will continue to identify how we contribute to society including our employees, customers, and the world at large.
Creating an even better place to work in 2019
Wolters Kluwer continuously strives for an inclusive company culture in which we attract, develop, and retain high-performing, productive, engaged, and diverse talent to deliver on our strategy. The dedication of our highly specialized employees is one of our greatest strengths and key to our future success.
Diversity makes a difference An instrumental component of success lies in building strong, diverse teams – especially within a knowledge-intensive company like Wolters Kluwer. Good teamwork inside the company, in addition to working closely with customers, is the only way to ensure we deliver high-quality, innovative products.
Greater diversity not only results in effective teamwork and innovation, but also creates an environment for strong employee engagement.
We aim to create equal opportunities for all employees regardless of personal background, race, gender, nationality, age, sexual orientation, physical disability, or religion. Without our diversity, we cannot reflect the
diversity of our customers and the communities in which we live and work. Our values and Business Principles articulate the importance we place on our diversity, and we believe it is one of the factors that sets us apart from many of our peers.
Putting our values in actionAt Wolters Kluwer, our company values encourage us to put the customer at the center of everything we do, while honoring our commitment to continuous improvement and innovation, aiming high and delivering the right results, and most importantly, winning as a team. World Values Day is an event we celebrate annually to increase awareness about the meaning and practice of values around the globe and it demonstrates how action-oriented and participatory our company values are. For 2019, the World Values Day theme was wellness – the quality or state of being in good health.
Creating an engaged workforce To ensure we engage our talent, we listen closely to our employees through an annual employee engagement survey. Our 2019 survey indicates our level of employee engagement remains high, employees have pride in the company, and integrity, trust, and respect continue to grow even higher.
We are getting better at anticipating and responding to change and our employees continue to be optimistic about the future success of our company. In 2020, we will continue to focus on what matters most to our employees, providing even more for developing skills and careers and tools and resources to do their work.
Embracing People and Society
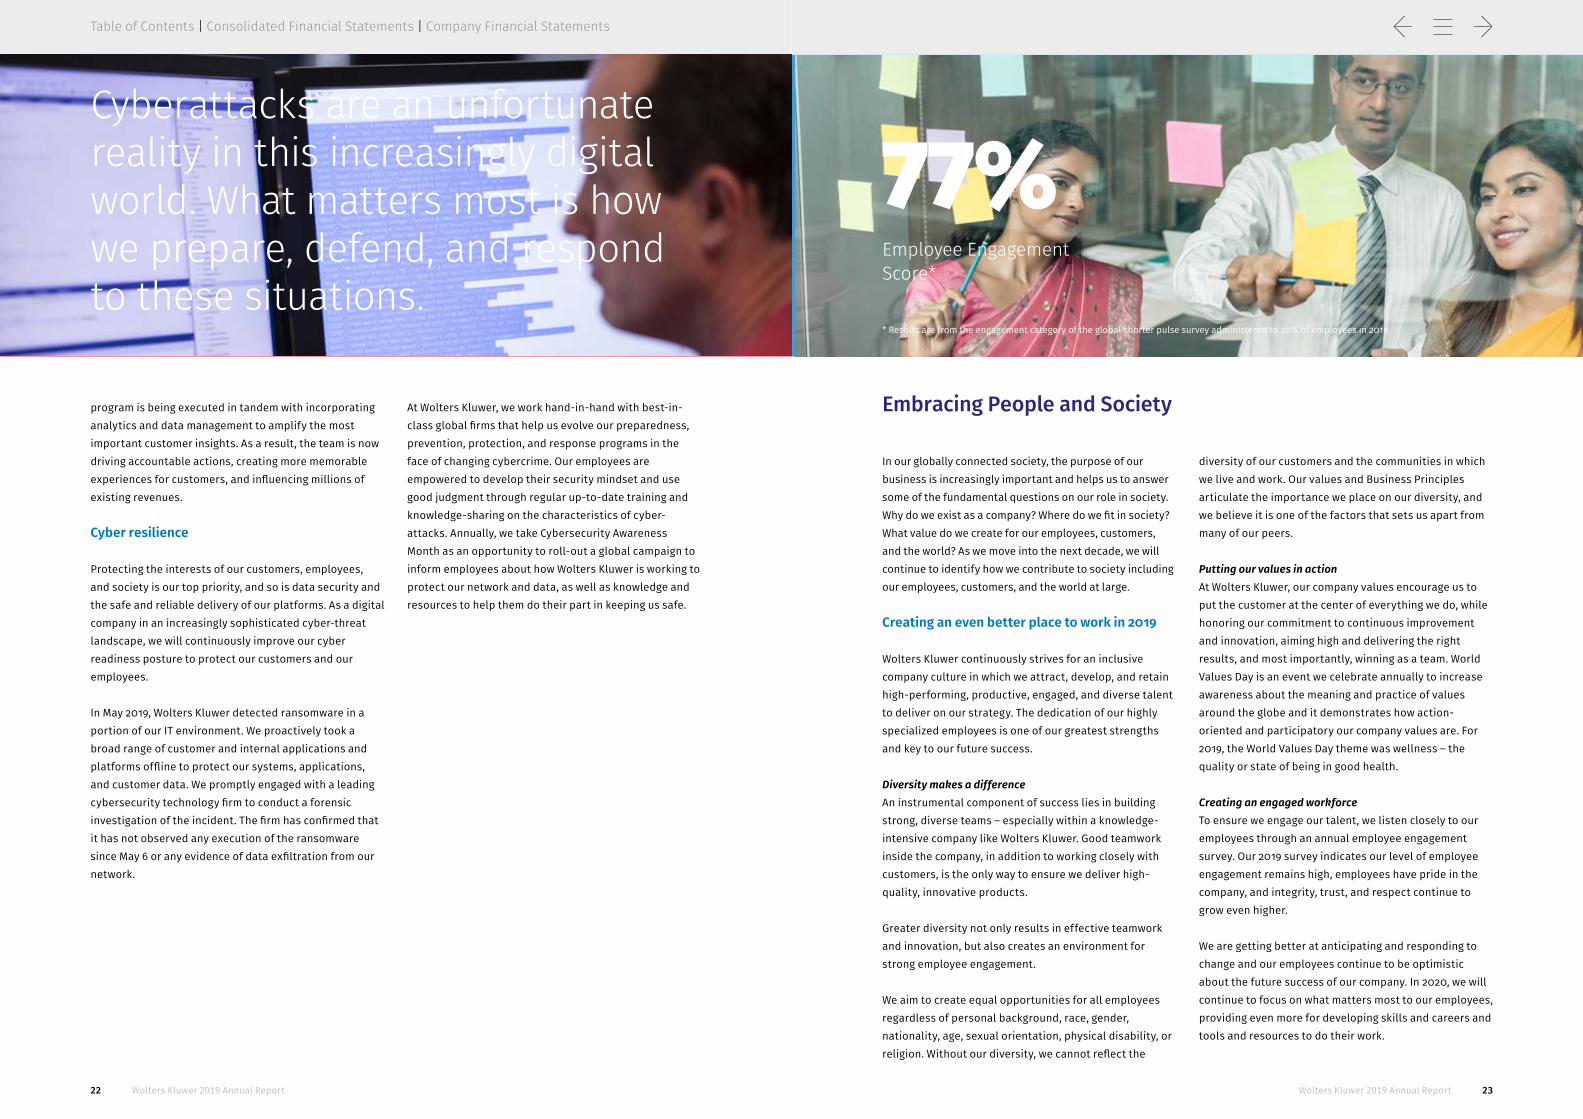
Cyberattacks are an unfortunate reality in this increasingly digital world. What matters most is how we prepare, defend, and respond to these situations.
77%Employee Engagement Score*
* Results are from the engagement category of the global shorter pulse survey administered to 20% of employees in 2019.

24 25Wolters Kluwer 2019 Annual Report Wolters Kluwer 2019 Annual Report
Table of Contents | Consolidated Financial Statements | Company Financial Statements
The digital transformation of human resourcesIn 2019, Wolters Kluwer continued to deliver on its ongoing commitment to continuous improvement and innovation and respond to feedback from our engagement survey. We accomplished this largely by driving operational efficiency through the global and highly successful implementation of market-leading technology and expanded service delivery, enabling our employees and leaders to be more effective at their jobs.
We enhanced our HR service delivery in the United States, expanded our HR portal, and enhanced the service delivery model to our global workforce. This resulted in an easier, more streamlined way for employees to get answers to their questions and to access our global HR systems.
The numbers reinforced our accomplishments: 79% of our global workforce accessed the global HR portal within 45 days of expansion to our global workforce.
One global career frameworkIn 2019, a single career framework was created to help organize all jobs and work globally. The career framework helps all global employees understand where their job fits within the company and how they contribute to Wolters Kluwer. It also provides a structure for developing employee’s skills within their role and beyond. For managers, the career framework helps them consistently understand their workforce of today and assists them with workforce planning for our future success.
Attracting and retaining talentDelivering on our strategy requires highly specialized talent. We enhanced our ability to attract and retain the talent we need through the consolidation of over 30 local external career websites into one global website. External job candidates now have one place to learn about Wolters Kluwer and to view and apply for open positions globally. The new external career website also provides our employees one place to direct people they know who might be right for an open position within our company.
The overhaul resulted in 34,000 visits to the new external career website within 45 days of launch with 44% of these visits resulting in an application for employment being started.
Development and successionA critical component of our employee engagement is developing skills and careers. We continued creating opportunities for development and growth through our on-demand foundational skill-building courses and resources available to all employees globally.
To expand our development opportunities, in 2019, we prepared for adding over 14,000 online courses globally, each designed to help employees gain knowledge across several subjects, taught by experts with real-world experience. Employees will also be given the opportunity to get personalized course recommendations based on their job title, skills, and goals for their current role and beyond. These new learning opportunities will be introduced to employees in February 2020.
We continued to focus on leadership development by delivering our highly successful curriculum for new managers and leaders. Wolters Kluwer also offers all leaders on-demand leadership learning taught by top experts with over 40 leadership tracks, each aligned with our global leadership competencies.
To strengthen our leadership pipeline, we perform our annual leadership talent review process to understand the skills, capabilities, and career aspirations of our leaders. Our annual succession process ensures succession plans are in place for our business-critical roles.
Expanding well-being globallyIn 2019, we implemented new health and well-being initiatives and have made improvements to existing initiatives in several countries.
In the United States, Wolters Kluwer offers a comprehensive well-being program – Be Well – which is an incentive-based program designed to encourage employees to make positive overall health choices by taking a holistic view of the individual and offering programs that focus on physical, mental, financial, and social well-being. Be Well offers a variety of programs including on-site health screenings, flu shots, a health assessment questionnaire, and health improvement challenges to encourage year-round engagement. Almost half of employees in the United States participated in at least one well-being activity in 2019. Additionally, aggregate data collected from the annual, self-reported health assessment showed that program participants improved their physical activity and reduced stress levels from previous years.
We also expanded our program offerings globally. To support our employees in the pursuit of their well-being, this year, we introduced an Employee Assistance Plan for all our employees and their family members worldwide. The program provides confidential 24/7 support, resources, and information to help with personal and work-life issues.
Corporate responsibility is everyone’s responsibility
We take our responsibility as a corporate citizen seriously. Good corporate governance is the foundation for building a successful business with sustainable impact. As a provider of governance-related expert solutions, we want to lead by example. It is essential for all our stakeholders that we demonstrate how we do this and how we regard the role of corporate governance within our overall sustainability strategy. Wolters Kluwer has therefore developed several policies and principles, that cover a wide range of domains to ensure the continuous compliance with high business standards.
The Wolters Kluwer Business Principles serve as our code of conduct, outlining the company-wide rules that each of our employees is expected to adhere to. Key elements from our Business Principles are also included in our Supplier Code of Conduct, that our suppliers are expected to adhere to.
The only way to get and keep talent is by creating more diversity. If you create more diversity, you attract more diversity.
50% 49% 43% 39% 75% 47%
female Executive Board
female non-managers
female Supervisory Board
female managers**
female division CEOs*
female total workforce
Diversity
* Includes the division CEOs of the operating divisions: Health, Tax & Accounting, Governance, Risk & Compliance, and Legal & Regulatory.** Managers are defined as employees having three or more direct reports.

26 27Wolters Kluwer 2019 Annual Report Wolters Kluwer 2019 Annual Report
Table of Contents | Consolidated Financial Statements | Company Financial Statements
To ensure compliance with our Business Principles and other corporate policies and applicable laws, we have deployed several initiatives. A company-wide management certification process requires the managers of each of our divisions and operating entities to sign a Letter of Representation on a semi-annual basis. In these letters, the executives confirm that they comply with all applicable policies and laws.
In addition, all Wolters Kluwer employees are required to complete compliance training at least once per year. Furthermore, employees are encouraged to report any suspected non-compliance with the Business Principles or other company policies. The company offers various channels of reporting, including line manager, HR, Legal, higher management, or to the Ethics & Compliance Committee through our global reporting system SpeakUp, which provides a safe, confidential channel for reporting concerns.
Wolters Kluwer’s Data Privacy Commitments guide our company-wide approach and express the value we attach to protecting the personal information of our customers, employees, and other stakeholders. We partner with third parties and vendors to ensure compliance. Wolters Kluwer established a cross-functional enterprise-wide compliance program for the General Data Protection Regulation (GDPR) coordinated by the Corporate Privacy Officer, with the mission to embed data privacy in our culture, processes, and day-to-day business operations. We have also launched a new global program which will focus on the implementation of the California Data Protection Act (CDPA), which will become effective on January 1, 2020, and we are closely monitoring other upcoming data privacy laws.
Educating employees ethicallyThe Annual Compliance Training was provided to all active employees globally in September 2019. 99% of our employees had completed this required training by year-end. The training program consists of several e-learning courses including ethics, IT and cybersecurity, fraud, data privacy, and more. New hires receive the training program upon their onboarding.
It is the company’s ongoing target to have at least 90% of our active employees worldwide follow and complete the online compliance training each year.
Reporting system for employees SpeakUp, our global reporting system for employees, underpins the importance of integrity and contributes to creating a culture in which employees are comfortable to speak up and report any concerns. SpeakUp is available 24/7 in 22 languages, alongside other reporting channels set out in our SpeakUp Policy. Via SpeakUp, employees can report any potential concerns, including suspected breaches of company policies, laws, or regulations, to the Ethics & Compliance Committee. The system also provides an option to report concerns anonymously, except for certain countries where anonymous reporting is legally not permitted. In 2019, 29 concerns were reported to the Ethics & Compliance Committee. We investigated all concerns reported and closed these matters. None of the concerns reported to the Ethics & Compliance Committee had a material impact on the company.
Impact on society
By helping professionals provide better healthcare, solve complex tax and accounting issues, and build better judicial and regulatory systems, Wolters Kluwer has a positive impact on society. At the same time, we strive to incorporate sustainability efforts into the day-to-day business operations that make this impact possible and viable for the long-term.
Accordingly, we are guided by international guidelines such as the Organization for Economic Co-operation and Development (OECD) Guidelines for Multinational Enterprises, the United Nations Guiding Principles on Business and Human Rights (UNGP), and the principles of the United Nations Global Compact. We also continuously strive to minimize our environmental footprint and play a part in the circular economy.
Protecting human rightsOur Human Rights Policy supports our ambitions with respect to the protection of human rights. The policy addresses the human rights issues which are most relevant for the company. Wolters Kluwer supports and respects human rights and strives to ensure that its activities will not infringe upon them. Wolters Kluwer encourages improvements of the human rights performance of its suppliers through its Supplier Code of Conduct.
Impact of our productsOur expert solutions – a combination of deep domain knowledge with advanced technology and services – deliver better outcomes, analytics, and improved productivity, and solve complex problems for our customers. We are recognized and valued for helping them realize their potential and deliver impact when it matters most.
We introduced the product impact portfolio as a framework for inspiring sustainable innovation. Our product impact portfolio helps to identify the impact our products have on customers and society. Each year, three top products from each division are selected to be included in the product impact portfolio. We use selected indicators around economic, social, and environmental topics and measure whether a product contributes to these indicators. Our product impact portfolio can be found in the Sustainability Data Report on the website.
Our values build cohesiveness across geographic and cultural boundaries, people understand the rules that should guide their decision-making and behavior.
Our employees help to shape transformation, they expect us to be more agile as a company to enhance their skills and careers.

28 29Wolters Kluwer 2019 Annual Report Wolters Kluwer 2019 Annual Report
Table of Contents | Consolidated Financial Statements | Company Financial Statements
Environmental responsibilityWolters Kluwer takes a stand against climate change and continuously reaffirms its commitment to social and environmental responsibility as they relate to both its suppliers and its own operations.
With our effort to minimize our environmental impact, we contribute to the COP21 Paris agreement of December 2016 on limiting global warming.
As part of our strategy, we have been actively focusing on an increase of revenues from digital solutions and services, which represent 89% of total revenues in 2019. Our digital products and services are considered “circular” in terms of business usage. Use of our digital products results in a more efficient use of resources as content is updated while the same product can continue to be used. Also, the multiplication of digital products reduces resource consumption.
To demonstrate our commitment to minimizing our environmental impact, we have included our resource-related sustainability ambitions in our Environmental Policy, available on www.wolterskluwer.com:
• Implement high-opportunity environmental measures; • Continue growing our expert solutions through
innovation and accelerating our global platform and cloud-based integrated solutions;
• Improve processes and optimize office space to reduce consumption of energy and water, and to improve waste treatment and recycling;
• Use alternative energy sources to reduce greenhouse gas production;
• Consolidate and outsource data centers to increase efficiency and reduce energy consumption; and
• Minimize business travel by promoting alternatives such as audio and video conferencing.
Two focal points where a major environmental impact can be made are our offices and data centers. Firstly, we constantly look for opportunities to reduce the footprint of our offices which also includes a shift to more efficient use of space through different office arrangements and the possibility of home-office work. Secondly, we actively reduce the number of data processing locations as well as vendors of these services, in order to reduce the total energy consumption of our offices and increase the energy effectiveness of our products and services. We monitor the Power Usage Effectiveness (PUE) ratio of our suppliers to ensure minimization of the amount of energy used for our products and services.
Environmental best practices within our officesAs part of Wolters Kluwer’s Green Is Green (GIG) Program, which has the goal to deliver both environmental benefits and cost savings, we launched the GIG Office Program in 2019. This is a volunteer-led green network across more than 40 of our offices to implement green best practices and create opportunities for colleagues to connect on sustainability. A two-month competition was held, designed to quickly enact changes on the ground and increase engagement around sustainability. Over 1,300 employees took part in at least one GIG event. Awards in five categories were given to offices that were greenest, most innovative, most engaged, had largest savings, and best reporting. Winning offices were able to give a donation to an environmental charity of choice and use funds for a green engagement event in 2020.
Responsibility through the supply chain We expect our suppliers to adhere to the standards described in our Supplier Code of Conduct. Existing and new suppliers that are managed through our central supplier database are invited to participate in a due diligence questionnaire to provide information on their efforts and policies on, among other topics, data security and data privacy, risk management, working standards, and environmental measures.
As part of this due diligence, we request suppliers to sign our Supplier Code of Conduct or to confirm adherence to an equivalent standard. A total of 260 suppliers have signed the Wolters Kluwer Supplier Code of Conduct or have an equivalent standard, while 90% of the suppliers we engaged with responded to our due diligence questionnaire and provided information on their sustainability strategy and actions. In 2020, we intend to increase the number of suppliers that sign our Supplier Code of Conduct or have an equivalent standard to 295, and to continue to have a response rate of 90% to our due diligence questionnaire. All our major data center suppliers are certified in the information security management standard ISO/IEC 27001. We continue to require these suppliers to be certified according to this standard. As our major data center suppliers operate on higher energy efficiency, we further reduce our environmental impact by outsourcing and further consolidating our data center activities. Please see our Sustainability Data Report, available on www.wolterskluwer.com, for more information on our social, environmental, and supply chain responsibility.
We continuously aim to deliver economic, social, and environmental impact through our expert solutions.
99% of our employees completed the Annual Compliance Training
260 suppliers committed to our Supplier Code of Conduct or equivalent standard
100% of our major data center suppliers certified according to ISO/IEC 27001

30 31Wolters Kluwer 2019 Annual Report Wolters Kluwer 2019 Annual Report
Table of Contents | Consolidated Financial Statements | Company Financial Statements
Global Growth Markets
Cathy Wolfe EVP & President Global Growth Markets
The Wolters Kluwer Global Growth Markets (GGM) group, formerly Emerging & Developing Markets, accelerates the company’s strategic presence in fast-growing geographies, particularly India, China, and Brazil. GGM’s mission is to service professionals in these markets with global expert solutions that combine deep domain knowledge and local expertise with specialized technology.
Global Business Services
Andres Sadler CEO Global Business Services
Wolters Kluwer Global Business Services (GBS) is responsible for improving the quality and performance of the internal technology infrastructure, while driving global financial and operational excellence programs. GBS enables businesses to focus on delivering customer outcomes while providing expertise, streamlined operating standards, enhanced IT systems and security, and a strengthened core to support Wolters Kluwer’s digital transformation across technology, accounting, sourcing, procurement, and events management.
Digital eXperience Group
Dennis CahillChief Technology Officer Digital eXperience Group
The Wolters Kluwer Digital eXperience Group (DXG), formerly Global Platform Organization, co-creates state-of-the-art digital solutions with our businesses around the world. The DXG mandate is to grow revenue in the company’s digital products through innovation in, and adoption of, advanced technologies and tools to meet and further anticipate customer needs. The group drives innovation in Wolters Kluwer through its user experience center of excellence, focused on customer-centric product development, and its artificial intelligence center of excellence, applying cutting-edge technologies for the next generation of expert solutions.
Corporate Office
The Wolters Kluwer Corporate Office sets the global strategic direction for the company and ensures good corporate governance. Its mission is to support and provide an enabling business and operating environment to help realize our strategy to deliver impact to our customers, employees, investors, and society at large.
Health
Diana Nole CEO Health
Wolters Kluwer provides trusted clinical technology and evidence-based solutions that engage clinicians, patients, researchers, students, and the next generation of healthcare providers. With a focus on clinical effectiveness, research and learning, safety and surveillance, and interoperability and data intelligence, our proven solutions drive effective decision-making and consistent outcomes across the continuum of care.
Customers span a broad scope of hospitals and healthcare organizations, individual students and clinicians, medical libraries and schools, payors, life science specialists, and retail pharmacies.
Portfolio includes Emmi Patient Engagement, Health Language, Lexicomp, Lippincott, Medi-Span, Ovid, POC Advisor, Sentri7, Simplifi 797, UpToDate, and UpToDate Advanced.
Tax & Accounting
Karen Abramson CEO Tax & Accounting
Wolters Kluwer fuels global commerce by enabling professionals in tax and accounting firms, governing authorities, and businesses of all sizes to grow, manage and protect their business and their clients’ businesses. Expert solutions – in compliance, collaboration, internal and external audit management, corporate performance management and firm management – integrate deep domain knowledge with workflows to ensure compliance, improved productivity, effective management, and strengthened client relationships.
Customers include accounting firms, corporate finance, tax and auditing departments, govern-ment agencies, corporations, libraries, and universities.
Portfolio includes A3 Software, ADDISON, ATX, CCH, CCH AnswerConnect, CCH Axcess, CCH Axcess iQ, CCH Tagetik, CCH iFirm, CCH ProSystem fx, CCH OneClick, CCH Integrator, CCH PinPoint, Genya, Prosoft, TeamMate, and Twinfield.
Governance, Risk & Compliance
Richard FlynnCEO Governance, Risk & Compliance
Wolters Kluwer provides legal and banking professionals with solutions to ensure compliance with ever-changing regulatory and legal obligations, manage risk, increase efficiency, and produce better business outcomes. The portfolio offers technology-enabled expert services and solutions focused on legal entity compliance, legal operations management, banking product compliance, and banking regulatory compliance.
Customers include corpora-tions, small businesses, law firms, corporate legal depart-ments, insurers, compliance professionals, risk managers, and financial institutions – including banks, credit unions, and leasing and securities firms.
Portfolio includes CASH Suite, CLM Matrix, ComplianceOne, CT Corporation, Expere, GainsKeeper, Lien Solutions, OneSumX, Passport, Tymetrix 360, and Vanceo.
Legal & Regulatory
Stacey CaywoodCEO Legal & Regulatory
Wolters Kluwer enables legal and compliance professionals to improve productivity and performance, mitigate risk, and solve complex problems with confidence. With expert information enriched with advanced technologies, we help professionals thrive in the complex and changing areas of legal and regulatory compliance. In the moments that matter most, professionals turn to us to serve their clients, and as they create more successful and sustainable businesses. Together, we support more transparent, just, and safe societies around the world.
Customers include law firms, corporate legal departments, corporations, environmental, health, and safety (EHS) professionals, operational risk managers, universities, and government agencies.
Portfolio includes Cheetah, ComplyTrack, Enablon, eVision, IPSOA, Iter, Jura, Kleos, LaLey, Lamyline, LEX, Leggi D’Italia, Legisway, Navigator, NotaioNext, Verifield, and Wolters Kluwer Online.de.
Full list of management is available on www.wolterskluwer.com.
We serve
Our Organization
90% of U.S. academic medical centers
93% of Fortune 500 companies
100% of the top U.S. accounting firms
90% of the world’s top banks
100% of the top 100 global law firms
Side by side with our customers, understanding their needs and addressing the rapid changes in their environment

32 33Wolters Kluwer 2019 Annual Report Wolters Kluwer 2019 Annual Report
Table of Contents | Consolidated Financial Statements | Company Financial Statements
2019 2019 Guidance 2018
Adjusted operating profit margin in % 23.6 23.0-23.5 23.1
Adjusted free cash flow in € million 765 750-775 759
Return on invested capital in % 11.8 10.5-11.5 10.6
Diluted adjusted EPS in € 2.76 Around 10% growth 2.48
Figures and guidance for adjusted free cash flow and diluted adjusted EPS in constant currencies (€/$ 1.18). Adjusted operating profit margin and ROIC in reporting currencies.
Key Performance Indicators*
Adjusted free cash flow € million
800
700
600
500
2017 2018 2019
746762
807
1,000
750
500
250
0
2017 2018 2019
Adjusted operating profit by division€ million
970 9861,089
110 112 104
295 291 341
320 329388
297 305320
(52) (51) (64)
2019 Key Figures Revenues 2017-2019*
Total annual revenues€ million
Health
Tax & Accounting
Governance, Risk & Compliance
Legal & Regulatory
4,612
Total employeesFTE at December 31
Total adjusted operating profit marginin %
0 5 10 15 20 25 30 35
27.0%
23.6%
27.4%
31.9%
11.0%
Revenues by mediain %
Digital
Services
100
75
50
25
0
2017 2018 2019
13 12 11
76 77 78
11 11 11
Revenues by typein %
Recurring
Non-recurring
100
75
50
25
0
2017 2018 2019
78 7876
24 22 22
5,000
4,000
3,000
2,000
1,000
0
2017 2018 2019
Revenues by division€ million
Health
Tax & Accounting
Governance, Risk & Compliance
Legal & Regulatory
4,259 1,166
1,1861,109
1,234 1,4131,295
914 945 880
1,054 1,068 975
4,3684,612
62
Revenues by geographyin %
Europe
North America
Asia Pacific
Rest of World
100
75
50
25
0
2017 2018 2019
6
61
31
2
61
31
6
61
31
2
18,361
124
Health
Tax & Accounting
Governance, Risk & Compliance
Legal & Regulatory
Corporate
1,186945
1,068
1,413
4,330
4,3072,903
6,697
* 2018 restated for IFRS 16. See Note 1 – General and Basis of Preparation. * 2018 restated for IFRS 16. See Note 1 – General and Basis of Preparation.
Adjusted operating profit marginin %
24
23
22
2017 2018 2019
3.00
2.75
2.50
2.25
2.00
2017 2018 2019
Diluted adjusted earnings per sharein euro
22.2
23.1
23.6
2.90
2.45
Organic revenue growthin %
5
4
3
2
2017 2018 2019
3.4
4.3 4.3
Health
Tax & Accounting
Governance, Risk & Compliance
Legal & Regulatory
Corporate
2.22

34 35Wolters Kluwer 2019 Annual Report Wolters Kluwer 2019 Annual Report
Table of Contents | Consolidated Financial Statements | Company Financial Statements
RevenuesGroup revenues rose 8% overall to €4,612 million, benefitting from the stronger U.S. dollar. The dollar averaged $1.12 per euro in 2019 compared to $1.18 per euro in 2018. In constant currencies, revenues increased by 5%. Excluding both the impact of exchange rate movements and the effect of acquisitions and disposals, organic growth was 4% (2018: 4%).
Revenues from North America, which accounted for 61% of group revenues, grew 4% organically. This was in line with the prior year (2018: 4%), with moderation in Tax & Accounting offset by a marked acceleration in Legal & Regulatory in this region. Revenues from Europe, 31% of total revenues, saw accelerated organic growth of 5% (2018: 4%), mainly driven by faster growth in Legal & Regulatory and in Tax & Accounting in this part of the world. Revenues from Asia Pacific and Rest of World, 8% of total revenues, grew 5% organically (2018: 7%), slowing mainly due to Health.
Recurring revenues accounted for 78% of total revenues (2018: 78%) and grew 5% organically (2018: 5%). Recurring revenues include subscriptions and other renewing revenue streams. Total Legal Services (LS) and Financial Services (FS) transactional revenues in our Governance, Risk & Compliance division rose 6% organically (2018: 6%). Other non-recurring revenues, which include software licenses, implementation fees, professional services, and other non-subscription offerings, rose 1% organically (2018: 6%). The group-wide trend in print book revenues deteriorated modestly (2019: 7% decline; 2018: 6% decline).
Revenues by type
€ million, unless otherwise stated 2019 2018* ∆ ∆ CC ∆ OG
Digital and service subscription 3,087 2,793 +11% +7% +7%
Print subscription 202 209 -3% -5% -5%
Other recurring 292 288 +1% -4% 0%
Total recurring revenues 3,581 3,290 +9% +5% +5%
Print books 212 226 -6% -8% -7%
LS transactional 246 214 +15% +9% +9%
FS transactional 105 98 +7% +1% +1%
Other non-recurring 468 431 +8% +6% +1%
Total revenues 4,612 4,259 +8% +5% +4%
∆: % Change; ∆ CC: % Change in constant currencies (€/$ 1.18); ∆ OG: % Organic growth. *2018 restated for IFRS 16.
Operational performance
Key figures
€ million, unless otherwise stated 2019 2018* ∆ ∆ CC ∆ OG
Revenues 4,612 4,259 +8%
Operating profit 908 967 -6%
Profit for the year 669 656 +2%
Diluted EPS (€) 2.46 2.35 +4%
Net cash from operating activities 1,102 1,001 +10%
Business performance – benchmark figures
Revenues 4,612 4,259 +8% +5% +4%
Adjusted operating profit 1,089 986 +11% +5% +7%
Adjusted operating profit margin 23.6% 23.1%
Adjusted net profit 790 682 +16% +9%
Diluted adjusted EPS 2.90 2.45 +19% +11%
Adjusted free cash flow 807 762 +6% +1%
Net debt 2,199 2,249 -2%
Return on invested capital (ROIC) 11.8% 10.6%
∆ :% Change; ∆ CC: % Change in constant currencies (€/$ 1.18); ∆ OG: % Organic growth. Benchmark adjusted figures are performance measures used by management. *2018 restated for IFRS 16. See Note 1 – General and Basis of Preparation.
Highlights• Revenues, up 5% in constant currencies and up 4%
organically.- Digital & services revenues up 6% organically (89% of
total revenues).- Recurring revenues up 5% organically (78% of total
revenues).• Operating profit down 6%
- Adjusted operating profit up 5% in constant currencies.- Prior year included disposal gains of €159 million
relating to divestments in Health, Governance Risk & Compliance, and Legal & Regulatory.
- Amortization and impairment of acquired identifiable intangible assets increased to €182 million (2018: €175 million) due to impairments of €38 million (2018: €9 million), partly offset by assets fully amortized.
• Adjusted operating profit margin up 50 basis-points to 23.6%.
• Profit for the year up 2%, reflecting a lower effective tax rate and a decrease in financing costs, partly offset by a lower operating profit.
• Diluted adjusted EPS €2.90, up 11% in constant currencies.
• Adjusted free cash flow €807 million, up 1% in constant currencies.
• Return on invested capital (ROIC) improved to 11.8%.• Balance sheet remains strong: net-debt-to-EBITDA 1.6x
at year-end 2019.
Operating profit Operating profit declined 6% to €908 million (2018: €967 million) primarily because the prior year included disposal gains of €159 million relating to divestments in Health, Governance Risk & Compliance, and Legal & Regulatory. Amortization and impairment of acquired identifiable intangible assets increased to €182 million (2018: €175 million) due to impairments of €38 million (2018: €9 million), including €36 million related to Emmi, the patient engagement solution we acquired in 2016, partly offset by assets fully amortized. In addition, there was the release of a €9 million payable relating to an earnout.
Adjusted operating profit was €1,089 million, an increase of 5% in constant currencies. The adjusted operating profit margin increased to 23.6% (2018: 23.1%). Adjusted operating profit included a net positive one-time item of €16 million (2018: €23 million), consisting of a one-time credit related to the modernization of one of our U.S. defined employee benefits plans. Excluding one-time items in both years, the underlying adjusted operating profit margin increased by 70 basis points, driven by operational efficiencies, mix shift, and currency. Adjusted operating profit included restructuring costs of €26 million (2018: €30 million). Restructuring relates to ongoing and new efficiency initiatives, including organizational changes, across the group.
€ million %
Revenues 2018* 4,259
Organic change 183 4
Acquisitions 32 1
Divestments (21) 0
Currency impact 159 3
Revenues 2019 4,612 8* Restated for IFRS 16.
Operational and Financial Review

36 37Wolters Kluwer 2019 Annual Report Wolters Kluwer 2019 Annual Report
Table of Contents | Consolidated Financial Statements | Company Financial Statements
Wolters Kluwer Health revenues increased 2% in constant currencies, reflecting the disposals of ProVation Medical (March 2018) and certain Allied Health assets (September 2019) as well as the deconsolidation of Medicom (March 2018). Organic growth was 4%. The adjusted operating profit margin declined due to lower net positive one-time items. The underlying margin improved modestly despite increased restructuring costs and investments in sales & marketing and product development. Operating profit included an impairment on Emmi, our patient engagement solution, in 2019, compared to significant disposal gains in the prior year.
Clinical Solutions (51% of divisional revenues) grew 6% organically (2018: 9%). The comparable period included two businesses (ProVation and Medicom) that were sold or deconsolidated in the first half of 2018. Our clinical decision tool UpToDate saw 9% organic growth driven by renewals and new customers. The rollout of UpToDate Advanced made progress, with over 850 hospitals now subscribed globally. Our drug information solutions delivered solid growth while investing in new features and closer integration with UpToDate. New sales of Emmi were soft as hospital spending on patient engagement solutions remained tight. In clinical software, performance was mixed.
Health Learning, Research & Practice (49% of divisional revenues) revenues rose 1% (2018: 1%) on an organic basis, with digital growth of 3% largely offset by decline in print formats. Ovid, our online medical research platform, delivered good organic growth driven by subscription renewals and strong performance in Asia Pacific, led by India. Print journal subscriptions and
advertising revenues declined, while revenues related to open access research continued to grow. Print book revenues for medical and nursing education and practice declined 5%, benefitting from the timing of distributor orders. Our nursing solutions, including the recently enhanced Lippincott CoursePoint+, sustained double-digit organic growth while continuing medical education recorded a decline. The unit remains focused on leveraging its quality medical and nursing content and advancing its information solutions with workflow and productivity tools.
Health
€ million, unless otherwise stated 2019 2018* ∆ ∆ CC ∆ OG
Revenues 1,186 1,109 +7% +2% +4%
Adjusted operating profit 320 305 +5% 0% +3%
Adjusted operating profit margin 27.0% 27.5%
Operating profit 243 343 -29%
Net capital expenditure 33 36
Ultimo FTEs 2,903 2,866
∆: % Change; ∆ CC: % Change in constant currencies (€/$ 1.18); ∆ OG: % Organic growth. *2018 restated for IFRS 16.
Health
• Clinical Solutions revenues grew 6% organically, led by UpToDate which grew 9%.• Health Learning, Research & Practice revenues rose 1% organically, with digital revenues up 3%.• Margin decline reflects lower one-time net positive items.
Divisional summary
€ million, unless otherwise stated 2019 2018* ∆ ∆ CC ∆ OG
Revenues
Health 1,186 1,109 +7% +2% +4%
Tax & Accounting 1,413 1,295 +9% +6% +6%
Governance, Risk & Compliance 1,068 975 +10% +4% +4%
Legal & Regulatory 945 880 +7% +6% +3%
Total revenues 4,612 4,259 +8% +5% +4%
Adjusted operating profit
Health 320 305 +5% 0% +3%
Tax & Accounting 388 329 +18% +14% +14%
Governance, Risk & Compliance 341 291 +17% +11% +11%
Legal & Regulatory 104 112 -7% -7% -6%
Corporate (64) (51) +25% +23% +23%
Total adjusted operating profit 1,089 986 +11% +5% +7%
∆: % Change; ∆ CC: % Change in constant currencies (€/$ 1.18); ∆ OG: % Organic growth. *2018 restated for IFRS 16.
Divisional performance
Organic growth was sustained at 4% as a marked improvement in Legal & Regulatory compensated for more moderate organic growth in Health and Tax & Accounting. The increase in our adjusted operating profit
margin was driven by Tax & Accounting and Governance, Risk & Compliance. Operational efficiencies, mix shift, and currency compensated for a lower level of net one-time benefits and for increased product investment.

38 39Wolters Kluwer 2019 Annual Report Wolters Kluwer 2019 Annual Report
Table of Contents | Consolidated Financial Statements | Company Financial Statements
Governance, Risk & Compliance
€ million, unless otherwise stated 2019 2018* ∆ ∆ CC ∆ OG
Revenues 1,068 975 +10% +4% +4%
Adjusted operating profit 341 291 +17% +11% +11%
Adjusted operating profit margin 31.9% 29.8%
Operating profit 306 309 -1%
Net capital expenditure 73 65
Ultimo FTEs 4,330 4,155
∆: % Change; ∆ CC: % Change in constant currencies (€/$ 1.18); ∆ OG: % Organic growth. *2018 restated for IFRS 16.
Wolters Kluwer Governance, Risk & Compliance (GRC) revenues grew 4% in constant currencies and 4% organically (2018: 4%). In May 2019, GRC acquired CLM Matrix, a provider of contract lifecycle management software. The adjusted operating profit margin increased, reflecting underlying cost savings and net positive one-time items in 2019. Operating profit declined 1%, as 2018 included significant disposal gains.
Legal Services (57% of divisional revenues) sustained 5% organic growth (2018: 5%). CT Corporation, the leading U.S. provider of registered agent and corporate legal compliance services, delivered strong organic growth driven by recurring service subscriptions and better-than-expected, high single-digit organic growth in transactional revenues. Enterprise Legal Management (ELM) Solutions, which supports corporate legal operations with legal spend and matter management software and analytics, recorded muted growth as an increase in volume-linked revenue from LegalVIEW Bill Analyzer was largely offset by lower software maintenance and professional services revenues amid longer sales cycles for large enterprise deals. ELM introduced several product innovations and made progress on integrating CLM Matrix.
Financial Services (43% of divisional revenues) delivered organic growth of 3% (2018: 3%). Finance, Risk & Reporting, which supports banks with OneSumX regulatory compliance and reporting software, recorded high single-digit organic growth, reflecting new software license sales and professional services in Europe, Middle East & Africa and in Asia Pacific, as well as increased recurring revenues from an expanded customer base. The unit is investing in a cloud-based version of our OneSumX
regulatory reporting solution. Our Compliance Solutions unit recorded stable revenues as growth in the GainsKeeper investment compliance solution and the OneSumX Regulatory Change Management solution was offset by declines in professional services and mortgage filing fees. Wolters Kluwer Lien Solutions, which accounts for over 80% of Financial Services (FS) transactional revenues, saw organic growth moderate as U.S. commercial lending activity plateaued in the second half of 2019.
Governance, Risk & Compliance
• Legal Services sustained 5% organic growth, driven by CT Corporation.• Financial Services grew 3% organically, led by our Finance, Risk & Reporting software.• The margin increased due to operating efficiencies and one-time items.
Wolters Kluwer Tax & Accounting revenues grew 6% in constant currencies and 6% organically (2018: 7% organic growth). Adjusted operating profit rose 14% in constant currencies, mainly driven by efficiency savings, lower restructuring costs and operational gearing. There was a modest benefit from a change in one-time items. Operating profit increased 35%, due to the increase in adjusted operating profit and due to lower amortization and impairment of acquired identifiable intangible assets.
Corporate Performance Solutions (14% of divisional revenues) grew 17% organically (2018: 19%) with both CCH Tagetik and TeamMate delivering double-digit growth. CCH Tagetik expanded revenues with existing customers and gained new customers for its cloud-based performance management software and services. In internal audit, TeamMate achieved strong growth in North America and Asia Pacific with both on-premise and cloud-based solutions.
North America Professional Tax & Accounting (51% of divisional revenues) saw a moderation in organic growth to 4% (2018: 6%). Software solutions recorded 6% organic growth, led by CCH Axcess, our U.S. cloud-based professional tax software suite, and iFirm, our global practice management solution, in Canada. During the year, we invested in and launched CCH Axcess Knowledge Coach to help support cloud customers with their audit engagements. Our Research & Learning business experienced a decline in both digital and print revenues, as the prior year benefitted from demand for information on the U.S. Tax Cuts & Jobs Act. Bank products and training services declined.
Europe Professional Tax & Accounting (29% of divisional revenues) delivered exceptional 8% organic growth (2018: 7%), with strong growth in on-premise software enhanced by double-digit growth in our European cloud and hybrid-cloud collaboration tools. All European countries where we operate saw positive growth. Italy delivered exceptionally strong performance as customers adopted its new automated invoicing tool. The European group continued to invest in rolling out cloud-based collaboration tools for tax advisors and their clients.
Asia Pacific & Rest of World Professional Tax & Accounting (6% of divisional revenues) declined on an organic basis with mixed performances. Our Tax & Accounting business in China delivered strong organic growth, but this was more than offset by softness in other parts of Asia Pacific and in Brazil.
Tax & Accounting
• Corporate Performance Solutions grew 17% organically.• Professional Tax & Accounting performed well, supported by software growth of 6%.• Margin increase mainly reflects efficiency savings and operational gearing.
Tax & Accounting
€ million, unless otherwise stated 2019 2018* ∆ ∆ CC ∆ OG
Revenues 1,413 1,295 +9% +6% +6%
Adjusted operating profit 388 329 +18% +14% +14%
Adjusted operating profit margin 27.4% 25.4%
Operating profit 344 255 +35%
Net capital expenditure 74 71
Ultimo FTEs 6,697 6,649
∆: % Change; ∆ CC: % Change in constant currencies (€/$ 1.18); ∆ OG: % Organic growth. *2018 restated for IFRS 16.

40 41Wolters Kluwer 2019 Annual Report Wolters Kluwer 2019 Annual Report
Table of Contents | Consolidated Financial Statements | Company Financial Statements
Corporate
€ million, unless otherwise stated 2019 2018* ∆ ∆ CC ∆ OG
Adjusted operating profit (64) (51) +25% +23% +23%
Operating profit (64) (51) +25%
Net capital expenditure 1 2
Ultimo FTEs 124 121
∆: % Change; ∆ CC: % Change in constant currencies (€/$ 1.18); ∆ OG: % Organic growth. *2018 restated for IFRS 16.
Corporate expenses
Net corporate expenses increased 23% in constant currencies. The increase in expenses partly reflects the absence of net positive one-time items of €5 million recorded in 2018. Underlying corporate costs increased, reflecting investment in enterprise software and services
to support global human resources, financial performance management, and digital marketing. In addition, central costs increased as a result of strengthening key central functions, including GDPR and data privacy.
Legal & Regulatory
€ million, unless otherwise stated 2019 2018* ∆ ∆ CC ∆ OG
Revenues 945 880 +7% +6% +3%
Adjusted operating profit 104 112 -7% -7% -6%
Adjusted operating profit margin 11.0% 12.7%
Operating profit 79 111 -29%
Net capital expenditure 45 40
Ultimo FTEs 4,307 4,343
∆: % Change; ∆ CC: % Change in constant currencies (€/$ 1.18); ∆ OG: % Organic growth. *2018 restated for IFRS 16.
Legal & Regulatory revenues increased 6% in constant currencies including the effect of net acquisitions, including eVision (October 2018) and Legisway (September 2018). Excluding currency and acquisitions, organic revenue growth improved to 3% (2018: 1%), which was better than expected and followed a strong fourth quarter. Adjusted operating profit and the related margin declined, due to lower net positive one-time items, the initial dilutive effect of recent acquisitions, and increased investment in product development and digital marketing. Operating profit declined due to the absence of prior year disposal gains.
EHS/ORM & Legal Software (15% of divisional revenues), which includes our global environmental, health and safety (EHS) and operational risk management (ORM) software and our European legal software, delivered 14% organic growth. EHS/ORM software provider Enablon had an exceptionally strong year driven by higher on-premise license sales, double-digit growth in cloud subscriptions, and significant growth in professional services following 2018 customer wins. Enablon made progress on the integration of eVision and, in early 2020, completed the acquisition of CGE Risk Management Solutions. Our legal software solutions recorded robust organic growth, made progress on the integration of contract management software Legisway, and invested in product enhancements for Kleos.
Legal & Regulatory Information Solutions (85% of divisional revenues) saw further improvement in organic growth to 1% (2018: 0%). Digital information solutions, which now make up 60% of the unit’s revenues, grew 5% organically, more than offsetting continued decline in print subscriptions and books. In Europe, growth was led by strong performances in Germany and Central Europe, including some positive one-off effects. Our U.S. Legal & Regulatory information solutions again delivered positive organic growth, with digital solutions, such as Cheetah and RBSource, delivering improved 5% organic growth. Ongoing restructuring initiatives drove savings, which helped fund wage inflation and increased investments to enhance content products with workflow tools.
Legal & Regulatory
• EHS/ORM & Legal Software grew 14% organically and now contributes 15% of division revenues.• Legal & Regulatory Information Solutions saw organic growth improve to 1%.• Margin decline reflects prior period one-time items, acquisitions, and increased product investment.

42 43Wolters Kluwer 2019 Annual Report Wolters Kluwer 2019 Annual Report
Table of Contents | Consolidated Financial Statements | Company Financial Statements
Net debt and leverageNet debt at December 31, 2019, amounted to €2,199 million (2018: €2,249 million). The 2019 net-debt-to-EBITDA ratio was 1.6x (2018: 1.8x), due to an increase in EBITDA combined with lower net debt. The reduction in net debt is attributable to strong free cash flow combined with lower spend on acquisitions and share buybacks.
Under IFRS 16, net debt includes short-term and long-term lease liabilities. Total lease liabilities increased to €368 million (2018: €255 million), largely attributable to our new office facility in New York, NY.
Working capital
€ million 2019 2018* Variance
Inventories 73 71 2
Contract assets 137 113 24
Trade receivables 1,087 1,022 65
Operating accounts receivable 231 230 1
Deferred income (1,679) (1,592) (87)
Other contract liabilities (39) (45) 6
Trade and other operating payables (859) (859) 0
Operating working capital (1,049) (1,060) 11
Cash and cash equivalents 899 783 116
Non-operating working capital (1,183) (998) (185)
Total (1,333) (1,275) (58)* 2018 restated for IFRS 16 and certain reclassifications. See Note 1 – General and Basis of Preparation.
Other developments
Financing resultsFinancing results amounted to a cost of €53 million (2018: €79 million cost), including a €9 million net gain on disposal of an equity-accounted investee (the sale of a 40% interest in an Austrian information services specialist) and a financial asset. The lower financing results also reflect the full twelve-month effect of lower borrowing costs after the redemption of our €750 million, 6.375% senior Eurobond in April 2018, and higher interest income on cash balances. Adjusted net financing costs decreased to €58 million (2018: €77 million).
TaxationProfit before tax decreased 4% to €858 million (2018: €890 million). The effective tax rate decreased to 22.0% (2018: 26.3%). The prior year was impacted by taxable gains on the divestments of Corsearch and ProVation Medical. The current year’s effective tax rate was impacted by favorable tax law changes and the conclusion of tax audits.
Adjusted profit before tax was €1,034 million (2018: €911 million), up 14% overall and up 7% in constant currencies. The benchmark tax rate on adjusted profit before tax was 23.6% (2018: 25.1%).
Earnings per ShareTotal profit for the year increased 2% to €669 million (2018: €656 million) and diluted earnings per share increased 4% to €2.46 (2018: €2.35).
Diluted adjusted EPS increased 19% overall and 11% in constant currencies to €2.90 (2018: €2.45), reflecting the 16% increase in adjusted net profit to €790 million (2018: €682 million) and a 2% reduction in the diluted weighted average number of ordinary shares outstanding to 272.2 million (2018: 278.8 million).
Return on invested capital (ROIC)In 2019, the ROIC was 11.8% (2018: 10.6%), mainly due to a higher adjusted operating profit.
Working capitalOperating working capital amounted to €(1,049) million, compared to €(1,060) million in 2018, an increase of €11 million. This increase includes the autonomous movements in working capital offset by the strengthening of the U.S. dollar. Non-operating working capital decreased to €(1,183) million, compared to €(998) million in 2018, mainly due to the private placement of €250 million being reclassified from long-term debt as it becomes payable in 2020.
Financial position
Balance sheetNon-current assets, mainly consisting of goodwill and acquired identifiable intangible assets, increased modestly by €11 million to €6,299 million in 2019, mainly as a result of an increase in right-of-use assets due to a new real estate lease in New York, NY, partly offset by the amortization and impairment on intangible assets for the year being higher than net expenditures.
Total equity increased by €126 million to €2,380 million mainly due the profit for the year, partly offset by the share buyback and dividend payments. During 2019, we
repurchased 5.5 million shares for a total consideration of €350 million, including 1.0 million shares to offset incentive share issuance (2018: 1.3 million). At December 31, 2019, share buybacks have not yet been executed for an amount of €50 million under the existing mandate.
In September 2019, we completed the reduction in ordinary share capital of 6.7 million of the shares held in treasury, following the share buybacks during the year. As of December 31, 2019, we held 6.4 million shares in treasury. In 2019, the total weighted average number of shares was 270.3 million (2018: 276.7 million).
Balance sheet
€ million, unless otherwise stated 2019 2018* Variance
Non-current assets 6,299 6,288 11
Working capital (1,333) (1,275) (58)
Total equity 2,380 2,254 126
Net debt 2,199 2,249 (50)
Net-debt-to-EBITDA ratio 1.6 1.8 (0.2)
* 2018 restated for IFRS 16 and certain reclassifications. See Note 1 – General and Basis of Preparation.
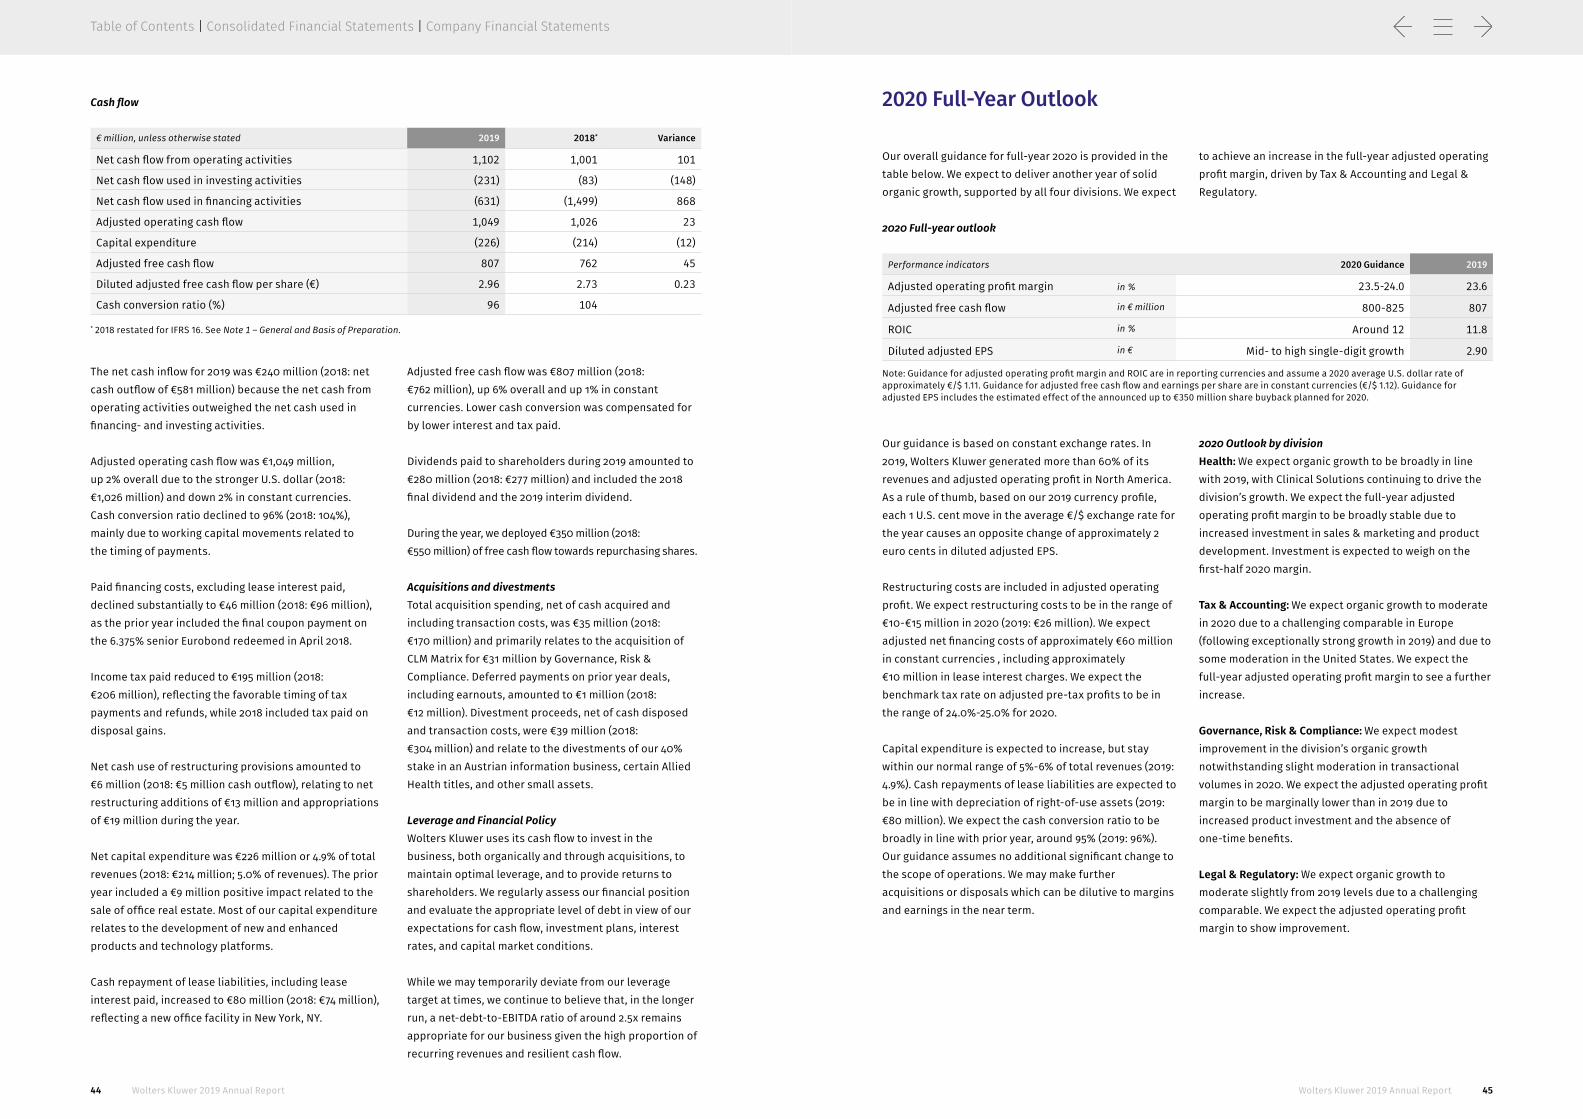
44 45Wolters Kluwer 2019 Annual Report Wolters Kluwer 2019 Annual Report
Table of Contents | Consolidated Financial Statements | Company Financial Statements
Our guidance is based on constant exchange rates. In 2019, Wolters Kluwer generated more than 60% of its revenues and adjusted operating profit in North America. As a rule of thumb, based on our 2019 currency profile, each 1 U.S. cent move in the average €/$ exchange rate for the year causes an opposite change of approximately 2 euro cents in diluted adjusted EPS.
Restructuring costs are included in adjusted operating profit. We expect restructuring costs to be in the range of €10-€15 million in 2020 (2019: €26 million). We expect adjusted net financing costs of approximately €60 million in constant currencies , including approximately €10 million in lease interest charges. We expect the benchmark tax rate on adjusted pre-tax profits to be in the range of 24.0%-25.0% for 2020.
Capital expenditure is expected to increase, but stay within our normal range of 5%-6% of total revenues (2019: 4.9%). Cash repayments of lease liabilities are expected to be in line with depreciation of right-of-use assets (2019: €80 million). We expect the cash conversion ratio to be broadly in line with prior year, around 95% (2019: 96%). Our guidance assumes no additional significant change to the scope of operations. We may make further acquisitions or disposals which can be dilutive to margins and earnings in the near term.
2020 Outlook by divisionHealth: We expect organic growth to be broadly in line with 2019, with Clinical Solutions continuing to drive the division’s growth. We expect the full-year adjusted operating profit margin to be broadly stable due to increased investment in sales & marketing and product development. Investment is expected to weigh on the first-half 2020 margin.
Tax & Accounting: We expect organic growth to moderate in 2020 due to a challenging comparable in Europe (following exceptionally strong growth in 2019) and due to some moderation in the United States. We expect the full-year adjusted operating profit margin to see a further increase.
Governance, Risk & Compliance: We expect modest improvement in the division’s organic growth notwithstanding slight moderation in transactional volumes in 2020. We expect the adjusted operating profit margin to be marginally lower than in 2019 due to increased product investment and the absence of one-time benefits.
Legal & Regulatory: We expect organic growth to moderate slightly from 2019 levels due to a challenging comparable. We expect the adjusted operating profit margin to show improvement.
2020 Full-Year Outlook
Our overall guidance for full-year 2020 is provided in the table below. We expect to deliver another year of solid organic growth, supported by all four divisions. We expect
to achieve an increase in the full-year adjusted operating profit margin, driven by Tax & Accounting and Legal & Regulatory.
2020 Full-year outlook
Performance indicators 2020 Guidance 2019
Adjusted operating profit margin in % 23.5-24.0 23.6
Adjusted free cash flow in € million 800-825 807
ROIC in % Around 12 11.8
Diluted adjusted EPS in € Mid- to high single-digit growth 2.90
Note: Guidance for adjusted operating profit margin and ROIC are in reporting currencies and assume a 2020 average U.S. dollar rate of approximately €/$ 1.11. Guidance for adjusted free cash flow and earnings per share are in constant currencies (€/$ 1.12). Guidance for adjusted EPS includes the estimated effect of the announced up to €350 million share buyback planned for 2020.
Cash flow
€ million, unless otherwise stated 2019 2018* Variance
Net cash flow from operating activities 1,102 1,001 101
Net cash flow used in investing activities (231) (83) (148)
Net cash flow used in financing activities (631) (1,499) 868
Adjusted operating cash flow 1,049 1,026 23
Capital expenditure (226) (214) (12)
Adjusted free cash flow 807 762 45
Diluted adjusted free cash flow per share (€) 2.96 2.73 0.23
Cash conversion ratio (%) 96 104
* 2018 restated for IFRS 16. See Note 1 – General and Basis of Preparation.
The net cash inflow for 2019 was €240 million (2018: net cash outflow of €581 million) because the net cash from operating activities outweighed the net cash used in financing- and investing activities.
Adjusted operating cash flow was €1,049 million, up 2% overall due to the stronger U.S. dollar (2018: €1,026 million) and down 2% in constant currencies. Cash conversion ratio declined to 96% (2018: 104%), mainly due to working capital movements related to the timing of payments.
Paid financing costs, excluding lease interest paid, declined substantially to €46 million (2018: €96 million), as the prior year included the final coupon payment on the 6.375% senior Eurobond redeemed in April 2018.
Income tax paid reduced to €195 million (2018: €206 million), reflecting the favorable timing of tax payments and refunds, while 2018 included tax paid on disposal gains.
Net cash use of restructuring provisions amounted to €6 million (2018: €5 million cash outflow), relating to net restructuring additions of €13 million and appropriations of €19 million during the year.
Net capital expenditure was €226 million or 4.9% of total revenues (2018: €214 million; 5.0% of revenues). The prior year included a €9 million positive impact related to the sale of office real estate. Most of our capital expenditure relates to the development of new and enhanced products and technology platforms.
Cash repayment of lease liabilities, including lease interest paid, increased to €80 million (2018: €74 million), reflecting a new office facility in New York, NY.
Adjusted free cash flow was €807 million (2018: €762 million), up 6% overall and up 1% in constant currencies. Lower cash conversion was compensated for by lower interest and tax paid.
Dividends paid to shareholders during 2019 amounted to €280 million (2018: €277 million) and included the 2018 final dividend and the 2019 interim dividend.
During the year, we deployed €350 million (2018: €550 million) of free cash flow towards repurchasing shares.
Acquisitions and divestmentsTotal acquisition spending, net of cash acquired and including transaction costs, was €35 million (2018: €170 million) and primarily relates to the acquisition of CLM Matrix for €31 million by Governance, Risk & Compliance. Deferred payments on prior year deals, including earnouts, amounted to €1 million (2018: €12 million). Divestment proceeds, net of cash disposed and transaction costs, were €39 million (2018: €304 million) and relate to the divestments of our 40% stake in an Austrian information business, certain Allied Health titles, and other small assets.
Leverage and Financial Policy Wolters Kluwer uses its cash flow to invest in the business, both organically and through acquisitions, to maintain optimal leverage, and to provide returns to shareholders. We regularly assess our financial position and evaluate the appropriate level of debt in view of our expectations for cash flow, investment plans, interest rates, and capital market conditions.
While we may temporarily deviate from our leverage target at times, we continue to believe that, in the longer run, a net-debt-to-EBITDA ratio of around 2.5x remains appropriate for our business given the high proportion of recurring revenues and resilient cash flow.

46 47Wolters Kluwer 2019 Annual Report Wolters Kluwer 2019 Annual Report
Table of Contents | Consolidated Financial Statements | Company Financial Statements
IntroductionThe company has a two-tier board structure consisting of an Executive Board and a Supervisory Board. The Executive Board and the Supervisory Board are responsible for the corporate governance structure. This Corporate Governance chapter comprises the corporate governance statement as specified in section 2a of the Decree with respect to the contents of the annual management report (Besluit inhoud bestuursverslag). Wolters Kluwer complies with all Principles and Best Practice Provisions of the Corporate Governance Code, unless stipulated otherwise in this chapter. Potential future material corporate developments might justify deviations from the Corporate Governance Code at the moment of occurrence. The Corporate Governance Code is available on www.mccg.nl.
Executive BoardThe Executive Board consists of the CEO and CFO and is entrusted with the management and day-to-day operations of the company. The Executive Board is responsible for achieving the company’s aims, the strategy and associated risk profile, the development of results, and sustainability. The responsibilities are set out in the By-Laws of the Executive Board. These By-Laws have been approved by the Supervisory Board and are available on www.wolterskluwer.com. In fulfilling its management responsibilities, the Executive Board takes into account the interests of the company and its affiliated business, as well as the relevant interests of the company’s stakeholders. The members of the Executive Board are appointed by the General Meeting of Shareholders. The full procedure for appointment and dismissal of members of the Executive Board is explained in the company’s Articles of Association, available on www.wolterskluwer.com. Information on the members of
the Executive Board is provided in Executive Board and Supervisory Board.
RemunerationThe remuneration of the Executive Board is determined by the Supervisory Board based on the remuneration policy approved by the General Meeting of Shareholders. The remuneration policy for the Executive Board was adopted by the Annual General Meeting of Shareholders in 2004 and most recently amended in 2011. In line with the new Dutch law, which implements the amended European Shareholder Rights Directive, the remuneration policy was amended. The amended version of the remuneration policy will be submitted to the Annual General Meeting of Shareholders of April 23, 2020. The Supervisory Board is responsible for the execution of the remuneration policy, based on the advice of the Selection and Remuneration Committee. Detailed information about the remuneration policy and its application in 2019 can be found in the Remuneration Report.
Under the Long-Term Incentive Plan (LTIP), Executive Board members can earn ordinary shares after a vesting period of three years, subject to clear and objective three-year performance criteria established in advance. As per the amended remuneration policy, the Executive Board members will be required, in line with Best Practice Provision 3.1.2 (vi) of the Corporate Governance Code, to hold the shares (net of taxes) after vesting for two more years (starting with the 2020-2022 performance period). However, if an Executive Board member is eligible for a company-sponsored deferral program and chooses to participate by deferring LTIP proceeds upon vesting, then such Executive Board member will be required to hold the remaining vested shares or a minimum of 50% of vested shares (net of taxes), whichever is higher for a two-year
Corporate Governance
This chapter provides an outline of the broad corporate governance structure of the company. Wolters Kluwer N.V., a publicly listed company organized under Dutch law, is the parent company of the Wolters Kluwer group. The corporate governance structure of the company is based on the company’s Articles of Association, the Dutch Civil Code, the Dutch Corporate Governance Code (the ‘Corporate Governance Code’), and all applicable laws and regulations.
Corporate Governance and Risk Management
period. For the current performance periods (up to and including the 2019-2021 cycle), Executive Board members are not required to retain the shares for a period of five years, as recommended in Best Practice Provision 3.1.2 (vi) of the Corporate Governance Code.
Term of appointmentSince the introduction of the first Corporate Governance Code in 2004, Executive Board members are appointed for a period of four years, after which reappointment is possible. The existing contract with Ms. McKinstry, who was appointed before the introduction of the first Corporate Governance Code and has an employment contract for an indefinite period, will be honored.
Severance arrangementsWith respect to future Executive Board appointments, the company will, as a policy, comply with Best Practice Provision 3.2.3 of the Corporate Governance Code regarding the maximum severance remuneration in the event of dismissal. In line with this Best Practice Provision, the contract with Mr. Entricken contains a severance payment of one year’s base salary. However, the company will honor the existing contract with Ms. McKinstry who was appointed before the introduction of the first Dutch Corporate Governance Code.
Change of controlThe employment contracts of the Executive Board members and a small group of senior executives contain stipulations with respect to a change of control of the company. According to these stipulations, in case of a change of control, the relevant persons will receive 100% of the number of conditional rights on shares awarded to them with respect to pending Long-Term Incentive Plans of which the performance period has not yet ended. In addition, they are entitled to a cash severance payment if their employment agreement would end following a change of control.
Supervisory BoardThe Supervisory Board supervises the policies of the Executive Board and the general affairs of the company and its enterprise, taking into account the relevant interests of the company’s stakeholders, and advises the Executive Board. The supervision includes the effectiveness of the company’s internal risk management and control systems and the integrity and quality of the financial reporting. The Supervisory Board also has due regard for sustainability issues. In addition, certain resolutions of the Executive Board must be approved by the Supervisory Board.
These resolutions are listed in the By-Laws of the Supervisory Board and include:• Transactions in which there are conflicts of interest with
Executive Board members that are of material significance for the company or the Executive Board member;
• Acquisitions or divestments of which the value is at least equal to 1% of the consolidated revenues of the company;
• The issuance of new shares or granting of rights to subscribe for shares; and
• The issue of bonds or other external financing of which the value exceeds 2.5% of annual consolidated revenues.
The responsibilities of the Supervisory Board are set out in the By-Laws of the Supervisory Board, published on www.wolterskluwer.com.
Appointment and compositionThe members of the Supervisory Board are appointed by the General Meeting of Shareholders. The full procedure of appointment and dismissal of Supervisory Board members is explained in the company’s Articles of Association, available on www.wolterskluwer.com. The current composition of the Supervisory Board can be found in Executive Board and Supervisory Board, and Report of the Supervisory Board. The composition of the Supervisory Board shall always be such that the members are able to act critically and independently of one another, the Executive Board, and any particular interests. As a policy, the Supervisory Board in principle aims at having all its members independent from the company, which currently is the case. The independence of Supervisory Board members is monitored on an ongoing basis, based on the criteria of independence as set out in Best Practice Provisions 2.1.7 and 2.1.8 of the Corporate Governance Code and Clause 1.5 of the Supervisory Board By-Laws. Further information on the Supervisory Board members can be found in the section Executive Board and Supervisory Board.
The number of supervisory board memberships of all Supervisory Board members is limited to such extent that the proper performance of their duties is assured. The number of board memberships of all Supervisory Board members is currently in compliance with the maximum number of board seats allowed under Dutch law.
Provision of informationWolters Kluwer considers it important that the Supervisory Board members are well-informed about the business and operations of the company. The Chairman of the Supervisory Board, the CEO and Chairman of the Executive Board, and the Company Secretary monitor, on

48 49Wolters Kluwer 2019 Annual Report Wolters Kluwer 2019 Annual Report
Table of Contents | Consolidated Financial Statements | Company Financial Statements
female, both in the Supervisory Board and the Executive Board, and at the division CEO level.
On December 31, 2019, the Supervisory Board had a female representation of 43%. Currently (after the resignation of Ms. Russo per year-end 2019), 33% of the Supervisory Board members are female, 50% of the Executive Board members are female, and 75% of the division CEO’s are female (divisions: Health, Tax & Accounting, Governance, Risk & Compliance, and Legal & Regulatory). After the appointment of Ms. Vandebroek at the AGM of April 23, 2020, the percentage female representation in the Supervisory Board will return to 43%. The Supervisory Board composition also comprises expertise within the broad information industry as well as specific market segments in which the company operates. Four nationalities are represented on the Supervisory Board. The composition of the Executive Board and Supervisory Board is in line with the diversity policy and Dutch law. For more information see Executive Board and Supervisory Board, and the Corporate Governance section on the website.
Insider Dealing PolicyThe members of the Executive Board and Supervisory Board are bound to the Wolters Kluwer Insider Dealing Policy and are not allowed to trade in Wolters Kluwer securities during closed periods. These periods begin either on the first business day of the quarter, or 30 calendar days prior to the publication of Wolters Kluwer’s annual results, half-year results, and first-quarter trading update and nine-month trading update, whichever is earlier. The day after the announcement of these results or updates, the Board members can trade again, with prior approval of the securities compliance officer which will be granted if they do not have inside information at that point in time.
Value creation and cultureThe Executive Board has adopted four company values that serve as guidelines for our employees and are at the heart of the company’s future success. The Business Principles serve as the company’s code of conduct and are an umbrella for several other policies and principles. These policies cover a wide range of domains to ensure the continuous compliance with high business standards. Further, the company has put in place a procedure to report any suspected misconduct or irregularities through various channels, including SpeakUp, the global reporting system, allowing employees to report their concerns in their own language to the Ethics & Compliance Committee. Our company values, Business Principles and related policies, and SpeakUp contribute to a culture focused on long-term value creation.
an ongoing basis, that the Supervisory Board receives adequate information. In addition, the CEO sends written updates to the Supervisory Board about important events. The Chairman of the Supervisory Board and the CEO hold several meetings and calls per year outside of formal meetings, to discuss the course of events at the company.
The Supervisory Board also has direct contact with layers of management below Executive Board level. Operating managers, including divisional CEOs, are regularly invited to present to the Supervisory Board on the operations in general and business development. In addition, the company facilitates visits to business units and individual meetings with staff and line managers. Furthermore, various staff members attend the Audit Committee meetings.
Committees of the Supervisory BoardThe Supervisory Board has two standing committees: the Audit Committee and the Selection and Remuneration Committee. The responsibilities of these committees can be found in their respective Terms of Reference, which are published on www.wolterskluwer.com. A summary of the main activities of these committees, as well as the composition, can be found in the Report of the Supervisory Board.
RemunerationThe remuneration of the Supervisory Board members is determined by the General Meeting of Shareholders. The remuneration does not depend on the results of the company. The Supervisory Board members do not receive shares or stock options by way of remuneration, nor shall they be granted loans. The Supervisory Board proposes to increase its remuneration to the Annual General Meeting of Shareholders which will be held on April 23, 2020, as explained in the Report of the Supervisory Board. In line with the new Dutch law which implements the amended European Shareholder Rights Directive, the Supervisory Board established a remuneration policy for the Supervisory Board. This remuneration policy will also be submitted to the Annual General Meeting of Shareholders of April 23, 2020. For more information, see Remuneration Report.
DiversityThe company’s diversity policy for the Supervisory Board, Executive Board, and division CEOs is published on the company website as Annex to the Supervisory Board By-Laws. Elements of diversity include nationality, gender, age, and expertise. The target is to have a representation of at least 30% male and at least 30%
business model and policies relating to environmental, social, and employee-related matters, respect for human rights, anti-corruption, and bribery matters. This includes information on the results and risks related to these matters, as well as the key performance indicators.The risk profile of the company with respect to environmental, social, employee, and human rights-related matters, is considered relatively low, due to the markets we operate in, the types of products and services we deliver, our highly qualified employees, and the customers and suppliers we deal with.
Shareholders and the General Meeting of Shareholders At least once a year, Wolters Kluwer holds a General Meeting of Shareholders. The agenda of the Annual General Meeting of Shareholders shall in each case contain the report of the Executive Board, the report of the Supervisory Board, the remuneration report, the adoption of the financial statements, and the proposal to distribute dividends or other distributions. Resolutions to release the members of the Executive Board and Supervisory Board from liability for their respective duties shall be voted on separately. Shareholders who alone or jointly represent at least half a percent (0.5%) of the issued capital of Wolters Kluwer shall have the right to request the Executive Board or Supervisory Board to put items on the agenda of a General Meeting of Shareholders, provided that such requests are made in writing at least 60 days before a General Meeting of Shareholders.
Voting at the Annual General Meeting of Shareholders In 2019, Wolters Kluwer again took active steps to try to reach a high percentage of shareholders present or represented at the Annual General Meeting of Shareholders. These steps included making standard proxy forms and voting instruction forms available online, enabling shareholders to give voting instructions electronically prior to the meeting, and actively contacting larger shareholders to inquire if they intended to vote during the Annual General Meeting of Shareholders. As a result, shareholders with voting rights for approximately 73% of the issued capital of the company were present or represented at the Annual General Meeting of Shareholders in 2019. Amendment Articles of AssociationA resolution to amend the Articles of Association may only be passed by the General Meeting of Shareholders at the proposal of the Executive Board subject to the approval of the Supervisory Board. The most recent amendment of the Articles of Association took place in 2016.
For more information, please see the section Embracing People and Society in the Report of the Executive Board.
Long-term value creation is embedded in both our 2019-2021 strategy, Accelerating Our Value, and our company culture. We accomplish our mission of delivering deep impact when it matters most through protecting people’s health and prosperity and contributing to a safe and just society. More information on our strategy, value creation model, and culture can be found in the Report of the Executive Board.
Risk managementThe Executive Board is responsible for identifying and managing the risks associated with the company’s strategy and activities and is supervised by the Supervisory Board. The Audit Committee undertakes preparatory work for the Supervisory Board in this area. Wolters Kluwer has implemented internal risk management and control systems which are embedded in the operations of the businesses to identify significant risks to which the company is exposed, and to enable the effective management of those risks. The aim of the systems is to provide a reasonable level of assurance on the reliability of financial reporting. For a detailed description of the risks and the internal risk management and control systems, reference is made to Risk Management.
SustainabilityThe Executive Board and Supervisory Board are committed to Wolters Kluwer’s sustainability strategy. Under supervision of the CEO and Chairman of the Executive Board, the Senior Vice President, General Counsel/Company Secretary, is responsible for the company’s sustainability strategy and our Corporate Sustainability team. To communicate the goals and progress achieved, sustainability-related (non-financial) information is included in this Annual Report. A separate Sustainability Data Report is issued jointly with the Annual Report and lists the sustainability-related data the company reports on. In addition, a dedicated section on the company’s website shows the ongoing sustainability activities and accomplishments.
Non-financial information statementIn the chapters Corporate Governance, the Report of the Executive Board, and Risk Management, Wolters Kluwer discloses non-financial information as required under the Non-Financial Information Decree (Besluit bekendmaking niet-financiële informatie) and section 2:391(1) of the Dutch Civil Code. As such, Wolters Kluwer has issued non-financial information statement by disclosing its

50 51Wolters Kluwer 2019 Annual Report Wolters Kluwer 2019 Annual Report
Table of Contents | Consolidated Financial Statements | Company Financial Statements
are independent from the company. See Report of the Wolters Kluwer Preference Shares Foundation for more information.
Information pursuant to Decree Clause 10 Take-over DirectiveThe information specified in both clause 10 of the Take-over Directive and the Decree, which came into force on December 31, 2006 (Decree Clause 10 Take-over Directive), can be found in this chapter and in Wolters Kluwer Shares and Bonds.
Legal structureThe ultimate parent company of the Wolters Kluwer group is Wolters Kluwer N.V. In 2002, Wolters Kluwer N.V. abolished the voluntary application of the structure regime (structuurregime). As a consequence, the structure regime became applicable to Wolters Kluwer Holding Nederland B.V., which is the parent company of Dutch operating subsidiaries. Wolters Kluwer International Holding B.V. is the direct or indirect parent company of the operating subsidiaries outside of the Netherlands.
For additional information and documents related to the Corporate Governance structure of Wolters Kluwer, please visit the Corporate Governance section on www.wolterskluwer.com.
Issuance of shares The Articles of Association of the company determine that shares shall be issued at the proposal of the Executive Board and by virtue of a resolution of the General Meeting of Shareholders, subject to designation of the Executive Board by the General Meeting of Shareholders. At the Annual General Meeting of Shareholders of April 18, 2019, the Executive Board was granted the authority for a period of 18 months to issue new shares, with exclusion of pre-emptive rights, subject to approval of the Supervisory Board. The authorization is limited to a maximum of 10% of the issued capital on the date of the meeting.
Acquisition of shares in the companyAcquisition of shares in the company (share buybacks) may only be effected after authorization by the General Meeting of Shareholders, and while respecting the restrictions imposed by the Articles of Association of the company. At the Annual General Meeting of Shareholders of April 18, 2019, the authorization to acquire shares in the company was granted to the Executive Board for a period of 18 months. The authorization is limited to a maximum of 10% of the issued capital on the date of the meeting. On December 31, 2019, Wolters Kluwer N.V. had 6,360,612 shares in the company (2.33% interest).
Preference shares Wolters Kluwer N.V. and the Wolters Kluwer Preference Shares Foundation (the Foundation) have concluded an agreement based on which preference shares can be taken by the Foundation. This option on preference shares is at present a measure that could be considered as a potential protection at Wolters Kluwer against exercising influence by a third party on the policy of the company without the consent of the Executive Board and Supervisory Board, including events that could threaten the strategy, continuity, independence, identity, or coherence between the activities of the company. The Foundation is entitled to exercise the option on preference shares in such a way that the number of preference shares taken will be no more than 100% of the number of issued and outstanding ordinary shares at the time of exercise. Among others by the exercise of the option on the preference shares by the Foundation, the Executive Board and the Supervisory Board will have the possibility to determine their position with respect to, for example, a party making a bid on the shares of Wolters Kluwer and its plans, or with respect to a third party that otherwise wishes to exercise decisive influence, and enables the Boards to examine and implement alternatives. All members of the Board of the Foundation
The ICF is deployed by the operating business units, the corporate office, Global Business Services, the Digital eXperience Group, and reviewed and tested by internal control officers. An annual risk assessment program for financial and IT general control risks determines the scope and controls to be tested. As part of that scope, key controls are tested annually. The results of testing are reported to management, the Audit Committee, and internal auditors on a quarterly basis. Where needed, remedial action plans are designed and implemented to address significant risks as derived from internal control testing, and internal and external audits.
Internal auditing is an independent and objective assurance and consulting activity that is guided by a philosophy of adding value to improve the operations of Wolters Kluwer. It assists in accomplishing its objectives by bringing a systematic and disciplined approach to evaluate and improve the effectiveness of the organization’s governance, risk management, and internal controls. The global Internal Audit department works according to an audit plan which is discussed with the external auditors, the Executive Board, and the Audit Committee. The plan is approved by the Executive Board and the Supervisory Board. The audit plan is based on risk assessments and focuses on strategy execution, financial reporting risks, and operational risks, including IT-related risks.
The global Risk Management department facilitates risk prevention, protection, and response programs via procurement of insurance, claims and incident management, business continuity management, loss control programs, and other initiatives to mitigate specific risks. The Internal Audit, Internal Control, Group Accounting & Reporting, Legal, Treasury, Tax, and Risk Management departments provide quarterly reports to the Audit Committee and the Executive Board.
Responsibility for risk management The Executive Board is responsible for overseeing risk management and internal controls within Wolters Kluwer. The company has implemented internal risk management and control processes, which are generally integrated into the operations of the businesses. The aim is to timely identify significant risks to which the company is exposed, to enable the effective management of those risks, and to provide a reasonable level of assurance on the reliability of the financial reporting of the Wolters Kluwer group. The Executive Board reviews an annual assessment of pertinent risks and mitigating actions and establishes the risk appetite. Based on this assessment, the Executive Board reviews the design and effectiveness of the internal risk management and control systems, taking into consideration the company’s risk appetite and the observations and reports of the internal auditor and the Corporate Risk Committee. The internal risk management and control systems cannot provide absolute assurance regarding the achievement of the company’s objectives or the reliability of the financial reporting, or entirely prevent material errors, losses, fraud, and violation of applicable laws and regulations.
Managing risks is integrated into the conduct of business of our divisions and operating entities, supported by several staff functions. The Executive Board is informed by division management about risks as part of the regular planning and reporting cycles on divisional and operational entity levels. The Corporate Risk Committee, consisting of representatives of various functional departments, meets periodically and monitors material risks and remediating actions with a focus on company-wide, non-business specific risks. The Committee also oversees the mitigation of certain risks that emerge and require a centralized approach.
Risk management and control systemsThe company has an Internal Control Framework for financial reporting (ICF), based on the COSO (Committee of Sponsoring Organizations of the Treadway Commission) 2013 framework, which is designed to provide reasonable assurance that the results of the business are accurately reflected in its internal and external financial reporting.
Risk Management
This section provides an overview of Wolters Kluwer’s approach to risk management, the main risks facing the company and the organization, as well as processes and actions to identify, assess, and mitigate these risks.

52 53Wolters Kluwer 2019 Annual Report Wolters Kluwer 2019 Annual Report
Table of Contents | Consolidated Financial Statements | Company Financial Statements
Risk categories and risk appetiteWolters Kluwer broadly classifies risks into the following categories: strategic & operational, legal & compliance, financial, and financial reporting. The tables on the following pages outline the 22 main risks the company has assessed up to the date of this Annual Report. It is not the intention to provide an exhaustive description of all possible risks. There may be risks that are not known yet or the company has not yet fully assessed. It is also possible that existing risks have been assessed as not significant, which could in the future develop into a material exposure for the company and have a significant adverse impact on its business. The company’s risk management and internal control systems have been designed to identify, mitigate, and respond to risks in a timely manner. However, full assurance cannot be attained.
The risk appetite of the main risks is qualified as balanced, conservative, or minimal. To achieve its strategic goals, Wolters Kluwer is prepared to take duly balanced risks in certain strategic areas, such as acquisitions, expansion in high-growth countries, and the launch of new innovative products. With respect to other risk categories, the approach of the company towards risks could be qualified as conservative, with regulatory compliance and financial reporting risks as the most conservative categories. The company carefully weighs risks against potential rewards. Actions to prevent and mitigate risks and uncertainties are summarized for each of the individual risks in the tables on the following pages.
Strategic & operational risks
Risk description and impact Mitigation
Economy and marketsGlobal and regional economic conditions may have a negative effect on several products. The impact of these conditions on the overall portfolio will depend on the severity of the economic issue, the countries or regions affected, and potential government responses. Our more cyclical products, which include training activities, advertising, books (Health/LR), and lending-related and corporate formation-related transactions (GRC), may be especially sensitive to economic conditions.
In 2019, the company continued progress in shifting the company’s portfolio towards digital and high-growth businesses. Recurring revenues represent 78% of the company’s consolidated revenues, reinforcing the company’s resilience. Furthermore, revenues come from a diversified product portfolio, customer segments, and geographic footprint bringing benefits of diversification. We continued reshaping the business through strategic acquisitions and divestments. The company monitors relevant political and macroeconomic issues (e.g. Brexit) in terms of risks and opportunities. At this moment, Brexit is not believed to have a direct material impact on Wolters Kluwer’s business.
ProductsThe decline of revenues coming from our legacy print business, which is a small proportion of our portfolio, including books and print-based subscriptions, may further accelerate. Most of our print portfolio is in Health (HLRP), Legal & Regulatory, and a small piece in Tax & Accounting.
The company mitigates the decline of print-related revenues through upgrading customers from print to digital products, customer retention management, and upselling opportunities. The company continues assessing its portfolio, leading to divestment of legacy businesses offset by acquisitions in growing markets and organic growth.
CompetitionWolters Kluwer faces competitive challenges from existing and new competitors, including free availability of some sources of information.
The company mitigates competitive risks by the current portfolio diversified by customer segment and product mix, with high recurring revenues, providing natural barriers to entry. The company further performs an analysis of its competitive landscape to focus on areas of concentration risk, growth risk, and margin risk and various levers in play to address and mitigate. We continue to invest 8%-10% of revenues annually in product development to expand offerings in expert solutions and services to support pricing levels and growth, and to transform our legacy information products.
Trends impacting business modelsTechnological or demographic trends might affect current business models. These developments could for example include disruptive technologies, such as the impact of artificial intelligence on the activities of professionals. In addition, new generations of customers might expect a different approach and different tools and solutions to support them in their work.
The company actively monitors trends in the markets in which the company operates and that might affect its business in the future. We ensure to have a strong understanding of evolving customer needs by closely monitoring net promotor scores, actively engaging via customer advisory boards, and hosting and participating in leading industry conferences. Further, we continue the adoption of advanced technologies throughout the company via our technology centers of excellence, innovation incentive programs, such as the Global Innovation Awards, and division-specific initiatives. Deep understanding of our customers, enabled by strong advanced technological capabilities, continues to allow the company to transform its portfolio of information, software solutions, and services, enhance its expert solutions, and ensuring alignment with longer-term trends. Finally, maintaining a diverse workforce, with good understanding of current and future customer needs, also contributes to safeguarding future value creation by the company.
54 55Wolters Kluwer 2019 Annual Report Wolters Kluwer 2019 Annual Report
Table of Contents | Consolidated Financial Statements | Company Financial Statements
Mergers and acquisitions (M&A)Risks with respect to acquisitions primarily relate to the integration of the acquired companies, retaining key personnel, and realization of projected sales and synergies.
The company has strict strategic and financial criteria for acquiring new businesses. The company’s investment decisions are very selective: the focus is on businesses with proven track record (relatively lower risk), that are relatively predictable. We conduct broad-based due diligence of acquisitions, using internal expertise and top-notch external due diligence and legal professionals. We also maintain relationships with preferred due diligence suppliers who have deep expertise in our targeted sectors, and incorporate lessons learned from prior transactions. The company uses contractual indemnities and warranties from the seller, and deal structures, such as earnout agreements to retain management and to assure alignment between the purchase price and the performance of the acquired company. Generally, acquisitions are expected to be accretive to adjusted earnings per share in year one and cover the company’s weighted average cost of capital within three to five years. Post-merger integration plans are developed with assistance from the company’s internal corporate carve out & integration team. The Executive Board approves an acquisition integration plan prior to completing an acquisition, which is actively managed and monitored after completion. In addition, capital allocation to M&A is very balanced.
DivestmentsExecution of the company’s strategy is also supported by the divestment of non-core activities. The ability to successfully divest operations can depend on the historical and projected perfor-mance of the business, economic and market circumstances, competitive dynamics, contractual obligations, shared costs within the group, the ability of the business to operate stand-alone, retention of key personnel, the buyer’s ability to realize synergies, and other factors.
To mitigate risks related to material divestments, the company usually carries out a vendor due diligence and engages external experts for such due diligence and execution of the transaction.
Risk description and impact Mitigation
IT and cybersecurityWolters Kluwer is exposed to IT-related risks and cyber threats that could affect our IT infrastructure and system availability, applications, and company and customer data.
The company takes active steps to mitigate IT and cybersecurity risks by increasing the investment in a globally managed cybersecurity program to effectively manage execution of project plans and provide management accountability at various levels. The company adopted the National Institute of Standards and Technology, Cyber Security Framework (NIST-CSF) to expand the maturity-based model of our cybersecurity program into a risk-based model. Further, we matured our controls for industry requirements by continuously assessing them against industry compliance programs, i.e. SOC 2 and ISO requirements. Also, we strengthened IT disaster recovery and updated our incident management capabilities to account for cyberattacks. The Annual Compliance Training program for all employees was again provided in 2019, consisting of policy education and online security modules. We also continued updating and aligning local policies/standards with global policies.
We implemented a mobile device management solution to protect our mobile devices and are actively implementing Multi Factor Authentication (MFA) to all users accessing our main internal IT systems. We completed SOC2 assessments on our cloud services and conducted risk evaluations for all our critical vendors through questionnaires and on-site audits. Further, we improved network resilience with the implementation of the network peering point, and customer service availability with the implementation of an additional cloud-based solution to enhance availability.
IT General Controls form an integral part of Wolters Kluwer’s Internal Control Framework and are aligned with the Global Information Security Policy. Controls over data and security programs are periodically tested to ensure personal data is adequately protected.
The company will continue to strengthen its security and incident response plans throughout 2020. IT and cybersecurity are standing Corporate Risk Committee agenda items.
Supply chain, technological developments, and projectsOur businesses could be adversely affected by the dependency on our supply chain, including but not limited to parties delivering outsourced and offshored data center services, software development, and maintenance activities, including back-office transaction processing.
Implementing new technology-related initiatives for delivering Wolters Kluwer’s products and services, as well as achieving cost efficiencies through technology/IT sourcing initiatives, are inherently complex and are subjected to many execution risks during the development and implementation phases.
To mitigate supply chain risks, the company applies third-party risk management criteria when choosing external partners and ensures detailed operating and service agreements with these external providers. We monitor progress and performance of key vendors during the term of agreement by oversight boards and program management teams. Centrally managed suppliers are subject to due diligence screening and requested to sign the Wolters Kluwer Supplier Code of Conduct or provide an equivalent standard. Over the past years, we have set a roadmap for consolidation and simplification of IT infrastructure and for implementing more service capabilities to support customers.
In addition, we implemented the procurement-hub, a transformational change to our sourcing and procurement operations. This includes a sourcing and procurement-wide enterprise solution and streamlined processes to further centralize our supplier onboarding and third-party risk management activities.
The Corporate Quality Assurance team aims to improve the success of large change initiatives by providing assurance that the key projects can move to the next stage of development or implementation, and by transferring lessons learned from one project to another. This team also supports standardization of change methodologies and frameworks.
Risk description and impact Mitigation

56 57Wolters Kluwer 2019 Annual Report Wolters Kluwer 2019 Annual Report
Table of Contents | Consolidated Financial Statements | Company Financial Statements
People and organizationThe success of the company is highly dependent on its ability to attract and retain talent with the skills and experience to deliver on current and future requirements.
The company ensures its ability to attract and retain talent through competitive, market-based rewards with a focus on pay for performance, aligned with individual and company achievements where appropriate, benefits benchmarked in local markets, and career development opportunities within the company. We have formal talent management programs that incorporate career progression tools, succession planning, company-sponsored learning programs, and consistently applied performance evaluation systems. In addition, we measure our recruiting efficiencies and the turnover patterns of our workforce to monitor and continuously improve our hiring and retention practices. Also, we conduct periodic surveys of the global workforce, to ensure management maintains a current view of employee engagement and insights for how to continuously improve it.
FraudIn the conduct of its business, the company may be exposed to internal or external fraudulent or related criminal actions relating to cyber frauds/malicious acts where a bad actor attempts to take something of value (tangible or intangible assets) from the company.
The Corporate Risk Committee examines potential exposure to fraudulent activities and is continuously implementing measures to address this. The company has continued the improvement of processes and procedures to mitigate this risk and build employee awareness across the organization. In addition to technical activities undertaken by information security and data privacy functions, the company issued fraud alerts and conducted anti-fraud/anti-cybercrime workshops and training sessions within at-risk businesses and functions, using case studies and best practices to further raise global fraud awareness and reduce social engineering risks.
Measures to mitigate risks relating to internal fraud include reviews that ensure adherence to the Wolters Kluwer Internal Control Framework: including strict policies on segregation of duties, risk-based internal audits, (fraud) risk assessment activities, staff training, and information sharing. The 2019 Annual Compliance Training included a specific module on fraud awareness.
Property damage and related non-technological business interruptionThe company could be exposed to damages to its tangible assets (i.e. facilities, IT and communications hardware, physical property) which could cause business interruption.
To mitigate against property damage and related non-technological business interruption risks, the company has implemented a centralized worldwide risk control and business continuity management program. Regular loss control visits at key operating companies and supplier locations are conducted by company risk managers accompanied by insurers. They work with our operating companies to cost-effectively implement recommendations for continued improvement. The company established a multi-disciplinary Global Incident Management Program to strengthen the ability to manage crises and incidents, irrespective of the type. Incident management is a standing agenda topic of the Corporate Risk Committee and incidents are reported quarterly to the Audit Committee.
Mitigation of technological risks to intangible property are described under the risk category IT and cybersecurity.
Risk description and impact Mitigation
Brand and reputation With the increasing prominence of the Wolters Kluwer brand, the company potentially becomes more vulnerable for brand or reputation risks.
To mitigate brand and reputation risks, the company has established the cross-functional Global Brand Organization that oversees the brand strategy and implementation work by the Global Branding & Communications (GBC) team. The GBC team works closely with other corporate functions and the businesses to grow the equity and awareness of the brand while monitoring any potential reputational risks.
In 2019, the GBC team implemented a new measurement system and new tools aimed at tracking progress in our strategy deployment, monitoring media coverage, and measuring brand perception and any positive or negative sentiment for Wolters Kluwer and key competitors globally. The Global Incident Management program enhances the coordination and communications among all our divisional and functional teams to manage crises and incidents which could affect the company’s reputation. Certain relevant teams have been trained on crisis preparedness.
Legal & compliance risks
Regulatory complianceThe company can be exposed to non-compliance with laws, regulations, or internal policies. Non-compliance could result in fines, restrictions on business, third-party claims, and reputational damage.
Compliance is an integral part of Wolters Kluwer’s Internal Control Framework which includes semi-annual Letters of Representation, annual internal control testing, and regular internal audits. Pertinent training programs are provided to all employees to create awareness about compliance subjects, mitigate compliance related risks and reinforce tone at the top. The training programs provide employees with knowledge to recognize potential violations or non-compliance with laws, regulations, or internal policies, so that non-compliance can be avoided. Our global reporting system SpeakUp allows employees to report any suspected non-compliance for investigation and remediation. The Ethics & Compliance Committee oversees the company’s compliance program and related initiatives, including the company’s Business Principles and related policies. In 2019, we implemented a new Trade Compliance Policy and updated our Business Principles to a Code of Business Ethics for release in 2020. We maintain a cross-functional enterprise-wide compliance program for monitoring and complying with applicable privacy laws, including the General Data Protection Regulation (GDPR) and the California Data Privacy Act (CCPA). We continuously evaluate whether legislative changes, new products, or business acquisitions require additional compliance efforts.
Risk description and impact Mitigation

58 59Wolters Kluwer 2019 Annual Report Wolters Kluwer 2019 Annual Report
Table of Contents | Consolidated Financial Statements | Company Financial Statements
Corruption and bribery As Wolters Kluwer’s businesses operate worldwide, these are exposed to diverse business cultures and practices. In addition, our customers include governmental and quasi-governmental organizations. These are factors that could potentially contribute to the risk of corruption and bribery.
Wolters Kluwer’s policies prohibit employees, either directly or indirectly, from offering, promising, demanding, or accepting bribes to obtain or retain business. The company has policies setting restrictions on accepting and offering gifts and hospitality. Our annual training makes all employees globally aware of these rules. In 2019, we launched a new training course with specific modules on anti-corruption and anti-bribery. Further, we conduct due diligence screening of centrally managed suppliers, that includes anti-bribery safeguards and the requirement to sign our Supplier Code of Conduct or adhere to an equivalent standard. Finally, our global misconduct reporting system SpeakUp encourages employees to report any suspected act of corruption or bribery.
Contractual complianceThe company could be exposed to claims by its contractual counterparties based on alleged non-compliance with contractual obligations, covenants, restrictions, and representations, such as the limits on number of users (available licenses), price commitments, or services to be delivered.
The company mitigates contractual compliance risks by negotiating contracts with attention to risk transfer clauses, representations, and warranties and covenants. For part of our vendor contracts, we use contract management systems to monitor material contractual rights and obligations, and software tools to track the use of software for which licenses are required. We implemented contract playbooks for the company’s internal legal department to assist in standardizing negotiation positions with respect to customer contracts. Further, our limitation of liability policy standardizes negotiation of liability provisions in SaaS and software agreements with customers and establishes an exceptions process to ensure proper balancing of risks and benefits.
Intellectual property protectionIntellectual property rights could be challenged, limited, invalidated, circumvented, or infringed.Technological developments make it increasingly difficult to protect intellectual property rights. Changes in legislation could have an impact on the ability to protect intellectual property rights.
Wolters Kluwer actively protects its intellectual property rights to safeguard its portfolio of information, software solutions, and services. The company relies on trademark, copyright, patent, and other intellectual property laws to establish and protect its proprietary rights to these products and services. We monitor legislative developments with respect to intellectual property rights. Our central trademarks database provides expert protection and supports the monitoring of our intellectual property. We updated intellectual property policies and procedures to ensure the proper protection of the company’s intellectual property rights.
Third-party claimsThe company may be exposed to litigation, administrative actions, and other claims by third parties, including claims relating to products, services (including software and SaaS offerings), informational content provided or published by the company, and employee and vendor relations. Such claims may be based on legal theories such as alleged negligence, product liability, breach of contract, or infringement of third-party intellectual property rights.
The company mitigates these risks by striving to produce high-quality products, services, and content, and by generally including disclaimers and limitations of liability in its contracts. The Business Principles require employees to comply with intellectual property laws and regulations. Further, the company’s limitation of liability policy standardizes negotiation of liability provisions in software customer agreements.
The company’s insurance program cover certain types of claim exposures. The company manages a range of insurable risks by arranging for insurance coverage for first-party and third-party liability exposures.
Risk description and impact Mitigation
Legislative developmentsChanges in laws, legislation, or trade restrictions could impact the company’s businesses in certain jurisdictions. Countries could impose restrictions on ownership of publishing activities by foreign companies.
The company monitors legislative developments and regulatory changes, including trade restrictions, to assess the potential impact on its businesses. In certain cases, the company partners with local companies to facilitate compliance with applicable laws.
Financial risks
Treasury Fluctuations in exchange and interest rates can adversely affect Wolters Kluwer’s results.
It is the company’s goal to mitigate the effects of currency and interest rate fluctuations on net profit, equity, and cash flow. Whenever possible, the company tries to do this by creating natural hedges, by matching the currency profile of income and expenses and of assets and liabilities.When natural hedges are not present, Wolters Kluwer strives to realize the same effect with the aid of derivative financial instruments. For this purpose, hedging ranges have been identified and policies and governance are in place, including authorization procedures and limits. The company only purchases or holds derivative financial instruments with the aim of mitigating risks, and not for speculative purposes. Most of these instruments qualify for hedge accounting as defined in IFRS 9. More disclosure and detailed information on financial risks and policies is provided in Note 30 – Financial Risk Management. The Treasury Policy on market risks (currency and interest), liquidity risks, and credit risks is reviewed by the Audit Committee, with quarterly reporting by the Treasury Committee to the Audit Committee on the status of these financial risks.
Post-employment benefitsThe company maintains a number of post-employment benefit programs globally. Generally, these programs are defined contribution plans, yet in some countries we maintain defined benefit plans, the largest of which is an active plan in the Netherlands, and next in size are the frozen and/or closed plans in the United States, the United Kingdom, Canada, Belgium, and Australia. For most of the active plans, the company as well as employees make investments for the future benefit of participants. For the frozen and/or closed plans, the company has to ensure they are properly funded to provide the committed level of benefits to participants. From a risk point of view, for the defined benefits plans, funding requirements are influenced by interest rates and the investment returns on the assets invested in each respective plan, which are influenced by financial markets and economic conditions.
The company performs an ongoing evaluation of all plans to ensure we are market competitive with designs that minimize risk and volatility. Steps we have taken to mitigate our risk include moving our closed retiree medical plan in the United States to a private exchange, thereby eliminating the liability and the financial risk of the program, lowering the risk of the frozen or closed defined benefit plans starting with the United States where we have lowered the company’s liability by reducing the number of participants in the plan through a cost-effective lump sum distribution initiative, and annuitizing a portion of the plan, thereby removing a third of the plan’s overall liability. We are also closely managing our investment strategy to see stronger asset returns with hedging parameters to manage downside risk. Further, we partner with independent expert advisors on market competitive plan design, plan performance monitoring, and defining investment and hedging strategies for all of our plans. The accounting for defined benefit plans is based on annual actuarial calculations in line with IAS 19 Employee Benefits.
Risk description and impact Mitigation

60 61Wolters Kluwer 2019 Annual Report Wolters Kluwer 2019 Annual Report
Table of Contents | Consolidated Financial Statements | Company Financial Statements
TaxesChanges in operational taxes and income tax rates, laws and regulations could adversely affect the company’s financial results, and tax assets and liabilities.
Next to income taxes, most taxes are either transactional or employee-related and are levied from the legal entities in the relevant jurisdictions. Wolters Kluwer maintains a liability for uncertain tax positions in line with IFRS accounting standards. The adequacy of this liability is evaluated on a regular basis in consultation with external advisors. Reference is made to Note 23 – Tax Assets and Liabilities for additional information about income tax and related risks. As a leader in tax and accounting products, the company takes its responsibility as a corporate citizen seriously. The company reviews its Tax Principles annually and updates them where necessary. The next update is scheduled for 2020. The principles are published on www.wolterskluwer.com.
Financial reporting risks
Misstatements, accounting estimates and judgments, and reliability of systemsThe processes and systems supporting the financial reporting may be susceptible to unintentional misstatements or manipulation.The preparation of financial statements in conformity with IFRS requires management to make judgments, estimates, and assumptions. Actual results may differ from those estimates and assumptions.
The company mitigates these risks by maintaining an Internal Control Framework for financial reporting as described in the introduction to this chapter. In addition, senior executives in the divisional and operating companies and senior corporate staff members sign Letters of Representation semi-annually, certifying compliance with laws and policies. Independent internal audits are carried out to ensure compliance with policies and procedures and ensure that existing controls provide adequate protection against actual risks. Further, financial results are inquired and reviewed by the Business, Analysis & Control, Group Accounting & Reporting, Treasury, and Corporate Tax departments and the Executive Board as part of regular business reviews.
potential impact Adjusted operating profit
€ millions
Diluted adjusted EPS
€ cents
1% decline of the U.S. dollar against the euro (9) (2)
1% decrease in discount rate in determining the gross service costs for the post-employment benefit plans (7) (2)
1% increase in interest rate assuming same mix of variable and fixed gross debt n/a (1)
1% increase in the benchmark tax rate on adjusted net profit n/a (4)
Risk description and impact Mitigation
Sensitivity analysisFluctuations in exchange, discount, interest, and tax rates affect Wolters Kluwer’s results. The following table illustrates the sensitivity to a change in these rates for adjusted operating profit and diluted adjusted EPS:
The Executive Board is responsible for the preparation of the financial statements in accordance with International Financial Reporting Standards (IFRS) as adopted by the European Union and with Part 9 of Book 2 of the Dutch Civil Code. The financial statements consist of the consolidated financial statements and the company’s financial statements. The responsibility of the Executive Board includes selecting and applying appropriate accounting policies and making accounting estimates that are reasonable in the circumstances.
The Executive Board is also responsible for the preparation of the Report of the Executive Board (which for this statement includes Corporate Governance and Risk Management) that is included in the 2019 Annual Report. The Report of the Executive Board and the Financial Statements are prepared in accordance with Part 9 of Book 2 of the Dutch Civil Code. The Executive Board endeavors to present a fair review of the situation of the business at balance sheet date and of the course of affairs in the year under review. Such an overview contains a selection of some of the main developments in the financial year and can never be exhaustive.
The company has identified the main risks it faces, including financial reporting risks. These risks can be found in Risk Management. In line with the Dutch Corporate Governance Code and the Dutch Act on financial supervision (Wet op het financieel toezicht), the company has not provided an exhaustive list of all possible risks. Furthermore, developments that are currently unknown to the Executive Board or considered to be unlikely may change the future risk profile of the company.
The company must have internal risk management and control systems that are suitable for the company. The design of the company’s internal risk management and control systems (including the Internal Control Framework for financial reporting) has been described in Risk Management. The objective of these systems is to manage, rather than eliminate, the risk of failure to achieve business objectives and the risk of material errors to the financial reporting. Accordingly, these systems can only provide reasonable, but not absolute, assurance against material losses or material errors.
As required by provision 1.4.3 of the Dutch Corporate Governance Code and Section 5:25c(2)(c) of the Dutch Financial Markets Supervision Act (Wet op het financieel toezicht) and on the basis of the foregoing and the explanations contained in Risk Management, the Executive Board confirms that to its knowledge:• There have been no material failings in the effectiveness
of the company’s internal risk management and control systems;
• The company’s internal risk management and control systems provide reasonable assurance that the financial reporting over 2019 does not contain any errors of material importance;
• There is a reasonable expectation that the company will be able to continue in operation and meet its liabilities for at least 12 months, therefore it is appropriate to adopt the going concern basis in preparing the financial reporting;
• There are no material risks or uncertainties that could reasonably be expected to have a material adverse effect on the continuity of the company’s enterprise in the coming 12 months;
• The 2019 Financial Statements give a true and fair view of the assets, liabilities, financial position, and profit or loss of the company and the undertakings included in the consolidation taken as a whole; and
• The Report of the Executive Board includes a fair review of the situation at the balance sheet date, the course of affairs during the financial year of the company, and the undertakings included in the consolidation taken as a whole, together with a description of the principal risks that the company faces.
Alphen aan den Rijn, February 25, 2020
Executive BoardNancy McKinstryCEO and Chairman of the Executive Board Kevin EntrickenCFO and member of the Executive Board
Statements by the Executive Board

62 63Wolters Kluwer 2019 Annual Report Wolters Kluwer 2019 Annual Report
Table of Contents | Consolidated Financial Statements | Company Financial Statements
Chris Vogelzang
Dutch, 1962, member of the Audit Committee. Appointed in 2019, and current term until 2023.
Position:CEO of Danske Bank
Supervisory directorships and other positions:• Member of the Supervisory Council of Rijksmuseum
Supervisory Board
Bertrand Bodson
Belgian, 1975. Appointed in 2019, current term until 2023.
Position:Chief Digital Officer and Member of the Executive Committee at Novartis
Supervisory directorships and other positions:• Member of the Board (Non-Executive Director) of Electrocomponents PLC
Jeanette Horan
British, 1955, Chairman of the Selection and Remuneration Committee dealing with remuneration matters. Appointed in 2016, and current term until 2020.
Position:Former Chief Information Officer at IBM
Supervisory directorships and other positions:Member of the Board (Non-Executive Director) of Nokia
Ann Ziegler
American, 1958, member of the Selection and Remuneration Committee. Appointed in 2017, and current term until 2021.
Position:Former Senior Vice President, Chief Financial Officer, and Executive Committee member of CDW Corporation
Supervisory directorships and other positions:• Member of the Board (Non-Executive Director) of Groupon Inc.;
• Member of the Board (Non-Executive Director) of Hanesbrands Inc.; and
• Member of the Board (Non-Executive Director) of US Foods.
Fidelma Russo
Irish and American, 1963, member of the Audit Committee. Appointed in 2016, and stepped down as member of the Supervisory Board as per year-end 2019.
Position:EVP and Chief Technology Officer at Iron Mountain Inc.
René Hooft Graafland
Dutch, 1955, Vice-Chairman of the Supervisory Board and Chairman of the Audit Committee. Appointed in 2012, and current term until 2020.
Position:Former CFO and member of the Executive Board of Heineken N.V.
Supervisory directorships and other positions:• Member of the Supervisory Board of Royal Ahold Delhaize N.V.;
• Member of the Supervisory Board of Royal Friesland Campina N.V.;
• Member of the Supervisory Board of Lucas Bols N.V.;
• Chairman of the Board of Stichting African Parks Foundation;
• Chairman of the Carré Foundation;
• Chairman of the Board of Stichting Nationaal Fonds 4 en 5 mei; and
• Member of the Dutch Monitoring Committee Corporate Governance.
Frans Cremers
Dutch, 1952, Chairman of the Supervisory Board and Chairman of the Selection and Remuneration Committee dealing with selection and appointment matters. Appointed in 2017, and current term until 2021.
Position:Former CFO and member of the Executive Board of VNU N.V.
Supervisory directorships and other positions:• Member of the Board of Directors of Stichting Preferente Aandelen Philips, Stichting Preferente Aandelen Heijmans, and Stichting Preferente Aandelen B KPN; and
• Investigator appointed by the Enterprise Section of the Amsterdam Court of Appeal in relation to the policy and course of events in the matter of SNS Reaal N.V. and SNS Bank N.V.
Executive Board
Profiles of the members of the Executive Board and Supervisory Board are available on www.wolterskluwer.com.
Kevin Entricken
American, 1965, Chief Financial Officer and member of the Executive Board since May 2013.
As CFO and member of the Executive Board, Mr. Entricken is responsible for Accounting &Reporting, Business Analysis & Control, Internal Audit, Internal Controls, Investor Relations, Mergers & Acquisitions, Taxation, Treasury, Risk Management, Real Estate, and Legal Affairs.
Nancy McKinstry
American, 1959, Chief Executive Officer and Chairman of the Executive Board since September 2003, and member of the Executive Board since June 2001.
As CEO and Chairman of the Executive Board, Ms. McKinstry is responsible for division performance, Global Strategy, Business Development, Technology, Global Business Services, Communications, Human Resources, Corporate Governance, and Sustainability.
64 65Wolters Kluwer 2019 Annual Report Wolters Kluwer 2019 Annual Report
Table of Contents | Consolidated Financial Statements | Company Financial Statements
MeetingsThe Supervisory Board held seven scheduled meetings in 2019. Six meetings were partly held without the members of the Executive Board being present. All of the current members attended all meetings. Mr. Angelici was excused for one meeting, and Ms. Russo was excused for two meetings. In addition to the scheduled meetings, there was one scheduled conference call between the Executive Board, the Chairman of the Supervisory Board, and the Chairman of the Audit Committee. The Chairman of the Supervisory Board had regular contact with the Chairman of the Executive Board.
Financial statementsThe Executive Board submitted the 2019 Financial Statements to the Supervisory Board. The Supervisory Board also took notice of the report and the statement by Deloitte Accountants B.V. (as referred to in Article 27, paragraph 3 of the company’s Articles of Association), which the Supervisory Board discussed with Deloitte. The members of the Supervisory Board signed the 2019 Financial Statements, pursuant to their statutory obligation under clause 2:101 (2) of the Dutch Civil Code. The Supervisory Board proposes to the shareholders that they adopt these Financial Statements at the Annual General Meeting of Shareholders of April 23, 2020, see 2019 Financial Statements.
EvaluationsThe Supervisory Board discussed its own functioning, as well as the functioning of the Executive Board and the performance of the individual members of both Boards. These discussions were partly held without the members of the Executive Board being present. The composition of the Supervisory Board, the Audit Committee, and the Selection and Remuneration Committee was also discussed in the absence of the Executive Board. The Supervisory Board members filled out a self-assessment. Overall, the outcome of the evaluation was positive. The composition of the Supervisory Board represents the relevant skill sets and areas of expertise. The Supervisory
Board meetings take place in an open and transparent atmosphere with each of the members actively participating. The Committees function well. Further optimization could be achieved by continuing to ensure a good balance between presentations and open discussion. During 2019, the Supervisory Board worked towards implementation of this recommendation. In addition to the formal evaluation process, as a standard practice, the Chairman of the Supervisory Board gives feedback to the Chairman of the Executive Board after every Supervisory Board meeting.
StrategyThe Supervisory Board was closely involved in the development of the strategy for 2019-2021, Accelerating Our Value, which was announced in February 2019. This strategy aims at accelerating the transformation of the company towards a global organization which grows expert solutions, advances deep domain expertise, and drives operational agility. This will contribute to long-term value creation for the company. During 2019, the Supervisory Board was kept informed of the start of the execution of the strategy. The Executive Board also discussed the corporate Vision & Strategy Plan for 2020-2022 with the Supervisory Board.
The divisional CEOs also presented their Vision & Strategy Plans for 2020-2022 to the Supervisory Board. This enabled the Supervisory Board to obtain a good view on the opportunities and challenges for each of the divisions and support the Executive Board in making the right strategic choices and investment decisions for each business. The Supervisory Board considers it important to meet each of the division CEOs periodically and get an update from them on the performance, key trends, strategy, and developments.
In 2019, the Supervisory Board visited the Enablon business in Paris. During that visit, presentations were given by the CEO of Legal & Regulatory, as well as the CEO and other managers of Enablon and eVision. Furthermore,
Report of the Supervisory Board
The Supervisory Board of Wolters Kluwer is responsible for supervising the Executive Board in setting and achieving the company’s strategy, targets, and policies, as well as the general course of affairs of the company. The Supervisory Board also assists the Executive Board with advice.
Supervisory Board Report
the Supervisory Board met with customers of the Enablon business to learn more of their businesses and the way they use the software of Enablon. In addition, the Supervisory Board attended a meeting with customers and employees on the innovation process at Enablon. The Supervisory Board appreciated the opportunity to receive a performance update and develop a deeper understanding of the Enablon business and the needs of its customers.
The Supervisory Board was also informed about the innovation activities within Wolters Kluwer. 2019 was the ninth consecutive year in which Wolters Kluwer rewarded promising new internal business initiatives via the Global Innovation Awards. Continuing focus on innovation and investment in new and enhanced products are an important means of driving long-term value creation as well as an increased culture of innovation at Wolters Kluwer.
In line with standard practice, management of the Global Business Services organization and the Digital eXperience Group (formerly Global Platform Organization) gave presentations, updating the Supervisory Board on the company’s technology strategy and execution thereof. The Supervisory Board was kept closely informed about the network and service interruptions in May 2019, and provided advice to the Executive Board. These discussions included the facts of the incident, recovery plans, the assessment of external experts, and future plans.
The Supervisory Board also considers it important to be aware of the main developments with respect to competition and the markets in which the company operates. Towards that end, an overview of the most important developments with respect to traditional and new competitors is discussed during each Supervisory Board meeting. Furthermore, one presentation prepared by the Corporate Strategy team was dedicated to the competitive position of Wolters Kluwer.
Acquisitions and divestmentsThe Executive Board kept the Supervisory Board informed about all pending acquisition and divestment activities. The Supervisory Board also discussed the performance and value creation of previous acquisitions, taking into consideration Wolters Kluwer’s financial and strategic criteria for acquisitions.
Corporate governance, sustainability, and risk managementThe Supervisory Board was kept informed about developments with respect to corporate governance and sustainability. The Supervisory Board and Audit Committee discussed risk management, including the risk profile of the company and risk appetite per risk category, as well as the assessment of internal risk management and control systems. The Audit Committee and Supervisory Board discussed the ongoing actions the company takes to further improve the internal risk management and control systems, including IT security and cybersecurity. In relation to the European General Data Protection Regulation which became effective in May 2018, as well as data privacy laws in other jurisdictions, the Supervisory Board invited the corporate privacy officer to present an update with respect to data privacy and data protection. For more information, see Risk Management.
The Supervisory Board took note of the continuous progress of the sustainability initiatives in 2019, and the inclusion of additional non-financial information in the Annual Report. These efforts aim to contribute to transparency and long-term value creation for all stakeholders.
Talent management and organizational developments Each year, the outcome of the annual talent reviews is discussed by the Supervisory Board. Diversity at board and senior management levels are elements which are taken into consideration as part of that discussion. Furthermore, as a standing topic during each Supervisory Board meeting, the Supervisory Board is informed about organizational developments, including appointments at senior positions within the company. During the year, the Supervisory Board also met with various executives and managers who gave presentations, which enabled the Board to get a good view on the available talent within the organization.
The Supervisory Board was also updated on the results of Wolters Kluwer’s employee engagement survey, which measures important topics such as engagement, alignment, agility, development, and other components driving engagement, and supporting a culture aimed at long-term value creation.

66 67Wolters Kluwer 2019 Annual Report Wolters Kluwer 2019 Annual Report
Table of Contents | Consolidated Financial Statements | Company Financial Statements
FinanceThe Supervisory Board carefully observes the financing of the company including the balance sheet and available headroom. The Supervisory Board also closely monitors the development of the net-debt-to-EBITDA ratio. The Supervisory Board approved the share buyback program in 2019 of up to €350 million, as well as the €50 million buyback for the first two months of 2020. Other financial subjects discussed included the budget, the financial outlook, the achievement of financial targets, the year-end and interim dividend, the outcome of the annual impairment test, and annual and interim financial results.
Investor RelationsThe Supervisory Board was well informed about Investor Relations activities, which is a standing agenda item during the Supervisory Board meetings. Updates included share price developments, communication with shareholders, shareholders’ views on acquisitions, analyst research, and the composition of the shareholder base. The Supervisory Board also carefully reviewed and approved the Annual Report and press releases regarding the full-year and half-year results, and the first-quarter update and nine-month trading update.
Audit CommitteeThe Audit Committee met four times in 2019, during the preparation of the full-year and half-year results, and around the first-quarter trading update and nine-month trading update. In addition, there was one scheduled conference call in December. After the Annual General Meeting of Shareholders in 2019, the Audit Committee consisted of Mr. Hooft Graafland (Chairman), Ms. Russo, and Mr. Vogelzang. Mr. Angelici and Mr. Noteboom retired after the 2019 Annual General Meeting. Ms. Russo retired year-end 2019. Mr. Hooft Graafland attended all meetings. Ms. Russo was excused for one meeting and Mr. Vogelzang was excused for one meeting due to an obligation existing before his appointment. The meetings of the Audit Committee were held in the presence of the Executive Board members, the external auditor, the internal auditor, and other corporate staff members. During 2019, as routine agenda items, the Audit Committee had discussions with the external auditors, as well as with the head of internal audit, without the members of the Executive Board being present. In addition, the Chairman of the Committee met with the external auditor and the head of internal audit in preparation of the Committee meetings. After every meeting, the Chairman of the Committee reports back to the full Supervisory Board. The main items discussed during the Audit Committee meetings include the financial results of the company, status updates on internal audit and internal controls, the
progress on the implementation of new IFRS standards (specifically IFRS 16), pensions, tax planning, impairment testing, the Treasury Policy, the financing of the company, risk management, cybersecurity, hedging, claims, incident management, the quarterly reports of the external auditor, and their full-year report on the audit.
The Audit Committee has reviewed the performance of the external auditor, the proposed audit scope and approach, the audit fees, and the independence of the external auditor, and has approved the non-audit services provided by the external auditor. In addition, the Audit Committee approved the updated Auditor Independence Policy, which is published on www.wolterskluwer.com.
Selection and Remuneration CommitteeThe Selection and Remuneration Committee met seven times in 2019 and had two additional conference calls. The Committee has the following composition: Ms. Horan (who chairs the remuneration-related discussions), Mr. Cremers (who chairs the selection and nomination-related discussions), and Ms. Ziegler. All members attended all meetings and calls. After every meeting, the respective chairs of the Committee report back to the full Supervisory Board. The resolutions regarding appointments and remuneration were taken by the full Supervisory Board, based on recommendations from the Committee.
The Committee has extensively discussed the new remuneration policy for the Executive Board, which will be submitted to the Annual General Meeting of Shareholders on April 23, 2020, including the base salary, new conditional awards of performance shares under the Long-Term Incentive Plan and the applicable performance measures, and targets for the Short-Term Incentive Plan. The Committee members were actively involved in the stakeholder outreach to gather the views of stakeholders on the draft remuneration policy. For more information about the remuneration policy of the Executive Board and the execution thereof, see Remuneration Report.
The Supervisory Board, based on a recommendation of the Selection and Remuneration Committee, also reviewed its own remuneration and established a remuneration policy for the Supervisory Board, in line with the new Dutch law which implements the amended European Shareholder Rights Directive. This policy will also be submitted to the Annual General Meeting of Shareholders of April 23, 2020. Taking into consideration the responsibilities of Supervisory Board members, remuneration levels at other two-tier board Dutch listed (AEX index) companies, and selected European companies, as well as the international composition of the Supervisory Board, it will also be
proposed to the Annual General Meeting of Shareholders on April 23, 2020, to increase the Supervisory Board remuneration. For more information, see Remuneration Report.
The Selection and Remuneration Committee discussed the composition of the Supervisory Board, which resulted in the nominations set out below.
Supervisory Board compositionIn 2019, the third and final term of Mr. Angelici expired. Furthermore, the first term of Mr. Noteboom expired. He was not available for reappointment. They retired after the Annual General Meeting of Shareholders which was held on April 18, 2019. At the same meeting, Mr. Chris Vogelzang and Mr. Bertrand Bodson (per September 1, 2019) were appointed as new members.
Ms. Russo resigned by the end of 2019, due to other commitments. In 2020, the second term of Mr. Hooft Graafland will expire. He is not available for re-election.
The Supervisory Board is pleased to nominate Mr. Jack de Kreij and Ms. Sophie Vandebroek for appointment as new Supervisory Board members. Mr. De Kreij gathered in-depth digital and financial and managerial experience in executive and supervisory board roles at various listed companies. He serves on various audit committees. After his appointment as Supervisory Board member, he will become chairman of the Audit Committee. Ms. Vandebroek gathered in-depth technology and managerial experience in executive and supervisory board roles at various companies. The nomination of Mr. De Kreij and Ms. Vandebroek will be on the agenda of the Annual General Meeting of Shareholders which will be held on April 23, 2020.
The composition of the Supervisory Board (both in the current composition and in the new composition after the 2020 Annual General Meeting of Shareholders) is in line with the profile and the company’s diversity policy, reflecting a diverse composition with respect to expertise, nationality, gender, and age. Four nationalities are represented on the Supervisory Board, with different talents and relevant areas of expertise. On December 31, 2019, the Supervisory Board had a female representation of 43%. Currently (after the resignation of Ms. Russo) two out of the six Supervisory Board members are female, which means a female representation of 33%, which is in line with Dutch governance standards. After the appointment of Ms. Vandebroek at the Annual General Meeting of Shareholders of April 23, 2020, the percentage will be 43% again. The profile, competences matrix, and diversity policy are published on www.wolterskluwer.com.
All Supervisory Board members comply with the Dutch law regarding the maximum number of supervisory board memberships. Furthermore, all members of the Supervisory Board are independent from the company within the meaning of best practice provisions 2.1.7, 2.1.8, and 2.1.9 of the Dutch Corporate Governance Code. For more information on each Supervisory Board member in accordance with the Dutch Corporate Governance Code, see Executive Board and Supervisory Board and Corporate Governance.
The Supervisory Board would like to thank the Executive Board and all employees worldwide for their highly appreciated efforts in the past year.
Alphen aan den Rijn, February 25, 2020
Supervisory BoardFrans Cremers, ChairmanRené Hooft Graafland, Vice-Chairman Bertrand BodsonJeanette Horan Chris VogelzangAnn Ziegler

68 69Wolters Kluwer 2019 Annual Report Wolters Kluwer 2019 Annual Report
Table of Contents | Consolidated Financial Statements | Company Financial Statements
This Remuneration Report provides an overview of the remuneration policy and its application in 2019. This Report is approved by the Supervisory Board.
Letter from the Chairman of the Selection and Remuneration Committee, dealing with remuneration matters
On behalf of the Selection and Remuneration Committee of the Supervisory Board, I am pleased to present the Remuneration Report for 2019. This report covers the 2019 remuneration earned and the outcomes of the performance against target of the variable compensation elements.
As discussed in more detail elsewhere in the 2019 Annual Report, at the start of last year, we set out our strategic priorities for the three-year period 2019-2021. This strategy builds on earlier plans which have driven a significant transformation of the company and have created substantial value for shareholders. The 2019-2021 strategy, Accelerating Our Value, aims to deliver continued good organic growth and further incremental improvements to our adjusted operating profit margin and return on invested capital, and seeks to drive long-term, sustainable value for all stakeholders.
Our philosophy around remuneration is to align the incentives for management with the interest of shareholders, providing a strong link between pay and performance. The outcome of the 2019 remuneration reflects the achievement of another year of solid 4% organic growth and significant improvement in the adjusted operating profit margin. It was a year when important progress was made behind the scenes in improving back-office systems and IT infrastructure and strengthening overall security. It was also a year where innovation was sustained at high levels with several exciting new offerings brought to market, as detailed in the Report of the Executive Board.
The performance measures in the Executive Board incentive plans align with and support the strategy by focusing on key performance indicators, including revenue growth, adjusted net profit, earnings per share (EPS), and shareholder returns, among other.
Remuneration policyThe existing remuneration policy for members of the Executive Board was adopted at the Annual General Meeting (AGM) of Shareholders of April 21, 2004, and amendments to the policy and the Long-Term Incentive Plan were approved by shareholders at the Annual General Meetings in 2007 and 2011. In light of the significant transformation of the company and in accordance with the implementation of the amended European Shareholder Rights Directive (SRD) in the Netherlands, the Selection and Remuneration Committee took the opportunity to review and update the remuneration policy. In November 2019, members of the Selection and Remuneration Committee held consultative meetings with our largest shareholders in Europe and the United States, whose firms’ aggregated holdings represented approximately 35% of Wolters Kluwer shares outstanding as of the end of November 2019, to hear their views on remuneration. Members of the Selection and Remuneration Committee also met with proxy advisors and investor associations. Opinions and policies on this topic are diverse and evolving, but we received constructive feedback which has helped us develop a remuneration policy for members of the Executive Board which we believe reflects the evolving nature of the business, strengthens long-term commitment, and retains a strong link to performance and value creation.
Main changes in remuneration policy for the Executive BoardThe most important changes in the updated remuneration policy for members of the Executive Board are:• Making the policy compliant with the Dutch law which
implements the amended SRD;• Proposing a predefined list of measures (including
financial, non-financial, key operational, or strategic measures) from which the Supervisory Board can annually select appropriate measures for the Short-Term Incentive Plan, instead of the current full flexibility for the Supervisory Board, in order to balance flexibility for the Supervisory Board with transparency for the stakeholders about potential targets;
• Replacing diluted earnings per share (EPS) by diluted adjusted earnings per share as a Long-Term Incentive Plan measure to bring the policy in line with current market practice. The other Long-Term Incentive Plan measure, Total Shareholder Return (TSR), remains in place. Diluted adjusted EPS has long been used by the company as a key performance indicator to measure the performance of the business and is an important measure used in our financial guidance;
• Introducing a two-year holding period requirement post the three-year vesting period of long-term incentive shares;
• Introducing formal share ownership guidelines (minimum number of shares Executive Board members should own: three times of base salary for CEO, two times of base salary for other Executive Board members); and
• Enabling the Supervisory Board to compensate new members of the Executive Board, when recruited externally, for the loss of compensation they might face when transitioning their employment, in order to be able to attract the best external talent.
In developing the policy, a constructive dialogue took place with the works council of the company. Based on this dialogue and the information provided, the works council did not see the need to render a formal advice. Additionally, the Supervisory Board took notice of the views of the Executive Board members on the structure and quantum of their remuneration as required by the Dutch Corporate Governance code.
In addition to the changes in the updated remuneration policy as set out above, the Supervisory Board also updated the TSR peer group, starting with the Long-Term Incentive Plan cycle 2020-2022, to reflect the transformation of the company and its transition from publishing to information solutions, software, and services. The updated TSR peer group is included in this Remuneration Report. We have replaced seven traditional publishers with seven new peers from the GICS (Global Industry Classification Standard) sectors Research & Consulting, Application Software, and Financial Exchanges & Data.
The Selection and Remuneration Committee also reviewed Supervisory Board remuneration and established a formal remuneration policy in line with the new Dutch law which implements the amended SRD. This policy was also reviewed and discussed with shareholders, proxy advisors, and investor associations during the consultation rounds.
The Supervisory Board, based on a recommendation of the Selection and Remuneration Committee, will submit these updated remuneration policies for members of the Executive Board and the Supervisory Board for adoption at the AGM on April 23, 2020. Subject to adoption by the AGM, both remuneration policies will take (retroactive) effect from January 1, 2020, and are intended to remain in place for four years. In addition, this Remuneration Report will be submitted for an advisory vote at the AGM on April 23, 2020. For more information please refer to the agenda for the AGM, available on www.wolterskluwer.com/agm. A copy of both remuneration policies is also included as annex to the AGM agenda.
Jeanette HoranChairman of the Selection and Remuneration Committee, dealing with remuneration matters
Remuneration Report

70 71Wolters Kluwer 2019 Annual Report Wolters Kluwer 2019 Annual Report
Table of Contents | Consolidated Financial Statements | Company Financial Statements
Executive Board remuneration
The remuneration policy for the Executive Board provides a structure that aligns compensation of the Executive Board members with the successful delivery of our long-term strategy. The key objectives of the remuneration policy are to:• Align rewards with individual and company performance;• Strengthen long-term commitment to the company;• Align with strategy, mission, and values of the company
and create long-term value for our stakeholders; and• Attract, motivate, and retain the best executive
management talent.
The Executive Board remuneration is comprised of the following elements: • A base salary;• A short-term incentive paid annually in cash; • A long-term incentive in the form of conditional rights on
ordinary shares which is subject to a three-year vesting schedule; and
• Retirements and other benefits.
The Selection and Remuneration Committee engaged an external compensation advisor to provide recommendations and information on market practices for compensation structure and levels. The Committee had extensive discussions, supported by its external advisor, to review the composition and key drivers of remuneration. The Committee has also taken into consideration to which extent the variable remuneration might expose the company to risks, taking into consideration the overall risk profile and risk appetite of the company, as described in Risk Management. The Committee believes that the remuneration policy provides management with good incentives to create long-term value, without increasing the overall risk profile of the company.
According to Dutch law, the Supervisory Board has the authority to adjust variable remuneration if the payout based on achievement of targets would in its view be unacceptable based on reasonability and fairness criteria. In addition, variable remuneration could be reclaimed after payout took place, to the extent the payout was based on incorrect information with respect to achieving the targets. This was not the case in 2019, and this authority was not used.
Pay peer groupFor remuneration benchmarking purposes, the Supervisory Board considers market data for all elements of remuneration from companies of comparable size, complexity, industry or business profile, and international scope. The benchmark companies in the pay peer group are comparable organizations in Europe and the United States, which takes into consideration the companies and geographic locations where Executive Board members might be recruited to or from. Every two years, the benchmark study is conducted, and the pay peer group reviewed. The last benchmark and review were done in 2019.
The pay peer benchmark group for 2019 consists of the following companies:
Bureau Veritas Nielsen Holdings
Equifax NortonLifeLock*
Experian Pearson
IHS Markit RELX
Informa S&P Global
Intertek Group SGS
Intuit The Sage Group
MSCI Thomson Reuters
News Corporation Verisk Analytics *Symantec renamed Norton LifeLock following the sale of Symantec enterprise security business to Broadcom Inc.
Total remuneration overview
The table below provides an overview of the total remuneration of the members of the Executive Board. In accordance with the Dutch Corporate Governance Code, the Supervisory Board carried out scenario analyses when
determining the structure and level of Executive Board remuneration. The table below includes the relative proportion between fixed and variable remuneration.
Remuneration of the Executive Board – IFRS based
in thousands of euros
Fixed compensation
Variable compensation
Proportion fixed/
variable
2019 Salary Social security
Pension contri-bution
Other benefits2
STIP LTIP3 Subtotal Tax related
cost
Total
N. McKinstry1 1,349 22 62 199 1,664 4,636 7,932 21%/79%
157 8,089
K.B. Entricken 698 22 34 260 703 1,464 3,181 32%/68%
1,408 4,589
Total 2,047 44 96 459 2,367 6,100 11,113 1,565 12,678
in thousands of euros
Fixed compensation
Variable compensation
Proportion fixed/
variable
2018 Salary Social security
Pension contri-bution
Other benefits2
STIP LTIP3 Subtotal Tax related
cost4
Total
N. McKinstry 1,283 21 52 185 1,697 4,554 7,792 20%/80%
(3,068) 4,724
K.B. Entricken 645 88 28 349 737 1,451 3,298 34%/66%
670 3,968
Total 1,928 109 80 534 2,434 6,005 11,090 (2,398) 8,6921 In 2019, Ms. McKinstry’s salary was $1,425,000 (€1,349,229). The 2019 STIP payment is calculated on a U.S. dollar denominated equivalent of total salary as: $1,425,000 x 130.67% ($1,862,012 equivalent to €1,663,996). 2 Executive Board members are eligible for benefits such as health insurance, life insurance, a car, and to participate in any all-employee plans that may be offered at any given point. 3 LTIP share-based payments are based on IFRS accounting policies and therefore do not reflect the actual payout or value of performance shares released upon vesting.4 In 2018, the tax related cost was negative, mainly due to a refund of payroll taxes of €3,038,776 (relating to the years 2016/2017 for Ms. McKinstry).
As shown in the table above, the variable performance-based incentives are the largest component of remuneration, thereby strengthening the alignment between remuneration and company performance and reflecting the philosophy that Executive Board compensation should be linked to the strategy aimed at
long-term value creation. This is in compliance with the goals of the remuneration policy. Because of the applicable performance criteria and the fact that the Long-Term Incentive Plan is based on the performance over a three-year period, the remuneration contributes to the long-term interests and value creation of the company.

72 73Wolters Kluwer 2019 Annual Report Wolters Kluwer 2019 Annual Report
Table of Contents | Consolidated Financial Statements | Company Financial Statements
Execution of remuneration policy in 2019 This section provides an overview of the execution of the remuneration policy for the Executive Board members in 2019, including a description of the remuneration components, base salary, Short-Term Incentive Plan (STIP), Long-Term Incentive Plan (LTIP), retirements, and other benefits. It further describes how the performance measures were applied in 2019. Remuneration over the financial year 2019 has been paid out in accordance with the remuneration policy. There have not been any deviations from the policy. Further, there have not been any deviations from the governance process with respect to the execution of the remuneration policy.
Base salaryThe base salary is set at a market competitive level to attract and retain the caliber of executives required to devise and execute the company’s strategy. Base salary is reviewed annually by the Supervisory Board. In 2019, the Executive Board members received a regular base salary increase of 2.5% in line with the remuneration policy. For 2020, the Supervisory Board approved again an increase in base salary for the Executive Board members of 2.5%,
which is in line with the overall budgeted 2020 salary increase for Wolters Kluwer executives globally and the remuneration policy.
Short-Term Incentive PlanThe Short-Term Incentive Plan provides Executive Board members with a cash incentive for the achievement of specific annual targets. These targets are annually determined by the Supervisory Board and largely reflect the key performance indicators that the company reports, which are important measures of the successful execution of the company’s strategy. As such, the remuneration is directly linked to the strategy, performance, and long-term interests of the company. Payout only takes place after verification by the external auditor of the financial statements of the company, including the financial performance indicators on which the financial STIP targets are based.
The target payout percentages and maximum achievement levels for 2019 (percentages of base salary) are indicated in the table below:
in % Target payout
(% of base salary)
Maximum achievable payout (% of base salary)
No payout if achievement levels
are below
Maximum payout if achievement levels for all measures are at or above
CEO 125 175 < 90 ≥110
CFO 95 145 < 90 ≥110
STIP performance measures 2019
N. McKinstry K.B. Entricken
Weighting %[a]
Achievement based on target
performance %1
Payout as % of base salary
(based on achievement)
[b]
Payout as % of salary
(weighted average)2
[a]x[b]
Payout as % of base salary
(based on achievement)
[c]
Payout as % of salary
(weighted average)3
[a]x[c]
Revenue performance 33.3 100 125 41.66 95 31.66
Adjusted net profit 33.3 101 130 43.33 100 33.33
Adjusted free cash flow 28.3 103 140 39.68 110 31.17
Revenues from digital products as a percentage of total revenues 5.0 99 120 6.00 90 4.51
Total payout as % of base salary
130.67 100.67
Total payout amount (in thousands of euros)
1,664
703
For 2020, the Supervisory Board has approved the same target payout percentages for the Executive Board members as for 2019. The STIP target payout percentages and maximum achievement level have remained unchanged since 2007.
1 Targets and achievements are in constant currency and exclude the impact of acquisitions and divestments.2 The 2019 STIP payment is calculated on a U.S. dollar denominated equivalent of total salary as: $1,425,000 x 130.67% ($1,862,012 equivalent to €1,663,996). The achieved STIP amounts will be payable in March 2020.3 The 2019 STIP payment is calculated on a U.S. dollar denominated equivalent of total salary as: $781,000 x 100.67% ($786,155 equivalent to €702,551). The achieved STIP amounts will be payable in March 2020.
For 2020, the Supervisory Board has approved the same performance measures as for 2019. In the new remuneration policy that will be submitted for approval at the AGM of April 23, 2020, the STIP performance measures will be established from a pre-defined list of financial measures, key operational measures, and non-financial measures aligned to the strategic and operational objectives of the company. The full list of measures can be found in the new remuneration policy, provided as an annex to the agenda for the AGM on www.wolterskluwer.com.
Long-Term Incentive PlanThe Long-Term Incentive Plan provides Executive Board members conditional rights on shares (performance shares). This plan aims to align the organization and its management with the strategic goals of the company, thus rewarding the creation of shareholder value. The total number of shares that the Executive Board members will receive depends on the achievement of predetermined performance conditions at the end of a three-year performance period. The performance
measures are set as follows, each weighted at 50% of the target value of the conditional performance shares:• Total Shareholder Return (TSR) relative to a group of TSR
peer companies (TSR-Related Shares); and• Diluted EPS (EPS-Related Shares).
In the new remuneration policy that will be submitted to the AGM of April 23, 2020, it is proposed to replace the diluted EPS by diluted adjusted EPS starting with the Long-Term Incentive Plan cycle 2020-22. Adjusted EPS figures are regarded as key performance indicators to measure the underlying performance of the business. The use of adjusted EPS would align with the guidance provided to the market.
Payout of the performance shares at the end of the three-year performance period will only take place after verification by the external auditor of the achievement of the TSR and EPS targets.
The STIP performance measures for 2019 and the corresponding achievements, and the resulting annual incentive payout percentages for the financial year 2019 are indicated in the table below:

74 75Wolters Kluwer 2019 Annual Report Wolters Kluwer 2019 Annual Report
Table of Contents | Consolidated Financial Statements | Company Financial Statements
TSRTSR reflects the return received by a shareholder and captures both the change in the company’s share price and the value of dividend income, assuming dividends are reinvested in the company. TSR is an appropriate measure, as it objectively measures the company’s financial performance and assesses its long-term value creation as compared to other companies in our peer group. TSR is calculated as the share price development over a three-year period including dividend reinvestment. By using a three-year performance period, there is a clear relation between remuneration and long-term value creation. The company uses a 60-day average of the share price at the beginning and end of each three-year performance period to reduce the influence of potential stock market volatility.
A TSR peer group is used to establish relative TSR performance. Wolters Kluwer’s TSR performance compared to the peer group determines the number of conditionally awarded TSR-Related Shares at the end of the three-year performance period, in accordance with the table below. These incentive zones are in line with best practice recommendations for the governance of long-term incentive plans.
TSR performance incentive table
Position Payout
1-2 150%3-4 125%5-6 100%7-8 75%9-16 0%
The TSR peer group consists of 15 companies selected by the Supervisory Board.
For the 2017-2019 performance period, the TSR peer group consisted of the following companies:
Arnoldo Mondadori PearsonAxel Springer Promotora de Informaciones*
Daily Mail & General Trust Reach*
Informa RELXJohn Wiley & Sons S&P Global Lagardère The Sage Group*
McClatchy Thomson ReutersNews Corporation
* In February 2019, Dun & Bradstreet Inc was delisted and replaced by The Sage Group plc. Promotora de Informaciones was formerly named Grupo PRISA and Reach plc was formerly named Trinity Mirror.
The TSR peer group for the 2020-2022 performance period will consist of the following companies:
Bureau Veritas* Pearson
Equifax* RELX
Experian* S&P Global
IHS Markit* SGS*
Informa The Sage Group
Intertek Group* Thomson Reuters
John Wiley & Sons Verisk Analytics*
News Corporation
*New to TSR peer group for the 2020-2022 performance period. In case of delisting or merger of a peer group company, the Supervisory Board will carefully consider an appropriate replacement company that meets strict pre-determined criteria. These criteria may include: industry, geographic focus, company size, company financial health, TSR correlation and volatility, and historical TSR performance.
Diluted EPSExecutive Board members can earn 0-150% of the number of conditionally awarded EPS-Related Shares, depending on Wolters Kluwer’s diluted EPS performance over the three-year performance period. The Supervisory Board determines the exact targets for the EPS-Related Shares for each three-year performance period. The targets will be based on the EPS performance in constant currencies, to exclude benefits or disadvantages based on currency effects over which the Executive Board has no control. Using EPS as a performance measure for LTIP leads to a strong alignment between the successful execution of the strategy to generate long-term shareholder value and management compensation.
EPS performance incentive table Achievement Payout
Less than 50% of target NoneOn target 100%Overachievement of target Up to 150%
Period 2016-2018
LTIP measure Weighting Target Achievement Payout %
TSR 50% n/a Third position 125%
Diluted EPS* 50% Target Compound Annual Growth Rate (CAGR) of 11.6%
CAGR of 20.0% 150%
Period 2017-2019
LTIP measure Weighting Target Achievement Payout %
TSR 50% n/a Third position 125%
Diluted EPS* 50% Target Compound Annual Growth Rate (CAGR) of 10.4%
CAGR of 14.8% 150%
TSR and EPS performanceThe TSR and EPS performances against target for the periods 2016-2018 and 2017-2019, and the resulting
vesting of conditionally awarded shares in 2019 and in 2020 are indicated in the tables below:
* For calculation purposes, the definition of diluted EPS as disclosed in the Glossary is used.
*
Conditionally awarded sharesThis section provides information on the conditional and actual share awards under the Long-Term Incentive Plan for Executive Board members and senior management.
The conditional share awards for the Executive Board members are determined by the comparable market information from European and U.S. companies.
Senior management remuneration consists of a base salary, STIP, and LTIP. The senior management STIP is based on the achievement of specific objective targets that are linked to creating value for shareholders, such as revenue performance, cash flows, and earnings.
The LTIP targets and payout schedule for senior management are similar to the LTIP targets and payout schedule for the Executive Board. Like in the new remuneration policy for the Executive Board, the share ownership guidelines will apply to the top senior management as well.
LTIP 2019-21 and LTIP 2018-20The Executive Board members and senior management have been conditionally awarded the following number of shares based on a 100% payout, subject to the conditions of the LTIP grants for 2019-21 and 2018-20:
Conditionally awarded
TSR-based shares
Conditionally awarded
EPS-based shares
Conditionally awarded
TSR-based shares
Conditionally awarded
EPS-based shares
Total conditionally awarded shares
Base numbers of shares at 100% payout
LTIP 2019-21 LTIP 2019-21 LTIP 2018-20 LTIP 2018-20 December 31, 2019
N. McKinstry 53,389 38,917 62,253 45,864 200,423
K.B. Entricken 16,476 12,010 19,686 14,503 62,675
Total 69,865 50,927 81,939 60,367 263,098
Senior management 220,199 220,198 218,282 218,283 876,962
Total 290,064 271,125 300,221 278,650 1,140,060

76 77Wolters Kluwer 2019 Annual Report Wolters Kluwer 2019 Annual Report
Table of Contents | Consolidated Financial Statements | Company Financial Statements
LTIP 2017-19 The LTIP 2017-2019 vested on December 31, 2019. The table below indicates the number of conditionally awarded shares vested:
number of shares Outstanding at December 31, 2019
Additional conditional number of TSR-shares
(25%)
Additional conditional number of EPS-shares
(50%)
Vested/payout February 27, 2020
N. McKinstry 135,864 19,586 28,760 184,210
K.B. Entricken 43,427 6,261 9,193 58,881
Total 179,291 25,847 37,953 243,091
Senior management 480,110 60,031 120,077 660,218
Total 659,401 85,878 158,030 903,309
number of shares Outstanding at December 31, 2018
Additional conditional
number of TSR-shares (25%)
Additional conditional number of EPS-shares (50%)
Payout/Vested shares December
31, 2018
Cash value vested shares*
N. McKinstry 148,000 21,416 31,168 200,584 11,513
K.B. Entricken 47,246 6,837 9,950 64,033 3,675
Total 195,246 28,253 41,118 264,617 15,188
Senior management 518,488 64,828 129,657 712,973 40,925
Total 713,734 93,081 170,775 977,590 56,113
* Cash value in thousands of euros; calculated as the number of shares vested multiplied by the volume weighted average price on February 21, 2019.
LTIP 2019-21 and 2018-20 grants for Executive Board and senior management
LTIP 2019-21 LTIP 2018-20
Fair values
Fair value of EPS shares at grant date (in €) 48.18 40.72
Fair value of TSR shares at grant date (in €) 35.12 30.00
TSR shares – key assumptions
Share price at grant date (in €) 51.66 43.48
Expected volatility 18% 20%
Expected life three years three years
Annual dividend increase 12.5% 5.6%
Risk-free interest rate (yield on three-year Dutch government bonds) 0.0% 0.0%
Shares owned by Executive Board members
number of shares December 31, 2019 December 31, 2018
N. McKinstry 462,131 354,638
K.B. Entricken 36,636 36,636
Total 498,767 391,274
Vesting LTIP 2017-2019 shares will be released on February 27, 2020. The volume-weighted average price for the shares released will be based on the average
exchange prices traded at the Euronext Amsterdam N.V. on February 27, 2020, the first day following the company’s publication of its annual results.
Conditional LTIP grants 2020-22As explained above, shares are conditionally awarded at the beginning of a three-year performance period. The percentages are determined through a benchmarking process. For the 2020-22 performance period, these percentages are determined to be 285% for the CEO, and 200% for the CFO. The level for the CEO has remained unchanged since 2007. The level for the CFO will be increased from 175% to 200%, following a benchmarking analysis which demonstrated that the CFO level was below market median. This is the first increase for CFO level since 2007.
The number of shares conditionally awarded at the start of the performance period is computed by dividing the amount, as calculated above, by the fair value of a conditionally awarded share at the start of the performance period. Because the fair value of TSR-Related Shares can be different from the fair value of EPS-Related Shares, the number of conditionally awarded TSR-Related Shares can deviate from the number of conditionally awarded EPS-Related Shares.
These holdings are in line with the new share ownership guidelines as recommended in the new remuneration
policy for the Executive Board members which will be submitted to the AGM of April 23, 2020.
LTIP 2016-18The LTIP 2016-18 vested on December 31, 2018. A total number of 977,590 shares were released on February 21, 2019. At that day, the volume-weighted average price of
Wolters Kluwer N.V. was €57.40. The table below indicates the number of shares vested and the cash equivalent thereof:

78 79Wolters Kluwer 2019 Annual Report Wolters Kluwer 2019 Annual Report
Table of Contents | Consolidated Financial Statements | Company Financial Statements
Retirements and other benefitsThe retirements and other benefits for which Executive Board members are eligible are intended to be competitive in the relevant market and may evolve year on year. Executive Board members are eligible for benefits such as health insurance, life insurance, a car, and to participate in whatever all-employee plans may be offered at any given point. Ms. McKinstry and Mr. Entricken participate in health and wellness programs as well as the defined contribution retirement savings plan of Wolters Kluwer United States. In addition, Ms. McKinstry will receive a benefit from a now closed, frozen defined benefit plan in the United States, similar to other U.S. employees who were employed at the time when this plan was active.
CEO pay-ratioThe pay-ratio, obtained by dividing the total 2019 remuneration for the CEO by the average of the total 2019 remuneration of all employees worldwide, is 81 (2018: 84). For this purpose, the total CEO remuneration is based on the remuneration costs as stated in the table Remuneration of the Executive Board – IFRS based, minus tax-related costs. The average employee remuneration is obtained by dividing the 2019 total personnel expenses as stated in Note 13 – Personnel Expenses (after subtracting the CEO’s remuneration), by the reported average number of FTEs (minus one). As such, both the total CEO remuneration (minus tax-related costs) and the average total remuneration of all employees (minus the CEO’s remuneration) are based on IFRS standards. The difference between the 2018 and 2019 ratios can be explained by the higher average employee pay in euros in 2019 following an appreciation of mainly the U.S. dollar.
Other informationThe company does not grant any personal loans, guarantees, or the like to Executive Board or Supervisory Board members.
Supervisory Board Remuneration
The Supervisory Board, based on a recommendation of the Selection and Remuneration Committee, also reviewed its own remuneration and established a remuneration policy for the Supervisory Board, in line with the new Dutch law which implements the amended SRD. This policy will also be submitted to the AGM of April 23, 2020. According to this policy, the remuneration for the Supervisory Board aims to attract and retain the high caliber individuals on the Supervisory Board with relevant skills and experience to guide the development and execution of the company strategy, and create long-term value creation. The remuneration is not tied to the performance of the company and therefore includes fixed compensation only. In case of exceptional circumstances ad-hoc committees may have to be established, for which the Chairman and members may receive a pro-rated compensation at the levels of the fee for the Audit Committee capped at five times the annual fee of the Audit Committee. The Supervisory Board seeks advice from an independent external remuneration advisor. Resolutions are always taken in the full Supervisory Board.
Supervisory Board remuneration
in thousands of euros Member Selection and Remuneration Committee
Member Audit Committee 2019 2018
F.J.G.M. Cremers, Chairman Co-chairman 114 117
R.D. Hooft Graafland, Vice-Chairman
Chairman 97 100
B.J.F.X. Bodson 1 22 –
J.A. Horan Co-chairman 100 91
C.F.H.H. Vogelzang 2 X 58 –
A.E. Ziegler X 95 95
B.F.J. Angelici 3 20 85
B.J. Noteboom 3 25 82
F.M. Russo 4 X 97 97
Total 628 667
1 Appointed at the AGM of 2019, with effect from September 1, 20192 Appointed at the AGM of 20193 Retired after the AGM of 20194 Retired at year-end 2019
in euros Annual fee 2020 (proposed)
Annual fee 2019 Annual fee 2018
Chairman 112,000 100,000 100,000
Vice-Chairman 83,500 75,000 75,000
Members 70,000 65,000 65,000
Chairman Audit Committee 22,500 20,000 20,000
Members Audit Committee 16,500 15,000 15,000
Chairman Selection and Remuneration Committee 17,500* 15,000** 15,000**
Members Selection and Remuneration Committee 11,500 10,000 10,000
Travel allowance for intercontinental travel 5,000 per meeting 3,000 per meeting 3,000 per meeting
* Due to the co-chairmanship, each co-chairman will receive €14,500** Due to the co-chairmanship, each co-chairman received €12,500
Fees members of the Supervisory BoardThe table below shows the fee schedule for the members of the Supervisory Board. Taking into consideration the responsibilities of Supervisory Board members, remuneration levels at other two-tier board Dutch listed
(AEX) companies, and selected European companies, as well as the international composition of the Supervisory Board, it will be proposed to the AGM on April 23, 2020, to increase the Supervisory Board remuneration.
Shares owned by Supervisory Board membersAt December 31, 2019, none of the members of the Supervisory Board held shares in Wolters Kluwer (2018: Mr. Noteboom owned 4,865 shares in Wolters Kluwer).

81Wolters Kluwer 2019 Annual Report
Table of Contents | Consolidated Financial Statements | Company Financial Statements
80 Wolters Kluwer 2019 Annual Report
Table of Contents | Consolidated Financial Statements | Company Financial Statements
Five-year overview of annual changes in remuneration (IFRS based)
Below table provides an overview of the Executive Board remuneration, Supervisory Board remuneration, company performance, and average employee remuneration of the last five years.
Members of the Supervisory Board are independent from the company. Their remuneration is not tied to the performance of the company and therefore includes fixed compensation only.
in thousands of euros, unless otherwise stated 2019 2018 2017 2016 2015
Executive Board remuneration (excluding tax related cost)
N. McKinstry 7,932 7,792 7,661 6,649 7,026
Annual change (in %) 1.8 1.7 15.2 (5.4)
K.B. Entricken 3,181 3,298 3,103 2,697 2,734
Annual change (in %) (3.6) 6.3 15.1 (1.4)
Supervisory Board remuneration
F.J.G.M. Cremers, Chairman1 114 117 60 – –
R.D. Hooft Graafland, Vice-Chairman 97 100 80 80 66
B.J.F.X. Bodson2 22 – – – –
J.A. Horan3 100 91 88 52 –
C.F.H.H. Vogelzang4 58 – – – –
A.E Ziegler1 95 95 57 – –
F.M. Russo5 97 97 87 54 –
B.J. Angelici6 20 85 72 75 64
B.J. Noteboom6 25 82 72 75 61
P.N. Wakkie7 – – 25 88 77
L.P. Forman7 – – 32 98 77
R. Qureshi8 – – – 23 60
B.M. Dalibard9 – – – – 22
Company’s performance
Organic growth (in %) 4.3 4.3 3.4 2.8 2.7
Adjusted operating profit margin (in %) 23.6 23.1 22.2 22.2 21.4
Stock price quotation December 31 (in €) 65.02 51.66 43.48 34.42 30.97
Stock price change (in %) 26 19 26 11 22
Total Shareholder Return (in %) 28 21 29 14 26
Average remuneration on a full-time equivalent (FTE) basis of employees
Average pay per FTE, excluding CEO 97.6 92.3 93.9 90.0 86.7
1 Appointed at the AGM of 20172 Appointed at the AGM of 2019, with effect from September 1, 20193 Appointed at the AGM of 20164 Appointed at the AGM of 20195 Appointed at the AGM of 2016; retired per year-end 2019
6 Retired after the AGM of 20197 Retired after the AGM of 20178 Retired after the AGM of 20169 Retired after the AGM of 2015
Alphen aan den Rijn, February 25, 2020
Supervisory Board
89 Note 1 – General and Basis of Preparation
92 Note 2 – Significant Accounting Policies
94 Note 3 – Accounting Estimates and Judgments
95 Note 4 – Benchmark Figures
101 Note 5 – Segment Reporting
103 Note 6 – Revenues
107 Note 7 – Earnings per Share
108 Note 8 – Acquisitions and Divestments
112 Note 9 – Assets/Liabilities Classified as Held for Sale
114 Note 10 – Sales Costs
115 Note 11 – General and Administrative Costs
115 Note 12 – Other Operating Income and (Expense)
116 Note 13 – Personnel Expenses
116 Note 14 – Amortization, Impairment, and Depreciation
117 Note 15 – Financing Results
118 Note 16 – Income Tax Expense
120 Note 17 – Non-controlling Interests
122 Note 18 – Goodwill, Acquired Identifiable Intangible Assets, and Other Intangible Assets
127 Note 19 – Property, Plant, and Equipment
128 Note 20 – Leasing
132 Note 21 – Investments in Equity-accounted Investees
134 Note 22 – Financial Assets
134 Note 23 – Tax Assets and Liabilities
137 Note 24 – Inventories
138 Note 25 – Contract Assets and Liabilities
141 Note 26 – Other Receivables
141 Note 27 – Cash and Cash Equivalents
142 Note 28 – Trade and Other Payables
142 Note 29 – Long-term Debt
147 Note 30 – Financial Risk Management
155 Note 31 – Employee Benefits
164 Note 32 – Provisions
166 Note 33 – Capital and Reserves
168 Note 34 – Share-based Payments
171 Note 35 – Related Party Transactions
171 Note 36 – Audit Fees
172 Note 37 – Commitments, Contingent Assets, and Contingent Liabilities
173 Note 38 – Remuneration of the Executive Board and Supervisory Board
174 Note 39 – Overview of Significant Participations
176 Note 40 – Events after Balance Sheet Date
2019 Financial Statements82 Consolidated Financial Statements
82 Consolidated Statement of Profit or Loss
83 Consolidated Statement of Comprehensive Income
84 Consolidated Statement of Cash Flows
86 Consolidated Statement of Financial Position
88 Consolidated Statement of Changes in Total Equity
89Notes to the Consolidated Financial Statements

83Wolters Kluwer 2019 Annual Report
Table of Contents | Consolidated Financial Statements | Company Financial Statements
82 Wolters Kluwer 2019 Annual Report
Table of Contents | Consolidated Financial Statements | Company Financial Statements
Consolidated Statement of Comprehensive Income
in millions of euros, for the year ended December 31 2019 2018restated*
Comprehensive income
Profit for the year 669 656
Other comprehensive income
Items that are or may be reclassified subsequently to the statement of profit or loss:
Exchange differences on translation of foreign operations 72 134
Exchange differences on translation of equity-accounted investees 0 1
Cost of hedging – changes in fair value (4) (4)
Net gains/(losses) on hedges of net investments in foreign operations (5) (8)
Effective portion of changes in fair value of cash flow hedges (4) 23
Net change in fair value of cash flow hedges reclassified to the statement of profit or loss Note 15 (5) (10)
Tax on other comprehensive income Note 23 2 0
Items that will not be reclassified to the statement of profit or loss:
Remeasurement gains/(losses) on defined benefit plans Note 31 8 12
Tax on other comprehensive income Note 23 (2) (4)
Other comprehensive income for the year, net of tax 62 144
Total comprehensive income for the year 731 800
Attributable to:
– Owners of the company 730 800
– Non-controlling interests 1 0
Total 731 800* Restated for IFRS 16. See Note 20 – Leasing.
Consolidated Statement of Profit or Loss
in millions of euros, unless otherwise stated, for the year ended December 31
2019 2018restated*
Revenues Note 5 and 6 4,612 4,259
Cost of revenues 1,385 1,297
Gross profit Note 5 3,227 2,962
Sales costs Note 10 808 753
General and administrative costs Note 11 1,512 1,398
Total operating expenses Note 5 2,320 2,151
Other operating income and (expense) Note 12 1 156
Operating profit Note 5 908 967
Financing income 25 21
Financing costs (83) (98)
Other finance income/(costs) 5 (2)
Total financing results Note 15 (53) (79)
Share of profit of equity-accounted investees, net of tax Note 21 3 2
Profit before tax 858 890
Income tax expense Note 16 (189) (234)
Profit for the year 669 656
Attributable to:
– Owners of the company 669 656
– Non-controlling interests Note 17 0 0
Profit for the year 669 656
Earnings per share (EPS) (€)
Basic EPS Note 7 2.47 2.37
Diluted EPS Note 7 2.46 2.35* Restated for IFRS 16. See Note 20 – Leasing.
Consolidated Financial Statements

84 85Wolters Kluwer 2019 Annual Report Wolters Kluwer 2019 Annual Report
Table of Contents | Consolidated Financial Statements | Company Financial Statements
Consolidated Statement of Cash Flows (continued)
in millions of euros, for the year ended December 31 2019 2018restated*
Cash flows from investing activities
Capital expenditure (226) (214)
Acquisition spending, net of cash acquired Note 8 (34) (166)
Receipts from divestments, net of cash disposed Note 8 40 307
Dividends received Note 21 0 1
Cash from settlement of derivatives (11) (11)
Net cash used in investing activities (231) (83)
Cash flows from financing activities
Repayment of loans (145) (752)
Proceeds from new loans 211 147
Repayment of principal portion of lease liabilities (69) (67)
Collateral received/(paid) Note 30 2 –
Repurchased shares Note 33 (350) (550)
Dividends paid (280) (277)
Net cash used in financing activities (631) (1,499)
Net cash flow 240 (581)
Cash and cash equivalents less bank overdrafts at January 1 179 751
Foreign exchange differences on cash and cash equivalents and bank overdrafts 15 9
194 760
Cash and cash equivalents less bank overdrafts at December 31 Note 27 434 179
Add: Bank overdrafts at December 31 Note 27 468 604
Less: Cash included in assets classified as held for sale at December 31 Note 9 (3) –
Cash and cash equivalents in the statement of financial position at December 31 Note 27 899 783
* Restated for IFRS 16. See Note 20 – Leasing.
Consolidated Statement of Cash Flows
in millions of euros, for the year ended December 31 2019 2018restated*
Cash flows from operating activities
Profit for the year 669 656
Adjustments for:
Financing results Note 15 53 79
Share of profit of equity-accounted investees, net of tax Note 21 (3) (2)
Income tax expense Note 16 189 234
Amortization, impairments, and depreciation Note 14 475 463
Additions to provisions Note 32 20 27
Release of provisions Note 32 (4) (19)
Fair value changes of contingent considerations Note 12 (9) (1)
Book (profit)/loss on divestments of operations Note 8 4 (163)
Curtailment (gain)/loss on employee benefits Note 31 (16) 2
Remeasurement loss on assets classified as held for sale Note 9 2 –
Share-based payments Note 34 25 22
Total adjustments 736 642
Changes in working capital:
Inventories (2) (3)
Contract assets (26) 4
Trade and other receivables (62) (75)
Deferred income and other contract liabilities 74 72
Trade and other payables (11) 42
Autonomous movements in working capital (27) 40
Interest paid (including the interest portion of lease payments) (82) (124)
Interest received 25 21
Paid income tax Note 23 (195) (206)
Appropriation of provisions Note 32 (20) (22)
Additional defined benefit plan contributions (2) (5)
Other (2) (1)
Net cash from operating activities 1,102 1,001* Restated for IFRS 16 and certain reclassifications. See Note 20 – Leasing and Note 1 – General and Basis of Preparation.

86 87Wolters Kluwer 2019 Annual Report Wolters Kluwer 2019 Annual Report
Table of Contents | Consolidated Financial Statements | Company Financial Statements
Consolidated Statement of Financial Position (continued)
in millions of euros, at December 31 2019 2018restated*
January 1, 2018restated*
Equity
Issued share capital Note 33 33 34 35
Share premium reserve 87 87 87
Legal reserves 242 182 20
Other reserves 2,018 1,951 2,115
Equity attributable to the owners of the company Note 48 2,380 2,254 2,257
Non-controlling interests Note 17 0 0 4
Total equity 2,380 2,254 2,261
Non-current liabilities
Bonds 1,629 1,628 1,627
Private placements 163 407 396
Lease liabilities 293 188 169
Other long-term debt 26 26 17
Total long-term debt Note 29 2,111 2,249 2,209
Deferred tax liabilities Note 23 348 356 301
Employee benefits Note 31 122 143 150
Provisions Note 32 5 11 3
Total non-current liabilities 2,586 2,759 2,663
Current liabilities
Deferred income Note 25 1,679 1,592 1,486
Other contract liabilities Note 25 39 45 43
Trade and other payables Note 28 901 893 866
Current income tax liabilities Note 23 163 165 127
Short-term provisions Note 32 24 21 41
Borrowings and bank overdrafts Note 29 670 748 288
Short-term bonds and private placements Note 29 250 – 750
Short-term lease liabilities Note 29 75 67 73
Liabilities classified as held for sale Note 9 8 – 80
Total current liabilities 3,809 3,531 3,754
Total liabilities 6,395 6,290 6,417
Total equity and liabilities 8,775 8,544 8,678
* Restated for IFRS 16, IFRIC 23, and certain reclassifications. See Note 20 – Leasing and Note 1 – General and Basis of Preparation.
Consolidated Statement of Financial Position
in millions of euros, at December 31 2019 2018restated*
January 1, 2018restated*
Non-current assets
Goodwill and intangible assets Note 18 5,694 5,785 5,581
Property, plant, and equipment Note 19 95 89 96
Right-of-use assets Note 20 341 231 220
Investments in equity-accounted investees Note 21 8 15 11
Financial assets Note 22 39 42 21
Contract assets Note 25 20 19 17
Deferred tax assets Note 23 102 107 94
Total non-current assets 6,299 6,288 6,040
Current assets
Inventories Note 24 73 71 94
Contract assets Note 25 137 113 113
Trade receivables Note 25 1,087 1,022 949
Other receivables Note 26 233 243 206
Current income tax assets Note 23 22 24 9
Cash and cash equivalents Note 27 899 783 1,020
Assets classified as held for sale Note 9 25 – 247
Total current assets 2,476 2,256 2,638
Total assets 8,775 8,544 8,678
* Restated for IFRS 16, IFRIC 23, and certain reclassifications. See Note 20 – Leasing and Note 1 – General and Basis of Preparation.

89Wolters Kluwer 2019 Annual Report
Table of Contents | Consolidated Financial Statements | Company Financial Statements
88 Wolters Kluwer 2019 Annual Report
Table of Contents | Consolidated Financial Statements | Company Financial Statements
General
Reporting entityWolters Kluwer N.V. (‘the company’) with its subsidiaries (together referred to as ‘the group’, and individually as ‘group entities’) is a global leader in professional information, software solutions, and services for the health, tax and accounting, finance, risk and compliance, and legal sectors. We help our customers make critical decisions every day by providing expert solutions that combine deep domain knowledge with specialized technology and services.
The group maintains operations across North America, Europe, Asia Pacific, and other regions (referred to as ‘Rest of World’). The company’s ordinary shares are quoted on Euronext Amsterdam (WKL) and are included in the AEX and Euronext 100 indices.
The registered office of Wolters Kluwer N.V. is located at Zuidpoolsingel 2, Alphen aan den Rijn, the Netherlands, with its statutory seat in Amsterdam and a registration with the Dutch Commercial Register under number 33.202.517.
Statement of complianceThe consolidated financial statements have been prepared in accordance with International Financial Reporting Standards (IFRS) and its interpretations, prevailing as of December 31, 2019, as endorsed for use in the European Union by the European Commission.
These financial statements were authorized for issuance by the Executive Board and Supervisory Board on February 25, 2020. The adoption of the financial statements and the adoption of the dividend are reserved for the shareholders in the Annual General Meeting of Shareholders on April 23, 2020.
Consolidated financial statementsThe consolidated financial statements of the company at and for the year ended December 31, 2019, comprise the company and its subsidiaries and the group’s interest in
associates and jointly controlled entities. The significant accounting policies applied in the preparation of these consolidated financial statements are set out in Note 2 - Significant Accounting Policies and the relevant respective notes to the consolidated financial statements. The group entities have consistently applied these policies.
A list of participations has been filed with the Chamber of Commerce in The Hague, the Netherlands, and is available from the company upon request. An overview of the significant participations is included in Note 39 – Overview of Significant Participations.
Basis of preparation
Basis of measurementThe consolidated financial statements have been prepared under the historical cost basis except for the following material items in the consolidated statement of financial position:• Financial assets and financial liabilities (including
derivative financial instruments) measured at fair value;• Assets and liabilities held for sale;• Contingent considerations;• Share-based payments; and• Net defined employee benefit assets/liabilities.
Functional and presentation currencyThe consolidated financial statements are presented in euros, which is the company’s functional and presentation currency. Unless otherwise indicated, the financial information is in euros and has been rounded to the nearest million.
Use of estimates and judgmentsThe preparation of financial statements in conformity with IFRS requires management to make judgments, estimates, and assumptions that affect the application of policies and reported amounts of assets and liabilities, the disclosure of contingent assets and liabilities, and the reported amounts of income and expense. Refer to Note 3 - Accounting Estimates and Judgments.
Notes to the Consolidated Financial Statements
Note 1 – General and Basis of Preparation
Consolidated Statement of Changes in Total Equity
in millions of euros Legal reserves Other reserves
Issu
ed s
hare
ca
pita
l
Shar
e pr
emiu
m
rese
rve
Lega
l res
erve
pa
rtic
ipat
ions
Hed
ge re
serv
e
Tran
slat
ion
rese
rve
Trea
sury
sh
ares
Reta
ined
ea
rnin
gs
Shar
ehol
ders
’ eq
uity
Non
-con
trol
ling
inte
rest
s
Tota
l equ
ity*
Balance at January 1, 2018, as originally reported
35
87 108 (114) 26 (247) 2,374 2,269 4 2,273
Effect of change in accounting policy (IFRS 16) (12) (12) (12)
Restated balance at January 1, 2018 35 87 108 (114) 26 (247) 2,362 2,257 4 2,261
Profit for the year* 656 656 0 656
Other comprehensive income for the year*
1 135 8 144 0 144
Total comprehensive income/(loss) for the year* 1 135 664 800 0 800
Transactions with owners of the company, recognized directly in equity:
Share-based payments 22 22 22
Cancellation of shares (1) 419 (418) 0 0
Release LTIP shares 55 (55) 0 0
Final cash dividend 2017 (181) (181) (2) (183)
Interim cash dividend 2018 (94) (94) (94)
Repurchased shares (550) (550) (550)
Other movements 26 (26) 0 (2) (2)
Balance at December 31, 2018 34 87 134 (113) 161 (323) 2,274 2,254 0 2,254
Balance at January 1, 2019 34 87 134 (113) 161 (323) 2,274 2,254 0 2,254
Profit for the year 669 669 0 669
Other comprehensive income for the year (16) 71 6 61 1 62
Total comprehensive income/(loss) for the year (16) 71 675 730 1 731
Transactions with owners of the company, recognized directly in equity:
Share-based payments 25 25 25
Cancellation of shares (1) 343 (342) 0 0
Release LTIP shares 51 (51) 0 0
Final cash dividend 2018 (174) (174) (1) (175)
Interim cash dividend 2019 (105) (105) (105)
Repurchased shares (350) (350) (350)
Other movements 5 (5) 0 0
Balance at December 31, 2019 33 87 139 (129) 232 (279) 2,297 2,380 0 2,380
* Restated for IFRS 16 and certain reclassifications. See Note 20 – Leasing and Note 1 – General and Basis of Preparation.

90 91Wolters Kluwer 2019 Annual Report Wolters Kluwer 2019 Annual Report
Table of Contents | Consolidated Financial Statements | Company Financial Statements
IFRIC 23 Uncertainty over Income Tax Treatments was retrospectively adopted on January 1, 2019, whereby the comparative financial information has been restated. IFRIC 23 has had no impact on the comparative shareholders’ equity and comparative profit for the year. In the comparative statement of financial position, IFRIC 23 resulted in a reclassification of €139 million and €115 million from deferred tax liabilities to current income tax liabilities at December 31, 2018, and January 1, 2018, respectively. In addition, €11 million of current income tax assets were netted against deferred tax liabilities at December 31, 2018. The comparative financial information in Note 16 – Income Tax Expense and Note 23 – Tax Assets and Liabilities is adjusted accordingly.
Effect of forthcoming accounting standardsThe following other forthcoming amendments and new standards are not yet effective for the year ended December 31, 2019, and have not been early adopted in preparing these financial statements:• Amendments to References to Conceptual Framework in
IFRS Standards;• Definition of Material (Amendments to IAS 1 and IAS 8);• Classification of liabilities as current or non-current
(Amendments to IAS 1);• Definition of a Business (Amendments to IFRS 3);• Interest Rate Benchmark Reform (Amendments to IFRS
9, IAS 39, and IFRS 7); and• IFRS 17 Insurance Contracts.
The group expects no significant impact because of these amendments and new standards.
ComparativesDuring the year, the group performed an in-depth analysis of its reporting on the specific disclosure requirements of IFRS 15. As a result of this analysis, some of the 2018 comparative disclosures were adjusted as follows:• Within Tax & Accounting, Governance, Risk & Compliance
and Legal & Regulatory, reclassifications of respectively €86 million, €18 million, and €161 million from multi-year contracts to contracts one year or less are included in the 2018 comparative figures, due to refinement of internal definitions. Refer to Note 6 – Revenues.
• Within Governance, Risk & Compliance, a reclassification of €37 million from at a point in time recognition to over time recognition is included in the 2018 comparative figures. Refer to Note 6 – Revenues.
• Within the movement schedule of contract assets, the 2018 comparative figures were restated due to separate disclosure of ‘Newly recognized cost to fulfil a contract’. Refer to Note 25 – Contract Assets and Liabilities.
• Within the movement schedule of deferred income, both ‘Recognized as revenue in the year on new and existing contracts’ and ‘New and existing contracts with customers’ were understated by €145 million in the 2018 comparative figures. Refer to Note 25 – Contract Assets and Liabilities.
• The 2018 comparative figure for the aggregate amount of the transaction price allocated to the remaining performance obligations that are unsatisfied at year-end is adjusted from €2,706 million to €2,836 million. Refer to Note 25 – Contract Assets and Liabilities.
In the comparative statement of financial position, legal provisions were reclassified from trade and other payables to provisions (December 31, 2018, and January 1, 2018: €9 million and €20 million respectively). This also resulted in a reclassification of €11 million in the 2018 statement of cash flows from autonomous movements in working capital to additions to, release of, and appropriation of provisions.
At January 1, 2018, the share buyback commitment of €50 million is reclassified from trade and other payables to treasury shares (within other reserves), since the commitment did not result in a liability at this date. This resulted in a corresponding increase in total equity.
At December 31, 2018, and January 1, 2018, an amount of €34 million is reclassified from retained earnings (within other reserves) to legal reserve participations (within legal reserves).
In addition, certain minor reclassifications have been made to the comparative statement of cash flows and statement of financial position and the related notes to conform to the current year presentation and to improve insights. These reclassifications have had no impact on the comparative shareholders’ equity and comparative profit for the year.
Going concernThe Executive Board and Supervisory Board have assessed, during the preparation of the consolidated financial statements of the group, the going concern assumption. The Executive Board and Supervisory Board believe that no events or conditions give rise to doubt about the ability of the group to continue in operation. This conclusion is drawn based on knowledge of the group, the estimated economic outlook and related identified risks and uncertainties. Furthermore, the conclusion is based on a review of the three-year strategic plan and next year's budget, including expected development in liquidity and capital, which includes the evaluation of current credit facilities available, contractual and expected maturities, and covenants. Consequently, it has been concluded that it is reasonable to apply the going concern assumption that the group will continue to be in operation at least 12 months from the end of the reporting period.
Effect of new accounting standardsExcept for the EU-endorsed amendments below, the group has consistently applied the accounting policies set out in Note 2 - Significant Accounting Policies and the relevant respective notes to the consolidated financial statements, to all periods presented in these financial statements.
The group has applied the following standards and other amendments for the first time for the annual reporting period commencing January 1, 2019:• IFRS 16 Leases;• Annual Improvements to IFRSs 2015-2017 Cycle
(Amendments to IFRS 3, IFRS 11, IAS 12, and IAS 23);• Prepayment Features with Negative Compensation
(Amendments to IFRS 9);• Plan Amendment, Curtailment or Settlement
(Amendments to IAS 19);• Long-term Interests in Associates and Joint Ventures
(Amendments to IAS 28); and• IFRIC 23 Uncertainty over Income Tax Treatments.
Apart from IFRS 16 and IFRIC 23, the standards and amendments listed above did not have any impact on the amounts recognized in the current or prior periods and are not expected to significantly affect future periods.
IFRS 16 Leases was adopted on January 1, 2019, with the use of certain practical expedients. The group applied the full retrospective approach whereby the comparative financial information has been restated. The key impact of IFRS 16 is disclosed in the table below. The full impact of IFRS 16 is summarized in Note 20 – Leasing.
Key impact of IFRS 16
2018* IFRS 16 2018 restated
Profit for the year 657 (1) 656
Right-of-use assets – 231 231
Lease liabilities (including short-term) – 255 255
Equity attributable to the owners of the company 2,267 (13) 2,254
Net cash from operating activities 934 67 1,001
Net cash used in financing activities (1,432) (67) (1,499)
Adjusted operating profit margin (%) 23.0 0.1 23.1
Cash conversion ratio (%) 105 (1) 104
Return on invested capital (ROIC) (%) 10.9 (0.3) 10.6
Net debt 1,994 255 2,249
Net-debt-to-EBITDA ratio 1.7 0.1 1.8
* Restated for certain reclassifications, as disclosed on the next page.
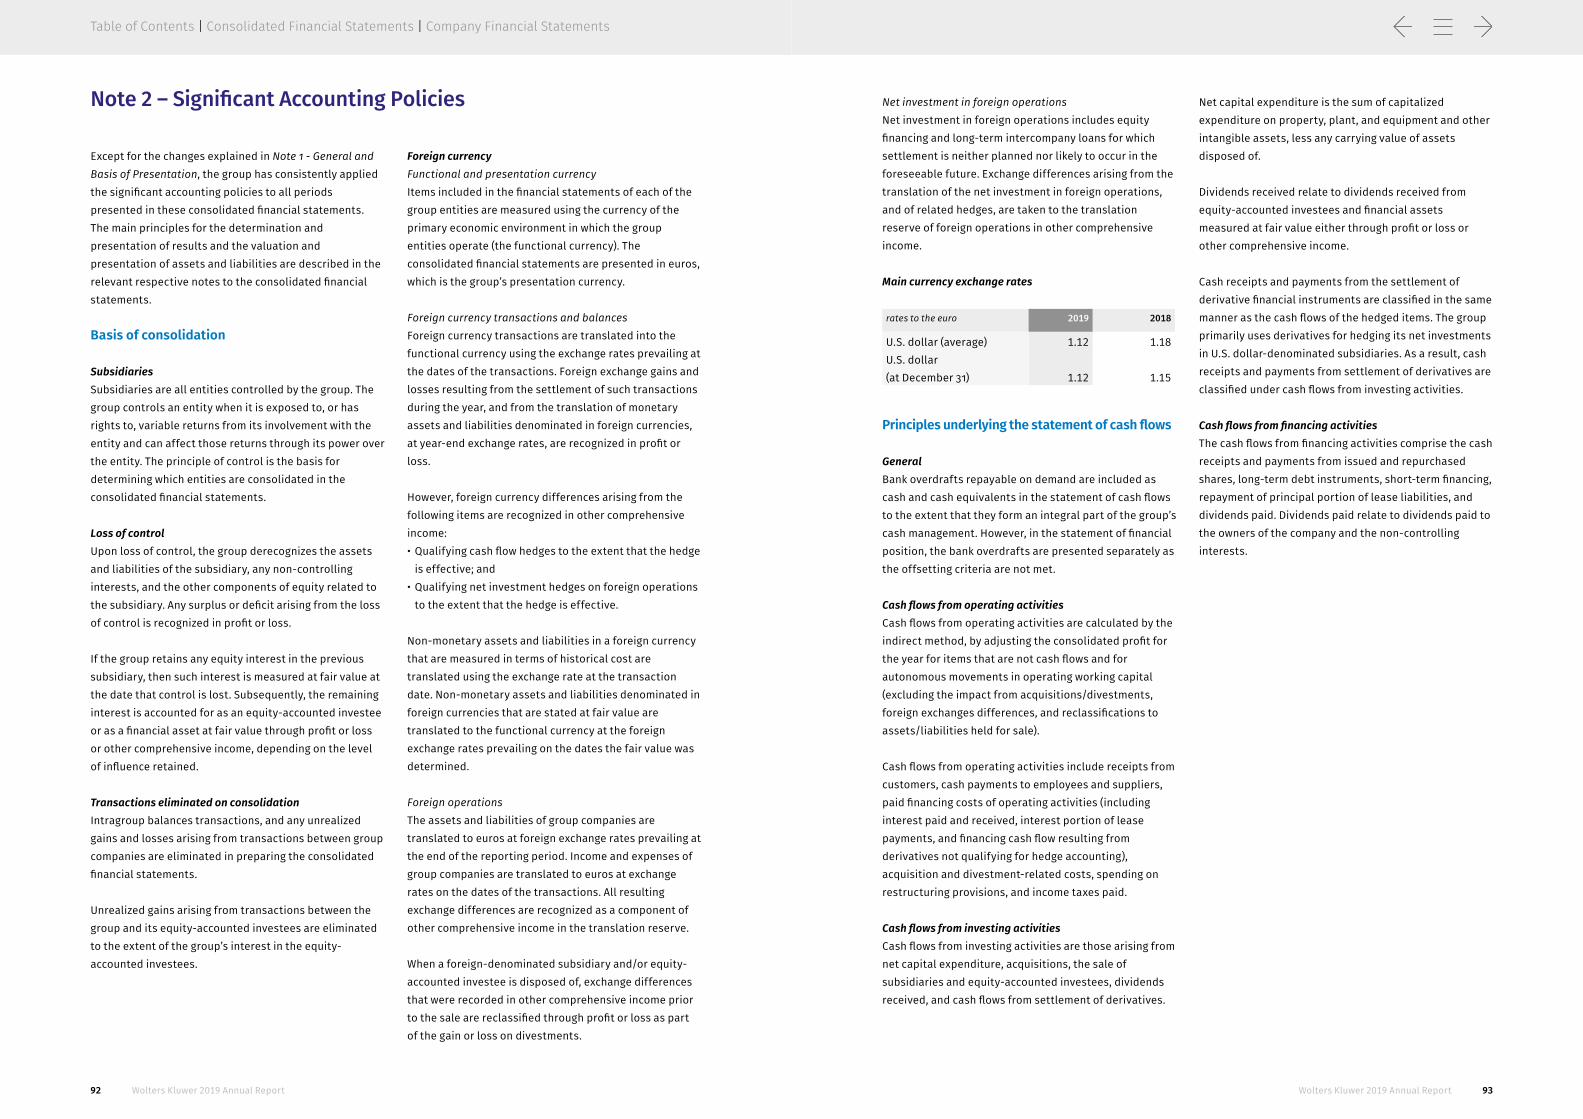
92 93Wolters Kluwer 2019 Annual Report Wolters Kluwer 2019 Annual Report
Table of Contents | Consolidated Financial Statements | Company Financial Statements
Note 2 – Significant Accounting Policies
Except for the changes explained in Note 1 - General and Basis of Presentation, the group has consistently applied the significant accounting policies to all periods presented in these consolidated financial statements. The main principles for the determination and presentation of results and the valuation and presentation of assets and liabilities are described in the relevant respective notes to the consolidated financial statements.
Basis of consolidation
SubsidiariesSubsidiaries are all entities controlled by the group. The group controls an entity when it is exposed to, or has rights to, variable returns from its involvement with the entity and can affect those returns through its power over the entity. The principle of control is the basis for determining which entities are consolidated in the consolidated financial statements.
Loss of controlUpon loss of control, the group derecognizes the assets and liabilities of the subsidiary, any non-controlling interests, and the other components of equity related to the subsidiary. Any surplus or deficit arising from the loss of control is recognized in profit or loss.
If the group retains any equity interest in the previous subsidiary, then such interest is measured at fair value at the date that control is lost. Subsequently, the remaining interest is accounted for as an equity-accounted investee or as a financial asset at fair value through profit or loss or other comprehensive income, depending on the level of influence retained.
Transactions eliminated on consolidationIntragroup balances transactions, and any unrealized gains and losses arising from transactions between group companies are eliminated in preparing the consolidated financial statements.
Unrealized gains arising from transactions between the group and its equity-accounted investees are eliminated to the extent of the group’s interest in the equity-accounted investees.
Foreign currencyFunctional and presentation currencyItems included in the financial statements of each of the group entities are measured using the currency of the primary economic environment in which the group entities operate (the functional currency). The consolidated financial statements are presented in euros, which is the group’s presentation currency.
Foreign currency transactions and balancesForeign currency transactions are translated into the functional currency using the exchange rates prevailing at the dates of the transactions. Foreign exchange gains and losses resulting from the settlement of such transactions during the year, and from the translation of monetary assets and liabilities denominated in foreign currencies, at year-end exchange rates, are recognized in profit or loss.
However, foreign currency differences arising from the following items are recognized in other comprehensive income:• Qualifying cash flow hedges to the extent that the hedge
is effective; and• Qualifying net investment hedges on foreign operations
to the extent that the hedge is effective.
Non-monetary assets and liabilities in a foreign currency that are measured in terms of historical cost are translated using the exchange rate at the transaction date. Non-monetary assets and liabilities denominated in foreign currencies that are stated at fair value are translated to the functional currency at the foreign exchange rates prevailing on the dates the fair value was determined.
Foreign operationsThe assets and liabilities of group companies are translated to euros at foreign exchange rates prevailing at the end of the reporting period. Income and expenses of group companies are translated to euros at exchange rates on the dates of the transactions. All resulting exchange differences are recognized as a component of other comprehensive income in the translation reserve.
When a foreign-denominated subsidiary and/or equity-accounted investee is disposed of, exchange differences that were recorded in other comprehensive income prior to the sale are reclassified through profit or loss as part of the gain or loss on divestments.
Net investment in foreign operationsNet investment in foreign operations includes equity financing and long-term intercompany loans for which settlement is neither planned nor likely to occur in the foreseeable future. Exchange differences arising from the translation of the net investment in foreign operations, and of related hedges, are taken to the translation reserve of foreign operations in other comprehensive income.
Main currency exchange rates
rates to the euro 2019 2018
U.S. dollar (average) 1.12 1.18U.S. dollar(at December 31) 1.12 1.15
Principles underlying the statement of cash flows
GeneralBank overdrafts repayable on demand are included as cash and cash equivalents in the statement of cash flows to the extent that they form an integral part of the group’s cash management. However, in the statement of financial position, the bank overdrafts are presented separately as the offsetting criteria are not met.
Cash flows from operating activitiesCash flows from operating activities are calculated by the indirect method, by adjusting the consolidated profit for the year for items that are not cash flows and for autonomous movements in operating working capital (excluding the impact from acquisitions/divestments, foreign exchanges differences, and reclassifications to assets/liabilities held for sale).
Cash flows from operating activities include receipts from customers, cash payments to employees and suppliers, paid financing costs of operating activities (including interest paid and received, interest portion of lease payments, and financing cash flow resulting from derivatives not qualifying for hedge accounting), acquisition and divestment-related costs, spending on restructuring provisions, and income taxes paid.
Cash flows from investing activitiesCash flows from investing activities are those arising from net capital expenditure, acquisitions, the sale of subsidiaries and equity-accounted investees, dividends received, and cash flows from settlement of derivatives.
Net capital expenditure is the sum of capitalized expenditure on property, plant, and equipment and other intangible assets, less any carrying value of assets disposed of.
Dividends received relate to dividends received from equity-accounted investees and financial assets measured at fair value either through profit or loss or other comprehensive income.
Cash receipts and payments from the settlement of derivative financial instruments are classified in the same manner as the cash flows of the hedged items. The group primarily uses derivatives for hedging its net investments in U.S. dollar-denominated subsidiaries. As a result, cash receipts and payments from settlement of derivatives are classified under cash flows from investing activities.
Cash flows from financing activitiesThe cash flows from financing activities comprise the cash receipts and payments from issued and repurchased shares, long-term debt instruments, short-term financing, repayment of principal portion of lease liabilities, and dividends paid. Dividends paid relate to dividends paid to the owners of the company and the non-controlling interests.

94 95Wolters Kluwer 2019 Annual Report Wolters Kluwer 2019 Annual Report
Table of Contents | Consolidated Financial Statements | Company Financial Statements
The preparation of financial statements in conformity with IFRS requires management to make judgments, estimates, and assumptions that affect the application of policies and reported amounts of assets and liabilities, the disclosure of contingent assets and liabilities, and the reported amounts of income and expense. The estimates and underlying assumptions are based on historical experience and other factors that are believed to be reasonable under the circumstances, the results of which form the basis of making the judgments about carrying values of assets and liabilities that are not clear from other sources. Actual results may differ from those estimates and may result in material adjustments in the next financial year(s).
The estimates and underlying assumptions are reviewed on an ongoing basis. Revisions to accounting estimates are recognized in the period in which the estimate is revised if the revision affects only that period, or the
period of the revision and future periods if the revision affects both current and future periods. Judgments made by management in the application of IFRS that have a significant effect on the financial statements and estimates with a significant risk of material adjustment in the next year are further discussed in the corresponding notes to the statements of profit or loss and financial position:
• Revenue recognition (see Note 6);• Fair value of contingent considerations (see Note 8);• Accounting for income taxes (see Note 16); • Valuation, measurement, and impairment testing of
goodwill, acquired identifiable intangible assets, and other intangible assets (see Note 18);
• Employee benefits (see Note 31); and• Legal and judicial proceedings (see Note 32).
Note 3 – Accounting Estimates and Judgments Note 4 – Benchmark Figures
Benchmark figures
in millions of euros, unless otherwise stated 2019 2018* Change in actual
currencies (%)
Change in constant
currencies (%) **
Revenues 4,612 4,259 8 5
Organic revenue growth (%) 4 4
Adjusted operating profit 1,089 986 11 5
Adjusted operating profit margin (%) 23.6 23.1
Adjusted net profit 790 682 16 9
Adjusted net financing costs Note 15 (58) (77) (25) (19)
Adjusted free cash flow 807 762 6 1
Cash conversion ratio (%) 96 104
Return on invested capital (ROIC) (%) 11.8 10.6
Net debt Note 29 2,199 2,249 (2)
Net-debt-to-EBITDA ratio 1.6 1.8
Diluted adjusted EPS (€) 2.90 2.45 19
Diluted adjusted EPS in constant currencies (€) 2.76 2.48 11
Diluted adjusted free cash flow per share (€) 2.96 2.73 8 3
* Restated for IFRS 16 and certain reclassifications. See Note 20 – Leasing and Note 1 – General and Basis of Preparation. ** Constant currencies at €/$ 1.18.
Revenue reconciliation
€ million %
Revenues 2018* 4,259
Organic change 183 4
Acquisitions 32 1
Divestments (21) 0
Currency impact 159 3
Revenues 2019 4,612 8
* Restated for IFRS 16. See Note 20 – Leasing.
Benchmark figures refer to figures adjusted for non-benchmark items and, where applicable, amortization and impairment of goodwill and acquired identifiable intangible assets. Adjusted figures are non-IFRS compliant financial figures but are internally regarded as key performance indicators to measure the underlying
performance of the business. These figures are presented as additional information and do not replace the information in the consolidated financial statements.
All figures are from continuing operations, unless stated otherwise.

96 97Wolters Kluwer 2019 Annual Report Wolters Kluwer 2019 Annual Report
Table of Contents | Consolidated Financial Statements | Company Financial Statements
Reconciliation between operating profit and adjusted operating profit
2019 2018*
Operating profit 908 967
Amortization and impairment of acquired identifiable intangible assets Note 14 182 175
Non-benchmark items in operating profit Note 12 (1) (156)
Adjusted operating profit 1,089 986
* Restated for IFRS 16. See Note 20 – Leasing.
Reconciliation between profit for the year and adjusted net profit
2019 2018*
Profit for the year attributable to the owners of the company (A) 669 656
Amortization and impairment of acquired identifiable intangible assets 182 175
Tax benefits on amortization and impairment of acquired identifiable intangible assets and goodwill (48) (43)
Non-benchmark items, net of tax (13) (106)
Adjusted net profit (B) 790 682
* Restated for IFRS 16. See Note 20 – Leasing.
Reconciliation between total financing results and adjusted net financing costs
2019 2018*
Total financing results Note 15 (53) (79)
Non-benchmark items in total financing results Note 15 (5) 2
Adjusted net financing costs (58) (77)
* Restated for IFRS 16. See Note 20 – Leasing.
Summary of non-benchmark items
2019 2018
Included in operating profit:
Other operating income and (expense) Note 12 1 156
Included in total financing results:
Other finance income/(costs) Note 15 5 (2)
Total non-benchmark items before tax 6 154
Tax benefit/(expense) on non-benchmark items 6 (57)
Impact of changes in tax rates and mandatory repatriation tax 1 9
Non-benchmark items, net of tax 13 106
Reconciliation between net cash from operating activities and adjusted free cash flow
2019 2018*
Net cash from operating activities 1,102 1,001
Capital expenditure (226) (214)
Repayment of principal portion of lease liabilities (69) (67)
Acquisition-related costs Note 8 1 4
Paid divestment expenses Note 8 1 3
Dividends received Note 21 0 1
Net tax charge/(benefit) on divested assets and consolidation of platform technology, and mandatory repatriation tax (2) 34
Adjusted free cash flow (C) 807 762* Restated for IFRS 16. See Note 20 – Leasing. Return on invested capital (ROIC)
2019 2018*
Adjusted operating profit 1,089 986
Allocated tax (257) (247)
Net operating profit after allocated tax (NOPAT) 832 739
Average invested capital 7,065 6,932
ROIC (NOPAT/Average invested capital) (%) 11.8 10.6
* Restated for IFRS 16. See Note 20 – Leasing.
Allocated tax is benchmark tax rate multiplied by adjusted operating profit.
Invested capital is defined as total assets minus current liabilities, excluding investments in equity-accounted investees, deferred tax assets, non-operating working capital, and cash and cash equivalents. This total is adjusted for accumulated amortization on acquired
identifiable intangible assets, goodwill amortized pre-IFRS, and goodwill written off to equity pre-IFRS (excluding acquired identifiable intangible assets and goodwill impaired and/or fully amortized), less any related deferred tax liabilities. The average invested capital is based on five measurement points during the year.

98 99Wolters Kluwer 2019 Annual Report Wolters Kluwer 2019 Annual Report
Table of Contents | Consolidated Financial Statements | Company Financial Statements
Cash conversion ratio
2019 2018*
Operating profit 908 967
Amortization, depreciation, and impairments Note 14 475 463
EBITDA 1,383 1,430
Non-benchmark items in operating profit Note 12 (1) (156)
Adjusted EBITDA 1,382 1,274
Autonomous movements in working capital (27) 40
Capital expenditure (226) (214)
Repayment of principal portion of lease liabilities (69) (67)
Interest portion of lease payments (11) (7)
Adjusted operating cash flow (H) 1,049 1,026
Adjusted operating profit (I) 1,089 986
Cash conversion ratio (H/I) (%) 96 104* Restated for IFRS 16 and certain reclassifications. See Note 20 – Leasing and Note 1 – General and Basis of Preparation.
Non-benchmark items in operating profitNon-benchmark items relate to income and expenses arising from circumstances or transactions that, given their size or nature, are clearly distinct from the ordinary activities of the group and are excluded from the benchmark figures. Apart from amortization and impairment of acquired identifiable intangible assets, non-benchmark items in operation profit include the items below. Refer also to Note 12 – Other Operating Income and (Expense).
Divestment-related resultsDivestment-related results are event-driven gains and losses incurred by the group from the sale of activities (subsidiaries and equity-accounted investees). These results also include the loss on remeasurement of disposal groups, divestment expenses, and restructuring of stranded costs, and have been included in other operating income and expense in the statement of profit or loss.
Acquisition-related costsAcquisition-related costs are one-time non-recurring cost incurred by the group resulting from acquisition activities. The acquisition-related costs are directly attributable to acquisitions, such as legal fees, broker/bank costs, and commercial and financial due diligence fees, and have been included in other operating income and expense in the statement of profit or loss.
Loss on remeasurement of disposal groupsLoss on remeasurement of disposal groups include losses for any initial or subsequent write-down of the disposal groups to fair value less costs of disposal.
Fair value changes of contingent considerationsResults from changes in the fair value of contingent considerations are not considered to be part of the ordinary activities of the group and have been included in other operating income and expense in the statement of profit or loss.
Additions to acquisition integration provisionsAdditions to acquisition integration provisions are those one-time non-recurring costs incurred by the group to integrate activities acquired by business combination and have been included in other operating income and expense in the statement of profit or loss.
Other non-benchmark itemsNon-benchmark items, which cannot be classified in the categories above, relate to income and expenses arising from circumstances or transactions that, given their size or nature, are clearly distinct from the ordinary activities of the group and are excluded from the benchmark figures.
Per share information
in euro, unless otherwise stated 2019 2018*
Total number of ordinary shares outstanding at December 31 (in millions of shares) Note 33 266.7 271.2
Weighted average number of ordinary shares (D) (in millions of shares) Note 7 270.3 276.7
Diluted weighted average number of ordinary shares (E) (in millions of shares) Note 7 272.2 278.8
Adjusted EPS (B/D) 2.92 2.47
Diluted adjusted EPS (B/E) 2.90 2.45
Diluted adjusted EPS in constant currencies 2.76 2.48
Basic EPS (A/D) Note 7 2.47 2.37
Diluted EPS (A/E) Note 7 2.46 2.35
Adjusted free cash flow per share (C/D) 2.98 2.75
Diluted adjusted free cash flow per share (C/E) 2.96 2.73
* Restated for IFRS 16. See Note 20 – Leasing.
Benchmark tax rate
2019 2018*
Income tax expense Note 16 189 234
Tax benefit on amortization and impairment of acquired identifiable intangible assets 48 43
Tax benefit/(expense) on non-benchmark items 6 (57)
Impact of changes in tax rates and mandatory repatriation tax 1 9
Tax on adjusted profit (F) 244 229
Adjusted net profit (B) 790 682
Adjustment for non-controlling interests 0 0
Adjusted profit before tax (G) 1,034 911
Benchmark tax rate (F/G) (%) 23.6 25.1
* Restated for IFRS 16. See Note 20 – Leasing.

100 101Wolters Kluwer 2019 Annual Report Wolters Kluwer 2019 Annual Report
Table of Contents | Consolidated Financial Statements | Company Financial Statements
Non-benchmark items in financing results Non-benchmark items in financing results include the below items. Refer also to Note 15 – Financing results.
Divestment-related results on equity-accounted investeesWhen equity accounting for equity-accounted investees ceases, the group calculates the book gain or loss as the difference between the sum of the fair value of proceeds less costs of disposal, the fair value of retained investment, and any amount reclassified from other comprehensive income less the carrying amount of the investment at the date on which significant influence is lost.
Book results and fair value changes of financial assets measured at fair value through profit or lossFair value changes of financial assets measured at fair value through profit or loss and any gain or loss on the sale of financial assets measured at fair value through profit or loss.
Financing component employee benefitsFinancing component employee benefits relates to net interest results on the net defined benefit liability or asset of the group’s defined benefit pension plans and other employee benefit plans.
Non-benchmark tax items in income tax expenseThis item includes the tax effect on non-benchmark items as defined above, and on the amortization and impairment of acquired identifiable intangible assets, and to income tax expense relating to any material changes in (income) tax laws and (income) tax rates in the jurisdictions where Wolters Kluwer operates.
Note 5 – Segment Reporting
reporting by division Health Tax & Accounting
Governance, Risk & Compliance
Legal & Regulatory
Corporate** Total
2019 2018* 2019 2018* 2019 2018* 2019 2018* 2019 2018 2019 2018*
Revenues from third parties 1,186 1,109 1,413 1,295 1,068 975 945 880 – – 4,612 4,259
Cost of revenues 376 348 397 379 294 277 318 293 – – 1,385 1,297
Gross profit 810 761 1,016 916 774 698 627 587 0 0 3,227 2,962
Sales costs 205 190 267 253 149 135 187 175 – – 808 753
General and administrative costs 356 303 405 408 319 309 368 327 64 51 1,512 1,398
Total operating expenses 561 493 672 661 468 444 555 502 64 51 2,320 2,151
Other operating income and (expense) (6) 75 0 0 0 55 7 26 0 0 1 156
Operating profit 243 343 344 255 306 309 79 111 (64) (51) 908 967
Amortization of acquired identifiable intangible assets 35 37 42 65 35 37 32 27 – – 144 166
Impairment of acquired identifiable intangible assets*** 36 – 2 9 – – – – – – 38 9
Non-benchmark expense/ (income) in operating profit 6 (75) 0 0 0 (55) (7) (26) 0 0 (1) (156)
Adjusted operating profit 320 305 388 329 341 291 104 112 (64) (51) 1,089 986
Amortization of other intangible assets and depreciation of PPE and right-of-use assets 54 62 97 90 67 62 58 53 1 0 277 267
Impairment of other intangible and right-of-use assets*** 2 7 11 10 0 1 3 3 – – 16 21
Goodwill and acquired identifiable intangible assets at December 31 1,370 1,424 1,599 1,622 1,186 1,164 965 1,009 – – 5,120 5,219
Capital expenditure 33 36 74 71 73 65 45 40 1 2 226 214
Assets classified as held for sale at December 31 – – – – – – 20 – 5 – 25 –
Liabilities classified as held for sale at December 31 – – – – – – 8 – – – 8 –
Number of FTEs at December 31 2,903 2,866 6,697 6,649 4,330 4,155 4,307 4,343 124 121 18,361 18,134
* Restated for IFRS 16. See Note 20 – Leasing.** The corporate function does not represent an operating segment. *** See Note 18 – Goodwill, Acquired Identifiable Intangible Assets and Other Intangible Assets and Note 20 – Leasing.
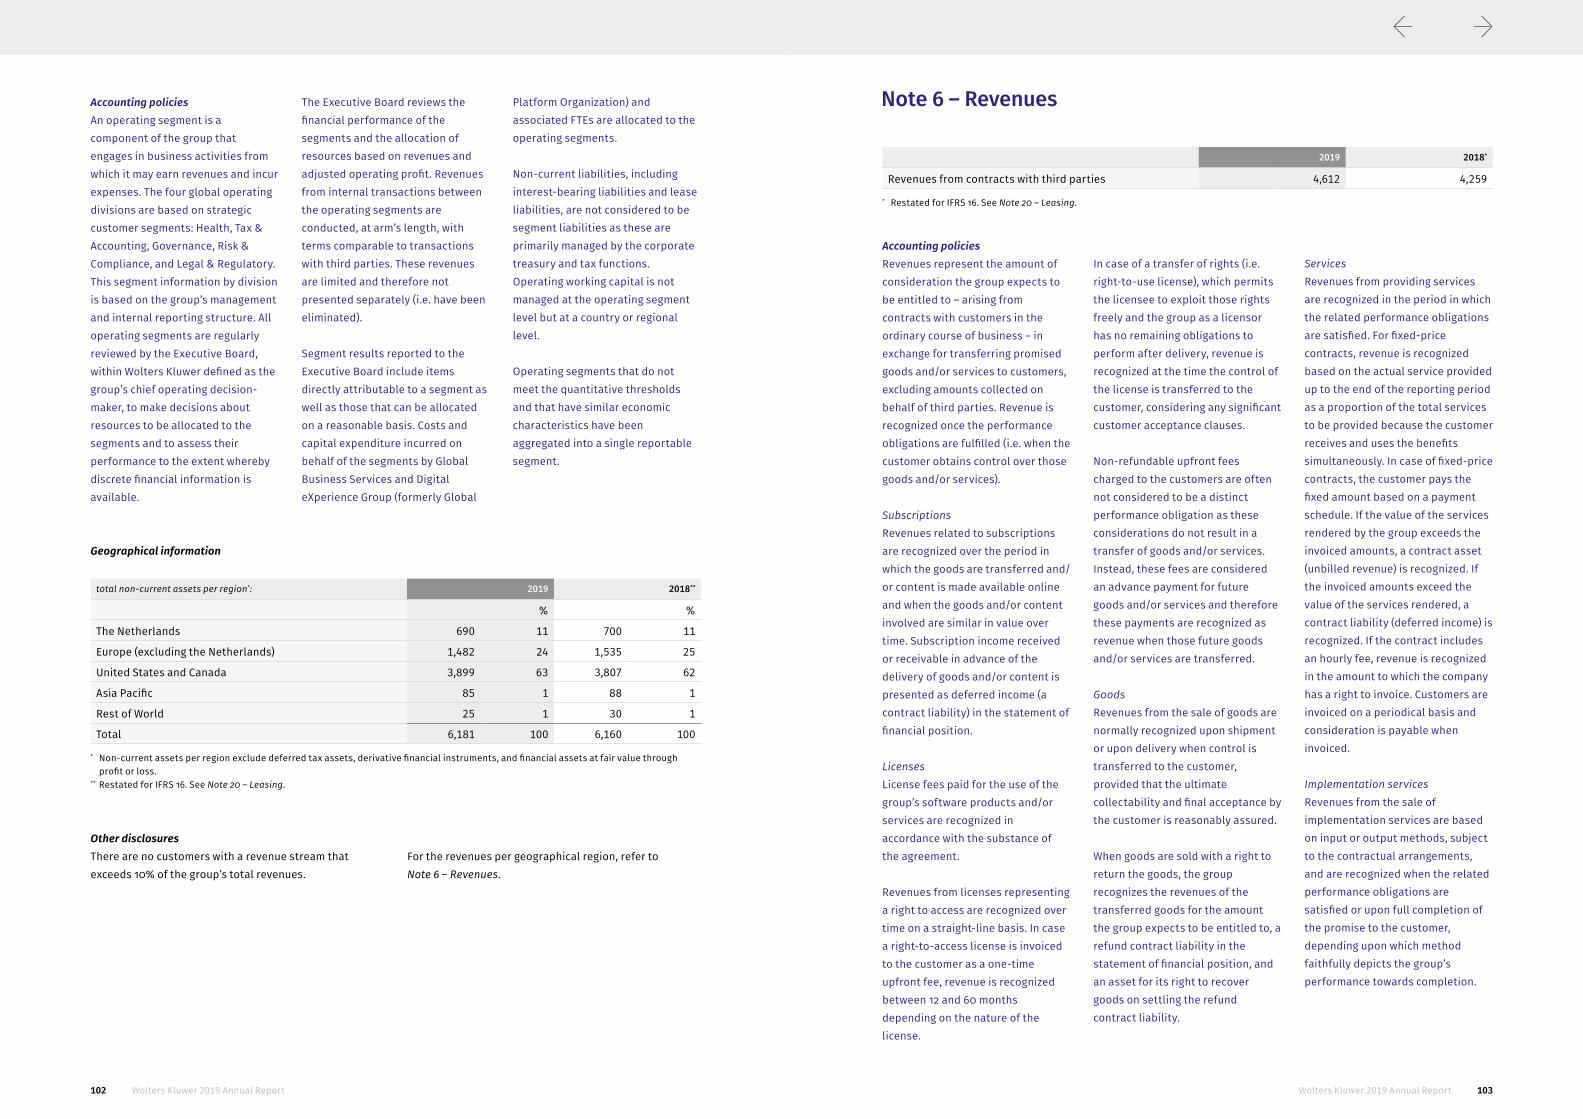
102 103Wolters Kluwer 2019 Annual Report Wolters Kluwer 2019 Annual Report
Table of Contents | Consolidated Financial Statements | Company Financial Statements
Accounting policiesAn operating segment is a component of the group that engages in business activities from which it may earn revenues and incur expenses. The four global operating divisions are based on strategic customer segments: Health, Tax & Accounting, Governance, Risk & Compliance, and Legal & Regulatory. This segment information by division is based on the group’s management and internal reporting structure. All operating segments are regularly reviewed by the Executive Board, within Wolters Kluwer defined as the group’s chief operating decision-maker, to make decisions about resources to be allocated to the segments and to assess their performance to the extent whereby discrete financial information is available.
The Executive Board reviews the financial performance of the segments and the allocation of resources based on revenues and adjusted operating profit. Revenues from internal transactions between the operating segments are conducted, at arm’s length, with terms comparable to transactions with third parties. These revenues are limited and therefore not presented separately (i.e. have been eliminated).
Segment results reported to the Executive Board include items directly attributable to a segment as well as those that can be allocated on a reasonable basis. Costs and capital expenditure incurred on behalf of the segments by Global Business Services and Digital eXperience Group (formerly Global
Platform Organization) and associated FTEs are allocated to the operating segments.
Non-current liabilities, including interest-bearing liabilities and lease liabilities, are not considered to be segment liabilities as these are primarily managed by the corporate treasury and tax functions. Operating working capital is not managed at the operating segment level but at a country or regional level.
Operating segments that do not meet the quantitative thresholds and that have similar economic characteristics have been aggregated into a single reportable segment.
Geographical information
total non-current assets per region*: 2019 2018**
% %
The Netherlands 690 11 700 11
Europe (excluding the Netherlands) 1,482 24 1,535 25
United States and Canada 3,899 63 3,807 62
Asia Pacific 85 1 88 1
Rest of World 25 1 30 1
Total 6,181 100 6,160 100
* Non-current assets per region exclude deferred tax assets, derivative financial instruments, and financial assets at fair value through profit or loss.** Restated for IFRS 16. See Note 20 – Leasing.
Other disclosuresThere are no customers with a revenue stream that exceeds 10% of the group’s total revenues.
For the revenues per geographical region, refer to Note 6 – Revenues.
Note 6 – Revenues
2019 2018*
Revenues from contracts with third parties 4,612 4,259
* Restated for IFRS 16. See Note 20 – Leasing.
Accounting policiesRevenues represent the amount of consideration the group expects to be entitled to – arising from contracts with customers in the ordinary course of business – in exchange for transferring promised goods and/or services to customers, excluding amounts collected on behalf of third parties. Revenue is recognized once the performance obligations are fulfilled (i.e. when the customer obtains control over those goods and/or services).
SubscriptionsRevenues related to subscriptions are recognized over the period in which the goods are transferred and/or content is made available online and when the goods and/or content involved are similar in value over time. Subscription income received or receivable in advance of the delivery of goods and/or content is presented as deferred income (a contract liability) in the statement of financial position.
LicensesLicense fees paid for the use of the group’s software products and/or services are recognized in accordance with the substance of the agreement.
Revenues from licenses representing a right to access are recognized over time on a straight-line basis. In case a right-to-access license is invoiced to the customer as a one-time upfront fee, revenue is recognized between 12 and 60 months depending on the nature of the license.
In case of a transfer of rights (i.e. right-to-use license), which permits the licensee to exploit those rights freely and the group as a licensor has no remaining obligations to perform after delivery, revenue is recognized at the time the control of the license is transferred to the customer, considering any significant customer acceptance clauses.
Non-refundable upfront fees charged to the customers are often not considered to be a distinct performance obligation as these considerations do not result in a transfer of goods and/or services. Instead, these fees are considered an advance payment for future goods and/or services and therefore these payments are recognized as revenue when those future goods and/or services are transferred.
GoodsRevenues from the sale of goods are normally recognized upon shipment or upon delivery when control is transferred to the customer, provided that the ultimate collectability and final acceptance by the customer is reasonably assured.
When goods are sold with a right to return the goods, the group recognizes the revenues of the transferred goods for the amount the group expects to be entitled to, a refund contract liability in the statement of financial position, and an asset for its right to recover goods on settling the refund contract liability.
ServicesRevenues from providing services are recognized in the period in which the related performance obligations are satisfied. For fixed-price contracts, revenue is recognized based on the actual service provided up to the end of the reporting period as a proportion of the total services to be provided because the customer receives and uses the benefits simultaneously. In case of fixed-price contracts, the customer pays the fixed amount based on a payment schedule. If the value of the services rendered by the group exceeds the invoiced amounts, a contract asset (unbilled revenue) is recognized. If the invoiced amounts exceed the value of the services rendered, a contract liability (deferred income) is recognized. If the contract includes an hourly fee, revenue is recognized in the amount to which the company has a right to invoice. Customers are invoiced on a periodical basis and consideration is payable when invoiced.
Implementation servicesRevenues from the sale of implementation services are based on input or output methods, subject to the contractual arrangements, and are recognized when the related performance obligations are satisfied or upon full completion of the promise to the customer, depending upon which method faithfully depicts the group’s performance towards completion.

104 105Wolters Kluwer 2019 Annual Report Wolters Kluwer 2019 Annual Report
Table of Contents | Consolidated Financial Statements | Company Financial Statements
Multiple-element contractsThere are arrangements that include various combinations of performance obligations, such as software licenses, services, training, and implementation. A performance obligation is only distinct if the customer can benefit from the goods and/or services on its own or together with other resources that are readily available to the customer, and the promise to transfer goods and/or services is separately identifiable from other promises in the contract. Goods and/or services that are not distinct are bundled with other goods and/or services in the contract, until a bundle of goods and/or services is created that is distinct, resulting in a single performance obligation.
Where performance obligations are satisfied over different periods of time, revenues are allocated to the respective performance obligations based on relative stand-alone selling prices at the inception of the arrangement, and revenues are recognized as each performance obligation is satisfied.
Agent/principal arrangementsIf the group acts as an agent, whereby the group sells goods and/or services on behalf of a principal, the group recognizes the amount of the net consideration as revenues. If the group acts as a principal, the group recognizes the gross amount of consideration for the specific goods and/or services transferred once the performance obligations are satisfied.
Variable considerationDiscounts (including volume discounts), return of goods, usage-based prices, and pricing based on index are the most common forms of variable considerations within the group. A discount is often contractually agreed and allocated
to all distinct performance obligations, unless there is a specific discount policy for that performance obligation. Volume-discounts, return of goods, and usage-based prices are estimated at contract inception and periodically reassessed during the contract term. The group considers normal price increases based on local inflation rates or customary business practices as compensation for cost price increases and not as variable consideration. Any pricing based on index that is beyond compensation for cost price increases is estimated at contract inception, periodically reassessed and recognized over the term of the contract.
Financing componentsAs a practical expedient, the group does not adjust the consideration for the effects of a significant financing component if the group expects that the period between the transfer of the promised goods and/or services to the customer and payment by the customer is one year or less. The group has no significant contracts with periods of one year or more between the transfer of goods and/or services and the payment of the consideration. Consequently, the group does not adjust any of the transaction prices for the time value of money.
WarrantyIn most cases, any warranty given in connection with the sale of products and/or services does not qualify as a distinct service and therefore these general warranties are not considered to be a separate performance obligation. Consequently, no warranty provisions are recognized.
Cost of revenuesCost of revenues comprises directly attributable costs of goods and/or services sold.
For digital products and services, cost of revenues may include data maintenance, hosting, license fees, royalties, product support, personnel expenses, subcontracted work, training, and other costs incurred to support and maintain the products, applications, and services.
For print products, these costs may include cost for paper, printing and binding, royalties, personnel expenses, subcontracted work, shipping costs, and other incurred costs.
Critical estimates and judgmentsRevenue recognition requires estimates and judgments. IFRS 15 Revenue from Contracts with Customers requires management to make judgments on the characteristics of a performance obligation, (un)bundling of multi-element arrangements and assessment whether the revenue should be recognized over time or at a point in time. In addition, management makes estimates of the stand-alone selling prices of performance obligations, variable considerations such as provisions for returns, and the product and contract life.
Also, when another party is involved in providing goods and/or services to a customer, management makes a judgment whether the promise to the customer is a performance obligation by the group (i.e. acting as a principal), or by another party (i.e. the group acts as an agent).
For the judgments applied to the incremental cost to obtain a contract, refer to Note 25 – Contract Assets and Liabilities.
Disaggregation of revenues
reporting per division Health Tax & Accounting**
Governance, Risk & Compliance **/***
Legal & Regulatory **
Total
2019 2018* 2019 2018* 2019 2018* 2019 2018* 2019 2018*
Revenue recognition
At a point in time recognition 249 254 235 231 391 376 280 281 1,155 1,142
Over time recognition 937 855 1,178 1,064 677 599 665 599 3,457 3,117
Revenues from third parties 1,186 1,109 1,413 1,295 1,068 975 945 880 4,612 4,259
Revenue per contract
Contracts one year or less 822 764 1,129 1,052 823 758 689 641 3,463 3,215
Multi-year contracts 364 345 284 243 245 217 256 239 1,149 1,044
Revenues from third parties 1,186 1,109 1,413 1,295 1,068 975 945 880 4,612 4,259* Restated for IFRS 16. See Note 20 – Leasing.** Within Tax & Accounting, Governance, Risk & Compliance, and Legal & Regulatory, reclassifications of respectively €86 million, €18 million, and €161 million from multi-year contracts to contracts one year or less are included in the 2018 comparative figures, due to a refinement of internal definitions.*** Within Governance, Risk & Compliance, a reclassification of €37 million from at a point in time recognition to over time recognition is included in the 2018 comparative figures.
Revenues by media format
reporting per division Health Tax & Accounting
Governance, Risk & Compliance
Legal & Regulatory
Total
2019 2018* 2019 2018* 2019 2018* 2019 2018* 2019 2018*
Digital 1,012 931 1,312 1,190 656 603 624 550 3,604 3,274
Services 6 6 45 44 402 361 60 59 513 470
Print 168 172 56 61 10 11 261 271 495 515
Revenues from third parties 1,186 1,109 1,413 1,295 1,068 975 945 880 4,612 4,259* Restated for IFRS 16. See Note 20 – Leasing.
Revenues by type
revenues were generated by the following types: 2019 2018*
Digital and service subscription 3,087 2,793
Print subscription 202 209
Other recurring 292 288
Total recurring revenues 3,581 3,290
Print books 212 226
Legal Services transactional 246 214
Financial Services transactional 105 98
Other non-recurring 468 431
Total revenues 4,612 4,259* Restated for IFRS 16. See Note 20 – Leasing.

106 107Wolters Kluwer 2019 Annual Report Wolters Kluwer 2019 Annual Report
Table of Contents | Consolidated Financial Statements | Company Financial Statements
Recurring/non-recurring revenues
reporting per division Health Tax & Accounting
Governance, Risk & Compliance
Legal & Regulatory
Total
2019 2018* 2019 2018* 2019 2018* 2019 2018* 2019 2018*
Recurring revenues 1,039 951 1,217 1,107 618 563 707 669 3,581 3,290
Non-recurring revenues 147 158 196 188 450 412 238 211 1,031 969
Revenues from third parties 1,186 1,109 1,413 1,295 1,068 975 945 880 4,612 4,259* Restated for IFRS 16. See Note 20 – Leasing.
Geographical information
revenues were generated in the following regions 2019 2018*
% %
The Netherlands 188 4 178 4
Europe (excluding the Netherlands) 1,232 27 1,151 27
United States and Canada 2,814 61 2,587 61
Asia Pacific 288 6 254 6
Rest of World 90 2 89 2
Total revenues 4,612 100 4,259 100
* Restated for IFRS 16. See Note 20 – Leasing.
Note 7 – Earnings per Share
The group presents basic and diluted earnings per share data for its ordinary shares.
Basic earnings per shareBasic earnings per share is calculated by dividing the profit for the year of €669 million (2018: €656 million)
attributable to the ordinary equity holders of the company, by the weighted average number of ordinary shares outstanding during the year of 270.3 million (2018: 276.7 million), after adjustment for own ordinary shares held (treasury shares).
Profit for the year
2019 2018*
Profit for the year attributable to the owners of the company (A) 669 656* Restated for IFRS 16. See Note 20 – Leasing.
Weighted average number of ordinary shares for the year
in millions of shares (unless otherwise stated) 2019 2018*
Outstanding ordinary shares at January 1 Note 33 279.7 290.3
Effect of cancellation of shares (2.1) (2.4)
Effect of repurchased shares (7.3) (11.2)
Weighted average number of ordinary shares (B) 270.3 276.7
Basic EPS (€) (A/B) 2.47 2.37* Restated for IFRS 16. See Note 20 – Leasing.
Diluted weighted average number of ordinary shares for the year
in millions of shares, unless otherwise stated 2019 2018*
Weighted average number of ordinary shares (B) 270.3 276.7
Effect of Long-Term Incentive Plan 1.9 2.1
Diluted weighted average number of ordinary shares (C) 272.2 278.8
Diluted EPS (€) (minimum of basic EPS and [A/C]) 2.46 2.35* Restated for IFRS 16. See Note 20 – Leasing.
Diluted earnings per shareDiluted earnings per share is determined by dividing the profit for the year of €669 million (2018: €656 million) attributable to ordinary shareholders of the company, by the weighted average number of ordinary shares
outstanding of 272.2 million (2018: 278.8 million), after adjustments for treasury shares and for the effects of all dilutive potential ordinary shares which consist of LTIP shares granted.

108 109Wolters Kluwer 2019 Annual Report Wolters Kluwer 2019 Annual Report
Table of Contents | Consolidated Financial Statements | Company Financial Statements
Note 8 – Acquisitions and Divestments
Accounting policiesBusiness combinations are accounted for using the acquisition method as at the acquisition date, which is the date on which control is transferred to the group.
Changes in the group’s interests in a subsidiary that do not result in a loss of control are accounted for as equity transactions.
Critical estimates and judgmentsThe fair value of the assets, liabilities, and contingent liabilities of a business combination should be measured within 12 months from the
acquisition date. For some acquisitions, provisional fair values have been included in the statement of financial position. The final valuation of the acquired identifiable intangible assets and liabilities assumed is still pending, but will be completed within the 12-month timeframe. Actual valuation of these assets, liabilities, and contingent liabilities may differ from the provisional valuation.
When a business combination agreement provides for a (possible) adjustment to the cost of the transaction, contingent on future
events (such as earnouts), the group includes an initial fair value of that adjustment in the cost of the transaction at the acquisition date if the adjustment is probable and can be measured reliably. The initial and subsequent measurement will usually be based on estimates of future results of the business combination. Actual results may differ from those estimates and may result in material adjustments in the next financial year(s). Subsequent changes to the fair value are recognized in profit or loss, based on a periodic reassessment of the contingent consideration.
Acquisitions
2019 2018
Carrying amount
Fair value adjustments
Recognizedvalues
Recognizedvalues*
Consideration payable in cash 33 157
Deferred and contingent considerations at fair value:
Non-current – 12
Current 6 1
Total consideration 39 170
Intangible assets Note 18 0 16 16 107
Other non-current assets 0 0 8
Current assets 1 1 13
Current liabilities (1) (1) (16)
Non-current liabilities 0 0 (7)
Deferred tax assets/(liabilities) 0 0 0 (19)
Fair value of net identifiable assets/(liabilities) 0 16 16 86
Goodwill on acquisitions Note 18 23 84
Cash effect of acquisitions:
Consideration payable in cash 33 157
Cash acquired 0 (3)
Deferred and contingent considerations paid 1 12
Acquisition spending, net of cash acquired 34 166
* Restated for IFRS 16. See Note 20 – Leasing.
Contribution of acquisitions
Revenues Adjusted operating profit
Profit for the year
Totals excluding the impact of 2019 acquisitions 4,609 1,089 669
Contribution of 2019 acquisitions 3 0 0
Totals for the year 2019 4,612 1,089 669
Pro forma contribution of 2019 acquisitions for the period January 1, 2019, up to acquisition date (unaudited) 1 0 0
Pro forma totals for the year 2019 4,613 1,089 669
The above information does not purport to represent what the actual results would have been had the acquisitions been concluded on January 1, 2019, nor is the information necessarily indicative for future results of the acquired operations. In determining the contributions
by the acquisitions, management has assumed that the fair value adjustments that arose on the date of the acquisition would have been the same if the acquisition had occurred on January 1, 2019.
Of the goodwill recognized in 2019, €23 million was deductible for income tax purposes (2018: nil).
The following tables provide information in aggregate for all business combinations in 2019:
GeneralOn May 7, 2019, Governance, Risk & Compliance (GRC) acquired 100% of the shares of CLM Matrix, a fast-growing provider of contract lifecycle management software, for $35 million, excluding a deferred and contingent consideration of up to $7 million. CLM Matrix became part of GRC’s ELM Solutions unit, a market leader in legal spend and matter management software. The acquisition enables GRC to offer a more comprehensive suite of solutions to address the growing needs of corporate legal operations. CLM Matrix had 2018 unaudited revenues of $3 million and had five full-time-equivalent employees at acquisition date. The transaction is expected to have an immaterial impact on adjusted EPS in the first full year and to generate a return on investment above our weighted average cost of capital (8%) within three to five years.
In addition, smaller acquisitions were completed, with a combined total consideration of €2 million, including deferred and contingent considerations and combined annualized unaudited revenues of €1 million.
Acquisition spendingTotal acquisition spending, net of cash acquired, in 2019 was €34 million (2018: €166 million), including deferred and contingent consideration payments of €1 million (2018: €12 million). In 2018, the group acquired Firecracker Inc., Legisway S.A., eVision Holding B.V., and a few smaller acquisitions.
Acquisition-related costs amounted to €1 million in 2019 (2018: €4 million).
The goodwill relating to the 2019 acquisitions represents future economic benefits specific to the group arising from assets that do not qualify for separate recognition as intangible assets. This includes expected new customers who generate revenue streams in the future and revenues generated because of new capabilities of the acquired product platforms.
Acquisitions

110 111Wolters Kluwer 2019 Annual Report Wolters Kluwer 2019 Annual Report
Table of Contents | Consolidated Financial Statements | Company Financial Statements
Deferred and contingent considerationsThe acquisitions completed in 2019 resulted in a maximum achievable undiscounted deferred and contingent consideration of €6 million. The fair value of this deferred and contingent consideration amounts to €6 million at acquisition date and at December 31, 2019.
For further disclosure on critical estimates and judgments, refer to Note 18 – Goodwill, Acquired Identifiable Intangible Assets, and Other Intangible Assets.
For further disclosure on deferred and contingent considerations, refer to Note 30 – Financial Risk Management.
Provisional fair value accountingThe fair value of the identifiable assets and liabilities will be revised if new information, obtained within one year from the acquisition date, about facts and circumstances that existed at the acquisition date, causes adjustments to the above amounts, or for any additional provisions that existed at the acquisition date. Subsequent changes in purchase price accounting for 2018 acquisitions resulted in additional acquired identifiable intangible assets of €7 million. Reference is made to Note 18 – Goodwill, Acquired Identifiable Intangible Assets and Other Intangible Assets.
Divestments
GeneralOn May 2, 2019, Wolters Kluwer completed the divestment of its 40% interest in Austrian information solutions provider MANZ’sche Verlags- und Universitäts-buchhandlung GmbH for €17 million in cash. This asset was classified as an investment in equity-accounted investees at year-end 2018. The transaction had an immaterial impact on adjusted earnings and resulted in a non-taxable divestment-related gain of €7 million.
On September 4, 2019, Health completed the sale of certain allied health titles to Ascend Learning, LLC for $8 million in cash. The titles were part of the Health Learning, Research & Practice (HLRP) business and included print and digital books in specialties, such as dental hygiene and massage therapy. The divestment will better align the HLRP content portfolio for growth in the core medicine and nursing segments. The assets generated revenues of approximately $5 million in 2019 (8 months). No employees were transferred to the new owner.
In 2019, net divestment proceeds amounted to €40 million and included €13 million of deferred proceeds related to the sale of certain Swedish publishing assets in January 2018.
In 2018, the group completed the divestments of ProVation Medical (Health), Corsearch (Governance, Risk & Compliance), and certain Swedish assets (Legal & Regulatory). The group also reduced its equity shareholding from 55% to 45% in Chengdu Medicom, China.
For divestments announced in 2019 and not completed before year-end, refer to Note 9 – Assets/Liabilities Classified as Held for Sale.
Divestment-related results on operations, equity-accounted investees, and financial assets
2019 2018
Divestments of operations:
Consideration receivable in cash 8 315
Consideration received as equity-accounted investee Note 21 – 2
Deferred divestment consideration receivable (current) Note 26 – 13
Consideration receivable 8 330
Intangible assets Note 18 11 –
Other non-current assets 0 0
Current assets (including assets held for sale) 1 234
Current liabilities (including liabilities held for sale) 0 (65)
Non-controlling interests Note 17 – (2)
Deferred tax assets/(liabilities) 0 0
Net identifiable assets/(liabilities) 12 167
Reclassification of foreign exchange differences on loss of control, recognized in other comprehensive income 0 –
Book profit/(loss) on divestments of operations (4) 163
Divestment expenses (1) (3)
Restructuring of stranded costs following divestments 0 (1)
Divestment-related results included in other operating income and (expense) Note 12 (5) 159
Divestments of equity-accounted investees and financial assets:
Consideration receivable in cash 19 6
Goodwill allocated Note 18 (5) (1)
Carrying value of financial assets Note 22 0 (2)
Carrying value of equity-accounted investees Note 21 (5) (1)
Divestment-related results included in total financing results Note 15 9 2
Cash effect of divestments:
Consideration receivable in cash 27 321
Cash included in divested operations 0 (14)
Deferred divestment consideration receivable 13 –
Receipts from divestments, net of cash disposed 40 307

112 113Wolters Kluwer 2019 Annual Report Wolters Kluwer 2019 Annual Report
Table of Contents | Consolidated Financial Statements | Company Financial Statements
Note 9 – Assets/Liabilities Classified as Held for Sale
Disposal groups
General
2019 2018
Legal & Regulatory – Belgian training business 6 –
Legal & Regulatory – Certain German businesses and assets 6 –
Net assets of disposal groups classified as held for sale 12 –
Assets and liabilities of disposal groupsThe assets and liabilities of the disposal groups can be specified as follows at December 31:
2019 2018
Non-current assets 12 –
Cash and cash equivalents 3 –
Other current assets 5 –
Non-current liabilities (2) –
Current liabilities (6) –
Net assets of disposal groups classified as held for sale 12 –
Investments in equity-accounted investees
At December 31, 2019, Wolters Kluwer was in negotiation to sell its 45% equity shareholding in Chengdu Medicom, China, and therefore reclassified the equity shareholding from investments in equity-accounted investees to assets classified as held for sale. No loss on remeasurement is recognized. It is expected that the sale of the equity-
accounted investment held for sale will occur within the next 12 months.
Refer also to Note 21 – Investments in Equity-accounted Investees.
Accounting policiesNon-current assets and disposal groups are classified as held for sale if their carrying amount will be recovered through a sale transaction rather than through continuing use. This condition is met only when the sale is highly probable and the asset or disposal group is available for immediate sale in its present condition. Management must be committed to the sale, which should be expected to qualify for recognition as a completed sale within 12 months from the date of classification.
When the group is committed to a sale plan involving a loss of control of a subsidiary, all assets and liabilities of that subsidiary are classified as held for sale when the criteria described above are met, regardless of whether the group will retain a non-controlling interest in its former subsidiary after the sale.When the group is committed to a sale plan involving a divestment of an investment in an equity-accounted investee, or a portion thereof, the investment, or the portion, is classified as held for sale when the
criteria described above are met. The group then ceases to apply the equity method in relation to the portion that is classified as held for sale. Any retained portion of an investment in equity-accounted investee that has not been classified as held for sale continues to be accounted for using the equity method.
Non-current assets and disposal groups classified as held for sale are measured at the lower of the carrying amount and fair value less costs of disposal.
On December 19, 2019, Legal & Regulatory announced that it has reached a binding agreement to sell its Belgian training business to NCOI Group. In Belgium, Wolters Kluwer intends to build on its position in professional information solutions, software, and services for the Legal & Regulatory, Tax & Accounting, and Health & Safety (HSE) segments, continuing to serve customers with leading solutions in these areas.
In addition, Legal & Regulatory is committed to a plan to sell certain small businesses and assets in Germany. These businesses and assets are actively marketed for sale at reasonable sales prices.
The sale of the disposal groups classified as held for sale is expected to occur within the next 12 months.
Refer to Note 40 – Events after Balance Sheet Date.
Results of disposal groups
2019 2018
Revenues 38 37
Adjusted operating profit 9 8
Operating profit 9 8
2019 2018
Assets of disposal groups classified as held for sale 20 –
Liabilities of disposal groups classified as held for sale (8) –
Net assets of disposal groups classified as held for sale 12
Investments in equity-accounted investees 5 –
Total net assets classified as held for sale 17 –
The loss on remeasurement of disposal groups amounts to €2 million (2018: nil). Refer also to Note 12 – Other Operating Income and (Expense).
The revenues, adjusted operating profit, and operating profit of the disposal groups, excluding the loss on remeasurement, can be specified as follows:

114 115Wolters Kluwer 2019 Annual Report Wolters Kluwer 2019 Annual Report
Table of Contents | Consolidated Financial Statements | Company Financial Statements
2019 2018
Marketing and promotion costs 234 224
Sales-related costs – sales commissions directly expensed 141 123
Sales-related costs – amortization of capitalized sales commissions Note 25 20 24
Other sales-related costs 316 295
Customer support costs 74 70
Additions to loss allowances on trade receivables and contract assets Note 25 23 17
Total 808 753
Note 10 – Sales Costs
2019 2018
Divestment-related results Note 8 (5) 159
Acquisition-related costs Note 8 (1) (4)
Loss on remeasurement of disposal groups Note 9 (2) –
Fair value changes of contingent considerations Note 30 9 1
Additions to acquisition integration provisions Note 32 0 0
Total 1 156
Note 12 – Other Operating Income and (Expense)
Accounting policiesGeneral and administrative costs include costs that are neither directly attributable to cost of revenues nor to sales costs. These costs include product development cost, information technology cost,
general overhead, amortization of acquired identifiable intangible assets and certain other intangible assets (if not part of cost of revenues), depreciation of property, plant, and equipment, depreciation of right-of-use assets, and
impairment of goodwill, acquired identifiable intangible assets, certain other intangible assets, property, plant, and equipment, and right-of-use assets.
Accounting policiesOther operating income and expense relates to items which are different in their nature or frequency from operating items. These include divestment-related results
(including the loss on remeasurement of disposal groups and direct attributable divestment costs), additions to provisions for restructuring of stranded costs following divestments, acquisition-
related costs, additions to acquisition integration provisions, and subsequent fair value changes of contingent considerations. See also Note 4 – Benchmark Figures.
2019 2018*
Research, development, and editorial costs 453 416
General and administrative operating expenses 877 807
Amortization and impairment of acquired identifiable intangible assets Note 14 182 175
Total 1,512 1,398
* Restated for IFRS 16. See Note 20 – Leasing.
Note 11 – General and Administrative Costs
Accounting policiesSales costs relate to direct internal personnel expenses and direct external costs incurred for marketing and sales activities.
Sales costs include sales commissions directly expensed as incurred and the amortization of capitalized sales commissions that qualify as cost to obtain a contract. As a practical expedient, the group recognizes as an expense the incremental cost of obtaining a contract if the amortization period of the asset that the group otherwise would have recognized, is one year or less. If sales commissions are granted for a bundled and/or multi-elements contract in which the predominant consideration element is recognized for performance obligations satisfied at a point in time (for example the
sale of a book, implementation and/or training services, and/or the sale of a license being a right to use), the sales commission is expensed when incurred. In addition, sales commissions, that are commensurate or based on generic performance indicators and/or net targets, are expensed when incurred.
For all other commission plans on new sales targets, the amortization period ranges between one and five years, depending on the nature of the underlying promise in the contract with the customer, unless the underlying non-cancellable contract period for the right-to-access license is longer than five years. In those situations, the longer non-cancellable contract period of the license contract prevails as amortization period.
Further, sales costs include the additions to loss allowances on trade receivables and unbilled revenues. The loss allowance is determined as an amount equal to the lifetime expected credit losses.
Estimates and judgmentsThe group determines the impairment of financial assets by making assumptions and estimating the risk of default and expected loss rates at contract inception over the expected life of the financial instrument, using the group’s historical incurred losses and existing market conditions, as well as forward-looking information at the end of each reporting period.
Amortization of acquired identifiable intangible assets includes an impairment of €38 million (2018: €9 million).

116 117Wolters Kluwer 2019 Annual Report Wolters Kluwer 2019 Annual Report
Table of Contents | Consolidated Financial Statements | Company Financial Statements
2019 2018
Salaries and wages 1,590 1,474
Social security charges 163 151
Costs of defined contribution plans 72 61
Expenses related to defined benefit plans Note 31 1 21
Equity-settled share-based payment transactions Note 34 25 22
Total 1,851 1,729
Employees
Headcount at December 31 18,979 18,553
In full-time equivalents at December 31 18,361 18,134
Thereof employed in the Netherlands 1,172 1,143
In full-time equivalents average per annum* 18,883 18,687
* Average full-time equivalents per annum include temporary help and contractors, whereas headcount and its full-time equivalent only relate to staff on the payroll of the group.
Note 13 – Personnel Expenses
For further disclosure on critical estimates and judgments, refer to Note 18 – Goodwill, Acquired Identifiable Intangible Assets, and Other Intangible Assets.
2019 2018*
Amortization of acquired identifiable intangible assets Note 18 144 166
Impairment of acquired identifiable intangible assets Note 18 38 9
Amortization of other intangible assets Note 18 180 174
Impairment of other intangible assets Note 18 15 21
Depreciation of property, plant, and equipment Note 19 25 25
Depreciation of right-of-use assets Note 20 72 68
Impairment of right-of-use assets Note 20 1 –
Total 475 463
* Restated for IFRS 16. See Note 20 – Leasing.
Note 14 – Amortization, Impairment, and Depreciation
2019 2018*
Financing income
Interest income for financial assets, measured at amortized cost:
Interest income on short-term bank deposits 17 12
Other financing income:
Derivatives – foreign exchange contracts 0 0
Other 8 9
Total financing income 25 21
Financing costs
Interest expense for financial liabilities, measured at amortized cost:
Euro Commercial Paper program and borrowings and bank overdrafts 0 (1)
Bonds and private placements (56) (69)
Amortization of fee expense for debt instruments (2) (2)
Other financing expense:
Interest expense for lease liabilities (11) (7)
Net foreign exchange gains/(losses) (3) (9)
Derivatives – foreign exchange contracts, not qualifying as hedge (1) (1)
Other (8) (7)
Items in hedge relationships:
Interest rate swaps (2) (2)
Foreign exchange gains/(losses) on loans subject to cash flow hedge (5) (10)
Net change in fair value of cash flow hedges reclassified from other comprehensive income 5 10
Total financing costs (83) (98)
Net financing results (58) (77)
Other finance income/(costs)
Divestment-related results on equity-accounted investees Note 8 7 (1)
Gain on sale of financial assets at fair value through profit or loss Note 8 2 3
Fair value changes of financial assets Note 22 0 (1)
Financing component employee benefits Note 31 (4) (3)
Total other finance income/(costs) 5 (2)
Total financing results (53) (79)
* Restated for IFRS 16. See Note 20 – Leasing.
Note 15 – Financing Results

118 119Wolters Kluwer 2019 Annual Report Wolters Kluwer 2019 Annual Report
Table of Contents | Consolidated Financial Statements | Company Financial Statements
2019 2018*
Current income tax expense 192 221
Adjustments previous years 6 1
Deferred tax expense:
Changes in tax rates (1) (5)
Origination and reversal of temporary differences (8) 17
Movements in deferred tax assets and liabilities Note 23 (9) 12
Total Note 23 189 234* Restated for IFRS 16 and IFRIC 23. See Note 20 – Leasing and Note 1 – General and Basis of Preparation.
Note 16 – Income Tax Expense
2019 2018*
% %
Profit before tax 858 890
Income tax expense at statutory tax rate in the Netherlands 25.0 214 25.0 223
Tax effect of:
Rate differential (local income tax rates versus statutory income tax rate in the Netherlands) (2.7) (23) (4.4) (40)
Tax incentives, exempt income, and divestments (1.9) (16) 1.4 12
Recognized and unrecognized tax losses 0.4 4 1.0 9
Adjustments previous years 0.7 6 0.1 1
Changes in income tax rates (0.1) (1) (0.5) (5)
Other taxes and U.S. repatriation tax 1.0 9 0.4 4
Non-deductible costs and other items (0.4) (4) 3.3 30
Total 22.0 189 26.3 234* Restated for IFRS 16. See Note 20 – Leasing.
Income tax expense recognized in statement of profit or loss
Reconciliation of the effective tax rateThe group’s effective tax rate in the statement of profit or loss differs from the Dutch income tax rate of 25%. The
table below reconciles the statutory income tax rate with the effective income tax rate in the statement of profit or loss:
Accounting policiesIncome tax on the result for the year is made up of current and deferred tax. Income tax is recognized in profit or loss except to the extent that it relates to business combinations and/or items directly recognized in equity or other comprehensive income.
Current income tax is the expected tax payable or tax receivable on the taxable income for the year, using the tax rates and tax laws that have been enacted or substantively enacted by the end of the reporting period, and any adjustment to tax payable or tax receivable in respect of previous years. If the current income tax shall be settled over more than 12 months and the amounts are material, the current income tax will be discounted using the risk-free rate belonging to the corresponding period, and the jurisdiction. The group recognizes deferred tax assets and liabilities for all taxable temporary differences between the carrying amounts of assets or liabilities in the statement of financial position for financial reporting purposes and their tax base for taxation purposes.
Deferred tax assets and liabilities are not recognized for temporary differences arising from:• Initial recognition of goodwill;• Investments in subsidiaries and
joint arrangements to the extent
that the parent can control the timing of the reversal of the temporary differences, and it is probable that they will not reverse in the foreseeable future; and
• Initial recognition of an asset or liability in a transaction, which is not a business combination and that, at the time of the transaction, affects neither accounting profit nor taxable profit.
A deferred tax asset is recognized for deductible temporary differences and for the carry-forward of unused tax losses and unused tax credits, to the extent that it is probable that future taxable profits will be available against which these can be utilized. Deferred tax assets are reviewed at the end of each reporting period and are remeasured to the extent that it is no longer probable that the related tax benefits will be realized.
Deferred tax assets and liabilities are not discounted and measured at the tax rates that are expected to be applied to the temporary differences when they reverse, based on the laws that have been enacted or substantively enacted by the end of the reporting period. The effect of changes in tax rates on the deferred tax position is recognized in profit or loss if, and to the extent that, the deferred tax position was originally formed through profit or loss.
Deferred tax assets and liabilities, including those associated with right-of-use assets and lease liabilities, are offset if there is a legally enforceable right to offset current income tax liabilities and assets, and they relate to income taxes levied by the same tax authority on the same taxable entity, or on different tax entities, but they intend to settle current income tax liabilities and assets on a net basis or their tax assets and liabilities will be realized simultaneously.
Uncertain tax positions are assessed at a fiscal unity level. If it is probable that a tax authority will accept an uncertain tax position in the income tax filing, then the group determines its accounting tax position consistently with the tax treatment used or planned to be used in its income tax filing. If this is not probable, then the group reflects the effect of uncertainty in determining its accounting tax position using either the most likely amount or the expected value method, depending on which method better predicts the resolution of the uncertainty.
Critical estimates and judgmentsIncome tax is calculated based on income before tax, considering the local tax rates and regulations. For each operating entity, the current income tax expense is calculated and differences between the accounting and tax base are determined,
resulting in deferred tax assets or liabilities. These calculations may deviate from the final tax assessments, which will be concluded in future periods.
A deferred tax asset is recognized for deductible temporary differences and the carry-forward of unused tax losses and unused tax credits to the extent that it is probable that future taxable profit will be available. Management assesses the probability that taxable profit will be available against which the unused tax losses or unused tax credits can be utilized.
In determining the amount of current and deferred tax, the group considers the impact of uncertain tax positions and whether additional taxes, penalties, and interest may be due. The group believes that its current income tax liabilities are adequate for all open tax years based on its assessment of many factors, including interpretations of tax laws, rules, and prior experience. The group operates in several countries with different tax laws and rules. Considering this complex
multinational environment in which the group operates, global transfer pricing policies are implemented for transactions between members of the group. These transactions are documented as required by international standards. However, local country tax authorities might challenge these transactions. The group considered potential challenges and provided for potential uncertain tax positions. The assessment for uncertain tax positions relies on estimates and assumptions, based on the judgments of tax professionals within the group, supplemented by external tax advisors, and may involve a series of estimates about future events. New information may become available that causes the group to change its estimate regarding the adequacy of existing income tax liabilities. Such changes to income tax liabilities will impact the income tax expense, positively or negatively, in the statement of profit or loss in the period that such a determination is made.
Changes in tax rates are considered if these tax rate changes are substantially enacted before year-end. The United States Tax Cuts and Jobs Act introduced
significant changes in U.S. tax laws that took effect on January 1, 2018. During 2018 and 2019, the U.S. government issued interpretative and legislative regulations in final and proposed form to further explain the application of the new tax laws. A complete understanding of the implications of the Act continues to take time, as government guidance will continue to be issued in 2020. Reported income tax amounts will therefore be subject to more judgment, estimation uncertainty, and measurement adjustments may need to be made in subsequent reporting periods.
Finally, not all tax authorities have decided whether they will allow the recently adopted IFRS standards (IFRS 9, IFRS 15, and IFRS 16) in the filing of income tax returns. If the tax authorities deviate from these standards, the classification between current income tax assets and liabilities and deferred tax assets and liabilities may change.
Refer to Note 23 – Tax Assets and Liabilities.

120 121Wolters Kluwer 2019 Annual Report Wolters Kluwer 2019 Annual Report
Table of Contents | Consolidated Financial Statements | Company Financial Statements
0wnership in % 2019 2018
Akadémiai Kiadó Kft. (Budapest, Hungary) 74 74
Note 17 – Non-controlling Interests
Non-controlling interests of consolidated participations in the profit for the year totaled €0 million (2018: €0 million). Non-controlling interests in the equity of consolidated participations, totaling €0 million (2018: €0 million), are based on third-party shareholdings in the underlying shareholders’ equity of the subsidiaries.
Financial information of non-controlling interests combined, based on 100% ownership, is as follows:
The group’s proportionate share of each line item in the financial statements of the non-controlling interests does
not materially differ from the fully consolidated financial statements.
The group’s shares in significant consolidated subsidiaries that were not fully owned at December 31 are:
Accounting policiesNon-controlling interests reflect the portion of the profit or loss and net assets of a subsidiary attributable to equity interests that are not owned, directly or indirectly through subsidiaries, by the group. Losses applicable to the non-controlling
interest in a subsidiary are allocated to the non-controlling interest even if these losses cause the non-controlling interest to have a debit balance. Acquisitions of non-controlling interests are accounted for as transactions with owners of the company in their capacity as owners
and therefore no goodwill is recognized for those transactions. Remeasurements of non-controlling interests are based on a proportionate amount of the net assets of the subsidiary.
2019 2018
Revenues 5 7
Adjusted operating profit 2 2
Net profit 1 2
Total assets 1 3
Total liabilities 1 1
Total equity 0 2
Total cash and cash equivalents 0 0
Rate differential indicates the effect of the group’s taxable income being generated and taxed in jurisdictions where tax rates differ from the statutory income tax rate in the Netherlands.
The effective tax rate decreased to 22.0% (2018: 26.3%), the prior year being impacted by taxable gains on the divestments of Corsearch and ProVation Medical in 2018.
The current year’s effective tax rate was impacted by favorable tax law changes and finalization of tax audits.
For income tax recognized directly in the statements of changes in total equity and other comprehensive income, reference is made to Note 23 - Tax Assets and Liabilities.
The movements in non-controlling interests are as follows:
2019 2018
Position at January 1 0 4
Dividends paid (1) (2)
Loss of control Note 8 – (2)
Share of profit in non-controlling interests, net of tax 0 0
Foreign exchange differences and other movements 1 0
Position at December 31 0 0
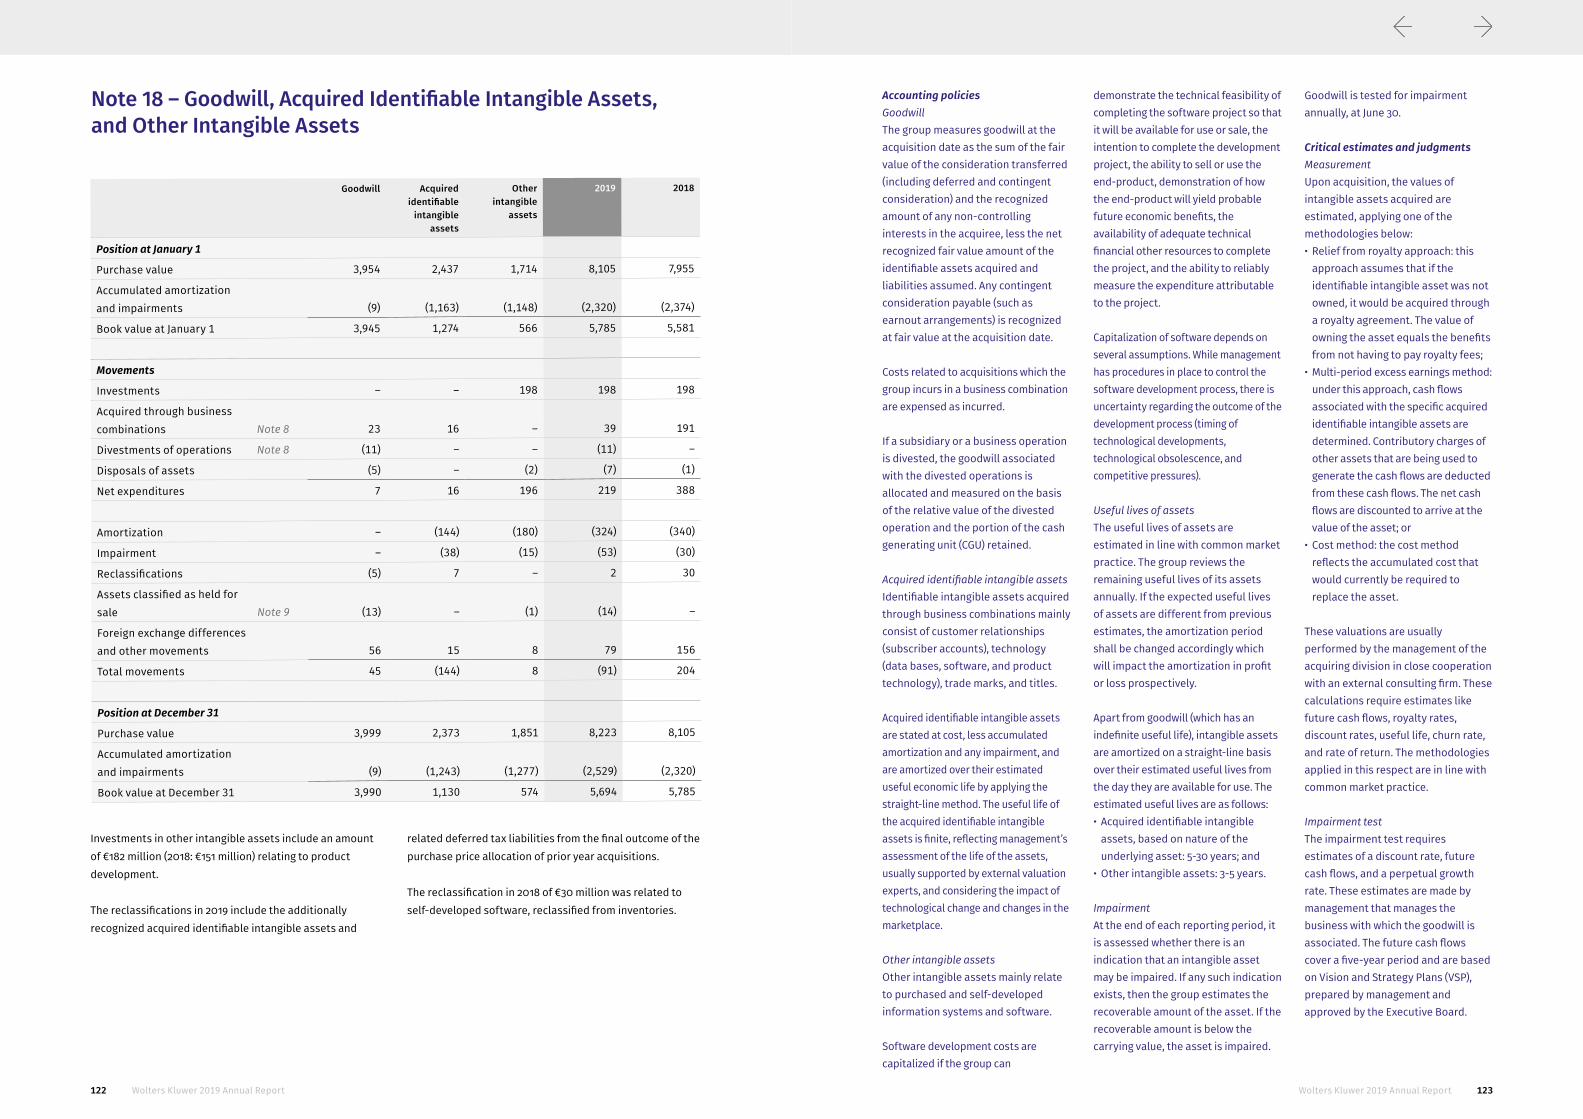
122 123Wolters Kluwer 2019 Annual Report Wolters Kluwer 2019 Annual Report
Table of Contents | Consolidated Financial Statements | Company Financial Statements
Goodwill Acquired identifiable
intangible assets
Other intangible
assets
2019 2018
Position at January 1
Purchase value 3,954 2,437 1,714 8,105 7,955
Accumulated amortization and impairments (9) (1,163) (1,148) (2,320) (2,374)
Book value at January 1 3,945 1,274 566 5,785 5,581
Movements
Investments – – 198 198 198
Acquired through business combinations Note 8 23 16 – 39 191
Divestments of operations Note 8 (11) – – (11) –
Disposals of assets (5) – (2) (7) (1)
Net expenditures 7 16 196 219 388
Amortization – (144) (180) (324) (340)
Impairment – (38) (15) (53) (30)
Reclassifications (5) 7 – 2 30
Assets classified as held for sale Note 9 (13) – (1) (14) –
Foreign exchange differences and other movements 56 15 8 79 156
Total movements 45 (144) 8 (91) 204
Position at December 31
Purchase value 3,999 2,373 1,851 8,223 8,105
Accumulated amortization and impairments (9) (1,243) (1,277) (2,529) (2,320)
Book value at December 31 3,990 1,130 574 5,694 5,785
Investments in other intangible assets include an amount of €182 million (2018: €151 million) relating to product development.
The reclassifications in 2019 include the additionally recognized acquired identifiable intangible assets and
related deferred tax liabilities from the final outcome of the purchase price allocation of prior year acquisitions.
The reclassification in 2018 of €30 million was related to self-developed software, reclassified from inventories.
Note 18 – Goodwill, Acquired Identifiable Intangible Assets, and Other Intangible Assets
Accounting policiesGoodwillThe group measures goodwill at the acquisition date as the sum of the fair value of the consideration transferred (including deferred and contingent consideration) and the recognized amount of any non-controlling interests in the acquiree, less the net recognized fair value amount of the identifiable assets acquired and liabilities assumed. Any contingent consideration payable (such as earnout arrangements) is recognized at fair value at the acquisition date.
Costs related to acquisitions which the group incurs in a business combination are expensed as incurred.
If a subsidiary or a business operation is divested, the goodwill associated with the divested operations is allocated and measured on the basis of the relative value of the divested operation and the portion of the cash generating unit (CGU) retained.
Acquired identifiable intangible assetsIdentifiable intangible assets acquired through business combinations mainly consist of customer relationships (subscriber accounts), technology (data bases, software, and product technology), trade marks, and titles.
Acquired identifiable intangible assets are stated at cost, less accumulated amortization and any impairment, and are amortized over their estimated useful economic life by applying the straight-line method. The useful life of the acquired identifiable intangible assets is finite, reflecting management’s assessment of the life of the assets, usually supported by external valuation experts, and considering the impact of technological change and changes in the marketplace.
Other intangible assetsOther intangible assets mainly relate to purchased and self-developed information systems and software.
Software development costs are capitalized if the group can
demonstrate the technical feasibility of completing the software project so that it will be available for use or sale, the intention to complete the development project, the ability to sell or use the end-product, demonstration of how the end-product will yield probable future economic benefits, the availability of adequate technical financial other resources to complete the project, and the ability to reliably measure the expenditure attributable to the project.
Capitalization of software depends on several assumptions. While management has procedures in place to control the software development process, there is uncertainty regarding the outcome of the development process (timing of technological developments, technological obsolescence, and competitive pressures).
Useful lives of assetsThe useful lives of assets are estimated in line with common market practice. The group reviews the remaining useful lives of its assets annually. If the expected useful lives of assets are different from previous estimates, the amortization period shall be changed accordingly which will impact the amortization in profit or loss prospectively.
Apart from goodwill (which has an indefinite useful life), intangible assets are amortized on a straight-line basis over their estimated useful lives from the day they are available for use. The estimated useful lives are as follows:• Acquired identifiable intangible
assets, based on nature of the underlying asset: 5-30 years; and
• Other intangible assets: 3-5 years.
ImpairmentAt the end of each reporting period, it is assessed whether there is an indication that an intangible asset may be impaired. If any such indication exists, then the group estimates the recoverable amount of the asset. If the recoverable amount is below the carrying value, the asset is impaired.
Goodwill is tested for impairment annually, at June 30.
Critical estimates and judgmentsMeasurementUpon acquisition, the values of intangible assets acquired are estimated, applying one of the methodologies below: • Relief from royalty approach: this
approach assumes that if the identifiable intangible asset was not owned, it would be acquired through a royalty agreement. The value of owning the asset equals the benefits from not having to pay royalty fees;
• Multi-period excess earnings method: under this approach, cash flows associated with the specific acquired identifiable intangible assets are determined. Contributory charges of other assets that are being used to generate the cash flows are deducted from these cash flows. The net cash flows are discounted to arrive at the value of the asset; or
• Cost method: the cost method reflects the accumulated cost that would currently be required to replace the asset.
These valuations are usually performed by the management of the acquiring division in close cooperation with an external consulting firm. These calculations require estimates like future cash flows, royalty rates, discount rates, useful life, churn rate, and rate of return. The methodologies applied in this respect are in line with common market practice.
Impairment testThe impairment test requires estimates of a discount rate, future cash flows, and a perpetual growth rate. These estimates are made by management that manages the business with which the goodwill is associated. The future cash flows cover a five-year period and are based on Vision and Strategy Plans (VSP), prepared by management and approved by the Executive Board.

124 125Wolters Kluwer 2019 Annual Report Wolters Kluwer 2019 Annual Report
Table of Contents | Consolidated Financial Statements | Company Financial Statements
Carrying amounts of goodwill and acquired identifiable intangible assets per operating segment
Goodwill Acquired identifiable
intangible assets
2019 2018
Health 1,068 302 1,370 1,424
Tax & Accounting 1,342 257 1,599 1,622
Governance, Risk & Compliance 886 300 1,186 1,164
Legal & Regulatory 694 271 965 1,009
Total 3,990 1,130 5,120 5,219
Impairment testing of goodwillThe group performs an annual impairment test by comparing the carrying amount of the CGU to which the goodwill belongs, net of related deferred taxes, to the recoverable amount of the CGU. The groups of CGUs for goodwill impairment testing represent the lowest level at which goodwill is monitored by management, whereby management considers the integration of the group’s business operations and the global leverage of assets, capital, and staff. Acquisitions are integrated into existing business operations and the goodwill arising from a business combination is allocated to the groups of CGUs that are expected to benefit from the synergies of the acquisition. The total number of groups of CGUs for goodwill impairment testing purposes was six in 2019 (2018: six CGUs).
The recoverable amount is determined based on the higher of the value-in-use and the fair value less costs of disposal. If there is sufficient headroom, the group only determines the value-in-use. The recoverable amount is determined by discounting the future cash flows to be generated from the continuing use of the CGUs. These valuations are based on non-observable market data. The recoverable amount calculations in 2019 were determined in a consistent manner with prior years. The cash flow projections are based on actual operating results and the long-term VSPs, as approved by the Executive Board.
The 2019 annual impairment test showed that the recoverable amount for all groups of CGUs for goodwill impairment testing exceeded their carrying amounts, so no impairment for goodwill was recognized.
Key assumptionsThe group’s key assumptions include assumptions that are based on non-observable market data (level 3 input). The period over which the group estimates its cash flow projections is five years. After five years, cash flow projections are extrapolated using an appropriate perpetual growth rate that is consistent with the long-term average market growth rate. The 2019 weighted long-term average growth rate is 2.5% for the United States and 0.3% for Europe (2018: 2.0% for the United States and 1.0% for Europe). In addition, the following key assumptions were used in the projections:• Revenue growth: based on actual experience, an
analysis of market growth and the expected development of market share; and
• Adjusted operating profit margin development: based on actual experience and management’s long-term projections. Adjusted operating profit is deemed to be the best approximation for estimating future cash flows.
The estimated pre-tax cash flows are discounted to their present value using a pre-tax weighted average cost of capital (WACC) between 6.2% and 16.7% (2018: between 8.5% and 15.7%), with a weighted average of 8.2% (2018: 10.6%).
Sensitivity analysisThe impairment testing includes an assessment if a reasonably possible change in a key assumption would cause the carrying amount of goodwill to exceed the recoverable amount. The outcome of the sensitivity analysis in the annual impairment test was that no
reasonably possible change in one of the key assumptions would cause the carrying amount to exceed the recoverable amount.
The goodwill impairment sensitivity per CGU is as follows:
Allowed change (in basis points) Allocated goodwill at
December 31, 2019
Applied revenue
growth rate
Decline in growth
Increase in discount
rate
Decrease in adjusted
operating profit margin
Health Learning, Research & Practice 1.5% >300 >300 >300 539
Clinical Solutions 2.6% >300 >300 >300 529
Tax & Accounting Americas and Asia Pacific 2.2% >300 >300 >300 927
Tax & Accounting Europe 0.3% >300 >300 >300 415
Governance, Risk & Compliance 2.4% >300 >300 >300 886
Legal & Regulatory 1.4% >300 >300 >300 694
Total 2.1% 3,990
Allowed change (in basis points) Allocated goodwill at
December 31, 2018
Applied revenue
growth rate
Decline in growth
Increase in discount
rate
Decrease in adjusted
operating profit margin
Health Learning, Research & Practice 1.6% >300 >300 >300 539
Clinical Solutions 2.0% >300 >300 >300 519
Tax & Accounting Americas and Asia Pacific 2.0% >300 >300 >300 913
Tax & Accounting Europe 1.0% >300 >300 >300 411
Governance, Risk & Compliance 2.0% >300 >300 >300 848
Legal & Regulatory 1.4% >300 >300 >300 715
Total 1.8% 3,945
2019 2018
Risk free rate United States (in %) 2.5 3.0
Risk free rate Europe (in %) 0.6 1.0
Market risk premium (in %) 6.0 6.5
Tax rate (in %) 25.0 25.0
Re-levered beta 0.72 0.97
In determining the WACC, the group used a risk-free rate based on the long-term yield on Dutch government bonds with a maturity of 20 years, adjusted for country
risk premiums and country-specific inflation differentials. In determining the WACC, the group applied the following assumptions:
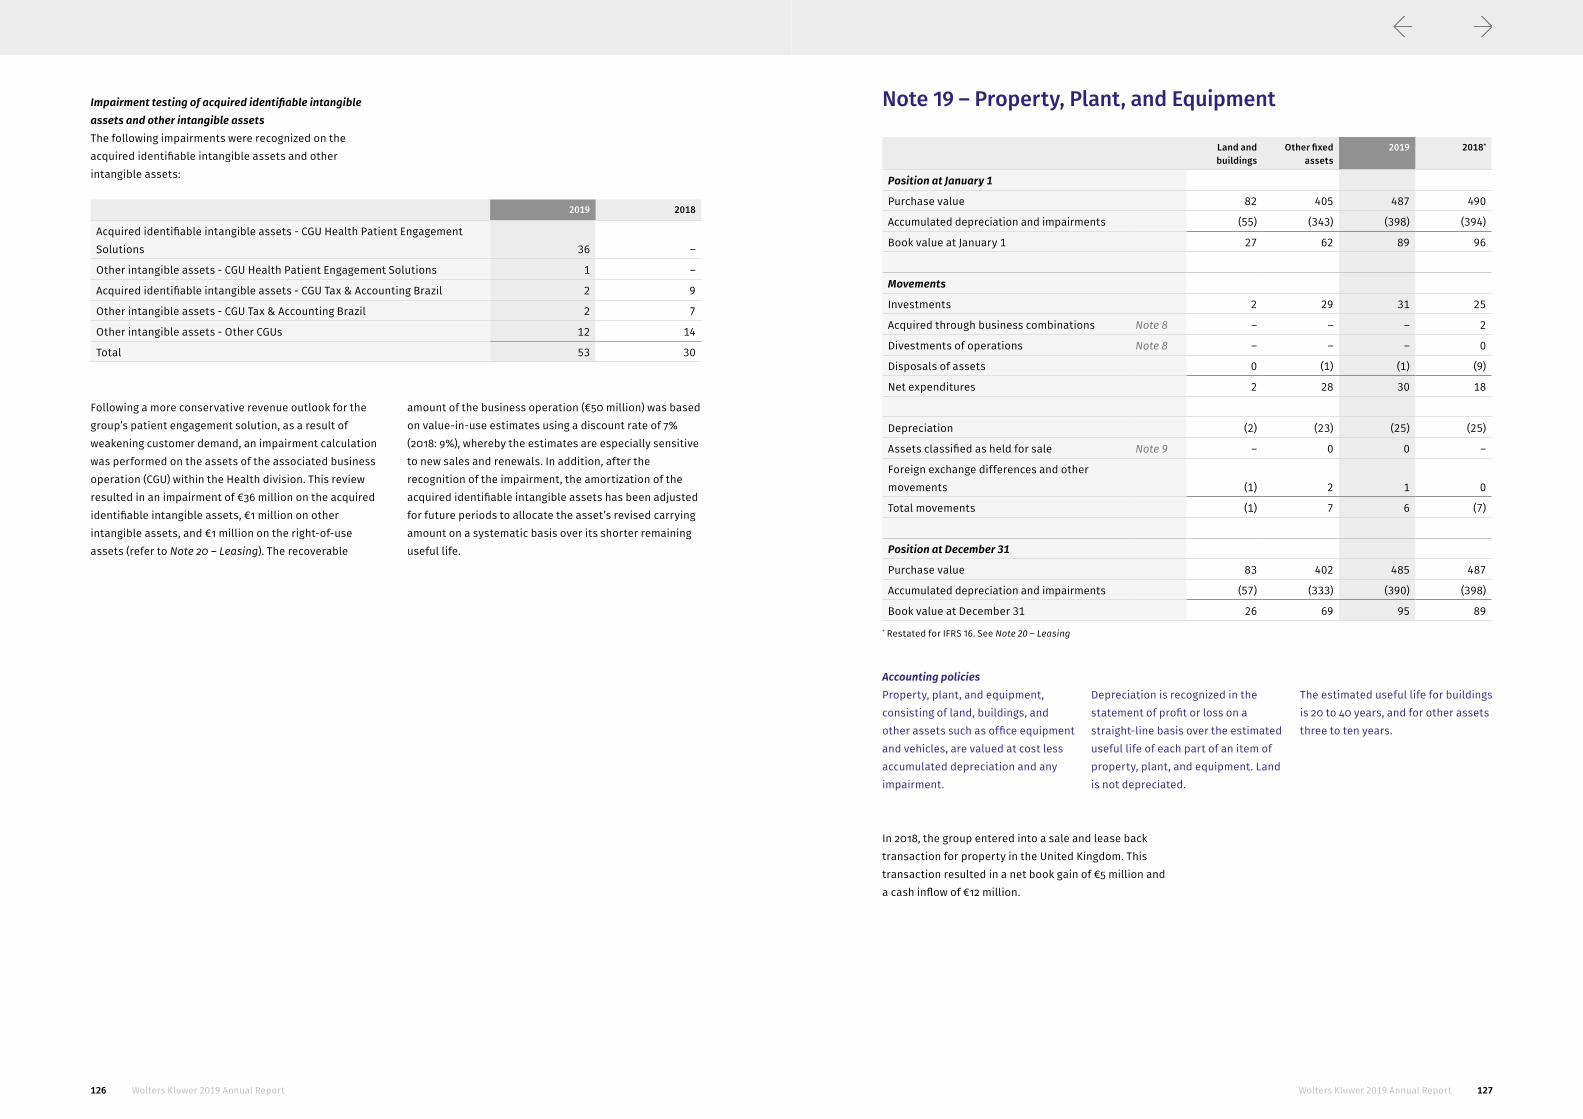
126 127Wolters Kluwer 2019 Annual Report Wolters Kluwer 2019 Annual Report
Table of Contents | Consolidated Financial Statements | Company Financial Statements
Accounting policiesProperty, plant, and equipment, consisting of land, buildings, and other assets such as office equipment and vehicles, are valued at cost less accumulated depreciation and any impairment.
Depreciation is recognized in the statement of profit or loss on a straight-line basis over the estimated useful life of each part of an item of property, plant, and equipment. Land is not depreciated.
The estimated useful life for buildings is 20 to 40 years, and for other assets three to ten years.
Land and buildings
Other fixed assets
2019 2018*
Position at January 1
Purchase value 82 405 487 490
Accumulated depreciation and impairments (55) (343) (398) (394)
Book value at January 1 27 62 89 96
Movements
Investments 2 29 31 25
Acquired through business combinations Note 8 – – – 2
Divestments of operations Note 8 – – – 0
Disposals of assets 0 (1) (1) (9)
Net expenditures 2 28 30 18
Depreciation (2) (23) (25) (25)
Assets classified as held for sale Note 9 – 0 0 –
Foreign exchange differences and other movements (1) 2 1 0
Total movements (1) 7 6 (7)
Position at December 31
Purchase value 83 402 485 487
Accumulated depreciation and impairments (57) (333) (390) (398)
Book value at December 31 26 69 95 89* Restated for IFRS 16. See Note 20 – Leasing
Note 19 – Property, Plant, and Equipment
2019 2018
Acquired identifiable intangible assets - CGU Health Patient Engagement Solutions 36 –
Other intangible assets - CGU Health Patient Engagement Solutions 1 –
Acquired identifiable intangible assets - CGU Tax & Accounting Brazil 2 9
Other intangible assets - CGU Tax & Accounting Brazil 2 7
Other intangible assets - Other CGUs 12 14
Total 53 30
Impairment testing of acquired identifiable intangible assets and other intangible assetsThe following impairments were recognized on the acquired identifiable intangible assets and other intangible assets:
Following a more conservative revenue outlook for the group’s patient engagement solution, as a result of weakening customer demand, an impairment calculation was performed on the assets of the associated business operation (CGU) within the Health division. This review resulted in an impairment of €36 million on the acquired identifiable intangible assets, €1 million on other intangible assets, and €1 million on the right-of-use assets (refer to Note 20 – Leasing). The recoverable
amount of the business operation (€50 million) was based on value-in-use estimates using a discount rate of 7% (2018: 9%), whereby the estimates are especially sensitive to new sales and renewals. In addition, after the recognition of the impairment, the amortization of the acquired identifiable intangible assets has been adjusted for future periods to allocate the asset’s revised carrying amount on a systematic basis over its shorter remaining useful life.
In 2018, the group entered into a sale and lease back transaction for property in the United Kingdom. This transaction resulted in a net book gain of €5 million and a cash inflow of €12 million.

128 129Wolters Kluwer 2019 Annual Report Wolters Kluwer 2019 Annual Report
Table of Contents | Consolidated Financial Statements | Company Financial Statements
Note 20 – Leasing
Summarized impact of the adoption of IFRS 16 on the financial statementsIFRS 16 is the new standard on lease accounting and results in almost all operating leases being recognized in the statement of financial position, as the distinction between operating and finance leases is no longer applicable to lessees. IFRS 16 results in presentation changes in the statement of profit or loss, the statement of financial position, and the statement of cash flows.
Under the new standard, which became effective on January 1, 2019, an asset (the right to use the leased item) and a financial liability (a liability for discounted future lease installments) are recognized in the statement of financial position. In addition, the rent expense is replaced by depreciation of the right-of-use asset and interest expense on the lease liability. As a result of IFRS 16, the adjusted operating profit improved and net debt increased.
The group has decided to transition to this new standard based on the full retrospective approach. This means that a restated statement of financial position at January 1, 2018, is prepared and the comparatives in the 2019 financial statements are restated.
The group elected to apply the practical expedients to exclude all short-term leases and all leases for which the underlying asset is of low value, and not to apply IFRS 16 to leases of intangible assets (such as software). For the group’s IT equipment and car leases, the group elected to apply the practical expedient to not separate non-lease components from lease components, and instead to account for these components as a single lease component.
The following tables present the financial statement line items impacted by IFRS 16.
The restatement of property, plant, and equipment includes a reclassification from trade and other payables, regarding accrued leasehold improvement compensation received from landlords of real estate.
The restatement of financial assets relates to the recognition of finance lease receivables, regarding some real estate leases that are (partly) subleased.
The restatement of other receivables includes the reversal of prepaid rent, which is incorporated in the lease liability under IFRS 16.
The restatement of trade and other payables includes the reversal of accrued rent, incorporated in the lease liability under IFRS 16, and a reclassification to property, plant, and equipment.
The restatement of revenues primarily relates to income from the sublease of real estate leases, which are under IFRS 16 recognized as a reduction to the right-of-use asset (reducing the associated deprecation). The decrease in
general and administrative costs is further due to the financing component of leases being reclassified to the financing results.
Changes in the Statement of Financial Position
impacted accounts only January 1, 2018*
IFRS 16 January 1, 2018,
restated
December 31, 2018*
IFRS 16 December 31, 2018, restated
Non-current assets
Property, plant, and equipment 101 (5) 96 94 (5) 89
Right-of-use assets – 220 220 – 231 231
Financial assets 19 2 21 40 2 42
Deferred tax assets 93 1 94 106 1 107
Current assets
Other receivables 212 (6) 206 247 (4) 243
Current liabilities
Trade and other payables 881 (15) 866 907 (14) 893
Short-term lease liabilities – 73 73 – 67 67
Non-current liabilities
Lease liabilities – 169 169 – 188 188
Deferred tax liabilities 304 (3) 301 359 (3) 356
Equity
Equity attributable to the owners of the company 2,269 (12) 2,257 2,267 (13) 2,254
* Restated for IFRIC 23 and certain reclassifications. See Note 1 – General and Basis of Preparation.
Changes in the Statement of Profit or Loss
2018 reported IFRS 16 2018 restated
Revenues 4,260 (1) 4,259
Cost of revenues 1,297 – 1,297
Gross profit 2,963 (1) 2,962
Sales costs 753 – 753
General and administrative costs 1,405 (7) 1,398
Total operating expenses 2,158 (7) 2,151
Other operating income and (expense) 156 – 156
Operating profit 961 6 967
Financing results (72) (7) (79)
Share of profit of equity-accounted investees, net of tax 2 – 2
Profit before tax 891 (1) 890
Income tax expense (234) 0 (234)
Profit for the year 657 (1) 656
Attributable to:
Owners of the company 657 (1) 656
Non-controlling interests 0 0 0
Profit for the year 657 (1) 656
Earnings per share (EPS) (€)
Basic EPS 2.37 0.00 2.37
Diluted EPS 2.35 0.00 2.35

130 131Wolters Kluwer 2019 Annual Report Wolters Kluwer 2019 Annual Report
Table of Contents | Consolidated Financial Statements | Company Financial Statements
Changes in the Statement of Cash Flows
2018 reported IFRS 16 2018 restated
Net cash from operating activities 934 67 1,001
Net cash used in financing activities (1,432) (67) (1,499)
The adoption of IFRS 16 impacted the presentation of the statement of cash flows, since the repayment of the principal is presented as a cash flow from financing
activities. The payment of the lease interest component is included in interest paid under the heading cash flows from operating activities.
In 2019, the additions from new leases include a new real estate lease in New York City, NY, for an amount of €86 million.
Accounting policiesThe group leases primarily real estate and, to a lesser extent, IT equipment and cars. The fixed rental periods mostly vary from one year to 15 years but may have renewal and/or termination options. For real estate and IT equipment, lease terms are negotiated on an individual basis and contain a wide range of different terms and conditions.
Leases are recognized as a right-of-use asset and a corresponding liability at the same date at which the leased asset is available for use by the group. The right-of-use asset is depreciated over the shorter of the asset’s useful life and the lease term, on a straight-line basis. The lease liability is discounted based on the incremental borrowing rate, because the rate implicit in the lease cannot readily be determined. The finance cost is charged to profit or loss over the lease period in order to produce a constant periodic rate of interest on the remaining balance of the liability for each period.
Payments associated with short-term leases and low-value leases are recognized on a straight-line basis as an expense in profit or loss. Short-term leases are leases with a lease term of 12 months or less, considering
any reasonably certain optional lease periods. Low-value leases comprise small items of office furniture and IT equipment. The total expenses arising from short-term leases and low-value leases are insignificant.
The group is to a very limited extent a lessor.
Estimates and judgmentsIFRS 16 requires management to use estimates for setting the discount rate and to apply judgment in the assessment of renewal and termination options (i.e. optional lease periods) in the real estate lease contracts.
Discount rateThe discount rate applied is based on the incremental borrowing rate for the respective leases considering the primary economic environment of the lease, the currency, the credit risk premium, the lease term, and the nature of the leased asset.
At December 31, 2019, the weighted average discount rate is 3.2% (2018: 3.1%).
Renewal and termination optionsRenewal and termination options are included in several real estate and
other lease contracts. These terms are used to maximize operational flexibility in terms of managing contracts. Most contract-specific renewal and termination options held are exercisable only by the group and not by the respective lessor.
In determining the lease term, the group considers all facts and circumstances that create an economic incentive to use the optional lease period. Optional lease periods are only included in the lease term if it is reasonably certain that the optional lease period is used. The assessment is reviewed if a significant event or a significant change in circumstances occur which affect this assessment and that are within the control of the group.
Real estate leases that are annually renewed or that have an indefinite contract term are on average leased for five years. Optional periods arising from renewal options of other real estate leases are mostly not considered to be reasonably certain, since the rent is often reset at the market price at renewal option date. Optional periods after termination option dates are often considered in the lease term, due to termination penalties included in the contract.
Movement schedule of right-of-use assets
Real estate Other leases 2019 2018
Position at January 1
Purchase value 487 80 567 509
Accumulated depreciation and impairments (289) (47) (336) (289)
Book value at January 1 198 33 231 220
Movements
Additions from new leases 103 25 128 30
Additions from sale and leaseback Note 19 – – – 2
Acquired through business combinations Note 8 – – – 6
Contract modifications and reassessments of options 52 0 52 37
Depreciation (53) (19) (72) (68)
Impairment Note 18 (1) 0 (1) –
Assets classified as held for sale Note 9 – 0 0 –
Foreign exchange differences and other movements 3 0 3 4
Total movements 104 6 110 11
Position at December 31
Purchase value 599 74 673 567
Accumulated depreciation and impairments (297) (35) (332) (336)
Book value at December 31 302 39 341 231
Contractual maturities of lease liabilities
2019 2018
Within one year 76 69
Between one and two years 65 54
Between two and three years 55 41
Between three and four years 46 34
Between four and five years 37 27
Between five and ten years 107 63
Ten years and more 35 –
Effect of discounting (53) (33)
Total lease liabilities at December 31 Note 29 368 255

132 133Wolters Kluwer 2019 Annual Report Wolters Kluwer 2019 Annual Report
Table of Contents | Consolidated Financial Statements | Company Financial Statements
Cash outflow for leases
2019 2018
Interest portion of lease payments 11 7
Repayment of principal portion of lease liabilities 69 67
Total 80 74
Other disclosuresAt December 31, 2019, the future undiscounted cash outflow arising from leases not yet commenced and to which the group is committed, amounts to €22 million (2018: €117 million). A lease liability and corresponding
right-of-use asset will be recognized for these leases at the lease commencement date.
The group’s lease agreements do not impact any covenants.
Note 21 – Investments in Equity-accounted Investees
The group’s shares in equity-accounted investees at December 31, are:
ownership in % 2019 2018
Logical Images Inc. (Rochester, NY, United States) 40 39
HaoYisheng (Beijing, China) 22 22
Chengdu Medicom Medical Information System Co., Ltd. (Chengdu, China) Note 9 45 45
Manz’schen Verlags- und Universitätsbuchhandlung GmbH (Wien, Austria) Note 8 – 40
Accounting policiesInterests in equity-accounted investees (associates) are accounted for using the equity method of accounting and are initially recognized at cost, which includes transaction costs. Associates are recognized from the date the group has significant influence, and recognition ceases the date the group has no significant influence over the equity investment.
The carrying value of the group’s investments in associates includes goodwill identified upon acquisition, net of any accumulated impairment.
When an interest in an associate is increased to a controlling interest, the equity interest previously held is treated as if it were disposed of and reacquired at fair value on the
acquisition date. Any resulting gain or loss compared to the carrying amount is recognized in profit or loss. Any amount that has previously been recognized in other comprehensive income, and that would be reclassified to profit or loss following a divestment, is similarly reclassified to profit or loss.
2019 2018
Position at January 1 15 11
Change in control Note 17 – 2
Divestments Note 8 (5) (1)
Transfer to assets classified as held for sale Note 9 (5) –
Dividends received 0 (1)
Share of profit in equity-accounted investees, net of tax 3 2
Foreign exchange differences and other movements 0 2
Position at December 31 8 15
The movement in equity-accounted investees is as follows:
At December 31, 2019, the equity shareholding in Chengdu Medicom is classified as an asset held for sale. Refer to Note 9 – Assets/Liabilities Classified as Held for Sale.
In 2019, the group sold its 40% equity shareholding in MANZ’sche Verlags- und Universitätsbuchhandlung GmbH, refer also to Note 8 – Acquisitions and Divestments. Furthermore, the sale of a 10% equity shareholding in
Total equity-accounted investees Group’s share
2019 2018 2019 2018
Total assets 46 57 15 20
Total liabilities 35 44 10 14
Total equity 11 13 5 6
Revenues 45 75 15 27
Net profit for the year 9 7 4 2
Chengdu Medicom Medical Information System Co., Ltd in 2018 resulted in a loss of control.
For the equity-accounted investees, the financial information (at 100%) and the group’s weighted proportionate share is as follows:

134 135Wolters Kluwer 2019 Annual Report Wolters Kluwer 2019 Annual Report
Table of Contents | Consolidated Financial Statements | Company Financial Statements
Deferred tax assets and liabilities
Assets Liabilities 2019 2018*
Intangible assets 5 (419) (414) (440)
Property, plant, and equipment and right-of-use assets 6 0 6 2
Employee benefits 30 (4) 26 32
Interest carry-forward 1 – 1 2
Tax value of loss carry-forwards recognized 55 – 55 51
Other items 95 (15) 80 104
Subtotal 192 (438) (246) (249)
Setoff of tax (90) 90 0 0
Position at December 31 102 (348) (246) (249)* Restated for IFRS 16 and IFRIC 23. See Note 20 – Leasing and Note 1 – General and Basis of Preparation.
Note 22 – Financial Assets
2019 2018*
Derivative financial instruments Note 29 16 21
Other receivables 22 19
Finance lease receivables 1 2
Financial assets at fair value through profit or loss 0 0
Total 39 42
* Restated for IFRS 16. See Note 20 – Leasing.
Financial assets at fair value through profit or loss
2019 2018
Position at January 1 0 3
Divestments Note 8 0 (2)
Revaluation gain/(loss) on financial assets at fair value through profit or loss Note 15 0 (1)
Foreign exchange differences and other movements 0 0
Position at December 31 0 0
Note 23 – Tax Assets and Liabilities
Other receivables predominantly relate to long-term advance payments.
The exposure to credit risk of the financial assets is considered immaterial. Refer to Note 30 – Financial Risk Management.
The actual recognition of deferred tax assets depends on the generation of future taxable income during the periods in which the temporary differences become deductible. Based on projected future taxable income and available strategies, the group considers the future realization of these deferred tax assets as being probable.
Other items mainly include recognition of deferred tax assets and liabilities for temporary differences on working capital items.
Movements in temporary differences and other movements, 2018
Bala
nce
atJa
nuar
y 1,
201
9
Acqu
isit
ions
/di
vest
men
ts
Tran
sfer
to
liabi
litie
s cl
assi
fied
as h
eld
for s
ale
Reco
gniz
ed in
st
atem
ent
of p
rofit
or l
oss
(Not
e 16
)
Reco
gniz
ed in
eq
uity
and
oth
er
com
preh
ensi
ve
inco
me
Fore
ign
exch
ange
diff
eren
ces
and
othe
r mov
emen
ts
Bala
nce
atDe
cem
ber 3
1,
2019
Intangible assets (440) (2) – 33 – (5) (414)
PPE and right-of-use assets 2 – – 4 – 0 6
Employee benefits 32 – 0 (4) (2) 0 26
Interest carry-forwards 2 – – (1) – 0 1
Tax value of loss carry-forwards recognized 51 – – 4 – 0 55
Other items 104 – – (27) 2 1 80
Total (249) (2) 0 9 0 (4) (246)
Bala
nce
atJa
nuar
y 1,
201
8*
Acqu
isit
ions
/di
vest
men
ts
Reco
gniz
ed in
st
atem
ent
of p
rofit
or l
oss
(Not
e 16
)
Reco
gniz
ed in
eq
uity
and
oth
er
com
preh
ensi
ve
inco
me
Fore
ign
exch
ange
diff
eren
ces
and
othe
r mov
emen
ts
Bala
nce
atDe
cem
ber 3
1,
2018
Intangible assets (427) (24) 19 – (8) (440)
PPE and right-of-use assets (5) – 7 – 0 2
Employee benefits 54 – (20) (4) 2 32
Interest carry-forwards 11 – (9) – 0 2
Tax value of loss carry-forwards recognized 49 5 (4) – 1 51
Other items 111 – (5) 0 (2) 104
Total (207) (19) (12) (4) (7) (249)* Restated for IFRS 16 and IFRIC 23. See Note 20 – Leasing and Note 1 – General and Basis of Preparation.
Movements in temporary differences and other movements, 2019

136 137Wolters Kluwer 2019 Annual Report Wolters Kluwer 2019 Annual Report
Table of Contents | Consolidated Financial Statements | Company Financial Statements
The current income tax liabilities include, to a large extent, uncertain tax positions, of which most of the liabilities are expected to be settled beyond one year. For the critical estimates and judgments applied to uncertain tax positions, refer to Note 16 – Income Tax Expense.
Unrecognized tax losses and temporary differencesThe group has not recognized deferred tax assets that relate to unused tax losses and temporary differences amounting to €268 million (2018: €249 million), as it is not probable that future taxable profit will be available against which the group can use the benefits. Of these
unused tax losses and temporary differences, 10% (2018: 9%) expire within the next five years, 12% (2018: 10%) expire after five years, and 78% (2018: 81%) carry forward indefinitely.
The amount of deferred tax assets arising from recognized income tax loss carry-forwards, which relate to tax jurisdictions where the group continued to incur tax losses in the current and/or preceding year, was €36 million at December 31, 2019 (2018: €32 million). It is considered probable based on forecasts that future taxable profits will be available.
Movements in overall tax position
2019 2018*
Position at January 1
Current income tax assets 24 9
Current income tax liabilities (165) (127)
Deferred tax assets 107 94
Deferred tax liabilities* (356) (301)
Overall tax position (390) (325)
Movements
Income tax expense Note 16 (189) (234)
Deferred tax from acquisitions and divestments Note 8 and 18 (2) (19)
Current income tax from acquisitions and divestments 0 (2)
Deferred tax on items recognized directly in other comprehensive income 0 (4)
Paid income tax 195 206
Transfer to liabilities classified as held for sale 0 (5)
Foreign exchange differences and other movements (1) (7)
Total movements 3 (65)
Position at December 31
Current income tax assets 22 24
Current income tax liabilities (163) (165)
Deferred tax assets 102 107
Deferred tax liabilities (348) (356)
Overall tax position (387) (390)* Restated for IFRS 16 and IFRIC 23. See Note 20 – Leasing and Note 1 – General and Basis of Preparation.
Deferred tax on items recognized immediately in other comprehensive income and equity
2019 2018*
Amount before tax
Tax Amount net of tax
Amount before tax
Tax Amount net of tax
Exchange differences on translation of foreign operations and net investment hedges 63 2 65 123 0 123
Gains/(losses) on cash flow hedges (9) – (9) 13 – 13
Remeasurement gains/(losses) on defined benefit plans 8 (2) 6 12 (4) 8
In other comprehensive income 62 0 62 148 (4) 144
Share-based payments 25 – 25 22 – 22
In equity 25 – 25 22 0 22* Restated for IFRS 16. See Note 20 – Leasing.
Note 24 – Inventories
2019 2018
Work in progress 19 15
Finished products and trade goods 54 56
Total 73 71
At December 31, 2019, the provision for obsolescence deducted from the inventory carrying values amounted to €19 million (2018: €18 million). In 2019, an amount of €3 million was recognized as an expense for the change in
the provision for obsolescence (2018: €3 million) and is presented as part of cost of revenues in the statement of profit or loss.
The total income tax recognized in the statement of other comprehensive income is impacted by changes in income tax rates for €0 million (2018: €0 million).
Accounting policiesInventories are valued at the lower of cost and net realizable value. The cost of inventories includes all costs of purchase and other costs incurred in bringing the inventories to their present location and condition. Net realizable value is the estimated
selling price in the ordinary course of business less the estimated cost of completion and the estimated cost necessary to complete the sale.
Inventories also include internally developed commercial software
products. The cost of internally produced goods includes the developing, manufacturing, content, and publishing costs. Trade goods purchased from third parties are valued at the purchase price.

138 139Wolters Kluwer 2019 Annual Report Wolters Kluwer 2019 Annual Report
Table of Contents | Consolidated Financial Statements | Company Financial Statements
Note 25 – Contract Assets and Liabilities
2019 2018
Trade receivables 1,087 1,022
Non-current contract assets 20 19
Current contract assets 137 113
Deferred income 1,679 1,592
Other contract liabilities 39 45
Loss allowance
2019 2018
Position at January 1 64 67
Additions to loss allowances Note 10 23 17
Usage of loss allowances (16) (20)
Transfer to assets classified as held for sale Note 9 0 –
Foreign exchange differences and other movements 1 0
Position at December 31 72 64
For further information on credit risk, refer to Note 30 – Financial Risk Management.
GeneralIn general, the group applies payment terms in line with common industry practice. There are no contracts with a material financing component. There are contracts with variable consideration, but the related estimates are almost never constrained. In a few contracts, the group acts as an agent.
Most of the goods and/or services require prepayment of the consideration. However, the group also has contracts with customers where invoicing occurs after delivery of the goods and/or services.
Loss allowance on trade receivables and contract assetsTrade receivables and contract assets are shown net of impairment losses amounting to €72 million (2018: €64 million). The fair value of the receivables approximates the carrying amount. Impairment losses on trade receivables and contracts assets are presented as part of sales costs in the statement of profit or loss.
In 2019, the movements in the loss allowance on trade receivables and contract assets are as follows:
The group did not recognize an impairment loss on the unbilled revenues during the year (2018: nil).
Accounting policiesContract assets and contract liabilitiesThe group recognizes the following contract-related assets: unbilled revenues, cost to obtain a contract, cost to fulfil a contract, and right-to-return assets. The group identifies the following contract-related liabilities: deferred income and the provisions for returns, refunds, and/or volume discounts.
In general, when either party to a customer contract has performed, the group recognizes unbilled revenues or deferred income, depending on the relationship between the group’s performance and the timing of the customers’ payment.
Where the group has performed by transferring a good and/or service to the customer and the customer has not yet paid the related consideration, unbilled revenues or a receivable is presented in the statement of financial position, depending on the nature of the group’s right to consideration.
For contracts whereby neither party has performed, trade receivables and deferred income balances are presented on a net basis.
A contract asset is recognized when the group’s right to consideration is conditional on something other than the passage of time, for example future performance of the entity. A receivable is recognized when the
group’s right to consideration is unconditional except for the passage of time.
Cost to obtain a contractIncremental cost for obtaining a contract (primarily sales commissions) will be capitalized and amortized if the contract term is expected to be 12 months or longer. The amortization period will usually be one, three, or five years, or the underlying contract life if longer, subject to the nature of the underlying performance obligations. Applying the practical expedient of IFRS 15, the group recognizes any incremental cost as an expense when incurred, if the amortization period is one year or less.
Cost to fulfil a contractIf the group incurs cost to fulfil a revenue contract with a customer (e.g. costs that are explicitly chargeable to the customer under the contract, set-up cost, or pre-contract costs) an asset is recognized if these costs directly relate to a contract, generate or enhance resources that will be used in satisfying performance obligations in the future, and are expected to be recovered. The amortization of set-up and pre-contract costs is recognized as an expense over the term of the associated contract.
ImpairmentAny impairment of assets relating to contracts with customers is
measured, presented, and disclosed in accordance with IFRS 9.
Deferred incomeDeferred income is presented in the statement of financial position when a customer has paid an amount of consideration prior to the group performing. It represents the part of the amount invoiced to customers that has not yet met the criteria for revenue recognition and thus still must be earned as revenue by means of the delivery of goods and/or services in the future. Deferred income is recognized at its nominal value.
Provisions for returns, refunds, and other liabilitiesThe group recognizes a contract liability if the group receives consideration from a customer and expects to refund some or all that consideration to the customer. The contract liability is measured as the amount of the consideration for which the group does not expect to be entitled to.
Critical estimates and judgmentsThe assessment of the nature of sales commission plans for meeting the capitalization criteria requires judgment. The applicable amortization period of the incremental cost to obtain a contract is estimated by the group, by matching the useful life of the capitalized sales commissions with the expected benefits of the underlying contract.
Contract assets (current and non-current)
Unbilled revenues
Cost to obtain a contract
Cost to fulfil a
contract
2019 2018*
Position at January 1 81 34 17 132 130
Acquired through business combinations Note 8 0 0 – 0 3
Transfer to assets classified as held for sale Note 9 0 0 – 0 –
Recognized as revenues in the year 495 495 459
Newly recognized cost to fulfil a contract 322 322 354
Transferred to trade receivables (471) (321) (792) (819)
Newly recognized cost to obtain a contract 21 21 26
Amortization of capitalized sales commissions Note 10 (20) (20) (24)
Foreign exchange differences and other movements (1) 0 0 (1) 3
Position at December 31 104 35 18 157 132* 2018 comparative figures were adjusted due to separate disclosure of ‘Newly recognized cost to fulfil a contract’.

140 141Wolters Kluwer 2019 Annual Report Wolters Kluwer 2019 Annual Report
Table of Contents | Consolidated Financial Statements | Company Financial Statements
Deferred income
2019 2018*
Position at January 1 1,592 1,486
Acquired through business combinations Note 8 1 7
Transfer to liabilities classified as held for sale Note 9 (2) –
New and existing contracts with customers 3,383 3,153
Recognized as revenues from opening balance (1,459) (1,395)
Recognized as revenues in the year on new and existing contracts (1,846) (1,691)
Foreign exchange differences and other movements 10 32
Position at December 31 1,679 1,592* 2018 comparative figures were adjusted as both ‘Recognized as revenues in the year on new and existing contracts’ and ‘New and existing contracts with customers’ were understated by €145 million.
No material amount of revenues was recognized in 2019 from performance obligations satisfied or partially satisfied in previous years, because of events such as changes in transaction price. Furthermore, we did not have material changes in deferred income because of changes in our estimates or because of contract modifications.
The aggregate amount of the transaction price allocated to the remaining performance obligations that are unsatisfied at year-end 2019 was €3,179 million (2018:
€2,836 million), of which €1,679 million (2018: €1,592 million) was included in deferred income. Most of the deferred income will be satisfied in the following year as the performance obligations are part of contracts that have an original duration of less than one year. The remainder of the unfulfilled performance obligations, not recognized in deferred income, relates to multi-year contracts agreed with customers, whereby we expect to satisfy these performance obligations between one and five years.
Note 26 – Other Receivables
Note 27 – Cash and Cash Equivalents
2019 2018*
Prepaid royalties 54 55
Other prepayments 137 140
Miscellaneous receivables 40 35
Deferred divestment consideration receivable Note 8 – 13
Derivative financial instruments Note 29 2 0
Total 233 243* Restated for IFRS 16. See Note 20 – Leasing.
2019 2018
Deposits 293 10
Cash and bank balances 606 773
Total cash and cash equivalents in the statement of financial position Note 29 899 783
Minus: Bank overdrafts used for cash management purposes Note 29 (468) (604)
Total cash and cash equivalents in the statement of cash flows 431 179
Plus: Cash included in assets held for sale Note 9 3 –
Total cash and cash equivalents including cash included in assets held for sale in the statement of cash flows 434 179
An amount of €0 million (2018: €0 million) relates to cash and cash equivalent balances of entities that the group does not fully own (see Note 17 - Non-controlling Interests).
All deposits are on demand deposits that are readily convertible into cash. Bank balances include an amount of approximately €26 million (2018: €24 million) of restricted cash, primarily due to local exchange control regulations that provide for restrictions on exporting cash and/or capital from the relevant country.
Accounting policiesCash and cash equivalents comprise cash balances and call deposits. Bank overdrafts predominantly result from cash pool arrangements
and are shown within borrowings and bank overdrafts in current liabilities. The group discloses the financial assets and financial
liabilities within these netting arrangements on a gross basis.
Other contract liabilities
2019 2018
Position at January 1 45 43
Additions to provision for returns, refunds, and other 169 159
Usage of provision for returns, refunds, and other (173) (154)
Foreign exchange differences and other movements (2) (3)
Position at December 31 39 45

142 143Wolters Kluwer 2019 Annual Report Wolters Kluwer 2019 Annual Report
Table of Contents | Consolidated Financial Statements | Company Financial Statements
Nominal value
Effective interest
rate in %
Nominal interest
rate in %
Repayment commit-
ments1-5 years
Repayment commit-
ments>5 years
2019 2018*
Bonds 2008-2028 (100.00**) €36 6.812 6.748 – 36 36 36
Bonds 2013-2023 (99.709**) €700 2.950 2.875 698 – 698 698
Bonds 2014-2024 (99.164**) €400 2.640 2.500 398 – 398 397
Bonds 2017-2027 (99.659**) €500 1.575 1.500 – 497 497 497
Subtotal bonds, measured at amortized cost 1,096 533 1,629 1,628
Private placement 2008-2038 ¥20,000 3.330 3.330 – 163 163 158
Private placement 2010-2020 (98.567**) €250 4.425 4.200 – – – 249
Subtotal private placements, measured at amortized cost – 163 163 407
Deferred and contingent acquisition payables, measured at fair value 1 – 1 12
Other debt, measured at amortized cost 25 – 25 14
Derivative financial instruments, measured at fair value – – 0 0
Subtotal other long-term debt 26 – 26 26
Total long-term debt (excluding lease liabilities) 1,122 696 1,818 2,061
Lease liabilities*** 293 188
Total long-term debt 2,111 2,249
* Restated for IFRS 16. See Note 20 – Leasing. ** Issue price of the financial instrument. *** For the repayment commitments of lease liabilities, refer to Note 20 – Leasing.
Note 29 – Long-term Debt
Note 28 – Trade and Other Payables
2019 2018*
Trade payables 169 193
Salaries and holiday allowances 241 239
Social security premiums and other taxation 70 59
Pension-related payables 27 27
Royalties payable 97 96
Other accruals and payables 255 245
Interest payable 32 32
Derivative financial instruments Note 29 – 0
Deferred and contingent acquisition payables Note 29 10 2
Total 901 893* Restated for IFRS 16. See Note 20 – Leasing.
Reconciliation long-term debt to net debt
2019 2018*
Total long-term debt 2,111 2,249
Borrowings and bank overdrafts:
Multi-currency rollover credit facility – 144
Euro Commercial Paper program 200 –
Collateral 2 –
Bank overdrafts, measured at amortized cost Note 27 468 604
Total borrowings and bank overdrafts 670 748
Short-term private placements, measured at amortized cost 250 –
Short-term lease liabilities 75 67
Deferred and contingent acquisition payables, measured at fair value Note 28 10 2
Derivative financial instruments, measured at fair value Note 28 – 0
Total short-term debt 1,005 817
Gross debt 3,116 3,066
Minus:
Cash and cash equivalents Note 27 (899) (783)
Deferred divestment consideration receivable Note 26 – (13)
Derivative financial instruments:
Non-current receivable Note 22 (16) (21)
Current receivable Note 26 (2) 0
Net debt 2,199 2,249
* Restated for IFRS 16. See Note 20 – Leasing.
Accounting policiesFinancial instrumentsFinancial instruments comprise the following:• Non-derivative financial assets and
liabilities: financial assets designated at fair value through profit or loss, trade and miscellaneous receivables, cash and cash equivalents, borrowings and bank overdrafts, trade payables, short-term and long-term debt; and
• Derivative financial assets and liabilities: currency forwards and cross-currency interest rate swaps.
Financial assets and liabilities are offset and presented as net in the statement of financial position when the group has a legal right to offset the amounts and intends either to settle them on a net basis or to realize the asset and settle the liability simultaneously.
The group recognizes non-derivative financial assets and liabilities on the trade date.
Non-derivative financial assets Loans and receivables comprise trade and miscellaneous receivables and are measured at amortized cost, less any accumulated impairment.
Impairment of non-derivative financial assetsThe determination of the provision for impairment is based on the group’s historical average of three years of credit losses, which is used as a proxy for expected losses on trade receivables with similar characteristics and credit profile. Trade receivables longer than one year overdue and specific risk trade receivables with no reasonable expectation of recovery, are impaired and hence provided for in full, unless reliable supporting information to conclude otherwise is available. The group does not present its impairment losses

144 145Wolters Kluwer 2019 Annual Report Wolters Kluwer 2019 Annual Report
Table of Contents | Consolidated Financial Statements | Company Financial Statements
Bala
nce
atJa
nuar
y 1,
20
19
Net c
ash
flow
s
Acqu
isit
ions
/ Di
vest
men
ts
Unw
indi
ng o
f di
scou
nt
Fore
ign
exch
ange
di
ffer
ence
s
Oth
er
non-
cash
m
ovem
ents
Bala
nce
atDe
cem
ber 3
1,
2019
Bonds 1,628 – – 1 – – 1,629
Private placements 407 – – 1 5 – 413
Other gross debt 172 67 6 – 2 (9) 238
Total 2,207 67 6 2 7 (9) 2,280
Bala
nce
atJa
nuar
y 1,
20
18
Net c
ash
flow
s
Acqu
isit
ions
/ Di
vest
men
ts
Unw
indi
ng o
f di
scou
nt
Fore
ign
exch
ange
di
ffer
ence
s
Oth
er
non-
cash
m
ovem
ents
Bala
nce
atDe
cem
ber 3
1,
2018
Bonds 1,627 – – 1 – – 1,628
Private placements 396 – – 1 10 – 407
Other gross debt 776 (617) 13 – 1 (1) 172
Total 2,799 (617) 13 2 11 (1) 2,207
Reconciliation of liabilities arising from financing activities Gross debt, excluding lease liabilities, derivative financial instruments, and bank overdrafts
separately in the statement of profit or loss, but in the notes thereto.
Non-derivative financial assets designated at fair value through profit or lossNon-derivative financial assets designated at fair value through profit or loss comprise equity investments and are measured at fair value. Fair value changes are recognized in profit or loss.
Non-derivative financial liabilitiesNon-derivative financial liabilities comprise long-term debt (such as bond loans and other loans from credit institutions), trade payables, and borrowings and bank overdrafts.
Non-derivative financial liabilities measured at amortized costFinancial liabilities measured at amortized cost are bonds, the Euro Commercial Paper program, private placements, and other long-term and short-term debt.
The group initially recognizes non-derivative financial liabilities at fair value less any directly attributable transaction costs. After initial recognition, these financial liabilities are measured at amortized cost with any difference between cost and redemption value being recognized in profit or loss over the period of the borrowings, using the effective interest method.
Non-derivative financial liabilities designated at fair value through profit or lossNon-derivative financial liabilities designated at fair value through profit or loss comprise contingent considerations and are measured at fair value. Changes therein are recognized in profit or loss.
Derivative financial instruments and hedging activitiesThe group holds derivative financial instruments to hedge risk exposures.Derivative financial instruments are initially recognized at fair value on the date a derivative contract is concluded and are subsequently remeasured at fair value. The method of recognizing gains or losses depends on whether the derivative is designated as a hedging instrument and if so, the nature of the item being hedged.
The group designates certain derivatives as either:• Hedges of a risk associated with a
recognized asset or liability or a highly probable forecast transaction (cash flow hedge);
• Hedges of a net investment in a foreign operation (net investment hedge); or
• Currency forward instruments to protect the group’s net profit.
The fair value of derivative financial instruments is classified as a non-current asset or long-term debt if the remaining maturity of the derivative financial instrument is more than 12 months, and as a current asset or liability if the remaining maturity of the derivative financial instrument is less than 12 months after the end of the reporting period.
With respect to foreign currency forwards used for hedge accounting, the group designates as a hedge instrument only the change in the value of the spot component of a forward contract (and not the forward element). The differential between the contracted forward rate and the market spot rate, defined as forward points, will be recognized as cost of
hedging in other comprehensive income, and accumulated in the hedge reserve within total equity.
Cash flow hedgeThe effective part of changes in the fair value of derivatives that are designated and qualify as cash flow hedges are recognized and accumulated in other comprehensive income. Amounts accumulated in other comprehensive income are reclassified to profit or loss in the same period the hedged item affects the statement of profit or loss within the line where the result from the hedged transaction is recognized.
The gain or loss relating to the ineffective part of the hedging relationship is recognized in profit or loss within financing results.
Reclassification of hedge reserve to profit or lossWhen a hedging instrument matures or is sold, or when a hedge no longer meets the criteria for hedge accounting, any cumulative gain or loss existing in other comprehensive income at that time remains in other comprehensive income and is recognized when the hedged transaction is ultimately recognized in profit or loss. When a hedged transaction is no longer expected to occur, the cumulative gain or loss that was reported in other comprehensive income is reclassified to profit or loss.
Net investment hedgeFair value changes of derivative financial instruments that are used to hedge the net investment in foreign operations, which are determined to be an effective hedge, are recognized directly in other comprehensive income in the translation reserve.
Gains and losses accumulated in other comprehensive income are included in profit or loss when the foreign operation is disposed. If a hedging relationship is terminated and the derivative financial instrument is not sold, future changes in the fair value of the derivative financial instrument are recognized in profit or loss.
The gain or loss relating to the ineffective part of the hedging relationship is recognized in profit or loss within financing results.
Derivatives that do not qualify for hedge accounting Changes in the fair value of any derivative financial instruments that do not qualify for hedge accounting are recognized in profit or loss within financing results.
Lease liabilities
2019 2018
Position at January 1 255 242
Additions from new leases 128 32
Acquired through business combinations Note 8 – 6
Transfer to liabilities classified as held for sale Note 9 0 –
Contract modifications and reassessments of options 52 38
Repayment of lease liabilities (80) (74)
Unwinding of discount 11 7
Foreign exchange differences and other movements 2 4
Position at December 31 368 255

146 147Wolters Kluwer 2019 Annual Report Wolters Kluwer 2019 Annual Report
Table of Contents | Consolidated Financial Statements | Company Financial Statements
Loan maturityThe following amounts of gross debt (excluding lease liabilities) at December 31, 2019, are due within and after five years:
2019
2021 5
2022 5
2023 714
2024 398
Due after 2024 696
Long-term debt 1,818
Short-term debt (2020) 930
Total (excluding lease liabilities) 2,748
Financial liabilities measured at amortized costBondsThe group has senior bonds outstanding for an amount of €1,629 million at December 31, 2019 (2018: €1,628 million). The nominal interest rates on the bonds are fixed until redemption.
Private placementsThe group holds private placements in euro and Japanese yen. Private placements denominated in Japanese yen (¥20,000 million) are converted and hedged to euro via cross-currency interest rate swaps. These swaps have been collateralized for credit risk in line with the treasury risk management policies. The value of the collateral is €2 million at December 31, 2019 (2018: €0 million).
Multi-currency rollover credit facilityIn June 2016, the group concluded the extension of the €600 million multi-currency revolving credit facility maturing in July 2020, to €550 million maturing in July 2021. The relevant terms and conditions remained effectively unchanged after adopting the IFRS 16 Leasing standard. The interest rates on the multi-currency rollover credit facility are variable. The credit facility is for general corporate purposes.
At December 31, 2019, no amounts were drawn (December 31, 2018: €144 million) under the facility. The multi-currency rollover facility is subject to customary conditions, including a financial credit covenant. The credit facility covenant requires that the consolidated net senior borrowings (excluding fully subordinated debt) to adjusted EBITDA shall not exceed 3.5. In 2019, the group was comfortably within the thresholds stipulated in the
financial covenant of the credit facility. At December 31, 2019, the indebtedness ratio was 1.6 (2018: 1.8). The existing credit facility covenant has not been redefined due to the adoption of IFRS 16.
Euro Commercial Paper programOn May 7, 2019, Wolters Kluwer established a Euro Commercial Paper (ECP) program, under which the company may issue unsecured, short-term debt (ECP notes) for a maximum of €1.0 billion. The program provides flexible funding for short-term cash needs at attractive rates. The outstanding amount per December 31, 2019 is €200 million, included in borrowings and bank overdrafts.
Other bilateral bank loansIn 2019, the group renewed a bilateral bank loan of $100 million (undrawn at December 31, 2019; December 31, 2018: undrawn). The interest rates on the other bilateral bank loans are variable.
Financial liabilities measured at fair value through profit or lossFinancial liabilities measured at fair value through profit or loss are deferred and contingent considerations and currency forwards classified as derivatives at fair value through profit or loss (not qualifying for hedge accounting).
Financial derivatives measured at fair value through other comprehensive incomeFinancial derivatives measured at fair value through other comprehensive income are derivatives such as net investment hedges and cash flow hedges.
Defaults and/or breachesThere were no defaults or breaches on the loans and borrowings during 2019 and 2018.
Risk management frameworkThe group’s activities are exposed to a variety of financial risks, including market, liquidity, and credit risk. Identification and management of financial risks are carried out by the central treasury department (Corporate Treasury), whereby the treasury operations are conducted within a framework of policies and guidelines (Treasury Policy), which have been approved by the Executive Board and Supervisory Board. The Treasury Policy is reviewed at least annually considering market circumstances and market volatility, and is based on assumptions concerning future events, subject to uncertainties and risks that are outside the group’s control. The Treasury Committee, comprising the Vice President Group Accounting & Reporting, Controller Corporate Office, Executive Vice President Treasury & Risk, and representatives of the Corporate Treasury and Treasury Back-Office, meets quarterly to review treasury activities and compliance with the Treasury Policy, and reports directly to the Executive Board and the Audit Committee. The Treasury Back-Office reports deviations directly to the CFO and the Executive Vice President Treasury & Risk.
Under the Internal Control Framework, the financial reporting controls, including policy and procedures of the Corporate Treasury Department are periodically reviewed. Corporate Treasury reports on a quarterly basis to the Audit Committee about its compliance to the Treasury Policy.
The group’s funding activities are carried out by Corporate Treasury, using long-term capital market instruments and committed credit facilities to ensure optimal financial flexibility and capital efficiency. The borrowings, together with cash generated from operations, are lent or contributed as equity to the operating companies. The group targets a net-debt-to-EBITDA ratio of approximately 2.5. However, the group could temporarily deviate from this relative indebtedness ratio. At December 31, 2019, the net-debt-to-EBITDA ratio was 1.6 (2018: 1.8).
All treasury activities – in particular, the use of derivative financial instruments – are subject to the principle of risk minimization and are executed by specialist treasury personnel. For this reason, financial transactions and risk positions are managed in a central treasury management and payment system. It is the group’s policy that material currency translation and variable interest exposures are partially hedged by Corporate Treasury, in accordance
with the annual treasury plan approved by the Audit Committee. The group does not purchase or hold derivative financial instruments for speculative purposes. The group’s risk profile is defined and reviewed regularly. Although the economic environment has become more challenging because of the volatility in financial markets, the exposure to financial risks for the company has not significantly changed, nor the approach to these risks.
Market riskMarket risk is the risk that changes in market prices, such as foreign exchange rates and interest rates, will affect the group’s profit or loss or the value of its holdings of financial instruments. The objective of market risk management is to manage and control market risk exposures within acceptable parameters, while optimizing the return.
Currency riskThe group has identified transaction and translation risks as the main currency risks. The transaction risk exposure within individual group entities is relatively immaterial. The transaction prices invoiced to customers for goods and/or services are mainly denominated in the customers’ local currencies. Given the nature of the business, almost all related costs are also incurred in those local currencies. Derivative financial instruments to hedge transaction risks are therefore not frequently used.
Hedge accountingTranslation risk is the risk that exchange rate gains or losses arise from translating the statement of profit or loss, statement of financial position, and statement of cash flows of foreign subsidiaries to the group’s presentation currency (euro) for consolidation purposes.
The group’s risk management strategy practice is that material currency translation exposures (including U.S. dollar net investments) are partially hedged by Corporate Treasury. Currency exposures, which impact the statements of financial position and/or profit or loss by 10% or more, are considered material. The translation exposure on the statement of cash flows is partly mitigated by matching cash inflows and outflows in the same currency. The group’s main translation risk is its exposure to the U.S. dollar.
In line with the group’s risk management strategy, the group manages the translation risk using three types of
Note 30 – Financial Risk Management

148 149Wolters Kluwer 2019 Annual Report Wolters Kluwer 2019 Annual Report
Table of Contents | Consolidated Financial Statements | Company Financial Statements
risk mitigating actions, of which two types of transactions are designated as a hedge and for which the group applies hedge accounting:• Partially protect total equity for foreign exchange
differences using U.S. dollar currency forward contracts qualifying as net investment hedges, which partially offset the translation risk on U.S. dollar-denominated subsidiaries and long-term receivables from U.S. operations being the hedged item. The fair value changes of the net investment hedge partially offset the currency differences on translation of U.S. dollar-denominated subsidiaries and long-term receivables from U.S. operations, both being recognized in equity. The group had U.S. dollar forward contracts outstanding for a total notional amount of €178 million ($200 million) at December 31, 2019 (2018: €175 million or $200 million). These hedges create a U.S. dollar balance sheet cover with a future settlement date and have a carrying value of €2 million at December 31, 2019 (see Note 29 - Long-term Debt). The group had U.S. dollar liabilities outstanding for a total notional amount of €451 million ($507 million) at December 31, 2019 (2018: €462 million or $529 million). The U.S. dollar liabilities include net investment hedges and other U.S. dollar-denominated liabilities. The U.S. dollar balance sheet cover of 13% (2018: 13%) is defined as the sum of U.S. dollar net investment hedges and other U.S. dollar liabilities outstanding, divided by the group’s net investment in U.S. dollar-denominated assets;
• Partially protect the translation differences on the Japanese yen private placement swaps (2019 and 2018: ¥20,000 million) using cash flow hedges by means of four cross-currency interest rate swaps. The fair value changes of the cash flow hedge are recognized in equity until the hedge relationship with the corresponding hedged instrument is terminated. At that moment the translation differences are recycled into profit or loss; and
• Partially protect net profit for foreign exchange differences using U.S. dollar and other currency forwards not qualifying for hedge accounting. The fair value changes of these currency forwards are recognized in the total financing results and partially offset any translation risk on profit or loss elements. In 2019, the group swapped 74% (2018: 59%) of the net financing results of €58 million (2018: €77 million) into U.S. dollar, using foreign exchange derivatives of $40 million (2018: $50 million). Based on the percentage of 74% for net financing results payable in U.S. dollar, an instantaneous 1% decline of the U.S. dollar against the euro from its exchange rate at December 31, 2019, with all other variables held constant, would result in a decrease of approximately €0.4 million of net financing results (2018: approximately €0.4 million).
Before applying hedge accounting, the group assesses, in accordance with the group’s risk management policies and the parameters of the hedge, that the designated hedge is highly effective. In 2019, the group did not record ineffectiveness because of hedging activities (2018: no ineffectiveness). The group measures hedge effectiveness on a forward-looking basis at the inception of the hedging relationship, and on an ongoing basis at reporting dates through a qualitative assessment of the critical terms of the hedging instrument and the hedged item. The hedge values will generally move in the opposite direction because of the same risk and hence an economic relationship exists. The results of these effectiveness tests all satisfied the effectiveness criterion during the year.
2019 2018
Revenues (31) (28)
Adjusted operating profit (9) (8)
Operating profit (8) (8)
Adjusted net profit (6) (5)
Profit for the year (6) (5)
Shareholders’ equity at December 31 (32) (33)
Adjusted free cash flow (7) (7)
Interest rate riskThe group is exposed to interest rate risk. The group aims to mitigate the impact on its results and cash flows of interest rate movements, both by arranging fixed or variable rate funding and by use of derivative financial instruments. At December 31, 2019, the group’s interest rate position (excluding cash and cash equivalents and lease liabilities) carried predominantly fixed rates rather than floating rates. Of the total interest portfolio (excluding cash and cash equivalents) 94% (2018: 95%) was carried at a fixed rate. The credit facility and the other bilateral loans have a variable interest rate, as well as the Euro Commercial Paper program.
Assuming the same mix of variable and fixed interest rate instruments, an instantaneous increase of interest rates of 1% compared to the rates on December 31, 2019, with all other variables held constant, would result, on an annual basis, in an increase of approximately €2 million of the net financing results (2018: €1 million).
Liquidity riskLiquidity risk is the risk that the group will encounter difficulty in meeting the obligations associated with its financial liabilities that are settled by delivering cash or another financial asset. The group’s approach to manage liquidity is to ensure, as far as possible, that it will have enough liquidity to meet its liabilities when they are due.
The group actively manages liquidity risk by maintaining enough cash and cash equivalents, and the availability of committed borrowing capacity. To reduce liquidity risk, the group has established the following minimum requirements:
• No more than 25% of outstanding gross debt minus available cash should be repayable within a 12-months period;
• Acquiring of funding to start at least one year in advance of all maturing debt or alternative committed funding should be in place; and
• Minimum headroom of €500 million (sum of unused committed credit facilities, cash and cash equivalents, and receivable derivative financial instruments, minus other short-term debt, current deferred acquisition payables, current payable derivative financial instruments, and bank overdrafts).
Per December 31, 2019, the group has access to the unused part of the committed credit facilities of €689 million in total (2018: €543 million) and has cash and cash equivalents of €899 million (2018: €783 million), receivable derivative financial instruments of €18 million (2018: €21 million), minus other short-term debt, current deferred acquisition payables, bank overdrafts, Euro Commercial Paper, and current payable derivative financial instruments of in total €680 million (2018: €606 million). The headroom was €926 million at year-end 2019 (2018: €741 million).
No property has been collateralized or in any other way secured under debt contracts.
Exposure to liquidity riskThe following tables relate to the remaining contractual cash flows of financial liabilities at the reporting date. The amounts for the non-derivative financial instruments are gross and undiscounted and include estimated interest payments and exclude the impact of netting agreements. For the remaining contractual cash flows of lease liabilities, refer to Note 20 – Leasing.
in millions Hedged risk Amount Type of instrument
Exchangerate movement
€
Interestrate movement
€
Cash flow hedge Changes in ¥ floatinginterest payments and
¥ exchange rates
¥20,000
Cross-currencyinterest
rate swaps
(2)
(2)
Net investment hedge Changes of the U.S. dollarnet investments due to
fluctuations of U.S. dollarexchange rates
$200
Forward
contracts
2 0
The following table details the group’s sensitivity to a 1% weakening of the U.S. dollar against the euro:
Sensitivity analysisA sensitivity analysis on the derivative financial instruments portfolio yields the following results, assuming an instantaneous 1% decline of the U.S. dollar and Japanese
yen against the euro from their levels at December 31, 2019, and an instantaneous 1% increase of the U.S. dollar, Japanese yen, and euro interest rates respectively:

150 151Wolters Kluwer 2019 Annual Report Wolters Kluwer 2019 Annual Report
Table of Contents | Consolidated Financial Statements | Company Financial Statements
The table shows net cash flow amounts for derivative financial instruments that have simultaneous cash settlements.
The table shows net cash flow amounts for derivative financial instruments that have simultaneous cash settlements.
Contractual cash flows 2019
Carrying amount
Contractual undiscounted
cash flows
Less than
1 year
1-2years
2-5years
More than 5 years
Non-derivative financial liabilities (excl. lease liabilities)
Bonds:
Bonds 2008-2028 36 57 2 2 7 46
Bonds 2013-2023 698 780 20 20 740 –
Bonds 2014-2024 398 450 10 10 430 –
Bonds 2017-2027 497 562 8 8 23 523
Private placements:
Private placement 2008-2038 163 264 5 5 16 238
Private placement 2010-2020 250 261 261 – – –
Long-term and short-term deferred and contingent acquisition payables 11 11 10 1 – –
Other debt 25 25 – 7 18 –
Borrowings and bank overdrafts 670 670 670 – – –
Trade payables 169 169 169 – – –
Total 2,917 3,249 1,155 53 1,234 807
Derivative financial instruments
(Receipts) (180) (180) – – –
Payments 178 178 – – –
Foreign exchange derivatives (2) (2) (2) 0 0 0
(Receipts) (264) (5) (5) (16) (238)
Payments 268 8 8 23 229
Cross-currency interest rate swaps (16) 4 3 3 7 (9)
Total (18) 2 1 3 7 (9)
Contractual cash flows 2018
Carrying amount
Contractual undiscounted
cash flows
Less than
1 year
1-2years
2-5years
More than 5 years
Non-derivative financial liabilities (excl. lease liabilities)
Bonds:
Bonds 2008-2028 36 59 2 2 7 48
Bonds 2013-2023 698 800 20 20 760 –
Bonds 2014-2024 397 460 10 10 30 410
Bonds 2017-2027 497 569 8 8 23 530
Private placements:
Private placement 2008-2038 158 262 5 5 16 236
Private placement 2010-2020 249 272 11 261 – –
Long-term and short-term deferred and contingent acquisition payables 14 14 2 5 7 –
Other debt 14 14 0 3 11 –
Borrowings and bank overdrafts 748 748 748 – – –
Trade payables 193 193 193 – – –
Total 3,004 3,391 999 314 854 1,224
Derivative financial instruments
(Receipts) (175) (175) – – –
Payments 174 174 – – –
Foreign exchange derivatives 0 (1) (1) 0 0 0
(Receipts) (262) (5) (5) (16) (236)
Payments 276 8 8 23 237
Cross-currency interest rate swaps (21) 14 3 3 7 1
Total (21) 13 2 3 7 1

152 153Wolters Kluwer 2019 Annual Report Wolters Kluwer 2019 Annual Report
Table of Contents | Consolidated Financial Statements | Company Financial Statements
Fair value of financial instrumentsThe following table shows the carrying amounts and fair values of financial assets and liabilities
(excluding lease liabilities), including their levels in the fair value hierarchy.
2019 2018
Carrying value
Fair value
Level 1
Level 2
Level 3
Carrying value
Fair value
Non-derivative financial instruments:
Financial assets at fair value through profit or loss 0 0 0 0 0
Unbilled revenues* 104 104 81 81
Trade receivables* 1,087 1,087 1,022 1,022
Deferred divestment consideration receivable* – – 13 13
Miscellaneous receivables (current)* 40 40 35 35
Cash and cash equivalents* 899 899 783 783
Total non-derivative financial assets 2,130 2,130 0 1,934 1,934
Bonds 2008-2028 36 54 54 36 53
Bonds 2013-2023 698 764 764 698 769
Bonds 2014-2024 398 439 439 397 434
Bonds 2017-2027 497 539 539 497 507
Private placement 2008-2038 163 227 227 158 219
Private placement 2010-2020 250 260 260 249 267
Long-term and short-term deferred and contingent acquisition payables 11 11 11 14 14
Other debt* 25 25 14 14
Borrowings and bank overdrafts* 670 670 748 748
Trade payables* 169 169 193 193
Total non-derivative financial liabilities 2,917 3,158 1,796 487 11 3,004 3,218
Derivative financial instruments:
Non-current receivable (16) (16) (16) (21) (21)
Current receivable (2) (2) (2) 0 0
Non-current payable – – – – –
Current payable – – – 0 0
Total derivative financial instruments (18) (18) (18) (21) (21)* Fair value approximates the carrying amount.
Credit riskCredit risk represents the loss that would be recognized if a customer or counterparty to a financial instrument fails to meet its contractual obligations and arises principally from the group’s receivables from customers and investments in debt securities. The carrying amount of non-derivative financial assets represents the maximum credit exposure and amounts to €2,130 million (2018: €1,934 million).
Financial instruments and excess cash at financial institutionsThe group is exposed to credit risks due to its use of derivatives and because of excess cash deposited at banks. It is the group’s policy to conclude financial transactions under ISDA (International Swap Dealers Association) master agreements. Cash invested and financial transactions are only concluded with financial institutions with strong credit ratings (at least a credit rating of A-/A3). Furthermore, credit limits per counterparty are in place and are monitored periodically.
At December 31, 2019, there were no material credit risk concentrations outstanding while the average weighted credit rating of counterparties was A+ (2018: A+). The aim is to spread transactions among counterparties. No credit limits were materially exceeded during the reporting period and management does not expect any losses from non-performance by these counterparties on current outstanding contracts.
Trade receivablesThe group has a natural exposure to credit risk in its operational business. This exposure of the group’s operating companies to credit risk is inherently limited, as there is no customer who represents more than 10% of the group’s revenues. A substantial part of the transactions is prepaid by customers. The group’s operating companies actively monitor the solvency of their key accounts and assess creditworthiness of customers before concluding a contract.
The group determines the impairment on trade receivables and contract assets using the lifetime expected credit loss model, whereby the historical credit losses on trade receivables (a credit event) are used as a base for the future expected credit losses. The policy and the assumptions are periodically evaluated by the group using macroeconomic data and historical back-testing of the assumptions.
The trade receivables that are neither past due nor impaired have sound creditworthiness and meet the credit rating grades as defined in the internal policy for assessing the impairment of financial assets.

154 155Wolters Kluwer 2019 Annual Report Wolters Kluwer 2019 Annual Report
Table of Contents | Consolidated Financial Statements | Company Financial Statements
2019 2018
Retirement plans 47 54
Other post-employment benefit plans 61 75
Other long-term employment benefits 14 14
Total 122 143
Note 31 – Employee Benefits
Level 3 financial liabilities comprise deferred and contingent acquisition payables. The group has reassessed the fair value of these payables at year-end 2019 and recognized a €9 million gain (2018: €1 million gain).
Deferred and contingent acquisition payables
Accounting policiesThe contingent considerations are based on a discounted cash flow model, which considers the present value of expected payments, using a risk-adjusted discount rate. The
expected payment is determined by considering possible adjusted operating profit or revenue scenarios, the amount to be paid under each scenario, and the probability of each scenario. The
estimated fair value could potentially increase (or decrease) if annual growth rates and/or adjusted operating profit margins are higher (or lower).
Accounting policiesDefined contribution plansObligations for contributions to defined contribution plans are recognized as personnel expenses in profit or loss in the period during which services are rendered by employees. Prepaid contributions are recognized as an asset to the extent that a cash refund or reduction in future payments is available.
Defined benefit plansThe group’s net obligation in respect of defined employee benefit plans is calculated separately for each plan by estimating the amount of future benefits that employees have earned in the current and prior periods, discounting that amount, and deducting the fair value of any plan assets.
The calculation of defined benefit obligations is performed annually by a qualified actuary using the projected unit credit method. When the calculation results in a potential asset for the group, the recognized asset is limited to the present value of economic benefits available in the form of any future refunds from the plan, or reductions in future contributions to the plan. To calculate the present value of economic benefits, consideration is given to any applicable minimum funding requirements.
All remeasurement gains and losses of the net defined benefit liabilities or assets, which are made up of actuarial gains and losses, return on
plan assets (excluding interest), and the effect of the asset ceiling (if any, excluding interest), are recognized immediately in other comprehensive income, in the period in which they occur.
The group determines the net interest expense or income on the net defined benefit liability or asset for the period by applying the discount rate used to measure the defined benefit obligation at the beginning of the annual period to the net defined benefit liability or asset, considering any changes in the net defined benefit liability or asset during the period resulting from contributions and benefit payments. Net interest expense and other expenses related to defined benefit plans, like fund administration costs, are recognized in profit or loss, when incurred.
When the benefits of a plan are changed or when a plan is curtailed, the resulting change in the defined benefits that relates to past service or the gain or loss on curtailment is recognized directly in profit or loss.The group recognizes gains and losses on the settlement of a defined benefit plan when the settlement occurs. A curtailment occurs when an entity significantly reduces the number of employees covered by a plan. Amendments to the terms of a defined benefit plan will be considered plan amendments and will be fully accounted for as past service costs. If a plan amendment, curtailment or settlement occurs, the current service
cost and the net interest for the period after the remeasurement are determined using the assumptions used for the remeasurement.
Long-term service benefitsThe group’s net obligation in respect of long-term service benefits, such as jubilee benefits, is the amount of future benefits that employees have earned in return for their service in the current and prior periods. The obligation is calculated using the projected unit credit method and is discounted to its present value, with the fair value of any related assets deducted.
Critical estimates and judgmentsThe net plan assets or liabilities of the defined employee benefit plans and the costs related to the pension and post-retirement medical plans are based on actuarial and economic assumptions. The main economic assumptions are:• Discount rate;• Rate of pension increase;• Inflation; and• Medical trend rate.
For actuarial assumptions, the group uses generally accepted mortality rates (longevity risk). The withdrawal rates and retirement rates are based on statistics provided by the relevant entities based on past experiences.
2019 2018
Balance at January 1 14 14
Acquired through business combinations Note 8 6 13
Settlements Note 8 (1) (12)
Fair value changes of contingent considerations Note 12 (9) (1)
Foreign exchange differences and other movements 1 0
Balance at December 31 11 14
Fair value December 31, 2019
Of which: short-term
Of which: long-term
Maximum exposure (undiscounted)
Fair value December 31, 2018
Total 11 10 1 11 14
• Level 3: inputs for the asset or liability that are not based on observable market data. The valuation method can be based on discounted cash flow analysis, or other models that are substantially identical.
There has been no change in the fair value hierarchy compared to 2018.
The Level 3 fair value movements in non-derivative financial liabilities are as follows:
Fair value hierarchyThe fair value has been determined by the group based on market data and appropriate valuation methods/quotes. Valuation methods include:• Level 1: reference to quoted prices (unadjusted) in active
markets for similar assets and liabilities;• Level 2: inputs other than quoted prices that are
observable for the asset or liability and that may have a significant impact on the fair value, either directly (i.e. as prices) or indirectly (i.e. derived from prices) based on discounted cash flow analysis, using data input of observable financial markets and financial institutions; and
The fair value of the deferred and contingent acquisition payables amounts to €11 million (2018: €14 million). A summary of deferred and contingent acquisition
payables at December 31, 2019, can be presented as follows:

156 157Wolters Kluwer 2019 Annual Report Wolters Kluwer 2019 Annual Report
Table of Contents | Consolidated Financial Statements | Company Financial Statements
Characteristics of material plans
The Netherlands United States United Kingdom
Retirement plans
Type of benefits Pensions Pensions Pensions
Type of plan Career average Final salary Final salary
Status of plan Open Frozen Frozen
Service costs Yes No No
Status of plan funding Funded Funded Funded
Other post-employment plans
Type of benefits Post-retirement medical plan
Type of plan Annual insurance premium coverage
Status of plan Open
Service costs Yes
Status of plan funding Unfunded
Provisions for retirement and other post-employment benefit plansThe provisions for retirement and other post-employment plans relate to defined employee benefit plans.The group has arranged pension schemes in various countries for most of its employees in accordance with the legal requirements, customs, and local situation of the countries involved. These retirement schemes are partly managed by the group itself and partly entrusted
to external entities, such as company pension funds and insurance companies. In addition, the group provides certain employees with other benefits upon retirement. These benefits include contributions towards medical health plans in the United States, where the employer refunds part of the insurance premium for retirees, or, in the case of uninsured schemes, bears the medical expenses while deducting the participants’ contributions.
There are open retirement plans for new entrants in the Netherlands and Belgium.
The group has closed plans in Belgium, Canada, and Australia. A closed plan means that no new members can join the pension plans. However, current participants in the plan can still accrue for future service benefits, and therefore the plan incurs service costs for the active participants.
If a plan is frozen, the plan is closed to new entrants and existing participants do not build up future service benefit accruals. The group has frozen plans in the United States, the United Kingdom, and Canada. These plans will have a service cost of zero.
Retirement plansThe group has its largest defined benefit retirement plan in the Netherlands with defined benefit obligations of
€1.2 billion as of December 31, 2019, followed by the United Kingdom and the United States with defined benefit obligations of €120 million and €104 million respectively. There are also retirement plans in Belgium, Canada, and Australia. All plans are funded schemes. The defined benefit plans in the Netherlands, United States, and United Kingdom are insured with the company’s self-administrated pension funds, which are separate legal entities with plan assets being held independently of the group.
The NetherlandsIn the Netherlands, the scheme is a career average salary scheme; members accrue a portion of their current salary at a rate calculated to enable them to reach a pension level based on their average salary. The Dutch pension plan falls under the supervision of the Dutch Central Bank (‘DNB’). The scheme funding level is determined by the new Financial Assessment Framework (‘nFTK’), whereby
funding liabilities are determined based on a 120-month moving average of the 20-year forward rate. Benefit reductions, if necessary, will be smoothed over time when recovery to full funding within eight years is not expected. Reductions will amount to one-eighth of the deficit at the measurement date. Indexation of pension entitlements will not be allowed at funding ratios below 110%, while full indexation will be allowed only at funding ratios higher than approximately 125% (these are year- and plan-specific).
The Dutch pension scheme has an unaudited 12-month rolling average coverage ratio - as determined under the nFTK - of 108.0% at December 31, 2019 (2018: 112.9%). If the nFTK funding ratio is below 104%, a rolling eight-year recovery plan should be submitted to DNB, on an annual basis. The pension contributions are based on contributions by the employer (two-thirds) and employees (one-third). The total annual pension contribution is currently determined at 24% of base salary. The pension base is capped but will be corrected for inflation annually.
United StatesThe U.S. retirement scheme has an annual statutory valuation which forms the basis for establishing the employer contribution each year (subject to ERISA and IRS minimums). The U.S. scheme was a final average pay plan, based on years of credited service, but is now a frozen plan. The pay and benefit accruals are frozen. The service costs are zero. The plan fiduciaries of the U.S. scheme are required by law to act in the interest of the fund's beneficiaries. The fiduciary duties for the scheme are allocated between committees which are staffed by senior employees of the group; the investment committee has the primary responsibility for the investment and management of plan assets.
United KingdomThe U.K. retirement scheme is a final salary-based scheme, but it is a frozen plan. The trustees of the pension fund are required by law to act in the interest of the fund's beneficiaries and are responsible for the investment policy regarding the assets of the fund. The board of trustees consists of an equal number of company-appointed and member-nominated directors. The level of funding is determined by statutory triennial actuarial valuations in accordance with pension legislation. Where the scheme falls below 100% funded status, the group and the scheme trustees must agree on how the deficit is to be remedied. Pension rate increase is usually a fixed promise and is built into the funding requirement. The U.K. Pensions Regulator has significant
powers and sets out in codes and guidance the parameters for scheme funding. At December 31, 2019, the future deficit contribution commitments are larger than the surplus in the U.K. plan and therefore there is an additional balance sheet liability recognized in respect of these contributions.
Other post-employment plansOther post-employment plans exist in the United States, Canada, and Italy. These plans have no plan assets and are unfunded. The main plan is the post-employment medical plan in the United States The group funds the U.S. post-employment medical plan obligations on a pay-as-you-go basis. If healthcare costs in the future increase more than anticipated, the actuarially determined liability, and as a result the related other post-employment benefit plan expense, could increase along with future cash outflows.
Funding requirementsFunding requirements of the plans are based on local legislation and separate actuarial valuations for which the assumptions differ from the assumptions used under IAS 19. The funding requirements are based on each pension fund’s actuarial measurement framework set out in the funding policies of the individual plans.
In the Netherlands, there is no formal requirement to fund deficits of the plan by the employer.
In the United States, there are minimum contribution requirements. In case the statutory funded status falls below certain thresholds, the U.S. Pensions Protection Act requires the deficit to be rectified with additional minimum employer contributions, spread over a seven-year period, to avoid restrictions on the ability to pay some accelerated benefit forms, such as lump sums. These funding levels are reassessed annually.
The trustees of the U.K. plan are required to act in the best interest of the plan’s participants. The group and the trustees finalized the latest triennial valuation in 2017 for funding purposes in 2018. The parties agreed to have a continuation of the funding of £1.4 million per annum for the years 2019 up to and including 2021. The U.K. Pensions Regulator has the power to demand more funding and support where a pension scheme has been exposed to an unacceptable level of risk. As part of the 2017 actuarial funding valuation, the parent company issued a guarantee of £18 million, with a negative pledge issued by a Wolters Kluwer U.K. group company. In addition, it has been agreed to continue with any annual deficit contributions. The funding will be reassessed based on a new triennial valuation to be finalized in 2021.

158 159Wolters Kluwer 2019 Annual Report Wolters Kluwer 2019 Annual Report
Table of Contents | Consolidated Financial Statements | Company Financial Statements
Risk management of main plans in the groupThe retirement and other post-employment plans expose the group to actuarial risks, such as longevity risks, interest rate risks, investment and market risks, and currency risks.
The group has restructured employee benefit plans in the past by moving existing and newly hired employees to defined contribution plans or by freezing the plans (either with no future service benefit accruals and/or no new participants entering the plan). These redesigns reduce or cancel future benefit accruals in the plans and consequently reduce the pace of liability growth. The group also reviews periodically its financing and investments policies (liability-driven investments) and its liability management (lump sum offerings).
The various plans manage their balance sheet to meet their pension promise. By using asset liability management (ALM) studies, major risk sources are identified, and the impact of decisions is assessed by quantifying the potential impact on elements like future pensions, contributions, and funded ratio. These ALM studies also determine risk and return measures that
consider the interests of all stakeholders. The outcome of these studies results in a risk-return trade-off, taking the duration of pension liabilities into account, which will be an integral part of the investment strategy. The investment strategy covers the allocation of asset classes and hedging strategies, and also decisions on new and alternative asset classes, passive versus active investments, leverage, and the use of derivatives.
Actuarial assumptions for retirement and other post-employment benefit plansThe discount rate is the yield rate at the end of the reporting period on high-quality corporate bonds that have maturity dates approximating the terms of the group’s obligations and that are denominated in the same currency in which the benefits are expected to be paid. The calculation is performed annually by qualified actuaries.
The following weighted average principal actuarial assumptions were used to determine the pension expense and other post-employment plans’ expense for the year under review, and defined benefit obligations at the end of the reporting period:
For most of the retirement and other post-employment schemes, the discount rate is determined or validated using the ‘Towers Watson Rate: Link methodology’, which uses mid-price AA corporate bond data from Bloomberg. Bonds with options are excluded, as are bonds whose yields are among the top and bottom 10% within each maturity category (outliers). The 30-year spot rate is assumed constant beyond 30 years. For the U.S. plans the discount rate is based on the yield curve/cash flow matching approach which uses spot yields from the standard FTSE and the timing of the cash flows of the plan.
Mortality assumptions for the most important plans are based on the following retirement mortality tables:• The Netherlands: AG projection table 2018, including
fund specific 2019 experience loading (2018: AG projection table 2018, including fund specific 2016 experience loading);
• U.S.: Pri-2012 Mortality Table with MP 2019 projections, being the current standard mortality table (2018: RP-2006 Mortality Table with MP 2018 projections); and
• U.K.: SAPS S2 (Year of Birth) CMI 2017 projections with 1.5% long-term improvement rate (2018: SAPS S2 (Year of Birth) - CMI 2017 projections with 1.5% long-term improvement rate.
Assumptions regarding future mortality experience are set based on actuarial advice and best estimate mortality tables in the applicable countries.
The current life expectancies underlying the value of the defined benefit retirement obligations at December 31, 2019, are as follows:
in years The Netherlands United States United Kingdom
Life expectancy at age of 65 now – Male 21.9 20.6 22.2
Life expectancy at age of 65 now – Female 24.2 22.6 24.1
Life expectancy aged 65 in 20 years – Male 24.0 22.9 23.9
Life expectancy aged 65 in 20 years – Female 26.3 25.3 26.0in % 2019 2018
Retirement plans
Discount rate to discount the obligations at year-end 1.3 2.1
Discount rate of pension expense 2.1 2.1
Expected rate of pension increases (in payment) at year-end 1.3 1.2
Expected rate of pension increases (in deferral) at year-end 1.3 1.1
Expected rate of inflation increase for pension expense 1.9 1.8
Other post-employment benefit plans
Discount rate to discount the obligations at year-end 2.4 3.7
Discount rate for pension expense 3.7 3.1
Medical cost trend rate 3.0 3.0
Given the nature of the defined benefit obligations in Belgium, Italy, and Australia, with lump sum benefit payments at retirement date instead of annuity payments, the impact of changing life expectancy after the retirement age on the plan liabilities is limited in these countries.
Sensitivity of actuarial assumptionsThe sensitivity for a 1% change in the discount rate, a 0.5% change in inflation, and a 0.5% change in the pension increase rate is as follows for the retirement plans:
Gross service cost represents the annual accrual of liability due to another year of service, excluding any interest or offsetting employee contributions, and
therefore differs from the current service cost included in the calculation of the pension expense.
Sensitivity retirement plans
in millions of euros Gross service cost Defined benefit obligations
2019 Baseline 19 1,565
Change compared to baselineDecrease of assumption
Increase of assumption
Decrease of assumption
Increase of assumption
Discount rate (change by 1%) +7 (5) +328 (251)
Pension increase rate (change by 0.5%) (2) +3 (115) +131
Inflation increase rate (change by 0.5%) (2) +2 (82) +90
Mortality table (change by one year) n/a +1 n/a +64

160 161Wolters Kluwer 2019 Annual Report Wolters Kluwer 2019 Annual Report
Table of Contents | Consolidated Financial Statements | Company Financial Statements
Sensitivity of the defined benefit obligations (DBO) of retirement plans in the statement of financial position and the defined benefit expense of the retirement plans in the statement of profit or loss (P&L)
The Netherlands United States United Kingdom
DBO P&L DBO P&L DBO P&L
Discount rate sensitivity P P P n/a P n/a
Pension increase sensitivity P P n/a n/a P n/a
Inflation rate sensitivity P P n/a n/a P n/a
Mortality sensitivity P P P n/a P n/a
Sensitivity of other post-employment plans
in millions of euros Gross service costs Defined benefit obligations
2019 Baseline 1 61
Change compared to baseline
Discount rate (by -1%) 0 +7
Discount rate (by +1%) 0 (6)
Pension rate increases are only applicable for the plans in the Netherlands and the United Kingdom. Pension increases in the Netherlands are related to price inflation. However, these increases are conditional and depend on the funding position of the Dutch pension fund. Pension increases are therefore capped. The pension increase assumption is based on the liability ceiling approach and determined as the rate of increase such that the present value of vested benefits, including the assumed rate of
pension increases, is not greater than the fair value of plan assets. For 2019, this resulted in a Dutch pension increase assumption of 1.19% compared to 1.03% at year-end 2018.
Since the retirement plans in the United States and the United Kingdom are frozen, the service cost is zero and not sensitive for changes in discount rate, pension increases, inflation, and longevity.
The actual medical cost trend rate in the United States exceeds the applied medical cost trend rate for its main medical plan which is capped at 3% (2018: 3%) according to the plan rules. The main U.S. medical plan is therefore not sensitive to medical cost increases. Employees over
the age of 65, who retired after 1992, are not subject to a cap, but instead receive an annual Health Reimbursement arrangement subsidy based on years of service at retirement.
Plan liabilities and assets
Defined benefit retirement plans
Other post- employment plans
2019 2018 2019 2018
Plan liabilities
Fair value at January 1 1,415 1,482 75 78
Settlements (34) – – –
Employer service cost 13 14 3 4
Interest expense on defined benefit obligations 29 30 3 2
Administration costs and taxes 2 1 – –
Benefits paid by fund (52) (56) – –
Benefits paid by employer – – (3) (4)
Remeasurement (gains)/losses 179 (65) (2) (8)
Acquired through business combinations – – – 0
Contributions by plan participants 3 3 – –
Plan amendments and curtailments – 2 (16) –
Foreign exchange differences 10 4 1 3
Fair value at December 31 1,565 1,415 61 75
Plan assets
Fair value at January 1 1,373 1,433 0 0
Settlements (33) – – –
Interest income on plan assets 28 29 – –
Return on plan assets greater/(less) than discount rate 188 (60) – –
Benefits paid by fund (52) (56) (3) (4)
Contributions by employer 16 21 3 4
Contributions by plan participants 3 3 – –
Foreign exchange differences 10 3 – –
Fair value at December 31 1,533 1,373 0 0
Funded status
Deficit/(surplus) at December 31 32 42 61 75
Irrecoverable surplus 16 12 – –
Transfer to liabilities classified as held for sale Note 9 (1) – – –
Net liability at December 31 47 54 61 75
Pension expenses
Employer service cost 13 14 3 4
Settlement gain (1) – – –
Plan amendments and curtailments – 2 (16) –
Interest expense on irrecoverable surplus 0 0 – –
Interest expense on defined benefit obligations 29 30 3 2
Interest income on plan assets (28) (29) – –
Administration costs and taxes 2 1 – –
Total pension expenses 15 18 (10) 6
Of which included in:
Personnel expenses Note 13 14 17 (13) 4
Other finance (income)/costs Note 15 1 1 3 2

162 163Wolters Kluwer 2019 Annual Report Wolters Kluwer 2019 Annual Report
Table of Contents | Consolidated Financial Statements | Company Financial Statements
number of years 2019 2018
Retirement plans
The Netherlands 18.8 18.2
United Kingdom 17.2 16.8
United States 12.2 10.9
Other post-employment plans
United States 9.7 11.5
Duration is an indicator of the plan liabilities’ sensitivity for changes in interest rates.
Investment mixThe breakdown of plan assets as of December 31 is as follows:
2019 Quoted Unquoted 2018 Quoted Unquoted
Equity
Equity 405 405 – 326 326 –
Private equity 4 – 4 6 – 6
Bonds
Government bonds 486 486 – 450 450 –
Corporate bonds 414 413 1 419 419 –
Other
Insurance contracts 71 – 71 62 – 62
Real estate 95 47 48 93 46 47
Derivatives and other 33 33 – 10 9 1
Cash 25 25 – 7 7 –
Total 1,533 1,409 124 1,373 1,257 116
Remeasurements
2019 2018
Position at January 1 (162) (174)
Recognized in other comprehensive income 8 12
Cumulative amount at December 31 (154) (162)
Remeasurement gains/(losses) for the year
2019 2018
Remeasurement gains/(losses) due to experience adjustments 6 22
Remeasurement gains/(losses) due to changes in demographic assumptions 47 13
Remeasurement gains/(losses) due to changes in financial assumptions (230) 38
Remeasurement gains/(losses) on defined benefit obligations (177) 73
Return on plan asset greater/(less) than discount rate 188 (60)
Change in irrecoverable surplus, other than interest and foreign exchange differences (3) (1)
Recognized gains/(losses) in other comprehensive income 8 12
In 2019, there was a retiree pension annuity lift-out performed on the U.S. pension plan, for the small in-payment pensions in the plan, affecting approximately 1,000 members. The net impact of the annuity lift-out has been recognized as a settlement gain (€1 million) in the statement of profit or loss.
In 2019, the U.S. post-employment medical plan has been closed for future accrual and closed for new entrants from December 31, 2019. This curtailment of benefits has been recognized in the statement of profit or loss as a past service costs gain of €16 million. A small service cost will continue to be recognized in the statement of profit or loss, from 2020 and onwards for members with grandfathered benefits.
In 2018, there was a plan amendment of €1.5 million in the U.K. pension fund following a High Court Decision relating to equalization of member benefits for the gender effects of Guaranteed Minimum Pensions (“GMP equalization”).
The group’s employer contributions to be paid to the defined benefit retirement plans in 2020 are estimated at €17 million (2019: actual employer contributions of €16 million; 2018: €21 million). In 2018, the U.S. pension fund received an additional contribution by the employer for an amount of €5 million.
In 2019, there was an asset ceiling of €13 million (2018: €8 million) in the U.K. pension plan; the surplus is not recognized as a pension asset as there is no unconditional right to a refund of this surplus from the U.K. scheme. In addition, the U.K. pension fund has a liability in respect of minimum funding requirements of €4 million (2018: €5 million).
RemeasurementsThe pre-tax cumulative amount of remeasurement gains/losses recognized in the statement of comprehensive income is as follows:
At December 31, 2019, 92% of the plan assets relate to quoted financial instruments (2018: 92%). Plan assets do not include any direct investments in the group or financial instruments issued by the group, nor do they
include any property or other assets used by the group. However, pension plans invest in index funds and as a result these plans may indirectly hold financial instruments issued by the group.
Proportion of plan assets
in % 2019 2018
Equity 27 24
Bonds 59 63
Other 14 13
Total 100 100
Experience adjustments result from changes, such as changes in plan populations, data corrections, and differences in cash flows.
Changes in demographic assumptions relate to differences between the current and previous actuarial assumptions in mortality tables, rate of employee turnover, disability, and early retirement.
Changes in financial assumptions relate to differences between the current and previous actuarial assumptions,
such as discount rate, pension rate increase, price increases, and future salary and benefit levels.
In 2019, there were remeasurement losses mainly due to financial assumption losses following the decrease in discount rates compared to prior year. In 2018, there were remeasurement gains mainly due to positive demographic assumption changes, experience changes in the Netherlands, and relatively higher discount rates compared to 2017.
The actual return on plan assets for the year ended December 31, 2019, was a gain of €216 million (2018: loss of €31 million). The actual returns on plan assets were higher in 2019 compared to 2018, mainly due to higher returns on bonds and to a lesser extent shares, and are in line with market returns.
DurationThe liability-weighted duration for the defined benefit plan liabilities at year-end is as follows:

164 165Wolters Kluwer 2019 Annual Report Wolters Kluwer 2019 Annual Report
Table of Contents | Consolidated Financial Statements | Company Financial Statements
Movements in provisions
Restructuring provisions
Legal provisions
Other provisions
2019 2018*
Position at January 1 0 8 3 11 3
Add: short-term provisions 20 1 0 21 41
Total at January 1 20 9 3 32 44
Movements
Acquired through business combinations Note 8 – – – 0 1
Additions for restructuring of stranded costs Note 8 0 – – 0 1
Additions to acquisition integration Note 12 0 – – 0 0
Other additions 16 2 2 20 26
Total additions 16 2 2 20 28
Appropriation of provisions (19) (1) 0 (20) (22)
Release of provisions (3) (1) 0 (4) (19)
Exchange differences and other movements 0 0 1 1 1
Total movements (6) 0 3 (3) (12)
Total at December 31 14 9 6 29 32
Less: short-term provisions (14) (8) (2) (24) (21)
Position at December 31 0 1 4 5 11
* Restated for certain reclassifications. See Note 1 – General and Basis of Preparation.
Other additions to the restructuring provision of €16 million mainly relate to restructuring programs announced in Legal & Regulatory and Health. Most of the provisions will be settled within the next 12 months (€24 million). The remaining long-term part of the provisions (€5 million) is expected to be settled in 2021 and beyond.
Note 32 – Provisions
2019 2018*
Provision for restructuring commitments 13 20
Provision for acquisition integration 1 0
Subtotal restructuring provisions 14 20
Legal provisions 9 9
Other provisions 6 3
Total 29 32
Of which short-term 24 21
* Restated for certain reclassifications. See Note 1 – General and Basis of Preparation.
Accounting policiesA provision is recognized when: (1) the group has a present legal or constructive obligation because of a past event; (2) it is probable that an outflow of resources in the form of economic benefits will be required to settle the obligation; and (3) the amount of the obligation can be reliably estimated.
Restructuring provisionThe provisions for restructuring include liabilities arising from changes in the organizational structure, integration of activities, expected redundancy payments, and onerous contracts. A provision for restructuring is recognized only when the general recognition criteria are met. Redundancy payments are recognized as an expense when the group is demonstrably committed – without realistic possibility of withdrawal – to a formal detailed plan to either terminate employment before the normal retirement date, or to provide termination benefits as result of an offer made to encourage voluntary redundancy.
Acquisition integration provisionThe acquisition integration provision relates to non-recurring expenses to be incurred for the integration of activities acquired through business combinations, and mainly consists of expected redundancy payments, IT migration costs, and onerous contracts.
Legal provisionsFor legal and judicial proceedings against the company and its operating entities, a legal provision is recognized only if an adverse outcome is probable and the amount of the loss can be reliably estimated. If one of these conditions is not met, the proceeding or claim is disclosed as a contingent liability, if material.
Other provisionsOther provisions primarily include provisions for dilapidation commitments on real estate and onerous contracts.
Critical estimates and judgmentsThe group is involved in legal and judicial proceedings in the ordinary course of business. Provisions and contingencies relating to these matters are periodically assessed based on the latest information available, usually after consultation and with the assistance of lawyers and other specialists.
The actual outcome of a proceeding or claim may differ from the estimated liability and consequently may affect the actual result. The prediction of the outcome and the assessment of a possible loss by management are based on management’s judgments and estimates.
Refer to Note 37 – Commitments, Contingent Assets, and Contingent Liabilities.

166 167Wolters Kluwer 2019 Annual Report Wolters Kluwer 2019 Annual Report
Table of Contents | Consolidated Financial Statements | Company Financial Statements
Note 33 – Capital and Reserves
Share capital and number of sharesThe authorized capital amounts to €143.04 million, consisting of €71.52 million in ordinary shares (596 million of ordinary shares with a nominal value of €0.12 per ordinary share) and €71.52 million in preference shares (596 million of preference shares with a nominal value of €0.12 per preference share).
Ordinary sharesThe issued share capital consists of ordinary shares. On September 27, 2019, Wolters Kluwer completed the reduction in ordinary share capital approved by shareholders at the Annual General Meeting of Shareholders held on April 18, 2019. In 2019, the company cancelled 6,700,707 ordinary shares previously held as treasury shares (2018: 10,600,000 ordinary shares were cancelled). Therefore, in 2019, the total number of issued ordinary shares is reduced to 273,016,153, with a nominal value of €33 million (2018: 279,716,860 shares, with a nominal value of €34 million).
Shares repurchased by the company are added to and held as treasury shares. Part of these treasury shares is retained and used to meet future obligations under
share-based incentive schemes. At December 31, 2019, share buybacks have not yet been executed for an amount of €50 million under the existing mandate.
Incremental costs directly attributable to the issue of ordinary shares are recognized as a deduction from equity, net of any tax effects.
Preference sharesPreference share capital is classified as equity if it is non-redeemable, or redeemable only at the company’s option, and any dividends are discretionary. There are no preference shares issued.
Repurchase and reissue of share capital (treasury shares) When share capital recognized as equity is repurchased (treasury shares), the amount of the consideration paid, including directly attributable costs, is recognized as a change in equity.
For a reconciliation of the weighted-average number of shares and earnings per share, see Note 7 – Earnings per Share.
Number of shares
in thousands of shares, unless otherwise stated
Number of ordinary shares
Minus: number of treasury shares
Total number of ordinary shares outstanding
2019 2018 2019 2018 2019 2018
At January 1 279,717 290,317 (8,553) (8,956) 271,164 281,361
Cancellation of shares (6,701) (10,600) 6,701 10,600 0 0
Repurchased shares – – (5,487) (11,503) (5,487) (11,503)
Long-Term Incentive Plan – – 978 1,306 978 1,306
At December 31 273,016 279,717 (6,361) (8,553) 266,655 271,164
Issued share capital at €0.12 (€‘000) 32,762 33,566
Proposed dividend per share (€) 1.18 0.98
Proposed dividend distribution (€‘000) 314,653 265,740
Treasury sharesTreasury shares are recorded at cost, representing the market price on the acquisition date. This reserve is not available for distribution. Treasury shares are deducted from retained earnings. The company will offset the dilution of its performance share issuance annually via share repurchases.
In 2019, the company executed a share buyback of €350 million (2018: €550 million). The company repurchased 5.5 million (2018: 11.5 million) of ordinary shares under this program at an average stock price of €63.80 (2018: €47.81). In 2019, the company used 1.0 million shares held in treasury for the vesting of the LTIP grant 2016-18.
Legal reserve participationsLegal reserve participations contain appropriations of profits of group companies, which are allocated to a legal reserve based on statutory and/or legal requirements. This includes reserves carried in respect of amounts capitalized for development cost. The legal reserve is not available for distribution.
Hedge reserveHedge reserve relates to the effective portion of the changes in fair value of the hedging instruments used for cash flow hedging and net investment hedging purposes. The hedge reserve is a legal reserve and not available for distribution.
Translation reserveTranslation reserve contains foreign exchange differences arising from the translation of the net investments in foreign operations. When a foreign operation is sold, accumulated exchange differences that were recorded in equity prior to the sale are reclassified from equity to profit or loss as part of the gain or loss on divestment. The translation reserve is a legal reserve and is not available for distribution.
DividendsDividends are recognized as a liability upon being declared. Pursuant to Article 29 of the Articles of Association, and with the approval of the Supervisory Board, a proposal will be submitted to the Annual General Meeting of Shareholders to make a total distribution of €1.18 per share over financial year 2019 (dividend over financial year 2018: €0.98 per share).
The group applies a semi-annual dividend frequency. On February 20, 2019, the Supervisory Board and Executive Board of Wolters Kluwer resolved to distribute an interim dividend of €0.39 per share, equal to 40% of prior year’s dividend (2018 interim dividend: 40% of prior year's dividend). The interim dividend was paid on September 19, 2019. Subject to the approval of the Annual General Meeting of Shareholders, a final dividend of €0.79 per ordinary share will be paid in cash on May 20, 2020.
The company has a progressive dividend policy under which the company expects to increase the total dividend per share each year.
Free distributable reservesThe share premium reserve, retained earnings, and undistributed profit for the year are available for dividend distribution.
Option preference sharesThe company has granted an option to purchase preference shares to the Wolters Kluwer Preference Shares Foundation (Stichting Preferente Aandelen Wolters Kluwer). The dividend on these shares would equal a normal market rate of return, based on a weighted average interest rate applied by the European Central Bank. Therefore, the fair value of the option is deemed to be zero.
Shareholder’s equity movement scheduleFor the equity movement schedule, refer to Note 48 - Shareholders’ Equity.

168 169Wolters Kluwer 2019 Annual Report Wolters Kluwer 2019 Annual Report
Table of Contents | Consolidated Financial Statements | Company Financial Statements
Key assumptions to the TSR shares
LTIP 2019-21 LTIP 2018-20
Share price at grant date (in €) 51.66 43.48
Expected volatility 18% 20%
Expected life 3 years 3 years
Annual dividend increase 12.5% 5.6%
Risk-free interest rate (yield on three-year Dutch government bonds) 0.0% 0.0%
in euro Fair value EPS shares
at grant date
Fair value TSR shares
at grant date
LTIP 2019-21 48.18 35.12
LTIP 2018-20 40.72 30.00
LTIP 2017-19 31.90 23.42
Note 34 – Share-based Payments
Long-Term Incentive PlanGeneralFor the Executive Board, the LTIP awards depend partially on the TSR performance (50% of the value of the conditionally awarded rights on shares) and partially on the EPS performance (50% of the value of the conditionally awarded rights on shares).
For senior management, the LTIP awards depend partially on the TSR performance (50% of the conditionally awarded rights on shares) and partially on the EPS performance (50% of the conditionally awarded rights on shares).
The TSR-related LTIP awards for the Executive Board and senior management are based on the same payout schedules.
In 2019, €25 million has been recognized within personnel expenses in profit or loss (2018: €22 million) related to the total cost of the LTIP grants for 2017-19, 2018-20, and 2019-21, see Note 13 – Personnel Expenses.
Conditionally awarded TSR-related LTIP sharesFor the conditional TSR awards that were awarded up to and including 2019, the payout of shares after three years fully depends on the group’s TSR relative to a pre-defined group of 15 peer companies. Vesting of these conditional grants is subject to the condition that the participant stays with the group until the plan’s maturity. The performance
period of the LTIP is three years, at the beginning of which a base number of shares (norm payout) is conditionally awarded to each beneficiary.
The expense of the TSR-related LTIP is recognized ratably in profit or loss over the performance period. Actual awards at the end of the performance period will range from 0% to 150% of the norm payout.
There will be no payout for the Executive Board and senior management if the group ends below the eighth position in the TSR ranking, while other payouts will be made as follows: 150% for first or second position, 125% for third or fourth position, 100% for fifth or sixth position, and 75% for seventh or eighth position.
Conditionally awarded EPS-related LTIP sharesThe amount recognized as an expense in a year is adjusted to reflect the number of share awards for which the related service and non-market performance conditions are expected to be met, such that the amount ultimately recognized as an expense is based on the number of awards that meet the related service and non-market conditions at the vesting date. For the EPS-related shares, there will be no payout if the performance over three years is less than 50% of the target. In case of overachievement of the target, the Executive Board members and senior management can earn up to a maximum of 150% of the conditionally awarded shares.
Fair value summary of conditionally awarded LTIP sharesThe fair value of each conditionally awarded share under the running LTIP grants for the Executive Board and senior
management of the group, as determined by an external consulting firm, is as follows:
The fair values of the conditionally awarded shares under the LTIP 2019-21 grants increased compared to the previous year, mainly because of the higher share price of Wolters Kluwer at January 1, 2019, compared to January 1, 2018.
LTIP 2016-18The LTIP 2016-18 vested on December 31, 2018. Total Shareholder Return (TSR) ranked third relative to the peer group of 15 companies, resulting in a payout of 125% of the
conditional base number of shares awarded to the Executive Board and senior management. The EPS-related shares resulted in a payout of 150%.
A total of 977,590 shares were released on February 21, 2019. At that date, the volume-weighted average price of Wolters Kluwer N.V. was €57.40.
Accounting policiesThe Long-Term Incentive Plan (LTIP) qualifies as an equity-settled share-based payments transaction. Executive Board members and senior management are awarded shares under the LTIP with performance conditions based on Diluted Earnings per Share (EPS) at constant currencies and Total Shareholder Return (TSR).
The fair value of shares awarded is recognized as an expense with a corresponding increase in equity. The fair value is measured at the grant date and spread over the period during which the employees become unconditionally entitled to the
shares. The amount recognized as an expense is adjusted for the actual forfeitures due to participants’ resignations before the vesting date.
TSR conditionThe fair value of the shares based on the TSR performance condition, a market condition under IFRS 2, is measured using a Monte Carlo simulation model, considering the terms and conditions upon which the shares were awarded.
EPS conditionThe fair value of the shares based on the non-market performance condition of EPS is equal to the
opening share price of the Wolters Kluwer shares of the year of the grant, adjusted by the present value of the future dividend payments during the three-year performance period.
The amount recognized as an expense in each year is adjusted to reflect the number of share awards for which the related service and non-market performance conditions are expected to be met, such that the amount ultimately recognized as an expense is based on the number of awards that meet the related service and non-market conditions at the vesting date.
LTIP 2016-2018: number of shares vested and the cash equivalent thereof
number of shares unless otherwise stated
Outstandingat December 31,
2018
Increase inconditional
number of TSR shares (25%)
Increase inconditional
number of EPS shares (50%)
Payout/vested sharesDecember 31,
2018
Cash valuevested shares *
Executive Board 195,246 28,253 41,118 264,617 15,188
Senior management 518,488 64,828 129,657 712,973 40,925
Total 713,734 93,081 170,775 977,590 56,113
* Cash value in thousands of euros; calculated as the number of shares vested multiplied by the volume weighted average price on February 21, 2019.

170 171Wolters Kluwer 2019 Annual Report Wolters Kluwer 2019 Annual Report
Table of Contents | Consolidated Financial Statements | Company Financial Statements
LTIP 2017-19The LTIP 2017-19 vested on December 31, 2019. On Total Shareholder Return (TSR), Wolters Kluwer ranked third relative to its peer group of 15 companies, resulting in a payout of 125% of the conditional base number of shares awarded to the Executive Board and senior management. The EPS-related shares resulted in a payout of 150%.
The shares will be released on February 27, 2020. The volume weighted average price for the shares released will be based on the average exchange prices traded on the Euronext Amsterdam N.V. on February 27, 2020, the first day following the company’s publication of its annual results.
Number of performance shares outstanding, corrected for the actual performance of the respective LTIP grants LTIP 2017-19
number of shares Total EPS-condition TSR-condition
Total grant 760,967 366,742 394,225
Forfeited in previous years (74,726) (37,363) (37,363)
Shares outstanding at January 1, 2019 686,241 329,379 356,862
Forfeited during the year (26,840) (13,420) (13,420)
Effect of 150% vesting based on EPS ranking 158,030 158,030 –
Effect of 125% vesting based on TSR ranking 85,878 – 85,878
Vested at December 31, 2019 903,309 473,989 429,320
LTIP 2018-20
base number of shares at 100% payout Total EPS-condition TSR-condition
Conditionally awarded grant 2018 611,122 294,775 316,347
Forfeited in previous years (8,754) (4,377) (4,377)
Shares outstanding at January 1, 2019 602,368 290,398 311,970
Forfeited during the year (23,497) (11,748) (11,749)
Shares outstanding at December 31, 2019 578,871 278,650 300,221
LTIP 2019-21
base number of shares at 100% payout Total EPS-condition TSR-condition
Conditionally awarded grant 2019 563,283 272,172 291,111
Forfeited during the year (2,094) (1,047) (1,047)
Shares outstanding at December 31, 2019 561,189 271,125 290,064
Overview of outstanding performance shares: LTIP 2019-21 and LTIP 2018-20
base number of shares at 100% payout LTIP 2019-21 LTIP 2018-20 Total
Conditionally awarded grant 2018 611,122 611,122
Forfeited in previous years (8,754) (8,754)
Shares outstanding at January 1, 2019 602,368 602,368
Conditionally awarded grant 2019 563,283 563,283
Forfeited during the year (2,094) (23,497) (25,591)
Shares outstanding at December 31, 2019 561,189 578,871 1,140,060
Note 36 – Audit Fees
With reference to Section 2:382a (1) and (2) of the Dutch Civil Code, the following fees for the financial year have been charged by Deloitte Accountants B.V. to the company, its subsidiaries, and other consolidated entities. Deloitte
is not involved in most of the statutory audits of operating companies that are outside the scope of the group audit.
Audit fees 2019
in millions of euros Deloitte Accountants B.V. Other Deloitte member firms and affiliates
Total Deloitte
Statutory audit of annual accounts 0.8 2.3 3.1
Other assurance services 0.0 0.0 0.0
Tax advisory services – 0.0 0.0
Other non-audit services – 0.1 0.1
Total 0.8 2.4 3.2
Audit fees 2018
in millions of euros Deloitte Accountants B.V. Other Deloitte member firms and affiliates
Total Deloitte
Statutory audit of annual accounts 0.8 2.1 2.9
Other assurance services 0.0 0.0 0.0
Tax advisory services – 0.1 0.1
Other non-audit services – 0.1 0.1
Total 0.8 2.3 3.1
The audit fees for 2019 and 2018 include final invoicing with respect to the statutory audits of 2018 and 2017, respectively.
The company has a related party relationship with its subsidiaries, equity-accounted investees, the pension funds, and members of the Supervisory Board and the Executive Board.
Wolters Kluwer N.V. has filed a list of the subsidiaries at the Dutch Commercial Register in The Hague, the Netherlands. Related party transactions are conducted at arm’s length, with terms comparable to transactions with third parties.
For transactions with key management, refer to Note 38 – Remuneration of the Executive Board and Supervisory Board and the Remuneration Report.
The group has no significant transactions or outstanding balances with its equity-accounted investees other than its equity-interest holdings.
Note 35 – Related Party Transactions

172 173Wolters Kluwer 2019 Annual Report Wolters Kluwer 2019 Annual Report
Table of Contents | Consolidated Financial Statements | Company Financial Statements
Note 37 – Commitments, Contingent Assets, and Contingent Liabilities
GuaranteesThe group has the following outstanding guarantees at December 31:
2019 2018
Bank credit facilities 199 196
Parental performance guarantees to third parties 13 13
Guarantee to the trustees of the U.K. retirement plan Note 31 21 20
Other guarantees (mainly real estate) 20 19
Royalty guarantees to health societies 4 2
Total 257 250
in thousands of euros 2019 2018
Fixed compensation:
Salary 2,047 1,928
Social security 44 109
Contribution defined contribution plan 96 80
Other benefits 459 534
Total fixed compensation 2,646 2,651
Variable compensation:
STIP 2,367 2,434
LTIP1 6,100 6,005
Total variable compensation 8,467 8,439
Subtotal fixed and variable compensation 11,113 11,090
Tax related costs2 1,565 (2,398)
Total remuneration Executive Board 12,678 8,692
Of the guarantees issued for bank credit facilities on behalf of several subsidiaries, €2 million have been utilized (2018: €2 million).
Contingent assetsThe group submitted a claim to its insurance company with respect to business losses incurred during the remediation of the network and service interruption in May 2019. It is not practically possible to estimate the financial effect.
Legal and judicial proceedings The group is involved in legal and judicial proceedings in the ordinary course of business. Provisions and contingencies relating to these matters are periodically assessed based upon the latest information available, usually with the assistance of lawyers and other specialists. While it is not practically possible to estimate the success-rate of claims against the group, the group has a policy to insure the operating units against such claims.
Shares owned by Executive Board membersAt December 31, 2019, the Executive Board jointly held 498,767 shares (2018: 391,274 shares).
Remuneration Supervisory BoardThe total remuneration of the Supervisory Board members was €628 thousand in 2019 (2018: €667 thousand).
Shares owned by Supervisory Board membersAt December 31, 2019, none of the members of the Supervisory Board owned shares (2018: Mr. Noteboom, retired member of the Supervisory Board, owned 4,865 shares).
For further details, refer to the Remuneration Report.
Note 38 – Remuneration of the Executive Board and Supervisory Board
Remuneration Executive BoardThe table below provides the total compensation of the Executive Board recognized in the statement of profit or loss:
1 LTIP share-based payments are based on IFRS accounting policies and therefore do not reflect the actual payout or value of performance shares released upon vesting.2 The 2018 tax related costs were negative, mainly due to a refund of payroll taxes of €3,038,776 (relating to the years 2016 and 2017 for Ms. McKinstry).

174 175Wolters Kluwer 2019 Annual Report Wolters Kluwer 2019 Annual Report
Table of Contents | Consolidated Financial Statements | Company Financial Statements
Below is a list of significant participations at December 31, 2019, in alphabetical order (legal entity name and the division it belongs to). The group has a 100% interest in all these participations.
Australia• Wolters Kluwer Australia Pty Limited (Tax & Accounting)
Belgium• Wolters Kluwer Belgium NV (Tax & Accounting and Legal
& Regulatory)• Wolters Kluwer Financial Services Belgium NV
(Governance, Risk & Compliance)
Canada• Wolters Kluwer Canada Limited (Tax & Accounting)
France• Enablon S.A.S. (Legal & Regulatory)• Holding Wolters Kluwer France S.A.S. (Legal &
Regulatory)• Wolters Kluwer France S.A.S. (Legal & Regulatory)
Germany• Wolters Kluwer Deutschland GmbH (Legal & Regulatory)• Wolters Kluwer Software und Service GmbH (Tax &
Accounting)
Ireland• Wolters Kluwer Finance Ireland DAC (Corporate office)• Wolters Kluwer Ireland Holding Limited (Corporate
office)
Italy• Tagetik Software S.r.l. (Tax & Accounting)• Wolters Kluwer Italy S.r.l. (Tax & Accounting and Legal &
Regulatory)
Luxembourg• Wolters Kluwer Financial Services Luxembourg S.A.
(Governance, Risk & Compliance) Poland• Wolters Kluwer Polska SP. z o.o. (Legal & Regulatory)
Spain• Wolters Kluwer España S.A. (Tax & Accounting and Legal
& Regulatory)
The Netherlands• eVision Holding B.V. (Legal & Regulatory)• eVision Industry Software B.V. (Legal & Regulatory)• Wolters Kluwer Global Business Services B.V. (Global
Business Services)• Wolters Kluwer Holding Nederland B.V. (Legal &
Regulatory)• Wolters Kluwer International Holding B.V. (Corporate
office)• Wolters Kluwer Nederland B.V. (Legal & Regulatory)• Wolters Kluwer Technology B.V. (Digital eXperience
Group)• Wolters Kluwer USA Holding B.V. (Corporate office)
United Kingdom• Wolters Kluwer Holdings (UK) PLC (Tax & Accounting)• Wolters Kluwer (UK) Limited (Tax & Accounting)
United States• CCH Incorporated (Tax & Accounting and Legal &
Regulatory)• CCH Legal Information Services, Inc. (Governance, Risk &
Compliance)• C T Corporation System (Governance, Risk & Compliance)• Emmi Solutions, LLC (Health)• Health Language, Inc. (Health)• LDI Operations, LLC (Health)• National Registered Agents, Inc. (Governance, Risk &
Compliance)• Ovid Technologies, Inc. (Health)• Universal Tax Systems, Inc. (Tax & Accounting)• UpToDate, Inc. (Health)• Wolters Kluwer Clinical Drug Information, Inc. (Health)• Wolters Kluwer ELM Solutions, Inc. (Governance, Risk &
Compliance)• Wolters Kluwer Financial Services, Inc. (Tax & Accounting
and Governance, Risk & Compliance)• Wolters Kluwer Health, Inc. (Health)• Wolters Kluwer North America, Inc. (Corporate office)• Wolters Kluwer R&D U.S. LP (Digital eXperience Group)• Wolters Kluwer United States Inc. (Global Business
Services and Corporate office)• Wolters Kluwer U.S. Corporation (Corporate office)
Note 39 – Overview of Significant Participations
In addition to these significant participations, the group has other consolidated entities in the countries listed, and also in the following countries: Austria, Brazil, China, Czech Republic, Denmark, Hong Kong, Hungary, India, Indonesia, Japan, Malaysia, Mexico, New Zealand, Norway, Portugal, Qatar, Romania, Russia, Singapore, Slovakia, South Africa, Sweden, Switzerland, and Ukraine.
The group has branches in Finland, Saudi Arabia, Taiwan, Thailand, and United Arab Emirates.
Apart from certain cash restrictions, (refer to Note 27 – Cash and Cash Equivalents), there are no significant restrictions on the group’s ability to access or use assets, and to settle liabilities within these subsidiaries. There are no interests in consolidated structured entities.
Refer to Note 8 – Acquisitions and Divestments for the consequences of losing control of subsidiaries during 2019 and 2018.
The financial statements of the parent and the subsidiaries used in the preparation of the consolidated financial statements have the same reporting date.

176 177Wolters Kluwer 2019 Annual Report Wolters Kluwer 2019 Annual Report
Table of Contents | Consolidated Financial Statements | Company Financial Statements
Note 40 – Events after Balance Sheet DateThe following subsequent events were evaluated up to February 25, 2020, which is the date the consolidated financial statements were authorized for issuance by the Executive Board and Supervisory Board:
On January 15, 2020, Legal & Regulatory announced the completion of the divestment of its Belgian training business.
On February 10, 2020, Legal & Regulatory completed the acquisition of 100% of the shares of CGE Risk Management Solutions B.V. (CGE), a leading provider of risk management software, including the industry-standard BowTieXP solution, for €20 million. There is no deferred and contingent consideration. The acquisition will extend Wolters Kluwer’s presence in the growing operational risk management software market. CGE will become part of the Environmental, Health & Safety and Operational Risk
Management (EHS/ORM) software group, which also includes Enablon and eVision. The combined offerings will enable customers to improve their EHS, ORM, and risk performance and to conduct more responsible, productive, and safe operations.
CGE recorded revenues of €5 million in 2018, mainly from software and services. Wolters Kluwer expects the acquisition to achieve a return on invested capital above the group’s after tax weighted average cost of capital (8%) within three to five years of completion. The transaction is expected to have a positive but immaterial impact on adjusted earnings in its first full year. CGE has approximately 30 employees, with headquarters in the Netherlands. CGE has a global customer base with the majority of customers in Europe, North America, and Australia. The group did not yet complete the purchase price allocation calculation.
180 Note 41 – Significant Accounting Policies
181 Note 42 – Financial Assets
181 Note 43 – Other Receivables
181 Note 44 – Cash and Cash Equivalents
182 Note 45 – Long-term Debt to Subsidiaries
182 Note 46 – Trade and Other Payables
182 Note 47 – Personnel Expenses
183 Note 48 – Shareholders’ Equity
185 Note 49 – Commitments and Contingent Liabilities
185 Note 50 – Details of Participating Interests
185 Note 51 – Profit Appropriation
Company Financial Statements178 Statement of Profit or Loss
179 Statement of Financial Position
180Notes to the Company Financial Statements

179Wolters Kluwer 2019 Annual Report
Table of Contents | Consolidated Financial Statements | Company Financial Statements
178 Wolters Kluwer 2019 Annual Report
Table of Contents | Consolidated Financial Statements | Company Financial Statements
in millions of euros and before appropriation of results, at December 31 2019 2018 restated*
Non-current assets
Financial assets Note 42 6,862 6,182
Deferred tax assets 15 16
Total non-current assets 6,877 6,198
Current assets
Other receivables Note 43 215 310
Cash and cash equivalents Note 44 285 10
Total current assets 500 320
Total assets 7,377 6,518
Equity
Issued share capital Note 33 33 34
Share premium reserve 87 87
Legal reserves 242 182
Other reserves 1,349 1,295
Undistributed profit 669 656
Shareholders’ equity Note 48 2,380 2,254
Non-current liabilities
Bonds Note 29 1,629 1,628
Private placements Note 29 163 407
Total long-term debt 1,792 2,035
Long-term debt to subsidiaries Note 45 0 0
Total non-current liabilities 1,792 2,035
Current liabilities
Short-term bonds and private placements Note 29 250 –
Trade and other payables Note 46 2,955 2,229
Total current liabilities 3,205 2,229
Total liabilities 4,997 4,264
Total equity and liabilities 7,377 6,518* Restated for IFRS 16 and certain reclassifications. See Note 41 – Significant Accounting Policies.
Company Financial Statements
Statement of Profit or Loss of Wolters Kluwer N.V.
in millions of euros 2019 2018*
General and administrative costs/(income) (55) (65)
Other operating income/(expense) – 0
Operating profit 55 65
Financing income third parties 11 11
Financing income related parties 4 13
Financing costs third parties (72) (91)
Financing costs related parties (9) (12)
Total financing results (66) (79)
Profit/(loss) before tax (11) (14)
Income tax expense (24) (34)
Profit/(loss) after tax (35) (48)
Results from subsidiaries, net of tax Note 42 704 704
Profit for the year 669 656* Restated for IFRS 16. See Note 41 – Significant Accounting Policies.
Statement of Financial Position of Wolters Kluwer N.V.

181Wolters Kluwer 2019 Annual Report
Table of Contents | Consolidated Financial Statements | Company Financial Statements
180 Wolters Kluwer 2019 Annual Report
Table of Contents | Consolidated Financial Statements | Company Financial Statements
Note 41 – Significant Accounting Policies
General Unless otherwise indicated, the amounts in these financial statements are in millions of euros.
Subsidiaries are valued using the equity method, applying the IFRS accounting policies as endorsed by the European Union.
The company shall, upon identification of a credit loss on an intercompany loan and/or receivable, eliminate the carrying amount of the intercompany loan and/or receivable for the value of the identified credit loss.
Any related party transactions between Wolters Kluwer N.V. and subsidiaries, associates, investments, or with members of the Supervisory Board and the Executive Board, are conducted at arm’s length, with terms comparable to transactions with third parties.
For the following disclosures reference is made to the notes to the consolidated financial statements:• Note 29 – Long-term Debt;• Note 33 – Capital and Reserves;• Note 34 – Share-based Payments;• Note 35 – Related Party Transactions, including loans,
advances and guarantees to the Executive Board and Supervisory Board;
• Note 38 – Remuneration of the Executive Board and Supervisory Board;
• Note 39 – Overview of Significant Participations; and• Note 40 – Events after Balance Sheet Date.
Accounting policiesThe company financial statements of Wolters Kluwer N.V. are prepared in accordance with the Dutch Civil Code, Book 2, Title 9, with the application of the regulations of section 362.8 allowing the use of the same accounting policies as applied for the consolidated financial
statements. These accounting policies are described in the Notes to the Consolidated Financial Statements. The company financial statements have also been restated for the effect of IFRS 16, with the following impact on the statement of financial position and profit or loss:
Notes to the Company Financial Statements
Changes in the Statement of Financial Position
impacted accounts only December 31, 2018, reported
IFRS 16 December 31, 2018, restated
Financial assets 6,195 (13) 6,182
Shareholders’ equity 2,267 (13) 2,254
Changes in the Statement of Profit or Loss
impacted accounts only December 31, 2018, reported
IFRS 16 December 31, 2018, restated
Results from subsidiaries, net of tax 705 (1) 704
Profit for the year 657 (1) 656
ComparativesAt January 1, 2018, the share buyback commitment of €50 million is reclassified from trade and other payables to treasury shares (within other reserves). This resulted in a corresponding increase in shareholders’ equity at this date.
At December 31, 2018, and January 1, 2018, an amount of €34 million is reclassified from retained earnings (within other reserves) to legal reserve participations (within legal reserves).
In addition, certain minor reclassifications have been made to the comparative statement of financial position and the related notes to conform to the current year presentation and to improve insights. These reclassifications have had no impact on the comparative shareholders’ equity and comparative profit for the year.
Note 42 – Financial Assets
2019 2018*
Equity value of subsidiaries 6,846 6,161
Derivative financial instruments Note 29 16 21
Total 6,862 6,182* Restated for IFRS 16 and certain reclassifications. See Note 41 – Significant Accounting Policies.
Movement equity value of subsidiaries
2019 2018*
Position at January 1 6,161 5,796
Results from subsidiaries, net of tax 704 704
Dividends received from subsidiaries (97) (483)
Remeasurement gains/(losses) on defined benefit plans, net of tax 7 9
Foreign exchange differences 71 135
Position at December 31 6,846 6,161* Restated for IFRS 16 and certain reclassifications. See Note 41 – Significant Accounting Policies.
Note 43 – Other Receivables
2019 2018
Receivables from subsidiaries 209 307
Derivative financial instruments Note 29 2 0
Current income tax assets 2 –
Miscellaneous receivables and prepayments 2 3
Total 215 310
Note 44 – Cash and Cash Equivalents
Cash and cash equivalents comprise cash balances and on demand deposits that are readily convertible into cash. There is no restricted cash.
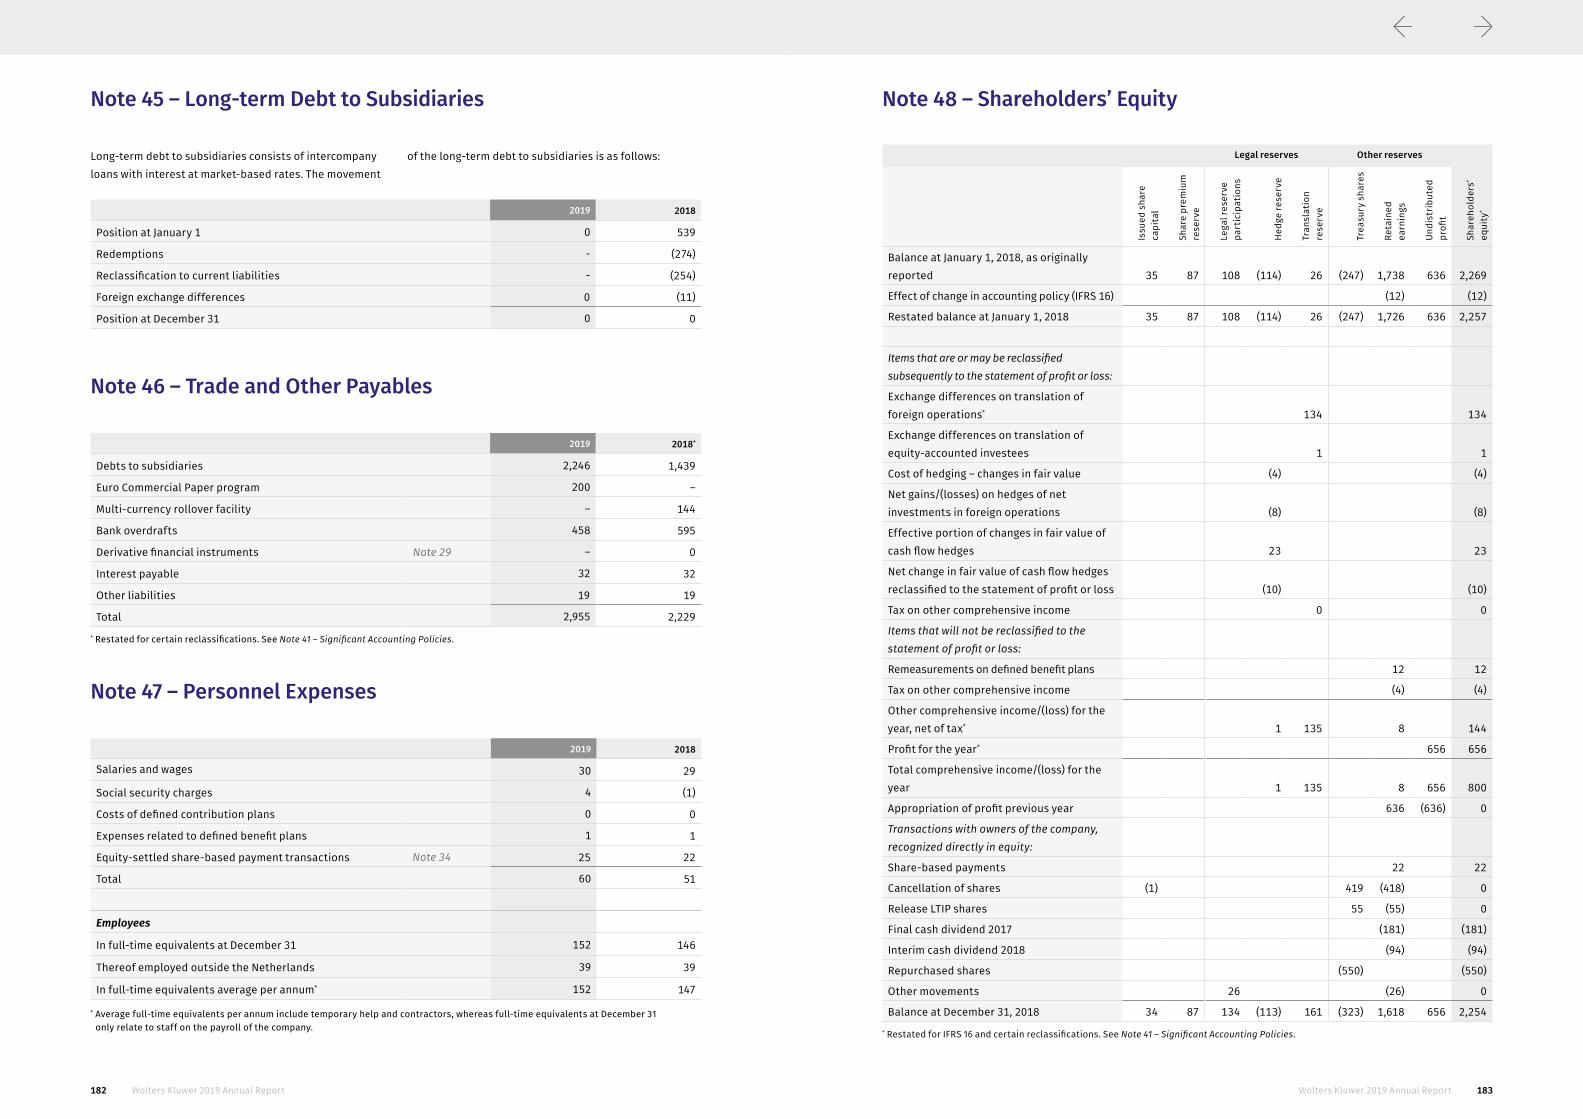
182 183Wolters Kluwer 2019 Annual Report Wolters Kluwer 2019 Annual Report
Table of Contents | Consolidated Financial Statements | Company Financial Statements
Legal reserves Other reserves
Issu
ed s
hare
ca
pita
l
Shar
e pr
emiu
m
rese
rve
Lega
l res
erve
pa
rtic
ipat
ions
Hed
ge re
serv
e
Tran
slat
ion
rese
rve
Trea
sury
sha
res
Reta
ined
ea
rnin
gs
Undi
stri
bute
d pr
ofit
Shar
ehol
ders
’ eq
uity
*
Balance at January 1, 2018, as originally reported 35 87 108 (114) 26 (247) 1,738 636 2,269
Effect of change in accounting policy (IFRS 16) (12) (12)
Restated balance at January 1, 2018 35 87 108 (114) 26 (247) 1,726 636 2,257
Items that are or may be reclassified subsequently to the statement of profit or loss:
Exchange differences on translation of foreign operations* 134 134
Exchange differences on translation of equity-accounted investees 1 1
Cost of hedging – changes in fair value (4) (4)
Net gains/(losses) on hedges of net investments in foreign operations (8) (8)
Effective portion of changes in fair value of cash flow hedges 23 23
Net change in fair value of cash flow hedges reclassified to the statement of profit or loss (10) (10)
Tax on other comprehensive income 0 0
Items that will not be reclassified to the statement of profit or loss:
Remeasurements on defined benefit plans 12 12
Tax on other comprehensive income (4) (4)
Other comprehensive income/(loss) for the year, net of tax* 1 135 8 144
Profit for the year* 656 656
Total comprehensive income/(loss) for the year 1 135 8 656 800
Appropriation of profit previous year 636 (636) 0
Transactions with owners of the company, recognized directly in equity:
Share-based payments 22 22
Cancellation of shares (1) 419 (418) 0
Release LTIP shares 55 (55) 0
Final cash dividend 2017 (181) (181)
Interim cash dividend 2018 (94) (94)
Repurchased shares (550) (550)
Other movements 26 (26) 0
Balance at December 31, 2018 34 87 134 (113) 161 (323) 1,618 656 2,254* Restated for IFRS 16 and certain reclassifications. See Note 41 – Significant Accounting Policies.
Note 48 – Shareholders’ EquityNote 45 – Long-term Debt to Subsidiaries
2019 2018
Position at January 1 0 539
Redemptions - (274)
Reclassification to current liabilities - (254)
Foreign exchange differences 0 (11)
Position at December 31 0 0
Note 46 – Trade and Other Payables
2019 2018*
Debts to subsidiaries 2,246 1,439
Euro Commercial Paper program 200 –
Multi-currency rollover facility – 144
Bank overdrafts 458 595
Derivative financial instruments Note 29 – 0
Interest payable 32 32
Other liabilities 19 19
Total 2,955 2,229* Restated for certain reclassifications. See Note 41 – Significant Accounting Policies.
Note 47 – Personnel Expenses
2019 2018
Salaries and wages 30 29
Social security charges 4 (1)
Costs of defined contribution plans 0 0
Expenses related to defined benefit plans 1 1
Equity-settled share-based payment transactions Note 34 25 22
Total 60 51
Employees
In full-time equivalents at December 31 152 146
Thereof employed outside the Netherlands 39 39
In full-time equivalents average per annum* 152 147
* Average full-time equivalents per annum include temporary help and contractors, whereas full-time equivalents at December 31 only relate to staff on the payroll of the company.
Long-term debt to subsidiaries consists of intercompany loans with interest at market-based rates. The movement
of the long-term debt to subsidiaries is as follows:

184 185Wolters Kluwer 2019 Annual Report Wolters Kluwer 2019 Annual Report
Table of Contents | Consolidated Financial Statements | Company Financial Statements
Note 49 – Commitments and Contingent Liabilities
GuaranteesPursuant to section 403 of the Dutch Civil Code, Book 2, the company has assumed joint and several liability for the debts arising out of the legal acts of several subsidiaries in the Netherlands. The relevant declarations have been filed with and are open for inspection at the
Dutch Commercial Register for the district in which the legal entity respective to the liability has its registered office.
The company has the following outstanding guarantees at December 31:
Of the guarantees issued for the bank credit facilities on behalf of several subsidiaries, €2 million have been utilized (2018: €2 million). The company forms part of a Dutch fiscal unity and pursuant to standard conditions has assumed joint and several liability for the tax liabilities of the fiscal unity.
At December 31, 2019, share buybacks have not yet been executed for an amount of €50 million under the existing mandate.
Note 50 – Details of Participating Interests
A list of subsidiaries and affiliated companies, prepared in accordance with the relevant legal requirements (Dutch Civil Code, Book 2, Part 9, Section 379) is filed at the offices of the Chamber of Commerce of The Hague, the
Netherlands. An overview of significant participations is included in Note 39 – Overview of Significant Participations.
Note 51 – Profit Appropriation
At the 2020 Annual General Meeting of Shareholders, Wolters Kluwer will propose a final dividend distribution of €0.79 per share, to be paid in cash on May 20, 2020. This will bring the total dividend for 2019 to €1.18 per share, an increase of 20% over the prior year.
Legal reserves Other reserves
Issu
ed s
hare
ca
pita
l
Shar
e pr
emiu
m
rese
rve
Lega
l res
erve
pa
rtic
ipat
ions
Hed
ge re
serv
e
Tran
slat
ion
rese
rve
Trea
sury
sh
ares
Reta
ined
ea
rnin
gs
Undi
stri
bute
d pr
ofit
Shar
ehol
ders
’ eq
uity
Balance at January 1, 2019 34 87 134 (113) 161 (323) 1,618 656 2,254
Items that are or may be reclassified subsequently to the statement of profit or loss:
Exchange differences on translation of foreign operations 71 71
Exchange differences on translation of equity-accounted investees 0 0
Net gains/(losses) on hedges of net investments in foreign operations (4) (4)
Cost of hedging – changes in fair value (5) (5)
Effective portion of changes in fair value of cash flow hedges (4) (4)
Net change in fair value of cash flow hedges reclassified to the statement of profit or loss (5) (5)
Tax on other comprehensive income 2 0 2
Items that will not be reclassified to the statement of profit or loss:
Remeasurements on defined benefit plans 8 8
Tax on other comprehensive income (2) (2)
Other comprehensive income/(loss) for the year, net of tax (16) 71 6 61
Profit for the year 669 669
Total comprehensive income/(loss) for the year (16) 71 6 669 730
Appropriation of profit previous year 656 (656) 0
Transactions with owners of the company, recognized directly in equity:
Share-based payments 25 25
Cancellation of shares (1) 343 (342) 0
Release LTIP shares 51 (51) 0
Final cash dividend 2018 (174) (174)
Interim cash dividend 2019 (105) (105)
Repurchased shares (350) (350)
Other movements 5 (5) 0
Balance at December 31, 2019 33 87 139 (129) 232 (279) 1,628 669 2,380
The legal reserves and treasury shares reserve are not available for dividend distribution to the owners of the company.
2019 2018
Bank credit facilities 199 196
Parental performance guarantees to third parties 13 13
Guarantee to the trustees of the U.K. retirement plan 21 20
Total guarantees outstanding 233 229
2019 2018
Proposed cash distribution 315 266

187Wolters Kluwer 2019 Annual Report
Table of Contents | Consolidated Financial Statements | Company Financial Statements
186 Wolters Kluwer 2019 Annual Report
Table of Contents | Consolidated Financial Statements | Company Financial Statements
Other Information on the Financial Statements
Independent Auditor's Report
To the shareholders and the Supervisory Board of Wolters Kluwer N.V.
Report on the audit of the financial statements for the year ended December 31, 2019, included in the 2019 Annual Report.
Our opinion
We have audited the accompanying financial statements for the year ended December 31, 2019, of Wolters Kluwer N.V., based in Alphen aan den Rijn, the Netherlands. The financial statements include the consolidated financial statements and the company financial statements as set out on pages 81 to 186 of the 2019 Annual Report.
In our opinion:• The accompanying consolidated financial statements
give a true and fair view of the financial position of Wolters Kluwer N.V. as at December 31, 2019, and of its result and its cash flows for the year ended December 31, 2019, in accordance with International Financial Reporting Standards as adopted by the European Union (IFRS-EU) and with Part 9 of Book 2 of the Dutch Civil Code; and
• The accompanying company financial statements give a true and fair view of the financial position of Wolters Kluwer N.V. as at December 31, 2019, and of its result for the year ended December 31, 2019, in accordance with Part 9 of Book 2 of the Dutch Civil Code.
The consolidated financial statements comprise:1. The consolidated statement of financial position as at
December 31, 2019;2. The following statements for the year ended December
31, 2019: the consolidated statement of profit or loss and the consolidated statements of comprehensive income, changes in total equity, and cash flows; and
3. The notes to the consolidated financial statements comprising a summary of the ,significant accounting policies and other explanatory information.
The company financial statements comprise:1. The company statement of financial position as at
December 31, 2019;2. The company statement of profit or loss for the year
ended December 31, 2019; and3. The notes to the company financial statements
comprising a summary of the significant accounting policies and other explanatory information.
Basis for our opinion
We conducted our audit in accordance with Dutch law, including the Dutch Standards on Auditing. Our responsibilities under those standards are further described in the section Our responsibilities for the audit of the financial statements in the auditor's report.We are independent of Wolters Kluwer N.V. in accordance with the EU Regulation on specific requirements regarding statutory audits of public-interest entities, the Wet toezicht accountantsorganisaties (Wta, Audit firms supervision act), the Verordening inzake de onafhankelijkheid van accountants bij assurance-opdrachten (ViO, Code of Ethics for Professional Accountants, a regulation with respect to independence), and other relevant independence regulations in the Netherlands. Furthermore, we have complied with the Verordening gedrags- en beroepsregels accountants (VGBA, Dutch Code of Ethics).
We believe the audit evidence we have obtained is sufficient and appropriate to provide a basis for our opinion.
MaterialityBased on our professional judgment, we determined the materiality for the financial statements as a whole at €50 million. The materiality is based on 5.8% of profit before tax (2018: 5.6%). We have also taken into account misstatements and/or possible misstatements that in our opinion are material for the users of the financial statements for qualitative reasons.
Authorization for Issuance
Alphen aan den Rijn, February 25, 2020
Executive BoardN. McKinstry, CEO and Chairman of the Executive BoardK.B. Entricken, CFO and Member of the Executive Board
Supervisory BoardF.J.G.M. Cremers, ChairmanD.R. Hooft Graafland, Vice-ChairmanB.J.F.X. BodsonJ.A. HoranC.F.H.H. VogelzangA.E. Ziegler
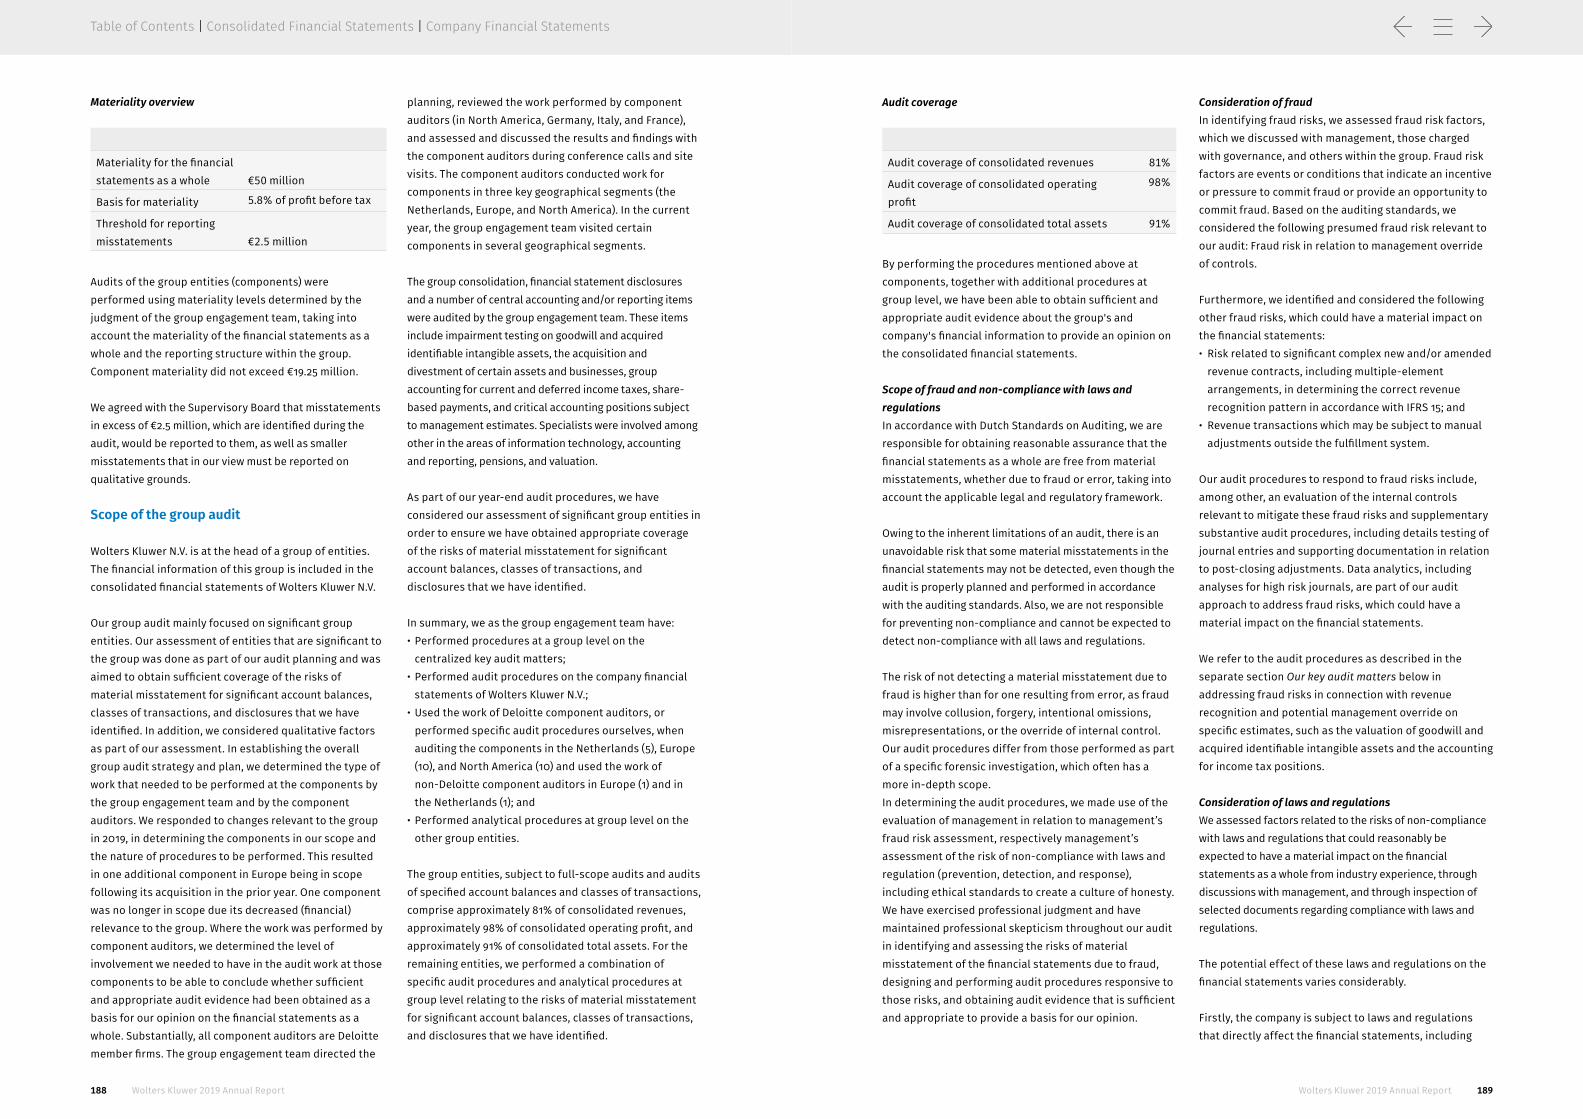
188 189Wolters Kluwer 2019 Annual Report Wolters Kluwer 2019 Annual Report
Table of Contents | Consolidated Financial Statements | Company Financial Statements
Audit coverage
Audit coverage of consolidated revenues 81%
Audit coverage of consolidated operating profit
98%
Audit coverage of consolidated total assets 91%
By performing the procedures mentioned above at components, together with additional procedures at group level, we have been able to obtain sufficient and appropriate audit evidence about the group's and company's financial information to provide an opinion on the consolidated financial statements.
Scope of fraud and non-compliance with laws and regulations In accordance with Dutch Standards on Auditing, we are responsible for obtaining reasonable assurance that the financial statements as a whole are free from material misstatements, whether due to fraud or error, taking into account the applicable legal and regulatory framework.
Owing to the inherent limitations of an audit, there is an unavoidable risk that some material misstatements in the financial statements may not be detected, even though the audit is properly planned and performed in accordance with the auditing standards. Also, we are not responsible for preventing non-compliance and cannot be expected to detect non-compliance with all laws and regulations.
The risk of not detecting a material misstatement due to fraud is higher than for one resulting from error, as fraud may involve collusion, forgery, intentional omissions, misrepresentations, or the override of internal control. Our audit procedures differ from those performed as part of a specific forensic investigation, which often has a more in-depth scope. In determining the audit procedures, we made use of the evaluation of management in relation to management’s fraud risk assessment, respectively management’s assessment of the risk of non-compliance with laws and regulation (prevention, detection, and response), including ethical standards to create a culture of honesty. We have exercised professional judgment and have maintained professional skepticism throughout our audit in identifying and assessing the risks of material misstatement of the financial statements due to fraud, designing and performing audit procedures responsive to those risks, and obtaining audit evidence that is sufficient and appropriate to provide a basis for our opinion.
Consideration of fraud In identifying fraud risks, we assessed fraud risk factors, which we discussed with management, those charged with governance, and others within the group. Fraud risk factors are events or conditions that indicate an incentive or pressure to commit fraud or provide an opportunity to commit fraud. Based on the auditing standards, we considered the following presumed fraud risk relevant to our audit: Fraud risk in relation to management override of controls.
Furthermore, we identified and considered the following other fraud risks, which could have a material impact on the financial statements:• Risk related to significant complex new and/or amended
revenue contracts, including multiple-element arrangements, in determining the correct revenue recognition pattern in accordance with IFRS 15; and
• Revenue transactions which may be subject to manual adjustments outside the fulfillment system.
Our audit procedures to respond to fraud risks include, among other, an evaluation of the internal controls relevant to mitigate these fraud risks and supplementary substantive audit procedures, including details testing of journal entries and supporting documentation in relation to post-closing adjustments. Data analytics, including analyses for high risk journals, are part of our audit approach to address fraud risks, which could have a material impact on the financial statements.
We refer to the audit procedures as described in the separate section Our key audit matters below in addressing fraud risks in connection with revenue recognition and potential management override on specific estimates, such as the valuation of goodwill and acquired identifiable intangible assets and the accounting for income tax positions.
Consideration of laws and regulations We assessed factors related to the risks of non-compliance with laws and regulations that could reasonably be expected to have a material impact on the financial statements as a whole from industry experience, through discussions with management, and through inspection of selected documents regarding compliance with laws and regulations.
The potential effect of these laws and regulations on the financial statements varies considerably.
Firstly, the company is subject to laws and regulations that directly affect the financial statements, including
Materiality overview
Materiality for the financial statements as a whole €50 million
Basis for materiality 5.8% of profit before tax
Threshold for reporting misstatements €2.5 million
Audits of the group entities (components) were performed using materiality levels determined by the judgment of the group engagement team, taking into account the materiality of the financial statements as a whole and the reporting structure within the group. Component materiality did not exceed €19.25 million.
We agreed with the Supervisory Board that misstatements in excess of €2.5 million, which are identified during the audit, would be reported to them, as well as smaller misstatements that in our view must be reported on qualitative grounds.
Scope of the group audit
Wolters Kluwer N.V. is at the head of a group of entities. The financial information of this group is included in the consolidated financial statements of Wolters Kluwer N.V.
Our group audit mainly focused on significant group entities. Our assessment of entities that are significant to the group was done as part of our audit planning and was aimed to obtain sufficient coverage of the risks of material misstatement for significant account balances, classes of transactions, and disclosures that we have identified. In addition, we considered qualitative factors as part of our assessment. In establishing the overall group audit strategy and plan, we determined the type of work that needed to be performed at the components by the group engagement team and by the component auditors. We responded to changes relevant to the group in 2019, in determining the components in our scope and the nature of procedures to be performed. This resulted in one additional component in Europe being in scope following its acquisition in the prior year. One component was no longer in scope due its decreased (financial) relevance to the group. Where the work was performed by component auditors, we determined the level of involvement we needed to have in the audit work at those components to be able to conclude whether sufficient and appropriate audit evidence had been obtained as a basis for our opinion on the financial statements as a whole. Substantially, all component auditors are Deloitte member firms. The group engagement team directed the
planning, reviewed the work performed by component auditors (in North America, Germany, Italy, and France), and assessed and discussed the results and findings with the component auditors during conference calls and site visits. The component auditors conducted work for components in three key geographical segments (the Netherlands, Europe, and North America). In the current year, the group engagement team visited certain components in several geographical segments.
The group consolidation, financial statement disclosures and a number of central accounting and/or reporting items were audited by the group engagement team. These items include impairment testing on goodwill and acquired identifiable intangible assets, the acquisition and divestment of certain assets and businesses, group accounting for current and deferred income taxes, share-based payments, and critical accounting positions subject to management estimates. Specialists were involved among other in the areas of information technology, accounting and reporting, pensions, and valuation.
As part of our year-end audit procedures, we have considered our assessment of significant group entities in order to ensure we have obtained appropriate coverage of the risks of material misstatement for significant account balances, classes of transactions, and disclosures that we have identified.
In summary, we as the group engagement team have:• Performed procedures at a group level on the
centralized key audit matters;• Performed audit procedures on the company financial
statements of Wolters Kluwer N.V.;• Used the work of Deloitte component auditors, or
performed specific audit procedures ourselves, when auditing the components in the Netherlands (5), Europe (10), and North America (10) and used the work of non-Deloitte component auditors in Europe (1) and in the Netherlands (1); and
• Performed analytical procedures at group level on the other group entities.
The group entities, subject to full-scope audits and audits of specified account balances and classes of transactions, comprise approximately 81% of consolidated revenues, approximately 98% of consolidated operating profit, and approximately 91% of consolidated total assets. For the remaining entities, we performed a combination of specific audit procedures and analytical procedures at group level relating to the risks of material misstatement for significant account balances, classes of transactions, and disclosures that we have identified.

190 191Wolters Kluwer 2019 Annual Report Wolters Kluwer 2019 Annual Report
Table of Contents | Consolidated Financial Statements | Company Financial Statements
Valuation of goodwill and acquired identifiable intangible assets
The group has €3,990 million of goodwill and€1,130 million of acquired identifiable intangible assets (December 31, 2018: €3,945 million and €1,274 million respectively), as disclosed in Note 18. Goodwill and acquired identifiable intangible assets represent 58% (2018: 61%) of total assets and 215% (2018: 232%) of total equity. Goodwill is subject to an annual impairment test.
The value-in-use of goodwill and acquired identifiable intangible assets is dependent on expected future cash flows from the underlying group of Cash Generating Units (“CGUs”) for goodwill and individual CGUs for acquired identifiable intangible assets.
The impairment assessment prepared by management includes a variety of internal and external factors, which represents significant estimates that require the use of valuation models and a significant level of management judgment, particularly the assumptions related to the weighted average cost of capital and the perpetual growth rates.
For two individual CGUs, Health Patient Engagement Solutions and Tax & Accounting Brazil, the annual impairment assessment resulted in triggers for impairment. The impairment tests performed resulted in an impairment of acquired identifiable intangible assets of €38 million as outlined in Note 18 to the financial statements.
The sensitivity analysis has been disclosed in Note 18 to the financial statements.
We obtained an understanding of the process in place and identified controls in the impairment assessment of the group for goodwill and acquired identifiable intangible assets as a basis for our mainly substantive audit approach.We obtained management’s impairment assessment and have evaluated the impairment models. We involved valuation specialists to assess the models used and the key assumptions applied as outlined in Note 18. Our valuation specialists assisted us specifically in challenging the weighted average cost of capital, the perpetual growth rates, and other rates applied by benchmarking against independent data and peers in the industry.
We challenged management’s key assumptions used for cash flow projections, weighted average cost of capital, and perpetual growth rates. We compared rates in use with historical trends and external data and performed sensitivity analyses. We reconciled forecasted cash flows per group of CGUs to authorized budgets and obtained an understanding how these budgets were compiled. For the individual CGU Health Patient Engagement Solutions, where impairment triggers were identified, these procedures were performed for the individual CGU.
We also evaluated the adequacy of the disclosures provided by the group in Note 18 in relation to its impairment assessment.
ObservationsOur procedures did not identify material exceptions and we considered management’s key assumptions, the weighted average cost of capital, and the perpetual growth rates, to be within a reasonable range of our own expectations.
Key audit matter How the key audit matter was addressed in the audit
corporate tax laws and financial reporting regulations and requirements under Part 9 of Book 2 of the Dutch Civil Code. We assessed the compliance with these laws and regulations as part of our procedures on the related consolidated financial statements.
Secondly, the group is subject to many other laws and regulations where the consequences of non-compliance with these laws could have a material effect on amounts and/or disclosures in the financial statements, for instance through imposing fines or litigation. We identified data and privacy legislation and Dutch stock exchange regulations, as those are most likely to have such an effect. As required by auditing standards, we performed audit procedures to identify non-compliance with these laws and regulations by inquiring of management, those charged with governance, and others within the group and inspecting correspondence with regulatory authorities. We also inspected lawyers’ letters and remained alert to indications of (suspected) non-
compliance throughout the audit. Furthermore, we performed corroborative inquiry with the group legal counsel and the internal audit department. Finally, we obtained written representations that all known instances of (suspected) non-compliance with laws and regulations have been disclosed to us.
Our key audit matters
Key audit matters are those matters that, in our professional judgment, were of most significance to our audit of the financial statements. We have communicated the key audit matters to the Supervisory Board. The key audit matters are not a comprehensive reflection of all matters discussed.
These matters were addressed in the context of our audit of the financial statements as a whole and in forming our opinion thereon, and we do not provide a separate opinion on these matters.
Revenue recognition
Revenue recognition resulting from sales transactions may be subject to manual adjustments outside the fulfillment systems. There is a risk of material misstatement that these revenue adjustments are based on non-valid, inaccurate, and improper period allocation manual journal entries. The group’s revenue recognition policies are disclosed in Note 6.
Significant complex new and/or amended revenue arrangements may also require careful consideration and judgment in determining the correct revenue recognition pattern in accordance with IFRS 15. For such contracts, the group may fail to defer revenue recognition, or allocate the incorrect selling price to the different elements in the arrangements in accordance with IFRS 15 requirements, resulting in inaccurate and improper revenue recognition.
Our risk assessment in connection with revenue recognition did not change, since the overall product portfolio of the group remained materially unchanged as compared to the prior year.
The revenue recognition testing procedures performed on existing contracts were focused on manual adjustments, which could impact the accuracy, occurrence, and cut-off of recorded revenue especially around period-end. We obtained an understanding of the revenue processes and tested design and implementation of controls in place, including segregation of duties, relevant to our audit.
Analytical reviews were performed by segment, product category, and geographical location. Manual entries made were challenged with authorized source documents like contracts, third-party delivery confirmations, and customer acceptance forms.
Component auditors were involved in assessing the accounting methodologies and revenue recognition policies applied for significant complex new and/or amended contracts, especially for those business units where we deem such transactions more likely to occur. Revenue, contract assets, and contract liabilities were challenged for recognition in accordance with the underlying contract, agreement, acceptance, usage, or delivery form, to evaluate proper allocation of the contract value to the different performance obligations and to evaluate the revenue recognition patterns applied.
We also evaluated the adequacy of the disclosures provided by the group in Note 6.
ObservationOur procedures did not identify any significant observations in manual adjustments to revenue and significant complex new and/or amended revenue arrangements.
Accounting for complex current and deferred income taxes (including uncertain tax positions)
The group, due to its international and decentralized operating model, has a complex tax structure, mainly in North America and Europe.
The tax positions taken in the various income tax returns are subject to periodic reviews by local tax authorities. Insufficient understanding of the local requirements may result in tax positions that are not supported by local laws and regulations. New tax laws and regulations being issued or proposed may also impact the group’s tax positions. The assessment process of the group’s current and deferred income tax balances is complex and requires careful consideration and judgment.
The current and deferred tax positions, including uncertain tax positions, are disclosed in Note 16 and Note 23.
We involved our tax specialists to obtain an understanding of the group’s tax strategy, including current transfer pricing arrangements, royalty agreements, and other agreements. We considered controls in place relevant to the assessments made by management in determining current and deferred income tax positions, including uncertain tax positions, and adopted a substantive audit approach.
Our audit procedures included the involvement of tax specialists to assess the appropriateness of current and deferred tax positions, including uncertain tax positions, from a tax accounting perspective, both at group level and local level for significant entities.
We analyzed the accounted permanent and temporary differences, (potential) tax risks, legislative developments, and the status of ongoing local tax authority audits. We challenged the group’s positions by independently testing assumptions and estimates with correspondence from tax authorities, historical track records, and tax opinions.
Contingencies were evaluated for triggers, including new tax laws and new information in the context of applicable tax laws, or the outcome of (substantially) completed tax audits, that could result in liabilities for or reversals of uncertain tax positions. New income tax positions recognized were evaluated and discussed with tax experts on compliance with local laws and regulations and substance requirements.We also evaluated the adequacy of the disclosure on the current and deferred tax positions as included in Note 16 and Note 23. ObservationOur audit procedures did not result in material observations in connection with the group’s tax positions and disclosures as included in Note 16 and 23.
Key audit matter How the key audit matter was addressed in the audit

192 193Wolters Kluwer 2019 Annual Report Wolters Kluwer 2019 Annual Report
Table of Contents | Consolidated Financial Statements | Company Financial Statements
Internal controls over financial reporting
The group has its businesses in a large number of countries and locations. The group operates various IT systems, processes, and procedures locally that are important for the continuity of its business operations and for the reliability of its financial reporting.
In addition, the group is exposed to IT-related risks and cyber threats that could affect their IT infrastructure and system availability, applications, and company and customer data.
In May 2019, the group detected ransomware in a portion of its IT environment. Certain customer and internal applications and platforms were taken offline. The group engaged with a leading cybersecurity technology firm to conduct a forensic investigation of the incident.
For more information see page 22 of the 2019 Annual Report.
We have considered the group’s internal controls over financial reporting as a basis for designing and performing the audit activities that are deemed appropriate for our audit. We are, however, not required to perform an audit on internal controls over financial reporting and accordingly, we do not express an opinion on the effectiveness of the group’s controls over financial reporting.
We have tailored our audit procedures to the diverse (local) IT landscapes and the implemented internal controls. We have included specialized IT auditors in our audit teams to test the reliability and continuity of the automated data processing, solely to the extent necessary within the scope of the financial statement audit. Where relevant to the audit, we have tested the operating effectiveness of (IT) controls and performed additional audit procedures where deemed necessary.
We also evaluated the consequences of the cyber incident on the reliability of the IT environment, compliance with data and privacy laws, and potential claims and litigations. For the impact on the IT environment, our evaluation of the group’s assessment was performed with the assistance of specialists.
We refer to section Risk Management, where the Internal Control Framework for financial reporting is described.
ObservationWe have reported our observations on internal controls over financial reporting to the Audit Committee and have performed additional audit procedures where deemed necessary with satisfactory results.
Key audit matter How the key audit matter was addressed in the audit Description of responsibilities regarding the financial statements
Responsibilities of management for the financial statementsManagement is responsible for the preparation and fair presentation of the financial statements in accordance with IFRS-EU and Part 9 of Book 2 of the Dutch Civil Code. Furthermore, management is responsible for such internal control as management determines is necessary to enable the preparation of the financial statements that are free from material misstatement, whether due to fraud or error.
As part of the preparation of the financial statements, management is responsible for assessing the company's ability to continue as a going concern. Based on the financial reporting frameworks mentioned, management should prepare the financial statements using the going concern basis of accounting, unless management either intends to liquidate the company or to cease operations or has no realistic alternative but to do so.
Management should disclose events and circumstances that may cast significant doubt on the company's ability to continue as a going concern in the financial statements.The Supervisory Board is responsible for overseeing the company's financial reporting process.
Our responsibilities for the audit of the financial statementsOur objective is to plan and perform the audit assignment in a manner that allows us to obtain sufficient and appropriate audit evidence for our opinion.
Our audit has been performed with a high, but not absolute, level of assurance, which means we may not detect all material errors and fraud during our audit.
Misstatements can arise from fraud or error and are considered material if, individually or in the aggregate, they could reasonably be expected to influence the economic decisions of users taken on the basis of these financial statements. The materiality affects the nature, timing, and extent of our audit procedures and the evaluation of the effect of identified misstatements on our opinion.
We have exercised professional judgment and have maintained professional skepticism throughout the audit, in accordance with Dutch Standards on Auditing, ethical requirements and independence requirements. Our audit included e.g.:• Identifying and assessing the risks of material misstatement
of the financial statements, whether due to fraud or error, designing and performing audit procedures responsive to those risks, and obtaining audit evidence that is sufficient and appropriate to provide a basis for our opinion. The risk of not detecting a material misstatement resulting from fraud is higher than for one resulting from error, as fraud may involve collusion, forgery, intentional omissions, misrepresentations, or the override of internal control;
• Obtaining an understanding of internal control relevant to the audit in order to design audit procedures that are
appropriate in the circumstances, but not for the purpose of expressing an opinion on the effectiveness of the company's internal control;
• Evaluating the appropriateness of accounting policies used and the reasonableness of accounting estimates and related disclosures made by management;
• Concluding on the appropriateness of management's use of the going concern basis of accounting, and based on the audit evidence obtained, whether a material uncertainty exists related to events or conditions that may cast significant doubt on the company's ability to continue as a going concern. If we conclude that a material uncertainty exists, we are required to draw attention in our auditor's report to the related disclosures in the financial statements or, if such disclosures are inadequate, to modify our opinion. Our conclusions are based on the audit evidence obtained up to the date of our auditor's report. However, future events or conditions may cause the company to cease to continue as a going concern;
• Evaluating the overall presentation, structure and content of the financial statements, including the disclosures; and
• Evaluating whether the financial statements represent the underlying transactions and events in a manner that achieves fair presentation.
Because we are ultimately responsible for the opinion, we are also responsible for directing, supervising, and performing the group audit. In this respect, we have determined the nature and extent of the audit procedures to be carried out for group entities. Decisive were the size and/or the risk profile of the group entities or operations. On this basis, we selected group entities for which an audit or review had to be carried out on the complete set of financial information or specific items.
We communicated with the Supervisory Board regarding, among other matters, the planned scope and timing of the audit and significant audit findings, including any significant findings in internal control that we identified during our audit. In this respect, we also submitted an additional report to the Audit Committee in accordance with Article 11 of the EU Regulation on specific requirements regarding statutory audit of public-interest entities. The information included in this additional report is consistent with our opinion in this auditor's report. We provided the Supervisory Board with a statement that we have complied with relevant ethical requirements regarding independence, and communicated to them all relationships and other matters that may reasonably be thought to bear on our independence, and where applicable, related safeguards.
From the matters communicated to the Supervisory Board, we determined the key audit matters; those matters that were of most significance in the audit of the financial statements. We described these matters in our auditor's report, unless law or regulation precludes public disclosure about the matter or when, in extremely rare circumstances, not communicating the matter is in the public interest.
Amsterdam, February 25, 2020Deloitte Accountants B.V. B.C.J. Dielissen
Report on the other information included in the 2019 Annual Report
In addition to the financial statements and our auditor's report thereon, the 2019 Annual Report contains other information that consists of:• Report of the Executive Board; • Report of the Supervisory Board;• Corporate Governance and Risk Management; and• Other Information as required by Part 9 of Book 2 of the
Dutch Civil Code.
Based on the following procedures performed, we conclude that the other information:• Is consistent with the financial statements and does not
contain material misstatements; and• Contains the information as required by Part 9 of Book 2
of the Dutch Civil Code.
We have read the other information. Based on our knowledge and understanding obtained through our audit of the financial statements or otherwise, we have considered whether the other information contains material misstatements.
By performing these procedures, we comply with the requirements of Part 9 of Book 2 of the Dutch Civil Code and the Dutch Standard on Auditing 720. The scope of the
procedures performed is substantially less than the scope of those performed in our audit of the financial statements.Management is responsible for the preparation of the other information, including the Report of the Executive Board in accordance with Part 9 of Book 2 of the Dutch Civil Code, and the other information as required by Part 9 of Book 2 of the Dutch Civil Code.
Report on other legal and regulatory requirements
EngagementWe were engaged by the Supervisory Board as auditor of Wolters Kluwer N.V. on April 23, 2014, as from the audit for the year 2015, and have operated as statutory auditor ever since that financial year. In the General Meeting of Shareholders on April 19, 2018, we were reappointed for a period of four years for the financial years 2019 through 2022.
No prohibited non-audit servicesWe have not provided prohibited non-audit services as referred to in Article 5(1) of the EU Regulation on specific requirements regarding statutory audit of public-interest entities.

195Wolters Kluwer 2019 Annual Report
Table of Contents | Consolidated Financial Statements | Company Financial Statements
194 Wolters Kluwer 2019 Annual Report
Table of Contents | Consolidated Financial Statements | Company Financial Statements
Other Information
ActivitiesThe Board of the Wolters Kluwer Preference Shares Foundation met twice in 2019. The matters discussed included the 2018 full-year results of Wolters Kluwer, the 2019 half-year results, the execution of the strategy, the financing of the company, acquisitions and divestments, developments in the market, and the general course of events at Wolters Kluwer. Representatives of the Executive Board of the company, the chairman of the Supervisory Board, and corporate staff attended the meetings to give the Board of the Foundation information about the developments within Wolters Kluwer.
The Board of the Foundation also followed developments of the company outside of board meetings, among other through receipt by the board members of press releases. As a result, the Board of the Foundation has a good view on the course of events at Wolters Kluwer. The Board of the Foundation also closely monitored the developments with respect to corporate governance and relevant Dutch legislation and discussed that topic during the meetings. Furthermore, the financing of the Foundation and the composition of the Board of the Foundation were discussed. The Foundation acquired no preference shares during the year under review.
Exercise of the preference shares optionWolters Kluwer N.V. and the Foundation have concluded an agreement based on which preference shares can be taken by the Foundation. This option on preference shares is at present a measure that could be considered as a potential protection at Wolters Kluwer against exercising influence by a third party on the policy of the company without the consent of the Executive Board and Supervisory Board, including events that could threaten
the strategy, continuity, independence, identity, or coherence between the activities of the company. The Foundation is entitled to exercise the option on preference shares in such a way that the number of preference shares taken will be no more than 100% of the number of issued and outstanding ordinary shares at the time of exercise. Among other by the exercise of the option on the preference shares by the Foundation, the Executive Board and the Supervisory Board will have the possibility to determine their position with respect to, for example, a party making a bid on the shares of Wolters Kluwer and its plans, or with respect to a third party that otherwise wishes to exercise decisive influence, and enables the boards to examine and implement alternatives.
Composition of the Board of the Wolters Kluwer Preference Shares FoundationThe composition of the Board remained unchanged in 2019.
The Foundation is a legal entity that is independent from the company as stipulated in clause 5:71 (1) sub c of the Act on financial supervision (Wet op het financieel toezicht). All members of the Board of the Foundation are independent from the company.
Alphen aan den Rijn, February 25, 2020
Board of Wolters Kluwer Preference Shares FoundationR.P. Voogd, ChairmanP. Bouw, Vice-ChairmanJ.H.M. LindenberghJ.S.T. Tiemstra
Report of the Wolters Kluwer Preference Shares Foundation
Article 29 of the Articles of AssociationParagraph 1From the profit as it appears on the annual accounts adopted by the General Meeting, a dividend shall be distributed on the preference shares, whose percentage – calculated on the paid part of the nominal amount – is equal to that of the average of the interest rate on Basis Refinancing Transactions (Refi interest of the European Central Bank). These are weighted according to the number of days over which this rate of interest applies during the financial year over which the dividend was paid, increased by a debit interest rate to be determined by the large Dutch banks and also increased by a margin determined by the Executive Board and approved by the Supervisory Board of one percentage point (1%) minimum and four percentage points (4%) maximum. The dividend on the preference shares shall be calculated on an annual basis on the paid part of the nominal amount. If in any financial year the distribution referred to in the first full sentence cannot be made or can only be made in part because the profits are not sufficient, the deficiency shall be distributed from the distributable part of the company’s equity. No further dividend shall be distributed on the preference shares.
Paragraph 2Subsequently such allocations to reserves shall be made as the Executive Board shall determine, subject to the approval of the Supervisory Board.
Paragraph 3Any balance remaining after that shall be distributed at the disposal of the General Meeting of Shareholders.
Paragraph 5Distribution of profit shall be made after adoption of the annual accounts showing that it is permitted.
Paragraph 6Subject to approval of the Supervisory Board, the Executive Board may resolve on distribution of interim dividend, provided the requirements of paragraph 4 have been met, according to an interim statement of assets and liabilities. It shall relate to the position of the assets and liabilities no earlier than on the first day of the third month before the month in which the resolution on distribution of interim dividend is made known. It shall be
drawn up with observance of valuation methods considered generally acceptable. The statement of assets and liabilities shall include the amounts to be reserved by virtue of the law. It shall be signed by the Members of the Executive Board; if the signature of one or more of them is lacking this shall be stated with reasons. The statement of assets and liabilities shall be deposited at the office of the Commercial Register within eight days after the day on which the resolution on distribution is made known.
Paragraph 7If a loss is suffered for any year, that loss shall be transferred to a new account for set-off against future profits, and for that year no dividend shall be distributed. Based on the proposal of the Executive Board that has been approved by the Supervisory Board, the General Meeting of Shareholders may resolve, however, to delete such a loss by writing it off on a reserve that need not be maintained, according to the law.
Article 30 of the Articles of AssociationParagraph 1On the proposal of the Executive Board that has been approved by the Supervisory Board, the General Meeting of Shareholders may resolve that a distribution of dividend on ordinary shares shall be made entirely or partially not in money but in ordinary shares in the capital of the company.
Paragraph 2On the proposal of the Executive Board that has been approved by the Supervisory Board, the General Meeting of Shareholders may resolve on distributions in money or in the manner as referred to in Paragraph 1 to holders of ordinary shares against one or more reserves that need not be maintained under the law.
Articles of Association Provisions Governing Profit Appropriation

196 197Wolters Kluwer 2019 Annual Report Wolters Kluwer 2019 Annual Report
Table of Contents | Consolidated Financial Statements | Company Financial Statements
Wolters Kluwer Shares and Bonds
American Depositary Receipts
Wolters Kluwer has a sponsored Level I American Depositary Receipt (ADR) program. The ratio of ADRs to ordinary shares is 1:1. The ADRs are denominated in U.S. dollar and are traded on the over-the-counter (OTC) securities market in the United States. The ADRs receive the same dividends as the ordinary shares converted into U.S. dollar at the prevailing €/$ exchange rate.
ADR depositary bank: Deutsche Bank Trust Company Americas, c/o American Stock Transfer & Trust Company, Peck Slip Station, P.O. Box 2050 New York, NY 10272-2050, United States.
Share price performance
Wolters Kluwer shares outperformed the Amsterdam AEX index and several other leading European indices in 2019. In 2019, the share price increased 26%, beating the EURO STOXX 600 which was up 23%. The MSCI Europe Commercial & Professional Services index increased 30% in 2019, while the EURO STOXX Media index increased 6%. Wolters Kluwer shares closed at €65.02 on December 31, 2019.
Over the five-year period ending December 31, 2019, Wolters Kluwer shares have appreciated by 156%, significantly outperforming the AEX index, which gained 42% over the same period. Wolters Kluwer shares also outperformed the EURO STOXX 600, which increased 21% over the same period. The MSCI Europe Commercial & Professional Services sector increased 37% over the same five-year period, while the EURO STOXX Media sector advanced by 3%.
The ADR price (quoted in U.S. dollar) has appreciated 138% over the five years to December 31, 2019, significantly outperforming the S&P 500 which rose 57% over that time frame.
Wolters Kluwer ordinary shares are listed on Euronext Amsterdam under the symbol WKL. In 2019, the average daily trading volume of Wolters Kluwer shares on Euronext Amsterdam was 642,783 shares (2018: 754,864), according to Euronext. Alternative trading venues include the market places operated by Cboe Europe Equities, Turquoise, and others.
Five-year share price performance 2015-2019 €
Five-year ADR price performance 2015-2019 U.S. $
Securities codes and ticker symbols
System Ordinary shares ADRs
ISIN NL0000395903 US9778742059
Sedol 5671519 2977049
Bloomberg WKL:NA WTKWY:US
Reuters RIC WLSNc.AS WTKWY
CUSIP – 977874205
Exchange Euronext Over-the-counter (OTC)
Source: Nasdaq/FactSet data. Indices rebased to Wolters Kluwer share price.
Source: Nasdaq/FactSet data. Indices rebased to Wolters Kluwer share price.
Wolters Kluwer Wolters Kluwer
AEX (rebased)
S&P 500 (rebased)
EURO STOXX Media (rebased)
MSCI Europe Comm & Prof Svcs (rebased)
2017 20172015 20152019 20192018 20182016 2016
70
60
50
40
30
20
80
70
60
50
40
30
20
Dividend per share €
1.20
1.10
1.00
0.90
0.80
0.70
0.60
0.50
0.40
0.30
0.20
0.10
0
Total dividend(2019 proposed)
Interim dividend*
96 97 98 99 00 01 02 03 04 05 06 07 08 09 10 11 12 13 14 15 16 17 18 19 20
0.18 0.19 0.20
0.34
0.470.340.28
0.400.46
0.50 0.53 0.55 0.55 0.55 0.550.58
0.64 0.650.66 0.67 0.68 0.69 0.70 0.71
0.750.79
0.85
1.18
0.98
Dividends
Dividend policyFor more than 30 years, Wolters Kluwer has increased or maintained its annual dividend per share in euro (or euro equivalent). In 2007, the company established a progressive dividend policy. Since 2011, all dividends are paid in cash following the termination of the stock dividend. In 2015, we introduced an interim dividend payment, aligning cash distributions closer to our seasonal cash flow pattern.
Wolters Kluwer is committed to a progressive dividend policy, under which we aim to increase the dividend per share in euro each year, irrespective of currency fluctuations. The payout ratio can therefore vary from year to year. Proposed annual increases in the dividend per share take into account our financial performance, market conditions, and our need for financial flexibility. The policy takes into consideration the characteristics of our business, our expectations for future cash flows, and our plans for organic investment in product development,
innovation and productivity, or for external investment in acquisitions. We balance these factors with the objective of maintaining a strong balance sheet.
2019 dividendIn light of our strong financial position and in view of our expected capital needs for the duration of our current three-year strategic plan (2019-2021), we are proposing to increase the total dividend per share for financial year 2019 by 20%. We will therefore recommend a final dividend of €0.79 per share, bringing the total dividend to €1.18 per share (2018: €0.98). The 2019 final dividend is subject to approval of shareholders at the Annual General Meeting in April 2020. For financial year 2020, we intend to maintain the interim distribution at 40% of prior year's total dividend. Assuming the 2019 dividend is approved, this will result in a 2020 interim dividend of €0.47 per share.
Shareholders can choose to reinvest interim and final dividends by purchasing additional Wolters Kluwer shares through the Dividend Reinvestment Plan (DRIP) administered by ABN AMRO Bank N.V.
*Proposed total dividend for 2019 is subject to AGM approval and determines interim dividend for 2020.
0.39
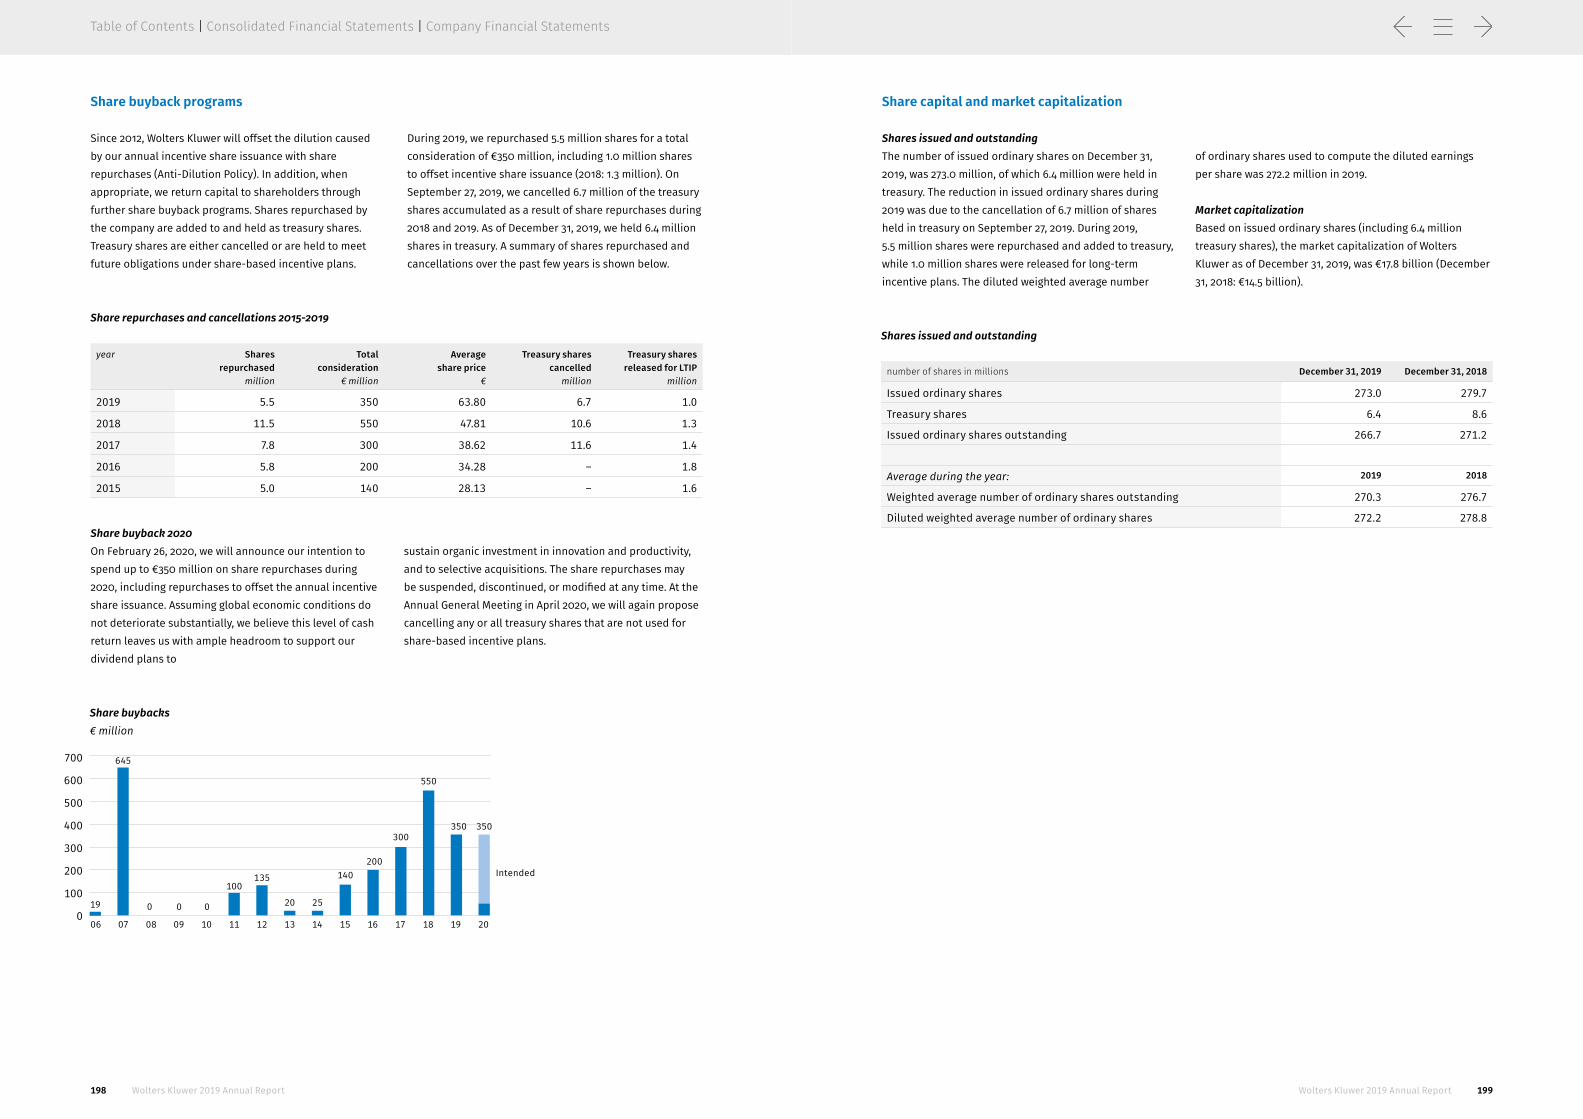
198 199Wolters Kluwer 2019 Annual Report Wolters Kluwer 2019 Annual Report
Table of Contents | Consolidated Financial Statements | Company Financial Statements
Share buyback 2020On February 26, 2020, we will announce our intention to spend up to €350 million on share repurchases during 2020, including repurchases to offset the annual incentive share issuance. Assuming global economic conditions do not deteriorate substantially, we believe this level of cash return leaves us with ample headroom to support our dividend plans to
sustain organic investment in innovation and productivity, and to selective acquisitions. The share repurchases may be suspended, discontinued, or modified at any time. At the Annual General Meeting in April 2020, we will again propose cancelling any or all treasury shares that are not used for share-based incentive plans.
Share repurchases and cancellations 2015-2019
year Shares repurchased
million
Total consideration
€ million
Average share price
€
Treasury shares cancelled
million
Treasury shares released for LTIP
million
2019 5.5 350 63.80 6.7 1.0
2018 11.5 550 47.81 10.6 1.3
2017 7.8 300 38.62 11.6 1.4
2016 5.8 200 34.28 – 1.8
2015 5.0 140 28.13 – 1.6
700
600
500
400
300
200
100
006 07 08 09 10 11 12 13 14 15 16 17 18 19 20
20
100
645
00019
135
25
140200
300350 350
550
Share buybacks € million
Share buyback programs
Since 2012, Wolters Kluwer will offset the dilution caused by our annual incentive share issuance with share repurchases (Anti-Dilution Policy). In addition, when appropriate, we return capital to shareholders through further share buyback programs. Shares repurchased by the company are added to and held as treasury shares. Treasury shares are either cancelled or are held to meet future obligations under share-based incentive plans.
During 2019, we repurchased 5.5 million shares for a total consideration of €350 million, including 1.0 million shares to offset incentive share issuance (2018: 1.3 million). On September 27, 2019, we cancelled 6.7 million of the treasury shares accumulated as a result of share repurchases during 2018 and 2019. As of December 31, 2019, we held 6.4 million shares in treasury. A summary of shares repurchased and cancellations over the past few years is shown below.
Intended
Shares issued and outstanding
number of shares in millions December 31, 2019 December 31, 2018
Issued ordinary shares 273.0 279.7
Treasury shares 6.4 8.6
Issued ordinary shares outstanding 266.7 271.2
Average during the year: 2019 2018
Weighted average number of ordinary shares outstanding 270.3 276.7
Diluted weighted average number of ordinary shares 272.2 278.8
Share capital and market capitalization
Shares issued and outstandingThe number of issued ordinary shares on December 31, 2019, was 273.0 million, of which 6.4 million were held in treasury. The reduction in issued ordinary shares during 2019 was due to the cancellation of 6.7 million of shares held in treasury on September 27, 2019. During 2019, 5.5 million shares were repurchased and added to treasury, while 1.0 million shares were released for long-term incentive plans. The diluted weighted average number
of ordinary shares used to compute the diluted earnings per share was 272.2 million in 2019.
Market capitalizationBased on issued ordinary shares (including 6.4 million treasury shares), the market capitalization of Wolters Kluwer as of December 31, 2019, was €17.8 billion (December 31, 2018: €14.5 billion).

200 201Wolters Kluwer 2019 Annual Report Wolters Kluwer 2019 Annual Report
Table of Contents | Consolidated Financial Statements | Company Financial Statements
Shareholder structure
Approximately 87% of the issued ordinary share capital of Wolters Kluwer is held by institutional investors. The remaining shares are held by retail investors, broker-dealers, or are held in treasury by Wolters Kluwer. Nearly two-thirds of the shares held by institutional investors are with firms that designate themselves as socially responsible (SRI) and approximately 15% are in core SRI or ESG funds. As of November 2019, approximately 24% of institutionally-held shares were held in passive, index, or quant funds. Investors in the United States hold the largest percentage of institutionally-held shares. Approximately 43% of institutionally-owned shares is held in North America, 29% in the United Kingdom, and 24% in Continental Europe.
AFM notifications of substantial holdings
Institution Capital interest Date of notification
Lazard Asset Management Company, LLC 5.09% October 24, 2015
FIL Limited 4.93% November 23, 2018
BlackRock, Inc. 4.76% March 15, 2019
Mawer Investment Management Ltd 3.05% November 14, 2017
Source: AFM website, as of February 24, 2020
Industry classification by main index providers
Main index provider System used Wolters Kluwer Industry Classification (Code)
Bloomberg BICS Technology: Technology Services: Information Services (1814)
STOXX, FTSE Russell ICB Consumer Services: Media: Media: Publishing (5557)
MSCI, S&P, Dow Jones GICS Industrials: Commercial & Professional Services: Research & Consulting Services (20202020)
Source: Bloomberg, FTSE Russell, MSCI, S&P Global, STOXX
Geographical distribution of Wolters Kluwer shares held by institutions
United States 37% Canada 5% United Kingdom 29% France 7% Germany 4% Switzerland 3% Netherlands 3% Rest of Europe 7% Rest of World 5%
Source: Nasdaq Corporate Solutions, as of November 30, 2019
Industry classifications
Wolters Kluwer has traditionally been classified as a publishing company as part of the media industry. The company’s increased focus on professional information,
software solutions, and services has led some index providers to reclassify the company into Research & Consulting Services.
Significant shareholders Shareholders who have notified the Dutch Authority for the Financial Markets (AFM) of a capital interest exceeding
the 3% reporting threshold are shown below. Updates can be found on the AFM website (www.afm.nl).
Wolters Kluwer weight in selected indices
Index Weight %
AEX 2.87
Euronext 100 0.59
EURO STOXX® 0.39
EURO STOXX® MEDIA 23.07
STOXX® Europe 600 0.20
STOXX® Europe 600 Media 9.93
STOXX® Europe 600 ESG-X 0.22
STOXX® Global ESG Leaders 0.33
MSCI Europe Commercial & Professional Services 10.02
MSCI World Commercial & Professional Services 3.43
Sources: Euronext, STOXX, MSCI, S&P. Weightings as of December 31, 2019.
ESG analyst ratings
Provider 2016 2017 2018 2019
Sustainalytics 98.6 87.3 87.2 92.5
ISS Quality Score 3 3 1 1
Bloomberg ESG 43.4 40.5 37.2 n/a
MSCI ESG Ratings A A AA AAA
Source: Sustainalytics, ISS, Bloomberg, MSCI. All scores or ratings as of December 31.
Indices
Wolters Kluwer shares are included in many stock market indices. Some of the most widely followed indices are shown below.
Equity research and ESG ratings
Wolters Kluwer is followed by approximately 25 sell-side financial analysts, of which, to our knowledge, 18 analysts are actively publishing recommendations, estimates, and research. As of February 6, 2020, five of the active analysts have an outperform rating, while the remainder are neutral or underperform. A list of analysts can be found on the Wolters Kluwer Investor Relations website.
A diverse range of research firms are publishing ESG research and ratings on Wolters Kluwer, based on varying methodologies. A selection of publicly available ratings is shown in the table below.

202 203Wolters Kluwer 2019 Annual Report Wolters Kluwer 2019 Annual Report
Table of Contents | Consolidated Financial Statements | Company Financial Statements
Wolters Kluwer listed fixed-income issues
Debt security Due Amount € million
Listing ISIN
4.200% private placement December 2020 250 Frankfurt XS0522820801
2.875% senior bonds March 2023 700 Luxembourg XS0907301260
2.500% senior bonds May 2024 400 Luxembourg XS1067329570
1.500% senior bonds March 2027 500 Luxembourg XS1575992596
6.748% senior bonds August 2028 36 Luxembourg XS0384322656
Commercial Paper
Type As of Amount € million
Total facility€ million
Euro Commercial Paper (ECP) December 31, 2019 200 1,000
Fixed-income issuesCurrently, Wolters Kluwer has five Eurobonds or other listed debt securities with a total face value of €1,886 million.
The nominal interest rates on the bonds are fixed until redemption.
On May 7, 2019, Wolters Kluwer established a Euro Commercial Paper (ECP) program, under which the company may issue unsecured, short-term debt (ECP notes) for a maximum of €1.0 billion. The program provides
flexible funding for short-term cash needs at attractive rates. The outstanding amount per December 31, 2019, is €200 million and included in borrowings and bank overdrafts.
Credit ratings on Wolters Kluwer senior long-term debt have been provided by Moody’s Investor Services and S&P
Global Ratings for many years. Wolters Kluwer is committed to maintaining investment grade credit ratings.
Credit ratings
Agency Long-term Short-term Outlook Date of rating Date affirmed
Moody’s Baa1 – Stable September 12, 2013 April 12, 2019
S&P BBB+ A-2 Stable March 7, 2013 May 27, 2019
Source: Moody’s, S&P Global
Investor Relations
EngagementWe communicate with our shareholders and other investors through a comprehensive investor relations program that includes our half-year and full-year financial results releases, our annual report, and other information published on our investor relations website. We host live webcast presentations of our half-year and full-year results, hold an Annual General Meeting of Shareholders, and organize periodic investor briefings.
We engage through an active schedule of events throughout the year, meetings with investors on roadshows in key financial centers and at investor conferences. We held more than 200 one-on-one or group meetings during 2019. The Executive Board met with shareholders representing more than half of our share capital.
In November 2019, members of the Supervisory Board also held consultative meetings with our largest shareholders in Europe and the United States to hear their views on the remuneration policy. Opinions and policies on this topic are diverse, but we received constructive feedback which has helped us update our remuneration policy to reflect the evolving nature of the business. For a more extensive discussion, please refer to the Remuneration Report.
Investor Relations is focused on helping the market understand our business, our strategy, our markets, as well as our financial performance. We aim to be responsive and proactive and welcome direct feedback from investors. Wolters Kluwer is committed to a high degree of transparency in its financial reporting and strives to be open with its shareholders and the wider investment community.
Investor Relations policyWolters Kluwer is strict in its compliance with applicable rules and regulations on fair disclosure to shareholders. Presentations are posted publicly on the company’s website as and when they are made available to analysts and investors. In adherence with fair disclosure rules, meetings and presentations do not take place during ‘closed periods’ before the publication of annual and quarterly financial information. The company does not assess, comment upon, or correct, other than factually, any analyst report or valuation prior to publication. The company is committed to helping investors and analysts become better acquainted with Wolters Kluwer and its management, as well as to maintain a long-term relationship of trust with the investment community at large.
Financial calendar
2020
April 23 Annual General Meeting of Shareholders
April 27 Ex-dividend date: 2019 final dividend
April 28 Record date: 2019 final dividend
May 6 First-Quarter 2020 Trading Update
May 20 Payment date: 2019 final dividend, ordinary shares
May 27 Payment date: 2019 final dividend, American Depositary Shares
August 5 Half-Year 2020 Results
September 1 Ex-dividend date: 2020 interim dividend
September 2 Record date: 2020 interim dividend
September 24 Payment date: 2020 interim dividend, ordinary shares
October 1 Payment date: 2020 interim dividend, American Depositary Shares
October 30 Nine-Month 2020 Trading Update
2021
February 24 Full-Year 2020 Results
March 10 Publication of 2020 Annual Report

204 205Wolters Kluwer 2019 Annual Report Wolters Kluwer 2019 Annual Report
Table of Contents | Consolidated Financial Statements | Company Financial Statements
Five-Year Key Figures
2019 2018* 2017** 2016 2015
Revenues 4,612 4,259 4,368 4,286 4,208
Operating profit 908 967 830 766 667
Profit for the year, attributable to owners of the company 669 656 636 489 423
Adjusted EBITDA 1,382 1,274 1,179 1,129 1,073
Adjusted operating profit 1,089 986 970 950 902
Adjusted net financing costs (58) (77) (109) (107) (119)
Adjusted net profit 790 682 639 618 583
Adjusted free cash flow 807 762 746 708 647
(Proposed) dividend/cash distribution 315 266 239 227 219
Acquisition spending 34 166 313 450 179
Capital expenditure 226 214 210 224 188
Amortization of other intangible assets, depreciation of PPE and right-of-use assets, and impairments 293 288 209 179 171
Amortization and impairment of acquired identifiable intangible assets 182 175 187 181 214
Shareholders’ equity 2,380 2,254 2,228 2,621 2,472
Guarantee equity 2,380 2,254 2,232 2,626 2,477
Net debt 2,199 2,249 2,069 1,927 1,788
Capital employed 4,966 5,013 4,845 5,637 5,329
Total assets 8,775 8,544 8,477 8,839 8,099
Ratios
As % of revenues:
Operating profit 19.7 22.7 19.0 17.9 15.8
Profit for the year, attributable to owners of the company 14.5 15.4 14.6 11.4 10.1
Adjusted EBITDA 30.0 29.9 27.0 26.4 25.5
Adjusted operating profit 23.6 23.1 22.2 22.2 21.4
Adjusted net profit 17.1 16.0 14.6 14.4 13.8
ROIC (%) 11.8 10.6 10.0 9.8 9.3
Dividend proposal in % of adjusted net profit 39.8 39.0 37.4 36.8 37.5
Dividend proposal in % of profit for the year, attributable to owners of the company 47.1 40.5 37.6 46.4 51.7
Cash conversion ratio (%) 96 104 100 100 100
Net interest coverage 18.7 12.8 8.9 8.9 7.6
Net-debt-to-EBITDA 1.6 1.8 1.8 1.7 1.7
Net gearing 0.9 1.0 0.9 0.7 0.7
Shareholders’ equity / capital employed 0.48 0.45 0.46 0.46 0.46
Guarantee equity to total assets 0.27 0.26 0.26 0.30 0.31
2019 2018* 2017** 2016 2015
Information per share (€)
Total dividend proposal in cash per share 1.18 0.98 0.85 0.79 0.75
Basic earnings per share 2.47 2.37 2.23 1.68 1.44
Adjusted earnings per share 2.92 2.47 2.24 2.12 1.98
Adjusted free cash flow per share 2.98 2.75 2.62 2.43 2.21
Based on fully diluted:
Diluted earnings per share 2.46 2.35 2.21 1.66 1.42
Diluted adjusted earnings per share 2.90 2.45 2.22 2.10 1.96
Diluted adjusted free cash flow per share 2.96 2.73 2.59 2.40 2.18
Weighted average number of shares issued (millions) 270.3 276.7 285.1 291.6 293.6
Diluted weighted average number of shares (millions) 272.2 278.8 287.7 294.6 297.4
Stock exchange (€)
Highest quotation 67.72 55.68 44.80 38.69 33.56
Lowest quotation 49.98 39.19 34.25 28.24 24.71
Quotation at December 31 65.02 51.66 43.48 34.42 30.97
Average daily trading volume Wolters Kluwer on Euronext Amsterdam N.V., number of shares (thousands of shares) 643 755 719 912 1,232
Employees
Headcount at December 31 18,979 18,553 18,830 18,807 18,692
In full-time equivalents at December 31 18,361 18,134 18,315 18,318 18,055
In full-time equivalents average per annum 18,883 18,687 18,982 18,910 19,296
* Restated for IFRS 16, IFRIC 23, and certain reclassifications. See Note 1 – General and Basis of Preparation.** Restated for IFRS 15.

206 207Wolters Kluwer 2019 Annual Report Wolters Kluwer 2019 Annual Report
Table of Contents | Consolidated Financial Statements | Company Financial Statements
Adjusted‘Adjusted’ refers to figures from continuing operations, adjusted for non-benchmark items and, where applicable, amortization and impairment of goodwill and acquired identifiable intangible assets. ‘Adjusted’ figures are non-IFRS compliant financial figures but are internally regarded as key performance indicators to measure the underlying performance of the business.
Adjusted earnings per shareAdjusted net profit divided by the weighted average number of ordinary shares outstanding.
Adjusted EBITDAEBITDA, adjusted for non-benchmark items in operating profit.
Adjusted net financing costsTotal financing results adjusted for non-benchmark items in total financing results.
Adjusted net profitProfit for the year from continuing operations attributable to the owners of the company, excluding the after-tax effect of non-benchmark items, amortization of acquired identifiable intangible assets, and impairments of goodwill and acquired identifiable intangible assets.
Adjusted operating profitOperating profit before amortization and impairment of acquired identifiable intangible assets and impairment of goodwill and adjusted for non-benchmark items.
Adjusted operating profit marginAdjusted operating profit as a percentage of revenues.
Adjusted profit before taxSum of adjusted operating profit, adjusted net financing costs, income from investments, and share of profit of equity-accounted investees (net of tax).
Allocated taxAllocated tax is benchmark tax rate multiplied by adjusted operating profit.
Basic earnings per shareThe profit or loss attributable to the ordinary shareholders of the company, divided by the weighted average number of ordinary shares outstanding during the period.
Benchmark tax rateTax on adjusted profit, divided by adjusted profit before tax.
Capital employed Total assets minus current liabilities.
Capital expenditureSum of capitalized expenditure on property, plant, and equipment and other intangible assets less anycarrying value of assets disposed of.
Cash flow: cash conversion ratioAdjusted operating cash flow divided by adjusted operating profit.
Cash flow: adjusted free cash flowNet cash from operating activities less capital expenditure, plus paid acquisition and divestment expenses, plus dividends received, and one-off cash tax items. Adjusted free cash flow is the cash flow available for payment of dividends to shareholders, acquisitions, repayments of debt, and repurchasing of shares.
Cash flow: adjusted operating cash flowAdjusted EBITDA plus or minus autonomous movements in working capital, less capital expenditure, less repayments of lease liabilities and lease interest paid.
Constant currenciesIncome, expense, and cash flows in local currencies are recalculated to euros, using the average exchange rates of the previous calendar year.
Continuing operationsThe results of the group, excluding the results of those components that have been presented as discontinued operations.
Diluted adjusted earnings per shareAdjusted earnings per share adjusted for the effects of all dilutive potential ordinary shares.
Shares conditionally awarded under LTIP-plans are included in the calculation of the diluted weighted average number of ordinary shares outstanding if the vesting conditions are satisfied.
Diluted earnings per shareBasic earnings per share adjusted for the effects of all dilutive potential ordinary shares.
Shares conditionally awarded under LTIP-plans are included in the calculation of the diluted weighted average number of ordinary shares outstanding if the vesting conditions are satisfied.
EBITAEBITA (earnings before interest, tax, and amortization) is calculated as operating profit plus amortization and impairment of acquired identifiable intangible assets and impairment of goodwill.
EBITDAOperating profit before amortization and impairment of acquired identifiable intangible assets and impairment of goodwill, and before amortization and impairment of other intangible assets and depreciation and impairment of property, plant, and equipment, and right-of-use assets.
Guarantee equitySum of total equity, subordinated (convertible) bonds, and perpetual cumulative bonds.
Invested capitalTotal assets minus current liabilities, excluding investments in equity-accounted investees, deferred tax assets, non-operating working capital and cash and cash equivalents. This total is adjusted for accumulated amortization on acquired identifiable intangible assets, goodwill amortized pre-IFRS, and goodwill written off to equity pre-IFRS (excluding acquired identifiable intangible assets and goodwill impaired and/or fully amortized), less any related deferred tax liabilities. The average invested capital is based on five measurement points during the year.
Net debtSum of long-term debt, borrowings and bank overdrafts, and deferred and contingent acquisition payables minus cash and cash equivalents, divestment receivables, collateral deposited, and the net fair value of derivative financial instruments.
Net-debt-to-EBITDA ratioNet debt divided by EBITDA, adjusted for divestment-related results on operations.
Net gearingNet debt divided by total equity.
Net interest coverageAdjusted operating profit, divided by adjusted net financing costs.
Non-benchmark itemsNon-benchmark items relate to expenses arising from circumstances or transactions that, given their size or nature, are clearly distinct from the ordinary activities of the group, and are excluded from the benchmark figures.
Non-benchmark items in operating profit: amortization and impairment of acquired identifiable intangible assets, results from divestments (including directly attributable divestment costs), additions to provisions for restructuring of stranded costs following divestments, acquisition-related costs, additions to acquisition integration provisions, subsequent fair value changes on contingent considerations, loss on
remeasurement on assets classified as held for sale, and other.
Non-benchmark items in total financing results: financing component employee benefits, gains and losses on financial assets at fair value through profit or loss, and divestment-related results on equity-accounted investees.
NOPATNet operating profit after allocated tax. Adjusted operating profit less allocated tax.
Operating accounts receivablesOperating accounts receivables consist of prepayments and miscellaneous receivables.
Operating current liabilitiesOperating current liabilities consist of salaries and holiday allowances, social security premiums and other taxation, pension-related payables, royalty payables, and other accruals and payables.
Organic revenue growthCalculated as revenue for the period, excluding the impact of acquisitions above a minimum threshold, divided by revenue for the period in the previous reporting period, adjusted for the impact of divestments of operations above a minimum threshold, all translated at constant currencies.
Tax on adjusted profitIncome tax expense adjusted for tax benefits on amortization of acquired identifiable intangible assets and impairments, tax on non-benchmark items, and the income tax effect of any material changes in (income) tax laws and (income) tax rates in the jurisdictions where the group operates.
Working capitalCurrent assets less current liabilities.
Working capital: non-operating working capitalNon-operating working capital is the total of the current receivables/payables of derivative financial instruments, the short-term part of the provisions, divestment receivables, current deferred and contingent acquisition payables, interest receivable/payable, current income tax assets/liabilities, borrowings and bank overdrafts, short-term part of bonds, private placements, and lease liabilities, and the assets and liabilities classified as held for sale.
Working capital: operating working capitalOperating working capital is working capital, minus non-operating working capital and cash and cash equivalents.
Glossary Contact Information
Wolters Kluwer N.V. Zuidpoolsingel 2P.O. Box 10302400 BA Alphen aan den Rijn The Netherlands
[email protected]/company/wolters-kluwerwww.facebook.com/wolterskluwer www.twitter.com/wolters_kluwer
Chamber of CommerceTrade Registry No. 33.202.517
Trademarks referenced are owned by Wolters Kluwer N.V. and/or its subsidiaries and may be registered in various countries.
Forward-looking statements and other important legal information
This report contains forward-looking statements. These statements may be identified by words such as “expect”, “should”, “could”, “shall” and similar expressions. Wolters Kluwer cautions that such forward-looking statements are qualified by certain risks and uncertainties that could cause actual results and events to differ materially from what is contemplated by the forward-looking statements. Factors which could cause actual results to differ from these forward-looking statements may include, without limitation, general economic conditions; conditions in the markets in which Wolters Kluwer is engaged; behavior of customers, suppliers, and competitors; technological developments; the implementation and execution of new ICT systems or outsourcing; and legal, tax, and regulatory rules affecting Wolters Kluwer’s businesses, as well as risks related to mergers, acquisitions, and divestments. In addition, financial risks such as currency movements, interest rate fluctuations, liquidity, and credit risks could influence future results. The foregoing list of factors should not be construed as exhaustive. Wolters Kluwer disclaims any intention or obligation to publicly update or revise any forward-looking statements, whether as a result of new information, future events or otherwise.
About this report
Sustainability information is integrated within the 2019 Annual Report. For more information on sustainability, visit www.wolterskluwer.com.
This Annual Report is also available as a PDF on our website www.wolterskluwer.com.
Cover image: Our colleague Eric Alberts, Manager User Experience Design at the Digital eXperience Group, in conversation with his colleagues in front of his visualization of trends that impact our markets, our customers, and the ongoing transformation of our expert solutions.