annual report - vivopower
TRANSCRIPT
ANNUAL REPORT For the year ended 31 March 2019
VIVOPOWER INTERNATIONAL PLC Annual Report and Accounts

Contents The Reports Page Highlights 1 Chairman’s Statement 2 Interim Chief Executive’s Review 3 Strategic Report 5 Directors’ Report 17 Corporate Governance 23 Directors’ Remuneration Report 26 Independent Auditor’s Report to the Members of VivoPower International PLC 31 Group Financial Statements and Notes Consolidated Statement of Comprehensive Income 35 Consolidated Statement of Financial Position 36 Consolidated Statement of Cash Flow 37 Consolidated Statement of Changes in Equity 38 Notes to the Financial Statements 39 Parent Company Financial Statements and Notes Company Statement of Financial Position 68 Company Statement of Cash Flow 69 Company Statement of Changes in Equity 70 Notes to the Company Financial Statements 71 Other Information Company Information 74
VivoPower International PLC VivoPower International PLC is an international solar and critical power services company, providing critical energy infrastructure generation and distribution solutions to a diverse range of commercial and industrial customers, including the development, construction, and sale of photovoltaic solar projects.
Nasdaq: VVPR

Highlights
Page | 1
(US dollars in thousands, except per share data) 2019 2018
Revenue 39,036 33,647
Gross profit 6,310 5,123
Operating loss (5,410) (7,595)
Adjusted EBITDA* (1,176) (3,201)
Basic earnings per share (dollars) (0.83) (2.06)
Diluted earnings per share (dollars) (0.83) (2.06) * Adjusted EBITDA is a non-IFRS financial measure. We define Adjusted EBITDA as earnings before interest, taxes, depreciation and amortisation, impairment of assets, impairment of goodwill, and one-off non-recurring costs, including restructuring expenses, non-recurring remuneration and consulting fees. We believe that Adjusted EBITDA and Adjusted earnings per share provides investors and other users of our financial information consistency and comparability with our past financial performance, facilitates period-to-period comparisons of operations and facilitates comparisons with our peer companies, many of which use a similar non-IFRS or generally accepted accounting principles in the United States (“GAAP”) financial measure to supplement their IFRS or GAAP results, as applicable.
19% revenue growth in Critical Power Services with improved margins
Record forward order book of $54.2 million in Critical Power Services with new contract wins in solar, data centres, and health services
First Australian 15 MW solar project on target for 2019 monetisation
Completed sale of North Carolina solar projects for $11.5 million
54% ($5.8 million annualised) reduction in Corporate and Solar Development overheads
Unrestricted cash resources increased to $4.5 million from $1.9 million previous year
Net debt reduced by $5.7 million to $14.7 million
Accomplishments
Chairman’s Statement
Page | 2
The fiscal year ended 31 March 2019 has seen a significant improvement in results for VivoPower International PLC (“VivoPower” or the “Company”), reflecting a strong turnaround in performance during the second half of the financial year. The key developments during FY2019 were as follows:
• Delivered revenue growth of 16% to $39 million, which was above budget and primarily reflects the strong outperformance of our Australian critical power services businesses (notwithstanding adverse foreign exchange movements);
• Implemented lean management practices, including streamlining leadership and board, resulting in a 54% reduction in the Company’s corporate and solar development overheads. Together with improved gross profit margins, this has seen a reduction in the adjusted EBITDA loss to $1.2 million from $3.2 million in the prior year;
• Improved balance sheet, with an increase in unrestricted cash to $4.5 million from $1.9 million in the prior year and reduced net debt from $20.4 million to $14.7 million;
• Exponential growth in the contracted forward order book for Aevitas, our critical power services business in Australia. With contract wins since year-end, the order book reached another all-time record high of $54.2 million, representing a 261% increase on $15 million this time last year;
• Significant progress in the Australian solar development arm with over 70 MW of qualified projects; and, • Progressed U.S. portfolio value enhancement, maximisation of sale process with new international buyers
now engaged in due diligence, with a revised process of bottom up project-by-project monetisation.
The financial year ended 31 March 2019 was a tale of two halves and two geographies, with outperformance in the second half of the fiscal year (versus the first half) and by our Australian businesses (versus our U.S. business). During the second half of the year, the board decided to take a more hands on role and also appointed Art Russell to be Interim Chief Executive Officer of the Company. During this period, overheads were reduced substantially, the U.S. portfolio value realisation process was taken in-house with regular proactive engagement with our joint venture partner introduced, the balance sheet was improved, and the Australian businesses secured even more forward orders.
The Board is also focused on continuously improving governance, as it seeks to ensure that VivoPower continues to increase its B Corp score. In this regard, an external independent review of board members and leadership performance was undertaken during the year. This practice will continue each year and will be led by our Senior Independent Director, Shimi Shah. We will also appoint another independent director to the board. In addition to governance, the Board is conscious of the heightened risk of cybersecurity attacks and is keen to ensure the Company remains attack free. Aside from implementing GDPR data protection protocols, it has also sanctioned a targeted upgrade to IT security to ensure no information or monies are lost to cyber-attacks. VivoPower’s primary objectives for the year ahead are to return to profitability as well as enhance and maximise value from monetisation of its 1.8 GW U.S. portfolio in an orderly project-by-project manner. A detailed bottom up review by our new in-house sales leader revealed that a top-down whole of portfolio sale approach is not conducive to value maximisation, nor was the lack of proactivity in originating and securing corporate power purchase agreements (“PPAs”) (which can transform the value of projects). With a new in-house sales leader in place, VivoPower has now taken greater control of the PPA workstream as well as the broader sale process. We continue to field interest from a range of parties, including international groups, but are keen to ensure we are able to enhance and maximise value in a patient and orderly manner. In the year ahead, VivoPower expects to return to profitability given the strong forward order book in Australia and reduced overhead cost base. Furthermore, monetisation of the U.S. portfolio will enable the Board to evaluate and, as appropriate, execute on value accretive strategic pivot options. On behalf of the rest of the Board, I would like to take this opportunity to thank all of our stakeholders for their support and engagement during the period. Rest assured, the VivoPower team and the Board remains steadfastly committed to overcoming challenges and maximising value across its business units.
Kevin Chin, Chairman 10 July 2019

Chief Executive’s Review
Page | 3
Overview
Agility and resilience have been required in the past financial year, as VivoPower’s businesses in Australia strongly outperformed and delivered above expectations, whilst the U.S business did not meet expectations, against the backdrop of changing market dynamics. Overall, the Company was able to deliver solid year-on-year revenue growth of 16%, largely due to strong growth in the Australian Critical Power Services businesses. We also aggressively reduced non-cash generative overheads which helped deliver a marked improvement in adjusted EBITDA, albeit it was still a loss of $1.2 million.
Australia
Aevitas, our critical power services businesses in Australia, represented by J.A. Martin Electrical Pty Limited (“J.A. Martin”) and Kenshaw Electrical Pty Limited (“Kenshaw”), focus on the design, supply, installation and maintenance of critical power and control systems. The revenue from these businesses grew to $37.8 million, an increase of 19% from the previous year, while improving gross margins to 14.5% from 13.6% due to pricing and efficiency initiatives. Excluding the foreign currency effect, underlying revenue growth in Australian dollar terms was 28%. In addition, these businesses secured a record forward order book of $34.3 million as at 31 March 2019, with an additional $19.9 million secured post balance date, which is expected to propel even stronger growth in the coming year. More importantly to the long-term growth and sustainability of these businesses is that this revenue growth has come from largely new industry sectors, encompassing solar, data centres, hospitals and aged care facilities which are all sectors buoyed by significant growth tailwinds.
In particular, J.A. Martin has seen its revenue base transform over the last 12 months, with an increasing contribution from the rapidly growing solar farm sector (whereas historically it has had greater reliance on mining, utilities and general industrials sectors). This was a deliberate strategy pivot that is finally bearing fruit. J.A. Martin successfully completed work for two solar farm projects this past year totaling 15 MW. As a result, it has now been certified by the Clean Energy Council (CEC) in Australia to be able to conduct the entire engineering, procurement, and construction (“EPC”) value chain for solar farms. J.A. Martin’s strategy is to focus on the small and medium scale solar projects segment of the market, which is less competitive, offers better margins, and significant growth opportunities. This growth outlook is already reflected in J.A. Martin’s current business development pipeline, which includes a further five projects worth an aggregate of $28 million (for which they expect to be prime contenders).
In a similar vein, Kenshaw has strategically positioned itself to expand its customer base to encompass growth sectors like data centres and health services infrastructure (including hospitals and aged care facilities). Kenshaw has completed another record year in generator supply and installations for data centres and has also secured two new contract wins to provide backup power generation upgrades to active treatment hospitals.
VivoPower has also continued our focus on the profitable development and sale of solar power projects throughout Australia. During the past year, the Company signed a definitive investment agreement with a leading Australian solar power developer, ITP Renewables, to partner in the development of a minimum of 50 MW utility-scale solar projects. The first project under this arrangement was initiated in July 2018 for the development of a 15 MW project that is expected to be construction ready in September 2019. Discussions are underway with various investors and VivoPower expects to achieve returns of up to 5.0x of invested capital on this project over the one-year investment period. A second solar project under this agreement has recently been approved and is expected to complete development by March 2020. VivoPower believes its continued focus and investment in the Australian solar development market is strategic, not only for the returns which it can provide due to some of the highest power prices in the world, but also for the pipeline of potential EPC work it can provide to J.A. Martin. While our Australian solar business has been slow to develop momentum, we believe this business now has the capacity to grow exponentially over the next two to five years and contribute both significant development profits to VivoPower and EPC opportunities to J.A. Martin.

Chief Executive’s Review (continued)
Page | 4
United States
The performance of the Company’s portfolio of U.S. solar projects held through Innovative Solar Ventures I, LLC (the “ISS Joint Venture”) has been below expectations. The ISS Joint Venture represents a 50% ownership in a diversified portfolio of 38 solar projects in 9 states, with a combined potential electrical generating capacity of 1.8 GW. When the original commitment to the ISS Joint Venture was made in 2017, it was expected that a majority percentage of these projects would become construction ready over a period of 1 to 5 years beginning in 2018. This would provide VivoPower with a profitable and recurring flow of development fees over this period, with an ever-increasing pool of cash generated from each project being recycled to the next, allowing for increased retention of equity interests in solar projects and development of a significant portfolio of long-term cash generating assets. Market dynamics and in particular Trump’s solar tariffs has adversely impacted this strategy. Nonetheless, there are solar developers in the US market doing well.
Following the completion of an independent forensic bottom up review commissioned by the board in January 2019, it was revealed that there had been a number of joint venture management issues that have contributed to the underperformance. These included a lack of proactive origination with regards to corporate PPAs, a lack of communication and alignment between our joint venture partner and former VivoPower team members, suboptimal documentation with regards to permits and other developments approvals, amongst other things. These basic development management issues have now been resolved but it is disappointing, as we should and could have been at a much more advanced stage of portfolio development and value creation at least a year ago but for these issues.
Year Ahead
Whilst revenue growth has been strong this past year, we are conscious that the Company has not returned to profitability as yet. This is a primary objective for the year ahead and we are working hard to ensure that the strong revenue growth trajectory of the Australian business translates into healthy profits. Over the past year, we have reduced our general and administrative expenses in solar and corporate by 54%, or $5.8 million, to $4.9 million run rate from a $10.6 million burn rate in the prior year. We will continue to press hard on every cost not directly attributable to cash generative activities and expect to see further overhead cost reductions of at least $1.5 million in the coming year. In addition, we will continue to work on improving gross profit margins.
Furthermore, we are working hard but in an orderly and considered manner to enhance value and maximise potential monetisation proceeds from the U.S. solar project portfolio. A key focus here is originating and securing corporate PPAs for appropriate projects; for other projects, we may still choose to sell them without PPAs, however, what is key is that the process is run as a bottom up not a top down process.
Other Comments
I am grateful for the support of our team through a very challenging year and thank them for their dedication and commitment. I would also like to thank our various stakeholders, including suppliers and patient shareholders who have stuck by us. I am confident that with attention to detail and persistence in doing the right things, VivoPower can and will be a success for all.
Art Russell Interim Chief Executive Officer 10 July 2019

Strategic Report
Page | 5
Principal Activities
VivoPower is an international solar and critical power services company that focuses on small and medium scale solar development, engineering, procurement and construction (“EPC”) and selected solar asset ownership and maintenance. Headquartered in London, VivoPower has operations in the United States, Australia and the United Kingdom. Management analyses our business in three reportable segments: Critical Power Services, Solar Development, and Corporate Office. Critical Power Services is represented by J.A. Martin Electrical Pty Limited (“J.A. Martin”) and Kenshaw Electrical Pty Limited (“Kenshaw”) operating in Australia with a focus on the design, supply, installation and maintenance of power and control systems, including for solar farms. Solar Development is the development and sale of commercial and utility scale PV solar power projects in the U.S. and Australia. Corporate Office is the Company’s corporate functions, including costs to maintain the Nasdaq public company listing, comply with applicable SEC reporting requirements, and related investor relations and is located in the United Kingdom. See Note 4.2 to our consolidated financial statements included herein for a breakdown of our financial results by reportable segment. Critical Power Services
VivoPower, through its wholly-owned Australian subsidiaries, J.A. Martin and Kenshaw, provide critical energy infrastructure generation and distribution solutions including the design, supply, installation and maintenance of power and control systems to a customer base in excess of 750 active commercial and industrial customers and is considered a trusted power adviser. J.A. Martin and Kenshaw are headquartered in the Hunter Valley and Newcastle region, which is the most densely populated industrial belt in Australia. Structural and cyclical factors have created a strong operating environment for our Critical Power Services businesses, particularly the strong growth in infrastructure investment, recovery in the mining sector, and increasing demand for data centres and solar farms. J.A. Martin and Kenshaw are owned by VivoPower through a holding company called Aevitas, which was formed in 2013 and acquired by VivoPower in December 2016. The Critical Power Services businesses have several core competencies, encompassing a range of electrical, mechanical and non-destructive testing services. J.A. Martin Electrical Pty Limited Founded in 1968, J.A. Martin is a specialised industrial electrical engineering and power services company that has been servicing the largest commercial and industrial belt in Australia, the Newcastle and Hunter Valley region in NSW, for more than 50 years. J.A. Martin operates from three premises in New South Wales, including a factory in Newcastle which manufactures, and services customised industrial switchboards and motor control centers. It has two office and workshop facilities, in the Hunter Valley for servicing the infrastructure, mining and industrial sectors, and in the Liverpool Plains for servicing customers in the infrastructure and mining sectors. J.A. Martin’s core competencies include: customised industrial switchboard and motor control center design, manufacture and maintenance; industrial electrical engineering, project management for mining, infrastructure and industrial applications; solar farm electrical contracting and EPC; electrical maintenance and servicing; and, industrial, mining and infrastructure CCTV and data cabling. With 120 employees and a fleet of 80 service vehicles J.A. Martin has built a strong reputation throughout eastern Australian for exceptional engineering and design, delivered on time and budget, supported by a high-level of quality and service. J.A. Martin serviced over 260 customers in the past year across a diverse range of industries, including solar farms, grain handling and agriculture, water and gas utilities, cotton gins, commercial buildings, mining, marine and rail infrastructure. J.A. Martin’s commitment to health & safety and quality, as recognised by their AS 4801 and ISO 9001 certifications, has positioned them to service some of the largest and most respected firms in the world.
Strategic Report (continued)
Page | 6
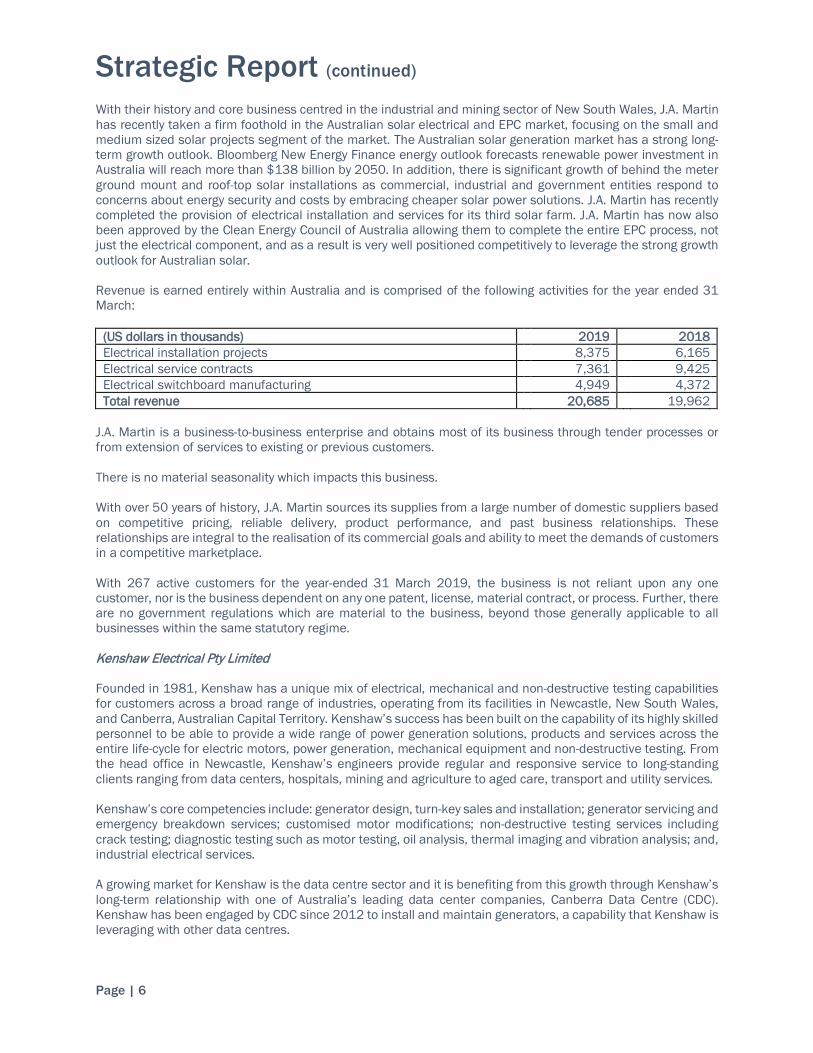
With their history and core business centred in the industrial and mining sector of New South Wales, J.A. Martin has recently taken a firm foothold in the Australian solar electrical and EPC market, focusing on the small and medium sized solar projects segment of the market. The Australian solar generation market has a strong long-term growth outlook. Bloomberg New Energy Finance energy outlook forecasts renewable power investment in Australia will reach more than $138 billion by 2050. In addition, there is significant growth of behind the meter ground mount and roof-top solar installations as commercial, industrial and government entities respond to concerns about energy security and costs by embracing cheaper solar power solutions. J.A. Martin has recently completed the provision of electrical installation and services for its third solar farm. J.A. Martin has now also been approved by the Clean Energy Council of Australia allowing them to complete the entire EPC process, not just the electrical component, and as a result is very well positioned competitively to leverage the strong growth outlook for Australian solar. Revenue is earned entirely within Australia and is comprised of the following activities for the year ended 31 March: (US dollars in thousands) 2019 2018 Electrical installation projects 8,375 6,165 Electrical service contracts 7,361 9,425 Electrical switchboard manufacturing 4,949 4,372 Total revenue 20,685 19,962 J.A. Martin is a business-to-business enterprise and obtains most of its business through tender processes or from extension of services to existing or previous customers. There is no material seasonality which impacts this business. With over 50 years of history, J.A. Martin sources its supplies from a large number of domestic suppliers based on competitive pricing, reliable delivery, product performance, and past business relationships. These relationships are integral to the realisation of its commercial goals and ability to meet the demands of customers in a competitive marketplace. With 267 active customers for the year-ended 31 March 2019, the business is not reliant upon any one customer, nor is the business dependent on any one patent, license, material contract, or process. Further, there are no government regulations which are material to the business, beyond those generally applicable to all businesses within the same statutory regime. Kenshaw Electrical Pty Limited Founded in 1981, Kenshaw has a unique mix of electrical, mechanical and non-destructive testing capabilities for customers across a broad range of industries, operating from its facilities in Newcastle, New South Wales, and Canberra, Australian Capital Territory. Kenshaw’s success has been built on the capability of its highly skilled personnel to be able to provide a wide range of power generation solutions, products and services across the entire life-cycle for electric motors, power generation, mechanical equipment and non-destructive testing. From the head office in Newcastle, Kenshaw’s engineers provide regular and responsive service to long-standing clients ranging from data centers, hospitals, mining and agriculture to aged care, transport and utility services. Kenshaw’s core competencies include: generator design, turn-key sales and installation; generator servicing and emergency breakdown services; customised motor modifications; non-destructive testing services including crack testing; diagnostic testing such as motor testing, oil analysis, thermal imaging and vibration analysis; and, industrial electrical services. A growing market for Kenshaw is the data centre sector and it is benefiting from this growth through Kenshaw’s long-term relationship with one of Australia’s leading data center companies, Canberra Data Centre (CDC). Kenshaw has been engaged by CDC since 2012 to install and maintain generators, a capability that Kenshaw is leveraging with other data centres.

Strategic Report (continued)
Page | 7
A second key growth market for Kenshaw is hospitals and aged care facilities. According to a 2015 Intergenerational Report by the Australian Treasury Department, this is expected to require the development of approximately 76,000 new locations by 2024 in order to meet demand, as the number of Australians aged 65 years and over is forecast to more than double over the next 40 years. Kenshaw has built up significant experience through servicing longstanding customers such as Hunter New England Health, Anglican Care, and BUPA for which it delivers customised critical back up power solutions and services as well as generator and thermal imaging services. Recent contract wins in the active treatment hospital sector, has also placed critical care power infrastructure as a priority for growth over the coming years. The Australian Government is providing record investment in health care across hospital funding. Nationwide, the Australian Government’s hospital funding contribution to states and territories is projected to grow from $21.2 billion in 2018/19 to an estimated $29.1 billion in 2024/25. Revenue is earned entirely within Australia and is comprised of the following activities for the year ended 31 March: (US dollars in thousands) 2019 2018 Generator sales and installation 11,095 5,919 Generator service and non-destructive testing 1,744 1,786 Motor sales and overhaul 4,276 3,965 Total revenue 17,115 11,670 Kenshaw has a regional based marketing strategy, utilising sales staff on the road and internally, open and private tenders, targeted billboard advertising, and web-based advertising. New business is developed through a number of channels including: targeted cold calling, leveraging of existing relationships, breakdown services, and formal tendering process. Kenshaw also maintains strong relationships with key suppliers and consultants who will refer new and potential clients to us for projects and other works. There is no material seasonality which impacts this business. Kenshaw’s relationship with its primary suppliers enables it to sell and service their equipment as dealers or agents. It is a primary supplier and service agent for Cummins generators and WEG electric motors. Kenshaw also maintains long term relationships with other equipment manufacturers such as Toshiba and FG Wilson. This allows it to offer a complete solution to its clients with flexibility of product choice. While equipment manufacturers are vital to success, it is the working relationships with all of its suppliers that allows Kenshaw to maintain our competitive advantage in delivering orders and projects. For the year-ended 31 March 2019, 32% of Kenshaw’s revenue was earned from one customer and this customer is expected to continue to provide significant revenue in future years. However, with 524 active customers for the year-ended 31 March?> 2019, the business is not solely reliant upon this customer, nor is the business reliant on any one patent, license, material contract, or process. Further, there are no government regulations which are material to the business, beyond those generally applicable to all businesses within the same statutory regime. Solar Development
VivoPower continues to prioritise the development, construction, and sale of solar projects in Australia, leveraging the customer relationships of J.A. Martin and Kenshaw and providing a pipeline of development of EPC opportunities to J.A. Martin. With respect to the U.S., the Company’s focus remains on the monetisation of our portfolio of solar projects, with a view to then using the proceeds to execute a strategic redeployment. Successful solar development requires an experienced team that can manage many work streams on a parallel path, from initially identifying attractive locations, to land control, permitting, interconnection, power marketing, and project sale to investors. Rather than build a substantial team internally to accomplish all of these activities, our business model is to joint venture on a non-exclusive basis with existing experienced project development teams so that multiple projects can be advanced simultaneously and allow us to focus on provision of capital,

Strategic Report (continued)
Page | 8
project management, and marketing and sale of projects. In Australia we have partnered with ITP Renewables (“ITP”), a global leader in renewable energy engineering, strategy and construction, and energy sector analytics. In the U.S., we have partnered with Innovative Solar Systems, LLC (“Innovative Solar”), one of the top solar developers in the U.S., having delivered 2.4 GW of projects to date, with another 13 GW in their current project pipeline. Since long-term investors typically value projects on the basis of long-term rates of return (IRR), the development profit that may be created by a developer is the difference between the cost to develop projects and the fair market value of such projects. We believe that successful project development results in a significantly lower cost basis than buying projects that are already developed. With this approach, we believe that we can achieve attractive risk-adjusted returns in the current market, and we target a minimum multiple of invested capital (“MOIC”) of approximately 1.7x - 2.0x. To achieve this return, we focus on managing capital in a disciplined manner during the early development stages and seeking strategic investors with a low cost of capital once projects achieve an advanced stage. The stages of solar development can be broadly characterised as: (i) early stage; (ii) mid-stage; (iii) advanced stage; (iv) construction; and, (v) operation. Our business model is to work through the development process from early stage through to advanced stage, and then sell those projects that have completed the advanced stage of development, also known as “shovel-ready” projects, to investors who will finance construction and ultimately own and operate the project. Early stage development is primarily focused on securing site control, data collection, community engagement, preliminary permitting, and offtake analysis. We consider site control to be achieved once we have obtained purchase or lease options, easements or other written rights of access to the land necessary for the construction and operation of the solar project. Mid-stage development is focused on:
• Transmission Interconnection Queue and Study - identification of a point of interconnection to the transmission or distribution system, obtaining a queue position with the relevant electric system operator, and completing at least one feasibility, screening, or system impact study (or equivalent). An interconnection study and its approval by the relevant transmission or distribution system operator is a prerequisite to the design and construction of the facilities that will interconnect the solar project with the transmission or distribution system.
• Environmental Impact Study and Permitting. Completion of an environmental impact study (or equivalent) is often a prerequisite to obtaining zoning/use permits. Depending on the size and location of the project, we generally initiate the studies needed for an environmental impact study approximately 18 months prior to the anticipated construction start date and receive the material permits before an interconnection is agreed with the relevant utility. To consider this milestone completed, we will have either finished an environmental impact study or received the material permits for the construction and operation of our solar project.
The most important goal of the advanced stage is to obtain an interconnection agreement with the relevant electric system operator and a revenue contract to sell power, usually through a Power Purchase Agreement (“PPA”). Long-term PPAs range from 5 to 15 years with creditworthy off takers, typically obtained by responding to requests for proposals or conducting bilateral negotiations with utility, commercial, industrial, municipal, or financial enterprises. In certain markets with liquid electricity trading, it is possible to enter into financial hedges to support a minimum price of power sold into such markets. A project in the advanced stage indicates a higher degree of confidence for successful completion. However, a project may become unachievable during any stage of development for a variety of reasons including, loss of land control, unsuitable studies, uneconomic interconnection or increased construction costs. Should a project be deemed not to be viable at any stage of development, the project will be discontinued. Accordingly, our focus is to continuously and rigorously evaluate project viability through the earlier development stages and identify projects which will not be viable as early as possible.

Strategic Report (continued)
Page | 9
Once completing the advanced stage of development, a project is considered to be shovel-ready. Prior to construction, VivoPower seeks qualified investors to purchase projects in order to maximise the return on our capital and opportunities from capital recycling. Potential purchases are identified and engaged from those parties known to VivoPower, its development partners, previous investors, and generally within the renewable energy industry. Depending on the purchasing party and their particular investment objectives and capabilities, VivoPower may enter into a development agreement with them to manage construction on their behalf. During the construction stage, key contracts such as the PPA and interconnection agreements are finalised and executed. Estimated costs to build and operate the project are determined with selected contractors, internal technical resources and engineers. All the definitive contracts between the projects, financing parties and the EPC firm who will build the project will be executed, the construction is completed, and project is commissioned and interconnected to the grid, achieving its commercial operations date (“COD”) under the PPA. Once achieving COD, the operational stage begins, and the project generates electricity and sells power. During this phase, VivoPower may provide ongoing services encompassing operations, maintenance and optimisation of these solar plants pursuant to long-term contracts. In addition, if a minority equity stake is retained, VivoPower may realise revenues from the sale of power. The solar energy development industry is competitive. Competition within the industry is strong and can be expected to continue to increase. Some of our competitors have substantially more operating experience, access to financial, engineering, construction, business development or other resources important for solar energy development, larger footprints or brand recognition. We compete with energy and infrastructure funds and renewable energy companies and developers, as well as conventional power companies, to acquire, invest in and develop energy projects. Competition in the solar energy sector can be significantly affected by legal, regulatory and tax changes, as well as environmental and energy incentives provided by governmental authorities. Our business is affected by various regulatory frameworks, particularly ones relating to energy and the environment. These include the rules and regulations of the Federal Energy Regulatory Commission, the U.S. Environmental Protection Agency, regional organisations that regulate wholesale electrical markets, state agencies that regulate energy development and generation and environmental matters, and foreign governmental bodies that occupy roles similar to the foregoing. Our business is also affected by various policy mechanisms that have been used by governments to accelerate the adoption of solar power or renewable energy technologies generally. Examples of such policy mechanisms include rebates, performance-based incentives, feed-in tariffs, tax credits, accelerated depreciation schedules and net metering policies. In some cases, such mechanisms are scheduled to be reduced or to expire or could be eliminated altogether. Rebates are provided to purchasers of solar systems based on the cost and size of the purchaser’s solar power system. Performance-based incentives provide payments to a solar system purchaser based on the energy produced by their solar power system. FITs pay solar system purchasers for solar power system generation based on energy produced at a rate that is generally guaranteed for a period of time. Tax credits and accelerated depreciate schedules permit an owner of a solar project to claim applicable credits and deduct depreciation from income on an accelerated basis on their tax returns. Net metering policies allow customers to deliver to the electric grid any excess electricity produced by their on-site solar power systems, and to be credited for that excess electricity at a rate that is often at or near the full retail price of electricity. In addition, many states in the U.S. and Australia have adopted renewable portfolio standards or similar mechanisms which mandate that a certain portion of electricity delivered by utilities to their customers come from eligible renewable energy resources. Some states significantly expanded their renewable portfolio standards in recent years. Our business is also affected by trade policy and regulations. Examples include tariffs on solar modules and solar cells. Such tariffs can have a significant impact on the pricing and supply of solar cells and solar modules, and as a result impact the sale value and/or economic viability of projects.
Strategic Report (continued)
Page | 10
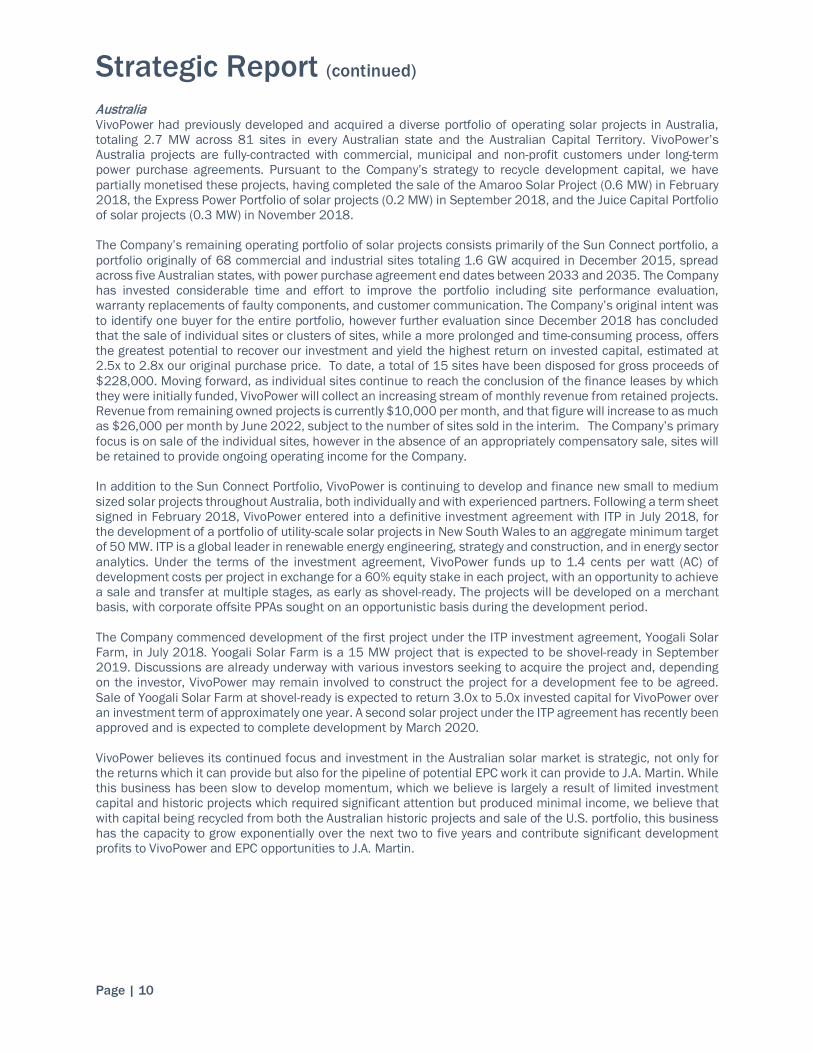
Australia VivoPower had previously developed and acquired a diverse portfolio of operating solar projects in Australia, totaling 2.7 MW across 81 sites in every Australian state and the Australian Capital Territory. VivoPower’s Australia projects are fully-contracted with commercial, municipal and non-profit customers under long-term power purchase agreements. Pursuant to the Company’s strategy to recycle development capital, we have partially monetised these projects, having completed the sale of the Amaroo Solar Project (0.6 MW) in February 2018, the Express Power Portfolio of solar projects (0.2 MW) in September 2018, and the Juice Capital Portfolio of solar projects (0.3 MW) in November 2018. The Company’s remaining operating portfolio of solar projects consists primarily of the Sun Connect portfolio, a portfolio originally of 68 commercial and industrial sites totaling 1.6 GW acquired in December 2015, spread across five Australian states, with power purchase agreement end dates between 2033 and 2035. The Company has invested considerable time and effort to improve the portfolio including site performance evaluation, warranty replacements of faulty components, and customer communication. The Company’s original intent was to identify one buyer for the entire portfolio, however further evaluation since December 2018 has concluded that the sale of individual sites or clusters of sites, while a more prolonged and time-consuming process, offers the greatest potential to recover our investment and yield the highest return on invested capital, estimated at 2.5x to 2.8x our original purchase price. To date, a total of 15 sites have been disposed for gross proceeds of $228,000. Moving forward, as individual sites continue to reach the conclusion of the finance leases by which they were initially funded, VivoPower will collect an increasing stream of monthly revenue from retained projects. Revenue from remaining owned projects is currently $10,000 per month, and that figure will increase to as much as $26,000 per month by June 2022, subject to the number of sites sold in the interim. The Company’s primary focus is on sale of the individual sites, however in the absence of an appropriately compensatory sale, sites will be retained to provide ongoing operating income for the Company. In addition to the Sun Connect Portfolio, VivoPower is continuing to develop and finance new small to medium sized solar projects throughout Australia, both individually and with experienced partners. Following a term sheet signed in February 2018, VivoPower entered into a definitive investment agreement with ITP in July 2018, for the development of a portfolio of utility-scale solar projects in New South Wales to an aggregate minimum target of 50 MW. ITP is a global leader in renewable energy engineering, strategy and construction, and in energy sector analytics. Under the terms of the investment agreement, VivoPower funds up to 1.4 cents per watt (AC) of development costs per project in exchange for a 60% equity stake in each project, with an opportunity to achieve a sale and transfer at multiple stages, as early as shovel-ready. The projects will be developed on a merchant basis, with corporate offsite PPAs sought on an opportunistic basis during the development period. The Company commenced development of the first project under the ITP investment agreement, Yoogali Solar Farm, in July 2018. Yoogali Solar Farm is a 15 MW project that is expected to be shovel-ready in September 2019. Discussions are already underway with various investors seeking to acquire the project and, depending on the investor, VivoPower may remain involved to construct the project for a development fee to be agreed. Sale of Yoogali Solar Farm at shovel-ready is expected to return 3.0x to 5.0x invested capital for VivoPower over an investment term of approximately one year. A second solar project under the ITP agreement has recently been approved and is expected to complete development by March 2020. VivoPower believes its continued focus and investment in the Australian solar market is strategic, not only for the returns which it can provide but also for the pipeline of potential EPC work it can provide to J.A. Martin. While this business has been slow to develop momentum, which we believe is largely a result of limited investment capital and historic projects which required significant attention but produced minimal income, we believe that with capital being recycled from both the Australian historic projects and sale of the U.S. portfolio, this business has the capacity to grow exponentially over the next two to five years and contribute significant development profits to VivoPower and EPC opportunities to J.A. Martin.

Strategic Report (continued)
Page | 11
The Australian renewable energy market is expected to experience very strong growth over the coming years. According to Bloomberg, new renewable and flexible generators are expected to make up 78% of Australia’s energy capacity by 2050, up from just 33% in 2017. Over the same period, fossil fuels will decline from 67% to 17% of Australia’s capacity mix, driven by the increasing affordability of renewables along with retirements of coal and other traditional sources of generation. Over US$138 billion is forecast to be invested in new renewables and battery storage in Australia over that period, compared to less than US$25 billion in other sources. Already the world leader in residential solar penetration, Australia will continue to add home rooftop solar, while at the same time seeing a boom in larger-scale commercial, industrial and utility-scale installations over the coming decade. With new solar already far less expensive than building or extending the lives of existing coal and gas generators, and nearly cheaper than running existing coal, Australia’s solar boom is expected to continue even in the absence of any additional incentives or other legislation. The Company believes that the combined project development, financing and construction expertise of VivoPower and J.A. Martin uniquely positions us as a broad-spectrum service provider to the burgeoning Australian solar market. United States The Company’s key objective in the United States is to enhance the value and then monetise its portfolio of U.S. solar projects, with a view to using the proceeds to execute a strategic pivot for the Company in the next twelve months. VivoPower’s portfolio of U.S. solar projects is held by Innovative Solar Ventures I, LLC (“ISS Joint Venture”), a joint venture with an affiliate of Innovative Solar. The ISS Joint Venture provides a 50% ownership in a diversified portfolio of 38 solar projects in 9 states across the United States, with a combined potential electrical generating capacity of 1.8 GW. Under the terms of the ISS Joint Venture, the Company has committed to invest $14.2 million in the ISS Joint Venture for its 50% equity interest, after reducing the commitment by $0.8 million in potential brokerage commissions that have not been required and which have been credited towards the Company’s commitment. The $14.2 million commitment is allocated to each of the 38 projects based on monthly capital contributions determined with reference to completion of specific project development milestones under an approved development budget for the ISS Joint Venture. To 31 March 2019, the Company contributed $13.1 million of the $14.2 million commitment to the ISS Joint Venture, leaving a remaining capital commitment at March 31, 2019, of $1.1 million, which is recorded in trade and other payables. With respect to any sale, 2/3 of the first $15 million of cumulative gross proceeds of project sales are distributed to VivoPower, 1/3 of the following $15 million, and 50% thereafter. Of the original 38 projects, three have been discontinued as we considered them less economically attractive versus other projects and did not want to invest further capital in them. The remainder of the are in various stages of development as summarised below and are all being actively marketed for sale with an expectation of full realisation within the next twelve months. The reflection of projects in fiscal years is based on the expected date the project will complete the advanced stage of development and be ‘shovel-ready’ and is for indicative purposes only as projects may be sold at any stage of development. None of these projects have been written up in value and continue to be carried at cost.

Strategic Report (continued)
Page | 12
♦ Project is eligible for a PPA under PURPA, a U.S. federal law that requires utilities in regulated areas to offer PPAs to renewable
energy providers with Qualifying Facilities. Financial Results
During the year ended 31 March 2019, the Company and its subsidiaries (the “Group”) generated statutory revenue of $39.0 million, gross profit of $6.3 million, operating loss of $5.4 million and a net loss of $11.2 million. For the year ended 31 March 2018, the Group generated revenue of $33.6 million, gross profit of $5.1 million, operating loss of $7.6 million, and a net loss of $27.9 million. Adjusted EBITDA for the year ended 31 March 2019 was a loss of $1.2 million, compared to a loss of $3.2 million in the previous year. Adjusted EBITDA is a non-IFRS financial measure. We define Adjusted EBITDA as earnings before interest, taxes, depreciation and amortisation, impairment of assets, impairment of goodwill, and one-off non-recurring costs, including restructuring expenses, non-recurring remuneration and consulting fees. The results of operations for the year ended 31 March 2019 reflect a year of significant growth for the Critical Power Services business segment. Kenshaw in particular has won a number of new contracts with data centre and hospital sector customers. These have contributed to a $6.0 million growth in Critical Power Services revenues, to $37.8 million, compared to $31.8 million in the year ended 31 March 2018. Solar revenues of $1.2 million comprise $0.4 million from sale of Solar Renewable Energy Certificates (“SREC’s”) and $0.8 million distributions from the Group’s investments in NC-31 and NC-47 solar projects in North Carolina, United States (together, the “NC Projects”) prior to their sale in July 2018. By contrast Solar revenues were $0.6 million higher in the year ended 31 March 2018, due principally to non-recurrence of development fee revenue recognised on the NC-47 project which was completed in April 2017. None of the 38 solar projects in the ISS Joint Venture achieved a shovel-ready stage of development during the year and accordingly did not contribute to profitability in the year ended 31 March 2019.
Project StateCapacity
(MW)Development
StageLand Control
Interconnection Queue
Environmental Studies
Zoning / Use Permit
Interconnection Study
Interconnection Agreement
Power Purchase Agreement
FY2020 Solar ProjectsIS 177 TX 34 Advanced IS 341 TX 27 Advanced IS 195 TX 41 Advanced IS 78 FL 75 Advanced
IS 330 FL 41 Advanced IS 145 TX 62 Advanced IS 165 TX 62 Advanced IS 144 TX 82 Advanced IS 75 TX 55 Advanced
IS 207 TX 83 Advanced IS 137 TX 27 Advanced IS 305 TX 41 Advanced IS 320 CO 41 Advanced IS 371 CO 86 Advanced IS 269 CO 55 Advanced IS 168 FL 43 Advanced IS 239 CO 55 Mid IS 229 KS 69 Mid IS 267 OK 41 Mid IS 291 KS 34 Mid IS 339 OK 69 Mid IS 244 KS 34 Mid IS 76 SC 21 Mid
IS 129 SC 26 Mid IS 132 SC 26 Mid
Subtotal 25 Projects 1,232FY2021 Solar Projects
IS 107 TX 87 Mid IS 88 NM 87 Mid
IS 276 TX 50 Mid IS 307 TX 50 Mid IS 111 GA 27 Early IS 90 GA 27 Early IS 83 GA 27 Early IS 86 GA 27 Early
IS 370 WA 74 Early IS 211 WA 56 Early
Subtotal 10 Projects 513Projects Discontinued
IS 97 SC 28 DiscontinuedIS 84 SC 30 Discontinued
IS 112 GA 20 DiscontinuedSubtotal 3 Projects 77
Total US Projects 38 Projects 1,823
Advanced StageEarly Stage Mid Stage

Strategic Report (continued)
Page | 13
The results of operations for the year ended 31 March 2019, reflect savings of $5.1 million in general and administrative costs. There was significant effort to rationalise the cost base of the Solar Development business in the year. Headcount reduction and bringing in-house previously outsourced business activities has generated savings of $4.1 million in labour, legal and professional fees, and travel expenses. Partly offsetting these savings were $0.6 million increase in labour and other overhead costs in Critical Power Services, required to support their growth in operations. Furthermore, there was a saving in one-time costs of $1.6 million for third party consulting fees incurred in the year ended 31 March 2018 on international solar procurement consulting, project evaluations, engineering review and technical validation related to the EPC contract for NC-31. The results of operations for the year ended 31 March 2019 also reflects restructuring costs of $2.0 million comprised of $1.8 million of legal and professional fees related to disputes with former employees, as further described in note 7 to the financial statements, and $0.2 million of further workforce reduction actions were also incurred in the year. Management analyses our business in three reportable segments: Critical Power Services, Solar Development, and Corporate Office. Critical Power Services is represented by J.A. Martin and Kenshaw operating in Australia with a focus on the design, supply, installation and maintenance of power and control systems. Solar Development is the development and sale of commercial and utility scale PV solar power projects in U.S. and Australia. Corporate Office is all United Kingdom based corporate functions. The following are the results of operations for the years ended 31 March by reportable segment: 2019 (US dollars in thousands) Critical Power
Services Solar
Development Corporate
Office Total
Revenue 37,800 1,236 - 39,036 Costs of sales (32,317 ) (409 ) - (32,726 ) Gross profit 5,483 827 - 6,310 General and administrative expenses (2,823 ) (2,148 ) (2,714 ) (7,685 ) Loss on sale of assets (30 ) (2,585 ) - (2,615 ) Depreciation and amortisation (1,272 ) (140 ) (8 ) (1,420 ) Operating profit/(loss) 1,358 (4,046 ) (2,722 ) (5,410 ) Restructuring costs (8 ) 7 (2,016 ) (2,017 ) Impairment of assets - - - - Impairment of goodwill - - - - Finance expense – net (1,354 ) (221 ) (1,664 ) (3,239 ) Loss before taxation (4 ) (4,260 ) (6,402 ) (10,666 ) Income tax (572 ) 15 - (557 ) Loss for the year (576 ) (4,245 ) (6,402 ) (11,223 ) 2018 (US dollars in thousands) Critical Power
Services Solar
Development Corporate
Office Total
Revenue 31,807 1,840 - 33,647 Costs of sales (27,482 ) (1,042 ) - (28,524 ) Gross profit 4,325 798 - 5,123 General and administrative expenses (2,173 ) (6,468 ) (4,173 ) (12,814 ) Gain on sale of assets 213 1,143 - 1,356 Depreciation and amortisation (1,233 ) (19 ) (8 ) (1,260 ) Operating profit/(loss) 1,132 (4,546 ) (4,181 ) (7,595 ) Restructuring costs (335 ) (964 ) (574 ) (1,873 ) Impairment of assets - (10,191 ) - (10,191 ) Impairment of goodwill - (11,092 ) - (11,092 ) Finance expense – net (1,283 ) (400 ) (1,703 ) (3,386 ) Loss before taxation (486 ) (27,193 ) (6,458 ) (34,137 ) Income tax (85 ) 6,291 52 6,258 Loss for the year (571 ) (20,902 ) (6,406 ) (27,879 )
Strategic Report (continued)
Page | 14
The $2.6 million loss on sale of assets in the Solar Development segment in the current year is comprised of a $1.9 million provision for onerous contracts related to future obligations to purchase SRECs from the NC Projects, discontinued solar development projects in the ISS Joint Venture ($0.8 million), and a correction to the gain on the sale of Amaroo solar project reported in the prior year ($0.3 million), offset by a gain on sale of the NC Projects ($0.4 million). As a result of the sale of VivoRex, LLC, on 2 July 2019 as disclosed in note 30 to the financial statements, total onerous contract provisions of $2.3 million, including the $1.9 million referenced above, were reversed and taken into income as a gain on sale of assets subsequent to year-end. Financing costs decreased by $0.2 million year-over-year. Interest on convertible loan notes and preferred share financing in Critical Power Services and the $19.0 million Arowana shareholder loan remained in line with prior year. $0.2 million of borrowing costs was incurred in the year related to a $2.0 million short-term loan (“DEPCOM Loan”) provided by SolarTide, LLC, an affiliate of DEPCOM Power, an engineering, procurement, and construction firm that was involved in the development of the NC Projects. Foreign exchange movements were also reduced in the current year. Partly offsetting these reductions, an additional $0.2 million interest on debtor finance borrowings were incurred in the year. As of 31 March 2019, the Group had net assets of $24.0 million (2018: $37.0 million), with intangible assets, including goodwill of $32.3 million (2017: $36.4 million) and non-current investments of nil (2018: $14.1 million). As of 31 March 2019, the Group’s current assets were $29.8 million (2018: $21.3 million), which was comprised of $4.5 million (2018: $1.9 million) of cash and cash equivalents, $1.3 million restricted cash (2018: nil), $10.4 million (2018: $7.9 million) of trade and other receivables, and $13.5 million (2018: $11.4 million) of assets held for sale related to the ISS Joint Venture portfolio (2018: NC Projects). Current liabilities were $20.8 million (2018: $20.6 million), which resulted in a current asset-to-liability ratio of 1.43:1 (2018: 1.03:1) at year-end. Cash generated for the year was $2.7 million (2018: cash used $9.0 million), arising from cash used by operating activities of $1.6 million (2018: cash generated $8.9 million), cash generated by investing activities of $11.9 million (2018: used $16.6 million), and cash used in financing activities of $7.6 million (2018: $1.3 million). At 31 March 2019, the Group had cash reserves of $4.5 million (2018: $1.9 million), restricted cash of $1.3 million (2018: nil) and debt of $19.3 million (2018: $22.3 million), giving a net debt position of $13.4 million (2018: $20.4 million). Cash flows from investing activities in the current year comprised $11.8 million proceeds from the sale of NC Projects and $0.5 million proceeds from sale of other project assets in Australia. These were offset by purchase of $0.2 million of operating assets in Critical Power Services businesses and $0.3 million investment in solar projects in Australia. Cash flows from financing activities included $2.0 million repayment of the DEPCOM Loan, a $4.0 million advance from NES on the sale proceeds of NC Projects, that was repaid on completion in July 2018. Also, the Group repaid the $0.8 million short-term loan from Arowana and $0.8 million of the parent company loan from Arowana. Finance lease repayments were $0.3 million, net of repayments, for motor vehicle assets in Critical Power Services businesses. $1.3 million transfers to restricted cash were made for security on debtor finance arrangements in Critical Power Services and cash held in escrow to fund a $0.5 million liability to DEPCOM. Also finance expense outflows of $3.2 million were incurred. Offsetting these, the Group received $0.8 million funding from debtor finance arrangements established in Critical Power Services.

Strategic Report (continued)
Page | 15
Principal Risks and Uncertainties VivoPower is exposed to a number of risks and uncertainties which could have a material impact on the Group’s long-term performance and could cause actual results to differ materially from historical and expected results. Market risk
The Group’s financial performance is tied very closely to the business activity within both the renewable energy and the investment management sectors. Capital and project availability are identified as being key market risks. Operational risk
VivoPower operates within local, and national, laws and regulations which from time to time may change. Competitive risk
Having the ability to pay developers down-payments to secure pipeline is advantageous, but there is competition from parties pursuing similar transactions. VivoPower expects greater competition from other parties entering the sector with this capability. People risk
Attraction and retention of key staff is essential to the continued success of the business. The Board recognises that the future success of the Group will depend to a substantial extent not only on the ability and experience of its senior management, but also on individuals and teams that support the projects. Staff are remunerated appropriately and employees are encouraged to develop their skills. International risk
As the Group operates internationally, it is subject to the tax laws and regulations of several countries. In addition, conducting business on different continents presents logistical and management challenges whether related to local standards, business cultures or compliance. The Group takes careful steps to comply with all applicable tax and other laws, rules and regulations. Financial risk
It is the Group’s policy to manage identifiable financial risks. The Group operates internationally and so has exposure to movements in exchange rates, in particular between the US Dollar, GB Pound and Australian Dollar. The Group ensures that it holds sufficient cash amounts to meet all working capital requirements. For further discussion on financial risk refer to note 28 of the financial statements. Employees People are central to our business and the contribution of talented and motivated employees is vital to the continued success of the Group. The Group has a policy of keeping employees informed of, and engaged in, its business strategy through regular briefings and team meetings. Employee involvement at all levels is encouraged. It is a policy of the Group to recruit, develop and promote people on merit and to treat everyone equally regardless of their race, ethnic origin or nationality, age, gender, sexual orientation, disability, religion or belief. The Group gives every consideration to applications for employment from disabled persons where the requirements of the position may be adequately covered by the abilities of the applicant concerned. In the event of members of staff becoming disabled, ways are examined to ensure that their employment with the Group continues and that the appropriate training is arranged. It is the policy of the Group to ensure that the training, career development and promotion of disabled employees should, as far as possible, be the same as that of other employees.

Strategic Report (continued)
Page | 16
The table shows, as per required quoted company regulations, the number of staff of each gender employed at the Company and their level of seniority.
Health and Safety The health and safety of the Group’s employees, customers, and visitors is of primary importance. The Group is committed to creating and maintaining a safe and healthy working environment. Health and safety audits and risk assessments, including fire risk assessments, are carried out regularly. The Environment The Group recognizes the importance of environmental responsibility and believes that its direct activities have a positive impact on the environment as the Company facilitates greater use of renewable energy. In addition, lightly damaged solar panels, that would have otherwise been bound for landfill, are donated to charity. Communities VivoPower has maintained an active program of community involvement in the locations we operate, including support for local children’s sport teams and engagement with other worthwhile causes supported by our employees. In addition, as noted above, the Company donates lightly damaged solar panels to a charity that provides aid to the impoverished, supports local education initiatives, and assists with charitable renewable energy projects. The Strategic Report comprising pages 5 to 16 was approved by the Board and signed on its behalf by:
Kevin Chin Chairman 10 July 2019
Female Male Total
Directors 1 4 5
Senior Manager 5 21 26
Employees 16 143 159
Total 22 168 190

Directors’ Report
Page | 17
The Directors are pleased to present their report and the audited financial statements of VivoPower International PLC (“the Company”) and its subsidiary undertakings (together “the Group”) for the year ended 31 March 2019. Subsidiary and associated undertakings are listed in note 13 to the financial statements.
Directors
The Directors who held office during the period and up until the date of this report: Appointed Resigned Non-executive Directors Kevin Chin 27 April 2016 Peter Sermol 21 December 2016 Shimi Shah 28 December 2017 Edward Hyams 2 November 2016 16 November 2018 Gary Hui 21 December 2016 26 October 2018 Pursuant to Articles of the Company, the Directors are divided into three classes, as nearly equal in number as possible and designated as Class A, Class B and Class C. The initial term of Class A Director, Gary Hui, expired at the Company’s first annual general meeting in September 2017; he was re-elected for a further three-year term. The initial term of Class B Directors, consisting of Peter Sermol and Edward Hyams, expired at the 2018 annual general meeting; they were re-elected for a further three-year term. The term of the Class C Directors, consisting of Kevin Chin and Shimi Shah, will expire at the 2019 annual general meeting. At each annual general meeting thereafter, successors to the class of Directors whose term expires at that annual general meeting are elected for a term to expire at the third annual meeting following such election. Accordingly, Kevin Chin and Shimi Shah retire by rotation of Class C Directors at the next Annual General Meeting; both have offered themselves for re-election to a further three-year term. Kevin and Shimi’s biographies are set out below. They both have a Non-Executive Directors Appointment Letter as described in the Director’s Remuneration Report on page 26. A resolution to reappoint Kevin Chin and Shimi Shah will be proposed at the forthcoming Annual General Meeting. The Company maintains insurance cover for all Directors and officers of Group companies against liabilities which may be incurred by them while acting as Directors or officers of Group companies. Details of Directors’ total remuneration are contained in the Directors’ Remuneration Report on page 26. Details of the current Board of Directors and their relevant experience is provided below.
Kevin Chin Kevin has extensive experience in “hands on” strategic and operational management having served as CEO, CFO and COO of various companies across a range of industries, including solar energy, software, traffic management, education, funds management and vocational education. He also has significant international experience in private equity, buyouts of public companies, mergers and acquisitions and capital raisings as well as funds management, accounting, litigation support and valuations. Kevin is the founder of Arowana & Co. (Arowana), a diversified investment group with operating companies across the U.K., U.S., Asia, Australia and New Zealand. Arowana has listed companies on the Australian Stock Exchange and NASDAQ as well as unlisted companies. Arowana International Limited, listed on the Australian Stock Exchange is the largest shareholder in VivoPower. Over his twenty-five year career, Kevin has held a number of strategic and operational leadership roles and was also previously with Lowy Family Group, J.P. Morgan, Ord Minnett, PwC and Deloitte. Kevin holds a Bachelor of Commerce degree from the University of New South Wales where he was one of the inaugural University Co-Op Scholars with the School of Banking and Finance. He is also a qualified Chartered Accountant and a Fellow of FINSIA, where he was a curriculum writer and lecturer in the Masters of Applied Finance programme.

Directors’ Report (continued)
Page | 18
Peter Sermol Peter has over thirty years of experience in institutional finance. Peter is the co-founder of North Star Solar Ltd, a company focused on installing U.K. rooftop solar PV and battery storage which developed a model to install renewable technologies with energy savings repaying capex. Prior to this, with his proven track record in trading distressed debt, Peter ran the Toronto office of Amstel Securities, a Dutch regulated brokerage firm for eight years. During this period Peter expanded the office to focus on uncovering and seeding uncorrelated investment opportunities. Taking a sector agnostic view, investments ranged from Latin American NPL’s, financing Canadian property developers, Australian non-conforming loans, U.S. viatical life insurance policies, U.S. non-prime auto loans. During this period, he also served as CEO of an online media distribution company. Previously, Peter worked with specialist brokerage and advisory firms including Anca Capital Partners and Amstel as well as co-founding his own brokerage firm, Global Markets Ltd trading Asian Convertible Bonds and GDRs. Peter studied marine electronics at the Merchant Naval College, Greenhithe. Shimi Shah
Shimi has been actively involved in investing and venture capital for over 20 years. Shimi is the Chairperson of Carousel Solutions, a technology and business advisory group, focusing on assisting companies navigate expansion into and out of the Middle East and Europe, build diversified businesses, appoint boards, and provide efficient technology solutions to mitigate security risk and increase productivity.
Shimi is also an active independent director and advisory board member. She is a board director of Bboxx, a $25 million revenue distributed energy business, chairs the leading kid’s club design company called Worldwide Kids Club, is part of the advisory committee for the Green Gateway Fund, a $250 million clean technology and sustainability fund and is on the advisory board of the North East Fund, a $200 million regional development fund. She also sits on the board of the Pay It Forward Foundation based in the U.S.
Prior to this, she was CEO at FORSA LLC, Managing Partner at Partnerships UK (PUK), Chief Investment Officer at Hanson Capital, and has worked at 3i and Citigroup. Shimi holds Masters in Management from Queens’ College Cambridge and Bachelor of Science degree from King’s College, London, in Management and Economics. She is an active member of the Young President’s Organization (YPO) in Europe and Africa. Statement of Directors Responsibilities
The directors are responsible for preparing the Annual Report and Accounts for the Group and parent company financial statements in accordance with applicable law and regulations. Company law requires the directors to prepare Group and parent company financial statements for the financial period. Under that law they have elected to prepare the Group financial statements in accordance with International Financial Reporting Standards and applicable law and have elected to prepare the financial statements for Company under the same methodology. Under company law the directors must not approve the financial statements unless they are satisfied that they give a true and fair view of the state of affairs of the Group and parent company and of their profit or loss for that period. In preparing each of the Group and parent company financial statements, the directors are required to:
• select suitable accounting policies and then apply them consistently;
• make judgements and estimates that are reasonable and prudent;
• state whether applicable IFRSs have been followed, subject to any material departures disclosed and explained in the financial statements; and,
• prepare the financial on the going concern basis unless it is inappropriate to presume that the Group and parent company will continue in business.
Directors’ Report (continued)
Page | 19
The Directors are responsible for keeping adequate accounting records that are sufficient to show and explain the Group’s and parent company’s transactions and disclose with reasonable accuracy at any time the financial position of the Group and parent company and enable them to ensure that its financial statements comply with the Companies Act 2006. They have general responsibility for taking such steps as are reasonably open to them to safeguard the assets of the Group and parent company and to prevent and detect fraud and other irregularities. This annual report and financial statements together with the Notice of Annual General Meeting and other information regarding the Group may be viewed on the Company’s website at www.vivopower.com. The Directors are responsible for the maintenance and integrity of the corporate and financial information included on the Company’s website. Legislation in the United Kingdom governing the preparation and dissemination of the financial statements may differ from the legislation in other jurisdictions in which the Company operates, including the U.S. and Australia. Directors’ Insurance and Indemnities
The Directors have the benefit of the indemnity provisions contained in the Company’s Articles of Association and the Company has maintained throughout the year directors’ and officers’ liability insurance for the benefit of the Company, the Directors and its officers. The Company has entered into qualifying third-party indemnity arrangements for the benefit of all its Directors in a form and scope which comply with the requirements of the Companies Act 2006 and which were in force throughout the year and remain in force. Future Developments
A detailed description of the Group’s business operations, results for the year ended 31 March 2019, and likely future developments are presented in detail in the Strategic Report. Financial Instruments
The Group’s principal financial instruments are bank balances, cash and medium-term loans. The main purpose of these financial instruments is to manage the Group’s funding and liquidity requirements. The Group also has other financial instruments such as trade receivables and trade payables which arise directly from its operations. The Board has overall responsibility for the establishment and oversight of the Group’s risk management framework. Policy for managing risks is set by the Chief Executive Officer and is implemented by the Group’s finance department. All risks are managed centrally with a tight control of all financial matters. For additional information on the composition of financial instruments, management objectives and policies, risk exposure and mitigation to note 28 of the financial statements. Going Concern
The financial statements have been prepared on a going concern basis, as directors believe the Company will be able to meet its liabilities as they fall due. As at 31 March 2019, the Company had unrestricted cash totaling $4.5 million, compared to $1.9 million as at 31 March 2018. During the year ended 31 March 2019. the Company reduced general and administrative expenses within the Solar Development and Corporate segments by $5.8 million, or 54%, from $10.6 million in the prior year to $4.8 million, and has implemented further reductions aimed at a further $2.0 million annual reduction going forward. The Company’s Critical Power Services segment represented by J.A. Martin Electrical Pty Limited and Kenshaw Electrical Pty Limited produced $2.6 million EBITDA for the year ended 31 March 2019 and is expected to continue to perform above this level going forward.

Directors’ Report (continued)
Page | 20
The Company is also engaged in a financing initiative with respect to these businesses which is expected to release the restricted cash of $0.8 million and provide up to $1.0 million of additional working capital. Lastly, the Company is actively engaged in a process to enhance value with a view to selling its investment in the ISS Joint Venture and accordingly has reclassified $13.5 million to assets held for sale; this investment is expected to be realised in cash over the next 12 months. The directors believe these actions provide sufficient cash to support business operations and meet obligations as they become due through July 2020. To ensure success of the business, the directors have prepared and reviewed additional plans to mitigate any cash flow risk that may arise during the next twelve months. These actions include the implementation of further operational cost reductions and a further sale of assets as required. The directors have examined going concern against a detailed profit, working capital, and cash flow forecast to June 2020, which reflects the matters discussed in the foregoing paragraphs but does not reflect any additional share issuance, new debt facilities other than disclosed above, nor sale of assets other than in the ordinary course of business. Having reviewed the future plans and projections for the Company’s business and its current financial position, the directors are satisfied that the Company has adequate financial resources to continue to manage the business risks successfully and to remain in operational existence for the foreseeable future. Accordingly, they continue to adopt the going concern basis in preparing the report and accounts. Legal Proceedings
From time to time, the Company is subject to legal proceedings and claims in the ordinary course of business. Although we believe that the outcome of any such matters will not have a material adverse effect on our business, such outcomes are not ascertainable in advance and litigation can have an adverse impact on us because of defense and settlement costs, diversion of management resources, damages or penalties and other factors. On 26 February 2018, Philip Comberg, formerly Chief Executive Officer and formerly a member of the Board of Directors of VivoPower, filed a claim in the High Court of Justice Queen’s Bench Division in the United Kingdom against VivoPower and a subsidiary, VivoPower International Services Limited (“VISL”). The claim is in respect of payments alleged to be due to Mr. Comberg, damages, and restitution in relation to services allegedly rendered by Mr. Comberg, interest and costs. In particular, Mr. Comberg claims VISL committed a repudiatory breach of Mr. Comberg’s service agreement with VISL in connection with the termination of Mr. Comberg’s employment in October 2017, and claims as damages amounts including £615,600 in unpaid amounts allegedly relating to the notice period under the service agreement, £540,000 relating to shares of stock in PLC that Mr. Comberg alleges were not delivered to him but were due, and, inter alia, amounts relating to bonuses alleged to be due, fees relating to services Mr. Comberg claims he provided, as well as interest and costs (collectively, the “Comberg Claims”). On 9 April 2018, VivoPower and VISL filed a defense and counterclaims against Mr. Comberg. In the defense, VivoPower and VISL denied that a repudiatory breach was committed by VISL and denied the other Comberg Claims and asserted that Mr. Comberg was terminated for cause and/or by the acceptance on the part of VISL of Mr. Comberg’s own repudiatory breach of Mr. Comberg’s service agreement. VivoPower and VISL also filed counterclaims against Mr. Comberg alleging that Mr. Comberg had mismanaged the Company, misrepresented information to the VivoPower Board, and failed to report his own wrongdoing in breach of his services agreement and fiduciary duties to VivoPower and VISL. On 26 November 2018, VivoPower and VISL agreed to a settlement of the counterclaims for an undisclosed amount. No settlement has been reached with respect to Mr. Comberg’s claim. VivoPower and VISL continue to strongly deny and defend the Comberg Claims. Donations
During the year ended 31 March 2019, the Group made no political donations nor other political expenditures.

Directors’ Report (continued)
Page | 21
Greenhouse Gas Emissions
Due to resource constraints, it is not practical for the Company to obtain information on greenhouse gas emissions resulting from our activities or operations or from use of purchased energy. Accordingly, no disclosure is made in this regard. Share Capital
As at 31 March 2019, there are 13,557,376 ordinary shares in issue. There were no new shares issued or repurchased during the year. At the Company’s Annual General Meeting in 2017, the directors were given authority to allot shares up to an aggregate nominal amount of $1,560.00. On 30 March 2017, the Company repurchased 129,805 shares at a price of $4.50 per share for a total of $591,915.80, including commission and held them as treasury shares. During the year ended 31 March 2019, 75,805 of these shares were awarded to employees under the Company’s 2017 Omnibus Incentive Plan. Based on the closing market value of these shares on the day of award, $85,660 was expensed as employee compensation and remaining cost of $260,011 was charged against retained earnings. The remaining 54,000 shares are being held as treasury shares and are included in the total number of shares outstanding at 31 March 2019. There are no specific restrictions on the transfer of shares in the Company, which is governed by the Articles of Association and prevailing legislation, nor is the Company aware of any agreements between holders of securities that may result in restrictions on the transfer of shares or that may result in restrictions on voting rights. Substantial Interests
As at 5 July 2019, the last practicable date before publication of this report, the Company has been notified of the following interests of 3% or more of its issued capital of 13,557,376 ordinary shares.
Number of Shares Percentage of Issued Capital
Arowana International Limited (1) 8,176,804 60.30% The Panaga Group Trust 1,241,531 9.2%
(1) Includes Arowana International Limited and its controlled entities including, Arowana Australasian Special Situations Fund 1 Pty Limited,
Arowana Australasian VCMP 2, LP, Arowana Australasian Special Situations Partnership 1, LP, Arowana Energy Holdings Pty Ltd. Dividends
The Company has never declared or paid any dividends on our ordinary shares, and we currently do not plan to declare dividends on our ordinary shares in the foreseeable future. Any determination to pay dividends to holders of our ordinary shares will be at the discretion of our board of directors and will depend upon many factors, including our financial condition, results of operations, projections, liquidity, earnings, legal requirements, restrictions in our debt arrangements and other factors that our board of directors deem relevant. Articles of Association
The Company’s Articles of Association may only be amended by special resolution at a general meeting of shareholders. Auditors
PKF Littlejohn LLP has indicated its willingness to continue as auditor. In accordance with s489 of the Companies Act 2006, a resolution to re-appoint them as auditors for the ensuing year will be put to the members at the forthcoming Annual General Meeting.
Directors’ Report (continued)
Page | 22
The Directors who held office at the date of approval of this Directors’ Report confirm that, so far as they are each aware, there is no relevant audit information of which the Company’s auditors are unaware; and each director has taken all the steps that he ought to have taken as a director to make himself aware of any relevant audit information and to establish that the Company’s auditors are aware of that information. This confirmation is given and should be interpreted in accordance with the provisions of s418 of the Companies Act 2006. The Directors' Report comprising pages 17 to 22 was approved by the Board and signed on its behalf by:
Kevin Chin Chairman 10 July 2019
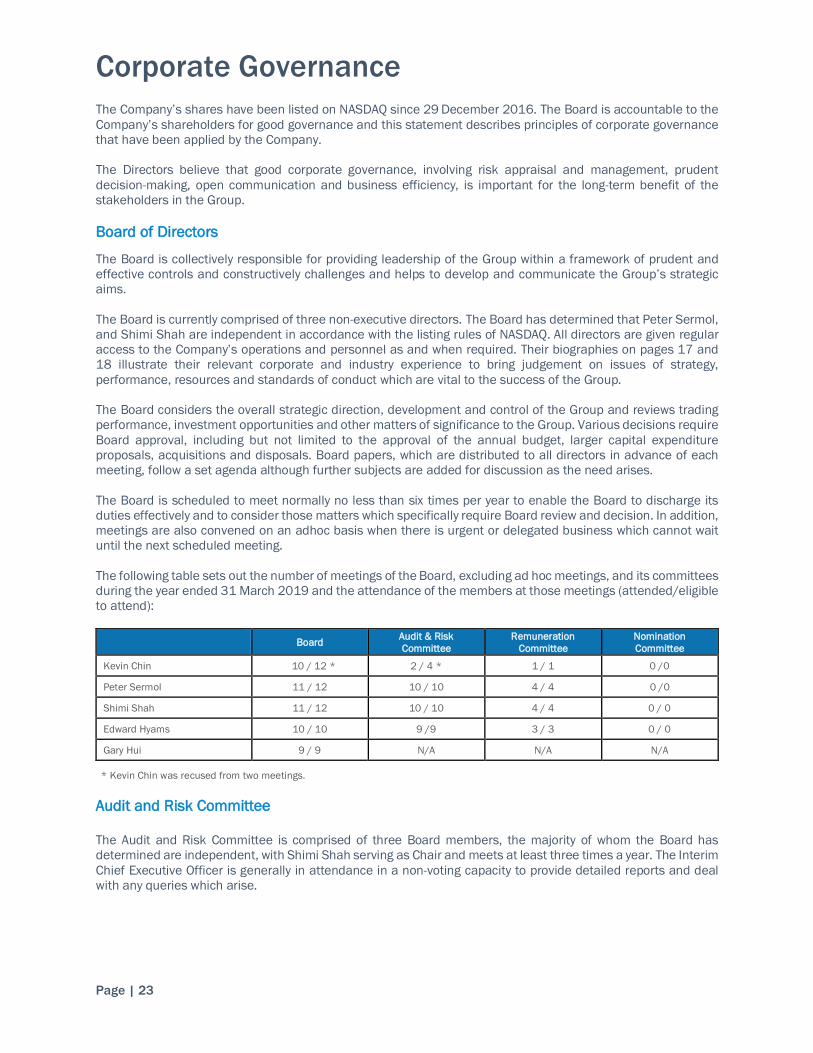
Corporate Governance
Page | 23
The Company’s shares have been listed on NASDAQ since 29 December 2016. The Board is accountable to the Company’s shareholders for good governance and this statement describes principles of corporate governance that have been applied by the Company. The Directors believe that good corporate governance, involving risk appraisal and management, prudent decision-making, open communication and business efficiency, is important for the long-term benefit of the stakeholders in the Group. Board of Directors
The Board is collectively responsible for providing leadership of the Group within a framework of prudent and effective controls and constructively challenges and helps to develop and communicate the Group’s strategic aims. The Board is currently comprised of three non-executive directors. The Board has determined that Peter Sermol, and Shimi Shah are independent in accordance with the listing rules of NASDAQ. All directors are given regular access to the Company’s operations and personnel as and when required. Their biographies on pages 17 and 18 illustrate their relevant corporate and industry experience to bring judgement on issues of strategy, performance, resources and standards of conduct which are vital to the success of the Group. The Board considers the overall strategic direction, development and control of the Group and reviews trading performance, investment opportunities and other matters of significance to the Group. Various decisions require Board approval, including but not limited to the approval of the annual budget, larger capital expenditure proposals, acquisitions and disposals. Board papers, which are distributed to all directors in advance of each meeting, follow a set agenda although further subjects are added for discussion as the need arises. The Board is scheduled to meet normally no less than six times per year to enable the Board to discharge its duties effectively and to consider those matters which specifically require Board review and decision. In addition, meetings are also convened on an adhoc basis when there is urgent or delegated business which cannot wait until the next scheduled meeting. The following table sets out the number of meetings of the Board, excluding ad hoc meetings, and its committees during the year ended 31 March 2019 and the attendance of the members at those meetings (attended/eligible to attend):
Board Audit & Risk
Committee Remuneration
Committee Nomination Committee
Kevin Chin 10 / 12 * 2 / 4 * 1 / 1 0 /0
Peter Sermol 11 / 12 10 / 10 4 / 4 0 /0
Shimi Shah 11 / 12 10 / 10 4 / 4 0 / 0
Edward Hyams 10 / 10 9 /9 3 / 3 0 / 0
Gary Hui 9 / 9 N/A N/A N/A
* Kevin Chin was recused from two meetings. Audit and Risk Committee The Audit and Risk Committee is comprised of three Board members, the majority of whom the Board has determined are independent, with Shimi Shah serving as Chair and meets at least three times a year. The Interim Chief Executive Officer is generally in attendance in a non-voting capacity to provide detailed reports and deal with any queries which arise.

Corporate Governance (continued)
Page | 24
An invitation is also extended to the auditors to attend meetings of the Audit and Risk Committee in order to discuss issues relating to the audit and financial control of the Group. The auditors also have direct access, should they so require, to the Audit and Risk Committee. The Audit and Risk Committee has responsibility within the terms of reference for, among other things, the planning and review of the Group’s annual and interim financial statements, the supervision of its auditors in the review of such financial statements and the review and monitoring of their independence. The Audit and Risk Committee focuses particularly on the Group’s compliance with legal requirements and accounting standards, and on ensuring that effective systems for internal financial control are maintained. The ultimate responsibility for reviewing and approving the report and interim statements
Remuneration Committee
The Remuneration Committee comprises three directors, the majority of whom the Board has determined are independent, with Shimi Shah serving as Chair. The Remuneration Committee meets at least twice a year and has the responsibility for determining, within the agreed terms of reference, the Group’s policy on the remuneration of senior executives. Nominations Committee
The Nominations Committee comprises three directors, the majority of whom the Board has determined are independent, with Peter Sermol serving as Chair. The Nominations Committee identifies, evaluates and selects candidates for Board positions, ensures appropriate succession planning and reviews annually the composition and the size of the Board. In considering the appointment of a new director, the Nominations Committee considers and defines the characteristics, qualities, skills and experience that it considers would complement the overall balance and composition of the Board. Internal Control
The Board oversees management’s activities in relation to the systems of internal control. Management has responsibility for maintaining the Group’s system of internal control and for reviewing its effectiveness. The system of internal control is designed to manage rather than eliminate the risk of failure to achieve the Group’s strategic business objectives and can only provide reasonable assurance against material misstatement or loss. The key elements of the system of internal control are: Control environment There is sufficient segregation of duties and authorisation controls on approval of customer and supplier contracts, recruitment of staff, approval of purchases and payment of suppliers. Financial reporting The senior management has regular meetings to discuss all aspects of the business and review financial performance against budget and provides a monthly summary report to the Board. The Group has a sustainable system of financial reporting and forecasting covering profits, assets, liabilities, cash flow and capital expenditure. The systems include regular monitoring of cash, monthly reporting of financial results. Budgets and business plans are prepared annually and reviewed by the Board. Capital investment For any significant investment, a detailed proposal is first approved by the Company’s Investment Committee. then by the board of directors of VivoPower International Services Limited (“Services Board”). Any major investment is always approved by the Board or the Services Board. The Company’s Investment Committee process contains five stages to ensure the Company has an explicit understanding of a portfolio’s purpose, objective and a clear definition of success in determining whether the portfolio achieves that purpose and meets that objective. The five stages include:

Corporate Governance (continued)
Page | 25
(i) Completion of a Lead Qualification Form to provide a project overview, indicative returns, capital required, risks, timeline and areas to consider in future diligence;
(ii) First Investment Committee Meeting (‘IC1’) to provide a comprehensive summary of the project including detailed legal, technical, financial information and risks;
(iii) Second Investment Committee Meeting (‘IC2’) which includes everything in IC1 plus summary of transaction documentation and update on diligence;
(iv) Board approval to fund the project, and formally recommend that project executes transaction documentation; and,
(v) Board approval to execute the transaction documentation. Communications with Shareholders
The Company encourages two-way communications with shareholders. The Board endeavors to maintain good relationships with its institutional shareholders by holding regular meetings after results are published with further dialogue as requested. The Company’s Annual General Meeting will be held on 23 September 2019 at the offices of DAC Beachcroft, LLP, 25 Walbrook, London, United Kingdom EC4N 8AF. The notice of the meeting is sent to shareholders at least 21 days before the meeting. This annual report and financial statements together with the Notice of Annual General Meeting and other information regarding the Group may be viewed on the Company’s website at www.vivopower.com.
Directors’ Remuneration Report
Page | 26
This report has been prepared in accordance with the provisions of the United Kingdom Companies Act 2006 and Schedule 8 of The Large and Medium-sized Companies and Groups (Accounts and Reports) Regulations 2008 (as amended in 2013). Statement by the Chairman of the Remuneration Committee On behalf of the Remuneration Committee (the "Committee"), I am pleased to present the Remuneration Report for the year ended 31 March 2019. The Committee is comprised of Shimi Shah, Peter Sermol, and Kevin Chin, the majority of whom the Board has determined are independent. Edward Hyams was a member and Chairman of the Committee until his retirement from the Board on 16 November 2018. The Committee has a written charter, a form of which is available free of charge on VivoPower’s website at www.vivopower.com. The remuneration committee’s duties, which are specified in our Remuneration Committee Charter, include, but are not limited to:
• Setting the remuneration policy for all executive directors and executive officers, including pension rights and any compensation payments;
• Reviewing the appropriateness and relevance of the remuneration policy;
• Determining total individual compensation packages;
• Reviewing and designing share incentive and share option plans, determining awards thereunder and administering such plans;
• Approving design of and targets for performance-related pay schemes;
• Determining pension arrangements;
• Appointing compensation consultants;
• Approving contractual appointment terms for directors and senior executives; and,
• Related duties. The Company’s objective with respect to remuneration of directors is to attract and retain high-calibre individuals who are able to bring an appropriately senior level of experience and judgement to bear on issues of strategy, performance, resources and standard of conduct. No changes are proposed to the Directors Remuneration Policy for Executive and Non-Executive Directors as approved by shareholders on 5 September 2017. The Company's Annual Report on Remuneration, disclosing the compensation paid to directors in respect of the year ended 31 March 2019, is provided below. Annual Report on Remuneration Executive Directors The Company had no Executive Directors during the year ended 31 March 2019. Previously, Carl Weatherley-White, former Chief Executive Officer, served as a Director from 4 October 2017 to 28 December 2017. Prior to that, Phillip Comberg, former Chief Executive Officer, served as a Director from 1 May 2016 until his resignation on 4 October 2017. The terms of their compensation as Directors was disclosed in the Annual Report and Accounts for the year ended 31 March 2018.

Directors’ Remuneration Report (continued)
Page | 27
Non-Executive Directors The amount earned by each Director for the years ended 31 March 2019 and 2018 is set out in the table below:
Salary and fees Bonus and
LTIP Pension and
Other Benefits 2019 Total
2018 Total
Kevin Chin £195,000 - - £195,000 £195,000
Shimi Shah £81,063 - - £81,063 £15,000
Peter Sermol £61,750 - - £61,750 £113,000
Edward Hyams £33,326 - - £33,326 £53,000
Gary Hui £106,873 - £3,964 £110,837 £126,636
Kevin Chin receives £165,000 per annum for being Chairman of the Board plus a further £30,000 for being a member of the Audit, Nomination and Remuneration Committees. Kevin Chin was officially appointed as a Non-Executive Director on 1 August 2016, and prior to this date he acted for the benefit of the Company through his role as the Executive Chairman and CEO of Arowana International from the date of incorporation (i.e. 1 February 2016). Shimi Shah was appointed as a Non-Executive Director on 28 December 2017 and commenced that role on the same date. Shimi Shah receives £48,000 per annum for being a Non-Executive Director and an additional £12,000 per annum for being a member of the Nomination, Audit & Risk and Remuneration Committees. In accordance with the Directors’ Remuneration Policy, Shimi Shah was also paid a one-time fee of £20,690 in the year ended 31 March 2019 as additional compensation for additional work undertaken on behalf of the Company. Peter Sermol was appointed as a Non-Executive Director on 1 August 2016 and commenced that role from 21 December 2016. Peter Sermol receives £48,000 per annum for being a Non-Executive Director and an additional £12,000 per annum for being a member of the Nomination, Audit & Risk and Remuneration Committees. In accordance with the Directors Remuneration Policy, Peter Sermol was also paid a one-time fee of £60,000 in the year ended 31 March 2018 as additional compensation for foregone opportunities at the time he joined the Board. Edward Hyams was appointed as a Non-Executive Director on 29 July 2016 and commenced that role from 2 November 2016 and served until he resigned on 16 November 2018. Edward Hyams received £48,000 per annum for being a Non-Executive Director and an additional £5,000 per annum for being a member of the Nomination, Audit & Risk and Remuneration Committees. Gary Hui was appointed as a Non-Executive Director on 1 August 2016 and served in that capacity until 26 October 2018. Prior to this date he acted for the benefit of the Company through his role as the CIO of Arowana International from the 1 July 2016. Gary Hui received £48,000 per annum for being a Non-Executive Director. In addition to director fees, Gary Hui was also paid an annual salary of US$360,000, of which $260,000 was recharged to Arowana International Limited. The retained cost of £76,875 (US$100,000) per annum was paid in compensation for additional work undertaken on behalf of the Company, including his role on the investment committee. Other payments to Directors in the year ended 31 March 2019
Payments to past Directors for loss of office
No payments were made to any past director during the year, nor in connection with a director's loss of office during the year.
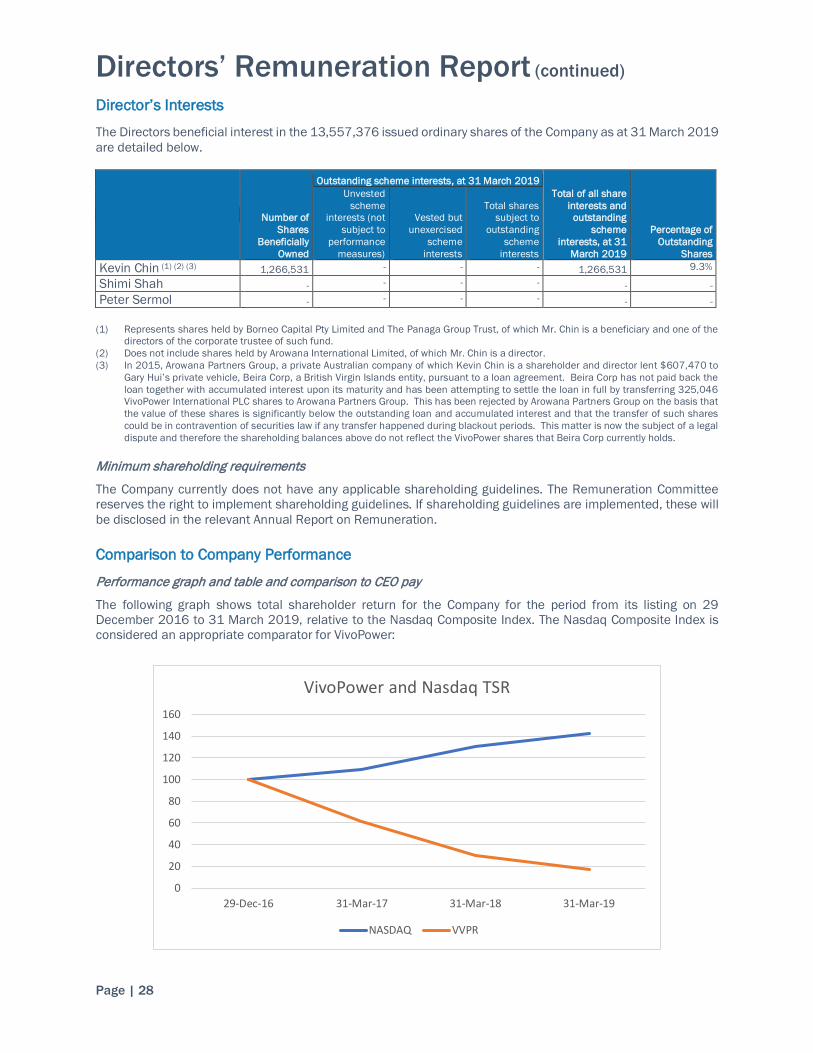
Directors’ Remuneration Report (continued)
Page | 28
Director’s Interests
The Directors beneficial interest in the 13,557,376 issued ordinary shares of the Company as at 31 March 2019 are detailed below.
Number of Shares
Beneficially Owned
Outstanding scheme interests, at 31 March 2019 Total of all share
interests and outstanding
scheme interests, at 31
March 2019
Percentage of Outstanding
Shares
Unvested scheme
interests (not subject to
performance measures)
Vested but unexercised
scheme interests
Total shares subject to
outstanding scheme
interests Kevin Chin (1) (2) (3) 1,266,531 - - - 1,266,531 9.3% Shimi Shah - - - - - - Peter Sermol - - - - - - (1) Represents shares held by Borneo Capital Pty Limited and The Panaga Group Trust, of which Mr. Chin is a beneficiary and one of the
directors of the corporate trustee of such fund. (2) Does not include shares held by Arowana International Limited, of which Mr. Chin is a director. (3) In 2015, Arowana Partners Group, a private Australian company of which Kevin Chin is a shareholder and director lent $607,470 to
Gary Hui’s private vehicle, Beira Corp, a British Virgin Islands entity, pursuant to a loan agreement. Beira Corp has not paid back the loan together with accumulated interest upon its maturity and has been attempting to settle the loan in full by transferring 325,046 VivoPower International PLC shares to Arowana Partners Group. This has been rejected by Arowana Partners Group on the basis that the value of these shares is significantly below the outstanding loan and accumulated interest and that the transfer of such shares could be in contravention of securities law if any transfer happened during blackout periods. This matter is now the subject of a legal dispute and therefore the shareholding balances above do not reflect the VivoPower shares that Beira Corp currently holds.
Minimum shareholding requirements
The Company currently does not have any applicable shareholding guidelines. The Remuneration Committee reserves the right to implement shareholding guidelines. If shareholding guidelines are implemented, these will be disclosed in the relevant Annual Report on Remuneration. Comparison to Company Performance
Performance graph and table and comparison to CEO pay
The following graph shows total shareholder return for the Company for the period from its listing on 29 December 2016 to 31 March 2019, relative to the Nasdaq Composite Index. The Nasdaq Composite Index is considered an appropriate comparator for VivoPower:
0
20
40
60
80
100
120
140
160
29-Dec-16 31-Mar-17 31-Mar-18 31-Mar-19
VivoPower and Nasdaq TSR
NASDAQ VVPR

Directors’ Remuneration Report (continued)
Page | 29
The following table shows details of the compensation paid to the individual(s) in the role of CEO:
Single figure of remuneration Bonus as % of maximum LTIP as % of maximum
2019 2018 2019 2018 2019 2018
Carl Weatherley-White £321,019 £146,904 0% 0% 15% 0%
Art Russell £25,336 N/A 0% N/A 0% N/A
Carl Weatherley-White was appointed as Chief Executive Officer and a Director on 4 October 2017 and resigned as a Director on 28 December 2017, remaining as Chief Executive Officer until his resignation on 12 February 2019. The information presented for 2018 reflects his compensation for the period of his tenure as CEO, from 4 October 2017 to 31 March 2018. The information presented for 2019 reflects his compensation for the period of his tenure as CEO from 1 April 2018 to 12 February 2019 and excludes £85,332 of separation compensation due pursuant to his employment agreement. Art Russell was appointed Interim Chief Executive Officer on 26 February 2019. The information presented for 2019 reflects his compensation for the period of his tenure as CEO, from 26 February 2019 to 31 March 2019. Relative importance of pay
The table below shows the total pay for all of the Group's employees compared to other key financial indicators.
(US dollars) Year ending 31 March 2019
Year ending 31 March 2018
Employee remuneration 17,413,000 16,977,000
Distributions to shareholders NIL NIL
Implementation of Remuneration Policy
Executive Directors
The Company has had no Executive Directors since Carl Weatherley-White, former Chief Executive Officer, resigned as a Director on 28 December 2017. Non-Executive Directors
Cash Compensation
The Committee will pay annual retainers to non-executive directors in line with the remuneration policy approved by shareholders on 5 September 2017. The Committee intends to keep the value of annual retainers under review and will consider from time to time whether the amount and terms on which retainers are payable are appropriate given the Company's economic position and wider market conditions. Any changes to retainers will be compliant with the remuneration policy and will be disclosed in the Remuneration Report for the relevant financial year. Directors receive an annual retainer for service on the Board, with supplementary retainers payable for additional Board responsibilities, as follows:
Annual retainer for Board membership £ 48,000
Annual retainer for the Chairman of the Board £165,000
Additional annual retainer for the committee members Agreed Individually The fee levels are reviewed on an annual basis and may be increased by the Company taking into account factors such as the time commitment of the role and market levels in companies of comparable size and complexity. Fees may be amended before any annual review to reflect any changes to the Director’s role or Board committee memberships which occur during the period or when making a new appointment.

Directors’ Remuneration Report (continued)
Page | 30
New Directors may also be eligible for a one-time fee of £6,000 or such higher amounts as the Company determines, based on market conditions, the proposed New Directors’ skills and experience and the Company's circumstances.
Equity Compensation
There is currently no equity plan in place for Non-Executive Directors. The Committee may determine to implement a plan for Non-Executive Directors, which plan would be subject to any applicable approval requirements. Details of such a plan would be disclosed in the Remuneration Report for the relevant financial year.
Benefits
The Committee will provide benefits to Non-Executive directors in line with the remuneration policy approved by shareholders on 5 September 2017. The Committee intends to keep the value of benefits under review and will consider whether the amount and terms on which benefits are provided are appropriate given the Company's economic position and wider market conditions. Any changes to benefits will be compliant with the remuneration policy outlined above and will be disclosed in the Remuneration Report for the relevant financial year. Consideration of Matters Relating to Directors’ Remuneration
Remuneration Committee
The members of the Committee during the period and their attendance at meetings of the Committee, are set out below:
Attendance Shimi Shah 4/4 Peter Sermol 4/4 Kevin Chin (appointed 16 November 2018) 1/1 Edward Hyams (resigned 16 November 2018) 3/3
No Non-Executive Directors are involved in deciding their own remuneration.
The Committee retained Pearl Meyer to advise the Committee on various matters, including the Equity Incentive Plan. Pearl Meyer is a signatory to the Remuneration Consultants' Code of Conduct. The Committee has reviewed the operating processes in place at Pearl Meyer and is satisfied that the advice it receives is independent and objective.
DAC Beachcroft LLP and Winston & Strawn LLP provide the Company with legal advice. Advice from DAC Beachcroft LLP and Winston & Strawn LLP is made available to the Remuneration Committee, where it relates to matters within its remit.
Statement of voting at general meeting
The Directors' Remuneration Policy for the year ended 31 March 2017 was approved by shareholders at the Annual General Meeting held on 5 September 2017. The resolution to approve the remuneration policy was approved by 99.0% of voting shareholders, with 0.8% voting against the resolution and 0.2% of votes not cast.
The Annual Report on Remuneration for the year ended 31 March 2018 was approved by shareholders at the Annual General Meeting held on 20 August 2018. The resolution to approve the report was approved by 99.7% of voting shareholders.
The Remuneration Report was approved by a duly authorised Committee of the Board of Directors on 10 July 2019 and signed on its behalf by:
Shimi Shah Chair of the Remuneration Committee

Independent Auditor’s Report to the Members of VivoPower International PLC
Page | 31
Opinion We have audited the financial statements of VivoPower International PLC (the parent company) and its subsidiaries (the group) for the year ended 31 March 2019 which comprise the Consolidated Statement of Comprehensive Income, the Consolidated and Parent Company Statements of Financial Position, the Consolidated and Parent Company Statements of Cash Flow, the Consolidated and Parent Company Statements of Changes in Equity, and notes to the financial statements, including a summary of significant accounting policies. The financial reporting framework that has been applied in their preparation is applicable law and International Financial Reporting Standards (IFRSs) as adopted by the European Union and, as regards the Parent Company financial statements, as applied in accordance with the provisions of the Companies Act 2006.
In our opinion:
• the financial statements give a true and fair view of the state of the group’s and of the parent company’s affairs as at 31 March 2019 and of the group’s and the parent company’s loss for the year then ended;
• the group’s and parent company’s financial statements have been properly prepared in accordance with IFRSs as adopted by the European Union and, for the parent company, as applied in accordance with the provisions of the Companies Act 2006; and,
• the financial statements have been prepared in accordance with the requirements of the Companies Act 2006.
Basis for opinion We conducted our audit in accordance with International Standards on Auditing (UK) (ISAs (UK)) and applicable law. Our responsibilities under those standards are further described in the Auditor’s responsibilities for the audit of the financial statements section of our report. We are independent of the group and parent company in accordance with the ethical requirements that are relevant to our audit of the financial statements in the UK, including the FRC’s Ethical Standard as applied to listed entities, and we have fulfilled our other ethical responsibilities in accordance with these requirements. We believe that the audit evidence we have obtained is sufficient and appropriate to provide a basis for our opinion.
Conclusions related to going concern We have nothing to report in respect of the following matters in relation to which the ISAs (UK) require us to report to you where:
• the directors’ use of the going concern basis of accounting in the preparation of the financial statements is not appropriate; or,
• the directors have not disclosed in the financial statements any identified material uncertainties that may cast significant doubt about the group’s or the parent company’s ability to continue to adopt the going concern basis of accounting for a period of at least twelve months from the date when the financial statements are authorised for issue.
Our application of materiality The scope of our audit was influenced by our application of materiality. We set certain quantitative thresholds for materiality. These, together with qualitative considerations, helped us to determine the scope of our audit and the nature, timing and extent of our audit procedures on the individual financial statement line items and disclosures and in evaluating the effect of misstatements, both individually and on the financial statements as a whole. Based on our professional judgement, we determined materiality for the group financial statements as a whole to be $1 million. This was calculated by applying a percentage to revenue (2%) and net assets (5%). The parent company materiality was $100,000 based upon applying a percentage of the loss before tax (5%). Performance materiality for the group and parent company was set at 70% of overall materiality.

Independent Auditor’s Report to the Members of VivoPower International PLC
Page | 32
Component materiality for significant and/or material subsidiary undertakings ranged from $375,000 to $55,000.
On overview of the scope of our audit In designing our audit, we determined materiality, as above, and assessed the risk of material misstatement in the financial statements. In particular, we looked at where the directors made subjective judgements, for example in respect of significant accounting estimates. We also addressed the risk of management override of internal controls, including evaluating whether there was evidence of bias by the directors that represented a risk of material misstatement due to fraud. The accounting records of all significant and/or material Australian undertakings were audited by Component auditors, under the oversight of us as Parent Company auditors in accordance with International Standard on Auditing 600, based upon Component materiality and risk to the Group.
Key audit matters Key audit matters are those matters that, in our professional judgment, were of most significance in our audit of the financial statements of the current period and include the most significant assessed risks of material misstatement (whether or not due to fraud) we identified, including those which had the greatest effect on: the overall audit strategy, the allocation of resources in the audit; and directing the efforts of the engagement team. These matters were addressed in the context of our audit of the financial statements as a whole, and in forming our opinion thereon, and we do not provide a separate opinion on these matters.
Key Audit Matter How the scope of our audit responded to the key audit matter Carrying value of intangible assets and tests for impairment The Group carries a material amount of goodwill ($22.623 million – refer note 12) and separately identifiable intangible assets ($9.744 million – refer note 12) relating to the historic acquisitions of VivoPower Pty Limited and Aevitas O Holdings Limited. Goodwill must be tested for impairment on at least an annual basis whilst other intangible assets are assessed for indicators of impairment. The determination of recoverable amount, being the higher of value in use and fair value less disposal costs, requires judgement by Management in identifying and then valuing the cash generating units. The estimated recoverable amount of these balances is subjective due to the inherent uncertainty involved in forecasting and discounting cash flows.
Our testing in this area included the following:
▪ Reviewing and challenging management’s value in use calculations including the rationale behind the key underlying assumptions and cash flow forecasts;
▪ Checking the mathematical accuracy of the value in use calculations;
▪ Performing sensitivity analysis to the headroom on reasonably possible changes in key assumptions;
▪ Assessing the accuracy of budgets and forecasts used in the prior year to actual results;
▪ Assessing the existence of external or internal indicators of impairment; and
▪ The amortisation calculation was reperformed to ensure it had been calculated in accordance with the estimated useful economic lives contained in the revised purchase price allocation report from the prior year. No issues were identified.
Independent Auditor’s Report to the Members of VivoPower International PLC
Page | 33
Other information The other information comprises the information included in the annual report, other than the financial statements and our auditor’s report thereon. The directors are responsible for the other information. Our opinion on the group and parent company financial statements does not cover the other information and, except to the extent otherwise explicitly stated in our report, we do not express any form of assurance conclusion thereon. In connection with our audit of the financial statements, our responsibility is to read the other information and, in doing so, consider whether the other information is materially inconsistent with the financial statements or our knowledge obtained in the audit or otherwise appears to be materially misstated. If we identify such material inconsistencies or apparent material misstatements, we are required to determine whether there is a material misstatement in the financial statements or a material misstatement of the other information. If, based on the work we have performed, we conclude that there is a material misstatement of this other information, we are required to report that fact. We have nothing to report in this regard.
Opinion on other matter prescribed by the Companies Act 2006 In our opinion the part of the directors’ remuneration report to be audited has been properly prepared in accordance with the Companies Act 2006. In our opinion, based on the work undertaken in the course of the audit: • the information given in the Strategic Report and the Directors’ Report for the financial year for which the
financial statements are prepared is consistent with the financial statements; and,
• the Strategic Report and the Directors’ Report have been prepared in accordance with applicable legal requirements
Matters on which we are required to report by exception In the light of the knowledge and understanding of the group and the parent company and their environment obtained in the course of the audit, we have not identified material misstatements in the Strategic Report or the Directors’ Report. We have nothing to report in respect of the following matters in relation to which the Companies Act 2006 requires us to report to you if, in our opinion: • adequate accounting records have not been kept by the parent company, or returns adequate for our audit
have not been received from branches not visited by us; or
• the parent company financial statements and the part of the directors’ remuneration report to be audited are not in agreement with the accounting records and returns; or
• certain disclosures of Directors’ remuneration specified by law are not made; or
• we have not received all the information and explanations we require for our audit.
Responsibilities of directors As explained more fully in the directors’ responsibilities statement, the directors are responsible for the preparation of the group and parent company financial statements and for being satisfied that they give a true and fair view, and for such internal control as the directors determine is necessary to enable the preparation of financial statements that are free from material misstatement, whether due to fraud or error.
In preparing the group and parent company financial statements, the directors are responsible for assessing the group’s and the parent company’s ability to continue as a going concern, disclosing, as applicable, matters related to going concern and using the going concern basis of accounting unless the directors either intend to liquidate the group or the parent company or to cease operations, or have no realistic alternative but to do so.
Independent Auditor’s Report to the Members of VivoPower International PLC
Page | 34
Auditors responsibilities for the audit of the financial statements Our objectives are to obtain reasonable assurance about whether the financial statements as a whole are free from material misstatement, whether due to fraud or error, and to issue an auditor’s report that includes our opinion. Reasonable assurance is a high level of assurance, but is not a guarantee that an audit conducted in accordance with ISAs (UK) will always detect a material misstatement when it exists. Misstatements can arise from fraud or error and are considered material if, individually or in the aggregate, they could reasonably be expected to influence the economic decisions of users taken on the basis of these financial statements. A further description of our responsibilities for the audit of the financial statements is located on the Financial Reporting Council’s website at: http://www.frc.org.uk/auditorsresponsibilities. This description forms part of our auditor’s report.
Use of our report This report is made solely to the company’s members, as a body, in accordance with Chapter 3 of Part 16 of the Companies Act 2006. Our audit work has been undertaken so that we might state to the company’s members those matters we are required to state to them in an auditor’s report and for no other purpose. To the fullest extent permitted by law, we do not accept or assume responsibility to anyone, other than the company and the company's members as a body, for our audit work, for this report, or for the opinions we have formed.
David Thompson (Senior Statutory Auditor) 1 Westferry Circus For and on behalf of PKF Littlejohn LLP Canary Wharf Statutory auditor London, UK, E14 4HD 10 July 2019

Consolidated Statement of Comprehensive Income for the year ended 31 March 2019
Page | 35
(US dollars in thousands, except per share amounts) Note 2019 2018
Revenue from contracts with customers 4 39,036 33,647 Cost of sales (32,726 ) (28,524 ) Gross profit 6,310 5,123
General and administrative expenses (7,685 ) (12,814 ) (Loss)/gain on sale of assets 5 (2,615 ) 1,356
Depreciation of property, plant and equipment 11 (430 ) (420 ) Amortisation of intangible assets 12 (990 ) (840 ) Operating loss 6 (5,410 ) (7,595 ) Restructuring costs 7 (2,017 ) (1,873 ) Impairment of assets - (10,191 ) Impairment of goodwill - (11,092 ) Finance income 9 4 9
Finance expense 9 (3,243 ) (3,395 ) Loss before income tax (10,666 ) (34,137 ) Income tax 10 (557 ) 6,258
Loss for the year attributable to owners of the company (11,223 ) (27,879 ) Other comprehensive income Items that may be reclassified subsequently to profit or loss: Currency translation differences recognised directly in equity (2,998 ) 222 Total comprehensive loss for the year attributable to owners of the company
(14,221 ) (27,657 )
Earnings per share attributable to owners of the company (dollars)
Basic 24 (0.83 ) (2.06 ) Diluted 24 (0.83 ) (2.06 )

Consolidated Statement of Financial Position as at 31 March 2019
Page | 36
(US dollars in thousands) Note 2019 2018
ASSETS Non-current assets Property, plant and equipment 11 1,205 1,915 Intangible assets 12 32,366 36,402 Deferred tax assets 10 2,054 2,570 Investments 14 - 14,147 Total non-current assets 35,625 55,034
Current assets Cash and cash equivalents 15 4,522 1,939 Restricted cash 16 1,319 - Trade and other receivables 17 10,399 7,903 Assets classified as held for sale 18 13,530 11,436 Total current assets 29,770 21,278
TOTAL ASSETS 65,395 76,312
EQUITY AND LIABILITIES Current liabilities Trade and other payables 19 17,923 14,082 Income tax liability 287 103 Provisions 20 1,710 2,470 Loans and borrowings 21 887 3,955 Total current liabilities 20,807 20,610
Non-current liabilities Loans and borrowings 21 18,380 18,385 Provisions 20 2,222 288 Deferred tax liabilities 10 1 26 Total non-current liabilities 20,603 18,699
Total Liabilities 41,410 39,309
Equity Share capital 22 163 163 Share premium 40,215 40,215 Cumulative translation reserve (2,177 ) 821 Other reserves 23 19,846 18,383 Accumulated deficit (34,062 ) (22,579 ) Total Equity 23,985 37,003
TOTAL EQUITY AND LIABILITIES 65,395 76,312 These financial statements were approved by the Board of Directors on 10 July 2019 and were signed on its behalf by:
Kevin Chin, Chairman

Consolidated Statement of Cash Flow for the year ended 31 March 2019
Page | 37
(US dollars in thousands)
Note 2019 2018
Cash flows from operating activities Loss for the year (11,223 ) (27,879 ) Income tax 913 (6,258 ) Finance income (4 ) (9 ) Finance expense 3,243 3,395
Impairment of goodwill - 11,092 Impairment of assets - 10,191 Depreciation of property, plant and equipment 430 420
Amortisation of intangible assets 990 840
Loss/(gain) on sale of assets 2,615 (1,356 ) Disposal of treasury shares 23 86 - Increase in equity instruments 23 815 - (Increase)/decrease in trade and other receivables (2,543 ) 11,457
Increase in trade and other payables 3,841 5,822
(Decrease)/increase in provisions (728 ) 1,182
Net cash (used in)/from operating activities (1,565 ) 8,897
Cash flows from investing activities
Interest received 9 4 9 Proceeds on sale of property plant and equipment 5 464 2,297
Purchase of property plant and equipment 11 (348 ) (1,101 ) Investment in capital projects (245 ) (17,823 ) Proceeds on sale of capital projects 5 11,981 -
Net cash from/(used in) investing activities 11,856 (16,618 ) Cash flows from financing activities
Finance lease borrowings 21 - 519
Finance lease repayments 21 (304 ) (181 ) Financing agreements proceeds 21 4,000 2,000
Financing agreements repayments 21 (6,000 ) - Debtor finance borrowings 21 751 - Loans from related parties 21 - 770
Repayment of loans from related parties 21 (1,520 ) - Repayment of bank loan 21 - (1,023 ) Finance expense 9 (3,243 ) (3,395 ) Transfers to restricted cash 16 (1,319 ) -
Net cash used in financing activities (7,635 ) (1,310 ) Net increase/(decrease) in cash and cash equivalents 2,656 (9,031 ) Cash and cash equivalents at the beginning of the year 15 1,939 10,970
Effect of exchange rate movements on cash held (73 ) - Cash and cash equivalents at the end of the year 15 4,522 1,939

Consolidated Statement of Changes in Equity for the year ended 31 March 2019
Page | 38
(US dollars in thousands) Share Capital
Share Premium
Cumulative Translation Reserve
Other Reserves
Retained Earnings (Accumulated Deficit) Total
At 1 February 2016 - - - - - - Total comprehensive income for the year - - 599 - 5,300 5,899 Redenomination of share capital (4) - - - - (4) Issue of new shares 167 40,215 - - - 40,382 Equity instruments - - - 25,072 - 25,072 Capital raising costs - - - (9,722) - (9,722) Share option reserve - - - 3,713 - 3,713 Purchase of treasury shares - - - (592) - (592) Other reserves - - - (142) - (142)
163 40,215 599 18,329 5,300 64,606 At 31 March 2017 163 40,215 599 18,329 5,300 64,606 Total comprehensive loss for the year - - 222 - (27,879) (27,657) Other reserves - - - 54 - 54 - - 222 54 (27,879) (27,603) At 31 March 2018 163 40,215 821 18,383 (22,579) 37,003 Total comprehensive loss for the year - - (2,998) - (11,223) (14,221) Equity instruments - - - 1,018 - 1,018 Disposal of treasury shares - - - 346
(260) 86
Other reserves - - 99 - 99 - - (2,998) 1,463 (11,483) (13,017) At 31 March 2019 163 40,215 (2,177) 19,846 (34,062) 23,985 For further information on “Other Reserves” please see note 23.
Notes to the Financial Statements for the year ended 31 March 2019
Page | 39
1. Reporting entity
VivoPower International PLC (“VivoPower” or the “Company”) is a public company limited by shares and incorporated under the laws of England and Wales and domiciled in the United Kingdom. The address of the Company’s registered office is 7th Floor, 9 Berkeley Street, London, United Kingdom W1J 8DW. The consolidated financial statements of the Company as at and for the year ended 31 March 2019 comprise the financial statements of the Company and its subsidiaries (together referred to as the ‘Group’ and individually as ‘Group entities’). The ultimate parent company into which these results are consolidated is Arowana International Limited.
2. Significant accounting policies
The principal accounting policies applied in the preparation of these financial statements are set out below. These policies have been consistently applied to all years presented, unless otherwise stated.
2.1 Basis of preparation
VivoPower International PLC consolidated financial statements were prepared in accordance with International Financial Reporting Standards (IFRS), as adopted by the European Union, IFRIC interpretations and the Companies Act 2006 applicable to companies reporting under IFRS. The consolidated financial statements have been prepared under the historical cost convention.
The preparation of financial statements with adopted IFRS requires the use of critical accounting estimates. It also requires the management to exercise judgement in the process of applying the Company’s accounting policies. The areas involving a higher degree of judgement or complexity, or areas where the assumptions and estimates are significant to the consolidated financial statements are disclosed in note 3.
The financial statements have been prepared on a going concern basis, as the directors believe the Company will be able to meet its liabilities as they fall due.
As at 31 March 2019, the Company had unrestricted cash totalling $4.5 million, compared to $1.9 million as at 31 March 2018.
During the year ended 31 March 2019, the Company reduced general and administrative expenses within the Solar Development and Corporate segments by $5.8 million, or 54%, from $10.6 million in the prior year to $4.8 million, and has implemented further reductions aimed at a further $2.0 million annual reduction going forward. The Company’s Critical Power Services segment represented by J.A. Martin Electrical Pty Limited and Kenshaw Electrical Pty Limited produced $2.6 million of operating profit before amortisation and depreciation for the year ended 31 March 2019 and is expected to continue to perform above this level going forward. The Company is also engaged in a financing initiative with respect to these businesses which is expected to release the restricted cash of $0.8 million and provide up to $1.0 million of additional working capital. Lastly, the Company is actively engaged in a process to enhance value with a view to selling its investment in the ISS Joint Venture and accordingly has reclassified $13.5 million to assets held for sale; this investment is expected to be realised in cash over the next 12 months. The directors believe these actions provide sufficient cash to support business operations and meet obligations as they become due through July 2020.
To ensure success of the business, the directors have prepared and reviewed additional plans to mitigate any cash flow risk that may arise during the next twelve months. These actions include the implementation of further operational cost reductions and a further sale of assets as required.

Notes to the Financial Statements (continued) for the year ended 31 March 2019
Page | 40
Based on the foregoing, the directors believe that the Company is well placed to manage its business risk successfully, despite some current economic and political uncertainty. The directors therefore have a reasonable expectation that the Company has adequate resources to continue in operational existence for the foreseeable future. Thus, they have continued to adopt the going concern basis in preparing these financial statements.
All financial information presented in US dollars has been rounded to the nearest thousand. 2.2 Basis of consolidation
The consolidated financial statements include those of VivoPower International PLC and all of its subsidiary undertakings. Subsidiary undertakings are those entities controlled directly or indirectly by the Company. The Company controls an investee when it is exposed to, or has rights to, variable returns from its involvement with the entity and has the ability to affect those returns through its power over the entity. The results of the subsidiaries acquired are included in the consolidated Statement of Comprehensive Income from the date of acquisition using the same accounting policies of those of the Group. All business combinations are accounted for using the purchase method. The consideration transferred in a business combination is the fair value at the acquisition date of the assets transferred and the liabilities incurred by the Group and includes the fair value of any contingent consideration arrangement. Acquisition-related costs are recognised in the income statement as incurred. Identifiable assets acquired and liabilities and contingent liabilities assumed in a business combination are measured initially at their fair value at the acquisition date. Where necessary, adjustments are made to the financial statements of subsidiaries to bring their accounting policies in line with those used by other members of the Group. All intra-group balances and transactions, including any unrealised income and expense arising from intra-group transactions, are eliminated in full in preparing the consolidated financial statements. Unrealised gains arising from transactions with equity invested investees are eliminated against the investment to the extent of the Group’s interest in the investee. Unrealised losses are eliminated in the same way as unrealised gains, but only to the extent that there is no evidence of impairment. Joint arrangements The Company applies IFRS 11 to all joint arrangements. Under IFRS 11, investments in joint arrangements are classified as either joint operations or joint ventures, depending on the contractual rights and obligations of each investor. VivoPower has assessed the nature of its joint arrangement and determined it to be a joint venture, which is accounted for using the equity method.
2.3 Intangible assets
All intangible assets, except goodwill, are stated at fair value less accumulated amortisation and any accumulated impairment losses. Goodwill is not amortised and is stated at cost less any accumulated impairment losses.
Goodwill Goodwill arose on the effective acquisition of VivoPower Pty Limited and the Aevitas Group Limited (“Aevitas”). Goodwill is reviewed annually to test for impairment.
Other intangible assets Intangible assets acquired through a business combination are initially measured at fair value and then amortised over their useful economic lives.

Notes to the Financial Statements (continued) for the year ended 31 March 2019
Page | 41
Amortisation is calculated on a straight-line basis to write down the assets over their useful economic lives at the following rates: Customer relationships – 10 years Trade names – 15 - 25 years Favourable supply contracts – 15 years Databases – 5 years
2.4 Property, plant and equipment
Property, plant and equipment are stated at cost less accumulated depreciation and any accumulated impairment losses. The cost of an item of property, plant and equipment comprises its purchase price and the costs directly attributable to bringing the asset into use. When parts of an item of property, plant and equipment have different useful lives, they are accounted as separate items (major components) of property, plant and equipment. Depreciation is calculated on a straight-line basis so as to write down the assets to their estimated residual value over their useful economic lives at the following rates: Computer equipment - 3 years Fixtures and fittings - 3 years Motor vehicles – 5 years Plant & equipment – 3.5 to 10 years Leasehold improvements – 20 to 40 years
2.5 Assets classified as held for sale
Assets are classified as held for sale if their carrying amount will be recovered principally through a sale transaction rather than through continuing use and a sale is considered highly probable. They are measured at the lower of their carrying value and fair value less costs to sell. An impairment loss is recognised for any subsequent write-down of the asset to fair value less costs to sell.
2.6 Leases
Leases are classified as finance leases whenever the terms of the lease transfer substantially all the risks and rewards of ownership to the lessee. All other leases are classified as operating leases. Assets held under finance leases are initially recognised as property, plant and equipment at an amount equal to the fair value of the leased assets or, if lower, the present value of the minimum lease payments at the inception of the lease, and then depreciated over their useful economic lives. Lease payments are apportioned between the repayment of capital and interest. The capital element of future lease payments is included in the Statement of Financial Position as a liability. Interest is charged to the Statement of Comprehensive Income so as to achieve a constant rate of interest on the remaining balance of the liability. Rentals payable under operating leases are charged to the Statement of Comprehensive Income on a straight-line basis over the lease term. Operating leases incentives are recognised as a reduction in the rental expense over the lease term.
2.7 Impairment of non-financial assets
Goodwill is allocated to cash-generating units for the purposes of impairment testing. The recoverable amount of the cash-generating unit (‘CGU’) to which the goodwill relates is tested annually for impairment or when events or changes to circumstances indicate that it might be impaired.

Notes to the Financial Statements (continued) for the year ended 31 March 2019
Page | 42
The carrying values of property, plant and equipment, investments and intangible assets other than goodwill are reviewed for impairment only when events indicate the carrying value may be impaired. In an impairment test the recoverable amount of the cash-generating unit or asset is estimated in order to determine the existence or extent of any impairment loss. The recoverable amount is the higher of fair value less costs to sell and the value in use to the Group. An impairment loss is recognised to the extent that the carrying value exceeds the recoverable amount. In determining a cash-generating unit’s or asset’s value in use, estimated future cash flows are discounted to their present value using a pre-tax discount rate that reflects current market assessments of the time-value of money and risks specific to the cash-generating unit or asset that have not already been included in the estimate of future cash flows. All impairment losses are recognised in the Statement of Comprehensive Income. An impairment loss in respect of goodwill is not reversed. In the case of other assets, impairment losses recognised in prior periods are assessed at each reporting date for any indications that the loss has decreased or no longer exists. These impairment losses are reversed if there has been any change in the estimates used to determine the recoverable amount. An impairment loss is reversed only to the extent so that the asset’s carrying amount does not exceed the carrying value that would have been determined, net of depreciation or amortisation, if no impairment loss had been recognised.
2.8 Financial instruments
Financial assets and liabilities are recognised in the Group’s Statement of Financial Position when the Group becomes a party to the contracted provision of the instrument. The following policies for financial instruments have been applied in the preparation of the consolidated financial statements.
From 1 April 2018, the Company classifies its financial assets in the following measurement categories:
• those to be measured subsequently at fair value through profit or loss; and,
• those to be measured at amortised cost.
The classification depends on the business model for managing the financial assets and the contractual terms of the cash flows. Financial assets are classified as at amortised cost only if both of the following criteria are met:
• the asset is held within a business model whose objective is to collect contractual cash flows; and,
• the contractual terms give rise to cash flows that are solely payments of principal and interest. Fair value is the price that would be received to sell an asset or paid to transfer a liability in an orderly transaction between market participants at the measurement date. The fair value measurement is based on the presumption that the transaction to sell the asset or transfer the liability takes place either:
• in the principal market for the asset or liability; or,
• in the absence of a principal market, in the most advantageous market for the asset or liability. The principal or the most advantageous market must be accessible by the Group. The fair value of an asset or a liability is measured using the assumptions that market participants would use when pricing the asset or liability, assuming that market participants act in their economic best interest.
All assets and liabilities for which fair value is measured or disclosed in the financial statements are categorised within the fair value hierarchy, described as follows, based on the lowest level input that is significant to the fair value measurement as a whole:

Notes to the Financial Statements (continued) for the year ended 31 March 2019
Page | 43
• Level 1 — quoted (unadjusted) market prices in active markets for identical assets or liabilities; • Level 2 — valuation techniques for which the lowest level input that is significant to the fair value
measurement is directly or indirectly observable; and • Level 3 — valuation techniques for which the lowest level input that is significant to the fair value
measurement is unobservable.
Cash and cash equivalents For the purpose of preparation of the Statement of Cash Flow, cash and cash equivalents includes cash at bank and in hand. Restricted cash Restricted cash are cash and cash equivalents whose availability for use within the Group is subject to certain restrictions by third parties. Bank borrowings Interest-bearing bank loans are recorded at the proceeds received. Direct issue costs paid on the establishment of loan facilities are recognised over the term of the loan on a straight-line basis. The initial payment is taken to the Statement of Financial Position and then amortised over the full-length of the facility. Trade and other receivables Trade and other receivables are recognised initially at fair value and subsequently measured at amortised cost using the effective interest method, less any allowance for the expected future issue of credit notes and for non-recoverability due to credit risk. The Group applies the IFRS 9 simplified approach to measuring expected credit losses which uses a lifetime expected loss allowance for all trade receivables and contract assets. To measure expected credit losses, trade receivables and contract assets have been grouped based on shared risk characteristics. In the prior year, the impairment was based on the incurred loss model.
Trade and other payables Trade and other payables are non-interest bearing and are stated at amortised cost using the effective interest method.
Share Capital Ordinary shares are classified as equity. Incremental costs directly attributable to the issue of ordinary shares are recognised as a deduction from equity, net of any tax effects. Repurchase of share capital (treasury shares) When share capital recognised as equity is repurchased as equity by the Company the amount of the consideration paid, which includes directly attributable costs, net of any tax effects, is recognised as a deduction from equity, and excluded from the number of shares in issue when calculating earnings per share.
2.9 Taxation
Income tax expense comprises current and deferred tax.
Current tax is recognised based on the amounts expected to be paid or recovered under the tax rates and laws that have been enacted or substantively enacted by the end of the reporting period.

Notes to the Financial Statements (continued) for the year ended 31 March 2019
Page | 44
Deferred tax is provided on temporary timing differences that arise between the carrying amounts of assets and liabilities for financial reporting purposes and their corresponding tax values. Liabilities are recorded on all temporary differences except in respect of initial recognition of goodwill and in respect of investments in subsidiaries where the timing of the reversal of the temporary difference is controlled by the Group and it is probable that it will not reverse in the foreseeable future. Deferred tax assets are recognised to the extent that it is probable that future taxable profits will be available against which the asset can be offset. Deferred tax is measured on an undiscounted basis using the tax rates and laws that have been enacted or substantively enacted by the end of the accounting period. Deferred tax assets and liabilities are offset if there is a legally enforceable right to offset current tax assets and liabilities, they relate to income taxes levied by the same tax authority and the Group intends to settle current tax liabilities and assets on a net basis or their tax assets and liabilities will be realised simultaneously. Current and deferred tax are recognised in the Statement of Comprehensive Income, except when the tax relates to items charged or credited directly to equity, in which case it is dealt with directly in equity.
2.10 Provisions
Provisions are recognised when the Group has a present obligation because of a past event, it is probable that the Group will be required to settle that obligation, and it can be measured reliably. Provisions are measured at the directors’ best estimate of the expenditure required to settle the obligation at the date of Statement of Financial Position. Where the time value of money is material, provisions are measured at the present value of expenditures expected to be paid in settlement.
2.11 Earnings per share
The Group presents basic and diluted earnings per share [EPS] data for ordinary shares. Basic EPS is calculated by dividing the profit or loss attributable to ordinary shareholders of the Company by the weighted average number of ordinary shares, excluding the shares held as treasury shares. Currently there are no diluting effects on EPS for ordinary shares, therefore, diluted EPS is the same as basic EPS.
2.12 Foreign currencies
The Company’s functional and presentational currency is the US dollar. Items included in the separate financial statements of each Group entity are measured in the functional currency of that entity. Transactions denominated in foreign currencies are translated into the functional currency of the entity at the rates of exchange prevailing at the dates of the individual transactions. Foreign currency monetary assets and liabilities are translated at the rates of exchange prevailing at the end of the reporting period. Exchange gains and losses arising are charged to the Statement of Comprehensive Income within finance income or expenses. The Statement of Comprehensive Income and Statement of Financial Position of foreign entities are translated into US dollars on consolidation at the average rates for the period and the rates prevailing at the end of the reporting period respectively. Exchange gains and losses arising on the translation of the Group’s net investment foreign entities are recognised as a separate component of shareholders’ equity. Foreign currency denominated share capital and related share premium and reserve accounts are recorded at the historical exchange rate at the time the shares were issued or the equity created.
Notes to the Financial Statements (continued) for the year ended 31 March 2019
Page | 45
2.13 Revenue from contracts with customers
Revenue comprises the fair value of the consideration received or receivable for the sale of services in the ordinary course of the Group’s activities. Revenue is shown net of discounts, value-added tax, other sales related taxes, and after the elimination of sales within the Group.
Revenue comprises development revenues, electrical installations, electrical servicing and maintenance and generator sales. Revenue is recognised upon satisfaction of contractual performance obligations. The Company adopted IFRS 15 “Revenue from Contracts with Customers” with effect from the date of incorporation. The Group has a number of different revenue streams and the key components in determining the correct recognition are as follows: Development revenue, which is revenue generated from development services relating to the building and construction of solar projects, is recognised on a percentage completion basis as the value is accrued by the end user over the life of the contract. The periodic recognition is calculated through weekly project progress reports. On longer-term power services projects such as large-scale equipment provision and installation, the performance obligation of completing the installation is satisfied over time, and revenue is recognised on a percentage completion basis using an input method. Revenue for stand-alone equipment sales is recognised at the point of passing control of the asset to the customer. Other revenue for small jobs and those completed in a limited timeframe are recognised when the job is complete. Warranties are of short duration and only cover defective workmanship and defective materials. No additional services are committed to which generate a performance obligation. No adjustment is made for the effects of financing, as the Group expects, at contract inception, that the period between when the goods and services are transferred to the customer and when the customer pays, will be one year or less. If the revenue recognised for goods and services rendered by the Company exceeds amounts that the Company is entitled to bill the customer, a contract asset is recognised. If amounts billed exceed the revenue recognised for goods and services rendered, a contract liability is recognised. Incremental costs of obtaining a contract are expensed as incurred.
2.14 Employee benefits
Pension The employer pension contributions are associated with defined contribution schemes. The costs are therefore recognised in the month in which the contribution is incurred, which is consistent with recognition of payroll expenses. Short-term benefits Short-term employee benefit obligations are measured on an undiscounted basis and are expensed as the related service is provided.
A liability is recognised for the amount expected to be paid under short-term cash bonus or profit-sharing plans if the Group has a present legal or constructive obligation to pay this amount because of past service provided by the employee and the obligation can be reliably measured.

Notes to the Financial Statements (continued) for the year ended 31 March 2019
Page | 46
Short-term compensated absences A liability for short-term compensated absences, such as holiday, is recognised for the amount the Group may be required to pay because of the unused entitlement that has accumulated at the end of the reporting period.
2.15 Restructuring costs
Restructuring costs are by nature one-time incurrences and do not represent the normal trading activities of the business and accordingly are disclosed separately on the consolidated statement of comprehensive income in accordance with IAS 1 in order to draw them to the attention of the reader of the financial statements. Restructuring costs are defined in accordance with IAS 37 as being related to sale or termination of a line of business, closure of business locations, changes in management structure, or fundamental reorganisations.
2.16 New standards, amendments and interpretations
During the current year, the Group adopted all of the new and revised Standards and Interpretations that are relevant to its operations and effective for accounting periods beginning on 1 April 2018. Their adoption did not have a material impact on the financial position of the Group. IFRS 9 was adopted without the need to restate comparative information. The IASB and IFRIC have issued the following standards and with an effective date after the date of the financial statements and have not been applied in preparing these consolidated financial statements:
• IFRS 16: ‘Leases’ – effective for annual periods on or after 1 January 2019;
• IFRIC 23: ‘Uncertainty over Income Tax Treatments’ – effective for annual periods on or after 1 January 2019.
• Annual Improvements 2015-2018 Cycle – effective for annual periods commencing on or after 1 January 2019.
The Group is assessing the impact on the financial statements of these adoptions. There are no other IFRS or IFRIC interpretations that are not yet effective that would be expected to have a material impact on the Group.
3. Significant accounting judgements and estimates
In preparing the consolidated financial statements, the directors are required to make judgements in applying the Group’s accounting policies and in making estimates and making assumptions about the future. These estimates could have a significant risk of causing a material adjustment to the carrying value of assets and liabilities in the future financial periods. The critical judgements that have been made in arriving at the amounts recognised in the consolidated financial statements are discussed below.
3.1 Revenue from contracts with customers – determining the timing of satisfaction of services
As disclosed in note 2.13 the Group concluded that solar development revenue and revenue from other long-term projects is recognised over time as the customer simultaneously receives and consumes the benefits provided. The Group determined that the percentage completion basis is the best method in measuring progress because there is a direct relationship between the Group’s effort and the transfer of services to the customer. The judgement used in applying the percentage completion basis affects the amount and timing of revenue from contracts.

Notes to the Financial Statements (continued) for the year ended 31 March 2019
Page | 47
3.2 Impairment of non-financial assets
The carrying values of property, plant and equipment, investments and intangible assets other than goodwill are reviewed for impairment only when events indicate the carrying value may be impaired. Goodwill is tested annually for impairment or when events or changes to circumstances indicate that it might be impaired. During the year ended 31 March 2018, two impairments of goodwill were recorded. To assess impairment, estimated future cash flows are discounted to their present value using a pre-tax discount rate that reflects current market assessments of the time-value of money and risks specific to the related cash-generating unit. Judgement was applied in making estimates and assumptions about the future cash flows, including the appropriateness of discounts rates applied, as further disclosed in note 12.
3.3 Operating profit/(loss)
In preparing the consolidated financial statements of the Group, judgement was applied with respect to those items which are presented in the consolidated statement of comprehensive income as included within operating profit/(loss). Those revenues and expenses which are determined to be specifically related to the on-going operating activities of the business are included within operating profit/(loss). Expenses or charges to earnings which are not related to operating activities, are one-time costs determined to be not representative of the normal trading activities of the business, or that arise from revaluation of assets, are reported below operating profit/(loss).
3.4 Income taxes
In recognising income tax assets and liabilities, management makes estimates of the likely outcome of decisions by tax authorities on transactions and events whose treatment for tax purposes is uncertain. Where the outcome of such matters is different, or expected to be different, from previous assessments made by management, a change to the carrying value of the income tax assets and liabilities will be recorded in the period in which such determination is made. The carrying values of income tax assets and liabilities are disclosed separately in the consolidated Statement of Financial Position.
3.5 Deferred tax assets Deferred tax assets for unused tax losses amounting to $1.005 million at 31 March 2019 (2018: $1.585 million) are recognised to the extent that it is probable that sufficient taxable profit will be available against which the losses can be utilised. Management judgement is required to determine the amount of deferred tax assets that can be recognised, based upon the likely timing and level of future taxable profits.
3.6 Share option reserve
As part of the Initial Public Offering Listing, VivoPower issued an amended and restated unit purchase option (UPO) replacing the options issued by Arowana Inc. The options are viewed as a share-based award granted to Early Bird Capital. The cost of the award is recognised directly in equity and is applied against capital raising costs. As the option holder has the right to receive shares in VivoPower international PLC the share-based payment transaction would be equity settled. The fair value of the options was determined at the grant date, using the Black Scholes Model, and not remeasured subsequently. As the options have no vesting conditions the related expense was recognised immediately.

Notes to the Financial Statements (continued) for the year ended 31 March 2019
Page | 48
3.7 Convertible preference shares and loan notes
As part of the IPO listing process VivoPower International PLC acquired Aevitas. The instruments previously issued by Aevitas were restructured to become convertible into VivoPower International PLC shares. The Company considered IAS 32 paragraph 16 in determining the accounting treatment. The Company has determined the instruments to be treated as equity under the “fixed-for-fixed” rule meaning that both the amount of consideration received/receivable and the number of equity instruments to be issued must be fixed for the instrument to be classified as equity. Both elements are satisfied within the instruments.
4 Revenue and segmental information The Group determines and presents operating segments based on the information that is provided internally to the Board of Directors, which is the Group’s chief operating decision maker. The Group considers that it has three reportable segments: Critical Power Services, Solar Development, and Corporate Office. Critical Power Services is represented by J.A. Martin Electrical Pty Limited (“J.A. Martin”) and Kenshaw Electrical Pty Limited (“Kenshaw”) operating in Australia with a focus on the design, supply, installation and maintenance of power and control systems. Solar Development is the development and sale of commercial and utility scale PV solar power projects in Australia and the U.S. Corporate Office is all United Kingdom based corporate functions. An operating segment is a component of the Group that engages in business activities from which it may earn revenues and incur expenses, including any revenues and expenses that relate to the transactions with any of the Group’s other components. Operating segments results are reviewed regularly by the Board of Directors to assess its performance and make decisions about resources to be allocated to the segment, and for which discrete financial information is available. Segment results that are reported to the Board of Directors include items directly attributable to a segment as well as those that can be allocated to a segment on a reasonable basis.
4.1 Revenue
Revenue by geographic location is as follows: (US dollars in thousands) 2019 2018 Australia 37,889 31,985 United States 1,147 1,622 Total revenue 39,036 33,647 Revenue by product and service is as follows: (US dollars in thousands) 2019 2018 Electrical products and related services 37,799 31,631 Development fees 90 828 Other revenue 1,147 1,188 Total revenue 39,036 33,647
The Group had one customer representing more than 10% of revenue (2018: none). Revenue recognised for this customer amounted to $8.5 million in the Critical Power Services segment.
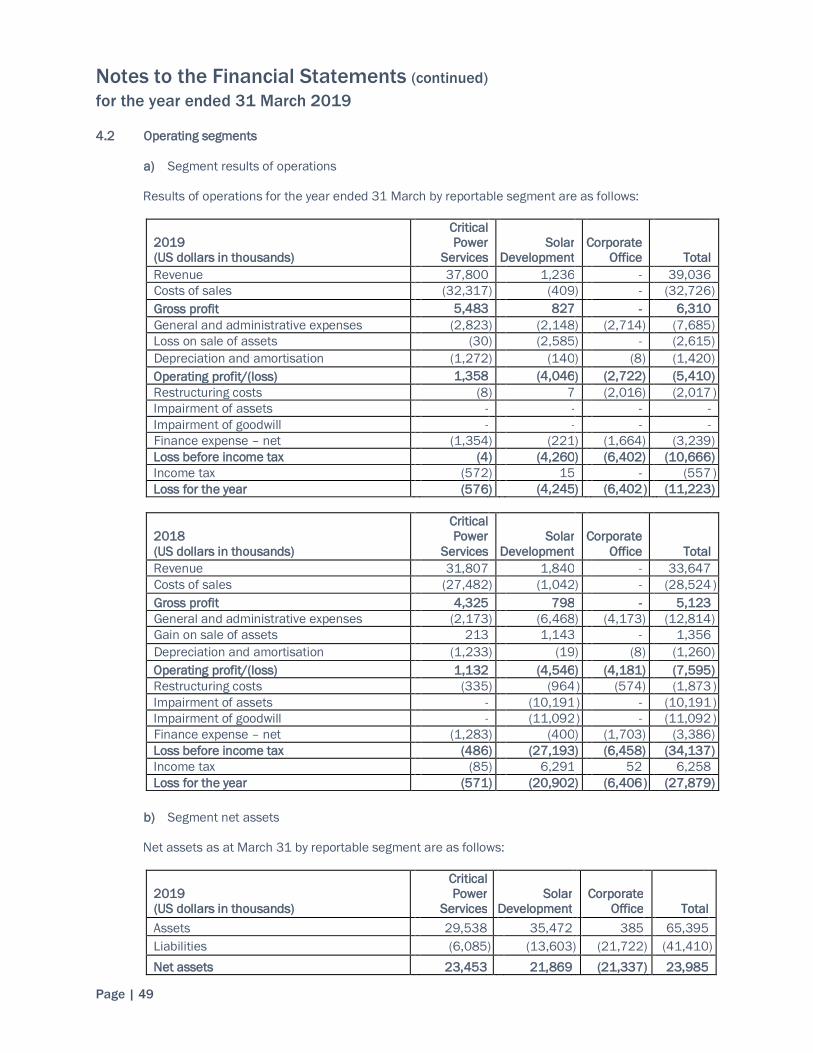
Notes to the Financial Statements (continued) for the year ended 31 March 2019
Page | 49
4.2 Operating segments a) Segment results of operations
Results of operations for the year ended 31 March by reportable segment are as follows:
2019 (US dollars in thousands)
Critical Power
Services Solar
Development Corporate
Office Total
Revenue 37,800 1,236 - 39,036 Costs of sales (32,317 ) (409 ) - (32,726 ) Gross profit 5,483 827 - 6,310 General and administrative expenses (2,823 ) (2,148 ) (2,714 ) (7,685 ) Loss on sale of assets (30 ) (2,585 ) - (2,615 ) Depreciation and amortisation (1,272 ) (140 ) (8 ) (1,420 ) Operating profit/(loss) 1,358 (4,046 ) (2,722 ) (5,410 ) Restructuring costs (8 ) 7 (2,016 ) (2,017 ) Impairment of assets - - - - Impairment of goodwill - - - - Finance expense – net (1,354 ) (221 ) (1,664 ) (3,239 ) Loss before income tax (4 ) (4,260 ) (6,402 ) (10,666 ) Income tax (572 ) 15 - (557 ) Loss for the year (576 ) (4,245 ) (6,402 ) (11,223 )
2018 (US dollars in thousands)
Critical Power
Services Solar
Development Corporate
Office Total
Revenue 31,807 1,840 - 33,647 Costs of sales (27,482 ) (1,042 ) - (28,524 ) Gross profit 4,325 798 - 5,123 General and administrative expenses (2,173 ) (6,468 ) (4,173 ) (12,814 ) Gain on sale of assets 213 1,143 - 1,356 Depreciation and amortisation (1,233 ) (19 ) (8 ) (1,260 ) Operating profit/(loss) 1,132 (4,546 ) (4,181 ) (7,595 ) Restructuring costs (335 ) (964 ) (574 ) (1,873 ) Impairment of assets - (10,191 ) - (10,191 ) Impairment of goodwill - (11,092 ) - (11,092 ) Finance expense – net (1,283 ) (400 ) (1,703 ) (3,386 ) Loss before income tax (486 ) (27,193 ) (6,458 ) (34,137 ) Income tax (85 ) 6,291 52 6,258 Loss for the year (571 ) (20,902 ) (6,406 ) (27,879 )
b) Segment net assets
Net assets as at March 31 by reportable segment are as follows:
2019 (US dollars in thousands)
Critical Power
Services Solar
Development Corporate
Office Total
Assets 29,538 35,472 385 65,395 Liabilities (6,085 ) (13,603 ) (21,722 ) (41,410 ) Net assets 23,453 21,869 (21,337 ) 23,985
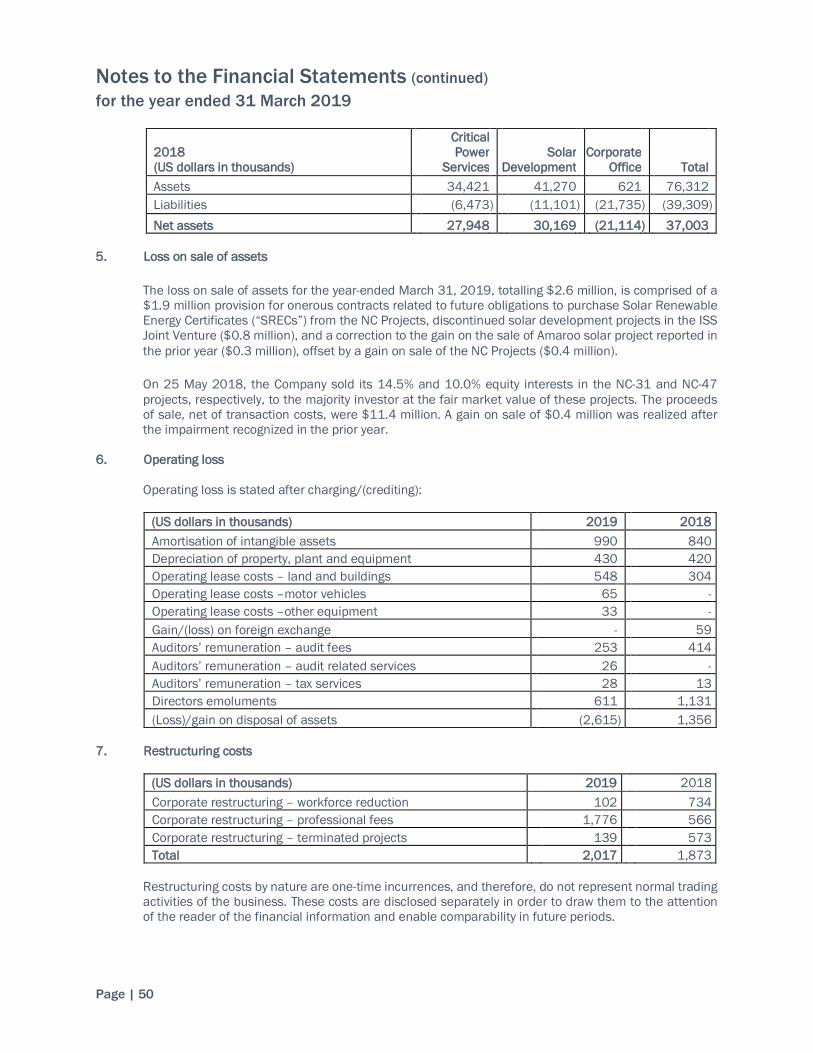
Notes to the Financial Statements (continued) for the year ended 31 March 2019
Page | 50
2018 (US dollars in thousands)
Critical Power
Services Solar
Development Corporate
Office Total
Assets 34,421 41,270 621 76,312 Liabilities (6,473 ) (11,101 ) (21,735 ) (39,309 ) Net assets 27,948 30,169 (21,114 ) 37,003
5. Loss on sale of assets
The loss on sale of assets for the year-ended March 31, 2019, totalling $2.6 million, is comprised of a $1.9 million provision for onerous contracts related to future obligations to purchase Solar Renewable Energy Certificates (“SRECs”) from the NC Projects, discontinued solar development projects in the ISS Joint Venture ($0.8 million), and a correction to the gain on the sale of Amaroo solar project reported in the prior year ($0.3 million), offset by a gain on sale of the NC Projects ($0.4 million).
On 25 May 2018, the Company sold its 14.5% and 10.0% equity interests in the NC-31 and NC-47 projects, respectively, to the majority investor at the fair market value of these projects. The proceeds of sale, net of transaction costs, were $11.4 million. A gain on sale of $0.4 million was realized after the impairment recognized in the prior year.
6. Operating loss
Operating loss is stated after charging/(crediting):
(US dollars in thousands) 2019 2018 Amortisation of intangible assets 990 840 Depreciation of property, plant and equipment 430 420 Operating lease costs – land and buildings 548 304 Operating lease costs –motor vehicles 65 - Operating lease costs –other equipment 33 - Gain/(loss) on foreign exchange - 59 Auditors’ remuneration – audit fees 253 414 Auditors’ remuneration – audit related services 26 - Auditors’ remuneration – tax services 28 13 Directors emoluments 611 1,131 (Loss)/gain on disposal of assets (2,615 ) 1,356
7. Restructuring costs
(US dollars in thousands) 2019 2018 Corporate restructuring – workforce reduction 102 734 Corporate restructuring – professional fees 1,776 566 Corporate restructuring – terminated projects 139 573 Total 2,017 1,873
Restructuring costs by nature are one-time incurrences, and therefore, do not represent normal trading activities of the business. These costs are disclosed separately in order to draw them to the attention of the reader of the financial information and enable comparability in future periods.

Notes to the Financial Statements (continued) for the year ended 31 March 2019
Page | 51
During the year, the Board undertook a strategic restructuring of our business to align operations, personnel, and business development activities to focus on a fewer number of areas of activity. Associated with this restructuring was the departure of a number of employees and contractors from the business. The workforce reduction cost represents the total salary, benefit, severance, and contract costs paid in the year or accruing to these individuals in the future for which no services will be rendered to the Company. Professional fees represent legal fees incurred to resolve certain disputes related to some of these separations in both the current and prior year. Terminated projects are the costs incurred related to solar business development in Asia for which the decision was made not to proceed for economic reasons.
8. Staff numbers and costs
The average number of employees (including directors) during the year was:
2019 2018 Sales and Business Development 9 9 Central Services & Management 32 37 Production 138 148 Total 179 194 Their aggregate remuneration costs comprised:
(US dollars in thousands) 2019 2018 Salaries, wages and incentives 14,327 14,299 Social security costs 1,044 834 Pension contributions 788 848 Short-term compensated absences 1,254 996 Total 17,413 16,977
Directors’ emoluments were $611,450 (2018: $1,130,570) of which the highest paid director received $254,084 (2018: $407,682). Director emoluments include employer social security costs. Key Management Personnel:
(US dollars in thousands) 2019 2018 Salaries, wages and incentives 2,354 2,281 Social security costs 176 217 Pension contributions 45 64 Equity incentives 130 - Short-term compensated absences - 13 Total 2,705 2,575
Key management personnel are those below the Board level that have a significant impact on the operations of the business. The number of key management personnel, including directors for the year ended 31 March 2019 was 10 (2018: 11).

Notes to the Financial Statements (continued) for the year ended 31 March 2019
Page | 52
9. Finance income and expense
(US dollars in thousands) 2019 2018 Finance income Interest received 4 9
Finance expense Related party loan interest payable 1,588 1,636 Convertible loan notes and preference shares interest payable 1,284 1,220 Financing agreement finance cost payable 206 217 Debtor invoice financing cost payable 164 - Finance lease interest payable 1 55 Bank interest payable - 17 Foreign exchange losses - 93 Other finance costs - 157 Total 3,243 3,395
10. Income tax expenses (a) Tax charge
(US dollars in thousands) 2019 2018 Current tax UK corporation tax 29 (29 ) Foreign tax (217 ) 2,279 Total current tax (188 ) 2,250 Deferred tax Current year UK corporation tax 267 (370 ) Foreign tax (636 ) 4,378 Total deferred tax (369 ) 4,008 Total income tax (557 ) 6,258
The difference between the total tax charge and the amount calculated by applying the weighted average corporation tax rate applicable to each of the tax jurisdictions in which the Group operates to the profit before tax is shown below. (US dollars in thousands) 2019 2018 Loss before income tax (10,666 ) (34,137 )
Group weighted average corporation tax rate 21.8% 22.8%
Tax at standard rate 2,325 7,772 Effects of:
Expenses that are not deductible for tax purposes 41 (3,872 ) Adjustment to prior year tax provisions (64 ) 2,358 Deferred tax assets not recognised on tax losses (2,859 ) - Total income tax for the year recognised in the Consolidated Statement of Comprehensive Income
(557 ) 6,258

Notes to the Financial Statements (continued) for the year ended 31 March 2019
Page | 53
(b) Deferred tax (US dollars in thousands) 2019 2018 Deferred tax assets 2,054 2,570 Deferred tax liabilities (1 ) (26 ) Net deferred tax asset/(liability) 2,053 2,544
These assets and liabilities are analysed as follows:
Deferred tax assets Tax losses
Other timing
differences
Total
1 April 2017 2,312 - 2,312 Credit/(charged) to comprehensive income (727 ) 985 258 31 March 2018 1,585 985 2,570 Credit/(charged) to comprehensive income (580 ) 64 (516 ) 31 March 2019 1,005 1,049 2,054
Deferred tax liabilities
Accelerated allowances
Other timing
differences
Total
1 April 2017 (13 ) (3,763 ) (3,776 ) Credit/(charged) to comprehensive income 5 3,745 3,750 31 March 2018 (8 ) (18 ) (26 ) Credit/(charged) to comprehensive income 7 18 25 31 March 2019 (1 ) - (1 )
Deferred tax has been recognised in the current period using the tax rates applicable to each of the tax jurisdictions in which the Group operates. Deferred tax assets and liabilities are offset when there is a legally enforceable right to set off current tax assets against current tax liabilities.
11. Property, plant and equipment
(US dollars in thousands) Computer
Equipment Motor
Vehicles Plant &
Equipment Leasehold
Improvement
Fixtures and
Fittings Total
Cost At 1 April 2017 525 1,632 1,892 156 11 4,216 Foreign exchange 3 10 12 1 - 26 Additions 121 437 537 4 2 1,101 Disposals (7 ) (82 ) (921 ) - - (1,010 ) At 31 March 2018 642 1,997 1,520 161 13 4,333 Foreign exchange (46 ) (148 ) (112 ) (12 ) (1 ) (319 ) Additions 73 55 205 11 4 348 Disposals (126 ) (275 ) (584 ) - - (985 ) At 31 March 2019 543 1,629 1,029 160 16 3,377

Notes to the Financial Statements (continued) for the year ended 31 March 2019
Page | 54
(US dollars in thousands) Computer
Equipment Motor
Vehicles Plant &
Equipment Leasehold
Improvement
Fixtures and
Fittings Total
Depreciation At 1 April 2017 327 1,027 650 41 8 2,053 Foreign exchange 2 6 4 - - 12 Charge for the year 97 203 107 12 1 420 Disposals (4 ) (63 ) - - - (67 ) At 31 March 2018 422 1,173 761 53 9 2,418 Foreign exchange (34 ) (93 ) (59 ) (4 ) (1 ) (191 ) Charge for the year 89 222 106 11 1 430 Disposals (97 ) (223 ) (165 ) - - (486) At 31 March 2019 380 1,079 644 59 9 2,172
Net book value At 1 April 2017 198 605 1,242 115 3 2,163 At 31 March 2018 220 824 759 108 4 1,915 At 31 March 2019 163 550 385 101 7 1,205
The Group has $0.6 (2017: $0.3) million of assets held under finance lease. Details of the liabilities are shown in note 21.
12. Intangible assets
(US dollars in thousands) 2019 2018 Goodwill 22,623 24,482 Other intangible assets 9,744 11,920 Carrying value at 31 March 32,367 36,402
(a) Goodwill
Goodwill arose on the purchase of Aevitas O Holdings Limited and VivoPower Pty Limited on 29 December 2016. (US dollars in thousands) 2019 2018 As at 1 April 24,482 30,393 Revaluations - 3,597 Goodwill previously not recognised - 627 Impairment - (11,092 ) Reclassifications - 138 Additions - - Foreign exchange (1,859 ) 819 Carrying value at 31 March 22,623 24,482
The carrying amounts of goodwill by Cash Generating Unit (“CGU”) are as follows: (US dollars in thousands) 2019 2018 Aevitas O Holdings Limited (allocated to Critical Power Services segment)
12,884 13,949
VivoPower Pty Limited (allocated to Solar Development segment) 9,739 10,533 Total 22,623 24,482
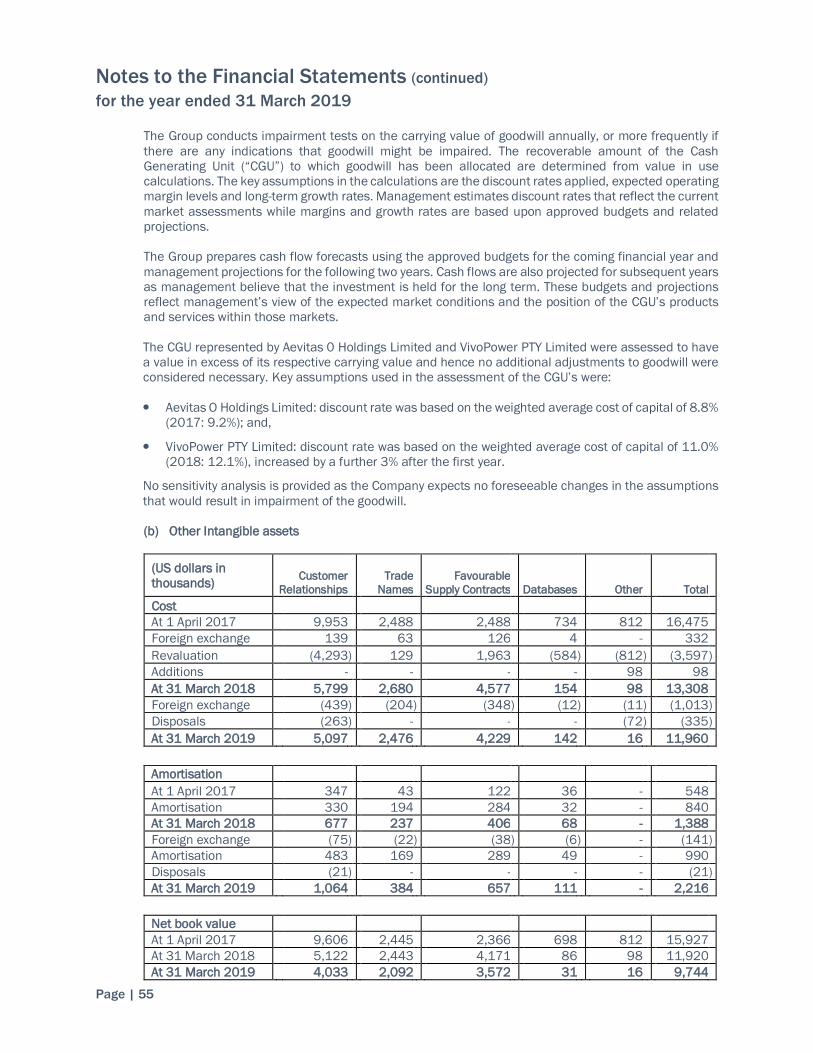
Notes to the Financial Statements (continued) for the year ended 31 March 2019
Page | 55
The Group conducts impairment tests on the carrying value of goodwill annually, or more frequently if there are any indications that goodwill might be impaired. The recoverable amount of the Cash Generating Unit (“CGU”) to which goodwill has been allocated are determined from value in use calculations. The key assumptions in the calculations are the discount rates applied, expected operating margin levels and long-term growth rates. Management estimates discount rates that reflect the current market assessments while margins and growth rates are based upon approved budgets and related projections. The Group prepares cash flow forecasts using the approved budgets for the coming financial year and management projections for the following two years. Cash flows are also projected for subsequent years as management believe that the investment is held for the long term. These budgets and projections reflect management’s view of the expected market conditions and the position of the CGU’s products and services within those markets. The CGU represented by Aevitas 0 Holdings Limited and VivoPower PTY Limited were assessed to have a value in excess of its respective carrying value and hence no additional adjustments to goodwill were considered necessary. Key assumptions used in the assessment of the CGU’s were:
● Aevitas O Holdings Limited: discount rate was based on the weighted average cost of capital of 8.8%
(2017: 9.2%); and,
● VivoPower PTY Limited: discount rate was based on the weighted average cost of capital of 11.0%
(2018: 12.1%), increased by a further 3% after the first year.
No sensitivity analysis is provided as the Company expects no foreseeable changes in the assumptions that would result in impairment of the goodwill.
(b) Other Intangible assets
(US dollars in thousands) Customer
Relationships Trade
Names Favourable
Supply Contracts Databases Other Total
Cost At 1 April 2017 9,953 2,488 2,488 734 812 16,475 Foreign exchange 139 63 126 4 - 332 Revaluation (4,293 ) 129 1,963 (584 ) (812 ) (3,597 ) Additions - - - - 98 98 At 31 March 2018 5,799 2,680 4,577 154 98 13,308 Foreign exchange (439 ) (204 ) (348 ) (12 ) (11 ) (1,013 ) Disposals (263 ) - - - (72 ) (335 ) At 31 March 2019 5,097 2,476 4,229 142 16 11,960
Amortisation At 1 April 2017 347 43 122 36 - 548 Amortisation 330 194 284 32 - 840 At 31 March 2018 677 237 406 68 - 1,388 Foreign exchange (75 ) (22 ) (38 ) (6 ) - (141 ) Amortisation 483 169 289 49 - 990 Disposals (21 ) - - - - (21 ) At 31 March 2019 1,064 384 657 111 - 2,216
Net book value At 1 April 2017 9,606 2,445 2,366 698 812 15,927 At 31 March 2018 5,122 2,443 4,171 86 98 11,920 At 31 March 2019 4,033 2,092 3,572 31 16 9,744
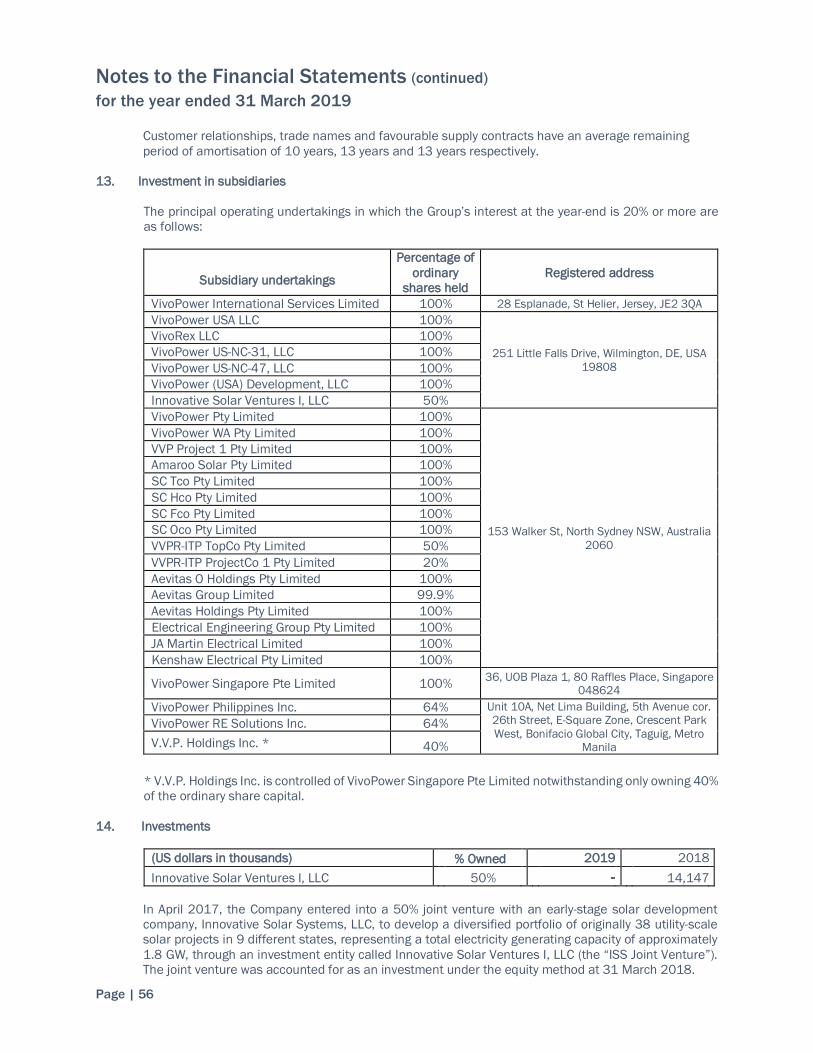
Notes to the Financial Statements (continued) for the year ended 31 March 2019
Page | 56
Customer relationships, trade names and favourable supply contracts have an average remaining period of amortisation of 10 years, 13 years and 13 years respectively.
13. Investment in subsidiaries
The principal operating undertakings in which the Group’s interest at the year-end is 20% or more are as follows:
Subsidiary undertakings
Percentage of ordinary
shares held Registered address
VivoPower International Services Limited 100% 28 Esplanade, St Helier, Jersey, JE2 3QA VivoPower USA LLC 100%
251 Little Falls Drive, Wilmington, DE, USA 19808
VivoRex LLC 100% VivoPower US-NC-31, LLC 100% VivoPower US-NC-47, LLC 100% VivoPower (USA) Development, LLC 100% Innovative Solar Ventures I, LLC 50% VivoPower Pty Limited 100%
153 Walker St, North Sydney NSW, Australia 2060
VivoPower WA Pty Limited 100% VVP Project 1 Pty Limited 100% Amaroo Solar Pty Limited 100% SC Tco Pty Limited 100% SC Hco Pty Limited 100% SC Fco Pty Limited 100% SC Oco Pty Limited 100% VVPR-ITP TopCo Pty Limited 50% VVPR-ITP ProjectCo 1 Pty Limited 20% Aevitas O Holdings Pty Limited 100% Aevitas Group Limited 99.9% Aevitas Holdings Pty Limited 100% Electrical Engineering Group Pty Limited 100% JA Martin Electrical Limited 100% Kenshaw Electrical Pty Limited 100%
VivoPower Singapore Pte Limited 100% 36, UOB Plaza 1, 80 Raffles Place, Singapore 048624
VivoPower Philippines Inc. 64% Unit 10A, Net Lima Building, 5th Avenue cor. 26th Street, E-Square Zone, Crescent Park West, Bonifacio Global City, Taguig, Metro
Manila
VivoPower RE Solutions Inc. 64% V.V.P. Holdings Inc. * 40%
* V.V.P. Holdings Inc. is controlled of VivoPower Singapore Pte Limited notwithstanding only owning 40% of the ordinary share capital.
14. Investments
(US dollars in thousands) % Owned 2019 2018 Innovative Solar Ventures I, LLC 50% - 14,147
In April 2017, the Company entered into a 50% joint venture with an early-stage solar development company, Innovative Solar Systems, LLC, to develop a diversified portfolio of originally 38 utility-scale solar projects in 9 different states, representing a total electricity generating capacity of approximately 1.8 GW, through an investment entity called Innovative Solar Ventures I, LLC (the “ISS Joint Venture”). The joint venture was accounted for as an investment under the equity method at 31 March 2018.

Notes to the Financial Statements (continued) for the year ended 31 March 2019
Page | 57
Under the terms of the ISS Joint Venture, the Company committed to invest $14.2 million in the ISS Joint Venture for its 50% equity interest, after reducing the commitment by $0.8 million in potential brokerage commissions that have not been required and which have been credited towards the Company’s commitment. The $14.2 million commitment is allocated to each of the projects based on monthly capital contributions determined with reference to completion of specific project development milestones under an approved development budget for the ISS Joint Venture. To 31 March 2019, the Company contributed $13.1 million of the $14.2 million commitment to the ISS Joint Venture, leaving a remaining capital commitment at 31 March 2019, of $1.1 million, which is recorded in trade and other payables. During the year, the Company made the decision to sell its portfolio of solar projects held within the ISS Joint Venture. Accordingly, the investment has been reclassified to current assets as asset held for sale, as more fully disclosed in note 18.
15. Cash and cash equivalents
(US dollars in thousands) 2019 2018
Cash at bank and in hand 4,522 1,939 The credit ratings of the counterparties with which cash was held are detailed in the table below. (US dollars in thousands) 2019 2018 A+ 17 891 A 14 69 AA- 4,491 979 Total 4,522 1,939
16. Restricted cash
(US dollars in thousands) 2019 2018 Preferred supplier escrow 503 - Debtor financing security account 816 - Total 1,319 -
At 31 March 2019, there is a total of $1.3 million of cash deposits which are subject to restrictions. $0.8 million of cash is restricted as security for bank guarantees provided to customers in support of performance obligations under power services contracts. Further, in 2017, a third-party U.S.-based solar EPC firm contributed $0.5 million to the Company’s initial investment in the ISS Joint Venture, in consideration for a right to provide certain engineering services to the project. As the expected services were not awarded on a timely basis, it was agreed that the deposit would be paid into escrow and returned to the EPC firm no later than 23 May 2019.
17. Trade and other receivables
(US dollars in thousands) 2019 2018 Current receivables Trade receivables 5,899 5,333 Contract assets 1,800 120 Prepayments 628 391 Other receivables 2,072 2,059 Total 10,399 7,903

Notes to the Financial Statements (continued) for the year ended 31 March 2019
Page | 58
In accordance with IFRS 15, contract assets are presented as a separate line item. The Company has not recognised any loss allowance for contract assets. Analysis of trade receivables:
(US dollars in thousands) 2019 2018
Trade and other receivables 5,929 5,335 Less: credit note provision (30 ) (2 ) Total 5,899 5,333
The maximum exposure to credit risk for trade receivables by geographic region was: (US dollars in thousands) 2019 2018 USA 78 129 United Kingdom - 12 Australia 5,821 5,192 Total 5,899 5,333
The aging of the trade receivables, net of provisions is: (US dollars in thousands) 2019 2018
0-90 days 5,765 5,326 Greater than 90 days 134 7 Total 5,899 5,333
18. Assets classified as held for sale
(US dollars in thousands) % Owned 2019 2018 Innovative Solar Ventures I, LLC 50% 13,530 - US-NC-31 Sponsor Partner, LLC 14.45% - 6,595 US-NC-47 Sponsor Partner, LLC 10% - 4,841 Total 13,530 11,436 As more fully disclosed in Note 14, the Company’s portfolio of U.S. solar projects is held through 50% ownership in Innovative Solar Ventures I, LLC (the “ISS Joint Venture”). During the year, the Company made the decision to sell its portfolio of U.S. solar projects and accordingly, the investment has been reclassified to current assets as assets held for sale. Assets classified as held for sale are included within the Solar Development segment in note 4.2. Reconciliation of the ISS Joint Venture investment is as follows (2018 comparative amount is disclosed within Investments, see Note 14): (US dollars in thousands) 2019 2018 Capital commitment 15,044 14,904 Commission credit (770 ) (757 ) Discontinued projects (848 ) - Acquisition costs 104 - Net assets 13,530 14,147
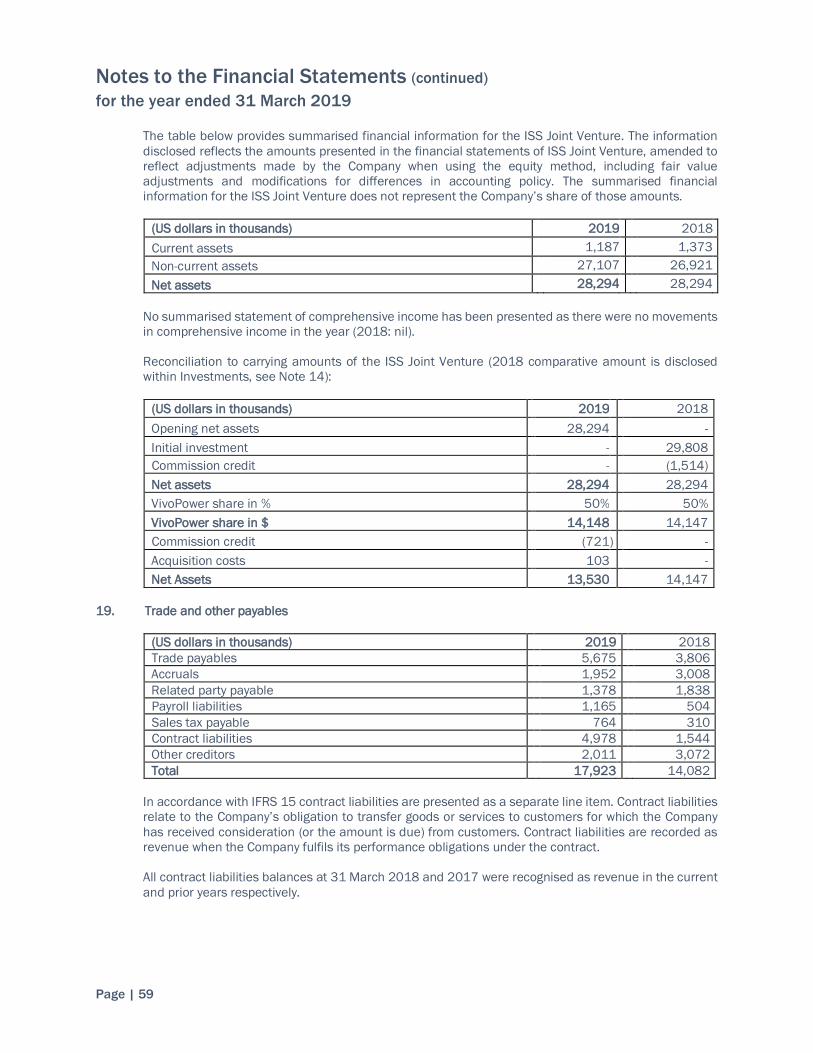
Notes to the Financial Statements (continued) for the year ended 31 March 2019
Page | 59
The table below provides summarised financial information for the ISS Joint Venture. The information disclosed reflects the amounts presented in the financial statements of ISS Joint Venture, amended to reflect adjustments made by the Company when using the equity method, including fair value adjustments and modifications for differences in accounting policy. The summarised financial information for the ISS Joint Venture does not represent the Company’s share of those amounts.
(US dollars in thousands) 2019 2018 Current assets 1,187 1,373 Non-current assets 27,107 26,921 Net assets 28,294 28,294 No summarised statement of comprehensive income has been presented as there were no movements in comprehensive income in the year (2018: nil). Reconciliation to carrying amounts of the ISS Joint Venture (2018 comparative amount is disclosed within Investments, see Note 14): (US dollars in thousands) 2019 2018 Opening net assets 28,294 - Initial investment - 29,808 Commission credit - (1,514) Net assets 28,294 28,294 VivoPower share in % 50% 50% VivoPower share in $ 14,148 14,147 Commission credit (721 ) - Acquisition costs 103 - Net Assets 13,530 14,147
19. Trade and other payables
(US dollars in thousands) 2019 2018 Trade payables 5,675 3,806 Accruals 1,952 3,008 Related party payable 1,378 1,838 Payroll liabilities 1,165 504 Sales tax payable 764 310 Contract liabilities 4,978 1,544 Other creditors 2,011 3,072 Total 17,923 14,082
In accordance with IFRS 15 contract liabilities are presented as a separate line item. Contract liabilities relate to the Company’s obligation to transfer goods or services to customers for which the Company has received consideration (or the amount is due) from customers. Contract liabilities are recorded as revenue when the Company fulfils its performance obligations under the contract. All contract liabilities balances at 31 March 2018 and 2017 were recognised as revenue in the current and prior years respectively.

Notes to the Financial Statements (continued) for the year ended 31 March 2019
Page | 60
20. Provisions
(US dollars in thousands) 2019 2018 Current provisions Employee entitlements 1,459 1,474 Employee terminations 157 616 Onerous contracts 94 380 1,710 2,470
Non-current provisions Employee entitlements 227 288 Onerous contracts 1,995 - 2,222 288
Total 3,932 2,758 Employee entitlements include long term leave and vacation provisions. The employee terminations provision represents severance and contract termination costs associated with employees and contractors who departed the business as a result of the restructuring more fully disclosed in note 7. The onerous contracts provision recognises the forecast losses associated with contracts to purchase Solar Renewable Energy Certificates from the NC-31 and NC-31 projects until 2027. The expected losses have been discounted at the Company’s borrowing rate on long-term debt of 8.5%.
(US dollars in thousands) Employee Entitlements
Employee Terminations
Onerous Contract Total
At 1 April 2017 1,576 - - 1,576 Charged/(credited) to profit or loss: - - - - Additional provisions recognised 186 616 380 1,182 At 31 March 2018 1,762 616 380 2,758 Foreign exchange (140 ) - - (140 ) Charged/(credited) to profit or loss: Additional provisions 510 243 1,804 2,557 Reverse unused provisions (26 ) (87 ) - (113 ) Provisions utilised (420 ) (614 ) (96 ) (1,130 ) At 31 March 2019 1,686 158 2,088 3,932
21. Loans and borrowings
(US dollars in thousands) 2019 2018 Current liabilities Debtor invoice financing 751 - Finance leases 136 285 Financing agreement - 2,000 Shareholder loan - 1,670 887 3,955

Notes to the Financial Statements (continued) for the year ended 31 March 2019
Page | 61
(US dollars in thousands) 2019 2018 Non-current liabilities Shareholder loan 18,242 18,092 Finance leases 138 293 18,380 18,385
Total 19,267 22,340 In August 2018, the Company secured a $3.6 million (AU$5 million) debtor finance facility to support the growing working capital requirements of its critical power services businesses. The facility is secured by a fixed charge over the debtors’ book and floating charge over all other assets of J.A. Martin Electrical Pty Limited and Kenshaw Electrical Pty Limited. The shareholder loan is due to Arowana International Limited (“AWN”), the Company’s majority shareholder, bears interest at 8.5% per annum paid monthly in advance, and is unsecured. No repayment of principal is required until July 2020, and then is repayable in 21 equal monthly instalments. Terms of the loan require that 50% of the net proceeds from sale of more than $10 million of the ISS Joint Venture or any critical power services business also be directed to loan repayment. The obligations under finance leases are as follows:
(US dollars in thousands) Minimum lease payments:
Present value of minimum lease
payments
2019 2018 2019 2018 Amounts payable under finance leases: Less than one year 147 291 136 285 Later than one year but not more than five 143 327 138 293 290 618 274 578 Future finance charges (16 ) (40 ) - - Total obligations under finance lease 274 578 274 578
22. Called up share capital
2019 2018 Allotted, called up and fully paid Ordinary shares of $0.012 each as at 31 March $ 162,689 $ 162,689 Number allotted
Ordinary shares of $0.012 each 13,557,376 13,557,376
No. of shares
At 1 April 2017 13,557,376 Issue of new shares - At 31 March 2018 13,557,376 Issue of new shares - At 31 March 2019 13,557,376

Notes to the Financial Statements (continued) for the year ended 31 March 2019
Page | 62
23. Other reserves
(US dollars in thousands) 2019 2018 Equity instruments 26,090 25,072 Share option reserve 3,713 3,713 Capital raising costs (9,722 ) (9,722 ) Treasury shares (246 ) (592 ) Foreign exchange 11 (88 ) Total 19,846 18,383
Equity instruments are convertible preference shares and convertible loan notes in Aevitas Group Limited (“Aevitas Group”) which must convert to shares of VivoPower at $10.20 per share no later than 30 June 2021. The Company has classified these instruments as equity under the “fixed-for-fixed” rule meaning that both the amount of consideration received/receivable and the number of equity instruments to be issued is fixed. There are 2,473,367 convertible preference shares outstanding with a face value of AU$3.00 per share and mature on June 30, 2021. The value held in reserves of AU$10,515,382 represents their face value plus dividends accrued to 31 March 2019. Convertible preference shares are subordinated to all creditors of Aevitas Group, rank equally amongst themselves, and rank in priority to ordinary shares of Aevitas Group. There are 2,473,367 convertible loan notes outstanding with a face value of AU$7.00 per share and mature on June 30, 2021. The value held in reserves of AU$23,806,189 represents their face value plus interest accrued to 31 March 2019. The convertible loan notes rank equally with the unsecured creditors of Aevitas Group.
Dividends or interest is payable quarterly in arrears at a rate of 7% on the capitalised value to 29 December 2016, the date at which they became convertible to VivoPower shares. At maturity, or if a trigger event such as a change of control event, listing event or a disposal of substantially all of Aevitas Group has occurred, the Company can choose to redeem the instruments or convert them into VivoPower ordinary shares at a price of US$10.20 per share. In connection with the acquisition of Aevitas Group, the Company entered into a guarantee of the obligations of Aevitas Group under the terms of the preference shares and loan notes. The share option reserve represents 828,000 share options granted to Early Bird Capital as part of the initial public share offering. The options entitle the holder to buy VivoPower ordinary shares at US$8.70 at any time before 30 April 2020. The options were accounted for as a share-based award and accordingly, the cost of the award was recognised directly in equity and was applied against capital raising costs. The fair value of the options was determined at the grant date, using the Black Scholes Model, and not remeasured subsequently. On 30 March 2017, the Company repurchased 129,805 shares at a price of $4.50 for a total sum of $591,911, including commission, and held them as treasury shares. During the year ended 31 March 2019, 75,805 of these shares were awarded to employees under the Company’s 2017 Omnibus Incentive Plan. Based on the closing market value of these shares on the day of award, $85,660 was expensed as employee compensation and remaining cost of $260,011 was charged against retained earnings.

Notes to the Financial Statements (continued) for the year ended 31 March 2019
Page | 63
24. Earnings per share
The earnings and weighted average numbers of ordinary shares used in the calculation of earnings per share are as follows: (US dollars in thousands) 2019 2018 Profit/(loss) for the year (11,223 ) (27,879 ) Weighted average number of shares in issue (‘000s) 13,557 13,557 Basic earnings/(loss) per share (dollars) (0.83 ) (2.06 ) Diluted earnings/(loss) per share (dollars) (0.83 ) (2.06 )
25. Contingencies
On 26 February 2018, the Company’s former Chief Executive Officer, Phillip Comberg, filed a legal claim alleging the Company committed a repudiatory breach of his service agreement in connection with the termination of his employment on 4 October 2017. Mr. Comberg is claiming damages of £615,600 related to the notice period in his service agreement, £540,000 related to shares in the Company he alleges were due to him, and other unquantified amounts related to bonuses and past services fees alleged to be due. On 9 April 2018, the Company filed a defence and counterclaim, denying that a repudiatory breach was committed by the Company and denying the other claims asserted by Mr. Comberg, claiming that Mr. Comberg was terminated for cause. On 26 November 2018, the Company agreed to a settlement of the counterclaims against Mr. Comberg for an undisclosed amount. No settlement has been reached with respect to Mr. Comberg’s claim. The Company continues to strongly deny and defend the claim. As the outcome of the litigation is uncertain, very much dependent upon uncertain future determinations by third parties, and the amount of any liability cannot be reliably measured, no provision has been made in these financial statements in respect of this matter.
26. Operating lease commitments
As at 31 March 2019, the Company had future aggregate minimum commitments under non-cancellable operating leases expiring as shown below. (US dollars in thousands) 2019 2018 Property
Payable in less than one year 442 312 Payable between one and five years 222 - Total 664 312 Motor vehicles
Payable in less than one year 149 - Payable between one and five years 547 - Total 696 - Other equipment
Payable in less than one year 8 16 Payable between one and five years 16 5 Total 24 21

Notes to the Financial Statements (continued) for the year ended 31 March 2019
Page | 64
27. Pensions
The Group’s principal pension plan comprises the compulsory Superannuation scheme in Australia, where the Group contributes 9.5%. A new pension scheme was also established for UK employees during the year, where the Group contributes 3%. The pension charge for the year represents contributions payable by the Group which amounted to $756,614 (2018: $900,483).
28. Financial instruments
(US dollars in thousands) 2019 2018 Financial assets at amortised cost Trade and other receivables 7,971 7,392 Cash and cash equivalents 4,522 1,939 Restricted cash 1,319 - Total 13,812 9,331 Financial Liabilities at amortised cost Loans and borrowings 19,267 22,340 Trade and other payables 11,016 11,724 Total 30,283 34,064
The amounts disclosed in the above table for trade and other receivables and payables do not agree to the amount reported in the Company’s consolidated statement of financial position as they exclude prepaid expenses, payroll and sale tax payables and contract assets and liabilities which do not meet the definition of financial assets or liabilities.
(a) Financial risk management The Group’s principal financial instruments are bank balances, cash and medium-term loans. The main purpose of these financial instruments is to manage the Group’s funding and liquidity requirements. The Group also has other financial instruments such as trade receivables and trade payables which arise directly from its operations.
The Group is exposed through its operations to the following financial risks:
● Liquidity risk
● Credit risk
● Interest rate risk
● Foreign currency risk
The Board of Directors has overall responsibility for the establishment and oversight of the Group’s risk management framework. Policy for managing risks is set by the Chief Executive Officer and is implemented by the Group’s finance department. All risks are managed centrally with a tight control of all financial matters. (b) Liquidity risk Liquidity risk is the risk that the Group will not be able to meet its financial obligations as they fall due. The Group considers that it has no significant liquidity risk. The Group held unrestricted cash resources of $4.5 million (2018: $1.9 million) at 31 March 2019. The ratio of current assets to current liabilities is 1.43 (2018: 1.03). During the year, the Group established a $3.6 million debtor finance facility to support its working capital requirements, of which only $0.8 million was drawn at 31 March 2019. In addition, the Group maintains near-term cash flow forecasts that enable it to identify its borrowings requirement so that remedial action can be taken if necessary.

Notes to the Financial Statements (continued) for the year ended 31 March 2019
Page | 65
Contractual maturities of financial liabilities, including interest payments, are as follows:
2019 (US dollars in thousands) Total
Less than
1 year 1-3 years 3-5 years
More than
5 years Contractual maturity of financial liabilities Trade and other payables (financial liabilities) 11,016 11,016 - - - Borrowings 22,480 2,556 19,924 - - Finance leases 290 147 143 - - Total 33,786 13,719 20,067 - -
2018 (US dollars in thousands) Total
Less than
1 year 1-3 years 3-5 years
More than
5 years Contractual maturity of financial liabilities Trade and other payables (financial liabilities) 11,724 11,724 - - - Borrowings 25,896 5,498 14,111 6,287 - Finance leases 619 291 328 - - Total 38,239 17,513 14,439 6,287 - (c) Credit risk The primary risk arises from the Group’s receivables from customers and contract assets. The majority of the Group’s customers are long standing and have been a customer of the Group for many years. Losses have occurred infrequently. The Group is mainly exposed to credit risks from credit sales but the Group has no significant concentrations of credit risk and keeps the credit status of customers under review. Credit risks of new customers are reviewed before entering into contracts. The debtor exposure is monitored by Group finance and the local entities review and report their exposure on a monthly basis. The Group does not consider the exposure to the above risks to be significant and has therefore not presented a sensitivity analysis on the identified risks. The credit quality of debtors neither past due nor impaired is good. Refer to note 17 for further analysis on trade receivables. (d) Foreign currency risk
The Group operates internationally and is exposed to foreign exchange risk on sales and purchases that are denominated in currencies other than the respective functional currencies of the Group entities to which they relate, primarily with respect to GBP and USD, but also between USD and AUD. The Group’s investments in overseas subsidiaries are not hedged as those currency positions are either USD denominated and/or considered to be long-term in nature. The Group is exposed to foreign exchange risk on $9.7 million of trade and other receivables denominated in AUD. In addition, the Group is exposed to foreign exchange risk on $11.1 million of trade and other payables, of which $10.5 million is denominated in AUD and $0.6 million in GBP. In addition, the Group is exposed to foreign exchange risk on $0.3 million of finance leases and $0.8 million debtor finance loans denominated in AUD. The related party loans are denominated in USD, and therefore, foreign currency risk is eliminated.

Notes to the Financial Statements (continued) for the year ended 31 March 2019
Page | 66
(e) Interest rate risk As a result of the related party loan agreement the Group is exposed to interest rate volatility. However, the interest rate is fixed for the medium term, therefore, the risk is largely mitigated for the near future. The Group will continue to monitor the movements in the wider global economy.
29. Related party transactions
Arowana International Limited is the ultimate controlling party by virtue of its 60.3% shareholding in VivoPower. Kevin Chin, Chairman of VivoPower, is also Chief Executive of Arowana International Limited. During the year, a number of services were provided to the Group from Arowana and its subsidiaries (“Arowana”); the extent of the transactions between the two groups is listed below. VivoPower is indebted to Arowana via a shareholder loan on normal commercial terms with interest at 8.5% per annum payable monthly in advance and principal repayable in equal monthly instalments of $75,000 for ten months beginning April 2018, with the remainder repayable in 21 equal monthly instalments commencing July 2020. At 31 March 2019 the principal balance due to Arowana by VivoPower under this loan was $18,242,636 (2018: $18,992,636). Directors fees for Kevin Chin in the amount of $254,084 were charged to the Company by Arowana Partners Group Pty Limited, a company of which Mr. Chin is a shareholder and director, during the year ended 31 March 2019. At 31 March 2019 the Company had an account payable to Arowana Partners Group Pty Limited of $47,990 (2018: $42,188) in respect of these services.
Art Russell, Interim Chief Executive Officer, is employed by Arowana International UK Limited, a subsidiary of Arowana, and seconded to VivoPower; $293,972 was charged to the Company during the year ended 31 March 2019. At 31 March 2019 the Company had an account payable of $32,657 (2018: $80,026) in respect of these services. Gary Hui, a former Director, was paid $219,334 by VivoPower USA LLC, of which $158,408 was recharged to Arowana during the year ended 31 March 2019. At 31 March 2019, VivoPower USA LLC has an account receivable from Arowana of $nil (2018: $242,915) in respect of these recharges. From time to time, costs incurred by Arowana on behalf of VivoPower are recharged to the Company. During the year ended 31 March 2019, no such amounts were recharged to the Company, however at 31 March 2019, the Company has a payable to Arowana in respect of recharges related to prior years of $1,268,670 (2018: $1,802,003).
Aevitas is indebted to the following subsidiaries of Arowana via their holdings in Aevitas convertible loan notes, which are accounted for as equity instruments within other reserves, as more fully described in note 23, and for which they earned $713,286 of interest during the year ended 31 March 2019. The outstanding amount represents the face value plus interest accrued to 31 March 2019:
● Arowana Australasian Special Situations 1A Pty Ltd: 666,666 Aevitas convertible loan notes with an
outstanding amount of $4,590,582;
● Arowana Australasian Special Situations 1B Pty Ltd: 666,667 Aevitas convertible loan notes with an outstanding amount of $4,590,589; and,
● Arowana Australasian Special Situations 1C Pty Ltd: 666,667 Aevitas convertible loan notes with an
outstanding amount of $4,590,589. Subsidiaries of Arowana hold the following convertible preferred shares of Aevitas, which are accounted for as equity instruments within other reserves, and for which they earned $305,694 of dividends during the year ended 31 March 2019. The outstanding amount represents the face value plus dividends accrued to 31 March 2019:

Notes to the Financial Statements (continued) for the year ended 31 March 2019
Page | 67
● Arowana Australasian Special Situations 1A Pty Ltd: 388,889 Aevitas convertible preferred shares
with an outstanding amount of $1,183,123;
● Arowana Australasian Special Situations 1B Pty Ltd: 388,889 Aevitas convertible preferred shares
with an outstanding amount of $1,183,123;
● Arowana Australasian Special Situations 1C Pty Ltd: 388,889 Aevitas convertible preferred shares
with an outstanding amount of $1,183,123; and,
● Arowana Australasian Special Situations Fund 1 Pty Limited: 833,333 Aevitas convertible preferred
shares held with an outstanding amount of $2,535,261.
Aevitas is indebted to The Panaga Group Trust, of which Mr. Kevin Chin is a beneficiary and one of the directors of the corporate trustee of such trust, who holds 4,500 Aevitas convertible loan notes with an outstanding amount of $29,422 representing face value plus interest accrued to 31 March 2019 and earned interest of $1,605 for the year ended 31 March 2019. Aevitas is also indebted to The Panaga Group Trust, who also holds 4,500 Aevitas convertible preferred shares with an outstanding amount of $13,020 representing face value plus dividends accrued to 31 March 2019 and earned dividends of $688 for the year ended 31 March 2019.
30. Subsequent event On 2 July 2019, the Company sold its 100% interest in VivoRex, LLC, for $1 and recorded a gain for accounting purposes of $2.276 million as a result of the disposal of onerous contract obligations of $2.047 million and other liabilities of $0.302 million, net of cash and other current assets of $0.073 million. Results of operations for VivoRex, LLC, are reported within the Solar Development operating segment, as disclosed in note 4.2, and accounted for $1.959 million (2018: $0.645 million) of the operating loss reported for this segment.
31. Key management personnel compensation Key management personnel, which are those roles that have a group management aspect to them are included in note 8 to the consolidated financial statements.
32. Ultimate controlling party The ultimate controlling party and the results into which these financials are consolidated is Arowana International Limited, a company registered in Australia.

Company Statement of Financial Position as at 31 March 2019
Page | 68
Registered number 09978410 As allowed by S408 Companies Act 2006, no profit and loss account is presented in respect of the parent company. The loss for Company after taxation was $2,212,000 (2018: $9,260,663 loss). These financials were approved by the Board on 10 July 2019 and signed on its behalf by:
Kevin Chin Chairman
(US dollars in thousands) Note 2019 2018
ASSETS Non-current assets Deferred tax assets 349 - Investments 3 7,388 7,388 Intercompany loan receivable 24,356 25,258 Total non-current assets 32,093 32,646
Current assets Cash and cash equivalents 4 20 Other receivables 4 18,238 17,257 Total current assets 18,242 17,277
TOTAL ASSETS 50,335 49,923
EQUITY AND LIABILITIES Current liabilities Trade payables 1,652 630 Accrued expenses and other payables 5 3,018 600 Total current liabilities 4,670 1,230
Equity Share capital 6 163 163 Share premium 40,215 40,215 Other reserves 7 18,101 18,657 Retained deficit (12,814 ) (10,342 ) Total Equity 45,665 48,693
TOTAL EQUITY AND LIABILITIES 50,335 49,923

Company Cash Flow Statement for the year ended 31 March 2019
Page | 69
(US dollars in thousands)
Note 2019 2018
Cash flows from operating activities Loss for the year (2,212) (9,261 ) Income tax (378 ) 29
Finance income - (2 ) Finance expense 36 33
Impairment of investment 3 - 10,465
Increase in trade and other receivables (27 ) 277
Increase in trade and other payables 805 86
Net cash (used in)/from operating activities (1,776 ) 1,627
Cash flows from investing activities
Interest received - 2 Intercompany loan funding 4 1,796 (2,008 ) Net cash from/(used in) investing activities 1,796 (2,006 ) Cash flows from financing activities
Other reserves - (7 ) Finance expense (36 ) (33 ) Net cash (used in)/from financing activities (36 ) (40 ) Net increase in cash and cash equivalents (16 ) (419 ) Cash and cash equivalents at the beginning of the year 20 439
Cash and cash equivalents at the end of the year 4 20

Company Statement of Changes in Equity for the year ended 31 March 2019
Page | 70
For further information on “Other Reserves” please see note 7 to the Company Financial Statements.
(US dollars in thousands) Share Capital Share Premium Other Reserves Retained Deficit Total At 1 February 2016 - - - - - Total comprehensive income for the year - - - (1,074) (1,074) Redenomination of share capital (4) - - - (4) Issue of new shares 167 40,215 - - 40,382 Equity instruments - - 25,072 - 25,072 Capital raising costs - - (9,722) - (9,722) Share option reserve - - 3,713 - 3,713 Purchase of shares - - (592) - (592)
163 40,215 18,471 (1,074) 57,775 At 31 March 2017 163 40,215 18,471 (1,074) 57,775 Total comprehensive income for the year - - - (9,261) (9,261) Foreign exchange - - 1 186 (7) 179 - - 1 186 (9,652) 9,466 At 31 March 2018 163 40,215 18,657 (10,342) 48,693 Total comprehensive income for the year - - (1,920) (2,212) (4,132) Equity instruments - - 1,018 - 1,018 Treasury shares granted to employees - - 346 (260) 86 Total comprehensive income for the year - - (556) (2,472) (3,028) At 31 March 2018 163 40,215 18,101 (12,814) 45,665

Notes to the Company Financial Statements for the year ended 31 March 2019
Page | 71
1. Basis of preparation
VivoPower International PLC company financial statements were prepared in accordance with International Financial Reporting Standards (IFRS) as adopted by the European Union, IFRIC interpretations and the Companies Act 2006 applicable to companies reporting under IFRS. The financial statements have been prepared under the historical cost convention. As allowed by S408 Companies Act 2006, no profit and loss account is presented in respect of the parent company.
2. Accounting policies
(a) Foreign exchange
The Company’s functional and presentational currency is the US dollar. Transactions denominated in foreign currencies are translated into the functional currency of the entity at the rates prevailing at the dates of the individual transactions. Foreign currency monetary assets and liabilities are translated at the rates prevailing at the balance sheet date. Exchange gains and losses arising are charged or credited to the profit and loss account. (b) Taxation
Deferred taxation is provided in full for material timing differences except where recoverability of a deferred tax is considered to be remote in the foreseeable future. Deferred tax balances are not discounted unless the effects are considered to be material the Company’s results.
(c) Investments
Investments held as non-current assets are shown at cost less provision for impairment. (d) Related party transactions Details of the related party transactions can be found in note 30 within the consolidated financial statements.
3. Investments
(US dollars in thousands) 2019 2018 Shares in group undertakings Investment in VivoPower International Services Limited 7,388 7,388 Total 7,388 7,388
The details of the principal undertakings in which the Group’s interest at the period-end was more than 20%, all of which are referred to in note 13 in the consolidated financial statements. As at 31 March 2018, VivoPower International Services Limited (“VISL”) recorded an impairment charge of $10.5 million against goodwill that arose on the acquisition of VivoPower Pty Limited in the previous year, as disclosed in note 12 in the consolidated financial statements. Accordingly, this impairment has been reflected in the Company’s investment in VISL.

Notes to the Company Financial Statements (continued) for the year ended 31 March 2019
Page | 72
4. Other receivables
(US dollars in thousands) 2019 2018 Amounts owed by group undertakings 18,099 17,145 Prepaid expenses 139 112 Total 18,238 17,257
5. Accrued expenses and other payables
(US dollars in thousands) 2019 2018 Accrued expenses 1,161 565 Payroll tax liabilities 9 6 Amounts owed to group undertakings 1,848 - Other creditors - 29 Total 3,018 600
6. Share capital
(US dollars) 2019 2018 Allotted, called up and fully paid Ordinary shares of $0.012 each as at 31 March $162,689 $162,689 Number allotted Ordinary shares of $0.012 each 13,557,376 13,557,376
No. of shares At 1 April 2017 13,557,376 Issue of new shares - At 31 March 2018 13,557,376 Issue of new shares - At 31 March 2019 13,557,376
The Company issued 13,557,376 ordinary shares at a nominal value of $0.012 during the period ended 31 March 2017. On 30 March 2017, the Company repurchased 129,805 shares at a price of $4.50 for a total sum of $591,916, including commission. The shares are being held as treasury shares. During the year ended 31 March 2019, 75,805 of these shares were awarded to employees under the Company’s 2017 Omnibus Incentive Plan. Based on the closing market value of these shares on the day of award, $85,660 was expensed as employee compensation and remaining cost of $260,011 was charged to retained earnings.
7. Other reserves
(US dollars in thousands) 2019 2018 Equity instruments 26,090 25,072 Capital raising costs (9,722) (9,722) Share option reserve 3,713 3,713 Treasury shares (see note 6) (246) (592) Foreign exchange (1,734) 186 Total 18,101 18,657

Notes to the Company Financial Statements (continued) for the year ended 31 March 2019
Page | 73
Equity instruments relate to convertible preference shares and convertible loan notes that are exchangeable for shares in VivoPower International PLC. There are 2,473,367 convertible preference shares at an issue price of $3.00 per share. There are 2,473,367 convertible loan notes at an issue price of $7.00 per share. The value held in reserves represents their face value plus the accrued interest to 31 March 2019. Interest is payable quarterly in arrears at a rate of 7% on both instruments.
Share option reserve relates to share options whereby the holder can buy VivoPower International PLC shares at US$8.70 at any time before 30 April 2020. As at 31 March 2019, there were 828,000 options outstanding.
8. Employees and directors
The company employed no members of staff during the course of the period. Contractual agreements are in place for five non-executive directors to serve on the board of VivoPower International PLC. See the Directors’ Report in the consolidated financial statements for full details of the directors.

Company Information
Page | 74
ADVISORS Company Registrars Legal Advisers Computershare Inc. DAC Beachcroft LLP 250 Royall Street 25 Walbrook Canton, MA, USA 02021 London, UK EC2A 2EG Correspondence address: Principal Bankers Computershare Inc., Barclays Bank PLC, P.O. Box 505000, Level 16, 1 Churchill Place, Louisville, KY, USA 40233 Canary Wharf, London, UK E14 5HP
Independent Auditors Company Secretary
PKF Littlejohn LLP, JTC (UK) Limited 1 Westferry Circus, 7th Floor Canary Wharf, 9 Berkeley Street London, UK E14 4HD London, UK W1J 8DW
SHAREHOLDER INFORMATION Country of Incorporation and Main Number of Securities in Issue Countries of Operation
As of 5 July 2019, the Company’s VivoPower International PLC is incorporated in issued share capital consists of England & Wales. The Company operates in the 13,557,376 ordinary shares United Kingdom, United States with a nominal value of $0.012 each. and Australia. The Company has 54,000 treasury shares.
Company Registration
Registered office: 7th Floor, 9 Berkeley Street, London, UK W1J 8DW Registered in England & Wales Company number: 09978410
FINANCIAL CALENDAR Annual General Meeting (“AGM”) The Company’s AGM will be held on 23 September 2019 at the offices of DAC Beachcroft, LLP, 25 Walbrook, London, United Kingdom EC4N 8AF. The notice of the meeting will be sent to shareholders at least 21 days before the meeting.
