annual report - vba.vic.gov.au · in the vba’s first annual report, ... audit plan aimed at...
TRANSCRIPT

ANNUAL REPORT

ISSN: 2203-8779 (Print) ISSN: 2203-8892 (Online)
© State of Victoria, Victorian Building Authority 2015
The Victorian Building Authority Annual Report 2014—15 is licensed under Creative Commons Attribution 4.0. You are free to re-use the work under that licence, on the condition that you credit the Victorian Building Authority as the author, indicate if changes were made to the document and comply with the other licence terms.
The licence does not apply to any branding, logo or images used in this publication.
Authorised by the Victorian Building Authority 733 Bourke Street Docklands, Victoria 3008
Printed on Australian made paper that is 100% recycled, uncoated, FSC® Certified and certified carbon neutral.
Available online at vba.vic.gov.au


REGULATING FOR A
QUALITY BUILT ENVIRONMENT IN VICTORIA.

vi
AN
NU
AL
RE
PO
RT
2014
—15
Accountable Officer’s declaration . . . . . . . . . . . . . . . . . . . . . . . . . . . . . . . . viii
1 REPORT OF OPERATIONS 1Year in review . . . . . . . . . . . . . . . . . . . . . . . . . . . . . . . . . . . . . . . . . . . . . . . . . 2
Strategic objectives . . . . . . . . . . . . . . . . . . . . . . . . . . . . . . . . . . . . . . . . . . . . . 3
Chairman and Chief Commissioner’s report . . . . . . . . . . . . . . . . . . . . . . . . . 4
Chief Executive Officer’s report . . . . . . . . . . . . . . . . . . . . . . . . . . . . . . . . . . . . 5
Legislation and relevant Minister . . . . . . . . . . . . . . . . . . . . . . . . . . . . . . . . . . 7
Nature and range of services provided. . . . . . . . . . . . . . . . . . . . . . . . . . . . . 7
Objectives, functions and powers . . . . . . . . . . . . . . . . . . . . . . . . . . . . . . . . . 7
Achievements . . . . . . . . . . . . . . . . . . . . . . . . . . . . . . . . . . . . . . . . . . . . . . . . . 8
Protected consumers and capable practitioners . . . . . . . . . . . . . . . . . . . . . 8
Contemporary approach . . . . . . . . . . . . . . . . . . . . . . . . . . . . . . . . . . . . . . . . 11
Organisational capability . . . . . . . . . . . . . . . . . . . . . . . . . . . . . . . . . . . . . . . 13
Our performance . . . . . . . . . . . . . . . . . . . . . . . . . . . . . . . . . . . . . . . . . . . . . . 14
Regulatory activity . . . . . . . . . . . . . . . . . . . . . . . . . . . . . . . . . . . . . . . . . . . . . 14
Building and plumbing registration and licensing activity . . . . . . . . . . . . . 15
Building and plumbing activity . . . . . . . . . . . . . . . . . . . . . . . . . . . . . . . . . . . 15
Security of payment . . . . . . . . . . . . . . . . . . . . . . . . . . . . . . . . . . . . . . . . . . . 15
Building and plumbing compliance activity . . . . . . . . . . . . . . . . . . . . . . . . 16
Building and plumbing enforcement activity . . . . . . . . . . . . . . . . . . . . . . . 16
Building and plumbing community activity . . . . . . . . . . . . . . . . . . . . . . . . . 16
Financial activity . . . . . . . . . . . . . . . . . . . . . . . . . . . . . . . . . . . . . . . . . . . . . . 17
Financial governance . . . . . . . . . . . . . . . . . . . . . . . . . . . . . . . . . . . . . . . . . . 19
BACV Provision . . . . . . . . . . . . . . . . . . . . . . . . . . . . . . . . . . . . . . . . . . . . . . . 19
Significant changes or factors affecting performance . . . . . . . . . . . . . . . . 19
Capital projects . . . . . . . . . . . . . . . . . . . . . . . . . . . . . . . . . . . . . . . . . . . . . . . 19
Disclosure of grants and transfer payments. . . . . . . . . . . . . . . . . . . . . . . . 19
Subsequent events . . . . . . . . . . . . . . . . . . . . . . . . . . . . . . . . . . . . . . . . . . . . 19
2 GOVERNANCE AND ORGANISATIONAL STRUCTURE 21Organisational structure and corporate governance arrangements . . . . 21
Board biographies . . . . . . . . . . . . . . . . . . . . . . . . . . . . . . . . . . . . . . . . . . . . 21
Audit and Risk Committee . . . . . . . . . . . . . . . . . . . . . . . . . . . . . . . . . . . . . . 23
Remuneration Committee. . . . . . . . . . . . . . . . . . . . . . . . . . . . . . . . . . . . . . . 24
CEO biography . . . . . . . . . . . . . . . . . . . . . . . . . . . . . . . . . . . . . . . . . . . . . . . 24
Organisational chart . . . . . . . . . . . . . . . . . . . . . . . . . . . . . . . . . . . . . . . . . . . 25
Division role statements . . . . . . . . . . . . . . . . . . . . . . . . . . . . . . . . . . . . . . . . 26
Human resource management . . . . . . . . . . . . . . . . . . . . . . . . . . . . . . . . . . 26
Incident management . . . . . . . . . . . . . . . . . . . . . . . . . . . . . . . . . . . . . . . . . 26
Performance against occupational, health and safety management measures . . . . . . . . . . . . . . . . . . . . . . . . 27
Employment and conduct principles . . . . . . . . . . . . . . . . . . . . . . . . . . . . . . 27
CONTENTS

vii
VIC
TOR
IAN
BU
ILD
ING
AU
THO
RIT
Y
3 WORKFORCE DATA 29Public administration values and employment principles . . . . . . . . . . . . . 29
Comparative workforce data . . . . . . . . . . . . . . . . . . . . . . . . . . . . . . . . . . . . 29
Disability Act . . . . . . . . . . . . . . . . . . . . . . . . . . . . . . . . . . . . . . . . . . . . . . . . . 31
Executive officer data . . . . . . . . . . . . . . . . . . . . . . . . . . . . . . . . . . . . . . . . . . 31
4 OTHER DISCLOSURES 33Implementation of VIPP . . . . . . . . . . . . . . . . . . . . . . . . . . . . . . . . . . . . . . . . 33
Consultancy expenditure . . . . . . . . . . . . . . . . . . . . . . . . . . . . . . . . . . . . . . . 34
Disclosure of major contracts . . . . . . . . . . . . . . . . . . . . . . . . . . . . . . . . . . . . 34
Government advertising expenditure . . . . . . . . . . . . . . . . . . . . . . . . . . . . . 34
Freedom of information . . . . . . . . . . . . . . . . . . . . . . . . . . . . . . . . . . . . . . . . 34
Compliance with the Building Act . . . . . . . . . . . . . . . . . . . . . . . . . . . . . . . . 35
National Competition Policy . . . . . . . . . . . . . . . . . . . . . . . . . . . . . . . . . . . . . 35
Protected Disclosures . . . . . . . . . . . . . . . . . . . . . . . . . . . . . . . . . . . . . . . . . . 35
Carers Recognition . . . . . . . . . . . . . . . . . . . . . . . . . . . . . . . . . . . . . . . . . . . . 36
Office-based environmental impacts . . . . . . . . . . . . . . . . . . . . . . . . . . . . . 36
Additional information available on request . . . . . . . . . . . . . . . . . . . . . . . 37
DataVic Access Policy . . . . . . . . . . . . . . . . . . . . . . . . . . . . . . . . . . . . . . . . . . 37
Risk management attestation . . . . . . . . . . . . . . . . . . . . . . . . . . . . . . . . . . . 37
Insurance attestation . . . . . . . . . . . . . . . . . . . . . . . . . . . . . . . . . . . . . . . . . . 37
Disclosure index . . . . . . . . . . . . . . . . . . . . . . . . . . . . . . . . . . . . . . . . . . . . . . 38
5 FINANCIAL STATEMENTS 41Accountable officer’s and chief finance and accounting officer’s declaration . . . . . . . . . . . . . . . . . . . . . . . . . . . . . . 41
Comprehensive operating statement for the financial year ended 30 June 2015 . . . . . . . . . . . . . . . . . . . . . . . . . . . . . . . . . . . . . . . . . . . 44
Comprehensive operating statement for the financial year ended 30 June 2015 . . . . . . . . . . . . . . . . . . . . . . . . . . . . . . . . . . . . . . . . . . . 45
Balance sheet as at 30 June 2015 . . . . . . . . . . . . . . . . . . . . . . . . . . . . . . . . 46
Statement of changes in equity for the financial year ended 30 June 2015 . . . . . . . . . . . . . . . . . . . . . . . . . . . . . . . . . . . . . . . . . . . 47
Cash flow statement for the financial year ended 30 June 2015 . . . . . . . . . . . . . . . . . . . . . . . . . . . . . . . . . . . . . . . . . . . 48
Notes to the financial statements . . . . . . . . . . . . . . . . . . . . . . . . . . . . . . . . 49
6 APPENDICES 971. BAB and BPB five-year regulatory information . . . . . . . . . . . . . . . . . . . . 97
2. BAB, BPB, BAC, PAC and BRAC reporting . . . . . . . . . . . . . . . . . . . . . . . . 98
Abbreviations . . . . . . . . . . . . . . . . . . . . . . . . . . . . . . . . . . . . . . . . . . . . . . . 102

ACCOUNTABLE OFFICER’S DECLARATION
In accordance with the Financial Management Act 1994 (Vic), I have great pleasure presenting the second Victorian Building Authority Annual Report, for the reporting period 1 July 2014 to 30 June 2015.
30 September 2015
Prue Digby Chief Executive Officer

1
VIC
TOR
IAN
BU
ILD
ING
AU
THO
RIT
Y
CONTENTS
7
REPORT OF OPERATIONS
1
GOVERNANCE AND ORGANISATIONAL
STRUCTURE
2
WORKFORCE DATA
3
OTHER DISCLOSURES
4
FINANCIAL STATEMENTS
5
APPENDICES
6
ABBREVIATIONS
1REPORT OF OPERATIONS
THE REPORT OF OPERATIONS FOR 2014—15, PROVIDES GENERAL INFORMATION ABOUT THE VBA AND ITS ACTIVITIES, ACHIEVEMENTS AND STRATEGIC DIRECTION.
2
AN
NU
AL
RE
PO
RT
2014
—15
YEAR IN REVIEW
Strategic direction
In 2014, the VBA Board approved a four year Corporate Plan 2014—18 that includes the following vision, mission, objectives and values.
A TRUSTED REGULATOR
A RESPECTED INDUSTRY
AN INFORMED COMMUNITY
REGULATING FOR A QUALITY BUILT ENVIRONMENT IN VICTORIA.
RESPONSIVENESSINTEGRITYIMPARTIALITYACCOUNTABILITYRESPECTLEADERSHIPHUMAN RIGHTS
FUTURE FOCUSACHIEVING TOGETHERINSPIRING EXCELLENCERESPECTING INDIVIDUALSENSURING TRUST
VISION
MISSION
VICTORIAN PUBLIC SECTOR VALUESAs a Victorian Public Sector entity, the VBA Board’s Charter reflects the VPS values. As a part of the VPS, the VBA’s staff must adhere to the values of:
VICTORIAN BUILDING AUTHORITY VALUESIn addition, the VBA’s Corporate Plan identifies additional and unique organisational values the VBA’s staff must adhere to. They are:

3
VIC
TOR
IAN
BU
ILD
ING
AU
THO
RIT
Y
REPORT OF OPERATIONS
1
PROTECTED CONSUMERS AND CAPABLE PRACTITIONERSStrategies
• Build the capability of practitioners
• Deliver improved consumer protection
• Deliver improved consumer and practitioner information
PUBLIC VALUEStrategies
• Deliver strategic and major projects arising from statutory obligations
• Develop a regulatory approach
• Influence and inform best practice policy and regulation
CONTEMPORARY APPROACHStrategies
• Deliver a positive customer experience
• Develop and maintain a strong VBA presence and stakeholder engagement
• Drive consistency of decision-making
ORGANISATIONAL CAPABILITYStrategies
• Increase staff skills and capability
• Drive a culture underpinned by integrity that encourages leadership, energy and enthusiasm
• Embed strong governance
• Manage our finances prudently
STRATEGIC OBJECTIVES
The VBA will achieve the vision through:
4
AN
NU
AL
RE
PO
RT
2014
—15
CHAIRMAN AND CHIEF COMMISSIONER’S REPORT
The Victorian Building Authority (VBA) completed its second year of operations on 30 June 2015.
The VBA’s role is to oversee the regulation of Victoria’s building and plumbing industries, which this year generated a record
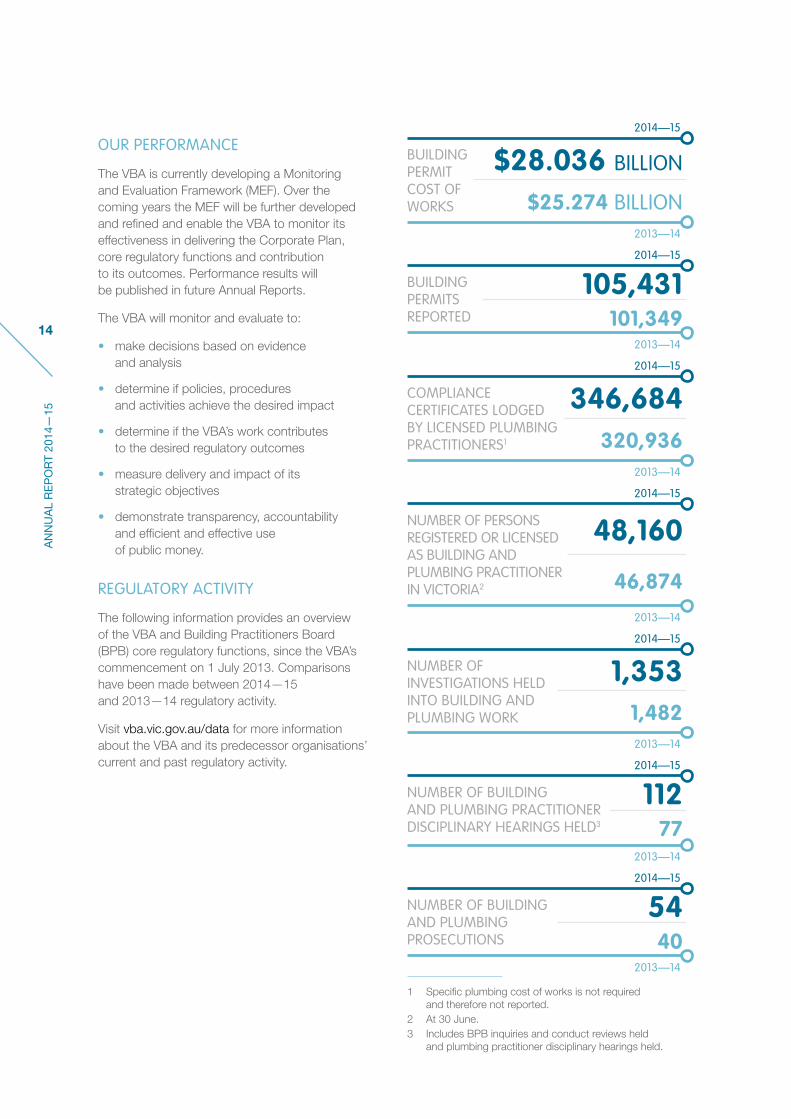
$28.036 billion in building permit activity arising from 105,431 reported building permits. In addition, over this period 346,684 compliance certificates were lodged with the VBA by licensed plumbing practitioners. These results were delivered by the construction industry and the 48,160 building and plumbing practitioners the VBA regulates. With this record activity comes a demand for vigilance and an increase in our regulatory activity. The VBA Board has identified a number of strategic issues as key focus areas in 2015—16. These include prioritising the monitoring and enforcement oversight of relevant building surveyors, ensuring consumers have access to straightforward and timely information and advice and improving practitioner registration and discipline regimes.
In the VBA’s first Annual Report, I wrote about the steps already taken to address the matters raised by the Victorian Auditor-General’s Office (VAGO) in 2011 and the Victorian Ombudsman in 2012 regarding the former Building and Plumbing Industry Commissions. I am pleased to advise that VAGO’s 2015 report, Victoria’s Consumer Protection Framework for Building Construction, acknowledged the work that the VBA has done and put in train to improve its regulatory performance.
The Board and I continue to provide oversight of the development and delivery of strategies and actions that will produce benefits for consumers as well as building and plumbing practitioners.
These include:
• Delivery of the 2014—18 Corporate Plan, setting the immediate future of the VBA.
• Increasing engagement and presence with industry stakeholders to ensure that our approach as a regulatory body is informed. This includes implementation of a stakeholder engagement framework to bring industry together to discuss key issues and the provision of a quarterly organisation and industry update, which reports data from the VBA’s operations and administration of the regulatory framework.
• Continuing to implement the VAGO recommendations of 2011 and 2015.
• Establishment of an enterprise risk management function to drive better decision making by the VBA.
There have been a number of new corporate governance initiatives and policies developed in 2014—15. The VBA has a strategic internal audit plan aimed at mitigating our strategic and operational risks and the Board and Audit and Risk Committee regularly review the VBA’s risk profile. The Board delivered the first phase of the VBA’s Monitoring and Evaluation Framework which will enable the VBA to assess and improve its performance and provide transparent information on the efficiency and effectiveness of the regulatory system to the Victorian community.
In 2015—16, the VBA will receive the Minister for Planning’s Statement of Expectations. Delivery on these expectations will further enhance the transparency and accountability of the VBA’s operations, lead to further business improvements and ensure that we continue to collaborate with other regulators involved in the building industry to improve regulatory outcomes. The initiatives in the Statement of Expectations will be fully integrated into the Corporate Plan.
I would like to express my appreciation to our Chief Executive Officer, Prue Digby, and her Executive Leadership Team and staff for their continued efforts to deliver good regulatory outcomes for the Victorian community.
I would also like to thank all the Board members for their significant contributions over the past year. In conclusion, I thank Dr Damien Cremean, who retired as Deputy Chief Commissioner earlier this year. Damien made a significant contribution to the VBA as one of the founding board members..
William R. Kusznirczuk Chairman and Chief Commissioner
5
VIC
TOR
IAN
BU
ILD
ING
AU
THO
RIT
Y
REPORT OF OPERATIONS
1
CHIEF EXECUTIVE OFFICER’S REPORT
This year our efforts have been squarely pointed at improving our operations, through a number of strategies and actions, to deliver better outcomes for Victoria’s building and plumbing industries, consumers and the community.
A great deal of work has been commenced on our Corporate Plan program of activities, while carrying out our core regulatory functions.
This year the VBA conducted 1,353 investigations into building and plumbing work. As a result, between the Building Practitioners Board (BPB) and the VBA, we conducted 112 building and plumbing practitioner disciplinary hearings and the VBA prosecuted 54 registered and unregistered building and plumbing practitioners. In addition, 18 rectification orders and notices were issued to plumbing practitioners. We have also enhanced our building inspection capability with additional resources and technical expertise to support our investigation function and assist in resolving consumer disputes.
As part of our regulatory remit, we have also worked with our regulatory partners to conduct an external cladding audit in response to the 2014 Docklands building fire. The VBA’s response to the Docklands building fire, including its external cladding audit and practitioner investigation, has been a major focus over the past six months. Building safety is a national issue and the VBA along with Department of Environment, Land, Water and Planning (DELWP) has been supporting the Minister for Planning in leading the national conversation to improve safety and regulation of building cladding materials through proposed reforms to the Building Code, National Construction Code and participating in a wide range of policy forums.
We have implemented an in-house risk-based plumbing audit function and introduced ongoing improvements to the VBA with better systems, resources and technical expertise to more efficiently service practitioners and consumers.
The VBA’s new Complaints Services Unit is providing a consistent approach in our dealings with complaints regarding building and plumbing work. The new Unit is enabling complaints to be resolved more efficiently and effectively.
To further enhance complaint handling, the VBA and Consumer Affairs Victoria are developing a memorandum of understanding (MOU) to improve delivery of the Building Advice and Conciliation Victoria (BACV) function, processes and education campaigns.
The Licensing and Registration Process Improvement Project is under way and will streamline our existing processes, reduce unnecessary regulatory burden on industry and practitioners, develop a better approach to provide a robust assessment of building and plumbing practitioner registration and licensing applications and support the BPB’s decision making. New arrangements to enable the VBA to influence training courses that provide a pathway to registration are being implemented from next year, including developing MOUs with key vocational education and training stakeholders.
A significant amount of time during 2014—15 was spent supporting VAGO’s Victoria’s Consumer Protection Framework for Building Construction audit. VAGO recognised the complexity of the regulatory environment and noted the work undertaken by the VBA to improve our performance. The VAGO report and its recommendations were welcomed and have been incorporated into our Corporate Plan.
The VBA recognises the importance of ongoing engagement and consultation with its stakeholders – practitioners, industry and consumers. In 2014—15, the VBA continued with its ongoing program of stakeholder meetings. The VBA has also developed a stakeholder engagement framework which will see the establishment of regular stakeholder reference groups to ensure industry and consumer perspectives are key inputs into our decision making.
I thank the Board for their guidance and the Executive Leadership Team and staff for their support and contribution to a solid list of achievements in 2014—2015.
We look forward to the coming year and delivery of our Corporate Plan “year two” program.
I am proud to present this Annual Report as the official record of the VBA’s continuing transformation and achievement.
Prue Digby Chief Executive Officer
I AM PROUD TO PRESENT THIS ANNUAL REPORT AS THE OFFICIAL RECORD OF THE VBA’S CONTINUING
TRANSFORMATION AND ACHIEVEMENT.

6
AN
NU
AL
RE
PO
RT
2014
—15
THE VBA REGULATES BUILDING AND PLUMBING
PRACTITIONERS TO ENSURE THE ACHIEVEMENT
OF EFFICIENT AND COMPETITIVE BUILDING
AND PLUMBING INDUSTRIES IN VICTORIA.

7
VIC
TOR
IAN
BU
ILD
ING
AU
THO
RIT
Y
REPORT OF OPERATIONS
1
LEGISLATION AND RELEVANT MINISTER
As at 30 June 2015, the Victorian Building Authority (VBA) is accountable to the Minister for Planning. The VBA is responsible for carrying out the functions detailed in the Building Act 1993 (Vic) and the Building and Construction Industry Security of Payment Act 2002 (Vic).
NATURE AND RANGE OF SERVICES PROVIDED
The VBA regulates building and plumbing practitioners to ensure the achievement of efficient and competitive building and plumbing industries in Victoria.
The VBA’s services include:
• responding to general enquiries from the public about the building and plumbing industries
• registering, licensing and disciplining plumbers in Victoria
• supporting the work of the Building Practitioners Board which is responsible for registering and disciplining building practitioners
• providing expert technical advice and informed solutions to industry
• undertaking inspections, investigations and audits to enforce compliance with relevant legislation
• working with other agencies and regulators to ensure building and plumbing practitioners are compliant and that their consumers are protected
• publishing data for building and plumbing practitioners
• monitoring the collection of building permit levies
• overseeing the work of building surveyors and Victoria’s building permit system.
OBJECTIVES, FUNCTIONS AND POWERS
The VBA’s functions under the Building Act 1993 (Vic) include to:
• monitor and enforce compliance with the Act
• administer licensing and registration of plumbers
• participate in the development of national building and plumbing standards
• monitor developments relevant to the regulation of building and plumbing standards
• promote the maintenance of adequate competency levels amongst plumbers
• provide information on:
– building and plumbing standards
– the regulation of buildings, building work and building practitioners
– the regulation of plumbing work and plumbing practitioners
• provide information and training to assist those who are carrying out functions under the Act or Building Regulations 2006 (Vic)
• promote the resolution of consumer complaints about work carried out by builders and plumbers
• conduct or promote research relating to the regulation of the building and plumbing industries in Victoria and report on the research outcomes in the VBA Annual Report
• monitor the collection of building permit levy
• charge and collect fees for information and training services provided by the VBA
• administer the Victorian Building Authority Fund
• advise the Minister for Planning.
The VBA’s functions under the Building and Construction Industry Security of Payment Act 2002 (Vic) include to:
• authorise nominating authorities (ANAs) to nominate adjudicators to determine payment disputes
• maintain a publicly available register of ANAs
• keep a record of adjudication determinations and publish adjudication statistics.

8
AN
NU
AL
RE
PO
RT
2014
—15
ACHIEVEMENTS
In 2014, the VBA released its Corporate Plan 2014—18 and in 2015 updated and refined its strategic direction with the release of the VBA Annual Plan 2015—16.
A number of actions have been completed or progressed in order to deliver the four strategic objectives:
• Protected consumers and capable practitioners
– Enable better protected and more confident building consumers serviced by capable building and plumbing practitioners
• Public value
– Create an accessible, transparent and responsive organisation that delivers public value through effective and efficient regulatory services
• Contemporary approach
– Lead a contemporary approach to regulation of industries and professions
• Organisational capability
– Increased organisational capability.
As noted, the VBA has responded to some emerging issues such as the Docklands building fire, bringing the VBA’s plumbing audit function in-house and the VAGO 2015 recommendations. As a result, the VBA has revised some of the actions and due dates in its Corporate Plan and the updated Annual Plan.
PROTECTED CONSUMERS AND CAPABLE PRACTITIONERS
STRATEGY ACTION YEAR DUE DELIVERY AND PROGRESS
Build the capability of practitioners
Create effective disciplinary processes
2014—15 to 2016—17
• New disciplinary procedures were developed by the VBA and implemented by the Building Practitioners Board (BPB) in February 2015 with more work to occur in 2016—17.
Develop capacity-building initiatives with peak bodies to secure a sustainable workforce across the building and plumbing industries
2015—16 to 2016—17
• Not yet commenced.
Build upon our strengths and improve the oversight of licensing and registration of practitioners
2014—15 to 2015—16
• Commenced project to re-engineer application processes and improve information relating to the registration of building practitioners and the registration and licensing of plumbing practitioners, for implementation in 2016.
Increase compliance and performance capability
2015—16 to 2016—17
• Functional alignment of the Compliance and Performance Division occurred in February 2015.
Work with registered training organisations to inform the design of courses and programs that deliver capable and qualified practitioners
2015—16 to 2016—17
• Not yet commenced.
9
VIC
TOR
IAN
BU
ILD
ING
AU
THO
RIT
Y
REPORT OF OPERATIONS
1
STRATEGY ACTION YEAR DUE DELIVERY AND PROGRESS
Deliver improved consumer protection
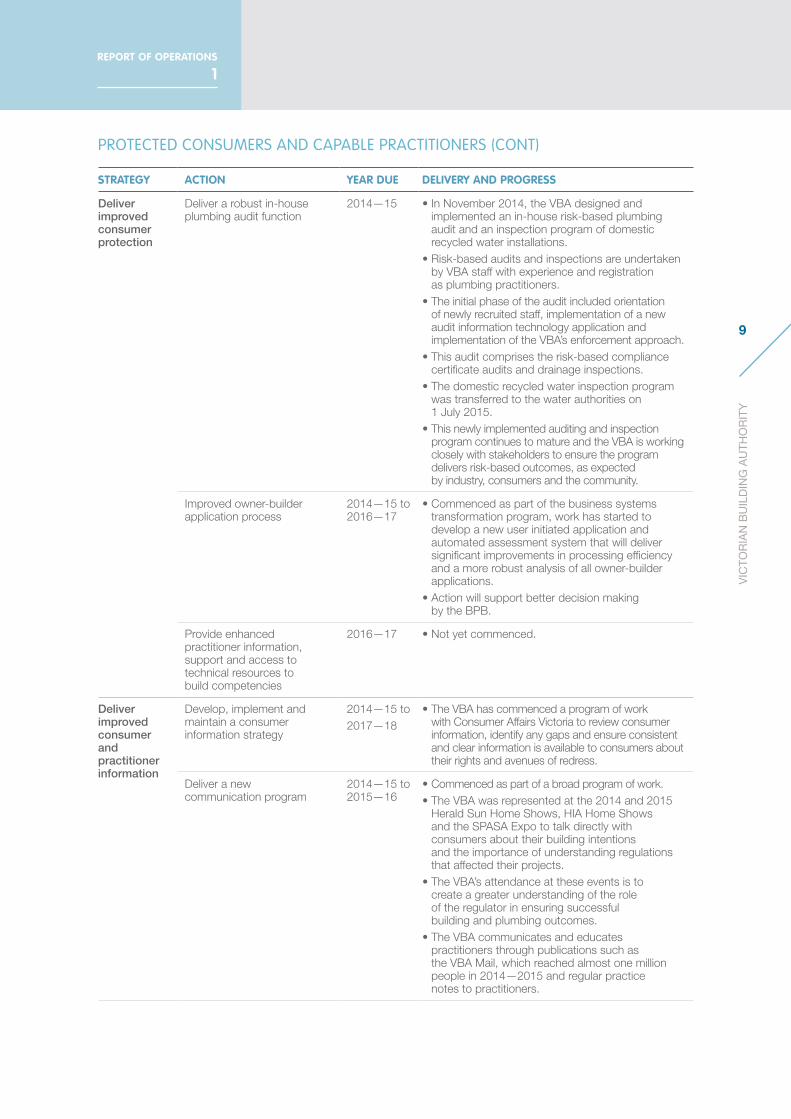
Deliver a robust in-house plumbing audit function
2014—15 • In November 2014, the VBA designed and implemented an in-house risk-based plumbing audit and an inspection program of domestic recycled water installations.
• Risk-based audits and inspections are undertaken by VBA staff with experience and registration as plumbing practitioners.
• The initial phase of the audit included orientation of newly recruited staff, implementation of a new audit information technology application and implementation of the VBA’s enforcement approach.
• This audit comprises the risk-based compliance certificate audits and drainage inspections.
• The domestic recycled water inspection program was transferred to the water authorities on 1 July 2015.
• This newly implemented auditing and inspection program continues to mature and the VBA is working closely with stakeholders to ensure the program delivers risk-based outcomes, as expected by industry, consumers and the community.
Improved owner-builder application process
2014—15 to 2016—17
• Commenced as part of the business systems transformation program, work has started to develop a new user initiated application and automated assessment system that will deliver significant improvements in processing efficiency and a more robust analysis of all owner-builder applications.
• Action will support better decision making by the BPB.
Provide enhanced practitioner information, support and access to technical resources to build competencies
2016—17 • Not yet commenced.
Deliver improved consumer and practitioner information
Develop, implement and maintain a consumer information strategy
2014—15 to 2017—18
• The VBA has commenced a program of work with Consumer Affairs Victoria to review consumer information, identify any gaps and ensure consistent and clear information is available to consumers about their rights and avenues of redress.
Deliver a new communication program
2014—15 to 2015—16
• Commenced as part of a broad program of work.• The VBA was represented at the 2014 and 2015
Herald Sun Home Shows, HIA Home Shows and the SPASA Expo to talk directly with consumers about their building intentions and the importance of understanding regulations that affected their projects.
• The VBA’s attendance at these events is to create a greater understanding of the role of the regulator in ensuring successful building and plumbing outcomes.
• The VBA communicates and educates practitioners through publications such as the VBA Mail, which reached almost one million people in 2014—2015 and regular practice notes to practitioners.
PROTECTED CONSUMERS AND CAPABLE PRACTITIONERS (CONT)

10
AN
NU
AL
RE
PO
RT
2014
—15
STRATEGY ACTION YEAR DUE DELIVERY AND PROGRESS
Provide a dispute resolution service
Implement a robust triage assessment
2014—15 • The VBA has implemented a dedicated Complaints Services Unit with clear processes, tools and technical expertise to assess, resolve or escalate complaints with the aim of delivering quicker timeframes and outcomes for consumers and practitioners involved in disputes and complaints.
• This action is complete.
PUBLIC VALUE
STRATEGY ACTION YEAR DUE DELIVERY AND PROGRESS
Deliver a positive customer experience
Develop, implement and publish a new customer service charter
2015—16 • Not yet commenced.
Develop and maintain a strong VBA presence and stakeholder engagement
Build a more effective regional service model
2015—16 • Not yet commenced.
Create and implement a new stakeholder engagement and communication strategy
2014—15 • The VBA continued regular meetings with a variety of stakeholder groups representing the building and plumbing industries and consumers to discuss key issues.
• The VBA developed a stakeholder engagement framework which will see the establishment of regular stakeholder reference groups to discuss operational issues and to ensure industry and consumer perspectives are key inputs into decision making.
• The VBA held state-wide seminars for builders and plumbers to inform them of changes to the National Construction Code.
Drive consistency of decision-making
Improve licensing and registration practices to reduce unnecessary regulatory burden on industry
2014—15 to 2017—18
• Commenced project to re-engineer application processes and improve information relating to the registration of building practitioners, and the registration and licensing of plumbing practitioners, for implementation in 2016.
PROTECTED CONSUMERS AND CAPABLE PRACTITIONERS (CONT)

11
VIC
TOR
IAN
BU
ILD
ING
AU
THO
RIT
Y
REPORT OF OPERATIONS
1
CONTEMPORARY APPROACH
STRATEGY ACTION YEAR DUE DELIVERY AND PROGRESS
Deliver strategic and major projects arising from statutory obligations
Develop and implement the Statement of Expectations in conjunction with Department of Environment, Land, Water and Planning (DELWP) to improve regulatory outcomes
2014—15 to 2015—16
• The VBA has worked in collaboration with DELWP to form a draft statement of expectations, for the Minister for Planning’s consideration, which includes improvements and targets to be implemented.
Deliver legislative changes and regulatory reforms as determined by government
2015—16 • New action added to the Annual Plan.
Support DELWP in sunsetting of the building regulations
2015—16 • The VBA has continued to provide support to DELWP in its preparation for drafting of new building regulations and associated regulatory impact assessment.
• This year the VBA has continued the collection of data, implemented a dedicated stakeholder engagement forum including expert working groups, liaised extensively with Councils, provided subject matter expertise to policy and regulatory evaluation and supported DELWP in the initial development of a regulatory impact statement.
Support DELWP in sunsetting of the plumbing regulations
2017—18 • Not yet commenced.
Enhance the VBA’s monitoring of private building surveyors’ mandatory inspection requirements
2015—16 • New action added to the Annual Plan.
Implement the recommendations arising from VAGO’s 2015 audit and finalise the implementation of actions arising from VAGO’s 2011 audit
2015—16 • New action added to the Annual Plan to capture VAGO’s 2011 and 2015 recommendations and integrate them into the VBA Corporate Plan.
• VAGO 2011 report recommendations and 2015 report recommendations and suggestions are being systematically managed through a project management approach to ensure effective implementation. Work is being overseen by the Executive Leadership Team and will be regularly reported to the Board.

12
AN
NU
AL
RE
PO
RT
2014
—15
CONTEMPORARY APPROACH (CONT)
STRATEGY ACTION YEAR DUE DELIVERY AND PROGRESS
Develop a regulatory approach
Participate in the development of national building and plumbing standards
2014—15 to 2017—18
• The National Construction Code (NCC) 2015 was adopted in Victoria on 1 May 2015.
• The VBA contributed to the NCC development through participation in all meetings of the Australian Building Codes Board (ABCB), Building Codes Committee and Plumbing Codes Committee.
• In addition, the VBA made submissions to two public comment documents published by the ABCB, reviewed all tabled draft NCC reference documents and participated directly in nine Australian Standard committees.
Create strong organisational intelligence capabilities that inform regulatory activities
2014—15 to 2017—18
• Established a Practitioner Intelligence Unit and developed an operational intelligence policy to inform the best use of compliance and enforcement resources and tools.
• Enhanced internal compliance reporting to encompass both building and plumbing work.
Build an evidence-based approach to regulation and allocation of effort and resources
2015—16 to 2017—18
• New action added to the Annual Plan.• The VBA has scoped and has in place milestones
for delivery of its regulatory approach.
Influence and inform best practice policy and regulation
Conduct and promote research regarding the regulation of Victoria's building and plumbing industries
2014—15 to 2017—18
• The VBA is a participating organisation in Swinburne University of Technology’s research on Minimisation of Damage to Residential Structures Due to Ground Movement, commencing in 2011 under a Grant from the Australian Research Council. The research is programmed to conclude late 2015.
• The Low Carbon Living (LCL) Cooperative Research Centre (CRC) commenced in 2013, the projects relating to the VBA as a partner organisation aim to identify how information, education, best practice regulation, codes and standards can maximise LCL outcomes in new and renovated buildings.
• In support of DELWP in the sunsetting of the building regulations research has focused on the regulatory areas of swimming pool safety, protection works, the role of reporting authorities and role of building permit data held by local councils
Develop and implement a new monitoring and evaluation framework
2015—16 • The first phase of the Monitoring and Evaluation Framework (MEF) has been delivered. The VBA is further developing a MEF and is expanding its menu of indicators to include measuring service delivery efficiency and effectiveness.
• Performance results will be progressively published in future Annual Reports.

13
VIC
TOR
IAN
BU
ILD
ING
AU
THO
RIT
Y
REPORT OF OPERATIONS
1
ORGANISATIONAL CAPABILITY
STRATEGY ACTION YEAR DUE DELIVERY AND PROGRESS
Increase staff skills and capability
Create a new staff competency and capability framework based on Victorian Public Sector Commission standards
2015—16 to 2017—18
• Work on a new staff competency and capability framework has commenced.
Deliver learning and development initiatives to the VBA
2015—16 • Development and implementation of a new VBA learning and development program has commenced.
Increase the VBA’s inspection service capability
2014—15 • The VBA has increased its in-house technical capability for building work inspections with an additional building surveyor, building inspector and a graduate building surveyor.
• The enhanced capability will provide technical expertise across the VBA and increased in-field inspection activities.
• It is further proposed to increase resources for inspections of building work in 2015—16.
Drive a culture underpinned by integrity that encourages leadership, energy and enthusiasm
Align Corporate Plan direction through organisational resource allocation and performance management
2014—15 to 2017—18
• The annual employee performance planning process is structured to enable alignment with the Corporate Plan’s strategic objectives.
Define and implement an engaged and innovative VBA culture
2014—15 to 2017—18
• The VBA Wellbeing Committee has been established and will drive programs and initiatives that support the VBA’s culture.
• A long-term cultural transformation and employee engagement program is under development.
Develop a new information, communication and technology (ICT) strategy to support the VBA's operations and optimise consumer outcomes
2015—16 • Work on the business systems transformation program has commenced and will provide our stakeholders with more efficient services that are easier to use, such as online forms and payments.
• The business systems transformation program will help the VBA make better business decisions, be more proactive in identifying and implementing change and provide better services to industry and consumers through increased accessibility.
• The VBA is updating its three-year ICT strategy to improve service delivery.
Embed strong governance
Address issues identified in audits and reviews and embed practices that support improved outcomes
2014—15 to 2017—18
• The VBA has in place a Strategic Internal Audit Plan 2014—16 aimed at mitigating strategic and operational risks and ensuring VAGO’s 2015 recommendations are implemented.
Establish a risk management function that drives strong decision-making
2014—15 • Released a new VBA Enterprise Risk Management Policy and Framework.
• Released a VBA Business Continuity Policy.• Preparation of a VBA Business Continuity
Plan is underway.
Manage our finances prudently
Upgrade financial systems to allow for better management of functions
2015—16 • Implementation of upgrades are yet to commence.
14
AN
NU
AL
RE
PO
RT
2014
—15
OUR PERFORMANCE
The VBA is currently developing a Monitoring and Evaluation Framework (MEF). Over the coming years the MEF will be further developed and refined and enable the VBA to monitor its effectiveness in delivering the Corporate Plan, core regulatory functions and contribution to its outcomes. Performance results will be published in future Annual Reports.
The VBA will monitor and evaluate to:
• make decisions based on evidence and analysis
• determine if policies, procedures and activities achieve the desired impact
• determine if the VBA’s work contributes to the desired regulatory outcomes
• measure delivery and impact of its strategic objectives
• demonstrate transparency, accountability and efficient and effective use of public money.
REGULATORY ACTIVITY
The following information provides an overview of the VBA and Building Practitioners Board (BPB) core regulatory functions, since the VBA’s commencement on 1 July 2013. Comparisons have been made between 2014—15 and 2013—14 regulatory activity.
Visit vba.vic.gov.au/data for more information about the VBA and its predecessor organisations’ current and past regulatory activity.
1 Specific plumbing cost of works is not required and therefore not reported.
2 At 30 June.3 Includes BPB inquiries and conduct reviews held
and plumbing practitioner disciplinary hearings held.
NUMBER OF BUILDING AND PLUMBING PRACTITIONER DISCIPLINARY HEARINGS HELD3
2014—15
2013—14
112 77
NUMBER OF BUILDING AND PLUMBING PROSECUTIONS
2014—15
2013—14
5440
NUMBER OF INVESTIGATIONS HELD INTO BUILDING AND PLUMBING WORK
2014—15
2013—14
1,3531,482
NUMBER OF PERSONS REGISTERED OR LICENSED AS BUILDING AND PLUMBING PRACTITIONER IN VICTORIA2
2014—15
2013—14
48,160
46,874
BUILDING PERMIT COST OF WORKS
2014—15
$28.036 BILLION
$25.274 BILLION2013—14
COMPLIANCE CERTIFICATES LODGED BY LICENSED PLUMBING PRACTITIONERS1
2014—15
346,684320,936
2013—14
BUILDING PERMITS REPORTED
2014—15
2013—14
105,431101,349

15
VIC
TOR
IAN
BU
ILD
ING
AU
THO
RIT
Y
REPORT OF OPERATIONS
1
BUILDING AND PLUMBING REGISTRATION AND LICENSING ACTIVITY
BPB 2014—15 2013—14 VBA 2014—15 2013—14
Applications for registration as a building practitioner received
2,836 2,247 Applications for registration or license as a plumbing practitioner received
1,853 1,765
Applications for registration as a building practitioner finalised
2,899 2,480 Applications for registration or license as a plumbing practitioner finalised
1,944 1,725
Number of persons registered as a building practitioner at 30 June
21,779 21,186 Number of persons registered or licensed as a plumbing practitioner at 30 June
26,381 25,688
Number of registrations by category of building practitioner at 30 June
Number of plumbing practitioners registered or licensed in each of the main classes of plumbing work at 30 June
Builder — Commercial builder 4,944 4,540 Drainage work 19,981 19,477
Builder — Domestic builder 14,692 14,398 Fire protection work 679 659
Building inspector 645 633 Gasfitting work 20,031 19,455
Building surveyor 638 603 Irrigation (non-agricultural) work 20,532 19,957
Draftsperson 2,373 2,360 Mechanical services work 16,548 16,513
Engineer 2,307 2,246 Roofing (stormwater) work 20,314 19,801
Quantity surveyor 127 134 Sanitary work 20,143 19,575
Erector or Supervisor (temporary structures)
109 107 Water supply work 20,469 19,889
Builder — Demolisher 327 302
BUILDING AND PLUMBING ACTIVITYVBA 2014—15 2013—14 VBA 2014—15 2013—14
Building permits reported 105,431 101,349 Compliance certificates lodged by licensed plumbing practitioners4
346,684 320,936
Building permits reported cost of works ($ billion)
$28.036 $25.274
Owner-builder certificates of consent issued by the BPB
8,310 7,730
Temporary structure occupancy permits issued
80 87
SECURITY OF PAYMENTVBA 2014—15 2013—14
Security of Payment
Number of adjudication applications
333 244
Value of amounts claimed ($ million)
$119.855 $93.923
Number of determinations 226 193
Value of adjudicated amounts ($ million)
$30.189 $30.099
4
4 Compliance certificates lodged can include multiple plumbing work classes. Visit vba.vic.gov.au/data for more detailed information.

16
AN
NU
AL
RE
PO
RT
2014
—15
BUILDING AND PLUMBING COMPLIANCE ACTIVITY
VBA VBA
Building audits completed 2014—15 2013—14 Plumbing audits completed5 2014—15 2013—14
Building audit program 976 450 Plumbing audits completed 7,573 16,447
Building permit levy audits 997 99 Plumbing audits as a percentage of lodged compliance certificates
2.2% 5.1%
Building investigations activity Plumbing investigations completed
Building practitioner investigations
464 441 Plumbing practitioner investigations
889 1,041
Sites visited as part of the field-based compliance program
261 307
Disciplinary hearings referred to BPB
151 145
BUILDING AND PLUMBING ENFORCEMENT ACTIVITYBPB AND VBA 2014—15 2013—14 VBA8 2014—15 2013—14
Building practitioner disciplinary hearings held by BPB
94 61 Plumbing practitioner disciplinary hearings held
18 16
Prosecutions completed — building
35 28 Prosecutions completed – plumbing
19 12
BUILDING AND PLUMBING COMMUNITY ACTIVITYVBA 2014—15 2013—14 VBA 2014—15 2013—14
Building complaints received 978 956 Plumbing complaints received 1,546 1,708
BACV inspections requested 117 107
BACV on site conciliations requested
767 777
VBA website and VBA Mail reach
2014—15 2013—14
Website visits 775,018 792,244
VBA Mail distribution9 996,167 508,35456789
5 In 2013—14, the VBA’s audits were conducted on the basis of auditing a random sample of 5% of the total compliance certificates lodged. From November 2014, the VBA moved to a risk-based audit approach. In addition, the VBA moved the plumbing audit function in-house. The number of audits completed was impacted during the transition period as the VBA established the necessary ICT infrastructure and trained new staff and the fact the VBA was required to conduct 19,168 inspections in 2014—15 of recycled water installations until 30 June 2015.
6 This audit program in 2014—15 focused on the Building Practitioner class, Builder – Demolisher. It also includes the completed and published external cladding audits of building permits as part of the 170 external cladding audits of building permits that the VBA commenced in May 2015, in response to the Docklands building fire.
7 This figure includes 68 field audits and 31 desk audits and audit reviews, across 271,186 building permits and building works totalling $53.7 billion.
8 In addition to plumbing disciplinary hearings and prosecutions, 18 rectification orders and notices were issued in 2014—15.9 In order to raise awareness of the VBA and its regulatory role, the VBA introduced a fortnightly email bulletin in December
2013. The increase in distribution numbers reflects that 23 issues were circulated in 2014—15 and only 13 issues were circulated in 2013—14.

17
VIC
TOR
IAN
BU
ILD
ING
AU
THO
RIT
Y
REPORT OF OPERATIONS
1
FINANCIAL ACTIVITY
Current year financial review & 2 year summary
ITEM2014—15
$M2013—14
$M
General building permit levy 17.8 16.5
BACV building permit levy 8.9 8.0
Plumbing compliance certificate sales 11.0 9.9
Practitioner registrations and licensing 8.0 7.5
Total income 51.0 46.7
Total expenses 46.6 42.0
Net result from operations 4.4 4.7
Total assets 43.6 38.5
Total liabilities 20.0 19.3
Accumulated surplus 9.1 4.7
BACV Provision 5.0 4.9
Net increase/decrease in cash and cash equivalents 5.1 8.5
Current year financial review and significant changes in financial position
EXPENDITURE$46.6 M
REVENUE$51.0 M
2014—15
EXPENDITURE$42.0 M
REVENUE$46.7 M
2013—14
EXPENDITURE$46.6 M
REVENUE$51.0 M
2014—15
EXPENDITURE$42.0 M
REVENUE$46.7 M
2013—14
The Victorian Building Authority’s financial result of a $4.4 million net surplus for the 2014—15 financial year was mainly contributable to another record year for building and plumbing activity in the state of Victoria. The building activity for 2014—15 reached a record high of $28.0 billion, an increase of 10.9 per cent on the 2013—14 result, which was previously the highest year on record. The sale of plumbing compliance certificates for 2014—15 reached a record high of $11.0 million from the sale of 355 thousand certificates, an increase of 7.6 per cent on the 2013—14 sales. Total revenue for 2014—15 was $51.0 million.
18
AN
NU
AL
RE
PO
RT
2014
—15
0
5,000
10,000
15,000
20,000
25,000
30,000
BUILDINGPERMIT LEVIES
REGISTRATIONS& LICENSES
PLUMBINGCOMPLIANCECERTIFICATES
OTHERREVENUE
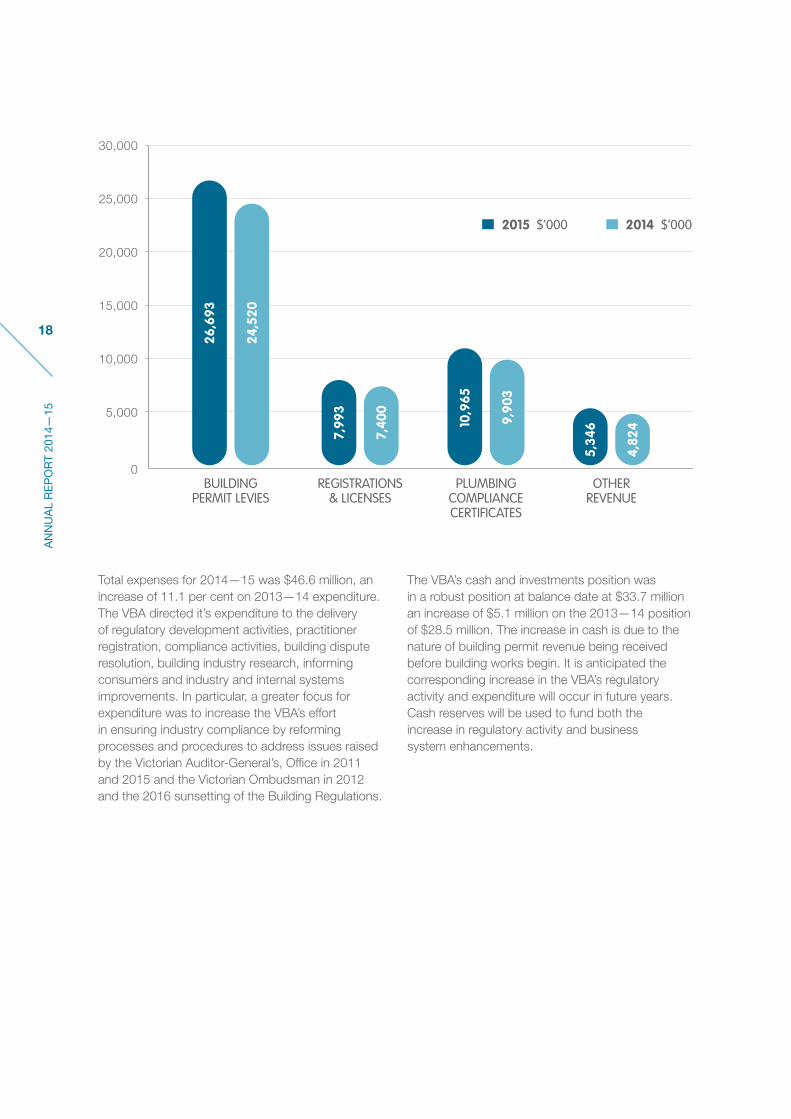
2015 $’000 2014 $’00026
,693
24,5
20
5,34
6
4,82
410,9
65
9,90
3
7,99
3
7,40
0
Total expenses for 2014—15 was $46.6 million, an increase of 11.1 per cent on 2013—14 expenditure. The VBA directed it’s expenditure to the delivery of regulatory development activities, practitioner registration, compliance activities, building dispute resolution, building industry research, informing consumers and industry and internal systems improvements. In particular, a greater focus for expenditure was to increase the VBA’s effort in ensuring industry compliance by reforming processes and procedures to address issues raised by the Victorian Auditor-General’s, Office in 2011 and 2015 and the Victorian Ombudsman in 2012 and the 2016 sunsetting of the Building Regulations.
The VBA’s cash and investments position was in a robust position at balance date at $33.7 million an increase of $5.1 million on the 2013—14 position of $28.5 million. The increase in cash is due to the nature of building permit revenue being received before building works begin. It is anticipated the corresponding increase in the VBA’s regulatory activity and expenditure will occur in future years. Cash reserves will be used to fund both the increase in regulatory activity and business system enhancements.
19
VIC
TOR
IAN
BU
ILD
ING
AU
THO
RIT
Y
REPORT OF OPERATIONS
1
FINANCIAL GOVERNANCE
The VBA is committed to a strong financial governance framework, supported by an independent Audit and Risk Committee.
There have been no events subsequent to the balance day that may have an effect in subsequent years. Full disclosure of the VBA’s financial position is included in the Financial Statements and Notes to the Financial Statements.
BACV PROVISION
The Building Advice and Conciliation Victoria (BACV) building permit levy funds the BACV functions as established under the Domestic Buildings Contracts (Conciliation and Dispute Resolution) Act 2002 (Vic). As part of the dispute resolution functions for the BACV, the VBA is allocated a portion of the levy to fund its role in the dispute resolution process and takes that income to account when received.
The VBA currently provides services in relation to BACV disputes arising from building permits issued in the past. As such, the VBA will in the future incur costs to service BACV disputes in relation to past building permits, including the cost of inspection reports and case administration. The BACV provision is the estimated net present value of those future costs to service disputes relating to past building permits issued. The value of the BACV provision as at 30 June 2015 is $5.0 million an increase of $0.1 million on the 2013—14 balance of $4.9 million.
SIGNIFICANT CHANGES OR FACTORS AFFECTING PERFORMANCE
There were no significant changes or factors which affected our performance during the reporting period.
CAPITAL PROJECTS
In 2014—15, the VBA did not manage any significant capital projects.
DISCLOSURE OF GRANTS AND TRANSFER PAYMENTS
The VBA provides an annual grant to the Australian Building Codes Board (ABCB). The ABCB is established under a joint initiative of all levels of government in Australia, together with the building industry. Its mission is to oversee issues relating to health, safety, amenity and sustainability in building. The ABCB promotes efficiency in the design, construction and performance of buildings through the National Construction Code (NCC) and the development of effective regulatory and non-regulatory approaches. The grant amount for 2014—15 was $0.6 million.
The VBA makes an annual contribution to the Department of Environment, Water, Land and Planning to fund the policy function. The payment amount for 2014—15 was $1.4 million.
SUBSEQUENT EVENTS
No matters or circumstances have arisen since the end of the financial year which significantly affected or may significantly affect the operations of the VBA, the results of those operations, or the state of affairs of the VBA in future years.

20
AN
NU
AL
RE
PO
RT
2014
—15
THE VBA BOARD IS RESPONSIBLE
FOR GOVERNANCE, STRATEGIC
MANAGEMENT AND CARRYING OUT
THE FUNCTIONS OF THE VBA.

21
VIC
TOR
IAN
BU
ILD
ING
AU
THO
RIT
Y
CONTENTS
7
REPORT OF OPERATIONS
1
GOVERNANCE AND ORGANISATIONAL
STRUCTURE
2
WORKFORCE DATA
3
OTHER DISCLOSURES
4
FINANCIAL STATEMENTS
5
APPENDICES
6
ABBREVIATIONS
2GOVERNANCE AND ORGANISATIONAL STRUCTURE
ORGANISATIONAL STRUCTURE AND CORPORATE GOVERNANCE ARRANGEMENTS
Board biographies
The VBA Board is established under section 200 of the Building Act 1993 (Vic) and is responsible for governance, strategic management and carrying out the functions of the VBA. Members are appointed on the Minister for Planning’s recommendation.
William (Bill) Kusznirczuk Chairman and Chief Commissioner
Bill Kusznirczuk is a leading Urban and Regional Planner in Australia.
He has extensive experience and knowledge in all aspects of planning, building, property development and how cities should look in the future. He is the founder and Managing Director of Clement-Stone Town Planners which has a long and respected tradition of providing professional advice in these fields.
He is a Board Member of the Metropolitan Planning Authority which provides advice to the Minister for Planning on future planning, development and infrastructure coordination for Victoria.
His valuable industry experience puts him at the forefront of advisors across Australia.
He is the former Chair of the Building Advisory Council and is an Australia Day Ambassador. Mr Kusznirczuk was appointed as the inaugural Chairman and Chief Commissioner of the Victorian Building Authority.

22
AN
NU
AL
RE
PO
RT
2014
—15
Dr Damien Cremean Deputy Chief Commissioner
(resigned 29 May 2015)
Damien Cremean has extensive experience in the areas of law, regulatory administration and dispute resolution in domestic building as the former deputy President of VCAT (domestic building list). He is also co-author of the standard Australian text on building and construction contracts and has extensive experience in a regulatory environment as a Board member and Chair of the Business Licensing Authority. Dr Cremean resigned from the Board on 29 May 2015.
David Bennett QC
David Bennett QC is a Senior Fellow of the University of Melbourne Law School and Chairman of the Advisory Board for its Masters of Construction Law program. In that Master’s program, he coordinates and lectures in two subjects. He is a former Adjunct Professor in Law at University of Technology, New South Wales and a founding board member of the University of Technology Sydney Centre for Dispute Resolution. He is Chair of the Building Regulation Advisory Committee.
In 2012, on behalf of the Department of Justice, he was responsible for the drafting of a model building contract for new homes published by Consumer Affairs Victoria for public use. Mr Bennett was nominated for appointment by the Minister for Consumer Affairs.
Warren Hutcheon
(appointed 9 September 2014)
Warren Hutcheon has over 31 years of experience in the insurance and risk industry and has held senior executive roles in both private and public sectors. He is currently Chief Executive Officer of Ansvar Insurance and a member of their Australian Board. He was previously CEO of the Victorian Managed Insurance Authority which provided risk and insurance services for the Government of Victoria.
Prior to this, Mr Hutcheon held executive and senior management positions with CGU, including Director of Strategic Initiatives, Director of Operations & Strategy and Head of Commercial Insurance.
Mr Hutcheon brings to the VBA Board a broad understanding of organisational change, risk and insurance across public and private sectors.
Brian Welch
Brian Welch has more than 26 years’ experience in senior executive roles within the building and property industry, including 20 years as Executive Director of the Master Builders Association of Victoria (MBAV). In this role Mr Welch drove establishment of the Master Builders’ brand and oversaw a threefold increase in membership and the opening of offices across Victoria.
Mr Welch brings to the Board this experience and understanding of the industry and the role and requirements of practitioners.
Lynne Williams
Lynne Williams brings extensive high level public service experience to the Board. She has held senior executive positions in State and Federal governments for more than 30 years, having most recently been Under Secretary in the Department of Treasury and Finance in Victoria.
Dr Williams has previously held senior executive positions in the departments of Premier and Cabinet, and Industry in Victoria. Dr Williams has considerable Board experience and is the current Chair of the Victorian Government Procurement Board, Deputy Chair of the Essential Services Commission of South Australia and Commissioner on the Victorian Legal Services Board.
Yvonne von Hartel
Yvonne von Hartel AM is a Founding Principal of the award-winning national architectural and urban design practice, peckvonhartel. She is a Council member of LaTrobe University and a Member of the LaTrobe University Council Infrastructure and Estates Planning Committee, a Trustee of the Melbourne Convention and Exhibition Centre, Chair of the Capital Works Committee and a Board member of the Queen Victoria Market Pty Ltd. She holds many concurrent design advisory roles including Member, University of Wollongong, SMART Infrastructure Advisory Council, Member of the Design Review Panel of the Sydney International Convention, Exhibition and Entertainment Precinct, a Member of the Capital Metro Agency Design Advisory Panel and Member of the Westconnex Design Advisory Panel.
In 2007, Ms von Hartel was awarded a Member of the Order of Australia for ‘services to architecture, design and building through involvement with a range of professional organisations, to the promotion of women in business, and to the community’.

23
VIC
TOR
IAN
BU
ILD
ING
AU
THO
RIT
Y
GOVERNANCE AND ORGANISATIONAL
STRUCTURE
2
Board meeting attendance 2014—15
NAME TERM OF APPOINTMENT ATTENDEDMAXIMUM
POSSIBLE
William R. Kusznirczuk Chief Commissioner (Chair)
1 July 2013 to 30 June 2016 14 14
David Bennett QC 1 July 2013 to 30 June 2016 14 14
Dr Damien Cremean Deputy Chief Commissioner
1 July 2013 to 29 May 2015 11 13
Brian Welch 29 October 2013 to 30 June 2016 12 14
Warren Hutcheon 9 September 2014 to 28 February 2017 9 10
Lynne Williams 1 April 2014 to 28 February 2017 13 14
Yvonne von Hartel AM 1 April 2014 to 28 February 2017 10 14
AUDIT AND RISK COMMITTEE
The Audit and Risk Committee provides assurance to the Board and CEO that accountability, risk and internal control environments are operating effectively and efficiently.
Achievements
The Audit and Risk Committee (ARC) met eight times during the year. Two Commissioners retired from the ARC in November 2014. Two Commissioners joined the ARC in November 2014. In accordance with the requirements of the Standing Directions of the Minister for Finance, all members of the ARC are independent of the management of the VBA.
On the recommendation of the ARC, the Board adopted amendments to the ARC charter in April 2015.
The ARC is responsible for overseeing internal and external audit, risk management and reviewing and recommending any changes to the VBA’s processes for monitoring compliance with applicable laws, regulations and codes of conduct.
In 2014—15, the ARC oversaw critical reviews of strategic risks and recommended for approval to the Board a new VBA Enterprise Risk Management Policy and Framework.
Audit and Risk Committee meeting attendance 2014—15
NAME ATTENDEDMAXIMUM
POSSIBLE
Dr Damien Cremean Deputy Chief Commissioner (Chair until 18 November 2014)
3 3
Warren Hutcheon (Chair from 19 November 2014)
5 5
David Bennett QC 3 3
Lynne Williams (from 19 November 2014)
4 5
Brian Welch 6 8
Dianne Azoor-Hughes (independent member)
7 8
24
AN
NU
AL
RE
PO
RT
2014
—15
REMUNERATION COMMITTEE
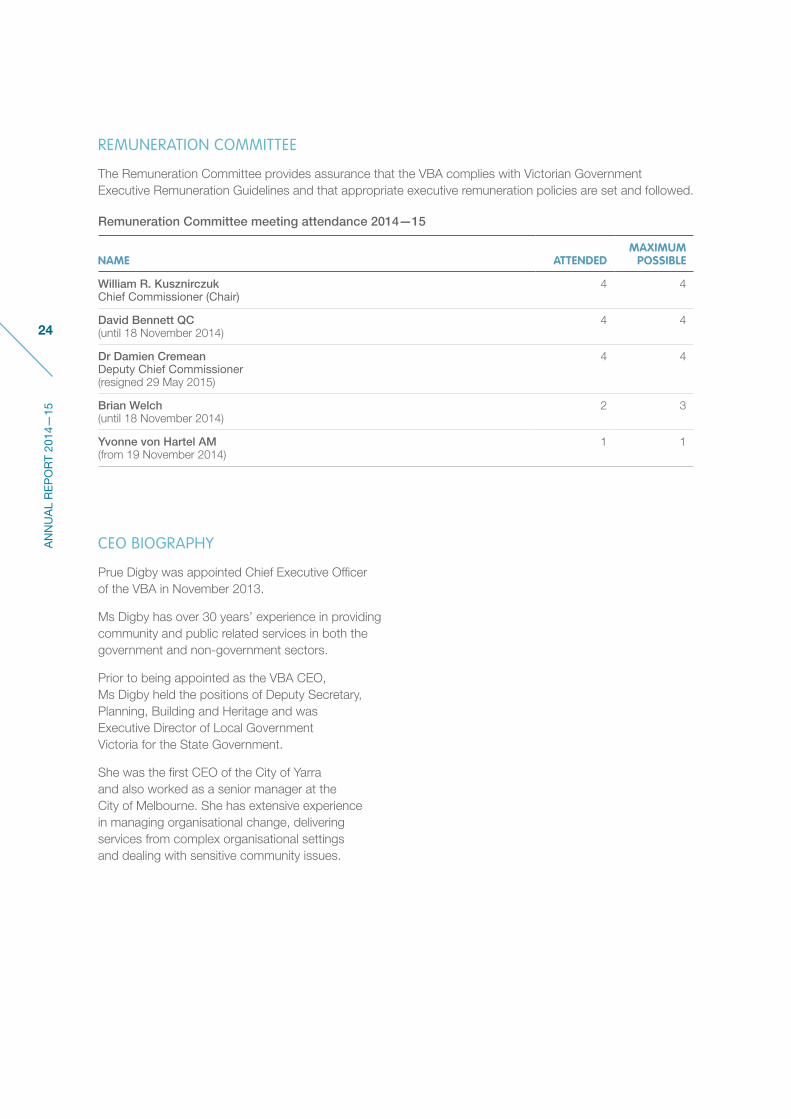
The Remuneration Committee provides assurance that the VBA complies with Victorian Government Executive Remuneration Guidelines and that appropriate executive remuneration policies are set and followed.
Remuneration Committee meeting attendance 2014—15
NAME ATTENDEDMAXIMUM
POSSIBLE
William R. Kusznirczuk Chief Commissioner (Chair)
4 4
David Bennett QC(until 18 November 2014)
4 4
Dr Damien CremeanDeputy Chief Commissioner(resigned 29 May 2015)
4 4
Brian Welch(until 18 November 2014)
2 3
Yvonne von Hartel AM(from 19 November 2014)
1 1
CEO BIOGRAPHY
Prue Digby was appointed Chief Executive Officer of the VBA in November 2013.
Ms Digby has over 30 years’ experience in providing community and public related services in both the government and non-government sectors.
Prior to being appointed as the VBA CEO, Ms Digby held the positions of Deputy Secretary, Planning, Building and Heritage and was Executive Director of Local Government Victoria for the State Government.
She was the first CEO of the City of Yarra and also worked as a senior manager at the City of Melbourne. She has extensive experience in managing organisational change, delivering services from complex organisational settings and dealing with sensitive community issues.

25
VIC
TOR
IAN
BU
ILD
ING
AU
THO
RIT
Y
GOVERNANCE AND ORGANISATIONAL
STRUCTURE
2
ORGANISATIONAL CHART
The VBA’s organisational structure is aligned to an integrated functional service model to better respond to the needs of consumers and practitioners.
Minister for Planning
VBA Board
Audit and Risk Committee Remuneration Committee
David Wolf Enquiries and Dispute Resolution
– Building Appeals Board Services– Customer Services– Inspection and Complaint Services
Adam Toma Licensing and Registration
– Building Practitioners Board Services– Practitioner Services, Plumbing
Jarrod Edwards Technical and Regulation
– Technical and Regulation, Building– Technical and Regulation, Plumbing
Kate Despot Compliance and Performance
– Practitioner Discipline– Audit– Investigations– Practitioner Intelligence and Levy
Marlo Baragwanath Office of the CEO
Governance –Communications –
Legal Services –
Stephen Gregory Corporate Services
People Services –Finance Services –
Information and Technology –
Prue Digby Chief Executive Officer
David Bennett (QC), Yvonne von Hartel AM, Warren Hutcheon, Brian Welch, and Lynne Williams
Commissioners
Vacant Deputy Chief Commissioner
William R. Kusznirczuk Chairman and Chief Commissioner

26
AN
NU
AL
RE
PO
RT
2014
—15
DIVISION ROLE STATEMENTS
Enquiries and Dispute Resolution
To provide quality customer service in responding to complaints and enquiries, technical inspections to support VBA investigations and assist in dispute resolution and Building Appeals Board (BAB) services.
Licensing and Registration
To administer the registration and licensing system for building practitioners and plumbing practitioners, by only licensing and registering competent persons to enter into and remain within the building and plumbing industries.
Technical and Regulation
To assist and support government, building and plumbing practitioners and consumers through the provision of technical educational tools and evidence based research information.
Compliance and Performance
To undertake investigations and audits, oversee collection of building levies and manage plumbing and building compliance information and disciplinary processes.
Office of the CEO
To provide communication, governance and legal services to the VBA to enable it to effectively regulate Victoria’s built environment and to manage the implementation of the VBA’s governance improvements.
Corporate Services
To provide finance, information technology and people services to enable the delivery of the VBA’s functions and business improvements.
HUMAN RESOURCE MANAGEMENT
In 2014—15, the VBA focussed its human resource efforts in two key areas in order to support the organisation to meet its strategic objectives. Some notable achievements are detailed below.
Building employee skills and capability
• Implementation of:
– an on-boarding program for new employees
– a two-year graduate development program
– an online learning management system.
• Development of a new learning and development program commenced, for implementation in 2015—16.
Driving a culture underpinned by integrity that encourages leadership, energy and enthusiasm
• Commencement of a cultural transformation and employee engagement program.
• Following the VBA’s participation in the 2014 Victorian Public Sector Commission’s People Matter Survey, employees were actively involved in driving the response to the survey’s results through the development of divisional and organisation-wide action plans. The action plans focussed on the areas of:
– leadership and communication
– employee development
– reward and recognition
– employee engagement.
• Re-establishment of the VBA Wellbeing committee with representatives from across the organisation.
INCIDENT MANAGEMENT
All VBA employees are encouraged to report workplace health and safety incidents, near misses and hazards. In 2014—15, the VBA actively promoted a revised incident management process.

27
VIC
TOR
IAN
BU
ILD
ING
AU
THO
RIT
Y
GOVERNANCE AND ORGANISATIONAL
STRUCTURE
2
PERFORMANCE AGAINST OCCUPATIONAL, HEALTH AND SAFETY MANAGEMENT MEASURES
MEASURE KEY PERFORMANCE INDICATOR 2014—15
Incidents Number of incidents10 Rate per 100 FTE
33 13.8
Claims Number of standard claims11 Rate per 100 FTENumber of lost time claims Rate per 100 FTENumber of claims exceeding 13 weeks Rate per 100 FTE
3 1.262 0.840 0
Fatalities Fatality claims 0
Claim costs Average cost per standard claim $6,601
Return to work Percentage of claims with RTW plan <30 days. 66.7
Management commitment
Evidence of OHS Policy and objectives, regular reporting to senior management
Achieved
Consultation and participation
Evidence of agreed structure of:• designated workgroups (DWGs)• health and safety representatives (HSRs)• issue resolution procedures (IRPs)Compliance with agreed structure on DWGs and HSRs
Achieved Achieved Not achievedAchieved
Risk management Percentage of internal audits/inspections conducted as planned.Reporting of incidents and injuriesPercentage of issues identified actioned arising from:• internal audits• HSR provisional improvement notices (PINs)• WorkCover notices
100%
100%
100%nana
Training OHS induction programHSR training
Achieved Achieved
EMPLOYMENT AND CONDUCT PRINCIPLES
All new VBA employees are required to complete on-boarding compliance-based training, which provides employees with an introduction to the Code of Conduct for Victorian Public Sector employees and the VBA’s Conflict of Interest and Gifts, Benefits and Hospitality policies. The training sets out the expectations and obligations expected of all VBA employees.
10 Incidents include all work-related incidents, near misses and hazards reported by VBA employees and contractors.
11 Data sourced from the VBA’s insurer Allianz on behalf of the Victorian WorkCover Authority.
28
AN
NU
AL
RE
PO
RT
2014
—15 THE VBA IS
COMMITTED TO APPLYING
PUBLIC SECTOR VALUES AND
EMPLOYMENT PRINCIPLES.

29
VIC
TOR
IAN
BU
ILD
ING
AU
THO
RIT
Y
CONTENTS
7
REPORT OF OPERATIONS
1
GOVERNANCE AND ORGANISATIONAL
STRUCTURE
2
WORKFORCE DATA
3
OTHER DISCLOSURES
4
FINANCIAL STATEMENTS
5
APPENDICES
6
ABBREVIATIONS
3WORKFORCE DATA
PUBLIC ADMINISTRATION VALUES AND EMPLOYMENT PRINCIPLES
The VBA is committed to applying public sector values and employment principles as set out in the Public Administration Act 2004 (Vic), including the application of merit and equity principles when appointing employees. The selection processes ensure that applicants are assessed and evaluated fairly and equitably on the basis of the key selection criteria and other accountabilities without discrimination and ensuring all relevant background checks are conducted. The VBA conducts National Police Record Checks on all new and external fixed-term and ongoing employees engaged by the VBA.
COMPARATIVE WORKFORCE DATA
The VBA commenced on 1 July 2013 and has been compared to the combined former Building Commission and Plumbing Industry Commission workforce information before this date.
Table 1: Full-time equivalents (FTE) staffing trends from 2011 to 201512
2015 2014 2013 2012 2011
238.912 207.5 161.4 165.9 165.4
12 The increase in FTE can be attributed to the additional fixed-term resources engaged to manage the in-house plumbing audit program, which commenced in 2014—15.

30
AN
NU
AL
RE
PO
RT
2014
—15
Table 2: Summary of employment levels in 2014 and 201513
ONGOING EMPLOYEES14 FIXED-TERM AND CASUAL EMPLOYEES
Employees (headcount)
Full-time (headcount)
Part-time (headcount) FTE FTE
June 2015 210 183 27 201.5 37.4
June 2014 201 179 22 192.7 14.8
Table 3: Details of employment levels in June of 2014 and 201515
2014—15 2013—14
Ongoing
Fixed-term and casual employees Ongoing
Fixed-term and casual employees
Employees (headcount) FTE FTE
Employees (headcount) FTE FTE
Gender:
Male 103 101.4 25.8 105 104.8 5
Female 107 100.1 11.6 96 879 9.8
Total 210 201.5 37.4 201 192.7 14.8
Age:
Under 25 4 4 6
25—34 39 38.5 8.6 49 48.2 6
35—44 69 64.8 5 61 57.3 5
45—54 48 47 12 43 40.9 3
55—64 41 39 5.8 41 39.7 0.8
Over 64 9 8.2 0 7 6.6 0
Total 210 201.5 37.4 201 192.7 14.8
VBA Classification
Band 1 2 1.1 0 2 1.1 0.8
Band 2 33 30.8 6 36 34.6 1
Band 3 26 25.1 6.6 29 27.3 1
Band 4 24 23.3 2.0 24 23.2 2
Band 5 83 81 22.8 72 70.6 8
Band 6 33 31.5 0 31 29.1 2
Executive 9 8.6 0 7 6.8 0
Total 210 201.5 37.4 201 192.7 14.8
13 All figures reflect employment levels during the last full pay period in June of each year14 Ongoing employees includes people engaged on an open-ended contract of employment and executives engaged
on a standard executive contract who were active in the last full pay period of June.15 Excluded are those on leave without pay or absent on secondment, external contractors/consultants
and temporary staff employed by employment agencies.

31
VIC
TOR
IAN
BU
ILD
ING
AU
THO
RIT
Y
WORKFORCE DATA
3
WORKFORCE INCLUSION POLICY
The VBA is committed to the employment of people from diverse backgrounds, with diversity and social inclusion a key focus for the VBA’s Wellbeing Committee.
In 2014—15, the VBA developed a new two year graduate program and engaged seven new graduates from a diverse range of academic backgrounds. The graduates will complete a tailored development program and will complete a series of work placements within the VBA, the broader Victorian Government and Local Government.
DISABILITY ACT
The VBA is committed to further advancing the principles of the Disability Discrimination Act 2006 (Vic). The VBA has a number of positions that have been specifically designed to suit staff with a disability.
EXECUTIVE OFFICER DATA
An Executive Officer (EO) is defined as a person employed as a public service body head or other executive under Part 3, Division 5 of the Public Administration Act 2004. All figures reflect employment levels at the last full pay period in June 2015 and corresponding previous reporting year.
Table 1: Breakdown of Executives16
2014—15 2013—14
Male Female Vacancies Male Female Vacancies
Class No. No. No. No. No. No.
CEO 0 1 0 0 0 118
EO 6 2 0 6 1 0
Total 6 3 0 6 1 1
Table 2: Reconciliation of executive numbers17
2015 2014
Executives with total remuneration over $100,000 (Financial Statement Note 22)
6 4
Add Vacancies (Table 1) 0 1
Executives employed with total remuneration below $100,000 2 6
Accountable Officer (CEO) 1 018
Less Separations 0 3
Total executive numbers at 30 June 9 8
16 All figures reflect employment levels during the last full pay period in June of each year. 17 All figures reflect employment levels during the last full pay period in June of each year.18 The CEO, Prue Digby is not included in headcount as the incumbent was seconded from the former DTPLI
from 25 November 2013 to 30 June 2014 and formally appointed to the role on 1 July 2014.

32
AN
NU
AL
RE
PO
RT
2014
—15
ACCESS TO DOCUMENTS
MAY BE OBTAINED THROUGH
FREEDOM OF INFORMATION PROVISIONS.

33
VIC
TOR
IAN
BU
ILD
ING
AU
THO
RIT
Y
CONTENTS
7
REPORT OF OPERATIONS
1
GOVERNANCE AND ORGANISATIONAL
STRUCTURE
2
WORKFORCE DATA
3
OTHER DISCLOSURES
4
FINANCIAL STATEMENTS
5
APPENDICES
6
ABBREVIATIONS
4OTHER DISCLOSURES
IMPLEMENTATION OF VIPP
The Victorian Industry Participation Policy Act 2003 (Vic) requires the VBA to report on the implementation of the Victorian Industry Participation Policy (VIPP). The VBA is required to apply VIPP in all procurement activities valued at $3 million or more in metropolitan Melbourne and for state-wide projects, or $1 million or more for procurement activities in regional Victoria. In 2014—15 the VBA did not meet VIPP procurement activity thresholds.

34
AN
NU
AL
RE
PO
RT
2014
—15
CONSULTANCY EXPENDITURE
Details of consultancies (valued at $10,000 or greater)
In 2014—15, there were three consultancies where the total fees payable to the consultants were $10,000 or greater. The total expenditure incurred during 2014—15 in relation to these consultancies was $142,515 (including GST). Details of individual consultancies are provided below.
($ thousand)
CONSULTANTPURPOSE OF CONSULTANCY
START DATE
END DATE
TOTAL APPROVED
PROJECT FEE (INCLUDING
GST)
EXPENDITURE 2014—15
(INCLUDING GST)
FUTURE EXPENDITURE
(INCLUDING GST)
Cube Group Management Consulting (Australia) Pty Ltd
Licensing & Registration Process Improvement Project
6/11/2014 20/2/2015 109,340 109,340 -
Learning Lane Pty Ltd
Development of building practitioner assessment framework
15/6/2015 30/11/2015 86,460 18,000 68,460
Performance Growth Pty Ltd
Development of plumbing practitioner assessment framework
27/4/2015 28/8/2015 47,025 15,175 31,850
Details of consultancies under $10,000
In 2014—15, there were no consultancies engaged during the year, where the total fees payable to the consultants was less than $10,000.
DISCLOSURE OF MAJOR CONTRACTS
The VBA adheres to the Victorian Government’s policy of disclosing contracts that are $10 million or more under the Financial Management Act. In 2014—15, the VBA had no contracts that were $10 million or more.
GOVERNMENT ADVERTISING EXPENDITURE
The VBA did not undertake any advertising campaigns over $150,000 in 2014—15.
FREEDOM OF INFORMATION
The Freedom of Information Act 1982 (Vic) allows the public a right to seek access to documents held by the VBA. For the 12 months ending 30 June 2015, the VBA received 99 freedom of information applications.
The majority of requests were from the parties to complaints investigated by the VBA’s plumbing and building investigators.
Many of the decisions on access resulted in full release of the documents sought. In only 11 requests for documents was access refused in full.
Access to documents may be obtained through written request to the Freedom of Information Officer and by outlining the documents to which access is requested.
In summary, the requirements for making a valid request, pursuant to section 17 of the Freedom of Information Act 1982 (Vic), are:
• it should be in writing and sent by post
• it should identify as clearly as possible which document is being requested
• it should be accompanied by the appropriate application fee of $27.20 (as at 1 July 2015) (the fee may be waived in certain circumstances).

35
VIC
TOR
IAN
BU
ILD
ING
AU
THO
RIT
Y
OTHER DISCLOSURES
4
Requests can only be made in writing by post and addressed to:
Freedom of Information Officer
Victorian Building Authority Goods Shed North 733 Bourke Street, Docklands VIC 3008
Access charges may also apply once documents have been processed and a decision on access is made, including for example, photocopying and search and retrieval charges.
Further information regarding the freedom of information service can be found at foi.vic.gov.au or by contacting the VBA.
COMPLIANCE WITH THE BUILDING ACT
The VBA owns and operates four regional offices in Ballarat, Bendigo, Morwell and Wangaratta. The VBA conducts bi-annual inspections and reports of its owned buildings to ensure compliance with building standards and regulations. This internal control system allows the VBA to satisfactorily manage risks.
The VBA conducted no major projects or works on VBA-owned buildings greater than $50,000 in 2014—15.
There have been no cases of registered building practitioners becoming deregistered following work on VBA owned buildings.
NATIONAL COMPETITION POLICY
In 1995, all Australian governments (federal, state and territory) agreed to review and, where appropriate, reform all existing legislative restrictions on competition.
Under National Competition Policy, the guiding legislative principle is that legislation, including future legislative proposals, should not restrict competition unless it can be demonstrated that:
• The benefits of the restriction to the community as a whole outweigh the costs
• The objectives of the legislation can only be achieved by restricting competition.
The VBA continues to comply with the requirements of the National Competition Policy.
Competitive neutrality seeks to enable fair competition between government and private sector businesses. Any advantages or disadvantages that government businesses may experience, simply as a result of government ownership, should be neutralised. The VBA continues to implement and apply this principle.
PROTECTED DISCLOSURES
The Protected Disclosure Act 2012 (Vic) (the Act) encourages and assists people in making disclosures of improper conduct by public officers and public bodies. The Act provides protection to people who make disclosures in accordance with the Act and establishes a system for the matters disclosed to be investigated and rectifying action to be taken.
The VBA does not tolerate improper conduct by employees, or the taking of reprisals against those who come forward to disclose such conduct. It is committed to ensuring transparency and accountability in its administrative and management practises and supports making disclosures that reveal corrupt conduct, conduct involving a substantial mismanagement of public resources, or conduct involving a substantial risk to public health and safety or the environment.
The VBA will take all reasonable steps to protect people who make such disclosures from any detrimental action in reprisal for making the disclosure. It will also afford natural justice to the person who is the subject of the disclosure to the extent it is legally possible.
Reporting procedures
Disclosures alleging improper conduct or detrimental action by the VBA or any of its employees or officers can be made to the Victorian Ombudsman or to:
Independent Broad-based Anti-Corruption Commission
Level 1, North Tower, 459 Collins Street Melbourne, VIC 3000 Phone: 1300 735 135 Online: ibac.vic.gov.au

36
AN
NU
AL
RE
PO
RT
2014
—15
Further information
The VBA’s Protected Disclosure Procedures outline the system for reporting disclosures of improper conduct or allegations of detrimental action taken by the VBA or any of its employees or officers. The procedures also demonstrate to potential disclosers that the VBA will take steps to ensure a person’s welfare will be managed before, during and after any investigation or action that may be taken by the Independent Broad-based Anti-corruption Commission (IBAC). Visit vba.vic.gov.au to view the procedures.
Further information or guidance is available from the VBA’s Protected Disclosure Coordinator:
Marlo Baragwanath Director, Office of the CEO
Goods Shed North 733 Bourke Street Docklands VIC 3008 Phone: 1300 815 127 Email: [email protected]
CARERS RECOGNITIONDuring 2014—15, the VBA continued to promote flexible working arrangements for all employees, including those in care relationships, as defined by the Carers Recognition Act 2012 (Vic).
The VBA also supports staff with other paid and unpaid leave options in order to fulfil a range of legislative responsibilities.
OFFICE-BASED ENVIRONMENTAL IMPACTS
The VBA’s head office is located in the Goods Shed North building, Docklands. In 2009, the Goods Shed North building received a five star Green Star rating from the Green Building Council of Australia.
With the aim of reducing its paper, water, gas and electricity usage, the VBA actively monitors its consumption of each. The tables below indicate an increase in electricity and paper usage reflecting an increase in the VBA’s headcount. New initiatives will be implemented in 2015—16 to further reduce the VBA’s environmental impacts.
ELECTRICITY USAGE AT GOODS SHED NORTH 2014—15 2013—14
Total energy usage segmented by primary source (MJ) 1,372,976 1,318,308
Greenhouse gas emissions associated with energy use, segmented by primary source and offsets (t CO^2e)
4,500
4,321
Units of energy used per FTE (MJ/FTE) 5747.3 6353.3
Units of energy used per unit of office area (MJ/m^2) 422 405
WASTE 2014—15 2013—14
LandfillCommingled
recycling Compost LandfillCommingled
recycling Compost
Total Units of waste disposed by destination (kg/year)
6951 9522 864 Information unavailable
for 2013—14Units of waste disposed of per FTE by destinations (kg/FTE)
29.1 39.9 3.6
Recycling rate (percentage of total waste) 60% 58%
PAPER 2014—15 2013—14
Total units of copy paper used (reams) 4,265 3,664
Units of copy paper used per FTE (reams/FTE) 17.853 15.336
Percentage of 75—100% recycled content copy paper purchased 97% 96%
Percentage of 50—75% recycled content copy paper purchased 1% 2%
Percentage of 0—50% recycled content copy paper purchased 2% 2%
Percentage of publications publicly accessible electronically 98% 98%

37
VIC
TOR
IAN
BU
ILD
ING
AU
THO
RIT
Y
OTHER DISCLOSURES
4
ADDITIONAL INFORMATION AVAILABLE ON REQUEST
In compliance with the requirements of the Standing Directions of the Minister for Finance, details in respect of the items listed below have been retained by the VBA and are available on request, subject to the provisions of the Freedom of Information Act 1982 (Vic).
a. A statement that declarations of pecuniary interests have been duly completed by all relevant officers
b. Details of shares held by a senior officer as nominee or held beneficially in a statutory authority or subsidiary
c. Details of publications produced by the VBA about the VBA, and how these can be obtained
d. Details of changes in prices, fees, charges, rates and levies charged by the VBA
e. Details of any major external reviews carried out on the VBA
f. Details of major research and development activities undertaken by the VBA
g. Details of overseas visits undertaken including a summary of the objectives and outcomes of each visit
h. Details of major promotional, public relations and marketing activities undertaken by the VBA to develop community awareness of the entity and its services
i. Details of assessments and measures undertaken to improve the occupational health and safety of staff
j. A general statement on industrial relations within the VBA and details of time lost through industrial accidents and disputes
k. A list of major committees sponsored by the VBA, the purposes of each committee and the extent to which the purposes have been achieved
l. Details of all consultancies and contractors including:
i. consultants/contractors engaged
ii. services provided
iii. expenditure committed to for each engagement.
The information is available on request from:
Marlo Baragwanath Director, Office of the CEO
Phone: 1300 815 127 Email: [email protected]
DATAVIC ACCESS POLICY
In accordance with the DataVic Access Policy, the VBA is making eligible datasets available on the data.vic.gov.au portal.
Visit vba.vic.gov.au/data for more information about the DataVic Access Policy and to view the VBA’s raw data.
RISK MANAGEMENT ATTESTATION
I, William (Bill) Kusznirczuk certify that the Victorian Building Authority has risk management processes in place consistent with AS/NZS ISO 31000:2009 and an internal control system is in place that enables the executive to understand, manage and satisfactorily control risk exposures. The Audit and Risk Committee verifies this assurance and that the risk profile of the Victorian Building Authority has been critically reviewed within the last 12 months.
1 September 2015
William R. Kusznirczuk Chairman and Chief Commissioner
INSURANCE ATTESTATION
I, Prue Digby certify that the Victorian Building Authority has complied with Ministerial Direction 4.5.5.1 – Insurance.
1 September 2015
Prue Digby Chief Executive Officer

38
AN
NU
AL
RE
PO
RT
2014
—15
DISCLOSURE INDEX
LEGISLATION REQUIREMENTPAGE REFERENCE
Ministerial Directions
Report of operations – FRD guidance
Charter and purpose
FRD 22E Manner of establishment and the relevant Ministers Page 7, 51
FRD 22E Objectives, functions, powers and duties Page 7
FRD 22E Nature and range of services provided Page 7
Management and structure
FRD 22E Organisational structure Page 25
Financial and other information
FRD 10 Disclosure index Page 38
FRD 12A Disclosure of major contracts Page 34
FRD 15B Executive officer disclosures Page 30
FRD 22E, SD 4.2(k) Operational and budgetary objectives and performance against objectives Page 8-19
FRD 22E Employment and conduct principles Page 29
FRD 22E Occupational health and safety policy Page 27
FRD 22E Summary of the financial results for the year Page 17-19
FRD 22E Major changes or factors affecting performance Page 19
FRD 22E Subsequent events Page 19

39
VIC
TOR
IAN
BU
ILD
ING
AU
THO
RIT
Y
OTHER DISCLOSURES
4
DISCLOSURE INDEX (CONT)
LEGISLATION REQUIREMENTPAGE REFERENCE
Ministerial Directions
FRD 22E Application and operation of Freedom of Information Act 1982 (Vic) Page 34
FRD 22E Compliance with building and maintenance provisions of Building Act 1993 (Vic)
Page 35
FRD 22E Statement on National Competition Policy Page 35
FRD 22E Application and operation of the Protected Disclosure 2012 (Vic) Page 35
FRD 22E Application and operation of the Carers Recognition Act 2012 (Vic) Page 36
FRD 22E Details of consultancies over $10,000 Page 34
FRD 22E Details of consultancies under $10,000 Page 34
FRD 22E Statement of availability of other information Page 37
FRD 24C Reporting of office based environmental impacts Page 36
FRD 25B Victorian Industry Participation Policy disclosures Page 33
FRD 29 Workforce Data disclosures Page 29-30
SD 4.5.5 Risk management compliance attestation Page 37
SD 4.5.5.1 Ministerial Standing Direction 4.5.5.1 compliance attestation Page 37
SD 4.2(g) Specific information requirements Page 8-13
SD 4.2(j) Sign-off requirements Page 0, 41
40
AN
NU
AL
RE
PO
RT
2014
—15
THE VBA IS COMMITTED TO A STRONG
FINANCIAL GOVERNANCE FRAMEWORK,
SUPPORTED BY AN AUDIT AND
RISK COMMITTEE.
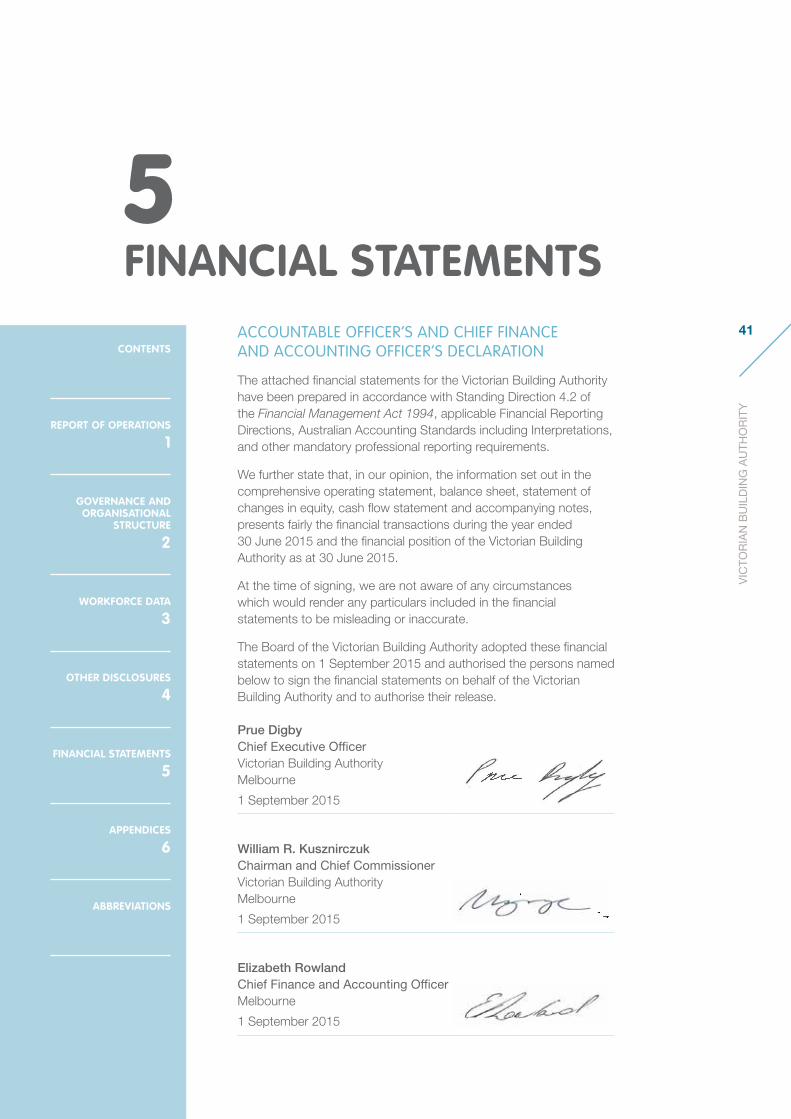
41
VIC
TOR
IAN
BU
ILD
ING
AU
THO
RIT
Y
CONTENTS
7
REPORT OF OPERATIONS
1
GOVERNANCE AND ORGANISATIONAL
STRUCTURE
2
WORKFORCE DATA
3
OTHER DISCLOSURES
4
FINANCIAL STATEMENTS
5
APPENDICES
6
ABBREVIATIONS
5FINANCIAL STATEMENTS
ACCOUNTABLE OFFICER’S AND CHIEF FINANCE AND ACCOUNTING OFFICER’S DECLARATION
The attached financial statements for the Victorian Building Authority have been prepared in accordance with Standing Direction 4.2 of the Financial Management Act 1994, applicable Financial Reporting Directions, Australian Accounting Standards including Interpretations, and other mandatory professional reporting requirements.
We further state that, in our opinion, the information set out in the comprehensive operating statement, balance sheet, statement of changes in equity, cash flow statement and accompanying notes, presents fairly the financial transactions during the year ended 30 June 2015 and the financial position of the Victorian Building Authority as at 30 June 2015.
At the time of signing, we are not aware of any circumstances which would render any particulars included in the financial statements to be misleading or inaccurate.
The Board of the Victorian Building Authority adopted these financial statements on 1 September 2015 and authorised the persons named below to sign the financial statements on behalf of the Victorian Building Authority and to authorise their release.
Prue Digby Chief Executive Officer Victorian Building Authority Melbourne
1 September 2015
William R. Kusznirczuk Chairman and Chief Commissioner Victorian Building Authority Melbourne
1 September 2015
Elizabeth Rowland Chief Finance and Accounting Officer Melbourne
1 September 2015
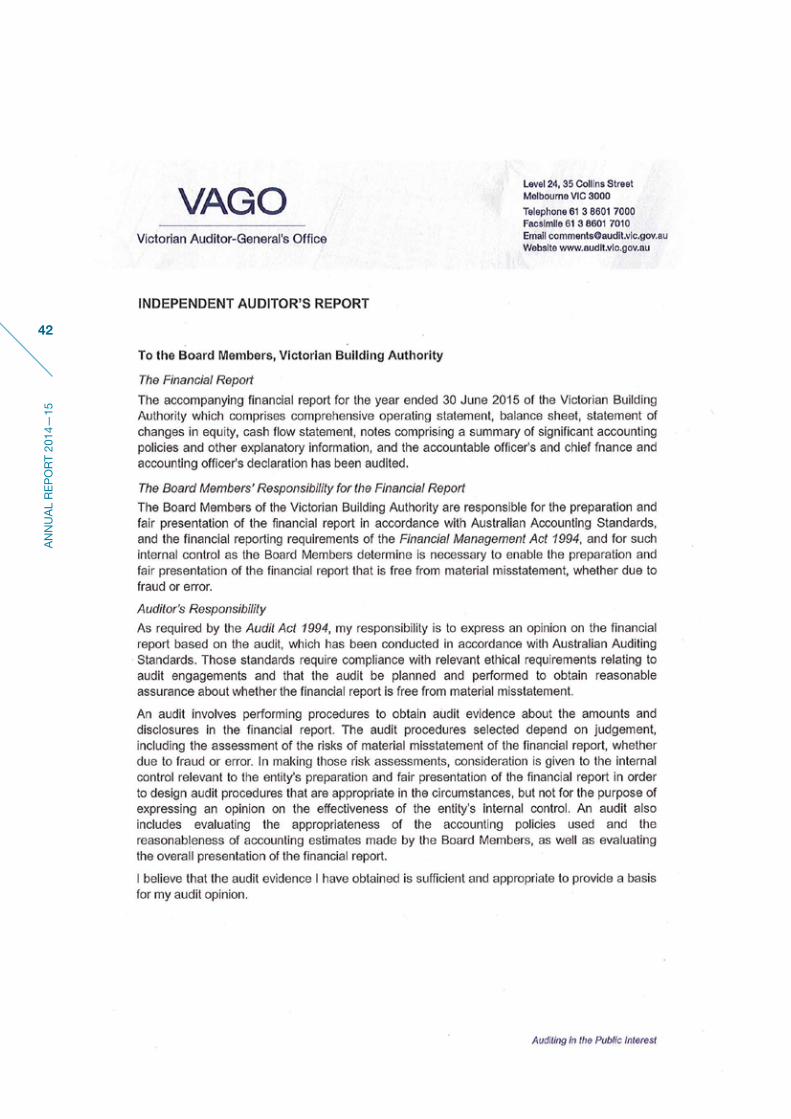
42
AN
NU
AL
RE
PO
RT
2014
—15

43
VIC
TOR
IAN
BU
ILD
ING
AU
THO
RIT
Y
FINANCIAL STATEMENTS
5

44
AN
NU
AL
RE
PO
RT
2014
—15
COMPREHENSIVE OPERATING STATEMENT FOR THE FINANCIAL YEAR ENDED 30 JUNE 2015
($ thousand)
NOTES 2015 2014
Continuing operations
Income from transactions
Building permit levies 2 26,693 24,520
Building practitioner registrations 3,204 2,931
Owner builder certification fees 812 777
Modifications & appeals (BAB Services) 201 214
Prosecutions & enquiry fines (Building) 611 547
Prosecutions & enquiry fines (Plumbing) 42 28
Plumbing compliance certificates 10,965 9,903
Plumbing registrations & licenses 4,789 4,469
Plumbing inspections 2,207 1,601
Plumbing examinations 264 291
Other income 473 720
Total Income from Transactions 50,261 46,001
Other Revenue
Interest income 737 645
Total Income 50,998 46,646

45
VIC
TOR
IAN
BU
ILD
ING
AU
THO
RIT
Y
FINANCIAL STATEMENTS
5
COMPREHENSIVE OPERATING STATEMENT FOR THE FINANCIAL YEAR ENDED 30 JUNE 2015
($ thousand)
NOTES 2015 2014
Expenses from transactions
Employee benefits 3(a) 22,916 18,873
Board & committee fees 986 786
Staff related expenditure 677 783
External staff 5,516 3,182
Technical contractors (panels) 1,332 1,368
Legal fees 1,649 1,428
Building/plumbing policy function 1,407 1,395
General administration costs 3(b) 3,126 3,488
Accommodation charges 2,937 2,203
IT services 1,483 778
Plumbing inspections & audits 1,106 3,220
Depreciation & amortisation 3(c) 1,946 2,207
Grants 3(d) 562 586
Audit fees 47 85
Total expenses from transactions 45,690 40,382
Net Result from transactions (net operating balance) 5,308 6,264
Other economic flows included in net result
Net gain/(loss) on non-financial assets 4 (337) (328)
Net gain/(loss) on financial instruments 4 (396) -
Other gains/(losses) from other economic flows 4 (148) (1,275)
Total other economic flows included in net result (881) (1,603)
Net Result from continuing operations 4,427 4,661
Comprehensive Result 4,427 4,661
The comprehensive operating statement should be read in conjunction with the accompanying notes.

46
AN
NU
AL
RE
PO
RT
2014
—15
BALANCE SHEET AS AT 30 JUNE 2015($ thousand)
NOTES 2015 2014
Financial assets
Cash and deposits 19(a) 28,766 24,772
Receivables 5 4,879 3,562
Investments and other financial assets 6 4,900 3,745
Total financial assets 38,545 32,079
Non-financial assets
Inventories 7 - 29
Other non-financial assets 10 17 117
Property, plant and equipment 8 4,402 5,012
Intangible assets 9 610 1,215
Total non-financial assets 5,029 6,373
Total assets 43,574 38,452
Liabilities
Payables 11 1,379 2,195
Borrowings 12 111 30
Provisions 13 10,424 9,255
Security deposits 1,884 1,872
Deferred revenue 5,140 4,927
Other liabilities 11(c ) 1,062 1,026
Total liabilities 20,000 19,305
Net Assets 23,574 19,147
Equity
Reserve - 2
Accumulated surplus/(deficit) 9,088 4,659
Contributed capital 25 14,486 14,486
Net worth 23,574 19,147
Commitments for expenditure 16
Contingent assets and contingent liabilities 17
The balance sheet should be read in conjunction with the accompanying notes.

47
VIC
TOR
IAN
BU
ILD
ING
AU
THO
RIT
Y
FINANCIAL STATEMENTS
5
STATEMENT OF CHANGES IN EQUITY FOR THE FINANCIAL YEAR ENDED 30 JUNE 2015
($ thousand)
NOTES
PLUMBING INDUSTRY
COMMISSION(PIC) TRUST
NO 1 RESERVE
ACCUMULATEDSURPLUS/
(DEFICIT)CONTRIBUTED
CAPITAL TOTAL
Balance at 1 July 2013 -
Net result for the year 4,661 4,661
Transfer from accumulated surplus 2 (2) -
Administrative restructure – net assets received 25 14,486 14,486
Balance at 30 June 2014 2 4,659 14,486 19,147
Net result for the year 4,427 4,427
Transfer to accumulated surplus (2) 2 -
Balance at 30 June 2015 - 9,089 14,486 23,574
Note:
Refer to Note 25: Restructuring of Administrative Changes
The statement of changes in equity should be read in conjunction with the notes to the financial statements.
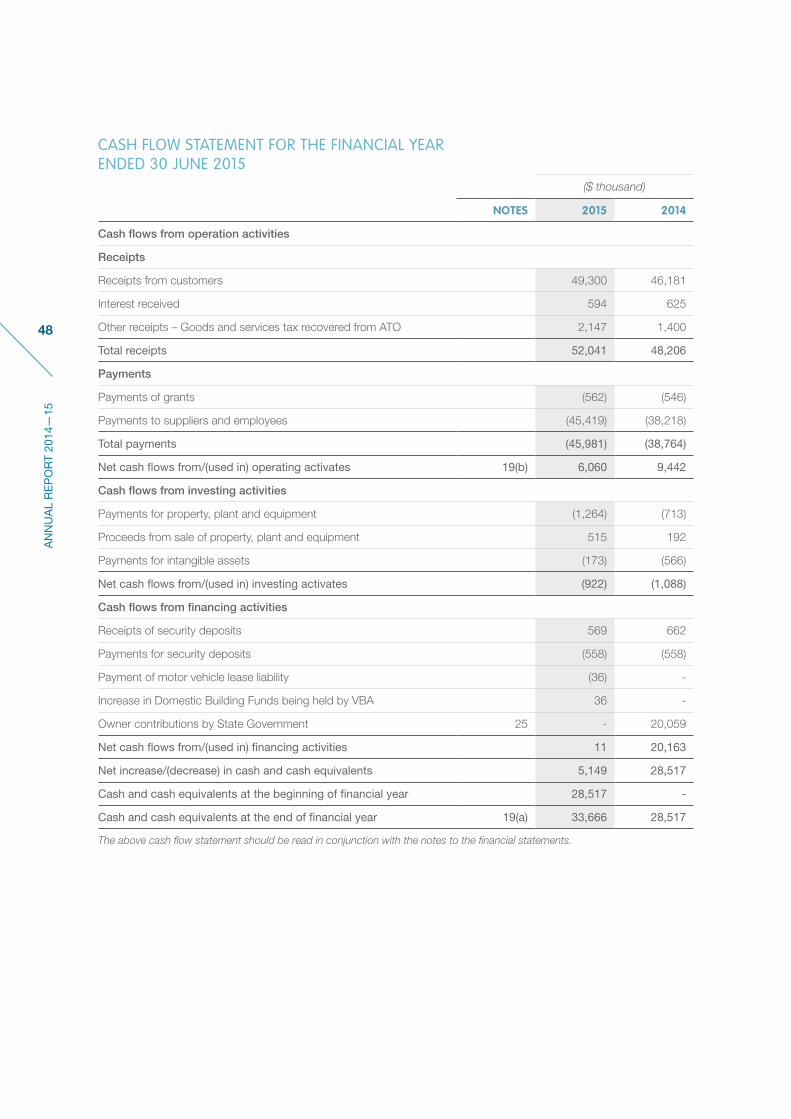
48
AN
NU
AL
RE
PO
RT
2014
—15
CASH FLOW STATEMENT FOR THE FINANCIAL YEAR ENDED 30 JUNE 2015
($ thousand)
NOTES 2015 2014
Cash flows from operation activities
Receipts
Receipts from customers 49,300 46,181
Interest received 594 625
Other receipts – Goods and services tax recovered from ATO 2,147 1,400
Total receipts 52,041 48,206
Payments
Payments of grants (562) (546)
Payments to suppliers and employees (45,419) (38,218)
Total payments (45,981) (38,764)
Net cash flows from/(used in) operating activates 19(b) 6,060 9,442
Cash flows from investing activities
Payments for property, plant and equipment (1,264) (713)
Proceeds from sale of property, plant and equipment 515 192
Payments for intangible assets (173) (566)
Net cash flows from/(used in) investing activates (922) (1,088)
Cash flows from financing activities
Receipts of security deposits 569 662
Payments for security deposits (558) (558)
Payment of motor vehicle lease liability (36) -
Increase in Domestic Building Funds being held by VBA 36 -
Owner contributions by State Government 25 - 20,059
Net cash flows from/(used in) financing activities 11 20,163
Net increase/(decrease) in cash and cash equivalents 5,149 28,517
Cash and cash equivalents at the beginning of financial year 28,517 -
Cash and cash equivalents at the end of financial year 19(a) 33,666 28,517
The above cash flow statement should be read in conjunction with the notes to the financial statements.

49
VIC
TOR
IAN
BU
ILD
ING
AU
THO
RIT
Y
FINANCIAL STATEMENTS
5
NOTES TO THE FINANCIAL STATEMENTS
Note 1. Summary of significant accounting policies Page 50
Note 2. Income from transactions Page 64
Note 3. Expenses from transactions Page 64
Note 4. Other economic flows included in net result Page 66
Note 5. Receivables Page 67
Note 6. Investments and other financial assets Page 68
Note 7. Inventories Page 68
Note 8. Property, Plant and Equipment Page 69
Note 9. Intangible assets Page 73
Note 10. Other non-financial assets Page 73
Note 11. Payables and other liabilities Page 74
Note 12. Borrowings Page 75
Note 13. Provisions Page 76
Note 14. Superannuation Page 78
Note 15. Leases Page 78
Note 16. Commitments for expenditure Page 79
Note 17. Contingent assets and contingent liabilities Page 79
Note 18. Financial Instruments Page 79
Note 19. Cash flow information Page 86
Note 20. Trust account balances Page 87
Note 21. Responsible persons Page 88
Note 22. Remuneration of executives Page 89
Note 23. Remuneration of external auditors Page 90
Note 24. Subsequent events Page 90
Note 25. Restructuring of Administrative Arrangements Page 91
Note 26. Glossary of terms and style conventions Page 92
50
AN
NU
AL
RE
PO
RT
2014
—15
NOTES TO THE FINANCIAL STATEMENTS
For the financial year ended 30 June 2015
NOTE 1. SUMMARY OF SIGNIFICANT ACCOUNTING POLICIES
These annual financial statements represent the audited general purpose financial statements of the Victorian Building Authority (VBA) for the year ended 30 June 2015. The purpose of the report is to provide users with information about the VBA’s stewardship of the resources entrusted to it.
(A) Statement of compliance
These general purpose financial statements have been prepared in accordance with the Financial Management Act 1994 (VIC) (FMA) and applicable Australian Accounting Standards (AAS) including Interpretations, issued by the Australian Accounting Standards Board (AASB). In particular, they are presented in a manner consistent with the requirements of AASB 1049 Whole of Government and General Government Sector Financial Reporting.
Where appropriate, those AASs paragraphs applicable to not-for-profit entities have been applied.
Accounting policies are selected and applied in a manner which ensures that the resulting financial information satisfies the concepts of relevance and reliability, thereby ensuring that the substance of the underlying transactions or other events is reported.
To gain a better understanding of the terminology used in this report, a glossary of terms and style conventions can be found in Note 26.
These annual financial statements were authorised for issue by the Victorian Building Authority Chairman and Chief Commissioner, Chief Executive Officer and Chief Finance and Accounting Officer on behalf of the Board of the VBA on 1 September 2015.
(B) Basis of accounting preparation and measurement
The accrual basis of accounting has been applied in the preparation of these financial statements whereby assets, liabilities, equity, income and expenses are recognised in the reporting period to which they relate, regardless of when cash is received or paid.
Judgements, estimates and assumptions are required to be made about the carrying values of assets and liabilities that are not readily apparent from other sources. The estimates and associated assumptions are based on professional judgements derived from historical experience and various other factors that are believed to be reasonable under the circumstances. Actual results may differ from these estimates.
Revisions to accounting estimates are recognised in the period in which the estimate is revised and also in future periods that are affected by the revision. Judgements and assumptions made by management in the application of AASs that have significant effect on the financial statements and estimates relate to:
• the fair value of land, buildings, infrastructure, plant and equipment;
• assumptions for the employee benefit provision based on the likely tenure of existing staff, patterns of leave claims, future salary movements and future discount rates (refer to Note 1(L));
• actuarial assumptions for Building Advice and Conciliation Victoria (BACV Provision) claims based on likely future claim numbers, pattern of prior year claims, future cost of processing claims, and future discount rates;
• provision for receivable doubtful debts (refer to Note 1(J));
• depreciation and amortisation of assets (refer to Note 1(G)); and
• make good provision (refer to Note 1(L)).
These financial statements are presented in Australian dollars, and prepared in accordance with the historical cost convention except for:
• non-financial physical assets which, subsequent to acquisition, are measured at a revalued amount being their fair value at the date of the revaluation less any subsequent accumulated depreciation and subsequent impairment losses. Revaluations are made with sufficient regularity to ensure that the carrying amounts do not materially differ from their fair value.

51
VIC
TOR
IAN
BU
ILD
ING
AU
THO
RIT
Y
FINANCIAL STATEMENTS
5
Consistent with AASB 13 Fair Value Measurement, the VBA determines the policies and procedures for recurring fair value measurements such as property, plant and equipment and financial instruments and for non-recurring fair value measurements such as non-financial physical assets held for sale, in accordance with the requirements of AASB 13 and the relevant Financial Reporting Directions.
All assets and liabilities for which fair value is measured or disclosed in the financial statements are categorised within the fair value hierarchy, described as follows, based on the lowest level input that is significant to the fair value measurement as a whole:
• Level 1 — Quoted (unadjusted) market prices in active markets for identical assets or liabilities;
• Level 2 — Valuation techniques for which the lowest level input that is significant to the fair value measurement is directly or indirectly observable; and
• Level 3 — Valuation techniques for which the lowest level input that is significant to the fair value measurement is unobservable.
For the purpose of fair value disclosures, the VBA has determined classes of assets and liabilities on the basis of the nature, characteristics and risks of the asset or liability and the level of the fair value hierarchy as explained above.
In addition, the VBA determines whether transfers have occurred between levels in the hierarchy by re-assessing the categorisation (based on the lowest level input that is significant to the fair value measurement as a whole) at the end of each reporting period.
The Valuer-General Victoria (VGV) is the VBA’s independent valuation agency.
The VBA, in conjunction with VGV, monitors changes in the fair value of each asset and liability through relevant data sources to determine whether revaluation is required.
(C) Reporting entity
The financial statements cover the VBA as an individual reporting entity. VBA functions include the Building Practitioners Board (BPB) and the Building Appeals Board (BAB).
The VBA is a self funded statutory authority established under the Building and Planning Legislation Amendment Act 2013.
Its principal address is:
Victorian Building Authority 733 Bourke Street Docklands VIC 3008
A description of the nature of the VBA’s operations and its principal activities is included in the report of operations on page 7, which does not form part of these financial statements.
(D) Scope and presentation of financial statements
Comprehensive operating statement
The comprehensive operating statement comprises two components, being ‘net result from transactions’ (or termed as ‘net operating balance’) and ‘other economic flows included in net result’. The sum of the two represents the net result.
The net result is equivalent to profit or loss derived in accordance with AASs.
Other economic flows’ are changes arising from market remeasurements. They include:
• gains and losses from disposal of non-financial assets;
• revaluations and impairments of non-financial physical and intangible assets;
• fair value changes of financial instruments; and
• gains and losses from revaluation of provisions.
This classification is consistent with the whole of government reporting format and is allowed under AASB 101 Presentation of Financial Statements.

52
AN
NU
AL
RE
PO
RT
2014
—15
Balance sheet
Assets and liabilities are presented in liquidity order with assets aggregated into financial assets and non-financial assets.
Current and non-current assets and liabilities (non-current being those assets or liabilities expected to be recovered or settled more than 12 months after the reporting period) are disclosed in the notes, where relevant.
Statement of changes in equity
The statement of changes in equity presents reconciliations of non-owner and owner changes in equity from opening balances at the beginning of the reporting period to the closing balances at the end of the reporting period. It also shows separately changes due to amounts recognised in the ‘Comprehensive result’ and amounts related to ‘Transactions with owner in its capacity as owner’.
Cash flow statement
Cash flows are classified according to whether or not they arise from operating, investing, or financing activities. This classification is consistent with requirements of AASB 107 Statement of Cash Flows.
(E) Changes in accounting policies
Subsequent to the 2013-14 reporting period, the following new and revised Standards were assessed and do not have a financial impact on the VBA.
• AASB 10 Consolidated Financial Statements;
• AASB 11 Joint Arrangements; and
• AASB 12 Disclosure of Interests in Other Entities.
(F) Income from transactions
Income is recognised to the extent that it is probable that the economic benefits will flow to the VBA and the income can be reliably measured at fair value.
Building permit levy (general and BACV)
Building permit levy receipts are brought to account in the month of issue of the building permit.
Building Practitioner Registrations
Yearly registration renewal fees receipted throughout the year are recognised as income on a pro-rata basis. Registration fees received relating to the subsequent year are recognised at year-end as deferred revenue.
Compliance Certificates, modifications and appeals, miscellaneous revenue and proceeds from sale of fixed assets
Compliance Certificates, modifications and appeals and miscellaneous revenue are brought to account when earned. Proceeds from sale of fixed assets are recognised upon signing the contract of sale.
Prosecutions
Prosecutions revenue recognises prosecution fines and costs payable to the VBA as a result of legal action taken by the VBA against building and plumbing practitioners in the Magistrates Court. The revenue is recognised in full when the first partial payment is received by the VBA.
Sundry revenue
Sundry revenue recognises Building Practitioners Board (BPB) fines and costs payable to the VBA as a result of action taken by the BPB against registered building practitioners at BPB hearings. The revenue is recognised in full when the practitioner’s appeal period has expired and demand for payment is made by the VBA.
Owner builder certification fees
Owner builder certification fees are recognised upon receipt of the application for certification. From 22 July 2014 a certificate of consent must be obtained for domestic building work to be undertaken by an owner builder valued in excess of $12,000, in order to obtain a building permit. The cost of an owner builder certificate of consent is $91.36 and this allows an owner builder to build one home every three years in the State of Victoria.

53
VIC
TOR
IAN
BU
ILD
ING
AU
THO
RIT
Y
FINANCIAL STATEMENTS
5
Plumbing registration and licence fees
Plumbing registration fees receipted throughout the year are for a triennium ending three years from the date paid. Fees received relating to the subsequent years are recognised at year-end as deferred revenue.
Yearly license renewal fees receipted throughout the year are recognised as income on a pro-rata basis. License fees received relating to the subsequent year are recognised at year-end as deferred revenue.
Interest Income
Interest income is recognised using the effective interest method which allocates the interest over the relevant period.
(G) Expenses from transactions
Expenses from transactions are recognised as they are incurred, and reported in the financial year to which they relate.
Employee expenses
These expenses include all costs related to employment (other than superannuation which is accounted for separately) including wages and salaries, fringe benefits tax, leave entitlements, redundancy payments and WorkCover premiums.
Refer to the section in Note 1(L) regarding employee benefits/provisions.
Superannuation
The amount expensed is the employer contributions for members of both defined benefit and defined contribution superannuation plans that are paid or payable during the reporting period.
The Department of Treasury and Finance (DTF) in their annual financial statements, disclose on behalf of the State as the sponsoring employer, the net defined benefit liability related to the members of these plans as an administered liability. Refer to DTF’s annual financial statements for more detailed disclosures in relation to these plans.
Depreciation and amortisation
All buildings, plant, equipment and other non-financial physical assets (excluding items under operating leases) that have finite useful lives are depreciated. Depreciation is generally calculated on a straight-line basis, at rates that allocate the asset’s value, less any estimated residual value, over its estimated useful life. Refer to Note 1 (K) for the depreciation policy for leasehold improvements.
The estimated useful lives, residual values and depreciation method are reviewed at the end of each annual reporting period, and adjustments made where appropriate.
The following are the estimated useful lives for the different asset classes for current and prior years.
ASSET USEFUL LIFE
Buildings 40 years
Motor vehicles – owned 5 years
Motor vehicles – leased through VicFleet 3.5 years
Furniture & fittings 6.7 years
IT equipment 3 years
Office machines and equipment 3 years
Software and intangibles 3 years
Land which is considered to have an indefinite life is not depreciated. Depreciation is not recognised in respect of these assets because their service potential has not, in any material sense, been consumed during the reporting period.
Intangible produced assets with finite useful lives are depreciated as an expense from transactions on a systematic (typically straight-line) basis over the asset’s useful life. Depreciation begins when the asset is available for use, that is, when it is in the location and condition necessary for it to be capable of operating in the manner intended by management.
The consumption of intangible non-produced assets with finite useful lives is not classified as depreciation, but as amortisation. It is recorded in the same way as depreciation.
Intangible assets with indefinite useful lives are not depreciated or amortised, but are tested annually for impairment.
54
AN
NU
AL
RE
PO
RT
2014
—15
Interest expense
Interest expense is recognised in the period in which it is incurred. It includes interest on finance leases.
Other operating expenses
Other operating expenses generally represent the day-to-day running costs incurred in normal operations and include:
Supplies and services
Supplies and services are recognised as an expense in the reporting period in which they are incurred. The carrying amounts of any inventories held for distribution are expensed when distributed.
Bad and doubtful debts
Refer to Note 1(J) Impairment of financial assets.
(H) Other economic flows included in the net result
Other economic flows measure the change in volume or value of assets or liabilities that do not result from transactions.
Net gain/(loss) on non-financial assets
Net gain/(loss) on non-financial assets and liabilities includes realised and unrealised gains and losses as follows:
Revaluation gains/(losses) of non‑financial physical assets
Refer to Note 1(K) Revaluations of non-financial physical assets.
Net gain/(loss) on disposal of non‑financial assets
Any gain or loss on the disposal of non-financial assets is recognised at the date of disposal and is the difference between the proceeds and the carrying value of the asset at the time.
Impairment of non‑financial assets
Intangible assets with indefinite useful lives (and intangible assets not yet available for use) are tested annually for impairment (as described below) and whenever there is an indication that the asset may be impaired.
All other assets are assessed annually for indications of impairment (refer to Note 1(K)).
If there is an indication of impairment, the asset concerned is tested as to whether its carrying value exceeds its recoverable amount. Where an asset’s carrying value exceeds its recoverable amount, the difference is written off as an other economic flow, except to the extent that the write-down can be debited to an asset revaluation reserve applicable to that class of asset.
If there is an indication that there has been a reversal in the estimate of an asset’s recoverable amount since the last impairment loss was recognised, the carrying amount shall be increased to its recoverable amount. The impairment loss is reversed only to the extent that the asset’s carrying amount does not exceed the carrying amount that would have been determined, net of depreciation or amortisation, if no impairment loss had been recognised in prior years.
It is deemed that, in the event of the loss or destruction of an asset, the future economic benefits arising from the use of the asset will be replaced unless a specific decision to the contrary has been made. The recoverable amount for most assets is measured at the higher of depreciated replacement cost and fair value less costs to sell. Recoverable amount for assets held primarily to generate net cash inflows is measured at the higher of the present value of future cash flows expected to be obtained from the asset and fair value less costs to sell.
Other gains/(losses) from other economic flows
Other gains/(losses) from other economic flows include the gains or losses from:
• the revaluation of the present value of the long service leave liability due to changes in the bond interest rates; and
• the revaluation of the present value of the BACV provision due to changes from the annual actuarial assessment of the provision.
55
VIC
TOR
IAN
BU
ILD
ING
AU
THO
RIT
Y
FINANCIAL STATEMENTS
5
(i) Financial instruments
Financial instruments arise out of contractual agreements that give rise to a financial asset of one entity and a financial liability or equity instrument of another entity. Due to the nature of the VBA’s activities, certain financial assets and financial liabilities arise under statute rather than a contract. Such financial assets and financial liabilities do not meet the definition of financial instruments in AASB 132 Financial Instruments: Presentation. For example, statutory receivables arising from taxes, fines and penalties do not meet the definition of financial instruments as they do not arise under contract.
Where relevant, for note disclosure purposes, a distinction is made between those financial assets and financial liabilities that meet the definition of financial instruments in accordance with AASB 132 and those that do not.
The following refers to financial instruments unless otherwise stated.
Categories of non-derivative financial instruments
Receivables
Receivables are financial instrument assets with fixed and determinable payments that are not quoted on an active market. These assets are initially recognised at fair value plus any directly attributable transaction costs. Due to the short-term nature of the financial instruments held by the VBA, the carrying amounts are a reasonable approximation of fair value, and the value of the instruments are not revisited after they are established.
Receivables include cash and deposits (refer to Note 1(J)), term deposits with maturity greater than three months and other receivables, but not statutory receivables.
Financial liabilities at amortised cost
Financial instrument liabilities are initially recognised on the date they originated. They are initially measured at fair value plus any directly attributable transaction costs. Due to the short-term nature of the financial instruments held by the VBA, the carrying amounts are a reasonable approximation of fair value, and the value of the instruments are not revisited after they are established (refer to Note 18).
Financial instrument liabilities measured at amortised cost include VBAs contractual payables, deposits held and advances received, and interest-bearing arrangements.
(J) Financial assets
Cash and deposits
Cash and deposits comprise cash on hand and cash at bank, deposits at call and those highly liquid investments (with an original maturity of three months or less), which are held for the purpose of meeting short term cash commitments rather than for investment purposes, and are readily convertible to known amounts of cash with an insignificant risk of changes in value.
Receivables
Receivables consist of:
• contractual receivables, such as debtors in relation to goods and services, and accrued investment income; and
• statutory receivables, such as amounts owing from fines and regulatory fees and Goods and Services Tax (GST) input tax credits recoverable.
Contractual receivables are classified as financial instruments and categorised as receivables (refer to Note 1(i)). Statutory receivables are recognised and measured similarly to contractual receivables (except for impairment), but are not classified as financial instruments because they do not arise from a contract.
Receivables are subject to impairment testing as described below. A provision for doubtful receivables is recognised when there is objective evidence that the debts may not be collected, and bad debts are written off when identified.
For the measurement principle of receivables, refer to Note 1(i).

56
AN
NU
AL
RE
PO
RT
2014
—15
Investments and other financial assets
Investments are classified in the following categories:
• financial assets at fair value through profit or loss;
• receivables; and
• held-to-maturity.
The classification depends on the purpose for which the investments were acquired. Management determines the classification of its investments at initial recognition.
Any dividend or interest earned on a financial asset is recognised as a transaction.
Derecognition of financial assets
A financial asset (or, where applicable, part of a financial asset or part of a group of similar assets) is derecognised when:
• the rights to receive cash flows from the asset have expired; or
• the VBA retains the right to receive cash flows from the asset, but has assumed an obligation to pay them in full without material delay to a third party under a ‘pass through’ arrangement; or
• the VBA has transferred its rights to receive cash flows from the asset and either:
(a) has transferred substantially all the risks and rewards of the asset; or
(b) has neither transferred nor retained substantially all the risks and rewards of the asset, but has transferred control of the asset.
Where the VBA has neither transferred nor retained substantially all the risks and rewards or transferred control, the asset is recognised to the extent of the VBA’s continuing involvement in the asset.
Impairment of financial assets
At the end of each reporting period, the VBA assesses whether there is objective evidence that a financial asset or group of financial assets is impaired. All financial instrument assets are subject to annual review for impairment.
Receivables are assessed for bad and doubtful debts on a regular basis. Those bad debts considered as written off by mutual consent are classified as a transaction expense. Bad debts not written off by mutual consent and the allowance for doubtful receivables are classified as other economic flows in the net result.
The amount of the allowance is the financial asset’s carrying amount.
In assessing impairment of statutory (non-contractual) financial assets, which are not financial instruments, professional judgement is applied in assessing materiality using estimates, averages and other computational methods in accordance with AASB 136 Impairment of Assets.
(K) Non-financial assets
Inventories
Inventories include goods and other property held either for sale, or for distribution at zero or nominal cost, or for consumption in the ordinary course of business operations.
Property, plant and equipment
All non-financial physical assets are measured initially at cost and subsequently revalued at fair value less accumulated depreciation and impairment. Where an asset is acquired for no or nominal cost, the cost is its fair value at the date of acquisition. Assets transferred as part of a machinery of government change are transferred at their carrying amount. More details about the valuation techniques and inputs used in determining the fair value of non-financial physical assets are discussed in Note 8 Property, plant and equipment.
The initial cost for non-financial physical assets under a finance lease (refer to Note 1(M)) is measured at amounts equal to the fair value of the leased asset or, if lower, the present value of the minimum lease payments, each determined at the inception of the lease.
For the accounting policy on impairment of non-financial physical assets, refer to impairment of non-financial assets under Note 1(H).
57
VIC
TOR
IAN
BU
ILD
ING
AU
THO
RIT
Y
FINANCIAL STATEMENTS
5
Revaluations of non-financial physical assets
Non-financial physical assets are measured at their fair value on a cyclical basis, in accordance with the Financial Reporting Directions (FRDs) issued by the Minister for Finance. A full revaluation normally occurs every five years, based upon the asset’s government purpose classification but may occur more frequently if fair value assessments indicate material changes in values. The non-financial physical assets carrying values were assessed as fair value when they were transferred to the VBA on 1 July 2013. Independent valuers are generally used to conduct these scheduled revaluations. Revaluation increases or decreases arise from differences between an asset’s carrying value and fair value.
Net revaluation increases (where the carrying amount of a class of assets is increased as a result of a revaluation) are recognised in ‘other economic flows included in net result’ and accumulated in equity under the asset revaluation reserve. However, the net revaluation increase is recognised in the net result to the extent that it reverses a net revaluation decrease in respect of the same class of property, plant and equipment previously recognised as an expense (other economic flows) in the net result.
Net revaluation decrease is recognised in ‘other economic flows included in net result’ to the extent that a credit balance exists in the asset revaluation reserve in respect of the same class of property, plant and equipment. Otherwise, the net revaluation decreases are recognised immediately as other economic flows in the net result. The net revaluation decrease recognised in ‘other economic flows included in net result’ reduces the amount accumulated in equity under the asset revaluation reserve.
Revaluation increases and decreases relating to individual assets in the same class of property, plant and equipment, are offset against one another but are not offset in respect of assets in different classes. The asset revaluation reserve is not transferred to accumulated funds on derecognition of the relevant asset.
Intangible assets
Intangible assets are initially recognised at cost. Subsequently, intangible assets with finite useful lives are carried at cost less accumulated depreciation/amortisation and accumulated impairment losses. Costs incurred subsequent to initial acquisition are capitalised when it is expected that additional future economic benefits will flow to the VBA.
When the recognition criteria in AASB 138 Intangible Assets are met, internally generated intangible assets are recognised and measured at cost less accumulated depreciation/amortisation and impairment.
Refer to Note 1(G) Depreciation and Note 1(G) Amortisation of non-produced intangible assets.
An internally-generated intangible asset arising from development (or from the development phase of an internal project) is recognised if, and only if, all of the following are demonstrated:
(a) the technical feasibility of completing the intangible asset so that it will be available for use or sale;
(b) an intention to complete the intangible asset and use or sell it;
(c) the ability to use or sell the intangible asset;
(d) the intangible asset will generate probable future economic benefits;
(e) the availability of adequate technical, financial and other resources to complete the development and to use or sell the intangible asset; and
(f) the ability to measure reliably the expenditure attributable to the intangible asset during its development.

58
AN
NU
AL
RE
PO
RT
2014
—15
Other non-financial assets
Prepayments
Other non-financial assets include prepayments which represent payments in advance of receipt of goods or services or that are part of expenditure made in one accounting period covering a term extending beyond that period.
(L) Liabilities
Payables
Payables consist of:
• contractual payables, such as accounts payable. Accounts payable represent liabilities for goods and services provided to the VBA prior to the end of the financial year that are unpaid, and arise when the VBA becomes obliged to make future payments in respect of the purchase of those goods and services; and
• statutory payables, such as goods and services tax and fringe benefits tax payables.
Contractual payables are classified as financial instruments and categorised as financial liabilities at amortised cost (refer to Note 1(i)). Statutory payables are recognised and measured similarly to contractual payables, but are not classified as financial instruments and not included in the category of financial liabilities at amortised cost, because they do not arise from a contract.
Borrowings
All interest bearing liabilities are initially recognised at the fair value of the consideration received, less directly attributable transaction costs. The measurement basis subsequent to initial recognition depends on whether the VBA has categorised its interest-bearing liabilities as either financial liabilities designated at fair value through profit or loss, or financial liabilities at amortised cost. Any difference between the initial recognised amount and the redemption value is recognised in net result over the period of the borrowing using the effective interest method.
The classification depends on the nature and purpose of the interest bearing liabilities. The VBA determines the classification of its interest bearing liabilities at initial recognition.
Provisions
Provisions are recognised when the VBA has a present obligation, the future sacrifice of economic benefits is probable, and the amount of the provision can be measured reliably.
The amount recognised as a provision is the best estimate of the consideration required to settle the present obligation at reporting date, taking into account the risks and uncertainties surrounding the obligation. Where a provision is measured using the cash flows estimated to settle the present obligation, its carrying amount is the present value of those cash flows, using the discount rate that reflects the time value of money and risks specific to the provision.
When some or all of the economic benefits required to settle a provision are expected to be received from a third party, the receivable is recognised as an asset if it is virtually certain that recovery will be received and the amount of the receivable can be measured reliably.
BACV Provision
The BACV provision is the estimated net present value of those future costs to service those disputes relating to past building permits. Disputes are eligible to be lodged up to 10 years after the permit levy is received. The estimated provision for the BACV services provided by the VBA as at 30 June 2015 and 2014 specifically allows for:
(a) inclusion of all types of services and administration carried out by the VBA in relation to their BACV service;
(b) future dispute cases arising from permits already issued;
(c) inflation, to consider future escalation of costs; and
(d) discounting of the expected inflated cash flows to allow for investment income on assets set aside in respect of the liability.

59
VIC
TOR
IAN
BU
ILD
ING
AU
THO
RIT
Y
FINANCIAL STATEMENTS
5
The BACV services provided by the VBA have the following notable features that contribute to the uncertainty around the valuation:
• The length of time between the issue date of the permit and the resolution of a dispute can take in the order of 11 years. The length of this delay period increases the uncertainty around the valuation assumptions as the total number of disputes cases shown in the data will only be complete for 2002, 2003, 2004 and 2005 years;
• The role of public awareness in influencing the number of cases and the rate of reporting is a source of uncertainty. While increased awareness may mean cases are reported (and finalised) earlier, it is also possible that more cases will be presented to Consumer Affairs Victoria (CAV) and then BACV as a consequence of that awareness;
• Uncertainty over whether the increasing trend in building works value might lead to an impact on cost in future years e.g. if it were to lead to a higher number of defects per inspection, there might be an impact on inspection costs; and
• Movements in discount rates: Commonwealth government bond returns can move significantly in short spaces of time. This could have a material impact on the liability.
The movement in the BACV Provision is disclosed in Note 4 Other economic flows included in the net result and Note 13 Provisions.
Make Good Provision
Under the Goods Shed North lease agreement, the VBA agreed to bring the leased property back to its original condition, obligating future costs to dismantle and remove the office fit out and restore the Goods Shed North to its original condition. Under AASB 137 Provisions, Contingent Liabilities and Contingent Assets it is generally accepted that this liability is recognised at the commencement of the lease, rather than at the end of the lease when the work is done. It is at the commencement that the partitioning or other fit out causes change to the floor and ceiling to necessitate the make good costs being incurred.
Employee benefits
Provision is made for benefits accruing to employees in respect of wages and salaries, annual leave and long service leave for services rendered to the reporting date.
(i) Wages and salaries and annual leave
Liabilities for wages and salaries, including non-monetary benefits, and annual leave, are recognised in the provision for employee benefits as ‘current liabilities’, because the VBA does not have an unconditional right to defer settlement of these liabilities.
Depending on the expectation of the timing of settlement, liabilities for wages and salaries and annual leave are measured at:
• undiscounted value- if the VBA expects to wholly settle within 12 months; or
• present value- if the VBA does not expect to wholly settle within 12 months.
(ii) Long service leave
Liability for long service leave (LSL) is recognised in the provision for employee benefits.
Unconditional LSL is disclosed in the notes to the financial statements as a current liability, even where the VBA does not expect to settle the liability within 12 months because it will not have the unconditional right to defer the settlement of the entitlement should an employee take leave within 12 months.
The components of this current LSL liability are measured at:
• undiscounted value- if the VBA expects to wholly settle within 12 months; and
• present value-if the VBA does not expect to wholly settle within 12 months.
Conditional LSL is disclosed as a non-current liability because there is an unconditional right to defer the settlement of the entitlement until the employee has completed the requisite years of service. This non-current LSL liability is measured at present value.

60
AN
NU
AL
RE
PO
RT
2014
—15
Any gain or loss following revaluation of the present value of non-current LSL liability is recognised as a transaction, except to the extent that a gain or loss arises due to changes in bond interest rates for which it is then recognised as an other economic flow.
(iii) Termination benefits
Termination benefits are payable when employment is terminated before the normal retirement date, or when an employee decides to accept an offer of benefits in exchange for the termination of employment. The VBA recognises termination benefits when it is demonstrably committed to either terminating the employment of current employees according to a detailed formal plan without possibility of withdrawal or providing termination benefits as a result of an offer made to encourage voluntary redundancy. Benefits falling due more than 12 months after the end of the reporting period are discounted to present value.
On-costs
On-costs such as payroll tax, workers compensation and superannuation are recognised separately from the provision for employee benefits.
Security deposits
Under Section 22 of the Building Act 1993 and regulation 323 under the Building Regulations 2006, the relevant building surveyor (RBS) may issue a building permit with a condition that a bond or guarantee be deposited to be held by the VBA until building works are completed. Payments are recognised as a liability at the time the deposit is received by the VBA. The liability is measured at carrying value.
(M) Leases
A lease is a right to use an asset for an agreed period of time in exchange for payment.
Leases are classified at their inception as either operating or finance leases based on the economic substance of the agreement so as to reflect the risks and rewards incidental to ownership. Leases of vehicles are classified as finance leases whenever the terms of the lease transfer substantially all the risks and rewards of ownership from the lessor to the lessee. All other leases are classified as operating leases.
Finance leases
VBA as lessee
At the commencement of the lease term, finance leases are initially recognised as assets and liabilities at amounts equal to the fair value of the lease property or, if lower, the present value of the minimum lease payments, each determined at the inception of the lease. The lease asset is accounted for as a non-financial physical asset. If there is certainty that the VBA will obtain the ownership of the lease asset by the end of the lease term, the asset shall be depreciated over the useful life of the asset. If there is no reasonable certainty that the lessee will obtain ownership by the end of the lease term, the asset shall be depreciated over the shorter of the lease term and its useful life.
Minimum finance lease payments are apportioned between the reduction of the outstanding lease liability and periodic finance expense which is calculated using the interest rate implicit in the lease. Contingent rentals associated with finance leases are recognised as an expense in the period in which they are incurred.
Operating leases
VBA as lessee
Operating lease payments, including any contingent rentals, are recognised as an expense on a straight- line basis over the lease term, except where another systematic basis is more representative of the time pattern of the benefits derived from the use of the leased asset. The leased asset is not recognised in the balance sheet.
All incentives for the agreement of a new or renewed operating lease are recognised as an integral part of the net consideration agreed for the use of the leased asset, irrespective of the incentive’s nature or form or the timing of payments.
In the event that lease incentives are received to enter into operating leases, the aggregate cost of incentives is recognised as a reduction of rental expense over the lease term on a straight-line basis, unless another systematic basis is more representative of the time pattern in which economic benefits from the leased asset are consumed.

61
VIC
TOR
IAN
BU
ILD
ING
AU
THO
RIT
Y
FINANCIAL STATEMENTS
5
(N) Equity
Contributions by owners
Additions to net assets which have been designated as contributions by owners are recognised as contributed capital. Other transfers that are in the nature of contributions to or distributions by owners have also been designated as contributions by owners.
Transfers of net assets arising from administrative restructurings are treated as distributions to or contributions by owners. Transfers of net liabilities arising from administrative restructurings are treated as distributions to owners.
(O) Commitments
Commitments for future expenditure include operating and capital commitments arising from contracts. In addition, where it is considered appropriate and provides additional relevant information to users, the net present values of significant individual projects are stated. These future expenditures cease to be disclosed as commitments once the related liabilities are recognised in the balance sheet (refer to Note 16).
(P) Contingent assets and contingent liabilities
Contingent assets and contingent liabilities are not recognised in the balance sheet, but are disclosed by way of a note (refer to Note 17 Contingent assets and contingent liabilities) and, if quantifiable, are measured at nominal value. Contingent assets and liabilities are presented inclusive of GST receivable or payable respectively.
(Q) Accounting for the goods and services tax
Income, expenses and assets are recognised net of the amount of associated goods and services tax (GST), except where GST incurred is not recoverable from the Australian Taxation Office (ATO). In this case, the GST payable is recognised as part of the cost of acquisition of the asset or as part of the expense.
Receivables and payables are stated inclusive of the amount of GST receivable or payable. The net amount of GST recoverable from, or payable to, the ATO, is included with other receivables or payables in the balance sheet.
Cash flows are presented on a gross basis. The GST components of cash flows arising from investing or financing activities which are recoverable from, or payable to the ATO, are presented as operating cash flow.
Commitments and contingent assets and liabilities are also stated inclusive of GST.
(R) Events after the reporting period
Assets, liabilities, income or expenses arise from past transactions or other past events. Where the transactions result from an agreement between the VBA and other parties, the transactions are only recognised when the agreement is irrevocable at or before the end of the reporting period. Adjustments are made to amounts recognised in the financial statements for events which occur between the end of the reporting period and the date when the financial statements are authorised for issue, where those events provide information about conditions which existed at the reporting date. Note disclosure is made about events between the end of the reporting period and the date the financial statements are authorised for issue where the events relate to conditions which arose after the end of the reporting period that are considered to be of material interest. There have been no events after the reporting date that would require disclosure in these financial statements.
(S) Plumbing Industry Commission (PIC) Trust No 1
The purpose of the Trust included awarding of scholarships, awards and the promotion of better plumbing standards. The Trust ceased to exist in 2014—15 and the remaining immaterial balance is no longer separately identified.
(T) Australian Accounting Standards issued that are not yet effective
Certain AASs have been published that are not mandatory for the 30 June 2015 reporting period. DTF assesses the impact of these new standards and advises the VBA of their applicability and early adoption where applicable.

62
AN
NU
AL
RE
PO
RT
2014
—15
The following AASs have been issued by the AASB but are not effective for 2014—15. They become effective for the first financial statements for reporting periods commencing after the stated operative dates as follows:
STANDARD/INTERPRETATION SUMMARYAPPLICABLE FOR ANNUAL REPORTING PERIODS BEGINNING ON IMPACT ON IMPACT ON PUBLIC SECTOR ENTITY FINANCIAL STATEMENTS
AASB 9 Financial Instruments The key changes include the simplified requirements for the classification and measurement of financial assets, a new hedging accounting model and a revised impairment loss model to recognise impairment losses earlier, as opposed to the current approach that recognises impairment only when incurred.
1 January 2018 The assessment has identified that the financial impact of available for sale (AFS) assets will now be reported through other comprehensive income (OCI) and no longer recycled to the profit and loss. While the preliminary assessment has not identified any material impact arising from AASB 9, it will continue to be monitored and assessed.
AASB 15 Revenue from Contracts with Customers
The core principle of AASB 15 requires an entity to recognise revenue when the entity satisfies a performance obligation by transferring a promised good or service to a customer.
1 January 2017
(Exposure Draft 263 – potential deferral to 1 Jan 2018)
The changes in revenue recognition requirements in AASB 15 may result in changes to the timing and amount of revenue recorded in the financial statements. The Standard will also require additional disclosures on service revenue and contract modifications. A potential impact will be the upfront recognition of revenue from licenses that cover multiple reporting periods. Revenue that was deferred and amortised over a period may now need to be recognised immediately as a transitional adjustment against the opening accumulated surplus if there are no former performance obligations outstanding.While the preliminary assessment has not identified any material impact arising from AASB 15, it will continue to be monitored and assessed.
AASB 2014-4 Amendments to Australian Accounting Standards – Clarification of Acceptable Methods of Depreciation and Amortisation [AASB 116 & AASB 138]
Amends AASB 116 Property, Plant and Equipment and AASB 138 Intangible Assets to:• establish the principle for the basis of depreciation and
amortisation as being the expected pattern of consumption of the future economic benefits of an asset;
• prohibit the use of revenue-based methods to calculate the depreciation or amortisation of an asset, tangible or intangible, because revenue generally reflects the pattern of economic benefits that are generated from operating the business, rather than the consumption through the use of the asset.
1 January 2016 The assessment has indicated that there is no expected impact as the revenue-based method is not used for depreciation and amortisation.
Early adoption of Standards AASB
2015-7 Amendments to Australian Accounting Standards.
The Australian Accounting Standards Board issued an amending accounting standard AASB 2015-7 Amendments to Australian Accounting Standards – Fair value disclosures of Not‑for‑Profit Public Sector Entities on 13 July 2015. In accordance with FRD 7A Early adoption of authoritative accounting pronouncements, the Minister for Finance has approved the option for Victorian not-for-profit public sector entities to early adopt the amending accounting standard to enable them to benefit from some limited exemption in relation to fair value disclosures for the 2014—15 reporting period. The limited exemption is available to those entities whose assets are held primarily for their current service potential rather than to generate cash flows. VBA meets the criteria specified in AASB 2015-7 to benefit from the reduced disclosure requirements so it has chosen to early adopt the amendments to fair value disclosure of not-for-profit public sector entities (Refer to Note 8).
63
VIC
TOR
IAN
BU
ILD
ING
AU
THO
RIT
Y
FINANCIAL STATEMENTS
5
The following AASs have been issued by the AASB but are not effective for 2014—15. They become effective for the first financial statements for reporting periods commencing after the stated operative dates as follows:
STANDARD/INTERPRETATION SUMMARYAPPLICABLE FOR ANNUAL REPORTING PERIODS BEGINNING ON IMPACT ON IMPACT ON PUBLIC SECTOR ENTITY FINANCIAL STATEMENTS
AASB 9 Financial Instruments The key changes include the simplified requirements for the classification and measurement of financial assets, a new hedging accounting model and a revised impairment loss model to recognise impairment losses earlier, as opposed to the current approach that recognises impairment only when incurred.
1 January 2018 The assessment has identified that the financial impact of available for sale (AFS) assets will now be reported through other comprehensive income (OCI) and no longer recycled to the profit and loss. While the preliminary assessment has not identified any material impact arising from AASB 9, it will continue to be monitored and assessed.
AASB 15 Revenue from Contracts with Customers
The core principle of AASB 15 requires an entity to recognise revenue when the entity satisfies a performance obligation by transferring a promised good or service to a customer.
1 January 2017
(Exposure Draft 263 – potential deferral to 1 Jan 2018)
The changes in revenue recognition requirements in AASB 15 may result in changes to the timing and amount of revenue recorded in the financial statements. The Standard will also require additional disclosures on service revenue and contract modifications. A potential impact will be the upfront recognition of revenue from licenses that cover multiple reporting periods. Revenue that was deferred and amortised over a period may now need to be recognised immediately as a transitional adjustment against the opening accumulated surplus if there are no former performance obligations outstanding.While the preliminary assessment has not identified any material impact arising from AASB 15, it will continue to be monitored and assessed.
AASB 2014-4 Amendments to Australian Accounting Standards – Clarification of Acceptable Methods of Depreciation and Amortisation [AASB 116 & AASB 138]
Amends AASB 116 Property, Plant and Equipment and AASB 138 Intangible Assets to:• establish the principle for the basis of depreciation and
amortisation as being the expected pattern of consumption of the future economic benefits of an asset;
• prohibit the use of revenue-based methods to calculate the depreciation or amortisation of an asset, tangible or intangible, because revenue generally reflects the pattern of economic benefits that are generated from operating the business, rather than the consumption through the use of the asset.
1 January 2016 The assessment has indicated that there is no expected impact as the revenue-based method is not used for depreciation and amortisation.
Early adoption of Standards AASB
2015-7 Amendments to Australian Accounting Standards.
The Australian Accounting Standards Board issued an amending accounting standard AASB 2015-7 Amendments to Australian Accounting Standards – Fair value disclosures of Not‑for‑Profit Public Sector Entities on 13 July 2015. In accordance with FRD 7A Early adoption of authoritative accounting pronouncements, the Minister for Finance has approved the option for Victorian not-for-profit public sector entities to early adopt the amending accounting standard to enable them to benefit from some limited exemption in relation to fair value disclosures for the 2014—15 reporting period. The limited exemption is available to those entities whose assets are held primarily for their current service potential rather than to generate cash flows. VBA meets the criteria specified in AASB 2015-7 to benefit from the reduced disclosure requirements so it has chosen to early adopt the amendments to fair value disclosure of not-for-profit public sector entities (Refer to Note 8).

64
AN
NU
AL
RE
PO
RT
2014
—15
NOTE 2. INCOME FROM TRANSACTIONS($ thousand)
BUILDING PERMIT LEVIES 2015 2014
Building Permit Levy – General Levy (i) 17,804 16,461
Building Permit Levy – BACV Levy (ii) 8,889 8,059
Total Levy 26,693 24,520
Notes:
(i) Building permit levy – General Levy
The General building permit levy is calculated based on 0.064 cents in every dollar of the cost of building work for which a building permit is sought.
(ii) Building permit levy – BACV Levy
The Building and Advice Conciliation Victoria (BACV) building permit levy is calculated on 0.064 cents in every dollar of the cost of building work for which a building permit is sought and funds the Building Advice and Conciliation Victoria functions established under the Domestic Building Contracts (Conciliation and Dispute Resolution) Act 2002 (VIC). The Act became effective on 1 July 2002. The VBA collects the levy and for the period July 2014 to June 2015, retains 50% of the BACV levy as revenue with the remaining 50% being payable to Consumer Affairs Victoria (CAV).
NOTE 3. EXPENSES FROM TRANSACTIONS($ thousand)
(a) Employee benefits
2015 2014
Salaries and related on costs 21,186 17,381
Superannuation expense – Defined contribution 1,700 1,440
Superannuation expense – Defined benefit 30 52
Total Employee benefits 22,916 18,873
Employees of the VBA are entitled to receive superannuation benefits and the VBA contributes to both defined benefit and defined contribution plans. The defined benefit plan provides benefits based on years of service and final average salary.
The VBA does not recognise any defined benefit liability in respect of the plan because the VBA has no legal or constructive obligation to pay future benefits relating to its employees; its only obligation is to pay superannuation contributions as they fall due. The Department of Treasury and Finance discloses the State’s defined benefit liabilities in its disclosure for administered items.
However, superannuation contributions paid or payable for the reporting period are included as part of employee benefits in the comprehensive operating statement of the VBA.
The VBA underwent substantial growth in 2014—15 to better enable the organisation to fulfill its regulatory functions.

65
VIC
TOR
IAN
BU
ILD
ING
AU
THO
RIT
Y
FINANCIAL STATEMENTS
5
NOTE 3. EXPENSES FROM TRANSACTIONS (CONT)($ thousand)
(b) General administration costs 2015 2014
FBT 190 304
Minor Assets 207 255
Internal Audit 89 62
Insurance 300 291
VCAT Funding 110 58
Travel 177 152
Motor Vehicles 332 264
Printing Stationery & Publications 560 637
Events/Seminars/Meetings 196 112
Records 145 276
General Office Expenses 820 772
Industry Development - 296
PIC No 1 Trust Expenditure - 9
Total General administration costs 3,126 3,488
($ thousand)
(c) Depreciation and amortisation 2015 2014
Buildings 22 22
Plant and equipment 1,076 1,110
Motor Vehicles 402 288
Intangibles 416 757
Make Good 30 30
Total Depreciation and amortisation 1,946 2,207
($ thousand)
(d) Grants 2015 2014
Australian Building Codes Board 513 546
Indigenous House 49 39
Total Grants 562 586

66
AN
NU
AL
RE
PO
RT
2014
—15
NOTE 4. OTHER ECONOMIC FLOWS INCLUDED IN NET RESULT($ thousand)
2015 2014
(a) Net gain/(loss) on non-financial assets
Write down of inventory (i) (29) -
Net gain/(loss) on disposal of property plant and equipment 55 (65)
Impairment of intangible assets (ii) (363) (263)
Total net gain/(loss) on non-financial assets (337) (328)
($ thousand)
2015 2014
(b) Net gain/(loss) on financial instruments
Impairment of receivables (iii) (396) -
Total net gain/(loss) on financial instruments (396) -
($ thousand)
2015 2014
(c) Other gains/(losses) from other economic flows
Net gain/(loss) arising from revaluation of long service liability (iv) (54) -
Net gain/(loss) arising from revaluation of BACV Provision (v) (94) (1,275)
Total other gains/(losses) from other economic flows (148) (1,275)
Notes:
(i) Write down of inventory greater than stock at the beginning of the 2014—15 financial year due to minor stock purchase in financial year – refer to Note 7
(ii) Impairments of intangible assets were the write offs of discontinued software projects.
(iii) Including (increase)/decrease in provision for doubtful debts from other economic flows – refer to Note 5
(iv) Revaluation gain/(loss) due to changes in bond rates
(v) Revaluation gain/(loss) due to annual actuarial assessment

67
VIC
TOR
IAN
BU
ILD
ING
AU
THO
RIT
Y
FINANCIAL STATEMENTS
5
NOTE 5. RECEIVABLES($ thousand)
2015 2014
Current receivables
Contractual
Plumbing inspections (i) 996 330
Other sundry receivables (i) 182 150
Provision for doubtful contractual receivables (i) (see also Note 5(a) below) (57) -
Accrued investment income 143 99
1,264 579
Statutory
Building permit levy 2,571 1,843
Building practitioner board fines & costs 608 538
Sundry debtors – prosecutions 364 100
Provision for doubtful statutory receivables (ii) (339) -
GST Input tax credit recoverable 411 502
3,615 2,983
Total receivables 4,879 3,562
Notes:
(i) The average credit period for plumbing inspections and other sundry receivables is 30 days.
(ii) The level of the provision for doubtful debts reflects all BPB fines and costs over 12 months old where money has yet to be received by the VBA for payment to the Victorian Building Authority Fund.
(a) Movement in the provision for doubtful receivables
($ thousand)
2015 2014
Balance at beginning of the year - -
Increase in the provision recognised in the net result (396) -
Balance at the end of the year (396) -
(b) Ageing analysis of contractual receivables
Please refer to Table 18.4 in Note 18 for ageing analysis of contractual receivables
(c) Nature and extent of risk arising from contractual receivables
Please refer to Note 18 for the nature and extent of risk arising from contractual receivables
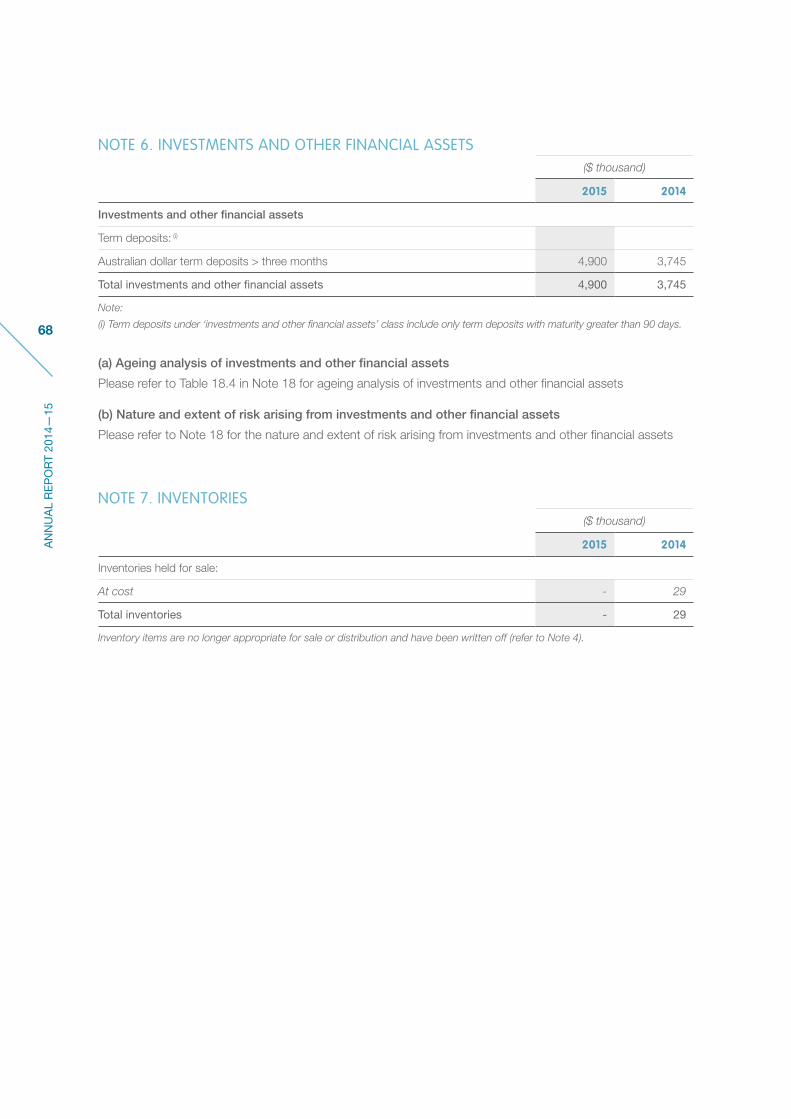
68
AN
NU
AL
RE
PO
RT
2014
—15
NOTE 6. INVESTMENTS AND OTHER FINANCIAL ASSETS($ thousand)
2015 2014
Investments and other financial assets
Term deposits: (i)
Australian dollar term deposits > three months 4,900 3,745
Total investments and other financial assets 4,900 3,745
Note:
(i) Term deposits under ‘investments and other financial assets’ class include only term deposits with maturity greater than 90 days.
(a) Ageing analysis of investments and other financial assets
Please refer to Table 18.4 in Note 18 for ageing analysis of investments and other financial assets
(b) Nature and extent of risk arising from investments and other financial assets
Please refer to Note 18 for the nature and extent of risk arising from investments and other financial assets
NOTE 7. INVENTORIES($ thousand)
2015 2014
Inventories held for sale:
At cost ‑ 29
Total inventories - 29
Inventory items are no longer appropriate for sale or distribution and have been written off (refer to Note 4).

69
VIC
TOR
IAN
BU
ILD
ING
AU
THO
RIT
Y
FINANCIAL STATEMENTS
5
NOTE 8. PROPERTY, PLANT, AND EQUIPMENT
Table 8.1: Classification by ‘public safety and environment’– carrying amounts
($ thousand)
Public safety and environment
Table disclosure reference Table 8.3
2015 2014
Nature Based classification
Land at fair value 686 686
Buildings at fair value 643 665
Plant, equipment and vehicles at fair value 2,800 3,358
Make good asset 273 303
Net Carrying amount of PPE 4,402 5,012
Table 8.2: Gross carrying amount and accumulated depreciation
($ thousand)
Gross carrying amount
Accumulated Depreciation
Net carrying amount
Gross carrying amount
Accumulated Depreciation
Net carrying amount
2015 2015 2015 2014 2014 2014
Land 686 - 686 686 - 686
Buildings at fair value 695 (52) 643 687 (22) 665
Plant, equipment and vehicles at fair value 5,339 (2,539) 2,800 4,756 (1,398) 3,358
Make good asset 333 (61) 273 333 (30) 303
7,053 (2,652) 4,402 6,462 (1,450) 5,012

70
AN
NU
AL
RE
PO
RT
2014
—15
Table 8.3: Classification by ‘public safety and environment’ purpose group – movement in carrying amounts
($ thousand)
Land at Fair value
Buildings at Fair value
Plant, equipment and motor
vehiclesMake
Good Asset Total
2015 2015 2015 2015 2015
Contributed assets 686 665 3,358 303 5,012
Additions - - 1,381 1,381
Disposals - - (461) (461)
Depreciation - (22) (1,478) (30) (1,530)
Closing balance 686 643 2,800 273 4,402
2014 2014 2014 2014 2014
Contributed assets 686 665 4,419 333 6,103
Additions - 22 594 616
Disposals - - (257) (257)
Depreciation - (22) (1,398) (30) (1,450)
Closing balance 686 665 3,358 303 5,012
Table 8.4: Aggregate depreciation recognition as an expense during the year
($ thousand)
2015 2014
Buildings at fair value (22) (22)
Plant, equipment and vehicles at fair value (1,478) (1,398)
Make good asset (30) (30)
(1,530) (1,450)

71
VIC
TOR
IAN
BU
ILD
ING
AU
THO
RIT
Y
FINANCIAL STATEMENTS
5
Table 8.5: Fair value measurement hierarchy for assets at as 30 June 2015 and 2014
($ thousand)
Carrying amount as at
30 June 2015
Fair value measurement at end of reporting period using:
Level 1 Level 2 Level 3
Land at fair value Non-specialised land 686 686
Total of land at fair value 686 686
Buildings at fair value
Non-specialised buildings 643 643
Total of buildings at fair value 643 643
Plant, equipment and vehicles at fair value
Vehicles 1,301 1,301
Plant and equipment 1,499 1,499
Total plant, equipment and vehicles at fair value 2,800 2,800
Make good asset 273 273
Total of make good asset 273 273
($ thousand)
Carrying amount as at
30 June 2014
Fair value measurement at end of reporting period using:
Level 1 Level 2 Level 3
Land at fair value Non-specialised land 686 686
Total of land at fair value 686 686
Buildings at fair value
Non-specialised buildings 665 665
Total of buildings at fair value 665 665
Plant, equipment and vehicles at fair value
Vehicles 953 953
Plant and equipment 2,405 2,405
Total plant, equipment and vehicles at fair value 3,358 3,358
Make good asset 303 303
Total of make good asset 303 303
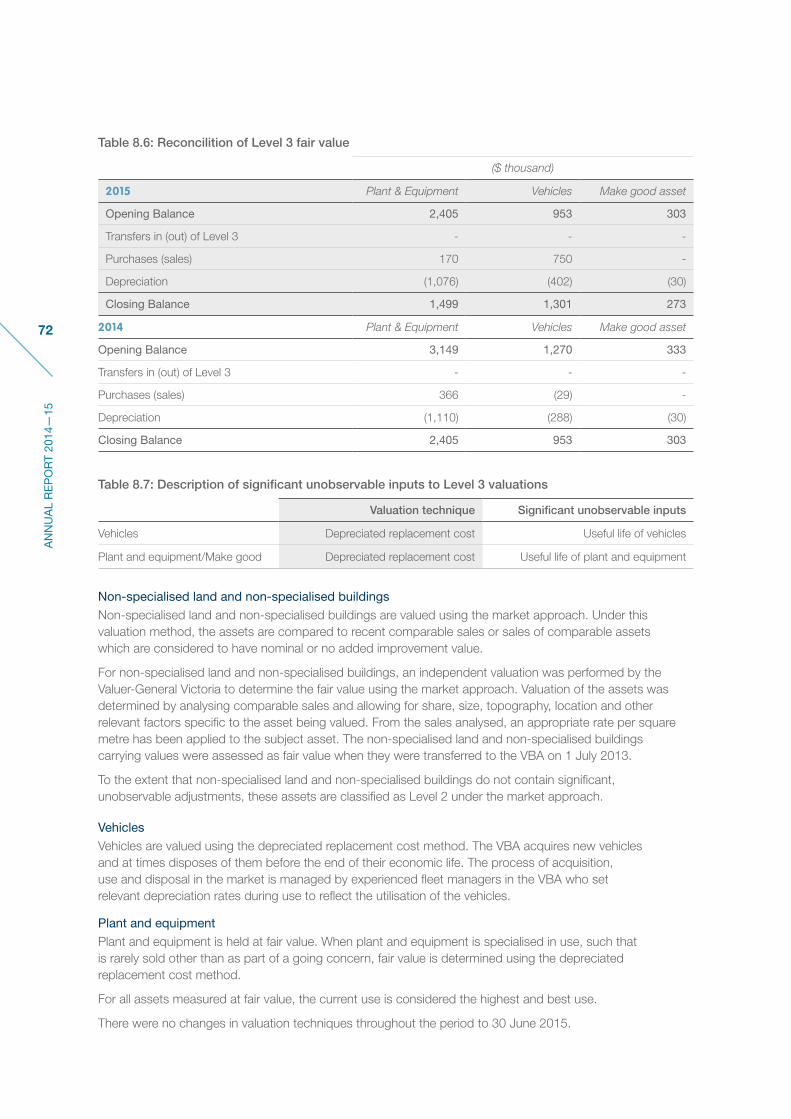
72
AN
NU
AL
RE
PO
RT
2014
—15
Table 8.6: Reconcilition of Level 3 fair value
($ thousand)
2015 Plant & Equipment Vehicles Make good asset
Opening Balance 2,405 953 303
Transfers in (out) of Level 3 - - -
Purchases (sales) 170 750 -
Depreciation (1,076) (402) (30)
Closing Balance 1,499 1,301 273
2014 Plant & Equipment Vehicles Make good asset
Opening Balance 3,149 1,270 333
Transfers in (out) of Level 3 - - -
Purchases (sales) 366 (29) -
Depreciation (1,110) (288) (30)
Closing Balance 2,405 953 303
Table 8.7: Description of significant unobservable inputs to Level 3 valuations
Valuation technique Significant unobservable inputs
Vehicles Depreciated replacement cost Useful life of vehicles
Plant and equipment/Make good Depreciated replacement cost Useful life of plant and equipment
Non-specialised land and non-specialised buildings
Non-specialised land and non-specialised buildings are valued using the market approach. Under this valuation method, the assets are compared to recent comparable sales or sales of comparable assets which are considered to have nominal or no added improvement value.
For non-specialised land and non-specialised buildings, an independent valuation was performed by the Valuer-General Victoria to determine the fair value using the market approach. Valuation of the assets was determined by analysing comparable sales and allowing for share, size, topography, location and other relevant factors specific to the asset being valued. From the sales analysed, an appropriate rate per square metre has been applied to the subject asset. The non-specialised land and non-specialised buildings carrying values were assessed as fair value when they were transferred to the VBA on 1 July 2013.
To the extent that non-specialised land and non-specialised buildings do not contain significant, unobservable adjustments, these assets are classified as Level 2 under the market approach.
Vehicles
Vehicles are valued using the depreciated replacement cost method. The VBA acquires new vehicles and at times disposes of them before the end of their economic life. The process of acquisition, use and disposal in the market is managed by experienced fleet managers in the VBA who set relevant depreciation rates during use to reflect the utilisation of the vehicles.
Plant and equipment
Plant and equipment is held at fair value. When plant and equipment is specialised in use, such that is rarely sold other than as part of a going concern, fair value is determined using the depreciated replacement cost method.
For all assets measured at fair value, the current use is considered the highest and best use.
There were no changes in valuation techniques throughout the period to 30 June 2015.
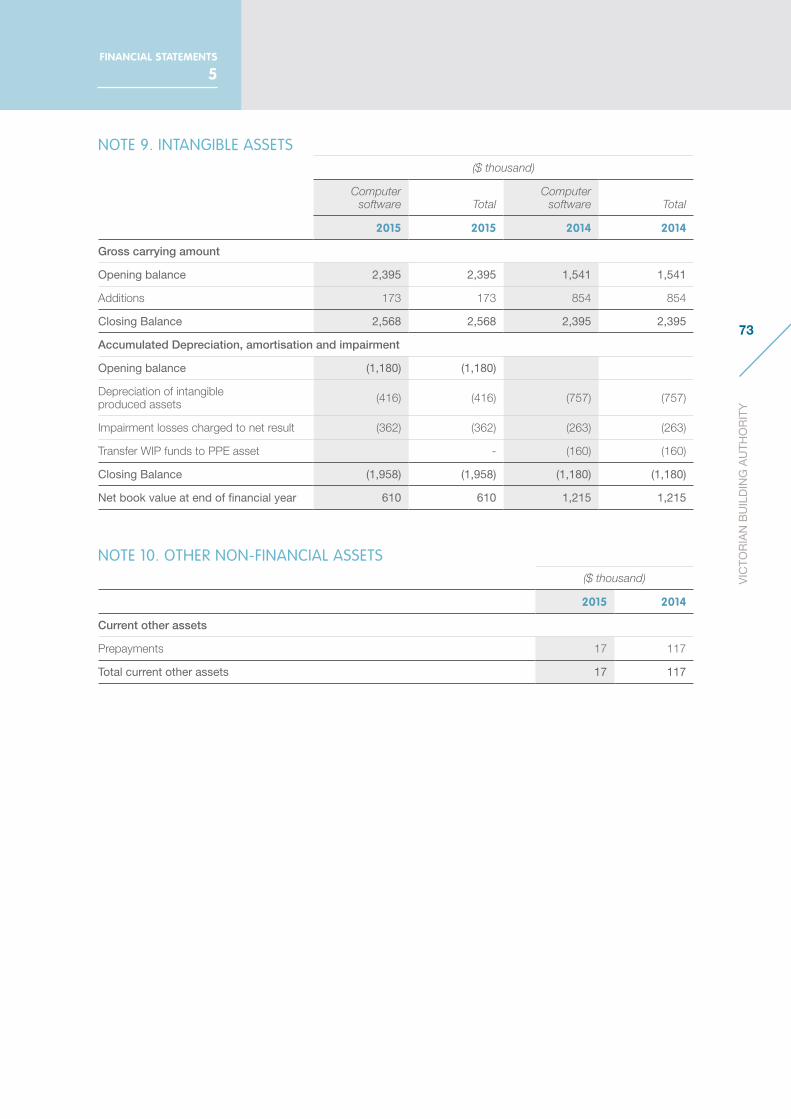
73
VIC
TOR
IAN
BU
ILD
ING
AU
THO
RIT
Y
FINANCIAL STATEMENTS
5
NOTE 9. INTANGIBLE ASSETS ($ thousand)
Computer software Total
Computer software Total
2015 2015 2014 2014
Gross carrying amount
Opening balance 2,395 2,395 1,541 1,541
Additions 173 173 854 854
Closing Balance 2,568 2,568 2,395 2,395
Accumulated Depreciation, amortisation and impairment
Opening balance (1,180) (1,180)
Depreciation of intangible produced assets (416) (416) (757) (757)
Impairment losses charged to net result (362) (362) (263) (263)
Transfer WIP funds to PPE asset - (160) (160)
Closing Balance (1,958) (1,958) (1,180) (1,180)
Net book value at end of financial year 610 610 1,215 1,215
NOTE 10. OTHER NON-FINANCIAL ASSETS ($ thousand)
2015 2014
Current other assets
Prepayments 17 117
Total current other assets 17 117

74
AN
NU
AL
RE
PO
RT
2014
—15
NOTE 11. PAYABLES AND OTHER LIABILITIES ($ thousand)
2015 2014
Current Payables
Contractual
Supplies and services 982 1,866
Other payables 290 109
1,272 1,975
Statutory
FBT Payable 31 -
Other taxes payable 76 220
107 220
Total Current payables 1,379 2,195
Notes:
(i) The average credit period is 30 days.
(a) Maturity analysis of contractual payables
Please refer to Table 18.5 in Note 18 for maturity analysis of contractual payables.
(b) Nature and extent of risk arising from contractual payables
Please refer to Table 18.6 in Note 18 for the nature and extent of risk arising from contractual payables
(c) Other liabilities
($ thousand)
2015 2014
Current
Amounts payable to government agencies
Domestic Building List 185 222
HIH clearing - 6
BACV clearing 852 798
Other 25 -
Total Other liabilities 1,062 1,026
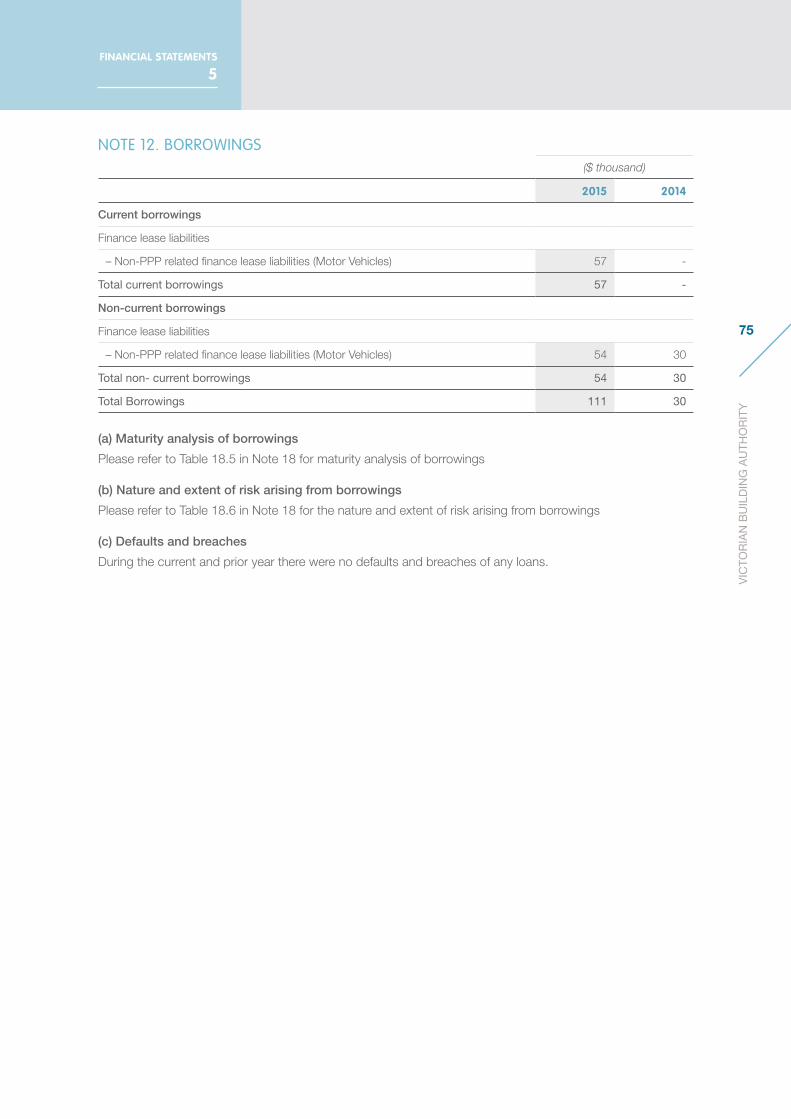
75
VIC
TOR
IAN
BU
ILD
ING
AU
THO
RIT
Y
FINANCIAL STATEMENTS
5
NOTE 12. BORROWINGS ($ thousand)
2015 2014
Current borrowings
Finance lease liabilities
– Non-PPP related finance lease liabilities (Motor Vehicles) 57 -
Total current borrowings 57 -
Non-current borrowings
Finance lease liabilities
– Non-PPP related finance lease liabilities (Motor Vehicles) 54 30
Total non- current borrowings 54 30
Total Borrowings 111 30
(a) Maturity analysis of borrowings
Please refer to Table 18.5 in Note 18 for maturity analysis of borrowings
(b) Nature and extent of risk arising from borrowings
Please refer to Table 18.6 in Note 18 for the nature and extent of risk arising from borrowings
(c) Defaults and breaches
During the current and prior year there were no defaults and breaches of any loans.

76
AN
NU
AL
RE
PO
RT
2014
—15
NOTE 13. PROVISIONS ($ thousand)
2015 2014
Current Provisions
Employee Benefits
Annual leave
Unconditional and expected to settle within 12 months 1,307 1,140
Unconditional and expected to settle after 12 months 407 370
Long Service Leave
Unconditional and expected to settle within 12 months 1,852 1,379
BACV provision 1,175 1,234
4,741 4,123
Provisions for on-costs
Unconditional and expected to settle within 12 months 534 381
Unconditional and expected to settle after 12 months 69 72
603 453
Total current provisions 5,344 4,576
Non-current provisions
Employee Benefits
Long Service Leave
Conditional and expected to settle after 12 months 588 440
On-costs 99 51
BACV 3,810 3,658
Make good provision 583 530
Total non-current provisions 5,080 4,679
Total provisions 10,424 9,255
(a) Employee benefits and on-costs (i)
Current employee benefits
Annual leave 1,714 1,510
Long Service Leave 1,852 1,379
Non current employee benefits
Long Service Leave 588 440
Total employee benefits 4,154 3,329
Current on-costs 603 453
Non current on-costs 99 51
Total on-costs 702 504
Total employee benefits and on-costs 4,856 3,833
Note:
(i) Employee benefits consist of annual leave and long service leave accrued by employees. On‑costs such as payroll tax and workers’ compensation insurance are not employee benefits and are recognised as a separate provision.

77
VIC
TOR
IAN
BU
ILD
ING
AU
THO
RIT
Y
FINANCIAL STATEMENTS
5
(b) Movements in provisions
($ thousand)
Make good On‑costs BACV Total
2015 2015 2015 2015
Opening balance 530 504 4,891 5,924
Additional provisions recognised 53 184 1,195 1,432
Additions due to transfer in - 14 - 14
Reductions arising from payments/other sacrifices of future economic benefits - - (1,181) (1,181)
Unwind of discount and effect of changes in the discount rate - - 80 80
Closing balance 583 702 4,985 6,270
Current - 603 1,175 1,778
Non-current 583 99 3,810 4,492
583 702 4,985 6,270
2014 2014 2014 2014
Opening balance 515 480 3,615 4,610
Additional provisions recognised 15 - 2,232 2,247
Additions due to transfer in - 24 - 24
Reductions arising from payments/other sacrifices of future economic benefits
- - (1,047) (1,047)
Unwind of discount and effect of changes in the discount rate
- - 91 91
Closing balance 530 504 4,891 5,925
Current - 453 1,234 1,687
Non-current 530 51 3,657 4,238
530 504 4,891 5,925

78
AN
NU
AL
RE
PO
RT
2014
—15
NOTE 14. SUPERANNUATION ($ thousand)
2015 2014
Defined Benefit plans:
State Superannuation Fund 30 52
Defined contribution plans:
VicSuper 1,016 874
Other 684 566
Total 1,730 1,492
NOTE 15. LEASES
Disclosures for lessees – Finance leases
Lease commitments in relation to finance leases contracted for at the reporting date are as follows:
($ thousand)
Minimum future lease
payments
Minimum future lease
payments
2015 2014
Non-cancellable finance leases
Not longer than one year 61 7
Longer than one year but not longer than five years 64 24
Longer than five years - -
Minimum future lease payments 125 31
less future interest charges (14) (1)
Present value of minimum lease payables 111 30
The lease commitments noted above relate to the VBA’s vehicles leased via VicFleet.

79
VIC
TOR
IAN
BU
ILD
ING
AU
THO
RIT
Y
FINANCIAL STATEMENTS
5
NOTE 16. COMMITMENTS FOR EXPENDITURE($ thousand)
NOMINAL VALUES 2015 2014
Operating and lease commitments payable
Less than one year 1,505 1,360
Longer than one year but not longer than five years 6,687 6,049
Five years or more 8,788 9,975
Total commitments (inclusive of GST) 16,980 17,385
Less GST recoverable from the Australian Tax Office 1,544 1,580
Total commitments (exclusive of GST) 15,436 15,805
Operating lease commitments noted above relate to the VBA’s accommodation at the Goods Shed North (GSN), 733 Bourke Street Docklands.
The lease was subject to a rent review during 2014—15. GSN rent was increased by 10.68 per cent instead of the assumed 4.25 per cent (annual rent increase).
NOTE 17. CONTINGENT ASSETS AND CONTINGENT LIABILITIES
No contingent assets and contingent liabilities existed as at 30 June 2015. (30 June 2014: $0)
NOTE 18. FINANCIAL INSTRUMENTS
(a) Financial Risk Management objectives and policies
The VBA’s principal financial instruments comprise cash assets, term deposits, receivables (excluding statutory receivables), payables (excluding statutory payables) and finance lease liabilities. Details of the significant accounting policies and methods adopted, including the criteria for recognition, the basis of measurement, and the basis on which income and expenses are recognised, with respect to each class of financial asset and financial liability are disclosed in Note 1 to the financial statements.
The main purpose in holding financial instruments is to prudently manage VBA’s financial risk within the government policy parameters. The VBA uses different methods to measure and manage the risk to which it is exposed. Primary responsibility for the identification and management of financial risks rests with the board.
The VBA’s main financial risk is interest rate risk. The VBA does not enter into derivative financial instruments to manage exposure to interest rate risk.

80
AN
NU
AL
RE
PO
RT
2014
—15
The carrying amounts of the VBA’s contractual financial assets and financial liabilities by category are in the Table below.
Table 18.1: Categorisation of financial instruments
($ thousand)
Contractual financial assets
Contractual financial
liabilities at amortised cost Total
2015
Contractual financial assets
Cash and deposits 28,766 28,766
Receivables (i) 1,264 1,264
Term deposits 4,900 4,900
Total contractual financial assets 34,930 34,930
Contractual financial liabilities
Payables 1,272 1,272
Amounts payable to government and agencies 1,062 1,062
Borrowings 111 111
Security deposits 1,884 1,884
Total contractual financial liabilities 4,329 4,329
2014
Contractual financial assets
Cash and deposits 24,772 24,772
Receivables (i) 579 579
Term deposits 3,745 3,745
Total contractual financial assets 29,096 29,096
Contractual financial liabilities
Payables 1,975 1,975
Amounts payable to government and agencies 1,026 1,026
Borrowings 30 30
Security deposits 1,872 1,872
Total contractual financial liabilities 4,903 4,903
Note:
(i) The amount of receivables disclosed here exclude statutory receivables (i.e. Amounts owing from Statutory Levies).

81
VIC
TOR
IAN
BU
ILD
ING
AU
THO
RIT
Y
FINANCIAL STATEMENTS
5
Table 18.2 Net holding gain/(loss) on financial instruments by category
($ thousand)
2015 Total interest income/(expense)
Contractual financial assets
Cash and deposits 143
Term Deposits 593
Total contractual financial assets 737
Contractual financial liabilities
Borrowings (7)
Total contractual financial liabilities (7)
2014 Total interest income/(expense)
Contractual financial assets
Cash and deposits 219
Term Deposits 426
Total contractual financial assets 645
Contractual financial liabilities
Borrowings -
Total contractual financial liabilities -
(b) Credit risk
Credit risk arises from the financial assets of the VBA, which comprise cash and cash equivalents, non-statutory receivables and other financial assets. Exposure to credit risk arises from the potential default of a counter party on their contractual obligations resulting in financial loss to the VBA. Credit risk is measured at fair value and is monitored on a regular basis.
The credit risk on financial assets of the VBA which have been recognised on the balance sheet, is the carrying amount, net of any provision for doubtful debts. The VBA minimises concentrations of credit risk by undertaking transactions with unrelated debtors. The VBA is not materially exposed to any individual debtor.
The carrying amount of financial assets recorded in the financial statements, net of any allowances for losses, represents the VBA’s maximum exposure to credit risk without taking account of the value of any collateral obtained.
Provision of impairment for contractual financial assets is recognised when there is objective evidence that the VBA will not be able to collect a receivable. Objective evidence includes financial difficulties of the debtor, default payments, debts which are more than 60 days overdue and changes in debtor credit ratings.
Currently the VBA does not hold any collateral as security nor credit enhancements relating to any of its financial assets. As at the reporting date, there is no event to indicate that any of the financial assets were impaired. There are no financial assets that have had their terms renegotiated so as to prevent them from being past due or impaired, and they are stated at the carrying amounts as indicated.

82
AN
NU
AL
RE
PO
RT
2014
—15
Table 18.3 Credit quality of contractual financial assets that are neither past due nor impaired
($ thousand)
Financial Institutions
(triple-A credit rating)
Government agencies (triple-A
credit rating) Other Total
2015
Cash and deposits 24,745 4,021 28,766
Receivables (i) 1,264 1,264
Investments and other financial assets 4,900 4,900
Total contractual financial assets 29,645 5,285 34,930
2014
Cash and deposits 14,400 10,372 24,772
Receivables (i) 579 579
Investments and other financial assets 3,745 3,745
Total contractual financial assets 18,145 10,951 29,096
Note:
(i) The amount of receivables disclosed here exclude statutory receivables (i.e. Amounts owing from Victorian Government and GST input tax credit recoverable).
Table 18.4 Ageing analysis of contractual financial assets
($ thousand)
Past due but not impaired
Carrying amount
Not past due and not
impairedLess than
1 month1‑3
months3‑12
months 1‑5
years Impaired
2015
Receivables (i)
Sale of goods and services 1,264 470 128 360 116 190 57
Investments and other contractual financial assets
4,900
Total 6,164 470 128 360 116 190 57
2014 Past due but not impaired
Receivables (i)
Sale of goods and services 579 274 109 26 170 -
Investments and other contractual financial assets
3,745
Total 4,324 274 109 26 170 -
Note:
(i) The amount of receivables disclosed here exclude statutory receivables (i.e. Amounts owing from Victorian Government and GST input tax credit recoverable).

83
VIC
TOR
IAN
BU
ILD
ING
AU
THO
RIT
Y
FINANCIAL STATEMENTS
5
(c) Liquidity risk
Liquidity risk arises when the VBA would be unable to meet its financial obligations as and when they fall due. The VBA operates under the Government fair payments policy of settling financial obligations within 30 days and in the event of a dispute, make payments within 30 days from the date of resolution. It also continuously manages risk through monitoring future cash flows and maturities planning to ensure adequate holding of high quality liquid assets.
(d) Market risk
The VBA’s exposure to market risk is primarily through interest rate risk. Exposure to interest rate risk is insignificant and might arise primarily through the VBA’s cash and cash equivalents and other financial assets. Minimisation of risk is achieved by mainly undertaking fixed rate or non-interest bearing financial instruments.
The carrying amount of financial assets and financial liabilities that are exposed to interest rates are as below:
Table 18.5: Maturity analysis of contractual financial liabilities (i)
($ thousand)
2015
Maturity dates
Carrying amount
Nominal amount
Less than 1 month
1-3 months
3-12 months
1- 5 years
Payables: (ii)
Supplies and services 1,272 1,272 1,272
Amounts payable to government and agencies 1,062 1,062 1,062
Borrowings:
Finance lease liabilities 111 125 5 15 41 64
Security Deposits (iii) 1,884 1,884 1,884
Total 4,329 4,343 2,338 15 41 1,948
2014
Maturity dates
Carrying amount
Nominal amount
Less than 1 month
1-3 months
3-12 months
1- 5 years
Payables: (ii)
Supplies and services 1,975 1,975 1,975
Amounts payable to government and agencies 1,026 1,026 1,026
Borrowings:
Finance lease liabilities 30 30 5 25
Security Deposits (iii) 1,872 1,872 1,872
Total 4,903 4,903 3,006 25 - 1,872
Note:
(i) Maturity analysis is presented using the contractual undiscounted cash flows
(ii) The carrying amounts disclosed exclude statutory amounts (e.g. GST payables)
(iii) Security Deposits are bonds paid by consumers for relocatable homes. Building Permits lapse after 2 years so it is expected deposits are refunded within the 2 year period. Building Permits can be extended for completion of work. There are instances of work taking an extended period of time to be completed.
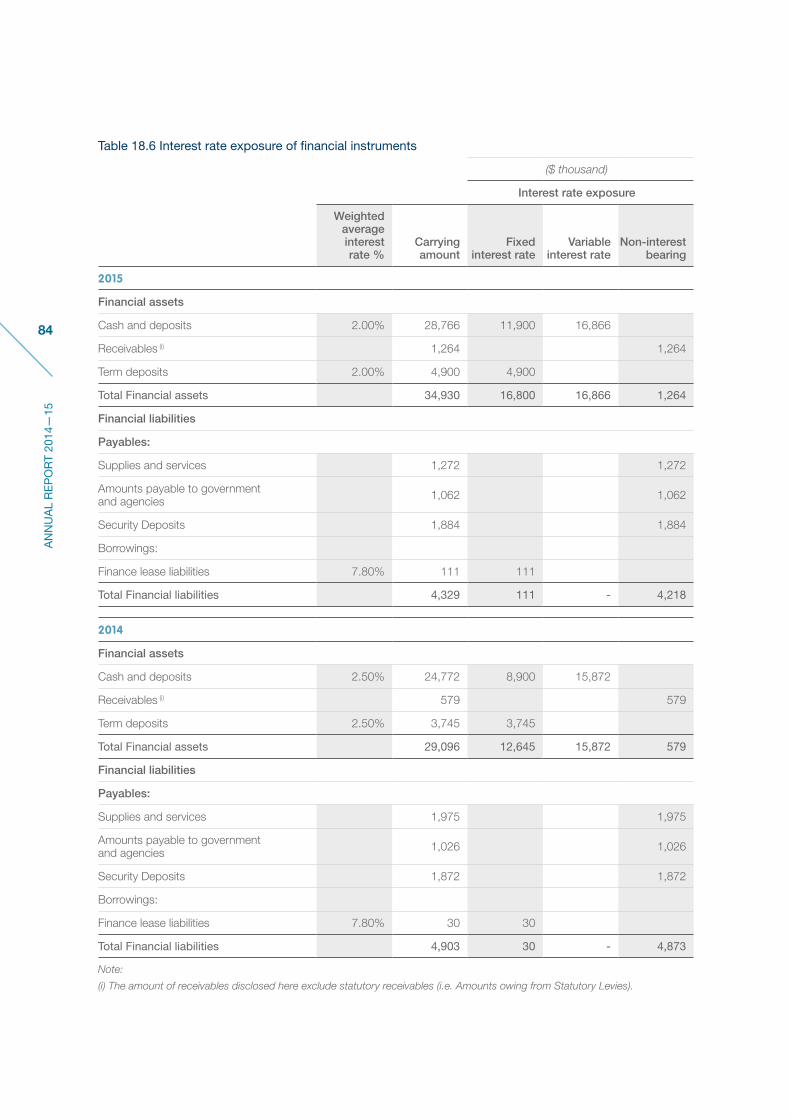
84
AN
NU
AL
RE
PO
RT
2014
—15
Table 18.6 Interest rate exposure of financial instruments
($ thousand)
Interest rate exposure
Weighted average interest rate %
Carrying amount
Fixed interest rate
Variable interest rate
Non-interestbearing
2015
Financial assets
Cash and deposits 2.00% 28,766 11,900 16,866
Receivables (i) 1,264 1,264
Term deposits 2.00% 4,900 4,900
Total Financial assets 34,930 16,800 16,866 1,264
Financial liabilities
Payables:
Supplies and services 1,272 1,272
Amounts payable to government and agencies 1,062 1,062
Security Deposits 1,884 1,884
Borrowings:
Finance lease liabilities 7.80% 111 111
Total Financial liabilities 4,329 111 - 4,218
2014
Financial assets
Cash and deposits 2.50% 24,772 8,900 15,872
Receivables (i) 579 579
Term deposits 2.50% 3,745 3,745
Total Financial assets 29,096 12,645 15,872 579
Financial liabilities
Payables:
Supplies and services 1,975 1,975
Amounts payable to government and agencies 1,026 1,026
Security Deposits 1,872 1,872
Borrowings:
Finance lease liabilities 7.80% 30 30
Total Financial liabilities 4,903 30 - 4,873
Note:
(i) The amount of receivables disclosed here exclude statutory receivables (i.e. Amounts owing from Statutory Levies).

85
VIC
TOR
IAN
BU
ILD
ING
AU
THO
RIT
Y
FINANCIAL STATEMENTS
5
Table 18.7 Interest rate risk sensitivity
($ thousand)
Interest rate
-100 basis points
+100 basis points
Carrying amount Net result Net result
2015
Contractual financial assets
Cash and deposits 16,866 (169) 169
Total impact (169) 169
Interest rate
-100 basis points
+100 basis points
Carrying amount Net result Net result
2014
Contractual financial assets
Cash and deposits 15,872 (159) 159
Total impact (159) 159
(e) Net fair values
The VBA currently holds a range of financial instruments that are recorded in the financial statements where the carrying amounts are a reasonable approximation of fair value, either due to their short-term nature or with the expectation that they will be paid in full by the end of the 2015-16 reporting period. These financial instruments include:
Financial Assets Financial Liabilities
Cash and deposits Payables
Receivables Supplies and services
Term Deposits Amounts payable to government and agencies
Borrowings:
Security Deposits
None of the VBA’s financial instruments are recorded at fair value post initial recognition.
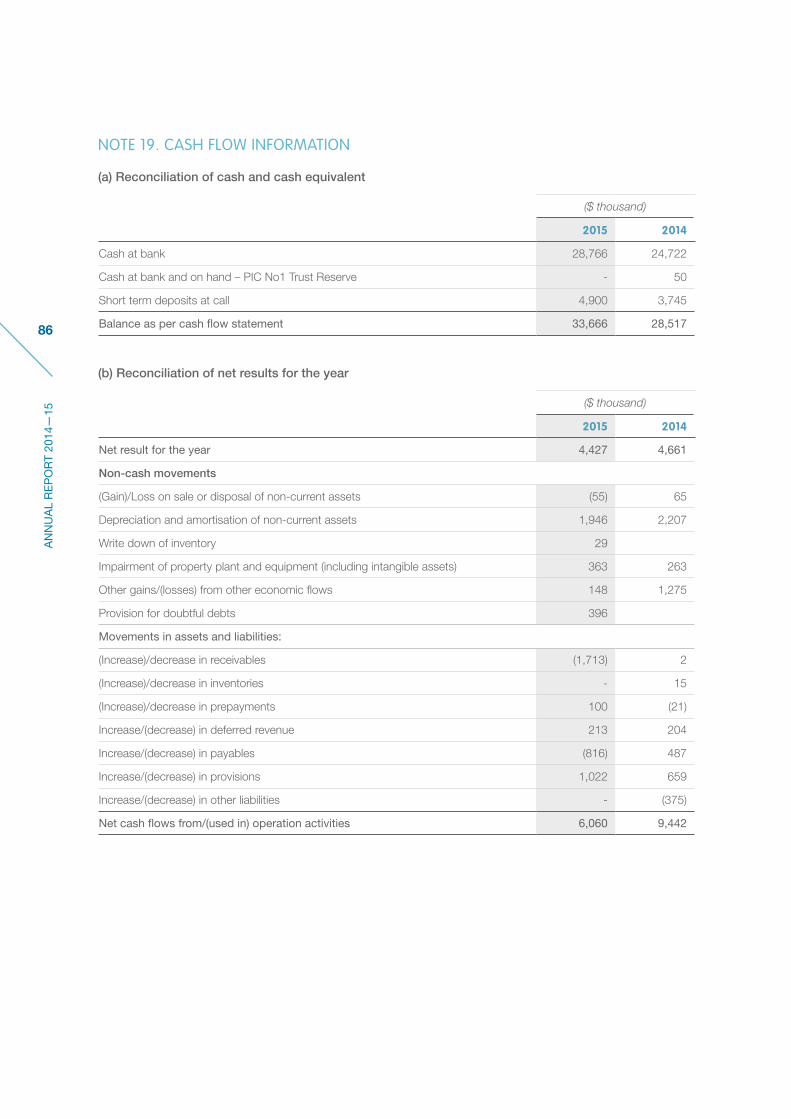
86
AN
NU
AL
RE
PO
RT
2014
—15
NOTE 19. CASH FLOW INFORMATION
(a) Reconciliation of cash and cash equivalent
($ thousand)
2015 2014
Cash at bank 28,766 24,722
Cash at bank and on hand – PIC No1 Trust Reserve - 50
Short term deposits at call 4,900 3,745
Balance as per cash flow statement 33,666 28,517
(b) Reconciliation of net results for the year
($ thousand)
2015 2014
Net result for the year 4,427 4,661
Non-cash movements
(Gain)/Loss on sale or disposal of non-current assets (55) 65
Depreciation and amortisation of non-current assets 1,946 2,207
Write down of inventory 29
Impairment of property plant and equipment (including intangible assets) 363 263
Other gains/(losses) from other economic flows 148 1,275
Provision for doubtful debts 396
Movements in assets and liabilities:
(Increase)/decrease in receivables (1,713) 2
(Increase)/decrease in inventories - 15
(Increase)/decrease in prepayments 100 (21)
Increase/(decrease) in deferred revenue 213 204
Increase/(decrease) in payables (816) 487
Increase/(decrease) in provisions 1,022 659
Increase/(decrease) in other liabilities - (375)
Net cash flows from/(used in) operation activities 6,060 9,442
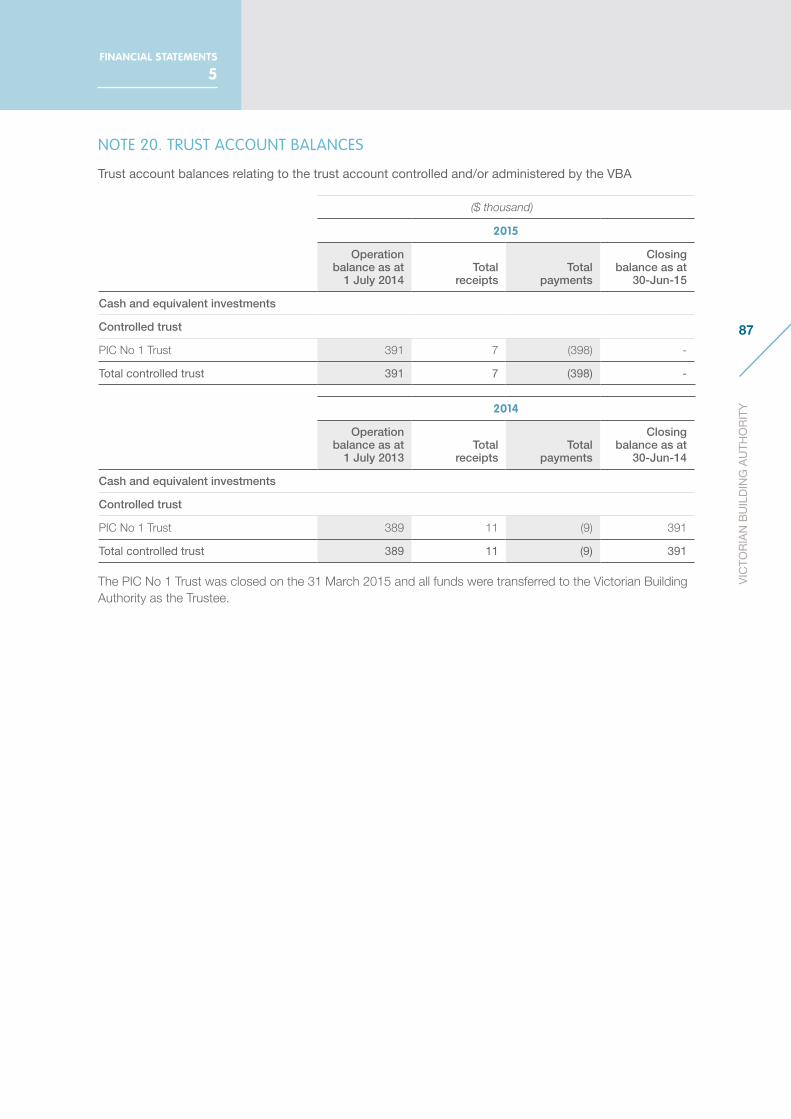
87
VIC
TOR
IAN
BU
ILD
ING
AU
THO
RIT
Y
FINANCIAL STATEMENTS
5
NOTE 20. TRUST ACCOUNT BALANCES
Trust account balances relating to the trust account controlled and/or administered by the VBA
($ thousand)
2015
Operation balance as at
1 July 2014Total
receiptsTotal
payments
Closing balance as at
30-Jun-15
Cash and equivalent investments
Controlled trust
PIC No 1 Trust 391 7 (398) -
Total controlled trust 391 7 (398) -
2014
Operation balance as at
1 July 2013Total
receiptsTotal
payments
Closing balance as at
30-Jun-14
Cash and equivalent investments
Controlled trust
PIC No 1 Trust 389 11 (9) 391
Total controlled trust 389 11 (9) 391
The PIC No 1 Trust was closed on the 31 March 2015 and all funds were transferred to the Victorian Building Authority as the Trustee.

88
AN
NU
AL
RE
PO
RT
2014
—15
NOTE 21. RESPONSIBLE PERSONS
In accordance with the Ministerial Directions issued by the Minister of Finance under the Financial Management Act 1994, the following disclosures are made regarding responsible persons for the reporting period.
The persons who held the positions of Ministers, Accountable Officer and the governing board of Commissioners for the year were:
Hon Matthew Guy MLC Minister for Planning 1 July 2014 – 3 December 2014
Hon Richard Wynne MLC Minister for Planning 4 December 2014 – 10 December 2014
Hon Robin Scott MLC Minister for Finance 10 December 2014 – 23 February 2015
Hon Richard Wynne MLC Minister for Planning 23 February 2015 – 30 June 2015
Prue Digby CEO/Accountable Officer 1 July 2014 – 30 June 2015
William R. Kusznirczuk Chief Commissioner/Chairman 1 July 2014 – 30 June 2015
Damian Cremean Deputy Commissioner/Deputy Chair 1 July 2014 – 29 May 2015
David Bennett QC Commissioner 1 July 2014 – 30 June 2015
Brian Welsh Commissioner 1 July 2014 – 30 June 2015
Lynne Williams Commissioner 1 July 2014 – 30 June 2015
Yvonne von Hartel Commissioner 1 July 2014 – 30 June 2015
Warren Hutcheon Commissioner 9 September 2014 – 30 June 2015
Amounts relating to Ministers are reported in the Financial Statements of the Department of Premier and Cabinet.
The number of responsible persons whose remuneration was within the specified bands are as follows:
INCOME BAND ($)
2014—15 2013—14
No. No.
0 – 9,999 - 2
10,000 – 19,999 - -
20,000 – 29,999 1 1
30,000 – 39,999 5 2
60,000 – 69,999 - 1
70,000 – 79,999 1 -
200,000 – 209,999 - 1
350,000 – 359,999 1 -
Total number of responsible persons 8 7
Total amount $’000 629 376
There were no related party transactions between the responsible persons above and the VBA.
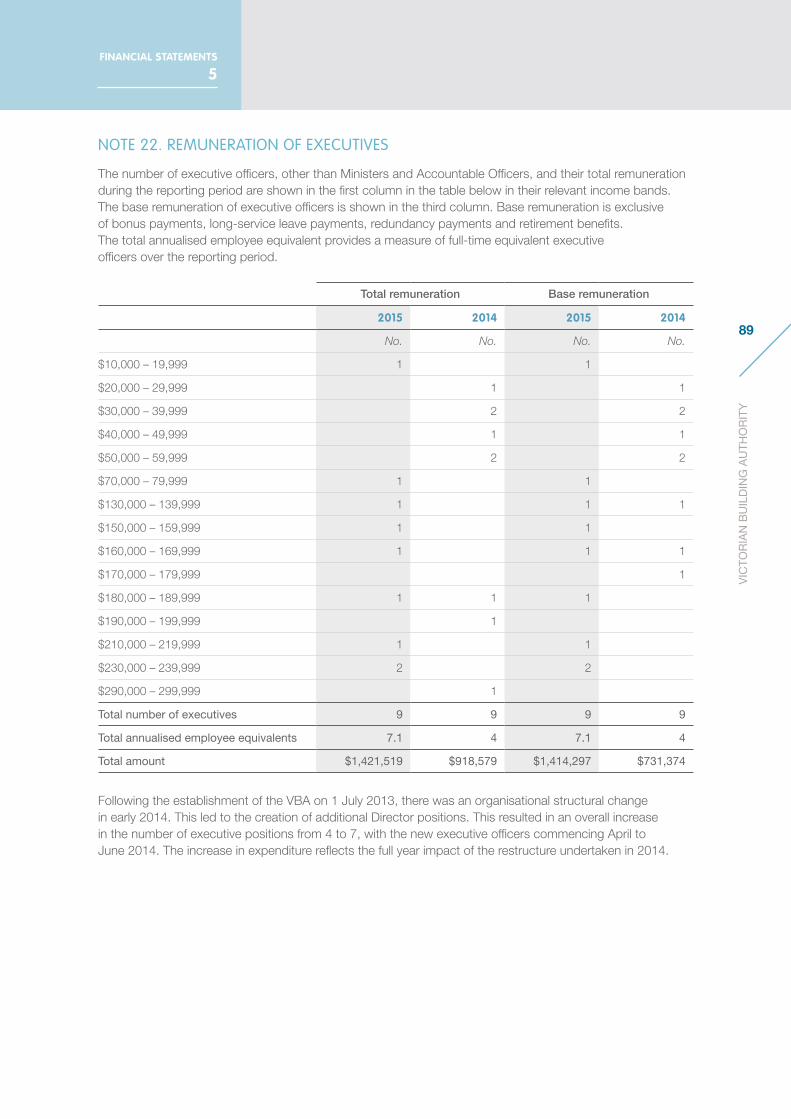
89
VIC
TOR
IAN
BU
ILD
ING
AU
THO
RIT
Y
FINANCIAL STATEMENTS
5
NOTE 22. REMUNERATION OF EXECUTIVES
The number of executive officers, other than Ministers and Accountable Officers, and their total remuneration during the reporting period are shown in the first column in the table below in their relevant income bands. The base remuneration of executive officers is shown in the third column. Base remuneration is exclusive of bonus payments, long-service leave payments, redundancy payments and retirement benefits. The total annualised employee equivalent provides a measure of full-time equivalent executive officers over the reporting period.
Total remuneration Base remuneration
2015 2014 2015 2014
No. No. No. No.
$10,000 – 19,999 1 1
$20,000 – 29,999 1 1
$30,000 – 39,999 2 2
$40,000 – 49,999 1 1
$50,000 – 59,999 2 2
$70,000 – 79,999 1 1
$130,000 – 139,999 1 1 1
$150,000 – 159,999 1 1
$160,000 – 169,999 1 1 1
$170,000 – 179,999 1
$180,000 – 189,999 1 1 1
$190,000 – 199,999 1
$210,000 – 219,999 1 1
$230,000 – 239,999 2 2
$290,000 – 299,999 1
Total number of executives 9 9 9 9
Total annualised employee equivalents 7.1 4 7.1 4
Total amount $1,421,519 $918,579 $1,414,297 $731,374
Following the establishment of the VBA on 1 July 2013, there was an organisational structural change in early 2014. This led to the creation of additional Director positions. This resulted in an overall increase in the number of executive positions from 4 to 7, with the new executive officers commencing April to June 2014. The increase in expenditure reflects the full year impact of the restructure undertaken in 2014.

90
AN
NU
AL
RE
PO
RT
2014
—15
NOTE 23. REMUNERATION OF EXTERNAL AUDITORS
($ thousand)
2015 2014
Victorian Auditor-General’s office
Audit or review of the financial statements 47 85
47 85
NOTE 24. SUBSEQUENT EVENTS
No matters or circumstances have arisen since the end of the financial year which significantly affected or may significantly affect the operations of the VBA, the results of those operations, or the state of affairs of the VBA in future years.

91
VIC
TOR
IAN
BU
ILD
ING
AU
THO
RIT
Y
FINANCIAL STATEMENTS
5
NOTE 25. RESTRUCTURING OF ADMINISTRATIVE ARRANGEMENTS
The Victorian Building Authority was established on 1 July 2013 under the Building and Planning Legislation Amendment Act 2013. This legislation abolished the former Building Commission and Plumbing Industry Commission and transferred all assets and liabilities of these statutory authorities to the new authority.
The contributed capital assumed by the VBA as a result of the administrative restructure of the Building Commission and Plumbing Industry Commission was recognised in the balance sheet ($14,486,129) at the carrying amount of those assets and liabilities in the balance sheet of the transferor’s balance sheet immediately before the transfer, with the exception of Property, Plant and Equipment and Intangible assets. The carrying amount of these assets were corrected for prior period errors. There are no administrative changes with respect to the VBA in 2014—15. The 2013—14 information is included for comparative purposes.
($ thousand)
2013—14 Building
Commission
Plumbing Industry
Commission Total
Financial assets
Cash and deposits 7,336 9,322 16,658
Receivables 2,909 655 3,564
Investments and other financial assets 3,400 - 3,400
Non-financial assets
Inventories - 44 44
Prepayments 96 - 96
Land & Buildings - 1,351 1,351
Property, plant and equipment (i) 2,801 1,619 4,420
Intangible assets (ii) 878 663 1,541
Make Good Asset 233 100 333
Total assets 17,653 13,754 31,407
Liabilities
Payables (1,111) (597) (1,708)
Provisions (6,098) (1,224) (7,322)
Security Deposits (1,768) - (1,768)
Deferred Revenue (1,262) (3,460) (4,722)
Other liabilities (1,401) - (1,401)
Total liabilities (11,640) (5,281) (16,921)
Total contributed capital 6,013 8,473 14,486
Note:
(i) The accumulated depreciation on Furniture and Fittings for the Plumbing Industry Commission was adjusted to reflect a depreciation rate of 6.7 years to align with the Building Commission depreciation rate. The accumulated depreciation on Motor Vehicles for the Building Commission has been adjusted to reflect a depreciation rate of 5 years to align with the Plumbing Industry Commission depreciation rate.
(ii) The Building Commission had an amount of $288,474 in work in progress for Building Appeals Board Software development. This project was abandoned in early 2012 and the development should have been expensed at this time.

92
AN
NU
AL
RE
PO
RT
2014
—15
NOTE 26. GLOSSARY OF TERMS AND STYLE CONVENTIONS
Amortisation
Amortisation is the expense which results from the consumption, extraction or use over time of a non-produced physical or intangible asset. This expense is classified as an other economic flow.
Borrowings
Borrowings refers to interest-bearing liabilities mainly raised from public borrowings raised through the Treasury Corporation of Victoria, finance leases and other interest-bearing arrangements. Borrowings also include non-interest-bearing advances from government that are acquired for policy purposes.
Comprehensive result
The net result of all items of income and expense recognised for the period. It is the aggregate of operating result and other comprehensive income.
Capital asset charge
The capital asset charge represents the opportunity cost of capital invested in the non-financial physical assets used in the provision of outputs.
Commitments
Commitments include those operating, capital and other outsourcing commitments arising from non-cancellable contractual or statutory sources.
Depreciation
Depreciation is an expense that arises from the consumption through wear or time of a produced physical or intangible asset. This expense is classified as a ‘transaction’ and so reduces the ‘net result from transaction’.
Effective interest method
The effective interest method is used to calculate the amortised cost of a financial asset or liability and of allocating interest income over the relevant period. The effective interest rate is the rate that exactly discounts estimated future cash receipts through the expected life of the financial instrument, or, where appropriate, a shorter period.
Employee benefits expenses
Employee benefits expenses include all costs related to employment including wages and salaries, fringe benefits tax, leave entitlements, redundancy payments, defined benefits superannuation plans, and defined contribution superannuation plans.
Ex-gratia expenses
Ex-gratia expenses mean the voluntary payment of money or other non-monetary benefit (e.g. a write off) that is not made either to acquire goods, services or other benefits for the entity or to meet a legal liability, or to settle or resolve a possible legal liability or claim against the entity.
Financial asset
A financial asset is any asset that is:
(a) cash;
(b) an equity instrument of another entity;
(c) a contractual or statutory right:
– to receive cash or another financial asset from another entity; or
– to exchange financial assets or financial liabilities with another entity under conditions that are potentially favourable to the entity; or
(d) a contract that will or may be settled in the entity’s own equity instruments and is:
– a non-derivative for which the entity is or may be obliged to receive a variable number of the entity’s own equity instruments; or
– a derivative that will or may be settled other than by the exchange of a fixed amount of cash or another financial asset for a fixed number of the entity’s own equity instruments.
Financial instrument
A financial instrument is any contract that gives rise to a financial asset of one entity and a financial liability or equity instrument of another entity. Financial assets or liabilities that are not contractual (such as statutory receivables or payables that arise as a result of statutory requirements imposed by governments) are not financial instruments.

93
VIC
TOR
IAN
BU
ILD
ING
AU
THO
RIT
Y
FINANCIAL STATEMENTS
5
Financial liability
A financial liability is any liability that is:
(a) A contractual obligation:
(i) to deliver cash or another financial asset to another entity; or
(ii) to exchange financial assets or financial liabilities with another entity under conditions that are potentially unfavourable to the entity; or
(b) A contract that will or may be settled in the entity’s own equity instruments and is:
(i) a non-derivative for which the entity is or may be obliged to deliver a variable number of the entity’s own equity instruments; or
(ii) a derivative that will or may be settled other than by the exchange of a fixed amount of cash or another financial asset for a fixed number of the entity’s own equity instruments. For this purpose, the entity’s own equity instruments do not include instruments that are themselves contracts for the future receipt or delivery of the entity’s own equity instruments.
Financial statements
A complete set of financial statements comprises:
(a) a statement of financial position as at the end of the period;
(b) a statement of profit or loss and other comprehensive income for the period;
(c) a statement of changes in equity for the period;
(d) a statement of cash flows for the period;
(e) notes, comprising a summary of significant accounting policies and other explanatory information;
(f) comparative information in respect of the preceding period as specified in paragraphs 38 of AASB 101 Presentation of Financial Statements; and
(g) a statement of financial position as at the beginning of the preceding period when an entity applies an accounting policy retrospectively or makes a retrospective restatement of items in its financial statements, or when it reclassifies items in its financial statements in accordance with paragraphs 41 of AASB 101.
General government sector
The general government sector comprises all government departments, offices and other bodies engaged in providing services free of charge or at prices significantly below their cost of production. General government services include those which are mainly non-market in nature, those which are largely for collective consumption by the community and those which involve the transfer or redistribution of income. These services are financed mainly through taxes, or other compulsory levies and user charges.
Grants for on-passing
All grants paid to one institutional sector (e.g. a State general government entity) to be passed on to another institutional sector (e.g. local government or a private non-profit institution).
Infrastructure systems
Infrastructure systems provide essential services used in the delivery of final services or products. They are generally a complex interconnected network of individual assets and mainly include sewerage systems, water storage and supply systems, ports, utilities and public transport assets owned by the State.
Intangible produced assets
Refer to produced assets in this glossary.
Interest expense
Costs incurred in connection with the borrowing of funds includes interest on bank overdrafts and short-term and long-term borrowings, amortisation of discounts or premiums relating to borrowings, interest component of finance leases repayments, and the increase in financial liabilities and non-employee provisions due to the unwinding of discounts to reflect the passage of time.
Interest income
Net result from transactions/net operating balance
Net result from transactions or net operating balance is a key fiscal aggregate and is income from transactions minus expenses from transactions. It is a summary measure of the ongoing sustainability of operations. It excludes gains and losses resulting from changes in price levels and other changes in the volume of assets. It is the component of the change in net worth that is due to transactions and can be attributed directly to government policies.

94
AN
NU
AL
RE
PO
RT
2014
—15
Net worth
Assets less liabilities, which is an economic measure of wealth.
Non-financial assets
Non-financial assets are all assets that are not ‘financial assets’. It includes inventories, land, buildings, infrastructure, road networks, land under roads, plant and equipment, investment properties, cultural and heritage assets, intangible and biological assets.
Other economic flows included in net result
Other economic flows included in net result are changes in the volume or value of an asset or liability that do not result from transactions. It includes:
• gains and losses from disposals, revaluations and impairments of non-financial physical and intangible assets;
• fair value changes of financial instruments and agricultural assets; and
• depletion of natural assets (non-produced) from their use or removal.
Other economic flows – other comprehensive income
Other economic flows – other comprehensive income comprises items (including reclassification adjustments) that are not recognised in net result as required or permitted by other Australian Accounting Standards.
The components of other economic flows – other comprehensive income include:
(a) changes in physical asset revaluation surplus;
(b) share of net movement in revaluation surplus of associates and joint ventures; and
(c) gains and losses on remeasuring available-for-sale financial assets.
Payables
Includes short and long term trade debt and accounts payable, grants, taxes and interest payable.
Public financial corporation sector
Public financial corporations are bodies primarily engaged in the provision of financial intermediation services or auxiliary financial services. They are able to incur financial liabilities on their own account (e.g. taking deposits, issuing securities or providing insurance services). Estimates are not published for the public financial corporation sector.
Public non-financial corporation sector
The public non-financial corporation (PNFC) sector comprises bodies mainly engaged in the production of goods and services (of a non-financial nature) for sale in the market place at prices that aim to recover most of the costs involved (e.g. water and port authorities). In general, PNFCs are legally distinguishable from the governments which own them.
Receivables
Includes amounts owing from government through appropriation receivable, short and long term trade credit and accounts receivable, accrued investment income, grants, taxes and interest receivable.
Sales of goods and services
Refers to income from the direct provision of goods and services and includes fees and charges for services rendered, sales of goods and services, fees from regulatory services and work done as an agent for private enterprises. It also includes rental income under operating leases and on produced assets such as buildings and entertainment, but excludes rent income from the use of non-produced assets such as land. User charges includes sale of goods and services income.
Supplies and services
Supplies and services generally represent cost of goods sold and the day-to-day running costs, including maintenance costs, incurred in the normal operations of the VBA.
95
VIC
TOR
IAN
BU
ILD
ING
AU
THO
RIT
Y
FINANCIAL STATEMENTS
5
Taxation income
Taxation income represents income received from the State’s taxpayers and includes:
• payroll tax, land tax and duties levied principally on conveyances and land transfers;
• gambling taxes levied mainly on private lotteries, electronic gaming machines, casino operations and racing;
• insurance duty relating to compulsory third party, life and non-life policies;
• insurance company contributions to fire brigades;
• motor vehicle taxes, including registration fees and duty on registrations and transfers;
• levies (including the environmental levy) on statutory corporations in other sectors of government; and
• other taxes, including landfill levies, licence and concession fees.
Transactions
Transactions are those economic flows that are considered to arise as a result of policy decisions, usually an interaction between two entities by mutual agreement. They also include flows in an entity such as depreciation where the owner is simultaneously acting as the owner of the depreciating asset and as the consumer of the service provided by the asset. Taxation is regarded as mutually agreed interactions between the government and taxpayers. Transactions can be in kind (e.g. assets provided/given free of charge or for nominal consideration) or where the final consideration is cash. In simple terms, transactions arise from the policy decisions of the government.
Style conventions
Figures in the tables and in the text have been rounded. Discrepancies in tables between totals and sums of components reflect rounding. Percentage variations in all tables are based on the underlying unrounded amounts.
The notation used in the tables is as follows:
zero, or rounded to zero
(xxx.x) negative numbers
200x year period
200x-0x year period
The financial statements and notes are presented based on the illustration for a government department in the 2013-14 Model Report for Victorian Government Departments. The presentation of other disclosures is generally consistent with the other disclosures made in earlier publications of the VBA’s annual reports.

96
AN
NU
AL
RE
PO
RT
2014
—15
THE FOLLOWING INFORMATION
PROVIDES AN OVERVIEW
INTO THE ON-GOING REGULATION
OF VICTORIA’S BUILDING AND PLUMBING
INDUSTRIES AND PRACTITIONERS.

97
VIC
TOR
IAN
BU
ILD
ING
AU
THO
RIT
Y
CONTENTS
7
REPORT OF OPERATIONS
1
GOVERNANCE AND ORGANISATIONAL
STRUCTURE
2
WORKFORCE DATA
3
OTHER DISCLOSURES
4
FINANCIAL STATEMENTS
5
APPENDICES
6
ABBREVIATIONS
6APPENDICES
1. BAB AND BPB FIVE-YEAR REGULATORY INFORMATION
The following information provides an overview into the operations of the Building Appeals Board (BAB) and Building Practitioners Board (BPB).
Building Appeals Board
2014—15 2013—14 2012—13 2011—12 2010—11
BAB performance
BAB modifications heard
1,913 1,094 1,311 1,319 1,548
BAB appeals and disputes heard
207 331 331 337 295
Building Practitioners Board
2014—15 2013—14 2012—13 2011—12 2010—11
BPB inquiry outcomes (number and value)
BPB inquiries completed
83 53 100 99 89
BPB inquiries and conduct reviews
94 61 197 141 na
Conduct review meetings
11 8 25 42 23
Case proven 82 52 98 100 96
Dismissed 1 1 2 0 4
Registrations suspended
17 5 11 13 9
Registrations cancelled
4 0 15 9 4
Fines 50 38 71 78 52
Fines ($ value) $190,914 $173,383 $370,635 $207,750 $133,766
Visit vba.vic.gov.au/data for more information about the VBA and its predecessor organisations’ current and past regulatory activity.

98
AN
NU
AL
RE
PO
RT
2014
—15
2. BAB, BPB, BAC, PAC AND BRAC REPORTING
The VBA supports the work of a number of Minister for Planning appointed boards, councils and a committee.
These boards, councils and committee are independent statutory bodies, with funding and resources provided by the VBA or DELWP. These bodies do not have their own reports of operation and their members’ attendance is reported on by the VBA and online at publicboards.vic.gov.au by the Victorian Public Sector Commissioner.
Building Appeals Board
The Building Appeals Board (BAB) is an independent statutory body established under section 166 of the Building Act 1993 (Vic), has jurisdiction on building matters and is responsible for determining appeals, disputes and requests for modifications (a decision that a provision in the Building Regulations 2006 (Vic) does not apply to a particular building) as well as compliance applications. The BAB also plays a role as the review body under Part 14 of the Residential Tenancies Act 1997 (Vic). The BAB is supported by the VBA and members are appointed on the Minister for Planning’s recommendation.
Meeting attendance 2014—15
MEMBER NAME TERM OF APPOINTMENT ATTENDED SCHEDULED19
Gerard Coutts (Chair) 4 November 2012 to 30 June 2018 26 27
Sarah McDonald (Deputy Chair) 28 August 2012 to 30 June 2018 27 24
Michael Kerr 24 June 2014 to 30 June 2018 16 21
Emily Mudge 1 July 2013 to 30 June 2015 17 20
Dang Ho 24 June 2014 to 30 June 2018 22 23
Babu (Seshu) Akula 10 October 2012 to 30 June 2015 10 16
Graeme Addison 7 August 2012 to 30 June 2015 12 13
Ian Pridgeon 7 August 2012 to 30 June 2015 17 21
Aileen McFadzean 1 July 2013 to 30 June 2018 17 19
Elizabeth Coe 28 August 2012 to 30 June 2018 25 24
William Kong 7 August 2012 to 30 June 2018 23 23
Geoffrey Woolcock 1 July 2013 to 30 June 2018 21 22
Brett Davis 9 April 2013 to 9 April 2016 15 21
John Clampett 28 August 2012 to 30 June 2018 21 22
Leslie Schwarz 1 July 2013 to 30 June 2018 28 26
Warren Knight 28 August 2012 to 30 June 2018 32 34
Joe Zita 1 June 2013 to 30 June 2018 30 28
Rebecca Cameron 7 August 2012 to 30 June 2018 32 27
Bushy (Trevor) Miles 28 August 2012 to 30 June 2015 19 20
Peter Jolly 9 April 2013 to 9 April 2016 34 32
Bryan Thomas 1 July 2013 to 30 June 2018 26 34
William Patrick Irwin 16 September 2014 to 15 September 2018 17 18
Ashley Hansen 16 September 2014 to 15 September 2018 17 17
Hank Van Ravenstein 16 September 2014 to 15 September 2018 11 16
Brent Williams 16 September 2014 to 15 September 2018 12 15
Patrick Tony Enright 16 September 2014 to 15 September 2018 16 16
David Graham 16 September 2014 to 15 September 2018 12 14
Neil McPhee 16 September 2014 to 15 September 2018 10 1219
19 Members are only required to attend scheduled meetings and may be invited to attend additional meetings to cover absences.
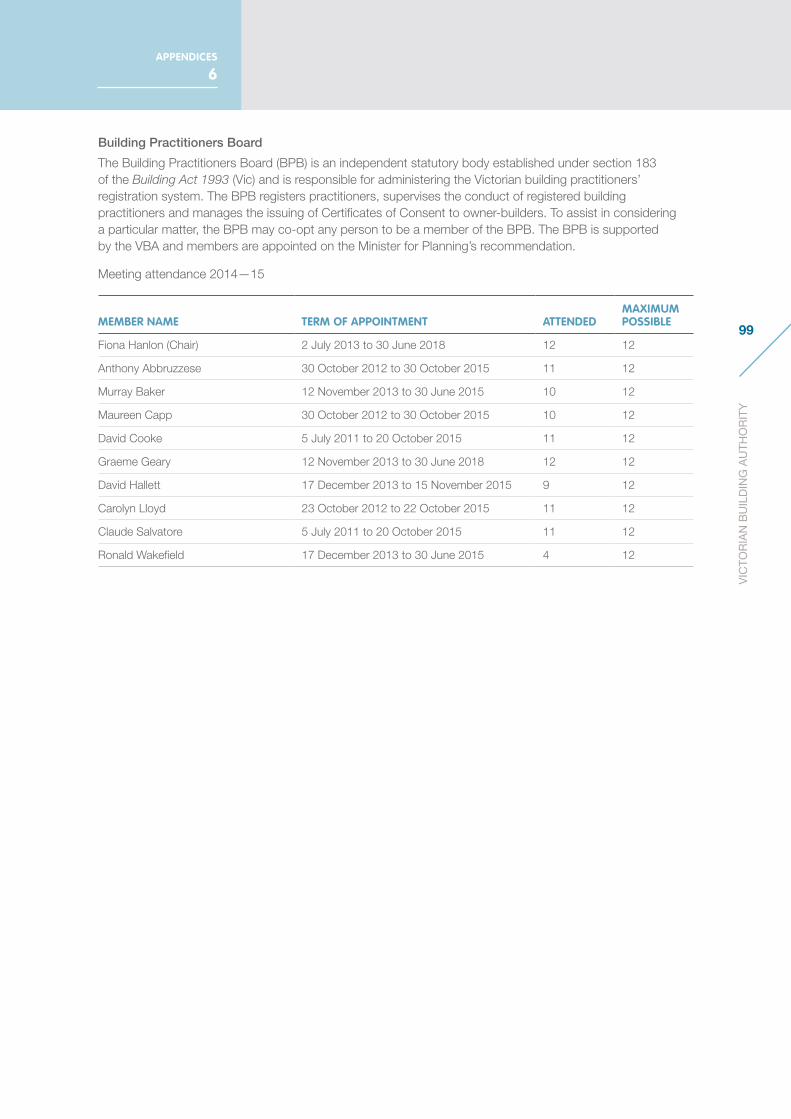
99
VIC
TOR
IAN
BU
ILD
ING
AU
THO
RIT
Y
APPENDICES
6
Building Practitioners Board
The Building Practitioners Board (BPB) is an independent statutory body established under section 183 of the Building Act 1993 (Vic) and is responsible for administering the Victorian building practitioners’ registration system. The BPB registers practitioners, supervises the conduct of registered building practitioners and manages the issuing of Certificates of Consent to owner-builders. To assist in considering a particular matter, the BPB may co-opt any person to be a member of the BPB. The BPB is supported by the VBA and members are appointed on the Minister for Planning’s recommendation.
Meeting attendance 2014—15
MEMBER NAME TERM OF APPOINTMENT ATTENDEDMAXIMUM POSSIBLE
Fiona Hanlon (Chair) 2 July 2013 to 30 June 2018 12 12
Anthony Abbruzzese 30 October 2012 to 30 October 2015 11 12
Murray Baker 12 November 2013 to 30 June 2015 10 12
Maureen Capp 30 October 2012 to 30 October 2015 10 12
David Cooke 5 July 2011 to 20 October 2015 11 12
Graeme Geary 12 November 2013 to 30 June 2018 12 12
David Hallett 17 December 2013 to 15 November 2015 9 12
Carolyn Lloyd 23 October 2012 to 22 October 2015 11 12
Claude Salvatore 5 July 2011 to 20 October 2015 11 12
Ronald Wakefield 17 December 2013 to 30 June 2015 4 12
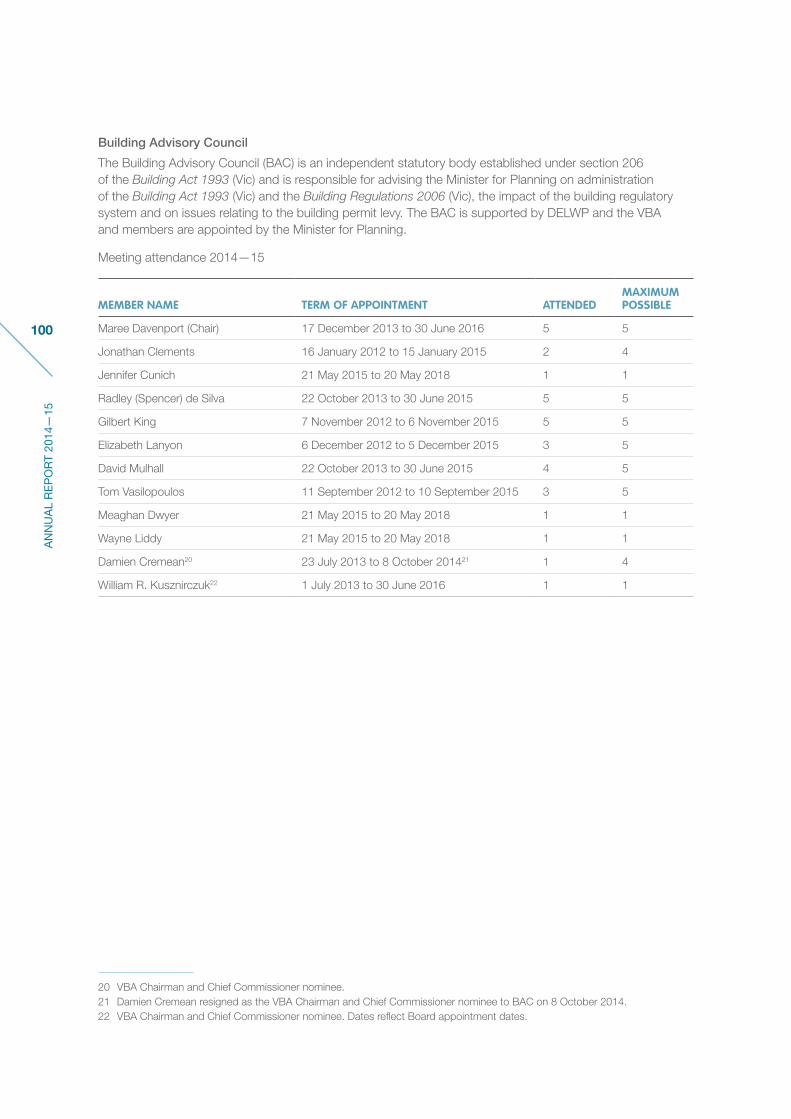
100
AN
NU
AL
RE
PO
RT
2014
—15
Building Advisory Council
The Building Advisory Council (BAC) is an independent statutory body established under section 206 of the Building Act 1993 (Vic) and is responsible for advising the Minister for Planning on administration of the Building Act 1993 (Vic) and the Building Regulations 2006 (Vic), the impact of the building regulatory system and on issues relating to the building permit levy. The BAC is supported by DELWP and the VBA and members are appointed by the Minister for Planning.
Meeting attendance 2014—15202122
MEMBER NAME TERM OF APPOINTMENT ATTENDEDMAXIMUM POSSIBLE
Maree Davenport (Chair) 17 December 2013 to 30 June 2016 5 5
Jonathan Clements 16 January 2012 to 15 January 2015 2 4
Jennifer Cunich 21 May 2015 to 20 May 2018 1 1
Radley (Spencer) de Silva 22 October 2013 to 30 June 2015 5 5
Gilbert King 7 November 2012 to 6 November 2015 5 5
Elizabeth Lanyon 6 December 2012 to 5 December 2015 3 5
David Mulhall 22 October 2013 to 30 June 2015 4 5
Tom Vasilopoulos 11 September 2012 to 10 September 2015 3 5
Meaghan Dwyer 21 May 2015 to 20 May 2018 1 1
Wayne Liddy 21 May 2015 to 20 May 2018 1 1
Damien Cremean20 23 July 2013 to 8 October 201421 1 4
William R. Kusznirczuk22 1 July 2013 to 30 June 2016 1 1
20 VBA Chairman and Chief Commissioner nominee.21 Damien Cremean resigned as the VBA Chairman and Chief Commissioner nominee to BAC on 8 October 2014.22 VBA Chairman and Chief Commissioner nominee. Dates reflect Board appointment dates.

101
VIC
TOR
IAN
BU
ILD
ING
AU
THO
RIT
Y
APPENDICES
6
Plumbing Advisory Council
The Plumbing Advisory Council (PAC) is an independent statutory body established under section 211A of the Building Act 1993 (Vic) and provides advice about the plumbing industry to the Minister for Planning and the VBA. The PAC is supported by DELWP and the VBA and members are appointed by the Minister for Planning.
Meeting attendance 2014—1523
MEMBER NAME TERM OF APPOINTMENT ATTENDEDMAXIMUM POSSIBLE
Kenneth Gardner (Chair) 6 September 2012 to 5 September 2015 4 4
Stephen Atherton 7 November 2012 to 6 November 2015 1 4
Sam Austin 22 October 2013 to 30 June 2015 3 4
Paul Bonsak 19 December 2012 to 18 December 2015 2 4
Carmel Coate 1 November 2012 to 31 October 2015 3 4
Brenden Day 1 November 2012 to 31 October 2015 3 4
Douglas McClusky 22 October 2013 to 30 June 2015 1 4
Patrick McCrudden 19 December 2012 to 18 December 2015 3 4
Sumit Oberoi 19 December 2013 to 30 June 2015 3 4
Earl Setches 22 October 2013 to 30 June 2015 2 4
Brian Welch23 20 February 2014 to 30 June 2016 0 4
Building Regulations Advisory Committee
The Building Regulations Advisory Committee (BRAC) is an independent statutory body established under section 209 of the Building Act 1993 (Vic) and is responsible for advising the Minister for Planning on draft building regulations and accrediting new building products, construction methods and components or systems connected with building work. The BRAC is supported by the VBA and members are appointed by the Minister for Planning.
Meeting attendance 2014—15 24
MEMBER NAME TERM OF APPOINTMENT ATTENDEDMAXIMUM POSSIBLE
David Bennett QC (Chair)24 23 July 2013 to 30 June 2016 3 3
Adam Dalrymple 20 July 2012 to 19 July 2015 1 3
Angela Jurjevic 18 September 2013 to 30 June 2016 2 3
Warren Knight 1 November 2012 to 19 September 2015 2 3
Sam (Sotirios) Loizou 8 March 2013 to 7 March 2016 3 3
Malcolm Macdonald 20 September 2012 to 19 September 2015 2 3
Marcus Marshall 18 September 2013 to 30 June 2016 1 3
Bryan Miller 8 March 2013 to 7 March 2016 1 3
John Prendergast 15 January 2014 to 30 June 2015 2 3
Robert Seiffert 20 September 2012 to 19 September 2015 2 3
Bronwyn Weir 1 November 2012 to 19 September 2015 2 3
23 VBA Chairman and Chief Commissioner nominee. Dates reflect Board appointment dates.24 VBA Chairman and Chief Commissioner nominee.

102
AN
NU
AL
RE
PO
RT
2014
—15
ABBREVIATIONS
7
ABBREVIATIONS
ABCB Australian Building Codes Board
AIBS Australian Institute of Building Surveyors
AM Medal of the Order of Australia
ARBV Architects Registration Board of Victoria
AS Australian Standard
BAB Building Appeals Board
BAC Building Advisory Council
BACV Building Advice and Conciliation Victoria
BPB Building Practitioners Board
BRAC Building Regulations Advisory Committee
CEO Chief Executive Officer
CFA Country Fire Authority
COAG Council of Australian Governments
DELWP Department of Environment, Land, Water and Planning
DWGs Designated work groups
EPA Environment Protection Authority
FTE Full-time equivalent
GSERP Government Sector Executive Remuneration Panel
GST Goods and Services Tax
HIA Housing Industry Association
IBAC Independent Broad-based Anti-corruption Commission
IRP Issue resolution procedure
MBAV Master Builders Association of Victoria
MFB Metropolitan Fire Brigade
na Not available
NCC National Construction Code
NOLS National Occupational Licensing System
NZS New Zealand Standard
OH&S Occupational health and safety
PAC Plumbing Advisory Council
PDF Portable document format
QC Queen's Counsel
SPASA Swimming Pool and Spa Association of Australia
VAGO Victorian Auditor-General's Office
VBA Victorian Building Authority
VCAT Victorian Civil and Administrative Tribunal
VIPP Victorian Industry Participation Policy
VMBSG Victorian Municipal Building Surveyors Group
VMIA Victorian Managed Insurance Authority

Victorian Building Authority
Online vba.vic.gov.au
Email [email protected]
Postal Address PO Box 536 Melbourne, Victoria 3001
Telephone 1300 815 127
Monday to Friday from 8:30am to 5:00pm
Goods Shed North 733 Bourke Street Docklands, Victoria 3008
For enquiries in languages other than English, contact the Translating and Interpreting Service on 131 450.
If you are deaf, or have a hearing or speech impairment, contact us through the National Relay Service. For more information, visit: relayservice.gov.au