annual report - ssga · annual report september 30, 2019 spdr® index shares funds beginning on...
TRANSCRIPT
Annual ReportSeptember 30, 2019
SPDR® Index Shares Funds
Beginning on January 1, 2021, as permitted by regulations adopted by the U.S. Securities and Exchange Commission, paper copies of aFund’s annual and semi- annual shareholder reports will no longer be sent by mail, unless you specifically request paper copies of thereports from the Fund (or from your financial intermediary, such as a broker-dealer or bank). Instead, the reports will be madeavailable on a Fund’s website (www.spdrs.com), and you will be notified by mail each time a report is posted, and provided with awebsite link to access the report. If you already elected to receive reports electronically, you will not be affected by this change andyou need not take any action. You may elect to receive shareholder reports and other communications by contacting your financialintermediary.
You may elect to receive all future reports in paper free of charge. If you invest through a financial intermediary, you can contact yourfinancial intermediary to request that you continue to receive paper copies of your shareholder reports. Your election to receivereports in paper will apply to all funds held in your account.
The information contained in this report is intended for the general information of shareholders of the Trust. This reportis not authorized for distribution to prospective investors unless preceded or accompanied by a current Trust prospectuswhich contains important information concerning the Trust. You may obtain a current prospectus and SAI from theDistributor by calling 1-866-787-2257 or visiting www.spdrs.com. Please read the prospectus carefully before you invest.


TA B L E O F C O N T E N T S
Notes to Performance Summaries (Unaudited) . . . . . . . . . . . . . . . . . . . . . . . . . . . . . . . . . . . . . . . . . . . . . . . . . . . . . . . 1
Management’s Discussion of Fund Performance, Performance Summaries & Portfolio Statistics (Unaudited)SPDR EURO STOXX Small Cap ETF (SMEZ). . . . . . . . . . . . . . . . . . . . . . . . . . . . . . . . . . . . . . . . . . . . . . . . . . . . . . . . . . 3SPDR MSCI ACWI Low Carbon Target ETF (LOWC) . . . . . . . . . . . . . . . . . . . . . . . . . . . . . . . . . . . . . . . . . . . . . . . . . . . 6SPDR Solactive Canada ETF (ZCAN). . . . . . . . . . . . . . . . . . . . . . . . . . . . . . . . . . . . . . . . . . . . . . . . . . . . . . . . . . . . . . . . 9SPDR MSCI EAFE Fossil Fuel Reserves Free ETF (EFAX) . . . . . . . . . . . . . . . . . . . . . . . . . . . . . . . . . . . . . . . . . . . . . . . 12SPDR MSCI EAFE StrategicFactors ETF (QEFA). . . . . . . . . . . . . . . . . . . . . . . . . . . . . . . . . . . . . . . . . . . . . . . . . . . . . . . 15SPDR MSCI Emerging Markets Fossil Fuel Reserves Free ETF (EEMX) . . . . . . . . . . . . . . . . . . . . . . . . . . . . . . . . . . . . 18SPDR MSCI Emerging Markets StrategicFactors ETF (QEMM). . . . . . . . . . . . . . . . . . . . . . . . . . . . . . . . . . . . . . . . . . . 21SPDR Solactive Germany ETF (ZDEU). . . . . . . . . . . . . . . . . . . . . . . . . . . . . . . . . . . . . . . . . . . . . . . . . . . . . . . . . . . . . . . 24SPDR Solactive Japan ETF (ZJPN). . . . . . . . . . . . . . . . . . . . . . . . . . . . . . . . . . . . . . . . . . . . . . . . . . . . . . . . . . . . . . . . . . 27SPDR Solactive United Kingdom ETF (ZGBR). . . . . . . . . . . . . . . . . . . . . . . . . . . . . . . . . . . . . . . . . . . . . . . . . . . . . . . . . 30SPDR MSCI World StrategicFactors ETF (QWLD) . . . . . . . . . . . . . . . . . . . . . . . . . . . . . . . . . . . . . . . . . . . . . . . . . . . . . 33SPDR S&P Emerging Asia Pacific ETF (GMF) . . . . . . . . . . . . . . . . . . . . . . . . . . . . . . . . . . . . . . . . . . . . . . . . . . . . . . . . . 36SPDR S&P Global Dividend ETF (WDIV) . . . . . . . . . . . . . . . . . . . . . . . . . . . . . . . . . . . . . . . . . . . . . . . . . . . . . . . . . . . . . 40SPDR S&P Global Infrastructure ETF (GII). . . . . . . . . . . . . . . . . . . . . . . . . . . . . . . . . . . . . . . . . . . . . . . . . . . . . . . . . . . . 43SPDR Solactive Hong Kong ETF (ZHOK) . . . . . . . . . . . . . . . . . . . . . . . . . . . . . . . . . . . . . . . . . . . . . . . . . . . . . . . . . . . . 46
Schedules of InvestmentsSPDR EURO STOXX Small Cap ETF (SMEZ). . . . . . . . . . . . . . . . . . . . . . . . . . . . . . . . . . . . . . . . . . . . . . . . . . . . . . . . . . 49SPDR MSCI ACWI Low Carbon Target ETF (LOWC) (Summary) . . . . . . . . . . . . . . . . . . . . . . . . . . . . . . . . . . . . . . . . . . 52SPDR Solactive Canada ETF (ZCAN). . . . . . . . . . . . . . . . . . . . . . . . . . . . . . . . . . . . . . . . . . . . . . . . . . . . . . . . . . . . . . . . 56SPDR MSCI EAFE Fossil Fuel Reserves Free ETF (EFAX) . . . . . . . . . . . . . . . . . . . . . . . . . . . . . . . . . . . . . . . . . . . . . . . 59SPDR MSCI EAFE StrategicFactors ETF (QEFA). . . . . . . . . . . . . . . . . . . . . . . . . . . . . . . . . . . . . . . . . . . . . . . . . . . . . . . 70SPDR MSCI Emerging Markets Fossil Fuel Reserves Free ETF (EEMX) . . . . . . . . . . . . . . . . . . . . . . . . . . . . . . . . . . . . 78SPDR MSCI Emerging Markets StrategicFactors ETF (QEMM) (Summary) . . . . . . . . . . . . . . . . . . . . . . . . . . . . . . . . . 86SPDR Solactive Germany ETF (ZDEU). . . . . . . . . . . . . . . . . . . . . . . . . . . . . . . . . . . . . . . . . . . . . . . . . . . . . . . . . . . . . . . 90SPDR Solactive Japan ETF (ZJPN). . . . . . . . . . . . . . . . . . . . . . . . . . . . . . . . . . . . . . . . . . . . . . . . . . . . . . . . . . . . . . . . . . 92SPDR Solactive United Kingdom ETF (ZGBR). . . . . . . . . . . . . . . . . . . . . . . . . . . . . . . . . . . . . . . . . . . . . . . . . . . . . . . . . 98SPDR MSCI World StrategicFactors ETF (QWLD) (Summary) . . . . . . . . . . . . . . . . . . . . . . . . . . . . . . . . . . . . . . . . . . . . 101SPDR S&P Emerging Asia Pacific ETF (GMF) . . . . . . . . . . . . . . . . . . . . . . . . . . . . . . . . . . . . . . . . . . . . . . . . . . . . . . . . . 104SPDR S&P Global Dividend ETF (WDIV) . . . . . . . . . . . . . . . . . . . . . . . . . . . . . . . . . . . . . . . . . . . . . . . . . . . . . . . . . . . . . 126SPDR S&P Global Infrastructure ETF (GII). . . . . . . . . . . . . . . . . . . . . . . . . . . . . . . . . . . . . . . . . . . . . . . . . . . . . . . . . . . . 129SPDR Solactive Hong Kong ETF (ZHOK) . . . . . . . . . . . . . . . . . . . . . . . . . . . . . . . . . . . . . . . . . . . . . . . . . . . . . . . . . . . . 132
Financial Statements . . . . . . . . . . . . . . . . . . . . . . . . . . . . . . . . . . . . . . . . . . . . . . . . . . . . . . . . . . . . . . . . . . . . . . . . . . . . . 134Financial Highlights . . . . . . . . . . . . . . . . . . . . . . . . . . . . . . . . . . . . . . . . . . . . . . . . . . . . . . . . . . . . . . . . . . . . . . . . . . . . . . 148Notes to Financial Statements . . . . . . . . . . . . . . . . . . . . . . . . . . . . . . . . . . . . . . . . . . . . . . . . . . . . . . . . . . . . . . . . . . . . 163Report of Independent Registered Public Accounting Firm . . . . . . . . . . . . . . . . . . . . . . . . . . . . . . . . . . . . . . . . . . . . 174Other Information (Unaudited). . . . . . . . . . . . . . . . . . . . . . . . . . . . . . . . . . . . . . . . . . . . . . . . . . . . . . . . . . . . . . . . . . . . . 176
The information contained in this report is intended for the general information of shareholders of the Trust. This reportis not authorized for distribution to prospective investors unless preceded or accompanied by a current Trust prospectuswhich contains important information concerning the Trust. You may obtain a current prospectus and SAI from theDistributor by calling 1-866-787-2257 or visiting www.spdrs.com. Please read the prospectus carefully before you invest.

[This Page Intentionally Left Blank]
N O T E S T O P E R F O R M A N C E S U M M A R I E S ( U N A U D I T E D )
The performance chart of a Fund’s total return at net asset value (“NAV”), the total return based on market price and itsbenchmark index is provided for comparative purposes only and represents the periods noted. A Fund’s per share NAV isthe value of one share of a Fund and is calculated by dividing the value of total assets less total liabilities by the number ofshares outstanding. The NAV return is based on the NAV of a Fund and the market return is based on the market price pershare of a Fund. The market price used to calculate the market return is determined by using the midpoint between thehighest bid and the lowest offer on the exchange on which the shares of a Fund are listed for trading, as of the time thata Fund’s NAV is calculated. NAV and market returns assume that dividends and capital gain distributions have beenreinvested in a Fund at NAV. Market returns do not include brokerage commissions that may be payable on secondarymarket transactions. If brokerage commissions were included market returns would be lower.
An index is a statistical measure of a specified financial market or sector. An index does not actually hold a portfolio ofsecurities and therefore does not reflect deductions for fees or expenses. In comparison, a Fund’s performance isnegatively impacted by these deductions. Index returns reflect all items of income, gain and loss and the reinvestment ofdividends and other income.
The EURO STOXX® Small Index is designed to provide a representation of small companies across the Eurozone. TheEurozone consists of European Union countries that have adopted the Euro as their currency. The Index consists of theEurozone stocks included in the STOXX® Europe Small 200 Index.
The MSCI ACWI Low Carbon Target Index is designed to address two dimensions of carbon exposure - carbon emissionsand fossil fuel reserves, expressed as potential emissions. By overweighting companies with low carbon emissions (relativeto sales) and those with low potential carbon emissions (per dollar of market capitalization), the Index reflects a lowercarbon exposure than that of the broad market. The Index is designed to achieve a target level of tracking relative to abroad market index (such as the Parent Index) while minimizing the carbon exposure. The Index is a subset of the MSCIACWI Index (the �Parent Index�), which measures the combined equity market performance of developed and emergingmarket countries.
The Solactive GBS Canada Large & Mid Cap USD Index NTR is a free float-adjusted market capitalization index that isdesigned to measure the equity market performance of large- and mid-cap companies in Canada. Securities eligible forinclusion in the Index include common stock, preferred stock, real estate investment trusts (�REITs�) and depositary receipts.
The MSCI EAFE (Europe, Australasia, Far East) ex Fossil Fuels Index is designed to measure the performance of companiesin the MSCI EAFE Index that are �fossil fuel reserves free,� which are defined as companies that do not own fossil fuelreserves. For purposes of the composition of the Index, fossil fuel reserves are defined as proved and probable coal, oil ornatural gas reserves used for energy purposes, but do not include metallurgical or coking coal, which is primarily used inconnection with steel production. The Index is a subset of the MSCI EAFE Index (the �Parent Index�), which serves as theinitial universe of eligible securities for the Index. The Parent Index captures large and mid-capitalization representationacross developed market Europe, Australasia, and Far East (�EAFE�) countries, excluding the United States and Canada.
The MSCI EAFE Factor Mix A-Series Index captures large- and mid-cap representation across 21 developed market EAFEcountries and aims to represent the performance of value, low volatility, and quality factor strategies. The Index is an equalweighted combination of the following three MSCI Factor Indices in a single composite index: the MSCI EAFE ValueWeighted Index, the MSCI EAFE Minimum Volatility Index, and the MSCI EAFE Quality Index.
The MSCI Emerging Markets ex Fossil Fuels Index is designed to measure the performance of companies in the MSCIEmerging Markets Index that are �fossil fuel reserves free,� which are defined as companies that do not own fossil fuelreserves. For purposes of the composition of the Index, fossil fuel reserves are defined as proved and probable coal, oil ornatural gas reserves used for energy purposes, but do not include metallurgical or coking coal, which is primarily used inconnection with steel production. The Index is a subset of the MSCI Emerging Markets Index (the �Parent Index�), whichserves as the initial universe of eligible securities for the Index. The Parent Index captures large and mid-capitalizationrepresentation across 23 emerging market countries.
The MSCI Emerging Markets (EM) Factor Mix A-Series Index captures large- and mid-cap representation across 24emerging markets countries and aims to represent the performance of value, low volatility, and quality factor strategies.The Index is an equal weighted combination of the following three MSCI Factor Indices in a single composite index: theMSCI EM Value Weighted Index, the MSCI EM Minimum Volatility Index, and the MSCI EM Quality Index.
The Solactive GBS Germany Large & Mid Cap USD Index NTR is a free float-adjusted market capitalization index that isdesigned to measure the equity market performance of large- and mid-cap companies in Germany. Securities eligible forinclusion in the Index include common stock, preferred stock, REITs and depositary receipts.
See accompanying notes to financial statements.1
The Solactive GBS Japan Large & Mid Cap USD Index NTR is a free float-adjusted market capitalization index that isdesigned to measure the equity market performance of large- and mid-cap companies in Japan. Securities eligible forinclusion in the Index include common stock, preferred stock, REITs and depositary receipts.
The Solactive GBS United Kingdom Large & Mid Cap USD Index NTR is a free float-adjusted market capitalization indexthat is designed to measure the equity market performance of large- and mid-cap companies in the United Kingdom.Securities eligible for inclusion in the Index include common stock, preferred stock, REITs and depositary receipts.
The MSCI World Factor Mix A-Series Index captures large-and mid-cap representation across 23 developed countries andaims to represent the performance of value, low volatility, and quality factor strategies. The Index is an equal weightedcombination of the following three MSCI Factor Indices in a single composite index: the MSCI World Value WeightedIndex, the MSCI World Minimum Volatility Index, and the MSCI World Quality Index.
The S&P® Asia Pacific Emerging BMI Index is a market capitalization weighted index designed to define and measure theinvestable universe of publicly traded companies domiciled in emerging Asian Pacific markets. The Index componentsecurities are a subset, based on region, of component securities included in the S&P Global BMI (Broad Market Index). TheS&P Global BMI is a comprehensive, float-weighted, rules-based benchmark that is readily divisible and customizable. Acountry will be eligible for inclusion in the S&P Global BMI if it is classified as either a developed or emerging market by theS&P Global Equity Index Committee. The Index is “float-adjusted,” meaning that only those shares publicly available toinvestors are included in the Index calculation.
The S&P Global Dividend Aristocrats Index is designed to measure the performance of high dividend-yield companiesincluded in the S&P Global BMI (Broad Market Index) that have followed a managed-dividends policy of increasing orstable dividends for at least ten consecutive years. To be included in the Index, stocks must meet the following criteria: (i)increased dividends or maintained stable dividends every year for at least ten consecutive years; (ii) a float-adjusted marketcapitalization greater than $1 billion as of the last business day of December (the �Rebalancing Reference Date�); (iii) athree-month average daily value traded greater than $5 million prior to the Rebalancing Reference Date; (iv) newconstituents must have a maximum 100% dividend payout ratio and current constituents must have a non-negativedividend payout ratio; and (v) a maximum indicated dividend yield of 10% as of the Rebalancing Reference Date.
The S&P Global Infrastructure Index is comprised of 75 of the largest publicly listed infrastructure companies that meetspecific investability requirements. The Index is designed to provide liquid exposure to the leading publicly listedcompanies in the global infrastructure industry, from both developed markets and emerging markets. The Index includespublicly traded companies with stock traded on a developed market exchange with float-adjusted market capitalizationsof a minimum of $100 million and minimum total market capitalizations of $250 million. Stocks must satisfy liquiditythresholds on 3 month average daily value trading of $1 million for developed markets and $500,000 for emerging markets.Fifteen emerging market stocks are chosen first, based on the highest float-adjusted market capitalization of the parentcompany, with no more than 10 chosen from each of the three subsets of infrastructure companies represented in the Index(i.e., transportation, utilities and energy infrastructure). The 60 largest developed market stocks, based on floatadjustedmarket capitalization, are then chosen to complete the index. The developed market stocks are chosen such that there area total of 30 transportation, 30 utilities and 15 energy infrastructure companies in the Index.
The Solactive GBS Hong Kong Large & Mid Cap USD Index NTR is a free float-adjusted market capitalization index that isdesigned to measure the equity market performance of large- and mid-cap companies in Hong Kong. A company’s freefloat-adjusted market capitalization is calculated by multiplying the number of shares readily available in the market by theprice of such shares. Companies with a larger free float-adjusted market capitalization make up a proportionally largerportion of the Index. The initial universe of securities eligible for inclusion in the Index include common stock, preferredstock, REITs and depositary receipts�.
See accompanying notes to financial statements.2

S P D R E U R O S T O X X S M A L L C A P E T FMANAGEMENT’S DISCUSSION OF FUND PERFORMANCE (UNAUDITED)
The SPDR EURO STOXX Small Cap ETF (the “Fund”) seeks to provide investment results that, before fees and expenses,correspond generally to the total return performance of an index that tracks the performance of small capitalizationEurozone equity securities. The Fund’s benchmark is the EURO STOXX Small Index (the “Index”).
For the 12-month period ended September 31, 2019 (the “Reporting Period”), the total return for the Fund was –2.59%,and the Index was –2.50%. The Fund and Index returns reflect the reinvestment of dividends and other income. The Fund’sperformance reflects the expenses of managing the Fund, including brokerage and advisory expenses. The Index isunmanaged and Index returns do not reflect fees and expenses of any kind, which would have a negative impact on returns.Fees and expenses and the cumulative effect of security misweights contributed to the difference between the Fund’sperformance and that of the Index.
In the fourth quarter of 2018, signs of sluggish growth weighed across continental Europe which led to a change incommentary from the European Central Bank. Mario Draghi (President of the ECB) acknowledged the “loss of growth inmomentum” and in December effectively ended its quantitative easing program even as Draghi noted that incoming datahad been weaker than expected and referenced geopolitical factors, protectionism and financial market volatility as keyrisks. The Fund declined 13.09% for the quarter. The first quarter of 2019 European equity markets rose as many of thesupportive trends applicable to risk sentiment globally also benefited European shares. The ECB acknowledged theforecast for slower growth conditions in Europe and the flexibility to use a variety of tools to stimulate sustained inflationreinforced market confidence in central bank support. The Fund increased 9.27% for the quarter. The second quarter of2019 was helped by the ECB President Mario Draghi’s comments that the bank was prepared to provide further monetarypolicy support. In the middle of the quarter the ECB reiterated that interest rates should remain at current levels throughthe end of the year. The Fund increased 5.84% for the quarter. The third quarter of 2019 was hurt by weakening currencies,weak economic data, and a warning from the ECB that stronger policies would likely be needed to help support growth.These factors led the Fund to decrease 3.08%.
The Fund did not invest in derivatives during the Reporting Period.
On an individual security level, the top positive contributors to the Fund’s performance during the Reporting Period werearGEN-X SE, ASM International N.V., and Altran Technologies SA. The top negative contributors to the Fund’s performanceduring the Reporting Period were ANDRITZ AG, Fuchs Petrolub SE Pref, and AIB Group PLC.
The views expressed above reflect those of the Fund’s portfolio manager only through the Reporting Period, and do notnecessarily represent the views of the Adviser as a whole. Any such views are subject to change at any time based uponmarket or other conditions and the Adviser disclaims any responsibility to update such views. These views may not be reliedon as investment advice and, because investment decisions for a fund are based on numerous factors, may not be reliedon as an indication of trading intent on behalf of any fund.
See accompanying notes to financial statements.3

S P D R E U R O S T O X X S M A L L C A P E T FPERFORMANCE SUMMARY (UNAUDITED)
Performance as of September 30, 2019
Cumulative Total Return Average Annual Total Return
NetAssetValue
MarketValue
EURO STOXX SmallIndex
NetAssetValue
MarketValue
EURO STOXX SmallIndex
ONE YEAR –2.59% –2.39% –2.50% –2.59% –2.39% –2.50%
FIVE YEARS 24.88% 24.91% 25.42% 4.54% 4.55% 4.63%
SINCE INCEPTION(1) 5.62% 5.37% 6.48% 1.03% 0.99% 1.19%
(1) For the period June 4, 2014 to September 30, 2019. Since shares of the Fund did not trade in the secondary market until the day after the Fund’s inception,for the period from inception to the first day of secondary market trading in shares of the Fund (6/4/14, 6/5/14, respectively), the NAV of the Fund is used as aproxy for the secondary market trading price to calculate market returns.
Comparison of Change in Value of a $10,000 Investment(Based on Net Asset Value)
SPDR EURO STOXX Small CapETF (a)
Euro Stoxx Small Index (b)
$7,000
$8,000
$9,000
$10,000
$11,000
$12,000
9/3
0/14
3/3
1/15
9/3
0/15
3/3
1/16
9/3
0/16
3/3
1/17
9/3
0/17
3/3
1/18
9/3
0/18
3/3
1/19
6
/3/1
4
9/3
0/19
$10,648(b)$10,562(a)
Line graph is based on cumulative total return.
The total expense ratio for SPDR EURO STOXX Small Cap ETF as stated in the Fees and Expenses table of themost recent prospectus is 0.45%.
Performance quoted represents past performance, which is no guarantee of future results. Investment returnand principal value will fluctuate, so you may have a gain or loss when shares are sold. Current performancemay be higher or lower than that quoted. Visit www.spdrs.com for most recent month-end performance. Thereturns do not reflect the deduction of taxes that a shareholder would pay on Fund distributions or on theredemption or sale of Fund shares. See �Notes to Performance Summaries� on page 1 for more information.
See accompanying notes to financial statements.4

S P D R E U R O S T O X X S M A L L C A P E T FPORTFOLIO STATIST ICS (UNAUDITED)
Top Ten Holdings as of September 30, 2019
Description % of Net Assets
ASM International NV 1.5%Euronext NV 1.5Recordati SpA 1.5Kesko Oyj Class B 1.5OSRAM Licht AG 1.5Amundi SA 1.4Carl Zeiss Meditec AG 1.4Jeronimo Martins SGPS SA 1.4Orion Oyj Class B 1.3IMCD NV 1.3
TOTAL 14.3%
(The ten largest holdings are subject to change, and there are no guarantees the Fund will continue to remain invested inany particular company.)
Sector Breakdown as of September 30, 2019
% of Net Assets
Industrials 19.1%Financials 15.5Health Care 11.4Communication Services 9.5Real Estate 8.9Information Technology 8.3Consumer Staples 8.1Consumer Discretionary 5.7Utilities 5.3Materials 4.9Energy 3.0Short-Term Investments 2.6Liabilities in Excess of Other Assets (2.3)
TOTAL 100.0%
(The Fund’s sector breakdown is expressed as a percentage of net assets and may change over time.)
See accompanying notes to financial statements.5
S P D R M S C I A C W I L O W C A R B O N TA R G E T E T FMANAGEMENT’S DISCUSSION OF FUND PERFORMANCE (UNAUDITED)
The SPDR MSCI ACWI Low Carbon Target ETF (the “Fund”) seeks to provide investment results that, before fees andexpenses, correspond generally to the total return performance of an index that tracks securities of publicly-tradedcompanies in developed and emerging markets while seeking to minimize carbon exposure. The Fund’s benchmark is theMSCI ACWI Low Carbon Target Index (the “Index”).
For the 12-month period ended September 30, 2019 (the “Reporting Period”), the total return for the Fund was 2.25%, andthe Index was 2.15%. The Fund and Index returns reflect the reinvestment of dividends and other income. The Fund’sperformance reflects the expenses of managing the Fund, including brokerage and advisory expenses. The Index isunmanaged and Index returns do not reflect fees and expenses of any kind, which would have a negative impact on returns.Tax withholding and compounding contributed to the difference between the Fund’s performance and that of the Index.
The reporting period kicked off with a thud, as the Fund returned double digit negative percentage points in the 4thquarter of 2018. US equities exhibited their worst quarterly performance since 2011 when the market was facing debtceiling negotiations and a credit rating downgrade from Standard & Poor’s. Although volatility prevailed during the entiretyof the quarter, October and December were particularly vicious. Equity markets in Asia-Pacific & Europe were not immuneto the risk aversion that permeated global capital markets, as a host of factors relating to rising interest rates and botheconomic growth as well as trade concerns had international markets reeling as well. The first quarter of 2019 exhibited asharp snap back in Fund performance and after a vigorous rally, many markets were within spitting distance of the highsnotched during the summer and fall of 2018. The concomitant effect of lowered growth expectations was a globalabout-face on the part of central banks and a reason to shift away from their tilt toward tighter monetary policy. That shift,together with skeptical sentiment, less-than-aggressive positioning, and economic data that was sufficiently mixed to wardoff immediate recession fears, allowed many equity and commodity markets to print double digit advances during the firstquarter of 2019. The momentum continued into the 2nd, during which the Fund posted a positive return once again. Aprilmarked another solid month for growth assets as investors embraced optimism about trade policy between theUnited States and China, and earnings results continued to outpace analyst estimates. But as quick as the monthly calendarturned, investors were met with increasingly uncomfortable developments. On the very first day of May, Federal Reserve(Fed) Chair Jerome Powell pushed back on market expectations for interest rate cuts by suggesting that recent low levelsof inflation were likely transitory. However in June, another wave of central bank accommodation was the proximate sourceof the upward moves in global markets, with both the European Central Bank and the Fed indicating that further policytools and interest rate cuts would be used to support economic growth. Oil prices fell into a bear market during May’strade-induced weakness, but then recovered to finish the quarter just below levels prevailing at the start of the quarter. Thethird quarter 2019 was marked by volatility in which the Fund was able to just eek out a small marginally positive return.
The Fund did not invest in derivatives during the Reporting Period.
On an individual security level, the top positive contributors to the Fund’s performance during the Reporting Period wereMicrosoft Corporation, Procter & Gamble Company, and Nestle S.A. The top negative contributors to the Fund’sperformance during the Reporting Period were Schlumberger NV, Amazon.com, Inc., and Barrick Gold Corporation.
The views expressed above reflect those of the Fund’s portfolio manager only through the Reporting Period, and do notnecessarily represent the views of the Adviser as a whole. Any such views are subject to change at any time based uponmarket or other conditions and the Adviser disclaims any responsibility to update such views. These views may not be reliedon as investment advice and, because investment decisions for a fund are based on numerous factors, may not be reliedon as an indication of trading intent on behalf of any fund.
See accompanying notes to financial statements.6

S P D R M S C I A C W I L O W C A R B O N TA R G E T E T FPERFORMANCE SUMMARY (UNAUDITED)
Performance as of September 30, 2019
Cumulative Total Return Average Annual Total Return
NetAssetValue
MarketValue
MSCI ACWI LowCarbon Target
Index
NetAssetValue
MarketValue
MSCI ACWI LowCarbon Target
Index
ONE YEAR 2.25% 2.64% 2.15% 2.25% 2.64% 2.15%
SINCE INCEPTION(1) 36.04% 36.18% 34.63% 6.55% 6.58% 6.33%
(1) For the period November 25, 2014 to September 30, 2019. Since shares of the Fund did not trade in the secondary market until the day after the Fund’sinception, for the period from inception to the first day of secondary market trading in shares of the Fund (11/25/14, 11/26/14, respectively), the NAV of theFund is used as a proxy for the secondary market trading price to calculate market returns.
Comparison of Change in Value of a $10,000 Investment(Based on Net Asset Value)
SPDR MSCI ACWI Low CarbonTarget ETF (a)
MSCI ACWI Low Carbon TargetIndex (b)
$8,000
$9,000
$10,000
$11,000
$12,000
$13,000
3/3
1/15
9/3
0/15
3/3
1/16
9/3
0/16
3/3
1/17
9/3
0/17
3/3
1/18
9/3
0/18
3/3
1/19
11/2
5/14
9/3
0/19
$13,604(a)$13,463(b)
Line graph is based on cumulative total return.The total expense ratio for SPDR MSCI ACWI Low Carbon Target ETF as stated in the Fees and Expenses table of the most recent prospectus is 0.30% (0.20% afterfee waiver). SSGA Funds Management, Inc. has contractually agreed to waive its management fee and/or reimburse certain expenses, until January 31, 2020, so thatthe net annual Fund operating expenses of the Fund, before application of any fees and expenses not paid by the Adviser pursuant to the Investment AdvisoryAgreement, if any, are limited to 0.20% of the Fund’s average daily net assets.Performance quoted represents past performance, which is no guarantee of future results. Investment return and principal value will fluctuate, so you may have a gainor loss when shares are sold. Current performance may be higher or lower than that quoted. Visit www.spdrs.com for most recent month-end performance. Thereturns do not reflect the deduction of taxes that a shareholder would pay on Fund distributions or on the redemption or sale of Fund shares. See �Notes toPerformance Summaries� on page 1 for more information.
See accompanying notes to financial statements.7
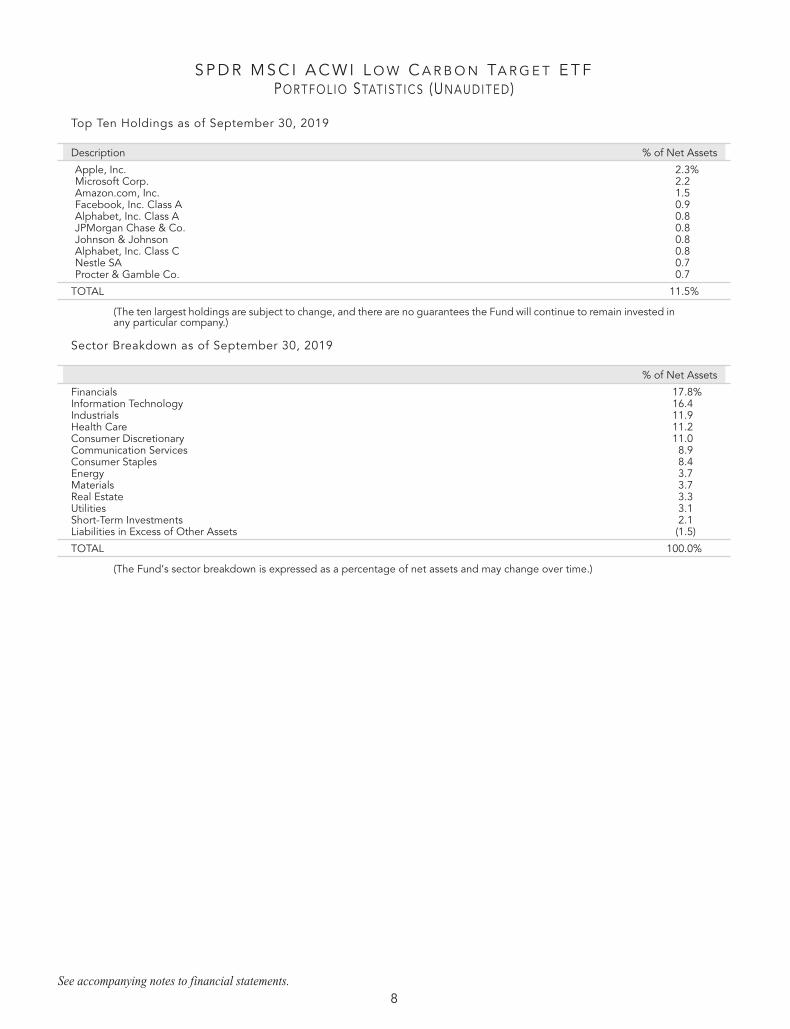
S P D R M S C I A C W I L O W C A R B O N TA R G E T E T FPORTFOLIO STATIST ICS (UNAUDITED)
Top Ten Holdings as of September 30, 2019
Description % of Net Assets
Apple, Inc. 2.3%Microsoft Corp. 2.2Amazon.com, Inc. 1.5Facebook, Inc. Class A 0.9Alphabet, Inc. Class A 0.8JPMorgan Chase & Co. 0.8Johnson & Johnson 0.8Alphabet, Inc. Class C 0.8Nestle SA 0.7Procter & Gamble Co. 0.7
TOTAL 11.5%
(The ten largest holdings are subject to change, and there are no guarantees the Fund will continue to remain invested inany particular company.)
Sector Breakdown as of September 30, 2019
% of Net Assets
Financials 17.8%Information Technology 16.4Industrials 11.9Health Care 11.2Consumer Discretionary 11.0Communication Services 8.9Consumer Staples 8.4Energy 3.7Materials 3.7Real Estate 3.3Utilities 3.1Short-Term Investments 2.1Liabilities in Excess of Other Assets (1.5)
TOTAL 100.0%
(The Fund’s sector breakdown is expressed as a percentage of net assets and may change over time.)
See accompanying notes to financial statements.8
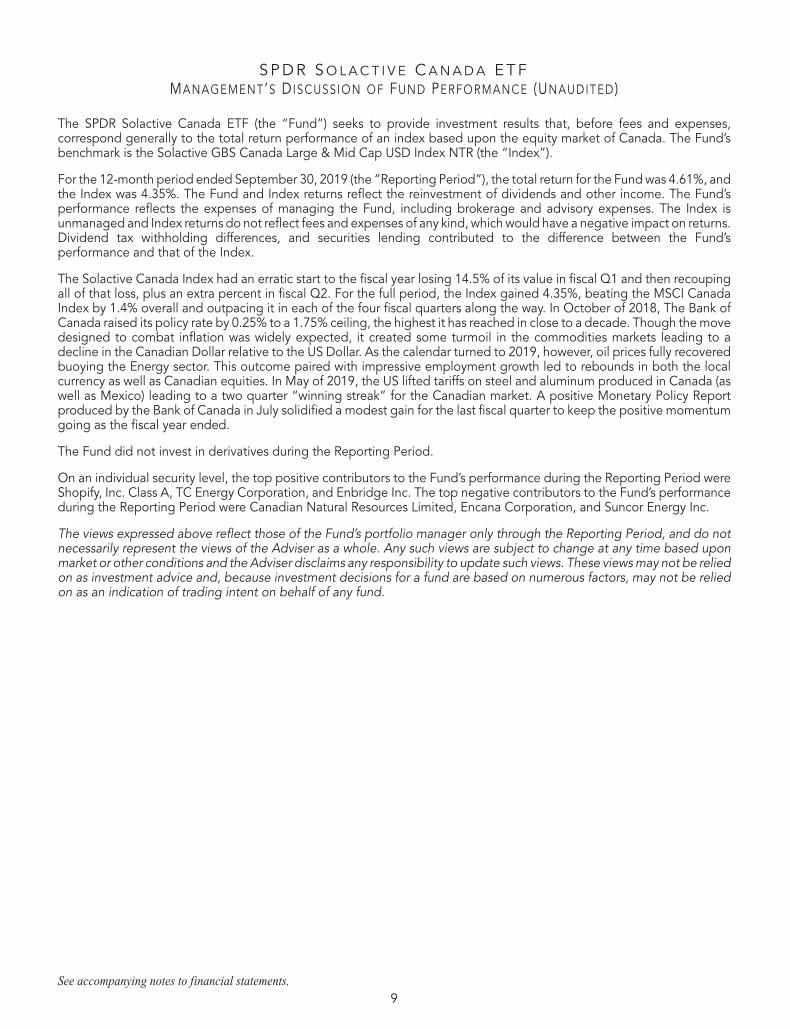
S P D R S O L A C T I V E C A N A D A E T FMANAGEMENT’S DISCUSSION OF FUND PERFORMANCE (UNAUDITED)
The SPDR Solactive Canada ETF (the “Fund”) seeks to provide investment results that, before fees and expenses,correspond generally to the total return performance of an index based upon the equity market of Canada. The Fund’sbenchmark is the Solactive GBS Canada Large & Mid Cap USD Index NTR (the “Index”).
For the 12-month period ended September 30, 2019 (the “Reporting Period”), the total return for the Fund was 4.61%, andthe Index was 4.35%. The Fund and Index returns reflect the reinvestment of dividends and other income. The Fund’sperformance reflects the expenses of managing the Fund, including brokerage and advisory expenses. The Index isunmanaged and Index returns do not reflect fees and expenses of any kind, which would have a negative impact on returns.Dividend tax withholding differences, and securities lending contributed to the difference between the Fund’sperformance and that of the Index.
The Solactive Canada Index had an erratic start to the fiscal year losing 14.5% of its value in fiscal Q1 and then recoupingall of that loss, plus an extra percent in fiscal Q2. For the full period, the Index gained 4.35%, beating the MSCI CanadaIndex by 1.4% overall and outpacing it in each of the four fiscal quarters along the way. In October of 2018, The Bank ofCanada raised its policy rate by 0.25% to a 1.75% ceiling, the highest it has reached in close to a decade. Though the movedesigned to combat inflation was widely expected, it created some turmoil in the commodities markets leading to adecline in the Canadian Dollar relative to the US Dollar. As the calendar turned to 2019, however, oil prices fully recoveredbuoying the Energy sector. This outcome paired with impressive employment growth led to rebounds in both the localcurrency as well as Canadian equities. In May of 2019, the US lifted tariffs on steel and aluminum produced in Canada (aswell as Mexico) leading to a two quarter “winning streak” for the Canadian market. A positive Monetary Policy Reportproduced by the Bank of Canada in July solidified a modest gain for the last fiscal quarter to keep the positive momentumgoing as the fiscal year ended.
The Fund did not invest in derivatives during the Reporting Period.
On an individual security level, the top positive contributors to the Fund’s performance during the Reporting Period wereShopify, Inc. Class A, TC Energy Corporation, and Enbridge Inc. The top negative contributors to the Fund’s performanceduring the Reporting Period were Canadian Natural Resources Limited, Encana Corporation, and Suncor Energy Inc.
The views expressed above reflect those of the Fund’s portfolio manager only through the Reporting Period, and do notnecessarily represent the views of the Adviser as a whole. Any such views are subject to change at any time based uponmarket or other conditions and the Adviser disclaims any responsibility to update such views. These views may not be reliedon as investment advice and, because investment decisions for a fund are based on numerous factors, may not be reliedon as an indication of trading intent on behalf of any fund.
See accompanying notes to financial statements.9
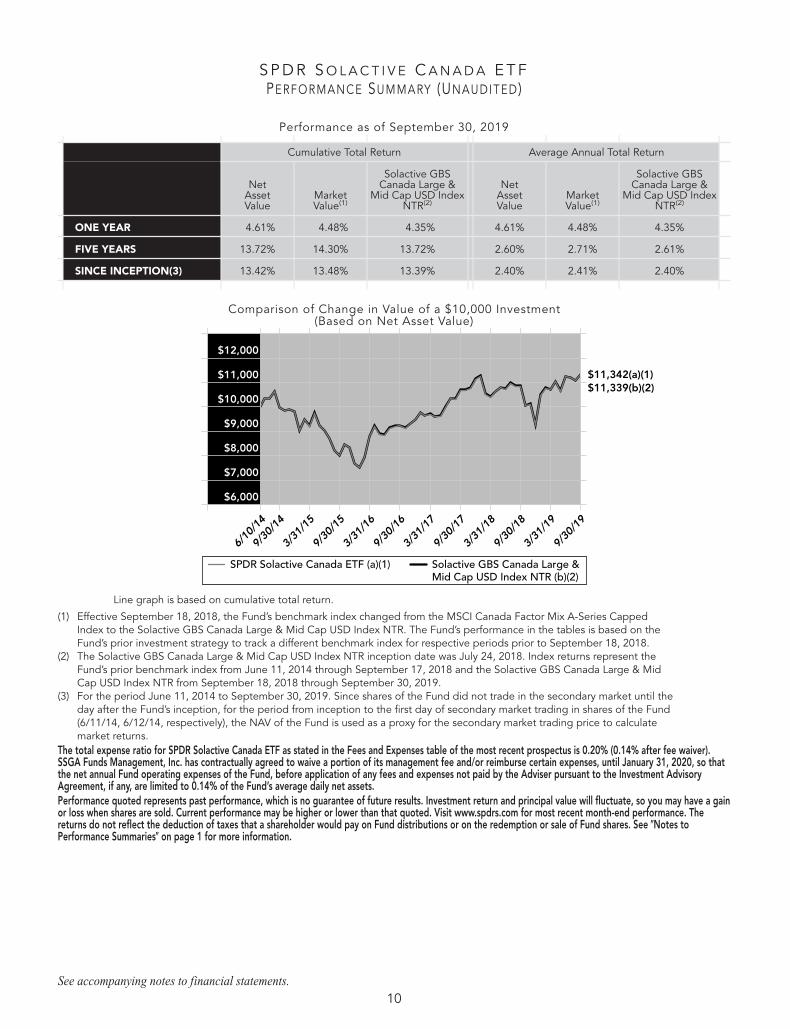
S P D R S O L A C T I V E C A N A D A E T FPERFORMANCE SUMMARY (UNAUDITED)
Performance as of September 30, 2019
Cumulative Total Return Average Annual Total Return
NetAssetValue
MarketValue(1)
Solactive GBSCanada Large &
Mid Cap USD IndexNTR(2)
NetAssetValue
MarketValue(1)
Solactive GBSCanada Large &
Mid Cap USD IndexNTR(2)
ONE YEAR 4.61% 4.48% 4.35% 4.61% 4.48% 4.35%
FIVE YEARS 13.72% 14.30% 13.72% 2.60% 2.71% 2.61%
SINCE INCEPTION(3) 13.42% 13.48% 13.39% 2.40% 2.41% 2.40%
Comparison of Change in Value of a $10,000 Investment(Based on Net Asset Value)
SPDR Solactive Canada ETF (a)(1) Solactive GBS Canada Large &Mid Cap USD Index NTR (b)(2)
$6,000
$7,000
$8,000
$9,000
$10,000
$11,000
$12,000
9/3
0/14
3/3
1/15
9/3
0/15
3/3
1/16
9/3
0/16
3/3
1/17
9/3
0/17
3/3
1/18
9/3
0/18
3/3
1/19
6/1
0/14
9/3
0/19
$11,342(a)(1)$11,339(b)(2)
Line graph is based on cumulative total return.
(1) Effective September 18, 2018, the Fund’s benchmark index changed from the MSCI Canada Factor Mix A-Series CappedIndex to the Solactive GBS Canada Large & Mid Cap USD Index NTR. The Fund’s performance in the tables is based on theFund’s prior investment strategy to track a different benchmark index for respective periods prior to September 18, 2018.
(2) The Solactive GBS Canada Large & Mid Cap USD Index NTR inception date was July 24, 2018. Index returns represent theFund’s prior benchmark index from June 11, 2014 through September 17, 2018 and the Solactive GBS Canada Large & MidCap USD Index NTR from September 18, 2018 through September 30, 2019.
(3) For the period June 11, 2014 to September 30, 2019. Since shares of the Fund did not trade in the secondary market until theday after the Fund’s inception, for the period from inception to the first day of secondary market trading in shares of the Fund(6/11/14, 6/12/14, respectively), the NAV of the Fund is used as a proxy for the secondary market trading price to calculatemarket returns.
The total expense ratio for SPDR Solactive Canada ETF as stated in the Fees and Expenses table of the most recent prospectus is 0.20% (0.14% after fee waiver).SSGA Funds Management, Inc. has contractually agreed to waive a portion of its management fee and/or reimburse certain expenses, until January 31, 2020, so thatthe net annual Fund operating expenses of the Fund, before application of any fees and expenses not paid by the Adviser pursuant to the Investment AdvisoryAgreement, if any, are limited to 0.14% of the Fund’s average daily net assets.Performance quoted represents past performance, which is no guarantee of future results. Investment return and principal value will fluctuate, so you may have a gainor loss when shares are sold. Current performance may be higher or lower than that quoted. Visit www.spdrs.com for most recent month-end performance. Thereturns do not reflect the deduction of taxes that a shareholder would pay on Fund distributions or on the redemption or sale of Fund shares. See �Notes toPerformance Summaries� on page 1 for more information.
See accompanying notes to financial statements.10

S P D R S O L A C T I V E C A N A D A E T FPORTFOLIO STATIST ICS (UNAUDITED)
Top Ten Holdings as of September 30, 2019
Description % of Net Assets
Royal Bank of Canada 7.6%Toronto-Dominion Bank 7.0Enbridge, Inc. 4.6Bank of Nova Scotia 4.5Canadian National Railway Co. 4.2Suncor Energy, Inc. 3.2TC Energy Corp. 3.1Bank of Montreal 3.1BCE, Inc. 2.9Brookfield Asset Management, Inc. Class A 2.7
TOTAL 42.9%
(The ten largest holdings are subject to change, and there are no guarantees the Fund will continue to remain invested inany particular company.)
Sector Breakdown as of September 30, 2019
% of Net Assets
Financials 36.2%Energy 17.4Industrials 10.6Materials 9.3Communication Services 6.2Information Technology 5.4Consumer Staples 4.3Consumer Discretionary 4.0Utilities 3.6Real Estate 1.7Health Care 0.6Short-Term Investments 4.4Liabilities in Excess of Other Assets (3.7)
TOTAL 100.0%
(The Fund’s sector breakdown is expressed as a percentage of net assets and may change over time.)
See accompanying notes to financial statements.11

S P D R M S C I E A F E F O S S I L F U E L R E S E R V E S F R E E E T FMANAGEMENT’S DISCUSSION OF FUND PERFORMANCE (UNAUDITED)
The SPDR MSCI EAFE Fossil Fuel Reserves Free ETF (the “Fund”) seeks to provide investment results that, before fees andexpenses, correspond generally to the total return performance of the MSCI EAFE ex Fossil Fuels Index. The Fund’sbenchmark is the MSCI EAFE ex Fossil Fuels Index (the “Index”).
For the 12-month period ended September 30, 2019 (the “Reporting Period”), the total return for the Fund was –0.79%,and the Index was –0.79%. The Fund and Index returns reflect the reinvestment of dividends and other income. The Fund’sperformance reflects the expenses of managing the Fund, including brokerage and advisory expenses. The Index isunmanaged and Index returns do not reflect fees and expenses of any kind, which would have a negative impact on returns.Fees and expenses, tax witholdings and the cumulative effect of security misweights contributed to the difference betweenthe Fund’s performance and that of the Index.
The first quarter of the Reporting Period was characterized by high volatility, with global markets falling dramatically onconcerns of international trade wars, particularly between the U.S. and China, and the possibility of central bankover-tightening. Unfortunately, with regard to the Federal Reserve, no clarity was provided on its intentions and itsadditional quarter-point rate hike in December did nothing to quell fears. By the end of 2018, markets had sold offsignificantly.
Fortunately, the Fed realized its error in poor communication and enlisted the help of former Fed Chairs in January to clarifyits dovish stance. Markets promptly rebounded, regaining most, if not all, of what had been lost in 2018’s fourth quarter bythe end of 2019’s first quarter. The Fed’s decision to keep rates flat in March added more support to the market’s advances.
But this strong rebound was reversed in May, as concerns about a U.S.-China trade war resurfaced. Negotiations seemedto be going well until a surprise statement by President Trump in early May claimed that China was breaking promises, andthat tariffs would be increased in response. However, the market regained its footing as prospects for a moreaccommodating Fed were solidified with another decision to keep rates flat in June.
The final quarter of the Reporting Period was once again volatile, as uncertainties around Brexit and the U.S.-China tradewar continued to persist. In addition, concerns about softening global economic growth grew stronger. Some of thisuncertainty was countered by two rate cuts by the Fed in August and September, which caused markets to rebound intothe final month of the Reporting Period.
With regard to Fossil Fuel companies, both the Fund and the Index slightly outperformed their MSCI EAFE Indexcounterpart during the Reporting Period. Because Fossil Fuel companies had slightly lower returns than the overall MSCIEAFE Index, the exclusion of such companies boosted the relative performance of the Index.
The Fund did not invest in derivatives during the Reporting Period.
On an individual security level, the top positive contributors to the Fund’s performance during the Reporting Period wereNestle S.A., Roche Holding AG, and Novartis AG. The top negative contributors to the Fund’s performance during theReporting Period were Teva Pharmaceutical Industries Limited, British American Tobacco p.l.c., and SoftBank Group Corp.
The views expressed above reflect those of the Fund’s portfolio manager only through the Reporting Period, and do notnecessarily represent the views of the Adviser as a whole. Any such views are subject to change at any time based uponmarket or other conditions and the Adviser disclaims any responsibility to update such views. These views may not be reliedon as investment advice and, because investment decisions for a fund are based on numerous factors, may not be reliedon as an indication of trading intent on behalf of any fund.
See accompanying notes to financial statements.12
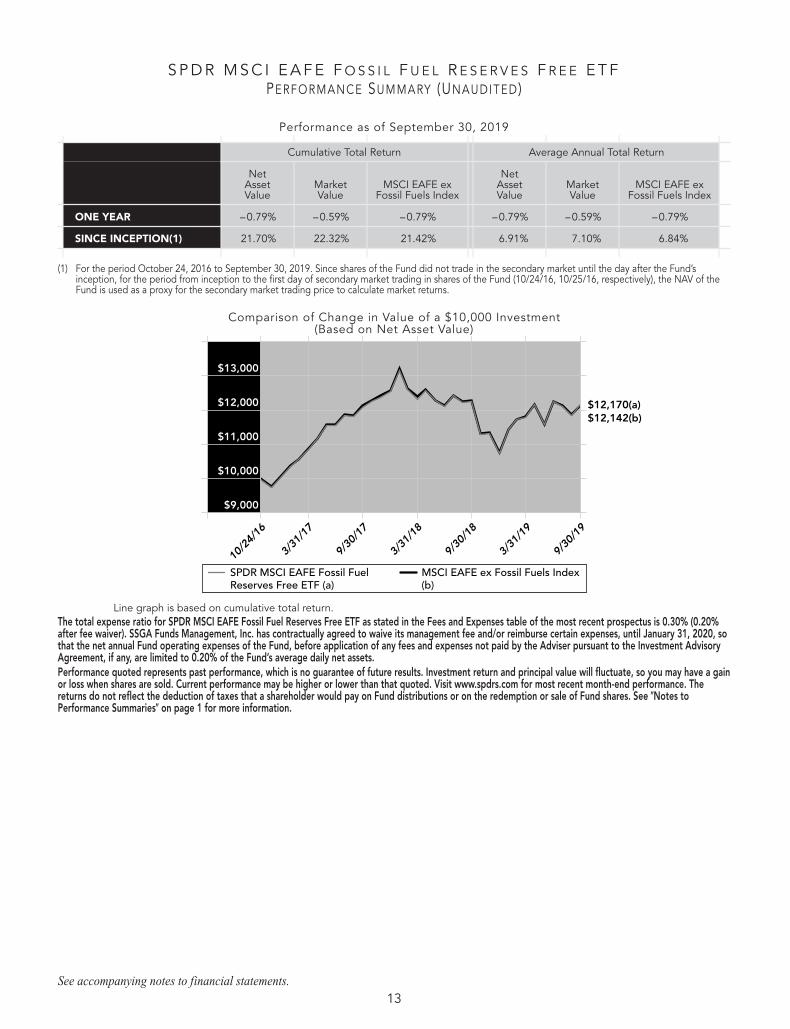
S P D R M S C I E A F E F O S S I L F U E L R E S E R V E S F R E E E T FPERFORMANCE SUMMARY (UNAUDITED)
Performance as of September 30, 2019
Cumulative Total Return Average Annual Total Return
NetAssetValue
MarketValue
MSCI EAFE exFossil Fuels Index
NetAssetValue
MarketValue
MSCI EAFE exFossil Fuels Index
ONE YEAR –0.79% –0.59% –0.79% –0.79% –0.59% –0.79%
SINCE INCEPTION(1) 21.70% 22.32% 21.42% 6.91% 7.10% 6.84%
(1) For the period October 24, 2016 to September 30, 2019. Since shares of the Fund did not trade in the secondary market until the day after the Fund’sinception, for the period from inception to the first day of secondary market trading in shares of the Fund (10/24/16, 10/25/16, respectively), the NAV of theFund is used as a proxy for the secondary market trading price to calculate market returns.
Comparison of Change in Value of a $10,000 Investment(Based on Net Asset Value)
SPDR MSCI EAFE Fossil FuelReserves Free ETF (a)
MSCI EAFE ex Fossil Fuels Index(b)
$9,000
$10,000
$11,000
$12,000
$13,000
3/3
1/17
9/3
0/17
3/3
1/18
9/3
0/18
3/3
1/19
10/2
4/16
9/3
0/19
$12,170(a)$12,142(b)
Line graph is based on cumulative total return.The total expense ratio for SPDR MSCI EAFE Fossil Fuel Reserves Free ETF as stated in the Fees and Expenses table of the most recent prospectus is 0.30% (0.20%after fee waiver). SSGA Funds Management, Inc. has contractually agreed to waive its management fee and/or reimburse certain expenses, until January 31, 2020, sothat the net annual Fund operating expenses of the Fund, before application of any fees and expenses not paid by the Adviser pursuant to the Investment AdvisoryAgreement, if any, are limited to 0.20% of the Fund’s average daily net assets.Performance quoted represents past performance, which is no guarantee of future results. Investment return and principal value will fluctuate, so you may have a gainor loss when shares are sold. Current performance may be higher or lower than that quoted. Visit www.spdrs.com for most recent month-end performance. Thereturns do not reflect the deduction of taxes that a shareholder would pay on Fund distributions or on the redemption or sale of Fund shares. See �Notes toPerformance Summaries� on page 1 for more information.
See accompanying notes to financial statements.13

S P D R M S C I E A F E F O S S I L F U E L R E S E R V E S F R E E E T FPORTFOLIO STATIST ICS (UNAUDITED)
Top Ten Holdings as of September 30, 2019
Description % of Net Assets
Nestle SA 2.6%Roche Holding AG 1.6Novartis AG 1.5HSBC Holdings PLC 1.2Toyota Motor Corp. 1.2AstraZeneca PLC 0.9SAP SE 0.9AIA Group, Ltd. 0.9LVMH Moet Hennessy Louis Vuitton SE 0.9GlaxoSmithKline PLC 0.8
TOTAL 12.5%
(The ten largest holdings are subject to change, and there are no guarantees the Fund will continue to remain invested inany particular company.)
Sector Breakdown as of September 30, 2019
% of Net Assets
Financials 19.9%Industrials 15.9Consumer Staples 12.9Health Care 12.5Consumer Discretionary 12.1Information Technology 7.3Materials 6.1Communication Services 5.8Real Estate 3.8Utilities 2.7Energy 0.2Short-Term Investments 4.7Liabilities in Excess of Other Assets (3.9)
TOTAL 100.0%
(The Fund’s sector breakdown is expressed as a percentage of net assets and may change over time.)
See accompanying notes to financial statements.14

S P D R M S C I E A F E S T R AT E G I C FA C T O R S E T FMANAGEMENT’S DISCUSSION OF FUND PERFORMANCE (UNAUDITED)
The SPDR MSCI EAFE StrategicFactors ETF (the “Fund”) seeks to provide investment results that, before fees andexpenses, correspond generally to the total return performance of an index based upon the European, Australasian, andFar Eastern developed equity markets. The Fund’s benchmark is the MSCI EAFE Factor Mix A- Series Index (the “Index”).
For the 12-month period ended September 30, 2019 (the “Reporting Period”), the total return for the Fund was 1.39%, andthe Index was 1.14%. The Fund and Index returns reflect the reinvestment of dividends and other income. The Fund’sperformance reflects the expenses of managing the Fund, including brokerage and advisory expenses. The Index isunmanaged and Index returns do not reflect fees and expenses of any kind, which would have a negative impact on returns.Cumulative cash drag, security misweights and tax withholding differences contributed to the difference between theFund’s performance and that of the Index.
Global equity markets slumped in the last calendar quarter of 2018. The Fund returned –10.4% as heightened volatilityarose from uncertainty surrounding erratic policy decisions and pronouncements.
Global markets however had a strong start to 2019. Despite continued gloomy economic forecasts and data and ongoingBrexit concerns, the fund returned 9.72% in the first calendar quarter. Trade conflict between the United States and the restof the world took center stage during the second half of 2019, battering equity markets. The impact of this was somewhatstymied by central bank accommodation with the European Central Bank and the Fed indicating further policy tools andinterest rate cuts would be used to support economic growth.
The Fund did not invest in derivatives during the Reporting Period.
On an individual security level, the top positive contributors to the Fund’s performance during the Reporting Period wereNestle S.A., Roche Holding AG, and Diageo plc. The top negative contributors to the Fund’s performance during theReporting Period were Astellas Pharma Inc., Nissan Motor Co., Ltd., and BASF SE.
The views expressed above reflect those of the Fund’s portfolio manager only through the Reporting Period, and do notnecessarily represent the views of the Adviser as a whole. Any such views are subject to change at any time based uponmarket or other conditions and the Adviser disclaims any responsibility to update such views. These views may not be reliedon as investment advice and, because investment decisions for a fund are based on numerous factors, may not be reliedon as an indication of trading intent on behalf of any fund.
See accompanying notes to financial statements.15

S P D R M S C I E A F E S T R AT E G I C FA C T O R S E T FPERFORMANCE SUMMARY (UNAUDITED)
Performance as of September 30, 2019
Cumulative Total Return Average Annual Total Return
NetAssetValue
MarketValue
MSCI EAFE FactorMix A-Series Index
NetAssetValue
MarketValue
MSCI EAFE FactorMix A-Series Index
ONE YEAR 1.39% 1.55% 1.14% 1.39% 1.55% 1.14%
FIVE YEARS 25.14% 25.71% 25.13% 4.59% 4.68% 4.59%
SINCE INCEPTION(1) 19.53% 19.95% 19.68% 3.41% 3.47% 3.43%
(1) For the period June 4, 2014 to September 30, 2019. Since shares of the Fund did not trade in the secondary market until the day after the Fund’s inception,for the period from inception to the first day of secondary market trading in shares of the Fund (6/4/14, 6/5/14, respectively), the NAV of the Fund is used as aproxy for the secondary market trading price to calculate market returns.
Comparison of Change in Value of a $10,000 Investment(Based on Net Asset Value)
SPDR MSCI EAFEStrategicFactors ETF (a)
MSCI EAFE Factor Mix A-SeriesIndex (b)
$8,000
$9,000
$10,000
$11,000
$12,000
$13,000
9/3
0/14
3/3
1/15
9/3
0/15
3/3
1/16
9/3
0/16
3/3
1/17
9/3
0/17
3/3
1/18
9/3
0/18
3/3
1/19
6
/4/1
4
9/3
0/19
$11,968(b)$11,953(a)
Line graph is based on cumulative total return.The total expense ratio for SPDR MSCI EAFE StrategicFactors ETF as stated in the Fees and Expenses table of the most recent prospectus is 0.30%.Performance quoted represents past performance, which is no guarantee of future results. Investment return and principal value will fluctuate, so you may have a gainor loss when shares are sold. Current performance may be higher or lower than that quoted. Visit www.spdrs.com for most recent month-end performance. Thereturns do not reflect the deduction of taxes that a shareholder would pay on Fund distributions or on the redemption or sale of Fund shares. See �Notes toPerformance Summaries� on page 1 for more information.
See accompanying notes to financial statements.16

S P D R M S C I E A F E S T R AT E G I C FA C T O R S E T FPORTFOLIO STATIST ICS (UNAUDITED)
Top Ten Holdings as of September 30, 2019
Description % of Net Assets
Nestle SA 2.6%Roche Holding AG 2.5AstraZeneca PLC 1.5Diageo PLC 1.4Novo Nordisk A/S Class B 1.3LVMH Moet Hennessy Louis Vuitton SE 1.0ASML Holding NV 1.0Unilever NV 1.0SAP SE 0.9AIA Group, Ltd. 0.9
TOTAL 14.1%
(The ten largest holdings are subject to change, and there are no guarantees the Fund will continue to remain invested inany particular company.)
Sector Breakdown as of September 30, 2019
% of Net Assets
Financials 17.4%Consumer Staples 14.4Industrials 13.9Consumer Discretionary 12.7Health Care 12.5Communication Services 6.7Information Technology 5.7Materials 5.0Real Estate 4.4Utilities 4.4Energy 2.2Short-Term Investments 3.7Liabilities in Excess of Other Assets (3.0)
TOTAL 100.0%
(The Fund’s sector breakdown is expressed as a percentage of net assets and may change over time.)
See accompanying notes to financial statements.17

S P D R M S C I E M E R G I N G M A R K E T S F O S S I L F U E L R E S E R V E S F R E E E T FMANAGEMENT’S DISCUSSION OF FUND PERFORMANCE (UNAUDITED)
The SPDR MSCI Emerging Markets Fossil Fuel Reserves Free ETF (the “Fund”) seeks to provide investment results that,before fees and expenses, correspond generally to the total return performance of the MSCI Emerging Markets ex FossilFuels Index. The Fund’s benchmark is the MSCI Emerging Markets ex Fossil Fuels Index (the “Index”).
For the 12-month period ended September 30, 2019 (the “Reporting Period”), the total return for the Fund was –2.62%,and the Index was –2.14%. The Fund and Index returns reflect the reinvestment of dividends and other income. The Fund’sperformance reflects the expenses of managing the Fund, including brokerage and advisory expenses. The Index isunmanaged and Index returns do not reflect fees and expenses of any kind, which would have a negative impact on returns.Cash, security misweights, transaction costs and compounding (the exponential growth of outperformance orunderperformance) also contributed to the difference between the Fund’s performance and that of the Index.
The Fund started off the period with negative returns as it continued to feel the impact of numerous Fed Rate increasesfrom the prior period, as well as fear over increased tariffs on products from China. There was a decline in global investmentin clean energy during the first half of 2019, sparked by a reduction in government subsidies for renewable energy. Despitethis decline, the Fund was able to make a nice comeback during this same period. Investor sentiment remained positive inpart due to a number of large economies that made longer-term pledges to reach net zero emissions, which wouldeliminate fossil fuel power. The renewable energy sector has also been supported by governments around the world.Speaking at the UN Climate Action Summit , Indian prime minister Narendra Modi pledged to double the renewableenergy target of his nation, which still relies on coal for more than half its power, by 2022. Unfortunately despite the partialcomeback, the Fund still ended the period in negative territory.
The Fund did not invest in derivatives during the Reporting Period.
On an individual security level, the top positive contributors to the Fund’s performance during the Reporting Period wereBanco Bradesco SA Pfd, B3 SA - Brasil, Bolsa, Balcao, and Itau Unibanco Holding SA Pfd. The top negative contributors tothe Fund’s performance during the Reporting Period were Hon Hai Precision Industry Co., Ltd., Celltrion, Inc., and Baidu,Inc. Sponsored ADR Class A.
The views expressed above reflect those of the Fund’s portfolio manager only through the Reporting Period, and do notnecessarily represent the views of the Adviser as a whole. Any such views are subject to change at any time based uponmarket or other conditions and the Adviser disclaims any responsibility to update such views. These views may not be reliedon as investment advice and, because investment decisions for a fund are based on numerous factors, may not be reliedon as an indication of trading intent on behalf of any fund.
See accompanying notes to financial statements.18

S P D R M S C I E M E R G I N G M A R K E T S F O S S I L F U E L R E S E R V E S F R E E E T FPERFORMANCE SUMMARY (UNAUDITED)
Performance as of September 30, 2019
Cumulative Total Return Average Annual Total Return
NetAssetValue
MarketValue
MSCI EmergingMarkets ex Fossil
Fuels Index
NetAssetValue
MarketValue
MSCI EmergingMarkets ex Fossil
Fuels Index
ONE YEAR –2.62% –2.45% –2.14% –2.62% –2.45% –2.14%
SINCE INCEPTION(1) 15.01% 15.10% 15.09% 4.88% 4.90% 4.91%
(1) For the period October 24, 2016 to September 30, 2019. Since shares of the Fund did not trade in the secondary market until the day after the Fund’sinception, for the period from inception to the first day of secondary market trading in shares of the Fund (10/24/16, 10/25/16, respectively), the NAV of theFund is used as a proxy for the secondary market trading price to calculate market returns.
Comparison of Change in Value of a $10,000 Investment(Based on Net Asset Value)
SPDR MSCI Emerging MarketsFossil Fuel Reserves Free ETF (a)
MSCI Emerging Markets exFossil Fuels Index (b)
$8,000
$10,000
$12,000
$14,000
3/3
1/17
9/3
0/17
3/3
1/18
9/3
0/18
3/3
1/19
10/2
4/16
9/3
0/19
$11,509(b)$11,501(a)
Line graph is based on cumulative total return.The total expense ratio for SPDR MSCI Emerging Markets Fossil Fuel Reserves Free ETF as stated in the Fees and Expenses table of the most recent prospectus is0.30%.Performance quoted represents past performance, which is no guarantee of future results. Investment return and principal value will fluctuate, so you may have a gainor loss when shares are sold. Current performance may be higher or lower than that quoted. Visit www.spdrs.com for most recent month-end performance. Thereturns do not reflect the deduction of taxes that a shareholder would pay on Fund distributions or on the redemption or sale of Fund shares. See �Notes toPerformance Summaries� on page 1 for more information.
See accompanying notes to financial statements.19

S P D R M S C I E M E R G I N G M A R K E T S F O S S I L F U E L R E S E R V E S F R E E E T FPORTFOLIO STATIST ICS (UNAUDITED)
Top Ten Holdings as of September 30, 2019
Description % of Net Assets
Tencent Holdings, Ltd. 5.0%Alibaba Group Holding, Ltd. ADR 4.9Taiwan Semiconductor Manufacturing Co., Ltd. 4.5Samsung Electronics Co., Ltd. 4.1China Construction Bank Corp. Class H 1.5Naspers, Ltd. Class N 1.4Ping An Insurance Group Co. of China, Ltd. Class H 1.3China Mobile, Ltd. 1.0Sberbank of Russia PJSC ADR 1.0Itau Unibanco Holding SA Preference Shares 1.0
TOTAL 25.7%
(The ten largest holdings are subject to change, and there are no guarantees the Fund will continue to remain invested inany particular company.)
Sector Breakdown as of September 30, 2019
% of Net Assets
Financials 26.6%Information Technology 15.7Consumer Discretionary 13.6Communication Services 12.5Materials 7.7Consumer Staples 7.4Industrials 5.7Real Estate 2.9Health Care 2.7Utilities 2.5Energy 0.8Short-Term Investments 0.7Other Assets in Excess of Liabilities 1.2
TOTAL 100.0%
(The Fund’s sector breakdown is expressed as a percentage of net assets and may change over time.)
See accompanying notes to financial statements.20

S P D R M S C I E M E R G I N G M A R K E T S S T R AT E G I C FA C T O R S E T FMANAGEMENT’S DISCUSSION OF FUND PERFORMANCE (UNAUDITED)
The SPDR MSCI Emerging Markets StrategicFactors ETF (the “Fund”) seeks to provide investment results that, before feesand expenses, correspond generally to the total return performance of an index based upon the emerging equity marketsof the world. The Fund’s benchmark is the MSCI Emerging Markets (EM) Factor Mix A-Series Index (the “Index”).
For the 12-month period ended September 30, 2019 (the “Reporting Period”), the total return for the Fund was –0.52%,and the Index was –0.11%. The Fund and Index returns reflect the reinvestment of dividends and other income. The Fund’sperformance reflects the expenses of managing the Fund, including brokerage and advisory expenses. The Index isunmanaged and Index returns do not reflect fees and expenses of any kind, which would have a negative impact on returns.Fees and expenses, tax withholdings and the cumulative effect of security misweights contributed to the differencebetween the Fund’s performance and that of the Index.
The first quarter of the Reporting Period was characterized by high volatility, with global markets falling dramatically onconcerns of international trade wars, particularly between the U.S. and China, and the possibility of central bankover-tightening. Unfortunately, with regard to the Federal Reserve, no clarity was provided on its intentions and itsadditional quarter-point rate hike in December did nothing to quell fears. By the end of 2018, markets had sold offsignificantly.
Fortunately, the Fed realized its error in poor communication and enlisted the help of former Fed Chairs in January to clarifyits dovish stance. Markets promptly rebounded, regaining most, if not all, of what had been lost in 2018’s fourth quarter bythe end of 2019’s first quarter. The Fed’s decision to keep rates flat in March added more support to the market’s advances.
But this strong rebound was reversed in May, as concerns about a U.S.-China trade war resurfaced. Negotiations seemedto be going well until a surprise statement by President Trump in early May claimed that China was breaking promises, andthat tariffs would be increased in response. However, the market regained its footing as prospects for a moreaccommodating Fed were solidified with another decision to keep rates flat in June.
The final quarter of the Reporting Period was once again volatile, as uncertainties around Brexit and the U.S.-China tradewar continued to persist. In addition, concerns about softening global economic growth grew stronger. Some of thisuncertainty was countered by two rate cuts by the Fed in August and September, which caused markets to rebound intothe final month of the Reporting Period.
With regard to factor performance during the Reporting Period in emerging markets, both quality and low volatility outperformed, but value was an underperformer. The combination of these three factors resulted in slight outperformance,with both the Fund and the Index slightly outperforming its MSCI Emerging Markets Index counterpart.
The Fund did not invest in derivatives during the Reporting Period.
On an individual security level, the top positive contributors to the Fund’s performance during the Reporting Period werePT Bank Central Asia Tbk, Gazprom PJSC Sponsored ADR, and Hindustan Unilever Limited. The top negative contributorsto the Fund’s performance during the Reporting Period were China Petroleum & Chemical Corporation Class H, Hon HaiPrecision Industry Co., Ltd., and Baidu, Inc. Sponsored ADR Class A.
The views expressed above reflect those of the Fund’s portfolio manager only through the Reporting Period, and do notnecessarily represent the views of the Adviser as a whole. Any such views are subject to change at any time based uponmarket or other conditions and the Adviser disclaims any responsibility to update such views. These views may not be reliedon as investment advice and, because investment decisions for a fund are based on numerous factors, may not be reliedon as an indication of trading intent on behalf of any fund.
See accompanying notes to financial statements.21

S P D R M S C I E M E R G I N G M A R K E T S S T R AT E G I C FA C T O R S E T FPERFORMANCE SUMMARY (UNAUDITED)
Performance as of September 30, 2019
Cumulative Total Return Average Annual Total Return
NetAssetValue
MarketValue
MSCI EmergingMarkets Factor Mix
A-Series Index
NetAssetValue
MarketValue
MSCI EmergingMarkets Factor Mix
A-Series Index
ONE YEAR –0.52% –0.33% –0.11% –0.52% –0.33% –0.11%
FIVE YEARS 8.12% 7.89% 11.16% 1.57% 1.53% 2.14%
SINCE INCEPTION(1) 7.42% 7.16% 11.28% 1.35% 1.31% 2.03%
(1) For the period June 4, 2014 to September 30, 2019. Since shares of the Fund did not trade in the secondary market until the day after the Fund’s inception,for the period from inception to the first day of secondary market trading in shares of the Fund (6/4/14, 6/5/14, respectively), the NAV of the Fund is used as aproxy for the secondary market trading price to calculate market returns.
Comparison of Change in Value of a $10,000 Investment(Based on Net Asset Value)
SPDR MSCI Emerging MarketsStrategicFactors ETF (a)
MSCI Emerging Markets FactorMix A-Series Index (b)
$6,000
$8,000
$10,000
$12,000
$14,000
9/3
0/14
3/3
1/15
9/3
0/15
3/3
1/16
9/3
0/16
3/3
1/17
9/3
0/17
3/3
1/18
9/3
0/18
3/3
1/19
6
/4/1
4
9/3
0/19
$11,128(b)$10,742(a)
Line graph is based on cumulative total return.The total expense ratio for SPDR MSCI Emerging Markets StrategicFactors ETF as stated in the Fees and Expenses table of the most recent prospectus is 0.30%.Performance quoted represents past performance, which is no guarantee of future results. Investment return and principal value will fluctuate, so you may have a gainor loss when shares are sold. Current performance may be higher or lower than that quoted. Visit www.spdrs.com for most recent month-end performance. Thereturns do not reflect the deduction of taxes that a shareholder would pay on Fund distributions or on the redemption or sale of Fund shares. See �Notes toPerformance Summaries� on page 1 for more information.
See accompanying notes to financial statements.22

S P D R M S C I E M E R G I N G M A R K E T S S T R AT E G I C FA C T O R S E T FPORTFOLIO STATIST ICS (UNAUDITED)
Top Ten Holdings as of September 30, 2019
Description % of Net Assets
Taiwan Semiconductor Manufacturing Co., Ltd. 2.9%Samsung Electronics Co., Ltd. 2.6SK Hynix, Inc. 2.0Tencent Holdings, Ltd. 1.9Tata Consultancy Services, Ltd. 1.5Bank Central Asia Tbk PT 1.3Infosys, Ltd. ADR 1.3Samsung Electronics Co., Ltd. GDR 1.2China Construction Bank Corp. Class H 1.2Hindustan Unilever, Ltd. 1.1
TOTAL 17.0%
(The ten largest holdings are subject to change, and there are no guarantees the Fund will continue to remain invested inany particular company.)
Sector Breakdown as of September 30, 2019
% of Net Assets
Financials 23.1%Information Technology 19.7Consumer Staples 11.7Communication Services 10.5Consumer Discretionary 9.3Energy 5.9Materials 5.6Industrials 5.2Utilities 3.9Health Care 2.6Real Estate 1.7Short-Term Investments 0.9Liabilities in Excess of Other Assets (0.1)
TOTAL 100.0%
(The Fund’s sector breakdown is expressed as a percentage of net assets and may change over time.)
See accompanying notes to financial statements.23

S P D R S O L A C T I V E G E R M A N Y E T FMANAGEMENT’S DISCUSSION OF FUND PERFORMANCE (UNAUDITED)
The SPDR Solactive Germany ETF (the “Fund”) seeks to provide investment results that, before fees and expenses,correspond generally to the total return performance of an Index based upon the equity market of Germany. The Fund’sbenchmark is the Solactive GBS Germany Large & Mid Cap USD Index NTR (the “Index”).
For the 12-month period ended September 30, 2019 (the “Reporting Period”), the total return for the Fund was –6.75%,and the Index was –6.96%. The Fund and Index returns reflect the reinvestment of dividends and other income. The Fund’sperformance reflects the expenses of managing the Fund, including brokerage and advisory expenses. The Index isunmanaged and Index returns do not reflect fees and expenses of any kind, which would have a negative impact on returns.Dividend tax withholding differences and cash drag contributed to the difference between the Fund’s performance andthat of the Index.
Germany rounded out the fourth calendar quarter of 2018 with a return of almost –15% as it was weighed down by someidiosyncratic issues in its health care sector as well as political uncertainty. In October, Chancellor Angela Merkelannounced her intention of stepping down in the wake of a poor showing by her Christian Democratic Union party inregional elections.
The Fund bounced back in the beginning of 2019 however, returning 6.56% in the first calendar quarter and 7.29% in thesecond calendar quarter. Investors remained relatively unperturbed by acrimonious trade dialogue with the United States.Some promising economic data as well as postponement of the potential auto tariffs by the United States helped limit anydamage to stock returns.
In the third calendar quarter of 2019 however investor confidence in Germany’s economic outlook was a source of concernand prompted the Bundesbank to warn of a possible recession, leading to a Fund return of –4.2%.
The Fund did not invest in derivatives during the Reporting Period.
On an individual security level, the top positive contributors to the Fund’s performance during the Reporting Period wereadidas AG, Allianz SE, and Munich Reinsurance Company. The top negative contributors to the Fund’s performance duringthe Reporting Period were Siemens AG, BASF SE, and Bayer AG.
The views expressed above reflect those of the Fund’s portfolio manager only through the Reporting Period, and do notnecessarily represent the views of the Adviser as a whole. Any such views are subject to change at any time based uponmarket or other conditions and the Adviser disclaims any responsibility to update such views. These views may not be reliedon as investment advice and, because investment decisions for a fund are based on numerous factors, may not be reliedon as an indication of trading intent on behalf of any fund.
See accompanying notes to financial statements.24

S P D R S O L A C T I V E G E R M A N Y E T FPERFORMANCE SUMMARY (UNAUDITED)
Performance as of September 30, 2019
Cumulative Total Return Average Annual Total Return
NetAssetValue
MarketValue(1)
Solactive GBSGermany Large &
Mid Cap USD IndexNTR(2)
NetAssetValue
MarketValue(1)
Solactive GBSGermany Large &
Mid Cap USD IndexNTR(2)
ONE YEAR –6.75% –6.21% –6.96% –6.75% –6.21% –6.96%
FIVE YEARS 15.34% 16.42% 15.23% 2.89% 3.09% 2.88%
SINCE INCEPTION(3) 3.00% 3.21% 2.99% 0.56% 0.60% 0.56%
Comparison of Change in Value of a $10,000 Investment(Based on Net Asset Value)
SPDR Solactive Germany ETF(a)(1)
Solactive GBS Germany Large &Mid Cap USD Index NTR (b)(2)
$6,000
$8,000
$10,000
$12,000
$14,000
9/3
0/14
3/3
1/15
9/3
0/15
3/3
1/16
9/3
0/16
3/3
1/17
9/3
0/17
3/3
1/18
9/3
0/18
3/3
1/19
6/1
1/14
9/3
0/19
$10,300(a)(1)$10,299(b)(2)
Line graph is based on cumulative total return.
(1) Effective September 18, 2018, the Fund’s benchmark index changed from the MSCI Germany Factor Mix A-Series CappedIndex to the Solactive GBS Germany Large & Mid Cap USD Index NTR. The Fund’s performance in the tables is based on theFund’s prior investment strategy to track a different benchmark index for respective periods prior to September 18, 2018.
(2) The Solactive GBS Germany Large & Mid Cap USD Index NTR inception date was July 24, 2018. Index returns represent theFund’s prior benchmark index from June 11, 2014 through September 17, 2018 and the Solactive GBS Germany Large & MidCap USD Index NTR from September 18, 2018 through September 30, 2019.
(3) For the period June 11, 2014 to September 30, 2019. Since shares of the Fund did not trade in the secondary market until theday after the Fund’s inception, for the period from inception to the first day of secondary market trading in shares of the Fund(6/11/14, 6/12/14, respectively), the NAV of the Fund is used as a proxy for the secondary market trading price to calculatemarket returns.
The total expense ratio for SPDR Solactive Germany ETF as stated in the Fees and Expenses table of the most recent prospectus is 0.20% (0.14% after fee waiver).SSGA Funds Management, Inc. has contractually agreed to waive a portion of its management fee and/or reimburse certain expenses, until January 31, 2020, so thatthe net annual Fund operating expenses of the Fund, before application of any fees and expenses not paid by the Adviser pursuant to the Investment AdvisoryAgreement, if any, are limited to 0.14% of the Fund’s average daily net assets.Performance quoted represents past performance, which is no guarantee of future results. Investment return and principal value will fluctuate, so you may have a gainor loss when shares are sold. Current performance may be higher or lower than that quoted. Visit www.spdrs.com for most recent month-end performance. Thereturns do not reflect the deduction of taxes that a shareholder would pay on Fund distributions or on the redemption or sale of Fund shares. See �Notes toPerformance Summaries� on page 1 for more information.
See accompanying notes to financial statements.25

S P D R S O L A C T I V E G E R M A N Y E T FPORTFOLIO STATIST ICS (UNAUDITED)
Top Ten Holdings as of September 30, 2019
Description % of Net Assets
SAP SE 10.5%Allianz SE 8.8Siemens AG 7.7Bayer AG 5.8BASF SE 5.7adidas AG 5.1Deutsche Telekom AG 4.8Daimler AG 4.0Muenchener Rueckversicherungs-Gesellschaft AG in Muenchen 3.3Deutsche Post AG 2.9
TOTAL 58.6%
(The ten largest holdings are subject to change, and there are no guarantees the Fund will continue to remain invested inany particular company.)
Sector Breakdown as of September 30, 2019
% of Net Assets
Financials 17.5%Consumer Discretionary 17.3Information Technology 14.1Industrials 13.1Health Care 11.2Materials 9.5Communication Services 5.2Real Estate 3.6Utilities 3.5Consumer Staples 3.4Short-Term Investment 0.0Other Assets in Excess of Liabilities 1.6
TOTAL 100.0%
(The Fund’s sector breakdown is expressed as a percentage of net assets and may change over time.)
See accompanying notes to financial statements.26
S P D R S O L A C T I V E J A PA N E T FMANAGEMENT’S DISCUSSION OF FUND PERFORMANCE (UNAUDITED)
The SPDR Solactive Japan ETF (the “Fund”) seeks to provide investment results that, before fees and expenses,correspond generally to the total return performance of an index based upon the equity market of Japan. The Fund’sbenchmark is the Solactive GBS Japan Large & Mid Cap USD Index NTR (the “Index”).
For the 12-month period ended September 30, 2019 (the “Reporting Period”), the total return for the Fund was –4.71%,and the Index was –4.80%. The Fund and Index returns reflect the reinvestment of dividends and other income. The Fund’sperformance reflects the expenses of managing the Fund, including brokerage and advisory expenses. The Index isunmanaged and Index returns do not reflect fees and expenses of any kind, which would have a negative impact on returns.Fees, cash drag and cumulative effect of security misweights contributed to the difference between the Fund’sperformance and that of the Index.
Equity markets in Asia-Pacific were not immune the risk aversion that permeated global capital markets during the fourthquarter of 2018, but the APAC region did manage to barely beat out both North American and European equities. In Japan,the equity market was fairly stable early on despite noisy data and increased trade tensions with South Korea. The Bank ofJapan convened at the end of July – leaving policy unchanged but acknowledging that additional easing measures couldbe taken if momentum toward achieving their inflation target waned. The Bank of Japan again took no action at theirSeptember policy meeting, but Governor Kuroda also indicated that the bank was more amenable to easing policy at aspeech following the meeting. While economic data has been generally weak in Japan, even for consumers, Q2 GDPsurprised to the upside with a gain of 1.8% on a seasonally adjusted annual basis. The Japanese market also had to contendwith mixed developments pertaining to trade. As part of an ongoing political dispute, South Korea removed Japan fromits list of trusted trading partners in the middle of the month (following a similar measure put forth by Japan against Korea).More optimistically, Japan reached at least a basic agreement outlining the contours of a bilateral trade deal with theUnited States following the G7 summit in France. In September, the Japanese market got a solid boost from the industrialand consumer discretionary sectors amidst easing trade tensions.
On an sector level, the top positive contributors to the Fund’s performance during the Reporting Period were InformationTechnology and Real Estate. The top negative contributors to the Fund’s performance during the Reporting Period wereFinancials and Materials.
The Fund did not invest in derivatives during the Reporting Period.
On an individual security level, the top positive contributors to the Fund’s performance during the Reporting Period wereToyota Motor Corp., Daiichi Sankyo Company, Limited, and Tokyo Electron Ltd. The top negative contributors to the Fund’sperformance during the Reporting Period were Eisai Co., Ltd., Mitsubishi UFJ Financial Group, Inc., and SoftBank GroupCorp.
The views expressed above reflect those of the Fund’s portfolio manager only through the Reporting Period, and do notnecessarily represent the views of the Adviser as a whole. Any such views are subject to change at any time based uponmarket or other conditions and the Adviser disclaims any responsibility to update such views. These views may not be reliedon as investment advice and, because investment decisions for a fund are based on numerous factors, may not be reliedon as an indication of trading intent on behalf of any fund.
See accompanying notes to financial statements.27

S P D R S O L A C T I V E J A PA N E T FPERFORMANCE SUMMARY (UNAUDITED)
Performance as of September 30, 2019
Cumulative Total Return Average Annual Total Return
NetAssetValue
MarketValue(1)
Solactive GBSJapan Large & Mid
Cap USD IndexNTR(2)
NetAssetValue
MarketValue(1)
Solactive GBSJapan Large & Mid
Cap USD IndexNTR(2)
ONE YEAR –4.71% –3.75% –4.80% –4.71% –3.75% –4.80%
FIVE YEARS 34.43% 35.86% 35.84% 6.10% 6.32% 6.32%
SINCE INCEPTION(3) 35.45% 36.63% 36.97% 5.88% 6.06% 6.11%
Comparison of Change in Value of a $10,000 Investment(Based on Net Asset Value)
SPDR Solactive Japan ETF (a)(1) Solactive GBS Japan Large &Mid Cap USD Index NTR (b)(2)
$9,000
$10,000
$11,000
$12,000
$13,000
$14,000
9/3
0/14
3/3
1/15
9/3
0/15
3/3
1/16
9/3
0/16
3/3
1/17
9/3
0/17
3/3
1/18
9/3
0/18
3/3
1/19
6/1
1/14
9/3
0/19
$13,697(b)(2)$13,545(a)(1)
Line graph is based on cumulative total return.
(1) Effective September 18, 2018, the Fund’s benchmark index changed from the MSCI Japan Factor Mix A-Series Capped Indexto the Solactive GBS Japan Large & Mid Cap USD Index NTR. The Fund’s performance in the tables is based on the Fund’sprior investment strategy to track a different benchmark index for respective periods prior to September 18, 2018.
(2) The Solactive GBS Japan Large & Mid Cap USD Index NTR inception date was July 24, 2018. Index returns represent theFund’s prior benchmark index from June 11, 2014 through September 17, 2018 and the Solactive GBS Japan Large & MidCap USD Index NTR from September 18, 2018 through September 30, 2019.
(3) For the period June 11, 2014 to September 30, 2019. Since shares of the Fund did not trade in the secondary market until theday after the Fund’s inception, for the period from inception to the first day of secondary market trading in shares of the Fund(6/11/14, 6/12/14, respectively), the NAV of the Fund is used as a proxy for the secondary market trading price to calculatemarket returns.
The total expense ratio for SPDR Solactive Japan ETF as stated in the Fees and Expenses table of the most recent prospectus is 0.20% (0.14% after fee waiver). SSGAFunds Management, Inc. has contractually agreed to waive a portion of its management fee and/or reimburse certain expenses, until January 31, 2020, so that thenet annual Fund operating expenses of the Fund, before application of any fees and expenses not paid by the Adviser pursuant to the Investment AdvisoryAgreement, if any, are limited to 0.14% of the Fund’s average daily net assets.Performance quoted represents past performance, which is no guarantee of future results. Investment return and principal value will fluctuate, so you may have a gainor loss when shares are sold. Current performance may be higher or lower than that quoted. Visit www.spdrs.com for most recent month-end performance. Thereturns do not reflect the deduction of taxes that a shareholder would pay on Fund distributions or on the redemption or sale of Fund shares. See �Notes toPerformance Summaries� on page 1 for more information.
See accompanying notes to financial statements.28
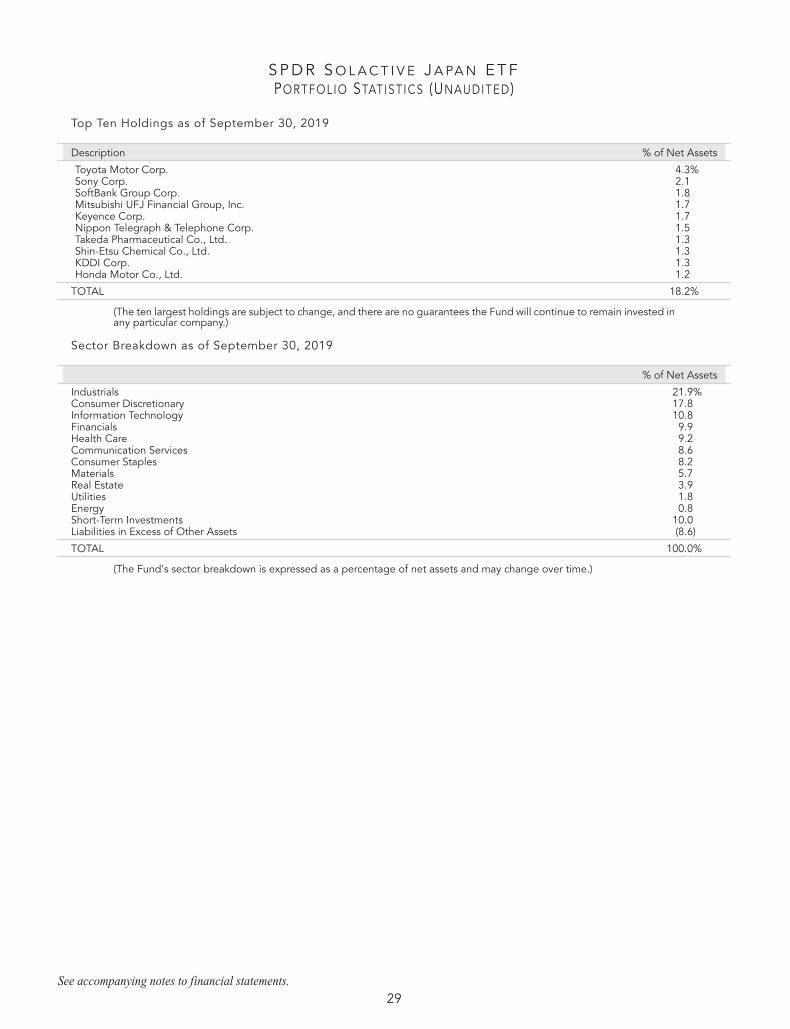
S P D R S O L A C T I V E J A PA N E T FPORTFOLIO STATIST ICS (UNAUDITED)
Top Ten Holdings as of September 30, 2019
Description % of Net Assets
Toyota Motor Corp. 4.3%Sony Corp. 2.1SoftBank Group Corp. 1.8Mitsubishi UFJ Financial Group, Inc. 1.7Keyence Corp. 1.7Nippon Telegraph & Telephone Corp. 1.5Takeda Pharmaceutical Co., Ltd. 1.3Shin-Etsu Chemical Co., Ltd. 1.3KDDI Corp. 1.3Honda Motor Co., Ltd. 1.2
TOTAL 18.2%
(The ten largest holdings are subject to change, and there are no guarantees the Fund will continue to remain invested inany particular company.)
Sector Breakdown as of September 30, 2019
% of Net Assets
Industrials 21.9%Consumer Discretionary 17.8Information Technology 10.8Financials 9.9Health Care 9.2Communication Services 8.6Consumer Staples 8.2Materials 5.7Real Estate 3.9Utilities 1.8Energy 0.8Short-Term Investments 10.0Liabilities in Excess of Other Assets (8.6)
TOTAL 100.0%
(The Fund’s sector breakdown is expressed as a percentage of net assets and may change over time.)
See accompanying notes to financial statements.29

S P D R S O L A C T I V E U N I T E D K I N G D O M E T FMANAGEMENT’S DISCUSSION OF FUND PERFORMANCE (UNAUDITED)
The SPDR Solactive United Kingdom ETF (the “Fund”) seeks to provide investment results that, before fees and expenses,correspond generally to the total return performance of an index based upon the equity market of United Kingdom. TheFund’s benchmark is the Solactive GBS United Kingdom Large & Mid Cap USD Index NTR (the “Index”).
For the 12-month period ended September 30, 2019 (the “Reporting Period”), the total return for the Fund was –2.77%,and the Index was –2.42%. The Fund and Index returns reflect the reinvestment of dividends and other income. The Fund’sperformance reflects the expenses of managing the Fund, including brokerage and advisory expenses. The Index isunmanaged and Index returns do not reflect fees and expenses of any kind, which would have a negative impact on returns.Fees, cash drag and cumulative effect of security misweights contributed to the difference between the Fund’sperformance and that of the Index.
For the reporting period, returns in UK lagged behind the broad EAFE region, which retuned –1.34%, and lagged behindS&P 500 index in the US, which returned 4.25%. Fourth quarter of 2018 was the weakest when in the middle of Brexitdisagreements Prime Minister Theresa May’s Brexit deal was swiftly met with cabinet resignations, a postponed vote inParliament as well as a leadership contest initiated by her own party. The Fund rebounded in the first quarter of 2019 asBrexit talks continued. Returns continued to be volatile in the second and third quarters ending the period at - 2.77%amidst weakness in the pound relative to the US dollar. The pound fell sharply in July as markets priced in a wider range ofBrexit options, including no deal, under the leadership of the new Prime Minister, Boris Johnson. The pound ultimately sankto around the lows reached in the fall of 2016 following the country’s vote to leave the European Union. While there wassignificant ongoing uncertainty surrounding Brexit, especially as Prime Minister Boris Johnson sought to suspendParliament just as MPs would have been returning from summer recess, the macro drivers of lower interest rates and oilprices appeared to weigh more heavily on the UK stock market. On a sector level, the top contributors to the Fund’sperformance during the Reporting Period were Health Care, Materials and Information Technology. The top negativecontributors to the Fund’s performance during the Reporting Period were Energy, Financials and Consumer Staples.
The Fund did not invest in derivatives during the Reporting Period.
On an individual security level, the top positive contributors to the Fund’s performance during the Reporting Period wereAstraZeneca PLC, Diageo plc, and GlaxoSmithKline plc. The top negative contributors to the Fund’s performance duringthe Reporting Period were Royal Dutch Shell Plc Class B, British American Tobacco p.l.c., and BP p.l.c.
The views expressed above reflect those of the Fund’s portfolio manager only through the Reporting Period, and do notnecessarily represent the views of the Adviser as a whole. Any such views are subject to change at any time based uponmarket or other conditions and the Adviser disclaims any responsibility to update such views. These views may not be reliedon as investment advice and, because investment decisions for a fund are based on numerous factors, may not be reliedon as an indication of trading intent on behalf of any fund.
See accompanying notes to financial statements.30

S P D R S O L A C T I V E U N I T E D K I N G D O M E T FPERFORMANCE SUMMARY (UNAUDITED)
Performance as of September 30, 2019
Cumulative Total Return Average Annual Total Return
NetAssetValue
MarketValue(1)
Solactive GBSUnited KingdomLarge & Mid CapUSD Index NTR(2)
NetAssetValue
MarketValue(1)
Solactive GBSUnited KingdomLarge & Mid CapUSD Index NTR(2)
ONE YEAR –2.77% –2.11% –2.42% –2.77% –2.11% –2.42%
FIVE YEARS 3.81% 4.18% 6.24% 0.75% 0.82% 1.22%
SINCE INCEPTION(3) –1.23% –0.79% 1.16% –0.23% –0.15% 0.22%
Comparison of Change in Value of a $10,000 Investment(Based on Net Asset Value)
SPDR Solactive United KingdomETF (a)(1)
Solactive GBS United KingdomLarge & Mid Cap USD Index NTR(b)(2)
$7,000
$8,000
$9,000
$10,000
$11,000
9/3
0/14
3/3
1/15
9/3
0/15
3/3
1/16
9/3
0/16
3/3
1/17
9/3
0/17
3/3
1/18
9/3
0/18
3/3
1/19
6/1
1/14
9/3
0/19
$10,116(b)(2)$9,877(a)(1)
Line graph is based on cumulative total return.
(1) Effective September 18, 2018, the Fund’s benchmark index changed from the MSCI United Kingdom Factor MixA-Series Capped Index to the Solactive GBS United Kingdom Large & Mid Cap USD Index NTR. The Fund’s performance inthe tables is based on the Fund’s prior investment strategy to track a different benchmark index for respective periods prior toSeptember 18, 2018.
(2) The Solactive GBS United Kingdom Large & Mid Cap USD Index NTR inception date was July 24, 2018. Index returnsrepresent the Fund’s prior benchmark index from June 11, 2014 through September 17, 2018 and the Solactive GBS UnitedKingdom Large & Mid Cap USD Index NTR from September 18, 2018 through September 30, 2019.
(3) For the period June 11, 2014 to September 30, 2019. Since shares of the Fund did not trade in the secondary market until theday after the Fund’s inception, for the period from inception to the first day of secondary market trading in shares of the Fund(6/11/14, 6/12/14, respectively), the NAV of the Fund is used as a proxy for the secondary market trading price to calculatemarket returns.
The total expense ratio for SPDR Solactive United Kingdom ETF as stated in the Fees and Expenses table of the most recent prospectus is 0.20% (0.14% after feewaiver). SSGA Funds Management, Inc. has contractually agreed to waive a portion of its management fee and/or reimburse certain expenses, until January 31, 2020,so that the net annual Fund operating expenses of the Fund, before application of any fees and expenses not paid by the Adviser pursuant to the InvestmentAdvisory Agreement, if any, are limited to 0.14% of the Fund’s average daily net assets.Performance quoted represents past performance, which is no guarantee of future results. Investment return and principal value will fluctuate, so you may have a gainor loss when shares are sold. Current performance may be higher or lower than that quoted. Visit www.spdrs.com for most recent month-end performance. Thereturns do not reflect the deduction of taxes that a shareholder would pay on Fund distributions or on the redemption or sale of Fund shares. See �Notes toPerformance Summaries� on page 1 for more information.
See accompanying notes to financial statements.31

S P D R S O L A C T I V E U N I T E D K I N G D O M E T FPORTFOLIO STATIST ICS (UNAUDITED)
Top Ten Holdings as of September 30, 2019
Description % of Net Assets
HSBC Holdings PLC 6.9%BP PLC 5.7Royal Dutch Shell PLC Class A 5.4AstraZeneca PLC 5.1Royal Dutch Shell PLC Class B 4.8GlaxoSmithKline PLC 4.7Diageo PLC 4.2British American Tobacco PLC 3.7Unilever PLC 2.9Rio Tinto PLC 2.4
TOTAL 45.8%
(The ten largest holdings are subject to change, and there are no guarantees the Fund will continue to remain invested inany particular company.)
Sector Breakdown as of September 30, 2019
% of Net Assets
Financials 19.8%Consumer Staples 16.8Energy 16.4Health Care 11.2Industrials 10.2Materials 7.2Consumer Discretionary 6.8Communication Services 5.9Utilities 3.1Real Estate 1.1Information Technology 1.0Other Assets in Excess of Liabilities 0.5
TOTAL 100.0%
(The Fund’s sector breakdown is expressed as a percentage of net assets and may change over time.)
See accompanying notes to financial statements.32

S P D R M S C I W O R L D S T R AT E G I C FA C T O R S E T FMANAGEMENT’S DISCUSSION OF FUND PERFORMANCE (UNAUDITED)
The SPDR MSCI World StrategicFactors ETF (the “Fund”) seeks to provide investment results that, before fees andexpenses, correspond generally to the total return performance of an index based upon the developed equity markets ofthe world. The Fund’s benchmark is the MSCI World Factor Mix A-Series Index (the “Index”).
For the 12-month period ended September 30, 2019 (the “Reporting Period”), the total return for the Fund was 4.99%, andthe Index was 5.07%. The Fund and Index returns reflect the reinvestment of dividends and other income. The Fund’sperformance reflects the expenses of managing the Fund, including brokerage and advisory expenses. The Index isunmanaged and Index returns do not reflect fees and expenses of any kind, which would have a negative impact on returns.
Management fees, cash and dividend drag, withholding tax rates differentials, cumulative effects of security mis-weightsand transaction costs contributed to the difference between the Fund’s performance and that of the Index.
Over the Reported Period, the Fund enjoyed a robust over performance relative to the MSCI World Index (+2.57%), andthis with a lower beta (0.85). Strong economic growth in North America, has led to record unemployment rates in bothCanada (5.7) and the USA (3.7%), have led to very strong equity markets in this region. However, trade tensions betweenthe US and China and fears of escalation in a trade war, led to a sharp increase in market volatility. The Federal Reserve,fearing a slowdown in the US economy was quick to act, by lowering the Federal Funds Target Rate. At the same time, theuncertainty around how Brexit will impact the United Kingdom and the rest of the European Union, contributed to negativeequity returns in most of the European markets. Asian equity markets enjoyed a mixed performance over the past year, withAustralia being the only one to exhibit positive return. Japan continues to experience very slow economic growth – realGDP turned negative in May of 2019 - and efforts to reinvigorate its prospects via expansive monetary and fiscal policy havenot delivered the expected outcome yet.
Over the past year, most of the added value, relative to its market capitalization-weighted parent index, the MSCI World,can be attributed to US market stocks in the Index. In other words, the stocks the Index overweights within the US marketrelative to the MSCI World Index, have led to over 2.4% out-performance relative to the parent Index. From a sectorperspective, Energy, Consumer Discretionary and Staples were the main contributors to the Fund’s out-performance, whileCommunication Services, Health Care and Industrials, added the least amount of value.
The Fund did not invest in derivatives during the Reporting Period.
On an individual security level, the top positive contributors to the Fund’s performance during the Reporting Period wereProcter & Gamble Company, Microsoft Corporation, and Roche Holding AG. The top negative contributors to the Fund’sperformance during the Reporting Period were Pfizer Inc., Altria Group Inc, and NVIDIA Corporation.
The views expressed above reflect those of the Fund’s portfolio manager only through the Reporting Period, and do notnecessarily represent the views of the Adviser as a whole. Any such views are subject to change at any time based uponmarket or other conditions and the Adviser disclaims any responsibility to update such views. These views may not be reliedon as investment advice and, because investment decisions for a fund are based on numerous factors, may not be reliedon as an indication of trading intent on behalf of any fund.
See accompanying notes to financial statements.33
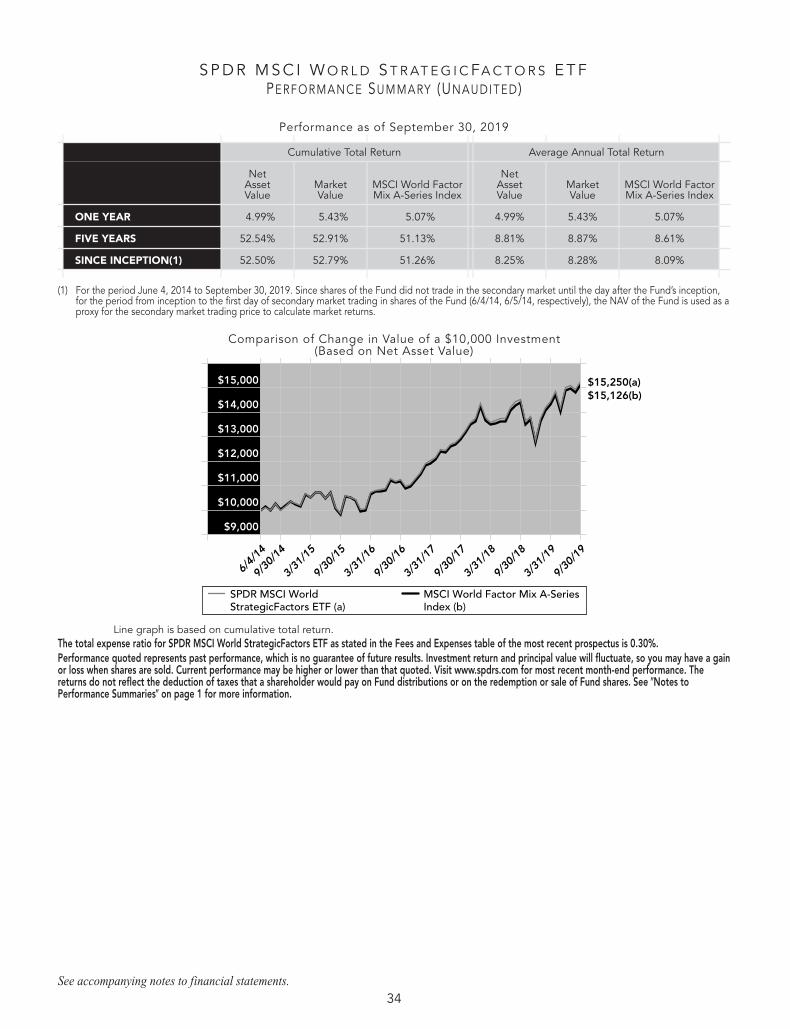
S P D R M S C I W O R L D S T R AT E G I C FA C T O R S E T FPERFORMANCE SUMMARY (UNAUDITED)
Performance as of September 30, 2019
Cumulative Total Return Average Annual Total Return
NetAssetValue
MarketValue
MSCI World FactorMix A-Series Index
NetAssetValue
MarketValue
MSCI World FactorMix A-Series Index
ONE YEAR 4.99% 5.43% 5.07% 4.99% 5.43% 5.07%
FIVE YEARS 52.54% 52.91% 51.13% 8.81% 8.87% 8.61%
SINCE INCEPTION(1) 52.50% 52.79% 51.26% 8.25% 8.28% 8.09%
(1) For the period June 4, 2014 to September 30, 2019. Since shares of the Fund did not trade in the secondary market until the day after the Fund’s inception,for the period from inception to the first day of secondary market trading in shares of the Fund (6/4/14, 6/5/14, respectively), the NAV of the Fund is used as aproxy for the secondary market trading price to calculate market returns.
Comparison of Change in Value of a $10,000 Investment(Based on Net Asset Value)
SPDR MSCI WorldStrategicFactors ETF (a)
MSCI World Factor Mix A-SeriesIndex (b)
$9,000
$10,000
$11,000
$12,000
$13,000
$14,000
$15,000
9/3
0/14
3/3
1/15
9/3
0/15
3/3
1/16
9/3
0/16
3/3
1/17
9/3
0/17
3/3
1/18
9/3
0/18
3/3
1/19
6
/4/1
4
9/3
0/19
$15,250(a)$15,126(b)
Line graph is based on cumulative total return.The total expense ratio for SPDR MSCI World StrategicFactors ETF as stated in the Fees and Expenses table of the most recent prospectus is 0.30%.Performance quoted represents past performance, which is no guarantee of future results. Investment return and principal value will fluctuate, so you may have a gainor loss when shares are sold. Current performance may be higher or lower than that quoted. Visit www.spdrs.com for most recent month-end performance. Thereturns do not reflect the deduction of taxes that a shareholder would pay on Fund distributions or on the redemption or sale of Fund shares. See �Notes toPerformance Summaries� on page 1 for more information.
See accompanying notes to financial statements.34

S P D R M S C I W O R L D S T R AT E G I C FA C T O R S E T FPORTFOLIO STATIST ICS (UNAUDITED)
Top Ten Holdings as of September 30, 2019
Description % of Net Assets
Apple, Inc. 2.5%Microsoft Corp. 2.1Johnson & Johnson 1.5Facebook, Inc. Class A 1.3Visa, Inc. Class A 1.3Procter & Gamble Co. 1.3Roche Holding AG 1.1Mastercard, Inc. Class A 1.0Alphabet, Inc. Class C 1.0PepsiCo, Inc. 1.0
TOTAL 14.1%
(The ten largest holdings are subject to change, and there are no guarantees the Fund will continue to remain invested inany particular company.)
Sector Breakdown as of September 30, 2019
% of Net Assets
Information Technology 18.4%Financials 15.1Health Care 11.7Consumer Staples 10.4Consumer Discretionary 10.1Industrials 9.9Communication Services 9.3Utilities 4.4Real Estate 4.0Materials 3.8Energy 2.3Short-Term Investments 1.4Liabilities in Excess of Other Assets (0.8)
TOTAL 100.0%
(The Fund’s sector breakdown is expressed as a percentage of net assets and may change over time.)
See accompanying notes to financial statements.35

S P D R S & P E M E R G I N G A S I A PA C I F I C E T FMANAGEMENT’S DISCUSSION OF FUND PERFORMANCE (UNAUDITED)
The SPDR S&P Emerging Asia Pacific ETF (the “Fund”) seeks to provide investment results that, before fees and expenses,correspond generally to the total return performance of an index based upon the emerging markets of the Asia Pacificregion. The Fund’s benchmark is the S&P Asia Pacific Emerging BMI Index (the “Index”).
For the 12-month period ended September 30, 2019 (the “Reporting Period”), the total return for the Fund was –1.56%,and the Index was –1.04%. The Fund and Index returns reflect the reinvestment of dividends and other income. The Fund’sperformance reflects the expenses of managing the Fund, including brokerage and advisory expenses. The Index isunmanaged and Index returns do not reflect fees and expenses of any kind, which would have a negative impact on returns.Fees and, expenses contributed to the difference between the Fund’s performance and that of the Index.
The S&P Asia Pacific Emerging BMI Index lost 7.53% in the final quarter of 2018 and delivered the worst quarterly returnduring this reporting period. Equity markets in Asia-Pacific were not immune to the risk aversion that permeated globalcapital markets during the fourth quarter. In China, various efforts emerged to prop up the economy but signs of slowergrowth weighed on the market and declined sharply on the quarter. China dropped sharply during October’s volatilitydespite a raft of policy support efforts including a reduction in the required reserve ratio for banks, a reduction in personalincome taxes as well as verbal intervention from Chinese President Xi Xinping promising “unwavering” support for theprivate sector. There were some signs of a bounce in November as industrial production and fixed asset investmentrebounded but industrial production fell back in December alongside weaker retail sales.
The first quarter of 2019 delivered the best quarterly Index return in this reporting period by gaining 11.78%. Early on inthe first quarter, emerging markets continued their string of outperformance, bolstered by an environment where the USdollar generally weakened and central banks reflected a more cautious tone with respect to tightening monetary policy.The renewal of trade talks between the United States and China also provided a boost to sentiment, and emerging marketsrebounded firmly. Chinese stocks exhibited a swift rise despite generally weak economic data and a host of warnings overthe future path of growth in the world’s second largest economy. For the fourth quarter, GDP growth in China slowed to6.4% which was the slowest rate of growth since 2009. Plummeting trade data also heightened concerns on global growthwhen exports were reported to have declined by 4.4% (year-on-year) in December and imports fell by 7.6%. But theChinese market was reinvigorated by the extension of the trade truce with the United States, and investors were alsocomforted by affirmations of policy support during China’s National People’s Congress in early March.
The Index lost .85% during second quarter of 2019. Emerging market equities were relatively flat during the secondquarter. However, the country dispersion was significant with roughly half of the broad emerging markets index marketcapitalization registering positive returns and half recording losses. The main driver of the relative EM weakness wasderived from poor performance in China. Confidence in an emerging market economic recovery was boosted early in theperiod when China reported a strong rebound in its NBS manufacturing PMI. The survey moved into expansion territory ata level of 50.5 and the reading represented the strongest monthly improvement in the index since 2012. China alsoreported positive economic surprises across February industrial production, fixed asset investment and a GDP releaseindicating China’s economy grew by 6.4% in the first quarter. That confidence was quickly wiped away in May as theChinese market faced the brunt of trade impediments, including fresh tariffs and new restrictions on Chinese telecomequipment maker Huawei. It did not help matters that Chinese retail sales (+7.2% year-on-year) grew at their slowest pacein 16 years in April or that industrial production (+5.4% year-on-year) advanced at its slowest rate in a decade. As if weakerdata and trade tensions weren’t sufficient to cast a cloud over Chinese equities, a government take-over of Baoshang Banksurprised markets and sparked contagion fears for China’s large financial services sector.
The Index ended up down 3.43% for the final quarter of this reporting period. The Index had one fleeting period of relativeoutperformance in early September as improving trade sentiment and slightly better than expected Chinese economicdata bolstered the emerging market complex. Outside of that period, this quarter was a tough one overall for the Index.Early in the quarter, emerging market equities followed the same path as other equity markets, with some progress earlyin July following the G20 trade truce and then losing steam in the latter part of the month. The Index was also negativelyimpacted by broader macroeconomic and geopolitical events, including the relatively disappointing comments from FedChair Powell at the end of July, the new tariffs announced by the United States and China’s devaluation of the yuan.
The Fund did not invest in derivatives during the Reporting Period.
On an individual security level, the top positive contributors to the Fund’s performance during the Reporting Period wereMeituan Dianping, United Integrated Services Co., Ltd., and PT Bank Central Asia Tbk. The top negative contributors to theFund’s performance during the Reporting Period were China Petroleum & Chemical Corporation Class H, Hon Hai PrecisionIndustry Co., Ltd., and Baidu, Inc. Sponsored ADR Class A.
See accompanying notes to financial statements.36

S P D R S & P E M E R G I N G A S I A PA C I F I C E T FM A N A G E M E N T ’ S D I S C U S S I O N O F F U N D P E R F O R M A N C E ( U N A U D I T E D ) ( C O N T I N U E D )
The views expressed above reflect those of the Fund’s portfolio manager only through the Reporting Period, and do notnecessarily represent the views of the Adviser as a whole. Any such views are subject to change at any time based uponmarket or other conditions and the Adviser disclaims any responsibility to update such views. These views may not be reliedon as investment advice and, because investment decisions for a fund are based on numerous factors, may not be reliedon as an indication of trading intent on behalf of any fund.
See accompanying notes to financial statements.37

S P D R S & P E M E R G I N G A S I A PA C I F I C E T FPERFORMANCE SUMMARY (UNAUDITED)
Performance as of September 30, 2019
Cumulative Total Return Average Annual Total Return
NetAssetValue
MarketValue
S&P Asia PacificEmerging BMI
Index
NetAssetValue
MarketValue
S&P Asia PacificEmerging BMI
Index
ONE YEAR –1.56% –1.35% –1.04% –1.56% –1.35% –1.04%
FIVE YEARS 25.51% 25.03% 25.54% 4.65% 4.57% 4.65%
TEN YEARS 73.71% 72.75% 77.91% 5.68% 5.62% 5.93%
Comparison of Change in Value of a $10,000 Investment(Based on Net Asset Value)
SPDR S&P Emerging Asia PacificETF (a)
S&P Asia Pacific Emerging BMIIndex (b)
$8,000
$12,000
$16,000
$20,000
9/3
0/10
9/3
0/11
9/3
0/12
9/3
0/13
9/3
0/14
9/3
0/15
9/3
0/16
9/3
0/17
9/3
0/18
9/3
0/09
9/3
0/19
$17,791(b)$17,371(a)
Line graph is based on cumulative total return.The total expense ratio for SPDR S&P Emerging Asia Pacific ETF as stated in the Fees and Expenses table of the most recent prospectus is 0.49%.Performance quoted represents past performance, which is no guarantee of future results. Investment return and principal value will fluctuate, so you may have a gainor loss when shares are sold. Current performance may be higher or lower than that quoted. Visit www.spdrs.com for most recent month-end performance. Thereturns do not reflect the deduction of taxes that a shareholder would pay on Fund distributions or on the redemption or sale of Fund shares. See �Notes toPerformance Summaries� on page 1 for more information.
See accompanying notes to financial statements.38

S P D R S & P E M E R G I N G A S I A PA C I F I C E T FPORTFOLIO STATIST ICS (UNAUDITED)
Top Ten Holdings as of September 30, 2019
Description % of Net Assets
Alibaba Group Holding, Ltd. ADR 6.1%Tencent Holdings, Ltd. 5.7Taiwan Semiconductor Manufacturing Co., Ltd. ADR 4.0China Construction Bank Corp. Class H 2.0HDFC Bank, Ltd. 1.6Ping An Insurance Group Co. of China, Ltd. Class H 1.5Reliance Industries, Ltd. GDR 1.4Housing Development Finance Corp., Ltd. 1.3Industrial & Commercial Bank of China, Ltd. Class H 1.3China Mobile, Ltd. 1.1
TOTAL 26.0%
(The ten largest holdings are subject to change, and there are no guarantees the Fund will continue to remain invested inany particular company.)
Sector Breakdown as of September 30, 2019
% of Net Assets
Financials 22.2%Information Technology 16.1Consumer Discretionary 15.8Communication Services 12.1Industrials 6.5Consumer Staples 6.5Energy 5.4Materials 5.3Health Care 4.1Real Estate 3.4Utilities 2.4Short-Term Investments 1.0Liabilities in Excess of Other Assets (0.8)
TOTAL 100.0%
(The Fund’s sector breakdown is expressed as a percentage of net assets and may change over time.)
See accompanying notes to financial statements.39
S P D R S & P G L O B A L D I V I D E N D E T FMANAGEMENT’S DISCUSSION OF FUND PERFORMANCE (UNAUDITED)
The SPDR S&P Global Dividend ETF (the “Fund”) seeks to provide investment results that, before fees and expenses,correspond generally to the total return of an index that tracks stocks of global companies that offer high dividend yields.The Fund’s benchmark is the S&P Global Dividend Aristocrats Index (the “Index”).
For the 12-month period ended September 30, 2019 (the “Reporting Period”), the total return for the Fund was 3.98%, andthe Index was 3.84%. The Fund and Index returns reflect the reinvestment of dividends and other income. The Fund’sperformance reflects the expenses of managing the Fund, including brokerage and advisory expenses. The Index isunmanaged and Index returns do not reflect fees and expenses of any kind, which would have a negative impact on returns.Fees, dividend tax withholding differences, cash, and small security misweights contributed to the difference between theFund’s performance and that of the Index.
The performance throughout Reporting Period was quite volatile. Six of the twelve months posted positive returns; swingsfrom month to month were very large in many cases. During the first few months of this Reporting Period (calendar Q4 of2018), US equities exhibited their worst quarterly performance since 2011. Although volatility prevailed during the entiretyof the quarter, October and December were particularly vicious. Both months started out with building optimism based onimproved outlooks for trade deals. In October, the United States, Canada and Mexico came to terms on a trade agreementwhich briefly lifted spirits. Meanwhile, December’s arrival was met with a trade truce between the United States and Chinabased on discussions at the G20 meeting in Argentina. However, a host of factors relating to rising interest rates, economicgrowth concerns and systematic or algorithmic trading strategies stifled those short-lived rallies and sent the Index down–7.50% for the quarter.
The first quarter of 2019 posted a return of 7.95% for the Index, a full reversion of the previous quarter’s negativeperformance. Lowered growth expectations was a global about-face on the part of central banks and a reason to shift awayfrom their tilt toward tighter monetary policy. That shift, together with skeptical sentiment, less-than-aggressivepositioning, and economic data that was sufficiently mixed to ward off immediate recession fears, allowed the Index toadvance during the first quarter of 2019. Early in April, global equity markets rose on indications that US and Chinese tradeofficials had resolved a number of outstanding issues. Some upside surprises in economic data, particularly in China,reinforced the continued recovery in stock prices. In May, trade conflicts and developments between the United States andthe rest of the world took center stage, battering equity markets. As May turned to June, liquidity returned and anotherwave of central bank accommodation was the proximate source of the moves with both the European Central Bank and theFed indicating that further policy tools and interest rate cuts would be used to support economic growth. The third quarterof 2019, the last quarter of the Reporting Period, continued to experience volatility, but ended relatively flat at 0.94%.
Throughout the Reporting Period, the performance of the sectors were quite varied as well, ranging from –19.80% to+12.24%. The top performing sectors were Utilities, Consumer Discretionary and Financials. The bottom performingsectors were Energy, Materials, and Health Care.
The Fund did not invest in derivatives during the Reporting Period.
On an individual security level, the top positive contributors to the Fund’s performance during the Reporting Period wereGreene King plc, Southern Company, and Emera Incorporated. The top negative contributors to the Fund’s performanceduring the Reporting Period were Occidental Petroleum Corporation, Helmerich & Payne, Inc., and Owens & Minor, Inc.
The views expressed above reflect those of the Fund’s portfolio manager only through the Reporting Period, and do notnecessarily represent the views of the Adviser as a whole. Any such views are subject to change at any time based uponmarket or other conditions and the Adviser disclaims any responsibility to update such views. These views may not be reliedon as investment advice and, because investment decisions for a fund are based on numerous factors, may not be reliedon as an indication of trading intent on behalf of any fund.
See accompanying notes to financial statements.40

S P D R S & P G L O B A L D I V I D E N D E T FPERFORMANCE SUMMARY (UNAUDITED)
Performance as of September 30, 2019
Cumulative Total Return Average Annual Total Return
NetAssetValue
MarketValue
S&P GlobalDividend
Aristocrats Index
NetAssetValue
MarketValue
S&P GlobalDividend
Aristocrats Index
ONE YEAR 3.98% 3.99% 3.84% 3.98% 3.99% 3.84%
FIVE YEARS 28.90% 29.02% 27.65% 5.21% 5.23% 5.00%
SINCE INCEPTION(1) 46.84% 46.77% 45.20% 6.24% 6.24% 6.06%
(1) For the period May 29, 2013 to September 30, 2019. Since shares of the Fund did not trade in the secondary market until the day after the Fund’s inception,for the period from inception to the first day of secondary market trading in shares of the Fund (5/29/13, 5/30/13, respectively), the NAV of the Fund is usedas a proxy for the secondary market trading price to calculate market returns.
Comparison of Change in Value of a $10,000 Investment(Based on Net Asset Value)
SPDR S&P Global Dividend ETF(a)
S&P Global Dividend AristocratsIndex (b)
$8,000
$10,000
$12,000
$14,000
9/3
0/13
9/3
0/14
9/3
0/15
9/3
0/16
9/3
0/17
9/3
0/18
5/2
9/13
9/3
0/19
$14,684(a)$14,520(b)
Line graph is based on cumulative total return.The total expense ratio for SPDR S&P Global Dividend ETF as stated in the Fees and Expenses table of the most recent prospectus is 0.40%.Performance quoted represents past performance, which is no guarantee of future results. Investment return and principal value will fluctuate, so you may have a gainor loss when shares are sold. Current performance may be higher or lower than that quoted. Visit www.spdrs.com for most recent month-end performance. Thereturns do not reflect the deduction of taxes that a shareholder would pay on Fund distributions or on the redemption or sale of Fund shares. See �Notes toPerformance Summaries� on page 1 for more information.
See accompanying notes to financial statements.41

S P D R S & P G L O B A L D I V I D E N D E T FPORTFOLIO STATIST ICS (UNAUDITED)
Top Ten Holdings as of September 30, 2019
Description % of Net Assets
Hennes & Mauritz AB Class B 1.8%AT&T, Inc. 1.6Greene King PLC 1.6IGM Financial, Inc. 1.6Compass Minerals International, Inc. 1.5WPP PLC 1.4Klepierre SA REIT 1.4Power Financial Corp. 1.4IG Group Holdings PLC 1.4Power Corp. of Canada 1.4
TOTAL 15.1%
(The ten largest holdings are subject to change, and there are no guarantees the Fund will continue to remain invested inany particular company.)
Sector Breakdown as of September 30, 2019
% of Net Assets
Financials 24.4%Utilities 14.8Communication Services 11.9Real Estate 10.2Industrials 9.3Consumer Staples 7.7Consumer Discretionary 7.3Energy 6.5Health Care 3.6Information Technology 2.2Materials 1.5Short-Term Investments 5.3Liabilities in Excess of Other Assets (4.7)
TOTAL 100.0%
(The Fund’s sector breakdown is expressed as a percentage of net assets and may change over time.)
See accompanying notes to financial statements.42

S P D R S & P G L O B A L I N F R A S T R U C T U R E E T FMANAGEMENT’S DISCUSSION OF FUND PERFORMANCE (UNAUDITED)
The SPDR S&P Global Infrastructure ETF (the “Fund”) seeks to provide investment results that, before fees and expenses,correspond generally to the total return performance of an index based upon the global infrastructure industry market. TheFund’s benchmark is the S&P Global Infrastructure Index (the “Index”).
For the 12-month period ended September 30, 2019 (the “Reporting Period”), the total return for the Fund was 13.76%,and the Index was 13.47%. The Fund and Index returns reflect the reinvestment of dividends and other income. The Fund’sperformance reflects the expenses of managing the Fund, including brokerage and advisory expenses. The Index isunmanaged and Index returns do not reflect fees and expenses of any kind, which would have a negative impact on returns.Cash drag/cumulative effect of security misweights/tax withholdings contributed to the difference between the Fund’sperformance and that of the Index.
It is said that the return performance of an Infrastructure index tends to track the broader economic environment. All threesectors within the Index; Energy, Industrials and Utilities posted a positive contribution during the Reporting Period. Thefirst quarter of the Reporting Period was the Index’s worst performing at a lackluster –5.34%. Uncertainty associated witherratic policy decisions regarding interest rates, International volatility, as well as the US and China trade wars contributedto global markets decline to end 2018. On a positive note, the Index mirrored the reversion that global marketsexperienced to start the New Year. The Index posted a return greater than 13% during the first 3 months of 2019 which isnot surprising as all equity Sectors posted positive gains on the period. Transportation in particular did quite well due toa substantial surge in manufactured goods along with massive tax hauls and business friendly policies help to increasetraffic growth of intermodal volumes. The Index would then begin to settle down and post modest gains for the rest of theperiod in question. While US equities overall posted modestly constructive results for the third quarter, it was the moreinterest rate-sensitive and defensive sectors that established leadership over the period. Utilities were the top performingS&P 500 sector, with a gain of 9.1%. The flight to safety and dramatic decline in interest rates bolstered the relatively strongresults from these defensive and interest rate-sensitive sectors. Relative outperformance was particularly acute in Augustand the second half of September – in line with periods when interest rates were falling most significantly.
The Fund did not invest in derivatives during the Reporting Period.
On an individual security level, the top positive contributors to the Fund’s performance during the Reporting Period wereNextEra Energy, Inc., Transurban Group Ltd., and Iberdrola SA. The top negative contributors to the Fund’s performanceduring the Reporting Period were Grupo Aeroportuario del Sureste SA de CV Sponsored ADR Class B, Aeroports de ParisSA, and PG&E Corporation.
The views expressed above reflect those of the Fund’s portfolio manager only through the Reporting Period, and do notnecessarily represent the views of the Adviser as a whole. Any such views are subject to change at any time based uponmarket or other conditions and the Adviser disclaims any responsibility to update such views. These views may not be reliedon as investment advice and, because investment decisions for a fund are based on numerous factors, may not be reliedon as an indication of trading intent on behalf of any fund.
See accompanying notes to financial statements.43

S P D R S & P G L O B A L I N F R A S T R U C T U R E E T FPERFORMANCE SUMMARY (UNAUDITED)
Performance as of September 30, 2019
Cumulative Total Return Average Annual Total Return
NetAssetValue
MarketValue(2)
S&P GlobalInfrastructure
Index(2)
NetAssetValue
MarketValue(2)
S&P GlobalInfrastructure
Index(2)
ONE YEAR 13.76% 13.91% 13.47% 13.76% 13.91% 13.47%
FIVE YEARS 28.20% 28.70% 26.45% 5.09% 5.18% 4.81%
TEN YEARS(1) 81.18% 81.42% 84.56% 6.12% 6.14% 6.32%
(1) Effective May 1, 2013, the Fund changed its benchmark index from the Macquarie Global Infrastructure 100 Index to the S&P Global Infrastructure Index. TheFund’s performance in the table above is based on the Fund’s prior investment strategy to track a different benchmark index for periods prior to May 1, 2013.
(2) Index returns represent the Fund’s prior investment strategy from September 30, 2008 through April 30, 2013 and the S&P Global Infrastructure Index fromMay 1, 2013 through September 30, 2019.
Comparison of Change in Value of a $10,000 Investment(Based on Net Asset Value)
SPDR S&P Global InfrastructureETF (a) (1)
S&P Global Infrastructure Index(b) (2)
$8,000
$10,000
$12,000
$14,000
$16,000
$18,000
$20,000
9/3
0/10
9/3
0/11
9/3
0/12
9/3
0/13
9/3
0/14
9/3
0/15
9/3
0/16
9/3
0/17
9/3
0/18
9/3
0/09
9/3
0/19
$18,456(b)(2)$18,118(a)(1)
Line graph is based on cumulative total return.The total expense ratio for SPDR S&P Global Infrastructure ETF as stated in the Fees and Expenses table of the most recent prospectus is 0.40%.Performance quoted represents past performance, which is no guarantee of future results. Investment return and principal value will fluctuate, so you may have a gainor loss when shares are sold. Current performance may be higher or lower than that quoted. Visit www.spdrs.com for most recent month-end performance. Thereturns do not reflect the deduction of taxes that a shareholder would pay on Fund distributions or on the redemption or sale of Fund shares. See �Notes toPerformance Summaries� on page 1 for more information.
See accompanying notes to financial statements.44

S P D R S & P G L O B A L I N F R A S T R U C T U R E E T FPORTFOLIO STATIST ICS (UNAUDITED)
Top Ten Holdings as of September 30, 2019
Description % of Net Assets
Aena SME SA 5.0%NextEra Energy, Inc. 4.9Transurban Group Stapled Security 4.9Enbridge, Inc. 4.6Atlantia SpA 4.2TC Energy Corp. 3.3Duke Energy Corp. 3.0Dominion Energy, Inc. 2.9Southern Co. 2.8Kinder Morgan, Inc. 2.7
TOTAL 38.3%
(The ten largest holdings are subject to change, and there are no guarantees the Fund will continue to remain invested inany particular company.)
Industry Breakdown as of September 30, 2019
% of Net Assets
Transportation Infrastructure 39.5%Electric Utilities 25.5Oil, Gas & Consumable Fuels 19.6Multi-Utilities 12.6Water Utilities 1.5Gas Utilities 0.8Independent Power & Renewable Electricity Producers 0.1Short-Term Investments 0.7Liabilities in Excess of Other Assets (0.3)
TOTAL 100.0%
(The Fund’s industry breakdown is expressed as a percentage of net assets and may change over time.)
See accompanying notes to financial statements.45

S P D R S O L A C T I V E H O N G K O N G E T FMANAGEMENT’S DISCUSSION OF FUND PERFORMANCE (UNAUDITED)
The SPDR Solactive Hong Kong ETF (the “Fund”) seeks to provide investment results that, before fees and expenses,correspond generally to the total return performance of an index based upon the equity market of Hong Kong. The Fund’sbenchmark is the Solactive GBS Hong Kong Large & Mid Cap USD Index NTR (the “Index”).
For the 12-month period ended September 30, 2019 (the “Reporting Period”), the total return for the Fund was –1.29%,and the Index was –1.11%. The Fund and Index returns reflect the reinvestment of dividends and other income. The Fund’sperformance reflects the expenses of managing the Fund, including brokerage and advisory expenses. The Index isunmanaged and Index returns do not reflect fees and expenses of any kind, which would have a negative impact on returns.Fees and expenses and cash drag contributed to the difference between the Fund’s performance and that of the Index.
The reporting period started with a global downturn in the fourth quarter that was driven by growth concerns and risk-offsentiment. Hong Kong held up well relative to regional peers with a quarterly return of –4.5% as its real-estate heavymarket was supported by lower interest rates. A strong recovery in the first quarter of 2019 was quickly overshadowed bypolitical turbulence in the country. Hong Kong’s government proposed a new law that expanded the legal framework ofextradition to countries previously uncovered, including mainland China. In response, massive demonstrations andprotests against the law took place. Hong Kong Chief Executive Carrie Lam’s announcement that she would withdraw theextradition bill did not reverse the market’s course, as protests continued and the market lost much of the ground it hadmade earlier in the year with a –10.71% drop in the third quarter of 2019.
The Fund did not invest in derivatives during the Reporting Period.
On an individual security level, the top positive contributors to the Fund’s performance during the Reporting Period wereAIA Group Limited, Link Real Estate Investment Trust, and Hong Kong Exchanges & Clearing Ltd.. The top negativecontributors to the Fund’s performance during the Reporting Period were Fullshare Holdings Limited, Hang Seng Bank,Limited, and CK Hutchison Holdings Ltd.
The views expressed above reflect those of the Fund’s portfolio manager only through the Reporting Period, and do notnecessarily represent the views of the Adviser as a whole. Any such views are subject to change at any time based uponmarket or other conditions and the Adviser disclaims any responsibility to update such views. These views may not be reliedon as investment advice and, because investment decisions for a fund are based on numerous factors, may not be reliedon as an indication of trading intent on behalf of any fund.
See accompanying notes to financial statements.46

S P D R S O L A C T I V E H O N G K O N G E T FPERFORMANCE SUMMARY (UNAUDITED)
Performance as of September 30, 2019
Cumulative Total Return Average Annual Total Return
NetAssetValue
MarketValue
Solactive GBS HongKong Large & Mid
Cap USD IndexNTR
NetAssetValue
MarketValue
Solactive GBS HongKong Large & Mid
Cap USD IndexNTR
ONE YEAR –1.29% –1.31% –1.11% –1.29% –1.31% –1.11%
SINCE INCEPTION(1) 0.04% –0.13% 0.20% 0.04% –0.13% 0.20%
(1) For the period ended September 18, 2018 to September 30, 2019. Since shares of the Fund did not trade in the secondary market until the day after theFund’s inception, for the period from inception to the first day of secondary market trading in shares of the Fund (9/18/18, 9/19/18, respectively), the NAV ofthe Fund is used as a proxy for the secondary market trading price to calculate market returns.
Comparison of Change in Value of a $10,000 Investment(Based on Net Asset Value)
SPDR Solactive Hong Kong ETF(a)
Solactive GBS Hong Kong Large& Mid Cap USD Index NTR (b)
$8,000
$8,500
$9,000
$9,500
$10,000
$10,500
$11,000
$11,500
12/3
1/18
3/3
1/19
6/3
0/19
9/1
8/18
9/3
0/19
$10,020(b)$10,004(a)
Line graph is based on cumulative total return.The total expense ratio for SPDR Solactive Hong Kong ETF as stated in the Fees and Expenses table of the most recent prospectus is 0.20%(0.14% after fee waiver).SSGA Funds Management, Inc. has contractually agreed to waive a portion of its management fee and/or reimburse certain expenses, until January 31, 2020, so thatthe net annual Fund operating expenses of the Fund, before application of any fees and expenses not paid by the Adviser pursuant to the Investment AdvisoryAgreement, if any, are limited to 0.14% of the Fund’s average daily net assets..Performance quoted represents past performance, which is no guarantee of future results. Investment return and principal value will fluctuate, so you may have a gainor loss when shares are sold. Current performance may be higher or lower than that quoted. Visit www.spdrs.com for most recent month-end performance. Thereturns do not reflect the deduction of taxes that a shareholder would pay on Fund distributions or on the redemption or sale of Fund shares. See �Notes toPerformance Summaries� on page 1 for more information.
See accompanying notes to financial statements.47

S P D R S O L A C T I V E H O N G K O N G E T FPORTFOLIO STATIST ICS (UNAUDITED)
Top Ten Holdings as of September 30, 2019
Description % of Net Assets
AIA Group, Ltd. 22.6%Hong Kong Exchanges & Clearing, Ltd. 6.8CK Hutchison Holdings, Ltd. 4.7Link REIT 4.5Sun Hung Kai Properties, Ltd. 4.1Hong Kong & China Gas Co., Ltd. 3.8CLP Holdings, Ltd. 3.8CK Asset Holdings, Ltd. 3.3Hang Seng Bank, Ltd. 3.1Jardine Matheson Holdings, Ltd. 2.7
TOTAL 59.4%
(The ten largest holdings are subject to change, and there are no guarantees the Fund will continue to remain invested inany particular company.)
Sector Breakdown as of September 30, 2019
% of Net Assets
Financials 33.4%Real Estate 23.5Industrials 13.1Utilities 12.1Consumer Discretionary 9.1Health Care 4.5Consumer Staples 2.2Communication Services 1.1Information Technology 0.7Short-Term Investment 0.0Other Assets in Excess of Liabilities 0.3
TOTAL 100.0%
(The Fund’s sector breakdown is expressed as a percentage of net assets and may change over time.)
See accompanying notes to financial statements.48

Security Description Shares Value
COMMON STOCKS — 99.7%AUSTRIA — 6.0%ANDRITZ AG. . . . . . . . . . . . . . . 4,100 $ 167,618IMMOFINANZ AG . . . . . . . . . . . 5,362 149,356Raiffeisen Bank International AG. . . 7,776 180,484Verbund AG . . . . . . . . . . . . . . . . 3,789 207,365Voestalpine AG . . . . . . . . . . . . . . 6,500 149,379Wienerberger AG . . . . . . . . . . . . . 6,677 162,619
1,016,821
BELGIUM — 8.3%Ackermans & van Haaren NV . . . . . 1,288 195,743Aedifica SA REIT . . . . . . . . . . . . 1,412 163,480Cofinimmo SA REIT . . . . . . . . . . 1,401 197,336Colruyt SA . . . . . . . . . . . . . . . . . 3,365 184,453Elia System Operator SA . . . . . . . . 1,935 158,215Sofina SA . . . . . . . . . . . . . . . . . 894 198,826Telenet Group Holding NV. . . . . . . 2,508 118,392Warehouses De Pauw CVA REIT. . . 1,009 185,242
1,401,687
FINLAND — 5.7%Huhtamaki Oyj . . . . . . . . . . . . . . 5,496 219,178Kesko Oyj Class B . . . . . . . . . . . . 3,920 247,697Konecranes Oyj . . . . . . . . . . . . . . 3,752 120,340Orion Oyj Class B . . . . . . . . . . . . 5,994 223,616Valmet Oyj . . . . . . . . . . . . . . . . . 7,665 148,827
959,658
FRANCE — 25.7%Air France-KLM (a) . . . . . . . . . . . 13,369 139,948Alten SA . . . . . . . . . . . . . . . . . . 1,658 189,431Altran Technologies SA . . . . . . . . . 13,002 204,258Amundi SA (b) . . . . . . . . . . . . . . 3,473 242,321BioMerieux . . . . . . . . . . . . . . . . 2,446 202,397Bollore SA . . . . . . . . . . . . . . . . . 52,538 217,767Casino Guichard Perrachon SA (c) . . 3,011 143,745Christian Dior SE. . . . . . . . . . . . . 267 126,388CNP Assurances . . . . . . . . . . . . . 8,574 165,729Dassault Aviation SA . . . . . . . . . . 133 188,206Elis SA . . . . . . . . . . . . . . . . . . . 11,143 197,042Eurazeo SE. . . . . . . . . . . . . . . . . 2,523 187,727Eutelsat Communications SA . . . . . 8,818 164,148Faurecia SE . . . . . . . . . . . . . . . . 4,251 201,691ICADE REIT . . . . . . . . . . . . . . . 1,611 144,105Iliad SA . . . . . . . . . . . . . . . . . . . 1,631 153,309JCDecaux SA . . . . . . . . . . . . . . . 4,328 117,205Lagardere SCA . . . . . . . . . . . . . . 6,006 132,919Remy Cointreau SA (c) . . . . . . . . . 1,231 163,460Rexel SA . . . . . . . . . . . . . . . . . . 17,453 186,810Sartorius Stedim Biotech . . . . . . . . 1,360 190,375SEB SA . . . . . . . . . . . . . . . . . . . 1,391 211,244Sopra Steria Group . . . . . . . . . . . . 951 118,504SPIE SA . . . . . . . . . . . . . . . . . . 7,377 147,739Wendel SA . . . . . . . . . . . . . . . . . 1,590 219,451
4,355,919
Security Description Shares Value
GERMANY — 21.4%alstria office REIT-AG . . . . . . . . . 9,117 $ 156,445Bechtle AG. . . . . . . . . . . . . . . . . 1,566 159,372Carl Zeiss Meditec AG . . . . . . . . . 2,100 239,473CTS Eventim AG & Co. KGaA . . . . 3,138 176,868Evotec SE (a) . . . . . . . . . . . . . . . 7,018 156,234Fraport AG Frankfurt Airport
Services Worldwide . . . . . . . . . 2,127 180,453Freenet AG . . . . . . . . . . . . . . . . . 7,371 151,798Fuchs Petrolub SE Preference
Shares . . . . . . . . . . . . . . . . . . 4,000 150,273Gerresheimer AG . . . . . . . . . . . . . 1,626 116,641Grand City Properties SA. . . . . . . . 5,950 133,885GRENKE AG . . . . . . . . . . . . . . . 1,580 130,222Hella GmbH & Co. KGaA . . . . . . . 2,558 114,394HOCHTIEF AG. . . . . . . . . . . . . . 1,284 146,421K+S AG. . . . . . . . . . . . . . . . . . . 10,983 152,245KION Group AG . . . . . . . . . . . . . 3,728 196,101METRO AG . . . . . . . . . . . . . . . . 9,669 152,636MorphoSys AG (a) . . . . . . . . . . . . 1,827 201,371Nemetschek SE . . . . . . . . . . . . . . 3,110 158,744OSRAM Licht AG . . . . . . . . . . . . 5,559 244,538ProSiebenSat.1 Media SE. . . . . . . . 12,374 170,515TAG Immobilien AG. . . . . . . . . . . 8,408 191,945Telefonica Deutschland Holding AG . 52,698 146,961
3,627,535
IRELAND — 1.7%AIB Group PLC. . . . . . . . . . . . . . 45,120 133,993Glanbia PLC (d) . . . . . . . . . . . . . 11,561 143,683Glanbia PLC (d) . . . . . . . . . . . . . 109 1,382
279,058
ITALY — 12.0%A2A SpA . . . . . . . . . . . . . . . . . . 89,885 165,020Amplifon SpA. . . . . . . . . . . . . . . 7,154 175,484Banco BPM SpA (a)(c) . . . . . . . . . 86,954 177,650DiaSorin SpA . . . . . . . . . . . . . . . 1,495 173,905Hera SpA (c). . . . . . . . . . . . . . . . 44,732 183,656Interpump Group SpA. . . . . . . . . . 4,919 155,518Italgas SpA. . . . . . . . . . . . . . . . . 28,074 181,250Nexi SpA (a)(b) . . . . . . . . . . . . . . 14,399 146,869Pirelli & C SpA (b). . . . . . . . . . . . 21,952 129,903Recordati SpA. . . . . . . . . . . . . . . 5,784 248,193Saipem SpA (a) . . . . . . . . . . . . . . 33,115 149,895Unione di Banche Italiane SpA . . . . 53,710 150,837
2,038,180
LUXEMBOURG — 0.6%RTL Group SA . . . . . . . . . . . . . . 2,215 106,541
NETHERLANDS — 10.8%Aalberts NV . . . . . . . . . . . . . . . . 5,505 218,216Altice Europe NV (a)(c) . . . . . . . . 32,920 172,269ASM International NV . . . . . . . . . 2,790 256,959Euronext NV (b) . . . . . . . . . . . . . 3,059 250,286IMCD NV . . . . . . . . . . . . . . . . . 3,019 223,316Koninklijke Vopak NV . . . . . . . . . 3,804 195,578
SPDR EURO STOXX SMALL CAP ETFSCHEDULE OF INVESTMENTSSeptember 30, 2019
See accompanying notes to financial statements.49

Security Description Shares Value
SBM Offshore NV . . . . . . . . . . . . 9,397 $ 156,230Signify NV (b) . . . . . . . . . . . . . . 6,263 172,269Takeaway.com NV (a)(b) . . . . . . . . 2,272 181,312
1,826,435
PORTUGAL — 1.4%Jeronimo Martins SGPS SA . . . . . . 14,037 236,892
SPAIN — 5.0%Bankia SA . . . . . . . . . . . . . . . . . 67,524 127,537Bolsas y Mercados Espanoles
SHMSF SA. . . . . . . . . . . . . . . 4,232 106,946Inmobiliaria Colonial Socimi SA
REIT . . . . . . . . . . . . . . . . . . . 15,528 187,400Mapfre SA . . . . . . . . . . . . . . . . . 57,216 154,133Siemens Gamesa Renewable Energy
SA (c) . . . . . . . . . . . . . . . . . . 12,873 174,725Viscofan SA . . . . . . . . . . . . . . . . 2,037 95,492
846,233
UNITED KINGDOM — 1.1%Dialog Semiconductor PLC (a) . . . . 3,744 177,269
TOTAL COMMON STOCKS(Cost $18,562,490) . . . . . . . . . . 16,872,228
SHORT-TERM INVESTMENTS — 2.6%State Street Institutional Liquid
Reserves Fund, Premier Class2.03% (e) (f) . . . . . . . . . . . . . . 45 45
State Street Navigator SecuritiesLending Portfolio III (g) (h) . . . . 440,165 440,165
TOTAL SHORT-TERM INVESTMENTS(Cost $440,210) . . . . . . . . . . . . . . . . . . . . . . . 440,210
TOTAL INVESTMENTS — 102.3%(Cost $19,002,700) . . . . . . . . . . . . . . . . . . . . . 17,312,438
LIABILITIES IN EXCESS OF OTHER ASSETS— (2.3)% . . . . . . . . . . . . . . . . . . . . . . . . . . (383,992)
NET ASSETS — 100.0% . . . . . . . . . . . . . . . . . $ 16,928,446
(a) Non-income producing security.(b) Securities purchased pursuant to Rule 144A of the Securities Act
of 1933, as amended. These securities, which represent 6.6% ofnet assets as of September 30, 2019, are considered liquid andmay be resold in transactions exempt from registration, normallyto qualified institutional buyers.
(c) All or a portion of the shares of the security are on loan atSeptember 30, 2019.
(d) Reflects separate holdings of the issuer’s common stock traded ondifferent securities exchanges.
(e) The Fund invested in certain money market funds managed bySSGA Funds Management, Inc. Amounts related to thesetransactions during the period ended September 30, 2019 areshown in the Affiliate Table below.
(f) The rate shown is the annualized seven-day yield at September 30,2019.
(g) The Fund invested in an affiliated entity. Amounts related to thesetransactions during the period ended September 30, 2019 areshown in the Affiliate Table below.
(h) Investment of cash collateral for securities loaned.
REIT Real Estate Investment Trust
The following table summarizes the value of the Fund’s investments according to the fair value hierarchy as of September 30,2019.
DescriptionLevel 1 –
Quoted Prices
Level 2 –Other SignificantObservable Inputs
Level 3 –Significant
Unobservable Inputs Total
ASSETS:INVESTMENTS:Common Stocks . . . . . . . . . . . . . . . . . . . . . . . . . . . . . . . . . . . . . $16,872,228 $— $— $16,872,228
Short-Term Investments . . . . . . . . . . . . . . . . . . . . . . . . . . . . . . . . 440,210 — — 440,210
TOTAL INVESTMENTS . . . . . . . . . . . . . . . . . . . . . . . . . . . . . . $17,312,438 $— $— $17,312,438
SPDR EURO STOXX SMALL CAP ETFSCHEDULE OF INVESTMENTS (continued)September 30, 2019
See accompanying notes to financial statements.50

Affiliate Table
Number ofShares Held
at9/30/18
Value at9/30/18
Cost ofPurchases
Proceedsfrom
Shares SoldRealized
Gain (Loss)
Change inUnrealized
Appreciation/Depreciation
Number ofShares Held
at9/30/19
Value at9/30/19
DividendIncome
State Street Institutional Liquid Reserves Fund, Premier Class . — $ — $ 3,238 $ 3,193 $— $— 45 $ 45 $ 1
State Street Institutional U.S. Government Money MarketFund, Class G Shares . . . . . . . . . . . . . . . . . . . . . . 1,461 1,461 636,060 637,521 — — — — 275
State Street Navigator Securities Lending Government MoneyMarket Portfolio . . . . . . . . . . . . . . . . . . . . . . . . 1,579,202 1,579,202 5,383,570 6,962,772 — — — — 5,967
State Street Navigator Securities Lending Portfolio III . . . . . — — 4,284,009 3,843,844 — — 440,165 440,165 10,810
Total. . . . . . . . . . . . . . . . . . . . . . . . . . . . . . . . . $1,580,663 $10,306,877 $11,447,330 $— $— $440,210 $17,053
SPDR EURO STOXX SMALL CAP ETFSCHEDULE OF INVESTMENTS (continued)September 30, 2019
See accompanying notes to financial statements.51

Security Description Shares Value
COMMON STOCKS - 99.4%ARGENTINA – 0.0% (a)Other Securities. . . . . . . . . . . . . . . . $ 38,770
AUSTRALIA – 2.1%Other Securities. . . . . . . . . . . . . . . . 1,719,010
AUSTRIA – 0.0% (a)Other Securities. . . . . . . . . . . . . . . . 40,313
BELGIUM – 0.2%Other Securities. . . . . . . . . . . . . . . . 143,618
BERMUDA – 0.1%Other Security. . . . . . . . . . . . . . . . . 45,296
BRAZIL – 0.8%Other Securities. . . . . . . . . . . . . . . . 705,182
CANADA – 3.4%Other Securities. . . . . . . . . . . . . . . . 2,816,212
CHILE – 0.2%Other Securities. . . . . . . . . . . . . . . . 151,311
CHINA – 3.5%Alibaba Group Holding, Ltd. ADR (b) . 2,387 399,178China Common Rich Renewable
Energy Investment, Ltd. (b)(c)(d) . . . 24,000 —Tencent Holdings, Ltd. . . . . . . . . . . . 10,484 441,592Other Securities. . . . . . . . . . . . . . . . 2,068,629
2,909,399
COLOMBIA – 0.2%Other Securities. . . . . . . . . . . . . . . . 171,530
DENMARK – 0.5%Other Securities. . . . . . . . . . . . . . . . 404,551
FINLAND – 0.4%Other Securities. . . . . . . . . . . . . . . . 301,505
FRANCE – 3.4%Other Securities. . . . . . . . . . . . . . . . 2,787,741
GERMANY – 2.4%Other Securities. . . . . . . . . . . . . . . . 1,957,897
HONG KONG – 1.4%Other Securities. . . . . . . . . . . . . . . . 1,161,049
HUNGARY – 0.0% (a)Other Security. . . . . . . . . . . . . . . . . 19,898
INDIA – 1.0%Other Securities. . . . . . . . . . . . . . . . 830,974
INDONESIA – 0.2%Other Securities. . . . . . . . . . . . . . . . 173,971
IRELAND – 0.4%Other Securities. . . . . . . . . . . . . . . . 349,601
ISRAEL – 0.1%Other Securities. . . . . . . . . . . . . . . . 94,598
ITALY – 0.6%Other Securities. . . . . . . . . . . . . . . . 483,062
Security Description Shares Value
JAPAN – 7.4%Mitsui & Co., Ltd. . . . . . . . . . . . . . . 18,600 $ 304,278Toyota Motor Corp. (d) . . . . . . . . . . . 4,600 307,135Other Securities. . . . . . . . . . . . . . . . 5,522,035
6,133,448
LUXEMBOURG – 0.0% (a)Other Securities. . . . . . . . . . . . . . . . 40,101
MACAU – 0.0% (a)Other Security. . . . . . . . . . . . . . . . . 1,561
MALAYSIA – 0.3%Other Securities. . . . . . . . . . . . . . . . 232,279
MEXICO – 0.3%Other Securities. . . . . . . . . . . . . . . . 251,176
NETHERLANDS – 1.0%Other Securities. . . . . . . . . . . . . . . . 863,745
NEW ZEALAND – 0.1%Other Security. . . . . . . . . . . . . . . . . 74,695
NORWAY – 0.3%Other Securities. . . . . . . . . . . . . . . . 258,553
PERU – 0.1%Other Securities. . . . . . . . . . . . . . . . 102,819
PHILIPPINES – 0.1%Other Securities. . . . . . . . . . . . . . . . 62,435
POLAND – 0.1%Other Securities. . . . . . . . . . . . . . . . 76,724
PORTUGAL – 0.0% (a)Other Security. . . . . . . . . . . . . . . . . 35,917
QATAR – 0.2%Other Securities. . . . . . . . . . . . . . . . 136,698
ROMANIA – 0.0% (a)Other Security. . . . . . . . . . . . . . . . . 16,143
RUSSIA – 0.3%Other Securities. . . . . . . . . . . . . . . . 258,225
SAUDI ARABIA – 0.1%Other Securities. . . . . . . . . . . . . . . . 112,460
SINGAPORE – 0.4%Other Securities. . . . . . . . . . . . . . . . 311,525
SOUTH AFRICA – 0.6%Other Securities. . . . . . . . . . . . . . . . 470,976
SOUTH KOREA – 1.4%Samsung Electronics Co., Ltd. . . . . . . 8,759 359,176Other Securities. . . . . . . . . . . . . . . . 777,284
1,136,460
SPAIN – 1.0%Other Securities. . . . . . . . . . . . . . . . 817,487
SWEDEN – 0.8%Other Securities. . . . . . . . . . . . . . . . 676,148
SWITZERLAND – 2.7%Nestle SA . . . . . . . . . . . . . . . . . . . 5,399 586,275
SPDR MSCI ACWI LOW CARBON TARGET ETFSUMMARY SCHEDULE OF INVESTMENTSSeptember 30, 2019
See accompanying notes to financial statements.52

Security Description Shares Value
Novartis AG . . . . . . . . . . . . . . . . . . 3,772 $ 327,362Roche Holding AG. . . . . . . . . . . . . . 1,256 365,848Other Securities. . . . . . . . . . . . . . . . 959,831
2,239,316
TAIWAN – 1.2%Taiwan Semiconductor Manufacturing
Co., Ltd. . . . . . . . . . . . . . . . . . . 46,000 403,294Other Securities. . . . . . . . . . . . . . . . 621,733
1,025,027
THAILAND – 0.3%Other Securities. . . . . . . . . . . . . . . . 213,307
TURKEY – 0.1%Other Securities. . . . . . . . . . . . . . . . 71,175
UNITED ARAB EMIRATES –0.1%
Other Securities. . . . . . . . . . . . . . . . 42,983
UNITED KINGDOM – 5.0%HSBC Holdings PLC . . . . . . . . . . . . 38,974 299,981Other Securities. . . . . . . . . . . . . . . . 3,807,232
4,107,213
UNITED STATES – 54.6%Abbott Laboratories . . . . . . . . . . . . . 3,320 277,784Alphabet, Inc. Class A (b) . . . . . . . . . 563 687,502Alphabet, Inc. Class C (b) . . . . . . . . . 521 635,099Amazon.com, Inc. (b) . . . . . . . . . . . . 727 1,262,007American Water Works Co., Inc. . . . . . 2,117 262,995Apple, Inc. . . . . . . . . . . . . . . . . . . . 8,279 1,854,248AT&T, Inc.. . . . . . . . . . . . . . . . . . . 13,360 505,542Bank of America Corp. . . . . . . . . . . . 16,026 467,478Berkshire Hathaway, Inc. Class B (b) . . 2,243 466,589Boeing Co.. . . . . . . . . . . . . . . . . . . 1,033 393,026Cisco Systems, Inc. . . . . . . . . . . . . . 8,297 409,955Citigroup, Inc. . . . . . . . . . . . . . . . . 4,492 310,307Coca-Cola Co. . . . . . . . . . . . . . . . . 8,100 440,964Comcast Corp. Class A . . . . . . . . . . . 8,377 377,635Costco Wholesale Corp. . . . . . . . . . . 996 286,958Eversource Energy . . . . . . . . . . . . . . 3,680 314,530Facebook, Inc. Class A (b) . . . . . . . . . 4,279 762,004Home Depot, Inc. . . . . . . . . . . . . . . 2,091 485,154Honeywell International, Inc. . . . . . . . 1,626 275,119Intel Corp. . . . . . . . . . . . . . . . . . . . 8,152 420,073International Business Machines Corp. . 1,880 273,390Johnson & Johnson . . . . . . . . . . . . . 4,967 642,630JPMorgan Chase & Co. . . . . . . . . . . . 5,766 678,601Mastercard, Inc. Class A . . . . . . . . . . 1,702 462,212McDonald’s Corp. . . . . . . . . . . . . . . 1,491 320,133Medtronic PLC . . . . . . . . . . . . . . . . 2,621 284,693Merck & Co., Inc. . . . . . . . . . . . . . . 4,919 414,081Microsoft Corp.. . . . . . . . . . . . . . . . 13,163 1,830,052ONEOK, Inc. . . . . . . . . . . . . . . . . . 4,721 347,890Oracle Corp.. . . . . . . . . . . . . . . . . . 5,397 296,997PepsiCo, Inc. . . . . . . . . . . . . . . . . . 2,558 350,702Pfizer, Inc. . . . . . . . . . . . . . . . . . . . 10,739 385,852
Security Description Shares Value
Procter & Gamble Co.. . . . . . . . . . . . 4,663 $ 579,984State Street Corp. (e) . . . . . . . . . . . . 611 36,165Texas Instruments, Inc. . . . . . . . . . . . 1,946 251,501UnitedHealth Group, Inc.. . . . . . . . . . 1,814 394,218Verizon Communications, Inc. . . . . . . 7,464 450,527Visa, Inc. Class A . . . . . . . . . . . . . . 3,345 575,373Walmart, Inc. . . . . . . . . . . . . . . . . . 2,636 312,840Walt Disney Co. . . . . . . . . . . . . . . . 3,389 441,654Wells Fargo & Co. . . . . . . . . . . . . . . 7,716 389,196Other Securities. . . . . . . . . . . . . . . . 24,645,918
45,259,578
TOTAL COMMON STOCKS(Cost $75,288,752) . . . . . . . . . . 82,333,662
WARRANTS — 0.0% (a)THAILAND – 0.0% (a)Other Security
(cost: $0) . . . . . . . . . . . . . . . . . . 51
SHORT-TERM INVESTMENTS -2.1%
State Street Institutional LiquidReserves Fund, Premier Class 2.03%(f)(g). . . . . . . . . . . . . . . . . . . . . 115,387 115,398
State Street Navigator SecuritiesLending Portfolio III (e)(h) . . . . . . . 1,636,978 1,636,978
TOTAL SHORT-TERMINVESTMENTS(Cost $1,752,375) . . . . . . . . . . . 1,752,376
TOTAL INVESTMENTS - 101.5%(Cost $77,041,127) . . . . . . . . . . 84,086,089
LIABILITIES IN EXCESS OFOTHER ASSETS - (1.5)% . . . . (1,247,623)
NET ASSETS - 100.0% . . . . . . . . $ 82,838,466
SPDR MSCI ACWI LOW CARBON TARGET ETFSUMMARY SCHEDULE OF INVESTMENTS (continued)September 30, 2019
See accompanying notes to financial statements.53

The Summary Schedule of Investments does not reflect the completeportfolio holdings. It includes the Fund’s 50 largest holdings and eachinvestment of any issuer that exceeds 1% of the Fund’s net assets. “OtherSecurities” represent all issues not required to be disclosed under therules adopted by the U.S. Securities and Exchange Commission(“SEC”). In certain instances, securities for which footnotes listed belowmay otherwise apply are included in the Other Securities caption. Thecomplete schedule of portfolio holdings is available on the Fund’swebsite at www.spdrs.com, without charge, upon request by calling1-866-787-2257 (toll-free) and on the SEC’s website at www.sec.gov.
(a) Amount is less than 0.05% of net assets.(b) Non-income producing security.(c) Fair valued as determined in good faith by the Trust’s Oversight
Committee in accordance with policy and procedures approvedby the Board of Trustees. Security value is determined based onLevel 3 inputs. As of September 30, 2019, total aggregate fairvalue of these securities is $0, representing 0.0% of the Fund’snet assets.
(d) All or a portion of the shares of the security are on loan atSeptember 30, 2019.
(e) The Fund invested in an affiliated entity. Amounts related tothese transactions during the period ended September 30, 2019are shown in the Affiliate Table below.
(f) The Fund invested in certain money market funds managed bySSGA Funds Management, Inc. Amounts related to thesetransactions during the period ended September 30, 2019 areshown in the Affiliate Table below.
(g) The rate shown is the annualized seven-day yield atSeptember 30, 2019.
(h) Investment of cash collateral for securities loaned.ADR American Depositary Receipt
The following table summarizes the value of the Fund’s investments according to the fair value hierarchy as of September 30,2019.
DescriptionLevel 1 –
Quoted Prices
Level 2 –Other SignificantObservable Inputs
Level 3 –Significant
Unobservable Inputs Total
ASSETS:INVESTMENTS:Common Stocks . . . . . . . . . . . . . . . . . . . . . . . . . . . . . . . . . . . . . $82,126,305 $207,357 $ 0(a) $82,333,662
Warrants . . . . . . . . . . . . . . . . . . . . . . . . . . . . . . . . . . . . . . . . . . 51 — — 51
Short-Term Investments . . . . . . . . . . . . . . . . . . . . . . . . . . . . . . . . 1,752,376 — — 1,752,376
TOTAL INVESTMENTS . . . . . . . . . . . . . . . . . . . . . . . . . . . . . . $83,878,732 $207,357 $ 0 $84,086,089
(a) Fund held a Level 3 security that was valued at $0 at September 30, 2019.
SPDR MSCI ACWI LOW CARBON TARGET ETFSUMMARY SCHEDULE OF INVESTMENTS (continued)September 30, 2019
See accompanying notes to financial statements.54

Affiliate Table
Number ofShares Held
at9/30/18
Value at9/30/18
Cost ofPurchases
Proceedsfrom
Shares SoldRealized
Gain (Loss)
Change inUnrealized
Appreciation/Depreciation
Number ofShares Held
at9/30/19
Value at9/30/19
DividendIncome
State Street Corp. . . . . . . . . . . . . . . . . . . . . . . . . 1,224 $ 102,547 $ 12,804 $ 53,765 $(7,879) $(17,542) 611 $ 36,165 $ 1,338
State Street Institutional Liquid Reserves Fund, PremierClass. . . . . . . . . . . . . . . . . . . . . . . . . . . . . . — — 410,050 294,652 — — 115,387 115,398 356
State Street Institutional U.S. Government Money MarketFund, Class G Shares. . . . . . . . . . . . . . . . . . . . . 258,097 258,097 7,997,959 8,256,056 — — — — 3,696
State Street Navigator Securities Lending GovernmentMoney Market Portfolio . . . . . . . . . . . . . . . . . . . 1,758,501 1,758,501 4,904,381 6,662,882 — — — — 4,627
State Street Navigator Securities Lending Portfolio III . . . . — — 6,060,298 4,423,320 — — 1,636,978 1,636,978 4,456
Total. . . . . . . . . . . . . . . . . . . . . . . . . . . . . . . . $2,119,145 $19,385,492 $19,690,675 $(7,879) $(17,542) $1,788,541 $14,473
SPDR MSCI ACWI LOW CARBON TARGET ETFSUMMARY SCHEDULE OF INVESTMENTS (continued)September 30, 2019
See accompanying notes to financial statements.55

Security Description Shares Value
COMMON STOCKS — 99.3%AEROSPACE & DEFENSE — 0.6%Bombardier, Inc. Class B (a) (b) . . . . . 29,170 $ 39,437CAE, Inc. . . . . . . . . . . . . . . . . . . . 3,654 92,895
132,332
AIRLINES — 0.5%Air Canada (a) . . . . . . . . . . . . . . . . 3,322 108,417
AUTO COMPONENTS — 1.0%Magna International, Inc.. . . . . . . . . . 3,932 209,726
BANKS — 25.7%Bank of Montreal. . . . . . . . . . . . . . . 8,786 647,536Bank of Nova Scotia. . . . . . . . . . . . . 16,838 956,994Canadian Imperial Bank of Commerce
(b) . . . . . . . . . . . . . . . . . . . . . . 6,120 505,270National Bank of Canada . . . . . . . . . . 4,603 229,176Royal Bank of Canada . . . . . . . . . . . 19,762 1,604,095Toronto-Dominion Bank . . . . . . . . . . 25,161 1,468,042
5,411,113
CAPITAL MARKETS — 3.0%Brookfield Asset Management, Inc.
Class A . . . . . . . . . . . . . . . . . . . 10,601 563,278CI Financial Corp. . . . . . . . . . . . . . . 3,027 44,194IGM Financial, Inc. (b) . . . . . . . . . . . 1,129 32,079
639,551
CHEMICALS — 2.1%Methanex Corp. . . . . . . . . . . . . . . . 1,048 37,210Nutrien, Ltd. (b) . . . . . . . . . . . . . . . 7,980 397,795
435,005
COMMERCIAL SERVICES & SUPPLIES —1.9%
Ritchie Bros Auctioneers, Inc.. . . . . . . 1,504 59,990Waste Connections, Inc. . . . . . . . . . . 3,603 331,209
391,199
CONSTRUCTION & ENGINEERING — 0.6%SNC-Lavalin Group, Inc. (b) . . . . . . . 2,438 34,360WSP Global, Inc.. . . . . . . . . . . . . . . 1,436 83,980
118,340
CONTAINERS & PACKAGING — 0.4%CCL Industries, Inc. Class B. . . . . . . . 1,997 80,604
DIVERSIFIED FINANCIAL SERVICES — 0.3%Onex Corp. . . . . . . . . . . . . . . . . . . 1,130 70,096
DIVERSIFIED TELECOMMUNICATIONSERVICES — 4.2%
BCE, Inc.. . . . . . . . . . . . . . . . . . . . 12,375 598,935TELUS Corp. . . . . . . . . . . . . . . . . . 8,266 294,367
893,302
ELECTRIC UTILITIES — 2.2%Emera, Inc. . . . . . . . . . . . . . . . . . . 3,243 142,457Fortis, Inc. . . . . . . . . . . . . . . . . . . . 5,955 251,918
Security Description Shares Value
Hydro One, Ltd. (b) (c) . . . . . . . . . . . 4,214 $ 77,946
472,321
EQUITY REAL ESTATE INVESTMENTTRUSTS (REITS) — 1.4%
Canadian Apartment Properties REIT . . 2,126 87,465Choice Properties Real Estate
Investment Trust . . . . . . . . . . . . . 3,162 34,486H&R Real Estate Investment Trust . . . . 3,860 67,433RioCan Real Estate Investment Trust . . 4,206 83,802SmartCentres Real Estate Investment
Trust . . . . . . . . . . . . . . . . . . . . . 1,199 29,432
302,618
FOOD & STAPLES RETAILING — 3.8%Alimentation Couche-Tard, Inc.
Class B . . . . . . . . . . . . . . . . . . . 11,682 358,225Empire Co., Ltd. Class A . . . . . . . . . . 2,360 63,937George Weston, Ltd. . . . . . . . . . . . . . 980 82,501Loblaw Cos., Ltd. . . . . . . . . . . . . . . 2,463 140,376Metro, Inc. . . . . . . . . . . . . . . . . . . . 3,513 154,768
799,807
FOOD PRODUCTS — 0.5%Saputo, Inc. . . . . . . . . . . . . . . . . . . 3,597 110,627
GAS UTILITIES — 0.3%AltaGas, Ltd. (b) . . . . . . . . . . . . . . . 3,762 55,265
HOTELS, RESTAURANTS & LEISURE — 1.3%Restaurant Brands International, Inc. . . 3,248 231,089Stars Group, Inc. (a) (b). . . . . . . . . . . 3,089 46,265
277,354
INDEPENDENT POWER & RENEWABLEELECTRICITY PRODUCERS — 0.2%
Northland Power, Inc. . . . . . . . . . . . . 2,158 41,432
INSURANCE — 7.2%Fairfax Financial Holdings, Ltd. . . . . . 347 153,057Great-West Lifeco, Inc. . . . . . . . . . . . 3,166 76,065iA Financial Corp., Inc. . . . . . . . . . . . 1,463 66,620Intact Financial Corp. . . . . . . . . . . . . 1,905 191,852Manulife Financial Corp. . . . . . . . . . . 26,991 495,379Power Corp. of Canada . . . . . . . . . . . 4,101 94,534Power Financial Corp. (b) . . . . . . . . . 3,279 76,081Sun Life Financial, Inc. . . . . . . . . . . . 8,150 364,657
1,518,245
IT SERVICES — 3.3%CGI, Inc. (a) . . . . . . . . . . . . . . . . . . 3,344 264,590Shopify, Inc. Class A (a) (b) . . . . . . . . 1,352 421,020
685,610
MEDIA — 0.8%Quebecor, Inc. Class B . . . . . . . . . . . 2,440 55,434Shaw Communications, Inc. Class B . . 6,188 121,657
177,091
METALS & MINING — 6.7%Agnico Eagle Mines, Ltd. . . . . . . . . . 3,199 171,548
SPDR SOLACTIVE CANADA ETFSCHEDULE OF INVESTMENTSSeptember 30, 2019
See accompanying notes to financial statements.56
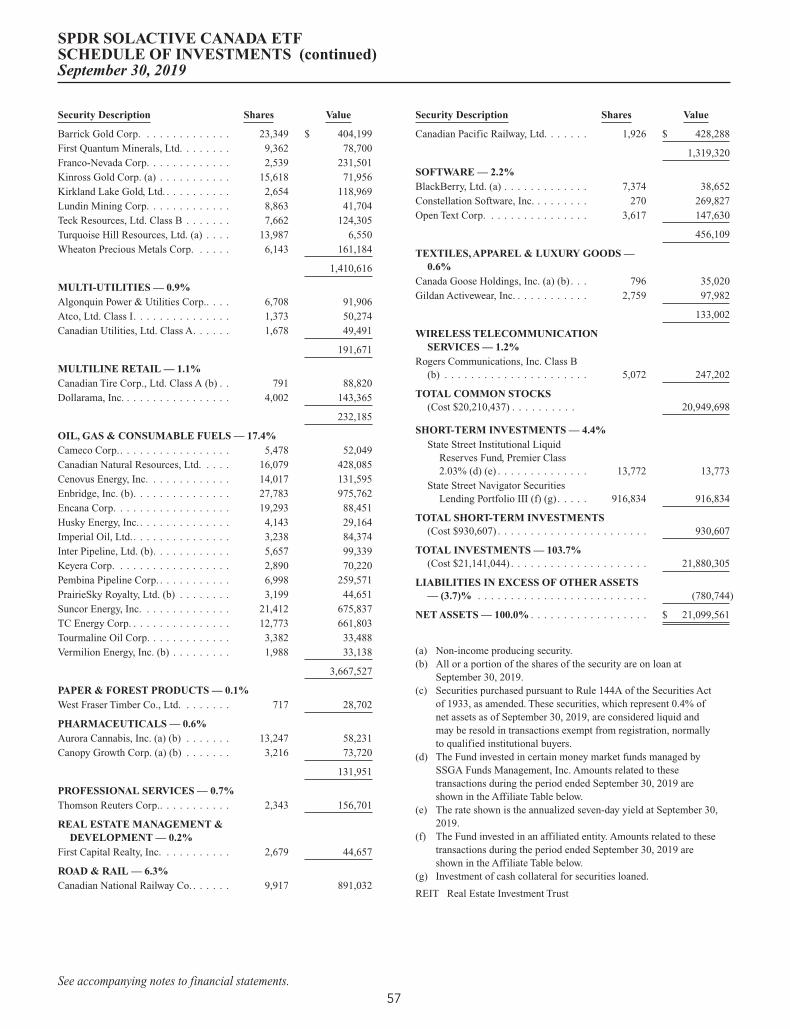
Security Description Shares Value
Barrick Gold Corp. . . . . . . . . . . . . . 23,349 $ 404,199First Quantum Minerals, Ltd. . . . . . . . 9,362 78,700Franco-Nevada Corp. . . . . . . . . . . . . 2,539 231,501Kinross Gold Corp. (a) . . . . . . . . . . . 15,618 71,956Kirkland Lake Gold, Ltd. . . . . . . . . . . 2,654 118,969Lundin Mining Corp. . . . . . . . . . . . . 8,863 41,704Teck Resources, Ltd. Class B . . . . . . . 7,662 124,305Turquoise Hill Resources, Ltd. (a) . . . . 13,987 6,550Wheaton Precious Metals Corp. . . . . . 6,143 161,184
1,410,616
MULTI-UTILITIES — 0.9%Algonquin Power & Utilities Corp.. . . . 6,708 91,906Atco, Ltd. Class I. . . . . . . . . . . . . . . 1,373 50,274Canadian Utilities, Ltd. Class A. . . . . . 1,678 49,491
191,671
MULTILINE RETAIL — 1.1%Canadian Tire Corp., Ltd. Class A (b) . . 791 88,820Dollarama, Inc. . . . . . . . . . . . . . . . . 4,002 143,365
232,185
OIL, GAS & CONSUMABLE FUELS — 17.4%Cameco Corp.. . . . . . . . . . . . . . . . . 5,478 52,049Canadian Natural Resources, Ltd. . . . . 16,079 428,085Cenovus Energy, Inc. . . . . . . . . . . . . 14,017 131,595Enbridge, Inc. (b). . . . . . . . . . . . . . . 27,783 975,762Encana Corp. . . . . . . . . . . . . . . . . . 19,293 88,451Husky Energy, Inc. . . . . . . . . . . . . . . 4,143 29,164Imperial Oil, Ltd.. . . . . . . . . . . . . . . 3,238 84,374Inter Pipeline, Ltd. (b). . . . . . . . . . . . 5,657 99,339Keyera Corp. . . . . . . . . . . . . . . . . . 2,890 70,220Pembina Pipeline Corp. . . . . . . . . . . . 6,998 259,571PrairieSky Royalty, Ltd. (b) . . . . . . . . 3,199 44,651Suncor Energy, Inc. . . . . . . . . . . . . . 21,412 675,837TC Energy Corp. . . . . . . . . . . . . . . . 12,773 661,803Tourmaline Oil Corp. . . . . . . . . . . . . 3,382 33,488Vermilion Energy, Inc. (b) . . . . . . . . . 1,988 33,138
3,667,527
PAPER & FOREST PRODUCTS — 0.1%West Fraser Timber Co., Ltd. . . . . . . . 717 28,702
PHARMACEUTICALS — 0.6%Aurora Cannabis, Inc. (a) (b) . . . . . . . 13,247 58,231Canopy Growth Corp. (a) (b) . . . . . . . 3,216 73,720
131,951
PROFESSIONAL SERVICES — 0.7%Thomson Reuters Corp.. . . . . . . . . . . 2,343 156,701
REAL ESTATE MANAGEMENT &DEVELOPMENT — 0.2%
First Capital Realty, Inc. . . . . . . . . . . 2,679 44,657
ROAD & RAIL — 6.3%Canadian National Railway Co. . . . . . . 9,917 891,032
Security Description Shares Value
Canadian Pacific Railway, Ltd. . . . . . . 1,926 $ 428,288
1,319,320
SOFTWARE — 2.2%BlackBerry, Ltd. (a) . . . . . . . . . . . . . 7,374 38,652Constellation Software, Inc. . . . . . . . . 270 269,827Open Text Corp. . . . . . . . . . . . . . . . 3,617 147,630
456,109
TEXTILES, APPAREL & LUXURY GOODS —0.6%
Canada Goose Holdings, Inc. (a) (b) . . . 796 35,020Gildan Activewear, Inc. . . . . . . . . . . . 2,759 97,982
133,002
WIRELESS TELECOMMUNICATIONSERVICES — 1.2%
Rogers Communications, Inc. Class B(b) . . . . . . . . . . . . . . . . . . . . . . 5,072 247,202
TOTAL COMMON STOCKS(Cost $20,210,437) . . . . . . . . . . 20,949,698
SHORT-TERM INVESTMENTS — 4.4%State Street Institutional Liquid
Reserves Fund, Premier Class2.03% (d) (e) . . . . . . . . . . . . . . 13,772 13,773
State Street Navigator SecuritiesLending Portfolio III (f) (g) . . . . . 916,834 916,834
TOTAL SHORT-TERM INVESTMENTS(Cost $930,607) . . . . . . . . . . . . . . . . . . . . . . . 930,607
TOTAL INVESTMENTS — 103.7%(Cost $21,141,044) . . . . . . . . . . . . . . . . . . . . . 21,880,305
LIABILITIES IN EXCESS OF OTHER ASSETS— (3.7)% . . . . . . . . . . . . . . . . . . . . . . . . . . (780,744)
NET ASSETS — 100.0% . . . . . . . . . . . . . . . . . . $ 21,099,561
(a) Non-income producing security.(b) All or a portion of the shares of the security are on loan at
September 30, 2019.(c) Securities purchased pursuant to Rule 144A of the Securities Act
of 1933, as amended. These securities, which represent 0.4% ofnet assets as of September 30, 2019, are considered liquid andmay be resold in transactions exempt from registration, normallyto qualified institutional buyers.
(d) The Fund invested in certain money market funds managed bySSGA Funds Management, Inc. Amounts related to thesetransactions during the period ended September 30, 2019 areshown in the Affiliate Table below.
(e) The rate shown is the annualized seven-day yield at September 30,2019.
(f) The Fund invested in an affiliated entity. Amounts related to thesetransactions during the period ended September 30, 2019 areshown in the Affiliate Table below.
(g) Investment of cash collateral for securities loaned.
REIT Real Estate Investment Trust
SPDR SOLACTIVE CANADA ETFSCHEDULE OF INVESTMENTS (continued)September 30, 2019
See accompanying notes to financial statements.57

The following table summarizes the value of the Fund’s investments according to the fair value hierarchy as of September 30,2019.
DescriptionLevel 1 –
Quoted Prices
Level 2 –Other SignificantObservable Inputs
Level 3 –Significant
Unobservable Inputs Total
ASSETS:INVESTMENTS:Common Stocks . . . . . . . . . . . . . . . . . . . . . . . . . . . . . . . . . . . . . $20,949,698 $— $— $20,949,698
Short-Term Investments . . . . . . . . . . . . . . . . . . . . . . . . . . . . . . . . 930,607 — — 930,607
TOTAL INVESTMENTS . . . . . . . . . . . . . . . . . . . . . . . . . . . . . . $21,880,305 $— $— $21,880,305
Affiliate Table
Number ofShares Held
at9/30/18
Value at9/30/18
Cost ofPurchases
Proceedsfrom
Shares SoldRealized
Gain (Loss)
Change inUnrealized
Appreciation/Depreciation
Number ofShares Held
at9/30/19
Value at9/30/19
DividendIncome
State Street Institutional Liquid Reserves Fund, Premier Class . . — $ — $ 17,657 $ 3,884 $— $— 13,772 $ 13,773 $ 34
State Street Institutional U.S. Government Money Market Fund,Class G Shares . . . . . . . . . . . . . . . . . . . . . . . . . . 516 516 681,701 682,217 — — — — 422
State Street Navigator Securities Lending Government MoneyMarket Portfolio . . . . . . . . . . . . . . . . . . . . . . . . . 751,313 751,313 11,367,863 12,119,176 — — — — 9,216
State Street Navigator Securities Lending Portfolio III . . . . . . — — 11,811,778 10,894,944 — — 916,834 916,834 13,749
Total . . . . . . . . . . . . . . . . . . . . . . . . . . . . . . . . . . $751,829 $23,878,999 $23,700,221 $— $— $930,607 $23,421
SPDR SOLACTIVE CANADA ETFSCHEDULE OF INVESTMENTS (continued)September 30, 2019
See accompanying notes to financial statements.58

Security Description Shares Value
COMMON STOCKS — 99.2%AUSTRALIA — 6.2%Alumina, Ltd. . . . . . . . . . . . . . . . 17,248 $ 27,570AMP, Ltd. . . . . . . . . . . . . . . . . . 20,843 25,655APA Group. . . . . . . . . . . . . . . . . 8,113 62,707Aristocrat Leisure, Ltd. . . . . . . . . . 3,831 79,065ASX, Ltd. . . . . . . . . . . . . . . . . . 1,234 67,472Aurizon Holdings, Ltd. . . . . . . . . . 12,635 50,278AusNet Services . . . . . . . . . . . . . 12,166 14,893Australia & New Zealand Banking
Group, Ltd. . . . . . . . . . . . . . . . 18,534 356,507Bank of Queensland, Ltd. (a). . . . . . 2,872 19,215Bendigo & Adelaide Bank, Ltd. (a). . 3,433 26,604BlueScope Steel, Ltd. . . . . . . . . . . 3,690 29,889Boral, Ltd. . . . . . . . . . . . . . . . . . 7,699 25,080Brambles, Ltd.. . . . . . . . . . . . . . . 10,304 79,225Caltex Australia, Ltd. . . . . . . . . . . 1,552 27,550Challenger, Ltd. . . . . . . . . . . . . . . 3,992 19,843CIMIC Group, Ltd.. . . . . . . . . . . . 700 14,848Coca-Cola Amatil, Ltd. . . . . . . . . . 3,075 22,087Cochlear, Ltd. . . . . . . . . . . . . . . . 370 51,943Coles Group, Ltd.. . . . . . . . . . . . . 7,513 78,034Commonwealth Bank of Australia . . 11,504 627,149Computershare, Ltd. . . . . . . . . . . . 3,301 35,956Crown Resorts, Ltd. . . . . . . . . . . . 2,563 20,830CSL, Ltd. . . . . . . . . . . . . . . . . . . 2,940 463,380Dexus REIT . . . . . . . . . . . . . . . . 6,919 55,672Flight Centre Travel Group, Ltd. (a) . 379 12,167Fortescue Metals Group, Ltd. (a) . . . 9,163 54,384Goodman Group REIT . . . . . . . . . 10,613 101,499GPT Group REIT. . . . . . . . . . . . . 11,413 47,417Harvey Norman Holdings, Ltd. (a) . . 3,793 11,589Incitec Pivot, Ltd.. . . . . . . . . . . . . 9,854 22,530Insurance Australia Group, Ltd. . . . . 15,271 81,366LendLease Group. . . . . . . . . . . . . 3,892 46,094Macquarie Group, Ltd. . . . . . . . . . 2,128 188,130Magellan Financial Group, Ltd. (a). . 813 28,206Medibank Pvt, Ltd.. . . . . . . . . . . . 17,315 39,706Mirvac Group REIT . . . . . . . . . . . 25,706 53,052National Australia Bank, Ltd. . . . . . 18,094 362,444Newcrest Mining, Ltd.. . . . . . . . . . 5,065 118,709Orica, Ltd. . . . . . . . . . . . . . . . . . 2,642 40,164QBE Insurance Group, Ltd. . . . . . . 8,657 73,334Ramsay Health Care, Ltd. (a) . . . . . 891 38,983REA Group, Ltd. (a) . . . . . . . . . . . 364 26,568Scentre Group REIT . . . . . . . . . . . 35,108 93,057SEEK, Ltd. . . . . . . . . . . . . . . . . . 2,325 33,667Sonic Healthcare, Ltd. . . . . . . . . . . 2,907 54,996Stockland REIT . . . . . . . . . . . . . . 15,459 47,440Suncorp Group, Ltd. (b). . . . . . . . . 8,297 76,386Sydney Airport . . . . . . . . . . . . . . 7,719 41,805Tabcorp Holdings, Ltd. . . . . . . . . . 13,150 43,015Telstra Corp., Ltd. . . . . . . . . . . . . 27,518 65,144TPG Telecom, Ltd. . . . . . . . . . . . . 2,523 11,809Transurban Group Stapled Security . 17,278 171,185Treasury Wine Estates, Ltd. . . . . . . 4,750 59,491
Security Description Shares Value
Vicinity Centres REIT. . . . . . . . . . 20,891 $ 36,211Wesfarmers, Ltd. . . . . . . . . . . . . . 7,450 199,981Westpac Banking Corp. . . . . . . . . . 22,445 448,691Woolworths Group, Ltd.. . . . . . . . . 8,662 217,793WorleyParsons, Ltd. (a) . . . . . . . . . 2,141 18,786
5,247,251
AUSTRIA — 0.2%ANDRITZ AG. . . . . . . . . . . . . . . 520 21,259Erste Group Bank AG . . . . . . . . . . 1,987 65,723Raiffeisen Bank International AG. . . 1,086 25,207Verbund AG . . . . . . . . . . . . . . . . 451 24,682Voestalpine AG . . . . . . . . . . . . . . 808 18,569
155,440
BELGIUM — 1.1%Ageas . . . . . . . . . . . . . . . . . . . . 1,245 69,059Anheuser-Busch InBev SA . . . . . . . 5,092 485,295Colruyt SA (a). . . . . . . . . . . . . . . 372 20,391Groupe Bruxelles Lambert SA . . . . 573 55,035KBC Group NV. . . . . . . . . . . . . . 1,658 107,766Proximus SADP . . . . . . . . . . . . . 1,066 31,669Solvay SA . . . . . . . . . . . . . . . . . 520 53,856Telenet Group Holding NV. . . . . . . 361 17,041UCB SA . . . . . . . . . . . . . . . . . . 816 59,248Umicore SA (a) . . . . . . . . . . . . . . 1,355 51,156
950,516
CHILE — 0.0% (c)Antofagasta PLC . . . . . . . . . . . . . 2,764 30,621
CHINA — 0.4%Alcon, Inc. (b) . . . . . . . . . . . . . . . 2,867 167,336BeiGene, Ltd. ADR (a)(b) . . . . . . . 200 24,492BOC Hong Kong Holdings, Ltd. . . . 24,500 83,132Yangzijiang Shipbuilding Holdings,
Ltd. . . . . . . . . . . . . . . . . . . . . 17,900 12,426
287,386
DENMARK — 1.9%AP Moller - Maersk A/S Class A . . . 27 28,819AP Moller - Maersk A/S Class B . . . 44 49,766Carlsberg A/S Class B . . . . . . . . . . 708 104,672Chr. Hansen Holding A/S . . . . . . . . 698 59,256Coloplast A/S Class B . . . . . . . . . . 770 92,757Danske Bank A/S . . . . . . . . . . . . . 4,444 61,892Demant A/S (a)(b) . . . . . . . . . . . . 682 17,472DSV A/S . . . . . . . . . . . . . . . . . . 1,440 137,050Genmab A/S (b). . . . . . . . . . . . . . 396 80,402H Lundbeck A/S . . . . . . . . . . . . . 401 13,303ISS A/S . . . . . . . . . . . . . . . . . . . 1,161 28,734Novo Nordisk A/S Class B . . . . . . . 11,601 596,519Novozymes A/S Class B . . . . . . . . 1,491 62,701Orsted A/S (d) . . . . . . . . . . . . . . . 1,255 116,657Pandora A/S . . . . . . . . . . . . . . . . 776 31,148Tryg A/S . . . . . . . . . . . . . . . . . . 736 21,096Vestas Wind Systems A/S. . . . . . . . 1,271 98,695
1,600,939
SPDR MSCI EAFE FOSSIL FUEL RESERVES FREE ETFSCHEDULE OF INVESTMENTSSeptember 30, 2019
See accompanying notes to financial statements.59

Security Description Shares Value
FINLAND — 1.2%Elisa Oyj . . . . . . . . . . . . . . . . . . 988 $ 50,948Fortum Oyj. . . . . . . . . . . . . . . . . 2,868 67,818Kone Oyj Class B. . . . . . . . . . . . . 2,234 127,231Metso Oyj . . . . . . . . . . . . . . . . . 644 24,060Neste Oyj (a) . . . . . . . . . . . . . . . 2,776 91,911Nokia Oyj . . . . . . . . . . . . . . . . . 37,114 188,147Nokian Renkaat Oyj . . . . . . . . . . . 811 22,882Nordea Bank Abp (e) . . . . . . . . . . 19,982 141,876Nordea Bank Abp (e) . . . . . . . . . . 290 2,056Orion Oyj Class B . . . . . . . . . . . . 729 27,196Sampo Oyj Class A. . . . . . . . . . . . 2,907 115,613Stora Enso Oyj Class R . . . . . . . . . 3,906 47,076UPM-Kymmene Oyj . . . . . . . . . . . 3,522 104,132Wartsila OYJ Abp (a) . . . . . . . . . . 2,796 31,320
1,042,266
FRANCE — 10.7%Accor SA . . . . . . . . . . . . . . . . . . 1,238 51,625Aeroports de Paris . . . . . . . . . . . . 208 37,008Air Liquide SA . . . . . . . . . . . . . . 2,785 396,529Airbus SE . . . . . . . . . . . . . . . . . 3,783 491,608Alstom SA . . . . . . . . . . . . . . . . . 1,069 44,321Amundi SA (d) . . . . . . . . . . . . . . 416 29,025Arkema SA. . . . . . . . . . . . . . . . . 471 43,913Atos SE . . . . . . . . . . . . . . . . . . . 653 46,046AXA SA . . . . . . . . . . . . . . . . . . 12,578 321,285BioMerieux . . . . . . . . . . . . . . . . 285 23,583BNP Paribas SA . . . . . . . . . . . . . 7,295 355,261Bollore SA . . . . . . . . . . . . . . . . . 6,311 26,159Bouygues SA . . . . . . . . . . . . . . . 1,492 59,777Bureau Veritas SA . . . . . . . . . . . . 1,964 47,319Capgemini SE . . . . . . . . . . . . . . . 1,053 124,097Carrefour SA . . . . . . . . . . . . . . . 3,924 68,704Casino Guichard Perrachon SA (a) . . 345 16,470Cie de Saint-Gobain . . . . . . . . . . . 3,260 127,946Cie Generale des Etablissements
Michelin SCA . . . . . . . . . . . . . 1,127 125,814CNP Assurances . . . . . . . . . . . . . 1,196 23,118Covivio REIT . . . . . . . . . . . . . . . 338 35,780Credit Agricole SA. . . . . . . . . . . . 7,527 91,414Danone SA. . . . . . . . . . . . . . . . . 3,997 352,176Dassault Aviation SA . . . . . . . . . . 16 22,641Dassault Systemes SE . . . . . . . . . . 858 122,302Edenred . . . . . . . . . . . . . . . . . . . 1,592 76,418Eiffage SA . . . . . . . . . . . . . . . . . 521 54,028EssilorLuxottica SA . . . . . . . . . . . 1,822 262,694Eurazeo SE. . . . . . . . . . . . . . . . . 267 19,866Eutelsat Communications SA . . . . . 1,221 22,729Faurecia SE . . . . . . . . . . . . . . . . 521 24,719Gecina SA REIT . . . . . . . . . . . . . 318 49,992Getlink SE . . . . . . . . . . . . . . . . . 2,910 43,717Hermes International . . . . . . . . . . 206 142,384ICADE REIT . . . . . . . . . . . . . . . 198 17,711Iliad SA . . . . . . . . . . . . . . . . . . . 182 17,107Imerys SA . . . . . . . . . . . . . . . . . 260 10,454Ingenico Group SA. . . . . . . . . . . . 411 40,102
Security Description Shares Value
Ipsen SA . . . . . . . . . . . . . . . . . . 261 $ 24,784JCDecaux SA . . . . . . . . . . . . . . . 520 14,082Kering SA . . . . . . . . . . . . . . . . . 491 250,274Klepierre SA REIT. . . . . . . . . . . . 1,358 46,132Legrand SA . . . . . . . . . . . . . . . . 1,754 125,212L’Oreal SA. . . . . . . . . . . . . . . . . 1,639 459,039LVMH Moet Hennessy Louis
Vuitton SE . . . . . . . . . . . . . . . 1,819 723,128Natixis SA . . . . . . . . . . . . . . . . . 6,621 27,465Orange SA . . . . . . . . . . . . . . . . . 13,108 205,709Pernod Ricard SA . . . . . . . . . . . . 1,398 249,038Peugeot SA. . . . . . . . . . . . . . . . . 3,899 97,256Publicis Groupe SA . . . . . . . . . . . 1,476 72,604Remy Cointreau SA (a) . . . . . . . . . 157 20,847Renault SA. . . . . . . . . . . . . . . . . 1,295 74,346Safran SA . . . . . . . . . . . . . . . . . 2,123 334,329Sanofi . . . . . . . . . . . . . . . . . . . . 7,293 676,297Sartorius Stedim Biotech . . . . . . . . 186 26,037Schneider Electric SE . . . . . . . . . . 3,565 312,868SCOR SE. . . . . . . . . . . . . . . . . . 1,027 42,423SEB SA . . . . . . . . . . . . . . . . . . . 138 20,957Societe BIC SA (a) . . . . . . . . . . . . 148 9,939Societe Generale SA . . . . . . . . . . . 5,487 150,386Sodexo SA . . . . . . . . . . . . . . . . . 600 67,374Suez . . . . . . . . . . . . . . . . . . . . . 2,123 33,387Teleperformance . . . . . . . . . . . . . 371 80,448Thales SA . . . . . . . . . . . . . . . . . 705 81,086Ubisoft Entertainment SA (b) . . . . . 530 38,332Unibail-Rodamco-Westfield (e) . . . . 280 2,011Unibail-Rodamco-Westfield REIT
(e). . . . . . . . . . . . . . . . . . . . . 889 129,629Valeo SA . . . . . . . . . . . . . . . . . . 1,581 51,277Veolia Environnement SA . . . . . . . 3,606 91,441Vinci SA . . . . . . . . . . . . . . . . . . 3,298 355,305Vivendi SA. . . . . . . . . . . . . . . . . 6,047 165,998Wendel SA . . . . . . . . . . . . . . . . . 172 23,739Worldline SA (b)(d) . . . . . . . . . . . 545 34,402
8,983,423
GERMANY — 8.9%1&1 Drillisch AG. . . . . . . . . . . . . 364 11,349adidas AG . . . . . . . . . . . . . . . . . 1,168 363,733Allianz SE . . . . . . . . . . . . . . . . . 2,759 643,231Aroundtown SA. . . . . . . . . . . . . . 5,306 43,408Axel Springer SE (b). . . . . . . . . . . 289 19,849BASF SE . . . . . . . . . . . . . . . . . . 5,961 416,695Bayer AG . . . . . . . . . . . . . . . . . . 6,052 426,817Bayerische Motoren Werke AG . . . . 2,178 153,366Bayerische Motoren Werke AG
Preference Shares . . . . . . . . . . . 391 21,718Beiersdorf AG . . . . . . . . . . . . . . . 653 77,028Brenntag AG. . . . . . . . . . . . . . . . 975 47,195Carl Zeiss Meditec AG . . . . . . . . . 267 30,447Commerzbank AG . . . . . . . . . . . . 6,643 38,543Continental AG . . . . . . . . . . . . . . 725 93,029Covestro AG (d). . . . . . . . . . . . . . 1,150 56,919Daimler AG . . . . . . . . . . . . . . . . 5,895 293,187
SPDR MSCI EAFE FOSSIL FUEL RESERVES FREE ETFSCHEDULE OF INVESTMENTS (continued)September 30, 2019
See accompanying notes to financial statements.60
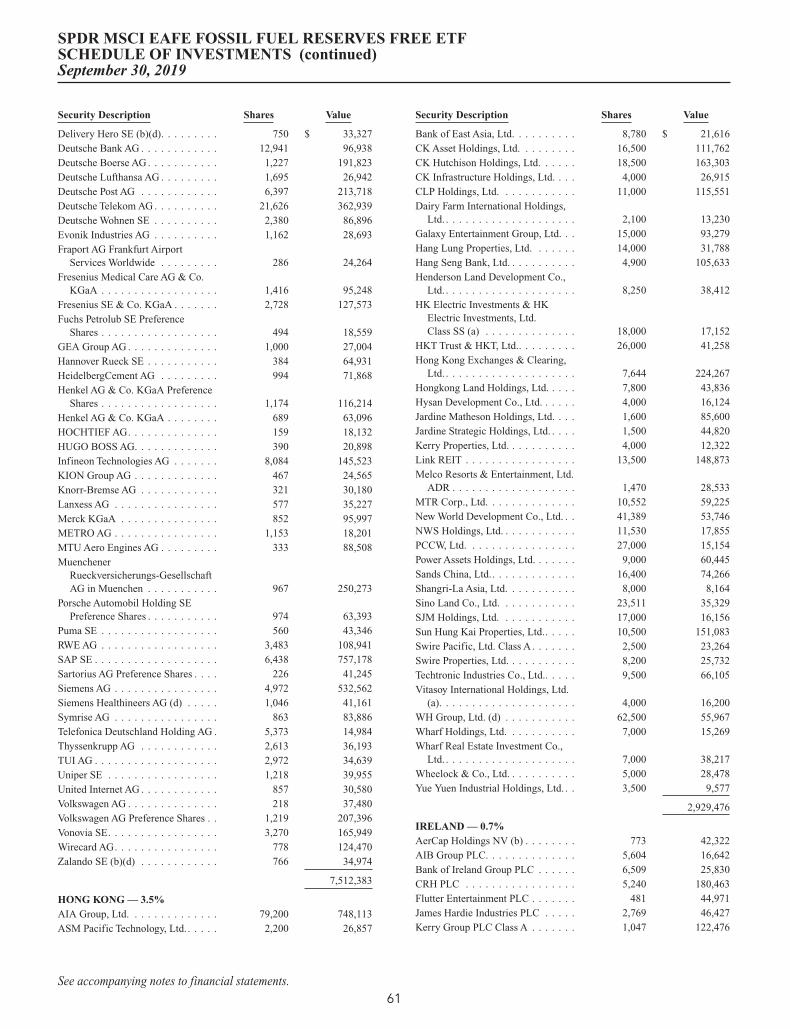
Security Description Shares Value
Delivery Hero SE (b)(d). . . . . . . . . 750 $ 33,327Deutsche Bank AG . . . . . . . . . . . . 12,941 96,938Deutsche Boerse AG . . . . . . . . . . . 1,227 191,823Deutsche Lufthansa AG . . . . . . . . . 1,695 26,942Deutsche Post AG . . . . . . . . . . . . 6,397 213,718Deutsche Telekom AG . . . . . . . . . . 21,626 362,939Deutsche Wohnen SE . . . . . . . . . . 2,380 86,896Evonik Industries AG . . . . . . . . . . 1,162 28,693Fraport AG Frankfurt Airport
Services Worldwide . . . . . . . . . 286 24,264Fresenius Medical Care AG & Co.
KGaA . . . . . . . . . . . . . . . . . . 1,416 95,248Fresenius SE & Co. KGaA . . . . . . . 2,728 127,573Fuchs Petrolub SE Preference
Shares . . . . . . . . . . . . . . . . . . 494 18,559GEA Group AG . . . . . . . . . . . . . . 1,000 27,004Hannover Rueck SE . . . . . . . . . . . 384 64,931HeidelbergCement AG . . . . . . . . . 994 71,868Henkel AG & Co. KGaA Preference
Shares . . . . . . . . . . . . . . . . . . 1,174 116,214Henkel AG & Co. KGaA . . . . . . . . 689 63,096HOCHTIEF AG. . . . . . . . . . . . . . 159 18,132HUGO BOSS AG. . . . . . . . . . . . . 390 20,898Infineon Technologies AG . . . . . . . 8,084 145,523KION Group AG . . . . . . . . . . . . . 467 24,565Knorr-Bremse AG . . . . . . . . . . . . 321 30,180Lanxess AG . . . . . . . . . . . . . . . . 577 35,227Merck KGaA . . . . . . . . . . . . . . . 852 95,997METRO AG . . . . . . . . . . . . . . . . 1,153 18,201MTU Aero Engines AG . . . . . . . . . 333 88,508Muenchener
Rueckversicherungs-GesellschaftAG in Muenchen . . . . . . . . . . . 967 250,273
Porsche Automobil Holding SEPreference Shares . . . . . . . . . . . 974 63,393
Puma SE . . . . . . . . . . . . . . . . . . 560 43,346RWE AG . . . . . . . . . . . . . . . . . . 3,483 108,941SAP SE . . . . . . . . . . . . . . . . . . . 6,438 757,178Sartorius AG Preference Shares . . . . 226 41,245Siemens AG . . . . . . . . . . . . . . . . 4,972 532,562Siemens Healthineers AG (d) . . . . . 1,046 41,161Symrise AG . . . . . . . . . . . . . . . . 863 83,886Telefonica Deutschland Holding AG . 5,373 14,984Thyssenkrupp AG . . . . . . . . . . . . 2,613 36,193TUI AG . . . . . . . . . . . . . . . . . . . 2,972 34,639Uniper SE . . . . . . . . . . . . . . . . . 1,218 39,955United Internet AG . . . . . . . . . . . . 857 30,580Volkswagen AG . . . . . . . . . . . . . . 218 37,480Volkswagen AG Preference Shares . . 1,219 207,396Vonovia SE. . . . . . . . . . . . . . . . . 3,270 165,949Wirecard AG. . . . . . . . . . . . . . . . 778 124,470Zalando SE (b)(d) . . . . . . . . . . . . 766 34,974
7,512,383
HONG KONG — 3.5%AIA Group, Ltd. . . . . . . . . . . . . . 79,200 748,113ASM Pacific Technology, Ltd. . . . . . 2,200 26,857
Security Description Shares Value
Bank of East Asia, Ltd. . . . . . . . . . 8,780 $ 21,616CK Asset Holdings, Ltd. . . . . . . . . 16,500 111,762CK Hutchison Holdings, Ltd. . . . . . 18,500 163,303CK Infrastructure Holdings, Ltd. . . . 4,000 26,915CLP Holdings, Ltd. . . . . . . . . . . . 11,000 115,551Dairy Farm International Holdings,
Ltd. . . . . . . . . . . . . . . . . . . . . 2,100 13,230Galaxy Entertainment Group, Ltd. . . 15,000 93,279Hang Lung Properties, Ltd. . . . . . . 14,000 31,788Hang Seng Bank, Ltd. . . . . . . . . . . 4,900 105,633Henderson Land Development Co.,
Ltd. . . . . . . . . . . . . . . . . . . . . 8,250 38,412HK Electric Investments & HK
Electric Investments, Ltd.Class SS (a) . . . . . . . . . . . . . . 18,000 17,152
HKT Trust & HKT, Ltd.. . . . . . . . . 26,000 41,258Hong Kong Exchanges & Clearing,
Ltd. . . . . . . . . . . . . . . . . . . . . 7,644 224,267Hongkong Land Holdings, Ltd. . . . . 7,800 43,836Hysan Development Co., Ltd. . . . . . 4,000 16,124Jardine Matheson Holdings, Ltd. . . . 1,600 85,600Jardine Strategic Holdings, Ltd. . . . . 1,500 44,820Kerry Properties, Ltd. . . . . . . . . . . 4,000 12,322Link REIT . . . . . . . . . . . . . . . . . 13,500 148,873Melco Resorts & Entertainment, Ltd.
ADR . . . . . . . . . . . . . . . . . . . 1,470 28,533MTR Corp., Ltd. . . . . . . . . . . . . . 10,552 59,225New World Development Co., Ltd. . . 41,389 53,746NWS Holdings, Ltd. . . . . . . . . . . . 11,530 17,855PCCW, Ltd. . . . . . . . . . . . . . . . . 27,000 15,154Power Assets Holdings, Ltd. . . . . . . 9,000 60,445Sands China, Ltd.. . . . . . . . . . . . . 16,400 74,266Shangri-La Asia, Ltd. . . . . . . . . . . 8,000 8,164Sino Land Co., Ltd. . . . . . . . . . . . 23,511 35,329SJM Holdings, Ltd. . . . . . . . . . . . 17,000 16,156Sun Hung Kai Properties, Ltd.. . . . . 10,500 151,083Swire Pacific, Ltd. Class A. . . . . . . 2,500 23,264Swire Properties, Ltd. . . . . . . . . . . 8,200 25,732Techtronic Industries Co., Ltd.. . . . . 9,500 66,105Vitasoy International Holdings, Ltd.
(a). . . . . . . . . . . . . . . . . . . . . 4,000 16,200WH Group, Ltd. (d) . . . . . . . . . . . 62,500 55,967Wharf Holdings, Ltd. . . . . . . . . . . 7,000 15,269Wharf Real Estate Investment Co.,
Ltd. . . . . . . . . . . . . . . . . . . . . 7,000 38,217Wheelock & Co., Ltd. . . . . . . . . . . 5,000 28,478Yue Yuen Industrial Holdings, Ltd. . . 3,500 9,577
2,929,476
IRELAND — 0.7%AerCap Holdings NV (b) . . . . . . . . 773 42,322AIB Group PLC. . . . . . . . . . . . . . 5,604 16,642Bank of Ireland Group PLC . . . . . . 6,509 25,830CRH PLC . . . . . . . . . . . . . . . . . 5,240 180,463Flutter Entertainment PLC . . . . . . . 481 44,971James Hardie Industries PLC . . . . . 2,769 46,427Kerry Group PLC Class A . . . . . . . 1,047 122,476
SPDR MSCI EAFE FOSSIL FUEL RESERVES FREE ETFSCHEDULE OF INVESTMENTS (continued)September 30, 2019
See accompanying notes to financial statements.61

Security Description Shares Value
Kingspan Group PLC . . . . . . . . . . 1,021 $ 49,867Smurfit Kappa Group PLC . . . . . . . 1,562 46,489
575,487
ISRAEL — 0.6%Azrieli Group, Ltd. . . . . . . . . . . . . 309 24,270Bank Hapoalim BM (b) . . . . . . . . . 6,946 54,756Bank Leumi Le-Israel BM . . . . . . . 9,287 66,103Check Point Software Technologies,
Ltd. (a)(b). . . . . . . . . . . . . . . . 806 88,257CyberArk Software, Ltd. (b) . . . . . . 200 19,964Elbit Systems, Ltd. . . . . . . . . . . . . 158 26,183Israel Chemicals, Ltd. . . . . . . . . . . 3,747 18,607Israel Discount Bank, Ltd. Class A . . 6,778 29,816Mizrahi Tefahot Bank, Ltd. . . . . . . . 987 24,534Nice, Ltd. (b) . . . . . . . . . . . . . . . 419 61,600Teva Pharmaceutical Industries, Ltd.
ADR (a)(b) . . . . . . . . . . . . . . . 1,990 13,691Teva Pharmaceutical Industries, Ltd.
(b) . . . . . . . . . . . . . . . . . . . . 5,236 36,034Wix.com, Ltd. (a)(b) . . . . . . . . . . . 300 35,022
498,837
ITALY — 1.5%Assicurazioni Generali SpA . . . . . . 7,245 140,435Atlantia SpA. . . . . . . . . . . . . . . . 3,173 76,760Davide Campari-Milano SpA . . . . . 4,001 36,160Ferrari NV . . . . . . . . . . . . . . . . . 808 124,689FinecoBank Banca Fineco SpA . . . . 3,425 36,264Intesa Sanpaolo SpA. . . . . . . . . . . 96,258 228,298Leonardo SpA . . . . . . . . . . . . . . . 2,841 33,419Mediobanca Banca di Credito
Finanziario SpA . . . . . . . . . . . . 4,027 43,990Moncler SpA . . . . . . . . . . . . . . . 1,235 44,027Pirelli & C SpA (d). . . . . . . . . . . . 2,416 14,297Poste Italiane SpA (d) . . . . . . . . . . 3,674 41,776Prysmian SpA . . . . . . . . . . . . . . . 1,596 34,277Recordati SpA. . . . . . . . . . . . . . . 730 31,325Snam SpA . . . . . . . . . . . . . . . . . 13,764 69,536Telecom Italia SpA (b)(e) . . . . . . . . 60,323 34,428Telecom Italia SpA (e). . . . . . . . . . 42,444 23,210Terna Rete Elettrica Nazionale SpA . 9,332 59,964UniCredit SpA . . . . . . . . . . . . . . 13,202 155,730
1,228,585
JAPAN — 26.2%ABC-Mart, Inc. . . . . . . . . . . . . . . 200 12,713Acom Co., Ltd. (a) . . . . . . . . . . . . 2,700 10,593Advantest Corp.. . . . . . . . . . . . . . 1,500 66,273Aeon Co., Ltd. (a) . . . . . . . . . . . . 4,200 76,966AEON Financial Service Co., Ltd.
(a). . . . . . . . . . . . . . . . . . . . . 500 7,523Aeon Mall Co., Ltd. . . . . . . . . . . . 600 9,466AGC, Inc.. . . . . . . . . . . . . . . . . . 1,300 40,296Air Water, Inc.. . . . . . . . . . . . . . . 1,100 19,664Aisin Seiki Co., Ltd. (a) . . . . . . . . . 1,200 37,696Ajinomoto Co., Inc. . . . . . . . . . . . 2,900 54,740Alfresa Holdings Corp. . . . . . . . . . 1,300 29,025
Security Description Shares Value
Alps Alpine Co., Ltd. . . . . . . . . . . 1,400 $ 26,128Amada Holdings Co., Ltd. (a) . . . . . 2,100 22,618ANA Holdings, Inc. . . . . . . . . . . . 700 23,537Aozora Bank, Ltd. . . . . . . . . . . . . 600 15,001Asahi Group Holdings, Ltd. . . . . . . 2,400 118,806Asahi Intecc Co., Ltd. . . . . . . . . . . 1,200 31,500Asahi Kasei Corp. (a) . . . . . . . . . . 8,400 82,698Astellas Pharma, Inc. . . . . . . . . . . 12,200 173,673Bandai Namco Holdings, Inc. (a) . . . 1,500 93,407Bank of Kyoto, Ltd. . . . . . . . . . . . 200 7,819Benesse Holdings, Inc. (a) . . . . . . . 300 7,789Bridgestone Corp. . . . . . . . . . . . . 3,900 150,984Brother Industries, Ltd. . . . . . . . . . 1,600 28,958Calbee, Inc. . . . . . . . . . . . . . . . . 500 15,545Canon, Inc. . . . . . . . . . . . . . . . . . 6,700 178,698Casio Computer Co., Ltd. (a) . . . . . 1,200 18,598Central Japan Railway Co. . . . . . . . 900 185,038Chiba Bank, Ltd. (a) . . . . . . . . . . . 4,000 20,578Chubu Electric Power Co., Inc. . . . . 4,000 57,923Chugai Pharmaceutical Co., Ltd. . . . 1,600 124,358Chugoku Electric Power Co., Inc.
(a). . . . . . . . . . . . . . . . . . . . . 2,000 25,704Coca-Cola Bottlers Japan Holdings,
Inc. . . . . . . . . . . . . . . . . . . . . 600 13,457Concordia Financial Group, Ltd. (a) . 7,800 29,879Credit Saison Co., Ltd. . . . . . . . . . 1,400 18,770CyberAgent, Inc. (a) . . . . . . . . . . . 500 19,200Dai Nippon Printing Co., Ltd. . . . . . 1,800 46,484Daicel Corp. (a) . . . . . . . . . . . . . . 1,900 16,051Daifuku Co., Ltd. (a). . . . . . . . . . . 600 30,923Dai-ichi Life Holdings, Inc. . . . . . . 7,100 107,017Daiichi Sankyo Co., Ltd. . . . . . . . . 3,900 245,529Daikin Industries, Ltd.. . . . . . . . . . 1,700 223,049Daito Trust Construction Co., Ltd.
(a). . . . . . . . . . . . . . . . . . . . . 500 63,891Daiwa House Industry Co., Ltd.. . . . 3,800 123,274Daiwa House REIT Investment
Corp.. . . . . . . . . . . . . . . . . . . 12 33,754Daiwa Securities Group, Inc. (a) . . . 9,600 42,761Denso Corp. (a) . . . . . . . . . . . . . . 2,700 118,643Dentsu, Inc. . . . . . . . . . . . . . . . . 1,600 56,331Disco Corp. (a) . . . . . . . . . . . . . . 200 37,863East Japan Railway Co. . . . . . . . . . 2,100 200,333Eisai Co., Ltd. . . . . . . . . . . . . . . . 1,700 86,372FamilyMart Co., Ltd. (a) . . . . . . . . 1,700 41,417FANUC Corp. (a). . . . . . . . . . . . . 1,300 244,663Fast Retailing Co., Ltd. (a) . . . . . . . 400 237,650Fuji Electric Co., Ltd. . . . . . . . . . . 800 24,464FUJIFILM Holdings Corp. . . . . . . . 2,400 105,260Fujitsu, Ltd. . . . . . . . . . . . . . . . . 1,400 112,117Fukuoka Financial Group, Inc. (a) . . 1,200 22,662GMO Payment Gateway, Inc. (a) . . . 200 13,380Hakuhodo DY Holdings, Inc. (a) . . . 1,800 25,999Hamamatsu Photonics KK . . . . . . . 800 29,683Hankyu Hanshin Holdings, Inc. (a). . 1,600 61,661Hikari Tsushin, Inc. . . . . . . . . . . . 100 21,633
SPDR MSCI EAFE FOSSIL FUEL RESERVES FREE ETFSCHEDULE OF INVESTMENTS (continued)September 30, 2019
See accompanying notes to financial statements.62

Security Description Shares Value
Hino Motors, Ltd. . . . . . . . . . . . . 1,900 $ 15,647Hirose Electric Co., Ltd. (a) . . . . . . 205 25,114Hisamitsu Pharmaceutical Co., Inc. . 300 13,116Hitachi Chemical Co., Ltd. . . . . . . . 600 19,570Hitachi Construction Machinery Co.,
Ltd. (a) . . . . . . . . . . . . . . . . . 700 16,873Hitachi High-Technologies Corp. . . . 300 17,321Hitachi Metals, Ltd. (a) . . . . . . . . . 1,400 15,104Hitachi, Ltd. . . . . . . . . . . . . . . . . 6,500 241,957Honda Motor Co., Ltd. . . . . . . . . . 10,500 271,888Hoshizaki Corp.. . . . . . . . . . . . . . 300 23,567Hoya Corp.. . . . . . . . . . . . . . . . . 2,500 204,002Hulic Co., Ltd. . . . . . . . . . . . . . . 2,100 21,471IHI Corp. . . . . . . . . . . . . . . . . . . 800 17,381Iida Group Holdings Co., Ltd. . . . . . 1,100 17,893Isetan Mitsukoshi Holdings, Ltd. (a) . 2,100 16,749Isuzu Motors, Ltd. (a) . . . . . . . . . . 3,900 42,960ITOCHU Corp. . . . . . . . . . . . . . . 9,000 185,788Itochu Techno-Solutions Corp. (a) . . 600 15,889J Front Retailing Co., Ltd. . . . . . . . 1,700 19,882Japan Airlines Co., Ltd. . . . . . . . . . 600 17,832Japan Airport Terminal Co., Ltd. (a) . 300 12,991Japan Exchange Group, Inc. . . . . . . 3,200 50,306Japan Post Bank Co., Ltd. (a) . . . . . 2,600 25,188Japan Post Holdings Co., Ltd. . . . . . 10,300 94,828Japan Prime Realty Investment Corp.
REIT . . . . . . . . . . . . . . . . . . . 5 23,734Japan Real Estate Investment Corp.
REIT (a). . . . . . . . . . . . . . . . . 9 60,375Japan Retail Fund Investment Corp.
REIT . . . . . . . . . . . . . . . . . . . 19 40,189Japan Tobacco, Inc. . . . . . . . . . . . 7,800 170,759JFE Holdings, Inc. . . . . . . . . . . . . 3,100 37,289JGC Corp. (a) . . . . . . . . . . . . . . . 1,600 20,919JSR Corp. (a) . . . . . . . . . . . . . . . 1,400 22,397JTEKT Corp. (a) . . . . . . . . . . . . . 1,600 18,343Kajima Corp. . . . . . . . . . . . . . . . 2,800 36,712Kakaku.com, Inc. . . . . . . . . . . . . . 800 19,675Kamigumi Co., Ltd. . . . . . . . . . . . 500 11,325Kaneka Corp. . . . . . . . . . . . . . . . 200 6,227Kansai Electric Power Co., Inc. (a) . . 4,700 52,556Kansai Paint Co., Ltd. (a) . . . . . . . . 1,200 27,881Kao Corp. . . . . . . . . . . . . . . . . . 3,100 229,011Kawasaki Heavy Industries, Ltd. . . . 800 17,706KDDI Corp. . . . . . . . . . . . . . . . . 11,600 303,215Keihan Holdings Co., Ltd. . . . . . . . 600 26,676Keikyu Corp. (a) . . . . . . . . . . . . . 1,600 31,015Keio Corp. . . . . . . . . . . . . . . . . . 600 37,363Keisei Electric Railway Co., Ltd. . . . 800 32,903Keyence Corp.. . . . . . . . . . . . . . . 600 371,409Kikkoman Corp. . . . . . . . . . . . . . 900 42,970Kintetsu Group Holdings Co., Ltd.
(a). . . . . . . . . . . . . . . . . . . . . 1,300 67,721Kirin Holdings Co., Ltd. . . . . . . . . 5,300 112,204Kobayashi Pharmaceutical Co., Ltd. . 300 22,817Kobe Steel, Ltd. (a) . . . . . . . . . . . 1,900 10,126
Security Description Shares Value
Koito Manufacturing Co., Ltd. . . . . 600 $ 29,313Komatsu, Ltd. . . . . . . . . . . . . . . . 6,200 141,985Konami Holdings Corp. (a) . . . . . . 500 24,150Konica Minolta, Inc. (a). . . . . . . . . 3,200 22,266Kose Corp. (a). . . . . . . . . . . . . . . 200 33,773Kubota Corp. . . . . . . . . . . . . . . . 6,700 101,329Kuraray Co., Ltd. . . . . . . . . . . . . . 2,200 27,013Kurita Water Industries, Ltd. (a). . . . 400 10,707Kyocera Corp. . . . . . . . . . . . . . . . 2,100 130,285Kyowa Kirin Co., Ltd. (a) . . . . . . . . 1,600 31,060Kyushu Electric Power Co., Inc. (a) . 2,600 24,538Kyushu Railway Co. (a) . . . . . . . . . 1,249 39,813Lawson, Inc. . . . . . . . . . . . . . . . . 300 15,350LINE Corp. (a)(b) . . . . . . . . . . . . 400 14,305Lion Corp. (a) . . . . . . . . . . . . . . . 1,600 31,548LIXIL Group Corp. (a) . . . . . . . . . 1,900 33,403M3, Inc. (a) . . . . . . . . . . . . . . . . 2,600 62,597Makita Corp.. . . . . . . . . . . . . . . . 1,500 47,189Marubeni Corp. . . . . . . . . . . . . . . 10,100 67,072Marui Group Co., Ltd. (a) . . . . . . . 1,400 29,561Maruichi Steel Tube, Ltd. (a). . . . . . 300 7,919Mazda Motor Corp. (a) . . . . . . . . . 4,000 35,512McDonald’s Holdings Co. Japan,
Ltd. . . . . . . . . . . . . . . . . . . . . 400 19,357Mebuki Financial Group, Inc. (a) . . . 5,700 14,029Medipal Holdings Corp. . . . . . . . . 1,200 26,715MEIJI Holdings Co., Ltd. (a) . . . . . 800 58,330Mercari, Inc. (b). . . . . . . . . . . . . . 500 12,422MINEBEA MITSUMI, Inc. . . . . . . 2,300 36,413MISUMI Group, Inc. . . . . . . . . . . 2,000 47,060Mitsubishi Chemical Holdings
Corp.. . . . . . . . . . . . . . . . . . . 8,400 59,855Mitsubishi Corp. . . . . . . . . . . . . . 8,900 218,310Mitsubishi Electric Corp. (a). . . . . . 12,000 159,056Mitsubishi Estate Co., Ltd. . . . . . . . 7,700 148,478Mitsubishi Gas Chemical Co., Inc. . . 1,100 14,677Mitsubishi Heavy Industries, Ltd.
(a). . . . . . . . . . . . . . . . . . . . . 2,100 82,232Mitsubishi Materials Corp. . . . . . . . 600 16,183Mitsubishi Motors Corp. (a) . . . . . . 4,200 18,226Mitsubishi Tanabe Pharma Corp. . . . 1,800 19,736Mitsubishi UFJ Financial Group,
Inc. . . . . . . . . . . . . . . . . . . . . 80,500 408,477Mitsubishi UFJ Lease & Finance
Co., Ltd. (a) . . . . . . . . . . . . . . 2,200 12,702Mitsui & Co., Ltd. (a) . . . . . . . . . . 11,000 179,949Mitsui Chemicals, Inc.. . . . . . . . . . 1,300 29,061Mitsui Fudosan Co., Ltd. . . . . . . . . 5,700 141,294Mitsui OSK Lines, Ltd. . . . . . . . . . 700 17,682Mizuho Financial Group, Inc. (a) . . . 156,300 239,494MonotaRO Co., Ltd. (a) . . . . . . . . . 700 18,304MS&AD Insurance Group Holdings,
Inc. . . . . . . . . . . . . . . . . . . . . 3,000 97,155Murata Manufacturing Co., Ltd. . . . 3,900 187,106Nabtesco Corp. (a) . . . . . . . . . . . . 700 21,665Nagoya Railroad Co., Ltd. . . . . . . . 1,300 38,853NEC Corp. . . . . . . . . . . . . . . . . . 1,600 67,509
SPDR MSCI EAFE FOSSIL FUEL RESERVES FREE ETFSCHEDULE OF INVESTMENTS (continued)September 30, 2019
See accompanying notes to financial statements.63

Security Description Shares Value
Nexon Co., Ltd. (b) . . . . . . . . . . . 3,200 $ 38,817NGK Insulators, Ltd. . . . . . . . . . . 1,900 27,056NGK Spark Plug Co., Ltd. . . . . . . . 1,100 20,947NH Foods, Ltd. . . . . . . . . . . . . . . 500 20,102Nidec Corp. (a) . . . . . . . . . . . . . . 1,500 201,527Nikon Corp. (a) . . . . . . . . . . . . . . 2,200 27,440Nintendo Co., Ltd. . . . . . . . . . . . . 700 259,209Nippon Building Fund, Inc. REIT . . 8 61,439Nippon Electric Glass Co., Ltd. . . . . 500 11,122Nippon Express Co., Ltd. . . . . . . . . 400 20,393Nippon Paint Holdings Co., Ltd. . . . 900 46,718Nippon Prologis REIT, Inc.. . . . . . . 14 38,357Nippon Steel Corp. (a) . . . . . . . . . 5,200 72,437Nippon Telegraph & Telephone
Corp.. . . . . . . . . . . . . . . . . . . 4,300 205,143Nippon Yusen KK (a) . . . . . . . . . . 1,200 20,042Nissan Chemical Corp. . . . . . . . . . 700 29,114Nissan Motor Co., Ltd. (a) . . . . . . . 15,200 94,807Nisshin Seifun Group, Inc. . . . . . . . 1,400 25,882Nissin Foods Holdings Co., Ltd. . . . 300 21,652Nitori Holdings Co., Ltd. . . . . . . . . 500 73,144Nitto Denko Corp. . . . . . . . . . . . . 1,200 57,782Nomura Holdings, Inc. (a) . . . . . . . 22,000 93,211Nomura Real Estate Holdings, Inc. . . 800 17,277Nomura Real Estate Master Fund,
Inc. REIT . . . . . . . . . . . . . . . . 26 46,960Nomura Research Institute, Ltd.. . . . 2,100 41,796NSK, Ltd. (a) . . . . . . . . . . . . . . . 2,600 21,892NTT Data Corp. (a) . . . . . . . . . . . 4,100 52,884NTT DOCOMO, Inc. (a) . . . . . . . . 8,800 224,163Obayashi Corp. . . . . . . . . . . . . . . 4,400 43,807Obic Co., Ltd. . . . . . . . . . . . . . . . 400 45,598Odakyu Electric Railway Co., Ltd.
(a). . . . . . . . . . . . . . . . . . . . . 1,900 45,498Oji Holdings Corp. . . . . . . . . . . . . 5,600 26,115Olympus Corp. . . . . . . . . . . . . . . 7,700 103,735Omron Corp. (a) . . . . . . . . . . . . . 1,400 76,558Ono Pharmaceutical Co., Ltd. . . . . . 2,600 47,080Oracle Corp. Japan . . . . . . . . . . . . 200 17,340Oriental Land Co., Ltd. (a) . . . . . . . 1,300 197,752ORIX Corp. . . . . . . . . . . . . . . . . 8,900 132,666Osaka Gas Co., Ltd. (a) . . . . . . . . . 2,500 47,814Otsuka Corp.. . . . . . . . . . . . . . . . 600 23,900Otsuka Holdings Co., Ltd. . . . . . . . 2,600 97,192Pan Pacific International Holdings
Corp.. . . . . . . . . . . . . . . . . . . 2,400 40,083Panasonic Corp. (a) . . . . . . . . . . . 14,500 117,476Park24 Co., Ltd. (a) . . . . . . . . . . . 700 16,244PeptiDream, Inc. (b) . . . . . . . . . . . 500 23,734Persol Holdings Co., Ltd. (a). . . . . . 1,400 26,452Pigeon Corp. (a) . . . . . . . . . . . . . 700 28,855Pola Orbis Holdings, Inc. . . . . . . . . 500 11,191Rakuten, Inc.. . . . . . . . . . . . . . . . 5,700 56,169Recruit Holdings Co., Ltd. . . . . . . . 8,900 270,603Renesas Electronics Corp. (b) . . . . . 5,400 35,076Resona Holdings, Inc. (a) . . . . . . . . 14,000 59,977
Security Description Shares Value
Ricoh Co., Ltd. (a) . . . . . . . . . . . . 4,500 $ 40,514Rinnai Corp. . . . . . . . . . . . . . . . . 200 13,435Rohm Co., Ltd. . . . . . . . . . . . . . . 500 38,168Ryohin Keikaku Co., Ltd.. . . . . . . . 2,000 37,344Sankyo Co., Ltd. (a) . . . . . . . . . . . 300 10,312Santen Pharmaceutical Co., Ltd. (a) . 2,600 45,180SBI Holdings, Inc. (a) . . . . . . . . . . 1,700 36,352Secom Co., Ltd.. . . . . . . . . . . . . . 1,500 136,822Sega Sammy Holdings, Inc. (a) . . . . 1,400 19,586Seibu Holdings, Inc. . . . . . . . . . . . 1,400 24,392Seiko Epson Corp. (a) . . . . . . . . . . 1,800 25,316Sekisui Chemical Co., Ltd. (a). . . . . 2,600 40,248Sekisui House, Ltd. . . . . . . . . . . . 4,300 84,548Seven & i Holdings Co., Ltd. . . . . . 4,900 187,340Seven Bank, Ltd. (a) . . . . . . . . . . . 3,500 9,586SG Holdings Co., Ltd. . . . . . . . . . . 800 19,579Sharp Corp. . . . . . . . . . . . . . . . . 1,300 14,374Shimadzu Corp.. . . . . . . . . . . . . . 1,500 37,863Shimamura Co., Ltd.. . . . . . . . . . . 100 7,920Shimano, Inc. . . . . . . . . . . . . . . . 500 75,318Shimizu Corp. (a). . . . . . . . . . . . . 3,800 34,387Shin-Etsu Chemical Co., Ltd. . . . . . 2,400 256,711Shinsei Bank, Ltd. . . . . . . . . . . . . 700 10,195Shionogi & Co., Ltd.. . . . . . . . . . . 1,800 99,914Shiseido Co., Ltd. . . . . . . . . . . . . 2,600 207,591Shizuoka Bank, Ltd. (a) . . . . . . . . . 2,600 19,366Showa Denko KK . . . . . . . . . . . . 700 18,297SMC Corp. . . . . . . . . . . . . . . . . . 400 170,622Softbank Corp. (a) . . . . . . . . . . . . 11,300 153,071SoftBank Group Corp. (a) . . . . . . . 10,800 423,706Sohgo Security Services Co., Ltd.
(a). . . . . . . . . . . . . . . . . . . . . 400 20,948Sompo Holdings, Inc. (a) . . . . . . . . 2,200 91,949Sony Corp. . . . . . . . . . . . . . . . . . 8,500 499,186Sony Financial Holdings, Inc. . . . . . 1,200 26,004Stanley Electric Co., Ltd. . . . . . . . . 800 21,141Subaru Corp. . . . . . . . . . . . . . . . 4,200 118,140SUMCO Corp. . . . . . . . . . . . . . . 1,700 22,808Sumitomo Chemical Co., Ltd. . . . . . 9,200 41,286Sumitomo Corp. (a) . . . . . . . . . . . 7,800 121,826Sumitomo Dainippon Pharma Co.,
Ltd. (a) . . . . . . . . . . . . . . . . . 1,300 21,351Sumitomo Electric Industries, Ltd.
(a). . . . . . . . . . . . . . . . . . . . . 4,800 60,891Sumitomo Heavy Industries, Ltd. . . . 700 20,726Sumitomo Metal Mining Co., Ltd. . . 1,700 52,648Sumitomo Mitsui Financial Group,
Inc. (a) . . . . . . . . . . . . . . . . . . 8,800 300,865Sumitomo Mitsui Trust Holdings,
Inc. (a) . . . . . . . . . . . . . . . . . . 2,200 79,308Sumitomo Realty & Development
Co., Ltd. (a) . . . . . . . . . . . . . . 2,200 83,725Sumitomo Rubber Industries, Ltd. . . 1,400 16,607Sundrug Co., Ltd.. . . . . . . . . . . . . 400 12,584Suntory Beverage & Food, Ltd. . . . . 800 34,198Suzuken Co., Ltd. . . . . . . . . . . . . 400 21,467Suzuki Motor Corp. (a) . . . . . . . . . 2,400 101,863
SPDR MSCI EAFE FOSSIL FUEL RESERVES FREE ETFSCHEDULE OF INVESTMENTS (continued)September 30, 2019
See accompanying notes to financial statements.64
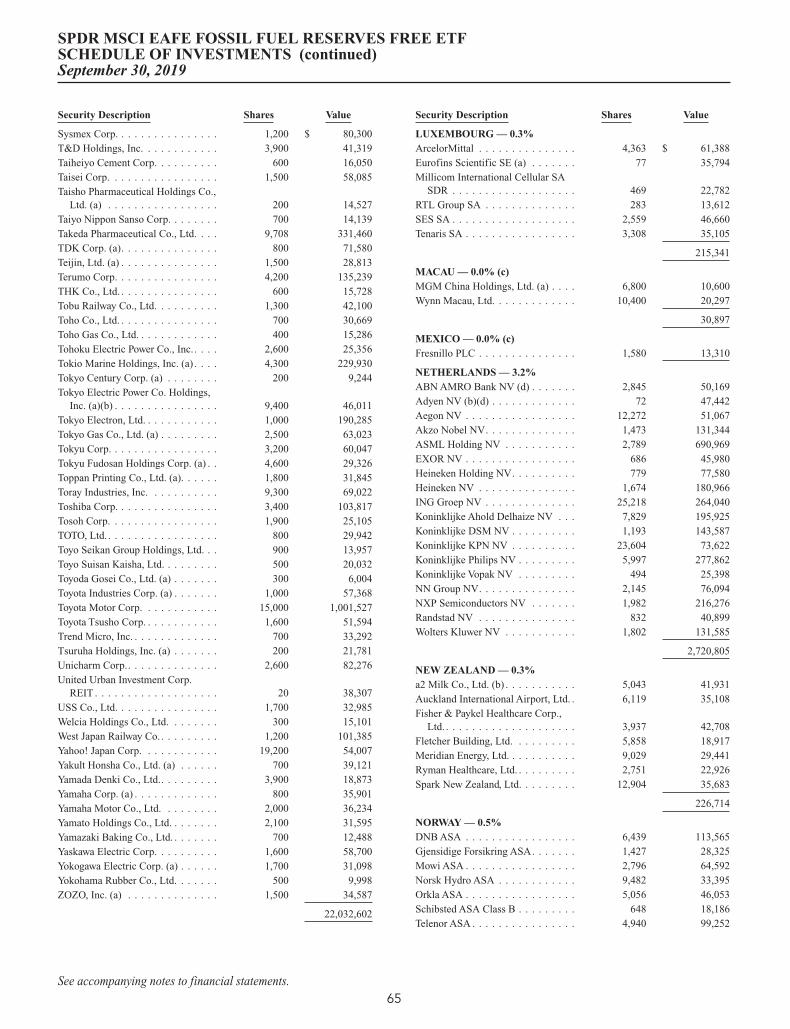
Security Description Shares Value
Sysmex Corp. . . . . . . . . . . . . . . . 1,200 $ 80,300T&D Holdings, Inc. . . . . . . . . . . . 3,900 41,319Taiheiyo Cement Corp. . . . . . . . . . 600 16,050Taisei Corp. . . . . . . . . . . . . . . . . 1,500 58,085Taisho Pharmaceutical Holdings Co.,
Ltd. (a) . . . . . . . . . . . . . . . . . 200 14,527Taiyo Nippon Sanso Corp. . . . . . . . 700 14,139Takeda Pharmaceutical Co., Ltd. . . . 9,708 331,460TDK Corp. (a). . . . . . . . . . . . . . . 800 71,580Teijin, Ltd. (a) . . . . . . . . . . . . . . . 1,500 28,813Terumo Corp. . . . . . . . . . . . . . . . 4,200 135,239THK Co., Ltd. . . . . . . . . . . . . . . . 600 15,728Tobu Railway Co., Ltd. . . . . . . . . . 1,300 42,100Toho Co., Ltd. . . . . . . . . . . . . . . . 700 30,669Toho Gas Co., Ltd. . . . . . . . . . . . . 400 15,286Tohoku Electric Power Co., Inc. . . . . 2,600 25,356Tokio Marine Holdings, Inc. (a) . . . . 4,300 229,930Tokyo Century Corp. (a) . . . . . . . . 200 9,244Tokyo Electric Power Co. Holdings,
Inc. (a)(b) . . . . . . . . . . . . . . . . 9,400 46,011Tokyo Electron, Ltd. . . . . . . . . . . . 1,000 190,285Tokyo Gas Co., Ltd. (a) . . . . . . . . . 2,500 63,023Tokyu Corp. . . . . . . . . . . . . . . . . 3,200 60,047Tokyu Fudosan Holdings Corp. (a) . . 4,600 29,326Toppan Printing Co., Ltd. (a). . . . . . 1,800 31,845Toray Industries, Inc. . . . . . . . . . . 9,300 69,022Toshiba Corp. . . . . . . . . . . . . . . . 3,400 103,817Tosoh Corp. . . . . . . . . . . . . . . . . 1,900 25,105TOTO, Ltd. . . . . . . . . . . . . . . . . . 800 29,942Toyo Seikan Group Holdings, Ltd. . . 900 13,957Toyo Suisan Kaisha, Ltd. . . . . . . . . 500 20,032Toyoda Gosei Co., Ltd. (a) . . . . . . . 300 6,004Toyota Industries Corp. (a) . . . . . . . 1,000 57,368Toyota Motor Corp. . . . . . . . . . . . 15,000 1,001,527Toyota Tsusho Corp. . . . . . . . . . . . 1,600 51,594Trend Micro, Inc. . . . . . . . . . . . . . 700 33,292Tsuruha Holdings, Inc. (a) . . . . . . . 200 21,781Unicharm Corp.. . . . . . . . . . . . . . 2,600 82,276United Urban Investment Corp.
REIT . . . . . . . . . . . . . . . . . . . 20 38,307USS Co., Ltd. . . . . . . . . . . . . . . . 1,700 32,985Welcia Holdings Co., Ltd. . . . . . . . 300 15,101West Japan Railway Co. . . . . . . . . . 1,200 101,385Yahoo! Japan Corp. . . . . . . . . . . . 19,200 54,007Yakult Honsha Co., Ltd. (a) . . . . . . 700 39,121Yamada Denki Co., Ltd.. . . . . . . . . 3,900 18,873Yamaha Corp. (a) . . . . . . . . . . . . . 800 35,901Yamaha Motor Co., Ltd. . . . . . . . . 2,000 36,234Yamato Holdings Co., Ltd. . . . . . . . 2,100 31,595Yamazaki Baking Co., Ltd. . . . . . . . 700 12,488Yaskawa Electric Corp. . . . . . . . . . 1,600 58,700Yokogawa Electric Corp. (a) . . . . . . 1,700 31,098Yokohama Rubber Co., Ltd. . . . . . . 500 9,998ZOZO, Inc. (a) . . . . . . . . . . . . . . 1,500 34,587
22,032,602
Security Description Shares Value
LUXEMBOURG — 0.3%ArcelorMittal . . . . . . . . . . . . . . . 4,363 $ 61,388Eurofins Scientific SE (a) . . . . . . . 77 35,794Millicom International Cellular SA
SDR . . . . . . . . . . . . . . . . . . . 469 22,782RTL Group SA . . . . . . . . . . . . . . 283 13,612SES SA . . . . . . . . . . . . . . . . . . . 2,559 46,660Tenaris SA . . . . . . . . . . . . . . . . . 3,308 35,105
215,341
MACAU — 0.0% (c)MGM China Holdings, Ltd. (a) . . . . 6,800 10,600Wynn Macau, Ltd. . . . . . . . . . . . . 10,400 20,297
30,897
MEXICO — 0.0% (c)Fresnillo PLC . . . . . . . . . . . . . . . 1,580 13,310
NETHERLANDS — 3.2%ABN AMRO Bank NV (d) . . . . . . . 2,845 50,169Adyen NV (b)(d) . . . . . . . . . . . . . 72 47,442Aegon NV . . . . . . . . . . . . . . . . . 12,272 51,067Akzo Nobel NV. . . . . . . . . . . . . . 1,473 131,344ASML Holding NV . . . . . . . . . . . 2,789 690,969EXOR NV . . . . . . . . . . . . . . . . . 686 45,980Heineken Holding NV. . . . . . . . . . 779 77,580Heineken NV . . . . . . . . . . . . . . . 1,674 180,966ING Groep NV . . . . . . . . . . . . . . 25,218 264,040Koninklijke Ahold Delhaize NV . . . 7,829 195,925Koninklijke DSM NV . . . . . . . . . . 1,193 143,587Koninklijke KPN NV . . . . . . . . . . 23,604 73,622Koninklijke Philips NV . . . . . . . . . 5,997 277,862Koninklijke Vopak NV . . . . . . . . . 494 25,398NN Group NV. . . . . . . . . . . . . . . 2,145 76,094NXP Semiconductors NV . . . . . . . 1,982 216,276Randstad NV . . . . . . . . . . . . . . . 832 40,899Wolters Kluwer NV . . . . . . . . . . . 1,802 131,585
2,720,805
NEW ZEALAND — 0.3%a2 Milk Co., Ltd. (b) . . . . . . . . . . . 5,043 41,931Auckland International Airport, Ltd. . 6,119 35,108Fisher & Paykel Healthcare Corp.,
Ltd. . . . . . . . . . . . . . . . . . . . . 3,937 42,708Fletcher Building, Ltd. . . . . . . . . . 5,858 18,917Meridian Energy, Ltd. . . . . . . . . . . 9,029 29,441Ryman Healthcare, Ltd. . . . . . . . . . 2,751 22,926Spark New Zealand, Ltd. . . . . . . . . 12,904 35,683
226,714
NORWAY — 0.5%DNB ASA . . . . . . . . . . . . . . . . . 6,439 113,565Gjensidige Forsikring ASA. . . . . . . 1,427 28,325Mowi ASA . . . . . . . . . . . . . . . . . 2,796 64,592Norsk Hydro ASA . . . . . . . . . . . . 9,482 33,395Orkla ASA . . . . . . . . . . . . . . . . . 5,056 46,053Schibsted ASA Class B . . . . . . . . . 648 18,186Telenor ASA . . . . . . . . . . . . . . . . 4,940 99,252
SPDR MSCI EAFE FOSSIL FUEL RESERVES FREE ETFSCHEDULE OF INVESTMENTS (continued)September 30, 2019
See accompanying notes to financial statements.65
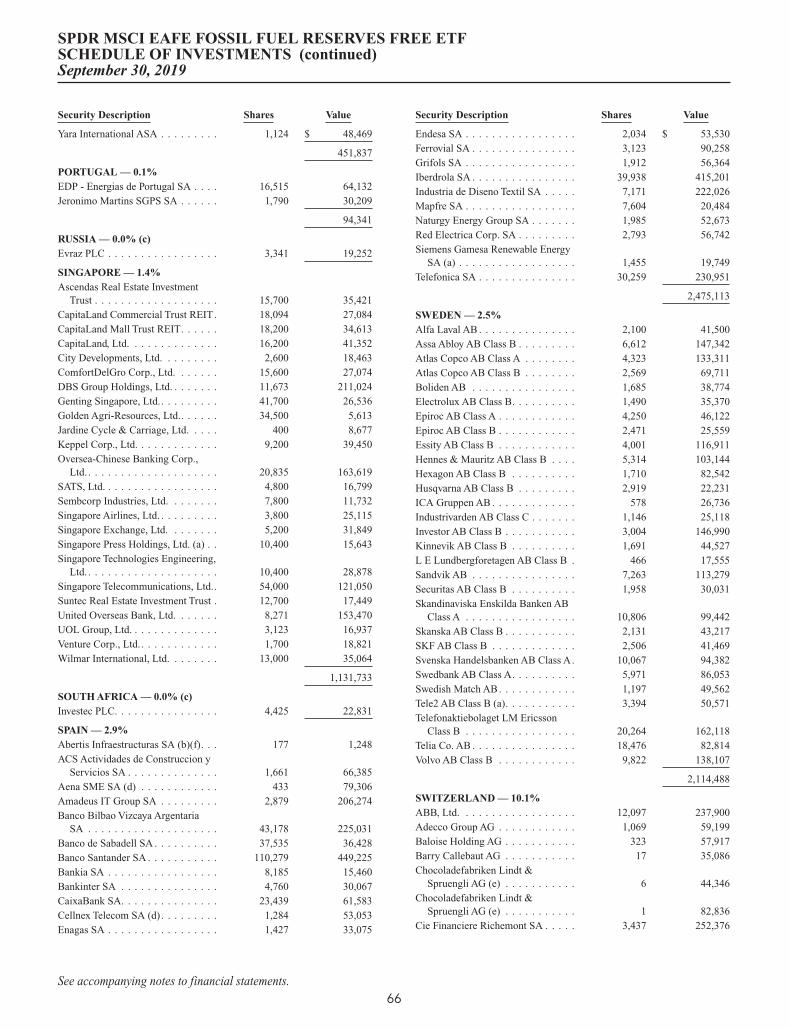
Security Description Shares Value
Yara International ASA . . . . . . . . . 1,124 $ 48,469
451,837
PORTUGAL — 0.1%EDP - Energias de Portugal SA . . . . 16,515 64,132Jeronimo Martins SGPS SA . . . . . . 1,790 30,209
94,341
RUSSIA — 0.0% (c)Evraz PLC . . . . . . . . . . . . . . . . . 3,341 19,252
SINGAPORE — 1.4%Ascendas Real Estate Investment
Trust . . . . . . . . . . . . . . . . . . . 15,700 35,421CapitaLand Commercial Trust REIT. 18,094 27,084CapitaLand Mall Trust REIT. . . . . . 18,200 34,613CapitaLand, Ltd. . . . . . . . . . . . . . 16,200 41,352City Developments, Ltd. . . . . . . . . 2,600 18,463ComfortDelGro Corp., Ltd. . . . . . . 15,600 27,074DBS Group Holdings, Ltd. . . . . . . . 11,673 211,024Genting Singapore, Ltd.. . . . . . . . . 41,700 26,536Golden Agri-Resources, Ltd.. . . . . . 34,500 5,613Jardine Cycle & Carriage, Ltd. . . . . 400 8,677Keppel Corp., Ltd. . . . . . . . . . . . . 9,200 39,450Oversea-Chinese Banking Corp.,
Ltd. . . . . . . . . . . . . . . . . . . . . 20,835 163,619SATS, Ltd. . . . . . . . . . . . . . . . . . 4,800 16,799Sembcorp Industries, Ltd. . . . . . . . 7,800 11,732Singapore Airlines, Ltd. . . . . . . . . . 3,800 25,115Singapore Exchange, Ltd. . . . . . . . 5,200 31,849Singapore Press Holdings, Ltd. (a) . . 10,400 15,643Singapore Technologies Engineering,
Ltd. . . . . . . . . . . . . . . . . . . . . 10,400 28,878Singapore Telecommunications, Ltd.. 54,000 121,050Suntec Real Estate Investment Trust . 12,700 17,449United Overseas Bank, Ltd. . . . . . . 8,271 153,470UOL Group, Ltd. . . . . . . . . . . . . . 3,123 16,937Venture Corp., Ltd.. . . . . . . . . . . . 1,700 18,821Wilmar International, Ltd. . . . . . . . 13,000 35,064
1,131,733
SOUTH AFRICA — 0.0% (c)Investec PLC. . . . . . . . . . . . . . . . 4,425 22,831
SPAIN — 2.9%Abertis Infraestructuras SA (b)(f). . . 177 1,248ACS Actividades de Construccion y
Servicios SA . . . . . . . . . . . . . . 1,661 66,385Aena SME SA (d) . . . . . . . . . . . . 433 79,306Amadeus IT Group SA . . . . . . . . . 2,879 206,274Banco Bilbao Vizcaya Argentaria
SA . . . . . . . . . . . . . . . . . . . . 43,178 225,031Banco de Sabadell SA . . . . . . . . . . 37,535 36,428Banco Santander SA . . . . . . . . . . . 110,279 449,225Bankia SA . . . . . . . . . . . . . . . . . 8,185 15,460Bankinter SA . . . . . . . . . . . . . . . 4,760 30,067CaixaBank SA. . . . . . . . . . . . . . . 23,439 61,583Cellnex Telecom SA (d) . . . . . . . . . 1,284 53,053Enagas SA . . . . . . . . . . . . . . . . . 1,427 33,075
Security Description Shares Value
Endesa SA . . . . . . . . . . . . . . . . . 2,034 $ 53,530Ferrovial SA . . . . . . . . . . . . . . . . 3,123 90,258Grifols SA . . . . . . . . . . . . . . . . . 1,912 56,364Iberdrola SA . . . . . . . . . . . . . . . . 39,938 415,201Industria de Diseno Textil SA . . . . . 7,171 222,026Mapfre SA . . . . . . . . . . . . . . . . . 7,604 20,484Naturgy Energy Group SA . . . . . . . 1,985 52,673Red Electrica Corp. SA . . . . . . . . . 2,793 56,742Siemens Gamesa Renewable Energy
SA (a) . . . . . . . . . . . . . . . . . . 1,455 19,749Telefonica SA . . . . . . . . . . . . . . . 30,259 230,951
2,475,113
SWEDEN — 2.5%Alfa Laval AB . . . . . . . . . . . . . . . 2,100 41,500Assa Abloy AB Class B . . . . . . . . . 6,612 147,342Atlas Copco AB Class A . . . . . . . . 4,323 133,311Atlas Copco AB Class B . . . . . . . . 2,569 69,711Boliden AB . . . . . . . . . . . . . . . . 1,685 38,774Electrolux AB Class B. . . . . . . . . . 1,490 35,370Epiroc AB Class A . . . . . . . . . . . . 4,250 46,122Epiroc AB Class B . . . . . . . . . . . . 2,471 25,559Essity AB Class B . . . . . . . . . . . . 4,001 116,911Hennes & Mauritz AB Class B . . . . 5,314 103,144Hexagon AB Class B . . . . . . . . . . 1,710 82,542Husqvarna AB Class B . . . . . . . . . 2,919 22,231ICA Gruppen AB . . . . . . . . . . . . . 578 26,736Industrivarden AB Class C . . . . . . . 1,146 25,118Investor AB Class B . . . . . . . . . . . 3,004 146,990Kinnevik AB Class B . . . . . . . . . . 1,691 44,527L E Lundbergforetagen AB Class B . 466 17,555Sandvik AB . . . . . . . . . . . . . . . . 7,263 113,279Securitas AB Class B . . . . . . . . . . 1,958 30,031Skandinaviska Enskilda Banken AB
Class A . . . . . . . . . . . . . . . . . 10,806 99,442Skanska AB Class B . . . . . . . . . . . 2,131 43,217SKF AB Class B . . . . . . . . . . . . . 2,506 41,469Svenska Handelsbanken AB Class A. 10,067 94,382Swedbank AB Class A. . . . . . . . . . 5,971 86,053Swedish Match AB. . . . . . . . . . . . 1,197 49,562Tele2 AB Class B (a). . . . . . . . . . . 3,394 50,571Telefonaktiebolaget LM Ericsson
Class B . . . . . . . . . . . . . . . . . 20,264 162,118Telia Co. AB . . . . . . . . . . . . . . . . 18,476 82,814Volvo AB Class B . . . . . . . . . . . . 9,822 138,107
2,114,488
SWITZERLAND — 10.1%ABB, Ltd. . . . . . . . . . . . . . . . . . 12,097 237,900Adecco Group AG . . . . . . . . . . . . 1,069 59,199Baloise Holding AG . . . . . . . . . . . 323 57,917Barry Callebaut AG . . . . . . . . . . . 17 35,086Chocoladefabriken Lindt &
Spruengli AG (e) . . . . . . . . . . . 6 44,346Chocoladefabriken Lindt &
Spruengli AG (e) . . . . . . . . . . . 1 82,836Cie Financiere Richemont SA . . . . . 3,437 252,376
SPDR MSCI EAFE FOSSIL FUEL RESERVES FREE ETFSCHEDULE OF INVESTMENTS (continued)September 30, 2019
See accompanying notes to financial statements.66
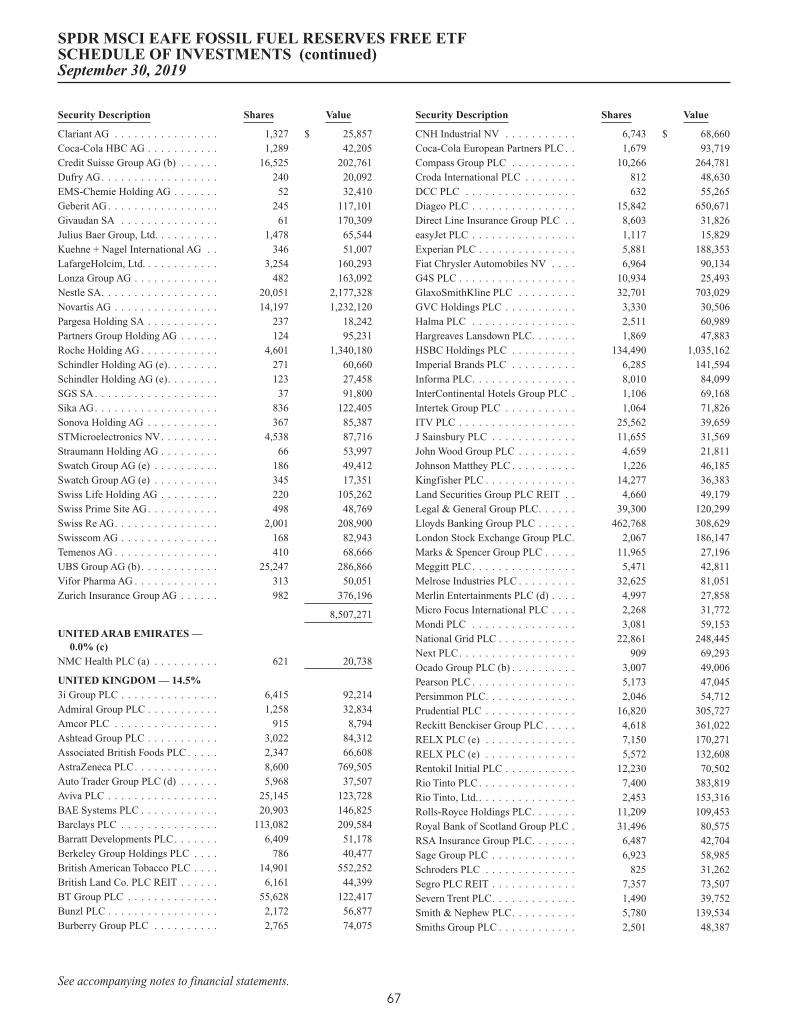
Security Description Shares Value
Clariant AG . . . . . . . . . . . . . . . . 1,327 $ 25,857Coca-Cola HBC AG . . . . . . . . . . . 1,289 42,205Credit Suisse Group AG (b) . . . . . . 16,525 202,761Dufry AG. . . . . . . . . . . . . . . . . . 240 20,092EMS-Chemie Holding AG . . . . . . . 52 32,410Geberit AG . . . . . . . . . . . . . . . . . 245 117,101Givaudan SA . . . . . . . . . . . . . . . 61 170,309Julius Baer Group, Ltd. . . . . . . . . . 1,478 65,544Kuehne + Nagel International AG . . 346 51,007LafargeHolcim, Ltd. . . . . . . . . . . . 3,254 160,293Lonza Group AG . . . . . . . . . . . . . 482 163,092Nestle SA. . . . . . . . . . . . . . . . . . 20,051 2,177,328Novartis AG . . . . . . . . . . . . . . . . 14,197 1,232,120Pargesa Holding SA . . . . . . . . . . . 237 18,242Partners Group Holding AG . . . . . . 124 95,231Roche Holding AG . . . . . . . . . . . . 4,601 1,340,180Schindler Holding AG (e). . . . . . . . 271 60,660Schindler Holding AG (e). . . . . . . . 123 27,458SGS SA . . . . . . . . . . . . . . . . . . . 37 91,800Sika AG. . . . . . . . . . . . . . . . . . . 836 122,405Sonova Holding AG . . . . . . . . . . . 367 85,387STMicroelectronics NV. . . . . . . . . 4,538 87,716Straumann Holding AG . . . . . . . . . 66 53,997Swatch Group AG (e) . . . . . . . . . . 186 49,412Swatch Group AG (e) . . . . . . . . . . 345 17,351Swiss Life Holding AG . . . . . . . . . 220 105,262Swiss Prime Site AG. . . . . . . . . . . 498 48,769Swiss Re AG. . . . . . . . . . . . . . . . 2,001 208,900Swisscom AG . . . . . . . . . . . . . . . 168 82,943Temenos AG . . . . . . . . . . . . . . . . 410 68,666UBS Group AG (b). . . . . . . . . . . . 25,247 286,866Vifor Pharma AG . . . . . . . . . . . . . 313 50,051Zurich Insurance Group AG . . . . . . 982 376,196
8,507,271
UNITED ARAB EMIRATES —0.0% (c)
NMC Health PLC (a) . . . . . . . . . . 621 20,738
UNITED KINGDOM — 14.5%3i Group PLC . . . . . . . . . . . . . . . 6,415 92,214Admiral Group PLC . . . . . . . . . . . 1,258 32,834Amcor PLC . . . . . . . . . . . . . . . . 915 8,794Ashtead Group PLC . . . . . . . . . . . 3,022 84,312Associated British Foods PLC . . . . . 2,347 66,608AstraZeneca PLC. . . . . . . . . . . . . 8,600 769,505Auto Trader Group PLC (d) . . . . . . 5,968 37,507Aviva PLC . . . . . . . . . . . . . . . . . 25,145 123,728BAE Systems PLC . . . . . . . . . . . . 20,903 146,825Barclays PLC . . . . . . . . . . . . . . . 113,082 209,584Barratt Developments PLC. . . . . . . 6,409 51,178Berkeley Group Holdings PLC . . . . 786 40,477British American Tobacco PLC . . . . 14,901 552,252British Land Co. PLC REIT . . . . . . 6,161 44,399BT Group PLC . . . . . . . . . . . . . . 55,628 122,417Bunzl PLC . . . . . . . . . . . . . . . . . 2,172 56,877Burberry Group PLC . . . . . . . . . . 2,765 74,075
Security Description Shares Value
CNH Industrial NV . . . . . . . . . . . 6,743 $ 68,660Coca-Cola European Partners PLC . . 1,679 93,719Compass Group PLC . . . . . . . . . . 10,266 264,781Croda International PLC . . . . . . . . 812 48,630DCC PLC . . . . . . . . . . . . . . . . . 632 55,265Diageo PLC . . . . . . . . . . . . . . . . 15,842 650,671Direct Line Insurance Group PLC . . 8,603 31,826easyJet PLC . . . . . . . . . . . . . . . . 1,117 15,829Experian PLC . . . . . . . . . . . . . . . 5,881 188,353Fiat Chrysler Automobiles NV . . . . 6,964 90,134G4S PLC . . . . . . . . . . . . . . . . . . 10,934 25,493GlaxoSmithKline PLC . . . . . . . . . 32,701 703,029GVC Holdings PLC . . . . . . . . . . . 3,330 30,506Halma PLC . . . . . . . . . . . . . . . . 2,511 60,989Hargreaves Lansdown PLC. . . . . . . 1,869 47,883HSBC Holdings PLC . . . . . . . . . . 134,490 1,035,162Imperial Brands PLC . . . . . . . . . . 6,285 141,594Informa PLC. . . . . . . . . . . . . . . . 8,010 84,099InterContinental Hotels Group PLC . 1,106 69,168Intertek Group PLC . . . . . . . . . . . 1,064 71,826ITV PLC . . . . . . . . . . . . . . . . . . 25,562 39,659J Sainsbury PLC . . . . . . . . . . . . . 11,655 31,569John Wood Group PLC . . . . . . . . . 4,659 21,811Johnson Matthey PLC . . . . . . . . . . 1,226 46,185Kingfisher PLC . . . . . . . . . . . . . . 14,277 36,383Land Securities Group PLC REIT . . 4,660 49,179Legal & General Group PLC. . . . . . 39,300 120,299Lloyds Banking Group PLC . . . . . . 462,768 308,629London Stock Exchange Group PLC. 2,067 186,147Marks & Spencer Group PLC . . . . . 11,965 27,196Meggitt PLC . . . . . . . . . . . . . . . . 5,471 42,811Melrose Industries PLC . . . . . . . . . 32,625 81,051Merlin Entertainments PLC (d) . . . . 4,997 27,858Micro Focus International PLC . . . . 2,268 31,772Mondi PLC . . . . . . . . . . . . . . . . 3,081 59,153National Grid PLC . . . . . . . . . . . . 22,861 248,445Next PLC. . . . . . . . . . . . . . . . . . 909 69,293Ocado Group PLC (b) . . . . . . . . . . 3,007 49,006Pearson PLC . . . . . . . . . . . . . . . . 5,173 47,045Persimmon PLC. . . . . . . . . . . . . . 2,046 54,712Prudential PLC . . . . . . . . . . . . . . 16,820 305,727Reckitt Benckiser Group PLC . . . . . 4,618 361,022RELX PLC (e) . . . . . . . . . . . . . . 7,150 170,271RELX PLC (e) . . . . . . . . . . . . . . 5,572 132,608Rentokil Initial PLC . . . . . . . . . . . 12,230 70,502Rio Tinto PLC . . . . . . . . . . . . . . . 7,400 383,819Rio Tinto, Ltd.. . . . . . . . . . . . . . . 2,453 153,316Rolls-Royce Holdings PLC. . . . . . . 11,209 109,453Royal Bank of Scotland Group PLC . 31,496 80,575RSA Insurance Group PLC. . . . . . . 6,487 42,704Sage Group PLC . . . . . . . . . . . . . 6,923 58,985Schroders PLC . . . . . . . . . . . . . . 825 31,262Segro PLC REIT . . . . . . . . . . . . . 7,357 73,507Severn Trent PLC. . . . . . . . . . . . . 1,490 39,752Smith & Nephew PLC. . . . . . . . . . 5,780 139,534Smiths Group PLC . . . . . . . . . . . . 2,501 48,387
SPDR MSCI EAFE FOSSIL FUEL RESERVES FREE ETFSCHEDULE OF INVESTMENTS (continued)September 30, 2019
See accompanying notes to financial statements.67

Security Description Shares Value
Spirax-Sarco Engineering PLC . . . . 489 $ 47,274St James’s Place PLC . . . . . . . . . . 3,346 40,383Standard Chartered PLC . . . . . . . . 18,594 156,773Standard Life Aberdeen PLC . . . . . 15,582 54,878Taylor Wimpey PLC . . . . . . . . . . . 20,689 41,174Tesco PLC . . . . . . . . . . . . . . . . . 63,295 187,976Unilever NV . . . . . . . . . . . . . . . . 9,470 569,379Unilever PLC . . . . . . . . . . . . . . . 7,206 434,230United Utilities Group PLC . . . . . . 4,300 43,758Vodafone Group PLC . . . . . . . . . . 173,170 345,704Weir Group PLC . . . . . . . . . . . . . 1,594 28,001Whitbread PLC . . . . . . . . . . . . . . 876 46,353Wm Morrison Supermarkets PLC
(a). . . . . . . . . . . . . . . . . . . . . 15,760 38,900WPP PLC . . . . . . . . . . . . . . . . . 8,382 105,151
12,210,764
UNITED STATES — 0.3%Carnival PLC . . . . . . . . . . . . . . . 1,087 45,142Ferguson PLC . . . . . . . . . . . . . . . 1,489 109,066QIAGEN NV (b) . . . . . . . . . . . . . 1,540 50,434
204,642
TOTAL COMMON STOCKS(Cost $83,493,258) . . . . . . . . . . 83,535,289
RIGHTS — 0.0% (c)AUSTRALIA — 0.0% (c)Harvey Norman Holdings,
Ltd.(expiring 10/11/19) (a) (b)(Cost: $0) . . . . . . . . . . . . . . . . 222 269
SHORT-TERM INVESTMENTS — 4.7%State Street Institutional Liquid
Reserves Fund, Premier Class2.03% (g) (h). . . . . . . . . . . . . . 24,556 24,558
State Street Navigator SecuritiesLending Portfolio III (i) (j) . . . . . 3,926,093 3,926,093
TOTAL SHORT-TERM INVESTMENTS(Cost $3,950,651). . . . . . . . . . . . . . . . . . . . . . 3,950,651
TOTAL INVESTMENTS — 103.9%(Cost $87,443,909) . . . . . . . . . . . . . . . . . . . . . 87,486,209
LIABILITIES IN EXCESS OF OTHER ASSETS— (3.9)% . . . . . . . . . . . . . . . . . . . . . . . . . . (3,309,128)
NET ASSETS — 100.0% . . . . . . . . . . . . . . . . . $ 84,177,081
(a) All or a portion of the shares of the security are on loan atSeptember 30, 2019.
(b) Non-income producing security.(c) Amount is less than 0.05% of net assets.(d) Securities purchased pursuant to Rule 144A of the Securities Act
of 1933, as amended. These securities, which represent 0.9% ofnet assets as of September 30, 2019, are considered liquid andmay be resold in transactions exempt from registration, normallyto qualified institutional buyers.
(e) Reflects separate holdings of the issuer’s common stock traded ondifferent securities exchanges.
(f) Fair valued as determined in good faith by the Trust’s OversightCommittee in accordance with policy and procedures approved bythe Board of Trustees. As of September 30, 2019, total aggregatefair value of this security is $1,248, representing less than 0.05%of net assets.
(g) The Fund invested in certain money market funds managed bySSGA Funds Management, Inc. Amounts related to thesetransactions during the period ended September 30, 2019 areshown in the Affiliate Table below.
(h) The rate shown is the annualized seven-day yield at September 30,2019.
(i) The Fund invested in an affiliated entity. Amounts related to thesetransactions during the period ended September 30, 2019 areshown in the Affiliate Table below.
(j) Investment of cash collateral for securities loaned.
ADR American Depositary ReceiptREIT Real Estate Investment TrustSDR Swedish Depositary Receipt
SPDR MSCI EAFE FOSSIL FUEL RESERVES FREE ETFSCHEDULE OF INVESTMENTS (continued)September 30, 2019
See accompanying notes to financial statements.68
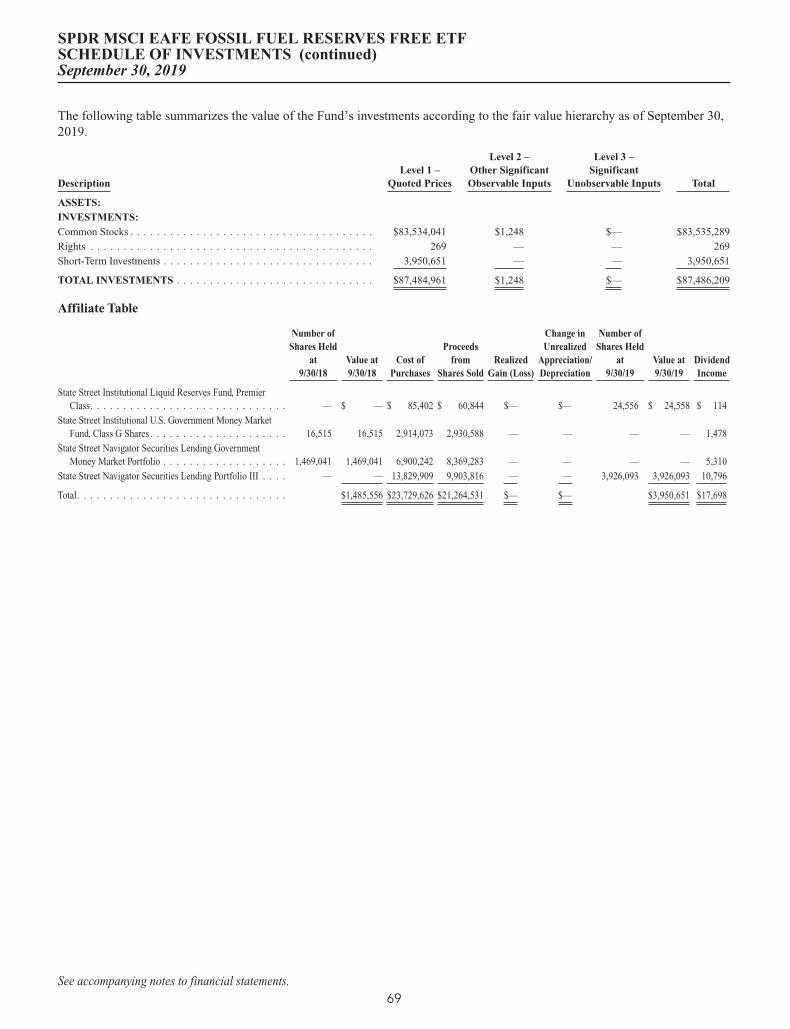
The following table summarizes the value of the Fund’s investments according to the fair value hierarchy as of September 30,2019.
DescriptionLevel 1 –
Quoted Prices
Level 2 –Other SignificantObservable Inputs
Level 3 –Significant
Unobservable Inputs Total
ASSETS:INVESTMENTS:Common Stocks . . . . . . . . . . . . . . . . . . . . . . . . . . . . . . . . . . . . . $83,534,041 $1,248 $— $83,535,289
Rights . . . . . . . . . . . . . . . . . . . . . . . . . . . . . . . . . . . . . . . . . . . 269 — — 269
Short-Term Investments . . . . . . . . . . . . . . . . . . . . . . . . . . . . . . . . 3,950,651 — — 3,950,651
TOTAL INVESTMENTS . . . . . . . . . . . . . . . . . . . . . . . . . . . . . . $87,484,961 $1,248 $— $87,486,209
Affiliate Table
Number ofShares Held
at9/30/18
Value at9/30/18
Cost ofPurchases
Proceedsfrom
Shares SoldRealized
Gain (Loss)
Change inUnrealized
Appreciation/Depreciation
Number ofShares Held
at9/30/19
Value at9/30/19
DividendIncome
State Street Institutional Liquid Reserves Fund, PremierClass. . . . . . . . . . . . . . . . . . . . . . . . . . . . . . — $ — $ 85,402 $ 60,844 $— $— 24,556 $ 24,558 $ 114
State Street Institutional U.S. Government Money MarketFund, Class G Shares. . . . . . . . . . . . . . . . . . . . . 16,515 16,515 2,914,073 2,930,588 — — — — 1,478
State Street Navigator Securities Lending GovernmentMoney Market Portfolio . . . . . . . . . . . . . . . . . . . 1,469,041 1,469,041 6,900,242 8,369,283 — — — — 5,310
State Street Navigator Securities Lending Portfolio III . . . . — — 13,829,909 9,903,816 — — 3,926,093 3,926,093 10,796
Total. . . . . . . . . . . . . . . . . . . . . . . . . . . . . . . . $1,485,556 $23,729,626 $21,264,531 $— $— $3,950,651 $17,698
SPDR MSCI EAFE FOSSIL FUEL RESERVES FREE ETFSCHEDULE OF INVESTMENTS (continued)September 30, 2019
See accompanying notes to financial statements.69

Security Description Shares Value
COMMON STOCKS — 99.3%AUSTRALIA — 6.0%AGL Energy, Ltd. . . . . . . . . . . . 21,531 $ 278,233Aristocrat Leisure, Ltd. . . . . . . . . 15,893 328,002ASX, Ltd. . . . . . . . . . . . . . . . . 5,810 317,677Aurizon Holdings, Ltd. . . . . . . . . 36,947 147,021Australia & New Zealand Banking
Group, Ltd.. . . . . . . . . . . . . . 37,081 713,264Bank of Queensland, Ltd. (a) . . . . 15,839 105,971Bendigo & Adelaide Bank, Ltd.
(a) . . . . . . . . . . . . . . . . . . . 15,083 116,885BHP Group PLC . . . . . . . . . . . . 11,239 239,934BHP Group, Ltd. . . . . . . . . . . . . 17,234 426,814Brambles, Ltd. . . . . . . . . . . . . . 47,500 365,215Caltex Australia, Ltd. . . . . . . . . . 13,681 242,859Coca-Cola Amatil, Ltd. . . . . . . . . 17,188 123,459Cochlear, Ltd. . . . . . . . . . . . . . . 3,244 455,415Coles Group, Ltd. . . . . . . . . . . . 26,729 277,621Commonwealth Bank of Australia . 22,460 1,224,424CSL, Ltd.. . . . . . . . . . . . . . . . . 16,892 2,662,385Dexus REIT . . . . . . . . . . . . . . . 60,361 485,676Flight Centre Travel Group, Ltd.
(a) . . . . . . . . . . . . . . . . . . . 3,283 105,397Fortescue Metals Group, Ltd. (a) . . 25,136 149,186Goodman Group REIT . . . . . . . . 26,271 251,248GPT Group REIT . . . . . . . . . . . 102,765 426,949Insurance Australia Group, Ltd.. . . 42,618 227,075LendLease Group . . . . . . . . . . . 6,694 79,279Macquarie Group, Ltd. . . . . . . . . 1,757 155,331Medibank Pvt, Ltd. . . . . . . . . . . 147,687 338,665Mirvac Group REIT . . . . . . . . . . 132,972 274,430National Australia Bank, Ltd. . . . . 26,746 535,753Newcrest Mining, Ltd. . . . . . . . . 24,891 583,374QBE Insurance Group, Ltd. . . . . . 18,747 158,807Ramsay Health Care, Ltd. (a) . . . . 3,090 135,192REA Group, Ltd. (a). . . . . . . . . . 1,761 128,534Scentre Group REIT. . . . . . . . . . 248,091 657,587SEEK, Ltd. . . . . . . . . . . . . . . . 3,785 54,808Sonic Healthcare, Ltd. . . . . . . . . 31,357 593,222Stockland REIT. . . . . . . . . . . . . 69,262 212,548Suncorp Group, Ltd. (b) . . . . . . . 12,076 111,178Tabcorp Holdings, Ltd. . . . . . . . . 23,017 75,290Telstra Corp., Ltd. . . . . . . . . . . . 288,471 682,903Transurban Group Stapled
Security . . . . . . . . . . . . . . . . 74,940 742,481Vicinity Centres REIT . . . . . . . . 195,843 339,462Wesfarmers, Ltd. . . . . . . . . . . . . 54,510 1,463,218Westpac Banking Corp. (a) . . . . . 44,298 885,548Woodside Petroleum, Ltd. . . . . . . 6,480 141,515Woolworths Group, Ltd. . . . . . . . 44,631 1,122,179
19,142,014
AUSTRIA — 0.1%Erste Group Bank AG . . . . . . . . . 2,446 80,906OMV AG. . . . . . . . . . . . . . . . . 2,228 119,602Raiffeisen Bank International AG . 3,299 76,571
Security Description Shares Value
Voestalpine AG . . . . . . . . . . . . . 2,792 $ 64,164
341,243
BELGIUM — 1.2%Ageas . . . . . . . . . . . . . . . . . . . 6,322 350,677Anheuser-Busch InBev SA. . . . . . 4,950 471,761Colruyt SA. . . . . . . . . . . . . . . . 12,496 684,972Groupe Bruxelles Lambert SA . . . 9,959 956,528KBC Group NV . . . . . . . . . . . . 2,528 164,314Proximus SADP . . . . . . . . . . . . 25,848 767,891Solvay SA . . . . . . . . . . . . . . . . 900 93,212UCB SA . . . . . . . . . . . . . . . . . 5,512 400,212
3,889,567
CHINA — 0.1%Alcon, Inc. (b) . . . . . . . . . . . . . 3,513 205,041BeiGene, Ltd. ADR (a)(b) . . . . . . 232 28,411BOC Hong Kong Holdings, Ltd. . . 57,036 193,530
426,982
DENMARK — 3.1%AP Moller - Maersk A/S Class B . . 113 127,808Carlsberg A/S Class B. . . . . . . . . 1,722 254,583Chr. Hansen Holding A/S. . . . . . . 5,625 477,528Coloplast A/S Class B. . . . . . . . . 8,292 998,883Danske Bank A/S. . . . . . . . . . . . 16,913 235,548Demant A/S (a)(b) . . . . . . . . . . . 4,926 126,197DSV A/S . . . . . . . . . . . . . . . . . 8,102 771,095Genmab A/S (b) . . . . . . . . . . . . 269 54,617H Lundbeck A/S . . . . . . . . . . . . 2,521 83,634ISS A/S . . . . . . . . . . . . . . . . . . 8,368 207,106Novo Nordisk A/S Class B . . . . . . 80,728 4,151,005Novozymes A/S Class B . . . . . . . 8,977 377,507Orsted A/S (c). . . . . . . . . . . . . . 8,832 820,970Pandora A/S . . . . . . . . . . . . . . . 5,579 223,940Tryg A/S . . . . . . . . . . . . . . . . . 21,517 616,742Vestas Wind Systems A/S . . . . . . 3,324 258,113
9,785,276
FINLAND — 1.4%Elisa Oyj . . . . . . . . . . . . . . . . . 19,931 1,027,771Fortum Oyj . . . . . . . . . . . . . . . 3,471 82,077Kone Oyj Class B . . . . . . . . . . . 13,558 772,156Neste Oyj (a) . . . . . . . . . . . . . . 7,653 253,386Nokia Oyj . . . . . . . . . . . . . . . . 51,743 262,308Nokian Renkaat Oyj . . . . . . . . . . 3,926 110,770Nordea Bank Abp (d) . . . . . . . . . 34,154 242,500Nordea Bank Abp (d) . . . . . . . . . 2,830 20,060Orion Oyj Class B . . . . . . . . . . . 5,366 200,187Sampo Oyj Class A . . . . . . . . . . 28,307 1,125,783UPM-Kymmene Oyj. . . . . . . . . . 12,098 357,692Wartsila OYJ Abp (a) . . . . . . . . . 14,526 162,717
4,617,407
FRANCE — 8.8%Aeroports de Paris . . . . . . . . . . . 3,464 616,317Air Liquide SA . . . . . . . . . . . . . 5,671 807,438Airbus SE . . . . . . . . . . . . . . . . 13,560 1,762,147
SPDR MSCI EAFE STRATEGICFACTORS ETFSCHEDULE OF INVESTMENTSSeptember 30, 2019
See accompanying notes to financial statements.70

Security Description Shares Value
Atos SE. . . . . . . . . . . . . . . . . . 870 $ 61,347AXA SA . . . . . . . . . . . . . . . . . 28,503 728,063BNP Paribas SA . . . . . . . . . . . . 20,483 997,506Bureau Veritas SA . . . . . . . . . . . 8,662 208,697Capgemini SE. . . . . . . . . . . . . . 1,008 118,793Carrefour SA . . . . . . . . . . . . . . 8,798 154,041Casino Guichard Perrachon SA (a). 2,972 141,883Cie de Saint-Gobain . . . . . . . . . . 6,307 247,532Cie Generale des Etablissements
Michelin SCA . . . . . . . . . . . . 5,745 641,352Credit Agricole SA . . . . . . . . . . 20,958 254,531Danone SA . . . . . . . . . . . . . . . 9,007 793,606Dassault Systemes SE. . . . . . . . . 4,022 573,310Engie SA . . . . . . . . . . . . . . . . . 22,067 360,380EssilorLuxottica SA . . . . . . . . . . 4,685 675,478Eutelsat Communications SA . . . . 5,627 104,748Faurecia SE . . . . . . . . . . . . . . . 2,973 141,055Getlink SE . . . . . . . . . . . . . . . . 5,094 76,527Hermes International . . . . . . . . . 1,917 1,325,005Iliad SA. . . . . . . . . . . . . . . . . . 651 61,192Ipsen SA . . . . . . . . . . . . . . . . . 1,171 111,194Kering SA . . . . . . . . . . . . . . . . 2,165 1,103,550Legrand SA . . . . . . . . . . . . . . . 7,581 541,179L’Oreal SA . . . . . . . . . . . . . . . 9,522 2,666,849LVMH Moet Hennessy Louis
Vuitton SE . . . . . . . . . . . . . . 8,379 3,330,999Orange SA . . . . . . . . . . . . . . . . 45,899 720,313Pernod Ricard SA . . . . . . . . . . . 2,478 441,428Peugeot SA . . . . . . . . . . . . . . . 11,152 278,173Publicis Groupe SA . . . . . . . . . . 1,909 93,903Renault SA . . . . . . . . . . . . . . . 5,954 341,819Safran SA . . . . . . . . . . . . . . . . 2,987 470,391Sanofi. . . . . . . . . . . . . . . . . . . 16,827 1,560,408Schneider Electric SE . . . . . . . . . 3,379 296,545SCOR SE . . . . . . . . . . . . . . . . 8,338 344,423SEB SA. . . . . . . . . . . . . . . . . . 539 81,855Societe BIC SA (a) . . . . . . . . . . 2,060 138,342Societe Generale SA. . . . . . . . . . 21,753 596,198Sodexo SA. . . . . . . . . . . . . . . . 6,165 692,271Thales SA . . . . . . . . . . . . . . . . 8,199 943,017TOTAL SA . . . . . . . . . . . . . . . 29,314 1,530,315Unibail-Rodamco-Westfield . . . . . 26,239 188,472Unibail-Rodamco-Westfield,REIT . . . . . . . . . . . . . . . . . . . 694 101,196Valeo SA . . . . . . . . . . . . . . . . . 6,721 217,985Vinci SA . . . . . . . . . . . . . . . . . 3,750 404,001Vivendi SA . . . . . . . . . . . . . . . 6,692 183,704Worldline SA (b)(c) . . . . . . . . . . 337 21,272
28,250,750
GERMANY — 6.8%adidas AG . . . . . . . . . . . . . . . . 6,040 1,880,950Allianz SE . . . . . . . . . . . . . . . . 4,603 1,073,140Aroundtown SA . . . . . . . . . . . . 10,658 87,192BASF SE. . . . . . . . . . . . . . . . . 12,777 893,158Bayer AG. . . . . . . . . . . . . . . . . 8,776 618,928Bayerische Motoren Werke AG . . . 5,345 376,374
Security Description Shares Value
Bayerische Motoren Werke AGPreference Shares. . . . . . . . . . 1,253 $ 69,599
Beiersdorf AG. . . . . . . . . . . . . . 8,242 972,223Commerzbank AG . . . . . . . . . . . 23,549 136,632Continental AG . . . . . . . . . . . . . 4,129 529,819Covestro AG (c) . . . . . . . . . . . . 8,309 411,255Daimler AG . . . . . . . . . . . . . . . 15,635 777,605Deutsche Bank AG. . . . . . . . . . . 44,546 333,684Deutsche Boerse AG. . . . . . . . . . 946 147,893Deutsche Lufthansa AG. . . . . . . . 8,842 140,545Deutsche Post AG . . . . . . . . . . . 17,062 570,027Deutsche Telekom AG. . . . . . . . . 71,879 1,206,312E.ON SE . . . . . . . . . . . . . . . . . 21,341 207,509Fresenius Medical Care AG & Co.
KGaA . . . . . . . . . . . . . . . . . 7,500 504,490Fresenius SE & Co. KGaA. . . . . . 3,151 147,354Fuchs Petrolub SE Preference
Shares . . . . . . . . . . . . . . . . . 2,646 99,406GEA Group AG. . . . . . . . . . . . . 4,710 127,190Hannover Rueck SE . . . . . . . . . . 2,056 347,649HeidelbergCement AG . . . . . . . . 1,524 110,188Henkel AG & Co. KGaA
Preference Shares. . . . . . . . . . 5,034 498,316Henkel AG & Co. KGaA . . . . . . . 7,083 648,638HUGO BOSS AG . . . . . . . . . . . 2,646 141,781Infineon Technologies AG . . . . . . 29,263 526,774Knorr-Bremse AG . . . . . . . . . . . 1,009 94,865Merck KGaA . . . . . . . . . . . . . . 3,683 414,972METRO AG . . . . . . . . . . . . . . . 7,078 111,734MTU Aero Engines AG . . . . . . . . 900 239,212Muenchener
Rueckversicherungs-GesellschaftAG in Muenchen . . . . . . . . . . 5,168 1,337,548
Porsche Automobil Holding SEPreference Shares. . . . . . . . . . 2,195 142,861
Puma SE . . . . . . . . . . . . . . . . . 744 57,589RWE AG . . . . . . . . . . . . . . . . . 8,135 254,445SAP SE. . . . . . . . . . . . . . . . . . 25,612 3,012,247Siemens AG . . . . . . . . . . . . . . . 5,971 639,567Thyssenkrupp AG . . . . . . . . . . . 6,765 93,702TUI AG. . . . . . . . . . . . . . . . . . 16,087 187,495Uniper SE . . . . . . . . . . . . . . . . 14,426 473,232United Internet AG. . . . . . . . . . . 1,309 46,708Volkswagen AG Preference Shares . 4,324 735,671Wirecard AG . . . . . . . . . . . . . . 2,696 431,324
21,857,803
HONG KONG — 5.1%AIA Group, Ltd. . . . . . . . . . . . . 308,623 2,915,215ASM Pacific Technology, Ltd. . . . 14,000 170,906Bank of East Asia, Ltd. . . . . . . . . 38,457 94,678CK Asset Holdings, Ltd. . . . . . . . 33,620 227,724CK Hutchison Holdings, Ltd. . . . . 53,000 467,842CK Infrastructure Holdings, Ltd. . . 90,000 605,595CLP Holdings, Ltd. . . . . . . . . . . 139,500 1,465,396Dairy Farm International Holdings,
Ltd. . . . . . . . . . . . . . . . . . . 21,600 136,080
SPDR MSCI EAFE STRATEGICFACTORS ETFSCHEDULE OF INVESTMENTS (continued)September 30, 2019
See accompanying notes to financial statements.71

Security Description Shares Value
Galaxy Entertainment Group, Ltd. . 68,000 $ 422,864Hang Seng Bank, Ltd.. . . . . . . . . 56,529 1,218,639HK Electric Investments & HK
Electric Investments, Ltd.Class SS . . . . . . . . . . . . . . . 456,540 435,027
HKT Trust & HKT, Ltd. . . . . . . . 582,540 924,407Hong Kong & China Gas Co., Ltd.. 709,799 1,383,490Hong Kong Exchanges & Clearing,
Ltd. . . . . . . . . . . . . . . . . . . 39,643 1,163,085Jardine Matheson Holdings, Ltd. . . 7,400 395,900Jardine Strategic Holdings, Ltd.. . . 2,600 77,688Link REIT . . . . . . . . . . . . . . . . 55,000 606,520MTR Corp., Ltd. . . . . . . . . . . . . 209,789 1,177,477New World Development Co., Ltd.. 94,749 123,038PCCW, Ltd. . . . . . . . . . . . . . . . 537,000 301,401Power Assets Holdings, Ltd. . . . . . 110,000 738,768Sands China, Ltd. . . . . . . . . . . . 86,800 393,066Sun Hung Kai Properties, Ltd. . . . 14,000 201,444Swire Pacific, Ltd. Class A . . . . . 15,500 144,236Techtronic Industries Co., Ltd. . . . 46,500 323,567WH Group, Ltd. (c) . . . . . . . . . . 117,000 104,771Yue Yuen Industrial Holdings,
Ltd. . . . . . . . . . . . . . . . . . . 59,500 162,803
16,381,627
IRELAND — 0.9%AerCap Holdings NV (b) . . . . . . . 1,580 86,505AIB Group PLC . . . . . . . . . . . . 48,289 143,404Bank of Ireland Group PLC . . . . . 16,975 67,362CRH PLC . . . . . . . . . . . . . . . . 5,960 205,259Flutter Entertainment PLC . . . . . . 971 90,784James Hardie Industries PLC . . . . 9,264 155,328Kerry Group PLC Class A . . . . . . 14,155 1,655,830Kingspan Group PLC . . . . . . . . . 7,032 343,450
2,747,922
ISRAEL — 0.9%Azrieli Group, Ltd.. . . . . . . . . . . 2,232 175,308Bank Hapoalim BM (b). . . . . . . . 74,009 583,419Bank Leumi Le-Israel BM . . . . . . 95,117 677,022Check Point Software
Technologies, Ltd. (a)(b) . . . . . 6,572 719,634Mizrahi Tefahot Bank, Ltd. . . . . . 21,961 545,898Teva Pharmaceutical Industries,
Ltd. ADR (a)(b) . . . . . . . . . . . 7,756 53,361Teva Pharmaceutical Industries,
Ltd. (b) . . . . . . . . . . . . . . . . 8,917 61,366
2,816,008
ITALY — 1.4%Assicurazioni Generali SpA . . . . . 27,257 528,343Enel SpA . . . . . . . . . . . . . . . . . 100,939 753,909Eni SpA . . . . . . . . . . . . . . . . . 22,905 350,443Ferrari NV . . . . . . . . . . . . . . . . 3,887 599,833FinecoBank Banca Fineco SpA . . . 14,354 151,980Intesa Sanpaolo SpA . . . . . . . . . 234,344 555,801Mediobanca Banca di Credito
Finanziario SpA. . . . . . . . . . . 13,465 147,089
Security Description Shares Value
Moncler SpA . . . . . . . . . . . . . . 7,993 $ 284,947Recordati SpA . . . . . . . . . . . . . 4,952 212,492Snam SpA . . . . . . . . . . . . . . . . 99,562 502,986Telecom Italia SpA. . . . . . . . . . . 365,273 199,747UniCredit SpA . . . . . . . . . . . . . 29,614 349,326
4,636,896
JAPAN — 25.0%ABC-Mart, Inc. . . . . . . . . . . . . . 7,800 495,822Advantest Corp. . . . . . . . . . . . . 7,000 309,276Aeon Co., Ltd. . . . . . . . . . . . . . 10,300 188,750Aisin Seiki Co., Ltd. (a) . . . . . . . 2,300 72,251Ajinomoto Co., Inc. . . . . . . . . . . 15,000 283,137ANA Holdings, Inc. . . . . . . . . . . 20,700 696,033Aozora Bank, Ltd. (a) . . . . . . . . . 4,300 107,505Asahi Group Holdings, Ltd. . . . . . 10,900 539,579Asahi Kasei Corp. (a) . . . . . . . . . 10,300 101,404Astellas Pharma, Inc. . . . . . . . . . 90,200 1,284,041Bandai Namco Holdings, Inc. (a). . 7,600 473,264Bank of Kyoto, Ltd. (a) . . . . . . . . 1,700 66,458Benesse Holdings, Inc. (a) . . . . . . 6,200 160,973Bridgestone Corp. . . . . . . . . . . . 22,600 874,933Canon, Inc. . . . . . . . . . . . . . . . 50,300 1,341,566Central Japan Railway Co. . . . . . . 3,100 637,354Chiba Bank, Ltd. (a) . . . . . . . . . . 18,100 93,117Chubu Electric Power Co., Inc. . . . 11,200 162,184Chugoku Electric Power Co., Inc.
(a) . . . . . . . . . . . . . . . . . . . 23,300 299,456Concordia Financial Group, Ltd.
(a) . . . . . . . . . . . . . . . . . . . 21,700 83,126Daicel Corp. (a) . . . . . . . . . . . . 8,000 67,583Daifuku Co., Ltd. (a) . . . . . . . . . 2,300 118,538Dai-ichi Life Holdings, Inc. . . . . . 19,208 289,520Daiichi Sankyo Co., Ltd. . . . . . . . 2,806 176,655Daikin Industries, Ltd. . . . . . . . . 1,000 131,205Daito Trust Construction Co., Ltd.
(a) . . . . . . . . . . . . . . . . . . . 4,500 575,017Daiwa House Industry Co., Ltd. . . 18,800 609,880Daiwa House REIT Investment
Corp. . . . . . . . . . . . . . . . . . 275 773,537Denso Corp. (a). . . . . . . . . . . . . 4,300 188,949Disco Corp. (a) . . . . . . . . . . . . . 600 113,588East Japan Railway Co. . . . . . . . . 10,000 953,967Eisai Co., Ltd.. . . . . . . . . . . . . . 700 35,565FamilyMart Co., Ltd. (a) . . . . . . . 7,100 172,975FANUC Corp. (a) . . . . . . . . . . . 600 112,922Fast Retailing Co., Ltd. (a) . . . . . . 200 118,825Fujitsu, Ltd. . . . . . . . . . . . . . . . 7,500 600,625Fukuoka Financial Group, Inc. (a) . 3,700 69,875Hankyu Hanshin Holdings, Inc.. . . 2,300 88,638Hikari Tsushin, Inc. . . . . . . . . . . 800 173,065Hitachi, Ltd. . . . . . . . . . . . . . . . 13,800 513,693Honda Motor Co., Ltd. . . . . . . . . 29,600 766,464Hoshizaki Corp. (a) . . . . . . . . . . 1,500 117,835Hoya Corp. . . . . . . . . . . . . . . . 11,300 922,088Idemitsu Kosan Co., Ltd. (a). . . . . 2,300 65,015IHI Corp.. . . . . . . . . . . . . . . . . 3,300 71,695
SPDR MSCI EAFE STRATEGICFACTORS ETFSCHEDULE OF INVESTMENTS (continued)September 30, 2019
See accompanying notes to financial statements.72
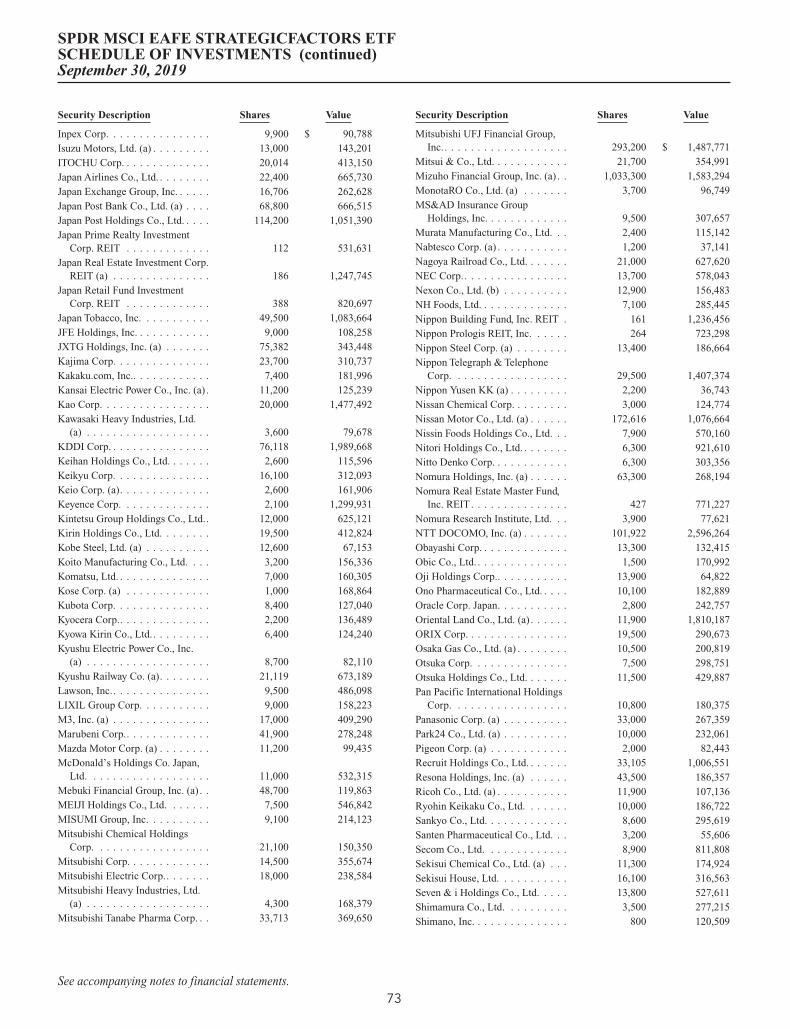
Security Description Shares Value
Inpex Corp. . . . . . . . . . . . . . . . 9,900 $ 90,788Isuzu Motors, Ltd. (a) . . . . . . . . . 13,000 143,201ITOCHU Corp. . . . . . . . . . . . . . 20,014 413,150Japan Airlines Co., Ltd. . . . . . . . . 22,400 665,730Japan Exchange Group, Inc. . . . . . 16,706 262,628Japan Post Bank Co., Ltd. (a) . . . . 68,800 666,515Japan Post Holdings Co., Ltd. . . . . 114,200 1,051,390Japan Prime Realty Investment
Corp. REIT . . . . . . . . . . . . . 112 531,631Japan Real Estate Investment Corp.
REIT (a) . . . . . . . . . . . . . . . 186 1,247,745Japan Retail Fund Investment
Corp. REIT . . . . . . . . . . . . . 388 820,697Japan Tobacco, Inc. . . . . . . . . . . 49,500 1,083,664JFE Holdings, Inc. . . . . . . . . . . . 9,000 108,258JXTG Holdings, Inc. (a) . . . . . . . 75,382 343,448Kajima Corp. . . . . . . . . . . . . . . 23,700 310,737Kakaku.com, Inc.. . . . . . . . . . . . 7,400 181,996Kansai Electric Power Co., Inc. (a) . 11,200 125,239Kao Corp. . . . . . . . . . . . . . . . . 20,000 1,477,492Kawasaki Heavy Industries, Ltd.
(a) . . . . . . . . . . . . . . . . . . . 3,600 79,678KDDI Corp. . . . . . . . . . . . . . . . 76,118 1,989,668Keihan Holdings Co., Ltd. . . . . . . 2,600 115,596Keikyu Corp. . . . . . . . . . . . . . . 16,100 312,093Keio Corp. (a). . . . . . . . . . . . . . 2,600 161,906Keyence Corp. . . . . . . . . . . . . . 2,100 1,299,931Kintetsu Group Holdings Co., Ltd.. 12,000 625,121Kirin Holdings Co., Ltd. . . . . . . . 19,500 412,824Kobe Steel, Ltd. (a) . . . . . . . . . . 12,600 67,153Koito Manufacturing Co., Ltd. . . . 3,200 156,336Komatsu, Ltd. . . . . . . . . . . . . . . 7,000 160,305Kose Corp. (a) . . . . . . . . . . . . . 1,000 168,864Kubota Corp. . . . . . . . . . . . . . . 8,400 127,040Kyocera Corp.. . . . . . . . . . . . . . 2,200 136,489Kyowa Kirin Co., Ltd.. . . . . . . . . 6,400 124,240Kyushu Electric Power Co., Inc.
(a) . . . . . . . . . . . . . . . . . . . 8,700 82,110Kyushu Railway Co. (a). . . . . . . . 21,119 673,189Lawson, Inc.. . . . . . . . . . . . . . . 9,500 486,098LIXIL Group Corp. . . . . . . . . . . 9,000 158,223M3, Inc. (a) . . . . . . . . . . . . . . . 17,000 409,290Marubeni Corp.. . . . . . . . . . . . . 41,900 278,248Mazda Motor Corp. (a) . . . . . . . . 11,200 99,435McDonald’s Holdings Co. Japan,
Ltd. . . . . . . . . . . . . . . . . . . 11,000 532,315Mebuki Financial Group, Inc. (a) . . 48,700 119,863MEIJI Holdings Co., Ltd. . . . . . . 7,500 546,842MISUMI Group, Inc. . . . . . . . . . 9,100 214,123Mitsubishi Chemical Holdings
Corp. . . . . . . . . . . . . . . . . . 21,100 150,350Mitsubishi Corp. . . . . . . . . . . . . 14,500 355,674Mitsubishi Electric Corp.. . . . . . . 18,000 238,584Mitsubishi Heavy Industries, Ltd.
(a) . . . . . . . . . . . . . . . . . . . 4,300 168,379Mitsubishi Tanabe Pharma Corp. . . 33,713 369,650
Security Description Shares Value
Mitsubishi UFJ Financial Group,Inc.. . . . . . . . . . . . . . . . . . . 293,200 $ 1,487,771
Mitsui & Co., Ltd. . . . . . . . . . . . 21,700 354,991Mizuho Financial Group, Inc. (a) . . 1,033,300 1,583,294MonotaRO Co., Ltd. (a) . . . . . . . 3,700 96,749MS&AD Insurance Group
Holdings, Inc. . . . . . . . . . . . . 9,500 307,657Murata Manufacturing Co., Ltd. . . 2,400 115,142Nabtesco Corp. (a) . . . . . . . . . . . 1,200 37,141Nagoya Railroad Co., Ltd. . . . . . . 21,000 627,620NEC Corp.. . . . . . . . . . . . . . . . 13,700 578,043Nexon Co., Ltd. (b) . . . . . . . . . . 12,900 156,483NH Foods, Ltd. . . . . . . . . . . . . . 7,100 285,445Nippon Building Fund, Inc. REIT . 161 1,236,456Nippon Prologis REIT, Inc. . . . . . 264 723,298Nippon Steel Corp. (a) . . . . . . . . 13,400 186,664Nippon Telegraph & Telephone
Corp. . . . . . . . . . . . . . . . . . 29,500 1,407,374Nippon Yusen KK (a) . . . . . . . . . 2,200 36,743Nissan Chemical Corp. . . . . . . . . 3,000 124,774Nissan Motor Co., Ltd. (a) . . . . . . 172,616 1,076,664Nissin Foods Holdings Co., Ltd. . . 7,900 570,160Nitori Holdings Co., Ltd. . . . . . . . 6,300 921,610Nitto Denko Corp. . . . . . . . . . . . 6,300 303,356Nomura Holdings, Inc. (a) . . . . . . 63,300 268,194Nomura Real Estate Master Fund,
Inc. REIT. . . . . . . . . . . . . . . 427 771,227Nomura Research Institute, Ltd. . . 3,900 77,621NTT DOCOMO, Inc. (a) . . . . . . . 101,922 2,596,264Obayashi Corp. . . . . . . . . . . . . . 13,300 132,415Obic Co., Ltd. . . . . . . . . . . . . . . 1,500 170,992Oji Holdings Corp.. . . . . . . . . . . 13,900 64,822Ono Pharmaceutical Co., Ltd. . . . . 10,100 182,889Oracle Corp. Japan. . . . . . . . . . . 2,800 242,757Oriental Land Co., Ltd. (a) . . . . . . 11,900 1,810,187ORIX Corp. . . . . . . . . . . . . . . . 19,500 290,673Osaka Gas Co., Ltd. (a) . . . . . . . . 10,500 200,819Otsuka Corp. . . . . . . . . . . . . . . 7,500 298,751Otsuka Holdings Co., Ltd. . . . . . . 11,500 429,887Pan Pacific International Holdings
Corp. . . . . . . . . . . . . . . . . . 10,800 180,375Panasonic Corp. (a) . . . . . . . . . . 33,000 267,359Park24 Co., Ltd. (a) . . . . . . . . . . 10,000 232,061Pigeon Corp. (a) . . . . . . . . . . . . 2,000 82,443Recruit Holdings Co., Ltd. . . . . . . 33,105 1,006,551Resona Holdings, Inc. (a) . . . . . . 43,500 186,357Ricoh Co., Ltd. (a) . . . . . . . . . . . 11,900 107,136Ryohin Keikaku Co., Ltd. . . . . . . 10,000 186,722Sankyo Co., Ltd. . . . . . . . . . . . . 8,600 295,619Santen Pharmaceutical Co., Ltd. . . 3,200 55,606Secom Co., Ltd. . . . . . . . . . . . . 8,900 811,808Sekisui Chemical Co., Ltd. (a) . . . 11,300 174,924Sekisui House, Ltd. . . . . . . . . . . 16,100 316,563Seven & i Holdings Co., Ltd. . . . . 13,800 527,611Shimamura Co., Ltd. . . . . . . . . . 3,500 277,215Shimano, Inc. . . . . . . . . . . . . . . 800 120,509
SPDR MSCI EAFE STRATEGICFACTORS ETFSCHEDULE OF INVESTMENTS (continued)September 30, 2019
See accompanying notes to financial statements.73

Security Description Shares Value
Shin-Etsu Chemical Co., Ltd. . . . . 9,800 $ 1,048,235Shinsei Bank, Ltd. . . . . . . . . . . . 5,100 74,276Shionogi & Co., Ltd. . . . . . . . . . 12,000 666,093Shizuoka Bank, Ltd. (a). . . . . . . . 12,000 89,382Showa Denko KK . . . . . . . . . . . 2,500 65,348SMC Corp. . . . . . . . . . . . . . . . 1,200 511,867SoftBank Group Corp. (a) . . . . . . 18,000 706,176Sompo Holdings, Inc. (a) . . . . . . . 4,500 188,078Sony Corp.. . . . . . . . . . . . . . . . 8,800 516,804Subaru Corp. . . . . . . . . . . . . . . 16,400 461,309SUMCO Corp. . . . . . . . . . . . . . 1,200 16,100Sumitomo Chemical Co., Ltd. (a) . 28,100 126,102Sumitomo Corp. . . . . . . . . . . . . 14,512 226,660Sumitomo Electric Industries, Ltd.
(a) . . . . . . . . . . . . . . . . . . . 11,300 143,348Sumitomo Mitsui Financial Group,
Inc. (a) . . . . . . . . . . . . . . . . 28,700 981,231Sumitomo Mitsui Trust Holdings,
Inc. (a) . . . . . . . . . . . . . . . . 7,100 255,948Sumitomo Rubber Industries, Ltd. . 7,400 87,780Suntory Beverage & Food, Ltd. . . . 19,987 854,406Suzuki Motor Corp. (a) . . . . . . . . 2,900 123,084Sysmex Corp. . . . . . . . . . . . . . . 6,200 414,882T&D Holdings, Inc. . . . . . . . . . . 8,400 88,994Taiheiyo Cement Corp. (a) . . . . . . 2,500 66,875Taisei Corp. . . . . . . . . . . . . . . . 7,900 305,913Taisho Pharmaceutical Holdings
Co., Ltd. (a) . . . . . . . . . . . . . 5,100 370,437Takeda Pharmaceutical Co., Ltd. . . 18,151 619,729TDK Corp. (a) . . . . . . . . . . . . . 1,200 107,370Terumo Corp. . . . . . . . . . . . . . . 9,200 296,239Tobu Railway Co., Ltd. . . . . . . . . 14,000 453,389Tohoku Electric Power Co., Inc. . . 10,500 102,401Tokio Marine Holdings, Inc. (a) . . 8,800 470,555Tokyo Electric Power Co.
Holdings, Inc. (a)(b) . . . . . . . . 68,900 337,248Tokyo Electron, Ltd. . . . . . . . . . . 700 133,199Tokyo Gas Co., Ltd. . . . . . . . . . . 12,808 322,881Toray Industries, Inc. . . . . . . . . . 53,200 394,834Toshiba Corp. . . . . . . . . . . . . . . 3,200 97,710Tosoh Corp. . . . . . . . . . . . . . . . 8,500 112,311Toyo Suisan Kaisha, Ltd. (a). . . . . 19,000 761,231Toyota Industries Corp. (a) . . . . . . 1,500 86,051Toyota Motor Corp. . . . . . . . . . . 31,700 2,116,560Toyota Tsusho Corp.. . . . . . . . . . 4,300 138,658Trend Micro, Inc.. . . . . . . . . . . . 1,500 71,339Tsuruha Holdings, Inc. . . . . . . . . 2,500 272,265Unicharm Corp. . . . . . . . . . . . . 17,206 544,479United Urban Investment Corp.
REIT. . . . . . . . . . . . . . . . . . 455 871,478USS Co., Ltd. . . . . . . . . . . . . . . 11,700 227,017West Japan Railway Co. . . . . . . . 8,300 701,247Yahoo! Japan Corp. . . . . . . . . . . 54,100 152,176Yamada Denki Co., Ltd. . . . . . . . 93,500 452,468Yamaha Corp. . . . . . . . . . . . . . . 3,200 143,604Yamaha Motor Co., Ltd. . . . . . . . 6,700 121,384Yamato Holdings Co., Ltd. . . . . . . 3,500 52,658
Security Description Shares Value
Yamazaki Baking Co., Ltd.. . . . . . 6,400 $ 114,173Yaskawa Electric Corp. . . . . . . . . 7,200 264,150Yokohama Rubber Co., Ltd. . . . . . 4,100 81,981ZOZO, Inc. (a) . . . . . . . . . . . . . 9,200 212,134
80,247,913
LUXEMBOURG — 0.2%ArcelorMittal . . . . . . . . . . . . . . 18,599 261,690RTL Group SA . . . . . . . . . . . . . 4,420 212,600SES SA. . . . . . . . . . . . . . . . . . 6,134 111,845Tenaris SA . . . . . . . . . . . . . . . . 6,456 68,511
654,646
NETHERLANDS — 3.0%ABN AMRO Bank NV (c) . . . . . . 3,714 65,493Adyen NV (b)(c) . . . . . . . . . . . . 249 164,070Aegon NV . . . . . . . . . . . . . . . . 43,451 180,812Akzo Nobel NV . . . . . . . . . . . . 1,220 108,784ASML Holding NV . . . . . . . . . . 12,495 3,095,610EXOR NV . . . . . . . . . . . . . . . . 3,902 261,533Heineken NV . . . . . . . . . . . . . . 3,240 350,258ING Groep NV . . . . . . . . . . . . . 57,209 598,994Koninklijke Ahold Delhaize NV . . 31,989 800,542Koninklijke DSM NV . . . . . . . . . 1,331 160,197Koninklijke KPN NV . . . . . . . . . 42,669 133,087Koninklijke Philips NV . . . . . . . . 5,267 244,039NN Group NV . . . . . . . . . . . . . 9,733 345,279NXP Semiconductors NV . . . . . . 2,124 231,771Randstad NV . . . . . . . . . . . . . . 3,984 195,842Royal Dutch Shell PLC Class A . . 40,645 1,194,070Royal Dutch Shell PLC Class B . . 33,637 993,163Wolters Kluwer NV . . . . . . . . . . 8,804 642,882
9,766,426
NEW ZEALAND — 0.5%Auckland International Airport,
Ltd. . . . . . . . . . . . . . . . . . . 34,820 199,780Fisher & Paykel Healthcare Corp.,
Ltd. . . . . . . . . . . . . . . . . . . 28,948 314,027Meridian Energy, Ltd. . . . . . . . . . 88,657 289,081Ryman Healthcare, Ltd.. . . . . . . . 26,910 224,254Spark New Zealand, Ltd. . . . . . . . 148,655 411,074
1,438,216
NORWAY — 0.5%DNB ASA . . . . . . . . . . . . . . . . 12,716 224,274Equinor ASA . . . . . . . . . . . . . . 8,157 155,357Gjensidige Forsikring ASA . . . . . 14,808 293,929Mowi ASA. . . . . . . . . . . . . . . . 9,683 223,693Telenor ASA. . . . . . . . . . . . . . . 27,347 549,441Yara International ASA . . . . . . . . 2,089 90,081
1,536,775
PORTUGAL — 0.1%EDP - Energias de Portugal SA . . . 31,080 120,693Jeronimo Martins SGPS SA . . . . . 9,762 164,746
285,439
SPDR MSCI EAFE STRATEGICFACTORS ETFSCHEDULE OF INVESTMENTS (continued)September 30, 2019
See accompanying notes to financial statements.74
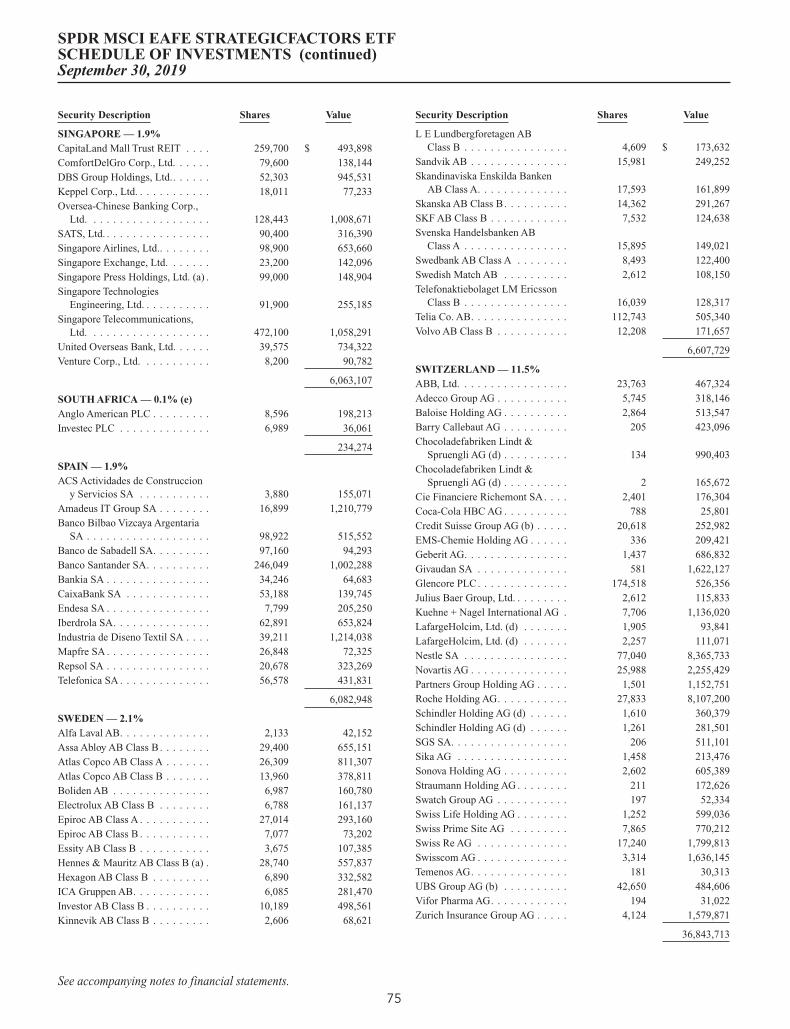
Security Description Shares Value
SINGAPORE — 1.9%CapitaLand Mall Trust REIT . . . . 259,700 $ 493,898ComfortDelGro Corp., Ltd. . . . . . 79,600 138,144DBS Group Holdings, Ltd.. . . . . . 52,303 945,531Keppel Corp., Ltd. . . . . . . . . . . . 18,011 77,233Oversea-Chinese Banking Corp.,
Ltd. . . . . . . . . . . . . . . . . . . 128,443 1,008,671SATS, Ltd. . . . . . . . . . . . . . . . . 90,400 316,390Singapore Airlines, Ltd.. . . . . . . . 98,900 653,660Singapore Exchange, Ltd. . . . . . . 23,200 142,096Singapore Press Holdings, Ltd. (a) . 99,000 148,904Singapore Technologies
Engineering, Ltd. . . . . . . . . . . 91,900 255,185Singapore Telecommunications,
Ltd. . . . . . . . . . . . . . . . . . . 472,100 1,058,291United Overseas Bank, Ltd. . . . . . 39,575 734,322Venture Corp., Ltd. . . . . . . . . . . 8,200 90,782
6,063,107
SOUTH AFRICA — 0.1% (e)Anglo American PLC . . . . . . . . . 8,596 198,213Investec PLC . . . . . . . . . . . . . . 6,989 36,061
234,274
SPAIN — 1.9%ACS Actividades de Construccion
y Servicios SA . . . . . . . . . . . 3,880 155,071Amadeus IT Group SA . . . . . . . . 16,899 1,210,779Banco Bilbao Vizcaya Argentaria
SA . . . . . . . . . . . . . . . . . . . 98,922 515,552Banco de Sabadell SA. . . . . . . . . 97,160 94,293Banco Santander SA. . . . . . . . . . 246,049 1,002,288Bankia SA . . . . . . . . . . . . . . . . 34,246 64,683CaixaBank SA . . . . . . . . . . . . . 53,188 139,745Endesa SA . . . . . . . . . . . . . . . . 7,799 205,250Iberdrola SA. . . . . . . . . . . . . . . 62,891 653,824Industria de Diseno Textil SA . . . . 39,211 1,214,038Mapfre SA . . . . . . . . . . . . . . . . 26,848 72,325Repsol SA . . . . . . . . . . . . . . . . 20,678 323,269Telefonica SA . . . . . . . . . . . . . . 56,578 431,831
6,082,948
SWEDEN — 2.1%Alfa Laval AB. . . . . . . . . . . . . . 2,133 42,152Assa Abloy AB Class B . . . . . . . . 29,400 655,151Atlas Copco AB Class A . . . . . . . 26,309 811,307Atlas Copco AB Class B . . . . . . . 13,960 378,811Boliden AB . . . . . . . . . . . . . . . 6,987 160,780Electrolux AB Class B . . . . . . . . 6,788 161,137Epiroc AB Class A . . . . . . . . . . . 27,014 293,160Epiroc AB Class B . . . . . . . . . . . 7,077 73,202Essity AB Class B . . . . . . . . . . . 3,675 107,385Hennes & Mauritz AB Class B (a) . 28,740 557,837Hexagon AB Class B . . . . . . . . . 6,890 332,582ICA Gruppen AB. . . . . . . . . . . . 6,085 281,470Investor AB Class B . . . . . . . . . . 10,189 498,561Kinnevik AB Class B . . . . . . . . . 2,606 68,621
Security Description Shares Value
L E Lundbergforetagen ABClass B . . . . . . . . . . . . . . . . 4,609 $ 173,632
Sandvik AB . . . . . . . . . . . . . . . 15,981 249,252Skandinaviska Enskilda Banken
AB Class A. . . . . . . . . . . . . . 17,593 161,899Skanska AB Class B. . . . . . . . . . 14,362 291,267SKF AB Class B . . . . . . . . . . . . 7,532 124,638Svenska Handelsbanken AB
Class A . . . . . . . . . . . . . . . . 15,895 149,021Swedbank AB Class A . . . . . . . . 8,493 122,400Swedish Match AB . . . . . . . . . . 2,612 108,150Telefonaktiebolaget LM Ericsson
Class B . . . . . . . . . . . . . . . . 16,039 128,317Telia Co. AB. . . . . . . . . . . . . . . 112,743 505,340Volvo AB Class B . . . . . . . . . . . 12,208 171,657
6,607,729
SWITZERLAND — 11.5%ABB, Ltd. . . . . . . . . . . . . . . . . 23,763 467,324Adecco Group AG . . . . . . . . . . . 5,745 318,146Baloise Holding AG . . . . . . . . . . 2,864 513,547Barry Callebaut AG . . . . . . . . . . 205 423,096Chocoladefabriken Lindt &
Spruengli AG (d) . . . . . . . . . . 134 990,403Chocoladefabriken Lindt &
Spruengli AG (d) . . . . . . . . . . 2 165,672Cie Financiere Richemont SA. . . . 2,401 176,304Coca-Cola HBC AG . . . . . . . . . . 788 25,801Credit Suisse Group AG (b) . . . . . 20,618 252,982EMS-Chemie Holding AG . . . . . . 336 209,421Geberit AG. . . . . . . . . . . . . . . . 1,437 686,832Givaudan SA . . . . . . . . . . . . . . 581 1,622,127Glencore PLC. . . . . . . . . . . . . . 174,518 526,356Julius Baer Group, Ltd. . . . . . . . . 2,612 115,833Kuehne + Nagel International AG . 7,706 1,136,020LafargeHolcim, Ltd. (d) . . . . . . . 1,905 93,841LafargeHolcim, Ltd. (d) . . . . . . . 2,257 111,071Nestle SA . . . . . . . . . . . . . . . . 77,040 8,365,733Novartis AG . . . . . . . . . . . . . . . 25,988 2,255,429Partners Group Holding AG . . . . . 1,501 1,152,751Roche Holding AG. . . . . . . . . . . 27,833 8,107,200Schindler Holding AG (d) . . . . . . 1,610 360,379Schindler Holding AG (d) . . . . . . 1,261 281,501SGS SA. . . . . . . . . . . . . . . . . . 206 511,101Sika AG . . . . . . . . . . . . . . . . . 1,458 213,476Sonova Holding AG . . . . . . . . . . 2,602 605,389Straumann Holding AG . . . . . . . . 211 172,626Swatch Group AG . . . . . . . . . . . 197 52,334Swiss Life Holding AG . . . . . . . . 1,252 599,036Swiss Prime Site AG . . . . . . . . . 7,865 770,212Swiss Re AG . . . . . . . . . . . . . . 17,240 1,799,813Swisscom AG . . . . . . . . . . . . . . 3,314 1,636,145Temenos AG. . . . . . . . . . . . . . . 181 30,313UBS Group AG (b) . . . . . . . . . . 42,650 484,606Vifor Pharma AG. . . . . . . . . . . . 194 31,022Zurich Insurance Group AG . . . . . 4,124 1,579,871
36,843,713
SPDR MSCI EAFE STRATEGICFACTORS ETFSCHEDULE OF INVESTMENTS (continued)September 30, 2019
See accompanying notes to financial statements.75

Security Description Shares Value
UNITED KINGDOM — 16.5%3i Group PLC . . . . . . . . . . . . . . 40,250 $ 578,585Admiral Group PLC . . . . . . . . . . 17,512 457,065Ashtead Group PLC . . . . . . . . . . 17,003 474,371Associated British Foods PLC. . . . 10,853 308,007AstraZeneca PLC . . . . . . . . . . . 51,964 4,649,597Aviva PLC . . . . . . . . . . . . . . . . 38,295 188,433BAE Systems PLC. . . . . . . . . . . 191,861 1,347,652Barclays PLC . . . . . . . . . . . . . . 305,957 567,054Barratt Developments PLC . . . . . 34,402 274,710Berkeley Group Holdings PLC . . . 7,150 368,209BP PLC. . . . . . . . . . . . . . . . . . 179,883 1,143,373British American Tobacco PLC . . . 24,293 900,333British Land Co. PLC REIT . . . . . 8,231 59,317BT Group PLC . . . . . . . . . . . . . 411,163 904,822Bunzl PLC . . . . . . . . . . . . . . . . 12,948 339,061Burberry Group PLC . . . . . . . . . 15,832 424,142Centrica PLC . . . . . . . . . . . . . . 135,625 123,242CNH Industrial NV . . . . . . . . . . 17,499 178,183Coca-Cola European Partners PLC. 6,736 373,511Compass Group PLC . . . . . . . . . 96,704 2,494,192Croda International PLC . . . . . . . 4,959 296,993DCC PLC . . . . . . . . . . . . . . . . 605 52,904Diageo PLC . . . . . . . . . . . . . . . 108,954 4,475,018Direct Line Insurance Group PLC . 141,425 523,182easyJet PLC . . . . . . . . . . . . . . . 1,254 17,771Experian PLC . . . . . . . . . . . . . . 32,206 1,031,477Fiat Chrysler Automobiles NV . . . 31,276 404,801G4S PLC . . . . . . . . . . . . . . . . . 12,809 29,864GlaxoSmithKline PLC . . . . . . . . 84,623 1,819,284Halma PLC . . . . . . . . . . . . . . . 3,469 84,257Hargreaves Lansdown PLC . . . . . 11,144 285,504HSBC Holdings PLC . . . . . . . . . 294,307 2,265,264Imperial Brands PLC . . . . . . . . . 42,402 955,270Informa PLC . . . . . . . . . . . . . . 5,471 57,441InterContinental Hotels Group
PLC . . . . . . . . . . . . . . . . . . 413 25,829Intertek Group PLC . . . . . . . . . . 5,661 382,148ITV PLC . . . . . . . . . . . . . . . . . 128,676 199,636J Sainsbury PLC . . . . . . . . . . . . 33,275 90,128John Wood Group PLC . . . . . . . . 13,865 64,909Johnson Matthey PLC. . . . . . . . . 7,092 267,166Kingfisher PLC. . . . . . . . . . . . . 96,838 246,782Land Securities Group PLC REIT . 7,223 76,227Legal & General Group PLC . . . . 211,207 646,511Lloyds Banking Group PLC . . . . . 621,942 414,786London Stock Exchange Group
PLC . . . . . . . . . . . . . . . . . . 8,895 801,052Marks & Spencer Group PLC . . . . 113,737 258,522Meggitt PLC. . . . . . . . . . . . . . . 7,310 57,202Melrose Industries PLC. . . . . . . . 27,844 69,173Mondi PLC . . . . . . . . . . . . . . . 12,306 236,266National Grid PLC . . . . . . . . . . . 123,673 1,344,035Next PLC . . . . . . . . . . . . . . . . 5,050 384,962Pearson PLC. . . . . . . . . . . . . . . 12,868 117,026Persimmon PLC . . . . . . . . . . . . 11,754 314,313
Security Description Shares Value
Prudential PLC . . . . . . . . . . . . . 16,475 $ 299,457Reckitt Benckiser Group PLC. . . . 6,448 504,086RELX PLC (d) . . . . . . . . . . . . . 86,520 2,060,404RELX PLC (d) . . . . . . . . . . . . . 3,429 81,607Rio Tinto PLC. . . . . . . . . . . . . . 39,810 2,064,845Rio Tinto, Ltd. . . . . . . . . . . . . . 13,337 833,579Rolls-Royce Holdings PLC . . . . . 22,511 219,814Royal Bank of Scotland Group
PLC . . . . . . . . . . . . . . . . . . 36,411 93,149RSA Insurance Group PLC . . . . . 41,081 270,434Sage Group PLC . . . . . . . . . . . . 36,200 308,428Schroders PLC . . . . . . . . . . . . . 4,182 158,469Segro PLC REIT . . . . . . . . . . . . 4,718 47,140Severn Trent PLC . . . . . . . . . . . 3,792 101,168Smith & Nephew PLC . . . . . . . . 63,994 1,544,863Smiths Group PLC. . . . . . . . . . . 12,891 249,404Spirax-Sarco Engineering PLC . . . 1,479 142,981SSE PLC . . . . . . . . . . . . . . . . . 71,584 1,098,692Standard Chartered PLC . . . . . . . 30,212 254,729Standard Life Aberdeen PLC . . . . 19,034 67,036Taylor Wimpey PLC. . . . . . . . . . 123,025 244,840Tesco PLC . . . . . . . . . . . . . . . . 87,128 258,756Unilever NV. . . . . . . . . . . . . . . 51,456 3,093,767Unilever PLC . . . . . . . . . . . . . . 38,334 2,309,986United Utilities Group PLC . . . . . 17,345 176,508Vodafone Group PLC . . . . . . . . . 560,770 1,119,479Weir Group PLC . . . . . . . . . . . . 1,099 19,306Whitbread PLC . . . . . . . . . . . . . 6,488 343,312Wm Morrison Supermarkets PLC . 30,278 74,735WPP PLC . . . . . . . . . . . . . . . . 22,093 277,153
52,767,689
UNITED STATES — 0.2%Carnival PLC . . . . . . . . . . . . . . 4,820 200,167Ferguson PLC . . . . . . . . . . . . . . 8,112 594,187
794,354
TOTAL COMMON STOCKS(Cost $312,049,551) . . . . . . . . 318,216,724
SHORT-TERM INVESTMENTS — 3.7%State Street Institutional Liquid
Reserves Fund, Premier Class2.03% (f) (g) . . . . . . . . . . . . . 11,804 11,805
State Street Navigator SecuritiesLending Portfolio III (h) (i). . . . 11,814,924 11,814,924
TOTAL SHORT-TERM INVESTMENTS(Cost $11,826,729) . . . . . . . . . . . . . . . . . . . . . 11,826,729
TOTAL INVESTMENTS — 103.0%(Cost $323,876,280) . . . . . . . . . . . . . . . . . . . . 330,043,453
LIABILITIES IN EXCESS OF OTHER ASSETS— (3.0)% . . . . . . . . . . . . . . . . . . . . . . . . . . (9,505,360)
NET ASSETS — 100.0% . . . . . . . . . . . . . . . . . $ 320,538,093
SPDR MSCI EAFE STRATEGICFACTORS ETFSCHEDULE OF INVESTMENTS (continued)September 30, 2019
See accompanying notes to financial statements.76
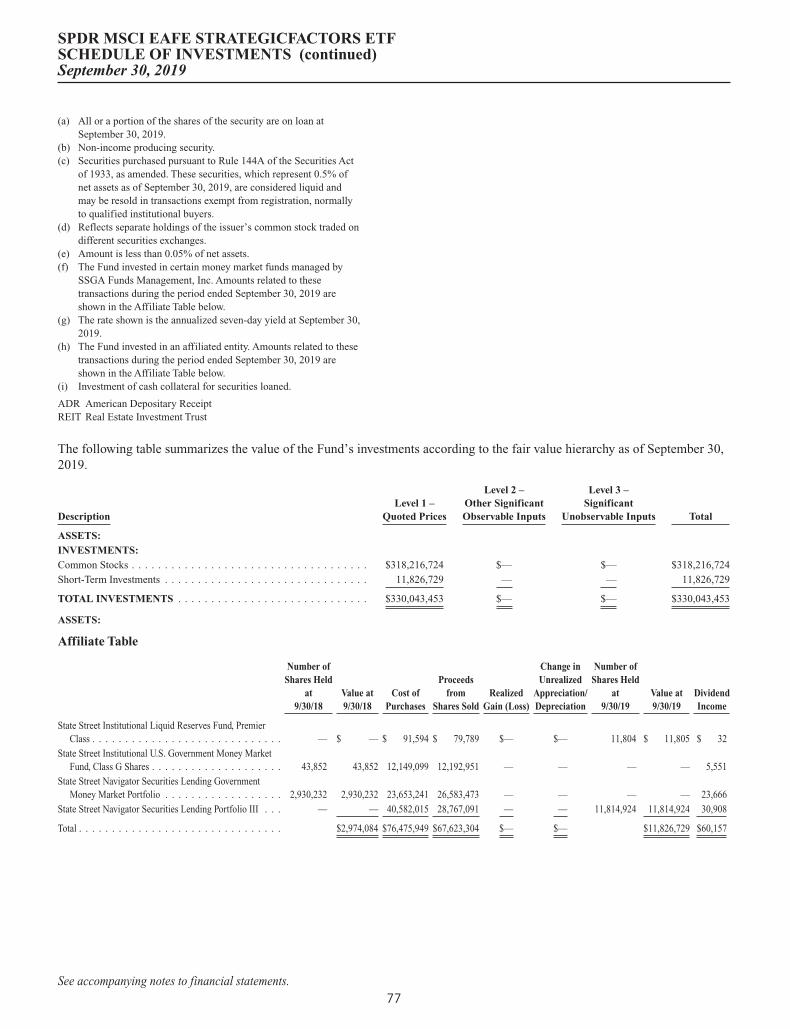
(a) All or a portion of the shares of the security are on loan atSeptember 30, 2019.
(b) Non-income producing security.(c) Securities purchased pursuant to Rule 144A of the Securities Act
of 1933, as amended. These securities, which represent 0.5% ofnet assets as of September 30, 2019, are considered liquid andmay be resold in transactions exempt from registration, normallyto qualified institutional buyers.
(d) Reflects separate holdings of the issuer’s common stock traded ondifferent securities exchanges.
(e) Amount is less than 0.05% of net assets.(f) The Fund invested in certain money market funds managed by
SSGA Funds Management, Inc. Amounts related to thesetransactions during the period ended September 30, 2019 areshown in the Affiliate Table below.
(g) The rate shown is the annualized seven-day yield at September 30,2019.
(h) The Fund invested in an affiliated entity. Amounts related to thesetransactions during the period ended September 30, 2019 areshown in the Affiliate Table below.
(i) Investment of cash collateral for securities loaned.
ADR American Depositary ReceiptREIT Real Estate Investment Trust
The following table summarizes the value of the Fund’s investments according to the fair value hierarchy as of September 30,2019.
DescriptionLevel 1 –
Quoted Prices
Level 2 –Other SignificantObservable Inputs
Level 3 –Significant
Unobservable Inputs Total
ASSETS:INVESTMENTS:Common Stocks . . . . . . . . . . . . . . . . . . . . . . . . . . . . . . . . . . . . $318,216,724 $— $— $318,216,724
Short-Term Investments . . . . . . . . . . . . . . . . . . . . . . . . . . . . . . . 11,826,729 — — 11,826,729
TOTAL INVESTMENTS . . . . . . . . . . . . . . . . . . . . . . . . . . . . . $330,043,453 $— $— $330,043,453
ASSETS:
Affiliate Table
Number ofShares Held
at9/30/18
Value at9/30/18
Cost ofPurchases
Proceedsfrom
Shares SoldRealized
Gain (Loss)
Change inUnrealized
Appreciation/Depreciation
Number ofShares Held
at9/30/19
Value at9/30/19
DividendIncome
State Street Institutional Liquid Reserves Fund, PremierClass . . . . . . . . . . . . . . . . . . . . . . . . . . . . . — $ — $ 91,594 $ 79,789 $— $— 11,804 $ 11,805 $ 32
State Street Institutional U.S. Government Money MarketFund, Class G Shares . . . . . . . . . . . . . . . . . . . . 43,852 43,852 12,149,099 12,192,951 — — — — 5,551
State Street Navigator Securities Lending GovernmentMoney Market Portfolio . . . . . . . . . . . . . . . . . . 2,930,232 2,930,232 23,653,241 26,583,473 — — — — 23,666
State Street Navigator Securities Lending Portfolio III . . . — — 40,582,015 28,767,091 — — 11,814,924 11,814,924 30,908
Total . . . . . . . . . . . . . . . . . . . . . . . . . . . . . . . $2,974,084 $76,475,949 $67,623,304 $— $— $11,826,729 $60,157
SPDR MSCI EAFE STRATEGICFACTORS ETFSCHEDULE OF INVESTMENTS (continued)September 30, 2019
See accompanying notes to financial statements.77
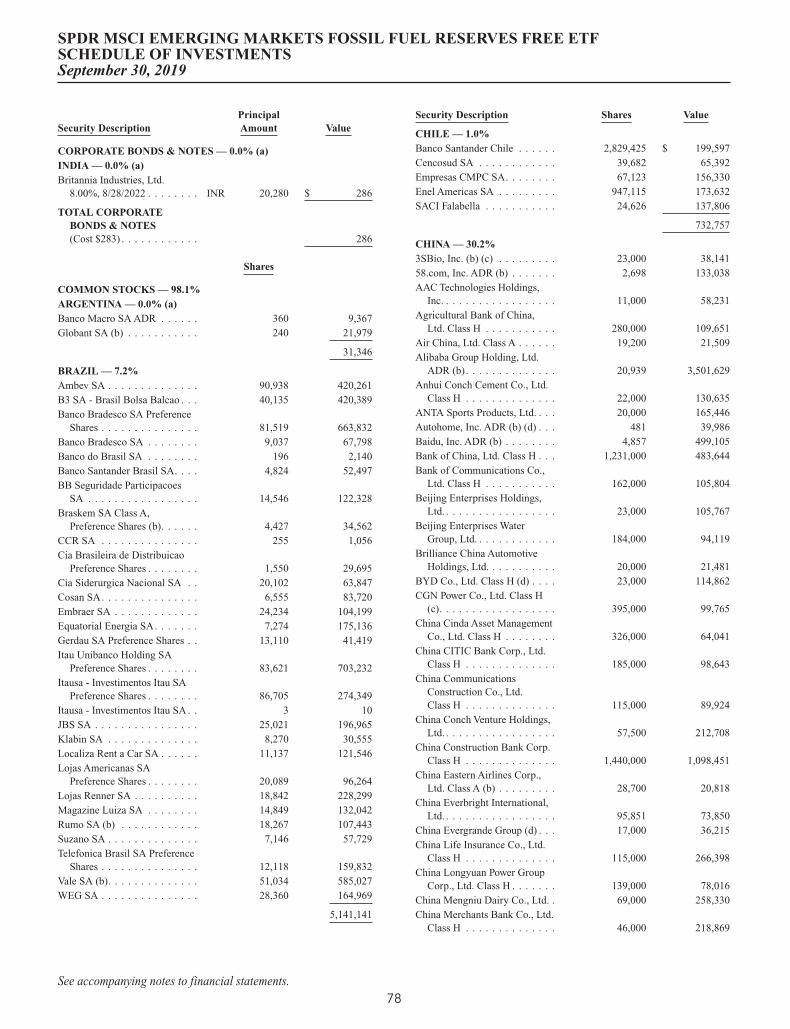
Security DescriptionPrincipalAmount Value
CORPORATE BONDS & NOTES — 0.0% (a)INDIA — 0.0% (a)Britannia Industries, Ltd.
8.00%, 8/28/2022 . . . . . . . . INR 20,280 $ 286
TOTAL CORPORATEBONDS & NOTES(Cost $283) . . . . . . . . . . . . 286
Shares
COMMON STOCKS — 98.1%ARGENTINA — 0.0% (a)Banco Macro SA ADR . . . . . . 360 9,367Globant SA (b) . . . . . . . . . . . 240 21,979
31,346
BRAZIL — 7.2%Ambev SA . . . . . . . . . . . . . . 90,938 420,261B3 SA - Brasil Bolsa Balcao . . . 40,135 420,389Banco Bradesco SA Preference
Shares . . . . . . . . . . . . . . . 81,519 663,832Banco Bradesco SA . . . . . . . . 9,037 67,798Banco do Brasil SA . . . . . . . . 196 2,140Banco Santander Brasil SA. . . . 4,824 52,497BB Seguridade Participacoes
SA . . . . . . . . . . . . . . . . . 14,546 122,328Braskem SA Class A,
Preference Shares (b). . . . . . 4,427 34,562CCR SA . . . . . . . . . . . . . . . 255 1,056Cia Brasileira de Distribuicao
Preference Shares . . . . . . . . 1,550 29,695Cia Siderurgica Nacional SA . . 20,102 63,847Cosan SA. . . . . . . . . . . . . . . 6,555 83,720Embraer SA . . . . . . . . . . . . . 24,234 104,199Equatorial Energia SA. . . . . . . 7,274 175,136Gerdau SA Preference Shares . . 13,110 41,419Itau Unibanco Holding SA
Preference Shares . . . . . . . . 83,621 703,232Itausa - Investimentos Itau SA
Preference Shares . . . . . . . . 86,705 274,349Itausa - Investimentos Itau SA . . 3 10JBS SA . . . . . . . . . . . . . . . . 25,021 196,965Klabin SA . . . . . . . . . . . . . . 8,270 30,555Localiza Rent a Car SA . . . . . . 11,137 121,546Lojas Americanas SA
Preference Shares . . . . . . . . 20,089 96,264Lojas Renner SA . . . . . . . . . . 18,842 228,299Magazine Luiza SA . . . . . . . . 14,849 132,042Rumo SA (b) . . . . . . . . . . . . 18,267 107,443Suzano SA . . . . . . . . . . . . . . 7,146 57,729Telefonica Brasil SA Preference
Shares . . . . . . . . . . . . . . . 12,118 159,832Vale SA (b). . . . . . . . . . . . . . 51,034 585,027WEG SA . . . . . . . . . . . . . . . 28,360 164,969
5,141,141
Security Description Shares Value
CHILE — 1.0%Banco Santander Chile . . . . . . 2,829,425 $ 199,597Cencosud SA . . . . . . . . . . . . 39,682 65,392Empresas CMPC SA. . . . . . . . 67,123 156,330Enel Americas SA . . . . . . . . . 947,115 173,632SACI Falabella . . . . . . . . . . . 24,626 137,806
732,757
CHINA — 30.2%3SBio, Inc. (b) (c) . . . . . . . . . 23,000 38,14158.com, Inc. ADR (b) . . . . . . . 2,698 133,038AAC Technologies Holdings,
Inc. . . . . . . . . . . . . . . . . . 11,000 58,231Agricultural Bank of China,
Ltd. Class H . . . . . . . . . . . 280,000 109,651Air China, Ltd. Class A . . . . . . 19,200 21,509Alibaba Group Holding, Ltd.
ADR (b). . . . . . . . . . . . . . 20,939 3,501,629Anhui Conch Cement Co., Ltd.
Class H . . . . . . . . . . . . . . 22,000 130,635ANTA Sports Products, Ltd. . . . 20,000 165,446Autohome, Inc. ADR (b) (d) . . . 481 39,986Baidu, Inc. ADR (b) . . . . . . . . 4,857 499,105Bank of China, Ltd. Class H . . . 1,231,000 483,644Bank of Communications Co.,
Ltd. Class H . . . . . . . . . . . 162,000 105,804Beijing Enterprises Holdings,
Ltd. . . . . . . . . . . . . . . . . . 23,000 105,767Beijing Enterprises Water
Group, Ltd. . . . . . . . . . . . . 184,000 94,119Brilliance China Automotive
Holdings, Ltd. . . . . . . . . . . 20,000 21,481BYD Co., Ltd. Class H (d) . . . . 23,000 114,862CGN Power Co., Ltd. Class H
(c). . . . . . . . . . . . . . . . . . 395,000 99,765China Cinda Asset Management
Co., Ltd. Class H . . . . . . . . 326,000 64,041China CITIC Bank Corp., Ltd.
Class H . . . . . . . . . . . . . . 185,000 98,643China Communications
Construction Co., Ltd.Class H . . . . . . . . . . . . . . 115,000 89,924
China Conch Venture Holdings,Ltd. . . . . . . . . . . . . . . . . . 57,500 212,708
China Construction Bank Corp.Class H . . . . . . . . . . . . . . 1,440,000 1,098,451
China Eastern Airlines Corp.,Ltd. Class A (b) . . . . . . . . . 28,700 20,818
China Everbright International,Ltd. . . . . . . . . . . . . . . . . . 95,851 73,850
China Evergrande Group (d) . . . 17,000 36,215China Life Insurance Co., Ltd.
Class H . . . . . . . . . . . . . . 115,000 266,398China Longyuan Power Group
Corp., Ltd. Class H . . . . . . . 139,000 78,016China Mengniu Dairy Co., Ltd. . 69,000 258,330China Merchants Bank Co., Ltd.
Class H . . . . . . . . . . . . . . 46,000 218,869
SPDR MSCI EMERGING MARKETS FOSSIL FUEL RESERVES FREE ETFSCHEDULE OF INVESTMENTSSeptember 30, 2019
See accompanying notes to financial statements.78

Security Description Shares Value
China Merchants Port HoldingsCo., Ltd.. . . . . . . . . . . . . . 46,981 $ 70,717
China Minsheng Banking Corp.,Ltd. Class H . . . . . . . . . . . 126,300 85,871
China National BuildingMaterial Co., Ltd. Class H . . 50,000 44,901
China Oilfield Services, Ltd.Class H . . . . . . . . . . . . . . 52,000 62,153
China Overseas Land &Investment, Ltd. . . . . . . . . . 46,000 144,641
China Pacific Insurance GroupCo., Ltd. Class H . . . . . . . . 32,400 119,030
China Railway Group, Ltd.Class H . . . . . . . . . . . . . . 162,000 98,365
China Resources Beer HoldingsCo., Ltd.. . . . . . . . . . . . . . 46,000 243,807
China Resources Gas Group,Ltd. . . . . . . . . . . . . . . . . . 34,000 168,061
China Southern Airlines Co.,Ltd. Class A . . . . . . . . . . . 21,900 20,332
China Spacesat Co., Ltd.Class A . . . . . . . . . . . . . . 10,900 33,076
China Taiping InsuranceHoldings Co., Ltd. . . . . . . . 56,000 125,010
China Telecom Corp., Ltd.Class H . . . . . . . . . . . . . . 230,000 104,740
China Tower Corp., Ltd. Class H(c). . . . . . . . . . . . . . . . . . 220,000 49,953
China Unicom Hong Kong,Ltd. . . . . . . . . . . . . . . . . . 92,000 97,640
China Vanke Co., Ltd. Class H . 47,400 165,066Chongqing Zhifei Biological
Products Co., Ltd. Class A . . 3,000 19,934CITIC Guoan Information
Industry Co., Ltd. Class A(b) . . . . . . . . . . . . . . . . . 41,600 21,030
CITIC Securities Co., Ltd.Class H . . . . . . . . . . . . . . 57,500 107,674
CITIC, Ltd.. . . . . . . . . . . . . . 69,000 87,137Country Garden Holdings Co.,
Ltd. . . . . . . . . . . . . . . . . . 112,000 141,868CRRC Corp., Ltd. Class H . . . . 115,000 80,242CSPC Pharmaceutical Group,
Ltd. . . . . . . . . . . . . . . . . . 92,000 184,718Ctrip.com International, Ltd.
ADR (b). . . . . . . . . . . . . . 6,820 199,758Dongfang Electric Corp., Ltd.
Class A . . . . . . . . . . . . . . 15,900 20,506ENN Energy Holdings, Ltd. . . . 9,000 93,107Fosun International, Ltd. . . . . . 81,000 100,225Future Land Development
Holdings, Ltd. (d) . . . . . . . . 48,000 41,881GDS Holdings, Ltd. ADR (b) . . 613 24,569Geely Automobile Holdings,
Ltd. (d) . . . . . . . . . . . . . . 115,000 195,104Gemdale Corp. Class A . . . . . . 68,793 111,264Genscript Biotech Corp. (b) (d) . 4,000 7,664GoerTek, Inc. Class A . . . . . . . 14,400 35,449
Security Description Shares Value
Great Wall Motor Co., Ltd.Class H (d) . . . . . . . . . . . . 104,000 $ 69,648
Guangshen Railway Co., Ltd.Class A . . . . . . . . . . . . . . 148,200 63,919
Guangzhou HaigeCommunications Group, Inc.Co. Class A . . . . . . . . . . . . 21,600 29,642
Haitong Securities Co., Ltd.Class A . . . . . . . . . . . . . . 25,200 50,462
Hangzhou Tigermed ConsultingCo., Ltd. Class A . . . . . . . . 3,100 26,936
Hengan International GroupCo., Ltd.. . . . . . . . . . . . . . 11,500 75,401
Hengtong Optic-electric Co.,Ltd. Class A . . . . . . . . . . . 10,400 22,661
Hithink RoyalFlush InformationNetwork Co., Ltd. Class A . . 2,200 30,561
Hua Hong Semiconductor, Ltd.(c) (d) . . . . . . . . . . . . . . . 4,000 7,960
Huaneng Power International,Inc. Class H . . . . . . . . . . . 184,000 88,486
Huatai Securities Co., Ltd.Class H (c) (d) . . . . . . . . . . 56,000 83,864
Huazhu Group, Ltd. ADR (d) . . 1,671 55,176Industrial & Commercial Bank
of China, Ltd. Class H . . . . . 1,005,000 673,043JD.com, Inc. ADR (b) . . . . . . . 12,518 353,133Kingdee International Software
Group Co., Ltd. (d) . . . . . . . 23,000 24,234Kweichow Moutai Co., Ltd.
Class A . . . . . . . . . . . . . . 700 112,726Lenovo Group, Ltd. . . . . . . . . 184,000 122,754Li Ning Co., Ltd. . . . . . . . . . . 6,500 18,656Longfor Group Holdings, Ltd.
(c). . . . . . . . . . . . . . . . . . 11,500 42,982Meituan Dianping Class B (b) . . 3,700 37,805MMG, Ltd. (b) (d) . . . . . . . . . 80,000 18,879Momo, Inc. ADR . . . . . . . . . . 1,820 56,384NetEase, Inc. ADR . . . . . . . . . 1,380 367,328New China Life Insurance Co.,
Ltd. Class H . . . . . . . . . . . 25,600 101,232New Oriental Education &
Technology Group, Inc. ADR(b) . . . . . . . . . . . . . . . . . 2,601 288,087
Oceanwide Holdings Co., Ltd.Class A . . . . . . . . . . . . . . 41,600 25,166
OFILM Group Co., Ltd. Class A(b) . . . . . . . . . . . . . . . . . 20,600 34,328
PICC Property & Casualty Co.,Ltd. Class H . . . . . . . . . . . 138,000 161,071
Pinduoduo, Inc. ADR (b) (d) . . . 1,722 55,483Ping An Insurance Group Co. of
China, Ltd. Class H. . . . . . . 79,500 913,204RiseSun Real Estate
Development Co., Ltd.Class A . . . . . . . . . . . . . . 19,800 22,957
Seazen Holdings Co., Ltd.Class A . . . . . . . . . . . . . . 5,700 22,652
SPDR MSCI EMERGING MARKETS FOSSIL FUEL RESERVES FREE ETFSCHEDULE OF INVESTMENTS (continued)September 30, 2019
See accompanying notes to financial statements.79

Security Description Shares Value
Semiconductor ManufacturingInternational Corp. (b) (d). . . 92,700 $ 115,884
Shandong BuchangPharmaceuticals Co., Ltd.Class A . . . . . . . . . . . . . . 11,270 30,096
Shanghai Fosun PharmaceuticalGroup Co., Ltd. Class A . . . . 13,400 47,418
Shanghai Lujiazui Finance &Trade Zone DevelopmentCo., Ltd. Class B . . . . . . . . 59,000 66,198
Shanghai Zhangjiang High-TechPark Development Co., Ltd.Class A . . . . . . . . . . . . . . 8,800 19,100
Shanxi Securities Co., Ltd.Class A . . . . . . . . . . . . . . 22,800 25,063
Shenzhen Kangtai BiologicalProducts Co., Ltd. Class A . . 2,200 22,871
Shenzhen Zhongjin LingnanNonfemet Co., Ltd. Class A . 35,300 19,970
Shenzhou International GroupHoldings, Ltd. . . . . . . . . . . 23,000 300,431
SINA Corp. (b) . . . . . . . . . . . 613 24,023Sinopharm Group Co., Ltd.
Class H . . . . . . . . . . . . . . 27,600 86,433SooChow Securities Co., Ltd.
Class A . . . . . . . . . . . . . . 20,700 26,813Sunac China Holdings, Ltd. . . . 42,000 168,763Sunny Optical Technology
Group Co., Ltd. . . . . . . . . . 9,300 136,664Suzhou Dongshan Precision
Manufacturing Co., Ltd.Class A . . . . . . . . . . . . . . 7,100 19,586
TAL Education Group ADR (b) . 9,286 317,953Tasly Pharmaceutical Group
Co., Ltd. Class A . . . . . . . . 9,300 20,290Tencent Holdings, Ltd. . . . . . . 84,900 3,576,036Tonghua Dongbao
Pharmaceutical Co., Ltd.Class A . . . . . . . . . . . . . . 12,200 29,897
Tunghsu OptoelectronicTechnology Co., Ltd.Class A . . . . . . . . . . . . . . 24,000 19,089
Vipshop Holdings, Ltd. ADR(b) . . . . . . . . . . . . . . . . . 8,563 76,382
Walvax Biotechnology Co., Ltd.Class A . . . . . . . . . . . . . . 8,800 33,259
Want Want China Holdings,Ltd. . . . . . . . . . . . . . . . . . 185,000 147,964
Weibo Corp. ADR (b) (d) . . . . . 471 21,077Weichai Power Co., Ltd.
Class A . . . . . . . . . . . . . . 85,900 134,963Wuliangye Yibin Co., Ltd.
Class A . . . . . . . . . . . . . . 4,242 77,104Wuxi Biologics Cayman, Inc.
(b) (c) . . . . . . . . . . . . . . . 9,500 96,946Xiaomi Corp. Class B (b) (c)
(d) . . . . . . . . . . . . . . . . . 24,000 26,941
Security Description Shares Value
Xinjiang Goldwind Science &Technology Co., Ltd.Class A . . . . . . . . . . . . . . 16,139 $ 28,295
Yum China Holdings, Inc. . . . . 5,866 266,492YY, Inc. ADR (b) . . . . . . . . . . 434 24,404Zhejiang Dahua Technology
Co., Ltd. Class A . . . . . . . . 13,800 33,373Zhejiang Longsheng Group Co.,
Ltd. Class A . . . . . . . . . . . 10,500 20,673Zhuzhou CRRC Times Electric
Co., Ltd. Class H . . . . . . . . 23,100 95,619ZTE Corp. Class A (b). . . . . . . 5,500 24,653ZTE Corp. Class H (b) . . . . . . 9,200 24,410ZTO Express Cayman, Inc.
ADR . . . . . . . . . . . . . . . . 3,102 66,166
21,672,688
COLOMBIA — 0.5%Bancolombia SA Preference
Shares . . . . . . . . . . . . . . . 20,853 257,781Grupo Argos SA . . . . . . . . . . 22,629 110,983Grupo de Inversiones
Suramericana SA PreferenceShares . . . . . . . . . . . . . . . 10 85
Grupo de InversionesSuramericana SA . . . . . . . . 2,294 21,763
390,612
EGYPT — 0.1%Commercial International Bank
Egypt SAE . . . . . . . . . . . . 15,264 72,781
GREECE — 0.2%Alpha Bank AE (b) . . . . . . . . . 31,219 58,302Hellenic Telecommunications
Organization SA. . . . . . . . . 2,830 38,998Piraeus Bank SA (b) . . . . . . . . 3,372 11,322
108,622
HONG KONG — 2.1%China Ding Yi Feng Holdings,
Ltd. (e). . . . . . . . . . . . . . . 8,000 102China Gas Holdings, Ltd. . . . . . 23,000 88,897China Mobile, Ltd. . . . . . . . . . 89,500 740,373China Resources Land, Ltd. . . . 46,000 192,757Guangdong Investment, Ltd. . . . 92,000 180,024Shimao Property Holdings, Ltd.. 13,000 37,975Sino Biopharmaceutical, Ltd. . . 188,500 239,490
1,479,618
HUNGARY — 0.3%OTP Bank Nyrt . . . . . . . . . . . 4,417 183,867
INDIA — 8.2%Adani Ports & Special
Economic Zone, Ltd. . . . . . . 10,407 60,788Ambuja Cements, Ltd.. . . . . . . 9,670 27,829Ashok Leyland, Ltd. . . . . . . . . 18,903 18,325Asian Paints, Ltd. . . . . . . . . . . 4,415 109,779Aurobindo Pharma, Ltd. . . . . . 12,080 100,398
SPDR MSCI EMERGING MARKETS FOSSIL FUEL RESERVES FREE ETFSCHEDULE OF INVESTMENTS (continued)September 30, 2019
See accompanying notes to financial statements.80

Security Description Shares Value
Axis Bank, Ltd. . . . . . . . . . . . 30,150 $ 291,422Bajaj Auto, Ltd. . . . . . . . . . . . 1,342 55,707Bajaj Finance, Ltd. . . . . . . . . . 2,652 151,408Bajaj Finserv, Ltd. . . . . . . . . . 616 73,996Bharat Forge, Ltd. . . . . . . . . . 3,382 21,301Bharat Petroleum Corp., Ltd. . . 11,640 77,213Bharti Airtel, Ltd.. . . . . . . . . . 29,521 152,898Bharti Infratel, Ltd.. . . . . . . . . 5,404 19,620Bosch, Ltd. . . . . . . . . . . . . . . 119 23,615Britannia Industries, Ltd. . . . . . 738 30,659Cipla, Ltd. . . . . . . . . . . . . . . 5,554 33,347Container Corp. Of India, Ltd.. . 2,222 18,961Dabur India, Ltd. . . . . . . . . . . 8,533 53,851Dr Reddy’s Laboratories, Ltd. . . 1,834 69,931Eicher Motors, Ltd. . . . . . . . . 208 52,141Glenmark Pharmaceuticals,
Ltd. . . . . . . . . . . . . . . . . . 2,815 12,911Godrej Consumer Products,
Ltd. . . . . . . . . . . . . . . . . . 5,483 53,175Grasim Industries, Ltd. . . . . . . 5,040 51,923Havells India, Ltd. . . . . . . . . . 4,057 41,120HCL Technologies, Ltd. . . . . . . 9,494 144,764Hero MotoCorp, Ltd. . . . . . . . 807 30,800Hindalco Industries, Ltd. . . . . . 18,729 50,569Hindustan Unilever, Ltd. . . . . . 10,907 305,030Housing Development Finance
Corp., Ltd. . . . . . . . . . . . . 25,192 702,789ICICI Bank, Ltd. . . . . . . . . . . 37,367 228,677Indiabulls Housing Finance,
Ltd. . . . . . . . . . . . . . . . . . 4,450 16,068Infosys, Ltd. . . . . . . . . . . . . . 46,207 525,290ITC, Ltd. . . . . . . . . . . . . . . . 57,327 210,197JSW Steel, Ltd. . . . . . . . . . . . 12,970 42,084Larsen & Toubro, Ltd. . . . . . . . 8,063 167,731LIC Housing Finance, Ltd. . . . . 14,224 75,597Lupin, Ltd. . . . . . . . . . . . . . . 3,573 36,084Mahindra & Mahindra Financial
Services, Ltd. . . . . . . . . . . 4,718 21,836Mahindra & Mahindra, Ltd. . . . 12,629 97,504Marico, Ltd. . . . . . . . . . . . . . 7,338 40,822Maruti Suzuki India, Ltd. . . . . . 1,778 168,490Motherson Sumi Systems, Ltd. . 15,190 22,495Nestle India, Ltd. . . . . . . . . . . 375 73,497Petronet LNG, Ltd. . . . . . . . . . 9,741 35,724Piramal Enterprises, Ltd. . . . . . 1,296 29,853REC, Ltd.. . . . . . . . . . . . . . . 11,222 19,501Shree Cement, Ltd. . . . . . . . . . 140 37,313Shriram Transport Finance Co.,
Ltd. . . . . . . . . . . . . . . . . . 2,366 35,756State Bank of India (b) . . . . . . 29,626 113,205Sun Pharmaceutical Industries,
Ltd. . . . . . . . . . . . . . . . . . 16,380 90,014Tata Consultancy Services, Ltd. . 15,558 460,864Tata Motors, Ltd. (b) . . . . . . . . 6,356 10,534Tata Steel, Ltd. . . . . . . . . . . . 5,641 28,695Tech Mahindra, Ltd. . . . . . . . . 5,649 56,953Titan Co., Ltd. . . . . . . . . . . . . 4,764 85,578
Security Description Shares Value
UltraTech Cement, Ltd. . . . . . . 1,342 $ 82,208United Spirits, Ltd. (b) . . . . . . 4,690 44,141UPL, Ltd. . . . . . . . . . . . . . . . 15,332 130,661Wipro, Ltd. . . . . . . . . . . . . . . 17,331 58,643Zee Entertainment Enterprises,
Ltd. . . . . . . . . . . . . . . . . . 8,102 30,353
5,912,638
INDONESIA — 2.2%Astra International Tbk PT . . . . 332,900 154,783Bank Central Asia Tbk PT . . . . 132,600 283,509Bank Mandiri Persero Tbk PT . . 363,000 178,367Bank Negara Indonesia Persero
Tbk PT . . . . . . . . . . . . . . 291,400 150,883Bank Rakyat Indonesia Persero
Tbk PT . . . . . . . . . . . . . . 1,091,200 316,713Kalbe Farma Tbk PT. . . . . . . . 910,800 107,474Telekomunikasi Indonesia
Persero Tbk PT . . . . . . . . . 978,900 297,222Unilever Indonesia Tbk PT . . . . 36,400 119,239
1,608,190
MALAYSIA — 2.2%CIMB Group Holdings Bhd . . . 116,537 140,000DiGi.Com Bhd . . . . . . . . . . . 102,100 115,829Genting Bhd . . . . . . . . . . . . . 66,300 90,891Genting Malaysia Bhd. . . . . . . 44,900 32,493IHH Healthcare Bhd . . . . . . . . 81,000 109,883IOI Corp. Bhd . . . . . . . . . . . . 114,300 120,934Malayan Banking Bhd. . . . . . . 61,154 124,294Maxis Bhd . . . . . . . . . . . . . . 85,800 114,755Petronas Chemicals Group Bhd . 76,000 136,862Petronas Gas Bhd . . . . . . . . . . 24,100 94,282Public Bank Bhd . . . . . . . . . . 41,200 197,587Sime Darby Bhd . . . . . . . . . . 69,455 37,323Sime Darby Plantation Bhd . . . 38,100 43,041Tenaga Nasional Bhd . . . . . . . 61,500 200,349
1,558,523
MEXICO — 2.9%America Movil SAB de CV
Series L . . . . . . . . . . . . . . 560,490 415,598Arca Continental SAB de CV . . 6,918 37,376Coca-Cola Femsa SAB de CV . . 7,982 48,549Fomento Economico Mexicano
SAB de CV. . . . . . . . . . . . 39,521 362,403Gruma SAB de CV Class B . . . 3,458 35,368Grupo Aeroportuario del
Pacifico SAB de CV Class B. 13,940 134,077Grupo Aeroportuario del Sureste
SAB de CV Class B . . . . . . 1,046 15,980Grupo Bimbo SAB de CV
Class A . . . . . . . . . . . . . . 26,718 48,703Grupo Carso SAB de CV
Series A1 . . . . . . . . . . . . . 21,683 63,619Grupo Financiero Banorte SAB
de CV Series O . . . . . . . . . 38,822 208,562
SPDR MSCI EMERGING MARKETS FOSSIL FUEL RESERVES FREE ETFSCHEDULE OF INVESTMENTS (continued)September 30, 2019
See accompanying notes to financial statements.81
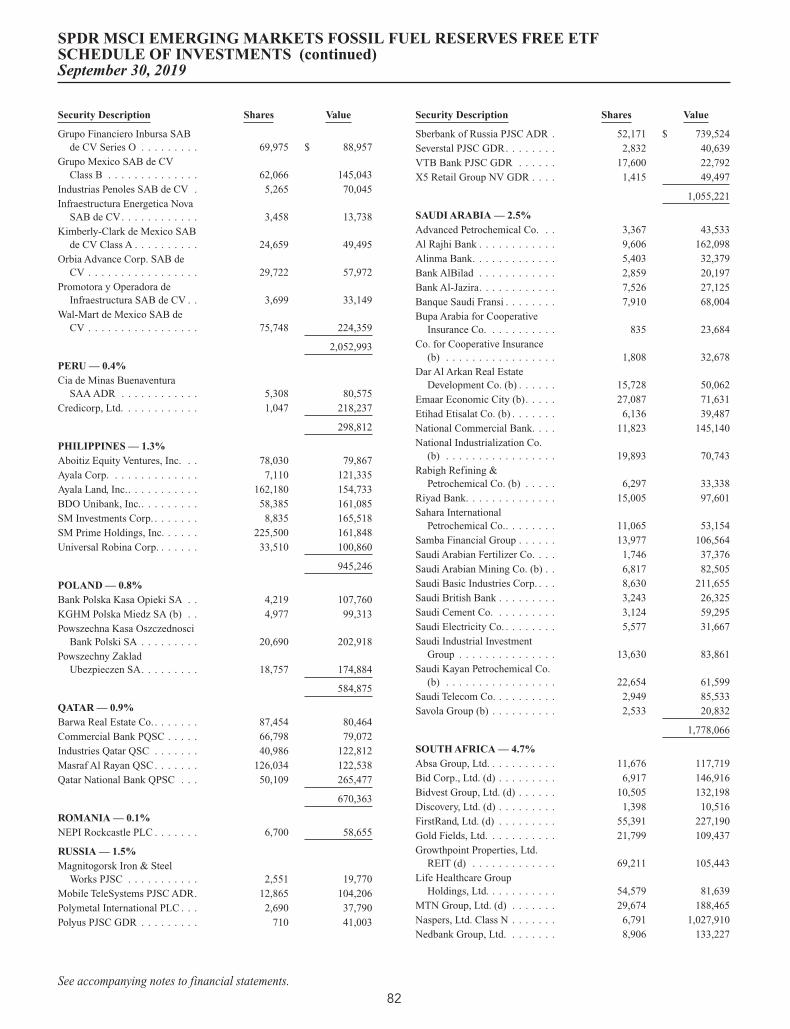
Security Description Shares Value
Grupo Financiero Inbursa SABde CV Series O . . . . . . . . . 69,975 $ 88,957
Grupo Mexico SAB de CVClass B . . . . . . . . . . . . . . 62,066 145,043
Industrias Penoles SAB de CV . 5,265 70,045Infraestructura Energetica Nova
SAB de CV. . . . . . . . . . . . 3,458 13,738Kimberly-Clark de Mexico SAB
de CV Class A . . . . . . . . . . 24,659 49,495Orbia Advance Corp. SAB de
CV . . . . . . . . . . . . . . . . . 29,722 57,972Promotora y Operadora de
Infraestructura SAB de CV . . 3,699 33,149Wal-Mart de Mexico SAB de
CV . . . . . . . . . . . . . . . . . 75,748 224,359
2,052,993
PERU — 0.4%Cia de Minas Buenaventura
SAA ADR . . . . . . . . . . . . 5,308 80,575Credicorp, Ltd. . . . . . . . . . . . 1,047 218,237
298,812
PHILIPPINES — 1.3%Aboitiz Equity Ventures, Inc. . . 78,030 79,867Ayala Corp. . . . . . . . . . . . . . 7,110 121,335Ayala Land, Inc.. . . . . . . . . . . 162,180 154,733BDO Unibank, Inc.. . . . . . . . . 58,385 161,085SM Investments Corp. . . . . . . . 8,835 165,518SM Prime Holdings, Inc. . . . . . 225,500 161,848Universal Robina Corp. . . . . . . 33,510 100,860
945,246
POLAND — 0.8%Bank Polska Kasa Opieki SA . . 4,219 107,760KGHM Polska Miedz SA (b) . . 4,977 99,313Powszechna Kasa Oszczednosci
Bank Polski SA . . . . . . . . . 20,690 202,918Powszechny Zaklad
Ubezpieczen SA. . . . . . . . . 18,757 174,884
584,875
QATAR — 0.9%Barwa Real Estate Co. . . . . . . . 87,454 80,464Commercial Bank PQSC . . . . . 66,798 79,072Industries Qatar QSC . . . . . . . 40,986 122,812Masraf Al Rayan QSC . . . . . . . 126,034 122,538Qatar National Bank QPSC . . . 50,109 265,477
670,363
ROMANIA — 0.1%NEPI Rockcastle PLC . . . . . . . 6,700 58,655
RUSSIA — 1.5%Magnitogorsk Iron & Steel
Works PJSC . . . . . . . . . . . 2,551 19,770Mobile TeleSystems PJSC ADR. 12,865 104,206Polymetal International PLC . . . 2,690 37,790Polyus PJSC GDR . . . . . . . . . 710 41,003
Security Description Shares Value
Sberbank of Russia PJSC ADR . 52,171 $ 739,524Severstal PJSC GDR. . . . . . . . 2,832 40,639VTB Bank PJSC GDR . . . . . . 17,600 22,792X5 Retail Group NV GDR . . . . 1,415 49,497
1,055,221
SAUDI ARABIA — 2.5%Advanced Petrochemical Co. . . 3,367 43,533Al Rajhi Bank . . . . . . . . . . . . 9,606 162,098Alinma Bank. . . . . . . . . . . . . 5,403 32,379Bank AlBilad . . . . . . . . . . . . 2,859 20,197Bank Al-Jazira. . . . . . . . . . . . 7,526 27,125Banque Saudi Fransi . . . . . . . . 7,910 68,004Bupa Arabia for Cooperative
Insurance Co. . . . . . . . . . . 835 23,684Co. for Cooperative Insurance
(b) . . . . . . . . . . . . . . . . . 1,808 32,678Dar Al Arkan Real Estate
Development Co. (b) . . . . . . 15,728 50,062Emaar Economic City (b). . . . . 27,087 71,631Etihad Etisalat Co. (b) . . . . . . . 6,136 39,487National Commercial Bank. . . . 11,823 145,140National Industrialization Co.
(b) . . . . . . . . . . . . . . . . . 19,893 70,743Rabigh Refining &
Petrochemical Co. (b) . . . . . 6,297 33,338Riyad Bank. . . . . . . . . . . . . . 15,005 97,601Sahara International
Petrochemical Co.. . . . . . . . 11,065 53,154Samba Financial Group . . . . . . 13,977 106,564Saudi Arabian Fertilizer Co. . . . 1,746 37,376Saudi Arabian Mining Co. (b) . . 6,817 82,505Saudi Basic Industries Corp. . . . 8,630 211,655Saudi British Bank . . . . . . . . . 3,243 26,325Saudi Cement Co. . . . . . . . . . 3,124 59,295Saudi Electricity Co. . . . . . . . . 5,577 31,667Saudi Industrial Investment
Group . . . . . . . . . . . . . . . 13,630 83,861Saudi Kayan Petrochemical Co.
(b) . . . . . . . . . . . . . . . . . 22,654 61,599Saudi Telecom Co. . . . . . . . . . 2,949 85,533Savola Group (b) . . . . . . . . . . 2,533 20,832
1,778,066
SOUTH AFRICA — 4.7%Absa Group, Ltd. . . . . . . . . . . 11,676 117,719Bid Corp., Ltd. (d) . . . . . . . . . 6,917 146,916Bidvest Group, Ltd. (d) . . . . . . 10,505 132,198Discovery, Ltd. (d) . . . . . . . . . 1,398 10,516FirstRand, Ltd. (d) . . . . . . . . . 55,391 227,190Gold Fields, Ltd. . . . . . . . . . . 21,799 109,437Growthpoint Properties, Ltd.
REIT (d) . . . . . . . . . . . . . 69,211 105,443Life Healthcare Group
Holdings, Ltd. . . . . . . . . . . 54,579 81,639MTN Group, Ltd. (d) . . . . . . . 29,674 188,465Naspers, Ltd. Class N . . . . . . . 6,791 1,027,910Nedbank Group, Ltd. . . . . . . . 8,906 133,227
SPDR MSCI EMERGING MARKETS FOSSIL FUEL RESERVES FREE ETFSCHEDULE OF INVESTMENTS (continued)September 30, 2019
See accompanying notes to financial statements.82

Security Description Shares Value
Redefine Properties, Ltd. REIT . 168,927 $ 87,235Remgro, Ltd. . . . . . . . . . . . . 8,888 95,659Sanlam, Ltd. . . . . . . . . . . . . . 27,295 134,256Sasol, Ltd. (d) . . . . . . . . . . . . 7,919 132,167Shoprite Holdings, Ltd. . . . . . . 9,201 74,421SPAR Group, Ltd. . . . . . . . . . 8,912 112,269Standard Bank Group, Ltd. . . . . 21,600 248,858Tiger Brands, Ltd. . . . . . . . . . 4,617 64,116Vodacom Group, Ltd. . . . . . . . 11,700 92,319Woolworths Holdings, Ltd. (d) . 10,419 37,849
3,359,809
SOUTH KOREA — 13.2%AMOREPACIFIC Group . . . . . 882 48,224Celltrion, Inc. (b) . . . . . . . . . . 1,361 186,602CJ CheilJedang Corp. . . . . . . . 50 9,802GS Holdings Corp. . . . . . . . . . 2,670 112,278Hana Financial Group, Inc. . . . . 5,339 157,338Helixmith Co., Ltd. (b) . . . . . . 449 24,887HLB, Inc. (b) . . . . . . . . . . . . 264 13,331Hyundai Engineering &
Construction Co., Ltd. . . . . . 3,298 127,657Hyundai Glovis Co., Ltd. . . . . . 786 102,509Hyundai Mobis Co., Ltd. . . . . . 1,207 254,286Hyundai Motor Co.. . . . . . . . . 2,425 271,663Hyundai Motor Co. Preference
Shares . . . . . . . . . . . . . . . 1,428 91,209Hyundai Steel Co. . . . . . . . . . 2,792 90,799Industrial Bank of Korea . . . . . 11,154 123,089KB Financial Group, Inc. . . . . . 7,032 251,027Kia Motors Corp. . . . . . . . . . . 5,215 198,808Korea Electric Power Corp. (b) . 4,598 99,560Korea Zinc Co., Ltd. . . . . . . . . 316 118,353KT&G Corp.. . . . . . . . . . . . . 2,207 194,657LG Chem, Ltd. . . . . . . . . . . . 997 249,636LG Corp. . . . . . . . . . . . . . . . 2,207 129,156LG Electronics, Inc. . . . . . . . . 2,768 155,970LG Household & Health Care,
Ltd. . . . . . . . . . . . . . . . . . 193 210,886Lotte Chemical Corp. . . . . . . . 447 88,193NAVER Corp. . . . . . . . . . . . . 2,340 307,135NCSoft Corp. . . . . . . . . . . . . 495 215,604POSCO . . . . . . . . . . . . . . . . 1,380 261,890Samsung Biologics Co., Ltd. (b)
(c). . . . . . . . . . . . . . . . . . 49 12,597Samsung C&T Corp. . . . . . . . 1,356 101,687Samsung Electro-Mechanics
Co., Ltd.. . . . . . . . . . . . . . 134 11,539Samsung Electronics Co., Ltd.
Preference Shares . . . . . . . . 9,839 324,909Samsung Electronics Co., Ltd.. . 71,573 2,934,963Samsung Fire & Marine
Insurance Co., Ltd. . . . . . . . 567 105,707Samsung SDI Co., Ltd. . . . . . . 1,500 279,647Samsung SDS Co., Ltd. . . . . . . 882 140,468Shinhan Financial Group Co.,
Ltd. . . . . . . . . . . . . . . . . . 7,527 263,034
Security Description Shares Value
SK Holdings Co., Ltd. . . . . . . . 858 $ 146,329SK Hynix, Inc. . . . . . . . . . . . 8,365 574,847SK Telecom Co., Ltd. . . . . . . . 615 124,167S-Oil Corp.. . . . . . . . . . . . . . 1,693 140,688Woongjin Coway Co., Ltd. . . . . 1,452 102,695Woori Financial Group, Inc. . . . 11,878 123,631
9,481,457
TAIWAN — 12.2%ASE Technology Holding Co.,
Ltd. . . . . . . . . . . . . . . . . . 64,656 147,549Asustek Computer, Inc. . . . . . . 23,000 153,089Catcher Technology Co., Ltd. . . 3,000 22,724Cathay Financial Holding Co.,
Ltd. . . . . . . . . . . . . . . . . . 114,000 150,288Chailease Holding Co., Ltd. . . . 3,090 12,450Chang Hwa Commercial Bank,
Ltd. . . . . . . . . . . . . . . . . . 207,736 144,965China Development Financial
Holding Corp. . . . . . . . . . . 474,000 141,171China Life Insurance Co., Ltd.
(b) . . . . . . . . . . . . . . . . . 129,560 102,731China Steel Corp.. . . . . . . . . . 256,000 189,785Chunghwa Telecom Co., Ltd. . . 45,000 161,002Compal Electronics, Inc. . . . . . 185,000 106,738CTBC Financial Holding Co.,
Ltd. . . . . . . . . . . . . . . . . . 256,000 169,982E.Sun Financial Holding Co.,
Ltd. . . . . . . . . . . . . . . . . . 268,881 227,502Far Eastern New Century Corp. . 47,000 43,403Far EasTone
Telecommunications Co.,Ltd. . . . . . . . . . . . . . . . . . 46,000 107,496
First Financial Holding Co.,Ltd. . . . . . . . . . . . . . . . . . 177,498 124,722
Formosa Chemicals & FibreCorp. . . . . . . . . . . . . . . . . 46,000 128,550
Formosa Petrochemical Corp. . . 4,000 12,661Formosa Plastics Corp. . . . . . . 69,000 210,172Foxconn Technology Co., Ltd. . . 46,000 95,931Fubon Financial Holding Co.,
Ltd. . . . . . . . . . . . . . . . . . 114,000 163,700Globalwafers Co., Ltd. . . . . . . 1,000 10,121Hon Hai Precision Industry Co.,
Ltd. . . . . . . . . . . . . . . . . . 207,400 489,345Hua Nan Financial Holdings
Co., Ltd.. . . . . . . . . . . . . . 214,898 145,115Lite-On Technology Corp. . . . . 92,000 146,194MediaTek, Inc. . . . . . . . . . . . 22,000 261,664Mega Financial Holding Co.,
Ltd. . . . . . . . . . . . . . . . . . 162,000 150,123Nan Ya Plastics Corp. . . . . . . . 92,000 206,688Pegatron Corp. . . . . . . . . . . . 46,000 80,066President Chain Store Corp. . . . 17,000 158,907Quanta Computer, Inc.. . . . . . . 44,000 80,272SinoPac Financial Holdings Co.,
Ltd. . . . . . . . . . . . . . . . . . 335,794 130,964
SPDR MSCI EMERGING MARKETS FOSSIL FUEL RESERVES FREE ETFSCHEDULE OF INVESTMENTS (continued)September 30, 2019
See accompanying notes to financial statements.83
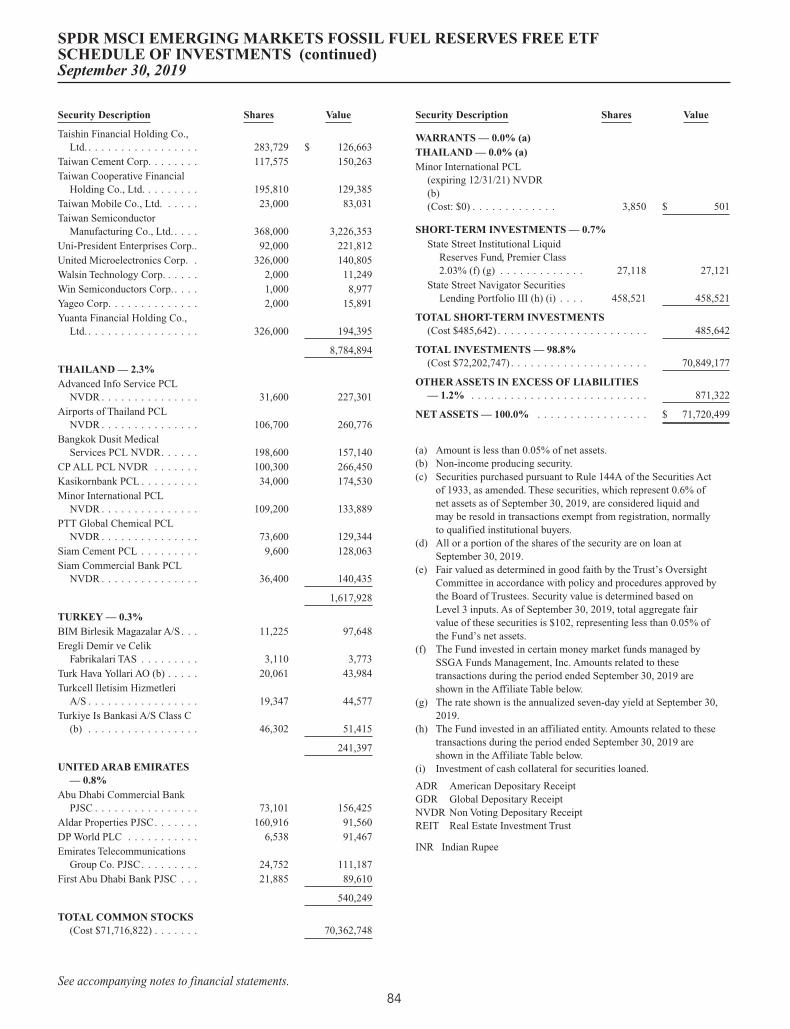
Security Description Shares Value
Taishin Financial Holding Co.,Ltd. . . . . . . . . . . . . . . . . . 283,729 $ 126,663
Taiwan Cement Corp. . . . . . . . 117,575 150,263Taiwan Cooperative Financial
Holding Co., Ltd. . . . . . . . . 195,810 129,385Taiwan Mobile Co., Ltd. . . . . . 23,000 83,031Taiwan Semiconductor
Manufacturing Co., Ltd. . . . . 368,000 3,226,353Uni-President Enterprises Corp.. 92,000 221,812United Microelectronics Corp. . 326,000 140,805Walsin Technology Corp. . . . . . 2,000 11,249Win Semiconductors Corp. . . . . 1,000 8,977Yageo Corp. . . . . . . . . . . . . . 2,000 15,891Yuanta Financial Holding Co.,
Ltd. . . . . . . . . . . . . . . . . . 326,000 194,395
8,784,894
THAILAND — 2.3%Advanced Info Service PCL
NVDR . . . . . . . . . . . . . . . 31,600 227,301Airports of Thailand PCL
NVDR . . . . . . . . . . . . . . . 106,700 260,776Bangkok Dusit Medical
Services PCL NVDR. . . . . . 198,600 157,140CP ALL PCL NVDR . . . . . . . 100,300 266,450Kasikornbank PCL . . . . . . . . . 34,000 174,530Minor International PCL
NVDR . . . . . . . . . . . . . . . 109,200 133,889PTT Global Chemical PCL
NVDR . . . . . . . . . . . . . . . 73,600 129,344Siam Cement PCL . . . . . . . . . 9,600 128,063Siam Commercial Bank PCL
NVDR . . . . . . . . . . . . . . . 36,400 140,435
1,617,928
TURKEY — 0.3%BIM Birlesik Magazalar A/S. . . 11,225 97,648Eregli Demir ve Celik
Fabrikalari TAS . . . . . . . . . 3,110 3,773Turk Hava Yollari AO (b) . . . . . 20,061 43,984Turkcell Iletisim Hizmetleri
A/S . . . . . . . . . . . . . . . . . 19,347 44,577Turkiye Is Bankasi A/S Class C
(b) . . . . . . . . . . . . . . . . . 46,302 51,415
241,397
UNITED ARAB EMIRATES— 0.8%
Abu Dhabi Commercial BankPJSC . . . . . . . . . . . . . . . . 73,101 156,425
Aldar Properties PJSC. . . . . . . 160,916 91,560DP World PLC . . . . . . . . . . . 6,538 91,467Emirates Telecommunications
Group Co. PJSC. . . . . . . . . 24,752 111,187First Abu Dhabi Bank PJSC . . . 21,885 89,610
540,249
TOTAL COMMON STOCKS(Cost $71,716,822) . . . . . . . 70,362,748
Security Description Shares Value
WARRANTS — 0.0% (a)THAILAND — 0.0% (a)Minor International PCL
(expiring 12/31/21) NVDR(b)(Cost: $0) . . . . . . . . . . . . . 3,850 $ 501
SHORT-TERM INVESTMENTS — 0.7%State Street Institutional Liquid
Reserves Fund, Premier Class2.03% (f) (g) . . . . . . . . . . . . . 27,118 27,121
State Street Navigator SecuritiesLending Portfolio III (h) (i) . . . . 458,521 458,521
TOTAL SHORT-TERM INVESTMENTS(Cost $485,642) . . . . . . . . . . . . . . . . . . . . . . . 485,642
TOTAL INVESTMENTS — 98.8%(Cost $72,202,747) . . . . . . . . . . . . . . . . . . . . . 70,849,177
OTHER ASSETS IN EXCESS OF LIABILITIES— 1.2% . . . . . . . . . . . . . . . . . . . . . . . . . . . 871,322
NET ASSETS — 100.0% . . . . . . . . . . . . . . . . . $ 71,720,499
(a) Amount is less than 0.05% of net assets.(b) Non-income producing security.(c) Securities purchased pursuant to Rule 144A of the Securities Act
of 1933, as amended. These securities, which represent 0.6% ofnet assets as of September 30, 2019, are considered liquid andmay be resold in transactions exempt from registration, normallyto qualified institutional buyers.
(d) All or a portion of the shares of the security are on loan atSeptember 30, 2019.
(e) Fair valued as determined in good faith by the Trust’s OversightCommittee in accordance with policy and procedures approved bythe Board of Trustees. Security value is determined based onLevel 3 inputs. As of September 30, 2019, total aggregate fairvalue of these securities is $102, representing less than 0.05% ofthe Fund’s net assets.
(f) The Fund invested in certain money market funds managed bySSGA Funds Management, Inc. Amounts related to thesetransactions during the period ended September 30, 2019 areshown in the Affiliate Table below.
(g) The rate shown is the annualized seven-day yield at September 30,2019.
(h) The Fund invested in an affiliated entity. Amounts related to thesetransactions during the period ended September 30, 2019 areshown in the Affiliate Table below.
(i) Investment of cash collateral for securities loaned.
ADR American Depositary ReceiptGDR Global Depositary ReceiptNVDR Non Voting Depositary ReceiptREIT Real Estate Investment Trust
INR Indian Rupee
SPDR MSCI EMERGING MARKETS FOSSIL FUEL RESERVES FREE ETFSCHEDULE OF INVESTMENTS (continued)September 30, 2019
See accompanying notes to financial statements.84
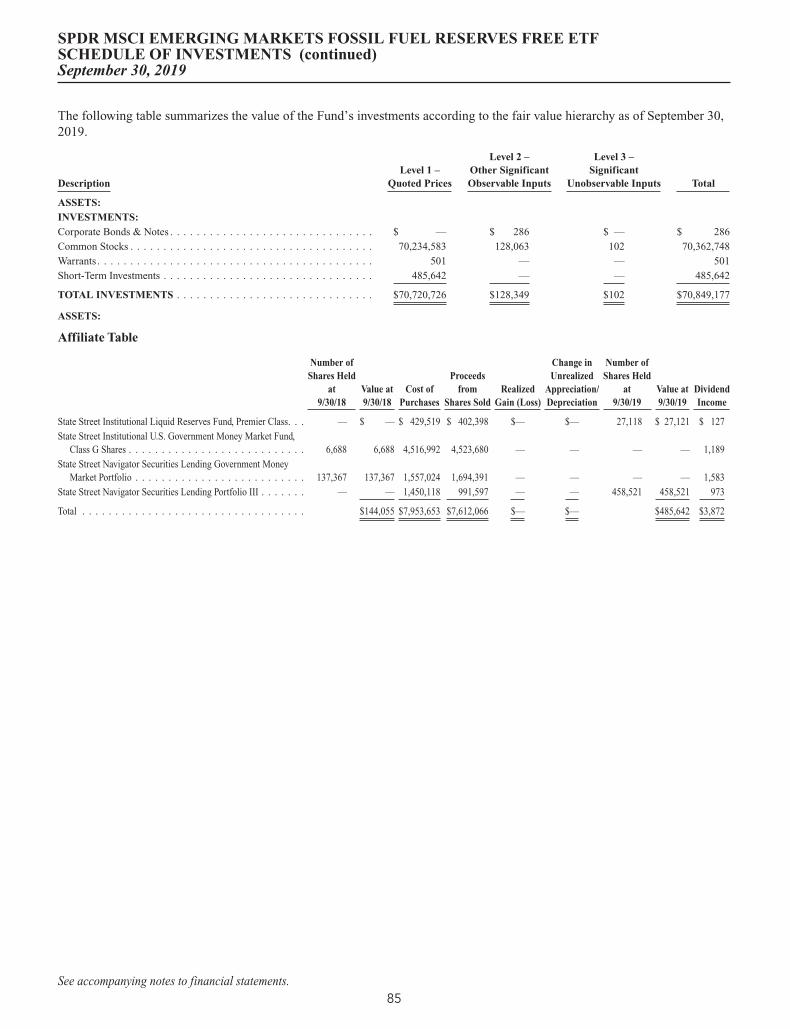
The following table summarizes the value of the Fund’s investments according to the fair value hierarchy as of September 30,2019.
DescriptionLevel 1 –
Quoted Prices
Level 2 –Other SignificantObservable Inputs
Level 3 –Significant
Unobservable Inputs Total
ASSETS:INVESTMENTS:Corporate Bonds & Notes . . . . . . . . . . . . . . . . . . . . . . . . . . . . . . . $ — $ 286 $ — $ 286
Common Stocks . . . . . . . . . . . . . . . . . . . . . . . . . . . . . . . . . . . . . 70,234,583 128,063 102 70,362,748
Warrants . . . . . . . . . . . . . . . . . . . . . . . . . . . . . . . . . . . . . . . . . . 501 — — 501
Short-Term Investments . . . . . . . . . . . . . . . . . . . . . . . . . . . . . . . . 485,642 — — 485,642
TOTAL INVESTMENTS . . . . . . . . . . . . . . . . . . . . . . . . . . . . . . $70,720,726 $128,349 $102 $70,849,177
ASSETS:
Affiliate Table
Number ofShares Held
at9/30/18
Value at9/30/18
Cost ofPurchases
Proceedsfrom
Shares SoldRealized
Gain (Loss)
Change inUnrealized
Appreciation/Depreciation
Number ofShares Held
at9/30/19
Value at9/30/19
DividendIncome
State Street Institutional Liquid Reserves Fund, Premier Class. . . — $ — $ 429,519 $ 402,398 $— $— 27,118 $ 27,121 $ 127
State Street Institutional U.S. Government Money Market Fund,Class G Shares . . . . . . . . . . . . . . . . . . . . . . . . . . . 6,688 6,688 4,516,992 4,523,680 — — — — 1,189
State Street Navigator Securities Lending Government MoneyMarket Portfolio . . . . . . . . . . . . . . . . . . . . . . . . . . 137,367 137,367 1,557,024 1,694,391 — — — — 1,583
State Street Navigator Securities Lending Portfolio III . . . . . . . — — 1,450,118 991,597 — — 458,521 458,521 973
Total . . . . . . . . . . . . . . . . . . . . . . . . . . . . . . . . . . $144,055 $7,953,653 $7,612,066 $— $— $485,642 $3,872
SPDR MSCI EMERGING MARKETS FOSSIL FUEL RESERVES FREE ETFSCHEDULE OF INVESTMENTS (continued)September 30, 2019
See accompanying notes to financial statements.85

Security Description Shares Value
COMMON STOCKS - 99.2%ARGENTINA – 0.1%Other Securities. . . . . . . . . . . . . . . . $ 343,880
BRAZIL – 5.1%Ambev SA ADR . . . . . . . . . . . . . . . 484,842 2,239,970BB Seguridade Participacoes SA . . . . . 150,314 1,264,104Itausa - Investimentos Itau SA
Preference Shares. . . . . . . . . . . . . 496,656 1,571,500Lojas Renner SA . . . . . . . . . . . . . . . 93,207 1,129,341Other Securities. . . . . . . . . . . . . . . . 7,506,519
13,711,434
CHILE – 1.3%Other Securities. . . . . . . . . . . . . . . . 3,549,207
CHINA – 22.1%Agricultural Bank of China, Ltd.
Class H . . . . . . . . . . . . . . . . . . . 2,803,000 1,097,687Alibaba Group Holding, Ltd. ADR (a) . 10,837 1,812,272ANTA Sports Products, Ltd. . . . . . . . . 172,000 1,422,838Bank of China, Ltd. Class H . . . . . . . . 5,688,071 2,234,770China Common Rich Renewable
Energy Investment, Ltd. (a)(b). . . . . 598,000 —China Construction Bank Corp.
Class H . . . . . . . . . . . . . . . . . . . 4,041,394 3,082,830China Huishan Dairy Holdings Co.,
Ltd. (a)(b) . . . . . . . . . . . . . . . . . 1,072,393 —China Petroleum & Chemical Corp.
Class H . . . . . . . . . . . . . . . . . . . 1,962,395 1,166,513Geely Automobile Holdings, Ltd. . . . . 721,000 1,223,219Industrial & Commercial Bank of
China, Ltd. Class H . . . . . . . . . . . 3,208,448 2,148,679Shenzhou International Group
Holdings, Ltd. . . . . . . . . . . . . . . . 127,300 1,662,821Sunny Optical Technology Group Co.,
Ltd. . . . . . . . . . . . . . . . . . . . . . 73,193 1,075,571Tencent Holdings, Ltd. . . . . . . . . . . . 122,278 5,150,419Other Securities. . . . . . . . . . . . . . . . 37,360,852
59,438,471
COLOMBIA – 0.2%Other Securities. . . . . . . . . . . . . . . . 467,685
CZECH REPUBLIC – 0.2%Other Securities. . . . . . . . . . . . . . . . 539,216
EGYPT – 0.5%Commercial International Bank Egypt
SAE GDR . . . . . . . . . . . . . . . . . 275,033 1,266,527Other Securities. . . . . . . . . . . . . . . . 201,783
1,468,310
GREECE – 0.3%FF Group (a)(b). . . . . . . . . . . . . . . . 491 257Other Securities. . . . . . . . . . . . . . . . 922,966
923,223
HONG KONG – 2.1%China Ding Yi Feng Holdings, Ltd. (b) . 64,000 816China Mobile, Ltd.. . . . . . . . . . . . . . 275,497 2,278,999
Security Description Shares Value
Guangdong Investment, Ltd.. . . . . . . . 700,000 $ 1,369,748Other Securities. . . . . . . . . . . . . . . . 1,950,902
5,600,465
HUNGARY – 0.4%Other Securities. . . . . . . . . . . . . . . . 1,073,229
INDIA – 12.5% (c)Asian Paints, Ltd. . . . . . . . . . . . . . . 62,554 1,555,403HCL Technologies, Ltd.. . . . . . . . . . . 96,414 1,470,110Hindustan Unilever, Ltd. . . . . . . . . . . 105,951 2,963,075Infosys, Ltd. ADR . . . . . . . . . . . . . . 296,752 3,374,070Infosys, Ltd. . . . . . . . . . . . . . . . . . . 187,458 2,131,058ITC, Ltd. . . . . . . . . . . . . . . . . . . . . 389,890 1,429,584Tata Consultancy Services, Ltd.. . . . . . 140,102 4,150,150Other Securities. . . . . . . . . . . . . . . . 16,459,119
33,532,569
INDONESIA – 3.7%Bank Central Asia Tbk PT . . . . . . . . . 1,665,825 3,561,662Telekomunikasi Indonesia Persero Tbk
PT . . . . . . . . . . . . . . . . . . . . . . 7,043,175 2,138,505Unilever Indonesia Tbk PT. . . . . . . . . 358,100 1,173,064Other Securities. . . . . . . . . . . . . . . . 3,142,820
10,016,051
LUXEMBOURG – 0.1%Other Security. . . . . . . . . . . . . . . . . 138,314
MALAYSIA – 3.1%Malayan Banking Bhd . . . . . . . . . . . 553,230 1,124,430Public Bank Bhd . . . . . . . . . . . . . . . 262,311 1,257,990Other Securities. . . . . . . . . . . . . . . . 6,022,453
8,404,873
MEXICO – 2.0%Wal-Mart de Mexico SAB de CV . . . . 755,395 2,237,414Other Securities. . . . . . . . . . . . . . . . 3,090,794
5,328,208
PAKISTAN – 0.0% (c)Other Securities. . . . . . . . . . . . . . . . 119,652
PERU – 0.6%Credicorp, Ltd. . . . . . . . . . . . . . . . . 5,447 1,135,373Other Securities. . . . . . . . . . . . . . . . 393,413
1,528,786
PHILIPPINES – 1.4%Other Securities. . . . . . . . . . . . . . . . 3,787,000
POLAND – 0.6%Other Securities. . . . . . . . . . . . . . . . 1,529,650
QATAR – 1.3%Other Securities. . . . . . . . . . . . . . . . 3,407,548
ROMANIA – 0.0% (c)Other Security. . . . . . . . . . . . . . . . . 39,194
RUSSIA – 3.3%Gazprom PJSC ADR . . . . . . . . . . . . 246,166 1,699,530Tatneft PJSC ADR (d). . . . . . . . . . . . 31,916 2,026,666
SPDR MSCI EMERGING MARKETS STRATEGICFACTORS ETFSUMMARY SCHEDULE OF INVESTMENTSSeptember 30, 2019
See accompanying notes to financial statements.86

Security Description Shares Value
Other Securities. . . . . . . . . . . . . . . . $ 5,099,942
8,826,138
SAUDI ARABIA – 2.2%Al Rajhi Bank. . . . . . . . . . . . . . . . . 82,815 1,397,470Other Securities. . . . . . . . . . . . . . . . 4,483,891
5,881,361
SINGAPORE – 0.1%Other Security. . . . . . . . . . . . . . . . . 148,587
SOUTH AFRICA – 3.1%Other Securities. . . . . . . . . . . . . . . . 8,374,889
SOUTH KOREA – 13.5%Samsung Electronics Co., Ltd. GDR
(d) . . . . . . . . . . . . . . . . . . . . . . 3,253 3,311,554Samsung Electronics Co., Ltd.
Preference Shares. . . . . . . . . . . . . 29,135 962,114Samsung Electronics Co., Ltd. . . . . . . 170,022 6,972,018Samsung Electronics Co., Ltd. GDR
(d) . . . . . . . . . . . . . . . . . . . . . . 748 620,092SK Hynix, Inc. . . . . . . . . . . . . . . . . 79,577 5,468,569Other Securities. . . . . . . . . . . . . . . . 19,054,001
36,388,348
TAIWAN – 13.1%Chunghwa Telecom Co., Ltd. . . . . . . . 412,540 1,475,993Far EasTone Telecommunications Co.,
Ltd. . . . . . . . . . . . . . . . . . . . . . 547,449 1,279,313First Financial Holding Co., Ltd. . . . . . 2,119,627 1,489,399Hon Hai Precision Industry Co., Ltd. . . 541,730 1,278,172Largan Precision Co., Ltd. . . . . . . . . . 12,000 1,721,220President Chain Store Corp. . . . . . . . . 131,000 1,224,516Taiwan Cooperative Financial Holding
Co., Ltd. . . . . . . . . . . . . . . . . . . 2,322,104 1,534,372Taiwan Mobile Co., Ltd. . . . . . . . . . . 517,542 1,868,353Taiwan Semiconductor Manufacturing
Co., Ltd. . . . . . . . . . . . . . . . . . . 879,495 7,710,765Other Securities. . . . . . . . . . . . . . . . 15,507,566
35,089,669
THAILAND – 4.2%Advanced Info Service PCL . . . . . . . . 172,400 1,240,085Other Securities. . . . . . . . . . . . . . . . 10,172,614
11,412,699
TURKEY – 0.7%Other Securities. . . . . . . . . . . . . . . . 1,787,759
UNITED ARAB EMIRATES –1.3%
Emirates Telecommunications GroupCo. PJSC . . . . . . . . . . . . . . . . . . 333,925 1,500,010
First Abu Dhabi Bank PJSC . . . . . . . . 293,875 1,203,294Other Securities. . . . . . . . . . . . . . . . 875,456
3,578,760
Security Description Shares Value
UNITED STATES – 0.1%Other Security. . . . . . . . . . . . . . . . . $ 230,488
TOTAL COMMON STOCKS(Cost $254,820,585) . . . . . . . . . 266,665,663
CORPORATE BONDS & NOTES- 0.0% (c)
INDIA – 0.0% (c)Other Security (cost: $6,463) . . . . . . . 6,514
WARRANTS — 0.0% (c)THAILAND – 0.0% (c)Other Securities
(cost: $0) . . . . . . . . . . . . . . . . . . 649
RIGHTS — 0.0% (c)CHINA – 0.0% (c)Legend Holdings Corp. Class H,
(expiring 5/19/23)(a)(b) . . . . . . . . . 1,461 —Other Securities. . . . . . . . . . . . . . . .
THAILAND – 0.0% (c)Other Securities. . . . . . . . . . . . . . . . 1,202
SHORT-TERM INVESTMENTS -0.9%
State Street Institutional LiquidReserves Fund, Premier Class 2.03%(e)(f) . . . . . . . . . . . . . . . . . . . . . 437,290 437,334
State Street Navigator SecuritiesLending Portfolio III (g)(h). . . . . . . 1,941,419 1,941,419
TOTAL SHORT-TERMINVESTMENTS(Cost $2,378,758) . . . . . . . . . . . 2,378,753
TOTAL INVESTMENTS - 100.1%(Cost $257,205,806) . . . . . . . . . 269,052,781
LIABILITIES IN EXCESS OFOTHER ASSETS - (0.1)% . . . . (186,272)
NET ASSETS - 100.0% . . . . . . . . $ 268,866,509
SPDR MSCI EMERGING MARKETS STRATEGICFACTORS ETFSUMMARY SCHEDULE OF INVESTMENTS (continued)September 30, 2019
See accompanying notes to financial statements.87

The Summary Schedule of Investments does not reflect the completeportfolio holdings. It includes the Fund’s 50 largest holdings and eachinvestment of any issuer that exceeds 1% of the Fund’s net assets. “OtherSecurities” represent all issues not required to be disclosed under therules adopted by the U.S. Securities and Exchange Commission(“SEC”). In certain instances, securities for which footnotes listed belowmay otherwise apply are included in the Other Securities caption. Thecomplete schedule of portfolio holdings is available on the Fund’swebsite at www.spdrs.com, without charge, upon request by calling1-866-787-2257 (toll-free) and on the SEC’s website at www.sec.gov.
(a) Non-income producing security.(b) Fair valued as determined in good faith by the Trust’s Oversight
Committee in accordance with policy and procedures approvedby the Board of Trustees. Security value is determined based onLevel 3 inputs. As of September 30, 2019, total aggregate fairvalue of these securities is $1,073, representing less than 0.05%of the Fund’s net assets.
(c) Amount is less than 0.05% of net assets.(d) Reflects separate holdings of the issuer’s common stock traded
on different securities exchanges.(e) The Fund invested in certain money market funds managed by
SSGA Funds Management, Inc. Amounts related to thesetransactions during the period ended September 30, 2019 areshown in the Affiliate Table below.
(f) The rate shown is the annualized seven-day yield atSeptember 30, 2019.
(g) The Fund invested in an affiliated entity. Amounts related tothese transactions during the period ended September 30, 2019are shown in the Affiliate Table below.
(h) Investment of cash collateral for securities loaned.ADR American Depositary ReceiptGDR Global Depositary Receipt
The following table summarizes the value of the Fund’s investments according to the fair value hierarchy as of September 30,2019.
DescriptionLevel 1 –
Quoted Prices
Level 2 –Other SignificantObservable Inputs
Level 3 –Significant
Unobservable Inputs Total
ASSETS:INVESTMENTS:Corporate Bonds & Notes . . . . . . . . . . . . . . . . . . . . . . . . . . . . . . $ — $ 6,514 $ — $ 6,514
Common Stocks . . . . . . . . . . . . . . . . . . . . . . . . . . . . . . . . . . . . 257,305,622 9,358,968 1,073(a) 266,665,663
Rights . . . . . . . . . . . . . . . . . . . . . . . . . . . . . . . . . . . . . . . . . . — 1,202 — 1,202
Warrants . . . . . . . . . . . . . . . . . . . . . . . . . . . . . . . . . . . . . . . . . 649 — — 649
Short-Term Investments . . . . . . . . . . . . . . . . . . . . . . . . . . . . . . . 2,378,753 — — 2,378,753
TOTAL INVESTMENTS . . . . . . . . . . . . . . . . . . . . . . . . . . . . . $259,685,024 $9,366,684 $1,073 $269,052,781
(a) Fund held Level 3 securities that were valued at $0 at September 30, 2019.
SPDR MSCI EMERGING MARKETS STRATEGICFACTORS ETFSUMMARY SCHEDULE OF INVESTMENTS (continued)September 30, 2019
See accompanying notes to financial statements.88

Affiliate Table
Number ofShares Held
at9/30/18
Value at9/30/18
Cost ofPurchases
Proceedsfrom
Shares SoldRealized
Gain (Loss)
Change inUnrealized
Appreciation/Depreciation
Number ofShares Held
at9/30/19
Value at9/30/19
DividendIncome
State Street Institutional Liquid Reserves Fund, PremierClass. . . . . . . . . . . . . . . . . . . . . . . . . . . . . . — $ — $ 2,626,121 $ 2,188,705 $(77) $ (5) 437,290 $ 437,334 $ 1,987
State Street Institutional U.S. Government Money MarketFund, Class G Shares. . . . . . . . . . . . . . . . . . . . . 325,185 325,185 14,441,865 14,767,050 — — — — 9,094
State Street Navigator Securities Lending GovernmentMoney Market Portfolio . . . . . . . . . . . . . . . . . . . 2,508,511 2,508,511 13,445,008 15,953,519 — — — — 23,360
State Street Navigator Securities Lending Portfolio III . . . . — — 16,258,321 14,316,902 — — 1,941,419 1,941,419 13,282
Total. . . . . . . . . . . . . . . . . . . . . . . . . . . . . . . . $2,833,696 $46,771,315 $47,226,176 $(77) $ (5) $2,378,753 $47,723
SPDR MSCI EMERGING MARKETS STRATEGICFACTORS ETFSUMMARY SCHEDULE OF INVESTMENTS (continued)September 30, 2019
See accompanying notes to financial statements.89
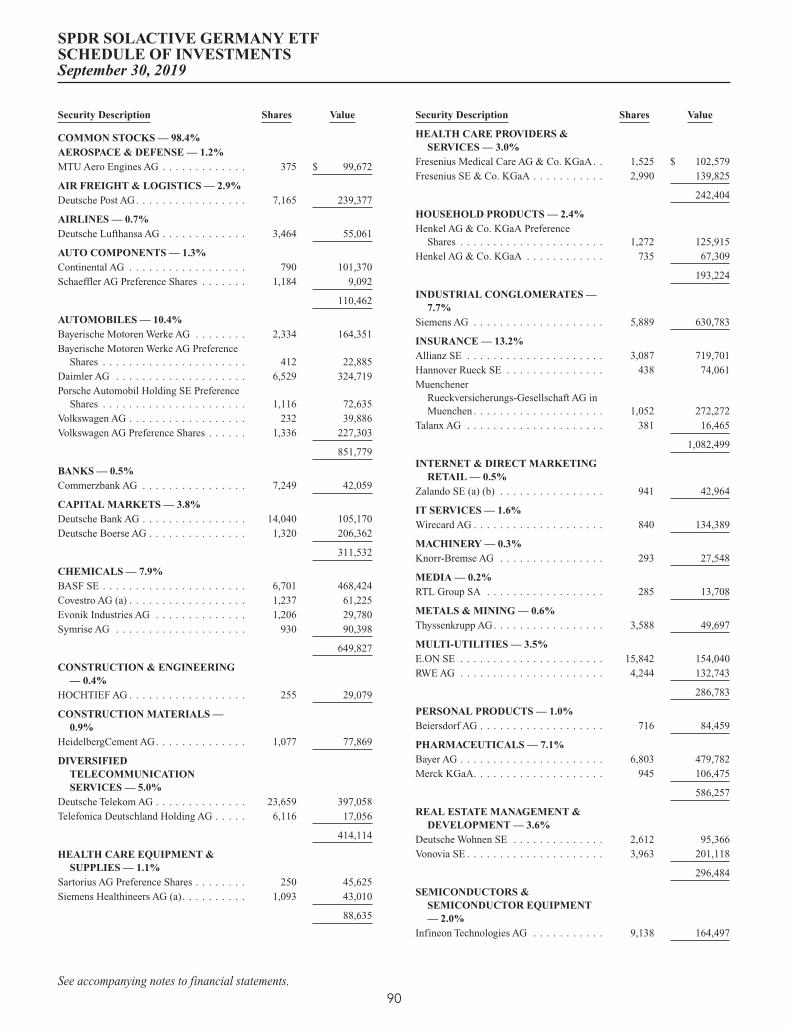
Security Description Shares Value
COMMON STOCKS — 98.4%AEROSPACE & DEFENSE — 1.2%MTU Aero Engines AG . . . . . . . . . . . . . 375 $ 99,672
AIR FREIGHT & LOGISTICS — 2.9%Deutsche Post AG. . . . . . . . . . . . . . . . . 7,165 239,377
AIRLINES — 0.7%Deutsche Lufthansa AG . . . . . . . . . . . . . 3,464 55,061
AUTO COMPONENTS — 1.3%Continental AG . . . . . . . . . . . . . . . . . . 790 101,370Schaeffler AG Preference Shares . . . . . . . 1,184 9,092
110,462
AUTOMOBILES — 10.4%Bayerische Motoren Werke AG . . . . . . . . 2,334 164,351Bayerische Motoren Werke AG Preference
Shares . . . . . . . . . . . . . . . . . . . . . . 412 22,885Daimler AG . . . . . . . . . . . . . . . . . . . . 6,529 324,719Porsche Automobil Holding SE Preference
Shares . . . . . . . . . . . . . . . . . . . . . . 1,116 72,635Volkswagen AG . . . . . . . . . . . . . . . . . . 232 39,886Volkswagen AG Preference Shares . . . . . . 1,336 227,303
851,779
BANKS — 0.5%Commerzbank AG . . . . . . . . . . . . . . . . 7,249 42,059
CAPITAL MARKETS — 3.8%Deutsche Bank AG . . . . . . . . . . . . . . . . 14,040 105,170Deutsche Boerse AG . . . . . . . . . . . . . . . 1,320 206,362
311,532
CHEMICALS — 7.9%BASF SE . . . . . . . . . . . . . . . . . . . . . . 6,701 468,424Covestro AG (a) . . . . . . . . . . . . . . . . . . 1,237 61,225Evonik Industries AG . . . . . . . . . . . . . . 1,206 29,780Symrise AG . . . . . . . . . . . . . . . . . . . . 930 90,398
649,827
CONSTRUCTION & ENGINEERING— 0.4%
HOCHTIEF AG . . . . . . . . . . . . . . . . . . 255 29,079
CONSTRUCTION MATERIALS —0.9%
HeidelbergCement AG. . . . . . . . . . . . . . 1,077 77,869
DIVERSIFIEDTELECOMMUNICATIONSERVICES — 5.0%
Deutsche Telekom AG . . . . . . . . . . . . . . 23,659 397,058Telefonica Deutschland Holding AG . . . . . 6,116 17,056
414,114
HEALTH CARE EQUIPMENT &SUPPLIES — 1.1%
Sartorius AG Preference Shares . . . . . . . . 250 45,625Siemens Healthineers AG (a). . . . . . . . . . 1,093 43,010
88,635
Security Description Shares Value
HEALTH CARE PROVIDERS &SERVICES — 3.0%
Fresenius Medical Care AG & Co. KGaA. . 1,525 $ 102,579Fresenius SE & Co. KGaA . . . . . . . . . . . 2,990 139,825
242,404
HOUSEHOLD PRODUCTS — 2.4%Henkel AG & Co. KGaA Preference
Shares . . . . . . . . . . . . . . . . . . . . . . 1,272 125,915Henkel AG & Co. KGaA . . . . . . . . . . . . 735 67,309
193,224
INDUSTRIAL CONGLOMERATES —7.7%
Siemens AG . . . . . . . . . . . . . . . . . . . . 5,889 630,783
INSURANCE — 13.2%Allianz SE . . . . . . . . . . . . . . . . . . . . . 3,087 719,701Hannover Rueck SE . . . . . . . . . . . . . . . 438 74,061Muenchener
Rueckversicherungs-Gesellschaft AG inMuenchen . . . . . . . . . . . . . . . . . . . . 1,052 272,272
Talanx AG . . . . . . . . . . . . . . . . . . . . . 381 16,465
1,082,499
INTERNET & DIRECT MARKETINGRETAIL — 0.5%
Zalando SE (a) (b) . . . . . . . . . . . . . . . . 941 42,964
IT SERVICES — 1.6%Wirecard AG . . . . . . . . . . . . . . . . . . . . 840 134,389
MACHINERY — 0.3%Knorr-Bremse AG . . . . . . . . . . . . . . . . 293 27,548
MEDIA — 0.2%RTL Group SA . . . . . . . . . . . . . . . . . . 285 13,708
METALS & MINING — 0.6%Thyssenkrupp AG. . . . . . . . . . . . . . . . . 3,588 49,697
MULTI-UTILITIES — 3.5%E.ON SE . . . . . . . . . . . . . . . . . . . . . . 15,842 154,040RWE AG . . . . . . . . . . . . . . . . . . . . . . 4,244 132,743
286,783
PERSONAL PRODUCTS — 1.0%Beiersdorf AG . . . . . . . . . . . . . . . . . . . 716 84,459
PHARMACEUTICALS — 7.1%Bayer AG . . . . . . . . . . . . . . . . . . . . . . 6,803 479,782Merck KGaA. . . . . . . . . . . . . . . . . . . . 945 106,475
586,257
REAL ESTATE MANAGEMENT &DEVELOPMENT — 3.6%
Deutsche Wohnen SE . . . . . . . . . . . . . . 2,612 95,366Vonovia SE . . . . . . . . . . . . . . . . . . . . . 3,963 201,118
296,484
SEMICONDUCTORS &SEMICONDUCTOR EQUIPMENT— 2.0%
Infineon Technologies AG . . . . . . . . . . . 9,138 164,497
SPDR SOLACTIVE GERMANY ETFSCHEDULE OF INVESTMENTSSeptember 30, 2019
See accompanying notes to financial statements.90
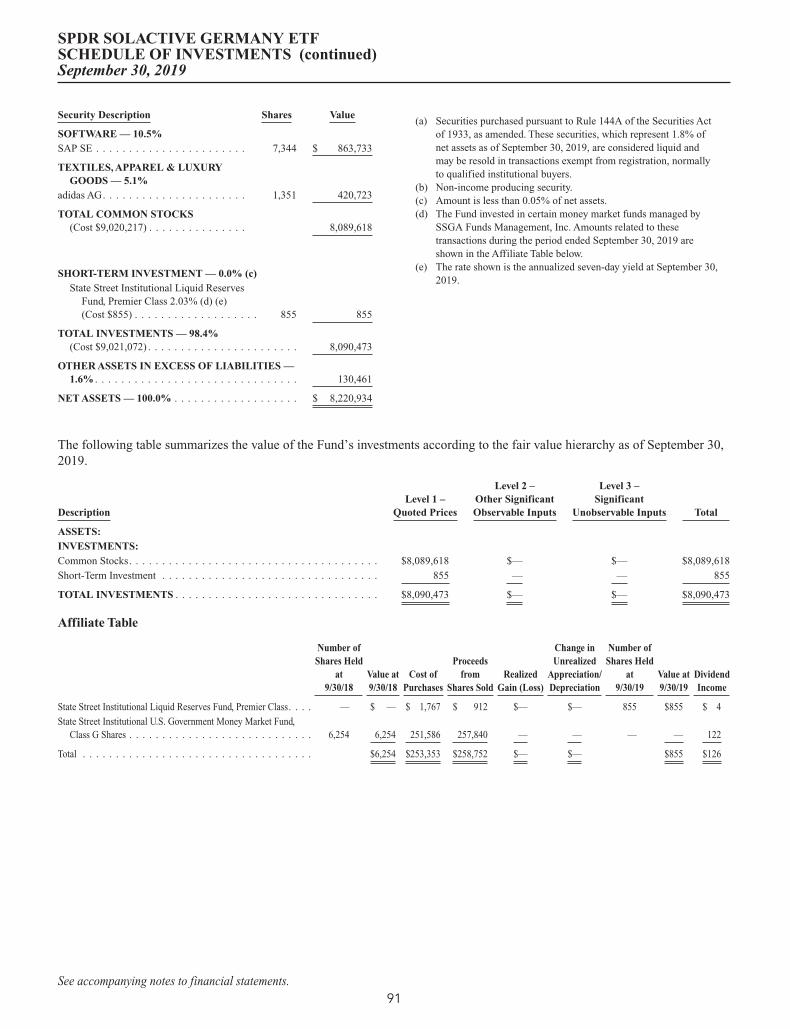
Security Description Shares Value
SOFTWARE — 10.5%SAP SE . . . . . . . . . . . . . . . . . . . . . . . 7,344 $ 863,733
TEXTILES, APPAREL & LUXURYGOODS — 5.1%
adidas AG. . . . . . . . . . . . . . . . . . . . . . 1,351 420,723
TOTAL COMMON STOCKS(Cost $9,020,217) . . . . . . . . . . . . . . . 8,089,618
SHORT-TERM INVESTMENT — 0.0% (c)State Street Institutional Liquid Reserves
Fund, Premier Class 2.03% (d) (e)(Cost $855) . . . . . . . . . . . . . . . . . . . 855 855
TOTAL INVESTMENTS — 98.4%(Cost $9,021,072) . . . . . . . . . . . . . . . . . . . . . . . 8,090,473
OTHER ASSETS IN EXCESS OF LIABILITIES —1.6% . . . . . . . . . . . . . . . . . . . . . . . . . . . . . . . 130,461
NET ASSETS — 100.0% . . . . . . . . . . . . . . . . . . . $ 8,220,934
(a) Securities purchased pursuant to Rule 144A of the Securities Actof 1933, as amended. These securities, which represent 1.8% ofnet assets as of September 30, 2019, are considered liquid andmay be resold in transactions exempt from registration, normallyto qualified institutional buyers.
(b) Non-income producing security.(c) Amount is less than 0.05% of net assets.(d) The Fund invested in certain money market funds managed by
SSGA Funds Management, Inc. Amounts related to thesetransactions during the period ended September 30, 2019 areshown in the Affiliate Table below.
(e) The rate shown is the annualized seven-day yield at September 30,2019.
The following table summarizes the value of the Fund’s investments according to the fair value hierarchy as of September 30,2019.
DescriptionLevel 1 –
Quoted Prices
Level 2 –Other SignificantObservable Inputs
Level 3 –Significant
Unobservable Inputs Total
ASSETS:INVESTMENTS:Common Stocks. . . . . . . . . . . . . . . . . . . . . . . . . . . . . . . . . . . . . . $8,089,618 $— $— $8,089,618
Short-Term Investment . . . . . . . . . . . . . . . . . . . . . . . . . . . . . . . . . 855 — — 855
TOTAL INVESTMENTS . . . . . . . . . . . . . . . . . . . . . . . . . . . . . . . $8,090,473 $— $— $8,090,473
Affiliate Table
Number ofShares Held
at9/30/18
Value at9/30/18
Cost ofPurchases
Proceedsfrom
Shares SoldRealized
Gain (Loss)
Change inUnrealized
Appreciation/Depreciation
Number ofShares Held
at9/30/19
Value at9/30/19
DividendIncome
State Street Institutional Liquid Reserves Fund, Premier Class. . . . — $ — $ 1,767 $ 912 $— $— 855 $855 $ 4
State Street Institutional U.S. Government Money Market Fund,Class G Shares . . . . . . . . . . . . . . . . . . . . . . . . . . . . 6,254 6,254 251,586 257,840 — — — — 122
Total . . . . . . . . . . . . . . . . . . . . . . . . . . . . . . . . . . . $6,254 $253,353 $258,752 $— $— $855 $126
SPDR SOLACTIVE GERMANY ETFSCHEDULE OF INVESTMENTS (continued)September 30, 2019
See accompanying notes to financial statements.91
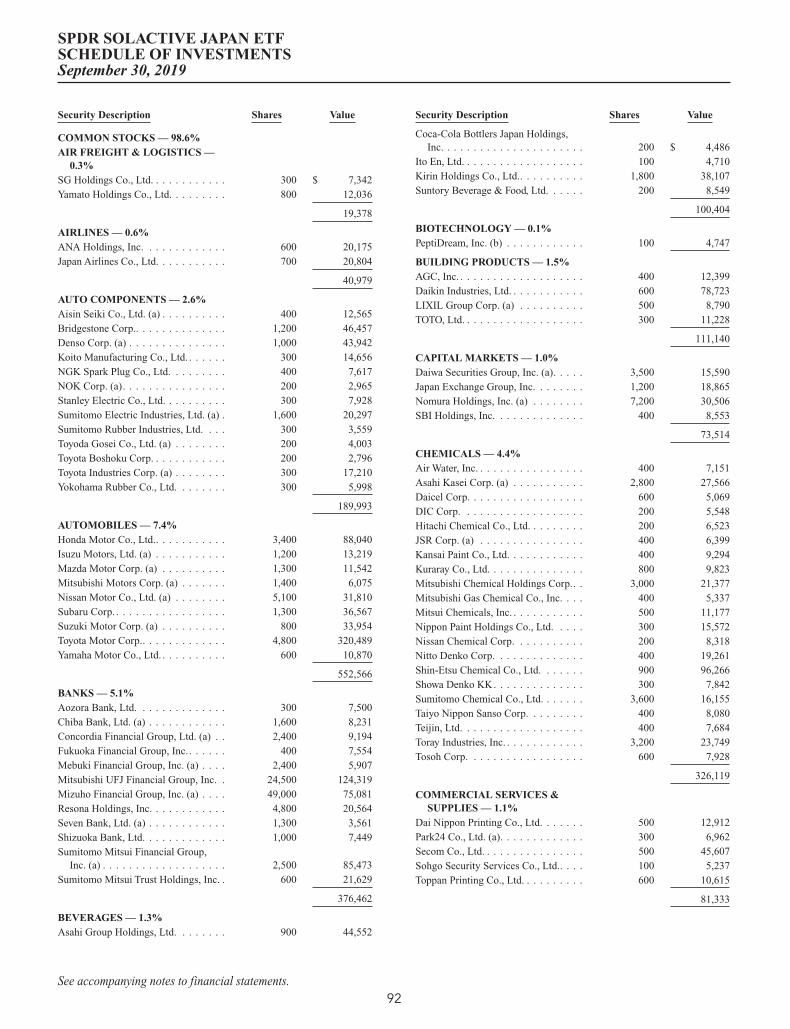
Security Description Shares Value
COMMON STOCKS — 98.6%AIR FREIGHT & LOGISTICS —
0.3%SG Holdings Co., Ltd. . . . . . . . . . . . 300 $ 7,342Yamato Holdings Co., Ltd. . . . . . . . . 800 12,036
19,378
AIRLINES — 0.6%ANA Holdings, Inc. . . . . . . . . . . . . 600 20,175Japan Airlines Co., Ltd. . . . . . . . . . . 700 20,804
40,979
AUTO COMPONENTS — 2.6%Aisin Seiki Co., Ltd. (a) . . . . . . . . . . 400 12,565Bridgestone Corp.. . . . . . . . . . . . . . 1,200 46,457Denso Corp. (a) . . . . . . . . . . . . . . . 1,000 43,942Koito Manufacturing Co., Ltd. . . . . . . 300 14,656NGK Spark Plug Co., Ltd. . . . . . . . . 400 7,617NOK Corp. (a). . . . . . . . . . . . . . . . 200 2,965Stanley Electric Co., Ltd. . . . . . . . . . 300 7,928Sumitomo Electric Industries, Ltd. (a) . 1,600 20,297Sumitomo Rubber Industries, Ltd. . . . 300 3,559Toyoda Gosei Co., Ltd. (a) . . . . . . . . 200 4,003Toyota Boshoku Corp. . . . . . . . . . . . 200 2,796Toyota Industries Corp. (a) . . . . . . . . 300 17,210Yokohama Rubber Co., Ltd. . . . . . . . 300 5,998
189,993
AUTOMOBILES — 7.4%Honda Motor Co., Ltd.. . . . . . . . . . . 3,400 88,040Isuzu Motors, Ltd. (a) . . . . . . . . . . . 1,200 13,219Mazda Motor Corp. (a) . . . . . . . . . . 1,300 11,542Mitsubishi Motors Corp. (a) . . . . . . . 1,400 6,075Nissan Motor Co., Ltd. (a) . . . . . . . . 5,100 31,810Subaru Corp. . . . . . . . . . . . . . . . . . 1,300 36,567Suzuki Motor Corp. (a) . . . . . . . . . . 800 33,954Toyota Motor Corp.. . . . . . . . . . . . . 4,800 320,489Yamaha Motor Co., Ltd. . . . . . . . . . . 600 10,870
552,566
BANKS — 5.1%Aozora Bank, Ltd. . . . . . . . . . . . . . 300 7,500Chiba Bank, Ltd. (a) . . . . . . . . . . . . 1,600 8,231Concordia Financial Group, Ltd. (a) . . 2,400 9,194Fukuoka Financial Group, Inc.. . . . . . 400 7,554Mebuki Financial Group, Inc. (a) . . . . 2,400 5,907Mitsubishi UFJ Financial Group, Inc. . 24,500 124,319Mizuho Financial Group, Inc. (a) . . . . 49,000 75,081Resona Holdings, Inc. . . . . . . . . . . . 4,800 20,564Seven Bank, Ltd. (a) . . . . . . . . . . . . 1,300 3,561Shizuoka Bank, Ltd. . . . . . . . . . . . . 1,000 7,449Sumitomo Mitsui Financial Group,
Inc. (a) . . . . . . . . . . . . . . . . . . . 2,500 85,473Sumitomo Mitsui Trust Holdings, Inc. . 600 21,629
376,462
BEVERAGES — 1.3%Asahi Group Holdings, Ltd. . . . . . . . 900 44,552
Security Description Shares Value
Coca-Cola Bottlers Japan Holdings,Inc. . . . . . . . . . . . . . . . . . . . . . 200 $ 4,486
Ito En, Ltd. . . . . . . . . . . . . . . . . . . 100 4,710Kirin Holdings Co., Ltd.. . . . . . . . . . 1,800 38,107Suntory Beverage & Food, Ltd. . . . . . 200 8,549
100,404
BIOTECHNOLOGY — 0.1%PeptiDream, Inc. (b) . . . . . . . . . . . . 100 4,747
BUILDING PRODUCTS — 1.5%AGC, Inc. . . . . . . . . . . . . . . . . . . . 400 12,399Daikin Industries, Ltd. . . . . . . . . . . . 600 78,723LIXIL Group Corp. (a) . . . . . . . . . . 500 8,790TOTO, Ltd. . . . . . . . . . . . . . . . . . . 300 11,228
111,140
CAPITAL MARKETS — 1.0%Daiwa Securities Group, Inc. (a). . . . . 3,500 15,590Japan Exchange Group, Inc. . . . . . . . 1,200 18,865Nomura Holdings, Inc. (a) . . . . . . . . 7,200 30,506SBI Holdings, Inc. . . . . . . . . . . . . . 400 8,553
73,514
CHEMICALS — 4.4%Air Water, Inc. . . . . . . . . . . . . . . . . 400 7,151Asahi Kasei Corp. (a) . . . . . . . . . . . 2,800 27,566Daicel Corp. . . . . . . . . . . . . . . . . . 600 5,069DIC Corp. . . . . . . . . . . . . . . . . . . 200 5,548Hitachi Chemical Co., Ltd. . . . . . . . . 200 6,523JSR Corp. (a) . . . . . . . . . . . . . . . . 400 6,399Kansai Paint Co., Ltd. . . . . . . . . . . . 400 9,294Kuraray Co., Ltd. . . . . . . . . . . . . . . 800 9,823Mitsubishi Chemical Holdings Corp.. . 3,000 21,377Mitsubishi Gas Chemical Co., Inc. . . . 400 5,337Mitsui Chemicals, Inc. . . . . . . . . . . . 500 11,177Nippon Paint Holdings Co., Ltd. . . . . 300 15,572Nissan Chemical Corp. . . . . . . . . . . 200 8,318Nitto Denko Corp. . . . . . . . . . . . . . 400 19,261Shin-Etsu Chemical Co., Ltd. . . . . . . 900 96,266Showa Denko KK. . . . . . . . . . . . . . 300 7,842Sumitomo Chemical Co., Ltd. . . . . . . 3,600 16,155Taiyo Nippon Sanso Corp. . . . . . . . . 400 8,080Teijin, Ltd. . . . . . . . . . . . . . . . . . . 400 7,684Toray Industries, Inc. . . . . . . . . . . . . 3,200 23,749Tosoh Corp. . . . . . . . . . . . . . . . . . 600 7,928
326,119
COMMERCIAL SERVICES &SUPPLIES — 1.1%
Dai Nippon Printing Co., Ltd. . . . . . . 500 12,912Park24 Co., Ltd. (a). . . . . . . . . . . . . 300 6,962Secom Co., Ltd. . . . . . . . . . . . . . . . 500 45,607Sohgo Security Services Co., Ltd.. . . . 100 5,237Toppan Printing Co., Ltd. . . . . . . . . . 600 10,615
81,333
SPDR SOLACTIVE JAPAN ETFSCHEDULE OF INVESTMENTSSeptember 30, 2019
See accompanying notes to financial statements.92

Security Description Shares Value
CONSTRUCTION &ENGINEERING — 0.8%
JGC Corp. . . . . . . . . . . . . . . . . . . 500 $ 6,537Kajima Corp.. . . . . . . . . . . . . . . . . 1,000 13,111Obayashi Corp. . . . . . . . . . . . . . . . 1,400 13,939Shimizu Corp. (a) . . . . . . . . . . . . . . 1,300 11,764Taisei Corp. . . . . . . . . . . . . . . . . . 400 15,489
60,840
CONSTRUCTION MATERIALS —0.1%
Taiheiyo Cement Corp. . . . . . . . . . . 400 10,700
CONSUMER FINANCE — 0.2%Acom Co., Ltd. (a) . . . . . . . . . . . . . 700 2,746AEON Financial Service Co., Ltd. (a) . 300 4,514Credit Saison Co., Ltd.. . . . . . . . . . . 400 5,363
12,623
CONTAINERS & PACKAGING —0.1%
Toyo Seikan Group Holdings, Ltd. . . . 400 6,203
DIVERSIFIED CONSUMERSERVICES — 0.1%
Benesse Holdings, Inc.. . . . . . . . . . . 200 5,193
DIVERSIFIED FINANCIALSERVICES — 0.7%
Mitsubishi UFJ Lease & Finance Co.,Ltd. (a) . . . . . . . . . . . . . . . . . . . 1,100 6,351
ORIX Corp. . . . . . . . . . . . . . . . . . 2,700 40,247Tokyo Century Corp. . . . . . . . . . . . . 100 4,622
51,220
DIVERSIFIEDTELECOMMUNICATIONSERVICES — 1.5%
Nippon Telegraph & Telephone Corp. . 2,400 114,498
ELECTRIC UTILITIES — 1.1%Chubu Electric Power Co., Inc. (a) . . . 1,500 21,721Chugoku Electric Power Co., Inc. (a) . . 700 8,996Kansai Electric Power Co., Inc. (a) . . . 1,600 17,891Kyushu Electric Power Co., Inc. (a). . . 900 8,494Tohoku Electric Power Co., Inc. . . . . . 1,100 10,728Tokyo Electric Power Co. Holdings,
Inc. (a) (b). . . . . . . . . . . . . . . . . 3,100 15,174
83,004
ELECTRICAL EQUIPMENT —1.8%
Fuji Electric Co., Ltd. . . . . . . . . . . . 200 6,116Mabuchi Motor Co., Ltd. . . . . . . . . . 100 3,724Mitsubishi Electric Corp. (a) . . . . . . . 4,200 55,670Nidec Corp. (a) . . . . . . . . . . . . . . . 500 67,176
132,686
ELECTRONIC EQUIPMENT,INSTRUMENTS &COMPONENTS — 5.8%
Alps Alpine Co., Ltd.. . . . . . . . . . . . 400 7,465
Security Description Shares Value
Hamamatsu Photonics KK . . . . . . . . 300 $ 11,131Hirose Electric Co., Ltd.. . . . . . . . . . 105 12,863Hitachi High-Technologies Corp. . . . . 200 11,547Hitachi, Ltd. . . . . . . . . . . . . . . . . . 2,000 74,448Keyence Corp. . . . . . . . . . . . . . . . . 200 123,803Kyocera Corp. . . . . . . . . . . . . . . . . 700 43,428Murata Manufacturing Co., Ltd. . . . . . 1,300 62,369Omron Corp. (a). . . . . . . . . . . . . . . 400 21,874Shimadzu Corp. . . . . . . . . . . . . . . . 600 15,145TDK Corp. (a) . . . . . . . . . . . . . . . . 200 17,895Yaskawa Electric Corp. . . . . . . . . . . 500 18,344Yokogawa Electric Corp. (a) . . . . . . . 600 10,976
431,288
ENTERTAINMENT — 1.7%DeNA Co., Ltd. . . . . . . . . . . . . . . . 300 5,294Konami Holdings Corp. (a) . . . . . . . . 200 9,660Nexon Co., Ltd. (b) . . . . . . . . . . . . . 900 10,917Nintendo Co., Ltd. . . . . . . . . . . . . . 200 74,060Square Enix Holdings Co., Ltd. . . . . . 200 9,715Toho Co., Ltd. (a) . . . . . . . . . . . . . . 300 13,144
122,790
EQUITY REAL ESTATEINVESTMENT TRUSTS(REITS) — 1.0%
Daiwa House REIT Investment Corp. . 3 8,439GLP J-REIT . . . . . . . . . . . . . . . . . 7 9,288Japan Retail Fund Investment Corp.
REIT . . . . . . . . . . . . . . . . . . . . 5 10,576Nippon Prologis REIT, Inc. . . . . . . . . 4 10,959Nomura Real Estate Master Fund, Inc.
REIT . . . . . . . . . . . . . . . . . . . . 8 14,449Orix JREIT, Inc. . . . . . . . . . . . . . . . 5 10,918United Urban Investment Corp. REIT . 5 9,577
74,206
FOOD & STAPLES RETAILING —1.7%
Aeon Co., Ltd. . . . . . . . . . . . . . . . . 1,400 25,655FamilyMart Co., Ltd. (a) . . . . . . . . . 400 9,745Lawson, Inc. . . . . . . . . . . . . . . . . . 100 5,117Matsumotokiyoshi Holdings Co., Ltd. . 100 3,659Seven & i Holdings Co., Ltd.. . . . . . . 1,600 61,172Sundrug Co., Ltd. . . . . . . . . . . . . . . 200 6,292Tsuruha Holdings, Inc. . . . . . . . . . . 100 10,891Welcia Holdings Co., Ltd.. . . . . . . . . 100 5,034
127,565
FOOD PRODUCTS — 1.7%Ajinomoto Co., Inc. . . . . . . . . . . . . 1,100 20,763Calbee, Inc.. . . . . . . . . . . . . . . . . . 100 3,109Ezaki Glico Co., Ltd.. . . . . . . . . . . . 100 4,150Kewpie Corp. . . . . . . . . . . . . . . . . 200 4,669Kikkoman Corp. . . . . . . . . . . . . . . 400 19,098MEIJI Holdings Co., Ltd. (a) . . . . . . . 200 14,582NH Foods, Ltd. . . . . . . . . . . . . . . . 200 8,041Nichirei Corp. . . . . . . . . . . . . . . . . 200 4,560
SPDR SOLACTIVE JAPAN ETFSCHEDULE OF INVESTMENTS (continued)September 30, 2019
See accompanying notes to financial statements.93

Security Description Shares Value
Nisshin Seifun Group, Inc. . . . . . . . . 500 $ 9,244Nissin Foods Holdings Co., Ltd.. . . . . 100 7,217Toyo Suisan Kaisha, Ltd. . . . . . . . . . 200 8,013Yakult Honsha Co., Ltd. (a). . . . . . . . 300 16,766Yamazaki Baking Co., Ltd. . . . . . . . . 300 5,352
125,564
GAS UTILITIES — 0.6%Osaka Gas Co., Ltd. . . . . . . . . . . . . 800 15,301Toho Gas Co., Ltd. . . . . . . . . . . . . . 300 11,464Tokyo Gas Co., Ltd. . . . . . . . . . . . . 800 20,167
46,932
HEALTH CARE EQUIPMENT &SUPPLIES — 2.4%
Asahi Intecc Co., Ltd. . . . . . . . . . . . 400 10,500Hoya Corp. . . . . . . . . . . . . . . . . . . 800 65,280Olympus Corp. . . . . . . . . . . . . . . . 2,800 37,722Sysmex Corp. . . . . . . . . . . . . . . . . 300 20,075Terumo Corp. . . . . . . . . . . . . . . . . 1,400 45,080
178,657
HEALTH CARE PROVIDERS &SERVICES — 0.4%
Alfresa Holdings Corp. . . . . . . . . . . 400 8,931Medipal Holdings Corp.. . . . . . . . . . 400 8,905Suzuken Co., Ltd. . . . . . . . . . . . . . . 200 10,733
28,569
HEALTH CARE TECHNOLOGY— 0.3%
M3, Inc. (a). . . . . . . . . . . . . . . . . . 900 21,668
HOTELS, RESTAURANTS &LEISURE — 0.9%
McDonald’s Holdings Co. Japan, Ltd. . 200 9,678Oriental Land Co., Ltd. (a) . . . . . . . . 400 60,847
70,525
HOUSEHOLD DURABLES —3.6%
Casio Computer Co., Ltd. (a). . . . . . . 400 6,200Haseko Corp. (a) . . . . . . . . . . . . . . 600 6,984Iida Group Holdings Co., Ltd. . . . . . . 300 4,880Nikon Corp. . . . . . . . . . . . . . . . . . 800 9,978Panasonic Corp. . . . . . . . . . . . . . . . 4,700 38,078Sekisui Chemical Co., Ltd. . . . . . . . . 900 13,932Sekisui House, Ltd. . . . . . . . . . . . . . 1,300 25,561Sharp Corp. . . . . . . . . . . . . . . . . . 400 4,423Sony Corp. . . . . . . . . . . . . . . . . . . 2,700 158,565
268,601
HOUSEHOLD PRODUCTS —0.7%
Lion Corp. . . . . . . . . . . . . . . . . . . 500 9,859Pigeon Corp. (a). . . . . . . . . . . . . . . 300 12,367Unicharm Corp. . . . . . . . . . . . . . . . 900 28,480
50,706
Security Description Shares Value
INDEPENDENT POWER &RENEWABLE ELECTRICITYPRODUCERS — 0.1%
Electric Power Development Co., Ltd.(a) . . . . . . . . . . . . . . . . . . . . . . 300 $ 6,843
INDUSTRIALCONGLOMERATES — 0.7%
Keihan Holdings Co., Ltd. . . . . . . . . 400 17,784Toshiba Corp. . . . . . . . . . . . . . . . . 1,200 36,641
54,425
INSURANCE — 3.0%Dai-ichi Life Holdings, Inc. . . . . . . . 2,300 34,668Japan Post Holdings Co., Ltd. . . . . . . 3,000 27,620Japan Post Insurance Co., Ltd. . . . . . . 200 3,016MS&AD Insurance Group Holdings,
Inc. . . . . . . . . . . . . . . . . . . . . . 1,100 35,623Sompo Holdings, Inc. (a) . . . . . . . . . 700 29,257Sony Financial Holdings, Inc. . . . . . . 400 8,668T&D Holdings, Inc. . . . . . . . . . . . . 1,200 12,713Tokio Marine Holdings, Inc. . . . . . . . 1,400 74,861
226,426
INTERNET & CATALOG RETAIL— 0.3%
Rakuten, Inc. . . . . . . . . . . . . . . . . . 1,700 16,753ZOZO, Inc. (a) . . . . . . . . . . . . . . . . 400 9,223
25,976
INTERACTIVE MEDIA &SERVICES — 0.4%
Kakaku.com, Inc. . . . . . . . . . . . . . . 300 7,378LINE Corp. (b) . . . . . . . . . . . . . . . 100 3,576Yahoo! Japan Corp.. . . . . . . . . . . . . 5,700 16,034
26,988
IT SERVICES — 1.2%Fujitsu, Ltd. . . . . . . . . . . . . . . . . . 400 32,033Itochu Techno-Solutions Corp. (a) . . . 200 5,296Nomura Research Institute, Ltd. . . . . . 600 11,942NTT Data Corp. (a). . . . . . . . . . . . . 1,400 18,058Obic Co., Ltd. . . . . . . . . . . . . . . . . 100 11,400Otsuka Corp. . . . . . . . . . . . . . . . . . 200 7,967SCSK Corp. . . . . . . . . . . . . . . . . . 100 4,691
91,387
LEISURE EQUIPMENT &PRODUCTS — 0.8%
Bandai Namco Holdings, Inc. . . . . . . 400 24,909Sega Sammy Holdings, Inc. (a) . . . . . 300 4,197Shimano, Inc. . . . . . . . . . . . . . . . . 100 15,063Yamaha Corp. . . . . . . . . . . . . . . . . 300 13,463
57,632
MACHINERY — 5.1%Amada Holdings Co., Ltd. . . . . . . . . 900 9,693Daifuku Co., Ltd. . . . . . . . . . . . . . . 300 15,461Ebara Corp.. . . . . . . . . . . . . . . . . . 200 5,324FANUC Corp. . . . . . . . . . . . . . . . . 400 75,281
SPDR SOLACTIVE JAPAN ETFSCHEDULE OF INVESTMENTS (continued)September 30, 2019
See accompanying notes to financial statements.94

Security Description Shares Value
Hino Motors, Ltd.. . . . . . . . . . . . . . 500 $ 4,117Hitachi Construction Machinery Co.,
Ltd. (a) . . . . . . . . . . . . . . . . . . . 200 4,821Hoshizaki Corp. . . . . . . . . . . . . . . . 100 7,856IHI Corp. . . . . . . . . . . . . . . . . . . . 400 8,690JTEKT Corp. (a) . . . . . . . . . . . . . . 500 5,732Kawasaki Heavy Industries, Ltd. . . . . 400 8,853Komatsu, Ltd. . . . . . . . . . . . . . . . . 2,000 45,802Kubota Corp.. . . . . . . . . . . . . . . . . 2,600 39,322Makita Corp. . . . . . . . . . . . . . . . . . 500 15,730MINEBEA MITSUMI, Inc. . . . . . . . 900 14,248MISUMI Group, Inc.. . . . . . . . . . . . 600 14,118Mitsubishi Heavy Industries, Ltd. . . . . 600 23,495Nabtesco Corp. (a) . . . . . . . . . . . . . 300 9,285NGK Insulators, Ltd. . . . . . . . . . . . . 600 8,544NSK, Ltd. . . . . . . . . . . . . . . . . . . . 1,000 8,420SMC Corp. . . . . . . . . . . . . . . . . . . 100 42,656Sumitomo Heavy Industries, Ltd. . . . . 300 8,883THK Co., Ltd. . . . . . . . . . . . . . . . . 200 5,243
381,574
MARINE — 0.2%Mitsui OSK Lines, Ltd. . . . . . . . . . . 300 7,578Nippon Yusen KK . . . . . . . . . . . . . 600 10,021
17,599
MEDIA — 0.5%CyberAgent, Inc. (a) . . . . . . . . . . . . 200 7,680Dentsu, Inc.. . . . . . . . . . . . . . . . . . 400 14,083Fuji Media Holdings, Inc. . . . . . . . . . 300 3,861Hakuhodo DY Holdings, Inc. (a) . . . . 400 5,777Nippon Television Holdings, Inc. . . . . 300 3,842Tokyo Broadcasting System Holdings,
Inc. . . . . . . . . . . . . . . . . . . . . . 200 3,235
38,478
METALS & MINING — 1.0%Hitachi Metals, Ltd. . . . . . . . . . . . . 500 5,394JFE Holdings, Inc. . . . . . . . . . . . . . 1,100 13,231Kobe Steel, Ltd. . . . . . . . . . . . . . . . 700 3,731Mitsubishi Materials Corp. . . . . . . . . 300 8,092Nippon Steel Corp. (a) . . . . . . . . . . . 1,800 25,074Sumitomo Metal Mining Co., Ltd. . . . 500 15,485
71,007
MULTILINE RETAIL — 0.7%Isetan Mitsukoshi Holdings, Ltd. (a) . . 800 6,381Izumi Co., Ltd. . . . . . . . . . . . . . . . 100 3,914J Front Retailing Co., Ltd. . . . . . . . . 600 7,017Marui Group Co., Ltd. (a). . . . . . . . . 500 10,557Pan Pacific International Holdings
Corp. . . . . . . . . . . . . . . . . . . . . 1,200 20,042Seria Co., Ltd. . . . . . . . . . . . . . . . . 100 2,427Takashimaya Co., Ltd. . . . . . . . . . . . 300 3,495
53,833
Security Description Shares Value
OIL, GAS & CONSUMABLEFUELS — 0.8%
Idemitsu Kosan Co., Ltd. . . . . . . . . . 264 $ 7,463Inpex Corp.. . . . . . . . . . . . . . . . . . 2,000 18,341JXTG Holdings, Inc. (a) . . . . . . . . . . 7,100 32,348
58,152
PAPER & FOREST PRODUCTS —0.1%
Oji Holdings Corp. . . . . . . . . . . . . . 2,100 9,793
PERSONAL PRODUCTS — 2.0%Kao Corp.. . . . . . . . . . . . . . . . . . . 1,000 73,875Kobayashi Pharmaceutical Co., Ltd. . . 100 7,606Pola Orbis Holdings, Inc. . . . . . . . . . 200 4,476Shiseido Co., Ltd. . . . . . . . . . . . . . . 800 63,874
149,831
PHARMACEUTICALS — 6.1%Astellas Pharma, Inc.. . . . . . . . . . . . 4,000 56,942Chugai Pharmaceutical Co., Ltd. . . . . 500 38,862Daiichi Sankyo Co., Ltd. . . . . . . . . . 1,300 81,843Eisai Co., Ltd. . . . . . . . . . . . . . . . . 500 25,404Hisamitsu Pharmaceutical Co., Inc.. . . 200 8,744Kyowa Kirin Co., Ltd. . . . . . . . . . . . 600 11,647Mitsubishi Tanabe Pharma Corp. . . . . 500 5,482Nippon Shinyaku Co., Ltd. . . . . . . . . 200 16,822Ono Pharmaceutical Co., Ltd. . . . . . . 800 14,486Otsuka Holdings Co., Ltd. . . . . . . . . 900 33,643Santen Pharmaceutical Co., Ltd.. . . . . 800 13,901Shionogi & Co., Ltd. . . . . . . . . . . . . 600 33,305Sumitomo Dainippon Pharma Co.,
Ltd. (a) . . . . . . . . . . . . . . . . . . . 400 6,570Taisho Pharmaceutical Holdings Co.,
Ltd. . . . . . . . . . . . . . . . . . . . . . 100 7,263Takeda Pharmaceutical Co., Ltd. . . . . 2,900 99,015
453,929
PROFESSIONAL SERVICES —1.2%
Nihon M&A Center, Inc. (a) . . . . . . . 300 8,439Persol Holdings Co., Ltd. . . . . . . . . . 300 5,668Recruit Holdings Co., Ltd. . . . . . . . . 2,500 76,012
90,119
REAL ESTATE MANAGEMENT &DEVELOPMENT — 2.9%
Aeon Mall Co., Ltd. . . . . . . . . . . . . 200 3,155Daito Trust Construction Co., Ltd. (a) . 200 25,556Daiwa House Industry Co., Ltd. . . . . . 1,300 42,173Hulic Co., Ltd.. . . . . . . . . . . . . . . . 800 8,179Mitsubishi Estate Co., Ltd. . . . . . . . . 2,700 52,064Mitsui Fudosan Co., Ltd. . . . . . . . . . 1,900 47,098Nomura Real Estate Holdings, Inc. . . . 200 4,319Sumitomo Realty & Development Co.,
Ltd. . . . . . . . . . . . . . . . . . . . . . 700 26,640Tokyu Fudosan Holdings Corp. (a) . . . 1,100 7,013
216,197
SPDR SOLACTIVE JAPAN ETFSCHEDULE OF INVESTMENTS (continued)September 30, 2019
See accompanying notes to financial statements.95

Security Description Shares Value
ROAD & RAIL — 4.8%Central Japan Railway Co. . . . . . . . . 300 $ 61,679East Japan Railway Co. . . . . . . . . . . 800 76,317Hankyu Hanshin Holdings, Inc. . . . . . 500 19,269Keikyu Corp.. . . . . . . . . . . . . . . . . 500 9,692Keio Corp. . . . . . . . . . . . . . . . . . . 300 18,682Keisei Electric Railway Co., Ltd. . . . . 300 12,339Kintetsu Group Holdings Co., Ltd. . . . 400 20,837Kyushu Railway Co. . . . . . . . . . . . . 400 12,750Nagoya Railroad Co., Ltd. . . . . . . . . 400 11,955Nippon Express Co., Ltd. . . . . . . . . . 200 10,197Odakyu Electric Railway Co., Ltd. . . . 800 19,157Seibu Holdings, Inc. . . . . . . . . . . . . 500 8,712Tobu Railway Co., Ltd. . . . . . . . . . . 500 16,193Tokyu Corp. . . . . . . . . . . . . . . . . . 1,300 24,394West Japan Railway Co. . . . . . . . . . . 400 33,795
355,968
SEMICONDUCTORS &SEMICONDUCTOREQUIPMENT — 1.5%
Advantest Corp. . . . . . . . . . . . . . . . 400 17,673Renesas Electronics Corp. (b) . . . . . . 1,700 11,042Rohm Co., Ltd. . . . . . . . . . . . . . . . 200 15,267SCREEN Holdings Co., Ltd. . . . . . . . 100 5,894SUMCO Corp.. . . . . . . . . . . . . . . . 500 6,708Tokyo Electron, Ltd. . . . . . . . . . . . . 300 57,086
113,670
SOFTWARE — 0.2%Trend Micro, Inc. . . . . . . . . . . . . . . 300 14,268
SPECIALTY RETAIL — 1.2%Fast Retailing Co., Ltd. . . . . . . . . . . 100 59,412Nitori Holdings Co., Ltd. (a) . . . . . . . 100 14,629USS Co., Ltd. . . . . . . . . . . . . . . . . 500 9,702Yamada Denki Co., Ltd. . . . . . . . . . . 1,400 6,775
90,518
TECHNOLOGY HARDWARE,STORAGE & PERIPHERALS —2.1%
Brother Industries, Ltd. . . . . . . . . . . 500 9,049Canon, Inc. . . . . . . . . . . . . . . . . . . 2,200 58,677FUJIFILM Holdings Corp. . . . . . . . . 800 35,087Konica Minolta, Inc. (a) . . . . . . . . . . 1,100 7,654NEC Corp. . . . . . . . . . . . . . . . . . . 500 21,096Ricoh Co., Ltd. (a) . . . . . . . . . . . . . 1,500 13,504Seiko Epson Corp. (a) . . . . . . . . . . . 600 8,439
153,506
TEXTILES, APPAREL & LUXURYGOODS — 0.1%
Asics Corp. (a). . . . . . . . . . . . . . . . 400 6,829
TOBACCO — 0.7%Japan Tobacco, Inc. . . . . . . . . . . . . . 2,400 52,541
Security Description Shares Value
TRADING COMPANIES &DISTRIBUTORS — 3.8%
ITOCHU Corp. . . . . . . . . . . . . . . . 3,200 $ 66,058Marubeni Corp. . . . . . . . . . . . . . . . 3,600 23,907Mitsubishi Corp. . . . . . . . . . . . . . . 2,900 71,135Mitsui & Co., Ltd. . . . . . . . . . . . . . 3,500 57,256MonotaRO Co., Ltd. (a) . . . . . . . . . . 200 5,230Sojitz Corp. . . . . . . . . . . . . . . . . . 2,400 7,439Sumitomo Corp.. . . . . . . . . . . . . . . 2,400 37,485Toyota Tsusho Corp. . . . . . . . . . . . . 400 12,898
281,408
WIRELESSTELECOMMUNICATIONSERVICES — 4.5%
KDDI Corp. . . . . . . . . . . . . . . . . . 3,600 94,101NTT DOCOMO, Inc. (a) . . . . . . . . . 2,500 63,683Softbank Corp. (a) . . . . . . . . . . . . . 3,300 44,702SoftBank Group Corp. (a). . . . . . . . . 3,400 133,389
335,875
TOTAL COMMON STOCKS(Cost $8,153,765) . . . . . . . . . . . . 7,335,445
SHORT-TERM INVESTMENTS — 10.0%State Street Institutional Liquid
Reserves Fund, Premier Class2.03% (c) (d) . . . . . . . . . . . . . . . 631 631
State Street Navigator SecuritiesLending Portfolio III (e) (f) . . . . . . 743,609 743,609
TOTAL SHORT-TERMINVESTMENTS(Cost $744,240) . . . . . . . . . . . . . 744,240
TOTAL INVESTMENTS — 108.6%(Cost $8,898,005) . . . . . . . . . . . . . . . . . . . . . . . 8,079,685
LIABILITIES IN EXCESS OF OTHER ASSETS —(8.6)% . . . . . . . . . . . . . . . . . . . . . . . . . . . . . . (642,867)
NET ASSETS — 100.0% . . . . . . . . . . . . . . . . . . . $ 7,436,818
(a) All or a portion of the shares of the security are on loan atSeptember 30, 2019.
(b) Non-income producing security.(c) The Fund invested in certain money market funds managed by
SSGA Funds Management, Inc. Amounts related to thesetransactions during the period ended September 30, 2019 areshown in the Affiliate Table below.
(d) The rate shown is the annualized seven-day yield at September 30,2019.
(e) The Fund invested in an affiliated entity. Amounts related to thesetransactions during the period ended September 30, 2019 areshown in the Affiliate Table below.
(f) Investment of cash collateral for securities loaned.
REIT Real Estate Investment Trust
SPDR SOLACTIVE JAPAN ETFSCHEDULE OF INVESTMENTS (continued)September 30, 2019
See accompanying notes to financial statements.96

The following table summarizes the value of the Fund’s investments according to the fair value hierarchy as of September 30,2019.
DescriptionLevel 1 –
Quoted Prices
Level 2 –Other SignificantObservable Inputs
Level 3 –Significant
Unobservable Inputs Total
ASSETS:INVESTMENTS:Common Stocks. . . . . . . . . . . . . . . . . . . . . . . . . . . . . . . . . . . . . . $7,335,445 $— $— $7,335,445
Short-Term Investments . . . . . . . . . . . . . . . . . . . . . . . . . . . . . . . . . 744,240 — — 744,240
TOTAL INVESTMENTS . . . . . . . . . . . . . . . . . . . . . . . . . . . . . . . $8,079,685 $— $— $8,079,685
Affiliate Table
Number ofShares Held
at9/30/18
Value at9/30/18
Cost ofPurchases
Proceedsfrom
Shares SoldRealized
Gain (Loss)
Change inUnrealized
Appreciation/Depreciation
Number ofShares Held
at9/30/19
Value at9/30/19
DividendIncome
State Street Institutional Liquid Reserves Fund, Premier Class. . . — $ — $ 1,510 $ 879 $— $— 631 $ 631 $ 3
State Street Institutional U.S. Government Money Market Fund,Class G Shares . . . . . . . . . . . . . . . . . . . . . . . . . . . 3,721 3,721 356,653 360,374 — — — — 219
State Street Navigator Securities Lending Government MoneyMarket Portfolio . . . . . . . . . . . . . . . . . . . . . . . . . . 652,778 652,778 691,265 1,344,043 — — — — 307
State Street Navigator Securities Lending Portfolio III . . . . . . . — — 1,351,781 608,172 — — 743,609 743,609 221
Total . . . . . . . . . . . . . . . . . . . . . . . . . . . . . . . . . . $656,499 $2,401,209 $2,313,468 $— $— $744,240 $750
SPDR SOLACTIVE JAPAN ETFSCHEDULE OF INVESTMENTS (continued)September 30, 2019
See accompanying notes to financial statements.97

Security Description Shares Value
COMMON STOCKS — 99.5%AEROSPACE & DEFENSE —
1.8%BAE Systems PLC . . . . . . . . . . . . 15,189 $ 106,689Rolls-Royce Holdings PLC. . . . . . . 9,087 88,732
195,421
AIRLINES — 0.6%easyJet PLC . . . . . . . . . . . . . . . . 1,275 18,069International Consolidated Airlines
Group SA . . . . . . . . . . . . . . . . 7,221 42,267
60,336
AUTOMOBILES — 0.6%Fiat Chrysler Automobiles NV . . . . 5,087 65,840
BANKS — 12.1%Barclays PLC . . . . . . . . . . . . . . . 81,723 151,464HSBC Holdings PLC . . . . . . . . . . 98,296 756,579Lloyds Banking Group PLC . . . . . . 334,738 223,243Royal Bank of Scotland Group PLC . 21,854 55,908Standard Chartered PLC . . . . . . . . 15,388 129,742
1,316,936
BEVERAGES — 4.7%Coca-Cola European Partners PLC . . 915 50,737Diageo PLC . . . . . . . . . . . . . . . . 11,236 461,491
512,228
CAPITAL MARKETS — 3.3%3i Group PLC . . . . . . . . . . . . . . . 4,575 65,765Hargreaves Lansdown PLC. . . . . . . 1,278 32,742Investec PLC. . . . . . . . . . . . . . . . 3,163 16,320London Stock Exchange Group PLC. 1,658 149,313Schroders PLC . . . . . . . . . . . . . . 611 23,153St James’s Place PLC . . . . . . . . . . 2,510 30,293Standard Life Aberdeen PLC . . . . . 11,029 38,843
356,429
CHEMICALS — 0.7%Croda International PLC . . . . . . . . 612 36,652Johnson Matthey PLC . . . . . . . . . . 923 34,771
71,423
COMMERCIAL SERVICES &SUPPLIES — 0.6%
G4S PLC . . . . . . . . . . . . . . . . . . 7,514 17,519Rentokil Initial PLC . . . . . . . . . . . 8,802 50,741
68,260
CONTAINERS & PACKAGING— 0.2%
DS Smith PLC . . . . . . . . . . . . . . 6,190 27,491
DIVERSIFIEDTELECOMMUNICATIONSERVICES — 0.8%
BT Group PLC . . . . . . . . . . . . . . 39,513 86,954
ELECTRIC UTILITIES — 0.7%SSE PLC . . . . . . . . . . . . . . . . . . 4,928 75,636
Security Description Shares Value
ELECTRICAL EQUIPMENT —0.5%
Melrose Industries PLC . . . . . . . . . 22,854 $ 56,777
ELECTRONIC EQUIPMENT,INSTRUMENTS &COMPONENTS — 0.4%
Halma PLC . . . . . . . . . . . . . . . . 1,801 43,744
ENERGY EQUIPMENT &SERVICES — 0.6%
Subsea 7 SA . . . . . . . . . . . . . . . . 1,131 11,698TechnipFMC PLC . . . . . . . . . . . . 2,025 48,884
60,582
EQUITY REAL ESTATEINVESTMENT TRUSTS(REITS) — 1.1%
British Land Co. PLC REIT . . . . . . 4,513 32,523Land Securities Group PLC REIT . . 3,303 34,858Segro PLC REIT . . . . . . . . . . . . . 5,104 50,996
118,377
FOOD & STAPLES RETAILING— 1.7%
J Sainsbury PLC . . . . . . . . . . . . . 10,074 27,286Tesco PLC . . . . . . . . . . . . . . . . . 45,988 136,577Wm Morrison Supermarkets PLC . . 10,969 27,075
190,938
FOOD PRODUCTS — 0.4%Associated British Foods PLC . . . . . 1,716 48,700
HEALTH CARE EQUIPMENT &SUPPLIES — 1.1%
ConvaTec Group PLC (a) . . . . . . . . 7,296 15,752Smith & Nephew PLC. . . . . . . . . . 4,104 99,074
114,826
HEALTH CARE PROVIDERS &SERVICES — 0.2%
NMC Health PLC . . . . . . . . . . . . 571 19,069
HOTELS, RESTAURANTS &LEISURE — 3.1%
Carnival PLC . . . . . . . . . . . . . . . 778 32,309Compass Group PLC . . . . . . . . . . 7,505 193,569InterContinental Hotels Group PLC . 803 50,219Merlin Entertainments PLC (a) . . . . 3,417 19,050Whitbread PLC . . . . . . . . . . . . . . 816 43,179
338,326
HOUSEHOLD DURABLES —1.3%
Barratt Developments PLC. . . . . . . 4,826 38,537Berkeley Group Holdings PLC . . . . 572 29,457Persimmon PLC. . . . . . . . . . . . . . 1,502 40,165Taylor Wimpey PLC . . . . . . . . . . . 14,926 29,705
137,864
SPDR SOLACTIVE UNITED KINGDOM ETFSCHEDULE OF INVESTMENTSSeptember 30, 2019
See accompanying notes to financial statements.98

Security Description Shares Value
HOUSEHOLD PRODUCTS —2.4%
Reckitt Benckiser Group PLC . . . . . 3,354 $ 262,206
INDUSTRIALCONGLOMERATES — 0.7%
DCC PLC . . . . . . . . . . . . . . . . . 452 39,525Smiths Group PLC . . . . . . . . . . . . 1,887 36,508
76,033
INSURANCE — 4.4%Admiral Group PLC . . . . . . . . . . . 1,063 27,744Aviva PLC . . . . . . . . . . . . . . . . . 18,388 90,480Direct Line Insurance Group PLC . . 6,549 24,227Legal & General Group PLC. . . . . . 27,992 85,684Prudential PLC . . . . . . . . . . . . . . 12,305 223,661RSA Insurance Group PLC. . . . . . . 4,916 32,362
484,158
INTERACTIVE MEDIA &SERVICES — 0.2%
Auto Trader Group PLC (a) . . . . . . 4,230 26,584
INTERNET & DIRECTMARKETING RETAIL —0.4%
Farfetch, Ltd. Class A (b) (c) . . . . . . 633 5,469Ocado Group PLC (b) . . . . . . . . . . 2,203 35,903
41,372
MACHINERY — 0.6%CNH Industrial NV . . . . . . . . . . . 4,641 47,257Weir Group PLC . . . . . . . . . . . . . 1,256 22,063
69,320
MEDIA — 2.5%Informa PLC. . . . . . . . . . . . . . . . 5,969 62,670ITV PLC . . . . . . . . . . . . . . . . . . 17,536 27,207Liberty Global PLC Class A (b). . . . 815 20,171Liberty Global PLC Class C (b). . . . 2,403 57,167Pearson PLC . . . . . . . . . . . . . . . . 3,724 33,867WPP PLC . . . . . . . . . . . . . . . . . 5,872 73,663
274,745
METALS & MINING — 6.0%Anglo American PLC . . . . . . . . . . 6,129 141,327Antofagasta PLC . . . . . . . . . . . . . 1,676 18,567BHP Group PLC . . . . . . . . . . . . . 9,723 207,570Evraz PLC . . . . . . . . . . . . . . . . . 2,190 12,619Fresnillo PLC . . . . . . . . . . . . . . . 893 7,523Rio Tinto PLC . . . . . . . . . . . . . . . 5,105 264,784
652,390
MULTI-UTILITIES — 1.8%Centrica PLC . . . . . . . . . . . . . . . 27,485 24,976National Grid PLC . . . . . . . . . . . . 16,145 175,458
200,434
MULTILINE RETAIL — 0.6%Marks & Spencer Group PLC . . . . . 9,296 21,129
Security Description Shares Value
Next PLC. . . . . . . . . . . . . . . . . . 594 $ 45,281
66,410
OIL, GAS & CONSUMABLEFUELS — 15.8%
BP PLC . . . . . . . . . . . . . . . . . . . 97,388 619,018Royal Dutch Shell PLC Class A. . . . 19,921 585,240Royal Dutch Shell PLC Class B. . . . 17,681 522,047
1,726,305
PAPER & FOREST PRODUCTS— 0.3%
Mondi PLC . . . . . . . . . . . . . . . . 1,752 33,637
PERSONAL PRODUCTS — 2.9%Unilever PLC . . . . . . . . . . . . . . . 5,223 314,735
PHARMACEUTICALS — 9.9%AstraZeneca PLC. . . . . . . . . . . . . 6,216 556,191GlaxoSmithKline PLC . . . . . . . . . 23,632 508,057Hikma Pharmaceuticals PLC . . . . . 668 18,110
1,082,358
PROFESSIONAL SERVICES —3.8%
Experian PLC . . . . . . . . . . . . . . . 4,311 138,070Intertek Group PLC . . . . . . . . . . . 767 51,777RELX PLC. . . . . . . . . . . . . . . . . 9,217 219,495
409,342
SOFTWARE — 0.6%Micro Focus International PLC . . . . 1,617 22,652Sage Group PLC . . . . . . . . . . . . . 4,916 41,885
64,537
SPECIALTY RETAIL — 0.4%JD Sports Fashion PLC . . . . . . . . . 1,963 18,176Kingfisher PLC . . . . . . . . . . . . . . 10,062 25,642
43,818
TEXTILES, APPAREL &LUXURY GOODS — 0.5%
Burberry Group PLC . . . . . . . . . . 1,961 52,536
TOBACCO — 4.6%British American Tobacco PLC . . . . 10,867 402,746Imperial Brands PLC . . . . . . . . . . 4,536 102,191
504,937
TRADING COMPANIES &DISTRIBUTORS — 1.7%
Ashtead Group PLC . . . . . . . . . . . 2,176 60,709Bunzl PLC . . . . . . . . . . . . . . . . . 1,601 41,924Ferguson PLC . . . . . . . . . . . . . . . 1,083 79,328
181,961
WATER UTILITIES — 0.6%Severn Trent PLC. . . . . . . . . . . . . 1,130 30,148United Utilities Group PLC . . . . . . 3,250 33,073
63,221
SPDR SOLACTIVE UNITED KINGDOM ETFSCHEDULE OF INVESTMENTS (continued)September 30, 2019
See accompanying notes to financial statements.99

Security Description Shares Value
WIRELESSTELECOMMUNICATIONSERVICES — 2.3%
Vodafone Group PLC . . . . . . . . . . 126,668 $ 252,871
TOTAL COMMON STOCKS(Cost $11,786,428) . . . . . . . . . . 10,850,067
TOTAL INVESTMENTS — 99.5%(Cost $11,786,428) . . . . . . . . . . . . . . . . . . . . . 10,850,067
OTHER ASSETS IN EXCESS OF LIABILITIES— 0.5%. . . . . . . . . . . . . . . . . . . . . . . . . . . . 55,914
NET ASSETS — 100.0% . . . . . . . . . . . . . . . . . . $ 10,905,981
(a) Securities purchased pursuant to Rule 144A of the Securities Actof 1933, as amended. These securities, which represent 0.6% ofnet assets as of September 30, 2019, are considered liquid andmay be resold in transactions exempt from registration, normallyto qualified institutional buyers.
(b) Non-income producing security.(c) All or a portion of the shares of the security are on loan at
September 30, 2019.
REIT Real Estate Investment Trust
The following table summarizes the value of the Fund’s investments according to the fair value hierarchy as of September 30,2019.
DescriptionLevel 1 –
Quoted Prices
Level 2 –Other SignificantObservable Inputs
Level 3 –Significant
Unobservable Inputs Total
ASSETS:INVESTMENTS:Common Stocks . . . . . . . . . . . . . . . . . . . . . . . . . . . . . . . . . . . . . $10,850,067 $— $— $10,850,067
TOTAL INVESTMENTS . . . . . . . . . . . . . . . . . . . . . . . . . . . . . . $10,850,067 $— $— $10,850,067
Affiliate Table
Number ofShares Held
at9/30/18
Value at9/30/18
Cost ofPurchases
Proceedsfrom
Shares SoldRealized
Gain (Loss)
Change inUnrealized
Appreciation/Depreciation
Number ofShares Held
at9/30/19
Value at9/30/19
DividendIncome
State Street Institutional Liquid Reserves Fund, Premier Class . . . — $ — $ 14,329 $ 14,329 $— $— — $— $ 22
State Street Institutional U.S. Government Money Market Fund,Class G Shares . . . . . . . . . . . . . . . . . . . . . . . . . . . . 19,148 19,148 481,434 500,582 — — — — 266
State Street Navigator Securities Lending Government MoneyMarket Portfolio . . . . . . . . . . . . . . . . . . . . . . . . . . . — — 3,230,287 3,230,287 — — — — 215
State Street Navigator Securities Lending Portfolio III . . . . . . . . — — 2,987,276 2,987,276 — — — — 228
Total . . . . . . . . . . . . . . . . . . . . . . . . . . . . . . . . . . . $19,148 $6,713,326 $6,732,474 $— $— $— $731
SPDR SOLACTIVE UNITED KINGDOM ETFSCHEDULE OF INVESTMENTS (continued)September 30, 2019
See accompanying notes to financial statements.100

Security Description Shares Value
COMMON STOCKS - 99.4%AUSTRALIA – 1.6%Other Securities. . . . . . . . . . . . . . . . $ 389,106
AUSTRIA – 0.1%Other Securities. . . . . . . . . . . . . . . . 16,209
BELGIUM – 0.3%Other Securities. . . . . . . . . . . . . . . . 81,589
CANADA – 3.5%Other Securities. . . . . . . . . . . . . . . . 855,103
CHINA – 0.1%Other Securities. . . . . . . . . . . . . . . . 19,222
DENMARK – 1.0%Novo Nordisk A/S Class B . . . . . . . . . 2,156 110,861Other Securities. . . . . . . . . . . . . . . . 126,744
237,605
FINLAND – 0.5%Other Securities. . . . . . . . . . . . . . . . 128,461
FRANCE – 2.8%Other Securities. . . . . . . . . . . . . . . . 675,428
GERMANY – 2.3%Deutsche Telekom AG. . . . . . . . . . . . 5,151 86,447Other Securities. . . . . . . . . . . . . . . . 476,336
562,783
HONG KONG – 1.7%Other Securities. . . . . . . . . . . . . . . . 412,552
IRELAND – 0.9%Accenture PLC Class A. . . . . . . . . . . 851 163,690Other Securities. . . . . . . . . . . . . . . . 57,481
221,171
ISRAEL – 0.3%Other Securities. . . . . . . . . . . . . . . . 81,601
ITALY – 0.7%Other Securities. . . . . . . . . . . . . . . . 178,998
JAPAN – 10.0%NTT DOCOMO, Inc. (a) . . . . . . . . . . 3,868 98,530Other Securities. . . . . . . . . . . . . . . . 2,309,710
2,408,240
LUXEMBOURG – 0.1%Other Securities. . . . . . . . . . . . . . . . 24,881
MEXICO – 0.0% (b)Other Security. . . . . . . . . . . . . . . . . 126
NETHERLANDS – 1.1%Other Securities. . . . . . . . . . . . . . . . 268,166
NEW ZEALAND – 0.1%Other Securities. . . . . . . . . . . . . . . . 33,128
NORWAY – 0.1%Other Securities. . . . . . . . . . . . . . . . 30,978
Security Description Shares Value
PORTUGAL – 0.1%Other Securities. . . . . . . . . . . . . . . . $ 11,256
SINGAPORE – 0.7%Other Securities. . . . . . . . . . . . . . . . 158,310
SOUTH AFRICA – 0.0% (b)Other Securities. . . . . . . . . . . . . . . . 7,496
SPAIN – 0.9%Other Securities. . . . . . . . . . . . . . . . 207,630
SWEDEN – 0.6%Other Securities. . . . . . . . . . . . . . . . 143,821
SWITZERLAND – 4.6%Nestle SA . . . . . . . . . . . . . . . . . . . 1,223 132,805Roche Holding AG. . . . . . . . . . . . . . 917 267,104Swiss Re AG . . . . . . . . . . . . . . . . . 1,122 117,134Other Securities. . . . . . . . . . . . . . . . 591,212
1,108,255
UNITED KINGDOM – 5.0%AstraZeneca PLC . . . . . . . . . . . . . . 1,159 103,704Other Securities. . . . . . . . . . . . . . . . 1,095,931
1,199,635
UNITED STATES – 60.3%Adobe, Inc. (c) . . . . . . . . . . . . . . . . 363 100,279Alphabet, Inc. Class A (c) . . . . . . . . . 190 232,017Alphabet, Inc. Class C (c) . . . . . . . . . 205 249,895Altria Group, Inc. . . . . . . . . . . . . . . 2,112 86,381Amgen, Inc. . . . . . . . . . . . . . . . . . . 495 95,787Apple, Inc. . . . . . . . . . . . . . . . . . . . 2,733 612,110AT&T, Inc.. . . . . . . . . . . . . . . . . . . 3,753 142,014Automatic Data Processing, Inc. . . . . . 581 93,785Bank of America Corp. . . . . . . . . . . . 3,015 87,948Cisco Systems, Inc. . . . . . . . . . . . . . 4,223 208,658Coca-Cola Co. . . . . . . . . . . . . . . . . 1,866 101,585Consolidated Edison, Inc. . . . . . . . . . 1,110 104,862Costco Wholesale Corp. . . . . . . . . . . 399 114,956Eli Lilly & Co. . . . . . . . . . . . . . . . . 1,041 116,415Exxon Mobil Corp. . . . . . . . . . . . . . 1,623 114,600Facebook, Inc. Class A (c) . . . . . . . . . 1,775 316,092Fiserv, Inc. (c) . . . . . . . . . . . . . . . . . 901 93,335Honeywell International, Inc. . . . . . . . 610 103,212Intel Corp. . . . . . . . . . . . . . . . . . . . 4,191 215,962International Business Machines Corp. . 983 142,948Johnson & Johnson . . . . . . . . . . . . . 2,712 350,879JPMorgan Chase & Co. . . . . . . . . . . . 932 109,687Mastercard, Inc. Class A . . . . . . . . . . 923 250,659McDonald’s Corp. . . . . . . . . . . . . . . 500 107,355Merck & Co., Inc. . . . . . . . . . . . . . . 1,060 89,231Microsoft Corp.. . . . . . . . . . . . . . . . 3,573 496,754NextEra Energy, Inc. . . . . . . . . . . . . 395 92,031NIKE, Inc. Class B. . . . . . . . . . . . . . 1,358 127,543Oracle Corp.. . . . . . . . . . . . . . . . . . 2,016 110,940PepsiCo, Inc. . . . . . . . . . . . . . . . . . 1,779 243,901Pfizer, Inc. . . . . . . . . . . . . . . . . . . . 5,191 186,513Procter & Gamble Co.. . . . . . . . . . . . 2,424 301,497
SPDR MSCI WORLD STRATEGICFACTORS ETFSUMMARY SCHEDULE OF INVESTMENTSSeptember 30, 2019
See accompanying notes to financial statements.101

Security Description Shares Value
Public Storage REIT. . . . . . . . . . . . . 363 $ 89,033Southern Co. . . . . . . . . . . . . . . . . . 1,474 91,049State Street Corp. (d) . . . . . . . . . . . . 60 3,551Texas Instruments, Inc. . . . . . . . . . . . 935 120,839TJX Cos., Inc.. . . . . . . . . . . . . . . . . 2,638 147,042Union Pacific Corp. . . . . . . . . . . . . . 554 89,737Verizon Communications, Inc. . . . . . . 2,230 134,603Visa, Inc. Class A . . . . . . . . . . . . . . 1,824 313,746Walmart, Inc. . . . . . . . . . . . . . . . . . 1,016 120,579Walt Disney Co. . . . . . . . . . . . . . . . 1,418 184,794Waste Management, Inc. . . . . . . . . . . 926 106,490Other Securities. . . . . . . . . . . . . . . . 7,372,692
14,573,986
TOTAL COMMON STOCKS(Cost $22,823,410) . . . . . . . . . . 24,035,736
SHORT-TERM INVESTMENTS -1.4%
State Street Institutional LiquidReserves Fund, Premier Class 2.03%(e)(f) . . . . . . . . . . . . . . . . . . . . . 30,335 30,339
State Street Navigator SecuritiesLending Portfolio III (d)(g). . . . . . . 307,622 307,622
TOTAL SHORT-TERMINVESTMENTS(Cost $337,960) . . . . . . . . . . . . 337,961
TOTAL INVESTMENTS - 100.8%(Cost $23,161,370) . . . . . . . . . . 24,373,697
LIABILITIES IN EXCESS OFOTHER ASSETS - (0.8)% . . . . (198,226)
NET ASSETS - 100.0% . . . . . . . . $ 24,175,471
The Summary Schedule of Investments does not reflect the completeportfolio holdings. It includes the Fund’s 50 largest holdings and eachinvestment of any issuer that exceeds 1% of the Fund’s net assets. “OtherSecurities” represent all issues not required to be disclosed under therules adopted by the U.S. Securities and Exchange Commission(“SEC”). In certain instances, securities for which footnotes listed belowmay otherwise apply are included in the Other Securities caption. Thecomplete schedule of portfolio holdings is available on the Fund’swebsite at www.spdrs.com, without charge, upon request by calling1-866-787-2257 (toll-free) and on the SEC’s website at www.sec.gov.
(a) All or a portion of the shares of the security are on loan atSeptember 30, 2019.
(b) Amount is less than 0.05% of net assets.(c) Non-income producing security.(d) The Fund invested in an affiliated entity. Amounts related to
these transactions during the period ended September 30, 2019are shown in the Affiliate Table below.
(e) The Fund invested in certain money market funds managed bySSGA Funds Management, Inc. Amounts related to thesetransactions during the period ended September 30, 2019 areshown in the Affiliate Table below.
(f) The rate shown is the annualized seven-day yield atSeptember 30, 2019.
(g) Investment of cash collateral for securities loaned.REIT Real Estate Investment Trust
The following table summarizes the value of the Fund’s investments according to the fair value hierarchy as of September 30,2019.
DescriptionLevel 1 –
Quoted Prices
Level 2 –Other SignificantObservable Inputs
Level 3 –Significant
Unobservable Inputs Total
ASSETS:INVESTMENTS:Common Stocks . . . . . . . . . . . . . . . . . . . . . . . . . . . . . . . . . . . . . $24,024,536 $11,200 $— $24,035,736
Short-Term Investments . . . . . . . . . . . . . . . . . . . . . . . . . . . . . . . . 337,961 — — 337,961
TOTAL INVESTMENTS . . . . . . . . . . . . . . . . . . . . . . . . . . . . . . $24,362,497 $11,200 $— $24,373,697
SPDR MSCI WORLD STRATEGICFACTORS ETFSUMMARY SCHEDULE OF INVESTMENTS (continued)September 30, 2019
See accompanying notes to financial statements.102

Affiliate Table
Number ofShares Held
at9/30/18
Value at9/30/18
Cost ofPurchases
Proceedsfrom
Shares SoldRealized
Gain (Loss)
Change inUnrealized
Appreciation/Depreciation
Number ofShares Held
at9/30/19
Value at9/30/19
DividendIncome
State Street Corp. . . . . . . . . . . . . . . . . . . . . . . . . . . . 80 $ 6,702 $ 1,179 $ 2,806 $(867) $(657) 60 $ 3,551 $ 116
State Street Institutional Liquid Reserves Fund, Premier Class. . . — — 112,173 81,840 6 — 30,335 30,339 79
State Street Institutional U.S. Government Money Market Fund,Class G Shares . . . . . . . . . . . . . . . . . . . . . . . . . . . 18,931 18,931 1,248,614 1,267,545 — — — — 892
State Street Navigator Securities Lending Government MoneyMarket Portfolio . . . . . . . . . . . . . . . . . . . . . . . . . . 298,707 298,707 1,306,349 1,605,056 — — — — 1,480
State Street Navigator Securities Lending Portfolio III . . . . . . . — — 1,429,297 1,121,675 — — 307,622 307,622 894
Total . . . . . . . . . . . . . . . . . . . . . . . . . . . . . . . . . . $324,340 $4,097,612 $4,078,922 $(861) $(657) $341,512 $3,461
SPDR MSCI WORLD STRATEGICFACTORS ETFSUMMARY SCHEDULE OF INVESTMENTS (continued)September 30, 2019
See accompanying notes to financial statements.103

Security DescriptionPrincipalAmount Value
CORPORATE BONDS & NOTES — 0.0% (a)INDIA — 0.0% (a)Britannia Industries, Ltd.
8.00%, 8/28/2022. . . . . . . INR 168,120 $ 2,420
TOTAL CORPORATEBONDS & NOTES(Cost $2,399) . . . . . . . . . 2,420
Shares
COMMON STOCKS — 99.8%CHINA — 48.2%21Vianet Group, Inc. ADR
(b) . . . . . . . . . . . . . . . . 10,043 76,528360 Security Technology, Inc.
Class A . . . . . . . . . . . . . 14,900 48,9913SBio, Inc. (b) (c) . . . . . . . . 46,000 76,281500.com, Ltd. Class A, ADR
(b) (d) . . . . . . . . . . . . . . 1,829 19,49751job, Inc. ADR (b) . . . . . . . 2,991 221,33458.com, Inc. ADR (b) . . . . . . 7,434 366,5715I5J Holding Group Co., Ltd.
Class A . . . . . . . . . . . . . 77,100 46,965AAC Technologies Holdings,
Inc. . . . . . . . . . . . . . . . . 87,000 460,558Addsino Co., Ltd. Class A (b) . 30,100 44,173Advanced Technology &
Materials Co., Ltd. Class A(b) . . . . . . . . . . . . . . . . 47,500 44,698
AECC Aero-Engine ControlCo., Ltd. Class A . . . . . . . 36,100 68,902
AECC Aviation Power Co.,Ltd. Class A . . . . . . . . . . 15,200 46,550
Aerospace CH UAV Co., Ltd. . 33,700 51,155Aerospace Hi-Tech Holdings
Grp, Ltd. Class A . . . . . . . 28,600 45,496Agile Group Holdings, Ltd. . . 389,598 473,119Agricultural Bank of China,
Ltd. Class A . . . . . . . . . . 354,400 171,711Agricultural Bank of China,
Ltd. Class H . . . . . . . . . . 2,994,000 1,172,485Air China, Ltd. Class H . . . . . 429,414 377,957Alibaba Group Holding, Ltd.
ADR (b) . . . . . . . . . . . . 159,457 26,665,994Aluminum Corp. of China,
Ltd. Class H (b) . . . . . . . . 768,304 242,073Angang Steel Co., Ltd.
Class H (d) . . . . . . . . . . . 575,616 209,998Anhui Conch Cement Co.,
Ltd. Class H . . . . . . . . . . 212,250 1,260,331Anhui Expressway Co., Ltd.
Class H . . . . . . . . . . . . . 32,000 17,879Anhui Guangxin
Agrochemical Co., Ltd.Class A . . . . . . . . . . . . . 29,800 62,135
Anhui Gujing Distillery Co.,Ltd. Class B . . . . . . . . . . 15,400 129,397
Security Description Shares Value
Anhui Hengyuan CoalIndustry and ElectricityPower Co., Ltd. Class A . . . 75,788 $ 59,007
Anhui Jiangnan ChemicalIndustry Co., Ltd. Class A(b) . . . . . . . . . . . . . . . . 69,400 50,049
Anhui Jinhe Industrial Co.,Ltd. Class A . . . . . . . . . . 17,500 48,766
Anhui Transport Consulting &Design Institute Co., Ltd.Class A . . . . . . . . . . . . . 36,800 58,334
Anhui Truchum AdvancedMaterials & TechnologyCo., Ltd. Class A (b) . . . . . 55,900 48,454
ANTA Sports Products, Ltd. . . 120,000 992,678Apeloa Pharmaceutical Co.,
Ltd. Class A . . . . . . . . . . 33,400 55,330ArtGo Holdings, Ltd. (b) (d). . 190,000 63,500Autobio Diagnostics Co., Ltd.
Class A . . . . . . . . . . . . . 10,000 123,943Autohome, Inc. ADR (b) (d) . . 5,396 448,569Avary Holding Shenzhen Co.,
Ltd. Class A . . . . . . . . . . 10,400 58,428AVIC Aircraft Co., Ltd.
Class A . . . . . . . . . . . . . 30,800 67,067AVIC Electromechanical
Systems Co., Ltd. Class A . 52,200 47,586Avic Heavy Machinery Co.,
Ltd. Class A . . . . . . . . . . 32,800 47,446AVIC International Holding
HK, Ltd. . . . . . . . . . . . . 834,621 18,312AVIC Jonhon Optronic
Technology Co., Ltd.Class A . . . . . . . . . . . . . 10,000 57,665
AVIC Shenyang Aircraft Co.,Ltd. Class A (b) . . . . . . . . 17,400 75,534
AviChina Industry &Technology Co., Ltd.Class H . . . . . . . . . . . . . 484,000 237,697
AVICOPTER PLC Class A . . 10,200 64,161BAIC Motor Corp., Ltd.
Class H (c) . . . . . . . . . . . 214,000 132,122Baidu, Inc. ADR (b) . . . . . . . 30,334 3,117,122Bank of China, Ltd. Class H . . 10,090,466 3,964,415Bank of Communications Co.,
Ltd. Class H . . . . . . . . . . 2,754,630 1,799,080Bank of Ningbo Co., Ltd.
Class A . . . . . . . . . . . . . 22,000 77,665Baozun, Inc. ADR (b) (d). . . . 2,534 108,202BBMG Corp. Class H (d) . . . 263,000 75,484Beibuwan Port Co., Ltd.
Class A . . . . . . . . . . . . . 39,000 47,731BeiGene, Ltd. ADR (b) . . . . . 4,927 603,360Beijing BDStar Navigation
Co., Ltd. Class A . . . . . . . 15,100 46,709Beijing Capital International
Airport Co., Ltd. Class H . . 116,000 98,992
SPDR S&P EMERGING ASIA PACIFIC ETFSCHEDULE OF INVESTMENTSSeptember 30, 2019
See accompanying notes to financial statements.104
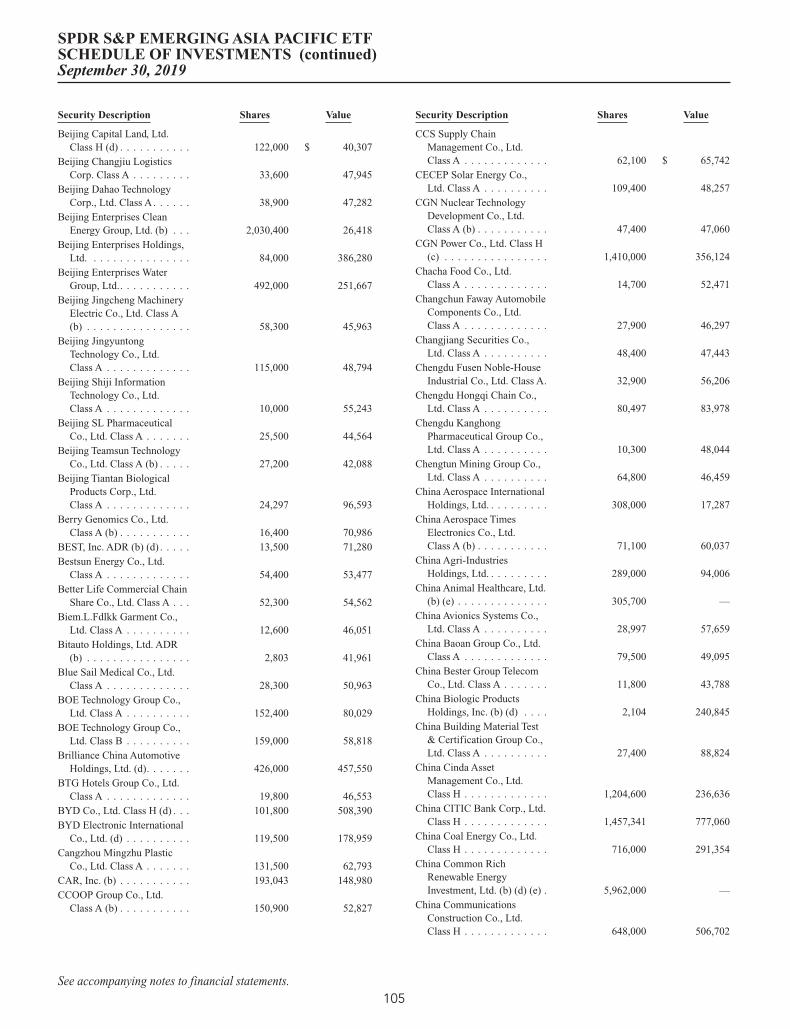
Security Description Shares Value
Beijing Capital Land, Ltd.Class H (d) . . . . . . . . . . . 122,000 $ 40,307
Beijing Changjiu LogisticsCorp. Class A . . . . . . . . . 33,600 47,945
Beijing Dahao TechnologyCorp., Ltd. Class A . . . . . . 38,900 47,282
Beijing Enterprises CleanEnergy Group, Ltd. (b) . . . 2,030,400 26,418
Beijing Enterprises Holdings,Ltd. . . . . . . . . . . . . . . . 84,000 386,280
Beijing Enterprises WaterGroup, Ltd.. . . . . . . . . . . 492,000 251,667
Beijing Jingcheng MachineryElectric Co., Ltd. Class A(b) . . . . . . . . . . . . . . . . 58,300 45,963
Beijing JingyuntongTechnology Co., Ltd.Class A . . . . . . . . . . . . . 115,000 48,794
Beijing Shiji InformationTechnology Co., Ltd.Class A . . . . . . . . . . . . . 10,000 55,243
Beijing SL PharmaceuticalCo., Ltd. Class A . . . . . . . 25,500 44,564
Beijing Teamsun TechnologyCo., Ltd. Class A (b) . . . . . 27,200 42,088
Beijing Tiantan BiologicalProducts Corp., Ltd.Class A . . . . . . . . . . . . . 24,297 96,593
Berry Genomics Co., Ltd.Class A (b) . . . . . . . . . . . 16,400 70,986
BEST, Inc. ADR (b) (d) . . . . . 13,500 71,280Bestsun Energy Co., Ltd.
Class A . . . . . . . . . . . . . 54,400 53,477Better Life Commercial Chain
Share Co., Ltd. Class A . . . 52,300 54,562Biem.L.Fdlkk Garment Co.,
Ltd. Class A . . . . . . . . . . 12,600 46,051Bitauto Holdings, Ltd. ADR
(b) . . . . . . . . . . . . . . . . 2,803 41,961Blue Sail Medical Co., Ltd.
Class A . . . . . . . . . . . . . 28,300 50,963BOE Technology Group Co.,
Ltd. Class A . . . . . . . . . . 152,400 80,029BOE Technology Group Co.,
Ltd. Class B . . . . . . . . . . 159,000 58,818Brilliance China Automotive
Holdings, Ltd. (d). . . . . . . 426,000 457,550BTG Hotels Group Co., Ltd.
Class A . . . . . . . . . . . . . 19,800 46,553BYD Co., Ltd. Class H (d) . . . 101,800 508,390BYD Electronic International
Co., Ltd. (d) . . . . . . . . . . 119,500 178,959Cangzhou Mingzhu Plastic
Co., Ltd. Class A . . . . . . . 131,500 62,793CAR, Inc. (b) . . . . . . . . . . . 193,043 148,980CCOOP Group Co., Ltd.
Class A (b) . . . . . . . . . . . 150,900 52,827
Security Description Shares Value
CCS Supply ChainManagement Co., Ltd.Class A . . . . . . . . . . . . . 62,100 $ 65,742
CECEP Solar Energy Co.,Ltd. Class A . . . . . . . . . . 109,400 48,257
CGN Nuclear TechnologyDevelopment Co., Ltd.Class A (b) . . . . . . . . . . . 47,400 47,060
CGN Power Co., Ltd. Class H(c) . . . . . . . . . . . . . . . . 1,410,000 356,124
Chacha Food Co., Ltd.Class A . . . . . . . . . . . . . 14,700 52,471
Changchun Faway AutomobileComponents Co., Ltd.Class A . . . . . . . . . . . . . 27,900 46,297
Changjiang Securities Co.,Ltd. Class A . . . . . . . . . . 48,400 47,443
Chengdu Fusen Noble-HouseIndustrial Co., Ltd. Class A. 32,900 56,206
Chengdu Hongqi Chain Co.,Ltd. Class A . . . . . . . . . . 80,497 83,978
Chengdu KanghongPharmaceutical Group Co.,Ltd. Class A . . . . . . . . . . 10,300 48,044
Chengtun Mining Group Co.,Ltd. Class A . . . . . . . . . . 64,800 46,459
China Aerospace InternationalHoldings, Ltd. . . . . . . . . . 308,000 17,287
China Aerospace TimesElectronics Co., Ltd.Class A (b) . . . . . . . . . . . 71,100 60,037
China Agri-IndustriesHoldings, Ltd. . . . . . . . . . 289,000 94,006
China Animal Healthcare, Ltd.(b) (e) . . . . . . . . . . . . . . 305,700 —
China Avionics Systems Co.,Ltd. Class A . . . . . . . . . . 28,997 57,659
China Baoan Group Co., Ltd.Class A . . . . . . . . . . . . . 79,500 49,095
China Bester Group TelecomCo., Ltd. Class A . . . . . . . 11,800 43,788
China Biologic ProductsHoldings, Inc. (b) (d) . . . . 2,104 240,845
China Building Material Test& Certification Group Co.,Ltd. Class A . . . . . . . . . . 27,400 88,824
China Cinda AssetManagement Co., Ltd.Class H . . . . . . . . . . . . . 1,204,600 236,636
China CITIC Bank Corp., Ltd.Class H . . . . . . . . . . . . . 1,457,341 777,060
China Coal Energy Co., Ltd.Class H . . . . . . . . . . . . . 716,000 291,354
China Common RichRenewable EnergyInvestment, Ltd. (b) (d) (e) . 5,962,000 —
China CommunicationsConstruction Co., Ltd.Class H . . . . . . . . . . . . . 648,000 506,702
SPDR S&P EMERGING ASIA PACIFIC ETFSCHEDULE OF INVESTMENTS (continued)September 30, 2019
See accompanying notes to financial statements.105
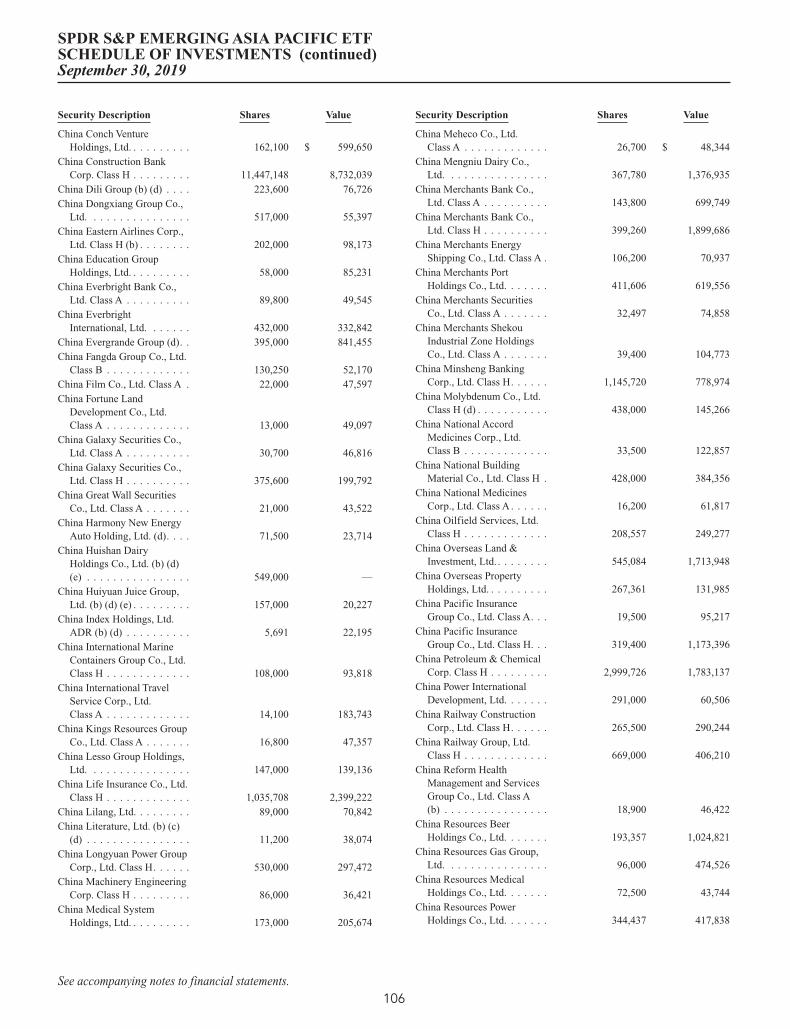
Security Description Shares Value
China Conch VentureHoldings, Ltd. . . . . . . . . . 162,100 $ 599,650
China Construction BankCorp. Class H . . . . . . . . . 11,447,148 8,732,039
China Dili Group (b) (d) . . . . 223,600 76,726China Dongxiang Group Co.,
Ltd. . . . . . . . . . . . . . . . 517,000 55,397China Eastern Airlines Corp.,
Ltd. Class H (b) . . . . . . . . 202,000 98,173China Education Group
Holdings, Ltd. . . . . . . . . . 58,000 85,231China Everbright Bank Co.,
Ltd. Class A . . . . . . . . . . 89,800 49,545China Everbright
International, Ltd. . . . . . . 432,000 332,842China Evergrande Group (d). . 395,000 841,455China Fangda Group Co., Ltd.
Class B . . . . . . . . . . . . . 130,250 52,170China Film Co., Ltd. Class A . 22,000 47,597China Fortune Land
Development Co., Ltd.Class A . . . . . . . . . . . . . 13,000 49,097
China Galaxy Securities Co.,Ltd. Class A . . . . . . . . . . 30,700 46,816
China Galaxy Securities Co.,Ltd. Class H . . . . . . . . . . 375,600 199,792
China Great Wall SecuritiesCo., Ltd. Class A . . . . . . . 21,000 43,522
China Harmony New EnergyAuto Holding, Ltd. (d). . . . 71,500 23,714
China Huishan DairyHoldings Co., Ltd. (b) (d)(e) . . . . . . . . . . . . . . . . 549,000 —
China Huiyuan Juice Group,Ltd. (b) (d) (e) . . . . . . . . . 157,000 20,227
China Index Holdings, Ltd.ADR (b) (d) . . . . . . . . . . 5,691 22,195
China International MarineContainers Group Co., Ltd.Class H . . . . . . . . . . . . . 108,000 93,818
China International TravelService Corp., Ltd.Class A . . . . . . . . . . . . . 14,100 183,743
China Kings Resources GroupCo., Ltd. Class A . . . . . . . 16,800 47,357
China Lesso Group Holdings,Ltd. . . . . . . . . . . . . . . . 147,000 139,136
China Life Insurance Co., Ltd.Class H . . . . . . . . . . . . . 1,035,708 2,399,222
China Lilang, Ltd. . . . . . . . . 89,000 70,842China Literature, Ltd. (b) (c)
(d) . . . . . . . . . . . . . . . . 11,200 38,074China Longyuan Power Group
Corp., Ltd. Class H. . . . . . 530,000 297,472China Machinery Engineering
Corp. Class H . . . . . . . . . 86,000 36,421China Medical System
Holdings, Ltd. . . . . . . . . . 173,000 205,674
Security Description Shares Value
China Meheco Co., Ltd.Class A . . . . . . . . . . . . . 26,700 $ 48,344
China Mengniu Dairy Co.,Ltd. . . . . . . . . . . . . . . . 367,780 1,376,935
China Merchants Bank Co.,Ltd. Class A . . . . . . . . . . 143,800 699,749
China Merchants Bank Co.,Ltd. Class H . . . . . . . . . . 399,260 1,899,686
China Merchants EnergyShipping Co., Ltd. Class A . 106,200 70,937
China Merchants PortHoldings Co., Ltd. . . . . . . 411,606 619,556
China Merchants SecuritiesCo., Ltd. Class A . . . . . . . 32,497 74,858
China Merchants ShekouIndustrial Zone HoldingsCo., Ltd. Class A . . . . . . . 39,400 104,773
China Minsheng BankingCorp., Ltd. Class H. . . . . . 1,145,720 778,974
China Molybdenum Co., Ltd.Class H (d) . . . . . . . . . . . 438,000 145,266
China National AccordMedicines Corp., Ltd.Class B . . . . . . . . . . . . . 33,500 122,857
China National BuildingMaterial Co., Ltd. Class H . 428,000 384,356
China National MedicinesCorp., Ltd. Class A . . . . . . 16,200 61,817
China Oilfield Services, Ltd.Class H . . . . . . . . . . . . . 208,557 249,277
China Overseas Land &Investment, Ltd. . . . . . . . . 545,084 1,713,948
China Overseas PropertyHoldings, Ltd. . . . . . . . . . 267,361 131,985
China Pacific InsuranceGroup Co., Ltd. Class A. . . 19,500 95,217
China Pacific InsuranceGroup Co., Ltd. Class H. . . 319,400 1,173,396
China Petroleum & ChemicalCorp. Class H . . . . . . . . . 2,999,726 1,783,137
China Power InternationalDevelopment, Ltd. . . . . . . 291,000 60,506
China Railway ConstructionCorp., Ltd. Class H. . . . . . 265,500 290,244
China Railway Group, Ltd.Class H . . . . . . . . . . . . . 669,000 406,210
China Reform HealthManagement and ServicesGroup Co., Ltd. Class A(b) . . . . . . . . . . . . . . . . 18,900 46,422
China Resources BeerHoldings Co., Ltd. . . . . . . 193,357 1,024,821
China Resources Gas Group,Ltd. . . . . . . . . . . . . . . . 96,000 474,526
China Resources MedicalHoldings Co., Ltd. . . . . . . 72,500 43,744
China Resources PowerHoldings Co., Ltd. . . . . . . 344,437 417,838
SPDR S&P EMERGING ASIA PACIFIC ETFSCHEDULE OF INVESTMENTS (continued)September 30, 2019
See accompanying notes to financial statements.106
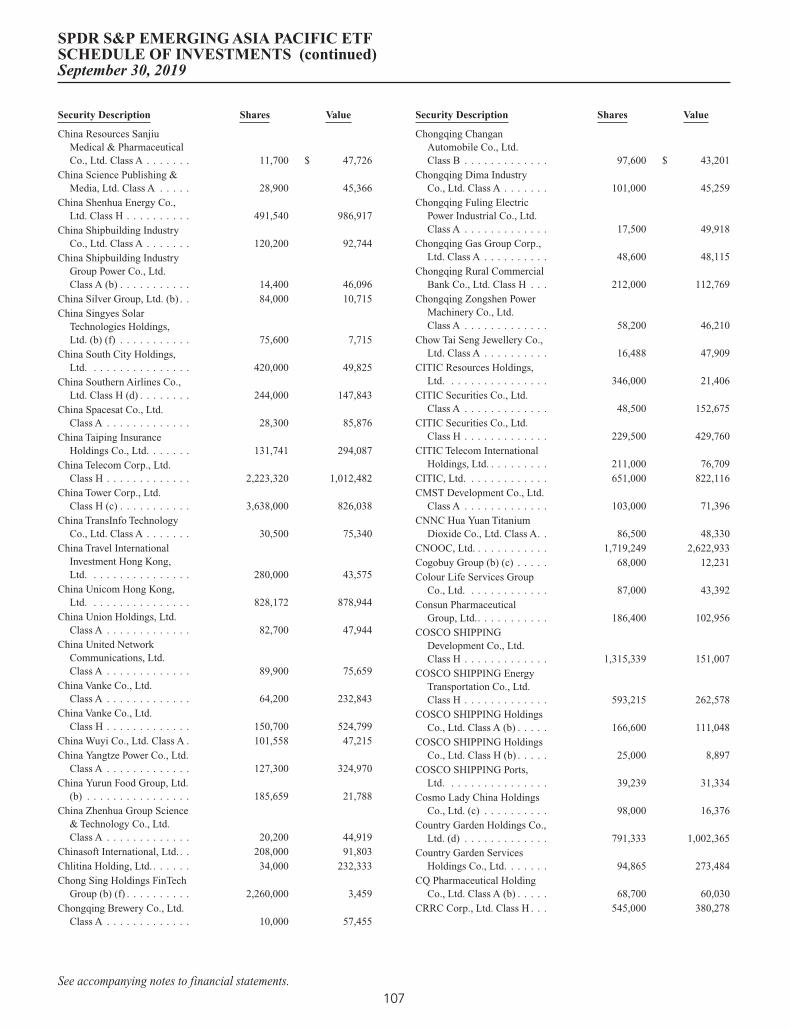
Security Description Shares Value
China Resources SanjiuMedical & PharmaceuticalCo., Ltd. Class A . . . . . . . 11,700 $ 47,726
China Science Publishing &Media, Ltd. Class A . . . . . 28,900 45,366
China Shenhua Energy Co.,Ltd. Class H . . . . . . . . . . 491,540 986,917
China Shipbuilding IndustryCo., Ltd. Class A . . . . . . . 120,200 92,744
China Shipbuilding IndustryGroup Power Co., Ltd.Class A (b) . . . . . . . . . . . 14,400 46,096
China Silver Group, Ltd. (b) . . 84,000 10,715China Singyes Solar
Technologies Holdings,Ltd. (b) (f) . . . . . . . . . . . 75,600 7,715
China South City Holdings,Ltd. . . . . . . . . . . . . . . . 420,000 49,825
China Southern Airlines Co.,Ltd. Class H (d) . . . . . . . . 244,000 147,843
China Spacesat Co., Ltd.Class A . . . . . . . . . . . . . 28,300 85,876
China Taiping InsuranceHoldings Co., Ltd. . . . . . . 131,741 294,087
China Telecom Corp., Ltd.Class H . . . . . . . . . . . . . 2,223,320 1,012,482
China Tower Corp., Ltd.Class H (c) . . . . . . . . . . . 3,638,000 826,038
China TransInfo TechnologyCo., Ltd. Class A . . . . . . . 30,500 75,340
China Travel InternationalInvestment Hong Kong,Ltd. . . . . . . . . . . . . . . . 280,000 43,575
China Unicom Hong Kong,Ltd. . . . . . . . . . . . . . . . 828,172 878,944
China Union Holdings, Ltd.Class A . . . . . . . . . . . . . 82,700 47,944
China United NetworkCommunications, Ltd.Class A . . . . . . . . . . . . . 89,900 75,659
China Vanke Co., Ltd.Class A . . . . . . . . . . . . . 64,200 232,843
China Vanke Co., Ltd.Class H . . . . . . . . . . . . . 150,700 524,799
China Wuyi Co., Ltd. Class A . 101,558 47,215China Yangtze Power Co., Ltd.
Class A . . . . . . . . . . . . . 127,300 324,970China Yurun Food Group, Ltd.
(b) . . . . . . . . . . . . . . . . 185,659 21,788China Zhenhua Group Science
& Technology Co., Ltd.Class A . . . . . . . . . . . . . 20,200 44,919
Chinasoft International, Ltd. . . 208,000 91,803Chlitina Holding, Ltd. . . . . . . 34,000 232,333Chong Sing Holdings FinTech
Group (b) (f) . . . . . . . . . . 2,260,000 3,459Chongqing Brewery Co., Ltd.
Class A . . . . . . . . . . . . . 10,000 57,455
Security Description Shares Value
Chongqing ChanganAutomobile Co., Ltd.Class B . . . . . . . . . . . . . 97,600 $ 43,201
Chongqing Dima IndustryCo., Ltd. Class A . . . . . . . 101,000 45,259
Chongqing Fuling ElectricPower Industrial Co., Ltd.Class A . . . . . . . . . . . . . 17,500 49,918
Chongqing Gas Group Corp.,Ltd. Class A . . . . . . . . . . 48,600 48,115
Chongqing Rural CommercialBank Co., Ltd. Class H . . . 212,000 112,769
Chongqing Zongshen PowerMachinery Co., Ltd.Class A . . . . . . . . . . . . . 58,200 46,210
Chow Tai Seng Jewellery Co.,Ltd. Class A . . . . . . . . . . 16,488 47,909
CITIC Resources Holdings,Ltd. . . . . . . . . . . . . . . . 346,000 21,406
CITIC Securities Co., Ltd.Class A . . . . . . . . . . . . . 48,500 152,675
CITIC Securities Co., Ltd.Class H . . . . . . . . . . . . . 229,500 429,760
CITIC Telecom InternationalHoldings, Ltd. . . . . . . . . . 211,000 76,709
CITIC, Ltd. . . . . . . . . . . . . 651,000 822,116CMST Development Co., Ltd.
Class A . . . . . . . . . . . . . 103,000 71,396CNNC Hua Yuan Titanium
Dioxide Co., Ltd. Class A. . 86,500 48,330CNOOC, Ltd. . . . . . . . . . . . 1,719,249 2,622,933Cogobuy Group (b) (c) . . . . . 68,000 12,231Colour Life Services Group
Co., Ltd. . . . . . . . . . . . . 87,000 43,392Consun Pharmaceutical
Group, Ltd.. . . . . . . . . . . 186,400 102,956COSCO SHIPPING
Development Co., Ltd.Class H . . . . . . . . . . . . . 1,315,339 151,007
COSCO SHIPPING EnergyTransportation Co., Ltd.Class H . . . . . . . . . . . . . 593,215 262,578
COSCO SHIPPING HoldingsCo., Ltd. Class A (b) . . . . . 166,600 111,048
COSCO SHIPPING HoldingsCo., Ltd. Class H (b) . . . . . 25,000 8,897
COSCO SHIPPING Ports,Ltd. . . . . . . . . . . . . . . . 39,239 31,334
Cosmo Lady China HoldingsCo., Ltd. (c) . . . . . . . . . . 98,000 16,376
Country Garden Holdings Co.,Ltd. (d) . . . . . . . . . . . . . 791,333 1,002,365
Country Garden ServicesHoldings Co., Ltd. . . . . . . 94,865 273,484
CQ Pharmaceutical HoldingCo., Ltd. Class A (b) . . . . . 68,700 60,030
CRRC Corp., Ltd. Class H . . . 545,000 380,278
SPDR S&P EMERGING ASIA PACIFIC ETFSCHEDULE OF INVESTMENTS (continued)September 30, 2019
See accompanying notes to financial statements.107

Security Description Shares Value
CSC Financial Co., Ltd.Class A . . . . . . . . . . . . . 17,700 $ 55,322
CSG Holding Co., Ltd.Class B . . . . . . . . . . . . . 164,450 52,024
CSPC Pharmaceutical Group,Ltd. . . . . . . . . . . . . . . . 456,000 915,560
CSSC Offshore and MarineEngineering Group Co.,Ltd. Class A (b) . . . . . . . . 18,400 43,828
CT Environmental Group, Ltd.(b) (e) . . . . . . . . . . . . . . 438,000 9,498
Ctrip.com International, Ltd.ADR (b) . . . . . . . . . . . . 40,406 1,183,492
CTS International LogisticsCorp., Ltd. Class A . . . . . . 48,600 47,231
CWT International, Ltd. (b)(f). . . . . . . . . . . . . . . . . 463,400 7,803
D&O Home Collection Co.,Ltd. Class A . . . . . . . . . . 18,900 52,641
Da An Gene Co., Ltd. of SunYat-Sen University Class A. 33,400 47,239
Dalian Huarui Heavy IndustryGroup Co., Ltd. Class A. . . 101,600 46,523
Datang International PowerGeneration Co., Ltd.Class H . . . . . . . . . . . . . 394,000 81,419
Datong Coal Industry Co.,Ltd. Class A (b) . . . . . . . . 154,000 90,573
Dazhong TransportationGroup Co., Ltd. Class B. . . 215,750 102,050
Dazzle Fashion Co., Ltd.Class A . . . . . . . . . . . . . 15,787 49,343
Deppon Logistics Co., Ltd.Class A . . . . . . . . . . . . . 25,600 47,391
DHC Software Co., Ltd.Class A . . . . . . . . . . . . . 88,900 83,906
Digital China Group Co., Ltd.Class A . . . . . . . . . . . . . 32,700 72,532
Digital China InformationService Co., Ltd. Class A . . 36,900 64,900
Dongfang Electric Corp., Ltd.Class H . . . . . . . . . . . . . 12,400 6,896
Dongfeng Motor Group Co.,Ltd. Class H . . . . . . . . . . 520,468 494,615
Dongguan DevelopmentHoldings Co., Ltd. Class A . 42,300 48,216
Double Medical Technology,Inc. Class A . . . . . . . . . . 12,700 84,172
Easysight Supply ChainManagement Co., Ltd.Class A (b) . . . . . . . . . . . 27,700 43,599
Ecovacs Robotics Co., Ltd.Class A . . . . . . . . . . . . . 14,400 44,362
EGLS Co., Ltd. Class A (b) . . 117,000 46,530Everbright Securities Co., Ltd.
Class A . . . . . . . . . . . . . 29,500 46,804Fanhua, Inc. ADR (d) . . . . . . 9,147 243,585Far East Horizon, Ltd. . . . . . . 162,000 150,440
Security Description Shares Value
FAW CAR Co., Ltd. Class A. . 41,100 $ 47,769FAWER Automotive Parts
Co., Ltd. Class A . . . . . . . 73,400 48,206FIH Mobile, Ltd. (b) (d) . . . . 317,000 38,819First Tractor Co., Ltd. Class H
(b) . . . . . . . . . . . . . . . . 68,000 14,139Flat Glass Group Co., Ltd.
Class A . . . . . . . . . . . . . 31,600 44,826Focus Media Information
Technology Co., Ltd.Class A . . . . . . . . . . . . . 99,000 72,782
Foshan Gas Group Co., Ltd.Class A . . . . . . . . . . . . . 21,100 51,146
Foshan Haitian Flavouring &Food Co., Ltd. Class A . . . 17,200 264,725
Founder Securities Co., Ltd.Class A . . . . . . . . . . . . . 49,900 48,145
Foxconn Industrial InternetCo., Ltd. Class A . . . . . . . 25,000 50,412
Fufeng Group, Ltd. (d) . . . . . 119,000 54,495Fujian Star-net
Communication Co., Ltd.Class A . . . . . . . . . . . . . 12,300 53,050
Fujian Sunner DevelopmentCo., Ltd. Class A . . . . . . . 13,000 44,892
Future Land DevelopmentHoldings, Ltd. (d). . . . . . . 84,000 73,291
Fuyao Glass Industry GroupCo., Ltd. Class A . . . . . . . 19,200 57,752
Gansu Jingyuan Coal Industryand Electricity Power Co.,Ltd. Class A . . . . . . . . . . 331,600 114,230
GCI Science & TechnologyCo., Ltd. Class A . . . . . . . 28,396 49,665
GCL System IntegrationTechnology Co., Ltd.Class A (b) . . . . . . . . . . . 69,700 65,491
GDS Holdings, Ltd. ADR (b) . 5,487 219,919Geely Automobile Holdings,
Ltd. (d) . . . . . . . . . . . . . 615,000 1,043,383Gem-Year Industrial Co., Ltd.
Class A (b) . . . . . . . . . . . 56,300 47,855Genimous Technology Co.,
Ltd. Class A . . . . . . . . . . 54,300 45,394Genscript Biotech Corp. (b)
(d) . . . . . . . . . . . . . . . . 72,000 137,949Getein Biotech, Inc. Class A. . 17,300 56,591GF Securities Co., Ltd.
Class H (b) . . . . . . . . . . . 115,400 120,855Giant Network Group Co.,
Ltd. Class A . . . . . . . . . . 19,200 50,815Global Top E-Commerce Co.,
Ltd. Class A . . . . . . . . . . 50,600 53,780Glodon Co., Ltd. Class A. . . . 12,000 59,637GoerTek, Inc. Class A . . . . . . 31,600 77,792Golden Eagle Retail Group,
Ltd. (d) . . . . . . . . . . . . . 98,000 106,508
SPDR S&P EMERGING ASIA PACIFIC ETFSCHEDULE OF INVESTMENTS (continued)September 30, 2019
See accompanying notes to financial statements.108

Security Description Shares Value
Goldenmax InternationalTechnology, Ltd. Class A(b) . . . . . . . . . . . . . . . . 37,900 $ 47,234
GOME Retail Holdings, Ltd.(b) (d) . . . . . . . . . . . . . . 1,653,322 149,738
Goodbaby InternationalHoldings, Ltd. (b). . . . . . . 267,000 40,189
Grandblue Environment Co.,Ltd. Class A . . . . . . . . . . 19,628 48,704
Great Wall Motor Co., Ltd.Class H (d) . . . . . . . . . . . 384,000 257,163
Greattown Holdings, Ltd.Class A . . . . . . . . . . . . . 44,500 45,926
Gree Electric Appliances, Inc.of Zhuhai Class A. . . . . . . 47,000 377,121
Gree Real Estate Co., Ltd.Class A (b) . . . . . . . . . . . 72,100 54,217
Greentown China Holdings,Ltd. (d) . . . . . . . . . . . . . 109,000 88,291
Grinm Advanced MaterialsCo., Ltd. Class A . . . . . . . 30,800 46,969
Guangdong Haid Group Co.,Ltd. Class A . . . . . . . . . . 10,500 46,022
Guangdong Hongda BlastingCo., Ltd. Class A . . . . . . . 24,000 46,312
Guangdong HotataTechnology Group Co.,Ltd. Class A . . . . . . . . . . 22,900 48,165
Guangdong Huatie TongdaHigh-speed RailwayEquipment Corp. Class A(b) . . . . . . . . . . . . . . . . 63,800 46,189
Guangdong LY IntelligentManufacturing Co., Ltd.Class A (b) . . . . . . . . . . . 44,000 57,671
Guangdong Vanward NewElectric Co., Ltd. Class A . . 50,700 66,879
Guangdong Xinbao ElectricalAppliances Holdings Co.,Ltd. Class A . . . . . . . . . . 41,200 73,040
Guangshen Railway Co., Ltd.Class H . . . . . . . . . . . . . 70,500 22,303
Guangxi LiuzhouPharmaceutical Co., Ltd.Class A . . . . . . . . . . . . . 17,900 89,635
Guangzhou AutomobileGroup Co., Ltd. Class H. . . 494,844 473,420
Guangzhou BaiyunInternational Airport Co.,Ltd. Class A . . . . . . . . . . 18,000 56,587
Guangzhou BaiyunshanPharmaceutical HoldingsCo., Ltd. Class H . . . . . . . 86,000 283,580
Guangzhou HaigeCommunications Group,Inc. Co. Class A. . . . . . . . 35,400 48,580
Guangzhou Holike CreativeHome Co., Ltd. Class A . . . 38,500 78,712
Security Description Shares Value
Guangzhou KingmedDiagnostics Group Co.,Ltd. Class A . . . . . . . . . . 9,992 $ 78,327
Guangzhou R&F PropertiesCo., Ltd. Class H . . . . . . . 339,376 513,432
Guangzhou Restaurant GroupCo., Ltd. Class A . . . . . . . 11,000 51,756
Guizhou Panjiang RefinedCoal Co., Ltd. Class A. . . . 120,984 86,911
Guizhou Space Appliance Co.,Ltd. Class A . . . . . . . . . . 21,400 77,794
Guocheng Mining Co., Ltd.Class A (b) . . . . . . . . . . . 47,900 68,752
Guomai Technologies, Inc.Class A . . . . . . . . . . . . . 46,900 57,860
Guosen Securities Co., Ltd.Class A . . . . . . . . . . . . . 38,000 65,345
Guotai Junan InternationalHoldings, Ltd. (d). . . . . . . 274,000 46,486
Guotai Junan Securities Co.,Ltd. Class A . . . . . . . . . . 37,800 93,002
Haidilao InternationalHolding, Ltd. (c) . . . . . . . 39,000 166,658
Haier Smart Home Co., Ltd.Class A . . . . . . . . . . . . . 36,600 78,415
Hailir Pesticides andChemicals Group Co., Ltd.Class A . . . . . . . . . . . . . 13,800 48,582
Hainan Strait Shipping Co.,Ltd. Class A . . . . . . . . . . 47,900 53,593
Haining China Leather MarketCo., Ltd. Class A . . . . . . . 88,200 51,503
Haisco Pharmaceutical GroupCo., Ltd. Class A . . . . . . . 18,600 47,248
Haitian InternationalHoldings, Ltd. . . . . . . . . . 75,000 153,647
Haitong Securities Co., Ltd.Class A . . . . . . . . . . . . . 25,700 51,463
Haitong Securities Co., Ltd.Class H . . . . . . . . . . . . . 360,800 378,317
Hang Zhou Great StarIndustrial Co., Ltd. Class A(b) . . . . . . . . . . . . . . . . 52,400 80,495
Hangcha Group Co., Ltd.Class A . . . . . . . . . . . . . 32,100 54,435
Hangzhou First AppliedMaterial Co., Ltd. Class A . 11,900 75,654
Hangzhou Hangyang Co., Ltd.Class A . . . . . . . . . . . . . 26,100 46,088
Hangzhou Hikvision DigitalTechnology Co., Ltd.Class A . . . . . . . . . . . . . 71,300 322,493
Hangzhou Jiebai Group Co.,Ltd. Class A . . . . . . . . . . 216,800 149,366
Hangzhou Lianluo InteractiveInformation TechnologyCo., Ltd. Class A (b) . . . . . 196,494 89,976
Hangzhou Robam AppliancesCo., Ltd. Class A . . . . . . . 15,000 55,243
SPDR S&P EMERGING ASIA PACIFIC ETFSCHEDULE OF INVESTMENTS (continued)September 30, 2019
See accompanying notes to financial statements.109

Security Description Shares Value
Hangzhou SilanMicroelectronics Co., Ltd.Class A . . . . . . . . . . . . . 20,100 $ 42,642
Han’s Laser TechnologyIndustry Group Co., Ltd.Class A . . . . . . . . . . . . . 10,000 49,782
Harbin Boshi Automation Co.,Ltd. Class A . . . . . . . . . . 38,989 53,669
Health & Happiness H&HInternational Holdings, Ltd.(d) . . . . . . . . . . . . . . . . 26,000 109,613
Hefei Meiya OptoelectronicTechnology, Inc. Class A . . 11,700 54,247
Henan Lingrui PharmaceuticalCo. Class A . . . . . . . . . . 41,400 47,654
Hengan International GroupCo., Ltd. . . . . . . . . . . . . 94,500 619,601
Hengdian Entertainment Co.,Ltd. Class A . . . . . . . . . . 23,000 48,408
Hengdian Group DMEGCMagnetics Co., Ltd.Class A . . . . . . . . . . . . . 51,000 48,706
Hengli Petrochemical Co.,Ltd. Class A . . . . . . . . . . 30,600 63,975
Hexing Electrical Co., Ltd.Class A . . . . . . . . . . . . . 19,800 51,710
Hisense Home AppliancesGroup Co., Ltd. Class A. . . 47,600 72,321
Hua Hong Semiconductor,Ltd. (c) (d) . . . . . . . . . . . 34,000 67,658
Huada AutomotiveTechnology Corp., Ltd.Class A . . . . . . . . . . . . . 26,200 50,117
Huadian Fuxin Energy Corp.,Ltd. Class H . . . . . . . . . . 224,000 39,146
Huadian Power InternationalCorp., Ltd. Class H. . . . . . 242,000 91,992
Huadong Medicine Co., Ltd.Class A . . . . . . . . . . . . . 19,300 70,809
Hualan BiologicalEngineering, Inc. Class A . . 17,896 85,957
Huaneng Power International,Inc. Class H . . . . . . . . . . 652,472 313,776
Huaneng Renewables Corp.,Ltd. Class H . . . . . . . . . . 420,000 143,047
Huangshan TourismDevelopment Co., Ltd.Class B . . . . . . . . . . . . . 51,300 49,761
Huangshi Dongbei ElectricalAppliance Co., Ltd.Class B . . . . . . . . . . . . . 76,800 85,402
Huatai Securities Co., Ltd.Class A . . . . . . . . . . . . . 67,400 180,175
Huatai Securities Co., Ltd.Class H (c) (d). . . . . . . . . 76,600 114,713
Huaxin Cement Co., Ltd.Class B . . . . . . . . . . . . . 30,100 59,146
Huayu Automotive SystemsCo., Ltd. Class A . . . . . . . 18,000 59,234
Security Description Shares Value
Huazhu Group, Ltd. ADR (d) . 15,830 $ 522,707Hubei Biocause
Pharmaceutical Co., Ltd.Class A . . . . . . . . . . . . . 49,300 48,670
Huizhou Desay SvAutomotive Co., Ltd.Class A . . . . . . . . . . . . . 14,500 47,818
Hunan Aihua Group Co., Ltd.Class A . . . . . . . . . . . . . 17,400 47,269
Hundsun Technologies, Inc.Class A . . . . . . . . . . . . . 10,000 103,526
Huolinhe Opencut CoalIndustry Corp., Ltd. ofInner Mongolia Class A (b). 63,300 72,419
HY Energy Group Co., Ltd.Class A . . . . . . . . . . . . . 74,900 88,313
Hytera CommunicationsCorp., Ltd. Class A . . . . . . 33,100 47,556
Iflytek Co., Ltd. Class A (b) . . 15,200 67,814IKD Co., Ltd. Class A. . . . . . 32,100 47,018Industrial & Commercial
Bank of China, Ltd.Class A . . . . . . . . . . . . . 193,300 149,688
Industrial & CommercialBank of China, Ltd.Class H . . . . . . . . . . . . . 8,288,138 5,550,517
Industrial Bank Co., Ltd.Class A . . . . . . . . . . . . . 103,800 254,805
INESA Intelligent Tech, Inc.Class B . . . . . . . . . . . . . 543,000 336,660
Inner Mongolia XingyeMining Co., Ltd. Class A(b) . . . . . . . . . . . . . . . . 61,000 45,785
Inner Mongolia Yili IndustrialGroup Co., Ltd. Class A. . . 28,500 113,821
Inner Mongolia Yitai CoalCo., Ltd. Class B . . . . . . . 218,981 200,806
Innovent Biologics, Inc. (b)(c) . . . . . . . . . . . . . . . . 41,000 130,488
iQIYI, Inc. ADR (b) (d). . . . . 21,690 349,860IReader Technology Co., Ltd.
Class A . . . . . . . . . . . . . 23,000 46,089Jack Sewing Machine Co.,
Ltd. Class A . . . . . . . . . . 16,700 47,496Jason Furniture Hangzhou
Co., Ltd. Class A . . . . . . . 10,300 49,083JC Finance & Tax
Interconnect Holdings, Ltd.Class A (b) . . . . . . . . . . . 33,800 44,112
JD.com, Inc. ADR (b) . . . . . . 97,146 2,740,489Jiajiayue Group Co., Ltd.
Class A . . . . . . . . . . . . . 19,900 74,181Jiangsu Akcome Science &
Technology Co., Ltd.Class A (b) . . . . . . . . . . . 329,500 74,287
Jiangsu ChangjiangElectronics TechnologyCo., Ltd. Class A (b) . . . . . 19,400 46,753
SPDR S&P EMERGING ASIA PACIFIC ETFSCHEDULE OF INVESTMENTS (continued)September 30, 2019
See accompanying notes to financial statements.110

Security Description Shares Value
Jiangsu Etern Co., Ltd.Class A . . . . . . . . . . . . . 81,000 $ 45,371
Jiangsu Expressway Co., Ltd.Class H . . . . . . . . . . . . . 396,299 503,500
Jiangsu Flowers KingHorticulture Co., Ltd.Class A . . . . . . . . . . . . . 46,400 45,937
Jiangsu Guotai InternationalGroup Co., Ltd. Class A. . . 140,100 105,155
Jiangsu Hengli Hydraulic Co.,Ltd. Class A . . . . . . . . . . 10,196 54,969
Jiangsu Hengrui MedicineCo., Ltd. Class A . . . . . . . 34,600 390,905
Jiangsu KanionPharmaceutical Co., Ltd.Class A . . . . . . . . . . . . . 33,700 79,281
Jiangsu King’s Luck BreweryJSC, Ltd. Class A . . . . . . . 12,200 55,215
Jiangsu Leike DefenseTechnology Co., Ltd.Class A (b) . . . . . . . . . . . 62,700 52,153
Jiangsu Yanghe BreweryJoint-Stock Co., Ltd.Class A . . . . . . . . . . . . . 10,000 145,634
Jiangsu Yangnong ChemicalCo., Ltd. Class A . . . . . . . 10,000 69,736
Jiangsu Yoke Technology Co.,Ltd. Class A . . . . . . . . . . 18,500 53,418
Jiangsu Yuyue MedicalEquipment & Supply Co.,Ltd. Class A . . . . . . . . . . 20,097 60,787
Jiangsu ZhongnanConstruction Group Co.,Ltd. Class A . . . . . . . . . . 43,300 47,052
Jiangxi Copper Co., Ltd.Class H . . . . . . . . . . . . . 291,578 337,721
Jiangxi LianchuangOptoelectronic Science &Technology Co., Ltd.Class A . . . . . . . . . . . . . 27,500 48,252
Jiangxi ZhengbangTechnology Co., Ltd.Class A . . . . . . . . . . . . . 20,300 42,953
Jiayou International LogisticsCo., Ltd. Class A . . . . . . . 16,280 68,027
JinkoSolar Holding Co., Ltd.ADR (b) (d) . . . . . . . . . . 3,511 56,000
Jinneng Science&TechnologyCo., Ltd. Class A . . . . . . . 31,600 47,569
Jinxi Axle Co., Ltd. Class A . . 82,100 49,781Jinyu Bio-Technology Co.,
Ltd. Class A . . . . . . . . . . 20,100 53,112Jizhong Energy Resources
Co., Ltd. Class A . . . . . . . 174,900 85,721Joincare Pharmaceutical
Group Industry Co., Ltd.Class A . . . . . . . . . . . . . 38,000 52,201
Joinn Laboratories China Co.,Ltd. Class A . . . . . . . . . . 10,000 94,942
Security Description Shares Value
Jointown PharmaceuticalGroup Co., Ltd. Class A. . . 25,800 $ 51,555
Joy City Property, Ltd. . . . . . 484,000 51,244Joyoung Co., Ltd. Class A . . . 27,800 85,177Juewei Food Co., Ltd. Class A. 10,000 56,797Jumei International Holding,
Ltd. ADR (b). . . . . . . . . . 2,695 5,713Kama Co., Ltd. Class B (b) . . 196,449 97,439Kangda International
Environmental Co., Ltd. (b)(c) . . . . . . . . . . . . . . . . 220,000 23,293
Keda Clean Energy Co., Ltd.Class A (b) . . . . . . . . . . . 82,500 46,788
KingClean Electric Co., Ltd.Class A . . . . . . . . . . . . . 17,200 52,772
Kingdee InternationalSoftware Group Co., Ltd. . . 249,000 262,359
Kingsoft Corp., Ltd. (b) (d) . . 109,000 231,365Konka Group Co., Ltd.
Class B . . . . . . . . . . . . . 373,500 118,157KTK Group Co., Ltd. Class A . 31,958 50,301Kuang-Chi Technologies Co.,
Ltd. Class A (b) . . . . . . . . 37,900 47,553Kunlun Energy Co., Ltd. . . . . 446,000 384,022Kunshan Kersen Science &
Technology Co., Ltd.Class A . . . . . . . . . . . . . 44,600 52,899
Kunwu Jiuding InvestmentHoldings Co., Ltd. Class A . 15,900 46,846
Kweichow Moutai Co., Ltd.Class A . . . . . . . . . . . . . 10,000 1,610,374
KWG Group Holdings, Ltd. . . 182,951 160,328Lao Feng Xiang Co., Ltd.
Class B . . . . . . . . . . . . . 61,179 206,663Launch Tech Co., Ltd.
Class H . . . . . . . . . . . . . 29,600 16,387Lenovo Group, Ltd. . . . . . . . 985,703 657,605LexinFintech Holdings, Ltd.
ADR (b) (d) . . . . . . . . . . 7,259 72,808Leyou Technologies Holdings,
Ltd. (b) . . . . . . . . . . . . . 245,800 79,327Li Ning Co., Ltd. . . . . . . . . . 265,874 763,090Lifetech Scientific Corp. (b). . 272,000 47,881Lionco Pharmaceutical Group
Co., Ltd. Class A . . . . . . . 63,300 73,306Livzon Pharmaceutical Group,
Inc. Class H . . . . . . . . . . 43,597 111,781Longfor Group Holdings, Ltd.
(c) . . . . . . . . . . . . . . . . 49,500 185,008LONGi Green Energy
Technology Co., Ltd.Class A . . . . . . . . . . . . . 38,900 142,882
Luenmei Quantum Co., Ltd.Class A . . . . . . . . . . . . . 35,000 54,893
Luolai Lifestyle TechnologyCo., Ltd. Class A . . . . . . . 38,600 48,864
Luthai Textile Co., Ltd.Class B . . . . . . . . . . . . . 50,400 50,082
SPDR S&P EMERGING ASIA PACIFIC ETFSCHEDULE OF INVESTMENTS (continued)September 30, 2019
See accompanying notes to financial statements.111

Security Description Shares Value
Luxshare Precision IndustryCo., Ltd. Class A . . . . . . . 47,700 $ 178,745
Luye Pharma Group, Ltd. (c) . 215,500 153,665Luzhou Laojiao Co., Ltd.
Class A . . . . . . . . . . . . . 11,300 134,849Maanshan Iron & Steel Co.,
Ltd. Class H (d) . . . . . . . . 784,971 295,388Maoye Commericial Co., Ltd.
Class A . . . . . . . . . . . . . 74,200 49,666Markor International Home
Furnishings Co., Ltd.Class A . . . . . . . . . . . . . 89,300 49,269
Mayinglong PharmaceuticalGroup Co., Ltd. Class A. . . 20,600 48,376
Meinian Onehealth HealthcareHoldings Co., Ltd. Class A . 46,100 78,499
Meituan Dianping Class B (b). 386,300 3,947,066Metallurgical Corp. of China,
Ltd. Class H . . . . . . . . . . 464,000 104,171Milkyway Chemical Supply
Chain Service Co., Ltd.Class A . . . . . . . . . . . . . 10,700 48,172
Minth Group, Ltd. (d) . . . . . . 96,000 325,127MLS Co., Ltd. Class A . . . . . 32,800 52,407Momo, Inc. ADR . . . . . . . . . 14,313 443,417Montnets Rongxin Technology
Group Co., Ltd. Class A(b) . . . . . . . . . . . . . . . . 20,300 47,842
Muyuan Foodstuff Co., Ltd.Class A . . . . . . . . . . . . . 16,900 166,842
NanJi E-Commerce Co., Ltd.Class A (b) . . . . . . . . . . . 39,000 56,306
Nanjing King-FriendBiochemicalPharmaceutical Co., Ltd.Class A . . . . . . . . . . . . . 10,448 54,353
Nanjing Well PharmaceuticalCo., Ltd. Class A . . . . . . . 10,175 47,176
Nanjing XinjiekouDepartment Store Co., Ltd.Class A (b) . . . . . . . . . . . 28,500 43,022
National AgriculturalHoldings, Ltd. (b) (d) (e) . . 112,000 4,250
NavInfo Co., Ltd. Class A . . . 26,900 61,325NetEase, Inc. ADR. . . . . . . . 10,007 2,663,663New China Life Insurance
Co., Ltd. Class A . . . . . . . 10,000 68,154New China Life Insurance
Co., Ltd. Class H . . . . . . . 85,200 336,914New Hope Liuhe Co., Ltd.
Class A . . . . . . . . . . . . . 32,900 79,103New Oriental Education &
Technology Group, Inc.ADR (b) . . . . . . . . . . . . 14,949 1,655,751
Newland Digital TechnologyCo., Ltd. Class A . . . . . . . 19,699 45,184
Ningbo Huaxiang ElectronicCo., Ltd. Class A . . . . . . . 24,500 51,222
Security Description Shares Value
Ningbo Jifeng Auto Parts Co.,Ltd. Class A . . . . . . . . . . 40,900 $ 48,281
Ningbo Tuopu Group Co., Ltd.Class A . . . . . . . . . . . . . 30,800 50,980
Ningbo Xusheng AutoTechnology Co., Ltd.Class A . . . . . . . . . . . . . 12,900 52,242
NIO, Inc. ADR (b) (d) . . . . . . 51,900 80,964Noah Holdings, Ltd. ADR (b)
(d) . . . . . . . . . . . . . . . . 2,740 80,008Northeast Pharmaceutical
Group Co., Ltd. Class A(b) . . . . . . . . . . . . . . . . 43,359 46,934
Offcn Education TechnologyCo., Ltd. Class A . . . . . . . 26,900 61,287
Offshore Oil Engineering Co.,Ltd. Class A . . . . . . . . . . 62,800 47,400
Oppein Home Group, Inc.Class A . . . . . . . . . . . . . 10,000 156,080
Orient Securities Co., Ltd.Class A . . . . . . . . . . . . . 33,100 47,278
PCI-Suntek Technology Co.,Ltd. Class A . . . . . . . . . . 50,390 71,832
Pengxin International MiningCo., Ltd. Class A (b) . . . . . 71,300 45,828
People’s Insurance Co. Groupof China, Ltd. Class A . . . . 39,300 47,328
People’s Insurance Co. Groupof China, Ltd. Class H . . . . 601,000 240,725
Perfect World Co., Ltd.Class A . . . . . . . . . . . . . 12,100 46,935
PetroChina Co., Ltd. Class H . 2,593,208 1,333,090PICC Property & Casualty
Co., Ltd. Class H . . . . . . . 908,433 1,060,306Pinduoduo, Inc. ADR (b) (d). . 36,100 1,163,142Ping An Bank Co., Ltd.
Class A . . . . . . . . . . . . . 100,700 219,839Ping An Healthcare and
Technology Co., Ltd. (b) (c)(d) . . . . . . . . . . . . . . . . 20,200 118,143
Ping An Insurance Group Co.of China, Ltd. Class A . . . . 74,900 912,913
Ping An Insurance Group Co.of China, Ltd. Class H . . . . 568,728 6,532,892
Pingdingshan Tianan CoalMining Co., Ltd. Class A(b) . . . . . . . . . . . . . . . . 124,200 65,916
Poly Culture Group Corp.,Ltd. Class H . . . . . . . . . . 32,200 25,589
Poly Developments andHoldings Group Co., Ltd.Class A . . . . . . . . . . . . . 64,200 128,558
Poly Property Group Co., Ltd.. 300,000 104,472Qianhe Condiment and Food
Co., Ltd. Class A . . . . . . . 16,600 50,164Qingdao East Steel Tower
Stock Co., Ltd. Class A . . . 55,200 49,084
SPDR S&P EMERGING ASIA PACIFIC ETFSCHEDULE OF INVESTMENTS (continued)September 30, 2019
See accompanying notes to financial statements.112

Security Description Shares Value
Qingdao TopscommCommunication, Inc.Class A . . . . . . . . . . . . . 18,500 $ 46,631
Qudian, Inc. ADR (b) (d) . . . . 13,392 92,271Rainbow Department Store
Co., Ltd. Class A . . . . . . . 29,900 50,160Raisecom Technology Co.,
Ltd. Class A . . . . . . . . . . 24,400 45,922SAIC Motor Corp., Ltd.
Class A . . . . . . . . . . . . . 39,500 131,534Sailun Group Co., Ltd.
Class A . . . . . . . . . . . . . 82,300 46,905Sanan Optoelectronics Co.,
Ltd. Class A . . . . . . . . . . 31,700 62,502Sany Heavy Industry Co., Ltd.
Class A . . . . . . . . . . . . . 52,900 105,782SDIC Capital Co., Ltd.
Class A . . . . . . . . . . . . . 28,998 50,596Seazen Holdings Co., Ltd.
Class A . . . . . . . . . . . . . 16,700 66,368Semiconductor Manufacturing
International Corp. (b) (d) . 498,883 623,651SF Holding Co., Ltd. Class A . 14,500 80,041Shaan Xi Provincial Natural
Gas Co., Ltd. Class A . . . . 54,900 54,968Shaanxi Aerospace Power
Hi-Tech Co., Ltd. Class A. . 34,800 46,100Shaanxi Coal Industry Co.,
Ltd. Class A . . . . . . . . . . 74,600 91,197Shaanxi Heimao Coking Co.,
Ltd. Class A . . . . . . . . . . 126,800 60,548Shandong Airlines Co., Ltd.
Class B . . . . . . . . . . . . . 73,400 74,248Shandong Chenming Paper
Holdings, Ltd. Class H . . . 74,350 29,780Shandong Gold Mining Co.,
Ltd. Class A . . . . . . . . . . 31,900 151,388Shandong Himile Mechanical
Science & Technology Co.,Ltd. Class A . . . . . . . . . . 18,500 49,403
Shandong Linglong Tyre Co.,Ltd. Class A . . . . . . . . . . 17,600 50,228
Shandong Molong PetroleumMachinery Co., Ltd.Class A (b) . . . . . . . . . . . 145,300 82,404
Shandong Weigao GroupMedical Polymer Co., Ltd.Class H . . . . . . . . . . . . . 240,000 247,060
Shandong Xinchao EnergyCorp., Ltd. Class A (b) . . . 223,500 62,907
Shandong XinhuaPharmaceutical Co., Ltd.Class A . . . . . . . . . . . . . 65,000 60,984
Shandong Yisheng Livestock& Poultry Breeding Co.,Ltd. Class A . . . . . . . . . . 13,600 42,469
Shang Gong Group Co., Ltd.Class B (b) . . . . . . . . . . . 175,300 92,032
Security Description Shares Value
Shanghai AtHub Co., Ltd.Class A . . . . . . . . . . . . . 20,100 $ 97,106
Shanghai Bairun InvestmentHolding Group Co., Ltd.Class A . . . . . . . . . . . . . 18,400 55,036
Shanghai Baosight SoftwareCo., Ltd. Class A . . . . . . . 10,100 50,576
Shanghai Baosight SoftwareCo., Ltd. Class B . . . . . . . 51,360 99,536
Shanghai Belling Co., Ltd.Class A . . . . . . . . . . . . . 21,900 46,307
Shanghai Chlor-AlkaliChemical Co., Ltd. Class B. 122,900 75,583
Shanghai Daimay AutomotiveInterior Co., Ltd. Class A . . 13,900 49,459
Shanghai Diesel Engine Co.,Ltd. Class B . . . . . . . . . . 166,400 84,531
Shanghai East ChinaComputer Co., Ltd.Class A . . . . . . . . . . . . . 15,400 54,063
Shanghai Electric Group Co.,Ltd. Class H . . . . . . . . . . 488,418 157,627
Shanghai Fengyuzhu Cultureand Technology Co., Ltd.Class A . . . . . . . . . . . . . 20,100 49,256
Shanghai FosunPharmaceutical Group Co.,Ltd. Class A . . . . . . . . . . 13,300 47,064
Shanghai FosunPharmaceutical Group Co.,Ltd. Class H (d) . . . . . . . . 40,000 107,406
Shanghai Fudan-ZhangjiangBio-Pharmaceutical Co.,Ltd. Class H . . . . . . . . . . 203,000 140,350
Shanghai GreencourtInvestment Group Co., Ltd.Class B (b) . . . . . . . . . . . 219,600 76,640
Shanghai Haixin Group Co.Class B . . . . . . . . . . . . . 221,813 91,165
Shanghai Highly Group Co.,Ltd. Class B . . . . . . . . . . 151,800 115,823
Shanghai Industrial UrbanDevelopment Group, Ltd.. . 51,000 6,441
Shanghai International AirportCo., Ltd. Class A . . . . . . . 14,100 157,522
Shanghai International PortGroup Co., Ltd. Class A. . . 124,600 99,279
Shanghai JinjiangInternational IndustrialInvestment Co., Ltd.Class B . . . . . . . . . . . . . 66,400 62,947
Shanghai JinjiangInternational Travel Co.,Ltd. Class B . . . . . . . . . . 48,674 82,502
Shanghai Jinqiao ExportProcessing ZoneDevelopment Co., Ltd.Class A . . . . . . . . . . . . . 25,400 48,906
SPDR S&P EMERGING ASIA PACIFIC ETFSCHEDULE OF INVESTMENTS (continued)September 30, 2019
See accompanying notes to financial statements.113

Security Description Shares Value
Shanghai Jinqiao ExportProcessing ZoneDevelopment Co., Ltd.Class B . . . . . . . . . . . . . 42,400 $ 45,114
Shanghai Lingang HoldingsCorp., Ltd. Class A . . . . . . 12,800 46,961
Shanghai Lingyun IndustriesDevelopment Co., Ltd.Class B (b) . . . . . . . . . . . 86,100 50,282
Shanghai Lujiazui Finance &Trade Zone DevelopmentCo., Ltd. Class B . . . . . . . 197,064 221,106
Shanghai M&G Stationery,Inc. Class A . . . . . . . . . . 9,996 62,374
Shanghai Mechanical andElectrical Industry Co., Ltd.Class B . . . . . . . . . . . . . 55,884 93,550
Shanghai PharmaceuticalsHolding Co., Ltd. Class A . 19,000 48,423
Shanghai PharmaceuticalsHolding Co., Ltd. Class H . 74,200 134,403
Shanghai Phoenix EnterpriseGroup Co., Ltd. Class B(b) . . . . . . . . . . . . . . . . 78,900 39,450
Shanghai PudongDevelopment Bank Co.,Ltd. Class A . . . . . . . . . . 117,700 195,145
Shanghai Putailai New EnergyTechnology Co., Ltd.Class A . . . . . . . . . . . . . 10,000 71,697
Shanghai RAAS BloodProducts Co., Ltd. Class A(b) . . . . . . . . . . . . . . . . 47,000 51,336
Shanghai Runda MedicalTechnology Co., Ltd.Class A . . . . . . . . . . . . . 32,800 46,757
Shanghai Waigaoqiao FreeTrade Zone Group Co., Ltd.Class B . . . . . . . . . . . . . 72,300 100,569
Shanghai Wanye EnterprisesCo., Ltd. Class A . . . . . . . 30,800 57,880
Shanghai Weaver NetworkCo., Ltd. Class A . . . . . . . 10,000 88,907
Shanghai Xin Nanyang OnlyEducation & TechnologyCo., Ltd. Class A (b) . . . . . 19,200 50,170
Shanghai ZhangjiangHigh-Tech ParkDevelopment Co., Ltd.Class A . . . . . . . . . . . . . 21,800 47,317
Shanghai Zhenhua HeavyIndustries Co., Ltd.Class B . . . . . . . . . . . . . 139,800 47,812
Shanxi Blue Flame HoldingCo., Ltd. Class A (b) . . . . . 41,200 60,809
Shanxi Lanhua Sci-TechVenture Co., Ltd. Class A . . 52,800 48,133
Security Description Shares Value
Shanxi Lu’an EnvironmentalEnergy Development Co.,Ltd. Class A . . . . . . . . . . 46,300 $ 46,941
Shanxi Meijin Energy Co.,Ltd. Class A . . . . . . . . . . 40,100 51,380
Shanxi Xinghuacun Fen WineFactory Co., Ltd. Class A . . 10,100 109,342
Shanxi Xishan Coal &Electricity Power Co., Ltd.Class A . . . . . . . . . . . . . 58,300 48,004
Shengda Mining Co., Ltd.Class A (b) . . . . . . . . . . . 23,200 44,833
Shengyi Technology Co., Ltd.Class A . . . . . . . . . . . . . 24,700 86,263
Shenzhen AgriculturalProducts Group Co., Ltd.Class A . . . . . . . . . . . . . 85,300 62,232
Shenzhen Aisidi Co., Ltd.Class A . . . . . . . . . . . . . 61,200 46,107
Shenzhen DanbondTechnology Co., Ltd.Class A . . . . . . . . . . . . . 25,800 45,341
Shenzhen Das Intellitech Co.,Ltd. Class A (b) . . . . . . . . 136,183 66,936
Shenzhen Ellassay FashionCo., Ltd. Class A . . . . . . . 26,380 57,849
Shenzhen Expressway Co.,Ltd. Class H . . . . . . . . . . 29,000 37,806
Shenzhen Fastprint CircuitTech Co., Ltd. Class A. . . . 46,000 49,149
Shenzhen Fenda TechnologyCo., Ltd. Class A (b) . . . . . 77,900 46,689
Shenzhen Gas Corp., Ltd.Class A . . . . . . . . . . . . . 53,900 48,608
Shenzhen Gongjin ElectronicsCo., Ltd. Class A . . . . . . . 28,400 55,200
Shenzhen Goodix TechnologyCo., Ltd. Class A . . . . . . . 10,100 287,674
Shenzhen H&T IntelligentControl Co., Ltd. Class A . . 27,200 48,220
Shenzhen Heungkong HoldingCo., Ltd. Class A . . . . . . . 145,300 47,204
Shenzhen Huaqiang IndustryCo., Ltd. Class A . . . . . . . 22,500 45,560
Shenzhen Investment, Ltd. . . . 350,888 129,355Shenzhen Kingdom Sci-Tech
Co., Ltd. Class A (b) . . . . . 14,900 43,608Shenzhen Kinwong Electronic
Co., Ltd. Class A . . . . . . . 10,000 64,597Shenzhen Megmeet Electrical
Co., Ltd. Class A . . . . . . . 16,900 46,645Shenzhen MTC Co., Ltd.
Class A (b) . . . . . . . . . . . 158,800 62,042Shenzhen Nanshan Power Co.,
Ltd. Class B (b) . . . . . . . . 70,500 45,235Shenzhen Neptunus
Bioengineering Co., Ltd.Class A . . . . . . . . . . . . . 102,193 47,510
SPDR S&P EMERGING ASIA PACIFIC ETFSCHEDULE OF INVESTMENTS (continued)September 30, 2019
See accompanying notes to financial statements.114
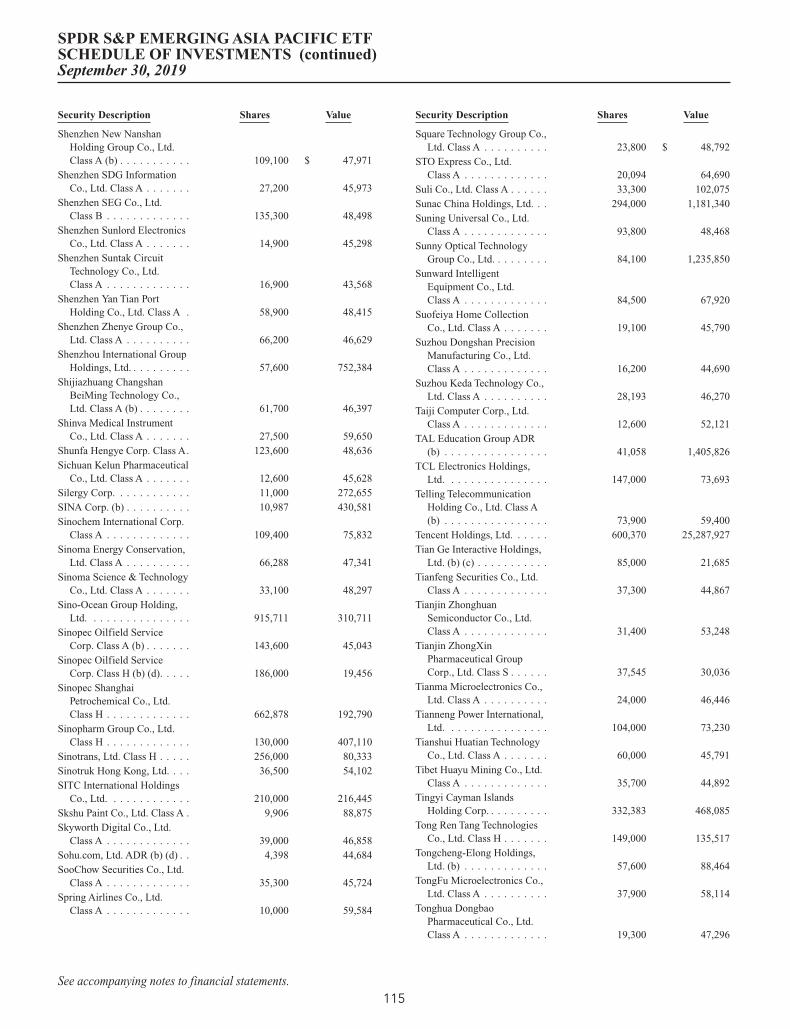
Security Description Shares Value
Shenzhen New NanshanHolding Group Co., Ltd.Class A (b) . . . . . . . . . . . 109,100 $ 47,971
Shenzhen SDG InformationCo., Ltd. Class A . . . . . . . 27,200 45,973
Shenzhen SEG Co., Ltd.Class B . . . . . . . . . . . . . 135,300 48,498
Shenzhen Sunlord ElectronicsCo., Ltd. Class A . . . . . . . 14,900 45,298
Shenzhen Suntak CircuitTechnology Co., Ltd.Class A . . . . . . . . . . . . . 16,900 43,568
Shenzhen Yan Tian PortHolding Co., Ltd. Class A . 58,900 48,415
Shenzhen Zhenye Group Co.,Ltd. Class A . . . . . . . . . . 66,200 46,629
Shenzhou International GroupHoldings, Ltd. . . . . . . . . . 57,600 752,384
Shijiazhuang ChangshanBeiMing Technology Co.,Ltd. Class A (b) . . . . . . . . 61,700 46,397
Shinva Medical InstrumentCo., Ltd. Class A . . . . . . . 27,500 59,650
Shunfa Hengye Corp. Class A. 123,600 48,636Sichuan Kelun Pharmaceutical
Co., Ltd. Class A . . . . . . . 12,600 45,628Silergy Corp. . . . . . . . . . . . 11,000 272,655SINA Corp. (b) . . . . . . . . . . 10,987 430,581Sinochem International Corp.
Class A . . . . . . . . . . . . . 109,400 75,832Sinoma Energy Conservation,
Ltd. Class A . . . . . . . . . . 66,288 47,341Sinoma Science & Technology
Co., Ltd. Class A . . . . . . . 33,100 48,297Sino-Ocean Group Holding,
Ltd. . . . . . . . . . . . . . . . 915,711 310,711Sinopec Oilfield Service
Corp. Class A (b) . . . . . . . 143,600 45,043Sinopec Oilfield Service
Corp. Class H (b) (d). . . . . 186,000 19,456Sinopec Shanghai
Petrochemical Co., Ltd.Class H . . . . . . . . . . . . . 662,878 192,790
Sinopharm Group Co., Ltd.Class H . . . . . . . . . . . . . 130,000 407,110
Sinotrans, Ltd. Class H . . . . . 256,000 80,333Sinotruk Hong Kong, Ltd. . . . 36,500 54,102SITC International Holdings
Co., Ltd. . . . . . . . . . . . . 210,000 216,445Skshu Paint Co., Ltd. Class A . 9,906 88,875Skyworth Digital Co., Ltd.
Class A . . . . . . . . . . . . . 39,000 46,858Sohu.com, Ltd. ADR (b) (d) . . 4,398 44,684SooChow Securities Co., Ltd.
Class A . . . . . . . . . . . . . 35,300 45,724Spring Airlines Co., Ltd.
Class A . . . . . . . . . . . . . 10,000 59,584
Security Description Shares Value
Square Technology Group Co.,Ltd. Class A . . . . . . . . . . 23,800 $ 48,792
STO Express Co., Ltd.Class A . . . . . . . . . . . . . 20,094 64,690
Suli Co., Ltd. Class A . . . . . . 33,300 102,075Sunac China Holdings, Ltd. . . 294,000 1,181,340Suning Universal Co., Ltd.
Class A . . . . . . . . . . . . . 93,800 48,468Sunny Optical Technology
Group Co., Ltd. . . . . . . . . 84,100 1,235,850Sunward Intelligent
Equipment Co., Ltd.Class A . . . . . . . . . . . . . 84,500 67,920
Suofeiya Home CollectionCo., Ltd. Class A . . . . . . . 19,100 45,790
Suzhou Dongshan PrecisionManufacturing Co., Ltd.Class A . . . . . . . . . . . . . 16,200 44,690
Suzhou Keda Technology Co.,Ltd. Class A . . . . . . . . . . 28,193 46,270
Taiji Computer Corp., Ltd.Class A . . . . . . . . . . . . . 12,600 52,121
TAL Education Group ADR(b) . . . . . . . . . . . . . . . . 41,058 1,405,826
TCL Electronics Holdings,Ltd. . . . . . . . . . . . . . . . 147,000 73,693
Telling TelecommunicationHolding Co., Ltd. Class A(b) . . . . . . . . . . . . . . . . 73,900 59,400
Tencent Holdings, Ltd. . . . . . 600,370 25,287,927Tian Ge Interactive Holdings,
Ltd. (b) (c) . . . . . . . . . . . 85,000 21,685Tianfeng Securities Co., Ltd.
Class A . . . . . . . . . . . . . 37,300 44,867Tianjin Zhonghuan
Semiconductor Co., Ltd.Class A . . . . . . . . . . . . . 31,400 53,248
Tianjin ZhongXinPharmaceutical GroupCorp., Ltd. Class S . . . . . . 37,545 30,036
Tianma Microelectronics Co.,Ltd. Class A . . . . . . . . . . 24,000 46,446
Tianneng Power International,Ltd. . . . . . . . . . . . . . . . 104,000 73,230
Tianshui Huatian TechnologyCo., Ltd. Class A . . . . . . . 60,000 45,791
Tibet Huayu Mining Co., Ltd.Class A . . . . . . . . . . . . . 35,700 44,892
Tingyi Cayman IslandsHolding Corp. . . . . . . . . . 332,383 468,085
Tong Ren Tang TechnologiesCo., Ltd. Class H . . . . . . . 149,000 135,517
Tongcheng-Elong Holdings,Ltd. (b) . . . . . . . . . . . . . 57,600 88,464
TongFu Microelectronics Co.,Ltd. Class A . . . . . . . . . . 37,900 58,114
Tonghua DongbaoPharmaceutical Co., Ltd.Class A . . . . . . . . . . . . . 19,300 47,296
SPDR S&P EMERGING ASIA PACIFIC ETFSCHEDULE OF INVESTMENTS (continued)September 30, 2019
See accompanying notes to financial statements.115

Security Description Shares Value
Tonghua Golden-HorsePharmaceutical IndustryCo., Ltd. Class A (b) . . . . . 46,400 $ 46,132
Tongwei Co., Ltd. Class A . . . 36,400 64,938Tongyu Communication, Inc.
Class A . . . . . . . . . . . . . 12,692 47,009Topchoice Medical Investment
Corp. Class A (b) . . . . . . . 10,000 143,533TravelSky Technology, Ltd.
Class H . . . . . . . . . . . . . 108,000 224,282Tsingtao Brewery Co., Ltd.
Class H . . . . . . . . . . . . . 88,000 530,959UE Furniture Co., Ltd.
Class A . . . . . . . . . . . . . 40,997 65,733Unigroup Guoxin
Microelectronics Co., Ltd.Class A . . . . . . . . . . . . . 10,000 71,543
Uni-President China Holdings,Ltd. . . . . . . . . . . . . . . . 209,000 225,545
Unisplendour Corp., Ltd.Class A . . . . . . . . . . . . . 16,000 70,532
Universal Scientific IndustrialShanghai Co., Ltd. Class A . 22,700 48,984
Valiant Co., Ltd. Class A . . . . 27,700 48,525Vatti Corp., Ltd. Class A . . . . 33,000 45,518Venustech Group, Inc.
Class A . . . . . . . . . . . . . 13,600 60,904Vipshop Holdings, Ltd. ADR
(b) . . . . . . . . . . . . . . . . 40,410 360,457Visionox Technology, Inc.
Class A (b) . . . . . . . . . . . 31,500 74,855Visual China Group Co., Ltd.
Class A . . . . . . . . . . . . . 22,300 63,891Wangneng Environment Co.,
Ltd. Class A . . . . . . . . . . 22,000 50,092Wanhua Chemical Group Co.,
Ltd. Class A . . . . . . . . . . 19,300 119,321Want Want China Holdings,
Ltd. (d) . . . . . . . . . . . . . 1,150,000 919,777Wasu Media Holding Co., Ltd.
Class A . . . . . . . . . . . . . 34,900 45,744Weibo Corp. ADR (b) (d). . . . 4,201 187,995Weichai Power Co., Ltd.
Class A . . . . . . . . . . . . . 133,100 209,122Weichai Power Co., Ltd.
Class H . . . . . . . . . . . . . 57,000 82,162Weimob, Inc. (b) (c) . . . . . . . 112,000 50,290West China Cement, Ltd. . . . . 426,000 69,556Westone Information Industry,
Inc. Class A . . . . . . . . . . 11,700 45,694WG Tech JiangXi Co., Ltd.
Class A . . . . . . . . . . . . . 10,100 46,814Will Semiconductor, Ltd.
Class A . . . . . . . . . . . . . 10,000 137,386Wuhan Guide Infrared Co.,
Ltd. Class A . . . . . . . . . . 21,700 72,200
Security Description Shares Value
Wuhu Sanqi InteractiveEntertainment NetworkTechnology Group Co.,Ltd. Class A . . . . . . . . . . 25,700 $ 64,887
Wuliangye Yibin Co., Ltd.Class A . . . . . . . . . . . . . 30,500 554,375
WUS Printed Circuit KunshanCo., Ltd. Class A . . . . . . . 21,300 73,076
WuXi AppTec Co., Ltd.Class A . . . . . . . . . . . . . 18,000 218,535
Wuxi Biologics Cayman, Inc.(b) (c) . . . . . . . . . . . . . . 40,000 408,194
Wuxi Shangji Automation Co.,Ltd. Class A . . . . . . . . . . 12,900 49,857
Wuxi Taiji Industry Co., Ltd.Class A . . . . . . . . . . . . . 45,100 46,987
Xiamen Faratronic Co., Ltd.Class A . . . . . . . . . . . . . 10,000 62,763
Xiamen Goldenhome Co.,Ltd. Class A . . . . . . . . . . 10,000 89,873
Xiamen International Port Co.,Ltd. Class H . . . . . . . . . . 138,000 17,603
Xiamen Intretech, Inc.Class A . . . . . . . . . . . . . 10,000 56,979
Xiamen ITG Group Corp.,Ltd. Class A . . . . . . . . . . 46,300 47,589
Xiamen Kingdomway GroupCo. Class A . . . . . . . . . . 24,600 56,598
Xiangpiaopiao Food Co., Ltd.Class A . . . . . . . . . . . . . 11,000 44,917
Xiaomi Corp. Class B (b) (c)(d) . . . . . . . . . . . . . . . . 1,274,400 1,430,558
Xilinmen Furniture Co., Ltd.Class A (b) . . . . . . . . . . . 29,700 51,738
Xinhuanet Co., Ltd. Class A . . 15,700 43,860Xinjiang Goldwind Science &
Technology Co., Ltd.Class A . . . . . . . . . . . . . 33,800 59,258
Xinjiang Goldwind Science &Technology Co., Ltd.Class H . . . . . . . . . . . . . 34,659 41,028
Xinjiang Tianye Co., Ltd.Class A . . . . . . . . . . . . . 69,000 45,026
Xinjiang Torch Gas Co., Ltd.Class A (b) . . . . . . . . . . . 17,900 50,508
Xinjiang Xintai Natural GasCo., Ltd. Class A . . . . . . . 14,200 45,933
Xinyi Solar Holdings, Ltd. . . . 304,748 182,707Yangzijiang Shipbuilding
Holdings, Ltd. . . . . . . . . . 317,200 220,198Yantai Changyu Pioneer Wine
Co., Ltd. Class B . . . . . . . 32,653 66,561Yantai Dongcheng
Pharmaceutical Co., Ltd.Class A . . . . . . . . . . . . . 45,300 77,010
Yantai Eddie PrecisionMachinery Co., Ltd.Class A . . . . . . . . . . . . . 13,500 48,584
SPDR S&P EMERGING ASIA PACIFIC ETFSCHEDULE OF INVESTMENTS (continued)September 30, 2019
See accompanying notes to financial statements.116
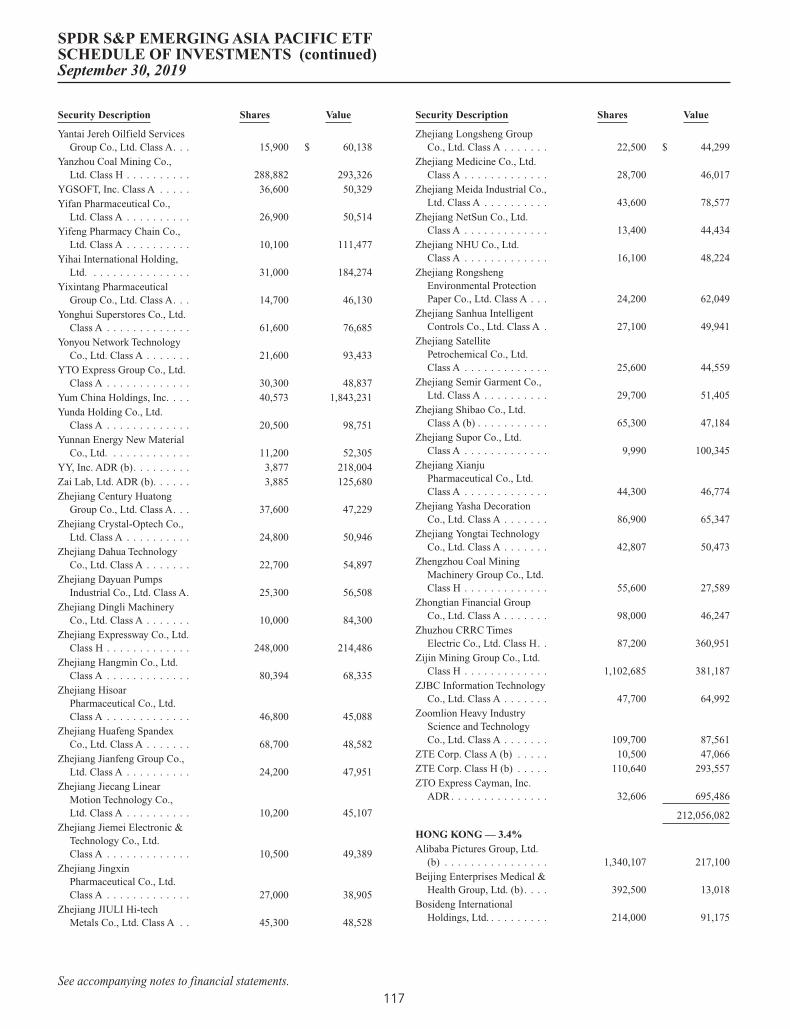
Security Description Shares Value
Yantai Jereh Oilfield ServicesGroup Co., Ltd. Class A. . . 15,900 $ 60,138
Yanzhou Coal Mining Co.,Ltd. Class H . . . . . . . . . . 288,882 293,326
YGSOFT, Inc. Class A . . . . . 36,600 50,329Yifan Pharmaceutical Co.,
Ltd. Class A . . . . . . . . . . 26,900 50,514Yifeng Pharmacy Chain Co.,
Ltd. Class A . . . . . . . . . . 10,100 111,477Yihai International Holding,
Ltd. . . . . . . . . . . . . . . . 31,000 184,274Yixintang Pharmaceutical
Group Co., Ltd. Class A. . . 14,700 46,130Yonghui Superstores Co., Ltd.
Class A . . . . . . . . . . . . . 61,600 76,685Yonyou Network Technology
Co., Ltd. Class A . . . . . . . 21,600 93,433YTO Express Group Co., Ltd.
Class A . . . . . . . . . . . . . 30,300 48,837Yum China Holdings, Inc. . . . 40,573 1,843,231Yunda Holding Co., Ltd.
Class A . . . . . . . . . . . . . 20,500 98,751Yunnan Energy New Material
Co., Ltd. . . . . . . . . . . . . 11,200 52,305YY, Inc. ADR (b). . . . . . . . . 3,877 218,004Zai Lab, Ltd. ADR (b). . . . . . 3,885 125,680Zhejiang Century Huatong
Group Co., Ltd. Class A. . . 37,600 47,229Zhejiang Crystal-Optech Co.,
Ltd. Class A . . . . . . . . . . 24,800 50,946Zhejiang Dahua Technology
Co., Ltd. Class A . . . . . . . 22,700 54,897Zhejiang Dayuan Pumps
Industrial Co., Ltd. Class A. 25,300 56,508Zhejiang Dingli Machinery
Co., Ltd. Class A . . . . . . . 10,000 84,300Zhejiang Expressway Co., Ltd.
Class H . . . . . . . . . . . . . 248,000 214,486Zhejiang Hangmin Co., Ltd.
Class A . . . . . . . . . . . . . 80,394 68,335Zhejiang Hisoar
Pharmaceutical Co., Ltd.Class A . . . . . . . . . . . . . 46,800 45,088
Zhejiang Huafeng SpandexCo., Ltd. Class A . . . . . . . 68,700 48,582
Zhejiang Jianfeng Group Co.,Ltd. Class A . . . . . . . . . . 24,200 47,951
Zhejiang Jiecang LinearMotion Technology Co.,Ltd. Class A . . . . . . . . . . 10,200 45,107
Zhejiang Jiemei Electronic &Technology Co., Ltd.Class A . . . . . . . . . . . . . 10,500 49,389
Zhejiang JingxinPharmaceutical Co., Ltd.Class A . . . . . . . . . . . . . 27,000 38,905
Zhejiang JIULI Hi-techMetals Co., Ltd. Class A . . 45,300 48,528
Security Description Shares Value
Zhejiang Longsheng GroupCo., Ltd. Class A . . . . . . . 22,500 $ 44,299
Zhejiang Medicine Co., Ltd.Class A . . . . . . . . . . . . . 28,700 46,017
Zhejiang Meida Industrial Co.,Ltd. Class A . . . . . . . . . . 43,600 78,577
Zhejiang NetSun Co., Ltd.Class A . . . . . . . . . . . . . 13,400 44,434
Zhejiang NHU Co., Ltd.Class A . . . . . . . . . . . . . 16,100 48,224
Zhejiang RongshengEnvironmental ProtectionPaper Co., Ltd. Class A . . . 24,200 62,049
Zhejiang Sanhua IntelligentControls Co., Ltd. Class A . 27,100 49,941
Zhejiang SatellitePetrochemical Co., Ltd.Class A . . . . . . . . . . . . . 25,600 44,559
Zhejiang Semir Garment Co.,Ltd. Class A . . . . . . . . . . 29,700 51,405
Zhejiang Shibao Co., Ltd.Class A (b) . . . . . . . . . . . 65,300 47,184
Zhejiang Supor Co., Ltd.Class A . . . . . . . . . . . . . 9,990 100,345
Zhejiang XianjuPharmaceutical Co., Ltd.Class A . . . . . . . . . . . . . 44,300 46,774
Zhejiang Yasha DecorationCo., Ltd. Class A . . . . . . . 86,900 65,347
Zhejiang Yongtai TechnologyCo., Ltd. Class A . . . . . . . 42,807 50,473
Zhengzhou Coal MiningMachinery Group Co., Ltd.Class H . . . . . . . . . . . . . 55,600 27,589
Zhongtian Financial GroupCo., Ltd. Class A . . . . . . . 98,000 46,247
Zhuzhou CRRC TimesElectric Co., Ltd. Class H. . 87,200 360,951
Zijin Mining Group Co., Ltd.Class H . . . . . . . . . . . . . 1,102,685 381,187
ZJBC Information TechnologyCo., Ltd. Class A . . . . . . . 47,700 64,992
Zoomlion Heavy IndustryScience and TechnologyCo., Ltd. Class A . . . . . . . 109,700 87,561
ZTE Corp. Class A (b) . . . . . 10,500 47,066ZTE Corp. Class H (b) . . . . . 110,640 293,557ZTO Express Cayman, Inc.
ADR . . . . . . . . . . . . . . . 32,606 695,486
212,056,082
HONG KONG — 3.4%Alibaba Pictures Group, Ltd.
(b) . . . . . . . . . . . . . . . . 1,340,107 217,100Beijing Enterprises Medical &
Health Group, Ltd. (b) . . . . 392,500 13,018Bosideng International
Holdings, Ltd. . . . . . . . . . 214,000 91,175
SPDR S&P EMERGING ASIA PACIFIC ETFSCHEDULE OF INVESTMENTS (continued)September 30, 2019
See accompanying notes to financial statements.117

Security Description Shares Value
Central Wealth GroupHoldings, Ltd. (b) (d) . . . . 266,000 $ 2,579
China Everbright, Ltd. . . . . . 126,000 147,386China Fiber Optic Network
System Group, Ltd. (b) (e) . 686,800 —China First Capital Group,
Ltd. (b) . . . . . . . . . . . . . 180,000 52,581China Gas Holdings, Ltd.. . . . 281,600 1,088,410China High Speed
Transmission EquipmentGroup Co., Ltd. (d) . . . . . . 8,000 4,908
China Mobile, Ltd.. . . . . . . . 608,636 5,034,830China Resources Cement
Holdings, Ltd. . . . . . . . . . 64,000 64,168China Resources Land, Ltd. . . 380,767 1,595,555China State Construction
International Holdings,Ltd. . . . . . . . . . . . . . . . 270,750 254,538
Citychamp Watch & JewelleryGroup, Ltd. (b) . . . . . . . . 490,000 108,758
Comba Telecom SystemsHoldings, Ltd. . . . . . . . . . 377,847 87,721
CP Pokphand Co., Ltd. . . . . . 910,000 77,774Dawnrays Pharmaceutical
Holdings, Ltd. . . . . . . . . . 232,000 44,095Digital China Holdings, Ltd.
(d) . . . . . . . . . . . . . . . . 154,000 82,899Fullshare Holdings, Ltd. (b) . . 696,100 22,643GCL-Poly Energy Holdings,
Ltd. (b) . . . . . . . . . . . . . 974,000 39,137Guangdong Investment, Ltd.. . 380,000 743,577Haier Electronics Group Co.,
Ltd. . . . . . . . . . . . . . . . 153,000 399,119Hi Sun Technology China,
Ltd. (b) . . . . . . . . . . . . . 294,000 50,254Huabao International
Holdings, Ltd. . . . . . . . . . 18,000 6,590Imperial Pacific International
Holdings, Ltd. (b) (d) . . . . 7,276,300 148,507Kingboard Holdings, Ltd. . . . 133,200 352,565Lee & Man Paper
Manufacturing, Ltd. . . . . . 240,000 129,806NetDragon Websoft Holdings,
Ltd. . . . . . . . . . . . . . . . 59,500 138,439Nine Dragons Paper Holdings,
Ltd. . . . . . . . . . . . . . . . 196,000 165,013Shanghai Industrial Holdings,
Ltd. (b) . . . . . . . . . . . . . 51,000 94,982Shenwan Hongyuan HK, Ltd.
(d) . . . . . . . . . . . . . . . . 65,000 9,701Shimao Property Holdings,
Ltd. . . . . . . . . . . . . . . . 177,500 518,503Sino Biopharmaceutical, Ltd. . 796,000 1,011,322Skyworth Group, Ltd. . . . . . . 278,243 71,696SSY Group, Ltd. . . . . . . . . . 446,691 353,278Sun Art Retail Group, Ltd. . . . 253,500 257,400
Security Description Shares Value
Tech Pro TechnologyDevelopment, Ltd. (b) (d)(e) . . . . . . . . . . . . . . . . 1,684,800 $ 7,307
Tibet Water Resources, Ltd.(b) . . . . . . . . . . . . . . . . 365,000 65,649
United Energy Group, Ltd.(b) . . . . . . . . . . . . . . . . 324,000 66,541
United LaboratoriesInternational Holdings,Ltd. . . . . . . . . . . . . . . . 114,000 59,913
Vinda International Holdings,Ltd. . . . . . . . . . . . . . . . 46,000 82,853
Wasion Holdings, Ltd. . . . . . 76,000 28,793WH Group, Ltd. (c) . . . . . . . 996,000 891,895Xinyi Glass Holdings, Ltd. . . . 362,000 398,507
15,081,485
INDIA — 17.6%Adani Ports & Special
Economic Zone, Ltd.. . . . . 117,267 684,965Adani Power, Ltd. (b) . . . . . . 83,826 76,056AIA Engineering, Ltd. . . . . . 10,026 252,394Ajanta Pharma, Ltd. . . . . . . . 3,873 55,230Alembic Pharmaceuticals,
Ltd. . . . . . . . . . . . . . . . 11,677 83,933Apollo Hospitals Enterprise,
Ltd. . . . . . . . . . . . . . . . 25,135 494,941Apollo Tyres, Ltd. . . . . . . . . 58,131 149,001Arvind Fashions, Ltd. (b) . . . . 6,303 38,702Arvind, Ltd. . . . . . . . . . . . . 31,511 21,320Ashok Leyland, Ltd. . . . . . . . 55,774 54,067Asian Paints, Ltd. . . . . . . . . 31,943 794,261AstraZeneca Pharma India,
Ltd. . . . . . . . . . . . . . . . 10,109 330,114Aurobindo Pharma, Ltd. . . . . 41,797 347,380Axis Bank, Ltd. . . . . . . . . . . 173,073 1,672,880Bajaj Auto, Ltd.. . . . . . . . . . 7,366 305,766Bajaj Finance, Ltd. . . . . . . . . 17,512 999,797Balkrishna Industries, Ltd. . . . 5,092 55,774Bank of Baroda (b). . . . . . . . 50,256 65,986BEML, Ltd. . . . . . . . . . . . . 8,113 109,293Bharat Electronics, Ltd.. . . . . 120,663 184,394Bharat Forge, Ltd. . . . . . . . . 32,470 204,504Bharat Heavy Electricals, Ltd.. 282,433 192,888Bharat Petroleum Corp., Ltd. . 54,514 361,612Bharti Airtel, Ltd. . . . . . . . . 261,675 1,355,290Bharti Infratel, Ltd. . . . . . . . 57,516 208,821Biocon, Ltd. . . . . . . . . . . . . 164,024 516,012Birlasoft, Ltd. . . . . . . . . . . . 61,845 60,432Bosch, Ltd. . . . . . . . . . . . . 880 174,633Britannia Industries, Ltd. . . . . 5,604 232,811Cadila Healthcare, Ltd. . . . . . 30,394 100,057Central Bank of India (b) . . . . 78,225 19,924CG Power and Industrial
Solutions, Ltd. (b) . . . . . . 98,385 19,644Cipla, Ltd. . . . . . . . . . . . . . 106,238 637,859Coal India, Ltd. . . . . . . . . . . 161,914 456,597
SPDR S&P EMERGING ASIA PACIFIC ETFSCHEDULE OF INVESTMENTS (continued)September 30, 2019
See accompanying notes to financial statements.118
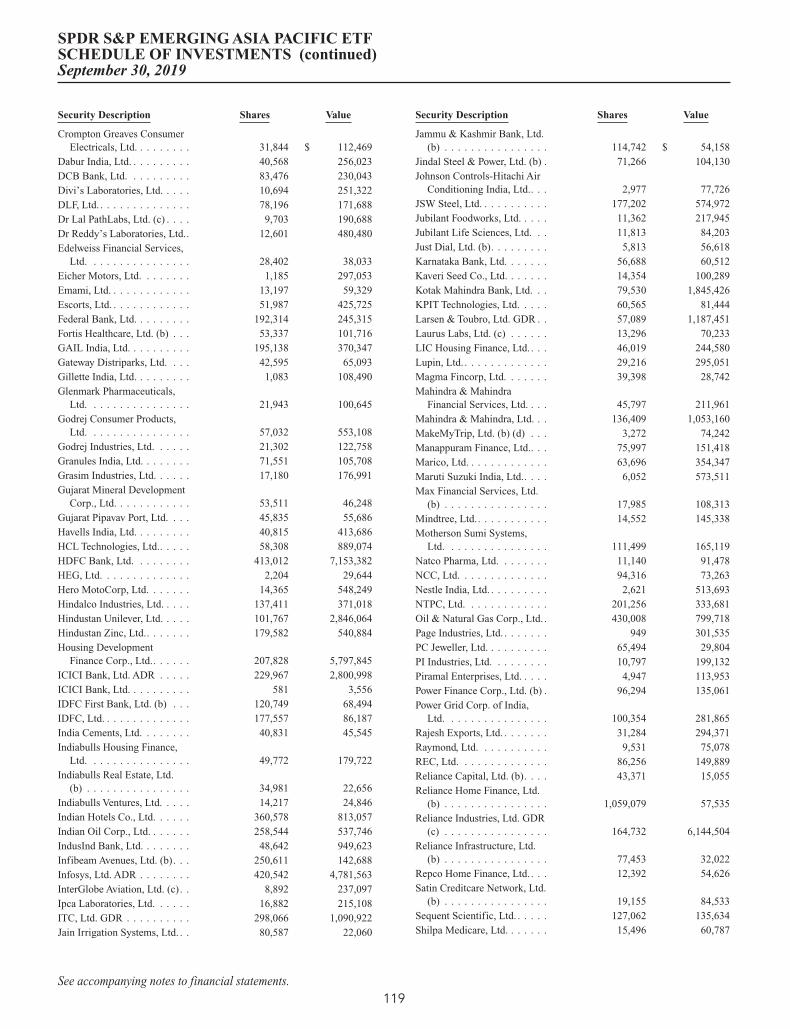
Security Description Shares Value
Crompton Greaves ConsumerElectricals, Ltd. . . . . . . . . 31,844 $ 112,469
Dabur India, Ltd. . . . . . . . . . 40,568 256,023DCB Bank, Ltd. . . . . . . . . . 83,476 230,043Divi’s Laboratories, Ltd. . . . . 10,694 251,322DLF, Ltd. . . . . . . . . . . . . . . 78,196 171,688Dr Lal PathLabs, Ltd. (c) . . . . 9,703 190,688Dr Reddy’s Laboratories, Ltd.. 12,601 480,480Edelweiss Financial Services,
Ltd. . . . . . . . . . . . . . . . 28,402 38,033Eicher Motors, Ltd. . . . . . . . 1,185 297,053Emami, Ltd. . . . . . . . . . . . . 13,197 59,329Escorts, Ltd. . . . . . . . . . . . . 51,987 425,725Federal Bank, Ltd. . . . . . . . . 192,314 245,315Fortis Healthcare, Ltd. (b) . . . 53,337 101,716GAIL India, Ltd. . . . . . . . . . 195,138 370,347Gateway Distriparks, Ltd. . . . 42,595 65,093Gillette India, Ltd. . . . . . . . . 1,083 108,490Glenmark Pharmaceuticals,
Ltd. . . . . . . . . . . . . . . . 21,943 100,645Godrej Consumer Products,
Ltd. . . . . . . . . . . . . . . . 57,032 553,108Godrej Industries, Ltd. . . . . . 21,302 122,758Granules India, Ltd. . . . . . . . 71,551 105,708Grasim Industries, Ltd. . . . . . 17,180 176,991Gujarat Mineral Development
Corp., Ltd. . . . . . . . . . . . 53,511 46,248Gujarat Pipavav Port, Ltd. . . . 45,835 55,686Havells India, Ltd. . . . . . . . . 40,815 413,686HCL Technologies, Ltd.. . . . . 58,308 889,074HDFC Bank, Ltd. . . . . . . . . 413,012 7,153,382HEG, Ltd. . . . . . . . . . . . . . 2,204 29,644Hero MotoCorp, Ltd. . . . . . . 14,365 548,249Hindalco Industries, Ltd. . . . . 137,411 371,018Hindustan Unilever, Ltd. . . . . 101,767 2,846,064Hindustan Zinc, Ltd.. . . . . . . 179,582 540,884Housing Development
Finance Corp., Ltd.. . . . . . 207,828 5,797,845ICICI Bank, Ltd. ADR . . . . . 229,967 2,800,998ICICI Bank, Ltd. . . . . . . . . . 581 3,556IDFC First Bank, Ltd. (b) . . . 120,749 68,494IDFC, Ltd. . . . . . . . . . . . . . 177,557 86,187India Cements, Ltd. . . . . . . . 40,831 45,545Indiabulls Housing Finance,
Ltd. . . . . . . . . . . . . . . . 49,772 179,722Indiabulls Real Estate, Ltd.
(b) . . . . . . . . . . . . . . . . 34,981 22,656Indiabulls Ventures, Ltd. . . . . 14,217 24,846Indian Hotels Co., Ltd. . . . . . 360,578 813,057Indian Oil Corp., Ltd. . . . . . . 258,544 537,746IndusInd Bank, Ltd. . . . . . . . 48,642 949,623Infibeam Avenues, Ltd. (b). . . 250,611 142,688Infosys, Ltd. ADR . . . . . . . . 420,542 4,781,563InterGlobe Aviation, Ltd. (c). . 8,892 237,097Ipca Laboratories, Ltd. . . . . . 16,882 215,108ITC, Ltd. GDR . . . . . . . . . . 298,066 1,090,922Jain Irrigation Systems, Ltd. . . 80,587 22,060
Security Description Shares Value
Jammu & Kashmir Bank, Ltd.(b) . . . . . . . . . . . . . . . . 114,742 $ 54,158
Jindal Steel & Power, Ltd. (b) . 71,266 104,130Johnson Controls-Hitachi Air
Conditioning India, Ltd.. . . 2,977 77,726JSW Steel, Ltd. . . . . . . . . . . 177,202 574,972Jubilant Foodworks, Ltd. . . . . 11,362 217,945Jubilant Life Sciences, Ltd. . . 11,813 84,203Just Dial, Ltd. (b). . . . . . . . . 5,813 56,618Karnataka Bank, Ltd. . . . . . . 56,688 60,512Kaveri Seed Co., Ltd. . . . . . . 14,354 100,289Kotak Mahindra Bank, Ltd. . . 79,530 1,845,426KPIT Technologies, Ltd. . . . . 60,565 81,444Larsen & Toubro, Ltd. GDR . . 57,089 1,187,451Laurus Labs, Ltd. (c) . . . . . . 13,296 70,233LIC Housing Finance, Ltd. . . . 46,019 244,580Lupin, Ltd. . . . . . . . . . . . . . 29,216 295,051Magma Fincorp, Ltd. . . . . . . 39,398 28,742Mahindra & Mahindra
Financial Services, Ltd. . . . 45,797 211,961Mahindra & Mahindra, Ltd. . . 136,409 1,053,160MakeMyTrip, Ltd. (b) (d) . . . 3,272 74,242Manappuram Finance, Ltd.. . . 75,997 151,418Marico, Ltd. . . . . . . . . . . . . 63,696 354,347Maruti Suzuki India, Ltd.. . . . 6,052 573,511Max Financial Services, Ltd.
(b) . . . . . . . . . . . . . . . . 17,985 108,313Mindtree, Ltd.. . . . . . . . . . . 14,552 145,338Motherson Sumi Systems,
Ltd. . . . . . . . . . . . . . . . 111,499 165,119Natco Pharma, Ltd. . . . . . . . 11,140 91,478NCC, Ltd. . . . . . . . . . . . . . 94,316 73,263Nestle India, Ltd. . . . . . . . . . 2,621 513,693NTPC, Ltd. . . . . . . . . . . . . 201,256 333,681Oil & Natural Gas Corp., Ltd. . 430,008 799,718Page Industries, Ltd. . . . . . . . 949 301,535PC Jeweller, Ltd. . . . . . . . . . 65,494 29,804PI Industries, Ltd. . . . . . . . . 10,797 199,132Piramal Enterprises, Ltd. . . . . 4,947 113,953Power Finance Corp., Ltd. (b) . 96,294 135,061Power Grid Corp. of India,
Ltd. . . . . . . . . . . . . . . . 100,354 281,865Rajesh Exports, Ltd. . . . . . . . 31,284 294,371Raymond, Ltd. . . . . . . . . . . 9,531 75,078REC, Ltd. . . . . . . . . . . . . . 86,256 149,889Reliance Capital, Ltd. (b). . . . 43,371 15,055Reliance Home Finance, Ltd.
(b) . . . . . . . . . . . . . . . . 1,059,079 57,535Reliance Industries, Ltd. GDR
(c) . . . . . . . . . . . . . . . . 164,732 6,144,504Reliance Infrastructure, Ltd.
(b) . . . . . . . . . . . . . . . . 77,453 32,022Repco Home Finance, Ltd. . . . 12,392 54,626Satin Creditcare Network, Ltd.
(b) . . . . . . . . . . . . . . . . 19,155 84,533Sequent Scientific, Ltd. . . . . . 127,062 135,634Shilpa Medicare, Ltd. . . . . . . 15,496 60,787
SPDR S&P EMERGING ASIA PACIFIC ETFSCHEDULE OF INVESTMENTS (continued)September 30, 2019
See accompanying notes to financial statements.119

Security Description Shares Value
Shoppers Stop, Ltd. . . . . . . . 18,200 $ 109,839Shriram City Union Finance,
Ltd. . . . . . . . . . . . . . . . 8,451 159,918Shriram Transport Finance
Co., Ltd. . . . . . . . . . . . . 20,825 314,716Siemens, Ltd. . . . . . . . . . . . 34,034 728,067Sintex Plastics Technology,
Ltd. (b) . . . . . . . . . . . . . 69,099 3,559South Indian Bank, Ltd. . . . . 510,659 78,182SpiceJet, Ltd. (b) . . . . . . . . . 65,397 115,441State Bank of India (b) . . . . . 205,187 784,049Steel Authority of India, Ltd. . 250,094 118,044Strides Pharma Science, Ltd. . 15,995 69,448Sun Pharma Advanced
Research Co., Ltd. (b) . . . . 28,874 51,193Sun Pharmaceutical
Industries, Ltd. . . . . . . . . 139,273 765,356Suven Life Sciences, Ltd. . . . 35,596 139,835Suzlon Energy, Ltd. (b) . . . . . 1,357,466 43,098Tata Consultancy Services,
Ltd. . . . . . . . . . . . . . . . 104,542 3,096,779Tata Motors, Ltd. (b) . . . . . . 226,367 375,155Tata Steel, Ltd. . . . . . . . . . . 42,637 216,889Tech Mahindra, Ltd. . . . . . . . 58,628 591,088Thyrocare Technologies, Ltd.
(c) . . . . . . . . . . . . . . . . 45,134 328,496Titan Co., Ltd. . . . . . . . . . . 14,091 253,123Torrent Pharmaceuticals, Ltd. . 9,038 212,646Ujjivan Financial Services,
Ltd. . . . . . . . . . . . . . . . 17,804 79,060UltraTech Cement, Ltd. . . . . . 7,653 468,804United Breweries, Ltd. . . . . . 8,504 161,653United Spirits, Ltd. (b) . . . . . 55,832 525,477UPL, Ltd. . . . . . . . . . . . . . 49,766 424,110Vakrangee, Ltd. . . . . . . . . . . 192,288 81,942Vedanta, Ltd. . . . . . . . . . . . 141,852 308,549V-Mart Retail, Ltd.. . . . . . . . 3,493 103,670Vodafone Idea, Ltd. (b) . . . . . 852,359 73,968Wipro, Ltd. ADR . . . . . . . . . 268,609 980,423WNS Holdings, Ltd. ADR (b) . 10,553 619,989Wockhardt, Ltd. (b) . . . . . . . 23,252 84,125Yes Bank, Ltd. . . . . . . . . . . 175,012 102,238Zee Entertainment
Enterprises, Ltd. . . . . . . . 102,766 384,998
77,346,043
INDONESIA — 3.1%Ace Hardware Indonesia Tbk
PT . . . . . . . . . . . . . . . . 2,405,900 299,996Adaro Energy Tbk PT . . . . . . 2,030,200 184,499AKR Corporindo Tbk PT. . . . 133,400 35,711Astra International Tbk PT. . . 2,632,200 1,223,848Bank Central Asia Tbk PT . . . 1,490,396 3,186,581Bank Mandiri Persero Tbk PT. 2,618,110 1,286,461Bank Negara Indonesia
Persero Tbk PT . . . . . . . . 561,700 290,841
Security Description Shares Value
Bank Rakyat IndonesiaPersero Tbk PT . . . . . . . . 6,885,280 $ 1,998,405
Barito Pacific Tbk PT . . . . . . 1,117,900 77,965Charoen Pokphand Indonesia
Tbk PT . . . . . . . . . . . . . 378,400 142,616Ciputra Development Tbk PT . 928,496 69,008Gudang Garam Tbk PT . . . . . 85,000 313,623Indah Kiat Pulp & Paper
Corp. Tbk PT . . . . . . . . . 221,900 101,219Indocement Tunggal Prakarsa
Tbk PT . . . . . . . . . . . . . 286,525 377,963Kalbe Farma Tbk PT . . . . . . 1,020,200 120,383Lippo Karawaci Tbk PT (b) . . 5,343,610 88,840Matahari Department Store
Tbk PT . . . . . . . . . . . . . 211,300 51,057Media Nusantara Citra Tbk
PT . . . . . . . . . . . . . . . . 427,800 37,220Pabrik Kertas Tjiwi Kimia
Tbk PT . . . . . . . . . . . . . 81,100 60,275Pakuwon Jati Tbk PT . . . . . . 2,304,300 107,951Perusahaan Gas Negara Tbk
PT . . . . . . . . . . . . . . . . 1,818,140 268,974PP Persero Tbk PT . . . . . . . . 786,076 94,418Semen Indonesia Persero Tbk
PT . . . . . . . . . . . . . . . . 544,600 443,123Summarecon Agung Tbk PT. . 872,700 71,009Surya Semesta Internusa Tbk
PT . . . . . . . . . . . . . . . . 1,388,000 71,380Telekomunikasi Indonesia
Persero Tbk PT . . . . . . . . 5,911,470 1,794,888Tiga Pilar Sejahtera Food Tbk
(b) (e) . . . . . . . . . . . . . . 963,100 5,699Tower Bersama Infrastructure
Tbk PT . . . . . . . . . . . . . 330,600 142,651Transcoal Pacific Tbk PT. . . . 90,000 46,284Unilever Indonesia Tbk PT. . . 67,200 220,134United Tractors Tbk PT . . . . . 190,845 276,621Wijaya Karya Persero Tbk PT . 743,457 100,821
13,590,464
MACAU — 0.0% (a)Newtree Group Holdings, Ltd.
(b) . . . . . . . . . . . . . . . . 314,000 21,229
MALAYSIA — 3.6%AEON Credit Service M Bhd . 67,050 233,482AirAsia Group Bhd . . . . . . . 242,600 101,977AirAsia X Bhd (b) . . . . . . . . 2,179,000 83,267Alliance Bank Malaysia Bhd . 718,410 489,006Astro Malaysia Holdings Bhd . 251,600 87,733Axiata Group Bhd . . . . . . . . 499,002 512,469BerMaz Motor Sdn Bhd . . . . 266,680 145,219British American Tobacco
Malaysia Bhd . . . . . . . . . 15,100 68,305Bursa Malaysia Bhd . . . . . . . 361,651 526,886Cahya Mata Sarawak Bhd . . . 240,200 154,894Carlsberg Brewery Malaysia
Bhd Class B . . . . . . . . . . 160,303 1,005,387
SPDR S&P EMERGING ASIA PACIFIC ETFSCHEDULE OF INVESTMENTS (continued)September 30, 2019
See accompanying notes to financial statements.120
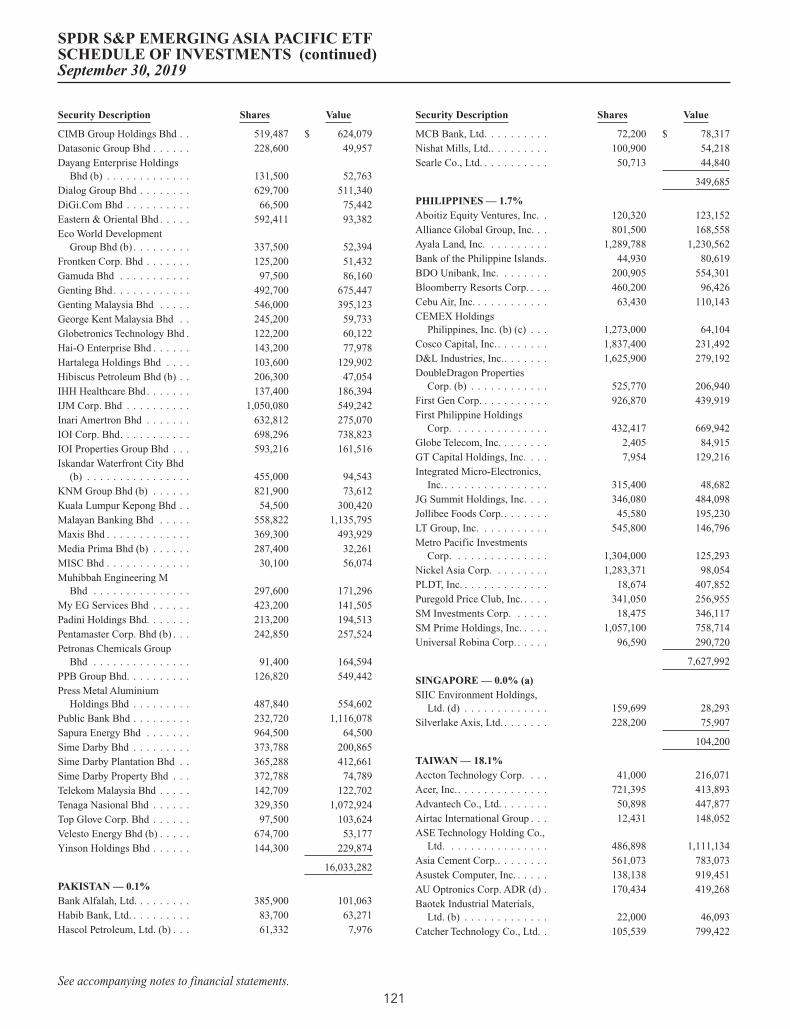
Security Description Shares Value
CIMB Group Holdings Bhd . . 519,487 $ 624,079Datasonic Group Bhd . . . . . . 228,600 49,957Dayang Enterprise Holdings
Bhd (b) . . . . . . . . . . . . . 131,500 52,763Dialog Group Bhd . . . . . . . . 629,700 511,340DiGi.Com Bhd . . . . . . . . . . 66,500 75,442Eastern & Oriental Bhd . . . . . 592,411 93,382Eco World Development
Group Bhd (b) . . . . . . . . . 337,500 52,394Frontken Corp. Bhd . . . . . . . 125,200 51,432Gamuda Bhd . . . . . . . . . . . 97,500 86,160Genting Bhd. . . . . . . . . . . . 492,700 675,447Genting Malaysia Bhd . . . . . 546,000 395,123George Kent Malaysia Bhd . . 245,200 59,733Globetronics Technology Bhd . 122,200 60,122Hai-O Enterprise Bhd . . . . . . 143,200 77,978Hartalega Holdings Bhd . . . . 103,600 129,902Hibiscus Petroleum Bhd (b) . . 206,300 47,054IHH Healthcare Bhd. . . . . . . 137,400 186,394IJM Corp. Bhd . . . . . . . . . . 1,050,080 549,242Inari Amertron Bhd . . . . . . . 632,812 275,070IOI Corp. Bhd. . . . . . . . . . . 698,296 738,823IOI Properties Group Bhd . . . 593,216 161,516Iskandar Waterfront City Bhd
(b) . . . . . . . . . . . . . . . . 455,000 94,543KNM Group Bhd (b) . . . . . . 821,900 73,612Kuala Lumpur Kepong Bhd . . 54,500 300,420Malayan Banking Bhd . . . . . 558,822 1,135,795Maxis Bhd . . . . . . . . . . . . . 369,300 493,929Media Prima Bhd (b) . . . . . . 287,400 32,261MISC Bhd . . . . . . . . . . . . . 30,100 56,074Muhibbah Engineering M
Bhd . . . . . . . . . . . . . . . 297,600 171,296My EG Services Bhd . . . . . . 423,200 141,505Padini Holdings Bhd. . . . . . . 213,200 194,513Pentamaster Corp. Bhd (b) . . . 242,850 257,524Petronas Chemicals Group
Bhd . . . . . . . . . . . . . . . 91,400 164,594PPB Group Bhd. . . . . . . . . . 126,820 549,442Press Metal Aluminium
Holdings Bhd . . . . . . . . . 487,840 554,602Public Bank Bhd . . . . . . . . . 232,720 1,116,078Sapura Energy Bhd . . . . . . . 964,500 64,500Sime Darby Bhd . . . . . . . . . 373,788 200,865Sime Darby Plantation Bhd . . 365,288 412,661Sime Darby Property Bhd . . . 372,788 74,789Telekom Malaysia Bhd . . . . . 142,709 122,702Tenaga Nasional Bhd . . . . . . 329,350 1,072,924Top Glove Corp. Bhd . . . . . . 97,500 103,624Velesto Energy Bhd (b) . . . . . 674,700 53,177Yinson Holdings Bhd . . . . . . 144,300 229,874
16,033,282
PAKISTAN — 0.1%Bank Alfalah, Ltd. . . . . . . . . 385,900 101,063Habib Bank, Ltd. . . . . . . . . . 83,700 63,271Hascol Petroleum, Ltd. (b) . . . 61,332 7,976
Security Description Shares Value
MCB Bank, Ltd. . . . . . . . . . 72,200 $ 78,317Nishat Mills, Ltd.. . . . . . . . . 100,900 54,218Searle Co., Ltd. . . . . . . . . . . 50,713 44,840
349,685
PHILIPPINES — 1.7%Aboitiz Equity Ventures, Inc. . 120,320 123,152Alliance Global Group, Inc. . . 801,500 168,558Ayala Land, Inc. . . . . . . . . . 1,289,788 1,230,562Bank of the Philippine Islands. 44,930 80,619BDO Unibank, Inc. . . . . . . . 200,905 554,301Bloomberry Resorts Corp. . . . 460,200 96,426Cebu Air, Inc. . . . . . . . . . . . 63,430 110,143CEMEX Holdings
Philippines, Inc. (b) (c) . . . 1,273,000 64,104Cosco Capital, Inc.. . . . . . . . 1,837,400 231,492D&L Industries, Inc.. . . . . . . 1,625,900 279,192DoubleDragon Properties
Corp. (b) . . . . . . . . . . . . 525,770 206,940First Gen Corp. . . . . . . . . . . 926,870 439,919First Philippine Holdings
Corp. . . . . . . . . . . . . . . 432,417 669,942Globe Telecom, Inc. . . . . . . . 2,405 84,915GT Capital Holdings, Inc. . . . 7,954 129,216Integrated Micro-Electronics,
Inc. . . . . . . . . . . . . . . . . 315,400 48,682JG Summit Holdings, Inc. . . . 346,080 484,098Jollibee Foods Corp.. . . . . . . 45,580 195,230LT Group, Inc. . . . . . . . . . . 545,800 146,796Metro Pacific Investments
Corp. . . . . . . . . . . . . . . 1,304,000 125,293Nickel Asia Corp. . . . . . . . . 1,283,371 98,054PLDT, Inc. . . . . . . . . . . . . . 18,674 407,852Puregold Price Club, Inc. . . . . 341,050 256,955SM Investments Corp. . . . . . 18,475 346,117SM Prime Holdings, Inc. . . . . 1,057,100 758,714Universal Robina Corp. . . . . . 96,590 290,720
7,627,992
SINGAPORE — 0.0% (a)SIIC Environment Holdings,
Ltd. (d) . . . . . . . . . . . . . 159,699 28,293Silverlake Axis, Ltd. . . . . . . . 228,200 75,907
104,200
TAIWAN — 18.1%Accton Technology Corp. . . . 41,000 216,071Acer, Inc.. . . . . . . . . . . . . . 721,395 413,893Advantech Co., Ltd. . . . . . . . 50,898 447,877Airtac International Group . . . 12,431 148,052ASE Technology Holding Co.,
Ltd. . . . . . . . . . . . . . . . 486,898 1,111,134Asia Cement Corp.. . . . . . . . 561,073 783,073Asustek Computer, Inc. . . . . . 138,138 919,451AU Optronics Corp. ADR (d) . 170,434 419,268Baotek Industrial Materials,
Ltd. (b) . . . . . . . . . . . . . 22,000 46,093Catcher Technology Co., Ltd. . 105,539 799,422
SPDR S&P EMERGING ASIA PACIFIC ETFSCHEDULE OF INVESTMENTS (continued)September 30, 2019
See accompanying notes to financial statements.121

Security Description Shares Value
Cathay Financial Holding Co.,Ltd. . . . . . . . . . . . . . . . 1,318,604 $ 1,738,333
Center Laboratories, Inc. . . . . 67,324 129,334Chailease Holding Co., Ltd. . . 27,000 108,785Chang Hwa Commercial
Bank, Ltd. . . . . . . . . . . . 646,182 450,929Chilisin Electronics Corp. . . . 14,937 40,346China Development Financial
Holding Corp. . . . . . . . . . 3,340,272 994,830China Life Insurance Co., Ltd.
(b) . . . . . . . . . . . . . . . . 215,605 170,958China Steel Chemical Corp. . . 18,877 76,361China Steel Corp. . . . . . . . . 1,791,625 1,328,220Chroma ATE, Inc. . . . . . . . . 30,000 142,146Chunghwa Telecom Co., Ltd. . 438,268 1,568,043Compal Electronics, Inc. . . . . 1,040,431 600,291Compeq Manufacturing Co.,
Ltd. . . . . . . . . . . . . . . . 49,000 54,884CTBC Financial Holding Co.,
Ltd. . . . . . . . . . . . . . . . 3,060,515 2,032,155Delta Electronics, Inc.. . . . . . 303,787 1,297,419E.Sun Financial Holding Co.,
Ltd. . . . . . . . . . . . . . . . 569,185 481,590Eclat Textile Co., Ltd. . . . . . . 42,365 568,062eCloudvalley Digital
Technology Co., Ltd.. . . . . 10,000 68,817Elite Material Co., Ltd. . . . . . 21,000 84,949eMemory Technology, Inc. . . . 16,000 169,157Epistar Corp. . . . . . . . . . . . 224,170 175,220Everlight Electronics Co.,
Ltd. . . . . . . . . . . . . . . . 169,996 152,602Far Eastern New Century
Corp. . . . . . . . . . . . . . . 919,170 848,820Far EasTone
Telecommunications Co.,Ltd. . . . . . . . . . . . . . . . 175,000 408,951
Feng TAY Enterprise Co.,Ltd. . . . . . . . . . . . . . . . 50,692 363,550
Firich Enterprises Co., Ltd. . . 33,957 41,263First Financial Holding Co.,
Ltd. . . . . . . . . . . . . . . . 1,071,071 752,610Formosa Chemicals & Fibre
Corp. . . . . . . . . . . . . . . 622,691 1,740,151Formosa Petrochemical Corp. . 207,000 655,205Formosa Plastics Corp. . . . . . 664,137 2,022,948Foxconn Technology Co., Ltd.. 251,519 524,530Fubon Financial Holding Co.,
Ltd. . . . . . . . . . . . . . . . 1,129,998 1,622,634Genius Electronic Optical Co.,
Ltd. . . . . . . . . . . . . . . . 6,000 81,516Giant Manufacturing Co.,
Ltd. . . . . . . . . . . . . . . . 48,000 326,452Globalwafers Co., Ltd. . . . . . 17,000 172,058Himax Technologies, Inc.
ADR (b) (d) . . . . . . . . . . 20,208 45,872Hiwin Technologies Corp. . . . 39,033 340,325Holy Stone Enterprise Co.,
Ltd. . . . . . . . . . . . . . . . 14,000 41,155
Security Description Shares Value
Hon Hai Precision IndustryCo., Ltd. . . . . . . . . . . . . 1,472,760 $ 3,474,868
Hotai Motor Co., Ltd. . . . . . . 44,000 668,697HTC Corp. . . . . . . . . . . . . . 123,710 141,556Hua Nan Financial Holdings
Co., Ltd. . . . . . . . . . . . . 968,594 654,065Innolux Corp. . . . . . . . . . . . 1,020,753 217,150Inventec Corp. . . . . . . . . . . 392,000 270,393ITEQ Corp. . . . . . . . . . . . . 16,000 77,874King Yuan Electronics Co.,
Ltd. . . . . . . . . . . . . . . . 372,898 418,878Largan Precision Co., Ltd. . . . 11,710 1,679,624Lite-On Technology Corp. . . . 567,891 902,417Macronix International . . . . . 362,673 368,231Makalot Industrial Co., Ltd. . . 47,016 249,291MediaTek, Inc. . . . . . . . . . . 170,219 2,024,555Medigen Biotechnology Corp.
(b) . . . . . . . . . . . . . . . . 14,000 28,474Mega Financial Holding Co.,
Ltd. . . . . . . . . . . . . . . . 1,915,148 1,774,743Merry Electronics Co., Ltd. . . 48,789 239,035Motech Industries, Inc. (b) . . . 139,934 42,308Nan Ya Plastics Corp. . . . . . . 950,759 2,135,986Nanya Technology Corp. . . . . 72,000 186,820Nien Made Enterprise Co.,
Ltd. . . . . . . . . . . . . . . . 11,000 96,440Novatek Microelectronics
Corp. . . . . . . . . . . . . . . 95,062 545,409PChome Online, Inc. (b) . . . . 25,957 108,348Pegatron Corp. . . . . . . . . . . 361,630 629,439Phoenix Silicon International
Corp. . . . . . . . . . . . . . . 22,000 50,347Pou Chen Corp. . . . . . . . . . . 245,000 313,905Powertech Technology, Inc. . . 237,518 667,587President Chain Store Corp. . . 55,000 514,110ProMOS Technologies, Inc.
(b) (e) . . . . . . . . . . . . . . 2,232 —Quanta Computer, Inc. . . . . . 575,194 1,049,364Radiant Opto-Electronics
Corp. . . . . . . . . . . . . . . 47,000 179,519Realtek Semiconductor Corp. . 94,161 698,062RichWave Technology Corp.. . 10,000 52,217Ritek Corp. (b) . . . . . . . . . . 122,834 34,683Shanghai Commercial &
Savings Bank, Ltd. . . . . . . 302,000 507,154Shin Kong Financial Holding
Co., Ltd. . . . . . . . . . . . . 2,691,938 814,753Silicon Motion Technology
Corp. ADR . . . . . . . . . . . 3,842 135,815Sino-American Silicon
Products, Inc. . . . . . . . . . 37,000 98,032SinoPac Financial Holdings
Co., Ltd. . . . . . . . . . . . . 3,485,630 1,359,446Sitronix Technology Corp. . . . 10,000 53,667Synnex Technology
International Corp. . . . . . . 235,000 274,960TA-I Technology Co., Ltd. . . . 21,000 24,232
SPDR S&P EMERGING ASIA PACIFIC ETFSCHEDULE OF INVESTMENTS (continued)September 30, 2019
See accompanying notes to financial statements.122

Security Description Shares Value
Taishin Financial Holding Co.,Ltd. . . . . . . . . . . . . . . . 1,130,911 $ 504,863
Taiwan Cement Corp. . . . . . . 934,801 1,194,696Taiwan FU Hsing Industrial
Co., Ltd. . . . . . . . . . . . . 223,000 316,626Taiwan Mobile Co., Ltd. . . . . 298,200 1,076,517Taiwan Paiho, Ltd. . . . . . . . . 31,000 77,339Taiwan Semiconductor
Manufacturing Co., Ltd.ADR . . . . . . . . . . . . . . . 377,913 17,565,396
Taiwan Surface MountingTechnology Corp.. . . . . . . 20,000 47,382
Taiwan Union TechnologyCorp. . . . . . . . . . . . . . . 13,000 59,501
Tatung Co., Ltd. (b) . . . . . . . 361,107 197,870Teco Electric and Machinery
Co., Ltd. . . . . . . . . . . . . 166,000 133,765TPK Holding Co., Ltd. (b) . . . 28,000 50,450Tripod Technology Corp. . . . . 213,361 766,805Unimicron Technology Corp. . 112,000 157,579Uni-President Enterprises
Corp. . . . . . . . . . . . . . . 702,971 1,694,861United Integrated Services
Co., Ltd. . . . . . . . . . . . . 86,755 459,998United Microelectronics Corp.
ADR . . . . . . . . . . . . . . . 354,898 741,737Vanguard International
Semiconductor Corp. . . . . 26,000 52,546Walsin Lihwa Corp. . . . . . . . 568,000 265,468Walsin Technology Corp. . . . . 36,000 202,485Win Semiconductors Corp. . . 37,000 332,141Winbond Electronics Corp. . . 123,000 70,768Wistron Corp. . . . . . . . . . . . 864,715 698,194Wiwynn Corp. . . . . . . . . . . 10,000 142,307Yageo Corp. . . . . . . . . . . . . 36,144 287,176Yuanta Financial Holding Co.,
Ltd. . . . . . . . . . . . . . . . 1,827,383 1,089,674Zhen Ding Technology
Holding, Ltd. . . . . . . . . . 33,000 118,068
79,792,471
THAILAND — 4.0%Advanced Info Service PCL . . 188,898 1,358,756Airports of Thailand PCL . . . 400,100 977,848Bangkok Dusit Medical
Services PCL . . . . . . . . . 112,000 88,619Bangkok Expressway & Metro
PCL . . . . . . . . . . . . . . . 2,116,107 747,228Beauty Community PCL . . . . 313,900 24,632BEC World PCL (b) . . . . . . . 138,200 33,437Bumrungrad Hospital PCL. . . 40,800 170,750Carabao Group PCL . . . . . . . 18,700 49,830Central Plaza Hotel PCL . . . . 56,300 60,745Charoen Pokphand Foods
PCL . . . . . . . . . . . . . . . 269,300 231,130Chularat Hospital PCL
Class F . . . . . . . . . . . . . 2,238,000 180,006COL PCL . . . . . . . . . . . . . 78,100 48,007
Security Description Shares Value
CP ALL PCL . . . . . . . . . . . 794,479 $ 2,110,558CPN Retail Growth Leasehold
REIT. . . . . . . . . . . . . . . 42,700 49,911E for L Aim PCL (b). . . . . . . 272,340 356Electricity Generating PCL . . 25,099 294,607Energy Absolute PCL . . . . . . 263,800 414,007Forth Smart Service PCL. . . . 233,300 49,582Frasers Property Thailand
Industrial Freehold &Leasehold REIT. . . . . . . . 84,400 49,395
Gulf Energy DevelopmentPCL . . . . . . . . . . . . . . . 55,300 289,292
Gunkul Engineering PCL. . . . 1,824,643 184,940Hana Microelectronics PCL . . 119,400 110,284Ichitan Group PCL. . . . . . . . 155,100 31,948Indorama Ventures PCL. . . . . 192,800 204,872IRPC PCL . . . . . . . . . . . . . 2,664,091 320,545Jasmine International PCL . . . 711,925 148,972Kasikornbank PCL. . . . . . . . 65,254 334,964Kasikornbank PCL NVDR. . . 32,300 165,275KCE Electronics PCL . . . . . . 366,000 198,646Krungthai Card PCL. . . . . . . 101,300 141,592MC Group PCL. . . . . . . . . . 345,500 85,853Mega Lifesciences PCL. . . . . 263,600 269,331Minor International PCL . . . . 369,486 453,024Muangthai Capital PCL. . . . . 26,800 49,946PTG Energy PCL. . . . . . . . . 205,200 126,132PTT Exploration &
Production PCL . . . . . . . . 178,007 704,229PTT Global Chemical PCL
NVDR. . . . . . . . . . . . . . 90,300 158,693PTT PCL . . . . . . . . . . . . . . 969,717 1,466,386Siam Cement PCL NVDR . . . 56,800 757,705Siam Commercial Bank PCL . 273,997 1,057,108Somboon Advance
Technology PCL . . . . . . . 192,000 105,463Srisawad Corp. PCL . . . . . . . 347,031 649,584Super Energy Corp. PCL
NVDR (b) . . . . . . . . . . . 1,176,700 23,853SVI PCL . . . . . . . . . . . . . . 1,118,800 167,537Thai Beverage PCL . . . . . . . 1,136,400 727,250Thai Oil PCL . . . . . . . . . . . 446,564 1,018,402Thai Union Group PCL
Class F . . . . . . . . . . . . . 249,900 136,450TMB Bank PCL . . . . . . . . . 2,299,600 118,044True Corp. PCL NVDR. . . . . 1,657,083 284,443WHA Premium Growth
Freehold & Leasehold RealEstate InvestmentTrustREIT. . . . . . . . . . . . . . . 78,400 49,729
17,479,896
SPDR S&P EMERGING ASIA PACIFIC ETFSCHEDULE OF INVESTMENTS (continued)September 30, 2019
See accompanying notes to financial statements.123

Security Description Shares Value
UNITED STATES — 0.0%(a)
Ideanomics, Inc. (b) (d) . . . . . 14,413 $ 21,692
TOTAL COMMONSTOCKS(Cost $409,637,324) . . . . . 439,504,521
RIGHTS — 0.0% (a)THAILAND — 0.0% (a)TMB Bank PCL (expiring
11/26/19) (b) (f)(Cost: $0) . . . . . . . . . . . . 1,591,933 8,848
WARRANTS — 0.0% (a)THAILAND — 0.0% (a)Minor International PCL
(expiring 9/30/21) (b)(Cost: $0) . . . . . . . . . . . . 20,064 2,611
SHORT-TERM INVESTMENTS — 1.0%State Street Navigator Securities
Lending Portfolio III (g) (h). . . 4,444,940 4,444,940
TOTAL SHORT-TERM INVESTMENTS(Cost $4,444,940). . . . . . . . . . . . . . . . . . . . . . 4,444,940
TOTAL INVESTMENTS — 100.8%(Cost $414,084,663) . . . . . . . . . . . . . . . . . . . . 443,963,340
LIABILITIES IN EXCESS OF OTHER ASSETS— (0.8)% . . . . . . . . . . . . . . . . . . . . . . . . . . (3,696,217)
NET ASSETS — 100.0% . . . . . . . . . . . . . . . . . $ 440,267,123
(a) Amount is less than 0.05% of net assets.(b) Non-income producing security.(c) Securities purchased pursuant to Rule 144A of the Securities Act
of 1933, as amended. These securities, which represent 2.8% ofnet assets as of September 30, 2019, are considered liquid andmay be resold in transactions exempt from registration, normallyto qualified institutional buyers.
(d) All or a portion of the shares of the security are on loan atSeptember 30, 2019.
(e) Fair valued as determined in good faith by the Trust’s OversightCommittee in accordance with policy and procedures approved bythe Board of Trustees. Security value is determined based onLevel 3 inputs. As of September 30, 2019, total aggregate fairvalue of these securities is $46,981, representing less than 0.05%of the Fund’s net assets.
(f) Fair valued as determined in good faith by the Trust’s OversightCommittee in accordance with policy and procedures approved bythe Board of Trustees. As of September 30, 2019, total aggregatefair value of these securities is $27,825, representing less than0.05% of net assets.
(g) The Fund invested in an affiliated entity. Amounts related to thesetransactions during the period ended September 30, 2019 areshown in the Affiliate Table below.
(h) Investment of cash collateral for securities loaned.
ADR American Depositary ReceiptCOL CollaterlizedGDR Global Depositary ReceiptNVDR Non Voting Depositary ReceiptREIT Real Estate Investment Trust
INR Indian Rupee
The following table summarizes the value of the Fund’s investments according to the fair value hierarchy as of September 30,2019.
DescriptionLevel 1 –
Quoted Prices
Level 2 –Other SignificantObservable Inputs
Level 3 –Significant
Unobservable Inputs Total
ASSETS:INVESTMENTS:Corporate Bonds & Notes . . . . . . . . . . . . . . . . . . . . . . . . . . . . . . $ — $ 2,420 $ — $ 2,420
Common Stocks . . . . . . . . . . . . . . . . . . . . . . . . . . . . . . . . . . . . 425,135,161 14,322,379 46,981(a) 439,504,521
Rights . . . . . . . . . . . . . . . . . . . . . . . . . . . . . . . . . . . . . . . . . . — 8,848 — 8,848
Warrants . . . . . . . . . . . . . . . . . . . . . . . . . . . . . . . . . . . . . . . . . 2,611 — — 2,611
Short-Term Investments . . . . . . . . . . . . . . . . . . . . . . . . . . . . . . . 4,444,940 — — 4,444,940
TOTAL INVESTMENTS . . . . . . . . . . . . . . . . . . . . . . . . . . . . . $429,582,712 $14,333,647 $46,981 $443,963,340
(a) Fund held Level 3 securities that were valued at $0 at September 30, 2019.
SPDR S&P EMERGING ASIA PACIFIC ETFSCHEDULE OF INVESTMENTS (continued)September 30, 2019
See accompanying notes to financial statements.124
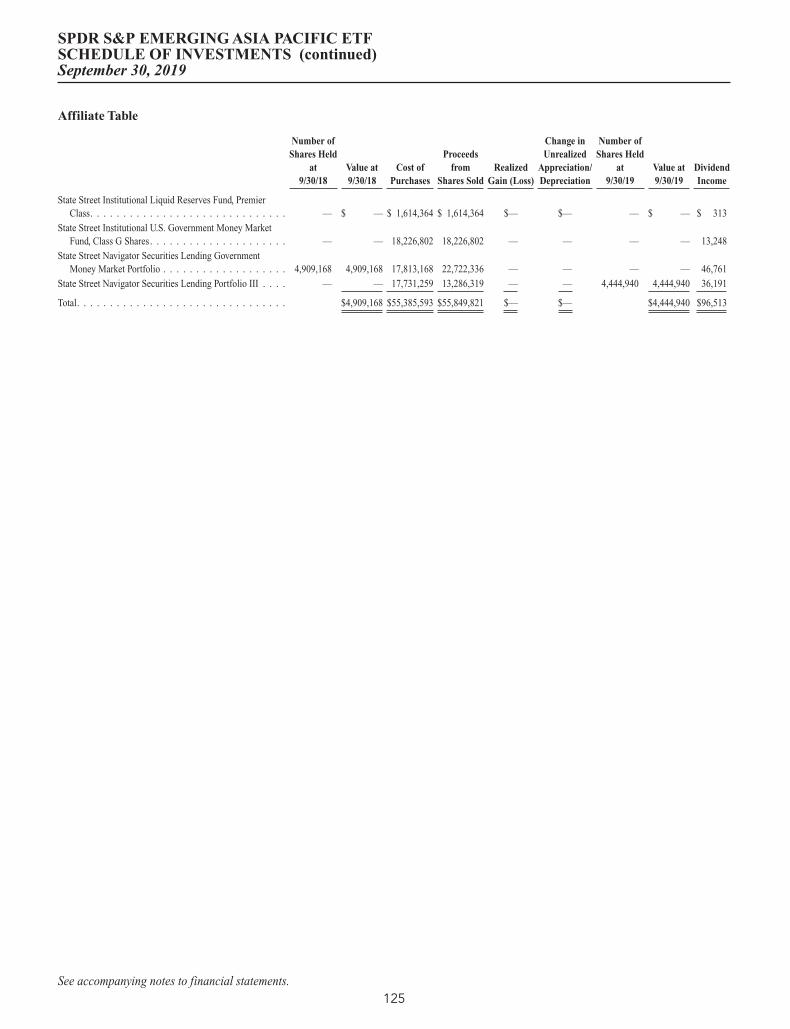
Affiliate Table
Number ofShares Held
at9/30/18
Value at9/30/18
Cost ofPurchases
Proceedsfrom
Shares SoldRealized
Gain (Loss)
Change inUnrealized
Appreciation/Depreciation
Number ofShares Held
at9/30/19
Value at9/30/19
DividendIncome
State Street Institutional Liquid Reserves Fund, PremierClass. . . . . . . . . . . . . . . . . . . . . . . . . . . . . . — $ — $ 1,614,364 $ 1,614,364 $— $— — $ — $ 313
State Street Institutional U.S. Government Money MarketFund, Class G Shares. . . . . . . . . . . . . . . . . . . . . — — 18,226,802 18,226,802 — — — — 13,248
State Street Navigator Securities Lending GovernmentMoney Market Portfolio . . . . . . . . . . . . . . . . . . . 4,909,168 4,909,168 17,813,168 22,722,336 — — — — 46,761
State Street Navigator Securities Lending Portfolio III . . . . — — 17,731,259 13,286,319 — — 4,444,940 4,444,940 36,191
Total. . . . . . . . . . . . . . . . . . . . . . . . . . . . . . . . $4,909,168 $55,385,593 $55,849,821 $— $— $4,444,940 $96,513
SPDR S&P EMERGING ASIA PACIFIC ETFSCHEDULE OF INVESTMENTS (continued)September 30, 2019
See accompanying notes to financial statements.125
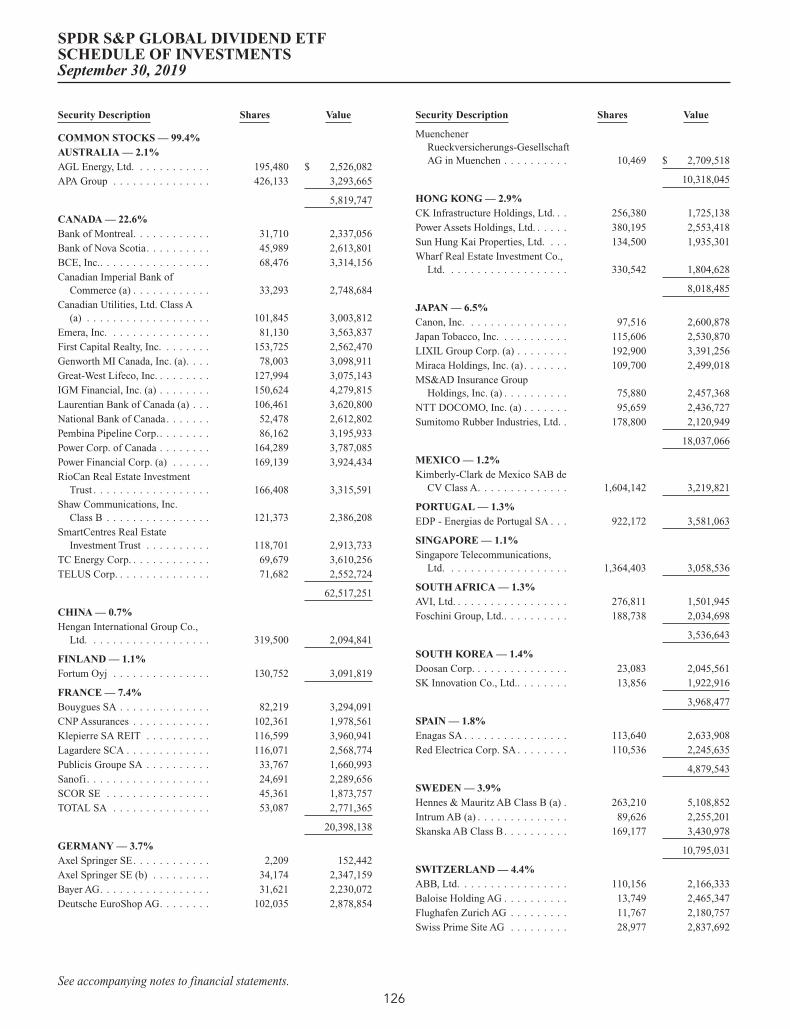
Security Description Shares Value
COMMON STOCKS — 99.4%AUSTRALIA — 2.1%AGL Energy, Ltd. . . . . . . . . . . . 195,480 $ 2,526,082APA Group . . . . . . . . . . . . . . . 426,133 3,293,665
5,819,747
CANADA — 22.6%Bank of Montreal. . . . . . . . . . . . 31,710 2,337,056Bank of Nova Scotia. . . . . . . . . . 45,989 2,613,801BCE, Inc.. . . . . . . . . . . . . . . . . 68,476 3,314,156Canadian Imperial Bank of
Commerce (a) . . . . . . . . . . . . 33,293 2,748,684Canadian Utilities, Ltd. Class A
(a) . . . . . . . . . . . . . . . . . . . 101,845 3,003,812Emera, Inc. . . . . . . . . . . . . . . . 81,130 3,563,837First Capital Realty, Inc. . . . . . . . 153,725 2,562,470Genworth MI Canada, Inc. (a). . . . 78,003 3,098,911Great-West Lifeco, Inc. . . . . . . . . 127,994 3,075,143IGM Financial, Inc. (a) . . . . . . . . 150,624 4,279,815Laurentian Bank of Canada (a) . . . 106,461 3,620,800National Bank of Canada. . . . . . . 52,478 2,612,802Pembina Pipeline Corp. . . . . . . . . 86,162 3,195,933Power Corp. of Canada . . . . . . . . 164,289 3,787,085Power Financial Corp. (a) . . . . . . 169,139 3,924,434RioCan Real Estate Investment
Trust . . . . . . . . . . . . . . . . . . 166,408 3,315,591Shaw Communications, Inc.
Class B . . . . . . . . . . . . . . . . 121,373 2,386,208SmartCentres Real Estate
Investment Trust . . . . . . . . . . 118,701 2,913,733TC Energy Corp. . . . . . . . . . . . . 69,679 3,610,256TELUS Corp. . . . . . . . . . . . . . . 71,682 2,552,724
62,517,251
CHINA — 0.7%Hengan International Group Co.,
Ltd. . . . . . . . . . . . . . . . . . . 319,500 2,094,841
FINLAND — 1.1%Fortum Oyj . . . . . . . . . . . . . . . 130,752 3,091,819
FRANCE — 7.4%Bouygues SA . . . . . . . . . . . . . . 82,219 3,294,091CNP Assurances . . . . . . . . . . . . 102,361 1,978,561Klepierre SA REIT . . . . . . . . . . 116,599 3,960,941Lagardere SCA . . . . . . . . . . . . . 116,071 2,568,774Publicis Groupe SA . . . . . . . . . . 33,767 1,660,993Sanofi. . . . . . . . . . . . . . . . . . . 24,691 2,289,656SCOR SE . . . . . . . . . . . . . . . . 45,361 1,873,757TOTAL SA . . . . . . . . . . . . . . . 53,087 2,771,365
20,398,138
GERMANY — 3.7%Axel Springer SE. . . . . . . . . . . . 2,209 152,442Axel Springer SE (b) . . . . . . . . . 34,174 2,347,159Bayer AG. . . . . . . . . . . . . . . . . 31,621 2,230,072Deutsche EuroShop AG. . . . . . . . 102,035 2,878,854
Security Description Shares Value
MuenchenerRueckversicherungs-GesellschaftAG in Muenchen . . . . . . . . . . 10,469 $ 2,709,518
10,318,045
HONG KONG — 2.9%CK Infrastructure Holdings, Ltd. . . 256,380 1,725,138Power Assets Holdings, Ltd. . . . . . 380,195 2,553,418Sun Hung Kai Properties, Ltd. . . . 134,500 1,935,301Wharf Real Estate Investment Co.,
Ltd. . . . . . . . . . . . . . . . . . . 330,542 1,804,628
8,018,485
JAPAN — 6.5%Canon, Inc. . . . . . . . . . . . . . . . 97,516 2,600,878Japan Tobacco, Inc. . . . . . . . . . . 115,606 2,530,870LIXIL Group Corp. (a) . . . . . . . . 192,900 3,391,256Miraca Holdings, Inc. (a) . . . . . . . 109,700 2,499,018MS&AD Insurance Group
Holdings, Inc. (a) . . . . . . . . . . 75,880 2,457,368NTT DOCOMO, Inc. (a) . . . . . . . 95,659 2,436,727Sumitomo Rubber Industries, Ltd. . 178,800 2,120,949
18,037,066
MEXICO — 1.2%Kimberly-Clark de Mexico SAB de
CV Class A. . . . . . . . . . . . . . 1,604,142 3,219,821
PORTUGAL — 1.3%EDP - Energias de Portugal SA . . . 922,172 3,581,063
SINGAPORE — 1.1%Singapore Telecommunications,
Ltd. . . . . . . . . . . . . . . . . . . 1,364,403 3,058,536
SOUTH AFRICA — 1.3%AVI, Ltd. . . . . . . . . . . . . . . . . . 276,811 1,501,945Foschini Group, Ltd.. . . . . . . . . . 188,738 2,034,698
3,536,643
SOUTH KOREA — 1.4%Doosan Corp. . . . . . . . . . . . . . . 23,083 2,045,561SK Innovation Co., Ltd.. . . . . . . . 13,856 1,922,916
3,968,477
SPAIN — 1.8%Enagas SA . . . . . . . . . . . . . . . . 113,640 2,633,908Red Electrica Corp. SA . . . . . . . . 110,536 2,245,635
4,879,543
SWEDEN — 3.9%Hennes & Mauritz AB Class B (a) . 263,210 5,108,852Intrum AB (a) . . . . . . . . . . . . . . 89,626 2,255,201Skanska AB Class B. . . . . . . . . . 169,177 3,430,978
10,795,031
SWITZERLAND — 4.4%ABB, Ltd. . . . . . . . . . . . . . . . . 110,156 2,166,333Baloise Holding AG . . . . . . . . . . 13,749 2,465,347Flughafen Zurich AG . . . . . . . . . 11,767 2,180,757Swiss Prime Site AG . . . . . . . . . 28,977 2,837,692
SPDR S&P GLOBAL DIVIDEND ETFSCHEDULE OF INVESTMENTSSeptember 30, 2019
See accompanying notes to financial statements.126

Security Description Shares Value
Swisscom AG . . . . . . . . . . . . . . 4,886 $ 2,412,253
12,062,382
UNITED KINGDOM — 14.8%Ashmore Group PLC . . . . . . . . . 460,992 2,874,486BAE Systems PLC. . . . . . . . . . . 367,819 2,583,600Close Brothers Group PLC. . . . . . 112,323 1,950,276Daily Mail & General Trust PLC . . 148,566 1,559,823Domino’s Pizza Group PLC . . . . . 567,642 1,783,038G4S PLC . . . . . . . . . . . . . . . . . 937,316 2,185,362GlaxoSmithKline PLC . . . . . . . . 142,000 3,052,815Greene King PLC . . . . . . . . . . . 413,408 4,314,978IG Group Holdings PLC . . . . . . . 515,002 3,824,321Kingfisher PLC. . . . . . . . . . . . . 926,288 2,360,548Next PLC . . . . . . . . . . . . . . . . 33,335 2,541,129Pennon Group PLC . . . . . . . . . . 292,853 2,984,499Schroders PLC . . . . . . . . . . . . . 70,622 2,676,094Tate & Lyle PLC . . . . . . . . . . . . 249,516 2,263,042WPP PLC . . . . . . . . . . . . . . . . 317,589 3,984,094
40,938,105
UNITED STATES — 21.2%AT&T, Inc.. . . . . . . . . . . . . . . . 119,414 4,518,626Compass Minerals International,
Inc.. . . . . . . . . . . . . . . . . . . 73,714 4,164,104Dominion Energy, Inc. . . . . . . . . 34,826 2,822,299Exxon Mobil Corp. . . . . . . . . . . 34,187 2,413,944General Mills, Inc. . . . . . . . . . . . 59,533 3,281,459Helmerich & Payne, Inc. . . . . . . . 58,257 2,334,358International Business Machines
Corp. . . . . . . . . . . . . . . . . . 23,009 3,345,969LTC Properties, Inc. REIT . . . . . . 63,577 3,256,414Mercury General Corp. . . . . . . . . 46,115 2,576,906National Health Investors, Inc.
REIT. . . . . . . . . . . . . . . . . . 34,289 2,825,071Occidental Petroleum Corp. . . . . . 39,436 1,753,719People’s United Financial, Inc. . . . 152,076 2,377,708Philip Morris International, Inc. . . 47,888 3,636,136PPL Corp. . . . . . . . . . . . . . . . . 99,028 3,118,392Principal Financial Group, Inc. . . . 50,484 2,884,656
Security Description Shares Value
Prudential Financial, Inc. . . . . . . . 24,619 $ 2,214,479Ryder System, Inc.. . . . . . . . . . . 41,654 2,156,427Southern Co. . . . . . . . . . . . . . . 59,280 3,661,725United Bankshares, Inc.. . . . . . . . 64,276 2,434,132Universal Corp. . . . . . . . . . . . . . 50,909 2,790,322
58,566,846
TOTAL COMMON STOCKS(Cost $274,373,212) . . . . . . . . 274,901,839
SHORT-TERM INVESTMENTS — 5.3%State Street Institutional Liquid
Reserves Fund, Premier Class2.03% (c) (d). . . . . . . . . . . . . 232,517 232,541
State Street Navigator SecuritiesLending Portfolio III (e) (f). . . . 14,467,092 14,467,092
TOTAL SHORT-TERM INVESTMENTS(Cost $14,699,630) . . . . . . . . . . . . . . . . . . . . . 14,699,633
TOTAL INVESTMENTS — 104.7%(Cost $289,072,842) . . . . . . . . . . . . . . . . . . . . 289,601,472
LIABILITIES IN EXCESS OF OTHER ASSETS— (4.7)% . . . . . . . . . . . . . . . . . . . . . . . . . . (12,912,068)
NET ASSETS — 100.0% . . . . . . . . . . . . . . . . . $ 276,689,404
(a) All or a portion of the shares of the security are on loan atSeptember 30, 2019.
(b) Non-income producing security.(c) The Fund invested in certain money market funds managed by
SSGA Funds Management, Inc. Amounts related to thesetransactions during the period ended September 30, 2019 areshown in the Affiliate Table below.
(d) The rate shown is the annualized seven-day yield at September 30,2019.
(e) The Fund invested in an affiliated entity. Amounts related to thesetransactions during the period ended September 30, 2019 areshown in the Affiliate Table below.
(f) Investment of cash collateral for securities loaned.
REIT Real Estate Investment Trust
The following table summarizes the value of the Fund’s investments according to the fair value hierarchy as of September 30,2019.
DescriptionLevel 1 –
Quoted Prices
Level 2 –Other SignificantObservable Inputs
Level 3 –Significant
Unobservable Inputs Total
ASSETS:INVESTMENTS:Common Stocks . . . . . . . . . . . . . . . . . . . . . . . . . . . . . . . . . . . . $274,901,839 $— $— $274,901,839
Short-Term Investments . . . . . . . . . . . . . . . . . . . . . . . . . . . . . . . 14,699,633 — — 14,699,633
TOTAL INVESTMENTS . . . . . . . . . . . . . . . . . . . . . . . . . . . . . $289,601,472 $— $— $289,601,472
SPDR S&P GLOBAL DIVIDEND ETFSCHEDULE OF INVESTMENTS (continued)September 30, 2019
See accompanying notes to financial statements.127

Affiliate Table
Number ofShares Held
at9/30/18
Value at9/30/18
Cost ofPurchases
Proceedsfrom
Shares SoldRealized
Gain (Loss)
Change inUnrealized
Appreciation/Depreciation
Number ofShares Held
at9/30/19
Value at9/30/19
DividendIncome
State Street Institutional Liquid Reserves Fund, PremierClass . . . . . . . . . . . . . . . . . . . . . . . . . . . — $ — $ 3,027,697 $ 2,795,148 $(11) $ 3 232,517 $ 232,541 $ 1,458
State Street Institutional U.S. Government MoneyMarket Fund, Class G Shares . . . . . . . . . . . . . 68,507 68,507 27,042,426 27,110,933 — — — — 9,030
State Street Navigator Securities Lending GovernmentMoney Market Portfolio . . . . . . . . . . . . . . . . 19,113,339 19,113,339 54,633,603 73,746,942 — — — — 148,309
State Street Navigator Securities Lending Portfolio III . — — 74,382,241 59,915,149 — — 14,467,092 14,467,092 83,934
Total . . . . . . . . . . . . . . . . . . . . . . . . . . . . . $19,181,846 $159,085,967 $163,568,172 $(11) $ 3 $14,699,633 $242,731
SPDR S&P GLOBAL DIVIDEND ETFSCHEDULE OF INVESTMENTS (continued)September 30, 2019
See accompanying notes to financial statements.128

Security Description Shares Value
COMMON STOCKS — 99.6%AUSTRALIA — 9.7%Atlas Arteria, Ltd. . . . . . . . . . . . . 981,950 $ 5,165,753Qube Holdings, Ltd. . . . . . . . . . . . 2,387,638 5,153,094Sydney Airport . . . . . . . . . . . . . . 1,642,656 8,896,349Transurban Group Stapled Security . 1,974,504 19,562,730
38,777,926
BRAZIL — 0.7%Centrais Eletricas Brasileiras SA
ADR . . . . . . . . . . . . . . . . . . . 46,802 448,363Cia de Saneamento Basico do Estado
de Sao Paulo ADR . . . . . . . . . . 58,828 698,877Cia Energetica de Minas Gerais
ADR (a) . . . . . . . . . . . . . . . . . 167,077 566,391Ultrapar Participacoes SA ADR (a). . 206,245 921,915
2,635,546
CANADA — 10.7%Enbridge, Inc. (a)(b) . . . . . . . . . . . 526,575 18,493,759Enbridge, Inc. (b) . . . . . . . . . . . . . 25,122 881,280Gibson Energy, Inc. . . . . . . . . . . . 39,600 680,438Inter Pipeline, Ltd. (a) . . . . . . . . . . 112,402 1,973,827Keyera Corp.. . . . . . . . . . . . . . . . 58,321 1,417,059Pembina Pipeline Corp. . . . . . . . . . 139,292 5,166,639TC Energy Corp. . . . . . . . . . . . . . 254,258 13,173,791Westshore Terminals Investment
Corp. (a) . . . . . . . . . . . . . . . . 65,493 1,011,580
42,798,373
CHILE — 0.3%Enel Americas SA ADR. . . . . . . . . 125,816 1,146,184
CHINA — 3.4%Beijing Capital International Airport
Co., Ltd. Class H . . . . . . . . . . . 2,434,000 2,077,131Beijing Enterprises Water Group,
Ltd. . . . . . . . . . . . . . . . . . . . . 1,034,000 528,910CGN Power Co., Ltd. Class H (c) . . . 1,749,000 441,746China Merchants Port Holdings Co.,
Ltd. . . . . . . . . . . . . . . . . . . . . 1,934,074 2,911,202China Resources Gas Group, Ltd. . . 142,000 701,903COSCO SHIPPING Ports, Ltd. . . . . 2,542,859 2,030,550Jiangsu Expressway Co., Ltd.
Class H . . . . . . . . . . . . . . . . . 1,820,000 2,312,320Kunlun Energy Co., Ltd. . . . . . . . . 686,000 590,670Zhejiang Expressway Co., Ltd.
Class H . . . . . . . . . . . . . . . . . 2,134,000 1,845,616
13,440,048
FRANCE — 6.0%Aeroports de Paris . . . . . . . . . . . . 48,625 8,651,390Engie SA . . . . . . . . . . . . . . . . . . 315,509 5,152,639Gaztransport Et Technigaz SA . . . . . 6,059 600,112Getlink SE . . . . . . . . . . . . . . . . . 646,955 9,719,175
24,123,316
Security Description Shares Value
GERMANY — 1.4%Fraport AG Frankfurt Airport
Services Worldwide . . . . . . . . . 54,998 $ 4,665,995Hamburger Hafen und Logistik AG . 31,290 779,808
5,445,803
HONG KONG — 1.6%China Gas Holdings, Ltd. . . . . . . . . 359,200 1,388,341Guangdong Investment, Ltd. . . . . . . 496,000 970,564Hutchison Port Holdings Trust. . . . . 8,041,770 1,254,516Shenzhen International Holdings,
Ltd. . . . . . . . . . . . . . . . . . . . . 1,412,205 2,712,938
6,326,359
ITALY — 8.1%ASTM SpA . . . . . . . . . . . . . . . . 53,066 1,697,394Atlantia SpA. . . . . . . . . . . . . . . . 700,247 16,940,050Enav SpA (c) . . . . . . . . . . . . . . . 379,120 2,140,980Enel SpA . . . . . . . . . . . . . . . . . . 1,328,638 9,923,543Societa Iniziative Autostradali e
Servizi SpA . . . . . . . . . . . . . . 101,622 1,773,720
32,475,687
LUXEMBOURG — 0.0% (d)Corp. America Airports SA (e) . . . . 42,844 194,083
MEXICO — 3.3%Grupo Aeroportuario del Centro
Norte SAB de CV ADR (a) . . . . . 63,960 3,041,298Grupo Aeroportuario del Pacifico
SAB de CV ADR . . . . . . . . . . . 56,021 5,407,147Grupo Aeroportuario del Sureste
SAB de CV ADR . . . . . . . . . . . 30,064 4,584,760
13,033,205
NETHERLANDS — 0.2%Koninklijke Vopak NV . . . . . . . . . 18,128 932,030
NEW ZEALAND — 2.0%Auckland International Airport, Ltd. . 1,406,814 8,071,607
SINGAPORE — 0.2%SIA Engineering Co., Ltd. . . . . . . . 366,600 683,945
SPAIN — 7.7%Aena SME SA (c) . . . . . . . . . . . . 109,439 20,044,145Iberdrola SA . . . . . . . . . . . . . . . . 1,029,363 10,701,408
30,745,553
SWITZERLAND — 1.3%Flughafen Zurich AG . . . . . . . . . . 28,341 5,252,386
UNITED KINGDOM — 3.0%BBA Aviation PLC . . . . . . . . . . . . 1,354,172 5,209,823National Grid PLC . . . . . . . . . . . . 645,969 7,020,165
12,229,988
UNITED STATES — 40.0%American Electric Power Co., Inc. . . 84,940 7,958,029American Water Works Co., Inc. . . . 31,100 3,863,553Cheniere Energy, Inc. (e) . . . . . . . . 63,705 4,017,237Consolidated Edison, Inc.. . . . . . . . 57,164 5,400,283
SPDR S&P GLOBAL INFRASTRUCTURE ETFSCHEDULE OF INVESTMENTSSeptember 30, 2019
See accompanying notes to financial statements.129

Security Description Shares Value
Dominion Energy, Inc. . . . . . . . . . 141,417 $ 11,460,434DTE Energy Co. . . . . . . . . . . . . . 31,580 4,198,877Duke Energy Corp.. . . . . . . . . . . . 125,358 12,016,818Edison International . . . . . . . . . . . 61,600 4,645,872Equitrans Midstream Corp. (a) . . . . 55,620 809,271Eversource Energy . . . . . . . . . . . . 55,666 4,757,773Exelon Corp.. . . . . . . . . . . . . . . . 167,212 8,078,012FirstEnergy Corp.. . . . . . . . . . . . . 92,900 4,480,567Kinder Morgan, Inc. . . . . . . . . . . . 530,694 10,937,603Macquarie Infrastructure Corp. . . . . 115,548 4,560,679NextEra Energy, Inc. . . . . . . . . . . . 84,098 19,593,993ONEOK, Inc. . . . . . . . . . . . . . . . 112,582 8,296,167Public Service Enterprise Group,
Inc. . . . . . . . . . . . . . . . . . . . . 86,997 5,400,774Sempra Energy . . . . . . . . . . . . . . 47,247 6,974,130Southern Co.. . . . . . . . . . . . . . . . 179,804 11,106,493Targa Resources Corp. (a) . . . . . . . 63,405 2,546,979WEC Energy Group, Inc. . . . . . . . . 54,306 5,164,501Williams Cos., Inc. . . . . . . . . . . . . 330,358 7,948,413Xcel Energy, Inc. . . . . . . . . . . . . . 90,249 5,856,258
160,072,716
TOTAL COMMON STOCKS(Cost $361,202,172) . . . . . . . . . 398,384,755
SHORT-TERM INVESTMENTS — 0.7%State Street Institutional Liquid
Reserves Fund, Premier Class2.03% (f) (g) . . . . . . . . . . . . . . 912,789 912,880
State Street Navigator SecuritiesLending Portfolio III (h) (i) . . . . . 1,828,735 1,828,735
TOTAL SHORT-TERM INVESTMENTS(Cost $2,741,615). . . . . . . . . . . . . . . . . . . . . . 2,741,615
TOTAL INVESTMENTS — 100.3%(Cost $363,943,787) . . . . . . . . . . . . . . . . . . . . 401,126,370
LIABILITIES IN EXCESS OF OTHER ASSETS— (0.3)% . . . . . . . . . . . . . . . . . . . . . . . . . . (1,303,784)
NET ASSETS — 100.0% . . . . . . . . . . . . . . . . . $ 399,822,586
(a) All or a portion of the shares of the security are on loan atSeptember 30, 2019.
(b) Reflects separate holdings of the issuer’s common stock traded ondifferent securities exchanges.
(c) Securities purchased pursuant to Rule 144A of the Securities Actof 1933, as amended. These securities, which represent 5.7% ofnet assets as of September 30, 2019, are considered liquid andmay be resold in transactions exempt from registration, normallyto qualified institutional buyers.
(d) Amount is less than 0.05% of net assets.(e) Non-income producing security.(f) The Fund invested in certain money market funds managed by
SSGA Funds Management, Inc. Amounts related to thesetransactions during the period ended September 30, 2019 areshown in the Affiliate Table below.
(g) The rate shown is the annualized seven-day yield at September 30,2019.
(h) The Fund invested in an affiliated entity. Amounts related to thesetransactions during the period ended September 30, 2019 areshown in the Affiliate Table below.
(i) Investment of cash collateral for securities loaned.
ADR American Depositary Receipt
The following table summarizes the value of the Fund’s investments according to the fair value hierarchy as of September 30,2019.
DescriptionLevel 1 –
Quoted Prices
Level 2 –Other SignificantObservable Inputs
Level 3 –Significant
Unobservable Inputs Total
ASSETS:INVESTMENTS:Common Stocks . . . . . . . . . . . . . . . . . . . . . . . . . . . . . . . . . . . . $398,384,755 $— $— $398,384,755
Short-Term Investments . . . . . . . . . . . . . . . . . . . . . . . . . . . . . . . 2,741,615 — — 2,741,615
TOTAL INVESTMENTS . . . . . . . . . . . . . . . . . . . . . . . . . . . . . $401,126,370 $— $— $401,126,370
SPDR S&P GLOBAL INFRASTRUCTURE ETFSCHEDULE OF INVESTMENTS (continued)September 30, 2019
See accompanying notes to financial statements.130

Affiliate Table
Number ofShares Held
at9/30/18
Value at9/30/18
Cost ofPurchases
Proceedsfrom
Shares SoldRealized
Gain (Loss)
Change inUnrealized
Appreciation/Depreciation
Number ofShares Held
at9/30/19
Value at9/30/19
DividendIncome
State Street Institutional Liquid Reserves Fund, PremierClass . . . . . . . . . . . . . . . . . . . . . . . . . . . . — $ — $ 1,430,210 $ 517,345 $15 $— 912,789 $ 912,880 $ 1,032
State Street Institutional U.S. Government Money MarketFund, Class G Shares . . . . . . . . . . . . . . . . . . . 824,073 824,073 21,693,897 22,517,970 — — — — 13,068
State Street Navigator Securities Lending GovernmentMoney Market Portfolio. . . . . . . . . . . . . . . . . . 4,976,109 4,976,109 63,292,476 68,268,585 — — — — 18,423
State Street Navigator Securities Lending Portfolio III . . . — — 37,636,383 35,807,648 — — 1,828,735 1,828,735 16,765
Total . . . . . . . . . . . . . . . . . . . . . . . . . . . . . . $5,800,182 $124,052,966 $127,111,548 $15 $— $2,741,615 $49,288
SPDR S&P GLOBAL INFRASTRUCTURE ETFSCHEDULE OF INVESTMENTS (continued)September 30, 2019
See accompanying notes to financial statements.131
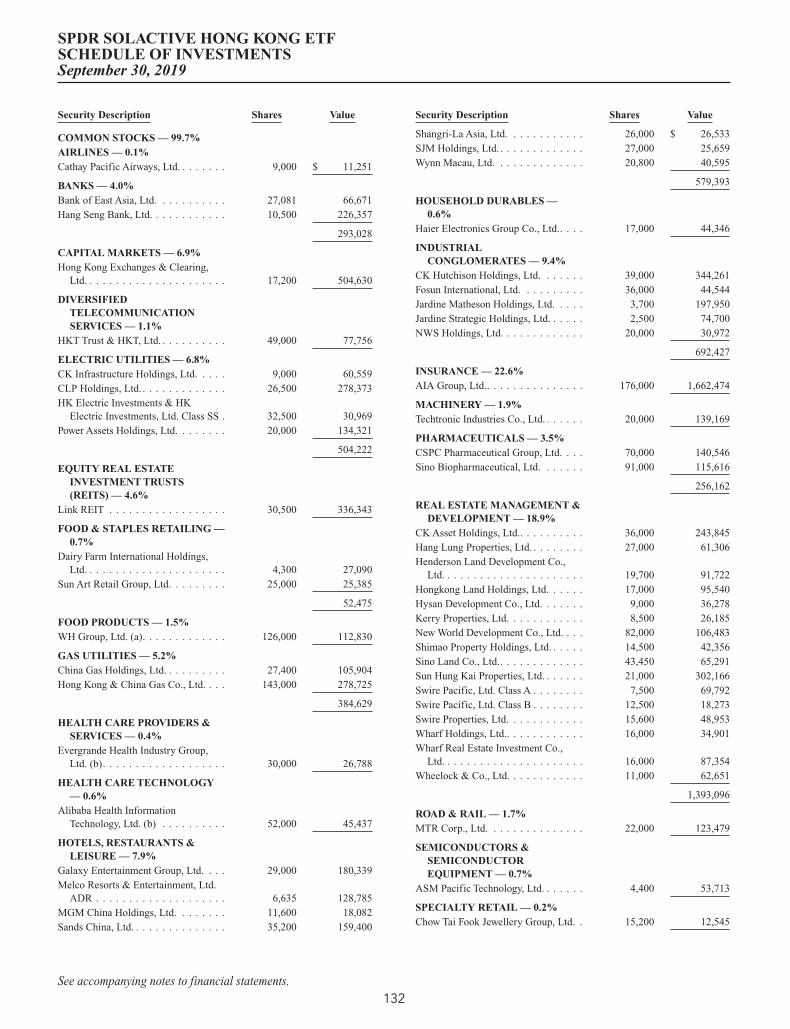
Security Description Shares Value
COMMON STOCKS — 99.7%AIRLINES — 0.1%Cathay Pacific Airways, Ltd. . . . . . . . 9,000 $ 11,251
BANKS — 4.0%Bank of East Asia, Ltd. . . . . . . . . . . 27,081 66,671Hang Seng Bank, Ltd. . . . . . . . . . . . 10,500 226,357
293,028
CAPITAL MARKETS — 6.9%Hong Kong Exchanges & Clearing,
Ltd. . . . . . . . . . . . . . . . . . . . . . 17,200 504,630
DIVERSIFIEDTELECOMMUNICATIONSERVICES — 1.1%
HKT Trust & HKT, Ltd. . . . . . . . . . . 49,000 77,756
ELECTRIC UTILITIES — 6.8%CK Infrastructure Holdings, Ltd. . . . . 9,000 60,559CLP Holdings, Ltd. . . . . . . . . . . . . . 26,500 278,373HK Electric Investments & HK
Electric Investments, Ltd. Class SS . 32,500 30,969Power Assets Holdings, Ltd. . . . . . . . 20,000 134,321
504,222
EQUITY REAL ESTATEINVESTMENT TRUSTS(REITS) — 4.6%
Link REIT . . . . . . . . . . . . . . . . . . 30,500 336,343
FOOD & STAPLES RETAILING —0.7%
Dairy Farm International Holdings,Ltd. . . . . . . . . . . . . . . . . . . . . . 4,300 27,090
Sun Art Retail Group, Ltd. . . . . . . . . 25,000 25,385
52,475
FOOD PRODUCTS — 1.5%WH Group, Ltd. (a). . . . . . . . . . . . . 126,000 112,830
GAS UTILITIES — 5.2%China Gas Holdings, Ltd. . . . . . . . . . 27,400 105,904Hong Kong & China Gas Co., Ltd. . . . 143,000 278,725
384,629
HEALTH CARE PROVIDERS &SERVICES — 0.4%
Evergrande Health Industry Group,Ltd. (b). . . . . . . . . . . . . . . . . . . 30,000 26,788
HEALTH CARE TECHNOLOGY— 0.6%
Alibaba Health InformationTechnology, Ltd. (b) . . . . . . . . . . 52,000 45,437
HOTELS, RESTAURANTS &LEISURE — 7.9%
Galaxy Entertainment Group, Ltd. . . . 29,000 180,339Melco Resorts & Entertainment, Ltd.
ADR . . . . . . . . . . . . . . . . . . . . 6,635 128,785MGM China Holdings, Ltd. . . . . . . . 11,600 18,082Sands China, Ltd. . . . . . . . . . . . . . . 35,200 159,400
Security Description Shares Value
Shangri-La Asia, Ltd. . . . . . . . . . . . 26,000 $ 26,533SJM Holdings, Ltd. . . . . . . . . . . . . . 27,000 25,659Wynn Macau, Ltd. . . . . . . . . . . . . . 20,800 40,595
579,393
HOUSEHOLD DURABLES —0.6%
Haier Electronics Group Co., Ltd.. . . . 17,000 44,346
INDUSTRIALCONGLOMERATES — 9.4%
CK Hutchison Holdings, Ltd. . . . . . . 39,000 344,261Fosun International, Ltd. . . . . . . . . . 36,000 44,544Jardine Matheson Holdings, Ltd. . . . . 3,700 197,950Jardine Strategic Holdings, Ltd. . . . . . 2,500 74,700NWS Holdings, Ltd. . . . . . . . . . . . . 20,000 30,972
692,427
INSURANCE — 22.6%AIA Group, Ltd.. . . . . . . . . . . . . . . 176,000 1,662,474
MACHINERY — 1.9%Techtronic Industries Co., Ltd. . . . . . . 20,000 139,169
PHARMACEUTICALS — 3.5%CSPC Pharmaceutical Group, Ltd. . . . 70,000 140,546Sino Biopharmaceutical, Ltd. . . . . . . 91,000 115,616
256,162
REAL ESTATE MANAGEMENT &DEVELOPMENT — 18.9%
CK Asset Holdings, Ltd.. . . . . . . . . . 36,000 243,845Hang Lung Properties, Ltd. . . . . . . . . 27,000 61,306Henderson Land Development Co.,
Ltd. . . . . . . . . . . . . . . . . . . . . . 19,700 91,722Hongkong Land Holdings, Ltd. . . . . . 17,000 95,540Hysan Development Co., Ltd. . . . . . . 9,000 36,278Kerry Properties, Ltd. . . . . . . . . . . . 8,500 26,185New World Development Co., Ltd. . . . 82,000 106,483Shimao Property Holdings, Ltd. . . . . . 14,500 42,356Sino Land Co., Ltd.. . . . . . . . . . . . . 43,450 65,291Sun Hung Kai Properties, Ltd. . . . . . . 21,000 302,166Swire Pacific, Ltd. Class A . . . . . . . . 7,500 69,792Swire Pacific, Ltd. Class B . . . . . . . . 12,500 18,273Swire Properties, Ltd. . . . . . . . . . . . 15,600 48,953Wharf Holdings, Ltd.. . . . . . . . . . . . 16,000 34,901Wharf Real Estate Investment Co.,
Ltd. . . . . . . . . . . . . . . . . . . . . . 16,000 87,354Wheelock & Co., Ltd. . . . . . . . . . . . 11,000 62,651
1,393,096
ROAD & RAIL — 1.7%MTR Corp., Ltd. . . . . . . . . . . . . . . 22,000 123,479
SEMICONDUCTORS &SEMICONDUCTOREQUIPMENT — 0.7%
ASM Pacific Technology, Ltd. . . . . . . 4,400 53,713
SPECIALTY RETAIL — 0.2%Chow Tai Fook Jewellery Group, Ltd. . 15,200 12,545
SPDR SOLACTIVE HONG KONG ETFSCHEDULE OF INVESTMENTSSeptember 30, 2019
See accompanying notes to financial statements.132
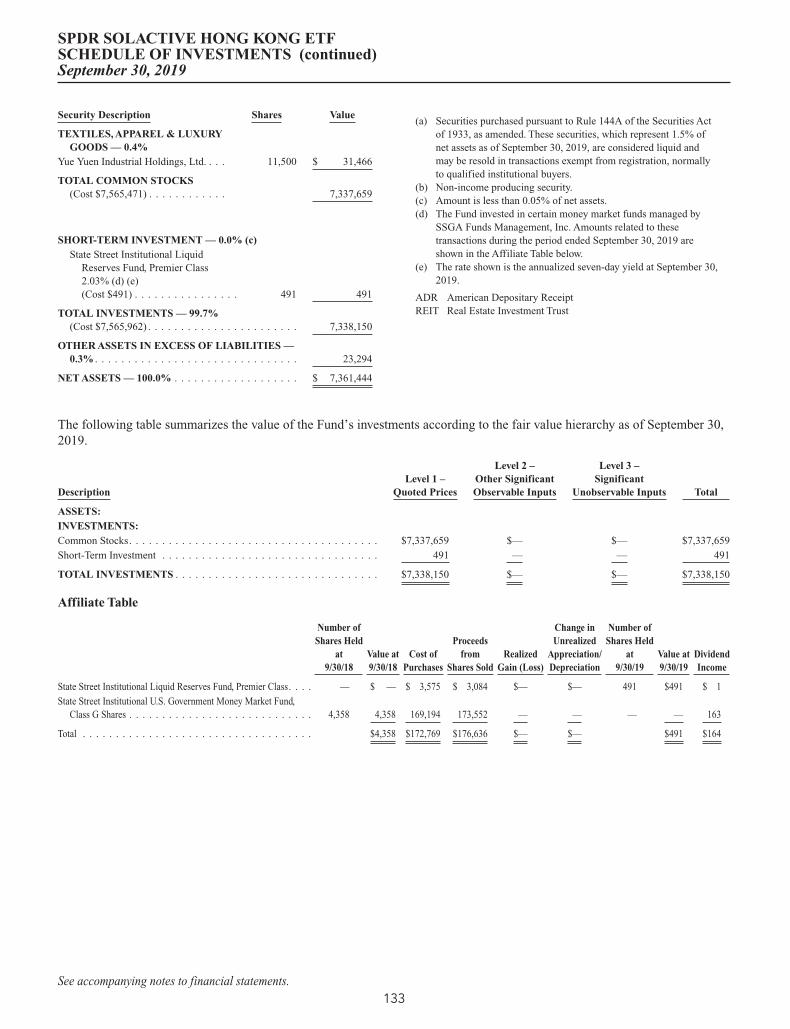
Security Description Shares Value
TEXTILES, APPAREL & LUXURYGOODS — 0.4%
Yue Yuen Industrial Holdings, Ltd. . . . 11,500 $ 31,466
TOTAL COMMON STOCKS(Cost $7,565,471) . . . . . . . . . . . . 7,337,659
SHORT-TERM INVESTMENT — 0.0% (c)State Street Institutional Liquid
Reserves Fund, Premier Class2.03% (d) (e)(Cost $491) . . . . . . . . . . . . . . . . 491 491
TOTAL INVESTMENTS — 99.7%(Cost $7,565,962) . . . . . . . . . . . . . . . . . . . . . . . 7,338,150
OTHER ASSETS IN EXCESS OF LIABILITIES —0.3% . . . . . . . . . . . . . . . . . . . . . . . . . . . . . . . 23,294
NET ASSETS — 100.0% . . . . . . . . . . . . . . . . . . . $ 7,361,444
(a) Securities purchased pursuant to Rule 144A of the Securities Actof 1933, as amended. These securities, which represent 1.5% ofnet assets as of September 30, 2019, are considered liquid andmay be resold in transactions exempt from registration, normallyto qualified institutional buyers.
(b) Non-income producing security.(c) Amount is less than 0.05% of net assets.(d) The Fund invested in certain money market funds managed by
SSGA Funds Management, Inc. Amounts related to thesetransactions during the period ended September 30, 2019 areshown in the Affiliate Table below.
(e) The rate shown is the annualized seven-day yield at September 30,2019.
ADR American Depositary ReceiptREIT Real Estate Investment Trust
The following table summarizes the value of the Fund’s investments according to the fair value hierarchy as of September 30,2019.
DescriptionLevel 1 –
Quoted Prices
Level 2 –Other SignificantObservable Inputs
Level 3 –Significant
Unobservable Inputs Total
ASSETS:INVESTMENTS:Common Stocks. . . . . . . . . . . . . . . . . . . . . . . . . . . . . . . . . . . . . . $7,337,659 $— $— $7,337,659
Short-Term Investment . . . . . . . . . . . . . . . . . . . . . . . . . . . . . . . . . 491 — — 491
TOTAL INVESTMENTS . . . . . . . . . . . . . . . . . . . . . . . . . . . . . . . $7,338,150 $— $— $7,338,150
Affiliate Table
Number ofShares Held
at9/30/18
Value at9/30/18
Cost ofPurchases
Proceedsfrom
Shares SoldRealized
Gain (Loss)
Change inUnrealized
Appreciation/Depreciation
Number ofShares Held
at9/30/19
Value at9/30/19
DividendIncome
State Street Institutional Liquid Reserves Fund, Premier Class. . . . — $ — $ 3,575 $ 3,084 $— $— 491 $491 $ 1
State Street Institutional U.S. Government Money Market Fund,Class G Shares . . . . . . . . . . . . . . . . . . . . . . . . . . . . 4,358 4,358 169,194 173,552 — — — — 163
Total . . . . . . . . . . . . . . . . . . . . . . . . . . . . . . . . . . . $4,358 $172,769 $176,636 $— $— $491 $164
SPDR SOLACTIVE HONG KONG ETFSCHEDULE OF INVESTMENTS (continued)September 30, 2019
See accompanying notes to financial statements.133

SPDR EUROSTOXX Small Cap
ETF
SPDR MSCIACWI Low
Carbon TargetETF
SPDR SolactiveCanada ETF
SPDR MSCIEAFE Fossil Fuel
Reserves Free ETF
ASSETSInvestments in unaffiliated issuers, at value* . . . . . . . . . . . . . . . $16,872,228 $82,297,548 $20,949,698 $83,535,558Investments in affiliated issuers, at value . . . . . . . . . . . . . . . . . . 440,210 1,788,541 930,607 3,950,651
Total Investments . . . . . . . . . . . . . . . . . . . . . . . . . . . . . . . . . 17,312,438 84,086,089 21,880,305 87,486,209Foreign currency, at value . . . . . . . . . . . . . . . . . . . . . . . . . . . . 3,176 195,413 82,264 253,965Cash . . . . . . . . . . . . . . . . . . . . . . . . . . . . . . . . . . . . . . . . . . . — 1 — —Receivable for investments sold . . . . . . . . . . . . . . . . . . . . . . . . — 13,000 — —Receivable for fund shares sold . . . . . . . . . . . . . . . . . . . . . . . . — — — —Dividends receivable — unaffiliated issuers. . . . . . . . . . . . . . . . 12,629 142,003 53,175 259,140Dividends receivable — affiliated issuers . . . . . . . . . . . . . . . . . — 441 23 —Interest receivable — unaffiliated issuers. . . . . . . . . . . . . . . . . . — — — —Securities lending income receivable — unaffiliated issuers . . . . 97 414 416 335Securities lending income receivable — affiliated issuers . . . . . 3,361 626 2,674 1,046Receivable from Adviser . . . . . . . . . . . . . . . . . . . . . . . . . . . . . — 6,730 1,071 7,004Receivable for foreign taxes recoverable . . . . . . . . . . . . . . . . . . 42,790 69,136 — 116,128Other Receivable. . . . . . . . . . . . . . . . . . . . . . . . . . . . . . . . . . . 461 1,382 — 1,382
TOTAL ASSETS . . . . . . . . . . . . . . . . . . . . . . . . . . . . . . 17,374,952 84,515,235 22,019,928 88,125,209
LIABILITIESDue to custodian . . . . . . . . . . . . . . . . . . . . . . . . . . . . . . . . . . . — — — —Payable upon return of securities loaned . . . . . . . . . . . . . . . . . . 440,165 1,636,978 916,834 3,926,093Payable for investments purchased . . . . . . . . . . . . . . . . . . . . . . — 16,806 — —Payable for fund shares repurchased . . . . . . . . . . . . . . . . . . . . . — — — —Deferred foreign taxes payable . . . . . . . . . . . . . . . . . . . . . . . . . — 2,004 — —Advisory fee payable . . . . . . . . . . . . . . . . . . . . . . . . . . . . . . . . 6,272 20,422 3,455 20,719Trustees’ fees and expenses payable . . . . . . . . . . . . . . . . . . . . . 69 241 78 119Accrued expenses and other liabilities. . . . . . . . . . . . . . . . . . . . — 318 — 1,197
TOTAL LIABILITIES . . . . . . . . . . . . . . . . . . . . . . . . . . 446,506 1,676,769 920,367 3,948,128
NET ASSETS . . . . . . . . . . . . . . . . . . . . . . . . . . . . . . . . . $16,928,446 $82,838,466 $21,099,561 $84,177,081
NET ASSETS CONSIST OF:Paid-in Capital . . . . . . . . . . . . . . . . . . . . . . . . . . . . . . . . . . . . $20,989,019 $77,026,953 $21,351,561 $84,510,528Total distributable earnings (loss)** . . . . . . . . . . . . . . . . . . . . . (4,060,573) 5,811,513 (252,000) (333,447)
NET ASSETS . . . . . . . . . . . . . . . . . . . . . . . . . . . . . . . . . $16,928,446 $82,838,466 $21,099,561 $84,177,081
NET ASSET VALUE PER SHARENet asset value per share . . . . . . . . . . . . . . . . . . . . . . . . . . . . . $ 56.43 $ 92.04 $ 60.28 $ 67.34
Shares outstanding (unlimited amount authorized, $0.01 parvalue) . . . . . . . . . . . . . . . . . . . . . . . . . . . . . . . . . . . . . . . . . 300,000 900,000 350,000 1,250,000
COST OF INVESTMENTS:Investments in unaffiliated issuers . . . . . . . . . . . . . . . . . . . . . . $18,562,490 $75,242,689 $20,210,437 $83,493,258Investments in affiliated issuers . . . . . . . . . . . . . . . . . . . . . . . . 440,210 1,798,438 930,607 3,950,651
Total cost of investments . . . . . . . . . . . . . . . . . . . . . . . . . . . . . $19,002,700 $77,041,127 $21,141,044 $87,443,909
Foreign currency, at cost . . . . . . . . . . . . . . . . . . . . . . . . . . . . . $ 3,198 $ 196,878 $ 82,064 $ 255,669
* Includes investments in securities on loan, at value . . . . . . . . . $ 886,497 $ 3,239,004 $ 2,954,996 $ 6,346,450
** Includes deferred foreign taxes. . . . . . . . . . . . . . . . . . . . . $ — $ 2,004 $ — $ —
SPDR INDEX SHARES FUNDSSTATEMENTS OF ASSETS AND LIABILITIESSeptember 30, 2019
See accompanying notes to financial statements.134

SPDR MSCIEAFE
StrategicFactorsETF
SPDR MSCIEmerging
Markets FossilFuel Reserves
Free ETF
SPDR MSCIEmergingMarkets
StrategicFactorsETF
SPDR SolactiveGermany ETF
SPDR SolactiveJapan ETF
SPDR SolactiveUnited Kingdom
ETF
SPDR MSCIWorld
StrategicFactorsETF
$318,216,724 $70,363,535 $266,674,028 $ 8,089,618 $ 7,335,445 $10,850,067 $24,032,18511,826,729 485,642 2,378,753 855 744,240 — 341,512
330,043,453 70,849,177 269,052,781 8,090,473 8,079,685 10,850,067 24,373,6971,751,640 216,221 2,007,589 3,160 33,303 42,270 58,369
— 3 1,866 — — — —334 1,786 5,379,863 — — — 23,574
— 2,988,446 — — — — —1,099,952 73,532 492,259 2 68,141 34,128 48,195
24 12 822 — — — 81— 143 — — — — —
691 1,560 2,854 — 42 1 625,395 179 1,810 — 142 20 151
— — — 422 368 548 —528,262 939 2,068 128,253 — 26 9,952
— 318 — — — — —
333,429,751 74,132,316 276,941,912 8,222,310 8,181,681 10,927,060 24,514,081
— — — — — 916 —11,814,924 458,521 1,941,419 — 743,609 — 307,622
997,495 1,923,516 222 — — 18,363 24,961— — 5,750,293 — — — —— 11,605 315,294 — — — —
78,871 16,886 67,703 1,351 1,214 1,775 5,947368 6 472 25 40 25 80
— 1,283 — — — — —
12,891,658 2,411,817 8,075,403 1,376 744,863 21,079 338,610
$320,538,093 $71,720,499 $268,866,509 $ 8,220,934 $ 7,436,818 $10,905,981 $24,175,471
$317,731,089 $73,600,815 $276,161,886 $10,359,846 $ 9,449,822 $12,944,404 $23,315,0382,807,004 (1,880,316) (7,295,377) (2,138,912) (2,013,004) (2,038,423) 860,433
$320,538,093 $71,720,499 $268,866,509 $ 8,220,934 $ 7,436,818 $10,905,981 $24,175,471
$ 62.85 $ 59.77 $ 57.51 $ 54.81 $ 74.37 $ 48.47 $ 80.58
5,100,000 1,200,000 4,675,000 150,000 100,000 225,000 300,000
$312,049,551 $71,717,105 $254,827,048 $ 9,020,217 $ 8,153,765 $11,786,428 $22,818,19911,826,729 485,642 2,378,758 855 744,240 — 343,171
$323,876,280 $72,202,747 $257,205,806 $ 9,021,072 $ 8,898,005 $11,786,428 $23,161,370
$ 1,762,964 $ 217,118 $ 2,013,459 $ 3,177 $ 33,553 $ 42,660 $ 58,936
$ 19,536,975 $ 1,414,463 $ 5,820,843 $ — $ 1,141,709 $ 4,916 $ 786,045
$ — $ 11,605 $ 315,294 $ — $ — $ — $ —
135
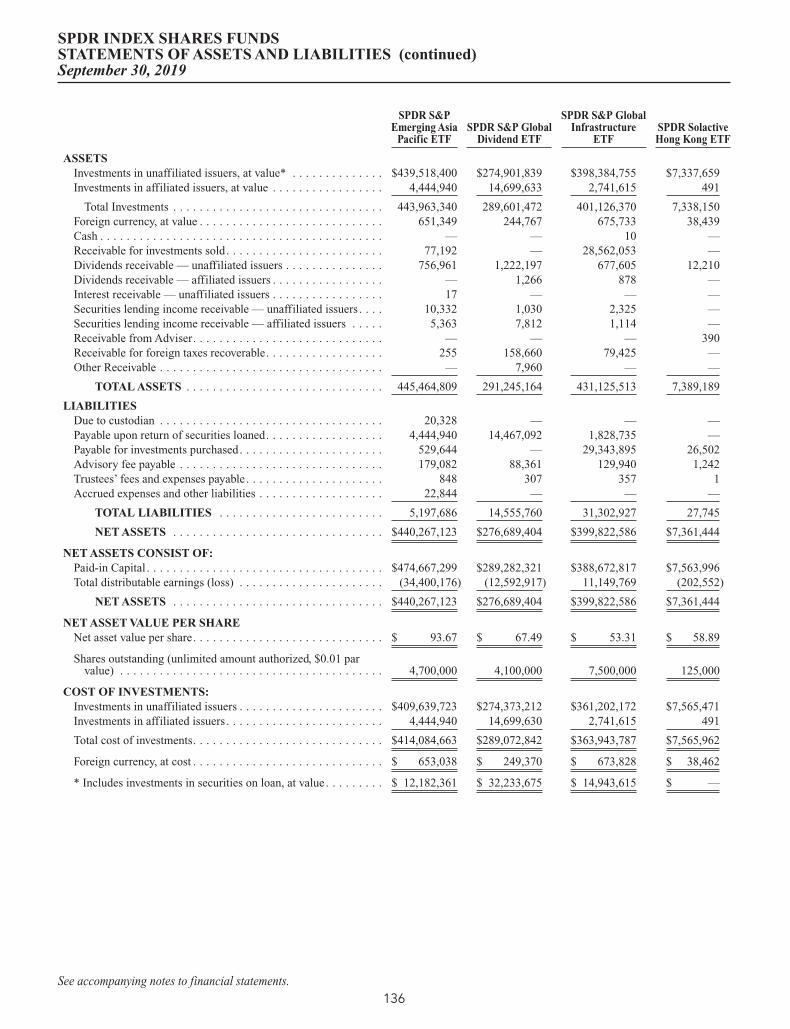
SPDR S&PEmerging Asia
Pacific ETFSPDR S&P Global
Dividend ETF
SPDR S&P GlobalInfrastructure
ETFSPDR SolactiveHong Kong ETF
ASSETSInvestments in unaffiliated issuers, at value* . . . . . . . . . . . . . . $439,518,400 $274,901,839 $398,384,755 $7,337,659Investments in affiliated issuers, at value . . . . . . . . . . . . . . . . . 4,444,940 14,699,633 2,741,615 491
Total Investments . . . . . . . . . . . . . . . . . . . . . . . . . . . . . . . . 443,963,340 289,601,472 401,126,370 7,338,150Foreign currency, at value . . . . . . . . . . . . . . . . . . . . . . . . . . . . 651,349 244,767 675,733 38,439Cash . . . . . . . . . . . . . . . . . . . . . . . . . . . . . . . . . . . . . . . . . . . — — 10 —Receivable for investments sold. . . . . . . . . . . . . . . . . . . . . . . . 77,192 — 28,562,053 —Dividends receivable — unaffiliated issuers . . . . . . . . . . . . . . . 756,961 1,222,197 677,605 12,210Dividends receivable — affiliated issuers . . . . . . . . . . . . . . . . . — 1,266 878 —Interest receivable — unaffiliated issuers . . . . . . . . . . . . . . . . . 17 — — —Securities lending income receivable — unaffiliated issuers . . . . 10,332 1,030 2,325 —Securities lending income receivable — affiliated issuers . . . . . 5,363 7,812 1,114 —Receivable from Adviser. . . . . . . . . . . . . . . . . . . . . . . . . . . . . — — — 390Receivable for foreign taxes recoverable. . . . . . . . . . . . . . . . . . 255 158,660 79,425 —Other Receivable . . . . . . . . . . . . . . . . . . . . . . . . . . . . . . . . . . — 7,960 — —
TOTAL ASSETS . . . . . . . . . . . . . . . . . . . . . . . . . . . . . . 445,464,809 291,245,164 431,125,513 7,389,189
LIABILITIESDue to custodian . . . . . . . . . . . . . . . . . . . . . . . . . . . . . . . . . . 20,328 — — —Payable upon return of securities loaned. . . . . . . . . . . . . . . . . . 4,444,940 14,467,092 1,828,735 —Payable for investments purchased. . . . . . . . . . . . . . . . . . . . . . 529,644 — 29,343,895 26,502Advisory fee payable . . . . . . . . . . . . . . . . . . . . . . . . . . . . . . . 179,082 88,361 129,940 1,242Trustees’ fees and expenses payable . . . . . . . . . . . . . . . . . . . . . 848 307 357 1Accrued expenses and other liabilities . . . . . . . . . . . . . . . . . . . 22,844 — — —
TOTAL LIABILITIES . . . . . . . . . . . . . . . . . . . . . . . . . 5,197,686 14,555,760 31,302,927 27,745
NET ASSETS . . . . . . . . . . . . . . . . . . . . . . . . . . . . . . . . $440,267,123 $276,689,404 $399,822,586 $7,361,444
NET ASSETS CONSIST OF:Paid-in Capital . . . . . . . . . . . . . . . . . . . . . . . . . . . . . . . . . . . . $474,667,299 $289,282,321 $388,672,817 $7,563,996Total distributable earnings (loss) . . . . . . . . . . . . . . . . . . . . . . (34,400,176) (12,592,917) 11,149,769 (202,552)
NET ASSETS . . . . . . . . . . . . . . . . . . . . . . . . . . . . . . . . $440,267,123 $276,689,404 $399,822,586 $7,361,444
NET ASSET VALUE PER SHARENet asset value per share. . . . . . . . . . . . . . . . . . . . . . . . . . . . . $ 93.67 $ 67.49 $ 53.31 $ 58.89
Shares outstanding (unlimited amount authorized, $0.01 parvalue) . . . . . . . . . . . . . . . . . . . . . . . . . . . . . . . . . . . . . . . . 4,700,000 4,100,000 7,500,000 125,000
COST OF INVESTMENTS:Investments in unaffiliated issuers . . . . . . . . . . . . . . . . . . . . . . $409,639,723 $274,373,212 $361,202,172 $7,565,471Investments in affiliated issuers . . . . . . . . . . . . . . . . . . . . . . . . 4,444,940 14,699,630 2,741,615 491
Total cost of investments. . . . . . . . . . . . . . . . . . . . . . . . . . . . . $414,084,663 $289,072,842 $363,943,787 $7,565,962
Foreign currency, at cost . . . . . . . . . . . . . . . . . . . . . . . . . . . . . $ 653,038 $ 249,370 $ 673,828 $ 38,462
* Includes investments in securities on loan, at value . . . . . . . . . $ 12,182,361 $ 32,233,675 $ 14,943,615 $ —
SPDR INDEX SHARES FUNDSSTATEMENTS OF ASSETS AND LIABILITIES (continued)September 30, 2019
See accompanying notes to financial statements.136

[This Page Intentionally Left Blank]
137

SPDR EUROSTOXX Small Cap
ETF
SPDR MSCIACWI Low
Carbon TargetETF
SPDR SolactiveCanada ETF
SPDR MSCIEAFE Fossil Fuel
Reserves Free ETF
INVESTMENT INCOMEInterest income — unaffiliated issuers . . . . . . . . . . . . . . . . . . . $ — $ — $ — $ —Dividend income — unaffiliated issuers . . . . . . . . . . . . . . . . . . 568,048 2,442,178 716,713 2,531,114Dividend income — affiliated issuers . . . . . . . . . . . . . . . . . . . . 276 5,390 456 1,592Dividend income — non-cash transactions . . . . . . . . . . . . . . . . — — 41,625 —Unaffiliated securities lending income . . . . . . . . . . . . . . . . . . . 4,355 4,157 6,213 4,239Affiliated securities lending income . . . . . . . . . . . . . . . . . . . . . 16,777 9,083 22,965 16,106Foreign taxes withheld. . . . . . . . . . . . . . . . . . . . . . . . . . . . . . . (76,953) (117,391) (117,308) (221,278)
TOTAL INVESTMENT INCOME (LOSS) . . . . . . . . . . . . . . 512,503 2,343,417 670,664 2,331,773
EXPENSESAdvisory fee. . . . . . . . . . . . . . . . . . . . . . . . . . . . . . . . . . . . . . 88,840 271,397 43,818 220,335Trustees’ fees and expenses . . . . . . . . . . . . . . . . . . . . . . . . . . 447 2,022 488 1,266Miscellaneous expenses . . . . . . . . . . . . . . . . . . . . . . . . . . . . . . 522 164 17 240
TOTAL EXPENSES . . . . . . . . . . . . . . . . . . . . . . . . . . . . . . . 89,809 273,583 44,323 221,841
Expenses waived/reimbursed by the Adviser . . . . . . . . . . . . . . . — (92,488) (13,651) (74,711)
NET EXPENSES. . . . . . . . . . . . . . . . . . . . . . . . . . . . . . . . . . 89,809 181,095 30,672 147,130
NET INVESTMENT INCOME (LOSS) . . . . . . . . . . . . . . . . $ 422,694 $ 2,162,322 $ 639,992 $ 2,184,643
REALIZED AND UNREALIZED GAIN (LOSS)Net realized gain (loss) on:
Investments — unaffiliated issuers . . . . . . . . . . . . . . . . . . . . (680,423) (141,562) (304,844) (658,586)Investments — affiliated issuers . . . . . . . . . . . . . . . . . . . . . . — — — —In-kind redemptions — unaffiliated issuers . . . . . . . . . . . . . . (355,274) 13,831,015 436,135 895,817In-kind redemptions — affiliated issuers . . . . . . . . . . . . . . . . — (7,879) — —Foreign currency transactions . . . . . . . . . . . . . . . . . . . . . . . . (4,506) (27,436) 1,606 (6,239)
Net realized gain (loss) . . . . . . . . . . . . . . . . . . . . . . . . . . . . . (1,040,203) 13,654,138 132,897 230,992
Net change in unrealized appreciation/depreciation on:Investments — unaffiliated issuers*. . . . . . . . . . . . . . . . . . . . (710,920) (25,482,068) 153,923 (3,029,168)Investments — affiliated issuers . . . . . . . . . . . . . . . . . . . . . . — (17,543) — —Foreign currency translations . . . . . . . . . . . . . . . . . . . . . . . . (1,390) (4,658) (580) (4,481)
Net change in unrealized appreciation/depreciation . . . . . . . . . (712,310) (25,504,269) 153,343 (3,033,649)
NET REALIZED AND UNREALIZED GAIN (LOSS) . . . . . (1,752,513) (11,850,131) 286,240 (2,802,657)
NET INCREASE (DECREASE) IN NET ASSETS FROMOPERATIONS . . . . . . . . . . . . . . . . . . . . . . . . . . . . . . . . . . . $(1,329,819) $ (9,687,809) $ 926,232 $ (618,014)
* Includes foreign deferred taxes . . . . . . . . . . . . . . . . . . . . . . . $ — $ 5,699 $ — $ —
SPDR INDEX SHARES FUNDSSTATEMENTS OF OPERATIONSFor theYear Ended September 30, 2019
See accompanying notes to financial statements.138

SPDR MSCIEAFE
StrategicFactorsETF
SPDR MSCIEmerging
Markets FossilFuel Reserves
Free ETF
SPDR MSCIEmergingMarkets
StrategicFactorsETF
SPDR SolactiveGermany ETF
SPDR SolactiveJapan ETF
SPDR SolactiveUnited Kingdom
ETF
SPDR MSCIWorld
StrategicFactorsETF
— $ 143 $ — $ — $ — $ — $ —9,614,667 2,031,235 9,520,242 276,475 200,804 450,251 629,634
5,583 1,316 11,081 126 222 288 1,087— — — — — 49,389 —
17,452 6,389 24,824 — 633 95 95754,574 2,556 36,642 — 528 443 2,374
(789,549) (182,167) (1,105,038) (36,881) (20,038) (5,392) (30,305)
8,902,727 1,859,472 8,487,751 239,720 182,149 495,074 603,747
804,351 145,070 811,594 16,041 18,933 19,210 74,4494,444 615 4,741 158 232 185 5082,378 — 213 6 79 8 23
811,173 145,685 816,548 16,205 19,244 19,403 74,980
— — — (4,976) (5,920) (5,956) —
811,173 145,685 816,548 11,229 13,324 13,447 74,980
$ 8,091,554 $ 1,713,787 $ 7,671,203 $ 228,491 $ 168,825 $ 481,627 $ 528,767
(4,796,244) (1,141,973) (9,733,059) (128,384) (95,416) (200,889) (147,137)— — (77) — — — 6
2,345,148 — 1,283,996 (19,657) (569,386) 38,468 2,143,039— — — — — — (867)
(13,617) (31,394) (127,965) (807) 823 (1,961) (1,757)
(2,464,713) (1,173,367) (8,577,105) (148,848) (663,979) (164,382) 1,993,284
(1,699,146) (1,759,977) (1,291,089) (665,162) (734,081) (550,737) (1,491,167)— — (5) — — — (657)
(16,406) (1,620) (15,351) (7,379) 622 (410) (163)
(1,715,552) (1,761,597) (1,306,445) (672,541) (733,459) (551,147) (1,491,987)
(4,180,265) (2,934,964) (9,883,550) (821,389) (1,397,438) (715,529) 501,297
$ 3,911,289 $(1,221,177) $(2,212,347) $(592,898) $(1,228,613) $(233,902) $ 1,030,064
$ — $ (6,740) $ 94,763 $ — $ — $ — $ —
139

SPDR S&PEmerging Asia
Pacific ETFSPDR S&P Global
Dividend ETF
SPDR S&P GlobalInfrastructure
ETFSPDR SolactiveHong Kong ETF
INVESTMENT INCOMEInterest income — unaffiliated issuers . . . . . . . . . . . . . . . . . . . $ 17 $ — $ — —Dividend income — unaffiliated issuers . . . . . . . . . . . . . . . . . . 12,373,855 12,376,022 12,464,865 220,484Dividend income — affiliated issuers . . . . . . . . . . . . . . . . . . . 13,561 10,488 14,100 164Dividend income — non-cash transactions . . . . . . . . . . . . . . . . — — 1,243,045 —Unaffiliated securities lending income . . . . . . . . . . . . . . . . . . . 200,056 55,923 34,768 —Affiliated securities lending income. . . . . . . . . . . . . . . . . . . . . 82,952 232,243 35,188 —Foreign taxes withheld . . . . . . . . . . . . . . . . . . . . . . . . . . . . . . (1,406,388) (1,046,355) (891,406) —
TOTAL INVESTMENT INCOME (LOSS). . . . . . . . . . . . . . 11,264,053 11,628,321 12,900,560 220,648
EXPENSESAdvisory fee . . . . . . . . . . . . . . . . . . . . . . . . . . . . . . . . . . . . . 2,207,183 986,304 1,259,833 14,522Trustees’ fees and expenses . . . . . . . . . . . . . . . . . . . . . . . . . . 8,147 3,981 4,864 105Miscellaneous expenses . . . . . . . . . . . . . . . . . . . . . . . . . . . . . 352 3,809 343 6
TOTAL EXPENSES . . . . . . . . . . . . . . . . . . . . . . . . . . . . . . . 2,215,682 994,094 1,265,040 14,633
Expenses waived/reimbursed by the Adviser. . . . . . . . . . . . . . . — — — (4,467)
NET EXPENSES . . . . . . . . . . . . . . . . . . . . . . . . . . . . . . . . . 2,215,682 994,094 1,265,040 10,166
NET INVESTMENT INCOME (LOSS) . . . . . . . . . . . . . . . . $ 9,048,371 $10,634,227 $11,635,520 $ 210,482
REALIZED AND UNREALIZED GAIN (LOSS)Net realized gain (loss) on:
Investments — unaffiliated issuers* . . . . . . . . . . . . . . . . . . . (2,654,137) (4,316,826) (5,329,549) (43,233)Investments — affiliated issuers . . . . . . . . . . . . . . . . . . . . . . — (11) 15 —In-kind redemptions — unaffiliated issuers . . . . . . . . . . . . . . 6,495,141 2,844,064 1,048,211 —Foreign currency transactions. . . . . . . . . . . . . . . . . . . . . . . . (119,077) (52,850) (40,501) 119
Net realized gain (loss) . . . . . . . . . . . . . . . . . . . . . . . . . . . . 3,721,927 (1,525,623) (4,321,824) (43,114)
Net change in unrealized appreciation/depreciation on:Investments — unaffiliated issuers** . . . . . . . . . . . . . . . . . . (20,579,604) 4,034,249 35,348,262 (298,439)Investments — affiliated issuers . . . . . . . . . . . . . . . . . . . . . . — 3 — —Foreign currency translations . . . . . . . . . . . . . . . . . . . . . . . . 4,912 (6,830) (574) —
Net change in unrealized appreciation/depreciation . . . . . . . . (20,574,692) 4,027,422 35,347,688 (298,439)
NET REALIZED AND UNREALIZED GAIN (LOSS) . . . . . (16,852,765) 2,501,799 31,025,864 (341,553)
NET INCREASE (DECREASE) IN NET ASSETS FROMOPERATIONS . . . . . . . . . . . . . . . . . . . . . . . . . . . . . . . . . . . $ (7,804,394) $13,136,026 $42,661,384 $(131,071)
* Includes foreign capital gain taxes. . . . . . . . . . . . . . . . . . . . . $ (140) $ — $ — $ —
** Includes foreign deferred taxes . . . . . . . . . . . . . . . . . . . . . . $ 376,510 $ — $ — $ —
SPDR INDEX SHARES FUNDSSTATEMENTS OF OPERATIONS (continued)For theYear Ended September 30, 2019
See accompanying notes to financial statements.140

[This Page Intentionally Left Blank]
141

SPDR EURO STOXX Small Cap ETFSPDR MSCI ACWI Low Carbon Target
ETF
Year Ended9/30/19
Year Ended9/30/18
Year Ended9/30/19
Year Ended9/30/18
INCREASE (DECREASE) IN NET ASSETS FROMOPERATIONS:Net investment income (loss) . . . . . . . . . . . . . . . . . . . . . . $ 422,694 $ 787,122 $ 2,162,322 $ 3,379,168Net realized gain (loss) . . . . . . . . . . . . . . . . . . . . . . . . . . (1,040,203) 1,637,662 13,654,138 (813,547)Net change in unrealized appreciation/depreciation . . . . . . (712,310) (3,912,462) (25,504,269) 11,315,089
Net increase (decrease) in net assets resulting fromoperations . . . . . . . . . . . . . . . . . . . . . . . . . . . . . . . . . (1,329,819) (1,487,678) (9,687,809) 13,880,710
Net equalization credits and charges . . . . . . . . . . . . . . . . . (12,895) (10,680) 27,374 10,352
DISTRIBUTIONS TO SHAREHOLDERS:Distributions to shareholders . . . . . . . . . . . . . . . . . . . . . . (598,209) (716,377) (2,546,683) (3,105,868)
FROM BENEFICIAL INTEREST TRANSACTIONS:Proceeds from sale of shares sold . . . . . . . . . . . . . . . . . . . — 22,456,335 26,641,940 8,953,370Cost of shares redeemed . . . . . . . . . . . . . . . . . . . . . . . . . (11,042,880) (9,121,521) (97,534,124) —Net income equalization . . . . . . . . . . . . . . . . . . . . . . . . . 12,895 10,680 (27,374) (10,352)Other Capital . . . . . . . . . . . . . . . . . . . . . . . . . . . . . . . . . — — 3,410 —
Net increase (decrease) in net assets from beneficialinterest transactions . . . . . . . . . . . . . . . . . . . . . . . . . (11,029,985) 13,345,494 (70,916,148) 8,943,018
Net increase (decrease) in net assets during the period . . . . (12,970,908) 11,130,759 (83,123,266) 19,728,212
Net assets at beginning of period . . . . . . . . . . . . . . . . . . . 29,899,354 18,768,595 165,961,732 146,233,520
NET ASSETS AT END OF PERIOD . . . . . . . . . . . . . . . . . $ 16,928,446 $29,899,354 $ 82,838,466 $165,961,732
SHARES OF BENEFICIAL INTEREST:Shares sold . . . . . . . . . . . . . . . . . . . . . . . . . . . . . . . . . . . — 350,000 300,000 100,000Shares redeemed . . . . . . . . . . . . . . . . . . . . . . . . . . . . . . . (200,000) (150,000) (1,200,000) —
Net increase (decrease). . . . . . . . . . . . . . . . . . . . . . . . . . (200,000) 200,000 (900,000) 100,000
SPDR INDEX SHARES FUNDSSTATEMENTS OF CHANGES IN NET ASSETS
See accompanying notes to financial statements.142
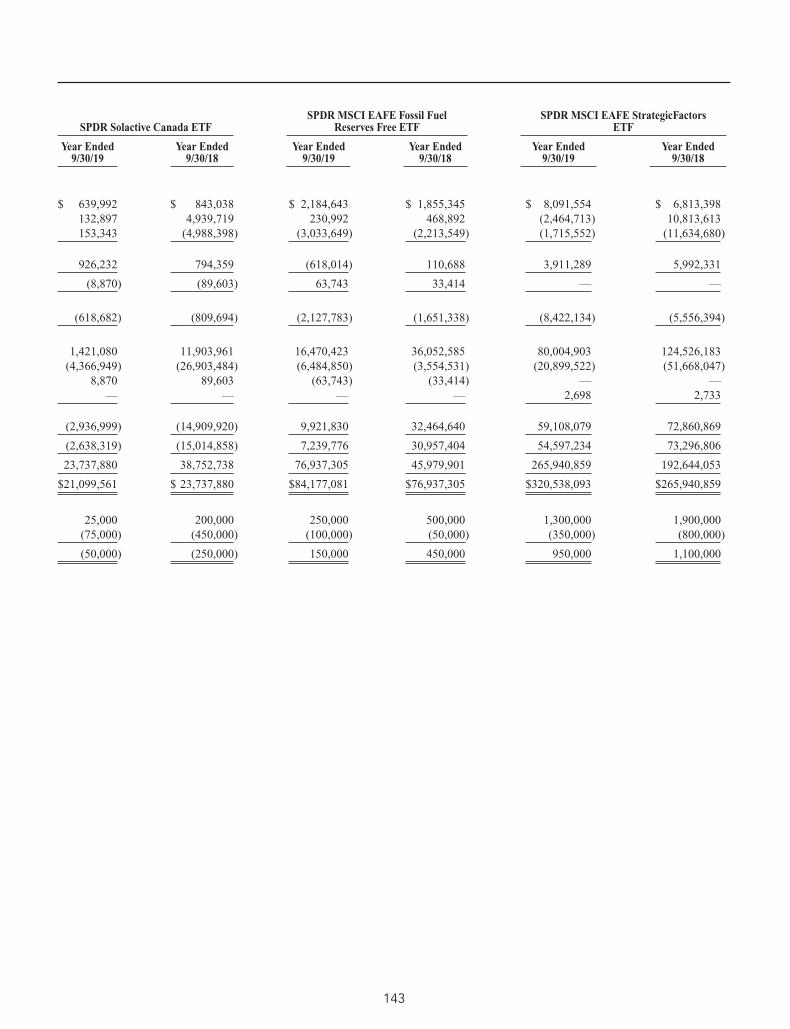
SPDR Solactive Canada ETFSPDR MSCI EAFE Fossil Fuel
Reserves Free ETFSPDR MSCI EAFE StrategicFactors
ETF
Year Ended9/30/19
Year Ended9/30/18
Year Ended9/30/19
Year Ended9/30/18
Year Ended9/30/19
Year Ended9/30/18
$ 639,992 $ 843,038 $ 2,184,643 $ 1,855,345 $ 8,091,554 $ 6,813,398132,897 4,939,719 230,992 468,892 (2,464,713) 10,813,613153,343 (4,988,398) (3,033,649) (2,213,549) (1,715,552) (11,634,680)
926,232 794,359 (618,014) 110,688 3,911,289 5,992,331
(8,870) (89,603) 63,743 33,414 — —
(618,682) (809,694) (2,127,783) (1,651,338) (8,422,134) (5,556,394)
1,421,080 11,903,961 16,470,423 36,052,585 80,004,903 124,526,183(4,366,949) (26,903,484) (6,484,850) (3,554,531) (20,899,522) (51,668,047)
8,870 89,603 (63,743) (33,414) — —— — — — 2,698 2,733
(2,936,999) (14,909,920) 9,921,830 32,464,640 59,108,079 72,860,869
(2,638,319) (15,014,858) 7,239,776 30,957,404 54,597,234 73,296,806
23,737,880 38,752,738 76,937,305 45,979,901 265,940,859 192,644,053
$21,099,561 $ 23,737,880 $84,177,081 $76,937,305 $320,538,093 $265,940,859
25,000 200,000 250,000 500,000 1,300,000 1,900,000(75,000) (450,000) (100,000) (50,000) (350,000) (800,000)
(50,000) (250,000) 150,000 450,000 950,000 1,100,000
143

SPDR MSCI Emerging Markets FossilFuel Reserves Free ETF
SPDR MSCI Emerging MarketsStrategicFactors ETF
Year Ended9/30/19
Year Ended9/30/18
Year Ended9/30/19
Year Ended9/30/18
INCREASE (DECREASE) IN NET ASSETS FROMOPERATIONS:Net investment income (loss) . . . . . . . . . . . . . . . . . . . . . . . . . . . $ 1,713,787 $ 504,396 $ 7,671,203 $ 6,589,120Net realized gain (loss) . . . . . . . . . . . . . . . . . . . . . . . . . . . . . . . (1,173,367) (454,590) (8,577,105) 150,612Net change in unrealized appreciation/depreciation . . . . . . . . . . . (1,761,597) (1,180,841) (1,306,445) (13,458,271)
Net increase (decrease) in net assets resulting from operations . (1,221,177) (1,131,035) (2,212,347) (6,718,539)
Net equalization credits and charges . . . . . . . . . . . . . . . . . . . . . . 212,906 88,133 — —
DISTRIBUTIONS TO SHAREHOLDERS:Distributions to shareholders . . . . . . . . . . . . . . . . . . . . . . . . . . . (820,869) (356,633) (7,885,947) (5,284,674)
FROM BENEFICIAL INTEREST TRANSACTIONS:Proceeds from sale of shares sold . . . . . . . . . . . . . . . . . . . . . . . . 42,361,340 16,522,790 26,208,036 108,165,929Cost of shares redeemed . . . . . . . . . . . . . . . . . . . . . . . . . . . . . . — — (14,012,108) (43,549,399)Net income equalization . . . . . . . . . . . . . . . . . . . . . . . . . . . . . . (212,906) (88,133) — —Other Capital . . . . . . . . . . . . . . . . . . . . . . . . . . . . . . . . . . . . . . 43,362 4,608 43,644 166,951
Net increase (decrease) in net assets from beneficial interesttransactions . . . . . . . . . . . . . . . . . . . . . . . . . . . . . . . . . . . . . 42,191,796 16,439,265 12,239,572 64,783,481
Net increase (decrease) in net assets during the period . . . . . . . . . 40,362,656 15,039,730 2,141,278 52,780,268
Net assets at beginning of period . . . . . . . . . . . . . . . . . . . . . . . . 31,357,843 16,318,113 266,725,231 213,944,963
NET ASSETS AT END OF PERIOD. . . . . . . . . . . . . . . . . . . . . . $71,720,499 $31,357,843 $268,866,509 $266,725,231
SHARES OF BENEFICIAL INTEREST:Shares sold . . . . . . . . . . . . . . . . . . . . . . . . . . . . . . . . . . . . . . . . 700,000 250,000 450,000 1,675,000Shares redeemed . . . . . . . . . . . . . . . . . . . . . . . . . . . . . . . . . . . . — — (250,000) (725,000)
Net increase (decrease) . . . . . . . . . . . . . . . . . . . . . . . . . . . . . . 700,000 250,000 200,000 950,000
SPDR INDEX SHARES FUNDSSTATEMENTS OF CHANGES IN NET ASSETS (continued)
See accompanying notes to financial statements.144

SPDR Solactive Germany ETF SPDR Solactive Japan ETF SPDR Solactive United Kingdom ETF
Year Ended9/30/19
Year Ended9/30/18
Year Ended9/30/19
Year Ended9/30/18
Year Ended9/30/19
Year Ended9/30/18
$ 228,491 $ 229,558 $ 168,825 $ 357,456 $ 481,627 $ 516,839(148,848) 2,316,150 (663,979) 1,466,269 (164,382) 100,427(672,541) (2,004,301) (733,459) (1,092,773) (551,147) (315,569)
(592,898) 541,407 (1,228,613) 730,952 (233,902) 301,697
424 (10,781) 43,737 (13,547) (8,937) 61,130
(241,939) (251,826) (313,379) (324,635) (450,912) (488,238)
1,330,529 6,122,919 — 24,019,758 2,391,999 18,744,529(1,349,117) (16,255,158) (7,067,661) (23,276,759) (1,290,282) (13,367,633)
(424) 10,781 (43,737) 13,547 8,937 (61,130)— — — — — —
(19,012) (10,121,458) (7,111,398) 756,546 1,110,654 5,315,766
(853,425) (9,842,658) (8,609,653) 1,149,316 416,903 5,190,355
9,074,359 18,917,017 16,046,471 14,897,155 10,489,078 5,298,723
$ 8,220,934 $ 9,074,359 $ 7,436,818 $ 16,046,471 $10,905,981 $ 10,489,078
25,000 100,000 — 300,000 50,000 350,000(25,000) (250,000) (100,000) (300,000) (25,000) (250,000)
— (150,000) (100,000) — 25,000 100,000
145

SPDR MSCI World StrategicFactorsETF SPDR S&P Emerging Asia Pacific ETF
Year Ended9/30/19
Year Ended9/30/18
Year Ended9/30/19
Year Ended9/30/18
INCREASE (DECREASE) IN NET ASSETS FROMOPERATIONS:Net investment income (loss). . . . . . . . . . . . . . . . . . . . . . . . $ 528,767 $ 600,775 $ 9,048,371 $ 9,028,728Net realized gain (loss) . . . . . . . . . . . . . . . . . . . . . . . . . . . . 1,993,284 1,337,794 3,721,927 5,398,566Net change in unrealized appreciation/depreciation . . . . . . . . (1,491,987) 896,986 (20,574,692) (16,726,431)
Net increase (decrease) in net assets resulting fromoperations . . . . . . . . . . . . . . . . . . . . . . . . . . . . . . . . . . . 1,030,064 2,835,555 (7,804,394) (2,299,137)
Net equalization credits and charges. . . . . . . . . . . . . . . . . . . — — — —
DISTRIBUTIONS TO SHAREHOLDERS:Distributions to shareholders . . . . . . . . . . . . . . . . . . . . . . . . (637,363) (617,481) (9,768,703) (8,629,436)
FROM BENEFICIAL INTEREST TRANSACTIONS:Proceeds from sale of shares sold. . . . . . . . . . . . . . . . . . . . . 7,715,033 15,149,291 56,416,552 74,204,656Cost of shares redeemed . . . . . . . . . . . . . . . . . . . . . . . . . . . (15,400,953) (7,504,842) (36,592,543) (39,087,690)Net income equalization . . . . . . . . . . . . . . . . . . . . . . . . . . . — — — —Other Capital . . . . . . . . . . . . . . . . . . . . . . . . . . . . . . . . . . . 628 — 113,100 61,962
Net increase (decrease) in net assets from beneficialinterest transactions . . . . . . . . . . . . . . . . . . . . . . . . . . . (7,685,292) 7,644,449 19,937,109 35,178,928
Net increase (decrease) in net assets during the period . . . . . . (7,292,591) 9,862,523 2,364,012 24,250,355
Net assets at beginning of period . . . . . . . . . . . . . . . . . . . . . 31,468,062 21,605,539 437,903,111 413,652,756
NET ASSETS AT END OF PERIOD . . . . . . . . . . . . . . . . . . $ 24,175,471 $31,468,062 $440,267,123 $437,903,111
SHARES OF BENEFICIAL INTEREST:Shares sold . . . . . . . . . . . . . . . . . . . . . . . . . . . . . . . . . . . . 100,000 200,000 600,000 700,000Shares redeemed . . . . . . . . . . . . . . . . . . . . . . . . . . . . . . . . (200,000) (100,000) (400,000) (400,000)
Net increase (decrease) . . . . . . . . . . . . . . . . . . . . . . . . . . . (100,000) 100,000 200,000 300,000
SPDR INDEX SHARES FUNDSSTATEMENTS OF CHANGES IN NET ASSETS (continued)
See accompanying notes to financial statements.146

SPDR S&P Global Dividend ETF SPDR S&P Global Infrastructure ETF SPDR Solactive Hong Kong ETF
Year Ended9/30/19
Year Ended9/30/18
Year Ended9/30/19
Year Ended9/30/18
Year Ended9/30/19
For the Period9/18/18* -
9/30/18
$ 10,634,227 $ 7,711,366 $ 11,635,520 $ 7,591,284 $ 210,482 $ 1,594(1,525,623) 12,291,119 (4,321,824) (4,447,099) (43,114) 724,027,422 (12,885,826) 35,347,688 (11,198,242) (298,439) 70,606
13,136,026 7,116,659 42,661,384 (8,054,057) (131,071) 72,272
162,067 151,319 — — — —
(11,452,864) (6,810,482) (10,356,948) (6,140,614) (143,753) —
97,255,977 110,524,336 120,445,493 90,329,739 1,553,519 6,000,000(29,671,050) (69,138,491) (5,141,469) (5,306,625) — —
(162,067) (151,319) — — — —4,025 93 4,889 3,844 2,121 8,356
67,426,885 41,234,619 115,308,913 85,026,958 1,555,640 6,008,356
69,272,114 41,692,115 147,613,349 70,832,287 1,280,816 6,080,628
207,417,290 165,725,175 252,209,237 181,376,950 6,080,628 —
$276,689,404 $207,417,290 $399,822,586 $252,209,237 $7,361,444 $6,080,628
1,500,000 1,550,000 2,400,000 1,800,000 25,000 100,000(450,000) (950,000) (100,000) (100,000) — —
1,050,000 600,000 2,300,000 1,700,000 25,000 100,000
* Inception date.
147

SPDR EURO STOXX Small Cap ETF
YearEnded9/30/19
YearEnded9/30/18
YearEnded9/30/17
YearEnded9/30/16
YearEnded9/30/15
Net asset value, beginning of period . . . . . . . . . . . . . . . . . . . . . . . . . . . . . . . . . . . . $ 59.80 $ 62.56 $ 47.42 $ 46.83 $ 50.65
Income (loss) from investment operations:Net investment income (loss) (a). . . . . . . . . . . . . . . . . . . . . . . . . . . . . . . . . . . . . . . . 1.19 1.41 0.94 1.00 1.18Net realized and unrealized gain (loss) (b). . . . . . . . . . . . . . . . . . . . . . . . . . . . . . . . . . (2.75) (3.00) 15.17 0.43 (4.00)
Total from investment operations . . . . . . . . . . . . . . . . . . . . . . . . . . . . . . . . . . . . . . . (1.56) (1.59) 16.11 1.43 (2.82)
Net equalization credits and charges (a) . . . . . . . . . . . . . . . . . . . . . . . . . . . . . . . . . . . (0.04) (0.02) 0.01 (0.04) 0.40
Distributions to shareholders from:Net investment income . . . . . . . . . . . . . . . . . . . . . . . . . . . . . . . . . . . . . . . . . . . . . . (1.77) (1.15) (0.98) (0.80) (1.40)
Net asset value, end of period. . . . . . . . . . . . . . . . . . . . . . . . . . . . . . . . . . . . . . . . . $ 56.43 $ 59.80 $ 62.56 $ 47.42 $ 46.83
Total return (c) . . . . . . . . . . . . . . . . . . . . . . . . . . . . . . . . . . . . . . . . . . . . . . . . . . (2.59)% (2.59)% 34.30% 3.14% (4.97)%Ratios and Supplemental Data:Net assets, end of period (in 000s). . . . . . . . . . . . . . . . . . . . . . . . . . . . . . . . . . . . . . . $16,928 $29,899 $18,769 $11,854 $11,708Ratios to average net assets:Total expenses . . . . . . . . . . . . . . . . . . . . . . . . . . . . . . . . . . . . . . . . . . . . . . . . . . . 0.45% 0.46% 0.45% 0.45% 0.46%Net investment income (loss) . . . . . . . . . . . . . . . . . . . . . . . . . . . . . . . . . . . . . . . . . . 2.14% 2.25% 1.79% 2.13% 2.33%Portfolio turnover rate (d) . . . . . . . . . . . . . . . . . . . . . . . . . . . . . . . . . . . . . . . . . . . . 46% 61% 40% 53% 46%
(a) Per share numbers have been calculated using average shares outstanding, which more appropriately presents the per share data for the year.(b) Amounts shown in this caption for a share outstanding may not accord with the change in aggregate gains and losses in securities for the fiscal period because of
the timing of sales and repurchases of Fund shares in relation to fluctuating market values for the Fund.(c) Total return is calculated assuming a purchase of shares at net asset value on the first day and a sale at net asset value on the last day of each period reported.
Distributions are assumed, for the purpose of this calculation, to be reinvested at net asset value per share on the respective payment dates of each distribution. Totalreturns for periods of less than one year are not annualized. Broker commission charges are not included in this calculation.
(d) Portfolio turnover rate excludes securities received or delivered from in-kind processing of creations or redemptions.
SPDR INDEX SHARES FUNDSFINANCIAL HIGHLIGHTSSelected data for a share outstanding throughout each period
See accompanying notes to financial statements.148

SPDR MSCI ACWI Low Carbon Target ETF
YearEnded9/30/19
YearEnded9/30/18
YearEnded9/30/17
YearEnded9/30/16
For thePeriod
11/26/14* -9/30/15
Net asset value, beginning of period . . . . . . . . . . . . . . . . . . . . . . . . . . . . . . . . $ 92.20 $ 86.02 $ 74.37 $ 67.90 $ 75.00
Income (loss) from investment operations:Net investment income (loss) (a) . . . . . . . . . . . . . . . . . . . . . . . . . . . . . . . . . . . . 2.09 1.96 1.82 1.69 1.53Net realized and unrealized gain (loss) (b) . . . . . . . . . . . . . . . . . . . . . . . . . . . . . . (0.25) 6.04 11.37 6.47 (7.64)
Total from investment operations . . . . . . . . . . . . . . . . . . . . . . . . . . . . . . . . . . . 1.84 8.00 13.19 8.16 (6.11)
Net equalization credits and charges (a) . . . . . . . . . . . . . . . . . . . . . . . . . . . . . . . 0.03 0.01 0.17 0.02 0.03
Other capital . . . . . . . . . . . . . . . . . . . . . . . . . . . . . . . . . . . . . . . . . . . . . . . . 0.00(c) — — — —
Distributions to shareholders from:Net investment income . . . . . . . . . . . . . . . . . . . . . . . . . . . . . . . . . . . . . . . . . . (2.03) (1.83) (1.71) (1.66) (1.02)Net realized gains . . . . . . . . . . . . . . . . . . . . . . . . . . . . . . . . . . . . . . . . . . . . . — — — (0.05) —
Total distributions . . . . . . . . . . . . . . . . . . . . . . . . . . . . . . . . . . . . . . . . . . . . . (2.03) (1.83) (1.71) (1.71) (1.02)
Net asset value, end of period . . . . . . . . . . . . . . . . . . . . . . . . . . . . . . . . . . . . . $ 92.04 $ 92.20 $ 86.02 $ 74.37 $ 67.90
Total return (d) . . . . . . . . . . . . . . . . . . . . . . . . . . . . . . . . . . . . . . . . . . . . . . 2.25% 9.36% 18.16% 12.22% (8.25)%Ratios and Supplemental Data:Net assets, end of period (in 000s) . . . . . . . . . . . . . . . . . . . . . . . . . . . . . . . . . . . $82,838 $165,962 $146,234 $96,683 $81,474Ratios to average net assets:Total expenses . . . . . . . . . . . . . . . . . . . . . . . . . . . . . . . . . . . . . . . . . . . . . . . 0.30% 0.30% 0.30% 0.30% 0.30%(e)Net expenses . . . . . . . . . . . . . . . . . . . . . . . . . . . . . . . . . . . . . . . . . . . . . . . . 0.20% 0.20% 0.20% 0.20% 0.20%(e)Net investment income (loss) . . . . . . . . . . . . . . . . . . . . . . . . . . . . . . . . . . . . . . 2.39% 2.17% 2.28% 2.38% 2.42%(e)Portfolio turnover rate (f) . . . . . . . . . . . . . . . . . . . . . . . . . . . . . . . . . . . . . . . . 15% 17% 12% 12% 4%(g)
* Commencement of operations.(a) Per share numbers have been calculated using average shares outstanding, which more appropriately presents the per share data for the year.(b) Amounts shown in this caption for a share outstanding may not accord with the change in aggregate gains and losses in securities for the fiscal period because of
the timing of sales and repurchases of Fund shares in relation to fluctuating market values for the Fund.(c) Amount is less than $0.005 per share.(d) Total return is calculated assuming a purchase of shares at net asset value on the first day and a sale at net asset value on the last day of each period reported.
Distributions are assumed, for the purpose of this calculation, to be reinvested at net asset value per share on the respective payment dates of each distribution. Totalreturns for periods of less than one year are not annualized. Broker commission charges are not included in this calculation.
(e) Annualized.(f) Portfolio turnover rate excludes securities received or delivered from in-kind processing of creations or redemptions.(g) Not annualized.
SPDR INDEX SHARES FUNDSFINANCIAL HIGHLIGHTS (continued)Selected data for a share outstanding throughout each period
See accompanying notes to financial statements.149

SPDR Solactive Canada ETF
YearEnded9/30/19
YearEnded9/30/18
YearEnded9/30/17
YearEnded9/30/16
YearEnded9/30/15
Net asset value, beginning of period. . . . . . . . . . . . . . . . . . . . . . . . . . . . . . . . . . . . . $ 59.34 $ 59.62 $ 52.66 $ 46.60 $ 59.82
Income (loss) from investment operations:Net investment income (loss) (a) . . . . . . . . . . . . . . . . . . . . . . . . . . . . . . . . . . . . . . . . 1.66 1.28 1.17 1.13 1.18Net realized and unrealized gain (loss) (b) . . . . . . . . . . . . . . . . . . . . . . . . . . . . . . . . . . 0.86 (0.21) 6.80 5.90 (13.19)
Total from investment operations. . . . . . . . . . . . . . . . . . . . . . . . . . . . . . . . . . . . . . . . 2.52 1.07 7.97 7.03 (12.01)
Net equalization credits and charges (a) . . . . . . . . . . . . . . . . . . . . . . . . . . . . . . . . . . . (0.02) (0.14) 0.09 0.11 0.40
Distributions to shareholders from:Net investment income . . . . . . . . . . . . . . . . . . . . . . . . . . . . . . . . . . . . . . . . . . . . . . (1.56) (1.21) (1.10) (1.08) (1.61)
Net asset value, end of period . . . . . . . . . . . . . . . . . . . . . . . . . . . . . . . . . . . . . . . . . $ 60.28 $ 59.34 $ 59.62 $ 52.66 $ 46.60
Total return (c) . . . . . . . . . . . . . . . . . . . . . . . . . . . . . . . . . . . . . . . . . . . . . . . . . . 4.61% 1.54% 15.52% 15.62% (19.84)%Ratios and Supplemental Data:Net assets, end of period (in 000s) . . . . . . . . . . . . . . . . . . . . . . . . . . . . . . . . . . . . . . . $21,100 $23,738 $38,753 $18,430 $ 9,319Ratios to average net assets:Total expenses . . . . . . . . . . . . . . . . . . . . . . . . . . . . . . . . . . . . . . . . . . . . . . . . . . . 0.20% 0.30% 0.30% 0.30% 0.30%Net expenses . . . . . . . . . . . . . . . . . . . . . . . . . . . . . . . . . . . . . . . . . . . . . . . . . . . . 0.14% 0.30% 0.30% 0.30% 0.30%Net investment income (loss) . . . . . . . . . . . . . . . . . . . . . . . . . . . . . . . . . . . . . . . . . . 2.92% 2.15% 2.11% 2.30% 2.21%Portfolio turnover rate (d) . . . . . . . . . . . . . . . . . . . . . . . . . . . . . . . . . . . . . . . . . . . . 8% 29% 17% 21% 15%
(a) Per share numbers have been calculated using average shares outstanding, which more appropriately presents the per share data for the year.(b) Amounts shown in this caption for a share outstanding may not accord with the change in aggregate gains and losses in securities for the fiscal period because of
the timing of sales and repurchases of Fund shares in relation to fluctuating market values for the Fund.(c) Total return is calculated assuming a purchase of shares at net asset value on the first day and a sale at net asset value on the last day of each period reported.
Distributions are assumed, for the purpose of this calculation, to be reinvested at net asset value per share on the respective payment dates of each distribution. Totalreturns for periods of less than one year are not annualized. Broker commission charges are not included in this calculation.
(d) Portfolio turnover rate excludes securities received or delivered from in-kind processing of creations or redemptions.
SPDR INDEX SHARES FUNDSFINANCIAL HIGHLIGHTS (continued)Selected data for a share outstanding throughout each period
See accompanying notes to financial statements.150
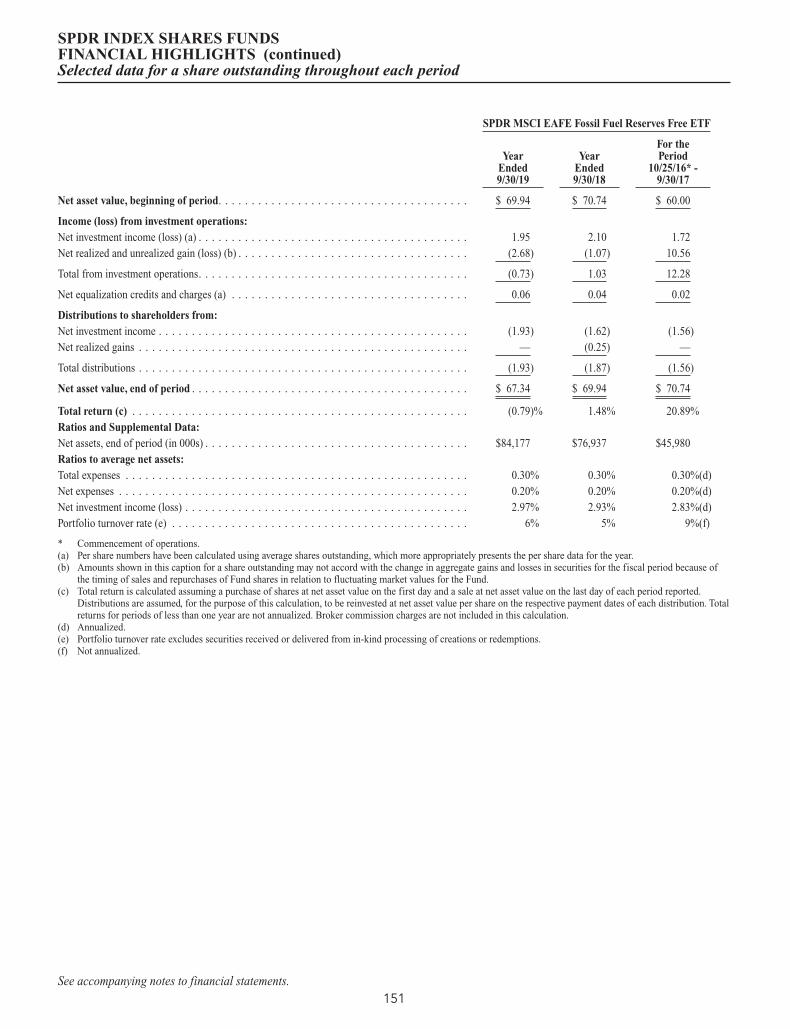
SPDR MSCI EAFE Fossil Fuel Reserves Free ETF
YearEnded9/30/19
YearEnded9/30/18
For thePeriod
10/25/16* -9/30/17
Net asset value, beginning of period. . . . . . . . . . . . . . . . . . . . . . . . . . . . . . . . . . . . . . $ 69.94 $ 70.74 $ 60.00
Income (loss) from investment operations:Net investment income (loss) (a) . . . . . . . . . . . . . . . . . . . . . . . . . . . . . . . . . . . . . . . . . 1.95 2.10 1.72Net realized and unrealized gain (loss) (b) . . . . . . . . . . . . . . . . . . . . . . . . . . . . . . . . . . . (2.68) (1.07) 10.56
Total from investment operations. . . . . . . . . . . . . . . . . . . . . . . . . . . . . . . . . . . . . . . . . (0.73) 1.03 12.28
Net equalization credits and charges (a) . . . . . . . . . . . . . . . . . . . . . . . . . . . . . . . . . . . . 0.06 0.04 0.02
Distributions to shareholders from:Net investment income . . . . . . . . . . . . . . . . . . . . . . . . . . . . . . . . . . . . . . . . . . . . . . . (1.93) (1.62) (1.56)Net realized gains . . . . . . . . . . . . . . . . . . . . . . . . . . . . . . . . . . . . . . . . . . . . . . . . . . — (0.25) —
Total distributions . . . . . . . . . . . . . . . . . . . . . . . . . . . . . . . . . . . . . . . . . . . . . . . . . . (1.93) (1.87) (1.56)
Net asset value, end of period . . . . . . . . . . . . . . . . . . . . . . . . . . . . . . . . . . . . . . . . . . $ 67.34 $ 69.94 $ 70.74
Total return (c) . . . . . . . . . . . . . . . . . . . . . . . . . . . . . . . . . . . . . . . . . . . . . . . . . . . (0.79)% 1.48% 20.89%Ratios and Supplemental Data:Net assets, end of period (in 000s) . . . . . . . . . . . . . . . . . . . . . . . . . . . . . . . . . . . . . . . . $84,177 $76,937 $45,980Ratios to average net assets:Total expenses . . . . . . . . . . . . . . . . . . . . . . . . . . . . . . . . . . . . . . . . . . . . . . . . . . . . 0.30% 0.30% 0.30%(d)Net expenses . . . . . . . . . . . . . . . . . . . . . . . . . . . . . . . . . . . . . . . . . . . . . . . . . . . . . 0.20% 0.20% 0.20%(d)Net investment income (loss) . . . . . . . . . . . . . . . . . . . . . . . . . . . . . . . . . . . . . . . . . . . 2.97% 2.93% 2.83%(d)Portfolio turnover rate (e) . . . . . . . . . . . . . . . . . . . . . . . . . . . . . . . . . . . . . . . . . . . . . 6% 5% 9%(f)
* Commencement of operations.(a) Per share numbers have been calculated using average shares outstanding, which more appropriately presents the per share data for the year.(b) Amounts shown in this caption for a share outstanding may not accord with the change in aggregate gains and losses in securities for the fiscal period because of
the timing of sales and repurchases of Fund shares in relation to fluctuating market values for the Fund.(c) Total return is calculated assuming a purchase of shares at net asset value on the first day and a sale at net asset value on the last day of each period reported.
Distributions are assumed, for the purpose of this calculation, to be reinvested at net asset value per share on the respective payment dates of each distribution. Totalreturns for periods of less than one year are not annualized. Broker commission charges are not included in this calculation.
(d) Annualized.(e) Portfolio turnover rate excludes securities received or delivered from in-kind processing of creations or redemptions.(f) Not annualized.
SPDR INDEX SHARES FUNDSFINANCIAL HIGHLIGHTS (continued)Selected data for a share outstanding throughout each period
See accompanying notes to financial statements.151

SPDR MSCI EAFE StrategicFactors ETF
YearEnded9/30/19
YearEnded9/30/18
YearEnded9/30/17
YearEnded9/30/16
YearEnded9/30/15
Net asset value, beginning of period . . . . . . . . . . . . . . . . . . . . . . . . . . . . . . . . . . $ 64.08 $ 63.16 $ 55.43 $52.68 $57.28
Income (loss) from investment operations:Net investment income (loss) (a) . . . . . . . . . . . . . . . . . . . . . . . . . . . . . . . . . . . . . . 1.84 1.85 1.90 1.56 1.60Net realized and unrealized gain (loss) (b) . . . . . . . . . . . . . . . . . . . . . . . . . . . . . . . . (1.08) 0.64 6.86 2.70 (4.56)
Total from investment operations. . . . . . . . . . . . . . . . . . . . . . . . . . . . . . . . . . . . . . 0.76 2.49 8.76 4.26 (2.96)
Other capital . . . . . . . . . . . . . . . . . . . . . . . . . . . . . . . . . . . . . . . . . . . . . . . . . . 0.00(c) 0.00(c) — — —
Distributions to shareholders from:Net investment income . . . . . . . . . . . . . . . . . . . . . . . . . . . . . . . . . . . . . . . . . . . . (1.99) (1.57) (1.03) (1.51) (1.64)Net realized gains . . . . . . . . . . . . . . . . . . . . . . . . . . . . . . . . . . . . . . . . . . . . . . . — — — — (0.00)(c)
Total distributions . . . . . . . . . . . . . . . . . . . . . . . . . . . . . . . . . . . . . . . . . . . . . . . (1.99) (1.57) (1.03) (1.51) (1.64)
Net asset value, end of period . . . . . . . . . . . . . . . . . . . . . . . . . . . . . . . . . . . . . . . $ 62.85 $ 64.08 $ 63.16 $55.43 $52.68
Total return (d) . . . . . . . . . . . . . . . . . . . . . . . . . . . . . . . . . . . . . . . . . . . . . . . . 1.39% 3.95% 15.92% 8.21% (5.34)%Ratios and Supplemental Data:Net assets, end of period (in 000s) . . . . . . . . . . . . . . . . . . . . . . . . . . . . . . . . . . . . . $320,538 $265,941 $192,644 $8,315 $5,268Ratios to average net assets:Total expenses . . . . . . . . . . . . . . . . . . . . . . . . . . . . . . . . . . . . . . . . . . . . . . . . . 0.30% 0.30% 0.30% 0.30% 0.30%Net investment income (loss) . . . . . . . . . . . . . . . . . . . . . . . . . . . . . . . . . . . . . . . . 3.02% 2.87% 3.20% 2.89% 2.80%Portfolio turnover rate (e) . . . . . . . . . . . . . . . . . . . . . . . . . . . . . . . . . . . . . . . . . . 12% 6% 9% 20% 14%
(a) Per share numbers have been calculated using average shares outstanding, which more appropriately presents the per share data for the year.(b) Amounts shown in this caption for a share outstanding may not accord with the change in aggregate gains and losses in securities for the fiscal period because of
the timing of sales and repurchases of Fund shares in relation to fluctuating market values for the Fund.(c) Amount is less than $0.005 per share.(d) Total return is calculated assuming a purchase of shares at net asset value on the first day and a sale at net asset value on the last day of each period reported.
Distributions are assumed, for the purpose of this calculation, to be reinvested at net asset value per share on the respective payment dates of each distribution. Totalreturns for periods of less than one year are not annualized. Broker commission charges are not included in this calculation.
(e) Portfolio turnover rate excludes securities received or delivered from in-kind processing of creations or redemptions.
SPDR INDEX SHARES FUNDSFINANCIAL HIGHLIGHTS (continued)Selected data for a share outstanding throughout each period
See accompanying notes to financial statements.152
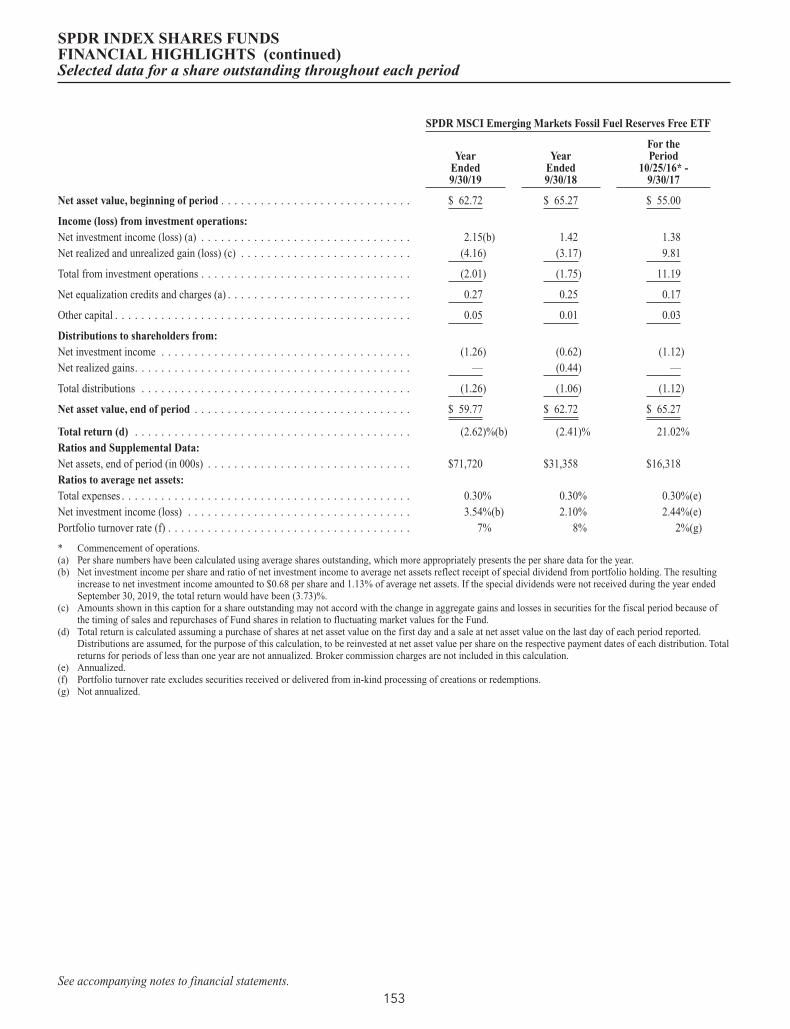
SPDR MSCI Emerging Markets Fossil Fuel Reserves Free ETF
YearEnded9/30/19
YearEnded9/30/18
For thePeriod
10/25/16* -9/30/17
Net asset value, beginning of period . . . . . . . . . . . . . . . . . . . . . . . . . . . . . $ 62.72 $ 65.27 $ 55.00
Income (loss) from investment operations:Net investment income (loss) (a) . . . . . . . . . . . . . . . . . . . . . . . . . . . . . . . . 2.15(b) 1.42 1.38Net realized and unrealized gain (loss) (c) . . . . . . . . . . . . . . . . . . . . . . . . . . (4.16) (3.17) 9.81
Total from investment operations . . . . . . . . . . . . . . . . . . . . . . . . . . . . . . . . (2.01) (1.75) 11.19
Net equalization credits and charges (a) . . . . . . . . . . . . . . . . . . . . . . . . . . . . 0.27 0.25 0.17
Other capital . . . . . . . . . . . . . . . . . . . . . . . . . . . . . . . . . . . . . . . . . . . . . 0.05 0.01 0.03
Distributions to shareholders from:Net investment income . . . . . . . . . . . . . . . . . . . . . . . . . . . . . . . . . . . . . . (1.26) (0.62) (1.12)Net realized gains. . . . . . . . . . . . . . . . . . . . . . . . . . . . . . . . . . . . . . . . . . — (0.44) —
Total distributions . . . . . . . . . . . . . . . . . . . . . . . . . . . . . . . . . . . . . . . . . (1.26) (1.06) (1.12)
Net asset value, end of period . . . . . . . . . . . . . . . . . . . . . . . . . . . . . . . . . $ 59.77 $ 62.72 $ 65.27
Total return (d) . . . . . . . . . . . . . . . . . . . . . . . . . . . . . . . . . . . . . . . . . . (2.62)%(b) (2.41)% 21.02%Ratios and Supplemental Data:Net assets, end of period (in 000s) . . . . . . . . . . . . . . . . . . . . . . . . . . . . . . . $71,720 $31,358 $16,318Ratios to average net assets:Total expenses . . . . . . . . . . . . . . . . . . . . . . . . . . . . . . . . . . . . . . . . . . . . 0.30% 0.30% 0.30%(e)Net investment income (loss) . . . . . . . . . . . . . . . . . . . . . . . . . . . . . . . . . . 3.54%(b) 2.10% 2.44%(e)Portfolio turnover rate (f) . . . . . . . . . . . . . . . . . . . . . . . . . . . . . . . . . . . . . 7% 8% 2%(g)
* Commencement of operations.(a) Per share numbers have been calculated using average shares outstanding, which more appropriately presents the per share data for the year.(b) Net investment income per share and ratio of net investment income to average net assets reflect receipt of special dividend from portfolio holding. The resulting
increase to net investment income amounted to $0.68 per share and 1.13% of average net assets. If the special dividends were not received during the year endedSeptember 30, 2019, the total return would have been (3.73)%.
(c) Amounts shown in this caption for a share outstanding may not accord with the change in aggregate gains and losses in securities for the fiscal period because ofthe timing of sales and repurchases of Fund shares in relation to fluctuating market values for the Fund.
(d) Total return is calculated assuming a purchase of shares at net asset value on the first day and a sale at net asset value on the last day of each period reported.Distributions are assumed, for the purpose of this calculation, to be reinvested at net asset value per share on the respective payment dates of each distribution. Totalreturns for periods of less than one year are not annualized. Broker commission charges are not included in this calculation.
(e) Annualized.(f) Portfolio turnover rate excludes securities received or delivered from in-kind processing of creations or redemptions.(g) Not annualized.
SPDR INDEX SHARES FUNDSFINANCIAL HIGHLIGHTS (continued)Selected data for a share outstanding throughout each period
See accompanying notes to financial statements.153

SPDR MSCI Emerging Markets StrategicFactors ETF
YearEnded9/30/19
YearEnded9/30/18
YearEnded9/30/17
YearEnded9/30/16
YearEnded9/30/15
Net asset value, beginning of period . . . . . . . . . . . . . . . . . . . . . . . . . . . . . . . . . $ 59.60 $ 60.69 $ 53.58 $ 47.58 $ 59.59
Income (loss) from investment operations:Net investment income (loss) (a) . . . . . . . . . . . . . . . . . . . . . . . . . . . . . . . . . . . . 1.63 1.53 1.40 1.27 1.58Net realized and unrealized gain (loss) (b) . . . . . . . . . . . . . . . . . . . . . . . . . . . . . . (2.02) (1.35) 6.69 5.69 (12.48)
Total from investment operations . . . . . . . . . . . . . . . . . . . . . . . . . . . . . . . . . . . . (0.39) 0.18 8.09 6.96 (10.90)
Other capital . . . . . . . . . . . . . . . . . . . . . . . . . . . . . . . . . . . . . . . . . . . . . . . . . 0.01 0.04 0.01 0.05 0.20
Distributions to shareholders from:Net investment income . . . . . . . . . . . . . . . . . . . . . . . . . . . . . . . . . . . . . . . . . . (1.71) (1.31) (0.99) (1.01) (1.31)Net realized gains . . . . . . . . . . . . . . . . . . . . . . . . . . . . . . . . . . . . . . . . . . . . . . — — — — (0.00)(c)
Total distributions. . . . . . . . . . . . . . . . . . . . . . . . . . . . . . . . . . . . . . . . . . . . . . (1.71) (1.31) (0.99) (1.01) (1.31)
Net asset value, end of period . . . . . . . . . . . . . . . . . . . . . . . . . . . . . . . . . . . . . $ 57.51 $ 59.60 $ 60.69 $ 53.58 $ 47.58
Total return (d). . . . . . . . . . . . . . . . . . . . . . . . . . . . . . . . . . . . . . . . . . . . . . . (0.52)% 0.23% 15.39% 15.00% (18.29)%Ratios and Supplemental Data:Net assets, end of period (in 000s) . . . . . . . . . . . . . . . . . . . . . . . . . . . . . . . . . . . $268,867 $266,725 $213,945 $116,539 $71,371Ratios to average net assets:Total expenses . . . . . . . . . . . . . . . . . . . . . . . . . . . . . . . . . . . . . . . . . . . . . . . . 0.30% 0.30% 0.30% 0.30% 0.30%Net investment income (loss). . . . . . . . . . . . . . . . . . . . . . . . . . . . . . . . . . . . . . . 2.84% 2.44% 2.50% 2.59% 2.82%Portfolio turnover rate (e) . . . . . . . . . . . . . . . . . . . . . . . . . . . . . . . . . . . . . . . . . 23% 30% 17% 34% 23%
(a) Per share numbers have been calculated using average shares outstanding, which more appropriately presents the per share data for the year.(b) Amounts shown in this caption for a share outstanding may not accord with the change in aggregate gains and losses in securities for the fiscal period because of
the timing of sales and repurchases of Fund shares in relation to fluctuating market values for the Fund.(c) Amount is less than $0.005 per share.(d) Total return is calculated assuming a purchase of shares at net asset value on the first day and a sale at net asset value on the last day of each period reported.
Distributions are assumed, for the purpose of this calculation, to be reinvested at net asset value per share on the respective payment dates of each distribution. Totalreturns for periods of less than one year are not annualized. Broker commission charges are not included in this calculation.
(e) Portfolio turnover rate excludes securities received or delivered from in-kind processing of creations or redemptions.
SPDR INDEX SHARES FUNDSFINANCIAL HIGHLIGHTS (continued)Selected data for a share outstanding throughout each period
See accompanying notes to financial statements.154

SPDR Solactive Germany ETF
YearEnded9/30/19
YearEnded9/30/18
YearEnded9/30/17
YearEnded9/30/16
YearEnded9/30/15
Net asset value, beginning of period . . . . . . . . . . . . . . . . . . . . . . . . . . . . . . . . . . . . . $60.50 $63.06 $ 52.12 $ 48.44 $53.58
Income (loss) from investment operations:Net investment income (loss) (a) . . . . . . . . . . . . . . . . . . . . . . . . . . . . . . . . . . . . . . . . 1.57 1.13 1.39(b) 1.20 1.24Net realized and unrealized gain (loss) (c). . . . . . . . . . . . . . . . . . . . . . . . . . . . . . . . . . . (5.65) (2.06) 10.33 3.33 (5.39)
Total from investment operations . . . . . . . . . . . . . . . . . . . . . . . . . . . . . . . . . . . . . . . . (4.08) (0.93) 11.72 4.53 (4.15)
Net equalization credits and charges (a) . . . . . . . . . . . . . . . . . . . . . . . . . . . . . . . . . . . . 0.00(d) (0.05) 0.58 0.20 0.18
Distributions to shareholders from:Net investment income. . . . . . . . . . . . . . . . . . . . . . . . . . . . . . . . . . . . . . . . . . . . . . . (1.61) (1.58) (1.36) (1.05) (1.17)
Net asset value, end of period . . . . . . . . . . . . . . . . . . . . . . . . . . . . . . . . . . . . . . . . . $54.81 $60.50 $ 63.06 $ 52.12 $48.44
Total return (e) . . . . . . . . . . . . . . . . . . . . . . . . . . . . . . . . . . . . . . . . . . . . . . . . . . . (6.75)% (1.64)% 23.78%(b) 9.99% (7.64)%Ratios and Supplemental Data:Net assets, end of period (in 000s) . . . . . . . . . . . . . . . . . . . . . . . . . . . . . . . . . . . . . . . $8,221 $9,074 $18,917 $13,031 $9,688Ratios to average net assets:Total expenses . . . . . . . . . . . . . . . . . . . . . . . . . . . . . . . . . . . . . . . . . . . . . . . . . . . . 0.20% 0.30% 0.30% 0.30% 0.30%Net expenses . . . . . . . . . . . . . . . . . . . . . . . . . . . . . . . . . . . . . . . . . . . . . . . . . . . . . 0.14% 0.30% 0.30% 0.30% 0.30%Net investment income (loss) . . . . . . . . . . . . . . . . . . . . . . . . . . . . . . . . . . . . . . . . . . . 2.85% 1.76% 2.44%(b) 2.37% 2.26%Portfolio turnover rate (f) . . . . . . . . . . . . . . . . . . . . . . . . . . . . . . . . . . . . . . . . . . . . . 13% 28% 19% 27% 18%
(a) Per share numbers have been calculated using average shares outstanding, which more appropriately presents the per share data for the year.(b) Net investment income per share and ratio of net investment income to average net assets reflect receipt of special dividend from portfolio holding. The resulting
increase to net investment income amounted to $0.29 per share and 0.50% of average net assets. If the special dividends were not received during the year endedSeptember 30, 2017, the total return would have been 23.40%.
(c) Amounts shown in this caption for a share outstanding may not accord with the change in aggregate gains and losses in securities for the fiscal period because ofthe timing of sales and repurchases of Fund shares in relation to fluctuating market values for the Fund.
(d) Amount is less than $0.005 per share.(e) Total return is calculated assuming a purchase of shares at net asset value on the first day and a sale at net asset value on the last day of each period reported.
Distributions are assumed, for the purpose of this calculation, to be reinvested at net asset value per share on the respective payment dates of each distribution. Totalreturns for periods of less than one year are not annualized. Broker commission charges are not included in this calculation.
(f) Portfolio turnover rate excludes securities received or delivered from in-kind processing of creations or redemptions.
SPDR INDEX SHARES FUNDSFINANCIAL HIGHLIGHTS (continued)Selected data for a share outstanding throughout each period
See accompanying notes to financial statements.155
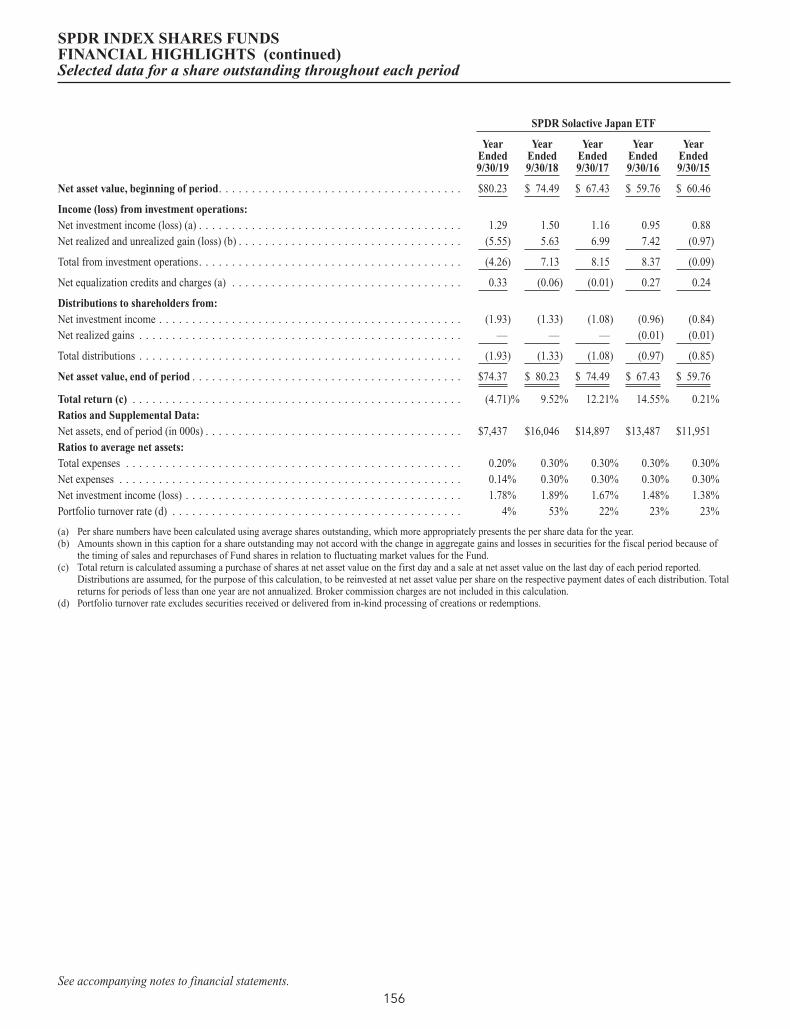
SPDR Solactive Japan ETF
YearEnded9/30/19
YearEnded9/30/18
YearEnded9/30/17
YearEnded9/30/16
YearEnded9/30/15
Net asset value, beginning of period. . . . . . . . . . . . . . . . . . . . . . . . . . . . . . . . . . . . . $80.23 $ 74.49 $ 67.43 $ 59.76 $ 60.46
Income (loss) from investment operations:Net investment income (loss) (a) . . . . . . . . . . . . . . . . . . . . . . . . . . . . . . . . . . . . . . . . 1.29 1.50 1.16 0.95 0.88Net realized and unrealized gain (loss) (b) . . . . . . . . . . . . . . . . . . . . . . . . . . . . . . . . . . (5.55) 5.63 6.99 7.42 (0.97)
Total from investment operations. . . . . . . . . . . . . . . . . . . . . . . . . . . . . . . . . . . . . . . . (4.26) 7.13 8.15 8.37 (0.09)
Net equalization credits and charges (a) . . . . . . . . . . . . . . . . . . . . . . . . . . . . . . . . . . . 0.33 (0.06) (0.01) 0.27 0.24
Distributions to shareholders from:Net investment income . . . . . . . . . . . . . . . . . . . . . . . . . . . . . . . . . . . . . . . . . . . . . . (1.93) (1.33) (1.08) (0.96) (0.84)Net realized gains . . . . . . . . . . . . . . . . . . . . . . . . . . . . . . . . . . . . . . . . . . . . . . . . . — — — (0.01) (0.01)
Total distributions . . . . . . . . . . . . . . . . . . . . . . . . . . . . . . . . . . . . . . . . . . . . . . . . . (1.93) (1.33) (1.08) (0.97) (0.85)
Net asset value, end of period . . . . . . . . . . . . . . . . . . . . . . . . . . . . . . . . . . . . . . . . . $74.37 $ 80.23 $ 74.49 $ 67.43 $ 59.76
Total return (c) . . . . . . . . . . . . . . . . . . . . . . . . . . . . . . . . . . . . . . . . . . . . . . . . . . (4.71)% 9.52% 12.21% 14.55% 0.21%Ratios and Supplemental Data:Net assets, end of period (in 000s) . . . . . . . . . . . . . . . . . . . . . . . . . . . . . . . . . . . . . . . $7,437 $16,046 $14,897 $13,487 $11,951Ratios to average net assets:Total expenses . . . . . . . . . . . . . . . . . . . . . . . . . . . . . . . . . . . . . . . . . . . . . . . . . . . 0.20% 0.30% 0.30% 0.30% 0.30%Net expenses . . . . . . . . . . . . . . . . . . . . . . . . . . . . . . . . . . . . . . . . . . . . . . . . . . . . 0.14% 0.30% 0.30% 0.30% 0.30%Net investment income (loss) . . . . . . . . . . . . . . . . . . . . . . . . . . . . . . . . . . . . . . . . . . 1.78% 1.89% 1.67% 1.48% 1.38%Portfolio turnover rate (d) . . . . . . . . . . . . . . . . . . . . . . . . . . . . . . . . . . . . . . . . . . . . 4% 53% 22% 23% 23%
(a) Per share numbers have been calculated using average shares outstanding, which more appropriately presents the per share data for the year.(b) Amounts shown in this caption for a share outstanding may not accord with the change in aggregate gains and losses in securities for the fiscal period because of
the timing of sales and repurchases of Fund shares in relation to fluctuating market values for the Fund.(c) Total return is calculated assuming a purchase of shares at net asset value on the first day and a sale at net asset value on the last day of each period reported.
Distributions are assumed, for the purpose of this calculation, to be reinvested at net asset value per share on the respective payment dates of each distribution. Totalreturns for periods of less than one year are not annualized. Broker commission charges are not included in this calculation.
(d) Portfolio turnover rate excludes securities received or delivered from in-kind processing of creations or redemptions.
SPDR INDEX SHARES FUNDSFINANCIAL HIGHLIGHTS (continued)Selected data for a share outstanding throughout each period
See accompanying notes to financial statements.156

SPDR Solactive United Kingdom ETF
YearEnded9/30/19
YearEnded9/30/18
YearEnded9/30/17
YearEnded9/30/16
YearEnded9/30/15
Net asset value, beginning of period . . . . . . . . . . . . . . . . . . . . . . . . . . . . . . . . . . . . . $ 52.45 $ 52.99 $48.26 $50.14 $57.08
Income (loss) from investment operations:Net investment income (loss) (a) . . . . . . . . . . . . . . . . . . . . . . . . . . . . . . . . . . . . . . . . 2.44 2.34 2.26 1.82 2.18Net realized and unrealized gain (loss) (b) . . . . . . . . . . . . . . . . . . . . . . . . . . . . . . . . . . (3.96) (1.29) 3.20 (1.77) (7.43)
Total from investment operations . . . . . . . . . . . . . . . . . . . . . . . . . . . . . . . . . . . . . . . . (1.52) 1.05 5.46 0.05 (5.25)
Net equalization credits and charges (a) . . . . . . . . . . . . . . . . . . . . . . . . . . . . . . . . . . . . (0.05) 0.28 1.18 — 0.34
Distributions to shareholders from:Net investment income. . . . . . . . . . . . . . . . . . . . . . . . . . . . . . . . . . . . . . . . . . . . . . . (2.41) (1.87) (1.91) (1.93) (2.03)
Net asset value, end of period . . . . . . . . . . . . . . . . . . . . . . . . . . . . . . . . . . . . . . . . . $ 48.47 $ 52.45 $52.99 $48.26 $50.14
Total return (c) . . . . . . . . . . . . . . . . . . . . . . . . . . . . . . . . . . . . . . . . . . . . . . . . . . . (2.77)% 2.46% 14.13% 0.18% (8.85)%Ratios and Supplemental Data:Net assets, end of period (in 000s) . . . . . . . . . . . . . . . . . . . . . . . . . . . . . . . . . . . . . . . $10,906 $10,489 $5,299 $2,413 $2,507Ratios to average net assets:Total expenses . . . . . . . . . . . . . . . . . . . . . . . . . . . . . . . . . . . . . . . . . . . . . . . . . . . . 0.20% 0.30% 0.30% 0.31% 0.30%Net expenses . . . . . . . . . . . . . . . . . . . . . . . . . . . . . . . . . . . . . . . . . . . . . . . . . . . . . 0.14% 0.30% 0.30% 0.31% 0.30%Net investment income (loss) . . . . . . . . . . . . . . . . . . . . . . . . . . . . . . . . . . . . . . . . . . . 5.01% 4.38% 4.49% 3.71% 3.90%Portfolio turnover rate (d) . . . . . . . . . . . . . . . . . . . . . . . . . . . . . . . . . . . . . . . . . . . . . 13% 50% 27% 24% 31%
(a) Per share numbers have been calculated using average shares outstanding, which more appropriately presents the per share data for the year.(b) Amounts shown in this caption for a share outstanding may not accord with the change in aggregate gains and losses in securities for the fiscal period because of
the timing of sales and repurchases of Fund shares in relation to fluctuating market values for the Fund.(c) Total return is calculated assuming a purchase of shares at net asset value on the first day and a sale at net asset value on the last day of each period reported.
Distributions are assumed, for the purpose of this calculation, to be reinvested at net asset value per share on the respective payment dates of each distribution. Totalreturns for periods of less than one year are not annualized. Broker commission charges are not included in this calculation.
(d) Portfolio turnover rate excludes securities received or delivered from in-kind processing of creations or redemptions.
SPDR INDEX SHARES FUNDSFINANCIAL HIGHLIGHTS (continued)Selected data for a share outstanding throughout each period
See accompanying notes to financial statements.157
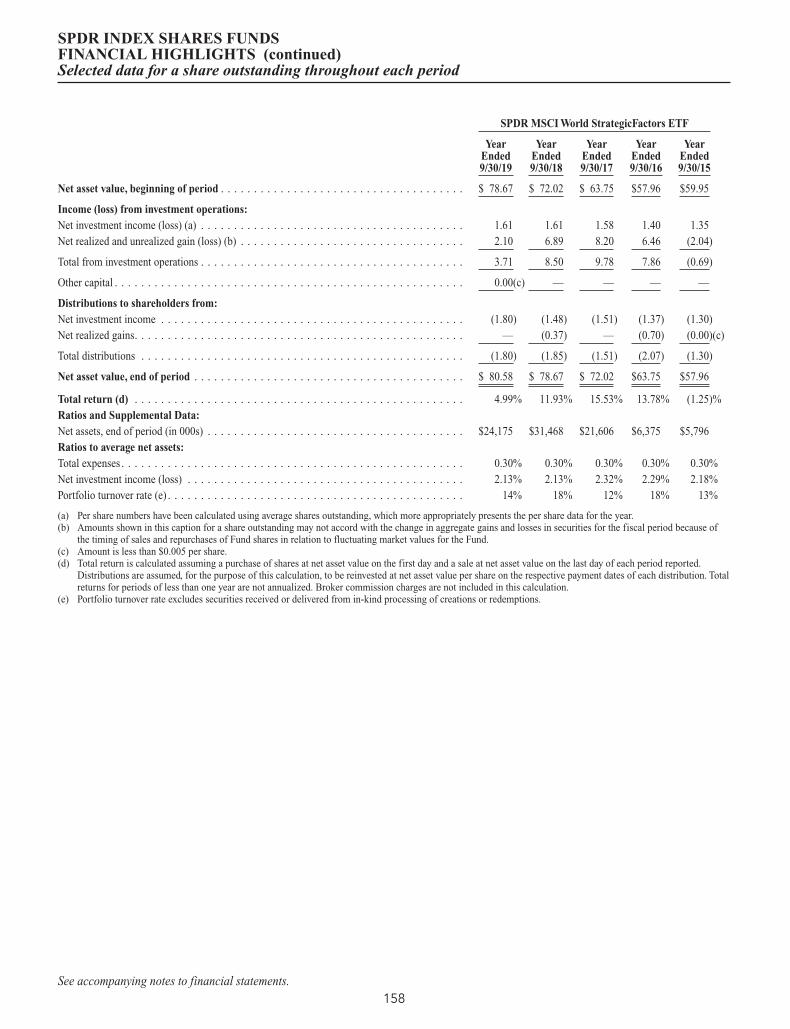
SPDR MSCI World StrategicFactors ETF
YearEnded9/30/19
YearEnded9/30/18
YearEnded9/30/17
YearEnded9/30/16
YearEnded9/30/15
Net asset value, beginning of period . . . . . . . . . . . . . . . . . . . . . . . . . . . . . . . . . . . . . $ 78.67 $ 72.02 $ 63.75 $57.96 $59.95
Income (loss) from investment operations:Net investment income (loss) (a) . . . . . . . . . . . . . . . . . . . . . . . . . . . . . . . . . . . . . . . . 1.61 1.61 1.58 1.40 1.35Net realized and unrealized gain (loss) (b) . . . . . . . . . . . . . . . . . . . . . . . . . . . . . . . . . . 2.10 6.89 8.20 6.46 (2.04)
Total from investment operations . . . . . . . . . . . . . . . . . . . . . . . . . . . . . . . . . . . . . . . . 3.71 8.50 9.78 7.86 (0.69)
Other capital . . . . . . . . . . . . . . . . . . . . . . . . . . . . . . . . . . . . . . . . . . . . . . . . . . . . . 0.00(c) — — — —
Distributions to shareholders from:Net investment income . . . . . . . . . . . . . . . . . . . . . . . . . . . . . . . . . . . . . . . . . . . . . . (1.80) (1.48) (1.51) (1.37) (1.30)Net realized gains. . . . . . . . . . . . . . . . . . . . . . . . . . . . . . . . . . . . . . . . . . . . . . . . . . — (0.37) — (0.70) (0.00)(c)
Total distributions . . . . . . . . . . . . . . . . . . . . . . . . . . . . . . . . . . . . . . . . . . . . . . . . . (1.80) (1.85) (1.51) (2.07) (1.30)
Net asset value, end of period . . . . . . . . . . . . . . . . . . . . . . . . . . . . . . . . . . . . . . . . . $ 80.58 $ 78.67 $ 72.02 $63.75 $57.96
Total return (d) . . . . . . . . . . . . . . . . . . . . . . . . . . . . . . . . . . . . . . . . . . . . . . . . . . 4.99% 11.93% 15.53% 13.78% (1.25)%Ratios and Supplemental Data:Net assets, end of period (in 000s) . . . . . . . . . . . . . . . . . . . . . . . . . . . . . . . . . . . . . . . $24,175 $31,468 $21,606 $6,375 $5,796Ratios to average net assets:Total expenses . . . . . . . . . . . . . . . . . . . . . . . . . . . . . . . . . . . . . . . . . . . . . . . . . . . . 0.30% 0.30% 0.30% 0.30% 0.30%Net investment income (loss) . . . . . . . . . . . . . . . . . . . . . . . . . . . . . . . . . . . . . . . . . . 2.13% 2.13% 2.32% 2.29% 2.18%Portfolio turnover rate (e) . . . . . . . . . . . . . . . . . . . . . . . . . . . . . . . . . . . . . . . . . . . . . 14% 18% 12% 18% 13%
(a) Per share numbers have been calculated using average shares outstanding, which more appropriately presents the per share data for the year.(b) Amounts shown in this caption for a share outstanding may not accord with the change in aggregate gains and losses in securities for the fiscal period because of
the timing of sales and repurchases of Fund shares in relation to fluctuating market values for the Fund.(c) Amount is less than $0.005 per share.(d) Total return is calculated assuming a purchase of shares at net asset value on the first day and a sale at net asset value on the last day of each period reported.
Distributions are assumed, for the purpose of this calculation, to be reinvested at net asset value per share on the respective payment dates of each distribution. Totalreturns for periods of less than one year are not annualized. Broker commission charges are not included in this calculation.
(e) Portfolio turnover rate excludes securities received or delivered from in-kind processing of creations or redemptions.
SPDR INDEX SHARES FUNDSFINANCIAL HIGHLIGHTS (continued)Selected data for a share outstanding throughout each period
See accompanying notes to financial statements.158
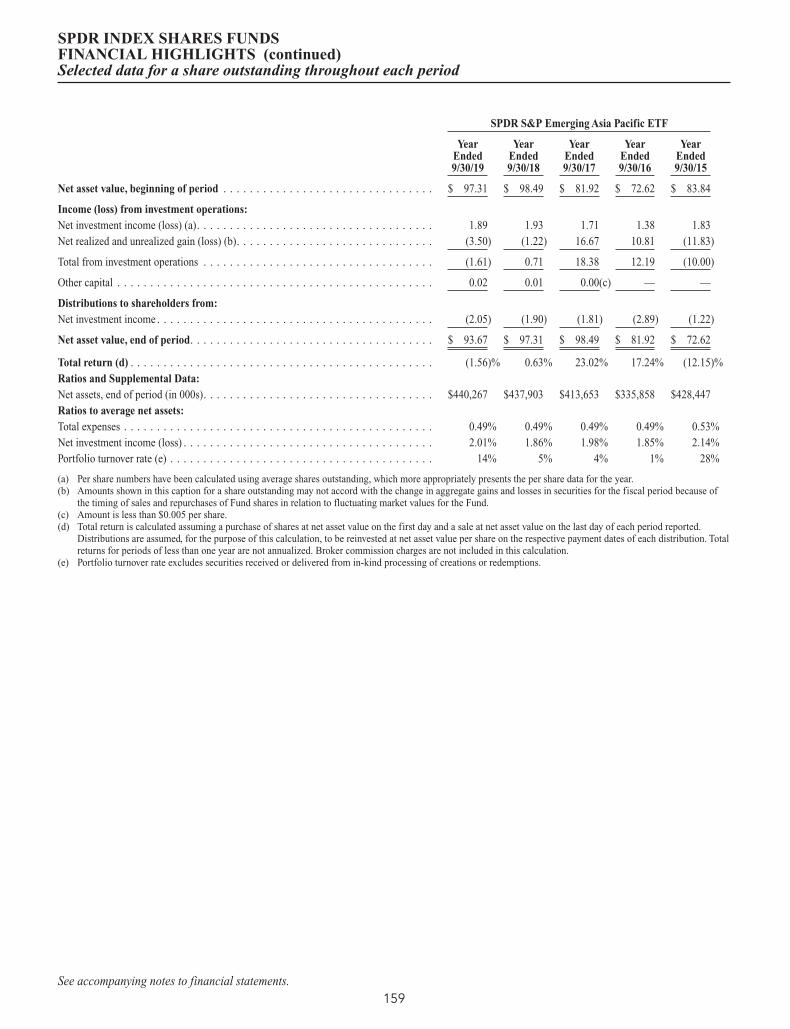
SPDR S&P Emerging Asia Pacific ETF
YearEnded9/30/19
YearEnded9/30/18
YearEnded9/30/17
YearEnded9/30/16
YearEnded9/30/15
Net asset value, beginning of period . . . . . . . . . . . . . . . . . . . . . . . . . . . . . . . . $ 97.31 $ 98.49 $ 81.92 $ 72.62 $ 83.84
Income (loss) from investment operations:Net investment income (loss) (a). . . . . . . . . . . . . . . . . . . . . . . . . . . . . . . . . . . . 1.89 1.93 1.71 1.38 1.83Net realized and unrealized gain (loss) (b). . . . . . . . . . . . . . . . . . . . . . . . . . . . . . (3.50) (1.22) 16.67 10.81 (11.83)
Total from investment operations . . . . . . . . . . . . . . . . . . . . . . . . . . . . . . . . . . . (1.61) 0.71 18.38 12.19 (10.00)
Other capital . . . . . . . . . . . . . . . . . . . . . . . . . . . . . . . . . . . . . . . . . . . . . . . . 0.02 0.01 0.00(c) — —
Distributions to shareholders from:Net investment income . . . . . . . . . . . . . . . . . . . . . . . . . . . . . . . . . . . . . . . . . . (2.05) (1.90) (1.81) (2.89) (1.22)
Net asset value, end of period. . . . . . . . . . . . . . . . . . . . . . . . . . . . . . . . . . . . . $ 93.67 $ 97.31 $ 98.49 $ 81.92 $ 72.62
Total return (d) . . . . . . . . . . . . . . . . . . . . . . . . . . . . . . . . . . . . . . . . . . . . . . (1.56)% 0.63% 23.02% 17.24% (12.15)%Ratios and Supplemental Data:Net assets, end of period (in 000s). . . . . . . . . . . . . . . . . . . . . . . . . . . . . . . . . . . $440,267 $437,903 $413,653 $335,858 $428,447Ratios to average net assets:Total expenses . . . . . . . . . . . . . . . . . . . . . . . . . . . . . . . . . . . . . . . . . . . . . . . 0.49% 0.49% 0.49% 0.49% 0.53%Net investment income (loss) . . . . . . . . . . . . . . . . . . . . . . . . . . . . . . . . . . . . . . 2.01% 1.86% 1.98% 1.85% 2.14%Portfolio turnover rate (e) . . . . . . . . . . . . . . . . . . . . . . . . . . . . . . . . . . . . . . . . 14% 5% 4% 1% 28%
(a) Per share numbers have been calculated using average shares outstanding, which more appropriately presents the per share data for the year.(b) Amounts shown in this caption for a share outstanding may not accord with the change in aggregate gains and losses in securities for the fiscal period because of
the timing of sales and repurchases of Fund shares in relation to fluctuating market values for the Fund.(c) Amount is less than $0.005 per share.(d) Total return is calculated assuming a purchase of shares at net asset value on the first day and a sale at net asset value on the last day of each period reported.
Distributions are assumed, for the purpose of this calculation, to be reinvested at net asset value per share on the respective payment dates of each distribution. Totalreturns for periods of less than one year are not annualized. Broker commission charges are not included in this calculation.
(e) Portfolio turnover rate excludes securities received or delivered from in-kind processing of creations or redemptions.
SPDR INDEX SHARES FUNDSFINANCIAL HIGHLIGHTS (continued)Selected data for a share outstanding throughout each period
See accompanying notes to financial statements.159
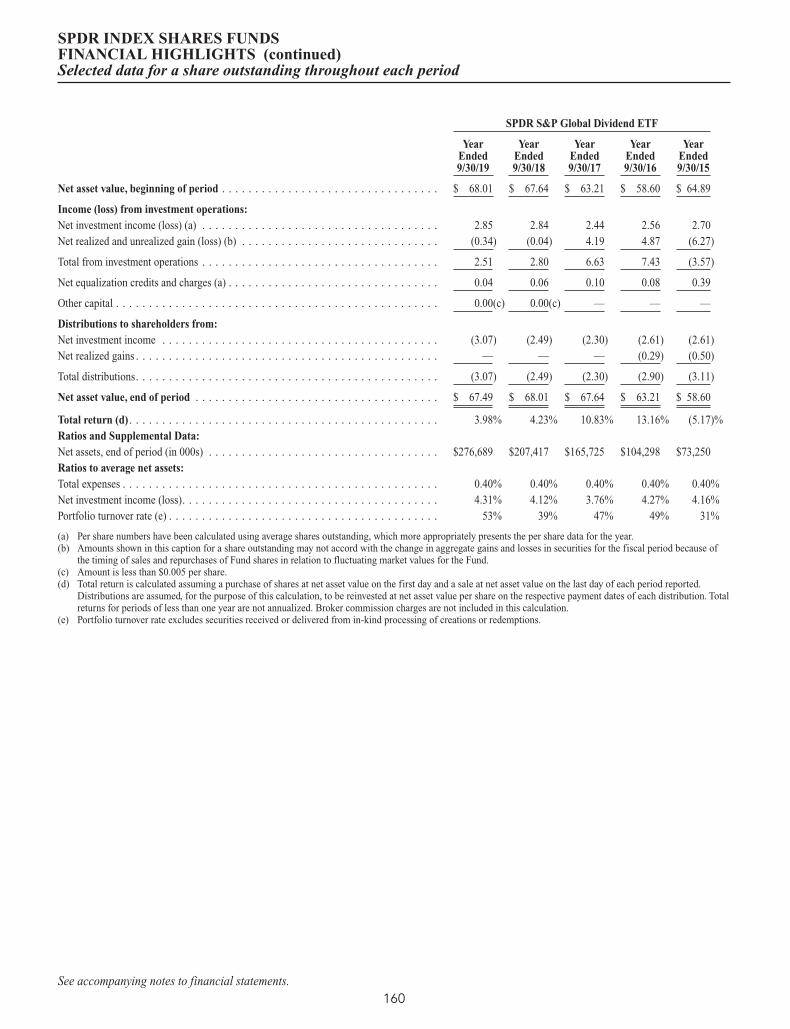
SPDR S&P Global Dividend ETF
YearEnded9/30/19
YearEnded9/30/18
YearEnded9/30/17
YearEnded9/30/16
YearEnded9/30/15
Net asset value, beginning of period . . . . . . . . . . . . . . . . . . . . . . . . . . . . . . . . . $ 68.01 $ 67.64 $ 63.21 $ 58.60 $ 64.89
Income (loss) from investment operations:Net investment income (loss) (a) . . . . . . . . . . . . . . . . . . . . . . . . . . . . . . . . . . . . 2.85 2.84 2.44 2.56 2.70Net realized and unrealized gain (loss) (b) . . . . . . . . . . . . . . . . . . . . . . . . . . . . . . (0.34) (0.04) 4.19 4.87 (6.27)
Total from investment operations . . . . . . . . . . . . . . . . . . . . . . . . . . . . . . . . . . . . 2.51 2.80 6.63 7.43 (3.57)
Net equalization credits and charges (a) . . . . . . . . . . . . . . . . . . . . . . . . . . . . . . . . 0.04 0.06 0.10 0.08 0.39
Other capital . . . . . . . . . . . . . . . . . . . . . . . . . . . . . . . . . . . . . . . . . . . . . . . . . 0.00(c) 0.00(c) — — —
Distributions to shareholders from:Net investment income . . . . . . . . . . . . . . . . . . . . . . . . . . . . . . . . . . . . . . . . . . (3.07) (2.49) (2.30) (2.61) (2.61)Net realized gains . . . . . . . . . . . . . . . . . . . . . . . . . . . . . . . . . . . . . . . . . . . . . . — — — (0.29) (0.50)
Total distributions. . . . . . . . . . . . . . . . . . . . . . . . . . . . . . . . . . . . . . . . . . . . . . (3.07) (2.49) (2.30) (2.90) (3.11)
Net asset value, end of period . . . . . . . . . . . . . . . . . . . . . . . . . . . . . . . . . . . . . $ 67.49 $ 68.01 $ 67.64 $ 63.21 $ 58.60
Total return (d). . . . . . . . . . . . . . . . . . . . . . . . . . . . . . . . . . . . . . . . . . . . . . . 3.98% 4.23% 10.83% 13.16% (5.17)%Ratios and Supplemental Data:Net assets, end of period (in 000s) . . . . . . . . . . . . . . . . . . . . . . . . . . . . . . . . . . . $276,689 $207,417 $165,725 $104,298 $73,250Ratios to average net assets:Total expenses . . . . . . . . . . . . . . . . . . . . . . . . . . . . . . . . . . . . . . . . . . . . . . . . 0.40% 0.40% 0.40% 0.40% 0.40%Net investment income (loss). . . . . . . . . . . . . . . . . . . . . . . . . . . . . . . . . . . . . . . 4.31% 4.12% 3.76% 4.27% 4.16%Portfolio turnover rate (e) . . . . . . . . . . . . . . . . . . . . . . . . . . . . . . . . . . . . . . . . . 53% 39% 47% 49% 31%
(a) Per share numbers have been calculated using average shares outstanding, which more appropriately presents the per share data for the year.(b) Amounts shown in this caption for a share outstanding may not accord with the change in aggregate gains and losses in securities for the fiscal period because of
the timing of sales and repurchases of Fund shares in relation to fluctuating market values for the Fund.(c) Amount is less than $0.005 per share.(d) Total return is calculated assuming a purchase of shares at net asset value on the first day and a sale at net asset value on the last day of each period reported.
Distributions are assumed, for the purpose of this calculation, to be reinvested at net asset value per share on the respective payment dates of each distribution. Totalreturns for periods of less than one year are not annualized. Broker commission charges are not included in this calculation.
(e) Portfolio turnover rate excludes securities received or delivered from in-kind processing of creations or redemptions.
SPDR INDEX SHARES FUNDSFINANCIAL HIGHLIGHTS (continued)Selected data for a share outstanding throughout each period
See accompanying notes to financial statements.160

SPDR S&P Global Infrastructure ETF
YearEnded9/30/19
YearEnded9/30/18
YearEnded9/30/17
YearEnded9/30/16
YearEnded9/30/15
Net asset value, beginning of period . . . . . . . . . . . . . . . . . . . . . . . . . . . . . . . . . . $ 48.50 $ 51.82 $ 47.69 $ 43.31 $ 48.84
Income (loss) from investment operations:Net investment income (loss) (a) . . . . . . . . . . . . . . . . . . . . . . . . . . . . . . . . . . . . . 1.86 1.81 1.73 1.58 1.46Net realized and unrealized gain (loss) (b) . . . . . . . . . . . . . . . . . . . . . . . . . . . . . . . 4.63 (3.55) 4.03 4.23 (5.62)
Total from investment operations . . . . . . . . . . . . . . . . . . . . . . . . . . . . . . . . . . . . . 6.49 (1.74) 5.76 5.81 (4.16)
Other capital . . . . . . . . . . . . . . . . . . . . . . . . . . . . . . . . . . . . . . . . . . . . . . . . . . 0.00(c) 0.00(c) — — —
Distributions to shareholders from:Net investment income . . . . . . . . . . . . . . . . . . . . . . . . . . . . . . . . . . . . . . . . . . . (1.68) (1.58) (1.63) (1.43) (1.37)
Net asset value, end of period . . . . . . . . . . . . . . . . . . . . . . . . . . . . . . . . . . . . . . $ 53.31 $ 48.50 $ 51.82 $ 47.69 $ 43.31
Total return (d) . . . . . . . . . . . . . . . . . . . . . . . . . . . . . . . . . . . . . . . . . . . . . . . 13.76% (3.43)% 12.35% 13.85% (8.77)%Ratios and Supplemental Data:Net assets, end of period (in 000s) . . . . . . . . . . . . . . . . . . . . . . . . . . . . . . . . . . . . $399,823 $252,209 $181,377 $85,850 $56,299Ratios to average net assets:Total expenses. . . . . . . . . . . . . . . . . . . . . . . . . . . . . . . . . . . . . . . . . . . . . . . . . 0.40% 0.40% 0.40% 0.40% 0.40%Net investment income (loss) . . . . . . . . . . . . . . . . . . . . . . . . . . . . . . . . . . . . . . . 3.69% 3.61% 3.54% 3.55% 3.03%Portfolio turnover rate (e) . . . . . . . . . . . . . . . . . . . . . . . . . . . . . . . . . . . . . . . . . . 14% 21% 22% 21% 7%
(a) Per share numbers have been calculated using average shares outstanding, which more appropriately presents the per share data for the year.(b) Amounts shown in this caption for a share outstanding may not accord with the change in aggregate gains and losses in securities for the fiscal period because of
the timing of sales and repurchases of Fund shares in relation to fluctuating market values for the Fund.(c) Amount is less than $0.005 per share.(d) Total return is calculated assuming a purchase of shares at net asset value on the first day and a sale at net asset value on the last day of each period reported.
Distributions are assumed, for the purpose of this calculation, to be reinvested at net asset value per share on the respective payment dates of each distribution. Totalreturns for periods of less than one year are not annualized. Broker commission charges are not included in this calculation.
(e) Portfolio turnover rate excludes securities received or delivered from in-kind processing of creations or redemptions.
SPDR INDEX SHARES FUNDSFINANCIAL HIGHLIGHTS (continued)Selected data for a share outstanding throughout each period
See accompanying notes to financial statements.161
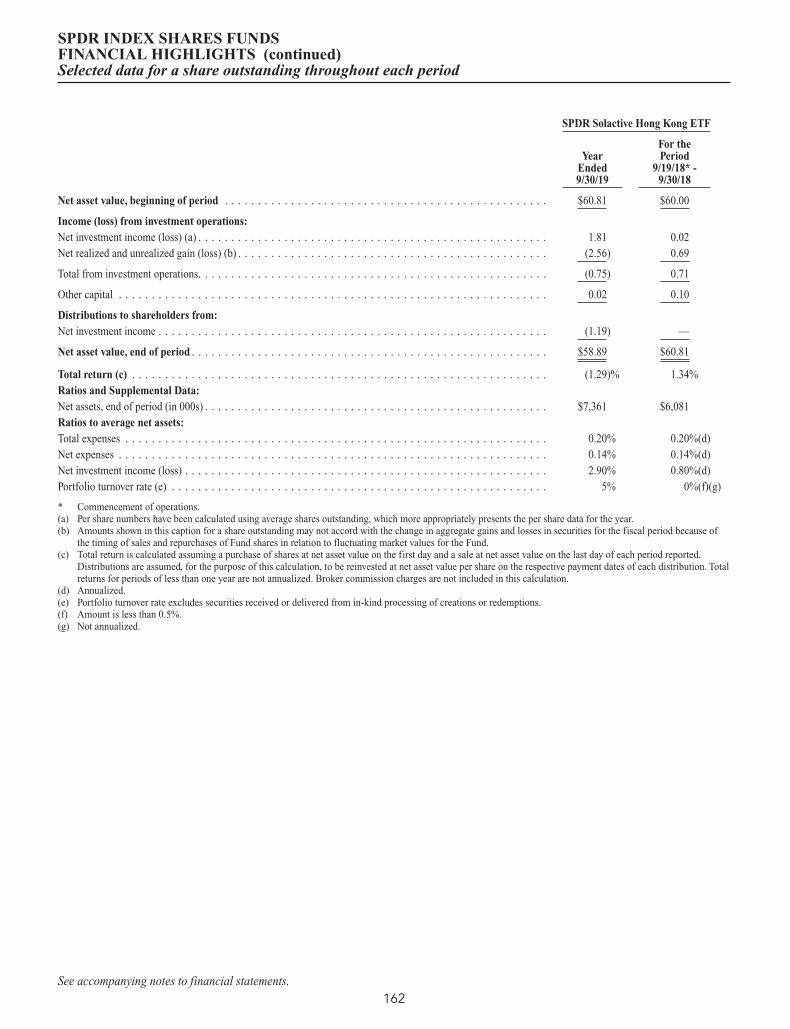
SPDR Solactive Hong Kong ETF
YearEnded9/30/19
For thePeriod
9/19/18* -9/30/18
Net asset value, beginning of period . . . . . . . . . . . . . . . . . . . . . . . . . . . . . . . . . . . . . . . . . . . . . . . . . $60.81 $60.00
Income (loss) from investment operations:Net investment income (loss) (a) . . . . . . . . . . . . . . . . . . . . . . . . . . . . . . . . . . . . . . . . . . . . . . . . . . . . . 1.81 0.02Net realized and unrealized gain (loss) (b) . . . . . . . . . . . . . . . . . . . . . . . . . . . . . . . . . . . . . . . . . . . . . . . (2.56) 0.69
Total from investment operations. . . . . . . . . . . . . . . . . . . . . . . . . . . . . . . . . . . . . . . . . . . . . . . . . . . . . (0.75) 0.71
Other capital . . . . . . . . . . . . . . . . . . . . . . . . . . . . . . . . . . . . . . . . . . . . . . . . . . . . . . . . . . . . . . . . . 0.02 0.10
Distributions to shareholders from:Net investment income . . . . . . . . . . . . . . . . . . . . . . . . . . . . . . . . . . . . . . . . . . . . . . . . . . . . . . . . . . . (1.19) —
Net asset value, end of period . . . . . . . . . . . . . . . . . . . . . . . . . . . . . . . . . . . . . . . . . . . . . . . . . . . . . . $58.89 $60.81
Total return (c) . . . . . . . . . . . . . . . . . . . . . . . . . . . . . . . . . . . . . . . . . . . . . . . . . . . . . . . . . . . . . . . (1.29)% 1.34%Ratios and Supplemental Data:Net assets, end of period (in 000s) . . . . . . . . . . . . . . . . . . . . . . . . . . . . . . . . . . . . . . . . . . . . . . . . . . . . $7,361 $6,081Ratios to average net assets:Total expenses . . . . . . . . . . . . . . . . . . . . . . . . . . . . . . . . . . . . . . . . . . . . . . . . . . . . . . . . . . . . . . . . 0.20% 0.20%(d)Net expenses . . . . . . . . . . . . . . . . . . . . . . . . . . . . . . . . . . . . . . . . . . . . . . . . . . . . . . . . . . . . . . . . . 0.14% 0.14%(d)Net investment income (loss) . . . . . . . . . . . . . . . . . . . . . . . . . . . . . . . . . . . . . . . . . . . . . . . . . . . . . . . 2.90% 0.80%(d)Portfolio turnover rate (e) . . . . . . . . . . . . . . . . . . . . . . . . . . . . . . . . . . . . . . . . . . . . . . . . . . . . . . . . . 5% 0%(f)(g)
* Commencement of operations.(a) Per share numbers have been calculated using average shares outstanding, which more appropriately presents the per share data for the year.(b) Amounts shown in this caption for a share outstanding may not accord with the change in aggregate gains and losses in securities for the fiscal period because of
the timing of sales and repurchases of Fund shares in relation to fluctuating market values for the Fund.(c) Total return is calculated assuming a purchase of shares at net asset value on the first day and a sale at net asset value on the last day of each period reported.
Distributions are assumed, for the purpose of this calculation, to be reinvested at net asset value per share on the respective payment dates of each distribution. Totalreturns for periods of less than one year are not annualized. Broker commission charges are not included in this calculation.
(d) Annualized.(e) Portfolio turnover rate excludes securities received or delivered from in-kind processing of creations or redemptions.(f) Amount is less than 0.5%.(g) Not annualized.
SPDR INDEX SHARES FUNDSFINANCIAL HIGHLIGHTS (continued)Selected data for a share outstanding throughout each period
See accompanying notes to financial statements.162
1. Organization
SPDR Index Shares Funds (the “Trust”), a Massachusetts business trust, registered under the Investment Company Act of1940, as amended (“1940 Act”), is an open-end management investment company.
As of September 30, 2019, the Trust consists of thirty (30) series, each of which represents a separate series of beneficialinterest in the Trust. The Declaration of Trust permits the Board of Trustees of the Trust (the “Board”) to authorize theissuance of an unlimited number of shares of beneficial interest at $0.01 par value. The financial statements herein relate tothe following series (each a “Fund”, and collectively, the “Funds”):
SPDR EURO STOXX Small Cap ETFSPDR MSCI ACWI Low Carbon Target ETFSPDR Solactive Canada ETFSPDR MSCI EAFE Fossil Fuel Reserves Free ETFSPDR MSCI EAFE StrategicFactors ETFSPDR MSCI Emerging Markets Fossil Fuel Reserves Free
ETFSPDR MSCI Emerging Markets StrategicFactors ETFSPDR Solactive Germany ETF
SPDR Solactive Japan ETFSPDR Solactive United Kingdom ETFSPDR MSCI World StrategicFactors ETFSPDR S&P Emerging Asia Pacific ETFSPDR S&P Global Dividend ETFSPDR S&P Global Infrastructure ETFSPDR Solactive Hong Kong ETF
Each Fund is classified as a non-diversified investment company under the 1940 Act.
Under the Trust’s organizational documents, its officers and trustees are indemnified against certain liabilities arising out ofthe performance of their duties to the Trust. Additionally, in the normal course of business, the Trust enters into contracts withservice providers that contain general indemnification clauses. The Trust’s maximum exposure under these arrangements isunknown as this would involve future claims that may be made against the Trust that have not yet occurred.
2. Summary of Significant Accounting Policies
The following is a summary of significant accounting policies followed by the Trust in the preparation of its financialstatements:
The preparation of financial statements in accordance with U.S. generally accepted accounting principles (“U.S. GAAP”)requires management to make estimates and assumptions that affect the reported amounts and disclosures in the financialstatements. Actual results could differ from those estimates. Each Fund is an investment company under U.S. GAAP andfollows the accounting and reporting guidance applicable to investment companies.
Security Valuation
Each Fund’s investments are valued at fair value each day that the New York Stock Exchange (“NYSE”) is open and, forfinancial reporting purposes, as of the report date should the reporting period end on a day that the NYSE is not open. Fairvalue is generally defined as the price a fund would receive to sell an asset or pay to transfer a liability in an orderlytransaction between market participants at the measurement date. By its nature, a fair value price is a good faith estimate ofthe valuation in a current sale and may not reflect an actual market price. The investments of each Fund are valued pursuant tothe policy and procedures developed by the Oversight Committee (the “Committee”) and approved by the Board. TheCommittee provides oversight of the valuation of investments for the Funds. The Board has responsibility for overseeing thedetermination of the fair value of investments.
Valuation techniques used to value each Fund’s investments by major category are as follows:
• Equity investments (including registered investment companies that are exchange-traded funds) traded on a recognizedsecurities exchange for which market quotations are readily available are valued at the last sale price or official closingprice, as applicable, on the primary market or exchange on which they trade. Equity investments traded on a recognizedexchange for which there were no sales on that day are valued at the last published sale price or at fair value.
• Rights and warrants are valued at the last reported sale price obtained from independent pricing services or brokers on the
SPDR INDEX SHARES FUNDSNOTES TO FINANCIAL STATEMENTSSeptember 30, 2019
163
valuation date. If no price is obtained from pricing services or brokers, valuation will be based upon the intrinsic value,pursuant to the valuation policy and procedures approved by the Board.
• Investments in registered investment companies (including money market funds) or other unitized pooled investmentvehicles that are not traded on an exchange are valued at that day’s published net asset value (“NAV”) per share or unit.
• Debt obligations (including short- term investments) are valued using quotations from independent pricing services orbrokers or are generally valued at the last reported evaluated prices.
In the event prices or quotations are not readily available or that the application of these valuation methods results in a pricefor an investment that is deemed to be not representative of the fair value of such investment, fair value will be determined ingood faith by the Committee, in accordance with the valuation policy and procedures approved by the Board.
Fair value pricing could result in a difference between the prices used to calculate a Fund’s NAV and the prices used by theFunds’ underlying benchmarks. Various inputs are used in determining the value of the Funds’ investments.
The Funds value their assets and liabilities at fair value using a fair value hierarchy consisting of three broad levels thatprioritize the inputs to valuation techniques giving the highest priority to readily available unadjusted quoted prices in activemarkets for identical assets or liabilities (Level 1 measurements) and the lowest priority to unobservable inputs (Level 3measurements) when market prices are not readily available or reliable. The categorization of a value determined for aninvestment within the hierarchy is based upon the pricing transparency of the investment and is not necessarily an indication ofthe risk associated with investing in it.
The three levels of the fair value hierarchy are as follows:
• Level 1 – Unadjusted quoted prices in active markets for an identical asset or liability;
• Level 2 – Inputs other than quoted prices included within Level 1 that are observable for the asset or liability either directlyor indirectly, including quoted prices for similar assets or liabilities in active markets, quoted prices for identical or similarassets or liabilities in markets that are not considered to be active, inputs other than quoted prices that are observable for theasset or liability (such as exchange rates, financing terms, interest rates, yield curves, volatilities, prepayment speeds, lossseverities, credit risks and default rates) or other market-corroborated inputs; and
• Level 3 – Unobservable inputs for the asset or liability, including the Committee’s assumptions used in determining the fairvalue of investments.
The value of each Fund’s investments according to the fair value hierarchy as of September 30, 2019, is disclosed in eachFund’s respective Schedule of Investments.
Investment Transactions and Income Recognition
Investment transactions are accounted for on trade date for financial reporting purposes. Realized gains and losses from thesale or disposition of investments and foreign exchange transactions, if any, are determined using the identified cost method.
Dividend income and capital gain distributions, if any, are recognized on the ex-dividend date, or when the informationbecomes available, net of any foreign taxes withheld at source, if any. Non-cash dividends received in the form of stock, if any,are recorded as dividend income at fair value.
Certain Funds invest in real estate investment trusts (“REITs”). REITs determine the tax character of their distributionsannually and may characterize a portion of their distributions as a return of capital or capital gain. The Funds’ policy is torecord all REIT distributions initially as dividend income and re-designate a portion to return of capital or capital gaindistributions at year end based on information provided by the REIT and/or SSGA Funds Management, Inc.’s (the “Adviser”or “SSGA FM”) estimates of such re-designations for which actual information has not yet been reported.
SPDR INDEX SHARES FUNDSNOTES TO FINANCIAL STATEMENTS (continued)September 30, 2019
164
Expenses
Certain expenses, which are directly identifiable to a specific Fund, are applied to that Fund within the Trust. Other expenseswhich cannot be attributed to a specific Fund are allocated in such a manner as deemed equitable, taking into considerationthe nature and type of expense and the relative net assets of the Funds within the Trust.
Foreign Currency Translation
The accounting records of the Funds are maintained in U.S. dollars. Foreign currencies as well as investment securities andother assets and liabilities denominated in a foreign currency are translated to U.S. dollars using exchange rates at period end.Purchases and sales of securities, income receipts and expense payments denominated in foreign currencies are translated intoU.S. dollars at the prevailing exchange rate on the respective dates of the transactions.
The effects of exchange rate fluctuations on investments are included with the net realized and unrealized gain (loss) oninvestment securities. Other foreign currency transactions resulting in realized and unrealized gain (loss) are disclosedseparately.
Foreign Taxes
The Funds may be subject to foreign taxes (a portion of which may be reclaimable) on income, stock dividends, realized andunrealized capital gains on investments or certain foreign currency transactions. Foreign taxes are recorded in accordance withSSGA FM’s understanding of the applicable foreign tax regulations and rates that exist in the foreign jurisdictions in whichthe Funds invest. These foreign taxes, if any, are paid by the Funds and are reflected in the Statements of Operations, ifapplicable. Foreign taxes payable or deferred as of September 30, 2019, if any, are disclosed in the Funds’ Statements ofAssets and Liabilities.
Equalization
Certain Funds in the Trust follow the accounting practice known as “Equalization” by which a portion of the proceeds fromsales and costs of reacquiring Fund shares, equivalent on a per share basis to the amount of distributable net investmentincome on the date of the transaction, is credited or charged to undistributed net investment income. As a result, undistributednet investment income per share is unaffected by sales or reacquisition of Fund shares. Amounts related to Equalization can befound on the Statements of Changes in Net Assets.
The following Funds utilized equalization during the period ended September 30, 2019:
SPDR EURO STOXX Small Cap ETFSPDR MSCI ACWI Low Carbon Target ETFSPDR Solactive Canada ETFSPDR MSCI EAFE Fossil Fuel Reserves Free ETFSPDR MSCI Emerging Markets Fossil Fuel Reserves Free
ETF
SPDR Solactive Germany ETFSPDR Solactive Japan ETFSPDR Solactive United Kingdom ETFSPDR S&P Global Dividend ETF
Distributions
The following Fund declares and distributes from net investment income, if any, to its shareholders quarterly:
SPDR S&P Global Dividend ETF
The following Funds declare and distribute from net investment income, if any, to their shareholders semi-annually:
SPDR EURO STOXX Small Cap ETFSPDR MSCI ACWI Low Carbon Target ETFSPDR Solactive Canada ETFSPDR MSCI EAFE Fossil Fuel Reserves Free ETFSPDR MSCI EAFE StrategicFactors ETF
SPDR MSCI Emerging Markets Fossil Fuel Reserves FreeETF
SPDR MSCI Emerging Markets StrategicFactors ETFSPDR Solactive Germany ETFSPDR Solactive Japan ETF
SPDR INDEX SHARES FUNDSNOTES TO FINANCIAL STATEMENTS (continued)September 30, 2019
165
SPDR Solactive United Kingdom ETFSPDR MSCI World StrategicFactors ETFSPDR S&P Emerging Asia Pacific ETF
SPDR S&P Global Infrastructure ETFSPDR Solactive Hong Kong ETF
Net realized capital gains, if any, are distributed annually. Dividends may be declared and paid more frequently or at any othertimes to improve Index tracking or to comply with the distribution requirements of the Internal Revenue Code of 1986, asamended (“Internal Revenue Code”). The amount and character of income and capital gains to be distributed are determinedin accordance with applicable tax regulations which may differ from net investment income and realized gains recognized forU.S. GAAP purposes.
3. Fees and Transactions with Affiliates
Advisory Fee
The Trust, on behalf of each Fund, has entered into an Investment Advisory Agreement with SSGA FM. For its advisoryservices to the Funds, facilities furnished, and expenses borne by the Adviser, each Fund pays the Adviser a fee(“Management/Advisory fee”) accrued daily and paid monthly, based on a percentage of each Fund’s average daily net assetsas shown in the following table:
Annual Rate
SPDR EURO STOXX Small Cap ETF. . . . . . . . . . . . . . . . . . . . . . . . . . . . . . . . . . . . . . . . . . . . . . . . . . . . . . . . . . . . . . 0.45%
SPDR MSCI ACWI Low Carbon Target ETF . . . . . . . . . . . . . . . . . . . . . . . . . . . . . . . . . . . . . . . . . . . . . . . . . . . . . . . . . 0.30
SPDR Solactive Canada ETF . . . . . . . . . . . . . . . . . . . . . . . . . . . . . . . . . . . . . . . . . . . . . . . . . . . . . . . . . . . . . . . . . . . . 0.20
SPDR MSCI EAFE Fossil Fuel Reserves Free ETF. . . . . . . . . . . . . . . . . . . . . . . . . . . . . . . . . . . . . . . . . . . . . . . . . . . . . 0.30
SPDR MSCI EAFE StrategicFactors ETF . . . . . . . . . . . . . . . . . . . . . . . . . . . . . . . . . . . . . . . . . . . . . . . . . . . . . . . . . . . 0.30
SPDR MSCI Emerging Markets Fossil Fuel Reserves Free ETF. . . . . . . . . . . . . . . . . . . . . . . . . . . . . . . . . . . . . . . . . . . . 0.30
SPDR MSCI Emerging Markets StrategicFactors ETF . . . . . . . . . . . . . . . . . . . . . . . . . . . . . . . . . . . . . . . . . . . . . . . . . . 0.30
SPDR Solactive Germany ETF . . . . . . . . . . . . . . . . . . . . . . . . . . . . . . . . . . . . . . . . . . . . . . . . . . . . . . . . . . . . . . . . . . . 0.20
SPDR Solactive Japan ETF. . . . . . . . . . . . . . . . . . . . . . . . . . . . . . . . . . . . . . . . . . . . . . . . . . . . . . . . . . . . . . . . . . . . . . 0.20
SPDR Solactive United Kingdom ETF. . . . . . . . . . . . . . . . . . . . . . . . . . . . . . . . . . . . . . . . . . . . . . . . . . . . . . . . . . . . . . 0.20
SPDR MSCI World StrategicFactors ETF. . . . . . . . . . . . . . . . . . . . . . . . . . . . . . . . . . . . . . . . . . . . . . . . . . . . . . . . . . . . 0.30
SPDR S&P Emerging Asia Pacific ETF. . . . . . . . . . . . . . . . . . . . . . . . . . . . . . . . . . . . . . . . . . . . . . . . . . . . . . . . . . . . . 0.49
SPDR S&P Global Dividend ETF . . . . . . . . . . . . . . . . . . . . . . . . . . . . . . . . . . . . . . . . . . . . . . . . . . . . . . . . . . . . . . . . . 0.40
SPDR S&P Global Infrastructure ETF. . . . . . . . . . . . . . . . . . . . . . . . . . . . . . . . . . . . . . . . . . . . . . . . . . . . . . . . . . . . . . 0.40
SPDR Solactive Hong Kong ETF . . . . . . . . . . . . . . . . . . . . . . . . . . . . . . . . . . . . . . . . . . . . . . . . . . . . . . . . . . . . . . . . . 0.20
The Adviser pays all expenses of each Fund other than the Management fee, brokerage expenses, taxes, interest, fees andexpenses of the Independent Trustees (including any Trustees’ counsel fees), acquired fund fees and expenses, litigationexpenses and other extraordinary expenses.
The Adviser has contractually agreed to waive a portion of its Management fee and/or reimburse expenses in an amount equalto any acquired fund fees and expenses (excluding holdings in acquired funds for cash management purposes, if any) for eachFund until January 31, 2020.
The Adviser has contractually agreed to waive a portion of its Management fee and/or reimburse certain expenses, untilJanuary 31, 2020, so that the net annual Fund operating expenses of the SPDR MSCI ACWI Low Carbon Target ETF and theSPDR MSCI EAFE Fossil Fuel Reserves Free ETF, before application of any fees and expenses not paid by the Adviserpursuant to the Investment Advisory Agreement, if any, will be limited to 0.20% of each Fund’s average daily net assets. Eachcontractual fee waiver and/or reimbursement does not provide for the recoupment by the Adviser of any fees the Adviserpreviously waived or reimbursed. The Adviser may continue each waiver and/or reimbursement from year to year, but there isno guarantee that the Adviser will do so. Each waiver and/or reimbursement may be cancelled or modified at any time afterJanuary 31, 2020. For the period ended September 30, 2019, the SPDR MSCI ACWI Low Carbon Target ETF and the SPDR
SPDR INDEX SHARES FUNDSNOTES TO FINANCIAL STATEMENTS (continued)September 30, 2019
166

MSCI EAFE Fossil Fuel Reserves Free ETF waived $92,488 and $74,711, respectively. Each waiver and/or reimbursementmay not be terminated prior to January 31, 2020 except with the approval of the Funds’ Board of Trustees.
The Adviser has contractually agreed to waive a portion of its Management fee and/or reimburse certain expenses, untilJanuary 31, 2020, so that the net annual Fund operating expenses of the SPDR Solactive Canada ETF, SPDR SolactiveGermany ETF, SPDR Solactive Japan ETF, SPDR Solactive United Kingdom ETF and SPDR Solactive Hong Kong ETF willbe limited to 0.14% of each Fund’s average daily net assets. Each contractual fee waiver and/or reimbursement does notprovide for the recoupment by the Adviser of any fees the Adviser previously waived or reimbursed. The Adviser may continueeach waiver and/or reimbursement from year to year, but there is no guarantee that the Adviser will do so and each waiver maybe cancelled or modified at any time after January 31, 2020. For the period ended September 30, 2019, the SPDR SolactiveCanada ETF, SPDR Solactive Germany ETF, SPDR Solactive Japan ETF, SPDR Solactive United Kingdom ETF and SPDRSolactive Hong Kong ETF waived $13,651, $4,976, $5,920, $5,956 and $4,467 respectively.
Administrator, Custodian, Sub-Administrator and Transfer Agent Fees
SSGA FM serves as administrator and State Street Bank & Trust Company (“State Street”), an affiliate of the Adviser, servesas custodian, sub-administrator and transfer agent. State Street receives fees for its services as custodian, sub-administratorand transfer agent from the Adviser.
Distributor
State Street Global Advisors Funds Distributors, LLC (“SSGA FD” or the “Distributor”), an affiliate of the Adviser, serves asthe distributor of the Trust.
Other Transactions with Affiliates - Securities Lending
State Street, an affiliate of the Funds, acts as the securities lending agent for the Funds, pursuant to an amended and restatedsecurities lending authorization agreement dated January 6, 2017.
Proceeds collected by State Street on investment of cash collateral or any fee income are allocated as follows (after deductionof such other amounts payable to State Street under the terms of the securities lending agreement): 85% payable to the Fund,and 15% payable to State Street.
In addition, cash collateral from lending activities is invested in the State Street Navigator Securities Lending Portfolio III, anaffiliated money market fund, for which SSGA FM serves as investment adviser. See Note 8 for additional informationregarding securities lending.
Other Transactions with Affiliates
The Funds may invest in affiliated entities, including securities issued by State Street Corporation, affiliated funds, or entitiesdeemed to be affiliates as a result of the Funds owning more than five percent of the entity’s voting securities or outstandingshares. Amounts relating to these transactions during the period ended September 30, 2019 are disclosed in the Schedules ofInvestments.
Due to Custodian
In certain circumstances, the Funds may have cash overdrafts with the custodian due to expense payments, capital transactions,trading of securities, investment operations or derivative transactions. The Due to custodian amount, if any, reflects cashoverdrawn with State Street, as custodian, who is an affiliate of the Funds.
4. Trustees’ Fees
The fees and expenses of the Trust’s trustees, who are not “interested persons” of the Trust, as defined in the 1940 Act(“Independent Trustees”), are paid directly by the Funds. The Independent Trustees are reimbursed for travel and otherout-of-pocket expenses in connection with meeting attendance and industry seminars.
SPDR INDEX SHARES FUNDSNOTES TO FINANCIAL STATEMENTS (continued)September 30, 2019
167

5. Investment Transactions
Purchases and sales of investments (excluding in-kind transactions and short term investments) for the period endedSeptember 30, 2019, were as follows:
Purchases Sales
SPDR EURO STOXX Small Cap ETF . . . . . . . . . . . . . . . . . . . . . . . . . . . . . . . . . . . . . . . . . . . . . . . . . . . . . . $ 9,134,335 $ 9,367,951
SPDR MSCI ACWI Low Carbon Target ETF . . . . . . . . . . . . . . . . . . . . . . . . . . . . . . . . . . . . . . . . . . . . . . . . . . 14,332,169 18,100,504
SPDR Solactive Canada ETF . . . . . . . . . . . . . . . . . . . . . . . . . . . . . . . . . . . . . . . . . . . . . . . . . . . . . . . . . . . . 1,680,227 1,735,959
SPDR MSCI EAFE Fossil Fuel Reserves Free ETF. . . . . . . . . . . . . . . . . . . . . . . . . . . . . . . . . . . . . . . . . . . . . . 4,435,600 4,431,127
SPDR MSCI EAFE StrategicFactors ETF . . . . . . . . . . . . . . . . . . . . . . . . . . . . . . . . . . . . . . . . . . . . . . . . . . . . 35,466,294 32,868,788
SPDR MSCI Emerging Markets Fossil Fuel Reserves Free ETF . . . . . . . . . . . . . . . . . . . . . . . . . . . . . . . . . . . . . 34,079,394 3,638,338
SPDR MSCI Emerging Markets StrategicFactors ETF. . . . . . . . . . . . . . . . . . . . . . . . . . . . . . . . . . . . . . . . . . . . 71,969,890 63,125,966
SPDR Solactive Germany ETF . . . . . . . . . . . . . . . . . . . . . . . . . . . . . . . . . . . . . . . . . . . . . . . . . . . . . . . . . . . 1,014,033 1,044,747
SPDR Solactive Japan ETF. . . . . . . . . . . . . . . . . . . . . . . . . . . . . . . . . . . . . . . . . . . . . . . . . . . . . . . . . . . . . . 397,055 642,240
SPDR Solactive United Kingdom ETF . . . . . . . . . . . . . . . . . . . . . . . . . . . . . . . . . . . . . . . . . . . . . . . . . . . . . . 1,273,317 1,240,393
SPDR MSCI World StrategicFactors ETF . . . . . . . . . . . . . . . . . . . . . . . . . . . . . . . . . . . . . . . . . . . . . . . . . . . . 3,626,876 3,477,267
SPDR S&P Emerging Asia Pacific ETF . . . . . . . . . . . . . . . . . . . . . . . . . . . . . . . . . . . . . . . . . . . . . . . . . . . . . 92,045,531 64,740,833
SPDR S&P Global Dividend ETF . . . . . . . . . . . . . . . . . . . . . . . . . . . . . . . . . . . . . . . . . . . . . . . . . . . . . . . . . 130,942,233 128,530,135
SPDR S&P Global Infrastructure ETF . . . . . . . . . . . . . . . . . . . . . . . . . . . . . . . . . . . . . . . . . . . . . . . . . . . . . . 49,939,861 42,168,657
SPDR Solactive Hong Kong ETF. . . . . . . . . . . . . . . . . . . . . . . . . . . . . . . . . . . . . . . . . . . . . . . . . . . . . . . . . . 1,867,287 383,562
For the period ended September 30, 2019, the following Funds had in-kind contributions, redemptions and net realizedgains/losses in the amounts as follows:
In-kindContributions
In-kindRedemptions
In-kind NetRealized
Gains/(Losses)
SPDR EURO STOXX Small Cap ETF . . . . . . . . . . . . . . . . . . . . . . . . . . . . . . . . . . . . . . . . . $ — $10,915,412 $ (355,274)
SPDR MSCI ACWI Low Carbon Target ETF . . . . . . . . . . . . . . . . . . . . . . . . . . . . . . . . . . . . . 23,667,007 90,519,955 13,823,136
SPDR Solactive Canada ETF. . . . . . . . . . . . . . . . . . . . . . . . . . . . . . . . . . . . . . . . . . . . . . . . 1,421,059 4,365,806 436,135
SPDR MSCI EAFE Fossil Fuel Reserves Free ETF . . . . . . . . . . . . . . . . . . . . . . . . . . . . . . . . . 16,314,198 6,366,581 895,817
SPDR MSCI EAFE StrategicFactors ETF . . . . . . . . . . . . . . . . . . . . . . . . . . . . . . . . . . . . . . . 76,520,688 20,417,357 2,345,148
SPDR MSCI Emerging Markets Fossil Fuel Reserves Free ETF . . . . . . . . . . . . . . . . . . . . . . . . 11,110,621 — —
SPDR MSCI Emerging Markets StrategicFactors ETF . . . . . . . . . . . . . . . . . . . . . . . . . . . . . . . 8,340,803 5,917,780 1,283,996
SPDR Solactive Germany ETF . . . . . . . . . . . . . . . . . . . . . . . . . . . . . . . . . . . . . . . . . . . . . . 1,330,179 1,349,267 (19,657)
SPDR Solactive Japan ETF . . . . . . . . . . . . . . . . . . . . . . . . . . . . . . . . . . . . . . . . . . . . . . . . . — 6,932,785 (569,386)
SPDR Solactive United Kingdom ETF . . . . . . . . . . . . . . . . . . . . . . . . . . . . . . . . . . . . . . . . . 2,392,177 1,289,496 38,468
SPDR MSCI World StrategicFactors ETF . . . . . . . . . . . . . . . . . . . . . . . . . . . . . . . . . . . . . . . 7,540,909 15,384,210 2,142,172
SPDR S&P Emerging Asia Pacific ETF . . . . . . . . . . . . . . . . . . . . . . . . . . . . . . . . . . . . . . . . 15,217,565 23,486,682 6,495,141
SPDR S&P Global Dividend ETF . . . . . . . . . . . . . . . . . . . . . . . . . . . . . . . . . . . . . . . . . . . . 93,013,930 29,178,517 2,844,064
SPDR S&P Global Infrastructure ETF . . . . . . . . . . . . . . . . . . . . . . . . . . . . . . . . . . . . . . . . . 112,880,667 5,745,312 1,048,211
SPDR Solactive Hong Kong ETF . . . . . . . . . . . . . . . . . . . . . . . . . . . . . . . . . . . . . . . . . . . . . 127,331 — —
6. Shareholder Transactions
Each Fund issues and redeems its shares, at NAV, by each Fund only in aggregations of a specified number of shares ormultiples thereof (“Creation Units”). Except when aggregated in Creation Units, shares of each Fund are not redeemable.Transactions in capital shares for each Fund are disclosed in detail in the Statements of Changes in Net Assets.
SPDR INDEX SHARES FUNDSNOTES TO FINANCIAL STATEMENTS (continued)September 30, 2019
168

The consideration for the purchase of Creation Units of a Fund may consist of the in-kind deposit of a designated portfolio ofsecurities and a specified amount of cash. Investors purchasing and redeeming Creation Units may pay a purchase transactionfee and a redemption transaction fee directly to the Trust and/or custodian, to offset transfer and other transaction costsassociated with the issuance and redemption of Creation Units, including Creation Units for cash. An additional variable feemay be charged for certain transactions. Such variable charges, if any, are included in “Other Capital” on the Statements ofChanges in Net Assets.
7. Income Tax Information
The Funds have qualified and intend to continue to qualify as regulated investment companies under Subchapter M of theInternal Revenue Code. Each Fund will not be subject to federal income taxes to the extent it distributes its taxable income,including any net realized capital gains, for each fiscal year. Therefore, no provision for federal income tax is required.
The Funds file federal and various state and local tax returns as required. No income tax returns are currently underexamination. Generally, the federal returns are subject to examination by the Internal Revenue Service for a period of threeyears from date of filing, while the state returns may remain open for an additional year depending upon jurisdiction. SSGAFM has analyzed the Funds’ tax positions taken on tax returns for all open years and does not believe there are any uncertaintax positions that would require recognition of a tax liability.
Distributions to shareholders are recorded on ex-dividend date. Income dividends and gain distributions are determined inaccordance with income tax rules and regulations, which may differ from generally accepted accounting principles.
Certain capital accounts in the financial statements have been adjusted for permanent book- tax differences. Theseadjustments have no impact on NAV or results of operations. Temporary book-tax differences will reverse in the future. Thesebook-tax differences are primarily due to differing treatments for nontaxable dividend adjustments to income, in-kindtransactions, passive foreign investment company gains and losses and wash sale loss deferrals. In addition, certain Fundsclaimed a portion of the payments made to redeeming shareholders as a distribution for income tax purposes.
The tax character of distributions paid during the periods ended September 30, 2019, was as follows:
OrdinaryIncome
Long-TermCapital Gains Total
SPDR EURO STOXX Small Cap ETF. . . . . . . . . . . . . . . . . . . . . . . . . . . . . . . . . . . . . . . . . . . . . $ 598,209 $— $ 598,209
SPDR MSCI ACWI Low Carbon Target ETF . . . . . . . . . . . . . . . . . . . . . . . . . . . . . . . . . . . . . . . . 2,546,683 — 2,546,683
SPDR Solactive Canada ETF . . . . . . . . . . . . . . . . . . . . . . . . . . . . . . . . . . . . . . . . . . . . . . . . . . . 618,682 — 618,682
SPDR MSCI EAFE Fossil Fuel Reserves Free ETF . . . . . . . . . . . . . . . . . . . . . . . . . . . . . . . . . . . . 2,127,783 — 2,127,783
SPDR MSCI EAFE StrategicFactors ETF . . . . . . . . . . . . . . . . . . . . . . . . . . . . . . . . . . . . . . . . . . 8,422,134 — 8,422,134
SPDR MSCI Emerging Markets Fossil Fuel Reserves Free ETF. . . . . . . . . . . . . . . . . . . . . . . . . . . . 820,869 — 820,869
SPDR MSCI Emerging Markets StrategicFactors ETF . . . . . . . . . . . . . . . . . . . . . . . . . . . . . . . . . . 7,885,947 — 7,885,947
SPDR Solactive Germany ETF. . . . . . . . . . . . . . . . . . . . . . . . . . . . . . . . . . . . . . . . . . . . . . . . . . 241,939 — 241,939
SPDR Solactive Japan ETF . . . . . . . . . . . . . . . . . . . . . . . . . . . . . . . . . . . . . . . . . . . . . . . . . . . . 313,379 — 313,379
SPDR Solactive United Kingdom ETF. . . . . . . . . . . . . . . . . . . . . . . . . . . . . . . . . . . . . . . . . . . . . 450,912 — 450,912
SPDR MSCI World StrategicFactors ETF. . . . . . . . . . . . . . . . . . . . . . . . . . . . . . . . . . . . . . . . . . . 637,363 — 637,363
SPDR S&P Emerging Asia Pacific ETF. . . . . . . . . . . . . . . . . . . . . . . . . . . . . . . . . . . . . . . . . . . . 9,768,703 — 9,768,703
SPDR S&P Global Dividend ETF. . . . . . . . . . . . . . . . . . . . . . . . . . . . . . . . . . . . . . . . . . . . . . . . 11,452,864 — 11,452,864
SPDR S&P Global Infrastructure ETF. . . . . . . . . . . . . . . . . . . . . . . . . . . . . . . . . . . . . . . . . . . . . 10,356,948 — 10,356,948
SPDR Solactive Hong Kong ETF . . . . . . . . . . . . . . . . . . . . . . . . . . . . . . . . . . . . . . . . . . . . . . . . 143,753 — 143,753
SPDR INDEX SHARES FUNDSNOTES TO FINANCIAL STATEMENTS (continued)September 30, 2019
169
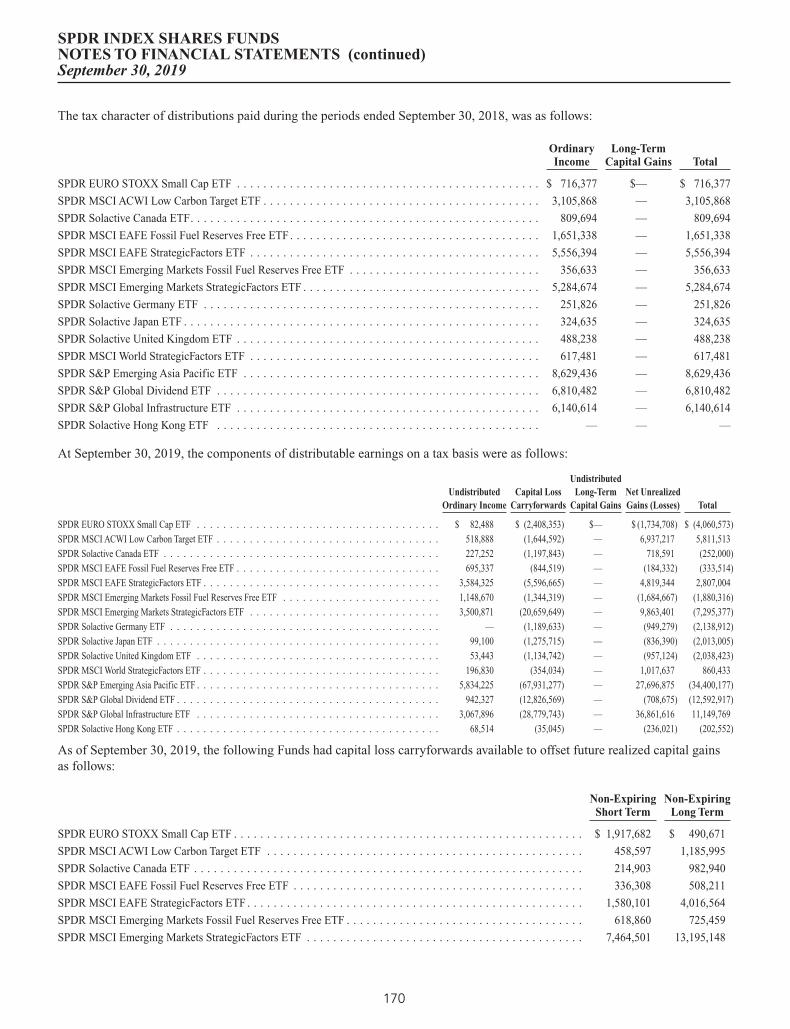
The tax character of distributions paid during the periods ended September 30, 2018, was as follows:
OrdinaryIncome
Long-TermCapital Gains Total
SPDR EURO STOXX Small Cap ETF . . . . . . . . . . . . . . . . . . . . . . . . . . . . . . . . . . . . . . . . . . . . . . $ 716,377 $— $ 716,377
SPDR MSCI ACWI Low Carbon Target ETF . . . . . . . . . . . . . . . . . . . . . . . . . . . . . . . . . . . . . . . . . . 3,105,868 — 3,105,868
SPDR Solactive Canada ETF. . . . . . . . . . . . . . . . . . . . . . . . . . . . . . . . . . . . . . . . . . . . . . . . . . . . . 809,694 — 809,694
SPDR MSCI EAFE Fossil Fuel Reserves Free ETF . . . . . . . . . . . . . . . . . . . . . . . . . . . . . . . . . . . . . . 1,651,338 — 1,651,338
SPDR MSCI EAFE StrategicFactors ETF . . . . . . . . . . . . . . . . . . . . . . . . . . . . . . . . . . . . . . . . . . . . 5,556,394 — 5,556,394
SPDR MSCI Emerging Markets Fossil Fuel Reserves Free ETF . . . . . . . . . . . . . . . . . . . . . . . . . . . . . 356,633 — 356,633
SPDR MSCI Emerging Markets StrategicFactors ETF . . . . . . . . . . . . . . . . . . . . . . . . . . . . . . . . . . . . 5,284,674 — 5,284,674
SPDR Solactive Germany ETF . . . . . . . . . . . . . . . . . . . . . . . . . . . . . . . . . . . . . . . . . . . . . . . . . . . 251,826 — 251,826
SPDR Solactive Japan ETF . . . . . . . . . . . . . . . . . . . . . . . . . . . . . . . . . . . . . . . . . . . . . . . . . . . . . . 324,635 — 324,635
SPDR Solactive United Kingdom ETF . . . . . . . . . . . . . . . . . . . . . . . . . . . . . . . . . . . . . . . . . . . . . . 488,238 — 488,238
SPDR MSCI World StrategicFactors ETF . . . . . . . . . . . . . . . . . . . . . . . . . . . . . . . . . . . . . . . . . . . . 617,481 — 617,481
SPDR S&P Emerging Asia Pacific ETF . . . . . . . . . . . . . . . . . . . . . . . . . . . . . . . . . . . . . . . . . . . . . 8,629,436 — 8,629,436
SPDR S&P Global Dividend ETF . . . . . . . . . . . . . . . . . . . . . . . . . . . . . . . . . . . . . . . . . . . . . . . . . 6,810,482 — 6,810,482
SPDR S&P Global Infrastructure ETF . . . . . . . . . . . . . . . . . . . . . . . . . . . . . . . . . . . . . . . . . . . . . . 6,140,614 — 6,140,614
SPDR Solactive Hong Kong ETF . . . . . . . . . . . . . . . . . . . . . . . . . . . . . . . . . . . . . . . . . . . . . . . . . — — —
At September 30, 2019, the components of distributable earnings on a tax basis were as follows:
UndistributedOrdinary Income
Capital LossCarryforwards
UndistributedLong-Term
Capital GainsNet UnrealizedGains (Losses) Total
SPDR EURO STOXX Small Cap ETF . . . . . . . . . . . . . . . . . . . . . . . . . . . . . . . . . . . . . $ 82,488 $ (2,408,353) $— $ (1,734,708) $ (4,060,573)
SPDR MSCI ACWI Low Carbon Target ETF . . . . . . . . . . . . . . . . . . . . . . . . . . . . . . . . . . 518,888 (1,644,592) — 6,937,217 5,811,513
SPDR Solactive Canada ETF . . . . . . . . . . . . . . . . . . . . . . . . . . . . . . . . . . . . . . . . . . 227,252 (1,197,843) — 718,591 (252,000)
SPDR MSCI EAFE Fossil Fuel Reserves Free ETF . . . . . . . . . . . . . . . . . . . . . . . . . . . . . . . 695,337 (844,519) — (184,332) (333,514)
SPDR MSCI EAFE StrategicFactors ETF . . . . . . . . . . . . . . . . . . . . . . . . . . . . . . . . . . . . 3,584,325 (5,596,665) — 4,819,344 2,807,004
SPDR MSCI Emerging Markets Fossil Fuel Reserves Free ETF . . . . . . . . . . . . . . . . . . . . . . . . 1,148,670 (1,344,319) — (1,684,667) (1,880,316)
SPDR MSCI Emerging Markets StrategicFactors ETF . . . . . . . . . . . . . . . . . . . . . . . . . . . . . 3,500,871 (20,659,649) — 9,863,401 (7,295,377)
SPDR Solactive Germany ETF . . . . . . . . . . . . . . . . . . . . . . . . . . . . . . . . . . . . . . . . . — (1,189,633) — (949,279) (2,138,912)
SPDR Solactive Japan ETF . . . . . . . . . . . . . . . . . . . . . . . . . . . . . . . . . . . . . . . . . . . 99,100 (1,275,715) — (836,390) (2,013,005)
SPDR Solactive United Kingdom ETF . . . . . . . . . . . . . . . . . . . . . . . . . . . . . . . . . . . . . 53,443 (1,134,742) — (957,124) (2,038,423)
SPDR MSCI World StrategicFactors ETF . . . . . . . . . . . . . . . . . . . . . . . . . . . . . . . . . . . . 196,830 (354,034) — 1,017,637 860,433
SPDR S&P Emerging Asia Pacific ETF . . . . . . . . . . . . . . . . . . . . . . . . . . . . . . . . . . . . . 5,834,225 (67,931,277) — 27,696,875 (34,400,177)
SPDR S&P Global Dividend ETF . . . . . . . . . . . . . . . . . . . . . . . . . . . . . . . . . . . . . . . . 942,327 (12,826,569) — (708,675) (12,592,917)
SPDR S&P Global Infrastructure ETF . . . . . . . . . . . . . . . . . . . . . . . . . . . . . . . . . . . . . 3,067,896 (28,779,743) — 36,861,616 11,149,769
SPDR Solactive Hong Kong ETF . . . . . . . . . . . . . . . . . . . . . . . . . . . . . . . . . . . . . . . . 68,514 (35,045) — (236,021) (202,552)
As of September 30, 2019, the following Funds had capital loss carryforwards available to offset future realized capital gainsas follows:
Non-ExpiringShort Term
Non-ExpiringLong Term
SPDR EURO STOXX Small Cap ETF . . . . . . . . . . . . . . . . . . . . . . . . . . . . . . . . . . . . . . . . . . . . . . . . . . . . . $ 1,917,682 $ 490,671
SPDR MSCI ACWI Low Carbon Target ETF . . . . . . . . . . . . . . . . . . . . . . . . . . . . . . . . . . . . . . . . . . . . . . . . 458,597 1,185,995
SPDR Solactive Canada ETF . . . . . . . . . . . . . . . . . . . . . . . . . . . . . . . . . . . . . . . . . . . . . . . . . . . . . . . . . . . 214,903 982,940
SPDR MSCI EAFE Fossil Fuel Reserves Free ETF . . . . . . . . . . . . . . . . . . . . . . . . . . . . . . . . . . . . . . . . . . . . 336,308 508,211
SPDR MSCI EAFE StrategicFactors ETF . . . . . . . . . . . . . . . . . . . . . . . . . . . . . . . . . . . . . . . . . . . . . . . . . . . 1,580,101 4,016,564
SPDR MSCI Emerging Markets Fossil Fuel Reserves Free ETF . . . . . . . . . . . . . . . . . . . . . . . . . . . . . . . . . . . . 618,860 725,459
SPDR MSCI Emerging Markets StrategicFactors ETF . . . . . . . . . . . . . . . . . . . . . . . . . . . . . . . . . . . . . . . . . . 7,464,501 13,195,148
SPDR INDEX SHARES FUNDSNOTES TO FINANCIAL STATEMENTS (continued)September 30, 2019
170

Non-ExpiringShort Term
Non-ExpiringLong Term
SPDR Solactive Germany ETF . . . . . . . . . . . . . . . . . . . . . . . . . . . . . . . . . . . . . . . . . . . . . . . . . . . . . . . . . . $ 99,508 $ 1,090,125
SPDR Solactive Japan ETF . . . . . . . . . . . . . . . . . . . . . . . . . . . . . . . . . . . . . . . . . . . . . . . . . . . . . . . . . . . . 754,958 520,757
SPDR Solactive United Kingdom ETF . . . . . . . . . . . . . . . . . . . . . . . . . . . . . . . . . . . . . . . . . . . . . . . . . . . . . 399,974 734,768
SPDR MSCI World StrategicFactors ETF . . . . . . . . . . . . . . . . . . . . . . . . . . . . . . . . . . . . . . . . . . . . . . . . . . . 97,651 256,383
SPDR S&P Emerging Asia Pacific ETF . . . . . . . . . . . . . . . . . . . . . . . . . . . . . . . . . . . . . . . . . . . . . . . . . . . . 16,921,341 51,009,936
SPDR S&P Global Dividend ETF . . . . . . . . . . . . . . . . . . . . . . . . . . . . . . . . . . . . . . . . . . . . . . . . . . . . . . . . 8,738,277 4,088,292
SPDR S&P Global Infrastructure ETF . . . . . . . . . . . . . . . . . . . . . . . . . . . . . . . . . . . . . . . . . . . . . . . . . . . . . 3,057,959 25,721,784
SPDR Solactive Hong Kong ETF . . . . . . . . . . . . . . . . . . . . . . . . . . . . . . . . . . . . . . . . . . . . . . . . . . . . . . . . 35,045 —
As of September 30, 2019, gross unrealized appreciation and gross unrealized depreciation of investments and other financialinstruments based on cost for federal income tax purposes were as follows:
TaxCost
GrossUnrealized
Appreciation
GrossUnrealized
Depreciation
Net UnrealizedAppreciation
(Depreciation)
SPDR EURO STOXX Small Cap ETF . . . . . . . . . . . . . . . . . . . . . . . . . . . . . . . . . . . . . . . . . . . . . . . . . $ 19,044,872 $ 803,839 $ 2,536,273 $ (1,732,434)
SPDR MSCI ACWI Low Carbon Target ETF . . . . . . . . . . . . . . . . . . . . . . . . . . . . . . . . . . . . . . . . . . . . . . 77,142,629 12,273,233 5,329,773 6,943,460
SPDR Solactive Canada ETF . . . . . . . . . . . . . . . . . . . . . . . . . . . . . . . . . . . . . . . . . . . . . . . . . . . . . . 21,161,885 1,922,194 1,203,774 718,420
SPDR MSCI EAFE Fossil Fuel Reserves Free ETF . . . . . . . . . . . . . . . . . . . . . . . . . . . . . . . . . . . . . . . . . . . 87,665,309 7,446,391 7,625,492 (179,101)
SPDR MSCI EAFE StrategicFactors ETF . . . . . . . . . . . . . . . . . . . . . . . . . . . . . . . . . . . . . . . . . . . . . . . . 325,201,022 28,171,671 23,329,240 4,842,431
SPDR MSCI Emerging Markets Fossil Fuel Reserves Free ETF . . . . . . . . . . . . . . . . . . . . . . . . . . . . . . . . . . . . 72,520,728 3,901,588 5,573,139 (1,671,551)
SPDR MSCI Emerging Markets StrategicFactors ETF . . . . . . . . . . . . . . . . . . . . . . . . . . . . . . . . . . . . . . . . . 258,864,921 35,519,926 25,332,066 10,187,860
SPDR Solactive Germany ETF . . . . . . . . . . . . . . . . . . . . . . . . . . . . . . . . . . . . . . . . . . . . . . . . . . . . . 9,034,649 365,774 1,309,950 (944,176)
SPDR Solactive Japan ETF . . . . . . . . . . . . . . . . . . . . . . . . . . . . . . . . . . . . . . . . . . . . . . . . . . . . . . . 8,915,836 334,552 1,170,703 (836,151)
SPDR Solactive United Kingdom ETF . . . . . . . . . . . . . . . . . . . . . . . . . . . . . . . . . . . . . . . . . . . . . . . . . 11,806,959 429,734 1,386,626 (956,892)
SPDR MSCI World StrategicFactors ETF . . . . . . . . . . . . . . . . . . . . . . . . . . . . . . . . . . . . . . . . . . . . . . . . 23,355,238 2,277,247 1,258,789 1,018,458
SPDR S&P Emerging Asia Pacific ETF. . . . . . . . . . . . . . . . . . . . . . . . . . . . . . . . . . . . . . . . . . . . . . . . . 416,265,165 105,145,318 77,447,143 27,698,175
SPDR S&P Global Dividend ETF. . . . . . . . . . . . . . . . . . . . . . . . . . . . . . . . . . . . . . . . . . . . . . . . . . . . 290,302,289 14,048,218 14,749,035 (700,817)
SPDR S&P Global Infrastructure ETF . . . . . . . . . . . . . . . . . . . . . . . . . . . . . . . . . . . . . . . . . . . . . . . . . 364,263,491 48,141,400 11,278,521 36,862,879
SPDR Solactive Hong Kong ETF . . . . . . . . . . . . . . . . . . . . . . . . . . . . . . . . . . . . . . . . . . . . . . . . . . . . 7,574,150 343,542 579,542 (236,000)
8. Securities Lending
Each Fund may lend securities to qualified broker-dealers or institutional investors. The loans are secured at all times by cash,cash equivalents or U.S. government securities in an amount at least equal to the market value of the securities loaned, plusaccrued interest and dividends, determined on a daily basis and adjusted accordingly. The value of the collateral with respectto a loaned security may be temporarily more or less than the value of a security due to market fluctuations of securitiesvalues. With respect to each loan, if on any U.S. business day the aggregate market value of securities collateral plus cashcollateral is less than the aggregate market value of the securities which are subject to the loan, the borrower will be notified toprovide additional collateral on the next business day.
The Funds will regain record ownership of loaned securities to exercise certain beneficial rights; however, the Funds may bearthe risk of delay in recovery of, or even loss of rights in the securities loaned should the borrower fail financially. In addition, aFund will bear the risk of loss of any cash collateral that it may invest. Each Fund receives compensation for lending itssecurities from interest or dividends earned on the cash, cash equivalents or U.S. government securities held as collateral, netof fee rebates paid to the borrower and net of fees paid to State Street as the lending agent. Additionally, a Fund will receive afee from the borrower for non-cash collateral equal to a percentage of the market value of the loaned securities.
The market value of securities on loan as of September 30, 2019, and the value of the invested cash collateral are disclosed inthe Funds’ Statements of Assets and Liabilities. Non-cash collateral is not disclosed in the Funds’ Statements of Assets andLiabilities as it is held by the lending agent on behalf of the Funds, and the Funds do not have the ability to re-hypothecatethose securities. Securities lending income, as disclosed in the Funds’ Statements of Operations, represents the income earned
SPDR INDEX SHARES FUNDSNOTES TO FINANCIAL STATEMENTS (continued)September 30, 2019
171
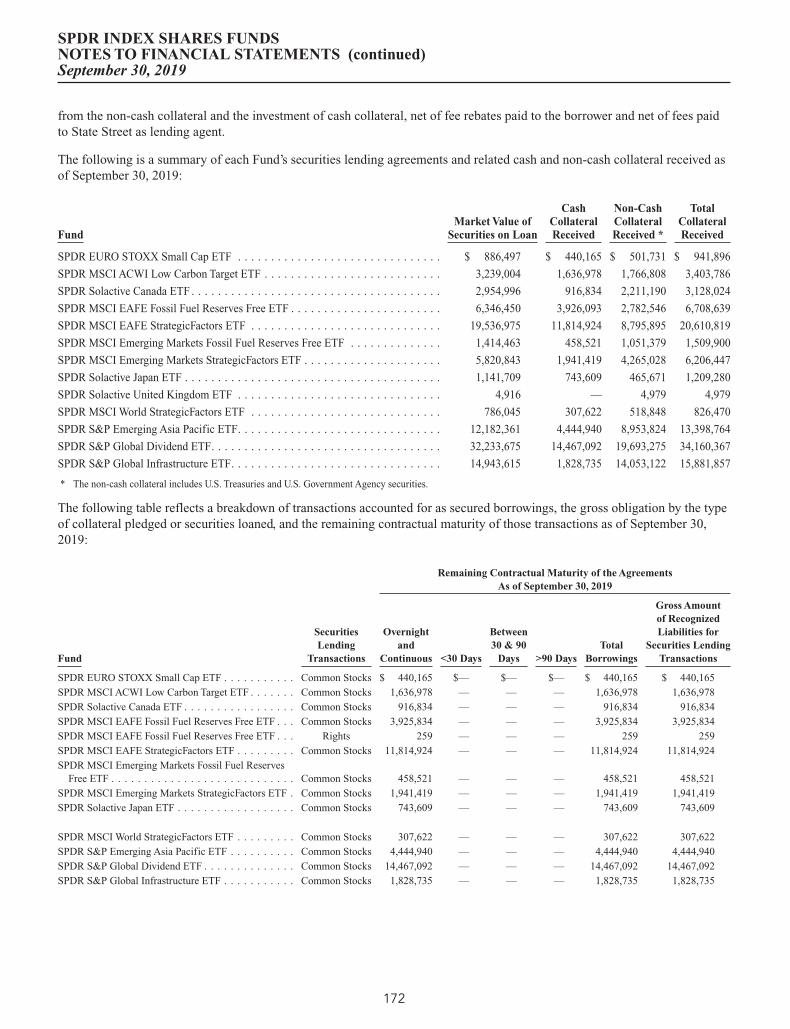
from the non-cash collateral and the investment of cash collateral, net of fee rebates paid to the borrower and net of fees paidto State Street as lending agent.
The following is a summary of each Fund’s securities lending agreements and related cash and non-cash collateral received asof September 30, 2019:
FundMarket Value of
Securities on Loan
CashCollateralReceived
Non-CashCollateralReceived *
TotalCollateralReceived
SPDR EURO STOXX Small Cap ETF . . . . . . . . . . . . . . . . . . . . . . . . . . . . . . . $ 886,497 $ 440,165 $ 501,731 $ 941,896
SPDR MSCI ACWI Low Carbon Target ETF . . . . . . . . . . . . . . . . . . . . . . . . . . . 3,239,004 1,636,978 1,766,808 3,403,786
SPDR Solactive Canada ETF . . . . . . . . . . . . . . . . . . . . . . . . . . . . . . . . . . . . . . 2,954,996 916,834 2,211,190 3,128,024
SPDR MSCI EAFE Fossil Fuel Reserves Free ETF . . . . . . . . . . . . . . . . . . . . . . . 6,346,450 3,926,093 2,782,546 6,708,639
SPDR MSCI EAFE StrategicFactors ETF . . . . . . . . . . . . . . . . . . . . . . . . . . . . . 19,536,975 11,814,924 8,795,895 20,610,819
SPDR MSCI Emerging Markets Fossil Fuel Reserves Free ETF . . . . . . . . . . . . . . 1,414,463 458,521 1,051,379 1,509,900
SPDR MSCI Emerging Markets StrategicFactors ETF . . . . . . . . . . . . . . . . . . . . . 5,820,843 1,941,419 4,265,028 6,206,447
SPDR Solactive Japan ETF . . . . . . . . . . . . . . . . . . . . . . . . . . . . . . . . . . . . . . . 1,141,709 743,609 465,671 1,209,280
SPDR Solactive United Kingdom ETF . . . . . . . . . . . . . . . . . . . . . . . . . . . . . . . 4,916 — 4,979 4,979
SPDR MSCI World StrategicFactors ETF . . . . . . . . . . . . . . . . . . . . . . . . . . . . . 786,045 307,622 518,848 826,470
SPDR S&P Emerging Asia Pacific ETF. . . . . . . . . . . . . . . . . . . . . . . . . . . . . . . 12,182,361 4,444,940 8,953,824 13,398,764
SPDR S&P Global Dividend ETF. . . . . . . . . . . . . . . . . . . . . . . . . . . . . . . . . . . 32,233,675 14,467,092 19,693,275 34,160,367
SPDR S&P Global Infrastructure ETF. . . . . . . . . . . . . . . . . . . . . . . . . . . . . . . . 14,943,615 1,828,735 14,053,122 15,881,857
* The non-cash collateral includes U.S. Treasuries and U.S. Government Agency securities.
The following table reflects a breakdown of transactions accounted for as secured borrowings, the gross obligation by the typeof collateral pledged or securities loaned, and the remaining contractual maturity of those transactions as of September 30,2019:
Remaining Contractual Maturity of the AgreementsAs of September 30, 2019
Fund
SecuritiesLending
Transactions
Overnightand
Continuous <30 Days
Between30 & 90
Days >90 DaysTotal
Borrowings
Gross Amountof RecognizedLiabilities for
Securities LendingTransactions
SPDR EURO STOXX Small Cap ETF . . . . . . . . . . . Common Stocks $ 440,165 $— $— $— $ 440,165 $ 440,165
SPDR MSCI ACWI Low Carbon Target ETF . . . . . . . Common Stocks 1,636,978 — — — 1,636,978 1,636,978
SPDR Solactive Canada ETF . . . . . . . . . . . . . . . . . Common Stocks 916,834 — — — 916,834 916,834
SPDR MSCI EAFE Fossil Fuel Reserves Free ETF . . . Common Stocks 3,925,834 — — — 3,925,834 3,925,834
SPDR MSCI EAFE Fossil Fuel Reserves Free ETF . . . Rights 259 — — — 259 259
SPDR MSCI EAFE StrategicFactors ETF . . . . . . . . . Common Stocks 11,814,924 — — — 11,814,924 11,814,924
SPDR MSCI Emerging Markets Fossil Fuel ReservesFree ETF . . . . . . . . . . . . . . . . . . . . . . . . . . . . Common Stocks 458,521 — — — 458,521 458,521
SPDR MSCI Emerging Markets StrategicFactors ETF . Common Stocks 1,941,419 — — — 1,941,419 1,941,419
SPDR Solactive Japan ETF . . . . . . . . . . . . . . . . . . Common Stocks 743,609 — — — 743,609 743,609
SPDR MSCI World StrategicFactors ETF . . . . . . . . . Common Stocks 307,622 — — — 307,622 307,622
SPDR S&P Emerging Asia Pacific ETF . . . . . . . . . . Common Stocks 4,444,940 — — — 4,444,940 4,444,940
SPDR S&P Global Dividend ETF . . . . . . . . . . . . . . Common Stocks 14,467,092 — — — 14,467,092 14,467,092
SPDR S&P Global Infrastructure ETF . . . . . . . . . . . Common Stocks 1,828,735 — — — 1,828,735 1,828,735
SPDR INDEX SHARES FUNDSNOTES TO FINANCIAL STATEMENTS (continued)September 30, 2019
172

9. Line of Credit
Certain Funds and other affiliated funds (each a “Participant” and, collectively, the “Participants”) participate in a$500 million revolving credit facility provided by a syndication of banks under which the Participants may borrow to fundshareholder redemptions. This agreement expires in October 2020 unless extended or renewed.
The following Funds participate in the credit facility as of September 30, 2019:
SPDR MSCI ACWI Low Carbon Target ETFSPDR MSCI Emerging Markets Fossil Fuel Reserves Free
ETFSPDR MSCI Emerging Markets StrategicFactors ETFSPDR S&P Emerging Asia Pacific ETF
The Funds had no outstanding loans as of September 30, 2019.
The Participants are charged an annual commitment fee which is calculated based on the unused portion of the shared creditline. Commitment fees are allocated among each of the Participants based on relative net assets. Commitment fees areordinary fund operating expenses paid by the Adviser. A Participant incurs and pays the interest expense related to itsborrowing. Interest is calculated at a rate per annum equal to the sum of 1% plus the greater of the New York Fed Bank Rateand 1-month LIBOR rate.
10. Risks
Concentration Risk
As a result of the Funds’ ability to invest a large percentage of their assets in obligations of issuers within the same country,state, region, currency or economic sector, an adverse economic, business or political development may affect the value of theFunds’ investments more than if the Funds were more broadly diversified.
Foreign and Emerging Markets Risk
Investing in foreign markets involves risks and considerations not typically associated with investing in the U.S. Foreignsecurities may be subject to risk of loss because of government regulation, economic, political and social instability in thecountries in which the Funds invest. Foreign markets may be less liquid than investments in the U.S. and may be subject to therisks of currency fluctuations. To the extent that a Fund invests in securities of issuers located in emerging markets, these risksmay be even more pronounced.
Market and Credit Risk
In the normal course of business, the Funds trade financial instruments and enter into financial transactions where risk ofpotential loss exists due to changes in the general economic conditions and fluctuations of the market (market risk).Additionally, a Fund may also be exposed to credit risk in the event that an issuer or guarantor fails to perform or that aninstitution or entity with which the Fund has unsettled or open transactions defaults.
11. Subsequent Events
Management has evaluated the impact of all subsequent events on the Funds through the date the financial statements wereissued and has determined that there were no subsequent events requiring adjustment or disclosure in the financial statements.
SPDR INDEX SHARES FUNDSNOTES TO FINANCIAL STATEMENTS (continued)September 30, 2019
173

To the Board of Trustees of SPDR Index Shares Funds and Shareholders of each of the fifteen funds listed below
Opinions on the Financial Statements
We have audited the accompanying statements of assets and liabilities, including the schedules of investments or summaryschedules of investments as indicated with an * below, of each of the funds listed below (fifteen of the funds constitutingSPDR Index Shares Funds, hereafter collectively referred to as the �Funds�) as of September 30, 2019, the related statementsof operations and of changes in net assets for each of the periods indicated below, including the related notes, and the financialhighlights for each of the periods indicated therein (collectively referred to as the “financial statements”). In our opinion, thefinancial statements present fairly, in all material respects, the financial position of each of the Funds as of September 30,2019, the results of each of their operations and the changes in each of their net assets for each of the periods indicated below,and each of the financial highlights for each of the periods indicated therein in conformity with accounting principlesgenerally accepted in the United States of America.
SPDR EURO STOXX Small Cap ETF (1)
SPDR MSCI ACWI Low Carbon Target ETF (1)*
SPDR Solactive Canada ETF (1)
SPDR MSCI EAFE Fossil Fuel Reserves Free ETF (1)
SPDR MSCI EAFE StrategicFactors ETF (1)
SPDR MSCI Emerging Markets Fossil Fuel Reserves Free ETF (1)
SPDR MSCI Emerging Markets StrategicFactors ETF (1)*
SPDR Solactive Germany ETF (1)
SPDR Solactive Japan ETF (1)
SPDR Solactive United Kingdom ETF (1)
SPDR MSCI World StrategicFactors ETF (1)*
SPDR S&P Emerging Asia Pacific ETF (1)
SPDR S&P Global Dividend ETF (1)
SPDR S&P Global Infrastructure ETF (1)
SPDR Solactive Hong Kong ETF (2)
(1) Statement of operations for the year ended September 30, 2019 and statements of changes in net assets for the years endedSeptember 30, 2019 and 2018
(2) Statement of operations for the year ended September 30, 2019 and statements of changes in net assets for the year endedSeptember 30, 2019 and for the period September 18, 2018 (inception date) through September 30, 2018
Basis for Opinions
These financial statements are the responsibility of the Funds’ management. Our responsibility is to express an opinion on theFunds’ financial statements based on our audits. We are a public accounting firm registered with the Public CompanyAccounting Oversight Board (United States) (“PCAOB”) and are required to be independent with respect to the Funds inaccordance with the U.S. federal securities laws and the applicable rules and regulations of the Securities and ExchangeCommission and the PCAOB.
REPORT OF INDEPENDENT REGISTERED PUBLIC ACCOUNTING FIRM
174

We conducted our audits of these financial statements in accordance with the standards of the PCAOB. Those standardsrequire that we plan and perform the audit to obtain reasonable assurance about whether the financial statements are free ofmaterial misstatement, whether due to error or fraud.
Our audits included performing procedures to assess the risks of material misstatement of the financial statements, whetherdue to error or fraud, and performing procedures that respond to those risks. Such procedures included examining, on a testbasis, evidence regarding the amounts and disclosures in the financial statements. Our audits also included evaluating theaccounting principles used and significant estimates made by management, as well as evaluating the overall presentation ofthe financial statements. Our procedures included confirmation of securities owned as of September 30, 2019 bycorrespondence with the custodian and brokers; when replies were not received from brokers, we performed other auditingprocedures. We believe that our audits provide a reasonable basis for our opinions.
/s/PricewaterhouseCoopers LLPBoston, MassachusettsNovember 26, 2019
We have served as the auditor of one or more investment companies in the SPDR Funds since 1993.
REPORT OF INDEPENDENT REGISTERED PUBLIC ACCOUNTING FIRM
175

Expense Example
As a shareholder of a Fund, you incur two types of costs: (1) transaction costs, including sales charges (loads), if applicable,on purchase payments, reinvested dividends, or other distributions and (2) ongoing costs, including advisory fees and otherFund expenses. This example is intended to help you understand your ongoing costs (in dollars) of investing in the Fund andto compare these costs with the ongoing costs of investing in other mutual funds. It is based on an investment of $1,000 madeat the beginning of the period shown and held for the entire period from April 1, 2019 to September 30, 2019.
The table below illustrates your Fund’s cost in two ways:
Based on actual fund return ——This section helps you to estimate the actual expenses that you paid over the period. The“Ending Account Value” shown is derived from each Fund’s actual return, and the third column shows the dollar amount thatwould have been paid by an investor who started with $1,000 in the Fund. You may use the information here, together with theamount you invested, to estimate the expenses that you paid over the period. To do so, simply divide your account value by$1,000 (for example, an $8,600 account value divided by $1,000 = 8.6), then multiply the result by the number given for theFund under the heading “Expenses Paid During Period”.
Based on hypothetical 5% return ——This section is intended to help you compare your Fund’s costs with those of othermutual funds. It assumes that the Fund had a yearly return of 5% before expenses, but that the expense ratio is unchanged. Inthis case, because the return used is not the Fund’s actual return, the results do not apply to your investment. The example isuseful in making comparisons because the U.S. Securities and Exchange Commission (the “SEC”) requires all mutual funds tocalculate expenses based on a 5% return. You can assess your Fund’s costs by comparing this hypothetical example with thehypothetical examples that appear in shareholder reports of other funds.
Please note that the expenses shown in the table are meant to highlight your ongoing costs only and do not reflect anytransaction costs, such as sales load charges (loads). Therefore, the hypothetical 5% return section of the table is useful incomparing ongoing costs only, and will not help you determine the relative total costs of owning different funds. In addition, ifthese transaction costs were included, your costs would have been higher.
ActualHypothetical (assuming a 5%
return before expenses)
AnnualizedExpense Ratio
Ending AccountValue
Expenses PaidDuring
Period(a)Ending Account
Value
Expenses PaidDuring
Period(a)
SPDR EURO STOXX Small Cap ETF . . . . . . . . . . . . . . . . 0.45% $1,025.80 $2.29 $1,022.80 $2.28
SPDR MSCI ACWI Low Carbon Target ETF . . . . . . . . . . . . 0.20 1,042.70 1.02 1,024.10 1.01
SPDR Solactive Canada ETF . . . . . . . . . . . . . . . . . . . . . . 0.14 1,058.20 0.72 1,024.40 0.71
SPDR MSCI EAFE Fossil Fuel Reserves Free ETF . . . . . . . . 0.20 1,033.10 1.02 1,024.10 1.01
SPDR MSCI EAFE StrategicFactors ETF . . . . . . . . . . . . . . 0.30 1,031.60 1.53 1,023.60 1.52
SPDR MSCI Emerging Markets Fossil Fuel Reserves Free
ETF . . . . . . . . . . . . . . . . . . . . . . . . . . . . . . . . . . . . 0.30 962.10 1.48 1,023.60 1.52
SPDR MSCI Emerging Markets StrategicFactors ETF . . . . . . 0.30 982.10 1.49 1,023.60 1.52
SPDR Solactive Germany ETF. . . . . . . . . . . . . . . . . . . . . 0.14 1,027.80 0.71 1,024.40 0.71
SPDR Solactive Japan ETF . . . . . . . . . . . . . . . . . . . . . . . 0.14 1,039.30 0.72 1,024.40 0.71
SPDR Solactive United Kingdom ETF . . . . . . . . . . . . . . . . 0.14 986.60 0.70 1,024.40 0.71
SPDR MSCI World StrategicFactors ETF . . . . . . . . . . . . . . 0.30 1,056.30 1.55 1,023.60 1.52
SPDR S&P Emerging Asia Pacific ETF . . . . . . . . . . . . . . . 0.49 955.00 2.40 1,022.60 2.48
SPDR S&P Global Dividend ETF . . . . . . . . . . . . . . . . . . . 0.40 1,041.40 2.05 1,023.10 2.03
SPDR S&P Global Infrastructure ETF . . . . . . . . . . . . . . . . 0.40 1,054.30 2.06 1,023.10 2.03
SPDR Solactive Hong Kong ETF . . . . . . . . . . . . . . . . . . . 0.14 897.90 0.67 1,024.40 0.71
(a) Expenses are equal to the Fund’s annualized net expense ratio multiplied by the average account value of the period, multiplied by 183, then divided by 365.
SPDR INDEX SHARES FUNDSOTHER INFORMATIONSeptember 30, 2019 (Unaudited)
176
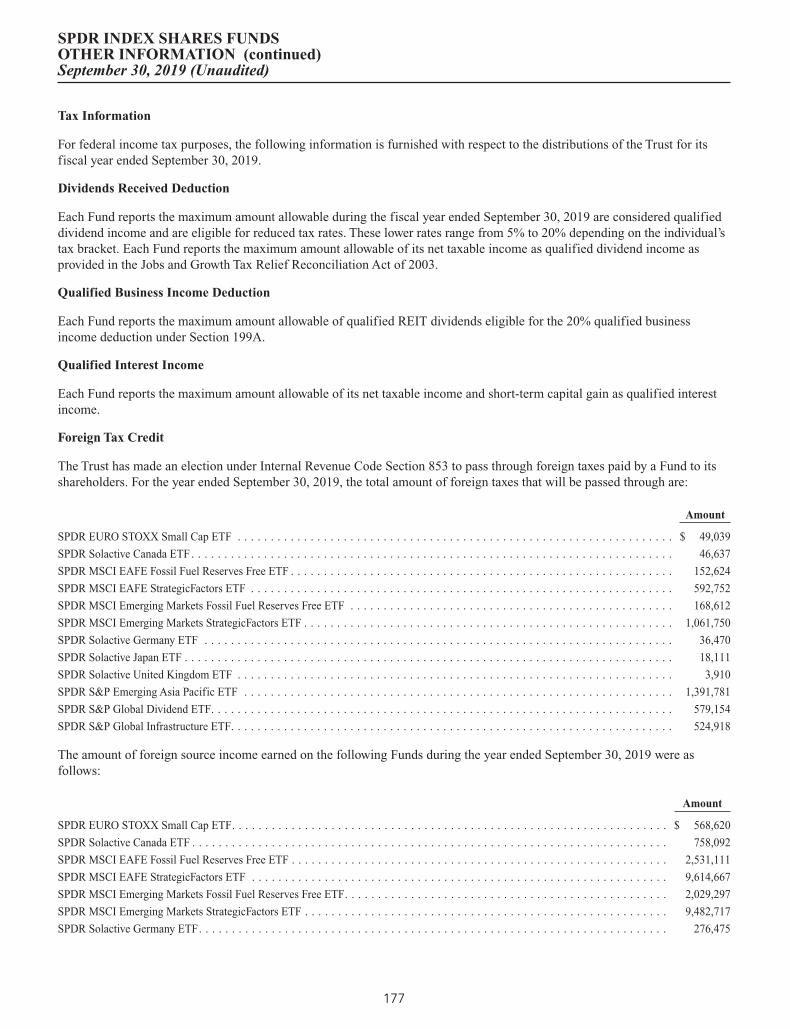
Tax Information
For federal income tax purposes, the following information is furnished with respect to the distributions of the Trust for itsfiscal year ended September 30, 2019.
Dividends Received Deduction
Each Fund reports the maximum amount allowable during the fiscal year ended September 30, 2019 are considered qualifieddividend income and are eligible for reduced tax rates. These lower rates range from 5% to 20% depending on the individual’stax bracket. Each Fund reports the maximum amount allowable of its net taxable income as qualified dividend income asprovided in the Jobs and Growth Tax Relief Reconciliation Act of 2003.
Qualified Business Income Deduction
Each Fund reports the maximum amount allowable of qualified REIT dividends eligible for the 20% qualified businessincome deduction under Section 199A.
Qualified Interest Income
Each Fund reports the maximum amount allowable of its net taxable income and short-term capital gain as qualified interestincome.
Foreign Tax Credit
The Trust has made an election under Internal Revenue Code Section 853 to pass through foreign taxes paid by a Fund to itsshareholders. For the year ended September 30, 2019, the total amount of foreign taxes that will be passed through are:
Amount
SPDR EURO STOXX Small Cap ETF . . . . . . . . . . . . . . . . . . . . . . . . . . . . . . . . . . . . . . . . . . . . . . . . . . . . . . . . . . . . . . . . . . $ 49,039
SPDR Solactive Canada ETF. . . . . . . . . . . . . . . . . . . . . . . . . . . . . . . . . . . . . . . . . . . . . . . . . . . . . . . . . . . . . . . . . . . . . . . . . 46,637
SPDR MSCI EAFE Fossil Fuel Reserves Free ETF . . . . . . . . . . . . . . . . . . . . . . . . . . . . . . . . . . . . . . . . . . . . . . . . . . . . . . . . . . 152,624
SPDR MSCI EAFE StrategicFactors ETF . . . . . . . . . . . . . . . . . . . . . . . . . . . . . . . . . . . . . . . . . . . . . . . . . . . . . . . . . . . . . . . . 592,752
SPDR MSCI Emerging Markets Fossil Fuel Reserves Free ETF . . . . . . . . . . . . . . . . . . . . . . . . . . . . . . . . . . . . . . . . . . . . . . . . . 168,612
SPDR MSCI Emerging Markets StrategicFactors ETF . . . . . . . . . . . . . . . . . . . . . . . . . . . . . . . . . . . . . . . . . . . . . . . . . . . . . . . . 1,061,750
SPDR Solactive Germany ETF . . . . . . . . . . . . . . . . . . . . . . . . . . . . . . . . . . . . . . . . . . . . . . . . . . . . . . . . . . . . . . . . . . . . . . . 36,470
SPDR Solactive Japan ETF . . . . . . . . . . . . . . . . . . . . . . . . . . . . . . . . . . . . . . . . . . . . . . . . . . . . . . . . . . . . . . . . . . . . . . . . . . 18,111
SPDR Solactive United Kingdom ETF . . . . . . . . . . . . . . . . . . . . . . . . . . . . . . . . . . . . . . . . . . . . . . . . . . . . . . . . . . . . . . . . . . 3,910
SPDR S&P Emerging Asia Pacific ETF . . . . . . . . . . . . . . . . . . . . . . . . . . . . . . . . . . . . . . . . . . . . . . . . . . . . . . . . . . . . . . . . . 1,391,781
SPDR S&P Global Dividend ETF. . . . . . . . . . . . . . . . . . . . . . . . . . . . . . . . . . . . . . . . . . . . . . . . . . . . . . . . . . . . . . . . . . . . . . 579,154
SPDR S&P Global Infrastructure ETF. . . . . . . . . . . . . . . . . . . . . . . . . . . . . . . . . . . . . . . . . . . . . . . . . . . . . . . . . . . . . . . . . . . 524,918
The amount of foreign source income earned on the following Funds during the year ended September 30, 2019 were asfollows:
Amount
SPDR EURO STOXX Small Cap ETF. . . . . . . . . . . . . . . . . . . . . . . . . . . . . . . . . . . . . . . . . . . . . . . . . . . . . . . . . . . . . . . . . . $ 568,620
SPDR Solactive Canada ETF . . . . . . . . . . . . . . . . . . . . . . . . . . . . . . . . . . . . . . . . . . . . . . . . . . . . . . . . . . . . . . . . . . . . . . . . 758,092
SPDR MSCI EAFE Fossil Fuel Reserves Free ETF . . . . . . . . . . . . . . . . . . . . . . . . . . . . . . . . . . . . . . . . . . . . . . . . . . . . . . . . . 2,531,111
SPDR MSCI EAFE StrategicFactors ETF . . . . . . . . . . . . . . . . . . . . . . . . . . . . . . . . . . . . . . . . . . . . . . . . . . . . . . . . . . . . . . . 9,614,667
SPDR MSCI Emerging Markets Fossil Fuel Reserves Free ETF. . . . . . . . . . . . . . . . . . . . . . . . . . . . . . . . . . . . . . . . . . . . . . . . . 2,029,297
SPDR MSCI Emerging Markets StrategicFactors ETF . . . . . . . . . . . . . . . . . . . . . . . . . . . . . . . . . . . . . . . . . . . . . . . . . . . . . . . 9,482,717
SPDR Solactive Germany ETF. . . . . . . . . . . . . . . . . . . . . . . . . . . . . . . . . . . . . . . . . . . . . . . . . . . . . . . . . . . . . . . . . . . . . . . 276,475
SPDR INDEX SHARES FUNDSOTHER INFORMATION (continued)September 30, 2019 (Unaudited)
177

Amount
SPDR Solactive Japan ETF . . . . . . . . . . . . . . . . . . . . . . . . . . . . . . . . . . . . . . . . . . . . . . . . . . . . . . . . . . . . . . . . . . . . . . . . . $ 200,848
SPDR Solactive United Kingdom ETF . . . . . . . . . . . . . . . . . . . . . . . . . . . . . . . . . . . . . . . . . . . . . . . . . . . . . . . . . . . . . . . . . 499,640
SPDR S&P Emerging Asia Pacific ETF. . . . . . . . . . . . . . . . . . . . . . . . . . . . . . . . . . . . . . . . . . . . . . . . . . . . . . . . . . . . . . . . . 12,352,179
SPDR S&P Global Dividend ETF. . . . . . . . . . . . . . . . . . . . . . . . . . . . . . . . . . . . . . . . . . . . . . . . . . . . . . . . . . . . . . . . . . . . . 9,833,369
SPDR S&P Global Infrastructure ETF. . . . . . . . . . . . . . . . . . . . . . . . . . . . . . . . . . . . . . . . . . . . . . . . . . . . . . . . . . . . . . . . . . 8,914,750
Proxy Voting Policies and Procedures and Records
A description of the Trust’s proxy voting policies and procedures that are used by the Funds’ investment adviser to voteproxies relating to the Funds’ portfolio of securities are available (i) without charge, upon request by calling 1-866-787-2257(toll free) or (ii) on the SEC’s website at www.sec.gov.
Information regarding how the investment adviser voted for the 12-month period ended June 30, is available by August 31 ofeach year by calling the same number, on the SEC’s website at www.sec.gov, and on the Funds’ website at www.spdrs.com.
Quarterly Portfolio Schedule
Following the Funds’ first and third fiscal quarter-ends, a complete schedule of investments is filed with the SEC as an exhibiton Form N-PORT, which can be found on the SEC’s website at www.sec.gov. The Funds’ schedules of investments areavailable upon request, without charge, by calling 1-866-787-2257 (toll free) and on the Funds’ website at www.spdrs.com.
Full Portfolio Schedule
The complete schedule of portfolio holdings for the following Funds is available on the Funds’ website at www.spdrs.com,without charge, upon request by calling 1-866-787-2257 (toll-free) and on the SEC’s website at www.sec.gov.
SPDR MSCI ACWI Low Carbon Target ETF
SPDR MSCI Emerging Markets StrategicFactors ETF
SPDR MSCI World StrategicFactors ETF
Approval of Advisory Agreement
At an in-person meeting held prior to September 30, 2019, the Board of Trustees of the Trust (the “Board”) evaluatedproposals to continue the Investment Advisory Agreement (the “Agreement”) between the Trust and SSGA FundsManagement, Inc. (the “Adviser” or “SSGA FM”) with respect to the series of the Trust (collectively, the “SPDR ETFs”). TheTrustees who are not “interested persons” of the Trust within the meaning of the Investment Company Act of 1940, asamended (the “Independent Trustees”), also met separately to consider the Agreement. The Independent Trustees were advisedby their independent legal counsel throughout the process.
To evaluate the Agreement, the Board requested, and SSGA FM, the Trust’s investment adviser and administrator, and StateStreet Bank and Trust Company, the Trust’s sub-administrator, transfer agent and custodian (“State Street”) provided, suchmaterials as the Board, with the advice of counsel, deemed reasonably necessary. In deciding whether to approve theAgreement, the Board considered various factors, including the (i) nature, extent and quality of services provided by theAdviser with respect to the SPDR ETFs under the Agreement, (ii) investment performance of the SPDR ETFs, (iii) profitsrealized by the Adviser and its affiliates from its relationship with the Trust, (iv) fees charged to comparable funds, (v) otherbenefits to the Adviser, and (vi) extent to which economies of scale would be shared as the SPDR ETFs grow.
Nature, Extent and Quality of Services
The Board considered the nature, extent and quality of services provided by the Adviser. In doing so, the Trustees relied ontheir prior experience in overseeing the management of the Trust and materials provided prior to and at the meeting. TheBoard reviewed the Agreement and the Adviser’s responsibilities for managing investment operations of each of the SPDR
SPDR INDEX SHARES FUNDSOTHER INFORMATION (continued)September 30, 2019 (Unaudited)
178

ETFs in accordance with each SPDR ETF’s investment objectives and policies, and applicable legal and regulatoryrequirements. The Board appreciated the nature of the SPDR ETFs as exchange-traded funds and the experience and expertiseof the Adviser with exchange-traded funds. The Board considered the background and experience of the Adviser’s seniormanagement, including those individuals responsible for portfolio management and regulatory compliance of the SPDR ETFs.The Board also considered the portfolio management resources, structures and practices of the Adviser, including thoseassociated with monitoring and securing each SPDR ETF’s compliance with its investment objectives and policies and withapplicable laws and regulations. The Board also considered information about the Adviser’s best execution procedures andoverall investment management business, noting that the Adviser serves a wide range of clients across a broad spectrum ofasset classes. The Board looked at the Adviser’s general knowledge of the investment management business and that of itsaffiliates which make up State Street Global Advisors, through which the Adviser shares all of its senior personnel. The Boardconsidered that the Adviser and its affiliates constitute one of the world’s largest investment management enterprises forindexed products generally and exchange-traded funds in particular. The Board specifically considered the Adviser’sexperience in managing equity exchange-traded funds with index-based investment objectives.
Investment Performance
The Board then reviewed the SPDR ETFs’ performance, noting that the distinctive indexed investment objective of each of theSPDR ETFs made analysis of investment performance, in absolute terms, less of a priority than that which normally attachesto the performance of actively-managed funds. Instead, the Board focused on the extent to which each SPDR ETF achieved itsobjective as a passively-managed index fund. The Board reviewed information regarding the SPDR ETFs’ index tracking.
Profits Realized by the Adviser
The Board considered the profitability of the advisory arrangement with the SPDR ETFs to the Adviser, including data on theSPDR ETFs’ historical profitability to the Adviser. The Board, including the Independent Trustees with their independent legalcounsel, had the opportunity to discuss, with representatives of the Adviser and State Street, methodologies used in computingcosts that formed the bases of profitability calculations.
Fees Charged to Comparable Funds
The Board evaluated each SPDR ETF’s unitary fee through review of comparative information with respect to fees paid bysimilar funds – i.e., exchange-traded funds tracking similar equity indexes. The Board reviewed the universe of similarexchange-traded funds for each SPDR ETF based upon data independently obtained from Broadridge Financial Solutions, Inc.(formerly Lipper Analytical Services) and related comparative information for similar exchange-traded funds. In doing so, theBoard used a fund by fund analysis of the data.
Other Benefits
The Board also considered whether the Adviser or its affiliates benefited in other ways from its relationship with the Trust,noting that the Adviser does not maintain soft-dollar arrangements in connection with the Trust’s brokerage transactions.
Economies of Scale
The Board reviewed information regarding economies of scale or other efficiencies that may result as each SPDR ETF’s assetsgrow in size. The Board noted that the Agreement did not provide for breakpoints in each SPDR ETF’s advisory fee rates asassets of a SPDR ETF increase. However, the Board further noted the Adviser’s assertion that future economies of scale(among several factors) had been taken into consideration for the SPDR ETFs by fixing relatively low advisory fees,effectively sharing the benefits of lower fees with the SPDR ETFs from inception. The Adviser also asserted that one of thebenefits of the unitary fee was to provide an unvarying expense structure, which could be lost or diluted with the addition ofbreakpoints. The Board noted that it intends to continue to monitor fees as the SPDR ETFs grow in size and assess whetherfee breakpoints may be warranted.
Conclusion
SPDR INDEX SHARES FUNDSOTHER INFORMATION (continued)September 30, 2019 (Unaudited)
179

After weighing the foregoing factors, none of which was dispositive in itself and may have been weighed differently by eachTrustee, the Board, including the Independent Trustees voting separately, approved the Agreement for each SPDR ETF. TheBoard’s conclusions with respect to the factors were as follows: (a) the nature and extent of the services provided by theAdviser with respect to the SPDR ETFs were appropriate; (b) the performance and, more importantly, the index tracking, ofeach SPDR ETF had been satisfactory; (c) the Adviser’s unitary fee for each SPDR ETF, considered in relation to servicesprovided and in relation to fees charged to comparable funds, was fair and reasonable; (d) the profitability of the Trust’srelationships with the Adviser was not excessive; (e) any additional potential benefits to the Adviser or its affiliates were notof a magnitude to materially affect the Board’s conclusions; and (f) the fees paid to the Adviser adequately shared theeconomies of scale with respect to the SPDR ETFs by way of the relatively low fee structure of the Trust.
SPDR INDEX SHARES FUNDSOTHER INFORMATION (continued)September 30, 2019 (Unaudited)
180

TRUSTEES AND OFFICERS INFORMATION
Name, Addressand Year of Birth
Position(s)with Funds
Term ofOffice andLength of
Time Served
PrincipalOccupation(s)During Past
5 Years
Numberof
Portfoliosin FundComplexOverseen
byTrustee†
OtherDirectorships
Held by TrusteeDuring thePast 5 Years
TrusteesIndependent TrusteesFRANK NESVET
c/o SPDR Index Shares FundsOne Iron StreetBoston, MA 022101943
IndependentTrustee,Chairman,TrusteeCommitteeChair
Term: UnlimitedServed: sinceSeptember 2000
Retired. 125 None.
BONNY EUGENIA BOATMANc/o SPDR Index Shares FundsOne Iron StreetBoston, MA 022101950
IndependentTrustee
Term: UnlimitedServed: sinceApril 2010
Retired. 125 None.
DWIGHT D. CHURCHILLc/o SPDR Index Shares FundsOne Iron StreetBoston, MA 022101953
IndependentTrustee
Term: UnlimitedServed: sinceApril 2010
Self-employedconsultant since 2010;CEO and President,CFA Institute (June2014-January 2015).
125 AffiliatedManagers Group,Inc. (Director).
CARL G. VERBONCOEURc/o SPDR Index Shares FundsOne Iron StreetBoston, MA 022101952
IndependentTrustee,AuditCommitteeChair
Term: UnlimitedServed: sinceApril 2010
Self-employedconsultant since 2009.
125 The Motley FoolFunds Trust(Trustee).
CLARE S. RICHERc/o SPDR Index Shares FundsOne Iron StreetBoston, MA 022101958
IndependentTrustee
Term: UnlimitedServed: sinceJuly 2018
Chief FinancialOfficer, PutnamInvestments LLC(December 2008 –May 2017).
125 Putnam AcquisitionFinancing Inc.(Director); PutnamAcquisitionFinancing LLC(Director); PutnamGP Inc. (Director);Putnam InvestorServices, Inc.(Director); PutnamInvestments Limited(Director);University of NotreDame (Trustee).
SANDRA G. SPONEMc/o SPDR Index Shares FundsOne Iron StreetBoston, MA 022101958
IndependentTrustee
Term: UnlimitedServed: sinceJuly 2018
Chief FinancialOfficer, M.A.MortensonCompanies, Inc.(February 2007 –April 2017).
125 Guggenheim /Rydex Funds(Trustee).
SPDR INDEX SHARES FUNDSOTHER INFORMATION (continued)September 30, 2019 (Unaudited)
181
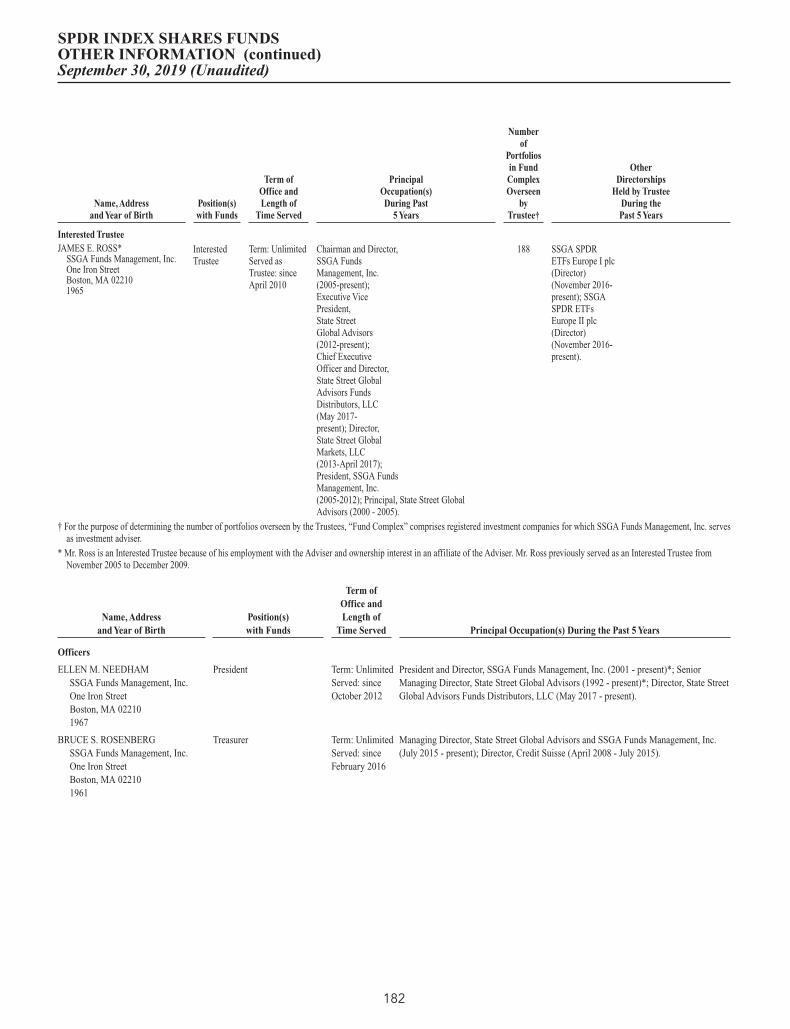
Name, Addressand Year of Birth
Position(s)with Funds
Term ofOffice andLength of
Time Served
PrincipalOccupation(s)During Past
5 Years
Numberof
Portfoliosin FundComplexOverseen
byTrustee†
OtherDirectorships
Held by TrusteeDuring thePast 5 Years
Interested TrusteeJAMES E. ROSS*
SSGA Funds Management, Inc.One Iron StreetBoston, MA 022101965
InterestedTrustee
Term: UnlimitedServed asTrustee: sinceApril 2010
Chairman and Director,SSGA FundsManagement, Inc.(2005-present);Executive VicePresident,State StreetGlobal Advisors(2012-present);Chief ExecutiveOfficer and Director,State Street GlobalAdvisors FundsDistributors, LLC(May 2017-present); Director,State Street GlobalMarkets, LLC(2013-April 2017);President, SSGA FundsManagement, Inc.(2005-2012); Principal, State Street GlobalAdvisors (2000 - 2005).
188 SSGA SPDRETFs Europe I plc(Director)(November 2016-present); SSGASPDR ETFsEurope II plc(Director)(November 2016-present).
† For the purpose of determining the number of portfolios overseen by the Trustees, “Fund Complex” comprises registered investment companies for which SSGA Funds Management, Inc. servesas investment adviser.
* Mr. Ross is an Interested Trustee because of his employment with the Adviser and ownership interest in an affiliate of the Adviser. Mr. Ross previously served as an Interested Trustee fromNovember 2005 to December 2009.
Name, Addressand Year of Birth
Position(s)with Funds
Term ofOffice andLength of
Time Served Principal Occupation(s) During the Past 5 Years
Officers
ELLEN M. NEEDHAMSSGA Funds Management, Inc.One Iron StreetBoston, MA 022101967
President Term: UnlimitedServed: sinceOctober 2012
President and Director, SSGA Funds Management, Inc. (2001 - present)*; SeniorManaging Director, State Street Global Advisors (1992 - present)*; Director, State StreetGlobal Advisors Funds Distributors, LLC (May 2017 - present).
BRUCE S. ROSENBERGSSGA Funds Management, Inc.One Iron StreetBoston, MA 022101961
Treasurer Term: UnlimitedServed: sinceFebruary 2016
Managing Director, State Street Global Advisors and SSGA Funds Management, Inc.(July 2015 - present); Director, Credit Suisse (April 2008 - July 2015).
SPDR INDEX SHARES FUNDSOTHER INFORMATION (continued)September 30, 2019 (Unaudited)
182

Name, Addressand Year of Birth
Position(s)with Funds
Term ofOffice andLength of
Time Served Principal Occupation(s) During the Past 5 Years
ANN M. CARPENTERSSGA Funds Management, Inc.One Iron StreetBoston, MA 022101966
VicePresident;DeputyTreasurer
Term: UnlimitedServed: sinceAugust 2012(witrh respecttoVicePresident);UnlimitedServed: sinceFebruary 2016(with respect toDeputyTreasurer)
Chief Operating Officer, SSGA Funds Management, Inc. (2005 - Present)*; ManagingDirector, State Street Global Advisors (2005 - present).*
MICHAEL P. RILEYSSGA Funds Management, Inc.One Iron StreetBoston, MA 022101969
VicePresident
Term: UnlimitedServed: sinceFebruary 2005
Managing Director, State Street Global Advisors (2005 - present).*
CHAD C. HALLETTSSGA Funds Management, Inc.One Iron StreetBoston, MA 022101969
DeputyTreasurer
Term: UnlimitedServed: sinceFebruary 2016
Vice President, State Street Global Advisors and SSGA Funds Management, Inc.(November 2014 - present); Vice President, State Street Bank and Trust Company (2001- November 2014).*
DARLENE ANDERSON-VASQUEZSSGA Funds Management, Inc.One Iron StreetBoston, MA 022101968
DeputyTreasurer
Term: UnlimitedServed: sinceNovember 2016
Managing Director, State Street Global Advisors and SSGA Funds Management, Inc.(May 2016 - present); Senior Vice President, John Hancock Investments (September2007 - May 2016).
ARTHUR A. JENSENSSGA Funds Management, Inc.1600 Summer StreetStamford, CT 069051966
DeputyTreasurer
Term: UnlimitedServed: SinceAugust 2017
Vice President at State Street Global Advisors (July 2016 – present); Mutual FundsController of GE Asset Management Incorporated (April 2011 - July 2016);
SUJATA UPRETISSGA Funds Management, Inc.One Iron StreetBoston, MA 022101974
AssistantTreasurer
Term: UnlimitedServed: sinceFebruary 2016
Vice President, State Street Global Advisors and SSGA Funds Management, Inc. (May2015 - present); Assistant Director, Cambridge Associates, LLC (July 2014 - January2015); Vice President, Bank of New York Mellon (July 2012 - August 2013); Manager,PricewaterhouseCoopers, LLP (September 2003 - July 2012).
DANIEL FOLEYSSGA Funds Management, Inc.One Iron StreetBoston, MA 022101972
AssistantTreasurer
Term: UnlimitedServed: sinceFebruary 2016
Vice President, State Street Global Advisors and SSGA Funds Management, Inc. (April2007 - present).*
DANIEL G. PLOURDESSGA Funds Management, Inc.One Iron StreetBoston, MA 022101980
AssistantTreasurer
Term: UnlimitedServed: sinceMay 2017
Vice President, State Street Global Advisors and SSGA Funds Management, Inc. (May2015 - present); Officer, State Street Bank and Trust Company (March 2009 - May2015).
SPDR INDEX SHARES FUNDSOTHER INFORMATION (continued)September 30, 2019 (Unaudited)
183
Name, Addressand Year of Birth
Position(s)with Funds
Term ofOffice andLength of
Time Served Principal Occupation(s) During the Past 5 Years
BRIAN HARRISSSGA Funds Management, Inc.One Iron StreetBoston, MA 022101973
Chief ComplianceOfficer; Anti-MoneyLaunderingOfficer; Code ofEthicsComplianceOfficer
Term: UnlimitedServed: sinceNovember 2013
Managing Director, State Street Global Advisors and SSGA Funds Management, Inc.(June 2013 - present)*; Senior Vice President and Global Head of InvestmentCompliance, BofA Global Capital Management (2010 - 2013).
SEAN O’MALLEYSSGA Funds Management, Inc.One Iron StreetBoston, MA 022101969
Chief LegalOfficer
Term: UnlimitedServed: sinceAugust 2019
Senior Vice President and Deputy General Counsel, State Street Global Advisors(November 2013 - present).
ANDREW DELORMESSGA Funds Management, Inc.One Iron StreetBoston, MA 022101975
Secretary Term: UnlimitedServed: sinceAugust 2019
Vice President and Senior Counsel, State Street Global Advisors (April 2016 - present);Vice President and Counsel, State Street Global Advisors (August 2014 - March 2016).
KEVIN MORRISSSGA Funds Management, Inc.One Iron StreetBoston, MA 022101982
Assistant Secretary Term: UnlimitedServed: sinceAugust 2019
Vice President and Senior Counsel, State Street Global Advisors (April 2019 - present);Vice President and Counsel, State Street Global Advisors (January 2016 - April 2019);Director, Asset Management Compliance, Fidelity Investments (June 2015 - January2016); Senior Compliance Advisor, Asset Management Compliance, FidelityInvestments (June 2012 - June 2015).
DAVID URMANSSGA Funds Management, Inc.One Iron StreetBoston, MA 022101985
Assistant Secretary Term: UnlimitedServed: sinceAugust 2019
Vice President and Senior Counsel, State Street Global Advisors (April 2019 - present);Vice President and Counsel, State Street Global Advisors (August 2015-April 2019);Associate, Ropes & Gray LLP (November 2012-August 2015).
* Served in various capacities and/or with various affiliated entities during noted time period.
The Trust’s Statement of Additional Information (SAI) includes additional information about the Funds’ directors and is available, without charge, upon request and by calling1-866-787-2257.
SPDR INDEX SHARES FUNDSOTHER INFORMATION (continued)September 30, 2019 (Unaudited)
184

[This Page Intentionally Left Blank]

[This Page Intentionally Left Blank]
SPDR® Index Shares Funds
SPDR Index Shares Funds
TrusteesBonny E. BoatmanDwight D. ChurchillFrank Nesvet, ChairmanClare S. RicherJames E. RossSandra G. SponemCarl G. Verboncoeur
Investment Manager and AdministratorSSGA Funds Management, Inc.One Iron StreetBoston, MA 02210
DistributorState Street Global Advisors Funds Distributors, LLCOne Iron StreetBoston, MA 02210
Custodian, Sub-Administratorand Transfer AgentState Street Bank and Trust CompanyOne Lincoln StreetBoston, MA 02111
Legal CounselMorgan, Lewis & Bockius LLP1111 Pennsylvania Avenue, NWWashington, DC 20004
Independent Registered Public AccountingFirmPricewaterhouseCoopers LLP101 Seaport BoulevardSuite 500Boston, MA 02210
The information contained in this report is intended for the general information of shareholders of the Trust. This reportis not authorized for distribution to prospective investors unless preceded or accompanied by a current Trust prospectuswhich contains important information concerning the Trust. You may obtain a current prospectus and SAI from theDistributor by calling 1-866-787-2257 or visiting www.spdrs.com. Please read the prospectus carefully before you invest.
SPDR® Index Shares Funds
For more complete information, please call 1.866.787.2257 or visit spdrs.com today.
ssga.com | spdrs.com
The Funds are not sponsored, endorsed, sold, or promoted byStoxx, S&P Dow Jones Indices LLC, MSCI Inc., or Solactive AG.Neither do these companies make any representationregarding the advisability of investing in the Funds. Shares ofthe Funds are not insured by the FDIC or by anothergovernmental agency; they are not obligations of the FDIC norare they deposits or obligations of or guaranteed by StateStreet Bank and Trust Company. Fund shares are subject toinvestment risks, including possible loss of the principalinvested.
Standard & Poor’s®, S&P® and SPDR® are registered trademarksof Standard & Poor’s Financial Services LLC (S&P); Dow Jones isa registered trademark of Dow Jones Trademark Holdings LLC(Dow Jones); and these trademarks have been licensed for useby S&P Dow Jones Indices LLC (SPDJI) and sublicensed forcertain purposes by State Street Corporation. State StreetCorporation’s financial products are not sponsored, endorsed,sold or promoted by SPDJI, Dow Jones, S&P, their respectiveaffiliates and third party licensors and none of such parties
make any representation regarding the advisability ofinvesting in such product(s) nor do they have any liability inrelation thereto, including for any errors, omissions, orinterruptions of any index.
Distributor: State Street Global Advisors FundsDistributors, LLC, member FINRA, SIPC, an indirectwholly-owned subsidiary of State Street Corporation.References to State Street may include State StreetCorporation and its affiliates. Certain State Street affiliatesprovide services and receive fees from the SPDR ETFs.
Before investing, consider a Fund's investment objective,risks, charges and expenses. To obtain a prospectus orsummary prospectus which contains this and otherinformation, call 1-866-787-2257 or visit www.spdrs.com.Read it carefully.
Not FDIC Insured • No Bank Guarantee • May Lose Value
The information contained in this report is intended for the general information of shareholders of the Trust. This report isnot authorized for distribution to prospective investors unless preceded or accompanied by a current Trust prospectus whichcontains important information concerning the Trust. You may obtain a current prospectus and SAI from the Distributor bycalling 1-866-787-2257 or visiting www.spdrs.com. Please read the prospectus carefully before you invest.
State Street Global Advisors© 2019 State Street Corporation - All Rights Reserved
0515 Exp. Date: 11/30/2020 SPDRIDEXAR
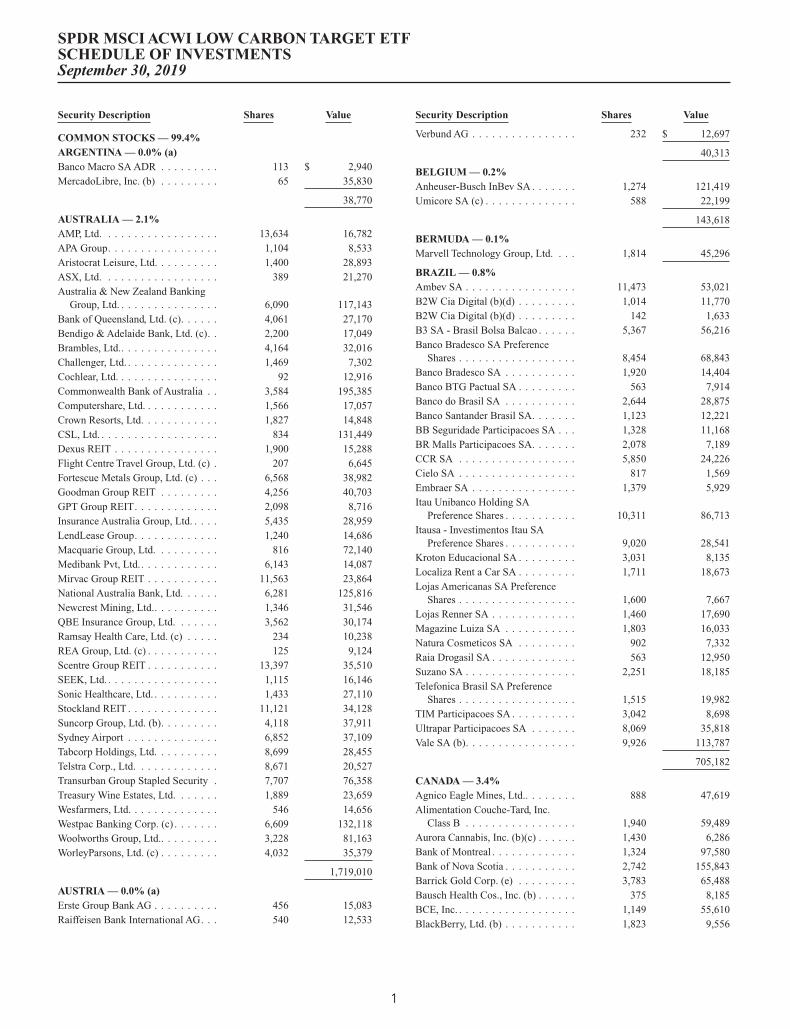
Security Description Shares Value
COMMON STOCKS — 99.4%ARGENTINA — 0.0% (a)Banco Macro SA ADR . . . . . . . . . 113 $ 2,940MercadoLibre, Inc. (b) . . . . . . . . . 65 35,830
38,770
AUSTRALIA — 2.1%AMP, Ltd. . . . . . . . . . . . . . . . . . 13,634 16,782APA Group. . . . . . . . . . . . . . . . . 1,104 8,533Aristocrat Leisure, Ltd. . . . . . . . . . 1,400 28,893ASX, Ltd. . . . . . . . . . . . . . . . . . 389 21,270Australia & New Zealand Banking
Group, Ltd. . . . . . . . . . . . . . . . 6,090 117,143Bank of Queensland, Ltd. (c). . . . . . 4,061 27,170Bendigo & Adelaide Bank, Ltd. (c). . 2,200 17,049Brambles, Ltd.. . . . . . . . . . . . . . . 4,164 32,016Challenger, Ltd. . . . . . . . . . . . . . . 1,469 7,302Cochlear, Ltd. . . . . . . . . . . . . . . . 92 12,916Commonwealth Bank of Australia . . 3,584 195,385Computershare, Ltd. . . . . . . . . . . . 1,566 17,057Crown Resorts, Ltd. . . . . . . . . . . . 1,827 14,848CSL, Ltd. . . . . . . . . . . . . . . . . . . 834 131,449Dexus REIT . . . . . . . . . . . . . . . . 1,900 15,288Flight Centre Travel Group, Ltd. (c) . 207 6,645Fortescue Metals Group, Ltd. (c) . . . 6,568 38,982Goodman Group REIT . . . . . . . . . 4,256 40,703GPT Group REIT. . . . . . . . . . . . . 2,098 8,716Insurance Australia Group, Ltd. . . . . 5,435 28,959LendLease Group. . . . . . . . . . . . . 1,240 14,686Macquarie Group, Ltd. . . . . . . . . . 816 72,140Medibank Pvt, Ltd.. . . . . . . . . . . . 6,143 14,087Mirvac Group REIT . . . . . . . . . . . 11,563 23,864National Australia Bank, Ltd. . . . . . 6,281 125,816Newcrest Mining, Ltd.. . . . . . . . . . 1,346 31,546QBE Insurance Group, Ltd. . . . . . . 3,562 30,174Ramsay Health Care, Ltd. (c) . . . . . 234 10,238REA Group, Ltd. (c) . . . . . . . . . . . 125 9,124Scentre Group REIT . . . . . . . . . . . 13,397 35,510SEEK, Ltd. . . . . . . . . . . . . . . . . . 1,115 16,146Sonic Healthcare, Ltd. . . . . . . . . . . 1,433 27,110Stockland REIT . . . . . . . . . . . . . . 11,121 34,128Suncorp Group, Ltd. (b). . . . . . . . . 4,118 37,911Sydney Airport . . . . . . . . . . . . . . 6,852 37,109Tabcorp Holdings, Ltd. . . . . . . . . . 8,699 28,455Telstra Corp., Ltd. . . . . . . . . . . . . 8,671 20,527Transurban Group Stapled Security . 7,707 76,358Treasury Wine Estates, Ltd. . . . . . . 1,889 23,659Wesfarmers, Ltd. . . . . . . . . . . . . . 546 14,656Westpac Banking Corp. (c) . . . . . . . 6,609 132,118Woolworths Group, Ltd.. . . . . . . . . 3,228 81,163WorleyParsons, Ltd. (c) . . . . . . . . . 4,032 35,379
1,719,010
AUSTRIA — 0.0% (a)Erste Group Bank AG . . . . . . . . . . 456 15,083Raiffeisen Bank International AG. . . 540 12,533
Security Description Shares Value
Verbund AG . . . . . . . . . . . . . . . . 232 $ 12,697
40,313
BELGIUM — 0.2%Anheuser-Busch InBev SA . . . . . . . 1,274 121,419Umicore SA (c) . . . . . . . . . . . . . . 588 22,199
143,618
BERMUDA — 0.1%Marvell Technology Group, Ltd. . . . 1,814 45,296
BRAZIL — 0.8%Ambev SA . . . . . . . . . . . . . . . . . 11,473 53,021B2W Cia Digital (b)(d) . . . . . . . . . 1,014 11,770B2W Cia Digital (b)(d) . . . . . . . . . 142 1,633B3 SA - Brasil Bolsa Balcao . . . . . . 5,367 56,216Banco Bradesco SA Preference
Shares . . . . . . . . . . . . . . . . . . 8,454 68,843Banco Bradesco SA . . . . . . . . . . . 1,920 14,404Banco BTG Pactual SA . . . . . . . . . 563 7,914Banco do Brasil SA . . . . . . . . . . . 2,644 28,875Banco Santander Brasil SA. . . . . . . 1,123 12,221BB Seguridade Participacoes SA . . . 1,328 11,168BR Malls Participacoes SA. . . . . . . 2,078 7,189CCR SA . . . . . . . . . . . . . . . . . . 5,850 24,226Cielo SA . . . . . . . . . . . . . . . . . . 817 1,569Embraer SA . . . . . . . . . . . . . . . . 1,379 5,929Itau Unibanco Holding SA
Preference Shares . . . . . . . . . . . 10,311 86,713Itausa - Investimentos Itau SA
Preference Shares . . . . . . . . . . . 9,020 28,541Kroton Educacional SA . . . . . . . . . 3,031 8,135Localiza Rent a Car SA . . . . . . . . . 1,711 18,673Lojas Americanas SA Preference
Shares . . . . . . . . . . . . . . . . . . 1,600 7,667Lojas Renner SA . . . . . . . . . . . . . 1,460 17,690Magazine Luiza SA . . . . . . . . . . . 1,803 16,033Natura Cosmeticos SA . . . . . . . . . 902 7,332Raia Drogasil SA . . . . . . . . . . . . . 563 12,950Suzano SA . . . . . . . . . . . . . . . . . 2,251 18,185Telefonica Brasil SA Preference
Shares . . . . . . . . . . . . . . . . . . 1,515 19,982TIM Participacoes SA . . . . . . . . . . 3,042 8,698Ultrapar Participacoes SA . . . . . . . 8,069 35,818Vale SA (b). . . . . . . . . . . . . . . . . 9,926 113,787
705,182
CANADA — 3.4%Agnico Eagle Mines, Ltd.. . . . . . . . 888 47,619Alimentation Couche-Tard, Inc.
Class B . . . . . . . . . . . . . . . . . 1,940 59,489Aurora Cannabis, Inc. (b)(c) . . . . . . 1,430 6,286Bank of Montreal . . . . . . . . . . . . . 1,324 97,580Bank of Nova Scotia . . . . . . . . . . . 2,742 155,843Barrick Gold Corp. (e) . . . . . . . . . 3,783 65,488Bausch Health Cos., Inc. (b) . . . . . . 375 8,185BCE, Inc. . . . . . . . . . . . . . . . . . . 1,149 55,610BlackBerry, Ltd. (b) . . . . . . . . . . . 1,823 9,556
SPDR MSCI ACWI LOW CARBON TARGET ETFSCHEDULE OF INVESTMENTSSeptember 30, 2019
1

Security Description Shares Value
Bombardier, Inc. Class B (b)(c) . . . . 6,517 $ 8,811Brookfield Asset Management, Inc.
Class A . . . . . . . . . . . . . . . . . 1,604 85,228Cameco Corp. . . . . . . . . . . . . . . . 1,326 12,599Canadian Imperial Bank of
Commerce (c) . . . . . . . . . . . . . 917 75,708Canadian National Railway Co. . . . . 1,384 124,351Canadian Pacific Railway, Ltd. . . . . 228 50,701Canadian Tire Corp., Ltd. Class A
(c). . . . . . . . . . . . . . . . . . . . . 143 16,057Canopy Growth Corp. (b)(c) . . . . . . 375 8,596CCL Industries, Inc. Class B. . . . . . 803 32,411CGI, Inc. (b) . . . . . . . . . . . . . . . . 324 25,636Constellation Software, Inc. . . . . . . 34 33,978Cronos Group, Inc. (b)(c) . . . . . . . . 338 3,056Dollarama, Inc. . . . . . . . . . . . . . . 646 23,142Enbridge, Inc. (c)(d) . . . . . . . . . . . 970 34,067Enbridge, Inc. (d) . . . . . . . . . . . . . 2,376 83,350Fairfax Financial Holdings, Ltd.. . . . 65 28,671First Quantum Minerals, Ltd. . . . . . 5,793 48,698Franco-Nevada Corp. . . . . . . . . . . 817 74,493George Weston, Ltd. . . . . . . . . . . . 499 42,008Great-West Lifeco, Inc. . . . . . . . . . 1,074 25,804Hydro One, Ltd. (c)(f) . . . . . . . . . . 5,246 97,035Intact Financial Corp. . . . . . . . . . . 205 20,646Kirkland Lake Gold, Ltd. . . . . . . . . 563 25,237Loblaw Cos., Ltd.. . . . . . . . . . . . . 377 21,487Lundin Mining Corp. . . . . . . . . . . 9,716 45,718Manulife Financial Corp. . . . . . . . . 2,559 46,967Metro, Inc. . . . . . . . . . . . . . . . . . 646 28,460National Bank of Canada . . . . . . . . 425 21,160Nutrien, Ltd. (c). . . . . . . . . . . . . . 900 44,864Pembina Pipeline Corp. . . . . . . . . . 3,746 138,947Power Corp. of Canada . . . . . . . . . 510 11,756Power Financial Corp. (c). . . . . . . . 1,378 31,973PrairieSky Royalty, Ltd. (c) . . . . . . 7,376 102,952Restaurant Brands International,
Inc. . . . . . . . . . . . . . . . . . . . . 632 44,966RioCan Real Estate Investment
Trust . . . . . . . . . . . . . . . . . . . 852 16,976Rogers Communications, Inc.
Class B (c) . . . . . . . . . . . . . . . 788 38,406Royal Bank of Canada. . . . . . . . . . 2,964 240,590Shaw Communications, Inc. Class B. 643 12,641Shopify, Inc. Class A (b)(c). . . . . . . 201 62,592SNC-Lavalin Group, Inc. (c) . . . . . . 845 11,909Stars Group, Inc. (b)(c) . . . . . . . . . 477 7,144Sun Life Financial, Inc. . . . . . . . . . 676 30,246TELUS Corp. . . . . . . . . . . . . . . . 696 24,786Thomson Reuters Corp. . . . . . . . . . 550 36,784Toronto-Dominion Bank . . . . . . . . 3,455 201,585Wheaton Precious Metals Corp.. . . . 3,256 85,433WSP Global, Inc. . . . . . . . . . . . . . 375 21,931
2,816,212
CHILE — 0.2%Aguas Andinas SA Class A. . . . . . . 53,911 29,524
Security Description Shares Value
Antofagasta PLC . . . . . . . . . . . . . 8,106 $ 89,801Cencosud SA . . . . . . . . . . . . . . . 420 692SACI Falabella . . . . . . . . . . . . . . 2,711 15,171Sociedad Quimica y Minera de Chile
SA Class B, Preference Shares. . . 585 16,123
151,311
CHINA — 3.5%51job, Inc. ADR (b) . . . . . . . . . . . 101 7,474AAC Technologies Holdings, Inc.
(c). . . . . . . . . . . . . . . . . . . . . 3,000 15,881Agricultural Bank of China, Ltd.
Class A . . . . . . . . . . . . . . . . . 21,162 10,253Agricultural Bank of China, Ltd.
Class H . . . . . . . . . . . . . . . . . 89,000 34,853Alcon, Inc. (b) . . . . . . . . . . . . . . . 754 44,008Alibaba Group Holding, Ltd. ADR
(b) . . . . . . . . . . . . . . . . . . . . 2,387 399,178Alibaba Health Information
Technology, Ltd. (b)(c). . . . . . . . 6,000 5,243ANTA Sports Products, Ltd. . . . . . . 1,000 8,272Baidu, Inc. ADR (b) . . . . . . . . . . . 479 49,222Bank of Beijing Co., Ltd. Class A . . 10,996 8,253Bank of China, Ltd. Class H . . . . . . 188,000 73,863Bank of Communications Co., Ltd.
Class A . . . . . . . . . . . . . . . . . 15,928 12,156Bank of Communications Co., Ltd.
Class H . . . . . . . . . . . . . . . . . 24,000 15,675BYD Co., Ltd. Class H (c) . . . . . . . 3,500 17,479CGN Power Co., Ltd. Class H (f) . . . 153,200 38,694China Cinda Asset Management Co.,
Ltd. Class H . . . . . . . . . . . . . . 60,000 11,787China CITIC Bank Corp., Ltd.
Class H . . . . . . . . . . . . . . . . . 36,000 19,195China Common Rich Renewable
Energy Investment, Ltd. (b)(c)(g) . 24,000 —China Conch Venture Holdings, Ltd. . 4,500 16,647China Construction Bank Corp.
Class H . . . . . . . . . . . . . . . . . 192,000 146,460China Everbright Bank Co., Ltd.
Class A . . . . . . . . . . . . . . . . . 26,509 14,626China Evergrande Group (c) . . . . . . 9,700 20,664China Life Insurance Co., Ltd.
Class H . . . . . . . . . . . . . . . . . 18,000 41,697China Mengniu Dairy Co., Ltd. . . . . 10,000 37,439China Merchants Bank Co., Ltd.
Class A . . . . . . . . . . . . . . . . . 1,600 7,786China Merchants Bank Co., Ltd.
Class H . . . . . . . . . . . . . . . . . 5,500 26,169China Minsheng Banking Corp., Ltd.
Class A . . . . . . . . . . . . . . . . . 4,145 3,494China Minsheng Banking Corp., Ltd.
Class H . . . . . . . . . . . . . . . . . 22,500 15,298China Molybdenum Co., Ltd.
Class H (c) . . . . . . . . . . . . . . . 27,000 8,955China Northern Rare Earth Group
High-Tech Co., Ltd. Class A . . . . 4,200 6,393
SPDR MSCI ACWI LOW CARBON TARGET ETFSCHEDULE OF INVESTMENTSSeptember 30, 2019
2
Security Description Shares Value
China Oilfield Services, Ltd.Class H . . . . . . . . . . . . . . . . . 22,000 $ 26,295
China Overseas Land & Investment,Ltd. . . . . . . . . . . . . . . . . . . . . 4,000 12,577
China Pacific Insurance Group Co.,Ltd. Class H . . . . . . . . . . . . . . 5,000 18,369
China Resources Beer Holdings Co.,Ltd. . . . . . . . . . . . . . . . . . . . . 2,000 10,600
China Resources Gas Group, Ltd. . . 18,000 88,974China Telecom Corp., Ltd. Class H. . 52,000 23,680China Tower Corp., Ltd. Class H (f) . 94,000 21,343China Unicom Hong Kong, Ltd. . . . 18,000 19,104China Vanke Co., Ltd. Class H . . . . 3,496 12,175China Yangtze Power Co., Ltd.
Class A . . . . . . . . . . . . . . . . . 10,896 27,815Chongqing Rural Commercial Bank
Co., Ltd. Class H . . . . . . . . . . . 28,000 14,894CITIC Securities Co., Ltd. Class H. . 4,500 8,427Country Garden Holdings Co., Ltd. . 19,000 24,067CSPC Pharmaceutical Group, Ltd. . . 4,000 8,031Ctrip.com International, Ltd. ADR
(b) . . . . . . . . . . . . . . . . . . . . 877 25,687Dongfeng Motor Group Co., Ltd.
Class H . . . . . . . . . . . . . . . . . 20,000 19,007ENN Energy Holdings, Ltd. . . . . . . 2,500 25,863Foshan Haitian Flavouring & Food
Co., Ltd. Class A . . . . . . . . . . . 600 9,235Fosun International, Ltd. . . . . . . . . 13,500 16,704Ganfeng Lithium Co., Ltd. Class A. . 1,900 6,002Geely Automobile Holdings, Ltd.
(c). . . . . . . . . . . . . . . . . . . . . 11,000 18,662Guangzhou Automobile Group Co.,
Ltd. Class H . . . . . . . . . . . . . . 3,200 3,061Huaneng Renewables Corp., Ltd.
Class H . . . . . . . . . . . . . . . . . 92,000 31,334Huazhu Group, Ltd. ADR (c) . . . . . 272 8,981Industrial & Commercial Bank of
China, Ltd. Class H. . . . . . . . . . 150,000 100,454Industrial Bank Co., Ltd. Class A . . . 6,232 15,298JD.com, Inc. ADR (b) . . . . . . . . . . 989 27,900Jiangsu Expressway Co., Ltd.
Class H . . . . . . . . . . . . . . . . . 12,000 15,246Jiangsu Yanghe Brewery Joint-Stock
Co., Ltd. Class A . . . . . . . . . . . 617 8,986Jinduicheng Molybdenum Co., Ltd.
Class A . . . . . . . . . . . . . . . . . 19,900 21,039Kweichow Moutai Co., Ltd. Class A . 102 16,426Lenovo Group, Ltd. . . . . . . . . . . . 12,000 8,006Luzhou Laojiao Co., Ltd. Class A . . 600 7,160Meituan Dianping Class B (b) . . . . . 1,600 16,348Muyuan Foodstuff Co., Ltd. Class A . 700 6,911NetEase, Inc. ADR . . . . . . . . . . . . 143 38,064New Oriental Education &
Technology Group, Inc. ADR (b) . 313 34,668Offshore Oil Engineering Co., Ltd.
Class A . . . . . . . . . . . . . . . . . 38,400 28,983People’s Insurance Co. Group of
China, Ltd. Class H. . . . . . . . . . 51,000 20,428
Security Description Shares Value
PICC Property & Casualty Co., Ltd.Class H . . . . . . . . . . . . . . . . . 30,000 $ 35,015
Pinduoduo, Inc. ADR (b)(c) . . . . . . 338 10,890Ping An Insurance Group Co. of
China, Ltd. Class H. . . . . . . . . . 9,000 103,382Postal Savings Bank of China Co.,
Ltd. Class H (f) . . . . . . . . . . . . 28,000 17,073Prosus NV (b) . . . . . . . . . . . . . . . 817 59,988Sany Heavy Industry Co., Ltd.
Class A . . . . . . . . . . . . . . . . . 3,300 6,599Shanghai Fosun Pharmaceutical
Group Co., Ltd. Class H (c). . . . . 5,000 13,426Shanghai International Airport Co.,
Ltd. Class A . . . . . . . . . . . . . . 700 7,820Shanghai International Port Group
Co., Ltd. Class A . . . . . . . . . . . 7,500 5,976Shanghai Pudong Development Bank
Co., Ltd. Class A . . . . . . . . . . . 6,334 10,502Shenzhou International Group
Holdings, Ltd. . . . . . . . . . . . . . 2,900 37,880Sunac China Holdings, Ltd. . . . . . . 1,000 4,018Sunny Optical Technology Group
Co., Ltd.. . . . . . . . . . . . . . . . . 1,900 27,921TAL Education Group ADR (b) . . . . 754 25,817Tencent Holdings, Ltd. . . . . . . . . . 10,484 441,592Towngas China Co., Ltd. . . . . . . . . 25,937 19,454Vipshop Holdings, Ltd. ADR (b) . . . 741 6,610Want Want China Holdings, Ltd. . . . 15,000 11,997Wens Foodstuffs Group Co., Ltd.
Class A . . . . . . . . . . . . . . . . . 1,100 5,727Wuliangye Yibin Co., Ltd. Class A . . 1,134 20,612Yangzijiang Shipbuilding Holdings,
Ltd. . . . . . . . . . . . . . . . . . . . . 11,400 7,914Yum China Holdings, Inc. . . . . . . . 746 33,891Zhejiang Expressway Co., Ltd.
Class H . . . . . . . . . . . . . . . . . 20,000 17,297Zhejiang Longsheng Group Co., Ltd.
Class A . . . . . . . . . . . . . . . . . 2,300 4,528ZTE Corp. Class H (b) . . . . . . . . . 3,600 9,552
2,909,399
COLOMBIA — 0.2%Bancolombia SA . . . . . . . . . . . . . 1,175 13,343Bancolombia SA Preference Shares . 696 8,604Ecopetrol SA . . . . . . . . . . . . . . . 49,307 41,816Grupo Aval Acciones y Valores SA
Preference Shares . . . . . . . . . . . 57,157 21,361Grupo de Inversiones Suramericana
SA Preference Shares . . . . . . . . 2,447 20,668Grupo de Inversiones Suramericana
SA . . . . . . . . . . . . . . . . . . . . 1,743 16,536Interconexion Electrica SA ESP. . . . 9,383 49,202
171,530
DENMARK — 0.5%Carlsberg A/S Class B . . . . . . . . . . 100 14,784Chr. Hansen Holding A/S . . . . . . . . 355 30,137Coloplast A/S Class B . . . . . . . . . . 181 21,804
SPDR MSCI ACWI LOW CARBON TARGET ETFSCHEDULE OF INVESTMENTSSeptember 30, 2019
3

Security Description Shares Value
Danske Bank A/S . . . . . . . . . . . . . 1,790 $ 24,929Genmab A/S (b). . . . . . . . . . . . . . 107 21,725ISS A/S . . . . . . . . . . . . . . . . . . . 443 10,964Novo Nordisk A/S Class B . . . . . . . 3,369 173,233Novozymes A/S Class B . . . . . . . . 1,091 45,879Orsted A/S (f) . . . . . . . . . . . . . . . 197 18,312Pandora A/S . . . . . . . . . . . . . . . . 205 8,229Vestas Wind Systems A/S. . . . . . . . 445 34,555
404,551
FINLAND — 0.4%Elisa Oyj . . . . . . . . . . . . . . . . . . 251 12,943Kone Oyj Class B. . . . . . . . . . . . . 1,015 57,806Neste Oyj (c) . . . . . . . . . . . . . . . 1,832 60,657Nokia Oyj (d) . . . . . . . . . . . . . . . 1,316 6,671Nokia Oyj (d) . . . . . . . . . . . . . . . 7,755 39,212Nokian Renkaat Oyj . . . . . . . . . . . 260 7,336Nordea Bank Abp (d) . . . . . . . . . . 4,873 34,599Nordea Bank Abp (d) . . . . . . . . . . 134 950Orion Oyj Class B . . . . . . . . . . . . 217 8,096Sampo Oyj Class A. . . . . . . . . . . . 1,515 60,252Wartsila OYJ Abp (c) . . . . . . . . . . 1,159 12,983
301,505
FRANCE — 3.4%Aeroports de Paris . . . . . . . . . . . . 135 24,019Airbus SE . . . . . . . . . . . . . . . . . 1,275 165,689Alstom SA . . . . . . . . . . . . . . . . . 622 25,788Amundi SA (f) . . . . . . . . . . . . . . 226 15,769Atos SE . . . . . . . . . . . . . . . . . . . 287 20,237AXA SA . . . . . . . . . . . . . . . . . . 3,700 94,510BNP Paribas SA . . . . . . . . . . . . . 1,862 90,678Bollore SA . . . . . . . . . . . . . . . . . 6,238 25,856Bureau Veritas SA . . . . . . . . . . . . 796 19,178Capgemini SE . . . . . . . . . . . . . . . 362 42,662Carrefour SA . . . . . . . . . . . . . . . 678 11,871CNP Assurances . . . . . . . . . . . . . 382 7,384Covivio REIT . . . . . . . . . . . . . . . 149 15,773Credit Agricole SA. . . . . . . . . . . . 1,483 18,011Danone SA. . . . . . . . . . . . . . . . . 1,195 105,291Dassault Aviation SA . . . . . . . . . . 10 14,151Dassault Systemes SE . . . . . . . . . . 235 33,498Edenred . . . . . . . . . . . . . . . . . . . 668 32,065Eiffage SA . . . . . . . . . . . . . . . . . 192 19,910EssilorLuxottica SA . . . . . . . . . . . 629 90,688Eurazeo SE. . . . . . . . . . . . . . . . . 286 21,280Eutelsat Communications SA . . . . . 525 9,773Gecina SA REIT . . . . . . . . . . . . . 153 24,053Getlink SE . . . . . . . . . . . . . . . . . 1,594 23,947Hermes International . . . . . . . . . . 63 43,545ICADE REIT . . . . . . . . . . . . . . . 268 23,973Iliad SA . . . . . . . . . . . . . . . . . . . 97 9,118Ingenico Group SA. . . . . . . . . . . . 100 9,757Kering SA . . . . . . . . . . . . . . . . . 152 77,478Klepierre SA REIT. . . . . . . . . . . . 840 28,535Legrand SA . . . . . . . . . . . . . . . . 741 52,897L’Oreal SA. . . . . . . . . . . . . . . . . 648 181,487
Security Description Shares Value
LVMH Moet Hennessy LouisVuitton SE . . . . . . . . . . . . . . . 560 $ 222,623
Natixis SA . . . . . . . . . . . . . . . . . 533 2,211Orange SA . . . . . . . . . . . . . . . . . 3,784 59,384Pernod Ricard SA . . . . . . . . . . . . 517 92,098Peugeot SA. . . . . . . . . . . . . . . . . 1,927 48,067Publicis Groupe SA . . . . . . . . . . . 241 11,855Remy Cointreau SA . . . . . . . . . . . 82 10,888Renault SA. . . . . . . . . . . . . . . . . 517 29,681Safran SA . . . . . . . . . . . . . . . . . 782 123,149Sanofi . . . . . . . . . . . . . . . . . . . . 2,141 198,540Schneider Electric SE . . . . . . . . . . 1,545 135,591SCOR SE. . . . . . . . . . . . . . . . . . 161 6,650Societe BIC SA (c) . . . . . . . . . . . . 114 7,656Societe Generale SA . . . . . . . . . . . 1,439 39,439Sodexo SA . . . . . . . . . . . . . . . . . 295 33,126Teleperformance . . . . . . . . . . . . . 119 25,804Thales SA . . . . . . . . . . . . . . . . . 294 33,815Ubisoft Entertainment SA (b) . . . . . 159 11,499Unibail-Rodamco-Westfield . . . . . . 2,759 19,818Unibail-Rodamco-Westfield REIT . . 349 50,889Valeo SA . . . . . . . . . . . . . . . . . . 103 3,341Vinci SA . . . . . . . . . . . . . . . . . . 1,547 166,664Vivendi SA. . . . . . . . . . . . . . . . . 2,514 69,012Worldline SA (b)(f) . . . . . . . . . . . 112 7,070
2,787,741
GERMANY — 2.4%1&1 Drillisch AG. . . . . . . . . . . . . 146 4,552adidas AG . . . . . . . . . . . . . . . . . 337 104,947Allianz SE . . . . . . . . . . . . . . . . . 899 209,592BASF SE . . . . . . . . . . . . . . . . . . 462 32,296Bayer AG . . . . . . . . . . . . . . . . . . 1,485 104,730Bayerische Motoren Werke AG . . . . 1,231 86,682Beiersdorf AG . . . . . . . . . . . . . . . 190 22,412Brenntag AG. . . . . . . . . . . . . . . . 81 3,921Continental AG . . . . . . . . . . . . . . 170 21,814Daimler AG . . . . . . . . . . . . . . . . 2,610 129,808Delivery Hero SE (b)(f) . . . . . . . . . 304 13,509Deutsche Bank AG . . . . . . . . . . . . 3,517 26,345Deutsche Boerse AG . . . . . . . . . . . 296 46,275Deutsche Post AG . . . . . . . . . . . . 934 31,204Deutsche Telekom AG . . . . . . . . . . 5,442 91,331Deutsche Wohnen SE . . . . . . . . . . 441 16,101Fraport AG Frankfurt Airport
Services Worldwide . . . . . . . . . 251 21,295Fresenius Medical Care AG & Co.
KGaA . . . . . . . . . . . . . . . . . . 484 32,556Fresenius SE & Co. KGaA . . . . . . . 827 38,674Fuchs Petrolub SE Preference
Shares . . . . . . . . . . . . . . . . . . 335 12,585GEA Group AG . . . . . . . . . . . . . . 409 11,045Henkel AG & Co. KGaA Preference
Shares . . . . . . . . . . . . . . . . . . 570 56,424HUGO BOSS AG. . . . . . . . . . . . . 154 8,252Infineon Technologies AG . . . . . . . 2,367 42,609KION Group AG . . . . . . . . . . . . . 116 6,102
SPDR MSCI ACWI LOW CARBON TARGET ETFSCHEDULE OF INVESTMENTSSeptember 30, 2019
4

Security Description Shares Value
Merck KGaA . . . . . . . . . . . . . . . 143 $ 16,112MTU Aero Engines AG . . . . . . . . . 123 32,692Muenchener
Rueckversicherungs-GesellschaftAG in Muenchen . . . . . . . . . . . 299 77,385
Puma SE . . . . . . . . . . . . . . . . . . 90 6,966SAP SE . . . . . . . . . . . . . . . . . . . 1,962 230,752Sartorius AG Preference Shares . . . . 52 9,490Siemens AG . . . . . . . . . . . . . . . . 1,604 171,808Siemens Healthineers AG (f). . . . . . 288 11,333Symrise AG . . . . . . . . . . . . . . . . 576 55,989Telefonica Deutschland Holding AG . 1,402 3,910United Internet AG . . . . . . . . . . . . 256 9,135Volkswagen AG Preference Shares . . 391 66,523Vonovia SE. . . . . . . . . . . . . . . . . 739 37,503Wirecard AG. . . . . . . . . . . . . . . . 250 39,997Zalando SE (b)(f) . . . . . . . . . . . . . 290 13,241
1,957,897
HONG KONG — 1.4%AIA Group, Ltd. . . . . . . . . . . . . . 23,800 224,812Bank of East Asia, Ltd. . . . . . . . . . 1,605 3,951China Everbright, Ltd.. . . . . . . . . . 14,000 16,376China Gas Holdings, Ltd. . . . . . . . . 5,400 20,872China Mobile, Ltd. . . . . . . . . . . . . 12,000 99,268China Resources Land, Ltd. . . . . . . 2,000 8,381CK Asset Holdings, Ltd. . . . . . . . . 9,459 64,070CK Hutchison Holdings, Ltd. . . . . . 4,000 35,309Dairy Farm International Holdings,
Ltd. . . . . . . . . . . . . . . . . . . . . 900 5,670Galaxy Entertainment Group, Ltd. . . 2,000 12,437Hang Lung Properties, Ltd. . . . . . . 8,000 18,165Hang Seng Bank, Ltd. . . . . . . . . . . 1,800 38,804Henderson Land Development Co.,
Ltd. . . . . . . . . . . . . . . . . . . . . 2,632 12,255Hong Kong & China Gas Co., Ltd. . . 20,504 39,965Hong Kong Exchanges & Clearing,
Ltd. . . . . . . . . . . . . . . . . . . . . 2,006 58,854Hongkong Land Holdings, Ltd. . . . . 3,600 20,232Hysan Development Co., Ltd. . . . . . 7,000 28,217Jardine Matheson Holdings, Ltd. . . . 400 21,400Jardine Strategic Holdings, Ltd. . . . . 600 17,928Kerry Properties, Ltd. . . . . . . . . . . 3,000 9,242Link REIT . . . . . . . . . . . . . . . . . 7,500 82,707Melco Resorts & Entertainment, Ltd.
ADR . . . . . . . . . . . . . . . . . . . 745 14,460MTR Corp., Ltd. . . . . . . . . . . . . . 3,932 22,069Power Assets Holdings, Ltd. . . . . . . 13,000 87,309Sands China, Ltd.. . . . . . . . . . . . . 6,400 28,982Shenzhen International Holdings,
Ltd. . . . . . . . . . . . . . . . . . . . . 8,016 15,399Sino Biopharmaceutical, Ltd. . . . . . 20,500 26,045Sino Land Co., Ltd. . . . . . . . . . . . 15,324 23,027Sun Hung Kai Properties, Ltd.. . . . . 3,500 50,361Swire Properties, Ltd. . . . . . . . . . . 3,600 11,297Techtronic Industries Co., Ltd.. . . . . 3,000 20,875
Security Description Shares Value
Wharf Real Estate Investment Co.,Ltd. . . . . . . . . . . . . . . . . . . . . 2,000 $ 10,919
Wheelock & Co., Ltd. . . . . . . . . . . 2,000 11,391
1,161,049
HUNGARY — 0.0% (a)OTP Bank Nyrt . . . . . . . . . . . . . . 478 19,898
INDIA — 1.0%Adani Ports & Special Economic
Zone, Ltd.. . . . . . . . . . . . . . . . 2,344 13,692Asian Paints, Ltd.. . . . . . . . . . . . . 2,078 51,669Avenue Supermarts, Ltd. (b)(f) . . . . 321 8,428Axis Bank, Ltd. . . . . . . . . . . . . . . 3,591 34,710Bajaj Auto, Ltd. . . . . . . . . . . . . . . 305 12,661Bharti Airtel, Ltd.. . . . . . . . . . . . . 5,228 27,077Bharti Infratel, Ltd.. . . . . . . . . . . . 1,747 6,343Dabur India, Ltd. . . . . . . . . . . . . . 1,262 7,964Eicher Motors, Ltd. . . . . . . . . . . . 46 11,531Godrej Consumer Products, Ltd. . . . 612 5,935HCL Technologies, Ltd. . . . . . . . . . 1,164 17,749Hindustan Unilever, Ltd. . . . . . . . . 1,636 45,753Housing Development Finance
Corp., Ltd. . . . . . . . . . . . . . . . 2,608 72,756ICICI Bank, Ltd. ADR . . . . . . . . . 2,385 29,049Infosys, Ltd. ADR . . . . . . . . . . . . 6,800 77,316ITC, Ltd. . . . . . . . . . . . . . . . . . . 10,093 37,007Larsen & Toubro, Ltd. GDR . . . . . . 1,797 37,378Mahindra & Mahindra, Ltd. GDR . . 1,869 14,485Maruti Suzuki India, Ltd. . . . . . . . . 312 29,566Nestle India, Ltd. . . . . . . . . . . . . . 106 20,775Petronet LNG, Ltd. . . . . . . . . . . . . 3,257 11,945Power Grid Corp. of India, Ltd. . . . . 2,831 7,951Reliance Industries, Ltd. . . . . . . . . 5,266 98,995State Bank of India GDR (b). . . . . . 486 18,662Sun Pharmaceutical Industries, Ltd. . 1,734 9,529Tata Consultancy Services, Ltd. . . . . 2,089 61,881Tata Motors, Ltd. (b) . . . . . . . . . . . 7,578 12,559Tech Mahindra, Ltd. . . . . . . . . . . . 1,555 15,678Titan Co., Ltd. . . . . . . . . . . . . . . . 297 5,335United Spirits, Ltd. (b) . . . . . . . . . 1,328 12,499Wipro, Ltd. ADR (c) . . . . . . . . . . . 3,231 11,793Yes Bank, Ltd. . . . . . . . . . . . . . . . 3,942 2,303
830,974
INDONESIA — 0.2%Astra International Tbk PT . . . . . . . 51,000 23,713Bank Central Asia Tbk PT . . . . . . . 20,100 42,975Bank Mandiri Persero Tbk PT . . . . . 13,400 6,584Bank Rakyat Indonesia Persero Tbk
PT . . . . . . . . . . . . . . . . . . . . 90,000 26,122Gudang Garam Tbk PT . . . . . . . . . 2,000 7,379Hanjaya Mandala Sampoerna Tbk
PT . . . . . . . . . . . . . . . . . . . . 40,900 6,598Jasa Marga Persero Tbk PT. . . . . . . 19,850 7,971Telekomunikasi Indonesia Persero
Tbk PT . . . . . . . . . . . . . . . . . 108,600 32,974
SPDR MSCI ACWI LOW CARBON TARGET ETFSCHEDULE OF INVESTMENTSSeptember 30, 2019
5

Security Description Shares Value
Unilever Indonesia Tbk PT . . . . . . . 6,000 $ 19,655
173,971
IRELAND — 0.4%Accenture PLC Class A . . . . . . . . . 1,280 246,208AerCap Holdings NV (b) . . . . . . . . 466 25,514AIB Group PLC. . . . . . . . . . . . . . 2,455 7,291Alkermes PLC (b) . . . . . . . . . . . . 153 2,985Flutter Entertainment PLC . . . . . . . 150 14,024James Hardie Industries PLC . . . . . 1,256 21,059Kerry Group PLC Class A . . . . . . . 278 32,520
349,601
ISRAEL — 0.1%Bank Hapoalim BM (b) . . . . . . . . . 2,979 23,484Bank Leumi Le-Israel BM . . . . . . . 1,973 14,043Check Point Software Technologies,
Ltd. (b) . . . . . . . . . . . . . . . . . 231 25,295Nice, Ltd. (b) . . . . . . . . . . . . . . . 123 18,083Teva Pharmaceutical Industries, Ltd.
ADR (b)(c) . . . . . . . . . . . . . . . 630 4,334Teva Pharmaceutical Industries, Ltd.
(b) . . . . . . . . . . . . . . . . . . . . 1,360 9,359
94,598
ITALY — 0.6%Assicurazioni Generali SpA . . . . . . 3,452 66,913Atlantia SpA. . . . . . . . . . . . . . . . 2,195 53,100Davide Campari-Milano SpA . . . . . 1,003 9,065Ferrari NV . . . . . . . . . . . . . . . . . 388 59,875Intesa Sanpaolo SpA. . . . . . . . . . . 27,282 64,706Leonardo SpA . . . . . . . . . . . . . . . 917 10,787Mediobanca Banca di Credito
Finanziario SpA . . . . . . . . . . . . 1,139 12,442Moncler SpA . . . . . . . . . . . . . . . 341 12,157Poste Italiane SpA (f) . . . . . . . . . . 3,464 39,388Snam SpA . . . . . . . . . . . . . . . . . 6,030 30,463Telecom Italia SpA . . . . . . . . . . . . 43,343 23,702Terna Rete Elettrica Nazionale SpA . 10,100 64,899UniCredit SpA . . . . . . . . . . . . . . 3,015 35,565
483,062
JAPAN — 7.4%Amada Holdings Co., Ltd. . . . . . . . 800 8,616Asahi Group Holdings, Ltd. . . . . . . 200 9,901Asahi Intecc Co., Ltd. . . . . . . . . . . 1,100 28,875Astellas Pharma, Inc. . . . . . . . . . . 4,500 64,060Bandai Namco Holdings, Inc. (c) . . . 200 12,454Bank of Kyoto, Ltd. . . . . . . . . . . . 300 11,728Canon, Inc. . . . . . . . . . . . . . . . . . 2,600 69,345Casio Computer Co., Ltd. (c) . . . . . 800 12,399Central Japan Railway Co. . . . . . . . 200 41,120Chiba Bank, Ltd. . . . . . . . . . . . . . 1,100 5,659Chugai Pharmaceutical Co., Ltd. . . . 200 15,545Concordia Financial Group, Ltd. (c) . 3,500 13,407CyberAgent, Inc. (c) . . . . . . . . . . . 600 23,040Daifuku Co., Ltd. (c). . . . . . . . . . . 700 36,077Dai-ichi Life Holdings, Inc. . . . . . . 1,700 25,624
Security Description Shares Value
Daiichi Sankyo Co., Ltd. . . . . . . . . 1,800 $ 113,321Daikin Industries, Ltd.. . . . . . . . . . 700 91,844Daito Trust Construction Co., Ltd. . . 100 12,778Daiwa House Industry Co., Ltd.. . . . 700 22,708Daiwa Securities Group, Inc. (c) . . . 4,300 19,154Denso Corp. (c) . . . . . . . . . . . . . . 1,000 43,942Dentsu, Inc. . . . . . . . . . . . . . . . . 900 31,686East Japan Railway Co. . . . . . . . . . 400 38,159Eisai Co., Ltd. (c). . . . . . . . . . . . . 300 15,242FANUC Corp. (c). . . . . . . . . . . . . 200 37,640Fast Retailing Co., Ltd. . . . . . . . . . 100 59,412FUJIFILM Holdings Corp. . . . . . . . 600 26,315Fujitsu, Ltd. . . . . . . . . . . . . . . . . 600 48,050Fukuoka Financial Group, Inc. . . . . 700 13,219Hisamitsu Pharmaceutical Co., Inc. . 200 8,744Hitachi, Ltd. . . . . . . . . . . . . . . . . 700 26,057Honda Motor Co., Ltd. . . . . . . . . . 3,300 85,450Hoshizaki Corp.. . . . . . . . . . . . . . 200 15,711Hoya Corp.. . . . . . . . . . . . . . . . . 600 48,960Iida Group Holdings Co., Ltd. . . . . . 1,100 17,893Isuzu Motors, Ltd. (c) . . . . . . . . . . 1,500 16,523ITOCHU Corp. . . . . . . . . . . . . . . 4,300 88,765Japan Airport Terminal Co., Ltd. (c) . 800 34,643Japan Post Bank Co., Ltd. (c) . . . . . 1,900 18,407Japan Post Holdings Co., Ltd. . . . . . 3,632 33,438Japan Tobacco, Inc. . . . . . . . . . . . 1,800 39,406JGC Corp. . . . . . . . . . . . . . . . . . 600 7,845Kajima Corp. (c) . . . . . . . . . . . . . 2,600 34,089Kamigumi Co., Ltd. . . . . . . . . . . . 1,000 22,651Kansai Paint Co., Ltd. . . . . . . . . . . 2,900 67,378Kao Corp. . . . . . . . . . . . . . . . . . 800 59,100KDDI Corp. . . . . . . . . . . . . . . . . 3,400 88,873Keikyu Corp. . . . . . . . . . . . . . . . 800 15,508Keio Corp. . . . . . . . . . . . . . . . . . 200 12,454Keyence Corp.. . . . . . . . . . . . . . . 200 123,803Kikkoman Corp. . . . . . . . . . . . . . 400 19,098Kirin Holdings Co., Ltd. . . . . . . . . 900 19,053Koito Manufacturing Co., Ltd. . . . . 900 43,969Komatsu, Ltd. (c) . . . . . . . . . . . . . 1,100 25,191Konami Holdings Corp. (c) . . . . . . 800 38,640Kose Corp. . . . . . . . . . . . . . . . . . 100 16,886Kubota Corp. . . . . . . . . . . . . . . . 2,000 30,247Kyocera Corp. . . . . . . . . . . . . . . . 100 6,204Lawson, Inc. . . . . . . . . . . . . . . . . 200 10,234M3, Inc. (c) . . . . . . . . . . . . . . . . 600 14,445Makita Corp.. . . . . . . . . . . . . . . . 200 6,292Marubeni Corp. . . . . . . . . . . . . . . 20,800 138,128Mebuki Financial Group, Inc. (c) . . . 2,700 6,645Medipal Holdings Corp. . . . . . . . . 200 4,452Mercari, Inc. (b). . . . . . . . . . . . . . 200 4,969MISUMI Group, Inc. . . . . . . . . . . 100 2,353Mitsubishi Corp. . . . . . . . . . . . . . 4,200 103,023Mitsubishi Electric Corp. (c). . . . . . 3,800 50,368Mitsubishi Estate Co., Ltd. . . . . . . . 2,900 55,920Mitsubishi Heavy Industries, Ltd.. . . 300 11,747Mitsubishi Motors Corp. (c) . . . . . . 1,900 8,245
SPDR MSCI ACWI LOW CARBON TARGET ETFSCHEDULE OF INVESTMENTSSeptember 30, 2019
6
Security Description Shares Value
Mitsubishi UFJ Financial Group,Inc. . . . . . . . . . . . . . . . . . . . . 23,700 $ 120,260
Mitsubishi UFJ Lease & FinanceCo., Ltd. (c) . . . . . . . . . . . . . . 2,700 15,589
Mitsui & Co., Ltd. . . . . . . . . . . . . 18,600 304,278Mitsui Fudosan Co., Ltd. (c) . . . . . . 2,500 61,971Mizuho Financial Group, Inc. (c) . . . 53,700 82,283MonotaRO Co., Ltd. (c) . . . . . . . . . 900 23,534MS&AD Insurance Group Holdings,
Inc. . . . . . . . . . . . . . . . . . . . . 1,000 32,385Murata Manufacturing Co., Ltd. . . . 800 38,381NEC Corp. . . . . . . . . . . . . . . . . . 600 25,316Nexon Co., Ltd. (b) . . . . . . . . . . . 800 9,704NGK Spark Plug Co., Ltd. . . . . . . . 900 17,138Nidec Corp. (c) . . . . . . . . . . . . . . 500 67,176Nikon Corp. (c) . . . . . . . . . . . . . . 200 2,495Nintendo Co., Ltd. . . . . . . . . . . . . 200 74,060Nippon Paint Holdings Co., Ltd. . . . 800 41,527Nippon Telegraph & Telephone
Corp.. . . . . . . . . . . . . . . . . . . 1,100 52,478Nissan Motor Co., Ltd. (c) . . . . . . . 2,800 17,465Nitori Holdings Co., Ltd. (c) . . . . . . 100 14,629Nitto Denko Corp. . . . . . . . . . . . . 200 9,630Nomura Holdings, Inc. (c) . . . . . . . 8,000 33,895Nomura Research Institute, Ltd.. . . . 2,000 39,806NTT Data Corp. (c) . . . . . . . . . . . 2,500 32,246NTT DOCOMO, Inc. (c) . . . . . . . . 2,700 68,777Obayashi Corp. . . . . . . . . . . . . . . 2,800 27,877Obic Co., Ltd. . . . . . . . . . . . . . . . 200 22,799Olympus Corp. . . . . . . . . . . . . . . 1,600 21,555Omron Corp. (c) . . . . . . . . . . . . . 800 43,747Ono Pharmaceutical Co., Ltd. . . . . . 600 10,865Oriental Land Co., Ltd. (c) . . . . . . . 400 60,847ORIX Corp. . . . . . . . . . . . . . . . . 3,600 53,663Pan Pacific International Holdings
Corp.. . . . . . . . . . . . . . . . . . . 2,800 46,764Panasonic Corp.. . . . . . . . . . . . . . 2,000 16,204Park24 Co., Ltd. (c) . . . . . . . . . . . 900 20,885PeptiDream, Inc. (b) . . . . . . . . . . . 100 4,747Rakuten, Inc.. . . . . . . . . . . . . . . . 3,800 37,446Recruit Holdings Co., Ltd. . . . . . . . 1,700 51,688Renesas Electronics Corp. (b) . . . . . 1,900 12,341Resona Holdings, Inc. (c) . . . . . . . . 6,300 26,990Ricoh Co., Ltd. (c) . . . . . . . . . . . . 1,800 16,205Rohm Co., Ltd. . . . . . . . . . . . . . . 600 45,801Ryohin Keikaku Co., Ltd.. . . . . . . . 1,000 18,672Sankyo Co., Ltd. (c) . . . . . . . . . . . 900 30,937SBI Holdings, Inc. (c) . . . . . . . . . . 900 19,245Secom Co., Ltd.. . . . . . . . . . . . . . 500 45,607Sekisui House, Ltd. . . . . . . . . . . . 1,800 35,392Seven & i Holdings Co., Ltd. . . . . . 1,000 38,233Seven Bank, Ltd. (c) . . . . . . . . . . . 3,400 9,312Shimadzu Corp.. . . . . . . . . . . . . . 1,000 25,242Shimano, Inc. . . . . . . . . . . . . . . . 100 15,064Shimizu Corp. (c). . . . . . . . . . . . . 2,700 24,433Shin-Etsu Chemical Co., Ltd. . . . . . 600 64,178
Security Description Shares Value
Shinsei Bank, Ltd. . . . . . . . . . . . . 1,000 $ 14,564Shionogi & Co., Ltd.. . . . . . . . . . . 200 11,102Shiseido Co., Ltd. . . . . . . . . . . . . 700 55,890Shizuoka Bank, Ltd. (c) . . . . . . . . . 2,500 18,621SMC Corp. . . . . . . . . . . . . . . . . . 100 42,656Softbank Corp. (c) . . . . . . . . . . . . 3,100 41,993SoftBank Group Corp. (c) . . . . . . . 2,900 113,773Sohgo Security Services Co., Ltd.
(c). . . . . . . . . . . . . . . . . . . . . 600 31,423Sompo Holdings, Inc. (c) . . . . . . . . 700 29,257Sony Corp. . . . . . . . . . . . . . . . . . 2,100 123,328Subaru Corp. . . . . . . . . . . . . . . . 700 19,690Sumitomo Corp. . . . . . . . . . . . . . 3,400 53,104Sumitomo Dainippon Pharma Co.,
Ltd. (c) . . . . . . . . . . . . . . . . . 900 14,781Sumitomo Mitsui Financial Group,
Inc. (c) . . . . . . . . . . . . . . . . . . 3,500 119,662Sumitomo Mitsui Trust Holdings,
Inc. . . . . . . . . . . . . . . . . . . . . 100 3,605Suzuki Motor Corp. . . . . . . . . . . . 100 4,244Sysmex Corp. (c) . . . . . . . . . . . . . 800 53,533Taisei Corp. . . . . . . . . . . . . . . . . 600 23,234Taisho Pharmaceutical Holdings Co.,
Ltd. . . . . . . . . . . . . . . . . . . . . 100 7,263Takeda Pharmaceutical Co., Ltd. . . . 3,020 103,112Terumo Corp. . . . . . . . . . . . . . . . 500 16,100Toho Gas Co., Ltd. . . . . . . . . . . . . 700 26,750Tokio Marine Holdings, Inc. (c) . . . . 800 42,778Tokyo Century Corp. (c) . . . . . . . . 700 32,353Tokyo Electron, Ltd. . . . . . . . . . . . 200 38,057Tokyu Corp. . . . . . . . . . . . . . . . . 1,000 18,765Toshiba Corp. . . . . . . . . . . . . . . . 1,000 30,534TOTO, Ltd. . . . . . . . . . . . . . . . . . 1,000 37,428Toyota Industries Corp. (c) . . . . . . . 200 11,473Toyota Motor Corp. (c) . . . . . . . . . 4,600 307,135Toyota Tsusho Corp. . . . . . . . . . . . 1,900 61,268Trend Micro, Inc. . . . . . . . . . . . . . 700 33,292Yahoo! Japan Corp. . . . . . . . . . . . 6,100 17,158Yakult Honsha Co., Ltd. (c) . . . . . . 200 11,177Yamaha Corp. . . . . . . . . . . . . . . . 600 26,926Yaskawa Electric Corp. . . . . . . . . . 800 29,350Yokogawa Electric Corp. (c) . . . . . . 1,100 20,122ZOZO, Inc. (c) . . . . . . . . . . . . . . 1,000 23,058
6,133,448
LUXEMBOURG — 0.0% (a)Eurofins Scientific SE (c) . . . . . . . 15 6,973Reinet Investments SCA . . . . . . . . 1,002 18,140SES SA . . . . . . . . . . . . . . . . . . . 822 14,988
40,101
MACAU — 0.0% (a)Wynn Macau, Ltd. . . . . . . . . . . . . 800 1,561
MALAYSIA — 0.3%AMMB Holdings Bhd. . . . . . . . . . 7,000 6,922CIMB Group Holdings Bhd . . . . . . 15,296 18,376Dialog Group Bhd . . . . . . . . . . . . 29,000 23,549
SPDR MSCI ACWI LOW CARBON TARGET ETFSCHEDULE OF INVESTMENTSSeptember 30, 2019
7

Security Description Shares Value
Gamuda Bhd. . . . . . . . . . . . . . . . 14,500 $ 12,814Genting Bhd . . . . . . . . . . . . . . . . 23,500 32,216Genting Malaysia Bhd. . . . . . . . . . 17,700 12,809Hong Leong Bank Bhd . . . . . . . . . 1,500 5,861IHH Healthcare Bhd . . . . . . . . . . . 12,300 16,686Malayan Banking Bhd. . . . . . . . . . 12,629 25,668Maxis Bhd . . . . . . . . . . . . . . . . . 4,300 5,751Petronas Dagangan Bhd . . . . . . . . . 2,900 16,346PPB Group Bhd. . . . . . . . . . . . . . 3,800 16,463Public Bank Bhd . . . . . . . . . . . . . 6,100 29,254RHB Capital Bhd . . . . . . . . . . . . . 7,100 9,564
232,279
MEXICO — 0.3%America Movil SAB de CV Series L. 55,985 41,512Coca-Cola Femsa SAB de CV. . . . . 2,805 17,061Fibra Uno Administracion SA de CV
REIT . . . . . . . . . . . . . . . . . . . 16,996 24,826Fomento Economico Mexicano SAB
de CV . . . . . . . . . . . . . . . . . . 3,306 30,316Fresnillo PLC . . . . . . . . . . . . . . . 1,693 14,262Grupo Aeroportuario del Pacifico
SAB de CV Class B . . . . . . . . . 1,539 14,802Grupo Aeroportuario del Sureste
SAB de CV Class B . . . . . . . . . 981 14,987Grupo Financiero Banorte SAB de
CV Series O . . . . . . . . . . . . . . 5,883 31,605Grupo Financiero Inbursa SAB de
CV Series O . . . . . . . . . . . . . . 8,189 10,411Grupo Televisa SAB Series CPO . . . 3,558 6,961Megacable Holdings SAB de CV . . . 1,548 6,231Promotora y Operadora de
Infraestructura SAB de CV . . . . . 729 6,533Wal-Mart de Mexico SAB de CV. . . 10,692 31,669
251,176
NETHERLANDS — 1.0%Aegon NV . . . . . . . . . . . . . . . . . 1,911 7,952Akzo Nobel NV. . . . . . . . . . . . . . 172 15,337ASML Holding NV . . . . . . . . . . . 783 193,987Heineken NV . . . . . . . . . . . . . . . 344 37,188ING Groep NV . . . . . . . . . . . . . . 5,417 56,718Koninklijke Ahold Delhaize NV . . . 1,621 40,566Koninklijke DSM NV . . . . . . . . . . 511 61,503Koninklijke KPN NV . . . . . . . . . . 3,515 10,964Koninklijke Philips NV . . . . . . . . . 2,209 102,351NN Group NV. . . . . . . . . . . . . . . 786 27,883NXP Semiconductors NV . . . . . . . 603 65,799Randstad NV . . . . . . . . . . . . . . . 415 20,400Royal Dutch Shell PLC Class B. . . . 5,669 167,382Wolters Kluwer NV . . . . . . . . . . . 763 55,715
863,745
NEW ZEALAND — 0.1%Meridian Energy, Ltd. . . . . . . . . . . 22,908 74,695
NORWAY — 0.3%DNB ASA . . . . . . . . . . . . . . . . . 3,344 58,979
Security Description Shares Value
Gjensidige Forsikring ASA. . . . . . . 1,882 $ 37,356Mowi ASA . . . . . . . . . . . . . . . . . 2,545 58,794Orkla ASA . . . . . . . . . . . . . . . . . 4,276 38,948Schibsted ASA Class B . . . . . . . . . 595 16,699Telenor ASA . . . . . . . . . . . . . . . . 2,378 47,777
258,553
PERU — 0.1%Credicorp, Ltd. . . . . . . . . . . . . . . 52 10,839Southern Copper Corp. . . . . . . . . . 2,695 91,980
102,819
PHILIPPINES — 0.1%Altus San Nicolas Corp. (b)(e) . . . . 371 37Ayala Land, Inc.. . . . . . . . . . . . . . 15,480 14,769International Container Terminal
Services, Inc.. . . . . . . . . . . . . . 3,420 7,945Robinsons Land Corp.. . . . . . . . . . 19,300 9,123SM Investments Corp. . . . . . . . . . . 980 18,360SM Prime Holdings, Inc. . . . . . . . . 17,000 12,201
62,435
POLAND — 0.1%Bank Polska Kasa Opieki SA . . . . . 685 17,496CD Projekt SA . . . . . . . . . . . . . . 206 12,507LPP SA . . . . . . . . . . . . . . . . . . . 1 2,145Powszechna Kasa Oszczednosci
Bank Polski SA . . . . . . . . . . . . 1,636 16,045Powszechny Zaklad Ubezpieczen
SA . . . . . . . . . . . . . . . . . . . . 2,305 21,491Santander Bank Polska SA . . . . . . . 90 7,040
76,724
PORTUGAL — 0.0% (a)Galp Energia SGPS SA . . . . . . . . . 2,383 35,917
QATAR — 0.2%Barwa Real Estate Co.. . . . . . . . . . 38,588 35,504Commercial Bank PQSC . . . . . . . . 12,224 14,470Industries Qatar QSC . . . . . . . . . . 7,110 21,304Qatar National Bank QPSC . . . . . . 12,348 65,420
136,698
ROMANIA — 0.0% (a)NEPI Rockcastle PLC . . . . . . . . . . 1,844 16,143
RUSSIA — 0.3%Magnit PJSC GDR . . . . . . . . . . . . 1,364 17,821Mobile TeleSystems PJSC ADR. . . . 3,584 29,031Moscow Exchange MICEX-RTS
PJSC (b). . . . . . . . . . . . . . . . . 17,113 24,938Polymetal International PLC . . . . . . 2,476 34,783Sberbank of Russia PJSC ADR . . . . 8,639 122,458VTB Bank PJSC GDR . . . . . . . . . 6,499 8,416X5 Retail Group NV GDR . . . . . . . 594 20,778
258,225
SAUDI ARABIA — 0.1%Al Rajhi Bank . . . . . . . . . . . . . . . 820 13,837
SPDR MSCI ACWI LOW CARBON TARGET ETFSCHEDULE OF INVESTMENTSSeptember 30, 2019
8

Security Description Shares Value
Dar Al Arkan Real EstateDevelopment Co. (b) . . . . . . . . . 2,083 $ 6,630
Etihad Etisalat Co. (b) . . . . . . . . . . 1,031 6,635National Commercial Bank . . . . . . 582 7,145Riyad Bank . . . . . . . . . . . . . . . . 1,860 12,099Samba Financial Group . . . . . . . . . 704 5,367Saudi Arabian Fertilizer Co. . . . . . . 889 19,030Saudi Arabian Mining Co. (b) . . . . . 945 11,437Saudi Telecom Co. . . . . . . . . . . . . 1,044 30,280
112,460
SINGAPORE — 0.4%CapitaLand Commercial Trust REIT. 6,400 9,580CapitaLand Mall Trust REIT. . . . . . 6,500 12,362City Developments, Ltd. . . . . . . . . 2,932 20,820DBS Group Holdings, Ltd. . . . . . . . 3,349 60,543Genting Singapore, Ltd.. . . . . . . . . 26,700 16,991Jardine Cycle & Carriage, Ltd. . . . . 800 17,355Oversea-Chinese Banking Corp.,
Ltd. . . . . . . . . . . . . . . . . . . . . 6,395 50,220SATS, Ltd. . . . . . . . . . . . . . . . . . 2,700 9,450Singapore Press Holdings, Ltd. (c) . . 9,100 13,687Singapore Technologies Engineering,
Ltd. . . . . . . . . . . . . . . . . . . . . 5,300 14,717Singapore Telecommunications, Ltd.. 20,529 46,019United Overseas Bank, Ltd. . . . . . . 1,854 34,401UOL Group, Ltd. . . . . . . . . . . . . . 992 5,380
311,525
SOUTH AFRICA — 0.6%Absa Group, Ltd. . . . . . . . . . . . . . 2,234 22,523Aspen Pharmacare Holdings, Ltd. . . 468 2,653Bid Corp., Ltd. (c) . . . . . . . . . . . . 352 7,477Discovery, Ltd. (c) . . . . . . . . . . . . 512 3,851FirstRand, Ltd. (c) . . . . . . . . . . . . 8,756 35,913Growthpoint Properties, Ltd. REIT
(c). . . . . . . . . . . . . . . . . . . . . 15,460 23,553Investec PLC. . . . . . . . . . . . . . . . 2,989 15,422Kumba Iron Ore, Ltd. (c) . . . . . . . . 1,041 25,710Liberty Holdings, Ltd. . . . . . . . . . . 1,164 8,629Momentum Metropolitan Holdings. . 1,211 1,490Mr. Price Group, Ltd. . . . . . . . . . . 817 8,527MTN Group, Ltd. (c) . . . . . . . . . . 3,290 20,895MultiChoice Group, Ltd. (b) . . . . . . 612 4,762Naspers, Ltd. Class N . . . . . . . . . . 817 123,664Nedbank Group, Ltd. . . . . . . . . . . 1,279 19,133Old Mutual, Ltd. (c) . . . . . . . . . . . 12,603 16,144Redefine Properties, Ltd. REIT . . . . 25,006 12,913RMB Holdings, Ltd. (c) . . . . . . . . . 5,246 25,984Sanlam, Ltd. . . . . . . . . . . . . . . . . 5,718 28,125SPAR Group, Ltd. . . . . . . . . . . . . 852 10,733Standard Bank Group, Ltd. . . . . . . . 3,369 38,815Truworths International, Ltd. . . . . . 1,124 3,929Vodacom Group, Ltd. . . . . . . . . . . 1,284 10,131
470,976
Security Description Shares Value
SOUTH KOREA — 1.4%Amorepacific Corp. . . . . . . . . . . . 87 $ 10,219AMOREPACIFIC Group . . . . . . . . 63 3,445BNK Financial Group, Inc. . . . . . . . 1,717 10,321Celltrion, Inc. (b) . . . . . . . . . . . . . 163 22,348CJ ENM Co., Ltd. . . . . . . . . . . . . 27 3,824Daelim Industrial Co., Ltd. . . . . . . . 290 25,214Daewoo Engineering & Construction
Co., Ltd. (b) . . . . . . . . . . . . . . 2,754 11,121Fila Korea, Ltd. . . . . . . . . . . . . . . 80 3,872GS Engineering & Construction
Corp.. . . . . . . . . . . . . . . . . . . 439 12,111Hana Financial Group, Inc. . . . . . . . 622 18,330Hanwha Life Insurance Co., Ltd. . . . 1,811 3,603Hotel Shilla Co., Ltd. . . . . . . . . . . 162 11,674Hyundai Engineering &
Construction Co., Ltd. . . . . . . . . 343 13,277Hyundai Heavy Industries Holdings
Co., Ltd.. . . . . . . . . . . . . . . . . 45 13,148Hyundai Mobis Co., Ltd. . . . . . . . . 162 34,130Hyundai Motor Co.. . . . . . . . . . . . 183 20,501Hyundai Motor Co. Preference
Shares (d) . . . . . . . . . . . . . . . . 216 15,331Hyundai Motor Co. Preference
Shares (d) . . . . . . . . . . . . . . . . 55 3,513Industrial Bank of Korea . . . . . . . . 1,173 12,945Kakao Corp. . . . . . . . . . . . . . . . . 116 13,141Kangwon Land, Inc. . . . . . . . . . . . 481 11,883KB Financial Group, Inc. . . . . . . . . 732 26,131Kia Motors Corp. . . . . . . . . . . . . . 326 12,428Korea Gas Corp. . . . . . . . . . . . . . 260 8,608Korea Shipbuilding & Offshore
Engineering Co., Ltd. (b) . . . . . . 347 35,972KT&G Corp.. . . . . . . . . . . . . . . . 296 26,107LG Electronics, Inc. . . . . . . . . . . . 222 12,509LG Household & Health Care, Ltd. . 7 7,649NAVER Corp. . . . . . . . . . . . . . . . 283 37,145NCSoft Corp. . . . . . . . . . . . . . . . 28 12,196Netmarble Corp. (b)(f) . . . . . . . . . 62 4,898S-1 Corp. . . . . . . . . . . . . . . . . . . 92 7,545Samsung Biologics Co., Ltd. (b)(f) . . 95 24,422Samsung C&T Corp. . . . . . . . . . . 186 13,948Samsung Electronics Co., Ltd.
Preference Shares . . . . . . . . . . . 1,728 57,063Samsung Electronics Co., Ltd.. . . . . 8,759 359,176Samsung Engineering Co., Ltd. (b). . 610 8,567Samsung Fire & Marine Insurance
Co., Ltd.. . . . . . . . . . . . . . . . . 44 8,203Samsung Life Insurance Co., Ltd. . . 142 8,441Samsung SDI Co., Ltd. . . . . . . . . . 92 17,152Samsung SDS Co., Ltd. . . . . . . . . . 105 16,722Shinhan Financial Group Co., Ltd. . . 767 26,803SK Holdings Co., Ltd. . . . . . . . . . . 151 25,753SK Hynix, Inc. . . . . . . . . . . . . . . 1,109 76,211SK Telecom Co., Ltd. . . . . . . . . . . 42 8,480Woongjin Coway Co., Ltd. . . . . . . . 190 13,438
SPDR MSCI ACWI LOW CARBON TARGET ETFSCHEDULE OF INVESTMENTSSeptember 30, 2019
9

Security Description Shares Value
Woori Financial Group, Inc. . . . . . . 667 $ 6,942
1,136,460
SPAIN — 1.0%Aena SME SA (f). . . . . . . . . . . . . 422 77,291Amadeus IT Group SA . . . . . . . . . 895 64,125Banco Bilbao Vizcaya Argentaria
SA . . . . . . . . . . . . . . . . . . . . 13,830 72,078Banco de Sabadell SA . . . . . . . . . . 7,096 6,887Banco Santander SA . . . . . . . . . . . 29,679 120,898Banco Santander SA (b) . . . . . . . . 1,882 7,654CaixaBank SA. . . . . . . . . . . . . . . 2,742 7,204Enagas SA . . . . . . . . . . . . . . . . . 1,376 31,892Ferrovial SA . . . . . . . . . . . . . . . . 2,625 75,866Grifols SA . . . . . . . . . . . . . . . . . 687 20,252Industria de Diseno Textil SA . . . . . 2,876 89,046Mapfre SA . . . . . . . . . . . . . . . . . 9,383 25,277Red Electrica Corp. SA . . . . . . . . . 5,185 105,338Siemens Gamesa Renewable Energy
SA (c) . . . . . . . . . . . . . . . . . . 1,402 19,029Telefonica SA . . . . . . . . . . . . . . . 12,401 94,650
817,487
SWEDEN — 0.8%Alfa Laval AB . . . . . . . . . . . . . . . 711 14,051Assa Abloy AB Class B . . . . . . . . . 2,790 62,172Atlas Copco AB Class A . . . . . . . . 228 7,031Atlas Copco AB Class B . . . . . . . . 1,598 43,362Autoliv, Inc. (c) . . . . . . . . . . . . . . 32 2,524Boliden AB . . . . . . . . . . . . . . . . 3,378 77,732Epiroc AB Class A . . . . . . . . . . . . 228 2,474Hennes & Mauritz AB Class B (c) . . 2,125 41,246Hexagon AB Class B . . . . . . . . . . 454 21,915ICA Gruppen AB . . . . . . . . . . . . . 384 17,762Industrivarden AB Class C . . . . . . . 1,883 41,271Investor AB Class B . . . . . . . . . . . 1,667 81,569Kinnevik AB Class B . . . . . . . . . . 1,465 38,576Sandvik AB . . . . . . . . . . . . . . . . 1,316 20,525Securitas AB Class B . . . . . . . . . . 400 6,135Skandinaviska Enskilda Banken AB
Class A . . . . . . . . . . . . . . . . . 1,220 11,227Skanska AB Class B . . . . . . . . . . . 966 19,591Svenska Handelsbanken AB Class A. 2,168 20,326Swedbank AB Class A. . . . . . . . . . 922 13,288Swedish Match AB. . . . . . . . . . . . 189 7,826Tele2 AB Class B (c). . . . . . . . . . . 513 7,644Telefonaktiebolaget LM Ericsson
Class B . . . . . . . . . . . . . . . . . 6,164 49,314Telia Co. AB . . . . . . . . . . . . . . . . 4,385 19,655Volvo AB Class B . . . . . . . . . . . . 3,480 48,932
676,148
SWITZERLAND — 2.7%ABB, Ltd. . . . . . . . . . . . . . . . . . 2,932 57,661Adecco Group AG . . . . . . . . . . . . 490 27,135Chocoladefabriken Lindt &
Spruengli AG . . . . . . . . . . . . . 7 51,737Cie Financiere Richemont SA . . . . . 996 73,136
Security Description Shares Value
Coca-Cola HBC AG . . . . . . . . . . . 237 $ 7,760Credit Suisse Group AG (b) . . . . . . 2,295 28,160EMS-Chemie Holding AG . . . . . . . 28 17,452Geberit AG . . . . . . . . . . . . . . . . . 97 46,362Givaudan SA . . . . . . . . . . . . . . . 27 75,383Kuehne + Nagel International AG . . 106 15,627Lonza Group AG . . . . . . . . . . . . . 80 27,069Nestle SA. . . . . . . . . . . . . . . . . . 5,399 586,275Novartis AG . . . . . . . . . . . . . . . . 3,772 327,362Roche Holding AG . . . . . . . . . . . . 1,256 365,848Schindler Holding AG . . . . . . . . . . 55 12,311SGS SA . . . . . . . . . . . . . . . . . . . 15 37,216Sika AG. . . . . . . . . . . . . . . . . . . 516 75,551Sonova Holding AG . . . . . . . . . . . 47 10,935STMicroelectronics NV. . . . . . . . . 463 8,949Swatch Group AG . . . . . . . . . . . . 64 17,002Swiss Life Holding AG . . . . . . . . . 16 7,655Swiss Re AG. . . . . . . . . . . . . . . . 481 50,215Swisscom AG . . . . . . . . . . . . . . . 52 25,673TE Connectivity, Ltd. . . . . . . . . . . 740 68,953Temenos AG . . . . . . . . . . . . . . . . 83 13,901UBS Group AG (b). . . . . . . . . . . . 6,335 71,981Vifor Pharma AG . . . . . . . . . . . . . 114 18,229Zurich Insurance Group AG . . . . . . 297 113,778
2,239,316
TAIWAN — 1.2%Acer, Inc. . . . . . . . . . . . . . . . . . . 2,000 1,147Asustek Computer, Inc. . . . . . . . . . 2,000 13,312Catcher Technology Co., Ltd. . . . . . 1,000 7,575Cathay Financial Holding Co., Ltd.. . 28,000 36,913Chailease Holding Co., Ltd. . . . . . . 2,307 9,295Chang Hwa Commercial Bank, Ltd. . 8,140 5,680China Development Financial
Holding Corp. . . . . . . . . . . . . . 44,000 13,105China Life Insurance Co., Ltd. (b) . . 7,382 5,853Chunghwa Telecom Co., Ltd. . . . . . 11,000 39,356CTBC Financial Holding Co., Ltd. . . 45,359 30,118Delta Electronics, Inc. . . . . . . . . . . 2,000 8,542Fubon Financial Holding Co., Ltd. . . 24,000 34,463Hiwin Technologies Corp. . . . . . . . 175 1,526Hon Hai Precision Industry Co.,
Ltd. . . . . . . . . . . . . . . . . . . . . 24,656 58,174Hotai Motor Co., Ltd. . . . . . . . . . . 1,000 15,198Hua Nan Financial Holdings Co.,
Ltd. . . . . . . . . . . . . . . . . . . . . 20,035 13,529MediaTek, Inc. . . . . . . . . . . . . . . 6,000 71,363Mega Financial Holding Co., Ltd. . . 31,922 29,582Novatek Microelectronics Corp. . . . 2,000 11,475President Chain Store Corp. . . . . . . 1,000 9,347Ruentex Development Co., Ltd. . . . . 11,000 14,714Ruentex Industries, Ltd.. . . . . . . . . 6,400 13,801Shin Kong Financial Holding Co.,
Ltd. . . . . . . . . . . . . . . . . . . . . 62,568 18,937SinoPac Financial Holdings Co.,
Ltd. . . . . . . . . . . . . . . . . . . . . 65,160 25,413
SPDR MSCI ACWI LOW CARBON TARGET ETFSCHEDULE OF INVESTMENTSSeptember 30, 2019
10
Security Description Shares Value
Synnex Technology InternationalCorp.. . . . . . . . . . . . . . . . . . . 16,000 $ 18,721
Taishin Financial Holding Co., Ltd. . 70,957 31,677Taiwan Business Bank. . . . . . . . . . 27,300 11,219Taiwan Cooperative Financial
Holding Co., Ltd. . . . . . . . . . . . 25,863 17,089Taiwan Mobile Co., Ltd. . . . . . . . . 1,000 3,610Taiwan Semiconductor
Manufacturing Co., Ltd. . . . . . . . 46,000 403,294Tatung Co., Ltd. (b) . . . . . . . . . . . 2,000 1,096Uni-President Enterprises Corp.. . . . 11,000 26,521Yageo Corp. . . . . . . . . . . . . . . . . 198 1,573Yuanta Financial Holding Co., Ltd.. . 36,573 21,809
1,025,027
THAILAND — 0.3%Airports of Thailand PCL. . . . . . . . 17,400 42,526Bangkok Bank PCL NVDR . . . . . . 2,600 14,749Bangkok Dusit Medical Services
PCL NVDR . . . . . . . . . . . . . . 14,600 11,552Bangkok Expressway & Metro PCL
NVDR . . . . . . . . . . . . . . . . . . 45,100 15,925BTS Group Holdings PCL NVDR . . 22,600 9,902CP ALL PCL . . . . . . . . . . . . . . . 9,064 24,079Energy Absolute PCL NVDR . . . . . 8,900 13,968Kasikornbank PCL . . . . . . . . . . . . 2,600 13,346Kasikornbank PCL NVDR . . . . . . . 2,700 13,816Krung Thai Bank PCL. . . . . . . . . . 34,000 19,120Minor International PCL NVDR . . . 8,800 10,790Siam Commercial Bank PCL
NVDR . . . . . . . . . . . . . . . . . . 2,500 9,645Siam Commercial Bank PCL . . . . . 3,600 13,889
213,307
TURKEY — 0.1%Akbank T.A.S. (b) . . . . . . . . . . . . 21,014 30,219TAV Havalimanlari Holding A/S . . . 1,521 6,357Turkiye Garanti Bankasi A/S (b) . . . 9,259 16,742Turkiye Is Bankasi A/S Class C (b) . . 16,081 17,857
71,175
UNITED ARAB EMIRATES —0.1%
Emirates Telecommunications GroupCo. PJSC . . . . . . . . . . . . . . . . 7,710 34,634
NMC Health PLC (c) . . . . . . . . . . 250 8,349
42,983
UNITED KINGDOM — 5.0%3i Group PLC . . . . . . . . . . . . . . . 3,599 51,735Ashtead Group PLC . . . . . . . . . . . 898 25,054AstraZeneca PLC. . . . . . . . . . . . . 2,306 206,335Auto Trader Group PLC (f). . . . . . . 1,464 9,201Aviva PLC . . . . . . . . . . . . . . . . . 11,911 58,609BAE Systems PLC . . . . . . . . . . . . 4,913 34,509Barclays PLC . . . . . . . . . . . . . . . 31,570 58,511Barratt Developments PLC. . . . . . . 3,489 27,861Berkeley Group Holdings PLC . . . . 341 17,561
Security Description Shares Value
British American Tobacco PLC ADR(c). . . . . . . . . . . . . . . . . . . . . 4,308 $ 158,965
British Land Co. PLC REIT . . . . . . 6,547 47,181BT Group PLC . . . . . . . . . . . . . . 13,487 29,680Bunzl PLC . . . . . . . . . . . . . . . . . 1,140 29,852Burberry Group PLC . . . . . . . . . . 996 26,683Capri Holdings, Ltd. (b). . . . . . . . . 393 13,032CNH Industrial NV . . . . . . . . . . . 1,821 18,542Coca-Cola European Partners PLC . . 205 11,367Compass Group PLC . . . . . . . . . . 4,122 106,315Croda International PLC . . . . . . . . 344 20,602DCC PLC . . . . . . . . . . . . . . . . . 292 25,534Diageo PLC . . . . . . . . . . . . . . . . 4,245 174,353Direct Line Insurance Group PLC . . 2,403 8,890Experian PLC . . . . . . . . . . . . . . . 3,428 109,790Fiat Chrysler Automobiles NV . . . . 1,604 20,760GlaxoSmithKline PLC . . . . . . . . . 9,608 206,559GVC Holdings PLC . . . . . . . . . . . 1,585 14,520Hargreaves Lansdown PLC. . . . . . . 297 7,609HSBC Holdings PLC . . . . . . . . . . 38,974 299,981Imperial Brands PLC . . . . . . . . . . 2,117 47,694Informa PLC. . . . . . . . . . . . . . . . 2,961 31,088Intertek Group PLC . . . . . . . . . . . 384 25,922ITV PLC . . . . . . . . . . . . . . . . . . 6,975 10,821John Wood Group PLC . . . . . . . . . 5,731 26,830Johnson Matthey PLC . . . . . . . . . . 873 32,887Kingfisher PLC . . . . . . . . . . . . . . 5,346 13,624Land Securities Group PLC REIT . . 3,713 39,185Legal & General Group PLC. . . . . . 19,433 59,485Liberty Global PLC Class A (b). . . . 453 11,212Linde PLC . . . . . . . . . . . . . . . . . 800 154,976Lloyds Banking Group PLC . . . . . . 147,605 98,441London Stock Exchange Group PLC. 460 41,426Marks & Spencer Group PLC . . . . . 2,853 6,485Meggitt PLC . . . . . . . . . . . . . . . . 3,081 24,109Melrose Industries PLC . . . . . . . . . 9,806 24,361Merlin Entertainments PLC (f) . . . . 2,763 15,403National Grid PLC . . . . . . . . . . . . 6,122 66,532Next PLC. . . . . . . . . . . . . . . . . . 319 24,317Pearson PLC . . . . . . . . . . . . . . . . 2,422 22,027Pentair PLC . . . . . . . . . . . . . . . . 17 643Persimmon PLC. . . . . . . . . . . . . . 781 20,885Prudential PLC . . . . . . . . . . . . . . 4,974 90,409Reckitt Benckiser Group PLC . . . . . 1,302 101,787RELX PLC. . . . . . . . . . . . . . . . . 2,891 68,847RELX PLC. . . . . . . . . . . . . . . . . 2,340 55,690Rio Tinto PLC . . . . . . . . . . . . . . . 2,404 124,689Rolls-Royce Holdings PLC. . . . . . . 4,110 40,133Royal Bank of Scotland Group PLC . 479 1,225RSA Insurance Group PLC. . . . . . . 3,243 21,348Sage Group PLC . . . . . . . . . . . . . 2,177 18,548Schroders PLC . . . . . . . . . . . . . . 206 7,806Segro PLC REIT . . . . . . . . . . . . . 2,805 28,026Severn Trent PLC. . . . . . . . . . . . . 2,563 68,379Smith & Nephew PLC. . . . . . . . . . 1,900 45,867Smiths Group PLC . . . . . . . . . . . . 745 14,414
SPDR MSCI ACWI LOW CARBON TARGET ETFSCHEDULE OF INVESTMENTSSeptember 30, 2019
11
Security Description Shares Value
St James’s Place PLC . . . . . . . . . . 933 $ 11,260Standard Chartered PLC . . . . . . . . 6,692 56,423Standard Life Aberdeen PLC . . . . . 10,214 35,973Taylor Wimpey PLC . . . . . . . . . . . 10,313 20,525TechnipFMC PLC . . . . . . . . . . . . 2,823 67,739Tesco PLC . . . . . . . . . . . . . . . . . 17,228 51,164Unilever NV . . . . . . . . . . . . . . . . 2,799 168,289Unilever PLC . . . . . . . . . . . . . . . 2,026 122,086United Utilities Group PLC . . . . . . 8,495 86,448Vodafone Group PLC . . . . . . . . . . 53,934 107,670Weir Group PLC . . . . . . . . . . . . . 728 12,788Whitbread PLC . . . . . . . . . . . . . . 469 24,817WPP PLC . . . . . . . . . . . . . . . . . 2,943 36,919
4,107,213
UNITED STATES — 54.6%3M Co. . . . . . . . . . . . . . . . . . . . 1,082 177,881Abbott Laboratories . . . . . . . . . . . 3,320 277,784AbbVie, Inc. . . . . . . . . . . . . . . . . 2,668 202,021ABIOMED, Inc. (b) . . . . . . . . . . . 52 9,250Activision Blizzard, Inc. . . . . . . . . 1,248 66,044Acuity Brands, Inc.. . . . . . . . . . . . 101 13,614Adobe, Inc. (b) . . . . . . . . . . . . . . 854 235,917Advance Auto Parts, Inc. . . . . . . . . 117 19,352Advanced Micro Devices, Inc. (b)(c). 1,851 53,660Affiliated Managers Group, Inc. . . . 52 4,334Aflac, Inc. . . . . . . . . . . . . . . . . . 1,962 102,652Agilent Technologies, Inc. . . . . . . . 710 54,407AGNC Investment Corp. REIT . . . . 1,378 22,172Akamai Technologies, Inc. (b) . . . . . 339 30,978Albemarle Corp. (c) . . . . . . . . . . . 340 23,637Alexandria Real Estate Equities, Inc.
REIT . . . . . . . . . . . . . . . . . . . 143 22,028Alexion Pharmaceuticals, Inc. (b). . . 355 34,769Align Technology, Inc. (b) . . . . . . . 143 25,872Alleghany Corp. (b) . . . . . . . . . . . 10 7,978Allegion PLC . . . . . . . . . . . . . . . 205 21,248Allergan PLC . . . . . . . . . . . . . . . 662 111,408Alliance Data Systems Corp. . . . . . 90 11,532Allstate Corp. . . . . . . . . . . . . . . . 726 78,902Ally Financial, Inc. . . . . . . . . . . . . 1,115 36,973Alphabet, Inc. Class A (b) . . . . . . . 563 687,502Alphabet, Inc. Class C (b) . . . . . . . 521 635,099Altria Group, Inc.. . . . . . . . . . . . . 3,533 144,500Amazon.com, Inc. (b) . . . . . . . . . . 727 1,262,007AMERCO . . . . . . . . . . . . . . . . . 52 20,282American Express Co.. . . . . . . . . . 1,522 180,022American International Group, Inc. . 2,158 120,201American Tower Corp. REIT. . . . . . 834 184,422American Water Works Co., Inc. . . . 2,117 262,995Ameriprise Financial, Inc. . . . . . . . 252 37,069AmerisourceBergen Corp. . . . . . . . 272 22,394AMETEK, Inc. . . . . . . . . . . . . . . 252 23,139Amgen, Inc. . . . . . . . . . . . . . . . . 1,184 229,116Amphenol Corp. Class A . . . . . . . . 299 28,854Analog Devices, Inc. . . . . . . . . . . . 879 98,211
Security Description Shares Value
Annaly Capital Management, Inc.REIT . . . . . . . . . . . . . . . . . . . 3,156 $ 27,773
ANSYS, Inc. (b) . . . . . . . . . . . . . 65 14,388Anthem, Inc. . . . . . . . . . . . . . . . . 479 115,008AO Smith Corp.. . . . . . . . . . . . . . 479 22,853Aon PLC . . . . . . . . . . . . . . . . . . 459 88,849Apple, Inc. . . . . . . . . . . . . . . . . . 8,279 1,854,248Applied Materials, Inc. . . . . . . . . . 1,778 88,722Aptiv PLC . . . . . . . . . . . . . . . . . 504 44,060Arch Capital Group, Ltd. (b) . . . . . . 579 24,306Arista Networks, Inc. (b) . . . . . . . . 42 10,035Assurant, Inc. . . . . . . . . . . . . . . . 101 12,708AT&T, Inc. . . . . . . . . . . . . . . . . . 13,360 505,542Athene Holding, Ltd. Class A (b) . . . 272 11,440Atmos Energy Corp. . . . . . . . . . . . 1,959 223,111Autodesk, Inc. (b) . . . . . . . . . . . . 413 61,000Automatic Data Processing, Inc. . . . 898 144,955AutoZone, Inc. (b) . . . . . . . . . . . . 63 68,331AvalonBay Communities, Inc. REIT . 312 67,183Avery Dennison Corp. . . . . . . . . . . 457 51,901AXA Equitable Holdings, Inc.. . . . . 699 15,490Axalta Coating Systems, Ltd. (b) . . . 1,344 40,522Baker Hughes a GE Co. . . . . . . . . . 5,546 128,667Ball Corp. . . . . . . . . . . . . . . . . . 804 58,539Bank of America Corp. . . . . . . . . . 16,026 467,478Bank of New York Mellon Corp. . . . 1,532 69,262Baxter International, Inc. . . . . . . . . 808 70,676BB&T Corp. . . . . . . . . . . . . . . . . 1,457 77,760Becton Dickinson and Co. . . . . . . . 516 130,527Berkshire Hathaway, Inc. Class B
(b) . . . . . . . . . . . . . . . . . . . . 2,243 466,589Best Buy Co., Inc. . . . . . . . . . . . . 478 32,977Biogen, Inc. (b) . . . . . . . . . . . . . . 337 78,460BioMarin Pharmaceutical, Inc. (b) . . 153 10,312BlackRock, Inc. . . . . . . . . . . . . . . 256 114,084Boeing Co. . . . . . . . . . . . . . . . . . 1,033 393,026Booking Holdings, Inc. (b) . . . . . . . 99 194,298BorgWarner, Inc. . . . . . . . . . . . . . 253 9,280Boston Properties, Inc. REIT . . . . . 206 26,710Boston Scientific Corp. (b). . . . . . . 2,632 107,096Brighthouse Financial, Inc. (b) . . . . 373 15,095Bristol-Myers Squibb Co.. . . . . . . . 2,927 148,428Broadcom, Inc. . . . . . . . . . . . . . . 688 189,936Broadridge Financial Solutions, Inc. . 205 25,508Brown-Forman Corp. Class B . . . . . 622 39,049Burlington Stores, Inc. (b) . . . . . . . 52 10,391C.H. Robinson Worldwide, Inc. (c) . . 274 23,230Cadence Design Systems, Inc. (b) . . 376 24,846Capital One Financial Corp. . . . . . . 1,058 96,257Cardinal Health, Inc. . . . . . . . . . . . 621 29,305CarMax, Inc. (b)(c). . . . . . . . . . . . 270 23,760Caterpillar, Inc. . . . . . . . . . . . . . . 1,046 132,120Cboe Global Markets, Inc. . . . . . . . 101 11,606CBRE Group, Inc. Class A (b). . . . . 736 39,015CBS Corp. Class B. . . . . . . . . . . . 323 13,040CDW Corp. . . . . . . . . . . . . . . . . 153 18,856
SPDR MSCI ACWI LOW CARBON TARGET ETFSCHEDULE OF INVESTMENTSSeptember 30, 2019
12
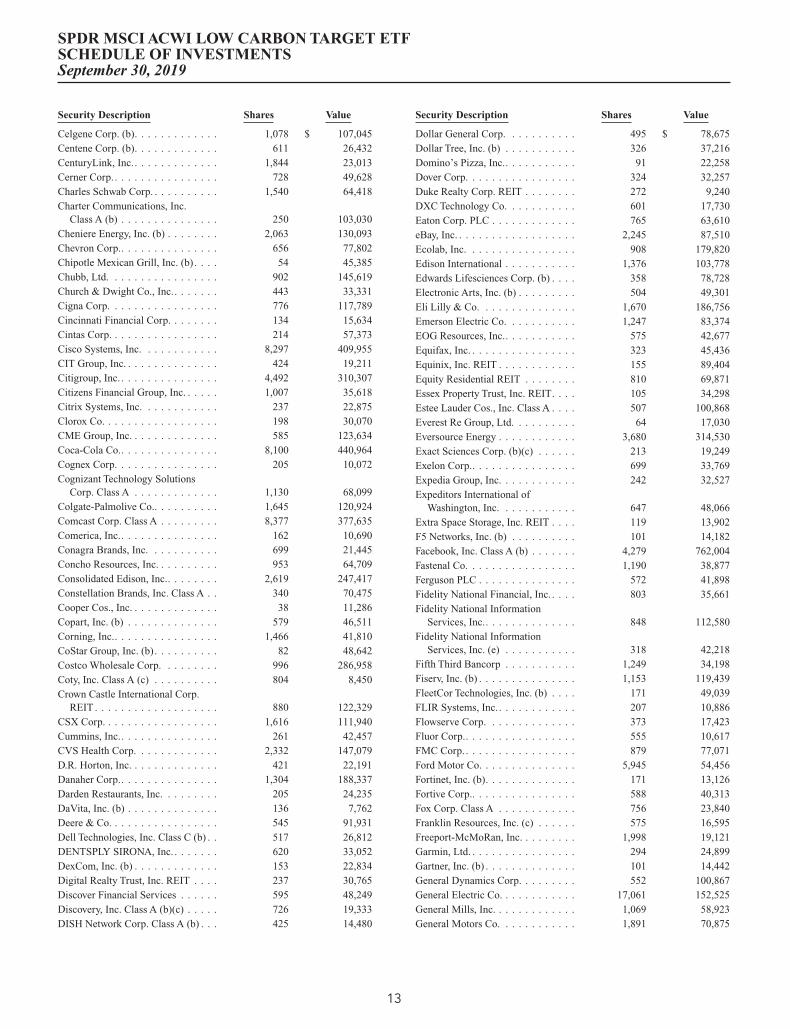
Security Description Shares Value
Celgene Corp. (b). . . . . . . . . . . . . 1,078 $ 107,045Centene Corp. (b). . . . . . . . . . . . . 611 26,432CenturyLink, Inc.. . . . . . . . . . . . . 1,844 23,013Cerner Corp. . . . . . . . . . . . . . . . . 728 49,628Charles Schwab Corp. . . . . . . . . . . 1,540 64,418Charter Communications, Inc.
Class A (b) . . . . . . . . . . . . . . . 250 103,030Cheniere Energy, Inc. (b) . . . . . . . . 2,063 130,093Chevron Corp.. . . . . . . . . . . . . . . 656 77,802Chipotle Mexican Grill, Inc. (b) . . . . 54 45,385Chubb, Ltd. . . . . . . . . . . . . . . . . 902 145,619Church & Dwight Co., Inc.. . . . . . . 443 33,331Cigna Corp. . . . . . . . . . . . . . . . . 776 117,789Cincinnati Financial Corp. . . . . . . . 134 15,634Cintas Corp. . . . . . . . . . . . . . . . . 214 57,373Cisco Systems, Inc. . . . . . . . . . . . 8,297 409,955CIT Group, Inc. . . . . . . . . . . . . . . 424 19,211Citigroup, Inc. . . . . . . . . . . . . . . . 4,492 310,307Citizens Financial Group, Inc. . . . . . 1,007 35,618Citrix Systems, Inc. . . . . . . . . . . . 237 22,875Clorox Co. . . . . . . . . . . . . . . . . . 198 30,070CME Group, Inc. . . . . . . . . . . . . . 585 123,634Coca-Cola Co.. . . . . . . . . . . . . . . 8,100 440,964Cognex Corp. . . . . . . . . . . . . . . . 205 10,072Cognizant Technology Solutions
Corp. Class A . . . . . . . . . . . . . 1,130 68,099Colgate-Palmolive Co.. . . . . . . . . . 1,645 120,924Comcast Corp. Class A . . . . . . . . . 8,377 377,635Comerica, Inc.. . . . . . . . . . . . . . . 162 10,690Conagra Brands, Inc. . . . . . . . . . . 699 21,445Concho Resources, Inc. . . . . . . . . . 953 64,709Consolidated Edison, Inc.. . . . . . . . 2,619 247,417Constellation Brands, Inc. Class A . . 340 70,475Cooper Cos., Inc. . . . . . . . . . . . . . 38 11,286Copart, Inc. (b) . . . . . . . . . . . . . . 579 46,511Corning, Inc.. . . . . . . . . . . . . . . . 1,466 41,810CoStar Group, Inc. (b). . . . . . . . . . 82 48,642Costco Wholesale Corp. . . . . . . . . 996 286,958Coty, Inc. Class A (c) . . . . . . . . . . 804 8,450Crown Castle International Corp.
REIT . . . . . . . . . . . . . . . . . . . 880 122,329CSX Corp. . . . . . . . . . . . . . . . . . 1,616 111,940Cummins, Inc.. . . . . . . . . . . . . . . 261 42,457CVS Health Corp. . . . . . . . . . . . . 2,332 147,079D.R. Horton, Inc. . . . . . . . . . . . . . 421 22,191Danaher Corp.. . . . . . . . . . . . . . . 1,304 188,337Darden Restaurants, Inc. . . . . . . . . 205 24,235DaVita, Inc. (b) . . . . . . . . . . . . . . 136 7,762Deere & Co. . . . . . . . . . . . . . . . . 545 91,931Dell Technologies, Inc. Class C (b) . . 517 26,812DENTSPLY SIRONA, Inc. . . . . . . . 620 33,052DexCom, Inc. (b) . . . . . . . . . . . . . 153 22,834Digital Realty Trust, Inc. REIT . . . . 237 30,765Discover Financial Services . . . . . . 595 48,249Discovery, Inc. Class A (b)(c) . . . . . 726 19,333DISH Network Corp. Class A (b) . . . 425 14,480
Security Description Shares Value
Dollar General Corp. . . . . . . . . . . 495 $ 78,675Dollar Tree, Inc. (b) . . . . . . . . . . . 326 37,216Domino’s Pizza, Inc.. . . . . . . . . . . 91 22,258Dover Corp. . . . . . . . . . . . . . . . . 324 32,257Duke Realty Corp. REIT . . . . . . . . 272 9,240DXC Technology Co. . . . . . . . . . . 601 17,730Eaton Corp. PLC . . . . . . . . . . . . . 765 63,610eBay, Inc. . . . . . . . . . . . . . . . . . . 2,245 87,510Ecolab, Inc. . . . . . . . . . . . . . . . . 908 179,820Edison International . . . . . . . . . . . 1,376 103,778Edwards Lifesciences Corp. (b) . . . . 358 78,728Electronic Arts, Inc. (b) . . . . . . . . . 504 49,301Eli Lilly & Co. . . . . . . . . . . . . . . 1,670 186,756Emerson Electric Co. . . . . . . . . . . 1,247 83,374EOG Resources, Inc.. . . . . . . . . . . 575 42,677Equifax, Inc. . . . . . . . . . . . . . . . . 323 45,436Equinix, Inc. REIT . . . . . . . . . . . . 155 89,404Equity Residential REIT . . . . . . . . 810 69,871Essex Property Trust, Inc. REIT. . . . 105 34,298Estee Lauder Cos., Inc. Class A . . . . 507 100,868Everest Re Group, Ltd. . . . . . . . . . 64 17,030Eversource Energy . . . . . . . . . . . . 3,680 314,530Exact Sciences Corp. (b)(c) . . . . . . 213 19,249Exelon Corp.. . . . . . . . . . . . . . . . 699 33,769Expedia Group, Inc. . . . . . . . . . . . 242 32,527Expeditors International of
Washington, Inc. . . . . . . . . . . . 647 48,066Extra Space Storage, Inc. REIT . . . . 119 13,902F5 Networks, Inc. (b) . . . . . . . . . . 101 14,182Facebook, Inc. Class A (b) . . . . . . . 4,279 762,004Fastenal Co. . . . . . . . . . . . . . . . . 1,190 38,877Ferguson PLC . . . . . . . . . . . . . . . 572 41,898Fidelity National Financial, Inc. . . . . 803 35,661Fidelity National Information
Services, Inc.. . . . . . . . . . . . . . 848 112,580Fidelity National Information
Services, Inc. (e) . . . . . . . . . . . 318 42,218Fifth Third Bancorp . . . . . . . . . . . 1,249 34,198Fiserv, Inc. (b) . . . . . . . . . . . . . . . 1,153 119,439FleetCor Technologies, Inc. (b) . . . . 171 49,039FLIR Systems, Inc.. . . . . . . . . . . . 207 10,886Flowserve Corp. . . . . . . . . . . . . . 373 17,423Fluor Corp.. . . . . . . . . . . . . . . . . 555 10,617FMC Corp. . . . . . . . . . . . . . . . . . 879 77,071Ford Motor Co. . . . . . . . . . . . . . . 5,945 54,456Fortinet, Inc. (b). . . . . . . . . . . . . . 171 13,126Fortive Corp.. . . . . . . . . . . . . . . . 588 40,313Fox Corp. Class A . . . . . . . . . . . . 756 23,840Franklin Resources, Inc. (c) . . . . . . 575 16,595Freeport-McMoRan, Inc. . . . . . . . . 1,998 19,121Garmin, Ltd. . . . . . . . . . . . . . . . . 294 24,899Gartner, Inc. (b) . . . . . . . . . . . . . . 101 14,442General Dynamics Corp. . . . . . . . . 552 100,867General Electric Co. . . . . . . . . . . . 17,061 152,525General Mills, Inc. . . . . . . . . . . . . 1,069 58,923General Motors Co. . . . . . . . . . . . 1,891 70,875
SPDR MSCI ACWI LOW CARBON TARGET ETFSCHEDULE OF INVESTMENTSSeptember 30, 2019
13

Security Description Shares Value
Genuine Parts Co. . . . . . . . . . . . . 207 $ 20,615Gilead Sciences, Inc.. . . . . . . . . . . 2,423 153,570Global Payments, Inc. . . . . . . . . . . 321 51,039GoDaddy, Inc. Class A (b) . . . . . . . 101 6,664Goldman Sachs Group, Inc. . . . . . . 662 137,186GrubHub, Inc. (b)(c) . . . . . . . . . . . 205 11,523H&R Block, Inc. (c) . . . . . . . . . . . 375 8,858Halliburton Co. . . . . . . . . . . . . . . 4,068 76,682Harley-Davidson, Inc. (c) . . . . . . . . 457 16,438Hartford Financial Services Group,
Inc. . . . . . . . . . . . . . . . . . . . . 780 47,276Hasbro, Inc. . . . . . . . . . . . . . . . . 276 32,758HCA Healthcare, Inc. . . . . . . . . . . 424 51,058HCP, Inc. REIT . . . . . . . . . . . . . . 425 15,143HD Supply Holdings, Inc. (b) . . . . . 404 15,827Helmerich & Payne, Inc. . . . . . . . . 1,130 45,279Henry Schein, Inc. (b) . . . . . . . . . . 153 9,716Hershey Co. . . . . . . . . . . . . . . . . 192 29,758Hewlett Packard Enterprise Co. . . . . 3,224 48,908Hilton Worldwide Holdings, Inc. . . . 153 14,246HollyFrontier Corp. . . . . . . . . . . . 1,494 80,138Hologic, Inc. (b) . . . . . . . . . . . . . 376 18,984Home Depot, Inc.. . . . . . . . . . . . . 2,091 485,154Honeywell International, Inc. . . . . . 1,626 275,119Host Hotels & Resorts, Inc. REIT . . 1,826 31,572HP, Inc. . . . . . . . . . . . . . . . . . . . 3,476 65,766Humana, Inc. . . . . . . . . . . . . . . . 267 68,264Huntington Bancshares, Inc. . . . . . . 450 6,422Huntington Ingalls Industries, Inc. . . 43 9,107IAC/InterActiveCorp (b) . . . . . . . . 101 22,015IDEXX Laboratories, Inc. (b) . . . . . 143 38,886IHS Markit, Ltd. (b) . . . . . . . . . . . 1,118 74,772Illinois Tool Works, Inc.. . . . . . . . . 591 92,486Illumina, Inc. (b) . . . . . . . . . . . . . 242 73,621Incyte Corp. (b) . . . . . . . . . . . . . . 168 12,471Ingersoll-Rand PLC . . . . . . . . . . . 468 57,662Intel Corp. . . . . . . . . . . . . . . . . . 8,152 420,073Intercontinental Exchange, Inc. . . . . 821 75,754International Business Machines
Corp.. . . . . . . . . . . . . . . . . . . 1,880 273,390International Flavors & Fragrances,
Inc. (c)(d) . . . . . . . . . . . . . . . . 287 35,212International Flavors & Fragrances,
Inc. (d). . . . . . . . . . . . . . . . . . 70 8,426Interpublic Group of Cos., Inc. . . . . 541 11,664Intuit, Inc. . . . . . . . . . . . . . . . . . 460 122,332Intuitive Surgical, Inc. (b). . . . . . . . 217 117,165Invesco, Ltd. . . . . . . . . . . . . . . . . 594 10,062Invitation Homes, Inc. REIT . . . . . . 323 9,564IPG Photonics Corp. (b) . . . . . . . . 52 7,051IQVIA Holdings, Inc. (b) . . . . . . . . 223 33,312J.M. Smucker Co.. . . . . . . . . . . . . 170 18,703Jack Henry & Associates, Inc. . . . . . 153 22,333Jacobs Engineering Group, Inc. . . . . 693 63,409Johnson & Johnson. . . . . . . . . . . . 4,967 642,630Johnson Controls International PLC . 1,522 66,801
Security Description Shares Value
Jones Lang LaSalle, Inc. . . . . . . . . 143 $ 19,886JPMorgan Chase & Co. . . . . . . . . . 5,766 678,601Juniper Networks, Inc.. . . . . . . . . . 421 10,420Kellogg Co. . . . . . . . . . . . . . . . . 237 15,251KeyCorp . . . . . . . . . . . . . . . . . . 1,038 18,518Keysight Technologies, Inc. (b) . . . . 205 19,936Kimberly-Clark Corp. . . . . . . . . . . 323 45,882Kimco Realty Corp. REIT . . . . . . . 949 19,815Kinder Morgan, Inc. . . . . . . . . . . . 6,038 124,443KKR & Co., Inc. Class A (c). . . . . . 1,100 29,535KLA Corp. . . . . . . . . . . . . . . . . . 244 38,906Kohl’s Corp. . . . . . . . . . . . . . . . . 153 7,598Kraft Heinz Co. . . . . . . . . . . . . . . 1,307 36,511Kroger Co. . . . . . . . . . . . . . . . . . 354 9,126L Brands, Inc. . . . . . . . . . . . . . . . 260 5,093L3Harris Technologies, Inc. . . . . . . 408 85,125Laboratory Corp. of America
Holdings (b) . . . . . . . . . . . . . . 146 24,528Lam Research Corp. . . . . . . . . . . . 263 60,782Lamb Weston Holdings, Inc. . . . . . . 205 14,908Las Vegas Sands Corp. . . . . . . . . . 1,051 60,706Lear Corp. . . . . . . . . . . . . . . . . . 52 6,131Leidos Holdings, Inc. . . . . . . . . . . 276 23,703Lennar Corp. Class A . . . . . . . . . . 413 23,066Lennox International, Inc. . . . . . . . 101 24,540Liberty Media Corp.-Liberty
Formula One Class C (b) . . . . . . 577 23,997Liberty Media Corp.-Liberty
SiriusXM Class A (b) . . . . . . . . 528 21,949Lincoln National Corp. . . . . . . . . . 359 21,655Live Nation Entertainment, Inc. (b) . 153 10,150LKQ Corp. (b) . . . . . . . . . . . . . . 667 20,977Lockheed Martin Corp. . . . . . . . . . 394 153,684Loews Corp. . . . . . . . . . . . . . . . . 1,003 51,634Lowe’s Cos., Inc. . . . . . . . . . . . . . 1,475 162,191Lululemon Athletica, Inc. (b) . . . . . 207 39,854M&T Bank Corp.. . . . . . . . . . . . . 226 35,701Macerich Co. REIT (c) . . . . . . . . . 317 10,014Macy’s, Inc. (c) . . . . . . . . . . . . . . 150 2,331ManpowerGroup, Inc. . . . . . . . . . . 313 26,367Marathon Petroleum Corp. . . . . . . . 2,868 174,231Markel Corp. (b) . . . . . . . . . . . . . 25 29,548Marriott International, Inc. Class A. . 136 16,914Marsh & McLennan Cos., Inc. . . . . 1,124 112,456Masco Corp. . . . . . . . . . . . . . . . . 898 37,429Mastercard, Inc. Class A . . . . . . . . 1,702 462,212Maxim Integrated Products, Inc. . . . 400 23,164McCormick & Co., Inc. . . . . . . . . . 279 43,608McDonald’s Corp. . . . . . . . . . . . . 1,491 320,133McKesson Corp. . . . . . . . . . . . . . 418 57,124Medtronic PLC . . . . . . . . . . . . . . 2,621 284,693Merck & Co., Inc. . . . . . . . . . . . . 4,919 414,081MetLife, Inc.. . . . . . . . . . . . . . . . 1,851 87,293Mettler-Toledo International, Inc.
(b) . . . . . . . . . . . . . . . . . . . . 52 36,629MGM Resorts International . . . . . . 1,042 28,884
SPDR MSCI ACWI LOW CARBON TARGET ETFSCHEDULE OF INVESTMENTSSeptember 30, 2019
14

Security Description Shares Value
Microchip Technology, Inc. (c) . . . . 376 $ 34,934Micron Technology, Inc. (b) . . . . . . 1,936 82,958Microsoft Corp. . . . . . . . . . . . . . . 13,163 1,830,052Mid-America Apartment
Communities, Inc. REIT . . . . . . 52 6,761Middleby Corp. (b). . . . . . . . . . . . 101 11,807Molson Coors Brewing Co. Class B . 386 22,195Mondelez International, Inc.
Class A . . . . . . . . . . . . . . . . . 3,000 165,960Monster Beverage Corp. (b) . . . . . . 801 46,506Moody’s Corp. . . . . . . . . . . . . . . 267 54,690Morgan Stanley . . . . . . . . . . . . . . 2,096 89,436Motorola Solutions, Inc. . . . . . . . . 206 35,104MSCI, Inc. . . . . . . . . . . . . . . . . . 205 44,639Mylan NV (b) . . . . . . . . . . . . . . . 898 17,762Nasdaq, Inc. . . . . . . . . . . . . . . . . 27 2,682National Oilwell Varco, Inc. . . . . . . 3,110 65,932Nektar Therapeutics (b)(c) . . . . . . . 323 5,883NetApp, Inc. . . . . . . . . . . . . . . . . 541 28,408Netflix, Inc. (b) . . . . . . . . . . . . . . 774 207,138Newell Brands, Inc. (c) . . . . . . . . . 687 12,861Newmont Goldcorp Corp. . . . . . . . 300 11,376News Corp. Class A . . . . . . . . . . . 1,157 16,105Nielsen Holdings PLC. . . . . . . . . . 1,148 24,395NIKE, Inc. Class B. . . . . . . . . . . . 2,600 244,192Nordstrom, Inc. (c) . . . . . . . . . . . . 101 3,401Norfolk Southern Corp. . . . . . . . . . 477 85,698Northern Trust Corp.. . . . . . . . . . . 179 16,704Northrop Grumman Corp. . . . . . . . 313 117,309NVIDIA Corp. . . . . . . . . . . . . . . 1,083 188,518Okta, Inc. (b) . . . . . . . . . . . . . . . 100 9,846Old Dominion Freight Line, Inc. . . . 205 34,844Omnicom Group, Inc. (c) . . . . . . . . 36 2,819ONEOK, Inc. . . . . . . . . . . . . . . . 4,721 347,890Oracle Corp. . . . . . . . . . . . . . . . . 5,397 296,997O’Reilly Automotive, Inc. (b) . . . . . 136 54,197PACCAR, Inc. . . . . . . . . . . . . . . . 626 43,826Palo Alto Networks, Inc. (b) . . . . . . 125 25,479Parker-Hannifin Corp.. . . . . . . . . . 187 33,774Paychex, Inc.. . . . . . . . . . . . . . . . 913 75,569PayPal Holdings, Inc. (b) . . . . . . . . 1,978 204,901People’s United Financial, Inc. . . . . 526 8,224PepsiCo, Inc.. . . . . . . . . . . . . . . . 2,558 350,702Perrigo Co. PLC . . . . . . . . . . . . . 210 11,737Pfizer, Inc. . . . . . . . . . . . . . . . . . 10,739 385,852Philip Morris International, Inc.. . . . 2,868 217,767Phillips 66 . . . . . . . . . . . . . . . . . 2,080 212,992Pioneer Natural Resources Co. . . . . 442 55,590PNC Financial Services Group, Inc. . 944 132,311Polaris, Inc. . . . . . . . . . . . . . . . . 38 3,344PPG Industries, Inc. . . . . . . . . . . . 740 87,697Principal Financial Group, Inc. . . . . 680 38,855Procter & Gamble Co. . . . . . . . . . . 4,663 579,984Progressive Corp.. . . . . . . . . . . . . 949 73,310Prologis, Inc. REIT. . . . . . . . . . . . 1,310 111,638Prudential Financial, Inc. . . . . . . . . 940 84,553
Security Description Shares Value
PTC, Inc. (b). . . . . . . . . . . . . . . . 101 $ 6,886Public Storage REIT . . . . . . . . . . . 297 72,845PulteGroup, Inc. . . . . . . . . . . . . . 421 15,388PVH Corp. . . . . . . . . . . . . . . . . . 127 11,205Qorvo, Inc. (b) . . . . . . . . . . . . . . 160 11,862QUALCOMM, Inc. . . . . . . . . . . . 2,328 177,580Quest Diagnostics, Inc. . . . . . . . . . 269 28,791Qurate Retail, Inc. Class A (b) . . . . . 1,103 11,377Ralph Lauren Corp. . . . . . . . . . . . 153 14,607Raytheon Co. . . . . . . . . . . . . . . . 514 100,842Realty Income Corp. REIT . . . . . . . 278 21,317Regeneron Pharmaceuticals, Inc. (b) . 83 23,024Regions Financial Corp. . . . . . . . . 1,594 25,217ResMed, Inc.. . . . . . . . . . . . . . . . 276 37,290Robert Half International, Inc.. . . . . 348 19,370Rockwell Automation, Inc. . . . . . . . 160 26,368Rollins, Inc. (c) . . . . . . . . . . . . . . 477 16,251Roper Technologies, Inc. . . . . . . . . 196 69,894Ross Stores, Inc. . . . . . . . . . . . . . 603 66,240Royal Caribbean Cruises, Ltd. . . . . . 52 5,633S&P Global, Inc. . . . . . . . . . . . . . 493 120,775salesforce.com, Inc. (b) . . . . . . . . . 1,368 203,066SBA Communications Corp. REIT . . 142 34,243Schlumberger, Ltd. . . . . . . . . . . . . 5,796 198,049Seagate Technology PLC . . . . . . . . 504 27,110Sealed Air Corp. . . . . . . . . . . . . . 861 35,740SEI Investments Co. . . . . . . . . . . . 205 12,147Sempra Energy . . . . . . . . . . . . . . 1,275 188,203Sensata Technologies Holding PLC
(b) . . . . . . . . . . . . . . . . . . . . 391 19,573ServiceNow, Inc. (b) . . . . . . . . . . . 223 56,609Sherwin-Williams Co. . . . . . . . . . . 385 211,700Signature Bank . . . . . . . . . . . . . . 52 6,199Simon Property Group, Inc. REIT . . 642 99,927Sirius XM Holdings, Inc. (c) . . . . . . 3,151 19,710Skyworks Solutions, Inc. . . . . . . . . 188 14,899SL Green Realty Corp. REIT . . . . . 201 16,432Snap, Inc. Class A (b)(c) . . . . . . . . 1,263 19,955Snap-on, Inc. (c) . . . . . . . . . . . . . 179 28,021Spirit AeroSystems Holdings, Inc.
Class A . . . . . . . . . . . . . . . . . 272 22,369Splunk, Inc. (b) . . . . . . . . . . . . . . 244 28,758Square, Inc. Class A (b)(c) . . . . . . . 527 32,648SS&C Technologies Holdings, Inc. . . 272 14,027Stanley Black & Decker, Inc. . . . . . 297 42,890Starbucks Corp. . . . . . . . . . . . . . . 2,659 235,109State Street Corp. (h) . . . . . . . . . . 611 36,165Stryker Corp. . . . . . . . . . . . . . . . 647 139,946SunTrust Banks, Inc.. . . . . . . . . . . 916 63,021SVB Financial Group (b) . . . . . . . . 101 21,104Symantec Corp. . . . . . . . . . . . . . . 1,416 33,460Synchrony Financial . . . . . . . . . . . 1,215 41,419Synopsys, Inc. (b) . . . . . . . . . . . . 187 25,666Sysco Corp. . . . . . . . . . . . . . . . . 1,211 96,153T Rowe Price Group, Inc. . . . . . . . . 433 49,470
SPDR MSCI ACWI LOW CARBON TARGET ETFSCHEDULE OF INVESTMENTSSeptember 30, 2019
15

Security Description Shares Value
Take-Two Interactive Software, Inc.(b) . . . . . . . . . . . . . . . . . . . . 153 $ 19,177
Tapestry, Inc. . . . . . . . . . . . . . . . 523 13,624Target Corp. . . . . . . . . . . . . . . . . 785 83,924TD Ameritrade Holding Corp. . . . . . 163 7,612Teleflex, Inc. . . . . . . . . . . . . . . . . 65 22,084Tesla, Inc. (b) . . . . . . . . . . . . . . . 234 56,364Texas Instruments, Inc. . . . . . . . . . 1,946 251,501Textron, Inc. . . . . . . . . . . . . . . . . 385 18,850Thermo Fisher Scientific, Inc. . . . . . 817 237,968Tiffany & Co. (c) . . . . . . . . . . . . . 287 26,585TJX Cos., Inc. . . . . . . . . . . . . . . . 2,303 128,369T-Mobile US, Inc. (b) . . . . . . . . . . 397 31,272Tractor Supply Co. . . . . . . . . . . . . 224 20,259TransDigm Group, Inc. . . . . . . . . . 63 32,802TransUnion . . . . . . . . . . . . . . . . 375 30,416Travelers Cos., Inc. . . . . . . . . . . . . 608 90,404Trimble, Inc. (b). . . . . . . . . . . . . . 577 22,393TripAdvisor, Inc. (b) . . . . . . . . . . . 105 4,061Twilio, Inc. Class A (b)(c) . . . . . . . 100 10,996Twitter, Inc. (b) . . . . . . . . . . . . . . 1,270 52,324UDR, Inc. REIT. . . . . . . . . . . . . . 272 13,187Ulta Salon Cosmetics & Fragrance,
Inc. (b). . . . . . . . . . . . . . . . . . 92 23,060Under Armour, Inc. Class A (b)(c) . . 753 15,015Union Pacific Corp. . . . . . . . . . . . 1,430 231,631United Parcel Service, Inc. Class B. . 1,032 123,654United Rentals, Inc. (b) . . . . . . . . . 190 23,682United Technologies Corp. . . . . . . . 1,752 239,183UnitedHealth Group, Inc. . . . . . . . . 1,814 394,218Unum Group. . . . . . . . . . . . . . . . 375 11,145US Bancorp . . . . . . . . . . . . . . . . 2,768 153,181Vail Resorts, Inc. . . . . . . . . . . . . . 101 22,984Valero Energy Corp. . . . . . . . . . . . 2,360 201,166Varian Medical Systems, Inc. (b) . . . 123 14,648Veeva Systems, Inc. Class A (b) . . . . 249 38,020Ventas, Inc. REIT. . . . . . . . . . . . . 430 31,403VEREIT, Inc. . . . . . . . . . . . . . . . 1,082 10,582VeriSign, Inc. (b) . . . . . . . . . . . . . 101 19,052Verisk Analytics, Inc. . . . . . . . . . . 432 68,316Verizon Communications, Inc.. . . . . 7,464 450,527Vertex Pharmaceuticals, Inc. (b) . . . 407 68,954VF Corp. . . . . . . . . . . . . . . . . . . 657 58,466Viacom, Inc. Class B. . . . . . . . . . . 323 7,762Visa, Inc. Class A. . . . . . . . . . . . . 3,345 575,373VMware, Inc. Class A . . . . . . . . . . 161 24,160Voya Financial, Inc. . . . . . . . . . . . 552 30,051Vulcan Materials Co. . . . . . . . . . . 323 48,851W.W. Grainger, Inc. . . . . . . . . . . . 119 35,361Wabtec Corp. (c) . . . . . . . . . . . . . 303 21,774Walmart, Inc. . . . . . . . . . . . . . . . 2,636 312,840Walgreens Boots Alliance, Inc. . . . . 1,778 98,341Walt Disney Co.. . . . . . . . . . . . . . 3,389 441,654Waters Corp. (b) . . . . . . . . . . . . . 188 41,967Wayfair, Inc. Class A (b)(c) . . . . . . 153 17,154WellCare Health Plans, Inc. (b) . . . . 52 13,477
Security Description Shares Value
Wells Fargo & Co. . . . . . . . . . . . . 7,716 $ 389,196Welltower, Inc. REIT . . . . . . . . . . 714 64,724Western Digital Corp. . . . . . . . . . . 591 35,247Western Union Co. (c). . . . . . . . . . 1,221 28,291Weyerhaeuser Co. REIT. . . . . . . . . 2,099 58,142Whirlpool Corp. . . . . . . . . . . . . . 56 8,868Willis Towers Watson PLC . . . . . . . 215 41,489Workday, Inc. Class A (b). . . . . . . . 187 31,783WP Carey, Inc. REIT . . . . . . . . . . 101 9,040Wynn Resorts, Ltd.. . . . . . . . . . . . 204 22,179Xerox Holdings Corp. . . . . . . . . . . 825 24,676Xilinx, Inc. . . . . . . . . . . . . . . . . . 610 58,499XPO Logistics, Inc. (b)(c) . . . . . . . 153 10,950Xylem, Inc. . . . . . . . . . . . . . . . . 809 64,413Yum! Brands, Inc. . . . . . . . . . . . . 472 53,539Zayo Group Holdings, Inc. (b). . . . . 425 14,408Zillow Group, Inc. Class C (b)(c) . . . 304 9,065Zimmer Biomet Holdings, Inc. . . . . 364 49,966Zoetis, Inc. . . . . . . . . . . . . . . . . . 794 98,924
45,259,578
TOTAL COMMON STOCKS(Cost $75,288,752) . . . . . . . . . . 82,333,662
WARRANTS — 0.0% (a)THAILAND — 0.0% (a)Minor International PCL (expiring
12/31/21) NVDR (b)(Cost: $0) . . . . . . . . . . . . . . . . 390 51
SHORT-TERM INVESTMENTS — 2.1%State Street Institutional Liquid
Reserves Fund, Premier Class2.03% (i) (j) . . . . . . . . . . . . . . 115,387 115,398
State Street Navigator SecuritiesLending Portfolio III (h) (k) . . . . 1,636,978 1,636,978
TOTAL SHORT-TERM INVESTMENTS(Cost $1,752,375). . . . . . . . . . . . . . . . . . . . . . 1,752,376
TOTAL INVESTMENTS — 101.5%(Cost $77,041,127) . . . . . . . . . . . . . . . . . . . . . 84,086,089
LIABILITIES IN EXCESS OF OTHER ASSETS— (1.5)% . . . . . . . . . . . . . . . . . . . . . . . . . . (1,247,623)
NET ASSETS — 100.0% . . . . . . . . . . . . . . . . . $ 82,838,466
SPDR MSCI ACWI LOW CARBON TARGET ETFSCHEDULE OF INVESTMENTSSeptember 30, 2019
16

(a) Amount is less than 0.05% of net assets.(b) Non-income producing security.(c) All or a portion of the shares of the security are on loan at
September 30, 2019.(d) Reflects separate holdings of the issuer’s common stock traded on
different securities exchanges.(e) Fair valued as determined in good faith by the Trust’s Oversight
Committee in accordance with policy and procedures approved bythe Board of Trustees. As of September 30, 2019, total aggregatefair value of these securities is $107,743 representing 0.2% of netassets.
(f) Securities purchased pursuant to Rule 144A of the Securities Actof 1933, as amended. These securities, which represent 0.5% ofnet assets as of September 30, 2019, are considered liquid andmay be resold in transactions exempt from registration, normallyto qualified institutional buyers.
(g) Fair valued as determined in good faith by the Trust’s OversightCommittee in accordance with policy and procedures approved bythe Board of Trustees. Security value is determined based onLevel 3 inputs. As of September 30, 2019, total aggregate fairvalue of these securities is $0, representing 0.0% of the Fund’s netassets.
(h) The Fund invested in an affiliated entity. Amounts related to thesetransactions during the period ended September 30, 2019 areshown in the Affiliate Table below.
(i) The Fund invested in certain money market funds managed bySSGA Funds Management, Inc. Amounts related to thesetransactions during the period ended September 30, 2019 areshown in the Affiliate Table below.
(j) The rate shown is the annualized seven-day yield at September 30,2019.
(k) Investment of cash collateral for securities loaned.
ADR American Depositary ReceiptGDR Global Depositary ReceiptNVDR Non Voting Depositary ReceiptREIT Real Estate Investment Trust
The following table summarizes the value of the Fund’s investments according to the fair value hierarchy as of September 30,2019.
DescriptionLevel 1 –
Quoted Prices
Level 2 –Other SignificantObservable Inputs
Level 3 –Significant
Unobservable Inputs Total
ASSETS:INVESTMENTS:Common Stocks . . . . . . . . . . . . . . . . . . . . . . . . . . . . . . . . . . . . . $82,126,305 $207,357 $ 0(a) $82,333,662
Warrants . . . . . . . . . . . . . . . . . . . . . . . . . . . . . . . . . . . . . . . . . . 51 — — 51
Short-Term Investments . . . . . . . . . . . . . . . . . . . . . . . . . . . . . . . . 1,752,376 — — 1,752,376
TOTAL INVESTMENTS . . . . . . . . . . . . . . . . . . . . . . . . . . . . . . $83,878,732 $207,357 $ 0 $84,086,089
(a) Fund held a Level 3 security that was valued at $0 at September 30, 2019.
SPDR MSCI ACWI LOW CARBON TARGET ETFSCHEDULE OF INVESTMENTSSeptember 30, 2019
17
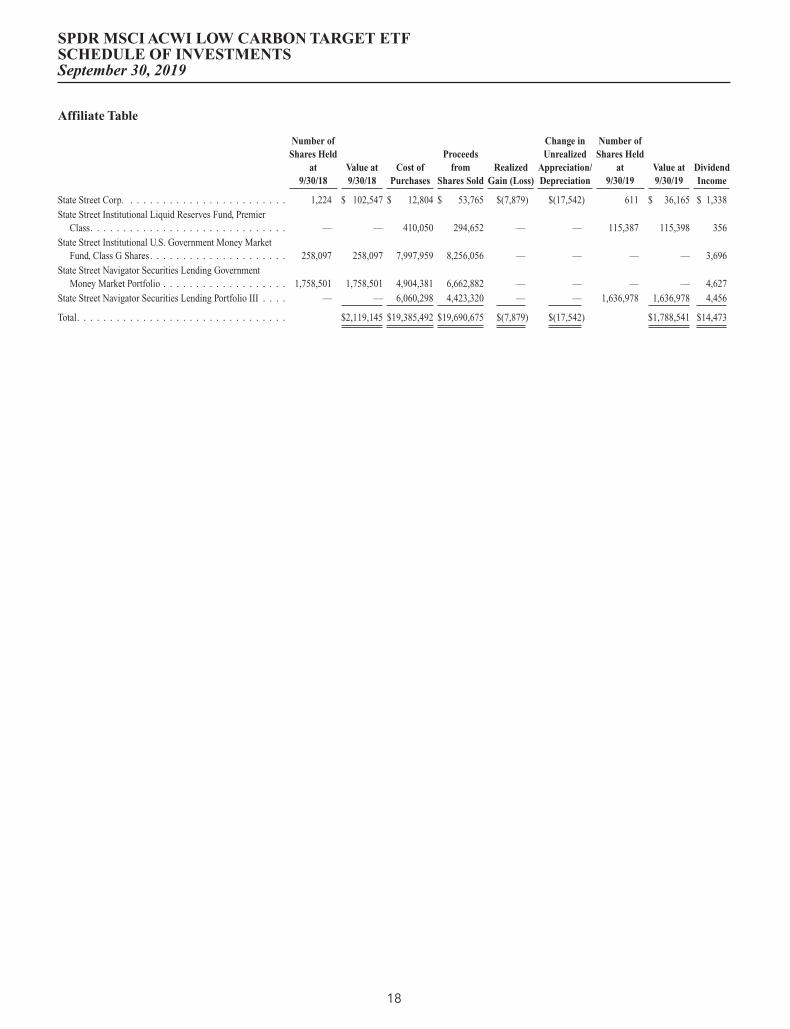
Affiliate Table
Number ofShares Held
at9/30/18
Value at9/30/18
Cost ofPurchases
Proceedsfrom
Shares SoldRealized
Gain (Loss)
Change inUnrealized
Appreciation/Depreciation
Number ofShares Held
at9/30/19
Value at9/30/19
DividendIncome
State Street Corp. . . . . . . . . . . . . . . . . . . . . . . . . 1,224 $ 102,547 $ 12,804 $ 53,765 $(7,879) $(17,542) 611 $ 36,165 $ 1,338
State Street Institutional Liquid Reserves Fund, PremierClass. . . . . . . . . . . . . . . . . . . . . . . . . . . . . . — — 410,050 294,652 — — 115,387 115,398 356
State Street Institutional U.S. Government Money MarketFund, Class G Shares. . . . . . . . . . . . . . . . . . . . . 258,097 258,097 7,997,959 8,256,056 — — — — 3,696
State Street Navigator Securities Lending GovernmentMoney Market Portfolio . . . . . . . . . . . . . . . . . . . 1,758,501 1,758,501 4,904,381 6,662,882 — — — — 4,627
State Street Navigator Securities Lending Portfolio III . . . . — — 6,060,298 4,423,320 — — 1,636,978 1,636,978 4,456
Total. . . . . . . . . . . . . . . . . . . . . . . . . . . . . . . . $2,119,145 $19,385,492 $19,690,675 $(7,879) $(17,542) $1,788,541 $14,473
SPDR MSCI ACWI LOW CARBON TARGET ETFSCHEDULE OF INVESTMENTSSeptember 30, 2019
18

Security DescriptionPrincipalAmount Value
CORPORATE BONDS & NOTES — 0.0% (a)INDIA — 0.0% (a)Britannia Industries, Ltd.
8.00%, 8/28/2022. . . . . . . INR 452,640 $ 6,514
TOTAL CORPORATEBONDS & NOTES(Cost $6,463) . . . . . . . . . 6,514
Shares
COMMON STOCKS — 99.2%ARGENTINA — 0.1%Banco BBVA Argentina SA
ADR . . . . . . . . . . . . . . . 2,056 8,903Banco Macro SA ADR . . . . . 5,872 152,789Grupo Financiero Galicia SA
ADR . . . . . . . . . . . . . . . 10,668 138,684Telecom Argentina SA ADR. . 1,272 12,720YPF SA ADR (b). . . . . . . . . 3,328 30,784
343,880
BRAZIL — 5.1%Ambev SA ADR . . . . . . . . . 484,842 2,239,970Ambev SA . . . . . . . . . . . . . 11,540 53,331Atacadao SA . . . . . . . . . . . 8,140 41,136B3 SA - Brasil Bolsa Balcao. . 11,361 119,000Banco Bradesco SA
Preference Shares. . . . . . . 55,869 454,957Banco Bradesco SA . . . . . . . 19,980 149,896Banco BTG Pactual SA. . . . . 1,664 23,390Banco do Brasil SA . . . . . . . 18,679 203,992Banco Santander Brasil SA . . 6,570 71,498BB Seguridade Participacoes
SA . . . . . . . . . . . . . . . . 150,314 1,264,104BR Malls Participacoes SA . . 6,498 22,480Braskem SA Class A,
Preference Shares (c) . . . . 4,325 33,766BRF SA (c) . . . . . . . . . . . . 5,786 53,062BRF SA ADR (c). . . . . . . . . 3,053 27,966CCR SA . . . . . . . . . . . . . . 13,329 55,199Centrais Eletricas Brasileiras
SA . . . . . . . . . . . . . . . . 4,974 47,944Centrais Eletricas Brasileiras
SA ADR (b) . . . . . . . . . . 5,530 55,577Centrais Eletricas Brasileiras
SA Class B, PreferenceShares . . . . . . . . . . . . . . 526 5,306
Cia Brasileira de DistribuicaoADR . . . . . . . . . . . . . . . 2,771 53,286
Cia Brasileira de DistribuicaoPreference Shares. . . . . . . 48 920
Cia de Saneamento Basico doEstado de Sao Paulo . . . . . 310 3,691
Cia de Saneamento Basico doEstado de Sao Paulo ADR . 7,531 89,468
Cia Energetica de MinasGerais ADR (b) . . . . . . . . 10,683 36,215
Security Description Shares Value
Cia Energetica de MinasGerais Preference Shares . . 5,555 $ 19,111
Cia Siderurgica Nacional SAADR (b) . . . . . . . . . . . . 7,894 24,945
Cia Siderurgica Nacional SA . 1,344 4,269Cielo SA . . . . . . . . . . . . . . 165,203 317,286Cosan SA . . . . . . . . . . . . . 2,563 32,734Embraer SA . . . . . . . . . . . . 460 1,978Embraer SA ADR . . . . . . . . 3,540 61,065Energisa SA . . . . . . . . . . . . 1,956 23,456Engie Brasil Energia SA . . . . 22,139 235,932Equatorial Energia SA . . . . . 24,542 590,896Gerdau SA Preference Shares . 20,872 65,942Hypera SA . . . . . . . . . . . . . 37,840 304,599IRB Brasil Resseguros S/A . . 59,925 541,791Itau Unibanco Holding SA
Preference Shares ADR (d). 75,301 633,281Itau Unibanco Holding SA
Preference Shares (d) . . . . 1,816 15,272Itausa - Investimentos Itau SA
Preference Shares. . . . . . . 496,656 1,571,500JBS SA . . . . . . . . . . . . . . . 21,025 165,509Klabin SA . . . . . . . . . . . . . 10,606 39,186Kroton Educacional SA. . . . . 32,169 86,342Localiza Rent a Car SA . . . . . 3,391 37,008Lojas Americanas SA
Preference Shares. . . . . . . 5,436 26,049Lojas Renner SA . . . . . . . . . 93,207 1,129,341M Dias Branco SA. . . . . . . . 1,130 9,495Magazine Luiza SA . . . . . . . 22,332 198,583Multiplan Empreendimentos
Imobiliarios SA . . . . . . . . 662 4,585Natura Cosmeticos SA . . . . . 1,276 10,372Notre Dame Intermedica
Participacoes SA . . . . . . . 1,468 19,119Petrobras Distribuidora SA. . . 8,428 55,702Petroleo Brasileiro SA
Preference Shares ADR (d). 38,293 503,170Petroleo Brasileiro SA ADR . . 24,722 357,727Petroleo Brasileiro SA
Preference Shares (d) . . . . 557 3,684Porto Seguro SA . . . . . . . . . 2,392 33,818Raia Drogasil SA. . . . . . . . . 4,348 100,010Rumo SA (c) . . . . . . . . . . . 29,674 174,536Sul America SA. . . . . . . . . . 12,966 148,511Suzano Papel e Celulose SA
ADR (b) (c) . . . . . . . . . . 3,876 31,279Suzano SA . . . . . . . . . . . . . 2,885 23,306Telefonica Brasil SA ADR . . . 16,329 215,053Telefonica Brasil SA
Preference Shares. . . . . . . 176 2,321TIM Participacoes SA ADR
(b) . . . . . . . . . . . . . . . . 2,945 42,290TIM Participacoes SA. . . . . . 766 2,190Ultrapar Participacoes SA . . . 324 1,438Ultrapar Participacoes SA
ADR (b) . . . . . . . . . . . . 20,358 91,000
SPDR MSCI EMERGING MARKETS STRATEGICFACTORS ETFSCHEDULE OF INVESTMENTSSeptember 30, 2019
1

Security Description Shares Value
Vale SA ADR . . . . . . . . . . . 53,358 $ 613,617Vale SA (c) . . . . . . . . . . . . 457 5,239WEG SA . . . . . . . . . . . . . . 5,285 30,743
13,711,434
CHILE — 1.3%Aguas Andinas SA Class A . . 586,663 321,285Banco de Chile . . . . . . . . . . 1,324,033 185,640Banco de Chile ADR (b) . . . . 38,054 1,069,317Banco de Credito e
Inversiones SA . . . . . . . . 2,335 147,250Banco Santander Chile ADR . 1,857 51,996Banco Santander Chile . . . . . 55,144 3,890Cencosud SA . . . . . . . . . . . 47,819 78,800Cia Cervecerias Unidas SA . . 1,261 14,104Cia Cervecerias Unidas SA
ADR . . . . . . . . . . . . . . . 9,290 206,145Colbun SA . . . . . . . . . . . . . 570,342 103,001Embotelladora Andina SA
Class B, Preference Shares . 1,332 4,463Empresa Nacional de
Telecomunicaciones SA(c) . . . . . . . . . . . . . . . . 2,529 22,203
Empresas CMPC SA . . . . . . 16,211 37,756Empresas COPEC SA. . . . . . 6,904 65,181Enel Americas SA ADR . . . . 23,482 213,921Enel Americas SA . . . . . . . . 61,246 11,228Enel Chile SA ADR . . . . . . . 1,996 8,403Enel Chile SA. . . . . . . . . . . 431,200 37,323Itau CorpBanca . . . . . . . . . . 2,145,003 16,263Itau CorpBanca ADR . . . . . . 827 9,233Latam Airlines Group SA
ADR (b) . . . . . . . . . . . . 4,032 44,755Latam Airlines Group SA . . . 2,211 24,472SACI Falabella . . . . . . . . . . 103,389 578,560Sociedad Quimica y Minera
de Chile SA ADR (b) . . . . 10,580 294,018
3,549,207
CHINA — 22.1%3SBio, Inc. (c) (e) . . . . . . . . 7,390 12,25551job, Inc. ADR (c) . . . . . . . 962 71,18858.com, Inc. ADR (c) . . . . . . 310 15,286AAC Technologies Holdings,
Inc. (b) . . . . . . . . . . . . . 77,000 407,620Agile Group Holdings, Ltd. . . 44,000 53,433Agricultural Bank of China,
Ltd. Class A . . . . . . . . . . 275,600 133,532Agricultural Bank of China,
Ltd. Class H . . . . . . . . . . 2,803,000 1,097,687Aier Eye Hospital Group Co.,
Ltd. Class A . . . . . . . . . . 9,100 45,199Air China, Ltd. Class H . . . . . 52,000 45,769Alibaba Group Holding, Ltd.
ADR (c). . . . . . . . . . . . . 10,837 1,812,272Aluminum Corp. of China,
Ltd. Class H (c) . . . . . . . . 156,000 49,152
Security Description Shares Value
Angang Steel Co., Ltd.Class H (b) . . . . . . . . . . . 31,200 $ 11,383
Anhui Conch Cement Co.,Ltd. Class A . . . . . . . . . . 14,000 81,045
Anhui Conch Cement Co.,Ltd. Class H . . . . . . . . . . 148,000 878,817
ANTA Sports Products, Ltd. . . 172,000 1,422,838Autohome, Inc. ADR (b) (c) . . 7,199 598,453AviChina Industry &
Technology Co., Ltd.Class H . . . . . . . . . . . . . 58,000 28,484
BAIC Motor Corp., Ltd.Class H (e) . . . . . . . . . . . 74,500 45,996
Baidu, Inc. ADR (c) . . . . . . . 5,922 608,545Bank of Beijing Co., Ltd.
Class A . . . . . . . . . . . . . 203,000 152,367Bank of China, Ltd. Class A . . 235,600 118,110Bank of China, Ltd. Class H . . 5,688,071 2,234,770Bank of Communications Co.,
Ltd. Class A . . . . . . . . . . 340,000 259,480Bank of Communications Co.,
Ltd. Class H . . . . . . . . . . 608,000 397,092Bank of Hangzhou Co., Ltd.
Class A . . . . . . . . . . . . . 38,900 46,029Bank of Jiangsu Co., Ltd.
Class A . . . . . . . . . . . . . 124,700 117,170Bank of Nanjing Co., Ltd.
Class A . . . . . . . . . . . . . 45,200 54,370Bank of Ningbo Co., Ltd.
Class A . . . . . . . . . . . . . 28,400 100,258Bank of Shanghai Co., Ltd.
Class A . . . . . . . . . . . . . 83,270 109,026BBMG Corp. Class H (b) . . . 80,000 22,961Beijing Capital International
Airport Co., Ltd. Class H . . 184,000 157,022Beijing Enterprises Holdings,
Ltd. . . . . . . . . . . . . . . . 17,000 78,176Beijing Enterprises Water
Group, Ltd.. . . . . . . . . . . 96,000 49,106BOE Technology Group Co.,
Ltd. Class A . . . . . . . . . . 113,400 59,549Brilliance China Automotive
Holdings, Ltd. . . . . . . . . . 346,000 371,625BYD Co., Ltd. Class H (b) . . . 9,000 44,946BYD Electronic International
Co., Ltd. (b) . . . . . . . . . . 11,000 16,473CGN Power Co., Ltd. Class H
(e) . . . . . . . . . . . . . . . . 1,389,100 350,845Chaozhou Three-Circle Group
Co., Ltd. Class A . . . . . . . 7,500 21,005China Agri-Industries
Holdings, Ltd. . . . . . . . . . 153,000 49,768China Aoyuan Group, Ltd. . . . 20,000 22,655China Cinda Asset
Management Co., Ltd.Class H . . . . . . . . . . . . . 332,548 65,327
China CITIC Bank Corp., Ltd.Class H . . . . . . . . . . . . . 862,000 459,622
SPDR MSCI EMERGING MARKETS STRATEGICFACTORS ETFSCHEDULE OF INVESTMENTSSeptember 30, 2019
2
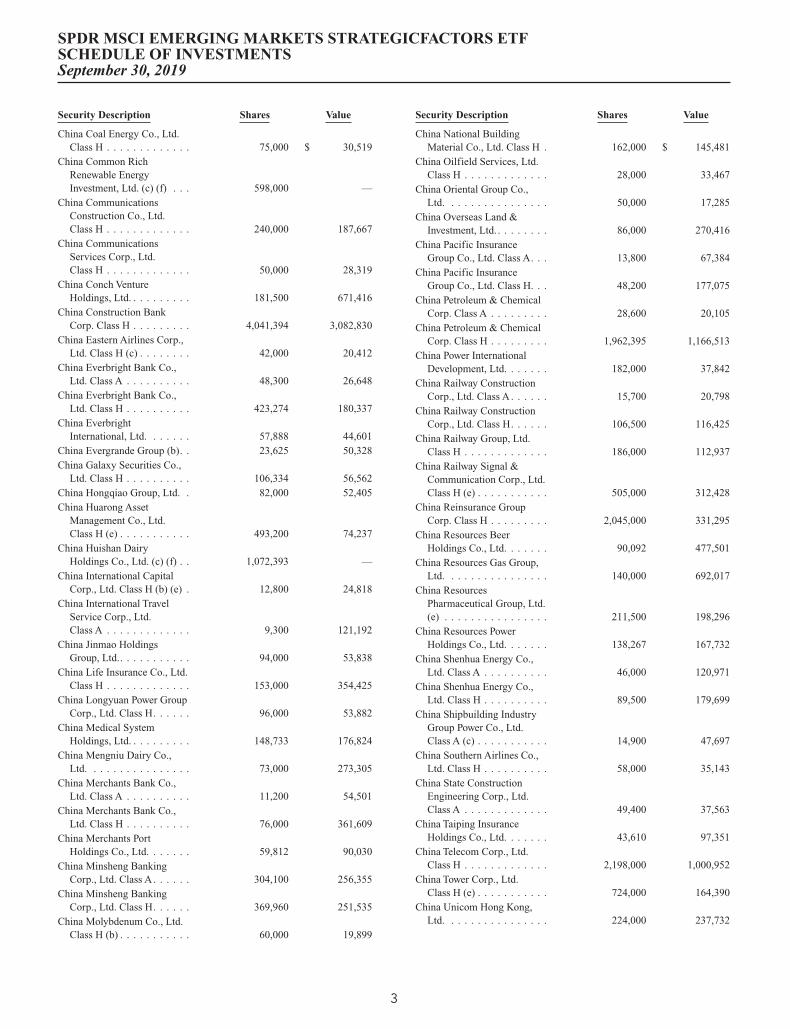
Security Description Shares Value
China Coal Energy Co., Ltd.Class H . . . . . . . . . . . . . 75,000 $ 30,519
China Common RichRenewable EnergyInvestment, Ltd. (c) (f) . . . 598,000 —
China CommunicationsConstruction Co., Ltd.Class H . . . . . . . . . . . . . 240,000 187,667
China CommunicationsServices Corp., Ltd.Class H . . . . . . . . . . . . . 50,000 28,319
China Conch VentureHoldings, Ltd. . . . . . . . . . 181,500 671,416
China Construction BankCorp. Class H . . . . . . . . . 4,041,394 3,082,830
China Eastern Airlines Corp.,Ltd. Class H (c) . . . . . . . . 42,000 20,412
China Everbright Bank Co.,Ltd. Class A . . . . . . . . . . 48,300 26,648
China Everbright Bank Co.,Ltd. Class H . . . . . . . . . . 423,274 180,337
China EverbrightInternational, Ltd. . . . . . . 57,888 44,601
China Evergrande Group (b). . 23,625 50,328China Galaxy Securities Co.,
Ltd. Class H . . . . . . . . . . 106,334 56,562China Hongqiao Group, Ltd. . 82,000 52,405China Huarong Asset
Management Co., Ltd.Class H (e) . . . . . . . . . . . 493,200 74,237
China Huishan DairyHoldings Co., Ltd. (c) (f) . . 1,072,393 —
China International CapitalCorp., Ltd. Class H (b) (e) . 12,800 24,818
China International TravelService Corp., Ltd.Class A . . . . . . . . . . . . . 9,300 121,192
China Jinmao HoldingsGroup, Ltd.. . . . . . . . . . . 94,000 53,838
China Life Insurance Co., Ltd.Class H . . . . . . . . . . . . . 153,000 354,425
China Longyuan Power GroupCorp., Ltd. Class H. . . . . . 96,000 53,882
China Medical SystemHoldings, Ltd. . . . . . . . . . 148,733 176,824
China Mengniu Dairy Co.,Ltd. . . . . . . . . . . . . . . . 73,000 273,305
China Merchants Bank Co.,Ltd. Class A . . . . . . . . . . 11,200 54,501
China Merchants Bank Co.,Ltd. Class H . . . . . . . . . . 76,000 361,609
China Merchants PortHoldings Co., Ltd. . . . . . . 59,812 90,030
China Minsheng BankingCorp., Ltd. Class A . . . . . . 304,100 256,355
China Minsheng BankingCorp., Ltd. Class H. . . . . . 369,960 251,535
China Molybdenum Co., Ltd.Class H (b) . . . . . . . . . . . 60,000 19,899
Security Description Shares Value
China National BuildingMaterial Co., Ltd. Class H . 162,000 $ 145,481
China Oilfield Services, Ltd.Class H . . . . . . . . . . . . . 28,000 33,467
China Oriental Group Co.,Ltd. . . . . . . . . . . . . . . . 50,000 17,285
China Overseas Land &Investment, Ltd. . . . . . . . . 86,000 270,416
China Pacific InsuranceGroup Co., Ltd. Class A. . . 13,800 67,384
China Pacific InsuranceGroup Co., Ltd. Class H. . . 48,200 177,075
China Petroleum & ChemicalCorp. Class A . . . . . . . . . 28,600 20,105
China Petroleum & ChemicalCorp. Class H . . . . . . . . . 1,962,395 1,166,513
China Power InternationalDevelopment, Ltd. . . . . . . 182,000 37,842
China Railway ConstructionCorp., Ltd. Class A . . . . . . 15,700 20,798
China Railway ConstructionCorp., Ltd. Class H. . . . . . 106,500 116,425
China Railway Group, Ltd.Class H . . . . . . . . . . . . . 186,000 112,937
China Railway Signal &Communication Corp., Ltd.Class H (e) . . . . . . . . . . . 505,000 312,428
China Reinsurance GroupCorp. Class H . . . . . . . . . 2,045,000 331,295
China Resources BeerHoldings Co., Ltd. . . . . . . 90,092 477,501
China Resources Gas Group,Ltd. . . . . . . . . . . . . . . . 140,000 692,017
China ResourcesPharmaceutical Group, Ltd.(e) . . . . . . . . . . . . . . . . 211,500 198,296
China Resources PowerHoldings Co., Ltd. . . . . . . 138,267 167,732
China Shenhua Energy Co.,Ltd. Class A . . . . . . . . . . 46,000 120,971
China Shenhua Energy Co.,Ltd. Class H . . . . . . . . . . 89,500 179,699
China Shipbuilding IndustryGroup Power Co., Ltd.Class A (c) . . . . . . . . . . . 14,900 47,697
China Southern Airlines Co.,Ltd. Class H . . . . . . . . . . 58,000 35,143
China State ConstructionEngineering Corp., Ltd.Class A . . . . . . . . . . . . . 49,400 37,563
China Taiping InsuranceHoldings Co., Ltd. . . . . . . 43,610 97,351
China Telecom Corp., Ltd.Class H . . . . . . . . . . . . . 2,198,000 1,000,952
China Tower Corp., Ltd.Class H (e) . . . . . . . . . . . 724,000 164,390
China Unicom Hong Kong,Ltd. . . . . . . . . . . . . . . . 224,000 237,732
SPDR MSCI EMERGING MARKETS STRATEGICFACTORS ETFSCHEDULE OF INVESTMENTSSeptember 30, 2019
3

Security Description Shares Value
China United NetworkCommunications, Ltd.Class A . . . . . . . . . . . . . 26,300 $ 22,134
China Vanke Co., Ltd.Class A . . . . . . . . . . . . . 5,600 20,310
China Vanke Co., Ltd.Class H . . . . . . . . . . . . . 19,692 68,576
China Yangtze Power Co., Ltd.Class A . . . . . . . . . . . . . 148,400 378,834
China Zhongwang Holdings,Ltd. . . . . . . . . . . . . . . . 55,200 22,462
Chongqing Rural CommercialBank Co., Ltd. Class H . . . 146,000 77,662
CIFI Holdings Group Co.,Ltd. . . . . . . . . . . . . . . . 69,288 40,480
CITIC Securities Co., Ltd.Class H . . . . . . . . . . . . . 34,000 63,668
CITIC, Ltd. . . . . . . . . . . . . 485,000 612,483CNOOC, Ltd. . . . . . . . . . . . 328,000 500,406COSCO SHIPPING Energy
Transportation Co., Ltd.Class H . . . . . . . . . . . . . 186,000 82,330
COSCO SHIPPING HoldingsCo., Ltd. Class H (c) . . . . . 36,500 12,990
COSCO SHIPPING Ports,Ltd. . . . . . . . . . . . . . . . 346,592 276,764
Country Garden Holdings Co.,Ltd. . . . . . . . . . . . . . . . 196,266 248,606
Country Garden ServicesHoldings Co., Ltd. . . . . . . 122,000 351,711
CRRC Corp., Ltd. Class H . . . 266,000 185,604CSPC Pharmaceutical Group,
Ltd. . . . . . . . . . . . . . . . 508,000 1,019,966Ctrip.com International, Ltd.
ADR (c). . . . . . . . . . . . . 3,601 105,473Dali Foods Group Co., Ltd.
(e) . . . . . . . . . . . . . . . . 314,000 192,660Daqin Railway Co., Ltd.
Class A . . . . . . . . . . . . . 154,200 163,891Datang International Power
Generation Co., Ltd.Class H . . . . . . . . . . . . . 98,000 20,252
Dongfeng Motor Group Co.,Ltd. Class H . . . . . . . . . . 368,000 349,721
ENN Energy Holdings, Ltd. . . 20,000 206,904Far East Horizon, Ltd. . . . . . . 39,000 36,217Focus Media Information
Technology Co., Ltd.Class A . . . . . . . . . . . . . 75,000 55,138
Foshan Haitian Flavouring &Food Co., Ltd. Class A . . . 8,300 127,745
Fosun International, Ltd. . . . . 73,500 90,944Foxconn Industrial Internet
Co., Ltd. Class A . . . . . . . 14,000 28,231Future Land Development
Holdings, Ltd. (b). . . . . . . 28,000 24,430Fuyao Glass Industry Group
Co., Ltd. Class A . . . . . . . 25,600 77,002
Security Description Shares Value
Fuyao Glass Industry GroupCo., Ltd. Class H (e) . . . . . 68,800 $ 190,882
GD Power Development Co.,Ltd. Class A . . . . . . . . . . 207,900 69,579
Geely Automobile Holdings,Ltd. . . . . . . . . . . . . . . . 721,000 1,223,219
GF Securities Co., Ltd.Class H (c) . . . . . . . . . . . 34,400 36,026
GOME Retail Holdings, Ltd.(b) (c) . . . . . . . . . . . . . . 1,741,000 157,679
Great Wall Motor Co., Ltd.Class H (b) . . . . . . . . . . . 127,000 85,051
Gree Electric Appliances, Inc.of Zhuhai Class A. . . . . . . 16,300 130,789
Greentown Service GroupCo., Ltd. . . . . . . . . . . . . 126,000 123,759
Guangzhou AutomobileGroup Co., Ltd. Class H. . . 85,200 81,511
Guangzhou R&F PropertiesCo., Ltd. Class H . . . . . . . 39,200 59,305
Guotai Junan Securities Co.,Ltd. Class H (e) . . . . . . . . 10,600 16,496
Haitian InternationalHoldings, Ltd. . . . . . . . . . 66,000 135,209
Haitong Securities Co., Ltd.Class H . . . . . . . . . . . . . 74,000 77,593
Hangzhou Hikvision DigitalTechnology Co., Ltd.Class A . . . . . . . . . . . . . 58,107 262,821
Henan Shuanghui Investment& Development Co., Ltd.Class A . . . . . . . . . . . . . 37,000 127,976
Hengan International GroupCo., Ltd. . . . . . . . . . . . . 51,874 340,118
HLA Corp., Ltd. Class A . . . . 13,200 15,009Hua Hong Semiconductor,
Ltd. (b) (e) . . . . . . . . . . . 8,000 15,920Huadian Power International
Corp., Ltd. Class H. . . . . . 208,000 79,067Huadong Medicine Co., Ltd.
Class A . . . . . . . . . . . . . 5,760 21,133Huaneng Power International,
Inc. Class H . . . . . . . . . . 718,000 345,289Huaneng Renewables Corp.,
Ltd. Class H . . . . . . . . . . 130,000 44,276Huatai Securities Co., Ltd.
Class H (e) . . . . . . . . . . . 27,043 40,499Huaxia Bank Co., Ltd.
Class A . . . . . . . . . . . . . 142,700 147,472Huayu Automotive Systems
Co., Ltd. Class A . . . . . . . 10,800 35,540Huazhu Group, Ltd. ADR (b) . 364 12,019Industrial & Commercial
Bank of China, Ltd.Class A . . . . . . . . . . . . . 52,300 40,500
Industrial & CommercialBank of China, Ltd.Class H . . . . . . . . . . . . . 3,208,448 2,148,679
SPDR MSCI EMERGING MARKETS STRATEGICFACTORS ETFSCHEDULE OF INVESTMENTSSeptember 30, 2019
4
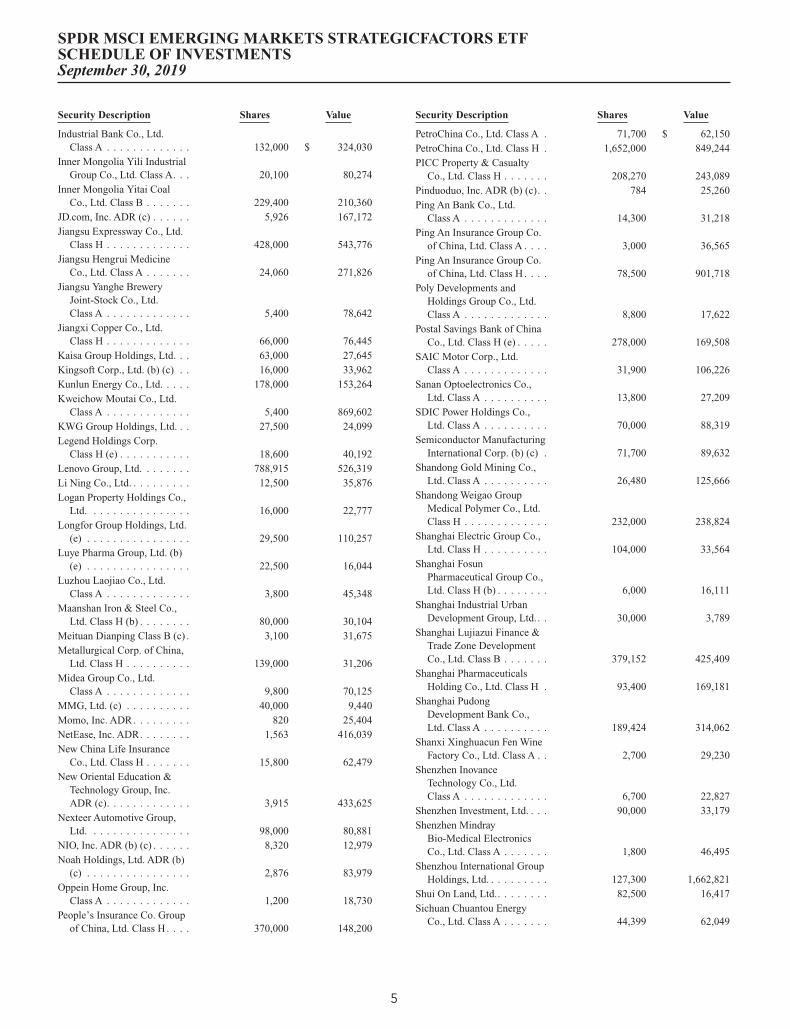
Security Description Shares Value
Industrial Bank Co., Ltd.Class A . . . . . . . . . . . . . 132,000 $ 324,030
Inner Mongolia Yili IndustrialGroup Co., Ltd. Class A. . . 20,100 80,274
Inner Mongolia Yitai CoalCo., Ltd. Class B . . . . . . . 229,400 210,360
JD.com, Inc. ADR (c) . . . . . . 5,926 167,172Jiangsu Expressway Co., Ltd.
Class H . . . . . . . . . . . . . 428,000 543,776Jiangsu Hengrui Medicine
Co., Ltd. Class A . . . . . . . 24,060 271,826Jiangsu Yanghe Brewery
Joint-Stock Co., Ltd.Class A . . . . . . . . . . . . . 5,400 78,642
Jiangxi Copper Co., Ltd.Class H . . . . . . . . . . . . . 66,000 76,445
Kaisa Group Holdings, Ltd. . . 63,000 27,645Kingsoft Corp., Ltd. (b) (c) . . 16,000 33,962Kunlun Energy Co., Ltd. . . . . 178,000 153,264Kweichow Moutai Co., Ltd.
Class A . . . . . . . . . . . . . 5,400 869,602KWG Group Holdings, Ltd. . . 27,500 24,099Legend Holdings Corp.
Class H (e) . . . . . . . . . . . 18,600 40,192Lenovo Group, Ltd. . . . . . . . 788,915 526,319Li Ning Co., Ltd. . . . . . . . . . 12,500 35,876Logan Property Holdings Co.,
Ltd. . . . . . . . . . . . . . . . 16,000 22,777Longfor Group Holdings, Ltd.
(e) . . . . . . . . . . . . . . . . 29,500 110,257Luye Pharma Group, Ltd. (b)
(e) . . . . . . . . . . . . . . . . 22,500 16,044Luzhou Laojiao Co., Ltd.
Class A . . . . . . . . . . . . . 3,800 45,348Maanshan Iron & Steel Co.,
Ltd. Class H (b) . . . . . . . . 80,000 30,104Meituan Dianping Class B (c) . 3,100 31,675Metallurgical Corp. of China,
Ltd. Class H . . . . . . . . . . 139,000 31,206Midea Group Co., Ltd.
Class A . . . . . . . . . . . . . 9,800 70,125MMG, Ltd. (c) . . . . . . . . . . 40,000 9,440Momo, Inc. ADR . . . . . . . . . 820 25,404NetEase, Inc. ADR. . . . . . . . 1,563 416,039New China Life Insurance
Co., Ltd. Class H . . . . . . . 15,800 62,479New Oriental Education &
Technology Group, Inc.ADR (c). . . . . . . . . . . . . 3,915 433,625
Nexteer Automotive Group,Ltd. . . . . . . . . . . . . . . . 98,000 80,881
NIO, Inc. ADR (b) (c) . . . . . . 8,320 12,979Noah Holdings, Ltd. ADR (b)
(c) . . . . . . . . . . . . . . . . 2,876 83,979Oppein Home Group, Inc.
Class A . . . . . . . . . . . . . 1,200 18,730People’s Insurance Co. Group
of China, Ltd. Class H . . . . 370,000 148,200
Security Description Shares Value
PetroChina Co., Ltd. Class A . 71,700 $ 62,150PetroChina Co., Ltd. Class H . 1,652,000 849,244PICC Property & Casualty
Co., Ltd. Class H . . . . . . . 208,270 243,089Pinduoduo, Inc. ADR (b) (c). . 784 25,260Ping An Bank Co., Ltd.
Class A . . . . . . . . . . . . . 14,300 31,218Ping An Insurance Group Co.
of China, Ltd. Class A . . . . 3,000 36,565Ping An Insurance Group Co.
of China, Ltd. Class H . . . . 78,500 901,718Poly Developments and
Holdings Group Co., Ltd.Class A . . . . . . . . . . . . . 8,800 17,622
Postal Savings Bank of ChinaCo., Ltd. Class H (e) . . . . . 278,000 169,508
SAIC Motor Corp., Ltd.Class A . . . . . . . . . . . . . 31,900 106,226
Sanan Optoelectronics Co.,Ltd. Class A . . . . . . . . . . 13,800 27,209
SDIC Power Holdings Co.,Ltd. Class A . . . . . . . . . . 70,000 88,319
Semiconductor ManufacturingInternational Corp. (b) (c) . 71,700 89,632
Shandong Gold Mining Co.,Ltd. Class A . . . . . . . . . . 26,480 125,666
Shandong Weigao GroupMedical Polymer Co., Ltd.Class H . . . . . . . . . . . . . 232,000 238,824
Shanghai Electric Group Co.,Ltd. Class H . . . . . . . . . . 104,000 33,564
Shanghai FosunPharmaceutical Group Co.,Ltd. Class H (b) . . . . . . . . 6,000 16,111
Shanghai Industrial UrbanDevelopment Group, Ltd.. . 30,000 3,789
Shanghai Lujiazui Finance &Trade Zone DevelopmentCo., Ltd. Class B . . . . . . . 379,152 425,409
Shanghai PharmaceuticalsHolding Co., Ltd. Class H . 93,400 169,181
Shanghai PudongDevelopment Bank Co.,Ltd. Class A . . . . . . . . . . 189,424 314,062
Shanxi Xinghuacun Fen WineFactory Co., Ltd. Class A . . 2,700 29,230
Shenzhen InovanceTechnology Co., Ltd.Class A . . . . . . . . . . . . . 6,700 22,827
Shenzhen Investment, Ltd. . . . 90,000 33,179Shenzhen Mindray
Bio-Medical ElectronicsCo., Ltd. Class A . . . . . . . 1,800 46,495
Shenzhou International GroupHoldings, Ltd. . . . . . . . . . 127,300 1,662,821
Shui On Land, Ltd.. . . . . . . . 82,500 16,417Sichuan Chuantou Energy
Co., Ltd. Class A . . . . . . . 44,399 62,049
SPDR MSCI EMERGING MARKETS STRATEGICFACTORS ETFSCHEDULE OF INVESTMENTSSeptember 30, 2019
5
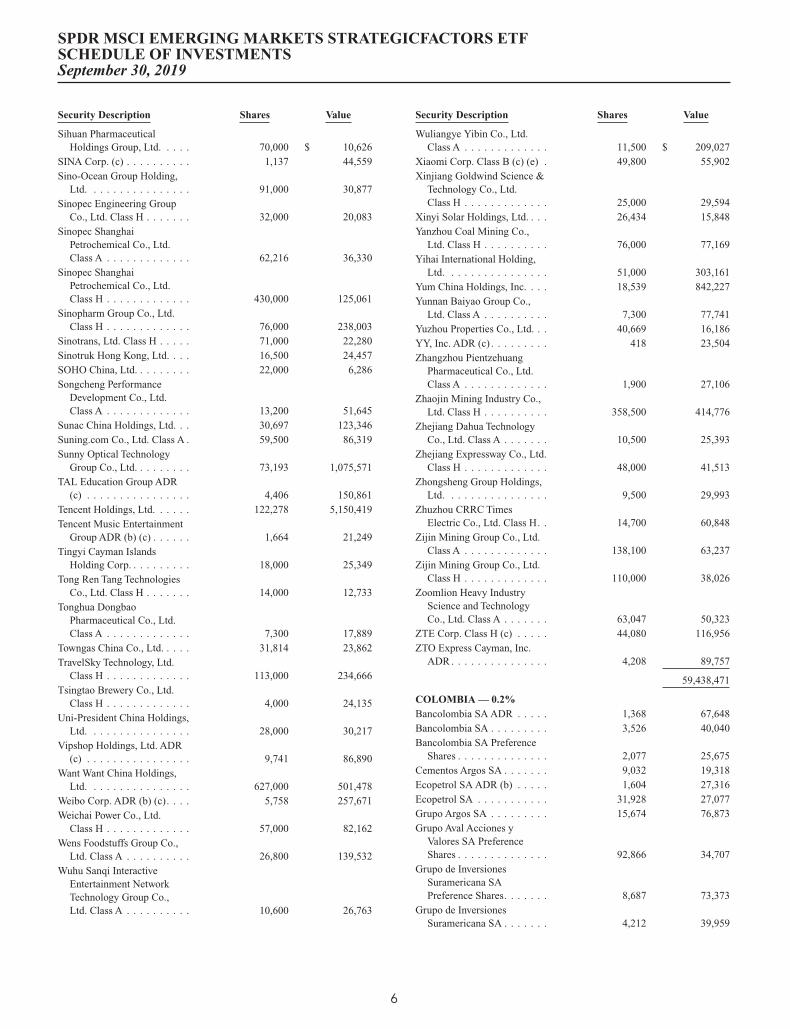
Security Description Shares Value
Sihuan PharmaceuticalHoldings Group, Ltd. . . . . 70,000 $ 10,626
SINA Corp. (c) . . . . . . . . . . 1,137 44,559Sino-Ocean Group Holding,
Ltd. . . . . . . . . . . . . . . . 91,000 30,877Sinopec Engineering Group
Co., Ltd. Class H . . . . . . . 32,000 20,083Sinopec Shanghai
Petrochemical Co., Ltd.Class A . . . . . . . . . . . . . 62,216 36,330
Sinopec ShanghaiPetrochemical Co., Ltd.Class H . . . . . . . . . . . . . 430,000 125,061
Sinopharm Group Co., Ltd.Class H . . . . . . . . . . . . . 76,000 238,003
Sinotrans, Ltd. Class H . . . . . 71,000 22,280Sinotruk Hong Kong, Ltd. . . . 16,500 24,457SOHO China, Ltd. . . . . . . . . 22,000 6,286Songcheng Performance
Development Co., Ltd.Class A . . . . . . . . . . . . . 13,200 51,645
Sunac China Holdings, Ltd. . . 30,697 123,346Suning.com Co., Ltd. Class A . 59,500 86,319Sunny Optical Technology
Group Co., Ltd. . . . . . . . . 73,193 1,075,571TAL Education Group ADR
(c) . . . . . . . . . . . . . . . . 4,406 150,861Tencent Holdings, Ltd. . . . . . 122,278 5,150,419Tencent Music Entertainment
Group ADR (b) (c) . . . . . . 1,664 21,249Tingyi Cayman Islands
Holding Corp. . . . . . . . . . 18,000 25,349Tong Ren Tang Technologies
Co., Ltd. Class H . . . . . . . 14,000 12,733Tonghua Dongbao
Pharmaceutical Co., Ltd.Class A . . . . . . . . . . . . . 7,300 17,889
Towngas China Co., Ltd. . . . . 31,814 23,862TravelSky Technology, Ltd.
Class H . . . . . . . . . . . . . 113,000 234,666Tsingtao Brewery Co., Ltd.
Class H . . . . . . . . . . . . . 4,000 24,135Uni-President China Holdings,
Ltd. . . . . . . . . . . . . . . . 28,000 30,217Vipshop Holdings, Ltd. ADR
(c) . . . . . . . . . . . . . . . . 9,741 86,890Want Want China Holdings,
Ltd. . . . . . . . . . . . . . . . 627,000 501,478Weibo Corp. ADR (b) (c). . . . 5,758 257,671Weichai Power Co., Ltd.
Class H . . . . . . . . . . . . . 57,000 82,162Wens Foodstuffs Group Co.,
Ltd. Class A . . . . . . . . . . 26,800 139,532Wuhu Sanqi Interactive
Entertainment NetworkTechnology Group Co.,Ltd. Class A . . . . . . . . . . 10,600 26,763
Security Description Shares Value
Wuliangye Yibin Co., Ltd.Class A . . . . . . . . . . . . . 11,500 $ 209,027
Xiaomi Corp. Class B (c) (e) . 49,800 55,902Xinjiang Goldwind Science &
Technology Co., Ltd.Class H . . . . . . . . . . . . . 25,000 29,594
Xinyi Solar Holdings, Ltd. . . . 26,434 15,848Yanzhou Coal Mining Co.,
Ltd. Class H . . . . . . . . . . 76,000 77,169Yihai International Holding,
Ltd. . . . . . . . . . . . . . . . 51,000 303,161Yum China Holdings, Inc. . . . 18,539 842,227Yunnan Baiyao Group Co.,
Ltd. Class A . . . . . . . . . . 7,300 77,741Yuzhou Properties Co., Ltd. . . 40,669 16,186YY, Inc. ADR (c) . . . . . . . . . 418 23,504Zhangzhou Pientzehuang
Pharmaceutical Co., Ltd.Class A . . . . . . . . . . . . . 1,900 27,106
Zhaojin Mining Industry Co.,Ltd. Class H . . . . . . . . . . 358,500 414,776
Zhejiang Dahua TechnologyCo., Ltd. Class A . . . . . . . 10,500 25,393
Zhejiang Expressway Co., Ltd.Class H . . . . . . . . . . . . . 48,000 41,513
Zhongsheng Group Holdings,Ltd. . . . . . . . . . . . . . . . 9,500 29,993
Zhuzhou CRRC TimesElectric Co., Ltd. Class H. . 14,700 60,848
Zijin Mining Group Co., Ltd.Class A . . . . . . . . . . . . . 138,100 63,237
Zijin Mining Group Co., Ltd.Class H . . . . . . . . . . . . . 110,000 38,026
Zoomlion Heavy IndustryScience and TechnologyCo., Ltd. Class A . . . . . . . 63,047 50,323
ZTE Corp. Class H (c) . . . . . 44,080 116,956ZTO Express Cayman, Inc.
ADR . . . . . . . . . . . . . . . 4,208 89,757
59,438,471
COLOMBIA — 0.2%Bancolombia SA ADR . . . . . 1,368 67,648Bancolombia SA . . . . . . . . . 3,526 40,040Bancolombia SA Preference
Shares . . . . . . . . . . . . . . 2,077 25,675Cementos Argos SA . . . . . . . 9,032 19,318Ecopetrol SA ADR (b) . . . . . 1,604 27,316Ecopetrol SA . . . . . . . . . . . 31,928 27,077Grupo Argos SA . . . . . . . . . 15,674 76,873Grupo Aval Acciones y
Valores SA PreferenceShares . . . . . . . . . . . . . . 92,866 34,707
Grupo de InversionesSuramericana SAPreference Shares. . . . . . . 8,687 73,373
Grupo de InversionesSuramericana SA . . . . . . . 4,212 39,959
SPDR MSCI EMERGING MARKETS STRATEGICFACTORS ETFSCHEDULE OF INVESTMENTSSeptember 30, 2019
6
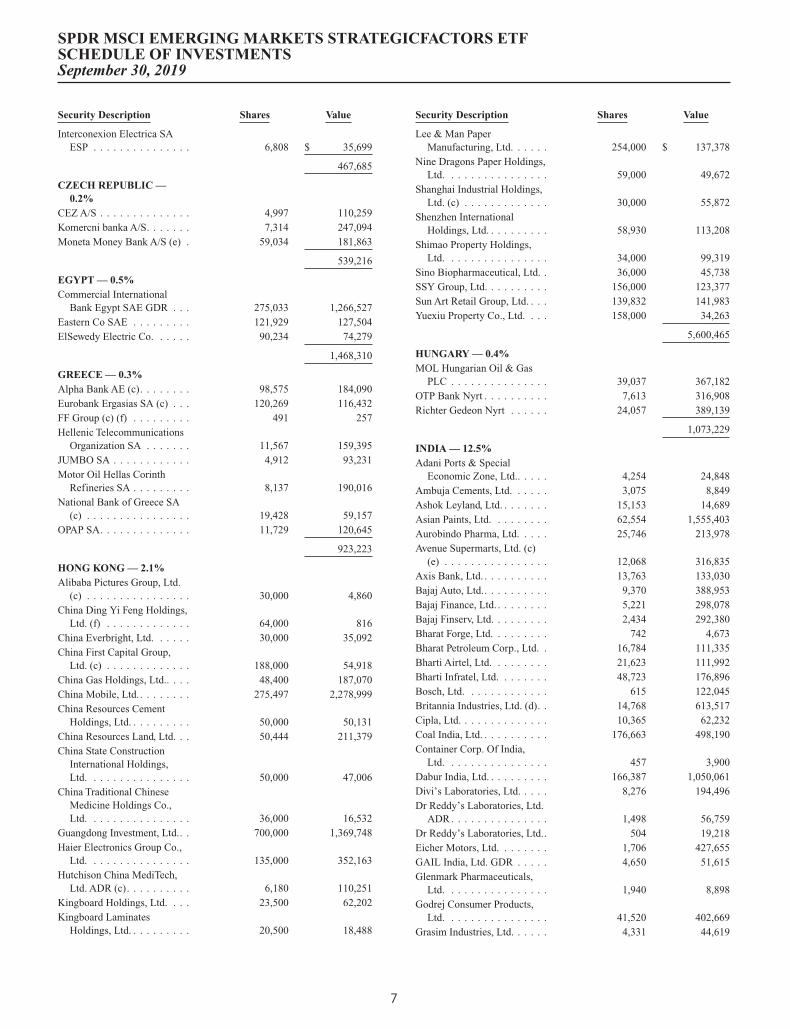
Security Description Shares Value
Interconexion Electrica SAESP . . . . . . . . . . . . . . . 6,808 $ 35,699
467,685
CZECH REPUBLIC —0.2%
CEZ A/S . . . . . . . . . . . . . . 4,997 110,259Komercni banka A/S. . . . . . . 7,314 247,094Moneta Money Bank A/S (e) . 59,034 181,863
539,216
EGYPT — 0.5%Commercial International
Bank Egypt SAE GDR . . . 275,033 1,266,527Eastern Co SAE . . . . . . . . . 121,929 127,504ElSewedy Electric Co. . . . . . 90,234 74,279
1,468,310
GREECE — 0.3%Alpha Bank AE (c). . . . . . . . 98,575 184,090Eurobank Ergasias SA (c) . . . 120,269 116,432FF Group (c) (f) . . . . . . . . . 491 257Hellenic Telecommunications
Organization SA . . . . . . . 11,567 159,395JUMBO SA . . . . . . . . . . . . 4,912 93,231Motor Oil Hellas Corinth
Refineries SA . . . . . . . . . 8,137 190,016National Bank of Greece SA
(c) . . . . . . . . . . . . . . . . 19,428 59,157OPAP SA. . . . . . . . . . . . . . 11,729 120,645
923,223
HONG KONG — 2.1%Alibaba Pictures Group, Ltd.
(c) . . . . . . . . . . . . . . . . 30,000 4,860China Ding Yi Feng Holdings,
Ltd. (f) . . . . . . . . . . . . . 64,000 816China Everbright, Ltd. . . . . . 30,000 35,092China First Capital Group,
Ltd. (c) . . . . . . . . . . . . . 188,000 54,918China Gas Holdings, Ltd.. . . . 48,400 187,070China Mobile, Ltd.. . . . . . . . 275,497 2,278,999China Resources Cement
Holdings, Ltd. . . . . . . . . . 50,000 50,131China Resources Land, Ltd. . . 50,444 211,379China State Construction
International Holdings,Ltd. . . . . . . . . . . . . . . . 50,000 47,006
China Traditional ChineseMedicine Holdings Co.,Ltd. . . . . . . . . . . . . . . . 36,000 16,532
Guangdong Investment, Ltd.. . 700,000 1,369,748Haier Electronics Group Co.,
Ltd. . . . . . . . . . . . . . . . 135,000 352,163Hutchison China MediTech,
Ltd. ADR (c). . . . . . . . . . 6,180 110,251Kingboard Holdings, Ltd. . . . 23,500 62,202Kingboard Laminates
Holdings, Ltd. . . . . . . . . . 20,500 18,488
Security Description Shares Value
Lee & Man PaperManufacturing, Ltd. . . . . . 254,000 $ 137,378
Nine Dragons Paper Holdings,Ltd. . . . . . . . . . . . . . . . 59,000 49,672
Shanghai Industrial Holdings,Ltd. (c) . . . . . . . . . . . . . 30,000 55,872
Shenzhen InternationalHoldings, Ltd. . . . . . . . . . 58,930 113,208
Shimao Property Holdings,Ltd. . . . . . . . . . . . . . . . 34,000 99,319
Sino Biopharmaceutical, Ltd. . 36,000 45,738SSY Group, Ltd. . . . . . . . . . 156,000 123,377Sun Art Retail Group, Ltd. . . . 139,832 141,983Yuexiu Property Co., Ltd. . . . 158,000 34,263
5,600,465
HUNGARY — 0.4%MOL Hungarian Oil & Gas
PLC . . . . . . . . . . . . . . . 39,037 367,182OTP Bank Nyrt . . . . . . . . . . 7,613 316,908Richter Gedeon Nyrt . . . . . . 24,057 389,139
1,073,229
INDIA — 12.5%Adani Ports & Special
Economic Zone, Ltd.. . . . . 4,254 24,848Ambuja Cements, Ltd. . . . . . 3,075 8,849Ashok Leyland, Ltd. . . . . . . . 15,153 14,689Asian Paints, Ltd. . . . . . . . . 62,554 1,555,403Aurobindo Pharma, Ltd. . . . . 25,746 213,978Avenue Supermarts, Ltd. (c)
(e) . . . . . . . . . . . . . . . . 12,068 316,835Axis Bank, Ltd. . . . . . . . . . . 13,763 133,030Bajaj Auto, Ltd.. . . . . . . . . . 9,370 388,953Bajaj Finance, Ltd. . . . . . . . . 5,221 298,078Bajaj Finserv, Ltd. . . . . . . . . 2,434 292,380Bharat Forge, Ltd. . . . . . . . . 742 4,673Bharat Petroleum Corp., Ltd. . 16,784 111,335Bharti Airtel, Ltd. . . . . . . . . 21,623 111,992Bharti Infratel, Ltd. . . . . . . . 48,723 176,896Bosch, Ltd. . . . . . . . . . . . . 615 122,045Britannia Industries, Ltd. (d). . 14,768 613,517Cipla, Ltd. . . . . . . . . . . . . . 10,365 62,232Coal India, Ltd. . . . . . . . . . . 176,663 498,190Container Corp. Of India,
Ltd. . . . . . . . . . . . . . . . 457 3,900Dabur India, Ltd. . . . . . . . . . 166,387 1,050,061Divi’s Laboratories, Ltd. . . . . 8,276 194,496Dr Reddy’s Laboratories, Ltd.
ADR . . . . . . . . . . . . . . . 1,498 56,759Dr Reddy’s Laboratories, Ltd.. 504 19,218Eicher Motors, Ltd. . . . . . . . 1,706 427,655GAIL India, Ltd. GDR . . . . . 4,650 51,615Glenmark Pharmaceuticals,
Ltd. . . . . . . . . . . . . . . . 1,940 8,898Godrej Consumer Products,
Ltd. . . . . . . . . . . . . . . . 41,520 402,669Grasim Industries, Ltd. . . . . . 4,331 44,619
SPDR MSCI EMERGING MARKETS STRATEGICFACTORS ETFSCHEDULE OF INVESTMENTSSeptember 30, 2019
7

Security Description Shares Value
Havells India, Ltd. . . . . . . . . 23,132 $ 234,457HCL Technologies, Ltd.. . . . . 96,414 1,470,110Hero MotoCorp, Ltd. . . . . . . 6,459 246,512Hindalco Industries, Ltd. . . . . 31,679 85,535Hindustan Petroleum Corp.,
Ltd. . . . . . . . . . . . . . . . 25,697 109,396Hindustan Unilever, Ltd. . . . . 105,951 2,963,075Housing Development
Finance Corp., Ltd.. . . . . . 19,649 548,155ICICI Bank, Ltd. ADR . . . . . 12,326 150,131ICICI Bank, Ltd. . . . . . . . . . 1,411 8,635ICICI Lombard General
Insurance Co., Ltd. (e). . . . 12,927 220,686Indiabulls Housing Finance,
Ltd. . . . . . . . . . . . . . . . 4,131 14,917Indian Oil Corp., Ltd. . . . . . . 58,311 121,281Infosys, Ltd. ADR . . . . . . . . 296,752 3,374,070Infosys, Ltd. . . . . . . . . . . . . 187,458 2,131,058InterGlobe Aviation, Ltd. (e). . 3,481 92,818ITC, Ltd. . . . . . . . . . . . . . . 389,890 1,429,584JSW Steel, Ltd. . . . . . . . . . . 10,695 34,702Larsen & Toubro, Ltd. GDR . . 3,401 70,741Larsen & Toubro, Ltd.. . . . . . 309 6,428LIC Housing Finance, Ltd. . . . 6,441 34,232Lupin, Ltd. . . . . . . . . . . . . . 6,794 68,612Mahindra & Mahindra
Financial Services, Ltd. . . . 1,130 5,230Mahindra & Mahindra, Ltd.
GDR . . . . . . . . . . . . . . . 10,350 80,212Mahindra & Mahindra, Ltd. . . 364 2,810Marico, Ltd. . . . . . . . . . . . . 119,344 663,922Maruti Suzuki India, Ltd.. . . . 11,002 1,042,592Motherson Sumi Systems,
Ltd. . . . . . . . . . . . . . . . 6,067 8,985Nestle India, Ltd. . . . . . . . . . 3,560 697,728NTPC, Ltd. . . . . . . . . . . . . 37,807 62,684Oil & Natural Gas Corp., Ltd. . 70,494 131,103Page Industries, Ltd. . . . . . . . 681 216,381Petronet LNG, Ltd.. . . . . . . . 120,265 441,053Pidilite Industries, Ltd. . . . . . 17,315 352,744Piramal Enterprises, Ltd. . . . . 791 18,221Power Grid Corp. of India,
Ltd. . . . . . . . . . . . . . . . 72,922 204,817REC, Ltd. . . . . . . . . . . . . . 24,212 42,074Reliance Industries, Ltd. GDR
(e) . . . . . . . . . . . . . . . . 14,044 523,841Reliance Industries, Ltd. . . . . 10,939 205,640Shree Cement, Ltd. . . . . . . . 37 9,861Shriram Transport Finance
Co., Ltd. . . . . . . . . . . . . 1,245 18,815State Bank of India GDR (c). . 2,479 95,194Sun Pharmaceutical
Industries, Ltd. . . . . . . . . 23,154 127,240Tata Consultancy Services,
Ltd. . . . . . . . . . . . . . . . 140,102 4,150,150Tata Motors, Ltd. ADR (b) (c). 15,401 129,214Tata Motors, Ltd. (c). . . . . . . 17,686 29,311
Security Description Shares Value
Tata Power Co., Ltd. . . . . . . . 21,484 $ 18,947Tata Steel, Ltd. . . . . . . . . . . 356 1,811Tata Steel, Ltd. GDR . . . . . . 8,841 43,940Tech Mahindra, Ltd. . . . . . . . 84,759 854,541Titan Co., Ltd. . . . . . . . . . . 43,971 789,872UltraTech Cement, Ltd. . . . . . 708 43,370United Spirits, Ltd. (c) . . . . . 27,363 257,534UPL, Ltd. . . . . . . . . . . . . . 54,342 463,107Vedanta, Ltd. . . . . . . . . . . . 43,613 94,865Vodafone Idea, Ltd. (c) . . . . . 267,291 23,196Wipro, Ltd. ADR (b). . . . . . . 76,172 278,028Wipro, Ltd. . . . . . . . . . . . . 170,148 575,733Yes Bank, Ltd. . . . . . . . . . . 40,147 23,453Zee Entertainment
Enterprises, Ltd. . . . . . . . 48,421 181,402
33,532,569
INDONESIA — 3.7%Adaro Energy Tbk PT . . . . . . 501,100 45,539AKR Corporindo Tbk PT. . . . 400 107Astra International Tbk PT. . . 289,800 134,743Bank Central Asia Tbk PT . . . 1,665,825 3,561,662Bank Danamon Indonesia Tbk
PT . . . . . . . . . . . . . . . . 400 134Bank Mandiri Persero Tbk PT. 266,900 131,147Bank Negara Indonesia
Persero Tbk PT . . . . . . . . 165,400 85,642Bank Rakyat Indonesia
Persero Tbk PT . . . . . . . . 424,900 123,324Bank Tabungan Negara
Persero Tbk PT . . . . . . . . 156,800 21,650Bukit Asam Tbk PT . . . . . . . 355,500 56,600Bumi Serpong Damai Tbk PT
(c) . . . . . . . . . . . . . . . . 115,000 11,261Charoen Pokphand Indonesia
Tbk PT . . . . . . . . . . . . . 790,400 297,896Gudang Garam Tbk PT . . . . . 80,900 298,495Hanjaya Mandala Sampoerna
Tbk PT . . . . . . . . . . . . . 2,703,100 436,076Indah Kiat Pulp & Paper
Corp. Tbk PT . . . . . . . . . 103,900 47,394Indocement Tunggal Prakarsa
Tbk PT . . . . . . . . . . . . . 22,500 29,680Indofood CBP Sukses
Makmur Tbk PT . . . . . . . 484,700 410,604Indofood Sukses Makmur Tbk
PT . . . . . . . . . . . . . . . . 453,000 245,727Jasa Marga Persero Tbk PT . . 29,100 11,685Kalbe Farma Tbk PT . . . . . . 2,042,600 241,025Pabrik Kertas Tjiwi Kimia
Tbk PT . . . . . . . . . . . . . 32,300 24,006Pakuwon Jati Tbk PT . . . . . . 1,660,778 77,803Perusahaan Gas Negara Tbk
PT . . . . . . . . . . . . . . . . 291,300 43,095Semen Indonesia Persero Tbk
PT . . . . . . . . . . . . . . . . 52,500 42,718Surya Citra Media Tbk PT . . . 765,100 62,523
SPDR MSCI EMERGING MARKETS STRATEGICFACTORS ETFSCHEDULE OF INVESTMENTSSeptember 30, 2019
8
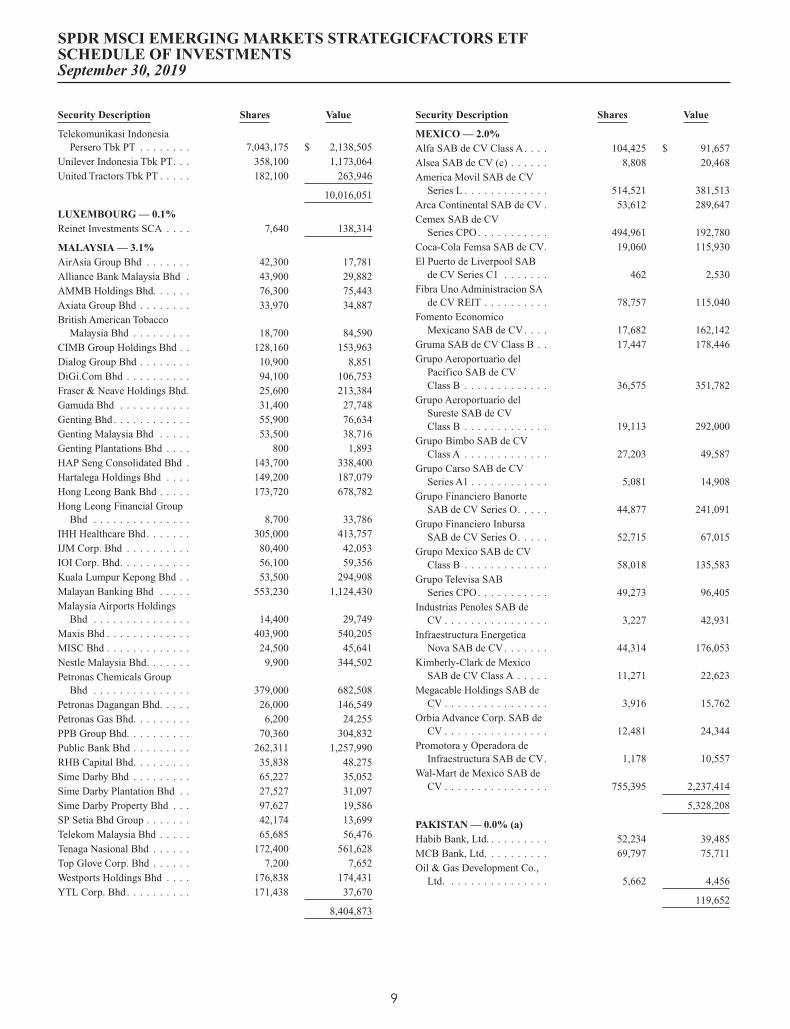
Security Description Shares Value
Telekomunikasi IndonesiaPersero Tbk PT . . . . . . . . 7,043,175 $ 2,138,505
Unilever Indonesia Tbk PT. . . 358,100 1,173,064United Tractors Tbk PT . . . . . 182,100 263,946
10,016,051
LUXEMBOURG — 0.1%Reinet Investments SCA . . . . 7,640 138,314
MALAYSIA — 3.1%AirAsia Group Bhd . . . . . . . 42,300 17,781Alliance Bank Malaysia Bhd . 43,900 29,882AMMB Holdings Bhd. . . . . . 76,300 75,443Axiata Group Bhd . . . . . . . . 33,970 34,887British American Tobacco
Malaysia Bhd . . . . . . . . . 18,700 84,590CIMB Group Holdings Bhd . . 128,160 153,963Dialog Group Bhd . . . . . . . . 10,900 8,851DiGi.Com Bhd . . . . . . . . . . 94,100 106,753Fraser & Neave Holdings Bhd. 25,600 213,384Gamuda Bhd . . . . . . . . . . . 31,400 27,748Genting Bhd. . . . . . . . . . . . 55,900 76,634Genting Malaysia Bhd . . . . . 53,500 38,716Genting Plantations Bhd . . . . 800 1,893HAP Seng Consolidated Bhd . 143,700 338,400Hartalega Holdings Bhd . . . . 149,200 187,079Hong Leong Bank Bhd . . . . . 173,720 678,782Hong Leong Financial Group
Bhd . . . . . . . . . . . . . . . 8,700 33,786IHH Healthcare Bhd. . . . . . . 305,000 413,757IJM Corp. Bhd . . . . . . . . . . 80,400 42,053IOI Corp. Bhd. . . . . . . . . . . 56,100 59,356Kuala Lumpur Kepong Bhd . . 53,500 294,908Malayan Banking Bhd . . . . . 553,230 1,124,430Malaysia Airports Holdings
Bhd . . . . . . . . . . . . . . . 14,400 29,749Maxis Bhd . . . . . . . . . . . . . 403,900 540,205MISC Bhd . . . . . . . . . . . . . 24,500 45,641Nestle Malaysia Bhd. . . . . . . 9,900 344,502Petronas Chemicals Group
Bhd . . . . . . . . . . . . . . . 379,000 682,508Petronas Dagangan Bhd. . . . . 26,000 146,549Petronas Gas Bhd. . . . . . . . . 6,200 24,255PPB Group Bhd. . . . . . . . . . 70,360 304,832Public Bank Bhd . . . . . . . . . 262,311 1,257,990RHB Capital Bhd. . . . . . . . . 35,838 48,275Sime Darby Bhd . . . . . . . . . 65,227 35,052Sime Darby Plantation Bhd . . 27,527 31,097Sime Darby Property Bhd . . . 97,627 19,586SP Setia Bhd Group . . . . . . . 42,174 13,699Telekom Malaysia Bhd . . . . . 65,685 56,476Tenaga Nasional Bhd . . . . . . 172,400 561,628Top Glove Corp. Bhd . . . . . . 7,200 7,652Westports Holdings Bhd . . . . 176,838 174,431YTL Corp. Bhd. . . . . . . . . . 171,438 37,670
8,404,873
Security Description Shares Value
MEXICO — 2.0%Alfa SAB de CV Class A. . . . 104,425 $ 91,657Alsea SAB de CV (c) . . . . . . 8,808 20,468America Movil SAB de CV
Series L . . . . . . . . . . . . . 514,521 381,513Arca Continental SAB de CV . 53,612 289,647Cemex SAB de CV
Series CPO. . . . . . . . . . . 494,961 192,780Coca-Cola Femsa SAB de CV. 19,060 115,930El Puerto de Liverpool SAB
de CV Series C1 . . . . . . . 462 2,530Fibra Uno Administracion SA
de CV REIT . . . . . . . . . . 78,757 115,040Fomento Economico
Mexicano SAB de CV. . . . 17,682 162,142Gruma SAB de CV Class B . . 17,447 178,446Grupo Aeroportuario del
Pacifico SAB de CVClass B . . . . . . . . . . . . . 36,575 351,782
Grupo Aeroportuario delSureste SAB de CVClass B . . . . . . . . . . . . . 19,113 292,000
Grupo Bimbo SAB de CVClass A . . . . . . . . . . . . . 27,203 49,587
Grupo Carso SAB de CVSeries A1 . . . . . . . . . . . . 5,081 14,908
Grupo Financiero BanorteSAB de CV Series O. . . . . 44,877 241,091
Grupo Financiero InbursaSAB de CV Series O. . . . . 52,715 67,015
Grupo Mexico SAB de CVClass B . . . . . . . . . . . . . 58,018 135,583
Grupo Televisa SABSeries CPO. . . . . . . . . . . 49,273 96,405
Industrias Penoles SAB deCV . . . . . . . . . . . . . . . . 3,227 42,931
Infraestructura EnergeticaNova SAB de CV . . . . . . . 44,314 176,053
Kimberly-Clark de MexicoSAB de CV Class A . . . . . 11,271 22,623
Megacable Holdings SAB deCV . . . . . . . . . . . . . . . . 3,916 15,762
Orbia Advance Corp. SAB deCV . . . . . . . . . . . . . . . . 12,481 24,344
Promotora y Operadora deInfraestructura SAB de CV. 1,178 10,557
Wal-Mart de Mexico SAB deCV . . . . . . . . . . . . . . . . 755,395 2,237,414
5,328,208
PAKISTAN — 0.0% (a)Habib Bank, Ltd. . . . . . . . . . 52,234 39,485MCB Bank, Ltd. . . . . . . . . . 69,797 75,711Oil & Gas Development Co.,
Ltd. . . . . . . . . . . . . . . . 5,662 4,456
119,652
SPDR MSCI EMERGING MARKETS STRATEGICFACTORS ETFSCHEDULE OF INVESTMENTSSeptember 30, 2019
9
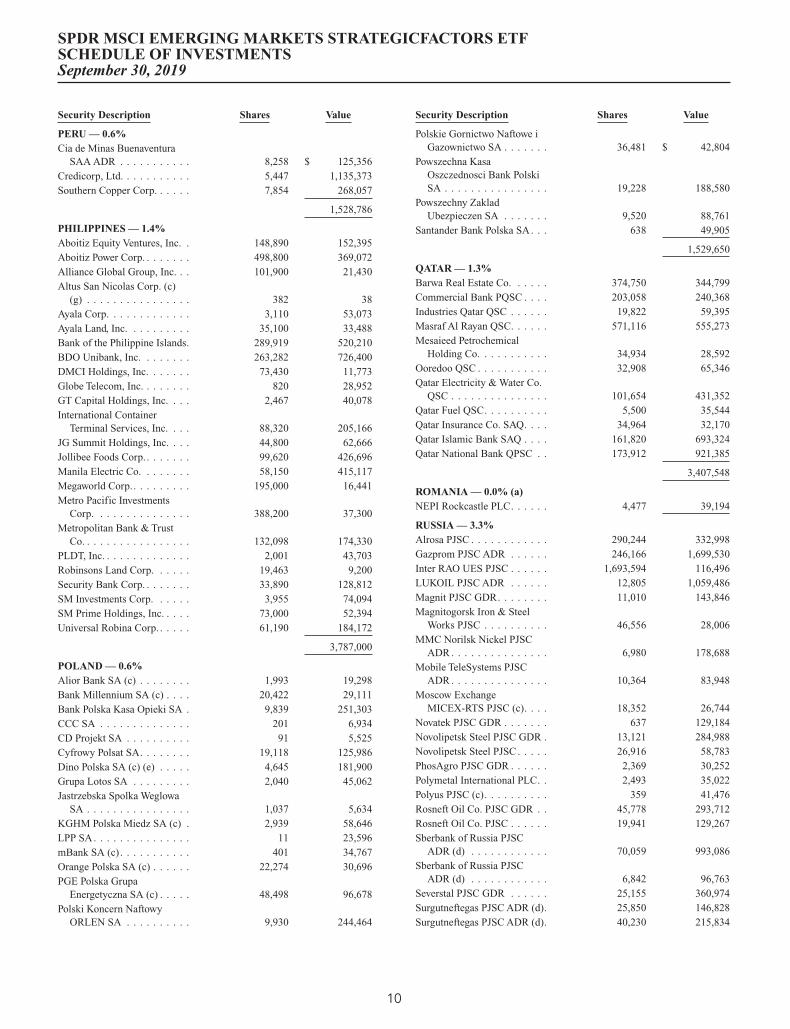
Security Description Shares Value
PERU — 0.6%Cia de Minas Buenaventura
SAA ADR . . . . . . . . . . . 8,258 $ 125,356Credicorp, Ltd. . . . . . . . . . . 5,447 1,135,373Southern Copper Corp. . . . . . 7,854 268,057
1,528,786
PHILIPPINES — 1.4%Aboitiz Equity Ventures, Inc. . 148,890 152,395Aboitiz Power Corp. . . . . . . . 498,800 369,072Alliance Global Group, Inc. . . 101,900 21,430Altus San Nicolas Corp. (c)
(g) . . . . . . . . . . . . . . . . 382 38Ayala Corp. . . . . . . . . . . . . 3,110 53,073Ayala Land, Inc. . . . . . . . . . 35,100 33,488Bank of the Philippine Islands. 289,919 520,210BDO Unibank, Inc. . . . . . . . 263,282 726,400DMCI Holdings, Inc. . . . . . . 73,430 11,773Globe Telecom, Inc. . . . . . . . 820 28,952GT Capital Holdings, Inc. . . . 2,467 40,078International Container
Terminal Services, Inc. . . . 88,320 205,166JG Summit Holdings, Inc. . . . 44,800 62,666Jollibee Foods Corp.. . . . . . . 99,620 426,696Manila Electric Co. . . . . . . . 58,150 415,117Megaworld Corp.. . . . . . . . . 195,000 16,441Metro Pacific Investments
Corp. . . . . . . . . . . . . . . 388,200 37,300Metropolitan Bank & Trust
Co. . . . . . . . . . . . . . . . . 132,098 174,330PLDT, Inc. . . . . . . . . . . . . . 2,001 43,703Robinsons Land Corp. . . . . . 19,463 9,200Security Bank Corp. . . . . . . . 33,890 128,812SM Investments Corp. . . . . . 3,955 74,094SM Prime Holdings, Inc. . . . . 73,000 52,394Universal Robina Corp. . . . . . 61,190 184,172
3,787,000
POLAND — 0.6%Alior Bank SA (c) . . . . . . . . 1,993 19,298Bank Millennium SA (c) . . . . 20,422 29,111Bank Polska Kasa Opieki SA . 9,839 251,303CCC SA . . . . . . . . . . . . . . 201 6,934CD Projekt SA . . . . . . . . . . 91 5,525Cyfrowy Polsat SA. . . . . . . . 19,118 125,986Dino Polska SA (c) (e) . . . . . 4,645 181,900Grupa Lotos SA . . . . . . . . . 2,040 45,062Jastrzebska Spolka Weglowa
SA . . . . . . . . . . . . . . . . 1,037 5,634KGHM Polska Miedz SA (c) . 2,939 58,646LPP SA . . . . . . . . . . . . . . . 11 23,596mBank SA (c) . . . . . . . . . . . 401 34,767Orange Polska SA (c) . . . . . . 22,274 30,696PGE Polska Grupa
Energetyczna SA (c) . . . . . 48,498 96,678Polski Koncern Naftowy
ORLEN SA . . . . . . . . . . 9,930 244,464
Security Description Shares Value
Polskie Gornictwo Naftowe iGazownictwo SA . . . . . . . 36,481 $ 42,804
Powszechna KasaOszczednosci Bank PolskiSA . . . . . . . . . . . . . . . . 19,228 188,580
Powszechny ZakladUbezpieczen SA . . . . . . . 9,520 88,761
Santander Bank Polska SA. . . 638 49,905
1,529,650
QATAR — 1.3%Barwa Real Estate Co. . . . . . 374,750 344,799Commercial Bank PQSC . . . . 203,058 240,368Industries Qatar QSC . . . . . . 19,822 59,395Masraf Al Rayan QSC. . . . . . 571,116 555,273Mesaieed Petrochemical
Holding Co. . . . . . . . . . . 34,934 28,592Ooredoo QSC . . . . . . . . . . . 32,908 65,346Qatar Electricity & Water Co.
QSC . . . . . . . . . . . . . . . 101,654 431,352Qatar Fuel QSC. . . . . . . . . . 5,500 35,544Qatar Insurance Co. SAQ. . . . 34,964 32,170Qatar Islamic Bank SAQ . . . . 161,820 693,324Qatar National Bank QPSC . . 173,912 921,385
3,407,548
ROMANIA — 0.0% (a)NEPI Rockcastle PLC. . . . . . 4,477 39,194
RUSSIA — 3.3%Alrosa PJSC . . . . . . . . . . . . 290,244 332,998Gazprom PJSC ADR . . . . . . 246,166 1,699,530Inter RAO UES PJSC . . . . . . 1,693,594 116,496LUKOIL PJSC ADR . . . . . . 12,805 1,059,486Magnit PJSC GDR. . . . . . . . 11,010 143,846Magnitogorsk Iron & Steel
Works PJSC . . . . . . . . . . 46,556 28,006MMC Norilsk Nickel PJSC
ADR . . . . . . . . . . . . . . . 6,980 178,688Mobile TeleSystems PJSC
ADR . . . . . . . . . . . . . . . 10,364 83,948Moscow Exchange
MICEX-RTS PJSC (c). . . . 18,352 26,744Novatek PJSC GDR . . . . . . . 637 129,184Novolipetsk Steel PJSC GDR . 13,121 284,988Novolipetsk Steel PJSC . . . . . 26,916 58,783PhosAgro PJSC GDR . . . . . . 2,369 30,252Polymetal International PLC. . 2,493 35,022Polyus PJSC (c). . . . . . . . . . 359 41,476Rosneft Oil Co. PJSC GDR . . 45,778 293,712Rosneft Oil Co. PJSC . . . . . . 19,941 129,267Sberbank of Russia PJSC
ADR (d) . . . . . . . . . . . . 70,059 993,086Sberbank of Russia PJSC
ADR (d) . . . . . . . . . . . . 6,842 96,763Severstal PJSC GDR . . . . . . 25,155 360,974Surgutneftegas PJSC ADR (d). 25,850 146,828Surgutneftegas PJSC ADR (d). 40,230 215,834
SPDR MSCI EMERGING MARKETS STRATEGICFACTORS ETFSCHEDULE OF INVESTMENTSSeptember 30, 2019
10
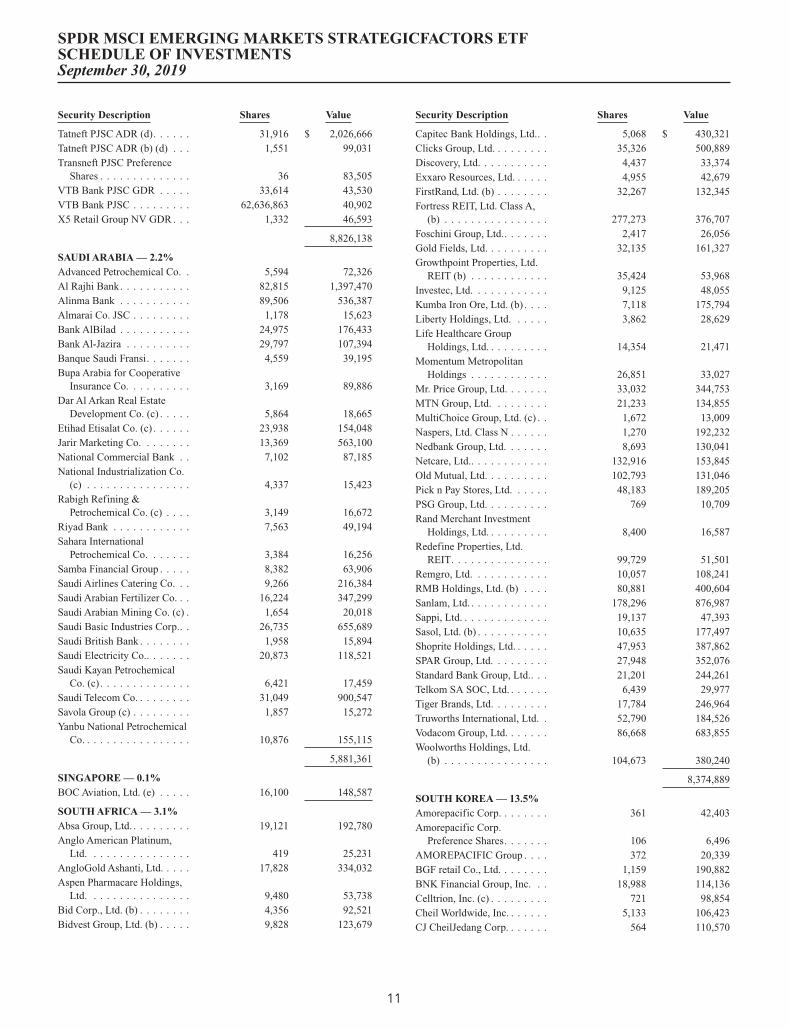
Security Description Shares Value
Tatneft PJSC ADR (d). . . . . . 31,916 $ 2,026,666Tatneft PJSC ADR (b) (d) . . . 1,551 99,031Transneft PJSC Preference
Shares . . . . . . . . . . . . . . 36 83,505VTB Bank PJSC GDR . . . . . 33,614 43,530VTB Bank PJSC . . . . . . . . . 62,636,863 40,902X5 Retail Group NV GDR . . . 1,332 46,593
8,826,138
SAUDI ARABIA — 2.2%Advanced Petrochemical Co. . 5,594 72,326Al Rajhi Bank. . . . . . . . . . . 82,815 1,397,470Alinma Bank . . . . . . . . . . . 89,506 536,387Almarai Co. JSC . . . . . . . . . 1,178 15,623Bank AlBilad . . . . . . . . . . . 24,975 176,433Bank Al-Jazira . . . . . . . . . . 29,797 107,394Banque Saudi Fransi. . . . . . . 4,559 39,195Bupa Arabia for Cooperative
Insurance Co. . . . . . . . . . 3,169 89,886Dar Al Arkan Real Estate
Development Co. (c) . . . . . 5,864 18,665Etihad Etisalat Co. (c) . . . . . . 23,938 154,048Jarir Marketing Co. . . . . . . . 13,369 563,100National Commercial Bank . . 7,102 87,185National Industrialization Co.
(c) . . . . . . . . . . . . . . . . 4,337 15,423Rabigh Refining &
Petrochemical Co. (c) . . . . 3,149 16,672Riyad Bank . . . . . . . . . . . . 7,563 49,194Sahara International
Petrochemical Co. . . . . . . 3,384 16,256Samba Financial Group . . . . . 8,382 63,906Saudi Airlines Catering Co. . . 9,266 216,384Saudi Arabian Fertilizer Co. . . 16,224 347,299Saudi Arabian Mining Co. (c) . 1,654 20,018Saudi Basic Industries Corp.. . 26,735 655,689Saudi British Bank . . . . . . . . 1,958 15,894Saudi Electricity Co.. . . . . . . 20,873 118,521Saudi Kayan Petrochemical
Co. (c) . . . . . . . . . . . . . . 6,421 17,459Saudi Telecom Co. . . . . . . . . 31,049 900,547Savola Group (c) . . . . . . . . . 1,857 15,272Yanbu National Petrochemical
Co. . . . . . . . . . . . . . . . . 10,876 155,115
5,881,361
SINGAPORE — 0.1%BOC Aviation, Ltd. (e) . . . . . 16,100 148,587
SOUTH AFRICA — 3.1%Absa Group, Ltd. . . . . . . . . . 19,121 192,780Anglo American Platinum,
Ltd. . . . . . . . . . . . . . . . 419 25,231AngloGold Ashanti, Ltd. . . . . 17,828 334,032Aspen Pharmacare Holdings,
Ltd. . . . . . . . . . . . . . . . 9,480 53,738Bid Corp., Ltd. (b) . . . . . . . . 4,356 92,521Bidvest Group, Ltd. (b) . . . . . 9,828 123,679
Security Description Shares Value
Capitec Bank Holdings, Ltd.. . 5,068 $ 430,321Clicks Group, Ltd. . . . . . . . . 35,326 500,889Discovery, Ltd. . . . . . . . . . . 4,437 33,374Exxaro Resources, Ltd. . . . . . 4,955 42,679FirstRand, Ltd. (b) . . . . . . . . 32,267 132,345Fortress REIT, Ltd. Class A,
(b) . . . . . . . . . . . . . . . . 277,273 376,707Foschini Group, Ltd.. . . . . . . 2,417 26,056Gold Fields, Ltd. . . . . . . . . . 32,135 161,327Growthpoint Properties, Ltd.
REIT (b) . . . . . . . . . . . . 35,424 53,968Investec, Ltd. . . . . . . . . . . . 9,125 48,055Kumba Iron Ore, Ltd. (b) . . . . 7,118 175,794Liberty Holdings, Ltd. . . . . . 3,862 28,629Life Healthcare Group
Holdings, Ltd. . . . . . . . . . 14,354 21,471Momentum Metropolitan
Holdings . . . . . . . . . . . . 26,851 33,027Mr. Price Group, Ltd. . . . . . . 33,032 344,753MTN Group, Ltd. . . . . . . . . 21,233 134,855MultiChoice Group, Ltd. (c) . . 1,672 13,009Naspers, Ltd. Class N . . . . . . 1,270 192,232Nedbank Group, Ltd. . . . . . . 8,693 130,041Netcare, Ltd.. . . . . . . . . . . . 132,916 153,845Old Mutual, Ltd. . . . . . . . . . 102,793 131,046Pick n Pay Stores, Ltd. . . . . . 48,183 189,205PSG Group, Ltd. . . . . . . . . . 769 10,709Rand Merchant Investment
Holdings, Ltd. . . . . . . . . . 8,400 16,587Redefine Properties, Ltd.
REIT. . . . . . . . . . . . . . . 99,729 51,501Remgro, Ltd. . . . . . . . . . . . 10,057 108,241RMB Holdings, Ltd. (b) . . . . 80,881 400,604Sanlam, Ltd. . . . . . . . . . . . . 178,296 876,987Sappi, Ltd. . . . . . . . . . . . . . 19,137 47,393Sasol, Ltd. (b) . . . . . . . . . . . 10,635 177,497Shoprite Holdings, Ltd. . . . . . 47,953 387,862SPAR Group, Ltd. . . . . . . . . 27,948 352,076Standard Bank Group, Ltd.. . . 21,201 244,261Telkom SA SOC, Ltd. . . . . . . 6,439 29,977Tiger Brands, Ltd. . . . . . . . . 17,784 246,964Truworths International, Ltd. . 52,790 184,526Vodacom Group, Ltd. . . . . . . 86,668 683,855Woolworths Holdings, Ltd.
(b) . . . . . . . . . . . . . . . . 104,673 380,240
8,374,889
SOUTH KOREA — 13.5%Amorepacific Corp. . . . . . . . 361 42,403Amorepacific Corp.
Preference Shares. . . . . . . 106 6,496AMOREPACIFIC Group . . . . 372 20,339BGF retail Co., Ltd. . . . . . . . 1,159 190,882BNK Financial Group, Inc. . . 18,988 114,136Celltrion, Inc. (c) . . . . . . . . . 721 98,854Cheil Worldwide, Inc. . . . . . . 5,133 106,423CJ CheilJedang Corp. . . . . . . 564 110,570
SPDR MSCI EMERGING MARKETS STRATEGICFACTORS ETFSCHEDULE OF INVESTMENTSSeptember 30, 2019
11

Security Description Shares Value
CJ Corp. . . . . . . . . . . . . . . 1,167 $ 80,002CJ Corp. Preference Shares
(c) . . . . . . . . . . . . . . . . 128 6,421CJ ENM Co., Ltd. . . . . . . . . 155 21,951CJ Logistics Corp. (c) . . . . . . 1,249 150,884Daelim Industrial Co., Ltd.. . . 1,190 103,465Daewoo Engineering &
Construction Co., Ltd. (c). . 4,648 18,768Daewoo Shipbuilding &
Marine Engineering Co.,Ltd. (c) . . . . . . . . . . . . . 1,302 33,308
DB Insurance Co., Ltd. . . . . . 10,088 435,180Doosan Bobcat, Inc. . . . . . . . 716 21,190E-MART, Inc. . . . . . . . . . . . 1,536 145,105Fila Korea, Ltd. . . . . . . . . . . 980 47,437GS Engineering &
Construction Corp. . . . . . . 1,838 50,708GS Holdings Corp.. . . . . . . . 2,498 105,045GS Retail Co., Ltd.. . . . . . . . 2,156 74,351Hana Financial Group, Inc. . . 15,642 460,963Hankook Tire & Technology
Co., Ltd. . . . . . . . . . . . . 2,180 58,776Hanmi Pharm Co., Ltd. . . . . . 7 1,615Hanmi Science Co., Ltd. . . . . 698 23,108Hanon Systems . . . . . . . . . . 2,849 28,582Hanwha Chemical Corp. . . . . 6,278 94,211Hanwha Corp.. . . . . . . . . . . 5,770 121,801Hanwha Life Insurance Co.,
Ltd. . . . . . . . . . . . . . . . 39,394 78,383HDC Hyundai Development
Co-Engineering &Construction . . . . . . . . . . 1,036 28,452
Hotel Shilla Co., Ltd. . . . . . . 314 22,628Hyundai Department Store
Co., Ltd. . . . . . . . . . . . . 730 47,664Hyundai Engineering &
Construction Co., Ltd. . . . . 2,410 93,285Hyundai Glovis Co., Ltd. . . . . 1,204 157,024Hyundai Heavy Industries
Holdings Co., Ltd. . . . . . . 462 134,991Hyundai Marine & Fire
Insurance Co., Ltd. . . . . . . 9,193 202,897Hyundai Mobis Co., Ltd. . . . . 2,309 486,451Hyundai Motor Co. . . . . . . . 6,102 683,583Hyundai Motor Co.
Preference Shares (d) . . . . 2,383 169,140Hyundai Motor Co.
Preference Shares (d) . . . . 1,008 64,383Hyundai Motor Co. GDR. . . . 1,212 38,542Hyundai Steel Co. . . . . . . . . 4,812 156,491Industrial Bank of Korea . . . . 13,568 149,728Kakao Corp. . . . . . . . . . . . . 354 40,101Kangwon Land, Inc. . . . . . . . 18,226 450,260KB Financial Group, Inc.. . . . 3,907 139,471KB Financial Group, Inc.
ADR . . . . . . . . . . . . . . . 14,320 511,510KCC Corp.. . . . . . . . . . . . . 213 38,820
Security Description Shares Value
Kia Motors Corp.. . . . . . . . . 15,022 $ 572,673Korea Aerospace Industries,
Ltd. . . . . . . . . . . . . . . . 734 23,993Korea Electric Power Corp.
ADR (b) (c) . . . . . . . . . . 34,747 376,657Korea Electric Power Corp.
(c) . . . . . . . . . . . . . . . . 8,057 174,457Korea Gas Corp. . . . . . . . . . 3,272 108,323Korea Investment Holdings
Co., Ltd. . . . . . . . . . . . . 853 53,698Korea Shipbuilding &
Offshore Engineering Co.,Ltd. (c) . . . . . . . . . . . . . 891 92,366
Korea Zinc Co., Ltd.. . . . . . . 132 49,439Korean Air Lines Co., Ltd. . . . 2,128 40,740KT&G Corp. . . . . . . . . . . . 10,553 930,771Kumho Petrochemical Co.,
Ltd. . . . . . . . . . . . . . . . 743 44,475LG Chem, Ltd. . . . . . . . . . . 805 201,561LG Chem, Ltd. Preference
Shares . . . . . . . . . . . . . . 209 29,267LG Corp. . . . . . . . . . . . . . . 2,720 159,177LG Display Co., Ltd. ADR (b)
(c) . . . . . . . . . . . . . . . . 16,179 96,265LG Display Co., Ltd. (c) . . . . 7,080 83,754LG Electronics, Inc. . . . . . . . 4,396 247,703LG Household & Health Care,
Ltd. . . . . . . . . . . . . . . . 966 1,055,521LG Household & Health Care,
Ltd. Preference Shares. . . . 228 146,961LG Innotek Co., Ltd. . . . . . . 477 45,461LG Uplus Corp. . . . . . . . . . 3,437 39,222Lotte Chemical Corp. . . . . . . 920 181,516Lotte Corp. . . . . . . . . . . . . 2,849 86,341Lotte Shopping Co., Ltd. . . . . 1,061 114,425Medy-Tox, Inc. (c) . . . . . . . . 607 182,737Meritz Securities Co., Ltd. . . . 6,982 29,477Mirae Asset Daewoo Co.,
Ltd. . . . . . . . . . . . . . . . 14,171 88,854NAVER Corp.. . . . . . . . . . . 3,021 396,520NCSoft Corp. . . . . . . . . . . . 2,241 976,099Netmarble Corp. (c) (e) . . . . . 218 17,223NH Investment & Securities
Co., Ltd. . . . . . . . . . . . . 2,874 30,514OCI Co., Ltd. . . . . . . . . . . . 635 36,895Orange Life Insurance, Ltd.
(e) . . . . . . . . . . . . . . . . 998 22,569Orion Corp/Republic of
Korea . . . . . . . . . . . . . . 174 14,314Ottogi Corp. . . . . . . . . . . . . 4 1,950Pan Ocean Co., Ltd. (c) . . . . . 5,010 19,141Pearl Abyss Corp. (c) . . . . . . 887 146,826POSCO ADR . . . . . . . . . . . 13,402 632,038POSCO . . . . . . . . . . . . . . . 395 74,961Posco International Corp. . . . 3,089 49,325S-1 Corp.. . . . . . . . . . . . . . 5,091 417,529
SPDR MSCI EMERGING MARKETS STRATEGICFACTORS ETFSCHEDULE OF INVESTMENTSSeptember 30, 2019
12

Security Description Shares Value
Samsung Biologics Co., Ltd.(c) (e) . . . . . . . . . . . . . . 240 $ 61,698
Samsung C&T Corp. . . . . . . 1,747 131,009Samsung Card Co., Ltd. . . . . 391 11,490Samsung Electro-Mechanics
Co., Ltd. . . . . . . . . . . . . 893 76,896Samsung Electronics Co., Ltd.
GDR (d) . . . . . . . . . . . . 3,253 3,311,554Samsung Electronics Co., Ltd.
Preference Shares. . . . . . . 29,135 962,114Samsung Electronics Co.,
Ltd. . . . . . . . . . . . . . . . 170,022 6,972,018Samsung Electronics Co., Ltd.
GDR (d) . . . . . . . . . . . . 748 620,092Samsung Engineering Co.,
Ltd. (c) . . . . . . . . . . . . . 1,855 26,054Samsung Fire & Marine
Insurance Co., Ltd. . . . . . . 2,808 523,500Samsung Heavy Industries
Co., Ltd. (c) . . . . . . . . . . 7,099 46,767Samsung Life Insurance Co.,
Ltd. . . . . . . . . . . . . . . . 7,305 434,214Samsung SDI Co., Ltd. . . . . . 694 129,383Samsung SDS Co., Ltd.. . . . . 390 62,112Samsung Securities Co., Ltd. . 1,510 44,625Shinhan Financial Group Co.,
Ltd. . . . . . . . . . . . . . . . 3,546 123,917Shinhan Financial Group Co.,
Ltd. ADR (b). . . . . . . . . . 14,104 493,499Shinsegae, Inc. . . . . . . . . . . 192 42,135SK Holdings Co., Ltd.. . . . . . 2,245 382,878SK Hynix, Inc. . . . . . . . . . . 79,577 5,468,569SK Innovation Co., Ltd.. . . . . 2,061 286,023SK Telecom Co., Ltd. ADR . . 27,855 618,381SK Telecom Co., Ltd. . . . . . . 539 108,823S-Oil Corp. . . . . . . . . . . . . 1,003 83,349Woongjin Coway Co., Ltd. . . . 7,780 550,255Woori Financial Group, Inc. . . 20,704 215,495Yuhan Corp. . . . . . . . . . . . . 225 42,982
36,388,348
TAIWAN — 13.1%Acer, Inc.. . . . . . . . . . . . . . 70,258 40,310Advantech Co., Ltd. . . . . . . . 96,951 853,120ASE Technology Holding Co.,
Ltd. . . . . . . . . . . . . . . . 76,124 173,720Asia Cement Corp.. . . . . . . . 43,200 60,293Asustek Computer, Inc. . . . . . 73,000 485,890AU Optronics Corp. . . . . . . . 896,000 227,000Catcher Technology Co., Ltd. . 74,000 560,525Cathay Financial Holding Co.,
Ltd. . . . . . . . . . . . . . . . 252,100 332,347Chailease Holding Co., Ltd. . . 14,673 59,119Chang Hwa Commercial
Bank, Ltd. . . . . . . . . . . . 145,823 101,760Cheng Shin Rubber Industry
Co., Ltd. . . . . . . . . . . . . 38,000 56,098Chicony Electronics Co., Ltd. . 184,822 544,496
Security Description Shares Value
China Airlines, Ltd. . . . . . . . 132,000 $ 38,633China Development Financial
Holding Corp. . . . . . . . . . 730,000 217,415China Life Insurance Co., Ltd.
(c) . . . . . . . . . . . . . . . . 75,884 60,170China Steel Corp. . . . . . . . . 210,440 156,010Chunghwa Telecom Co., Ltd. . 412,540 1,475,993Compal Electronics, Inc. . . . . 411,000 237,132CTBC Financial Holding Co.,
Ltd. . . . . . . . . . . . . . . . 403,900 268,186Delta Electronics, Inc.. . . . . . 25,623 109,431E.Sun Financial Holding Co.,
Ltd. . . . . . . . . . . . . . . . 824,254 697,406Eclat Textile Co., Ltd. . . . . . . 22,379 300,075Eva Airways Corp. . . . . . . . . 232,444 102,270Evergreen Marine Corp.
Taiwan, Ltd. . . . . . . . . . . 43,265 18,129Far Eastern New Century
Corp. . . . . . . . . . . . . . . 73,560 67,930Far EasTone
Telecommunications Co.,Ltd. . . . . . . . . . . . . . . . 547,449 1,279,313
Feng TAY Enterprise Co.,Ltd. . . . . . . . . . . . . . . . 47,814 342,910
First Financial Holding Co.,Ltd. . . . . . . . . . . . . . . . 2,119,627 1,489,399
Formosa Chemicals & FibreCorp. . . . . . . . . . . . . . . 55,000 153,701
Formosa Petrochemical Corp. . 98,000 310,194Formosa Plastics Corp. . . . . . 109,000 332,012Formosa Taffeta Co., Ltd. . . . 15,000 16,342Foxconn Technology Co., Ltd.. 26,892 56,082Fubon Financial Holding Co.,
Ltd. . . . . . . . . . . . . . . . 197,000 282,885Giant Manufacturing Co.,
Ltd. . . . . . . . . . . . . . . . 4,000 27,204Globalwafers Co., Ltd. . . . . . 35,000 354,236Highwealth Construction
Corp. . . . . . . . . . . . . . . 15,500 24,930Hiwin Technologies Corp. . . . 1,116 9,730Hon Hai Precision Industry
Co., Ltd. . . . . . . . . . . . . 541,730 1,278,172Hotai Motor Co., Ltd. . . . . . . 5,000 75,988Hua Nan Financial Holdings
Co., Ltd. . . . . . . . . . . . . 1,424,432 961,880Innolux Corp. . . . . . . . . . . . 787,751 167,582Inventec Corp. . . . . . . . . . . 92,000 63,460Largan Precision Co., Ltd. . . . 12,000 1,721,220Lite-On Technology Corp. . . . 102,952 163,598MediaTek, Inc. . . . . . . . . . . 18,877 224,520Mega Financial Holding Co.,
Ltd. . . . . . . . . . . . . . . . 485,657 450,052Micro-Star International Co.,
Ltd. . . . . . . . . . . . . . . . 78,000 227,027Nan Ya Plastics Corp. . . . . . . 78,000 175,236Nanya Technology Corp. . . . . 156,000 404,777Nien Made Enterprise Co.,
Ltd. . . . . . . . . . . . . . . . 20,000 175,345
SPDR MSCI EMERGING MARKETS STRATEGICFACTORS ETFSCHEDULE OF INVESTMENTSSeptember 30, 2019
13
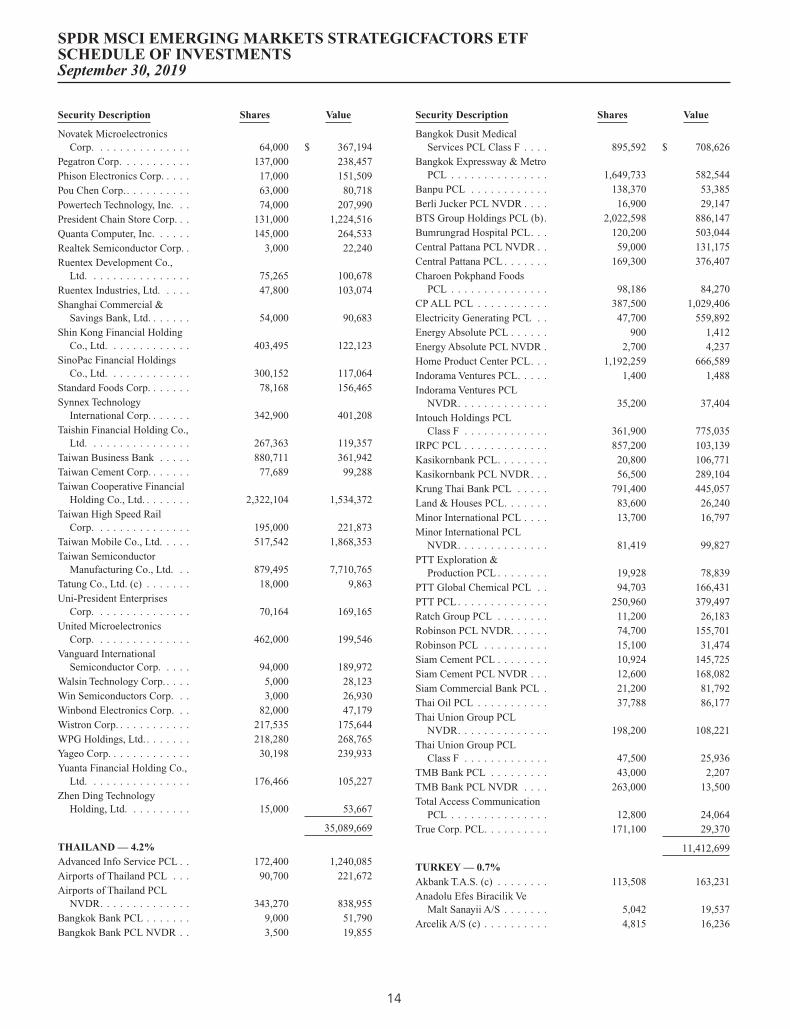
Security Description Shares Value
Novatek MicroelectronicsCorp. . . . . . . . . . . . . . . 64,000 $ 367,194
Pegatron Corp. . . . . . . . . . . 137,000 238,457Phison Electronics Corp. . . . . 17,000 151,509Pou Chen Corp. . . . . . . . . . . 63,000 80,718Powertech Technology, Inc. . . 74,000 207,990President Chain Store Corp. . . 131,000 1,224,516Quanta Computer, Inc. . . . . . 145,000 264,533Realtek Semiconductor Corp. . 3,000 22,240Ruentex Development Co.,
Ltd. . . . . . . . . . . . . . . . 75,265 100,678Ruentex Industries, Ltd. . . . . 47,800 103,074Shanghai Commercial &
Savings Bank, Ltd. . . . . . . 54,000 90,683Shin Kong Financial Holding
Co., Ltd. . . . . . . . . . . . . 403,495 122,123SinoPac Financial Holdings
Co., Ltd. . . . . . . . . . . . . 300,152 117,064Standard Foods Corp. . . . . . . 78,168 156,465Synnex Technology
International Corp. . . . . . . 342,900 401,208Taishin Financial Holding Co.,
Ltd. . . . . . . . . . . . . . . . 267,363 119,357Taiwan Business Bank . . . . . 880,711 361,942Taiwan Cement Corp. . . . . . . 77,689 99,288Taiwan Cooperative Financial
Holding Co., Ltd. . . . . . . . 2,322,104 1,534,372Taiwan High Speed Rail
Corp. . . . . . . . . . . . . . . 195,000 221,873Taiwan Mobile Co., Ltd. . . . . 517,542 1,868,353Taiwan Semiconductor
Manufacturing Co., Ltd. . . 879,495 7,710,765Tatung Co., Ltd. (c) . . . . . . . 18,000 9,863Uni-President Enterprises
Corp. . . . . . . . . . . . . . . 70,164 169,165United Microelectronics
Corp. . . . . . . . . . . . . . . 462,000 199,546Vanguard International
Semiconductor Corp. . . . . 94,000 189,972Walsin Technology Corp. . . . . 5,000 28,123Win Semiconductors Corp. . . 3,000 26,930Winbond Electronics Corp. . . 82,000 47,179Wistron Corp. . . . . . . . . . . . 217,535 175,644WPG Holdings, Ltd. . . . . . . . 218,280 268,765Yageo Corp. . . . . . . . . . . . . 30,198 239,933Yuanta Financial Holding Co.,
Ltd. . . . . . . . . . . . . . . . 176,466 105,227Zhen Ding Technology
Holding, Ltd. . . . . . . . . . 15,000 53,667
35,089,669
THAILAND — 4.2%Advanced Info Service PCL . . 172,400 1,240,085Airports of Thailand PCL . . . 90,700 221,672Airports of Thailand PCL
NVDR. . . . . . . . . . . . . . 343,270 838,955Bangkok Bank PCL . . . . . . . 9,000 51,790Bangkok Bank PCL NVDR . . 3,500 19,855
Security Description Shares Value
Bangkok Dusit MedicalServices PCL Class F . . . . 895,592 $ 708,626
Bangkok Expressway & MetroPCL . . . . . . . . . . . . . . . 1,649,733 582,544
Banpu PCL . . . . . . . . . . . . 138,370 53,385Berli Jucker PCL NVDR . . . . 16,900 29,147BTS Group Holdings PCL (b). 2,022,598 886,147Bumrungrad Hospital PCL. . . 120,200 503,044Central Pattana PCL NVDR . . 59,000 131,175Central Pattana PCL . . . . . . . 169,300 376,407Charoen Pokphand Foods
PCL . . . . . . . . . . . . . . . 98,186 84,270CP ALL PCL . . . . . . . . . . . 387,500 1,029,406Electricity Generating PCL . . 47,700 559,892Energy Absolute PCL . . . . . . 900 1,412Energy Absolute PCL NVDR . 2,700 4,237Home Product Center PCL. . . 1,192,259 666,589Indorama Ventures PCL. . . . . 1,400 1,488Indorama Ventures PCL
NVDR. . . . . . . . . . . . . . 35,200 37,404Intouch Holdings PCL
Class F . . . . . . . . . . . . . 361,900 775,035IRPC PCL . . . . . . . . . . . . . 857,200 103,139Kasikornbank PCL. . . . . . . . 20,800 106,771Kasikornbank PCL NVDR. . . 56,500 289,104Krung Thai Bank PCL . . . . . 791,400 445,057Land & Houses PCL. . . . . . . 83,600 26,240Minor International PCL . . . . 13,700 16,797Minor International PCL
NVDR. . . . . . . . . . . . . . 81,419 99,827PTT Exploration &
Production PCL . . . . . . . . 19,928 78,839PTT Global Chemical PCL . . 94,703 166,431PTT PCL . . . . . . . . . . . . . . 250,960 379,497Ratch Group PCL . . . . . . . . 11,200 26,183Robinson PCL NVDR. . . . . . 74,700 155,701Robinson PCL . . . . . . . . . . 15,100 31,474Siam Cement PCL . . . . . . . . 10,924 145,725Siam Cement PCL NVDR . . . 12,600 168,082Siam Commercial Bank PCL . 21,200 81,792Thai Oil PCL . . . . . . . . . . . 37,788 86,177Thai Union Group PCL
NVDR. . . . . . . . . . . . . . 198,200 108,221Thai Union Group PCL
Class F . . . . . . . . . . . . . 47,500 25,936TMB Bank PCL . . . . . . . . . 43,000 2,207TMB Bank PCL NVDR . . . . 263,000 13,500Total Access Communication
PCL . . . . . . . . . . . . . . . 12,800 24,064True Corp. PCL. . . . . . . . . . 171,100 29,370
11,412,699
TURKEY — 0.7%Akbank T.A.S. (c) . . . . . . . . 113,508 163,231Anadolu Efes Biracilik Ve
Malt Sanayii A/S . . . . . . . 5,042 19,537Arcelik A/S (c) . . . . . . . . . . 4,815 16,236
SPDR MSCI EMERGING MARKETS STRATEGICFACTORS ETFSCHEDULE OF INVESTMENTSSeptember 30, 2019
14

Security Description Shares Value
Aselsan Elektronik Sanayi VeTicaret A/S . . . . . . . . . . . 1,960 $ 6,984
BIM Birlesik Magazalar A/S . 56,458 491,139Eregli Demir ve Celik
Fabrikalari TAS . . . . . . . . 27,065 32,834Ford Otomotiv Sanayi A/S . . . 7,872 82,812Haci Omer Sabanci Holding
A/S. . . . . . . . . . . . . . . . 38,573 65,376KOC Holding A/S . . . . . . . . 27,660 92,633TAV Havalimanlari Holding
A/S. . . . . . . . . . . . . . . . 3,078 12,865Tupras Turkiye Petrol
Rafinerileri A/S . . . . . . . . 14,379 365,427Turk Hava Yollari AO (c) . . . . 16,041 35,170Turkcell Iletisim Hizmetleri
A/S. . . . . . . . . . . . . . . . 25,762 59,358Turkiye Garanti Bankasi A/S
(c) . . . . . . . . . . . . . . . . 104,868 189,622Turkiye Is Bankasi A/S
Class C (c) . . . . . . . . . . . 112,870 125,333Turkiye Sise ve Cam
Fabrikalari A/S . . . . . . . . 35,308 29,202
1,787,759
UNITED ARAB EMIRATES— 1.3%
Abu Dhabi Commercial BankPJSC. . . . . . . . . . . . . . . 60,636 129,752
Aldar Properties PJSC . . . . . 115,243 65,573DP World PLC . . . . . . . . . . 10,339 144,643Dubai Islamic Bank PJSC . . . 123,776 176,912Emaar Development PJSC . . . 165,437 185,563Emaar Malls PJSC . . . . . . . . 50,000 25,591Emaar Properties PJSC . . . . . 117,463 147,422Emirates Telecommunications
Group Co. PJSC . . . . . . . 333,925 1,500,010First Abu Dhabi Bank PJSC . . 293,875 1,203,294
3,578,760
UNITED STATES — 0.1%Titan Cement International SA
(c) . . . . . . . . . . . . . . . . 11,069 230,488
TOTAL COMMONSTOCKS(Cost $254,820,585) . . . . . 266,665,663
RIGHTS — 0.0% (a)CHINA — 0.0% (a)Legend Holdings Corp.
(expiring 5/19/23) (c) (f) . . 1,461 —
THAILAND — 0.0% (a)TMB Bank PCL (expiring
11/26/19) (c) (g) . . . . . . . 30,321 169
Security Description Shares Value
TMB Bank PCL (expiring11/26/19) (g). . . . . . . . . . 185,943 $ 1,033
1,202
TOTAL RIGHTS(Cost $0) . . . . . . . . . . . . 1,202
WARRANTS — 0.0% (a)THAILAND — 0.0% (a)Minor International PCL
(expiring 12/31/21) NVDR(c) . . . . . . . . . . . . . . . . 4,110 535
Minor International PCL(expiring 9/30/21) (c) . . . . 875 114
TOTAL WARRANTS(Cost $0) . . . . . . . . . . . . 649
SHORT-TERM INVESTMENTS — 0.9%State Street Institutional Liquid
Reserves Fund, Premier Class2.03% (h) (i) . . . . . . . . . . . . 437,290 437,334
State Street Navigator SecuritiesLending Portfolio III (j) (k) . . . 1,941,419 1,941,419
TOTAL SHORT-TERM INVESTMENTS(Cost $2,378,758). . . . . . . . . . . . . . . . . . . . . . 2,378,753
TOTAL INVESTMENTS — 100.1%(Cost $257,205,806) . . . . . . . . . . . . . . . . . . . . 269,052,781
LIABILITIES IN EXCESS OF OTHER ASSETS— (0.1)% . . . . . . . . . . . . . . . . . . . . . . . . . . (186,272)
NET ASSETS — 100.0% . . . . . . . . . . . . . . . . . $ 268,866,509
SPDR MSCI EMERGING MARKETS STRATEGICFACTORS ETFSCHEDULE OF INVESTMENTSSeptember 30, 2019
15

(a) Amount is less than 0.05% of net assets.(b) All or a portion of the shares of the security are on loan at
September 30, 2019.(c) Non-income producing security.(d) Reflects separate holdings of the issuer’s common stock traded on
different securities exchanges.(e) Securities purchased pursuant to Rule 144A of the Securities Act
of 1933, as amended. These securities, which represent 1.4% ofnet assets as of September 30, 2019, are considered liquid andmay be resold in transactions exempt from registration, normallyto qualified institutional buyers.
(f) Fair valued as determined in good faith by the Trust’s OversightCommittee in accordance with policy and procedures approved bythe Board of Trustees. Security value is determined based onLevel 3 inputs. As of September 30, 2019, total aggregate fairvalue of these securities is $1,073, representing less than 0.05% ofthe Fund’s net assets.
(g) Fair valued as determined in good faith by the Trust’s OversightCommittee in accordance with policy and procedures approved bythe Board of Trustees. As of September 30, 2019, total aggregatefair value of these securities is $1,240, representing less than0.05% of net assets.
(h) The Fund invested in certain money market funds managed bySSGA Funds Management, Inc. Amounts related to thesetransactions during the period ended September 30, 2019 areshown in the Affiliate Table below.
(i) The rate shown is the annualized seven-day yield at September 30,2019.
(j) The Fund invested in an affiliated entity. Amounts related to thesetransactions during the period ended September 30, 2019 areshown in the Affiliate Table below.
(k) Investment of cash collateral for securities loaned.
ADR American Depositary ReceiptGDR Global Depositary ReceiptNVDR Non Voting Depositary ReceiptREIT Real Estate Investment Trust
INR Indian Rupee
The following table summarizes the value of the Fund’s investments according to the fair value hierarchy as of September 30,2019.
DescriptionLevel 1 –
Quoted Prices
Level 2 –Other SignificantObservable Inputs
Level 3 –Significant
Unobservable Inputs Total
ASSETS:INVESTMENTS:Corporate Bonds & Notes . . . . . . . . . . . . . . . . . . . . . . . . . . . . . . $ — $ 6,514 $ — $ 6,514
Common Stocks . . . . . . . . . . . . . . . . . . . . . . . . . . . . . . . . . . . . 257,305,622 9,358,968 1,073(a) 266,665,663
Rights . . . . . . . . . . . . . . . . . . . . . . . . . . . . . . . . . . . . . . . . . . — 1,202 — 1,202
Warrants . . . . . . . . . . . . . . . . . . . . . . . . . . . . . . . . . . . . . . . . . 649 — — 649
Short-Term Investments . . . . . . . . . . . . . . . . . . . . . . . . . . . . . . . 2,378,753 — — 2,378,753
TOTAL INVESTMENTS . . . . . . . . . . . . . . . . . . . . . . . . . . . . . $259,685,024 $9,366,684 $1,073 $269,052,781
(a) Fund held Level 3 securities that were valued at $0 at September 30, 2019.
SPDR MSCI EMERGING MARKETS STRATEGICFACTORS ETFSCHEDULE OF INVESTMENTSSeptember 30, 2019
16
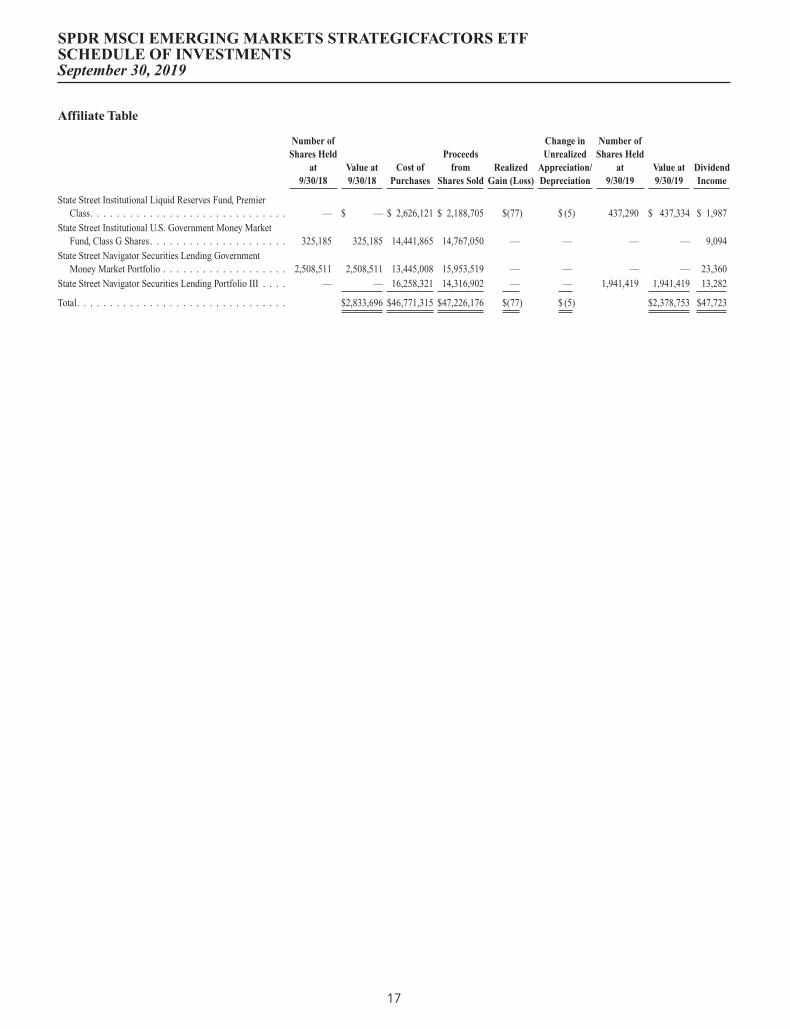
Affiliate Table
Number ofShares Held
at9/30/18
Value at9/30/18
Cost ofPurchases
Proceedsfrom
Shares SoldRealized
Gain (Loss)
Change inUnrealized
Appreciation/Depreciation
Number ofShares Held
at9/30/19
Value at9/30/19
DividendIncome
State Street Institutional Liquid Reserves Fund, PremierClass. . . . . . . . . . . . . . . . . . . . . . . . . . . . . . — $ — $ 2,626,121 $ 2,188,705 $(77) $ (5) 437,290 $ 437,334 $ 1,987
State Street Institutional U.S. Government Money MarketFund, Class G Shares. . . . . . . . . . . . . . . . . . . . . 325,185 325,185 14,441,865 14,767,050 — — — — 9,094
State Street Navigator Securities Lending GovernmentMoney Market Portfolio . . . . . . . . . . . . . . . . . . . 2,508,511 2,508,511 13,445,008 15,953,519 — — — — 23,360
State Street Navigator Securities Lending Portfolio III . . . . — — 16,258,321 14,316,902 — — 1,941,419 1,941,419 13,282
Total. . . . . . . . . . . . . . . . . . . . . . . . . . . . . . . . $2,833,696 $46,771,315 $47,226,176 $(77) $ (5) $2,378,753 $47,723
SPDR MSCI EMERGING MARKETS STRATEGICFACTORS ETFSCHEDULE OF INVESTMENTSSeptember 30, 2019
17

Security Description Shares Value
COMMON STOCKS — 99.4%AUSTRALIA — 1.6%AGL Energy, Ltd.. . . . . . . . . . . . . 86 $ 1,111AMP, Ltd. . . . . . . . . . . . . . . . . . 846 1,041Aristocrat Leisure, Ltd. . . . . . . . . . 380 7,843Aurizon Holdings, Ltd. . . . . . . . . . 876 3,486Australia & New Zealand Banking
Group, Ltd. . . . . . . . . . . . . . . . 1,060 20,389Bank of Queensland, Ltd. (a). . . . . . 554 3,707Bendigo & Adelaide Bank, Ltd. (a). . 232 1,798BHP Group PLC . . . . . . . . . . . . . 465 9,927BHP Group, Ltd. . . . . . . . . . . . . . 504 12,482Brambles, Ltd.. . . . . . . . . . . . . . . 1,575 12,110Caltex Australia, Ltd. . . . . . . . . . . 81 1,438Cochlear, Ltd. . . . . . . . . . . . . . . . 53 7,441Commonwealth Bank of Australia . . 510 27,803CSL, Ltd. . . . . . . . . . . . . . . . . . . 395 62,257Dexus REIT . . . . . . . . . . . . . . . . 504 4,055Flight Centre Travel Group, Ltd. (a) . 84 2,697Fortescue Metals Group, Ltd. (a) . . . 983 5,834Goodman Group REIT . . . . . . . . . 536 5,126GPT Group REIT. . . . . . . . . . . . . 986 4,096Incitec Pivot, Ltd.. . . . . . . . . . . . . 468 1,070Insurance Australia Group, Ltd. . . . . 136 725LendLease Group. . . . . . . . . . . . . 51 604Macquarie Group, Ltd. . . . . . . . . . 45 3,978Medibank Pvt, Ltd.. . . . . . . . . . . . 2,462 5,646Mirvac Group REIT . . . . . . . . . . . 2,149 4,435National Australia Bank, Ltd. . . . . . 1,349 27,022Newcrest Mining, Ltd.. . . . . . . . . . 820 19,218Oil Search, Ltd. . . . . . . . . . . . . . . 373 1,842Origin Energy, Ltd. (a) . . . . . . . . . 523 2,811QBE Insurance Group, Ltd. . . . . . . 410 3,473REA Group, Ltd. (a) . . . . . . . . . . . 56 4,087Santos, Ltd. . . . . . . . . . . . . . . . . 5 26Scentre Group REIT . . . . . . . . . . . 1,754 4,649Sonic Healthcare, Ltd. . . . . . . . . . . 596 11,275South32, Ltd. . . . . . . . . . . . . . . . 715 1,263Stockland REIT . . . . . . . . . . . . . . 1,178 3,615Suncorp Group, Ltd. (b). . . . . . . . . 304 2,798Telstra Corp., Ltd. . . . . . . . . . . . . 4,472 10,587Transurban Group Stapled Security . 639 6,331Vicinity Centres REIT. . . . . . . . . . 1,854 3,214Wesfarmers, Ltd. . . . . . . . . . . . . . 867 23,273Westpac Banking Corp. . . . . . . . . . 1,431 28,607Woodside Petroleum, Ltd. . . . . . . . 128 2,795Woolworths Group, Ltd.. . . . . . . . . 840 21,121
389,106
AUSTRIA — 0.1%Erste Group Bank AG . . . . . . . . . . 369 12,205OMV AG . . . . . . . . . . . . . . . . . . 66 3,543Raiffeisen Bank International AG. . . 5 116Voestalpine AG . . . . . . . . . . . . . . 15 345
16,209
Security Description Shares Value
BELGIUM — 0.3%Ageas . . . . . . . . . . . . . . . . . . . . 96 $ 5,325Anheuser-Busch InBev SA . . . . . . . 110 10,483Colruyt SA . . . . . . . . . . . . . . . . . 373 20,446Groupe Bruxelles Lambert SA . . . . 36 3,458KBC Group NV. . . . . . . . . . . . . . 71 4,615Proximus SADP . . . . . . . . . . . . . 590 17,528Solvay SA . . . . . . . . . . . . . . . . . 30 3,107UCB SA . . . . . . . . . . . . . . . . . . 229 16,627
81,589
CANADA — 3.5%Agnico Eagle Mines, Ltd.. . . . . . . . 944 50,622Alimentation Couche-Tard, Inc.
Class B . . . . . . . . . . . . . . . . . 266 8,157Bank of Montreal . . . . . . . . . . . . . 357 26,311Bank of Nova Scotia . . . . . . . . . . . 349 19,836Barrick Gold Corp.. . . . . . . . . . . . 3,284 56,850Barrick Gold Corp. (c) . . . . . . . . . 647 11,200Bausch Health Cos., Inc. (b) . . . . . . 151 3,296BCE, Inc. . . . . . . . . . . . . . . . . . . 589 28,507Bombardier, Inc. Class B (a)(b) . . . . 726 982Brookfield Asset Management, Inc.
Class A . . . . . . . . . . . . . . . . . 182 9,670Canadian Imperial Bank of
Commerce (a) . . . . . . . . . . . . . 227 18,741Canadian National Railway Co. . . . . 557 50,046Canadian Natural Resources, Ltd. . . 230 6,124Canadian Pacific Railway, Ltd. . . . . 45 10,007Cenovus Energy, Inc. . . . . . . . . . . 373 3,502CGI, Inc. (b) . . . . . . . . . . . . . . . . 75 5,934CI Financial Corp. . . . . . . . . . . . . 373 5,446Constellation Software, Inc. . . . . . . 21 20,987Enbridge, Inc. (a) . . . . . . . . . . . . . 391 13,732Encana Corp. . . . . . . . . . . . . . . . 301 1,380Fairfax Financial Holdings, Ltd.. . . . 45 19,849First Capital Realty, Inc. . . . . . . . . 449 7,484Fortis, Inc. . . . . . . . . . . . . . . . . . 152 6,430Franco-Nevada Corp. . . . . . . . . . . 672 61,272George Weston, Ltd. . . . . . . . . . . . 78 6,566Gildan Activewear, Inc. . . . . . . . . . 196 6,961Great-West Lifeco, Inc. . . . . . . . . . 140 3,364Husky Energy, Inc. . . . . . . . . . . . . 301 2,119iA Financial Corp., Inc. . . . . . . . . . 75 3,415Imperial Oil, Ltd. . . . . . . . . . . . . . 80 2,085Intact Financial Corp. . . . . . . . . . . 548 55,189Inter Pipeline, Ltd. (a) . . . . . . . . . . 449 7,885Kinross Gold Corp. (b) . . . . . . . . . 4,000 18,429Kirkland Lake Gold, Ltd. . . . . . . . . 300 13,448Loblaw Cos., Ltd.. . . . . . . . . . . . . 21 1,197Magna International, Inc. . . . . . . . . 342 18,242Manulife Financial Corp. . . . . . . . . 373 6,846Metro, Inc. . . . . . . . . . . . . . . . . . 130 5,727National Bank of Canada . . . . . . . . 75 3,734Nutrien, Ltd. (a). . . . . . . . . . . . . . 151 7,527Open Text Corp. . . . . . . . . . . . . . 226 9,224Pembina Pipeline Corp. . . . . . . . . . 30 1,113
SPDR MSCI WORLD STRATEGICFACTORS ETFSCHEDULE OF INVESTMENTSSeptember 30, 2019
1

Security Description Shares Value
Power Corp. of Canada . . . . . . . . . 359 $ 8,275Power Financial Corp. (a). . . . . . . . 125 2,900PrairieSky Royalty, Ltd. (a) . . . . . . 71 991Restaurant Brands International,
Inc. . . . . . . . . . . . . . . . . . . . . 8 569RioCan Real Estate Investment
Trust . . . . . . . . . . . . . . . . . . . 550 10,958Rogers Communications, Inc.
Class B (a) . . . . . . . . . . . . . . . 524 25,539Royal Bank of Canada. . . . . . . . . . 386 31,332Saputo, Inc. . . . . . . . . . . . . . . . . 211 6,489Shaw Communications, Inc. Class B. 605 11,894SmartCentres Real Estate Investment
Trust . . . . . . . . . . . . . . . . . . . 11 270SNC-Lavalin Group, Inc. (a) . . . . . . 75 1,057Sun Life Financial, Inc. . . . . . . . . . 120 5,369Suncor Energy, Inc. . . . . . . . . . . . 218 6,881TC Energy Corp. . . . . . . . . . . . . . 152 7,876Teck Resources, Ltd. Class B . . . . . 151 2,450TELUS Corp. . . . . . . . . . . . . . . . 739 26,317Thomson Reuters Corp. . . . . . . . . . 286 19,128Toronto-Dominion Bank . . . . . . . . 866 50,528Waste Connections, Inc.. . . . . . . . . 75 6,900Wheaton Precious Metals Corp.. . . . 379 9,944
855,103
CHINA — 0.1%Alcon, Inc. (b) . . . . . . . . . . . . . . . 184 10,739BOC Hong Kong Holdings, Ltd. . . . 2,500 8,483
19,222
DENMARK — 1.0%AP Moller - Maersk A/S Class A . . . 5 5,337Carlsberg A/S Class B . . . . . . . . . . 5 739Chr. Hansen Holding A/S . . . . . . . . 187 15,875Coloplast A/S Class B . . . . . . . . . . 274 33,007Danske Bank A/S . . . . . . . . . . . . . 503 7,005Demant A/S (a)(b) . . . . . . . . . . . . 125 3,202DSV A/S . . . . . . . . . . . . . . . . . . 104 9,898H Lundbeck A/S . . . . . . . . . . . . . 33 1,095ISS A/S . . . . . . . . . . . . . . . . . . . 62 1,534Novo Nordisk A/S Class B . . . . . . . 2,156 110,861Novozymes A/S Class B . . . . . . . . 200 8,411Orsted A/S (d) . . . . . . . . . . . . . . . 50 4,648Pandora A/S . . . . . . . . . . . . . . . . 313 12,564Tryg A/S . . . . . . . . . . . . . . . . . . 495 14,188Vestas Wind Systems A/S. . . . . . . . 119 9,241
237,605
FINLAND — 0.5%Elisa Oyj . . . . . . . . . . . . . . . . . . 506 26,093Fortum Oyj. . . . . . . . . . . . . . . . . 5 118Kone Oyj Class B. . . . . . . . . . . . . 373 21,243Neste Oyj (a) . . . . . . . . . . . . . . . 235 7,781Nokia Oyj (e) . . . . . . . . . . . . . . . 479 2,428Nokia Oyj (e) . . . . . . . . . . . . . . . 4,139 20,928Nokian Renkaat Oyj . . . . . . . . . . . 99 2,793
Security Description Shares Value
Nordea Bank Abp. . . . . . . . . . . . . 1,381 $ 9,805Orion Oyj Class B . . . . . . . . . . . . 131 4,887Sampo Oyj Class A. . . . . . . . . . . . 525 20,880Stora Enso Oyj Class R . . . . . . . . . 193 2,326UPM-Kymmene Oyj . . . . . . . . . . . 157 4,642Wartsila OYJ Abp (a) . . . . . . . . . . 405 4,537
128,461
FRANCE — 2.8%Aeroports de Paris . . . . . . . . . . . . 3 534Air Liquide SA . . . . . . . . . . . . . . 63 8,970Airbus SE . . . . . . . . . . . . . . . . . 86 11,176Arkema SA. . . . . . . . . . . . . . . . . 9 839Atos SE . . . . . . . . . . . . . . . . . . . 27 1,904AXA SA . . . . . . . . . . . . . . . . . . 973 24,854BNP Paribas SA . . . . . . . . . . . . . 849 41,346Bouygues SA . . . . . . . . . . . . . . . 101 4,047Bureau Veritas SA . . . . . . . . . . . . 5 120Capgemini SE . . . . . . . . . . . . . . . 26 3,064Carrefour SA . . . . . . . . . . . . . . . 479 8,387Casino Guichard Perrachon SA (a) . . 90 4,297Cie de Saint-Gobain . . . . . . . . . . . 142 5,573Cie Generale des Etablissements
Michelin SCA . . . . . . . . . . . . . 65 7,256CNP Assurances . . . . . . . . . . . . . 15 290Credit Agricole SA. . . . . . . . . . . . 1,136 13,797Danone SA. . . . . . . . . . . . . . . . . 102 8,987Dassault Systemes SE . . . . . . . . . . 69 9,836Eiffage SA . . . . . . . . . . . . . . . . . 35 3,629Electricite de France SA . . . . . . . . 319 3,572Engie SA . . . . . . . . . . . . . . . . . . 949 15,498EssilorLuxottica SA . . . . . . . . . . . 33 4,758Eurazeo SE. . . . . . . . . . . . . . . . . 118 8,780Faurecia SE . . . . . . . . . . . . . . . . 45 2,135Gecina SA REIT . . . . . . . . . . . . . 21 3,301Getlink SE . . . . . . . . . . . . . . . . . 652 9,795Hermes International . . . . . . . . . . 108 74,648Iliad SA . . . . . . . . . . . . . . . . . . . 5 470Ipsen SA . . . . . . . . . . . . . . . . . . 26 2,469Kering SA . . . . . . . . . . . . . . . . . 54 27,525Klepierre SA REIT. . . . . . . . . . . . 98 3,329Legrand SA . . . . . . . . . . . . . . . . 11 785L’Oreal SA. . . . . . . . . . . . . . . . . 185 51,813LVMH Moet Hennessy Louis
Vuitton SE . . . . . . . . . . . . . . . 202 80,303Natixis SA . . . . . . . . . . . . . . . . . 589 2,443Orange SA . . . . . . . . . . . . . . . . . 2,206 34,620Pernod Ricard SA . . . . . . . . . . . . 15 2,672Peugeot SA. . . . . . . . . . . . . . . . . 303 7,558Publicis Groupe SA . . . . . . . . . . . 70 3,443Renault SA. . . . . . . . . . . . . . . . . 169 9,702Safran SA . . . . . . . . . . . . . . . . . 57 8,976Sanofi . . . . . . . . . . . . . . . . . . . . 229 21,236Schneider Electric SE . . . . . . . . . . 96 8,425SCOR SE. . . . . . . . . . . . . . . . . . 110 4,544Societe BIC SA (a) . . . . . . . . . . . . 69 4,634Societe Generale SA . . . . . . . . . . . 959 26,284
SPDR MSCI WORLD STRATEGICFACTORS ETFSCHEDULE OF INVESTMENTSSeptember 30, 2019
2

Security Description Shares Value
Sodexo SA . . . . . . . . . . . . . . . . . 36 $ 4,042Suez . . . . . . . . . . . . . . . . . . . . . 206 3,240Thales SA . . . . . . . . . . . . . . . . . 81 9,316TOTAL SA. . . . . . . . . . . . . . . . . 727 37,952Unibail-Rodamco-Westfield . . . . . . 780 5,603Unibail-Rodamco-Westfield REIT . . 20 2,916Valeo SA . . . . . . . . . . . . . . . . . . 185 6,000Veolia Environnement SA . . . . . . . 227 5,756Vinci SA . . . . . . . . . . . . . . . . . . 107 11,528Vivendi SA. . . . . . . . . . . . . . . . . 212 5,820Worldline SA (b)(d) . . . . . . . . . . . 10 631
675,428
GERMANY — 2.3%adidas AG . . . . . . . . . . . . . . . . . 158 49,204Allianz SE . . . . . . . . . . . . . . . . . 143 33,339BASF SE . . . . . . . . . . . . . . . . . . 215 15,029Bayer AG . . . . . . . . . . . . . . . . . . 247 17,420Bayerische Motoren Werke AG . . . . 167 11,759Bayerische Motoren Werke AG
Preference Shares . . . . . . . . . . . 41 2,277Beiersdorf AG . . . . . . . . . . . . . . . 81 9,555Brenntag AG. . . . . . . . . . . . . . . . 66 3,195Commerzbank AG . . . . . . . . . . . . 1,072 6,220Continental AG . . . . . . . . . . . . . . 101 12,960Covestro AG (d). . . . . . . . . . . . . . 218 10,790Daimler AG . . . . . . . . . . . . . . . . 623 30,985Deutsche Bank AG . . . . . . . . . . . . 1,590 11,910Deutsche Boerse AG . . . . . . . . . . . 21 3,283Deutsche Lufthansa AG . . . . . . . . . 152 2,416Deutsche Post AG . . . . . . . . . . . . 784 26,193Deutsche Telekom AG . . . . . . . . . . 5,151 86,447E.ON SE . . . . . . . . . . . . . . . . . . 566 5,503Fresenius Medical Care AG & Co.
KGaA . . . . . . . . . . . . . . . . . . 36 2,422Fresenius SE & Co. KGaA . . . . . . . 80 3,741Fuchs Petrolub SE Preference
Shares . . . . . . . . . . . . . . . . . . 81 3,043Hannover Rueck SE . . . . . . . . . . . 29 4,904HeidelbergCement AG . . . . . . . . . 45 3,254Henkel AG & Co. KGaA Preference
Shares . . . . . . . . . . . . . . . . . . 120 11,879Henkel AG & Co. KGaA . . . . . . . . 101 9,249HUGO BOSS AG. . . . . . . . . . . . . 57 3,054Infineon Technologies AG . . . . . . . 864 15,553Knorr-Bremse AG . . . . . . . . . . . . 55 5,171Lanxess AG . . . . . . . . . . . . . . . . 8 488Merck KGaA . . . . . . . . . . . . . . . 8 901METRO AG . . . . . . . . . . . . . . . . 38 600MTU Aero Engines AG . . . . . . . . . 39 10,366Muenchener
Rueckversicherungs-GesellschaftAG in Muenchen . . . . . . . . . . . 127 32,869
Porsche Automobil Holding SEPreference Shares . . . . . . . . . . . 107 6,964
RWE AG . . . . . . . . . . . . . . . . . . 247 7,726SAP SE . . . . . . . . . . . . . . . . . . . 125 14,701
Security Description Shares Value
Siemens AG . . . . . . . . . . . . . . . . 161 $ 17,245Siemens Healthineers AG (d) . . . . . 172 6,768Telefonica Deutschland Holding AG . 3,722 10,380Thyssenkrupp AG . . . . . . . . . . . . 140 1,939TUI AG . . . . . . . . . . . . . . . . . . . 877 10,222Uniper SE . . . . . . . . . . . . . . . . . 285 9,349Volkswagen AG . . . . . . . . . . . . . . 14 2,407Volkswagen AG Preference Shares . . 146 24,840Vonovia SE. . . . . . . . . . . . . . . . . 84 4,263
562,783
HONG KONG — 1.7%AIA Group, Ltd. . . . . . . . . . . . . . 1,200 11,335ASM Pacific Technology, Ltd. . . . . . 200 2,441Bank of East Asia, Ltd. . . . . . . . . . 363 894CK Asset Holdings, Ltd. . . . . . . . . 1,270 8,602CK Hutchison Holdings, Ltd. . . . . . 1,000 8,827CK Infrastructure Holdings, Ltd. . . . 1,500 10,093CLP Holdings, Ltd. . . . . . . . . . . . 3,000 31,514Dairy Farm International Holdings,
Ltd. . . . . . . . . . . . . . . . . . . . . 1,000 6,300Galaxy Entertainment Group, Ltd. . . 1,000 6,219Hang Seng Bank, Ltd. . . . . . . . . . . 2,900 62,518Henderson Land Development Co.,
Ltd. . . . . . . . . . . . . . . . . . . . . 2,310 10,755HK Electric Investments & HK
Electric Investments, Ltd.Class SS. . . . . . . . . . . . . . . . . 16,331 15,561
HKT Trust & HKT, Ltd.. . . . . . . . . 14,540 23,073Hong Kong & China Gas Co., Ltd. . . 10,463 20,394Hong Kong Exchanges & Clearing,
Ltd. . . . . . . . . . . . . . . . . . . . . 856 25,114Hongkong Land Holdings, Ltd. . . . . 800 4,496Jardine Matheson Holdings, Ltd. . . . 500 26,750Jardine Strategic Holdings, Ltd. . . . . 300 8,964Link REIT . . . . . . . . . . . . . . . . . 2,500 27,569MTR Corp., Ltd. . . . . . . . . . . . . . 5,665 31,796New World Development Co., Ltd. . . 1,322 1,717NWS Holdings, Ltd. . . . . . . . . . . . 5,000 7,743PCCW, Ltd. . . . . . . . . . . . . . . . . 12,000 6,735Power Assets Holdings, Ltd. . . . . . . 3,000 20,148Sands China, Ltd.. . . . . . . . . . . . . 2,000 9,057Techtronic Industries Co., Ltd.. . . . . 500 3,479WH Group, Ltd. (d) . . . . . . . . . . . 2,500 2,239Wharf Real Estate Investment Co.,
Ltd. . . . . . . . . . . . . . . . . . . . . 1,000 5,460Wheelock & Co., Ltd. . . . . . . . . . . 2,000 11,391Yue Yuen Industrial Holdings, Ltd. . . 500 1,368
412,552
IRELAND — 0.9%Accenture PLC Class A . . . . . . . . . 851 163,690AerCap Holdings NV (b) . . . . . . . . 74 4,052AIB Group PLC. . . . . . . . . . . . . . 1,181 3,507Bank of Ireland Group PLC . . . . . . 342 1,357CRH PLC . . . . . . . . . . . . . . . . . 167 5,751Flutter Entertainment PLC . . . . . . . 12 1,122
SPDR MSCI WORLD STRATEGICFACTORS ETFSCHEDULE OF INVESTMENTSSeptember 30, 2019
3

Security Description Shares Value
Kerry Group PLC Class A . . . . . . . 333 $ 38,954Smurfit Kappa Group PLC . . . . . . . 92 2,738
221,171
ISRAEL — 0.3%Azrieli Group, Ltd. . . . . . . . . . . . . 134 10,525Bank Hapoalim BM (b) . . . . . . . . . 986 7,773Bank Leumi Le-Israel BM . . . . . . . 1,824 12,983Check Point Software Technologies,
Ltd. (a)(b). . . . . . . . . . . . . . . . 185 20,257Elbit Systems, Ltd. . . . . . . . . . . . . 32 5,303Israel Chemicals, Ltd. . . . . . . . . . . 5 25Mizrahi Tefahot Bank, Ltd. . . . . . . . 563 13,995Nice, Ltd. (b) . . . . . . . . . . . . . . . 57 8,380Teva Pharmaceutical Industries, Ltd.
(b) . . . . . . . . . . . . . . . . . . . . 343 2,360
81,601
ITALY — 0.7%Assicurazioni Generali SpA . . . . . . 1,561 30,258Atlantia SpA. . . . . . . . . . . . . . . . 142 3,435Enel SpA . . . . . . . . . . . . . . . . . . 2,843 21,234Eni SpA. . . . . . . . . . . . . . . . . . . 1,065 16,294Ferrari NV . . . . . . . . . . . . . . . . . 96 14,814Intesa Sanpaolo SpA. . . . . . . . . . . 10,857 25,750Leonardo SpA . . . . . . . . . . . . . . . 389 4,576Mediobanca Banca di Credito
Finanziario SpA . . . . . . . . . . . . 390 4,260Moncler SpA . . . . . . . . . . . . . . . 223 7,950Poste Italiane SpA (d) . . . . . . . . . . 461 5,242Recordati SpA. . . . . . . . . . . . . . . 104 4,463Snam SpA . . . . . . . . . . . . . . . . . 4,459 22,527Telecom Italia SpA (b)(e) . . . . . . . . 6,484 3,701Telecom Italia SpA (e). . . . . . . . . . 5,042 2,757UniCredit SpA . . . . . . . . . . . . . . 995 11,737
178,998
JAPAN — 10.0%ABC-Mart, Inc. . . . . . . . . . . . . . . 200 12,713Aeon Co., Ltd.. . . . . . . . . . . . . . . 500 9,163AGC, Inc.. . . . . . . . . . . . . . . . . . 200 6,199Aisin Seiki Co., Ltd. (a) . . . . . . . . . 200 6,283Ajinomoto Co., Inc. . . . . . . . . . . . 300 5,663ANA Holdings, Inc. . . . . . . . . . . . 300 10,087Aozora Bank, Ltd. . . . . . . . . . . . . 200 5,000Asahi Group Holdings, Ltd. . . . . . . 200 9,901Asahi Kasei Corp. . . . . . . . . . . . . 300 2,953Astellas Pharma, Inc. . . . . . . . . . . 2,900 41,283Bandai Namco Holdings, Inc. . . . . . 100 6,227Bank of Kyoto, Ltd. . . . . . . . . . . . 100 3,909Benesse Holdings, Inc. (a) . . . . . . . 200 5,193Bridgestone Corp. . . . . . . . . . . . . 200 7,743Calbee, Inc. . . . . . . . . . . . . . . . . 200 6,218Canon, Inc. . . . . . . . . . . . . . . . . . 1,500 40,007Central Japan Railway Co. . . . . . . . 100 20,560Chiba Bank, Ltd. . . . . . . . . . . . . . 300 1,543Chubu Electric Power Co., Inc. (a) . . 500 7,240
Security Description Shares Value
Chugoku Electric Power Co., Inc.(a). . . . . . . . . . . . . . . . . . . . . 200 $ 2,570
Concordia Financial Group, Ltd. . . . 900 3,448Daifuku Co., Ltd. . . . . . . . . . . . . . 200 10,308Dai-ichi Life Holdings, Inc. . . . . . . 500 7,536Daiichi Sankyo Co., Ltd. . . . . . . . . 100 6,296Daikin Industries, Ltd.. . . . . . . . . . 100 13,121Daito Trust Construction Co., Ltd. . . 100 12,778Daiwa House REIT Investment
Corp.. . . . . . . . . . . . . . . . . . . 8 22,503Daiwa Securities Group, Inc.. . . . . . 600 2,673Dentsu, Inc. . . . . . . . . . . . . . . . . 200 7,041East Japan Railway Co. . . . . . . . . . 200 19,079FamilyMart Co., Ltd. (a) . . . . . . . . 300 7,309FANUC Corp. . . . . . . . . . . . . . . . 100 18,820FUJIFILM Holdings Corp. . . . . . . . 500 21,929Fujitsu, Ltd. . . . . . . . . . . . . . . . . 200 16,017Hamamatsu Photonics KK . . . . . . . 500 18,552Hankyu Hanshin Holdings, Inc. . . . . 200 7,708Hitachi, Ltd. . . . . . . . . . . . . . . . . 300 11,167Honda Motor Co., Ltd. . . . . . . . . . 900 23,305Hoya Corp.. . . . . . . . . . . . . . . . . 300 24,480Idemitsu Kosan Co., Ltd. (a) . . . . . . 200 5,653IHI Corp. . . . . . . . . . . . . . . . . . . 100 2,173Inpex Corp. . . . . . . . . . . . . . . . . 300 2,751Isetan Mitsukoshi Holdings, Ltd. (a) . 200 1,595Isuzu Motors, Ltd. . . . . . . . . . . . . 200 2,203ITOCHU Corp. (a) . . . . . . . . . . . . 500 10,322Japan Airlines Co., Ltd. . . . . . . . . . 500 14,860Japan Exchange Group, Inc. . . . . . . 500 7,860Japan Post Bank Co., Ltd. (a) . . . . . 2,000 19,375Japan Post Holdings Co., Ltd. . . . . . 5,400 49,715Japan Prime Realty Investment Corp.
REIT . . . . . . . . . . . . . . . . . . . 5 23,734Japan Real Estate Investment Corp.
REIT (a). . . . . . . . . . . . . . . . . 5 33,542Japan Retail Fund Investment Corp.
REIT . . . . . . . . . . . . . . . . . . . 11 23,267Japan Tobacco, Inc. . . . . . . . . . . . 900 19,703JFE Holdings, Inc. . . . . . . . . . . . . 200 2,406JXTG Holdings, Inc. (a) . . . . . . . . 2,300 10,479Kajima Corp. . . . . . . . . . . . . . . . 300 3,933Kansai Electric Power Co., Inc. (a) . . 500 5,591Kao Corp. . . . . . . . . . . . . . . . . . 300 22,162Kawasaki Heavy Industries, Ltd. . . . 100 2,213KDDI Corp. . . . . . . . . . . . . . . . . 2,100 54,892Keikyu Corp. . . . . . . . . . . . . . . . 300 5,815Kintetsu Group Holdings Co., Ltd. . . 800 41,675Kirin Holdings Co., Ltd. . . . . . . . . 200 4,234Kobe Steel, Ltd. . . . . . . . . . . . . . . 500 2,665Koito Manufacturing Co., Ltd. . . . . 200 9,771Komatsu, Ltd. (a) . . . . . . . . . . . . . 200 4,580Konica Minolta, Inc. . . . . . . . . . . . 500 3,479Kuraray Co., Ltd. . . . . . . . . . . . . . 200 2,456Kyocera Corp. . . . . . . . . . . . . . . . 200 12,408Kyushu Electric Power Co., Inc. (a) . 500 4,719
SPDR MSCI WORLD STRATEGICFACTORS ETFSCHEDULE OF INVESTMENTSSeptember 30, 2019
4

Security Description Shares Value
Kyushu Railway Co. . . . . . . . . . . . 557 $ 17,755Lawson, Inc. . . . . . . . . . . . . . . . . 200 10,234M3, Inc. (a) . . . . . . . . . . . . . . . . 300 7,223Marubeni Corp. . . . . . . . . . . . . . . 1,100 7,305Mazda Motor Corp. . . . . . . . . . . . 500 4,439McDonald’s Holdings Co. Japan,
Ltd. . . . . . . . . . . . . . . . . . . . . 200 9,678Mebuki Financial Group, Inc. . . . . . 900 2,215MEIJI Holdings Co., Ltd. (a) . . . . . 200 14,582MISUMI Group, Inc. . . . . . . . . . . 200 4,706Mitsubishi Chemical Holdings
Corp.. . . . . . . . . . . . . . . . . . . 600 4,275Mitsubishi Corp. . . . . . . . . . . . . . 300 7,359Mitsubishi Electric Corp. . . . . . . . . 600 7,953Mitsubishi Estate Co., Ltd. . . . . . . . 200 3,857Mitsubishi Heavy Industries, Ltd.. . . 200 7,832Mitsubishi Motors Corp. (a) . . . . . . 500 2,170Mitsubishi Tanabe Pharma Corp. . . . 900 9,868Mitsubishi UFJ Financial Group,
Inc. . . . . . . . . . . . . . . . . . . . . 10,500 53,280Mitsubishi UFJ Lease & Finance
Co., Ltd. (a) . . . . . . . . . . . . . . 500 2,887Mitsui & Co., Ltd. . . . . . . . . . . . . 600 9,815Mitsui Chemicals, Inc.. . . . . . . . . . 300 6,706Mitsui Fudosan Co., Ltd. . . . . . . . . 200 4,958Mitsui OSK Lines, Ltd. . . . . . . . . . 100 2,526Mizuho Financial Group, Inc. (a) . . . 33,800 51,791MS&AD Insurance Group Holdings,
Inc. . . . . . . . . . . . . . . . . . . . . 200 6,477Murata Manufacturing Co., Ltd. . . . 200 9,595Nabtesco Corp. (a) . . . . . . . . . . . . 200 6,190Nagoya Railroad Co., Ltd. . . . . . . . 600 17,932NEC Corp. . . . . . . . . . . . . . . . . . 1,200 50,632NH Foods, Ltd. . . . . . . . . . . . . . . 200 8,041Nippon Building Fund, Inc. REIT . . 5 38,399Nippon Express Co., Ltd. . . . . . . . . 100 5,098Nippon Prologis REIT, Inc.. . . . . . . 6 16,439Nippon Steel Corp.. . . . . . . . . . . . 500 6,965Nippon Telegraph & Telephone
Corp.. . . . . . . . . . . . . . . . . . . 1,500 71,561Nippon Yusen KK . . . . . . . . . . . . 200 3,340Nissan Chemical Corp. . . . . . . . . . 200 8,318Nissan Motor Co., Ltd. (a) . . . . . . . 4,500 28,068Nissin Foods Holdings Co., Ltd. . . . 200 14,434Nitori Holdings Co., Ltd. (a) . . . . . . 200 29,257Nitto Denko Corp. . . . . . . . . . . . . 200 9,630Nomura Holdings, Inc. (a) . . . . . . . 1,200 5,084Nomura Real Estate Master Fund,
Inc. REIT . . . . . . . . . . . . . . . . 15 27,092NSK, Ltd. . . . . . . . . . . . . . . . . . 300 2,526NTT Data Corp. (a) . . . . . . . . . . . 1,200 15,478NTT DOCOMO, Inc. (a) . . . . . . . . 3,868 98,530Obayashi Corp. . . . . . . . . . . . . . . 500 4,978Obic Co., Ltd. . . . . . . . . . . . . . . . 100 11,399Oji Holdings Corp. . . . . . . . . . . . . 600 2,798Olympus Corp. . . . . . . . . . . . . . . 500 6,736Omron Corp. (a) . . . . . . . . . . . . . 200 10,937
Security Description Shares Value
Ono Pharmaceutical Co., Ltd. . . . . . 500 $ 9,054Oracle Corp. Japan . . . . . . . . . . . . 100 8,670Oriental Land Co., Ltd. (a) . . . . . . . 300 45,635ORIX Corp. . . . . . . . . . . . . . . . . 600 8,944Otsuka Corp.. . . . . . . . . . . . . . . . 100 3,983Otsuka Holdings Co., Ltd. . . . . . . . 500 18,691Pan Pacific International Holdings
Corp.. . . . . . . . . . . . . . . . . . . 400 6,681Panasonic Corp.. . . . . . . . . . . . . . 900 7,292Park24 Co., Ltd. (a) . . . . . . . . . . . 500 11,603Pigeon Corp. (a) . . . . . . . . . . . . . 200 8,244Rakuten, Inc.. . . . . . . . . . . . . . . . 500 4,927Recruit Holdings Co., Ltd. . . . . . . . 798 24,263Resona Holdings, Inc. (a) . . . . . . . . 1,200 5,141Ricoh Co., Ltd. . . . . . . . . . . . . . . 500 4,501SBI Holdings, Inc. (a) . . . . . . . . . . 200 4,277Secom Co., Ltd.. . . . . . . . . . . . . . 300 27,364Seiko Epson Corp. (a) . . . . . . . . . . 200 2,813Sekisui Chemical Co., Ltd. . . . . . . . 200 3,096Seven & i Holdings Co., Ltd. . . . . . 200 7,647Shimamura Co., Ltd.. . . . . . . . . . . 200 15,841Shimano, Inc. . . . . . . . . . . . . . . . 100 15,064Shimizu Corp. . . . . . . . . . . . . . . . 500 4,525Shin-Etsu Chemical Co., Ltd. . . . . . 200 21,393Shinsei Bank, Ltd. . . . . . . . . . . . . 300 4,369Shionogi & Co., Ltd.. . . . . . . . . . . 300 16,652Shizuoka Bank, Ltd. . . . . . . . . . . . 500 3,724SoftBank Group Corp. (a) . . . . . . . 600 23,539Sony Corp. . . . . . . . . . . . . . . . . . 300 17,618Subaru Corp. . . . . . . . . . . . . . . . 300 8,439Sumitomo Chemical Co., Ltd. . . . . . 600 2,693Sumitomo Corp. . . . . . . . . . . . . . 300 4,686Sumitomo Electric Industries, Ltd.
(a). . . . . . . . . . . . . . . . . . . . . 500 6,343Sumitomo Metal Mining Co., Ltd. . . 300 9,291Sumitomo Mitsui Financial Group,
Inc. (a) . . . . . . . . . . . . . . . . . . 800 27,351Sumitomo Mitsui Trust Holdings,
Inc. . . . . . . . . . . . . . . . . . . . . 200 7,210Sundrug Co., Ltd.. . . . . . . . . . . . . 200 6,292Suntory Beverage & Food, Ltd. . . . . 500 21,374Suzuken Co., Ltd. . . . . . . . . . . . . 100 5,367Suzuki Motor Corp. (a) . . . . . . . . . 200 8,489Taiheiyo Cement Corp. . . . . . . . . . 100 2,675Taisei Corp. . . . . . . . . . . . . . . . . 200 7,745Taisho Pharmaceutical Holdings Co.,
Ltd. (a) . . . . . . . . . . . . . . . . . 200 14,527Takeda Pharmaceutical Co., Ltd. . . . 368 12,565TDK Corp. . . . . . . . . . . . . . . . . . 100 8,947Tobu Railway Co., Ltd. . . . . . . . . . 300 9,715Toho Co., Ltd. . . . . . . . . . . . . . . . 100 4,381Tohoku Electric Power Co., Inc. . . . . 500 4,876Tokio Marine Holdings, Inc. (a) . . . . 200 10,694Tokyo Electric Power Co. Holdings,
Inc. (a)(b) . . . . . . . . . . . . . . . . 2,100 10,279Tokyo Electron, Ltd. . . . . . . . . . . . 100 19,028Tokyo Gas Co., Ltd. . . . . . . . . . . . 300 7,563
SPDR MSCI WORLD STRATEGICFACTORS ETFSCHEDULE OF INVESTMENTSSeptember 30, 2019
5

Security Description Shares Value
Tokyu Corp. . . . . . . . . . . . . . . . . 200 $ 3,753Toppan Printing Co., Ltd. . . . . . . . . 500 8,846Toray Industries, Inc. . . . . . . . . . . 300 2,227Toyo Suisan Kaisha, Ltd. . . . . . . . . 500 20,032Toyota Industries Corp. (a) . . . . . . . 200 11,474Toyota Motor Corp. (a) . . . . . . . . . 1,100 73,445Trend Micro, Inc. . . . . . . . . . . . . . 200 9,512Tsuruha Holdings, Inc. . . . . . . . . . 100 10,891Unicharm Corp.. . . . . . . . . . . . . . 200 6,329United Urban Investment Corp.
REIT . . . . . . . . . . . . . . . . . . . 11 21,069USS Co., Ltd. (a) . . . . . . . . . . . . . 500 9,702Yahoo! Japan Corp. . . . . . . . . . . . 2,200 6,188Yamada Denki Co., Ltd.. . . . . . . . . 2,400 11,614Yamato Holdings Co., Ltd. . . . . . . . 200 3,009Yamazaki Baking Co., Ltd. . . . . . . . 300 5,352ZOZO, Inc. (a) . . . . . . . . . . . . . . 200 4,612
2,408,240
LUXEMBOURG — 0.1%ArcelorMittal . . . . . . . . . . . . . . . 808 11,369Millicom International Cellular SA
SDR . . . . . . . . . . . . . . . . . . . 130 6,315RTL Group SA . . . . . . . . . . . . . . 125 6,012SES SA . . . . . . . . . . . . . . . . . . . 65 1,185
24,881
MEXICO — 0.0% (f)Fresnillo PLC . . . . . . . . . . . . . . . 15 126
NETHERLANDS — 1.1%ABN AMRO Bank NV (d) . . . . . . . 176 3,104Aegon NV . . . . . . . . . . . . . . . . . 1,315 5,472Akzo Nobel NV. . . . . . . . . . . . . . 12 1,070ASML Holding NV . . . . . . . . . . . 298 73,829EXOR NV . . . . . . . . . . . . . . . . . 56 3,753Heineken Holding NV. . . . . . . . . . 33 3,286Heineken NV . . . . . . . . . . . . . . . 38 4,108ING Groep NV . . . . . . . . . . . . . . 1,973 20,658Koninklijke Ahold Delhaize NV . . . 1,059 26,502Koninklijke DSM NV . . . . . . . . . . 30 3,611Koninklijke KPN NV . . . . . . . . . . 1,257 3,921Koninklijke Philips NV . . . . . . . . . 142 6,579NN Group NV. . . . . . . . . . . . . . . 159 5,641NXP Semiconductors NV . . . . . . . 151 16,477Randstad NV . . . . . . . . . . . . . . . 130 6,390Royal Dutch Shell PLC Class A. . . . 1,249 36,693Royal Dutch Shell PLC Class B. . . . 1,065 31,445Wolters Kluwer NV . . . . . . . . . . . 214 15,627
268,166
NEW ZEALAND — 0.1%Auckland International Airport, Ltd. . 1,168 6,701Fisher & Paykel Healthcare Corp.,
Ltd. . . . . . . . . . . . . . . . . . . . . 510 5,533Ryman Healthcare, Ltd. . . . . . . . . . 1,303 10,859Spark New Zealand, Ltd. . . . . . . . . 3,629 10,035
33,128
Security Description Shares Value
NORWAY — 0.1%DNB ASA . . . . . . . . . . . . . . . . . 753 $ 13,281Equinor ASA . . . . . . . . . . . . . . . 191 3,638Norsk Hydro ASA . . . . . . . . . . . . 899 3,166Telenor ASA . . . . . . . . . . . . . . . . 510 10,246Yara International ASA . . . . . . . . . 15 647
30,978
PORTUGAL — 0.1%EDP - Energias de Portugal SA . . . . 848 3,293Galp Energia SGPS SA . . . . . . . . . 226 3,406Jeronimo Martins SGPS SA . . . . . . 270 4,557
11,256
SINGAPORE — 0.7%CapitaLand Commercial Trust REIT. 10,200 15,268CapitaLand Mall Trust REIT. . . . . . 8,600 16,356DBS Group Holdings, Ltd. . . . . . . . 500 9,039Keppel Corp., Ltd. . . . . . . . . . . . . 800 3,430Oversea-Chinese Banking Corp.,
Ltd. . . . . . . . . . . . . . . . . . . . . 1,588 12,471SATS, Ltd. . . . . . . . . . . . . . . . . . 2,708 9,478Singapore Airlines, Ltd. . . . . . . . . . 2,300 15,201Singapore Exchange, Ltd. . . . . . . . 1,100 6,737Singapore Press Holdings, Ltd. (a) . . 5,600 8,423Singapore Technologies Engineering,
Ltd. . . . . . . . . . . . . . . . . . . . . 1,500 4,165Singapore Telecommunications, Ltd.. 20,242 45,376United Overseas Bank, Ltd. . . . . . . 300 5,567Venture Corp., Ltd.. . . . . . . . . . . . 200 2,214Wilmar International, Ltd. . . . . . . . 1,700 4,585
158,310
SOUTH AFRICA — 0.0% (f)Anglo American PLC . . . . . . . . . . 279 6,433Investec PLC. . . . . . . . . . . . . . . . 206 1,063
7,496
SPAIN — 0.9%ACS Actividades de Construccion y
Servicios SA . . . . . . . . . . . . . . 106 4,236Aena SME SA (d) . . . . . . . . . . . . 18 3,297Amadeus IT Group SA . . . . . . . . . 413 29,591Banco Bilbao Vizcaya Argentaria
SA . . . . . . . . . . . . . . . . . . . . 4,569 23,812Banco de Sabadell SA . . . . . . . . . . 3,738 3,628Banco Santander SA . . . . . . . . . . . 9,515 38,760Bankia SA . . . . . . . . . . . . . . . . . 992 1,874Bankinter SA . . . . . . . . . . . . . . . 958 6,051CaixaBank SA. . . . . . . . . . . . . . . 3,325 8,736Enagas SA . . . . . . . . . . . . . . . . . 143 3,314Ferrovial SA . . . . . . . . . . . . . . . . 197 5,693Iberdrola SA . . . . . . . . . . . . . . . . 1,052 10,937Industria de Diseno Textil SA . . . . . 953 29,506Mapfre SA . . . . . . . . . . . . . . . . . 703 1,894Naturgy Energy Group SA . . . . . . . 158 4,193Red Electrica Corp. SA . . . . . . . . . 196 3,982Repsol SA . . . . . . . . . . . . . . . . . 953 14,899
SPDR MSCI WORLD STRATEGICFACTORS ETFSCHEDULE OF INVESTMENTSSeptember 30, 2019
6

Security Description Shares Value
Telefonica SA . . . . . . . . . . . . . . . 1,733 $ 13,227
207,630
SWEDEN — 0.6%Assa Abloy AB Class B . . . . . . . . . 120 2,674Atlas Copco AB Class A . . . . . . . . 562 17,331Atlas Copco AB Class B . . . . . . . . 521 14,138Autoliv, Inc. (a) . . . . . . . . . . . . . . 75 5,916Boliden AB . . . . . . . . . . . . . . . . 276 6,351Electrolux AB Class B. . . . . . . . . . 307 7,288Epiroc AB Class A . . . . . . . . . . . . 562 6,099Epiroc AB Class B . . . . . . . . . . . . 330 3,413Essity AB Class B . . . . . . . . . . . . 136 3,974Hennes & Mauritz AB Class B (a) . . 858 16,654Industrivarden AB Class C . . . . . . . 176 3,857Investor AB Class B . . . . . . . . . . . 229 11,205Sandvik AB . . . . . . . . . . . . . . . . 48 749Skandinaviska Enskilda Banken AB
Class A . . . . . . . . . . . . . . . . . 432 3,975Skanska AB Class B . . . . . . . . . . . 114 2,312SKF AB Class B . . . . . . . . . . . . . 191 3,161Svenska Handelsbanken AB Class A. 393 3,684Swedbank AB Class A. . . . . . . . . . 734 10,578Telefonaktiebolaget LM Ericsson
Class B . . . . . . . . . . . . . . . . . 1,484 11,872Telia Co. AB . . . . . . . . . . . . . . . . 649 2,909Volvo AB Class B . . . . . . . . . . . . 404 5,681
143,821
SWITZERLAND — 4.6%ABB, Ltd. . . . . . . . . . . . . . . . . . 248 4,877Adecco Group AG . . . . . . . . . . . . 191 10,577Baloise Holding AG . . . . . . . . . . . 8 1,435Chocoladefabriken Lindt &
Spruengli AG . . . . . . . . . . . . . 5 36,955Cie Financiere Richemont SA . . . . . 65 4,773Credit Suisse Group AG (b) . . . . . . 601 7,374EMS-Chemie Holding AG . . . . . . . 41 25,554Geberit AG . . . . . . . . . . . . . . . . . 27 12,905Givaudan SA . . . . . . . . . . . . . . . 12 33,503Glencore PLC . . . . . . . . . . . . . . . 5,355 16,151Julius Baer Group, Ltd. . . . . . . . . . 39 1,730Kuehne + Nagel International AG . . 256 37,740LafargeHolcim, Ltd. . . . . . . . . . . . 79 3,892Lonza Group AG . . . . . . . . . . . . . 14 4,737Nestle SA. . . . . . . . . . . . . . . . . . 1,223 132,805Novartis AG . . . . . . . . . . . . . . . . 923 80,105Partners Group Holding AG . . . . . . 72 55,295Roche Holding AG . . . . . . . . . . . . 917 267,104Schindler Holding AG (e). . . . . . . . 30 6,715Schindler Holding AG (e). . . . . . . . 90 20,091SGS SA . . . . . . . . . . . . . . . . . . . 5 12,405Sika AG. . . . . . . . . . . . . . . . . . . 103 15,081Sonova Holding AG . . . . . . . . . . . 77 17,915STMicroelectronics NV. . . . . . . . . 78 1,508Straumann Holding AG . . . . . . . . . 8 6,545Swatch Group AG . . . . . . . . . . . . 6 1,594
Security Description Shares Value
Swiss Life Holding AG . . . . . . . . . 15 $ 7,177Swiss Prime Site AG. . . . . . . . . . . 227 22,230Swiss Re AG. . . . . . . . . . . . . . . . 1,122 117,134Swisscom AG . . . . . . . . . . . . . . . 101 49,864TE Connectivity, Ltd. . . . . . . . . . . 106 9,877Temenos AG . . . . . . . . . . . . . . . . 50 8,374UBS Group AG (b). . . . . . . . . . . . 1,577 17,918Zurich Insurance Group AG . . . . . . 147 56,315
1,108,255
UNITED KINGDOM — 5.0%3i Group PLC . . . . . . . . . . . . . . . 1,000 14,375Admiral Group PLC . . . . . . . . . . . 535 13,964Amcor PLC . . . . . . . . . . . . . . . . 188 1,807Ashtead Group PLC . . . . . . . . . . . 396 11,048Associated British Foods PLC . . . . . 80 2,270AstraZeneca PLC. . . . . . . . . . . . . 1,159 103,704Auto Trader Group PLC (d) . . . . . . 65 409Aviva PLC . . . . . . . . . . . . . . . . . 1,259 6,195BAE Systems PLC . . . . . . . . . . . . 2,986 20,974Barclays PLC . . . . . . . . . . . . . . . 10,877 20,159Barratt Developments PLC. . . . . . . 196 1,565Berkeley Group Holdings PLC . . . . 157 8,085BP PLC . . . . . . . . . . . . . . . . . . . 5,259 33,427British American Tobacco PLC
ADR . . . . . . . . . . . . . . . . . . . 480 17,712British American Tobacco PLC . . . . 148 5,485British Land Co. PLC REIT . . . . . . 313 2,256BT Group PLC . . . . . . . . . . . . . . 5,578 12,275Bunzl PLC . . . . . . . . . . . . . . . . . 324 8,484Burberry Group PLC . . . . . . . . . . 384 10,287Capri Holdings, Ltd. (b). . . . . . . . . 179 5,936Centrica PLC . . . . . . . . . . . . . . . 3,424 3,111CNH Industrial NV . . . . . . . . . . . 349 3,554Coca-Cola European Partners PLC . . 69 3,826Compass Group PLC . . . . . . . . . . 2,647 68,272Croda International PLC . . . . . . . . 138 8,265DCC PLC . . . . . . . . . . . . . . . . . 41 3,585Diageo PLC . . . . . . . . . . . . . . . . 1,995 81,940Direct Line Insurance Group PLC . . 5,691 21,053easyJet PLC . . . . . . . . . . . . . . . . 57 808Experian PLC . . . . . . . . . . . . . . . 675 21,619Fiat Chrysler Automobiles NV . . . . 854 11,053G4S PLC . . . . . . . . . . . . . . . . . . 520 1,212GlaxoSmithKline PLC . . . . . . . . . 2,321 49,899Hargreaves Lansdown PLC. . . . . . . 274 7,020HSBC Holdings PLC . . . . . . . . . . 6,819 52,485Imperial Brands PLC . . . . . . . . . . 991 22,326Informa PLC. . . . . . . . . . . . . . . . 301 3,160Intertek Group PLC . . . . . . . . . . . 157 10,598ITV PLC . . . . . . . . . . . . . . . . . . 3,997 6,201J Sainsbury PLC . . . . . . . . . . . . . 640 1,734Johnson Matthey PLC . . . . . . . . . . 191 7,195Kingfisher PLC . . . . . . . . . . . . . . 2,025 5,161Land Securities Group PLC REIT . . 221 2,332Legal & General Group PLC. . . . . . 4,888 14,962Linde PLC . . . . . . . . . . . . . . . . . 36 6,974
SPDR MSCI WORLD STRATEGICFACTORS ETFSCHEDULE OF INVESTMENTSSeptember 30, 2019
7

Security Description Shares Value
Lloyds Banking Group PLC . . . . . . 21,195 $ 14,135London Stock Exchange Group PLC. 47 4,233Marks & Spencer Group PLC . . . . . 4,440 10,092Melrose Industries PLC . . . . . . . . . 8 20Merlin Entertainments PLC (d) . . . . 197 1,098Mondi PLC . . . . . . . . . . . . . . . . 309 5,933National Grid PLC . . . . . . . . . . . . 859 9,335Next PLC. . . . . . . . . . . . . . . . . . 126 9,605Pearson PLC . . . . . . . . . . . . . . . . 197 1,792Pentair PLC . . . . . . . . . . . . . . . . 51 1,928Persimmon PLC. . . . . . . . . . . . . . 301 8,049Prudential PLC . . . . . . . . . . . . . . 459 8,343Reckitt Benckiser Group PLC . . . . . 99 7,740RELX PLC (e) . . . . . . . . . . . . . . 873 20,790RELX PLC (e) . . . . . . . . . . . . . . 789 18,777Rio Tinto PLC . . . . . . . . . . . . . . . 971 50,363Rio Tinto, Ltd.. . . . . . . . . . . . . . . 298 18,625Rolls-Royce Holdings PLC. . . . . . . 753 7,353Royal Bank of Scotland Group PLC . 2,132 5,454RSA Insurance Group PLC. . . . . . . 87 573Sage Group PLC . . . . . . . . . . . . . 1,060 9,031Schroders PLC . . . . . . . . . . . . . . 111 4,206Smith & Nephew PLC. . . . . . . . . . 779 18,806Smiths Group PLC . . . . . . . . . . . . 294 5,688SSE PLC . . . . . . . . . . . . . . . . . . 435 6,677Standard Chartered PLC . . . . . . . . 1,530 12,900Standard Life Aberdeen PLC . . . . . 1,578 5,558Taylor Wimpey PLC . . . . . . . . . . . 3,233 6,434TechnipFMC PLC . . . . . . . . . . . . 151 3,645Tesco PLC . . . . . . . . . . . . . . . . . 2,915 8,657Unilever NV . . . . . . . . . . . . . . . . 1,357 81,589Unilever PLC . . . . . . . . . . . . . . . 992 59,777United Utilities Group PLC . . . . . . 358 3,643Vodafone Group PLC . . . . . . . . . . 15,446 30,835Weir Group PLC . . . . . . . . . . . . . 5 88Whitbread PLC . . . . . . . . . . . . . . 152 8,043Wm Morrison Supermarkets PLC . . 1,283 3,167WPP PLC . . . . . . . . . . . . . . . . . 629 7,891
1,199,635
UNITED STATES — 60.3%3M Co. . . . . . . . . . . . . . . . . . . . 509 83,680Abbott Laboratories . . . . . . . . . . . 457 38,237AbbVie, Inc. . . . . . . . . . . . . . . . . 120 9,086Activision Blizzard, Inc. . . . . . . . . 35 1,852Acuity Brands, Inc.. . . . . . . . . . . . 75 10,109Adobe, Inc. (b) . . . . . . . . . . . . . . 363 100,279AES Corp. . . . . . . . . . . . . . . . . . 276 4,510Aflac, Inc. . . . . . . . . . . . . . . . . . 506 26,474Agilent Technologies, Inc. . . . . . . . 27 2,069AGNC Investment Corp. REIT . . . . 2,420 38,938Air Products & Chemicals, Inc. . . . . 38 8,431Align Technology, Inc. (b) . . . . . . . 95 17,187Alleghany Corp. (b) . . . . . . . . . . . 41 32,708Allergan PLC . . . . . . . . . . . . . . . 105 17,670Alliant Energy Corp.. . . . . . . . . . . 75 4,045
Security Description Shares Value
Allstate Corp. . . . . . . . . . . . . . . . 628 $ 68,251Ally Financial, Inc. . . . . . . . . . . . . 217 7,196Alphabet, Inc. Class A (b) . . . . . . . 190 232,017Alphabet, Inc. Class C (b) . . . . . . . 205 249,895Altria Group, Inc.. . . . . . . . . . . . . 2,112 86,381Amazon.com, Inc. (b) . . . . . . . . . . 15 26,039Ameren Corp. . . . . . . . . . . . . . . . 289 23,134American Airlines Group, Inc.. . . . . 75 2,023American Electric Power Co., Inc. . . 434 40,661American Express Co.. . . . . . . . . . 151 17,860American Financial Group, Inc. . . . . 75 8,089American International Group, Inc. . 280 15,596American Tower Corp. REIT. . . . . . 69 15,258American Water Works Co., Inc. . . . 110 13,665Ameriprise Financial, Inc. . . . . . . . 111 16,328AmerisourceBergen Corp. . . . . . . . 140 11,526Amgen, Inc. . . . . . . . . . . . . . . . . 495 95,787Amphenol Corp. Class A . . . . . . . . 494 47,671Annaly Capital Management, Inc.
REIT . . . . . . . . . . . . . . . . . . . 4,673 41,122Anthem, Inc. . . . . . . . . . . . . . . . . 111 26,651AO Smith Corp.. . . . . . . . . . . . . . 151 7,204Aon PLC . . . . . . . . . . . . . . . . . . 370 71,621Apache Corp. . . . . . . . . . . . . . . . 75 1,920Apple, Inc. . . . . . . . . . . . . . . . . . 2,733 612,110Applied Materials, Inc. . . . . . . . . . 979 48,852Aptiv PLC . . . . . . . . . . . . . . . . . 248 21,680Aramark . . . . . . . . . . . . . . . . . . 226 9,849Arch Capital Group, Ltd. (b) . . . . . . 1,559 65,447Archer-Daniels-Midland Co.. . . . . . 190 7,803Arconic, Inc. . . . . . . . . . . . . . . . . 105 2,730Arista Networks, Inc. (b) . . . . . . . . 75 17,919Arrow Electronics, Inc. (b) . . . . . . . 71 5,295Arthur J Gallagher & Co. . . . . . . . . 151 13,525AT&T, Inc. . . . . . . . . . . . . . . . . . 3,753 142,014Athene Holding, Ltd. Class A (b) . . . 218 9,169Automatic Data Processing, Inc. . . . 581 93,785AutoZone, Inc. (b) . . . . . . . . . . . . 41 44,469AvalonBay Communities, Inc. REIT . 285 61,369Avery Dennison Corp. . . . . . . . . . . 75 8,518Baker Hughes a GE Co. . . . . . . . . . 101 2,343Ball Corp. . . . . . . . . . . . . . . . . . 30 2,184Bank of America Corp. . . . . . . . . . 3,015 87,948Bank of New York Mellon Corp. . . . 208 9,404Baxter International, Inc. . . . . . . . . 672 58,780BB&T Corp. . . . . . . . . . . . . . . . . 217 11,581Becton Dickinson and Co. . . . . . . . 55 13,913Berkshire Hathaway, Inc. Class B
(b) . . . . . . . . . . . . . . . . . . . . 414 86,120Best Buy Co., Inc. . . . . . . . . . . . . 291 20,076Biogen, Inc. (b) . . . . . . . . . . . . . . 191 44,469BlackRock, Inc. . . . . . . . . . . . . . . 21 9,358Boeing Co. . . . . . . . . . . . . . . . . . 77 29,296Booking Holdings, Inc. (b) . . . . . . . 42 82,430BorgWarner, Inc. . . . . . . . . . . . . . 212 7,776Boston Scientific Corp. (b). . . . . . . 238 9,684
SPDR MSCI WORLD STRATEGICFACTORS ETFSCHEDULE OF INVESTMENTSSeptember 30, 2019
8
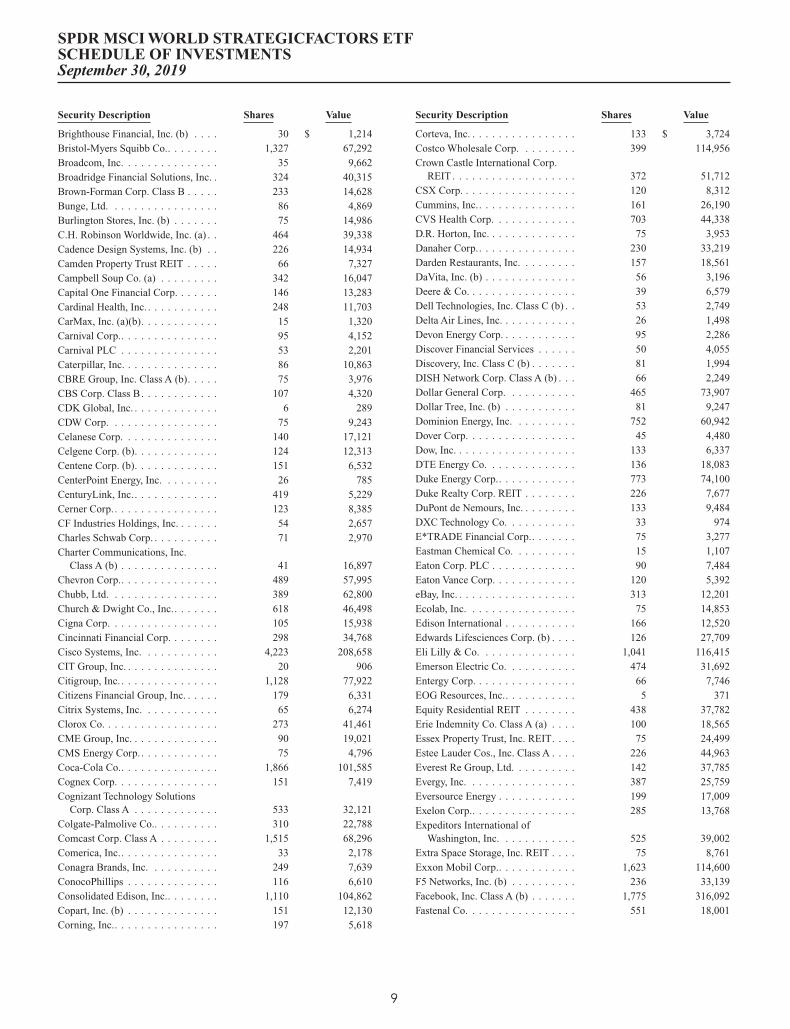
Security Description Shares Value
Brighthouse Financial, Inc. (b) . . . . 30 $ 1,214Bristol-Myers Squibb Co.. . . . . . . . 1,327 67,292Broadcom, Inc. . . . . . . . . . . . . . . 35 9,662Broadridge Financial Solutions, Inc. . 324 40,315Brown-Forman Corp. Class B . . . . . 233 14,628Bunge, Ltd. . . . . . . . . . . . . . . . . 86 4,869Burlington Stores, Inc. (b) . . . . . . . 75 14,986C.H. Robinson Worldwide, Inc. (a) . . 464 39,338Cadence Design Systems, Inc. (b) . . 226 14,934Camden Property Trust REIT . . . . . 66 7,327Campbell Soup Co. (a) . . . . . . . . . 342 16,047Capital One Financial Corp. . . . . . . 146 13,283Cardinal Health, Inc. . . . . . . . . . . . 248 11,703CarMax, Inc. (a)(b). . . . . . . . . . . . 15 1,320Carnival Corp.. . . . . . . . . . . . . . . 95 4,152Carnival PLC . . . . . . . . . . . . . . . 53 2,201Caterpillar, Inc. . . . . . . . . . . . . . . 86 10,863CBRE Group, Inc. Class A (b). . . . . 75 3,976CBS Corp. Class B. . . . . . . . . . . . 107 4,320CDK Global, Inc. . . . . . . . . . . . . . 6 289CDW Corp. . . . . . . . . . . . . . . . . 75 9,243Celanese Corp. . . . . . . . . . . . . . . 140 17,121Celgene Corp. (b). . . . . . . . . . . . . 124 12,313Centene Corp. (b). . . . . . . . . . . . . 151 6,532CenterPoint Energy, Inc. . . . . . . . . 26 785CenturyLink, Inc.. . . . . . . . . . . . . 419 5,229Cerner Corp. . . . . . . . . . . . . . . . . 123 8,385CF Industries Holdings, Inc. . . . . . . 54 2,657Charles Schwab Corp. . . . . . . . . . . 71 2,970Charter Communications, Inc.
Class A (b) . . . . . . . . . . . . . . . 41 16,897Chevron Corp.. . . . . . . . . . . . . . . 489 57,995Chubb, Ltd. . . . . . . . . . . . . . . . . 389 62,800Church & Dwight Co., Inc.. . . . . . . 618 46,498Cigna Corp. . . . . . . . . . . . . . . . . 105 15,938Cincinnati Financial Corp. . . . . . . . 298 34,768Cisco Systems, Inc. . . . . . . . . . . . 4,223 208,658CIT Group, Inc. . . . . . . . . . . . . . . 20 906Citigroup, Inc. . . . . . . . . . . . . . . . 1,128 77,922Citizens Financial Group, Inc. . . . . . 179 6,331Citrix Systems, Inc. . . . . . . . . . . . 65 6,274Clorox Co. . . . . . . . . . . . . . . . . . 273 41,461CME Group, Inc. . . . . . . . . . . . . . 90 19,021CMS Energy Corp. . . . . . . . . . . . . 75 4,796Coca-Cola Co.. . . . . . . . . . . . . . . 1,866 101,585Cognex Corp. . . . . . . . . . . . . . . . 151 7,419Cognizant Technology Solutions
Corp. Class A . . . . . . . . . . . . . 533 32,121Colgate-Palmolive Co.. . . . . . . . . . 310 22,788Comcast Corp. Class A . . . . . . . . . 1,515 68,296Comerica, Inc.. . . . . . . . . . . . . . . 33 2,178Conagra Brands, Inc. . . . . . . . . . . 249 7,639ConocoPhillips . . . . . . . . . . . . . . 116 6,610Consolidated Edison, Inc.. . . . . . . . 1,110 104,862Copart, Inc. (b) . . . . . . . . . . . . . . 151 12,130Corning, Inc.. . . . . . . . . . . . . . . . 197 5,618
Security Description Shares Value
Corteva, Inc. . . . . . . . . . . . . . . . . 133 $ 3,724Costco Wholesale Corp. . . . . . . . . 399 114,956Crown Castle International Corp.
REIT . . . . . . . . . . . . . . . . . . . 372 51,712CSX Corp. . . . . . . . . . . . . . . . . . 120 8,312Cummins, Inc.. . . . . . . . . . . . . . . 161 26,190CVS Health Corp. . . . . . . . . . . . . 703 44,338D.R. Horton, Inc. . . . . . . . . . . . . . 75 3,953Danaher Corp.. . . . . . . . . . . . . . . 230 33,219Darden Restaurants, Inc. . . . . . . . . 157 18,561DaVita, Inc. (b) . . . . . . . . . . . . . . 56 3,196Deere & Co. . . . . . . . . . . . . . . . . 39 6,579Dell Technologies, Inc. Class C (b) . . 53 2,749Delta Air Lines, Inc. . . . . . . . . . . . 26 1,498Devon Energy Corp. . . . . . . . . . . . 95 2,286Discover Financial Services . . . . . . 50 4,055Discovery, Inc. Class C (b) . . . . . . . 81 1,994DISH Network Corp. Class A (b) . . . 66 2,249Dollar General Corp. . . . . . . . . . . 465 73,907Dollar Tree, Inc. (b) . . . . . . . . . . . 81 9,247Dominion Energy, Inc. . . . . . . . . . 752 60,942Dover Corp. . . . . . . . . . . . . . . . . 45 4,480Dow, Inc. . . . . . . . . . . . . . . . . . . 133 6,337DTE Energy Co. . . . . . . . . . . . . . 136 18,083Duke Energy Corp.. . . . . . . . . . . . 773 74,100Duke Realty Corp. REIT . . . . . . . . 226 7,677DuPont de Nemours, Inc. . . . . . . . . 133 9,484DXC Technology Co. . . . . . . . . . . 33 974E*TRADE Financial Corp.. . . . . . . 75 3,277Eastman Chemical Co. . . . . . . . . . 15 1,107Eaton Corp. PLC . . . . . . . . . . . . . 90 7,484Eaton Vance Corp. . . . . . . . . . . . . 120 5,392eBay, Inc. . . . . . . . . . . . . . . . . . . 313 12,201Ecolab, Inc. . . . . . . . . . . . . . . . . 75 14,853Edison International . . . . . . . . . . . 166 12,520Edwards Lifesciences Corp. (b) . . . . 126 27,709Eli Lilly & Co. . . . . . . . . . . . . . . 1,041 116,415Emerson Electric Co. . . . . . . . . . . 474 31,692Entergy Corp. . . . . . . . . . . . . . . . 66 7,746EOG Resources, Inc.. . . . . . . . . . . 5 371Equity Residential REIT . . . . . . . . 438 37,782Erie Indemnity Co. Class A (a) . . . . 100 18,565Essex Property Trust, Inc. REIT. . . . 75 24,499Estee Lauder Cos., Inc. Class A . . . . 226 44,963Everest Re Group, Ltd. . . . . . . . . . 142 37,785Evergy, Inc. . . . . . . . . . . . . . . . . 387 25,759Eversource Energy . . . . . . . . . . . . 199 17,009Exelon Corp.. . . . . . . . . . . . . . . . 285 13,768Expeditors International of
Washington, Inc. . . . . . . . . . . . 525 39,002Extra Space Storage, Inc. REIT . . . . 75 8,761Exxon Mobil Corp.. . . . . . . . . . . . 1,623 114,600F5 Networks, Inc. (b) . . . . . . . . . . 236 33,139Facebook, Inc. Class A (b) . . . . . . . 1,775 316,092Fastenal Co. . . . . . . . . . . . . . . . . 551 18,001
SPDR MSCI WORLD STRATEGICFACTORS ETFSCHEDULE OF INVESTMENTSSeptember 30, 2019
9

Security Description Shares Value
Federal Realty Investment TrustREIT . . . . . . . . . . . . . . . . . . . 21 $ 2,859
FedEx Corp. . . . . . . . . . . . . . . . . 65 9,462Ferguson PLC . . . . . . . . . . . . . . . 190 13,917Fidelity National Financial, Inc. . . . . 492 21,850Fidelity National Information
Services, Inc.. . . . . . . . . . . . . . 343 45,537Fifth Third Bancorp . . . . . . . . . . . 319 8,734First Republic Bank . . . . . . . . . . . 75 7,253FirstEnergy Corp.. . . . . . . . . . . . . 167 8,054Fiserv, Inc. (b) . . . . . . . . . . . . . . . 901 93,335FleetCor Technologies, Inc. (b) . . . . 11 3,155Flex, Ltd. (b). . . . . . . . . . . . . . . . 539 5,641Fluor Corp.. . . . . . . . . . . . . . . . . 86 1,645Ford Motor Co. . . . . . . . . . . . . . . 3,108 28,469Fortive Corp.. . . . . . . . . . . . . . . . 101 6,925Fox Corp. Class A . . . . . . . . . . . . 111 3,500Fox Corp. Class B . . . . . . . . . . . . 29 915Franklin Resources, Inc. (a) . . . . . . 232 6,696Freeport-McMoRan, Inc. . . . . . . . . 449 4,297Gap, Inc. (a) . . . . . . . . . . . . . . . . 294 5,104Garmin, Ltd. . . . . . . . . . . . . . . . . 75 6,352General Dynamics Corp. . . . . . . . . 239 43,672General Electric Co. . . . . . . . . . . . 2,629 23,503General Mills, Inc. . . . . . . . . . . . . 267 14,717General Motors Co. . . . . . . . . . . . 863 32,345Genuine Parts Co. . . . . . . . . . . . . 99 9,859Gilead Sciences, Inc.. . . . . . . . . . . 458 29,028Goldman Sachs Group, Inc. . . . . . . 114 23,624Halliburton Co. . . . . . . . . . . . . . . 108 2,036Harley-Davidson, Inc. (a) . . . . . . . . 75 2,698Hartford Financial Services Group,
Inc. . . . . . . . . . . . . . . . . . . . . 75 4,546Hasbro, Inc. . . . . . . . . . . . . . . . . 95 11,276HCA Healthcare, Inc. . . . . . . . . . . 80 9,634HCP, Inc. REIT . . . . . . . . . . . . . . 548 19,525Henry Schein, Inc. (b) . . . . . . . . . . 179 11,366Hershey Co. . . . . . . . . . . . . . . . . 346 53,627Hess Corp. . . . . . . . . . . . . . . . . . 45 2,722Hewlett Packard Enterprise Co. . . . . 634 9,618Hilton Worldwide Holdings, Inc. . . . 75 6,983HollyFrontier Corp. . . . . . . . . . . . 48 2,575Home Depot, Inc.. . . . . . . . . . . . . 268 62,181Honeywell International, Inc. . . . . . 610 103,212Hormel Foods Corp. . . . . . . . . . . . 754 32,972Host Hotels & Resorts, Inc. REIT . . 182 3,147HP, Inc. . . . . . . . . . . . . . . . . . . . 518 9,801Humana, Inc. . . . . . . . . . . . . . . . 93 23,777Huntington Bancshares, Inc. . . . . . . 301 4,295Huntington Ingalls Industries, Inc. . . 20 4,236IDEX Corp. . . . . . . . . . . . . . . . . 75 12,291Illinois Tool Works, Inc.. . . . . . . . . 288 45,069Illumina, Inc. (b) . . . . . . . . . . . . . 95 28,901Intel Corp. . . . . . . . . . . . . . . . . . 4,191 215,962Intercontinental Exchange, Inc. . . . . 111 10,242
Security Description Shares Value
International Business MachinesCorp.. . . . . . . . . . . . . . . . . . . 983 $ 142,948
International Flavors & Fragrances,Inc. (a) . . . . . . . . . . . . . . . . . . 71 8,711
International Paper Co. . . . . . . . . . 45 1,882Interpublic Group of Cos., Inc. . . . . 373 8,042Intuit, Inc. . . . . . . . . . . . . . . . . . 244 64,889Intuitive Surgical, Inc. (b). . . . . . . . 68 36,715Invesco, Ltd. . . . . . . . . . . . . . . . . 110 1,863IPG Photonics Corp. (b) . . . . . . . . 75 10,170J.M. Smucker Co.. . . . . . . . . . . . . 182 20,024Jack Henry & Associates, Inc. . . . . . 318 46,418JB Hunt Transport Services, Inc. . . . 29 3,209Jefferies Financial Group, Inc. . . . . . 151 2,778Johnson & Johnson. . . . . . . . . . . . 2,712 350,879Johnson Controls International PLC . 187 8,207JPMorgan Chase & Co. . . . . . . . . . 932 109,687Juniper Networks, Inc.. . . . . . . . . . 5 124Kellogg Co. . . . . . . . . . . . . . . . . 586 37,709KeyCorp . . . . . . . . . . . . . . . . . . 309 5,513Kimberly-Clark Corp. . . . . . . . . . . 211 29,973Kimco Realty Corp. REIT . . . . . . . 226 4,719Kinder Morgan, Inc. . . . . . . . . . . . 473 9,749KLA Corp. . . . . . . . . . . . . . . . . . 140 22,323Kohl’s Corp. . . . . . . . . . . . . . . . . 81 4,022Kraft Heinz Co. . . . . . . . . . . . . . . 264 7,375Kroger Co. . . . . . . . . . . . . . . . . . 419 10,802L Brands, Inc. . . . . . . . . . . . . . . . 151 2,958L3Harris Technologies, Inc. . . . . . . 205 42,771Laboratory Corp. of America
Holdings (b) . . . . . . . . . . . . . . 70 11,760Lam Research Corp. . . . . . . . . . . . 151 34,898Lamb Weston Holdings, Inc. . . . . . . 175 12,726Las Vegas Sands Corp. . . . . . . . . . 331 19,119Lear Corp. . . . . . . . . . . . . . . . . . 95 11,200Leggett & Platt, Inc. (a) . . . . . . . . . 151 6,182Lennar Corp. Class A . . . . . . . . . . 75 4,189Liberty Broadband Corp. Class C
(b) . . . . . . . . . . . . . . . . . . . . 111 11,618Liberty Media Corp.-Liberty
SiriusXM Class C (b) . . . . . . . . 23 965Liberty Property Trust REIT . . . . . . 301 15,450Lincoln National Corp. . . . . . . . . . 81 4,886LKQ Corp. (b) . . . . . . . . . . . . . . 151 4,749Lockheed Martin Corp. . . . . . . . . . 63 24,574Loews Corp. . . . . . . . . . . . . . . . . 101 5,199Lowe’s Cos., Inc. . . . . . . . . . . . . . 158 17,374Lululemon Athletica, Inc. (b) . . . . . 110 21,178LyondellBasell Industries NV
Class A . . . . . . . . . . . . . . . . . 353 31,583M&T Bank Corp.. . . . . . . . . . . . . 65 10,268Macy’s, Inc. (a) . . . . . . . . . . . . . . 151 2,347ManpowerGroup, Inc. . . . . . . . . . . 50 4,212Marathon Oil Corp. . . . . . . . . . . . 75 920Marathon Petroleum Corp. . . . . . . . 264 16,038Markel Corp. (b) . . . . . . . . . . . . . 43 50,822Marriott International, Inc. Class A. . 87 10,820
SPDR MSCI WORLD STRATEGICFACTORS ETFSCHEDULE OF INVESTMENTSSeptember 30, 2019
10

Security Description Shares Value
Marsh & McLennan Cos., Inc. . . . . 803 $ 80,340Mastercard, Inc. Class A . . . . . . . . 923 250,659Maxim Integrated Products, Inc. . . . 280 16,215McCormick & Co., Inc. . . . . . . . . . 213 33,292McDonald’s Corp. . . . . . . . . . . . . 500 107,355McKesson Corp. . . . . . . . . . . . . . 146 19,952Medtronic PLC . . . . . . . . . . . . . . 553 60,067Merck & Co., Inc. . . . . . . . . . . . . 1,060 89,231MetLife, Inc.. . . . . . . . . . . . . . . . 334 15,751Mettler-Toledo International, Inc.
(b) . . . . . . . . . . . . . . . . . . . . 35 24,654MGM Resorts International . . . . . . 152 4,213Micron Technology, Inc. (b) . . . . . . 482 20,654Microsoft Corp. . . . . . . . . . . . . . . 3,573 496,754Middleby Corp. (b). . . . . . . . . . . . 75 8,767Molson Coors Brewing Co. Class B . 60 3,450Mondelez International, Inc.
Class A . . . . . . . . . . . . . . . . . 333 18,422Monster Beverage Corp. (b) . . . . . . 334 19,392Moody’s Corp. . . . . . . . . . . . . . . 111 22,736Morgan Stanley . . . . . . . . . . . . . . 318 13,569Mosaic Co. . . . . . . . . . . . . . . . . . 90 1,845Motorola Solutions, Inc. . . . . . . . . 462 78,729Mylan NV (b) . . . . . . . . . . . . . . . 81 1,602National Oilwell Varco, Inc. . . . . . . 95 2,014National Retail Properties, Inc.
REIT . . . . . . . . . . . . . . . . . . . 373 21,037NetApp, Inc. . . . . . . . . . . . . . . . . 258 13,548Newell Brands, Inc. . . . . . . . . . . . 99 1,853Newmont Goldcorp Corp. . . . . . . . 2,022 76,674NextEra Energy, Inc. . . . . . . . . . . . 395 92,031Nielsen Holdings PLC. . . . . . . . . . 151 3,209NIKE, Inc. Class B. . . . . . . . . . . . 1,358 127,543NiSource, Inc. . . . . . . . . . . . . . . . 151 4,518Noble Energy, Inc. . . . . . . . . . . . . 56 1,258Nordstrom, Inc. (a) . . . . . . . . . . . . 221 7,441Norfolk Southern Corp. . . . . . . . . . 56 10,061Northrop Grumman Corp. . . . . . . . 134 50,222Norwegian Cruise Line Holdings,
Ltd. (b) . . . . . . . . . . . . . . . . . 75 3,883Nucor Corp. . . . . . . . . . . . . . . . . 80 4,073NVIDIA Corp. . . . . . . . . . . . . . . 466 81,117NVR, Inc. (b) . . . . . . . . . . . . . . . 3 11,152Occidental Petroleum Corp. . . . . . . 287 12,763Old Dominion Freight Line, Inc. . . . 75 12,748Omnicom Group, Inc. (a) . . . . . . . . 244 19,105ONEOK, Inc. . . . . . . . . . . . . . . . 60 4,421Oracle Corp. . . . . . . . . . . . . . . . . 2,016 110,940O’Reilly Automotive, Inc. (b) . . . . . 59 23,512PACCAR, Inc. . . . . . . . . . . . . . . . 66 4,621Palo Alto Networks, Inc. (b) . . . . . . 75 15,287Paychex, Inc.. . . . . . . . . . . . . . . . 1,032 85,419PayPal Holdings, Inc. (b) . . . . . . . . 45 4,662People’s United Financial, Inc. . . . . 113 1,767PepsiCo, Inc.. . . . . . . . . . . . . . . . 1,779 243,901Pfizer, Inc. . . . . . . . . . . . . . . . . . 5,191 186,513
Security Description Shares Value
Philip Morris International, Inc.. . . . 310 $ 23,538Phillips 66 . . . . . . . . . . . . . . . . . 223 22,835Pinnacle West Capital Corp. . . . . . . 75 7,280Pioneer Natural Resources Co. . . . . 20 2,515Plains GP Holdings L.P. Class A (b) . 140 2,972PNC Financial Services Group, Inc. . 126 17,660Polaris, Inc. . . . . . . . . . . . . . . . . 75 6,601PPG Industries, Inc. . . . . . . . . . . . 196 23,228PPL Corp. . . . . . . . . . . . . . . . . . 166 5,227Principal Financial Group, Inc. . . . . 307 17,542Procter & Gamble Co. . . . . . . . . . . 2,424 301,497Progressive Corp.. . . . . . . . . . . . . 788 60,873Prologis, Inc. REIT. . . . . . . . . . . . 101 8,607Prudential Financial, Inc. . . . . . . . . 206 18,530Public Service Enterprise Group,
Inc. . . . . . . . . . . . . . . . . . . . . 136 8,443Public Storage REIT . . . . . . . . . . . 363 89,033PulteGroup, Inc. . . . . . . . . . . . . . 126 4,605QUALCOMM, Inc. . . . . . . . . . . . 93 7,094Quest Diagnostics, Inc. . . . . . . . . . 27 2,890Qurate Retail, Inc. Class A (b) . . . . . 151 1,558Raymond James Financial, Inc. . . . . 75 6,185Raytheon Co. . . . . . . . . . . . . . . . 275 53,952Realty Income Corp. REIT . . . . . . . 298 22,851Regeneron Pharmaceuticals, Inc. (b) . 95 26,353Regions Financial Corp. . . . . . . . . 282 4,461RenaissanceRe Holdings, Ltd. . . . . . 151 29,211Republic Services, Inc. . . . . . . . . . 881 76,251ResMed, Inc.. . . . . . . . . . . . . . . . 126 17,024Robert Half International, Inc.. . . . . 142 7,904Rockwell Automation, Inc. . . . . . . . 140 23,072Rollins, Inc. (a) . . . . . . . . . . . . . . 111 3,782Ross Stores, Inc. . . . . . . . . . . . . . 730 80,190Royal Caribbean Cruises, Ltd. . . . . . 27 2,925Schlumberger, Ltd. . . . . . . . . . . . . 264 9,021Seagate Technology PLC . . . . . . . . 15 807SEI Investments Co. . . . . . . . . . . . 146 8,651Sempra Energy . . . . . . . . . . . . . . 81 11,956Simon Property Group, Inc. REIT . . 101 15,721Sirius XM Holdings, Inc. (a) . . . . . . 901 5,636Skyworks Solutions, Inc. . . . . . . . . 152 12,046Snap-on, Inc.. . . . . . . . . . . . . . . . 75 11,740Southern Co.. . . . . . . . . . . . . . . . 1,474 91,049Southwest Airlines Co. . . . . . . . . . 96 5,185Spectrum Brands Holdings, Inc. . . . 4 199Spirit AeroSystems Holdings, Inc.
Class A . . . . . . . . . . . . . . . . . 75 6,168Starbucks Corp. . . . . . . . . . . . . . . 462 40,850State Street Corp. (g) . . . . . . . . . . 60 3,551Stryker Corp. . . . . . . . . . . . . . . . 85 18,385SunTrust Banks, Inc.. . . . . . . . . . . 125 8,600Synchrony Financial . . . . . . . . . . . 271 9,238Synopsys, Inc. (b) . . . . . . . . . . . . 161 22,097Sysco Corp. . . . . . . . . . . . . . . . . 291 23,105T Rowe Price Group, Inc. . . . . . . . . 250 28,562Tapestry, Inc. . . . . . . . . . . . . . . . 434 11,306
SPDR MSCI WORLD STRATEGICFACTORS ETFSCHEDULE OF INVESTMENTSSeptember 30, 2019
11
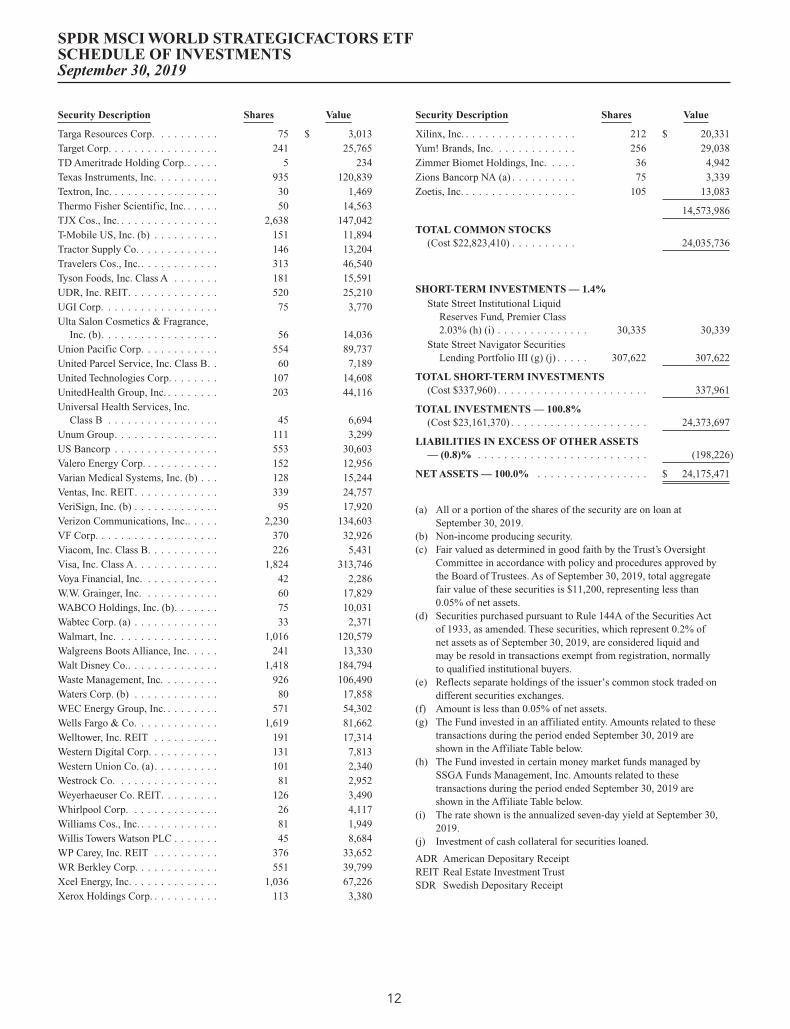
Security Description Shares Value
Targa Resources Corp. . . . . . . . . . 75 $ 3,013Target Corp. . . . . . . . . . . . . . . . . 241 25,765TD Ameritrade Holding Corp. . . . . . 5 234Texas Instruments, Inc. . . . . . . . . . 935 120,839Textron, Inc. . . . . . . . . . . . . . . . . 30 1,469Thermo Fisher Scientific, Inc. . . . . . 50 14,563TJX Cos., Inc. . . . . . . . . . . . . . . . 2,638 147,042T-Mobile US, Inc. (b) . . . . . . . . . . 151 11,894Tractor Supply Co. . . . . . . . . . . . . 146 13,204Travelers Cos., Inc. . . . . . . . . . . . . 313 46,540Tyson Foods, Inc. Class A . . . . . . . 181 15,591UDR, Inc. REIT. . . . . . . . . . . . . . 520 25,210UGI Corp. . . . . . . . . . . . . . . . . . 75 3,770Ulta Salon Cosmetics & Fragrance,
Inc. (b). . . . . . . . . . . . . . . . . . 56 14,036Union Pacific Corp. . . . . . . . . . . . 554 89,737United Parcel Service, Inc. Class B. . 60 7,189United Technologies Corp. . . . . . . . 107 14,608UnitedHealth Group, Inc. . . . . . . . . 203 44,116Universal Health Services, Inc.
Class B . . . . . . . . . . . . . . . . . 45 6,694Unum Group. . . . . . . . . . . . . . . . 111 3,299US Bancorp . . . . . . . . . . . . . . . . 553 30,603Valero Energy Corp. . . . . . . . . . . . 152 12,956Varian Medical Systems, Inc. (b) . . . 128 15,244Ventas, Inc. REIT. . . . . . . . . . . . . 339 24,757VeriSign, Inc. (b) . . . . . . . . . . . . . 95 17,920Verizon Communications, Inc.. . . . . 2,230 134,603VF Corp. . . . . . . . . . . . . . . . . . . 370 32,926Viacom, Inc. Class B. . . . . . . . . . . 226 5,431Visa, Inc. Class A. . . . . . . . . . . . . 1,824 313,746Voya Financial, Inc. . . . . . . . . . . . 42 2,286W.W. Grainger, Inc. . . . . . . . . . . . 60 17,829WABCO Holdings, Inc. (b). . . . . . . 75 10,031Wabtec Corp. (a) . . . . . . . . . . . . . 33 2,371Walmart, Inc. . . . . . . . . . . . . . . . 1,016 120,579Walgreens Boots Alliance, Inc. . . . . 241 13,330Walt Disney Co.. . . . . . . . . . . . . . 1,418 184,794Waste Management, Inc. . . . . . . . . 926 106,490Waters Corp. (b) . . . . . . . . . . . . . 80 17,858WEC Energy Group, Inc. . . . . . . . . 571 54,302Wells Fargo & Co. . . . . . . . . . . . . 1,619 81,662Welltower, Inc. REIT . . . . . . . . . . 191 17,314Western Digital Corp. . . . . . . . . . . 131 7,813Western Union Co. (a). . . . . . . . . . 101 2,340Westrock Co. . . . . . . . . . . . . . . . 81 2,952Weyerhaeuser Co. REIT. . . . . . . . . 126 3,490Whirlpool Corp. . . . . . . . . . . . . . 26 4,117Williams Cos., Inc. . . . . . . . . . . . . 81 1,949Willis Towers Watson PLC . . . . . . . 45 8,684WP Carey, Inc. REIT . . . . . . . . . . 376 33,652WR Berkley Corp. . . . . . . . . . . . . 551 39,799Xcel Energy, Inc. . . . . . . . . . . . . . 1,036 67,226Xerox Holdings Corp. . . . . . . . . . . 113 3,380
Security Description Shares Value
Xilinx, Inc. . . . . . . . . . . . . . . . . . 212 $ 20,331Yum! Brands, Inc. . . . . . . . . . . . . 256 29,038Zimmer Biomet Holdings, Inc. . . . . 36 4,942Zions Bancorp NA (a) . . . . . . . . . . 75 3,339Zoetis, Inc. . . . . . . . . . . . . . . . . . 105 13,083
14,573,986
TOTAL COMMON STOCKS(Cost $22,823,410) . . . . . . . . . . 24,035,736
SHORT-TERM INVESTMENTS — 1.4%State Street Institutional Liquid
Reserves Fund, Premier Class2.03% (h) (i) . . . . . . . . . . . . . . 30,335 30,339
State Street Navigator SecuritiesLending Portfolio III (g) (j) . . . . . 307,622 307,622
TOTAL SHORT-TERM INVESTMENTS(Cost $337,960) . . . . . . . . . . . . . . . . . . . . . . . 337,961
TOTAL INVESTMENTS — 100.8%(Cost $23,161,370) . . . . . . . . . . . . . . . . . . . . . 24,373,697
LIABILITIES IN EXCESS OF OTHER ASSETS— (0.8)% . . . . . . . . . . . . . . . . . . . . . . . . . . (198,226)
NET ASSETS — 100.0% . . . . . . . . . . . . . . . . . $ 24,175,471
(a) All or a portion of the shares of the security are on loan atSeptember 30, 2019.
(b) Non-income producing security.(c) Fair valued as determined in good faith by the Trust’s Oversight
Committee in accordance with policy and procedures approved bythe Board of Trustees. As of September 30, 2019, total aggregatefair value of these securities is $11,200, representing less than0.05% of net assets.
(d) Securities purchased pursuant to Rule 144A of the Securities Actof 1933, as amended. These securities, which represent 0.2% ofnet assets as of September 30, 2019, are considered liquid andmay be resold in transactions exempt from registration, normallyto qualified institutional buyers.
(e) Reflects separate holdings of the issuer’s common stock traded ondifferent securities exchanges.
(f) Amount is less than 0.05% of net assets.(g) The Fund invested in an affiliated entity. Amounts related to these
transactions during the period ended September 30, 2019 areshown in the Affiliate Table below.
(h) The Fund invested in certain money market funds managed bySSGA Funds Management, Inc. Amounts related to thesetransactions during the period ended September 30, 2019 areshown in the Affiliate Table below.
(i) The rate shown is the annualized seven-day yield at September 30,2019.
(j) Investment of cash collateral for securities loaned.
ADR American Depositary ReceiptREIT Real Estate Investment TrustSDR Swedish Depositary Receipt
SPDR MSCI WORLD STRATEGICFACTORS ETFSCHEDULE OF INVESTMENTSSeptember 30, 2019
12
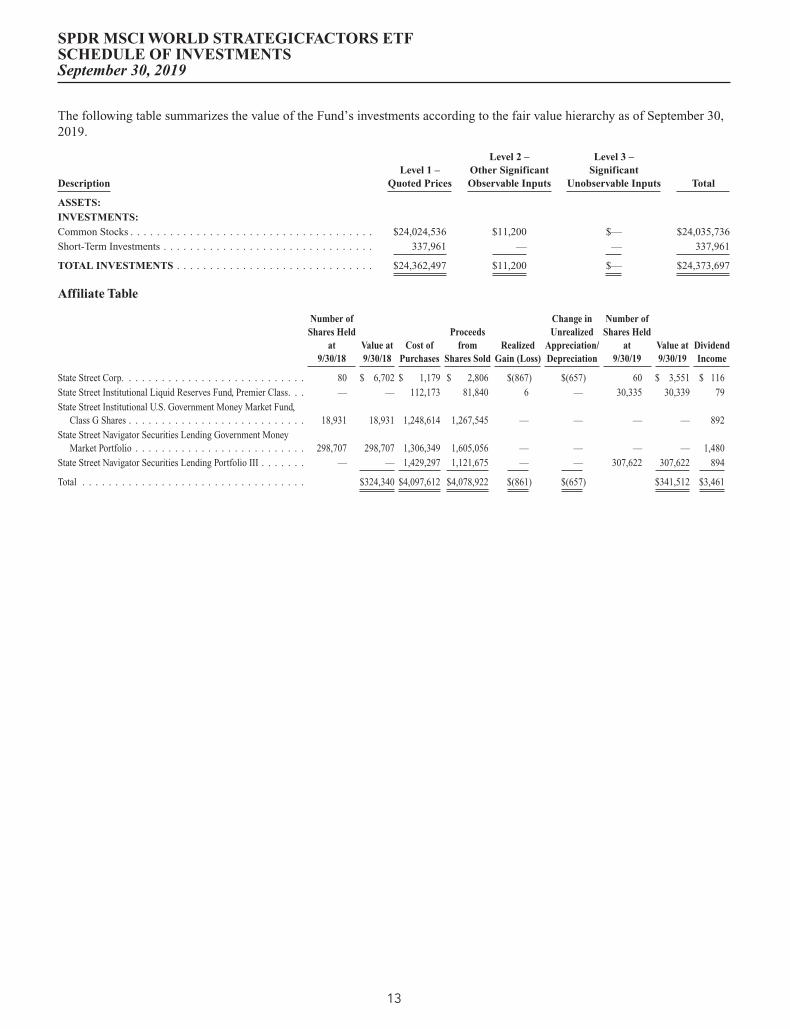
The following table summarizes the value of the Fund’s investments according to the fair value hierarchy as of September 30,2019.
DescriptionLevel 1 –
Quoted Prices
Level 2 –Other SignificantObservable Inputs
Level 3 –Significant
Unobservable Inputs Total
ASSETS:INVESTMENTS:Common Stocks . . . . . . . . . . . . . . . . . . . . . . . . . . . . . . . . . . . . . $24,024,536 $11,200 $— $24,035,736
Short-Term Investments . . . . . . . . . . . . . . . . . . . . . . . . . . . . . . . . 337,961 — — 337,961
TOTAL INVESTMENTS . . . . . . . . . . . . . . . . . . . . . . . . . . . . . . $24,362,497 $11,200 $— $24,373,697
Affiliate Table
Number ofShares Held
at9/30/18
Value at9/30/18
Cost ofPurchases
Proceedsfrom
Shares SoldRealized
Gain (Loss)
Change inUnrealized
Appreciation/Depreciation
Number ofShares Held
at9/30/19
Value at9/30/19
DividendIncome
State Street Corp. . . . . . . . . . . . . . . . . . . . . . . . . . . . 80 $ 6,702 $ 1,179 $ 2,806 $(867) $(657) 60 $ 3,551 $ 116
State Street Institutional Liquid Reserves Fund, Premier Class. . . — — 112,173 81,840 6 — 30,335 30,339 79
State Street Institutional U.S. Government Money Market Fund,Class G Shares . . . . . . . . . . . . . . . . . . . . . . . . . . . 18,931 18,931 1,248,614 1,267,545 — — — — 892
State Street Navigator Securities Lending Government MoneyMarket Portfolio . . . . . . . . . . . . . . . . . . . . . . . . . . 298,707 298,707 1,306,349 1,605,056 — — — — 1,480
State Street Navigator Securities Lending Portfolio III . . . . . . . — — 1,429,297 1,121,675 — — 307,622 307,622 894
Total . . . . . . . . . . . . . . . . . . . . . . . . . . . . . . . . . . $324,340 $4,097,612 $4,078,922 $(861) $(657) $341,512 $3,461
SPDR MSCI WORLD STRATEGICFACTORS ETFSCHEDULE OF INVESTMENTSSeptember 30, 2019
13