annual report on port state control in the … · memorandum of understanding on port state control...
TRANSCRIPT

ANNUAL REPORT
ON
PORT STATE CONTROL
IN THE ASIA-PACIFIC REGION
2012

This work is copyright. It may be reproduced in whole or part subject to the inclusion
of an acknowledgement of the source but not for commercial use or sale.
Further information may be obtained from:
The Tokyo MOU Secretariat
Ascend Shimbashi 8F
6-19-19 Shimbashi
Minato-ku, Tokyo
Japan 105-0004
Tel: +81-3-3433-0621
Fax: +81-3-3433-0624
This Report is also available at Tokyo MOU web-site
(http://www.tokyo-mou.org) on the Internet.

MEMORANDUM OF UNDERSTANDING ON PORT STATE CONTROL IN THE ASIA-PACIFIC REGION
FOREWORD
We are pleased to present the Annual Report on Port State Control in the Asia-Pacific
Region 2012.
The member Authorities of the Tokyo MOU carried out a total of 30,929 inspections in 2012,
which creates a new record not only of its own but also for the regional PSC regimes around
the world. Detentions have decreased both in number and in percentage in 2012. It is for the
first time that the regional detention rate is below 5%, except for the year of starting operation
of the Tokyo MOU. This can be seen as a positive outcome of effective operation of PSC
programme by the Tokyo MOU Authorities. There are several notable developments in the
Tokyo MOU in 2012, namely: implementation of the new coding system, enacting measures
on under-performing ships permanently, renewal of the MOU web-site and establishing the
open forum with the industry.
This annual report outlines the port State control developments and activities of the Tokyo
MOU in 2012. Moreover, the report also provides port State control statistics and analysis on
the results of inspections carried out by member Authorities during the year.
The Tokyo MOU has played a key role in promotion of maritime safety, protection of the
marine environment and safeguarding living and working conditions on board ships in the
Asia-Pacific region since its establishment. The Tokyo MOU will continue its commitment and
efforts to enhance and improve PSC activities so as to eliminate substandard ships to the
maximum extent in the region.
Abdul Samad Bin Shaik Osman Mitsutoyo Okada
Chairman Secretary
Port State Control Committee Tokyo MOU Secretariat

MEMORANDUM OF UNDERSTANDING ON PORT STATE CONTROL IN THE ASIA-PACIFIC REGION
CONTENTS
page
OVERVIEW
General introduction ............................................................................…….. 1
Review of year 2012 .............................................................................…….. 2
The Port State Control Committee ......................................................…….. 3
Technical Working Group (TWG) ……………………………………………… 5
The Asia-Pacific Computerized Information System (APCIS) ...........……. 5
Training and seminars for port State control officers .......................…….. 6
Co-operation with other regional port State control agreements ………... 9
PORT STATE CONTROL UNDER THE TOKYO MOU, 2012
Inspections ...........................................................................................……... 12
Detentions ............................................................................................……... 12
Deficiencies ..........................................................................................……... 13
Overview of port State control results 2002-2012 …………………………... 14
ANNEX 1 -- STATUS OF THE RELEVANT INSTRUMENTS .......................….. 21
ANNEX 2 -- PORT STATE INSPECTION STATISTICS ..............................…….. 23
Statistics for 2012 .....................................................................……… 23
Summary of port State inspection data 2010-2012 .......................… 32
ANNEX 3 -- ORGANIZATION STRUCTURE OF THE TOKYO MOU .............. 50
Explanatory Note on the Black-Grey-White Lists ……………………………… 51

MEMORANDUM OF UNDERSTANDING ON PORT STATE CONTROL IN THE ASIA-PACIFIC REGION
LIST OF FIGURES AND TABLES page
Figure 1 Inspection percentage ………………………………………………….. 15
Figure 2 Port State inspections - contribution by Authorities ……………… 15
Figure 3 Type of ship inspected ………………………………………………….. 16
Figure 4 Detentions per flag ……………………………………………………… 16
Figure 5 Detention per ship type ………………………………………………… 17
Figure 6 Deficiencies by main categories ……………………………………… 17
Figure 7 Most frequent detainable deficiencies ………………………………. 18
Figure 8 No. of inspections ……………………………………………………….. 19
Figure 9 Inspection percentage ………………………………………………….. 19
Figure 10 No. of inspections with deficiencies …………………………………. 19
Figure 11 No. of deficiencies ………………………………………………………. 20
Figure 12 No. of detentions …………………………………….…………………... 20
Figure 13 Detention percentage ……………………………….…………………... 20
Figure 14 Comparison of inspections per ship type …………………………... 38
Figure 15 Comparison of detentions per ship type ………………………….… 38
Figure 16 Comparison of inspections with deficiencies per ship type …….. 40
Figure 17 Comparison of number of deficiencies by main categories …….. 46
Figure 18 Comparison of most frequent detainable deficiencies …………… 48
Table 1 Status of the relevant instruments …………………………………… 21
Table 1a Status of MARPOL 73/78 ……………………………………………….. 22
Table 2 Port State inspections carried out by Authorities …………………. 23
Table 2a Port State inspections on maritime security ……………………….. 24
Table 3 Port State inspections per flag ……………………………………….. 25
Table 4 Port State inspections per ship type …………………………………. 28
Table 5 Port State inspections per recognized organization …….……….. 29
Table 6 Deficiencies by categories …………………………………………….. 31
Table 7 Black – Grey – White Lists ……………………………………………... 32
Table 8 Inspections and detentions per flag …………………………………. 34
Table 9 Inspections and detentions per ship type ………………………….. 39
Table 10 Inspections with deficiencies per ship type ……………………….. 41
Table 11 Inspections and detentions per recognized organization ……….. 42
Table 12 Performance of recognized organization …………………………… 44
Table 13 Comparison of deficiencies by categories ………………………….. 47
Table 14 Comparison of most frequent detainable deficiencies …………… 49

MEMORANDUM OF UNDERSTANDING ON PORT STATE CONTROL IN THE ASIA-PACIFIC REGION
1
O V E R V I E W
GENERAL INTRODUCTION
The Annual Report on Port State Control in the Asia-Pacific Region is published under the auspices of the Port State Control Committee of the Memorandum of Understanding on Port State Control in the Asia-Pacific Region (Tokyo MOU). This annual report is the eighteenth issue and covers port State control activities and developments in the year 2012. The Memorandum was concluded in Tokyo on 1 December 1993. The following maritime Authorities in the Asia-Pacific region are the signatories to the Memorandum: Australia, Canada, Chile, China, Fiji, Hong Kong (China), Indonesia, Japan, Republic of Korea, Malaysia, New Zealand, Papua New Guinea, the Philippines, the Russian Federation, Singapore, Solomon Islands, Thailand, Vanuatu and Viet Nam. The Memorandum came into effect on 1 April 1994. In accordance with the provisions of the Memorandum, the Authorities which have signed and formally accepted the Memorandum or which have been accepted with unanimous consent of the Port State Control Committee would become full members. Currently, the Memorandum has 18 full members, namely: Australia, Canada, Chile, China, Fiji, Hong Kong (China), Indonesia, Japan, Republic of Korea, Malaysia, New Zealand, Papua New Guinea, the Philippines, the Russian Federation,
Singapore, Thailand, Vanuatu and Viet Nam. A maritime Authority which declared the clear intention to fully adhere to the Memorandum within a three-year period would be accepted as a co-operating member with unanimous consent of the Port State Control Committee. The Republic of the Marshall Islands and Peru are participating in the Tokyo MOU as the co-operating member Authorities at the moment. The main objective of the Memorandum is to establish an effective port State control regime in the Asia-Pacific region through co-operation of its members and harmonization of their activities, to eliminate substandard shipping so as to promote maritime safety, to protect the marine environment and to safeguard working and living conditions on board ships. The Port State Control Committee established under the Memorandum monitors and controls the implementation and on-going operation of the Memorandum. The Committee consists of representatives of the member Authorities, co-operating member Authorities and observers. The observer status has been granted the following maritime Authorities and the inter-governmental organizations by the Committee: Democratic People’s Republic of Korea, Macao (China), Solomon Islands, United States Coast Guard, the International Maritime Organization (IMO), the International Labour Organization (ILO), the Paris MOU, the Viña del Mar Agreement, the Indian Ocean

MEMORANDUM OF UNDERSTANDING ON PORT STATE CONTROL IN THE ASIA-PACIFIC REGION
2
MOU and the Black Sea MOU. The Secretariat of the Memorandum is located in Tokyo, Japan. For the purpose of the Memorandum, the following instruments are the basis for port State control activities in the region:
the International Convention on Load Lines, 1966;
the Protocol of 1988 relating to the International Convention on Load Lines, 1966, as amended;
the International Convention for the
Safety of Life at Sea, 1974, as amended;
the Protocol of 1978 relating to the International Convention for the Safety of Life at Sea, 1974;
the Protocol of 1988 relating to the International Convention for the Safety of Life at Sea, 1974;
the International Convention for the
Prevention of Pollution from Ships 1973, as modified by the Protocol of 1978 relating thereto, as amended;
the International Convention on Standards for Training, Certification and Watchkeeping for Seafarers, 1978, as amended;
the Convention on the International Regulations for Preventing Collisions at Sea, 1972;
the International Convention on Tonnage Measurement of Ships,
1969;
the Merchant Shipping (Minimum Standards) Convention, 1976 (ILO Convention No. 147); and
the International Convention on the Control of Harmful Anti-fouling Systems on Ships, 2001.
REVIEW OF YEAR 2012
The Tokyo MOU implemented a new coding system in 2012, which was an achievement of the joint work done by the Paris and the Tokyo Memoranda. The new coding system would be adopted widely by other regional PSC regimes and industrial organizations for information exchange. After nearly two years’ trial, the Tokyo MOU decided to implement the measures against the under-performing ships permanently. It is encouraging that the number of under-performing ships every month now has been decreasing, comparing with the early time of the trial implementation. As informed in the previous Annual Report, the Tokyo MOU was considering establishment of a scheme for exchange views and carrying out dialogues with the industry. In this context, a first open forum with the industry was convened in conjunction with the Port State Control Committee meeting in Chile. The forum was attended by the International Association of Classification societies (IACS), the Association of Asian Classification Society (ACS), INTERCARGO, the International Chamber of Shipping and the International Shipping Federation (ICS/ISF) and the International Transport Workers’ Federation (ITF). The concentrated inspection campaign (CIC)

MEMORANDUM OF UNDERSTANDING ON PORT STATE CONTROL IN THE ASIA-PACIFIC REGION
3
on Fire Safety System (FSS) was conducted from 1 September to 30 November 2012. During the campaign period, a total of 8,274 PSC inspections were conducted by the eighteen member Authorities, of which 6,606 were related to a CIC inspection. There were a total of 217 detentions recorded during the CIC inspections, among which 150 or 69% of them were detained as the direct results of the CIC. The CIC-topic related detention rate is 2.3% while the overall CIC detention rate 3.3%. A total of 4,279 CIC related deficiencies were recorded. The most significant deficiencies found during the campaign were related to fire-fighting equipment and appliances 659 (15.40%), followed with ready availability of fire-fighting equipment 470 (11%) and fire detection and alarm system 410 (9.58%). Although the overall results of the CIC is satisfactory generally, giving the fact that nearly 70% of the detentions was the CIC-topic related during the campaign period, the industry has not achieved an acceptable level of compliance with the relevant fire safety system requirements. This campaign was carried out jointly with the Paris MOU and also with participation by regional PSC regimes of the Black Sea MOU, the Indian
Ocean MOU, the Mediterranean MOU and the Viña del Mar Agreement. The Tokyo MOU web-site was renewed in 2012. The new version of the web-site incorporates the new features of FAQ section, free text search, e-mail addresses of member Authorities and an on-line query form. Users can find the new design of the web-site is refreshing, professional and easy for use and navigation.
THE PORT STATE CONTROL COMMITTEE
The Port State Control Committee held its twenty-second meeting in Viña del Mar, Chile, from 16 to 19 April 2012. The meeting was hosted by the Directorate General of the Maritime Territory and Merchant Marine (DIRECTEMAR) of Chile. The meeting was chaired by Mr. Ong Hua Siong, Assistant Director (Ship Regulation and Development/ Port State Control), Shipping Division, Maritime and Port Authority of Singapore. The twenty-second Committee meeting was attended by representatives of the member
The twenty-second Committee meeting, Viña del Mar, April 2012.

MEMORANDUM OF UNDERSTANDING ON PORT STATE CONTROL IN THE ASIA-PACIFIC REGION
4
Authorities of Australia, Canada, Chile, China, Hong Kong (China), Japan, Republic of Korea, Malaysia, New Zealand, Papua New Guinea, the Philippines, the Russian Federation, Singapore, Thailand, Vanuatu and Viet Nam; the co-operating member Authority of the Marshall Islands and observers from the DPR Korea, Macao (China), the United States Coast Guard, the Black Sea MOU, the Indian Ocean MOU, the Paris MOU and the Viña del Mar Agreement. The Committee considered the application for Co-operating Member status by Peru. Having reviewed an evaluation report by the monitoring team, the Committee unanimously agreed to accept Peru as a Co-operating Member of the Tokyo MOU in accordance with the relevant provisions of the Memorandum. The Committee considered the outcome of the further trial of measures against the under-performing ships. The Committee decided to implement the measures permanently. The Committee considered and approved the proposals for the renewal of the MOU web-site. The Committee adopted guidelines for PSC on Maritime Labour Convention (MLC) 2006 in principle and agreed to consider inclusion of the MLC as a relevant instrument under the Tokyo MOU at its next meeting, having noted that the conditions for entry into force of MLC 2006 would be met soon. The Committee reviewed a detailed report on the results of the CIC on harmful substances (Marine Pollutants) carried in packaged form in 2010. The Committee agreed to submit an action paper regarding training on securing and stowage of dangerous to IMO as the output of the CIC. The Committee considered
a comprehensive report of the CIC on Structural Safety and the Load Lines which was conducted in 2011 with the Paris MOU jointly. The Committee approved the arrangements for the joint CIC on Fire Safety System (FSS) with the Paris MOU scheduled for September – November 2012. Moreover, the Committee agreed to prepare a further joint CIC with the Paris MOU on propulsion and auxiliary machinery in 2013 and to keep communications with the Paris MOU for the possible topics for CICs in 2014 and thereafter. The Committee reviewed achievements and status of the action plan developed based on the strategic plan. The Committee noted with satisfaction the work done by the inter-sessional working group on consideration of new inspection regime (NIR). The Committee agreed in general to the proposed elements for the NIR and instructed the group to finalize its work by the time of next meeting. During the meeting, the Committee also gave consideration and made decisions on the following: assessment of performance of member
Authorities; establishment of an intersessional group
for restructuring of the PSC Manual; approval of the general arrangement for
organization of open forum for dialogue and exchange of views with the industry;
change of currency used for financial
contribution; and
awarding the winner of the best deficiency

MEMORANDUM OF UNDERSTANDING ON PORT STATE CONTROL IN THE ASIA-PACIFIC REGION
5
photo of the year.
The twenty-third meeting of the Port State Control Committee will be held in Singapore in January 2013.
TECHICAL WORKING GROUP (TWG)
The fifth meeting of the Technical Working Group (TWG) was held in Viña del Mar, Chile, from 13 to 14 April 2012, precedence of the twenty-second meeting of the Committee. The TWG05 meeting was chaired by Mr. Christopher Lindesay, Principal Systems Officer, Australian Maritime Safety Authority. The TWG meeting discussed and made recommendations to the Committee on matters relating to: cases considered by the detention review
panel; periodical revision of the PSC Manual; development and review of PSC
guidelines;
preparation and arrangements for on-going and upcoming CICs;
reports of intersessional groups: advisory group on information exchange (AG-IE), intersessional group on batch protocol (IG-BP) and intersessional group on statistics (IG-Statistics);
activities and operation of the APCIS system;
management and maintenance of the
coding system;
analysis and statistics on PSC; information exchange with other regional
PSC databases; and
reports and evaluations of technical co-operation activities.
The meeting elected Mr. Kenny Crawford, Manager, International and Coastal Shipping, Maritime New Zealand, as the Vice-Chairman to succeed Mr. Ning Bo of China, who would be unable to complete his term by the next meeting.
ASIA-PACIFIC COMPUTERIZED INFORMATION SYSTEM (APCIS)
For reporting and storing of port State inspection results and facilitating exchange of information in the region, a computerized database system, the Asia-Pacific Computerized Information System (APCIS), was established. The central site of the APCIS is located in Moscow, under the auspices of the Ministry of Transport of the Russian Federation. The APCIS system is connected by member Authorities on-line or by batch protocol for searching ships for inspection and for inputting and transmitting inspection reports. The APCIS also supports on-line publication of PSC data on the Tokyo MOU web-site (http://www.tokyo-mou.org) on a real time basis. Based on data stored in the database, the APCIS produces annual and detailed PSC statistics. For inter-regional information exchange, the APCIS has established deep hyperlinks with

MEMORANDUM OF UNDERSTANDING ON PORT STATE CONTROL IN THE ASIA-PACIFIC REGION
6
Training course for PSC officers
Onboard training
the databases of:
THETIS of the Paris MOU; BSIS of the Black Sea MOU; IOCIS of the Indian Ocean MOU; and CIALA of the Viña del Mar Agreement.
TRAINING AND SEMINARS FOR PORT STATE CONTROL OFFICERS
The second general training course for PSC officers was held in Yokohama, Japan, from 27 August to 21 September 2012. This was the eighth training course jointly organized by IMO and the Tokyo MOU. A total of 18 PSC officers participated in the training course. Eleven of them were from the Tokyo MOU Authorities of Chile, China, Indonesia, Macao (China), Malaysia, Papua New
Guinea, the Philippines, the Russian Federation, Thailand, Vanuatu and Viet Nam. The other seven were invited by IMO, one each from Abuja MOU, Caribbean MOU, Indian Ocean MOU, Mediterranean MOU and the Viña del Mar Agreement and two from Riyadh MOU. The course was conducted with the assistance by the Shipbuilding Research Center of Japan (SRC).
The four-week general training course is composed of two-week classroom lectures, which provide trainees with a wide range of lectures and presentations relating to relevant IMO conventions, regulations and other crucial issues which are considered essential to conduct PSC, and onboard training during the following two weeks for giving trainees opportunities to use the theoretical knowledge gained through the

MEMORANDUM OF UNDERSTANDING ON PORT STATE CONTROL IN THE ASIA-PACIFIC REGION
7
Onboard training
The twentieth seminar for PSC officers
classroom lectures. Experts from the Ministry of Land, Infrastructure, Transport and Tourism of Japan (MLIT), SRC and the Secretariat delivered lectures on the relevant subjects. For the onboard training, participants were divided into eight groups to receive the practical training at ports of Yokohama, Niigata, Nagoya, Osaka, Kobe, Hiroshima, Takamatsu or Hakata respectively. In addition, a technical visit to a liferaft manufacturer was also arranged.
The twentieth seminar for PSC officers together with the Workshop on Capacity Building for Implementation and Management of IMO Regulations were held in Port Moresby, Papua New Guinea, from 16 to 19 July 2012. The seminar was hosted by the National Maritime Safety Authority of Papua New Guinea (NMSA). Participants from Authorities of Australia, Canada, Chile, China, Fiji, Hong Kong (China), Indonesia, Japan, the Republic of Korea, Macao (China), Malaysia, Papua New Guinea, the Philippines, Thailand, Vanuatu and Viet Nam attended the seminar and the workshop. The major topics of the seminar were the CIC on Fire Safety System (FSS), introduction of Port State Control Procedures 2011 (Res. A.1052(27)), mandatory enclosed space training, safety issues of container ships, results of the CIC on Structural Safety and the Load Lines. Experts from the Australian

MEMORANDUM OF UNDERSTANDING ON PORT STATE CONTROL IN THE ASIA-PACIFIC REGION
8
Specialized training course
Specialized training course
Maritime Safety Authority (AMSA), Transport Canada and MLIT of Japan made the comprehensive and informative presentations on the relevant topics. One case study session was also conducted to discuss the actual cases provided by Authorities or reviewed by the detention review panel. In conjunction with the seminar, a Workshop on Capacity Building for Implementation and Management of IMO Regulations was organized jointly by IMO and the Tokyo MOU. Two experts invited by IMO delivered presentations on general introduction of IMO and IMO conventions, the Code of Implementation of Mandatory IMO Instruments, Voluntary IMO Member State Audit Scheme (VIMSAS), recent amendments
to conventions and interpretation of vague regulations, development on PSC in IMO and introduction of PSCOs’ decision support tool. Two specialized training courses were conducted in 2012. The second specialized training course was organized in Hanoi, Viet Nam, from 13 to 15 February 2012, by the kind invitation of Vietnam Maritime
Administration (VINAMARINE). The subject of the second specialized training course was PSC inspection reporting, new coding system and the APCIS system. Participants from Australia, Chile, China, Fiji, Hong Kong (China), Indonesia, DPR Korea, Macao (China), Malaysia, Papua New Guinea, the Philippines, the Russian Federation, Singapore, Thailand, Vanuatu and

MEMORANDUM OF UNDERSTANDING ON PORT STATE CONTROL IN THE ASIA-PACIFIC REGION
9
Viet Nam attended the training course. Experts from the APCIS and the Secretariat made presentations at the course. The third specialized training course was convened in Kuala Lumpur, Malaysia from 25 to 29 June 2012. The training course, hosted by the Marine Department of Malaysia, was pertaining to MARPOL issues. Speakers from the Marine Department of Malaysia, the Maritime and Port Authority of Singapore (MPA), PETRONAS and MISC were invited to provide lectures at the course. PSC officers from China, Fiji, Hong Kong (China), Indonesia, Macao (China), Malaysia, the Marshall Islands, New Zealand, Papua New Guinea, the Philippines, the Russian Federation, Singapore, Thailand, Vanuatu and Viet Nam participated in the course. There were three expert missions organized in 2012. One mission was held in Batangas, the Philippines, from 22 to 26 October 2012. Experts from Japan conducted the training. The other two were in Viet Nam, i.e. Danang from 2 to 6 July 2012 and Ho Chi Minh City from 17 to 21 December 2012 respectively. Experts from the Republic of Korea were dispatched for the two missions. Five PSC officer exchanges were completed in 2012, namely one PSC officer from Australia to China, one from Hong Kong (China) to Singapore, one from Japan to Australia, one from the Republic of Korea to New Zealand and one from the Russian Federation to Canada. Currently, the PSC officers exchange programme is implemented among the Authorities of Australia, Canada, China, Hong Kong (China), Japan, the Republic of Korea, New Zealand, the Russian Federation and Singapore. The successful and effective implementation
of technical co-operation programmes enables the Tokyo MOU to enhance and improve its activities continuously. The technical co-operation activities have received full support from the Authorities and the continuous financial assistance from the Nippon Foundation.
CO-OPERATION WITH OTHER REGIONAL PORT STATE CONTROL AGREEMENTS
Establishment and effective operation of regional co-operation regimes on port State control has formed a worldwide network for elimination of substandard shipping. Currently, there are a total of nine regional port State control agreements (MOUs) covering the major part of the world, namely:
Abuja MOU Black Sea MOU Caribbean MOU Indian Ocean MOU Mediterranean MOU Paris MOU Riyadh MOU Tokyo MOU Viña del Mar Agreement
As one of the inter-governmental organizations (IGO) associated with IMO, the Tokyo MOU has attended the meetings of the Flag State Implementation (FSI) Sub-Committee since 2006. The Tokyo MOU Secretariat presented at the twentieth session of FSI in March 2012. In support of inter-regional collaboration on port State control, the Tokyo MOU holds an observer status of the Paris MOU, the Caribbean MOU and the Indian Ocean MOU. In a similar manner, the Tokyo MOU has granted an observer status to the Paris MOU,

MEMORANDUM OF UNDERSTANDING ON PORT STATE CONTROL IN THE ASIA-PACIFIC REGION
10
the Indian Ocean MOU, the Viña del Mar Agreement and the Black Sea MOU. The Tokyo MOU has established, and maintains, effective and close co-operation with the Paris MOU both at administrative and the technical levels. Representatives of the two Secretariats attend the Port State Control Committee meetings of each MOU on a regular basis. During the period of 2012, continuous efforts and further coordinated actions by the two Memoranda were made on the following:
submission of the results of CIC on Structural Safety and the Load Lines to FSI jointly;
carrying out the joint CIC on Fire
Safety System (FSS) 2012; preparation of the joint CICs on
Propulsion and Auxiliary Machinery 2013 and on Hours of Rest 2014;
continuous submission to IMO on
annual list of flags targeted by the Paris MOU, Tokyo MOU and the United States Coast Guard; and
continuous analysis of performance
of flag and RO and submission of the outcome to IMO jointly.
Under the project of technical co-operation with Indian Ocean MOU, a fourth and the final PSC training course was convened in Durban in South Africa, from 5 to 16 March 2012. The training was organized by the Tokyo and the Indian Ocean Memoranda, and IMO jointly. Experts from the Tokyo MOU Authorities of Australia, Hong Kong (China) and Japan and an officer from the Tokyo MOU Secretariat conducted the training. A total of 16
PSC training course for Indian Ocean MOU

MEMORANDUM OF UNDERSTANDING ON PORT STATE CONTROL IN THE ASIA-PACIFIC REGION
11
participants from the Indian Ocean MOU Authorities as well as other regional PSC agreements attended the training course. The training course was hosted by the South African Maritime Safety Authority (SAMSA) and with the financial support provided by the Nippon Foundation and IMO. A new project of technical co-operation with the Viña del Mar Agreement has been initiated. Necessary preparations have been conducted. A first PSC training course will be organized in Ecuador March 2013.

MEMORANDUM OF UNDERSTANDING ON PORT STATE CONTROL IN THE ASIA-PACIFIC REGION
12
PORT STATE CONTROL UNDER THE TOKYO MOU, 2012
INSPECTIONS
In 2012, 30,929 inspections, involving 16,439 individual ships, were carried out on ships registered under 101 flags. Figure 2 and Table 2 show the number of inspections carried out by the member Authorities of the Tokyo MOU. Out of 30,929 inspections, there were 19,250 inspections where ships were found with deficiencies. Since the total number of individual ships operating in the region was estimated at 24,019*, the inspection rate in the region was approximately 68%** in 2012 (see Figure 1). It is notable that the trend of increase of number of inspections and inspection rate has been maintained.
Information on inspections according to ships’ flag is shown in Table 3. Figures summarizing inspections according to ship type are set out in Figure 3 and Table 4.
* Number of individual ships which visited the ports of the region during the year (the figure was provided by LLI). ** The inspection rate is calculated by: number of individual ships inspected/number of individual ships visited.
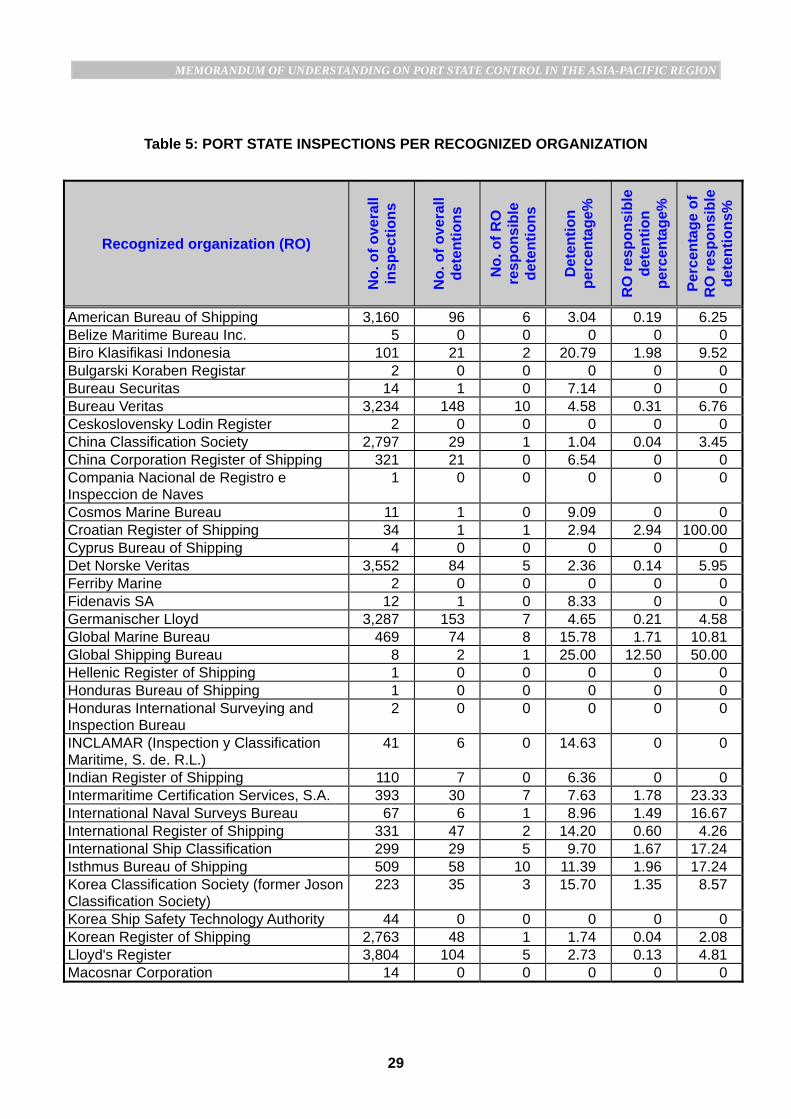
Inspection results regarding recognized organizations are shown in Table 5.
DETENTIONS
Ships are detained when the condition of the ship or its crew does not correspond substantially with the applicable conventions. Such strong action is to ensure that the ship will not sail until it can proceed to sea without presenting a danger to the ship or persons on board, or without presenting an unreasonable threat of harm to the marine environment. In 2012, 1,421 ships registered under 67 flags were detained because of serious deficiencies found onboard. The detention rate of ships

MEMORANDUM OF UNDERSTANDING ON PORT STATE CONTROL IN THE ASIA-PACIFIC REGION
13
inspected was 4.59%. It is a good sign that both number of detentions and detention rate decreased, comparing with the last year. Figure 4 shows the detention rate by flag that had at least 20 port State inspections and whose detention rate was above the average regional rate. Figure 5 gives the detention rate by ship type. A newly introduced Figure 7 shows the most frequent detainable deficiencies found during inspections. Black-grey-white list (Table 7) indicates levels of performance of flags during three-year rolling period. The black-grey-white list for 2010-2012 consists of 63 flags, whose ships were involved in 30 or more inspections during the period. It is disappointing that the
performance of certain flags became worse as the number of flags in the black list increased from 13 to 15 and the number for the grey list from 16 to 17. Tanzania appeared in the black-grey-white list for the first time but as a black list flag. Belize re-joined in the black list since it failed to maintain good performance of its fleet. The white list includes 31 flags, reduced by 2 comparing with the last year.
DEFICIENCIES
All conditions on board found not in compliance with the requirements of the relevant instruments by the port State control officers were recorded as deficiencies and requested to be rectified.
A total of 100,330 deficiencies were recorded in 2012. The deficiencies found are categorized and shown in Figure 6 and Table 6. It has been noted that fire safety measures, safety of navigation and life-saving appliances continue to be the top three categories of deficiencies which are frequently discovered on ships. In 2012, 20,522 fire safety measures related deficiencies, 17,124 safety of navigation related deficiencies and 12,070

MEMORANDUM OF UNDERSTANDING ON PORT STATE CONTROL IN THE ASIA-PACIFIC REGION
14
life-saving appliances related deficiencies were recorded, representing approximately 50% of the total number of deficiencies. The fire safety measures related deficiencies increased by 2,408 in number or 13% in 2012. The significant rise of deficiencies on fire safety measures is a reflection of the topic of the CIC of the year.
OVERVIEW OF PORT STATE CONTROL RESULTS 2002 – 2012
Figures 8-13 show the comparison of port State inspection results for 2002- 2012. These figures indicate the trends in port State activities and ship performance over the past eleven years.

MEMORANDUM OF UNDERSTANDING ON PORT STATE CONTROL IN THE ASIA-PACIFIC REGION
15
Figure 1: INSPECTION PERCENTAGE
Figure 2: PORT STATE INSPECTIONS - CONTRIBUTION BY AUTHORITIES
Total ships inspected: 16,439Percentage: 68%
Total individual ship visited: 24,019
Australia 3,179; 10.28%
Canada 487; 1.57%
China 8,321; 26.90%
Hong Kong, China 743; 2.40%
Indonesia 2,673; 8.64%
Japan 5,193; 16.79%
Republic of Korea 2,350; 7.60%
Malaysia 892; 2.88%
New Zealand 476; 1.54%
Papua New Guinea 70; 0.23% Russian Federation 1,081; 3.50%
Singapore 779; 2.52%
Thailand 456; 1.47%
Total inspections: 30,929
Viet Nam 1,290; 4.17%
Chile 907; 2.93%
Philippines 2,004; 6.48%
Fiji 28; 0.09%

MEMORANDUM OF UNDERSTANDING ON PORT STATE CONTROL IN THE ASIA-PACIFIC REGION
16
Figure 3: TYPE OF SHIP INSPECTED
Figure 4: DETENTIONS PER FLAG
Flags: 1. Tanzania 2. Saint Kitts and Nevis 3. Indonesia 4. Korea, Dem. People’s Rep. 5. Sierra Leone 6. Bangladesh 7. Cambodia 8. Mongolia 9. Egypt 10. Belize 11. Thailand 12. Tuvalu 13. Togo 14. Kiribati 15. Viet Nam 16. Antigua and Barbuda 17. Philippines 18. India 19. Denmark 20. Italy 21. Germany 22. Taiwan, China 23. Russian Federation Note: Flags listed above are those flags the ships of which were involved in at least 20 port State inspections and detention percentage of which are above the regional average detention percentage. The complete information on detentions by flag is given in Table 3.
Per
cen
tag
e
oil tanker/combination carrier: 2,072; 6.70%
chemical tanker: 2,016; 6.52%
gas carrier: 596; 1.93%
bulk carrier: 10,389; 33.59%
ro-ro/container/vehicle ship: 5,759; 18.62%
general dry cargo ship: 7,807; 25.24%
refrigerated cargo carrier: 811; 2.62%
passenger ship/ferry: 337; 1.09%
other types: 1,142; 3.69%
0
10
20
1 2 3 4 5 6 7 8 9 10 11 12 13 14 15 16 17 18 19 20 21 22 23
Detention percentage
Regional average: 4.59%
Detention: 5 Percentage: 20.83%
6 18.18%
31 17.32%
16 12.31% 41
9.98%
14 6.48%
2 10.00%
14 5.32%
Flags
35 17.07%
40 15.50%
54 6.88% 8
6.02%
29 9.35%
17 8.02% 37
6.60% 9 5.36%
2 8.70%
5 4.81%
240 14.50%
7 6.31%
7 14.89%
13 9.15%
14 4.61%

MEMORANDUM OF UNDERSTANDING ON PORT STATE CONTROL IN THE ASIA-PACIFIC REGION
17
Figure 5: DETENTION PER SHIP TYPE
Figure 6: DEFICIENCIES BY MAIN CATEGORIES
3.77
2.67
6.29
7.99
3.18
3.8
2.63
2.85
2.22Oil tanker/combination carrier
Gas carrier
Chemical tanker
Bulk carrier
Ro-ro/conrainer/vehicle ship
General dry cargo ship
Refrigerated cargo carrier
Passenger ship/ferry
Other types
Detention percentage
Average detention percentage: 4.59%
life saving appliances12,070; 12.03%
fire safety measures 20,522; 20.45%
stability, structure and relevant equipment 3,593; 3.58%
load lines 6,753; 6.73%
safety of navigation17,124; 17.07%
others 36,976; 36.85%
ISM related deficiencies 3,292; 3.28%

MEMORANDUM OF UNDERSTANDING ON PORT STATE CONTROL IN THE ASIA-PACIFIC REGION
18
Figure 7: MOST FREQUENT DETAINABLE DEFICIENCIES
155
125
113
96
96
89
76
74
155
98
Fire-dampers (Fire safety)
Lifeboats (Life savingappliances)
Emergency fire pump andits pipes (Fire safety)
Oil filtering equipment(MARPOL Annex I)
Maintenance of the shipand equipment (ISM)
Resources and personnel(ISM)
Shipboard operations (ISM)
Endorsement by flag State(Crew Certificates)
Fire detection and alarmsystem (Fire safety)
Fixed fire extinguishinginstallation (Fire safety)

MEMORANDUM OF UNDERSTANDING ON PORT STATE CONTROL IN THE ASIA-PACIFIC REGION
19
OVERVIEW OF PORT STATE CONTROL RESULTS 2002 - 2012
Figure 8: NO. OF INSPECTIONS
Figure 9: INSPECTION PERCENTAGE
Figure 10: NO. OF INSPECTIONS WITH DEFICIENCIES
19,588 20,12421,400 21,058 21,686 22,039 22,152 23,116
25,762
28,62730,929
0
5,000
10,000
15,000
20,000
25,000
30,000
2002 2003 2004 2005 2006 2007 2008 2009 2010 2011 2012
13,760 14,816 14,396 14,421 14,916 14,864 15,298 15,42216,575
18,650 19,250
0
5,000
10,000
15,000
20,000
2002 2003 2004 2005 2006 2007 2008 2009 2010 2011 2012
78% 77%
69% 70% 69%66%
63% 61%66% 68% 68%
0%
20%
40%
60%
80%
2002 2003 2004 2005 2006 2007 2008 2009 2010 2011 2012

MEMORANDUM OF UNDERSTANDING ON PORT STATE CONTROL IN THE ASIA-PACIFIC REGION
20
Figure 11: NO. OF DEFICIENCIES
Figure 12: NO. OF DETENTIONS
Figure 13: DETENTION PERCENTAGE
75,21084,119
73,163 74,66880,556
83,950 89,478 86,820 90,177103,549 100,330
0
20,000
40,000
60,000
80,000
100,000
2002 2003 2004 2005 2006 2007 2008 2009 2010 2011 2012
1,307
1,709
1,393
1,0971,171
1,238
1,528
1,3361,411
1,5621,421
0
500
1,000
1,500
2,000
2002 2003 2004 2005 2006 2007 2008 2009 2010 2011 2012
6.67%
8.49%
6.51%
5.21% 5.40% 5.62%
6.90%
5.78% 5.48%5.46%
4.59%
0.00%
2.00%
4.00%
6.00%
8.00%
2002 2003 2004 2005 2006 2007 2008 2009 2010 2011 2012

MEMORANDUM OF UNDERSTANDING ON PORT STATE CONTROL IN THE ASIA-PACIFIC REGION
21
ILO
147
**
-
25/0
5/9
3
- - -
28/1
1/8
0
-
31/0
5/8
3
- - - - -
07/0
5/9
1
- - - - -
06/0
7/0
4
- - -
28/1
1/8
1
CO
LR
EG
72
29/0
2/8
0
07/0
3/7
5
02/0
8/7
7
07/0
1/8
0
04/0
3/8
3
15/0
7/7
7
13/1
1/7
9
21/0
6/7
7
29/0
7/7
7
23/1
2/8
0
26/1
1/7
6
18/0
5/7
6
-
09/1
1/7
3
29/0
4/7
7
06/0
8/7
9
28/0
7/8
2
18/1
2/9
0
26
/04/
88
09/0
1/8
0
01
/05/
85
20/1
2/9
9
12/0
3/8
2
15/0
7/7
7
AF
S
200
1
09/0
1/0
7
08/0
4/1
0
-
07/0
3/11
- - -
08/0
7/0
3
24/0
7/0
8
27/0
9/1
0
- - -
19/1
0/1
2
31/1
2/0
9
-
20/0
8/0
8
- 09
/05/
08
- -
07/0
3/11
-
17/0
9/0
8
ST
CW
78
07/1
1/8
3
06/1
1/8
7
09/0
6/8
7
08/0
6/8
1
27/0
3/9
1
03/1
1/8
4
27/0
1/8
7
27/0
5/8
2
04/0
4/8
5
31/0
1/9
2
30/0
7/8
6
28/1
0/9
1
22/0
2/8
4
09/1
0/7
9
01/0
5/8
8
19/0
6/9
7
22/0
4/9
1
18/1
2/9
0
25
/04/
89
16/0
7/8
2
01
/05/
85
18/0
7/0
5
01/0
6/9
4
28/0
4/8
4
MA
RP
OL
73
/78
14/1
0/8
7
16/1
1/9
2
10/1
0/9
4
01/0
7/8
3
-
11/0
4/8
5
21/1
0/8
6
09/0
6/8
3
23/0
7/8
4
31/0
1/9
7
25/0
9/9
8
25/1
0/9
3
15/0
6/0
1
03/1
1/8
3
01/1
1/9
0
02/1
1/0
7
13/0
4/8
9
29/0
5/9
1
26
/04/
88
25/0
4/8
0
01
/05/
85
20/1
2/9
9
30/0
6/0
4
02/1
0/8
3
SO
LA
S
PR
OT
88
07
/02/
97
08/0
4/1
0
29/0
9/9
5
03/0
2/9
5
28/0
7/0
4
23/1
0/0
2
-
24/0
6/9
7
14/1
1/9
4
11/1
1/11
03/0
6/0
1
- -
18/0
8/0
0
10/0
8/9
9
-
14/0
9/9
2
27/0
5/0
2
16
/10/
95
21/0
8/0
9
08
/08/
01
24/0
6/0
5
-
03/0
2/0
0
SO
LA
S
PR
OT
78
17
/08/
83
-
15/0
7/9
2
17/1
2/8
2
28/0
7/0
4
14/1
1/8
1
23/0
8/8
8
15/0
5/8
0
02/1
2/8
2
19/1
0/8
3
23/0
2/9
0
- -
12/0
5/8
1
01/0
6/8
4
-
28/0
7/8
2
12/1
0/9
2
26
/04/
88
16/0
7/8
2
01
/05/
85
20/1
2/9
9
-
01/0
5/8
1
SO
LA
S
74
17/0
8/8
3
08/0
5/7
8
28/0
3/8
0
07/0
1/8
0
04/0
3/8
3
25/0
5/8
0
17/0
2/8
1
15/0
5/8
0
31/1
2/8
0
19/1
0/8
3
23/0
2/9
0
12/1
1/8
0
15/1
2/8
1
09/0
1/8
0
16/0
3/8
1
18/1
2/8
4
28/0
7/8
2
18/1
2/9
0
26
/04/
88
04/1
2/7
9
01
/05/
85
20/1
2/9
9
30/0
6/0
4
25/0
5/8
0
LO
AD
LIN
E
PR
OT
88
07
/02/
97
08/0
4/1
0
03/0
3/9
5
03/0
2/9
5
28/0
7/0
4
23/1
0/0
2
-
24/0
6/9
7
14/1
1/9
4
11/1
1/11
03/0
6/0
1
- -
18/0
8/0
0
18/0
8/9
9
-
26/1
1/9
0
27/0
5/0
2
29
/11/
94
24/0
6/0
9
08
/08/
01
11/1
0/1
0
-
03/0
2/0
0
LO
AD
LIN
E
66
29/0
7/6
8
14/0
1/7
0
10/0
3/7
5
05/1
0/7
3
29/1
1/7
2
16/0
8/7
2
17/0
1/7
7
15/0
5/6
8
10/0
7/6
9
12/0
1/7
1
05/0
2/7
0
18/0
5/7
6
04/0
3/6
9
04/0
7/6
6
21/0
9/7
1
30/1
2/9
2
28/0
7/8
2
18/1
2/9
0
26
/04/
88
18/0
1/6
7
18
/10/
89
18/0
7/0
5
30/0
6/0
4
21/0
7/6
8
TO
NN
AG
E
69
21/0
5/8
2
18/0
7/9
4
22/1
1/8
2
08/0
4/8
0
29/1
1/7
2
18/0
7/8
2
14/0
3/8
9
17/0
7/8
0
18/0
1/8
0
24/0
4/8
4
06/0
1/7
8
25/1
0/9
3
06/0
9/7
8
20/1
1/6
9
06/0
6/8
5
11/0
6/9
6
13/0
1/8
9
18/1
2/9
0
25
/04/
89
16/0
7/8
2
18
/10/
89
18/0
7/0
5
30/0
6/0
4
18/0
7/8
2
Au
tho
rity
Aus
tral
ia
Can
ada
Chi
le
Chi
na
Fiji
Hon
g K
ong,
Chi
na*
Indo
nes
ia
Japa
n
Rep
ubl
ic o
f Kor
ea
Mal
aysi
a
New
Zea
lan
d
Pap
ua
New
Gu
inea
Phi
lippi
nes
Rus
sia
n F
eder
atio
n
Sin
gap
ore
Tha
iland
Van
uat
u
Vie
t N
am
Mar
shal
l Isl
ands
Per
u
DP
R K
ore
a
Mac
ao, C
hin
a
Sol
omo
n Is
lan
ds
Ent
ry in
to f
orce
dat
e
AN
NE
X 1
STA
TU
S O
F T
HE
RE
LE
VA
NT
INS
TR
UM
EN
TS
Tab
le 1
: S
TAT
US
OF
TH
E R
EL
EV
AN
T IN
ST
RU
ME
NT
S
(Dat
e of
dep
osit
of in
stru
men
ts)
(A
s at
31
Dec
embe
r 20
12)
* E
ffect
ive
date
of e
xten
sio
n of
inst
rum
ents
. **
A
lthou
gh s
ome
Aut
horit
ies
have
not
rat
ified
the
ILO
Con
ven
tion
No.
147,
pa
rts
of t
he I
LO c
onve
ntio
ns r
efer
red
to t
here
in a
re im
plem
ent
ed u
nder
the
ir
natio
nal l
egis
latio
n an
d po
rt S
tate
con
trol
is c
arrie
d o
ut o
n m
atte
rs c
over
ed b
y th
e na
tiona
l reg
ulat
ions
.

MEMORANDUM OF UNDERSTANDING ON PORT STATE CONTROL IN THE ASIA-PACIFIC REGION
22
Table 1a: STATUS OF MARPOL 73/78
(Date of deposit of instruments)
(As at 31 December 2012)
Authority Annexes I & II Annex III Annex IV Annex V Annex VI
Australia 14/10/87 10/10/94 27/02/04 14/08/90 07/08/07
Canada 16/11/92 08/08/02 26/03/10 26/03/10 26/03/10
Chile 10/10/94 10/10/94 10/10/94 15/08/08 16/10/06
China 01/07/83 13/09/94 02/11/06 21/11/88 23/05/06
Fiji - - - - -
Hong Kong, China* 11/04/85 07/03/95 02/11/06 27/03/96 20/03/08
Indonesia 21/10/86 24/08/12 24/08/12 24/08/12 -
Japan 09/06/83 09/06/83 09/06/83 09/06/83 15/02/05
Republic of Korea 23/07/84 28/02/96 28/11/03 28/02/96 20/04/06
Malaysia 31/01/97 27/09/10 27/09/10 31/01/97 27/09/10
New Zealand 25/09/98 25/09/98 - 25/09/98 -
Papua New Guinea 25/10/93 25/10/93 25/10/93 25/10/93 -
Philippines 15/06/01 15/06/01 15/06/01 15/06/01 -
Russian Federation 03/11/83 14/08/87 14/08/87 14/08/87 -
Singapore 01/11/90 02/03/94 01/05/05 27/05/99 10/08/00
Thailand 02/11/07 - - - -
Vanuatu 13/04/89 22/04/91 15/03/04 22/04/91 15/03/04
Viet Nam 29/05/91 - - - -
Marshall Islands 26/04/88 26/04/88 26/04/88 26/04/88 07/03/02
Peru 25/04/80 25/04/80 25/04/80 25/04/80 -
DPR Korea 01/05/01 01/05/01 01/05/01 01/05/01 -
Macao, China 20/12/99 20/12/99 02/11/06 20/12/99 23/05/06
Solomon Islands 30/06/04 30/06/04 30/06/04 30/06/04 -
Entry into force date 02/10/1983 01/07/1992 27/09/2003 31/12/1988 19/05/2005
* Effective date of extension of instruments.

MEMORANDUM OF UNDERSTANDING ON PORT STATE CONTROL IN THE ASIA-PACIFIC REGION
23
ANNEX 2
PORT STATE INSPECTION STATISTICS
STATISTICS FOR 2012
Table 2: PORT STATE INSPECTIONS CARRIED OUT BY AUTHORITIES
Au
tho
rity
No
. o
f in
div
idu
al
ship
s in
spec
ted
(a
)
No
. o
f in
itia
l an
d
follo
w-u
p i
nsp
ecti
on
s (b
+c)
No
. o
f in
itia
l in
spec
tio
ns
(b)
No
. o
f fo
llow
-up
in
spec
tio
ns
(c)
No
. of
insp
ecti
on
s w
ith
def
icie
nci
es
(d)
No
. of
def
icie
nci
es 1
)
(e)
No
. o
f d
eten
tio
ns
1)
(f)
No
. o
f in
div
idu
al
ship
s vi
site
d 2)
(g)
Insp
ecti
on
rat
e (a
/g%
)
Det
enti
on
per
cen
tag
e
(f/b
%)
Australia3) 2,842 4,120 3,179 941 1,678 7,770 210 5,443 52.21 6.61
Canada4) 483 487 487 0 292 993 7 1,744 27.69 1.44
Chile 842 1,213 907 306 402 994 16 1,837 45.84 1.76
China 6,356 9,464 8,321 1,143 7,002 45,364 596 14,808 42.92 7.16
Fiji 26 38 28 10 2 2 0 161 16.15 0
Hong Kong, China 724 783 743 40 600 3,001 34 4,743 15.26 4.58
Indonesia 2,318 3,039 2,673 366 757 3,783 67 6,462 35.87 2.51
Japan 3,573 6,259 5,193 1,066 3,371 16,340 237 7,595 47.04 4.56
Republic of Korea 1,995 2,854 2,350 504 1,673 6,937 113 9,433 21.15 4.81
Malaysia 786 1,062 892 170 403 1,365 12 6,596 11.92 1.35
New Zealand 404 669 476 193 263 866 16 910 44.40 3.36
Papua New Guinea 68 87 70 17 24 78 0 319 21.32 0
Philippines 1,529 2,394 2,004 390 458 1,684 3 2,164 70.66 0.15
Russian Federation4) 756 2,085 1,081 1,004 771 4,184 28 1,492 50.67 2.59
Singapore 600 1,349 779 570 696 3,322 44 12,596 4.76 5.65
Thailand 372 498 456 42 99 250 1 3,583 10.38 0.22
Vanuatu 0 0 0 0 0 0 0 3 0 0
Viet Nam 1,067 1,689 1,290 399 759 3,397 37 2,508 42.54 2.87
Total 16,439 38,090 30,929 7,161 19,250 100,330 1,421 Regional 24,019
Regional68%
Regional4.59%
1) Numbers of deficiencies and detentions do not include those related to security. 2) LLI data for 2012. 3) Data for Australia is also provided to Indian Ocean MOU. 4) Data are only for the Pacific ports.

MEMORANDUM OF UNDERSTANDING ON PORT STATE CONTROL IN THE ASIA-PACIFIC REGION
24
Table 2a: PORT STATE INSPECTIONS ON MARITME SECURITY
Au
tho
rity
No
. of
insp
ecti
on
s
No
. of
insp
ecti
on
s w
ith
sec
uri
ty
rela
ted
d
efic
ien
cies
No
. of
secu
irty
re
late
d
def
icie
nci
es
No
. of
secu
rity
re
late
d
det
enti
on
s
Det
enti
on
p
erce
nta
ge
(%)
Australia 3,179 5 5 0 0
Canada 487 4 4 0 0
Chile 907 14 14 0 0
China 8,321 804 961 18 0.22
Fiji 28 0 0 0 0
Hong Kong, China 743 130 137 2 0.27
Indonesia 2,673 20 22 0 0
Japan 5,193 328 385 1 0.02
Republic of Korea 2,350 306 510 9 0.38
Malaysia 892 37 44 2 0.22
New Zealand 476 5 5 0 0
Papua New Guinea 70 1 1 0 0
Philippines 2,004 24 24 0 0
Russian Federation 1,081 82 87 1 0.09
Singapore 779 188 200 0 0
Thailand 456 7 7 0 0
Vanuatu 0 0 0 0 0
Viet Nam 1,290 78 84 0 0
Total 30,929 2,033 2,490 33 Regional
0.11%
Note: Security related data showing in the above table and the tables of deficiency by category are
excluded from all other statistical tables and figures in this report.

MEMORANDUM OF UNDERSTANDING ON PORT STATE CONTROL IN THE ASIA-PACIFIC REGION
25
Table 3: PORT STATE INSPECTIONS PER FLAG
Flag
No. of inspections
No. of inspections
with deficiencies
No. of deficiencies
No. of detentions
Detention percentage
%
Antigua and Barbuda 561 365 1,614 37 6.60 Argentina 3 2 7 0 0 Australia 6 4 9 0 0 Bahamas 701 341 1,317 18 2.57 Bahrain 2 2 12 0 0 Bangladesh 47 41 272 7 14.89 Barbados 19 13 42 1 5.26 Belgium 29 15 42 1 3.45 Belize 411 375 2,742 41 9.98 Bermuda (UK) 72 37 135 2 2.78 Brazil 4 4 32 1 25.00 Brunei Darussalam 6 2 7 0 0 Cambodia 1,655 1,621 12,463 240 14.50 Canada 1 0 0 0 0 Cayman Islands (UK) 117 39 104 2 1.71 Chile 3 3 10 0 0 China 920 458 2,023 8 0.87 Comoros 8 8 57 1 12.50 Cook Islands 9 6 23 1 11.11 Croatia 25 17 92 1 4.00 Curacao 28 16 65 0 0 Cyprus 495 276 1,120 21 4.24 Denmark 133 67 259 8 6.02 Dominica 13 9 65 0 0 Ecuador 4 4 16 0 0 Egypt 20 15 94 2 10.00 Equatorial Guinea 3 3 35 1 33.33 Ethiopia 4 4 16 1 25.00 Falkland Islands (UK) 1 1 3 0 0 Finland 4 3 6 0 0 France 45 24 74 1 2.22 Georgia 3 3 29 0 0 Germany 263 183 753 14 5.32 Gibraltar (UK) 59 31 103 1 1.69 Greece 319 155 587 8 2.51 Honduras 11 11 62 1 9.09 Hong Kong, China 2,831 1,440 6,073 24 0.85 Iceland 1 1 2 0 0 India 111 57 345 7 6.31

MEMORANDUM OF UNDERSTANDING ON PORT STATE CONTROL IN THE ASIA-PACIFIC REGION
26
Flag
No. of inspections
No. of inspections
with deficiencies
No. of deficiencies
No. of detentions
Detention percentage
%
Indonesia 179 164 1,208 31 17.32 Iran 3 3 14 0 0 Ireland 1 0 0 0 0 Isle of Man (UK) 186 84 356 4 2.15 Israel 5 4 27 2 40.00 Italy 168 88 383 9 5.36 Jamaica 13 10 37 2 15.38 Japan 168 85 366 3 1.79 Jordan 1 0 0 0 0 Kiribati 212 180 1,380 17 8.02 Korea, Democratic People's Republic
205 204 1,993 35 17.07
Korea, Republic of 1,367 1,022 5,148 8 0.59 Kuwait 17 9 42 0 0 Lao, People's Democratic Republic
1 0 0 0 0
Liberia 2,278 1,279 5,388 88 3.86 Libyan Arab Jamahiriya 6 2 10 0 0 Lithuania 3 1 5 0 0 Luxembourg 17 7 17 1 5.88 Malaysia 234 134 784 8 3.42 Maldives 12 9 62 0 0 Malta 740 436 1,883 26 3.51 Marshall Islands 1,492 762 3,077 42 2.82 Moldova 3 3 22 0 0 Mongolia 130 118 854 16 12.31 Myanmar 5 4 26 0 0 Netherlands 156 103 392 6 3.85 New Zealand 1 1 3 0 0 Nigeria 1 1 10 0 0 Norway 260 124 482 5 1.92 Pakistan 7 4 15 0 0 Palau 1 0 0 0 0 Panama 9,189 5,646 28,847 417 4.54 Papua New Guinea 14 13 152 5 35.71 Peru 4 4 32 1 25.00 Philippines 216 145 836 14 6.48 Portugal 8 3 24 1 12.50 Qatar 4 3 16 0 0 Russian Federation 304 269 1,409 14 4.61 Saint Kitts and Nevis 33 29 212 6 18.18

MEMORANDUM OF UNDERSTANDING ON PORT STATE CONTROL IN THE ASIA-PACIFIC REGION
27
Flag
No. of inspections
No. of inspections
with deficiencies
No. of deficiencies
No. of detentions
Detention percentage
%
Saint Vincent and the Grenadines
184 165 973 8 4.35
Samoa 4 3 10 0 0 Saudi Arabia 26 14 31 0 0 Sierra Leone 258 244 2,249 40 15.50 Singapore 1,901 874 3,563 28 1.47 Spain 1 1 2 0 0 Sri Lanka 8 8 28 1 12.50 Sweden 29 5 20 1 3.45 Switzerland 28 12 47 1 3.57 Taiwan, China 104 54 275 5 4.81 Tanzania 24 22 191 5 20.83 Thailand 310 227 1,432 29 9.35 Togo 23 22 165 2 8.70 Tonga 12 11 62 1 8.33 Tunisia 1 1 2 0 0 Turkey 51 26 110 2 3.92 Tuvalu 142 119 765 13 9.15 Ukraine 1 1 5 0 0 United Arab Emirates (UAE) 3 2 3 0 0 United Kingdom (UK) 262 146 506 11 4.20 United States 62 36 136 2 3.23 Vanuatu 115 81 373 4 3.48 Viet Nam 785 564 3,130 54 6.88 Ship's registration withdrawn 4 3 30 3 75.00
Total 30,929 19,250 100,330 1,421 Regional
4.59

MEMORANDUM OF UNDERSTANDING ON PORT STATE CONTROL IN THE ASIA-PACIFIC REGION
28
Table 4: PORT STATE INSPECTIONS PER SHIP TYPE
Type of ship
No. of inspections
No. of inspections
with deficiencies
No. of deficiencies
No. of detentions
Detention percentage
%
NLS tanker 54 29 126 3 5.56 Combination carrier 45 17 65 2 4.44 Oil tanker 1,973 820 3,552 41 2.08 Gas carrier 596 299 1,437 17 2.85 Chemical tanker 2,016 1,088 5,179 53 2.63 Bulk carrier 10,389 5,825 28,028 395 3.80 Vehicle carrier 876 345 1,028 10 1.14 Container ship 4,685 2,835 11,549 154 3.29 Ro-Ro cargo ship 198 151 963 19 9.60 General cargo/multi-purpose ship 7,807 6,327 40,881 624 7.99 Refrigerated cargo carrier 811 576 2,844 51 6.29 Woodchip carrier 245 145 553 6 2.45 Livestock carrier 45 31 200 3 6.67 Ro-Ro passenger ship 90 78 549 4 4.44 Passenger ship 247 155 794 5 2.02 Factory ship 2 1 2 0 0 Heavy load carrier 108 69 285 7 6.48 Offshore service vessel 157 77 412 6 3.82 MODU & FPSO 5 4 30 0 0 High speed passenger craft 26 23 71 1 3.85 Special purpose ship 54 25 115 2 3.70 Tugboat 220 133 663 4 1.82 Others 280 197 1,004 14 5.00 Total 30,929 19,250 100,330 1,421 4.59
MEMORANDUM OF UNDERSTANDING ON PORT STATE CONTROL IN THE ASIA-PACIFIC REGION
29
Table 5: PORT STATE INSPECTIONS PER RECOGNIZED ORGANIZATION
Recognized organization (RO)
No
. of
ove
rall
insp
ecti
on
s
No
. of
ove
rall
det
enti
on
s
No
. of
RO
re
spo
nsi
ble
d
eten
tio
ns
Det
enti
on
p
erce
nta
ge%
RO
res
po
nsi
ble
d
eten
tio
n
per
cen
tag
e%
Per
cen
tag
e o
f R
O r
esp
on
sib
le
det
enti
on
s%
American Bureau of Shipping 3,160 96 6 3.04 0.19 6.25 Belize Maritime Bureau Inc. 5 0 0 0 0 0 Biro Klasifikasi Indonesia 101 21 2 20.79 1.98 9.52 Bulgarski Koraben Registar 2 0 0 0 0 0 Bureau Securitas 14 1 0 7.14 0 0 Bureau Veritas 3,234 148 10 4.58 0.31 6.76 Ceskoslovensky Lodin Register 2 0 0 0 0 0 China Classification Society 2,797 29 1 1.04 0.04 3.45 China Corporation Register of Shipping 321 21 0 6.54 0 0 Compania Nacional de Registro e Inspeccion de Naves
1 0 0 0 0 0
Cosmos Marine Bureau 11 1 0 9.09 0 0 Croatian Register of Shipping 34 1 1 2.94 2.94 100.00 Cyprus Bureau of Shipping 4 0 0 0 0 0 Det Norske Veritas 3,552 84 5 2.36 0.14 5.95 Ferriby Marine 2 0 0 0 0 0 Fidenavis SA 12 1 0 8.33 0 0 Germanischer Lloyd 3,287 153 7 4.65 0.21 4.58 Global Marine Bureau 469 74 8 15.78 1.71 10.81 Global Shipping Bureau 8 2 1 25.00 12.50 50.00 Hellenic Register of Shipping 1 0 0 0 0 0 Honduras Bureau of Shipping 1 0 0 0 0 0 Honduras International Surveying and Inspection Bureau
2 0 0 0 0 0
INCLAMAR (Inspection y Classification Maritime, S. de. R.L.)
41 6 0 14.63 0 0
Indian Register of Shipping 110 7 0 6.36 0 0 Intermaritime Certification Services, S.A. 393 30 7 7.63 1.78 23.33 International Naval Surveys Bureau 67 6 1 8.96 1.49 16.67 International Register of Shipping 331 47 2 14.20 0.60 4.26 International Ship Classification 299 29 5 9.70 1.67 17.24 Isthmus Bureau of Shipping 509 58 10 11.39 1.96 17.24 Korea Classification Society (former Joson Classification Society)
223 35 3 15.70 1.35 8.57
Korea Ship Safety Technology Authority 44 0 0 0 0 0 Korean Register of Shipping 2,763 48 1 1.74 0.04 2.08 Lloyd's Register 3,804 104 5 2.73 0.13 4.81 Macosnar Corporation 14 0 0 0 0 0

MEMORANDUM OF UNDERSTANDING ON PORT STATE CONTROL IN THE ASIA-PACIFIC REGION
30
Recognized organization (RO)
No
. of
ove
rall
insp
ecti
on
s
No
. of
ove
rall
det
enti
on
s
No
. of
RO
re
spo
nsi
ble
d
eten
tio
ns
Det
enti
on
p
erce
nta
ge%
RO
res
po
nsi
ble
d
eten
tio
n
per
cen
tag
e%
Per
cen
tag
e o
f R
O r
esp
on
sib
le
det
enti
on
s%
Marconi International Marine Company Ltd.
3 0 0 0 0 0
Maritime Lloyd Ltd, Georgia 17 0 0 0 0 0 Maritime Technical Systems and Services 34 2 0 5.88 0 0 National Cargo Bureau Inc. 1 0 0 0 0 0 National Shipping Adjusters Inc 39 5 0 12.82 0 0 New United International Marine Services Ltd
7 0 0 0 0 0
Nippon Kaiji Kyokai 9,538 327 11 3.43 0.12 3.36 Overseas Marine Certification Services 299 37 2 12.37 0.67 5.41 Panama Bureau of Shipping 35 3 0 8.57 0 0 Panama Marine Survey and Certification Services, Inc.
2 1 0 50.00 0 0
Panama Maritime Documentation Services 498 44 1 8.84 0.20 2.27 Panama Maritime Surveyors Bureau Inc 13 2 0 15.38 0 0 Panama Register Corporation 44 6 0 13.64 0 0 Panama Shipping Certificate Inc. 2 0 0 0 0 0 Panama Shipping Registrar Inc. 143 17 2 11.89 1.40 11.76 Phoenix Register of Shipping 3 1 0 33.33 0 0 Polski Rejestr Statkow 17 0 0 0 0 0 Registro Brasileiro de Navios de Aeronaves
1 0 0 0 0 0
Registro Internacional Naval S.A. 15 1 0 6.67 0 0 Registro Italiano Navale 753 29 0 3.85 0 0 RINAVE Portuguesa 11 1 0 9.09 0 0 Russian Maritime Register of Shipping 498 27 0 5.42 0 0 Ship Classification Malaysia 6 0 0 0 0 0 Shipping Register of Ukraine 1 0 0 0 0 0 SingClass International Pte Ltd 15 2 0 13.33 0 0 Sing-Lloyd 31 4 2 12.90 6.45 50.00 Turkish Lloyd 3 0 0 0 0 0 Union Bureau of Shipping 1,061 149 17 14.04 1.60 11.41 Universal Maritime Bureau 270 33 4 12.22 1.48 12.12 Universal Shipping Bureau 81 13 1 16.05 1.23 7.69 Vietnam Register 824 55 4 6.67 0.49 7.27 Other 368 50 4 13.59 1.09 8.00 Note: The number of overall inspections and overall detentions is calculated corresponding to each recognized organization (RO) that issued statutory certificate(s) for a ship. In case that ship’s certificates were issued by more than one ROs, the inspection and detention would be counted to each of them.

MEMORANDUM OF UNDERSTANDING ON PORT STATE CONTROL IN THE ASIA-PACIFIC REGION
31
Table 6: DEFICIENCIES BY CATEGORIES
Nature of deficiencies
No. of deficiencies
Certificate & Documentation Crew Certificates 1,275 Documents 5,359 Ship Certificates 2,754
Structural Conditions 3,593 Water/Weathertight conditions 6,753 Emergency Systems 5,628 Radio Communications 2,987 Cargo operations including equipment 675 Fire safety 20,522 Alarms 798
Working and Living Conditions Living Conditions 672 Working Conditions 4,496
Safety of Navigation 17,124 Life saving appliances 12,070 Dangerous goods 241 Propulsion and auxiliary machinery 5,470
Pollution prevention
Anti Fouling 16 MARPOL Annex I 2,335 MARPOL Annex II 27 MARPOL Annex III 17 MARPOL Annex IV 1,013 MARPOL Annex V 981 MARPOL Annex VI 796
ISM 3,292 Other 1,436 Total 100,330 ISPS 2,490 Grand total 102,820

MEMORANDUM OF UNDERSTANDING ON PORT STATE CONTROL IN THE ASIA-PACIFIC REGION
32
SUMMARY OF PORT STATE INSPECTION DATA 2010 – 2012
Table 7: BLACK – GREY – WHITE LISTS *
Flag Inspections
2010-2012
Detentions
2010-2012
Black to Grey
Limit
Grey to White
Limit
Excess
Factor
BLACK LIST
Papua New Guinea 36 11 6 4.84
Sierra Leone 708 127 61 3.87
Cambodia 5,131 814 390 3.68
Georgia 109 23 13 3.67
Korea, Democratic People's Republic 513 90 46 3.62
Tanzania 38 9 6 3.10
Mongolia 416 60 38 2.57
Indonesia 577 80 51 2.53
Saint Kitts and Nevis 152 24 16 2.42
Bangladesh 94 15 11 2.09
Tonga 38 7 6 1.79
Kiribati 570 63 50 1.67
Thailand 1,017 102 85 1.52
Viet Nam 2,163 200 171 1.42
Belize 1,117 96 93 1.09
GREY LIST
Barbados 72 8 9 1 0.86
Tuvalu 421 35 39 20 0.80
Dominica 47 5 7 0 0.75
Egypt 49 5 7 0 0.73
Luxembourg 44 3 6 0 0.49
Turkey 176 11 18 6 0.39
Myanmar 39 2 6 0 0.38
Togo 40 2 6 0 0.37
Belgium 91 5 11 2 0.35
Curacao 66 3 9 1 0.29
Gibraltar (UK) 171 9 18 6 0.25
Kuwait 41 1 6 0 0.21
Switzerland 71 2 9 1 0.13
Antigua and Barbuda 1,647 102 133 98 0.12
Saudi Arabia 58 1 8 0 0.09
Croatia 84 2 10 2 0.05
India 336 16 32 15 0.04
WHITE LIST
Maldives 33 0 0 0

MEMORANDUM OF UNDERSTANDING ON PORT STATE CONTROL IN THE ASIA-PACIFIC REGION
33
Flag Inspections
2010-2012
Detentions
2010-2012
Black to Grey
Limit
Grey to White
Limit
Excess
Factor
Philippines 644 33 34 -0.06
Taiwan, China 255 10 11 -0.11
Italy 457 21 23 -0.13
Sweden 79 1 1 -0.20
Cyprus 1,495 76 88 -0.29
Netherlands 436 18 21 -0.29
Malta 2,001 94 121 -0.48
Saint Vincent and the Grenadines 687 27 37 -0.53
Malaysia 755 29 41 -0.59
United States 153 3 5 -0.60
Russian Federation 900 35 50 -0.62
Panama 25,833 1,267 1740 -0.62
Denmark 393 12 19 -0.68
United Kingdom (UK) 767 25 42 -0.82
Germany 820 27 45 -0.82
France 146 2 5 -0.83
Liberia 6,055 239 391 -0.87
Vanuatu 335 8 15 -0.88
Greece 943 29 53 -0.93
Cayman Islands (UK) 296 6 13 -0.97
Marshall Islands 3,524 114 221 -1.08
Bermuda (UK) 213 3 8 -1.08
Isle of Man (UK) 435 9 21 -1.12
Bahamas 1,976 57 119 -1.14
Norway 715 17 38 -1.14
Singapore 4,945 110 316 -1.47
Japan 429 5 21 -1.52
Hong Kong, China 6,855 89 445 -1.82
Korea, Republic of 3,858 45 243 -1.84
China 2,303 17 141 -1.96
Note: 1) Flags listed above are those of ships which were involved in 30 or more port State
inspections over the 3-year period. 2) According to the decision by the Port State Control Committee, flags involving 30-49
port State inspections with nil detentions are listed on top of the White List. * See explanatory note on page 51. p=7%
z95%=1.645
q=3%

MEMORANDUM OF UNDERSTANDING ON PORT STATE CONTROL IN THE ASIA-PACIFIC REGION
34
Table 8: INSPECTIONS AND DETENTIONS PER FLAG
Number of inspections Number of detentions 3-year rolling
average detention
%
Flag 2010 2011 2012 Total 2010 2011
2012
Total
Algeria 5 3 0 8 0 1 0 1 12.50
Antigua and Barbuda 541 545 561 1,647 24 41 37 102 6.19
Argentina 6 3 3 12 0 0 0 0 0
Australia 9 7 6 22 0 0 0 0 0
Bahamas 610 665 701 1,976 15 24 18 57 2.88
Bahrain 2 1 2 5 0 0 0 0 0
Bangladesh 14 33 47 94 4 4 7 15 15.96
Barbados 23 30 19 72 4 3 1 8 11.11
Belgium 23 39 29 91 2 2 1 5 5.49
Belize 358 348 411 1,117 34 21 41 96 8.59
Bermuda (UK) 68 73 72 213 0 1 2 3 1.41
Bolivia 3 1 0 4 1 0 0 1 25.00
Brazil 4 3 4 11 1 1 1 3 27.27
Brunei Darussalam 7 5 6 18 0 0 0 0 0
Bulgaria 4 1 0 5 1 0 0 1 20.00
Cambodia 1,649 1,827 1,655 5,131 266 308 240 814 15.86
Canada 0 0 1 1 0 0 0 0 0
Cayman Islands (UK) 84 95 117 296 2 2 2 6 2.03
Chile 0 1 3 4 0 0 0 0 0
China 676 707 920 2,303 8 1 8 17 0.74
Comoros 9 12 8 29 3 2 1 6 20.69
Cook Islands 12 6 9 27 0 0 1 1 3.70
Croatia 31 28 25 84 1 0 1 2 2.38
Curacao 15 23 28 66 1 2 0 3 4.55
Cyprus 500 500 495 1,495 27 28 21 76 5.08
Denmark 132 128 133 393 1 3 8 12 3.05
Dominica 20 14 13 47 3 2 0 5 10.64
Ecuador 2 2 4 8 0 1 0 1 12.50
Egypt 11 18 20 49 1 2 2 5 10.20
Equatorial Guinea 0 3 3 6 0 0 1 1 16.67
Ethiopia 6 7 4 17 0 1 1 2 11.76
Falkland Islands (UK) 0 3 1 4 0 0 0 0 0
Fiji 0 1 0 1 0 0 0 0 0
Finland 0 0 4 4 0 0 0 0 0
France 54 47 45 146 1 0 1 2 1.37

MEMORANDUM OF UNDERSTANDING ON PORT STATE CONTROL IN THE ASIA-PACIFIC REGION
35
Number of inspections Number of detentions 3-year rolling
average detention
%
Flag 2010 2011 2012 Total 2010 2011
2012
Total
Georgia 67 39 3 109 14 9 0 23 21.10
Germany 279 278 263 820 5 8 14 27 3.29
Gibraltar (UK) 61 51 59 171 5 3 1 9 5.26
Greece 291 333 319 943 10 11 8 29 3.08
Honduras 1 1 11 13 0 0 1 1 7.69
Hong Kong, China 1,765 2,259 2,831 6,855 29 36 24 89 1.30
Iceland 0 0 1 1 0 0 0 0 0
India 101 124 111 336 2 7 7 16 4.76
Indonesia 205 193 179 577 25 24 31 80 13.86
Iran 5 5 3 13 0 0 0 0 0
Ireland 0 3 1 4 0 0 0 0 0
Isle of Man (UK) 107 142 186 435 2 3 4 9 2.07
Israel 5 5 5 15 0 0 2 2 13.33
Italy 137 152 168 457 7 5 9 21 4.6
Jamaica 2 5 13 20 1 0 2 3 15
Japan 107 154 168 429 2 0 3 5 1.17
Jordan 1 0 1 2 0 0 0 0 0
Kiribati 193 165 212 570 28 18 17 63 11.05
Korea, Democratic People's Republic 140 168 205 513 15 40 35 90 17.54
Korea, Republic of 1,179 1,312 1,367 3,858 23 14 8 45 1.17
Kuwait 11 13 17 41 0 1 0 1 2.44
Lao, People's Democratic Republic 0 0 1 1 0 0 0 0 0
Latvia 1 0 0 1 0 0 0 0 0
Liberia 1,758 2,019 2,278 6,055 66 85 88 239 3.95
Libyan Arab Jamahiriya 7 1 6 14 0 0 0 0 0
Lithuania 5 1 3 9 1 0 0 1 11.11
Luxembourg 9 18 17 44 1 1 1 3 6.82
Malaysia 239 282 234 755 9 12 8 29 3.84
Maldives 10 11 12 33 0 0 0 0 0
Malta 554 707 740 2,001 29 39 26 94 4.7
Marshall Islands 923 1,109 1,492 3,524 32 40 42 114 3.23
Mauritius 0 2 0 2 0 0 0 0 0
Mexico 0 1 0 1 0 0 0 0 0
Moldova 2 6 3 11 0 0 0 0 0
Mongolia 150 136 130 416 28 16 16 60 14.42
Myanmar 19 15 5 39 1 1 0 2 5.13

MEMORANDUM OF UNDERSTANDING ON PORT STATE CONTROL IN THE ASIA-PACIFIC REGION
36
Number of inspections Number of detentions 3-year rolling
average detention
%
Flag 2010 2011 2012 Total 2010 2011
2012
Total
Netherlands 141 139 156 436 8 4 6 18 4.13
New Zealand 2 2 1 5 0 0 0 0 0
Nigeria 1 0 1 2 0 0 0 0 0
Norway 228 227 260 715 5 7 5 17 2.38
Pakistan 6 7 7 20 0 0 0 0 0
Palau 0 0 1 1 0 0 0 0 0
Panama 7,952 8,692 9,189 25,833 418 432 417 1,267 4.90
Papua New Guinea 12 10 14 36 4 2 5 11 30.56
Peru 1 1 4 6 0 0 1 1 16.67
Philippines 213 215 216 644 8 11 14 33 5.12
Poland 1 0 0 1 0 0 0 0 0
Portugal 7 6 8 21 1 0 1 2 9.52
Qatar 10 5 4 19 0 0 0 0 0
Romania 0 1 0 1 0 0 0 0 0
Russian Federation 320 276 304 900 12 9 14 35 3.89
Saint Helena (UK) 0 1 0 1 0 0 0 0 0
Saint Kitts and Nevis 64 55 33 152 11 7 6 24 15.79
Saint Vincent and the Grenadines 265 238 184 687 11 8 8 27 3.93
Samoa 7 2 4 13 0 0 0 0 0
Saudi Arabia 12 20 26 58 1 0 0 1 1.72
Seychelles 2 0 0 2 0 0 0 0 0
Sierra Leone 167 283 258 708 35 52 40 127 17.94
Singapore 1,380 1,664 1,901 4,945 38 44 28 110 2.22
Slovakia 3 0 0 3 1 0 0 1 33.33
Solomon Islands 3 1 0 4 0 0 0 0 0
Spain 1 4 1 6 0 0 0 0 0
Sri Lanka 7 7 8 22 0 0 1 1 4.55
Sweden 30 20 29 79 0 0 1 1 1.27
Switzerland 22 21 28 71 0 1 1 2 2.82
Syrian Arab Republic 1 0 0 1 0 0 0 0 0
Taiwan, China 68 83 104 255 2 3 5 10 3.92
Tanzania 3 11 24 38 2 2 5 9 23.68
Thailand 349 358 310 1,017 35 38 29 102 10.03
Togo 8 9 23 40 0 0 2 2 5
Tonga 14 12 12 38 1 5 1 7 18.42
Tunisia 2 1 1 4 0 0 0 0 0

MEMORANDUM OF UNDERSTANDING ON PORT STATE CONTROL IN THE ASIA-PACIFIC REGION
37
Number of inspections Number of detentions 3-year rolling
average detention
%
Flag 2010 2011 2012 Total 2010 2011
2012
Total
Turkey 60 65 51 176 6 3 2 11 6.25
Tuvalu 160 119 142 421 14 8 13 35 8.31
Ukraine 1 2 1 4 0 0 0 0 0
United Arab Emirates (UAE) 6 5 3 14 0 0 0 0 0
United Kingdom (UK) 236 269 262 767 4 10 11 25 3.26
United States 38 53 62 153 0 1 2 3 1.96
Vanuatu 104 116 115 335 3 1 4 8 2.39
Viet Nam 640 738 785 2,163 55 91 54 200 9.25
Ship's registration withdrawn 3 0 4 7 1 0 3 4 57.14
Total 25,762 28,627 30,929 85,318 1,411 1,562 1,421 4,394 5.15

MEMORANDUM OF UNDERSTANDING ON PORT STATE CONTROL IN THE ASIA-PACIFIC REGION
38
Figure 14: COMPARISON OF INSPECTIONS PER SHIP TYPE
Figure 15: COMPARISON OF DETENTIONS PER SHIP TYPE
1,1421,067
1,047337290
307811
784839
7,807
7,7757,355
5,7595,295 4,942
10,3899,018
7,1422,016
1,7721,483
596618
6202,072
2,0082,027
Oil tanker/combination carrier
Gas carrier
Chemical tanker
Bulk carrier
Ro-ro/container/vehicle ship
General dry cargo ship
Refrigerated cargo carrier
Passenger ship
Other types
2010
2011
2012
2.32 2.24
2.22
2.26
5.15
2.74
4.21
2.85
3.27
5.15
3.44
2.37
2.63
2.77
5.15 5.
644.
95
3.80
4.69
5.15
2.33
3.32
3.18 2.96
5.15
8.95
9.25
7.99
8.72
5.15
8.34
6.76
6.29
7.15
5.15
1.95
2.07
2.67
2.25
5.15
4.20
4.59
3.77
4.18 5.
15
0.00
1.00
2.00
3.00
4.00
5.00
6.00
7.00
8.00
9.00
10.002010201120123-year averageAverage detention percentage
Oil tanker/ combination
carrier
Gas carrier Chemical tanker
Bulk carrier Ro-ro/ container/
vehicle ship
General dry cargo ship
Refrigerated cargo carrier
Passenger ship/ferry
Other types

MEMORANDUM OF UNDERSTANDING ON PORT STATE CONTROL IN THE ASIA-PACIFIC REGION
39
Table 9: INSPECTIONS AND DETENTIONS PER SHIP TYPE
Number of inspections Number of detentions Average detention
percentage %
Type of ship 2010
2011 2012 Total 2010 2011
2012
Total
NLS tanker 85 99 54 238 0 2 3 5 2.10
Combination carrier 107 73 45 225 5 2 2 9 4.00
Oil tanker 1835 1836 1973 5,644 42 41 41 124 2.20
Gas carrier 620 618 596 1,834 17 26 17 60 3.27
Chemical tanker 1483 1772 2016 5,271 51 42 53 146 2.77
Bulk carrier 7142 9018 10389 26,549 403 446 395 1,244 4.69
Vehicle carrier 746 668 876 2,290 16 11 10 37 1.62
Container ship 3963 4421 4685 13,069 92 151 154 397 3.04
Ro-Ro cargo ship 233 206 198 637 7 14 19 40 6.28
General cargo/multi-purpose ship 7355 7775 7807 22,937 658 719 624 2,001 8.72
Refrigerated cargo carrier 839 784 811 2,434 70 53 51 174 7.15
Woodchip carrier 220 235 245 700 7 12 6 25 3.57
Livestock carrier 53 50 45 148 2 7 3 12 8.11
Ro-Ro Passenger ship 83 92 90 265 4 5 4 13 4.91
Passenger ship 224 198 247 669 2 1 5 8 1.20
Factory ship 1 1 2 4 0 0 0 0 0
Heavy load carrier 61 79 108 248 3 3 7 13 5.24
Offshore service vessel 149 115 157 421 9 3 6 18 4.28
MODU & FPSO 11 4 5 20 0 1 0 1 5.00
High speed passenger craft 57 42 26 125 0 0 1 1 0.80
Special purpose ship 40 49 54 143 0 0 2 2 1.40
Tugboat 212 222 220 654 12 8 4 24 3.67
Others 243 270 280 793 11 15 14 40 5.04
Total 25,762 28,627 30,929 85,318 1,411 1,562 1,421 4,394 5.15

MEMORANDUM OF UNDERSTANDING ON PORT STATE CONTROL IN THE ASIA-PACIFIC REGION
40
Figure 16: COMPARISON OF INSPECTIONS WITH DEFICIENCIES PER SHIP TYPE
Passenger ship/ferry
Passenger ship/ferry
General dry cargo ship
Passenger ship/ferry
General dry cargo ship
Other types
Passenger ship/ferry
General dry cargo ship
General dry cargo ship
(a) Year 2010
Oil tanker/combination carrierGas carrier
Bulk carrierChemical tanker
Ro-ro/container/vehicle ship
Refrigerated cargo carrier
Oil tanker/combination carrier
Gas carrier
Bulk carrierChemical tanker
Ro-ro/container/vehicle ship
Refrigerated cargo carrier
Other types
(b) Year 2011
Oil tanker/combination carrierGas carrier
Bulk carrierChemical tanker
Ro-ro/container/vehicle ship
Refrigerated cargo carrier
Other types
(c) Year 2012
Oil tanker/combination carrierGas carrier
Bulk carrierChemical tanker
Ro-ro/container/vehicle ship
Refrigerated cargo carrier
Other types
(d) 3-year summary
* % over [+] or under [-] average
-0.30
1.40
13.80
18.19
-6.64
-13.29
-16.93
-3.95
Average
-23.72
-25 -20 -15 -10 -5 0 5 10 15 20 25
-0.51
6.90
8.78
18.80
-4.40
-8.27
-12.07
-20.44
Average
-6.17
-25 -20 -15 -10 -5 0 5 10 15 20 25
-0.43
5.85
13.10
18.45
-6.85
-10.67
-16.52
-22.09
Average
-4.83
-25 -20 -15 -10 -5 0 5 10 15 20 25
-0.548.95
16.4718.20
-9.95
-10.67-20.63
-3.77
Average
-22.31
-25 -20 -15 -10 -5 0 5 10 15 20 25

MEMORANDUM OF UNDERSTANDING ON PORT STATE CONTROL IN THE ASIA-PACIFIC REGION
41
Table 10: INSPECTIONS WITH DEFICIENCIES PER SHIP TYPE
Type of ship
Number of inspections Number of inspections
with deficiencies 3-year
average percentage
%
2010
2011 2012 Total 2010 2011
2012
Total
Oil tanker/combination carrier 2,027 2,008 2,072 6,107 852 832 866 2,550 41.76
Gas carrier 620 618 596 1,834 271 298 299 868 47.33
Chemical tanker 1,483 1,772 2,016 5,271 796 919 1,088 2,803 53.18
Bulk carrier 7,142 9,018 10,389 26,549 4,326 5,519 5,825 15,670 59.02
Ro-ro/container/vehicle ship 4,942 5,295 5,759 15,996 2,688 3,098 3,331 9,117 57.00
General dry cargo ship 7,355 7,775 7,807 22,937 6,071 6,480 6,327 18,878 82.30
Refrigerated cargo carrier 839 784 811 2,434 678 619 576 1,873 76.95
Passenger ship 307 290 337 934 225 193 233 651 69.70
Other types 1,047 1,067 1,142 3,256 668 692 705 2,065 63.42
Total 25,762 28,627 30,929 85,318 16,575 18,650 19,250 54,475 63.85

MEMORANDUM OF UNDERSTANDING ON PORT STATE CONTROL IN THE ASIA-PACIFIC REGION
42
Table 11: INSPECTIONS AND DETENTIONS PER RECOGNIZED ORGANIZATION
Recognized organization (RO)
No
. o
f o
vera
ll in
spec
tio
ns
201
0-20
12
No
. o
f o
vera
ll d
eten
tio
ns
201
0-20
12
No
. o
f R
O
resp
on
sib
le
det
enti
on
s 20
10-
2012
3-ye
ar a
ver
ga
e d
eten
tio
n
per
cen
tag
e%
3-ye
ar a
ver
age
RO
res
po
nsi
ble
d
eten
tio
n
per
cen
tag
e%
3-ye
ar a
ver
age
per
cen
tag
e o
f R
O r
esp
on
sib
le
det
enti
on
s%
American Bureau of Shipping 8,173 257 15 3.14 0.18 5.84 Belize Maritime Bureau Inc. 13 1 0 7.69 0 0 Belize Register Corporation 1 0 0 0 0 0 Biro Klasifikasi Indonesia 296 53 3 17.91 1.01 5.66 Bulgarski Koraben Registar 4 0 0 0 0 0 Bureau Securitas 24 1 0 4.17 0 0 Bureau Veritas 8,570 418 18 4.88 0.21 4.31 Ceskoslovensky Lodin Register 6 0 0 0 0 0 China Classification Society 7,363 82 3 1.11 0.04 3.66 China Corporation Register of Shipping 972 76 2 7.82 0.21 2.63 Compania Nacional de Registro e Inspeccion de Naves
1 0 0 0 0 0
Cosmos Marine Bureau 50 3 0 6.00 0 0 Croatian Register of Shipping 111 4 2 3.60 1.80 50.00 Cyprus Bureau of Shipping 12 0 0 0 0 0 Det Norske Veritas 9,455 275 11 2.91 0.12 4.00 Ferriby Marine 2 0 0 0 0 0 Fidenavis SA 25 1 0 4.00 0 0 Germanischer Lloyd 9,036 403 19 4.46 0.21 4.71 Global Marine Bureau 1,427 208 24 14.58 1.68 11.54 Global Shipping Bureau 8 2 1 25.00 12.50 50.00 Hellenic Register of Shipping 13 3 0 23.08 0 0 Honduras Bureau of Shipping 4 0 0 0 0 0 Honduras International Surveying and Inspection Bureau
5 0 0 0 0 0
INCLAMAR (Inspection y Classification Maritime, S. de. R.L.)
255 39 1 15.29 0.39 2.56
Indian Register of Shipping 340 16 0 4.71 0 0 Intermaritime Certification Services, S.A. 1,119 79 10 7.06 0.89 12.66 International Naval Surveys Bureau 179 14 1 7.82 0.56 7.14 International Register of Shipping 1,203 178 20 14.80 1.66 11.24 International Ship Classification 917 100 15 10.91 1.64 15.00 Isthmus Bureau of Shipping 1,495 167 22 11.17 1.47 13.17 Korea Classification Society (former Joson Classification Society)
519 89 6 17.15 1.16 6.74
Korea Ship Safety Technology Authority 146 2 0 1.37 0 0 Korean Register of Shipping 7,531 155 3 2.06 0.04 1.94 Lloyd's Register 10,316 337 16 3.27 0.16 4.75 Macosnar Corporation 14 0 0 0 0 0 Marconi International Marine Company Ltd. 6 0 0 0 0 0 Maritime Lloyd Ltd, Georgia 17 0 0 0 0 0 Maritime Technical Systems and Services 147 13 1 8.84 0.68 7.69 National Cargo Bureau Inc. 5 0 0 0 0 0 National Shipping Adjusters Inc 105 10 0 9.52 0 0 New United International Marine Services Ltd 7 0 0 0 0 0 Nippon Kaiji Kyokai 26,000 961 52 3.70 0.20 5.41 NV Unitas 1 0 0 0 0 0

MEMORANDUM OF UNDERSTANDING ON PORT STATE CONTROL IN THE ASIA-PACIFIC REGION
43
Recognized organization (RO)
No
. o
f o
vera
ll in
spec
tio
ns
201
0-20
12
No
. o
f o
vera
ll d
eten
tio
ns
201
0-20
12
No
. o
f R
O
resp
on
sib
le
det
enti
on
s 20
10-
2012
3-ye
ar a
ver
ga
e d
eten
tio
n
per
cen
tag
e%
3-ye
ar a
ver
age
RO
res
po
nsi
ble
d
eten
tio
n
per
cen
tag
e%
3-ye
ar a
ver
age
per
cen
tag
e o
f R
O r
esp
on
sib
le
det
enti
on
s%
Overseas Marine Certification Services 871 126 9 14.47 1.03 7.14 Panama Bureau of Shipping 152 17 1 11.18 0.66 5.88 Panama Marine Survey and Certification Services, Inc.
2 1 0 50.00 0 0
Panama Maritime Documentation Services 1,191 125 8 10.50 0.67 6.40 Panama Maritime Surveyors Bureau Inc 186 30 1 16.13 0.54 3.33 Panama Register Corporation 168 18 0 10.71 0 0 Panama Shipping Certificate Inc. 10 1 0 10.00 0 0 Panama Shipping Registrar Inc. 514 62 4 12.06 0.78 6.45 Phoenix Register of Shipping 5 1 0 20.00 0 0 Polski Rejestr Statkow 51 2 0 3.92 0 0 Registro Brasileiro de Navios de Aeronaves 1 0 0 0 0 0 Registro Internacional Naval S.A. 37 3 1 8.11 2.70 33.33 Registro Italiano Navale 1,951 91 1 4.66 0.05 1.10 RINAVE Portuguesa 19 1 0 5.26 0 0 Russian Maritime Register of Shipping 1,572 107 4 6.81 0.25 3.74 Russian River Register 2 0 0 0 0 0 Ship Classification Malaysia 6 0 0 0 0 0 Shipping Register of Ukraine 8 1 0 12.50 0 0 SingClass International Pte Ltd 15 2 0 13.33 0 0 Sing-Lloyd 31 4 2 12.90 6.45 50.00 Societe Generale de Surveillance 1 0 0 0 0 0 Turkish Lloyd 19 2 0 10.53 0 0 Union Bureau of Shipping 3,304 546 71 16.53 2.15 13.00 Universal Maritime Bureau 1,006 142 16 14.12 1.59 11.27 Universal Shipping Bureau 260 29 2 11.15 0.77 6.90 Vietnam Register 2,315 226 22 9.76 0.95 9.73 Other 1,341 170 26 12.68 1.94 15.29
See also the note in page 30.

MEMORANDUM OF UNDERSTANDING ON PORT STATE CONTROL IN THE ASIA-PACIFIC REGION
44
Table 12: PERFORMANCE OF RECOGNIZED ORGANIZATION
Recognized organization (RO)
No
. of
ove
rall
insp
ecti
on
s 20
10-2
012
No
. of
RO
re
spo
nsi
ble
d
eten
tio
ns
2010
-201
2
Lo
w/m
ediu
m
Lim
it
Med
ium
/hig
h
Lim
it
Exc
ess
fact
or
Per
form
ance
le
vel
Union Bureau of Shipping 3,304 71 80 52 0.68
Medium
Croatian Register of Shipping 111 2 5 0 0.46
International Ship Classification 917 15 26 11 0.28
International Register of Shipping 1,203 20 33 16 0.26
Global Marine Bureau 1,427 24 38 19 0.25
Universal Maritime Bureau 1,006 16 28 12 0.24
Maritime Technical Systems and Services 147 1 6 0 0.21
Panama Bureau of Shipping 152 1 6 0 0.19
Biro Klasifikasi Indonesia 296 3 10 1 0.17
International Naval Surveys Bureau 179 1 7 0 0.14
Panama Maritime Surveyors Bureau Inc 186 1 7 0 0.13
Universal Shipping Bureau 260 2 9 1 0.12
Korea Classification Society (former Joson Classification Society)
519 6 16 5 0.12
Isthmus Bureau of Shipping 1,495 22 39 20 0.08
INCLAMAR (Inspection y Classification Maritime, S. de. R.L.)
255 1 9 1 0.01
Panama Shipping Registrar Inc. 514 4 16 5 -0.15
High
Overseas Marine Certification Services 871 9 25 10 -0.17
Intermaritime Certification Services, S.A. 1,119 10 31 14 -0.47
Vietnam Register 2,315 22 58 35 -0.64
Panama Maritime Documentation Services 1,191 8 32 15 -0.77
Indian Register of Shipping 340 0 12 2 -0.95
China Corporation Register of Shipping 972 2 27 12 -1.46
Russian Maritime Register of Shipping 1,572 4 41 22 -1.51
Bureau Veritas 8,570 18 193 150 -1.74
Germanischer Lloyd 9,036 19 203 158 -1.74
American Bureau of Shipping 8,173 15 185 142 -1.77
Nippon Kaiji Kyokai 26,000 52 558 482 -1.78
Lloyd's Register 10,316 16 230 182 -1.81
Det Norske Veritas 9,455 11 212 166 -1.85

MEMORANDUM OF UNDERSTANDING ON PORT STATE CONTROL IN THE ASIA-PACIFIC REGION
45
Recognized organization (RO)
No
. of
ove
rall
insp
ecti
on
s 20
10-2
012
No
. of
RO
re
spo
nsi
ble
d
eten
tio
ns
2010
-201
2
Lo
w/m
ediu
m
Lim
it
Med
ium
/hig
h
Lim
it
Exc
ess
fact
or
Per
form
ance
le
vel
Registro Italiano Navale 1,951 1 50 28 -1.88
China Classification Society 7,363 3 168 127 -1.94
Korean Register of Shipping 7,531 3 171 130 -1.94
Note: 1) In this table, only recognized organizations (RO) that had more than 60 inspections
are taken into account. The formula used is identical to the one used for the Black-Grey-White List. However, the values for P and Q are adjusted to P=2% and Q=1%.
2) ROs involving 60-179 inspections with zero detention are not included in this table.

MEMORANDUM OF UNDERSTANDING ON PORT STATE CONTROL IN THE ASIA-PACIFIC REGION
46
Figure 17: COMPARISON OF NUMBER OF DEFICIENCIES BY MAIN CATEGORIES
36,976
35,82631,160
3,2923,497
3,19117,124
17,43515,648
6,7538,139
6,1823,593
8,2576,921
20,522
18,11415,998
12,07012,281
11,077Lifesaving appliances
Fire safety measures
Stability, structure andrelated equipment
Load lines
Safety of navigation
ISM related deficiencies
Others
2010
2011
2012

MEMORANDUM OF UNDERSTANDING ON PORT STATE CONTROL IN THE ASIA-PACIFIC REGION
47
Table 13: COMPARISON OF DEFICIENCIES BY CATEGORIES
Nature of deficiency
Number of deficiencies
2010 2011 2012
Certificate & Documentation Crew Certificates 1,483 1,400 1,275 Documents 4,288 5,633 5,359 Ship Certificates 2,788 2,978 2,754
Structural Conditions 3,730 4,268 3,593 Water/Weathertight conditions 6,182 8,139 6,753 Emergency Systems 4,365 5,209 5,628 Radio Communications 3,296 3,319 2,987 Cargo operations including equipment 478 526 675 Fire safety 15,554 17,709 20,522 Alarms 661 703 798
Working and Living Conditions Living Conditions 498 459 672 Working Conditions 3,920 4,585 4,496
Safety of Navigation 16,289 18,319 17,124 Life saving appliances 12,066 13,476 12,070 Dangerous goods 303 289 241 Propulsion and auxiliary machinery 5,466 6,424 5,470
Pollution prevention
Anti Fouling 12 23 16 MARPOL Annex I 2,094 2,339 2,335 MARPOL Annex II 18 21 27 MARPOL Annex III 92 37 17 MARPOL Annex IV 879 996 1,013 MARPOL Annex V 864 1,055 981 MARPOL Annex VI 508 680 796
ISM 3,191 3,497 3,292 Other 1,375 1,608 1,436
Total 90,400 103,692 100,330
ISPS 2,527 2,790 2,490Grand total 92,927 106,482 102,820

MEMORANDUM OF UNDERSTANDING ON PORT STATE CONTROL IN THE ASIA-PACIFIC REGION
48
Figure 18: COMPARISON OF MOST FREQUENT DETAINABLE DEFICIENCIES
155
155
125
113
98
96
96
89
76
74
135
165
151
165
134
62
98
56
76
60
127
198
163
173
133
43
60
51
71
47
Fire-dampers (Firesafety)
Lifeboats (Life savingappliances)
Emergency fire pumpand its pipes (Fire safety)
Oil filtering equipment(MARPOL Annex I)
Maintenance of the shipand equipment (ISM)
Resources andpersonnel (ISM)
Shipboard operations(ISM)
Endorsement by flagState (Crew Certificates)
Fire detection and alarmsystem (Fire safety)
Fixed fire extinguishinginstallation (Fire safety)
2012
2011
2010

MEMORANDUM OF UNDERSTANDING ON PORT STATE CONTROL IN THE ASIA-PACIFIC REGION
49
Table 14: COMPARISON OF MOST FREQUENT DETAINABLE DEFICIENCIES
No. Most frequent deficiencies Year
2010 2011 2012
1 Fire-dampers (Fire safety) 127 135 155
2 Lifeboats (Life saving appliances) 198 165 155
3 Emergency fire pump and its pipes (Fire safety) 163 151 125
4 Oil filtering equipment (MARPOL Annex I) 173 165 113
5 Maintenance of the ship and equipment (ISM) 133 134 98
6 Resources and personnel (ISM) 43 62 96
7 Shipboard operations (ISM) 60 98 96
8 Endorsement by flag State (Crew Certificates) 51 56 89
9 Fire detection and alarm system (Fire safety) 71 76 76
10 Fixed fire extinguishing installation (Fire safety) 47 60 74

MEMORANDUM OF UNDERSTANDING ON PORT STATE CONTROL IN THE ASIA-PACIFIC REGION
50
ANNEX 3
ORGANIZATIONAL STRUCTURE OF THE TOKYO MOU
Observer Organizations:
IMO, ILO, other MOUs
National Port State Control Services
Co-operating Member Authorities
Observer Authorities
Tokyo MOU Secretariat
Asia-Pacific Computerized
Information System (APCIS)
Member Authorities
Port State Control Committee

MEMORANDUM OF UNDERSTANDING ON PORT STATE CONTROL IN THE ASIA-PACIFIC REGION
51
EXPLANATORY NOTE ON THE BLACK – GREY – WHITE LISTS The Port State Control Committee adopted the same method as used by the Paris MOU for assessment of performance of flags. Compared to the calculation method of previous year, this system has the advantage of providing an excess percentage that is significant and also reviewing the number of inspections and detentions over a 3-year period at the same time, based on binomial calculus. The performance of each flag State is calculated using a standard formula for statistical calculations in which certain values have been fixed in accordance with the agreement of the Port State Control Committee. Two limits have been included in the new system, the ‘black to grey’ and the ‘grey to white’ limit, each with its own specific formula:
)1(5.0 ppNzpNu greytoblack
)1(5.0 ppNzpNu greytowhite In the formula "N" is the number of inspections, "p" is the allowable detention limit (yardstick), set to 7% by the Tokyo MOU Port State Control Committee, and "z" is the significance requested (z=1.645 for a statistically acceptable certainty level of 95%). The result "u" is the allowed number of detentions for either the black or white list. The "u" results can be found in the table as the ‘black to grey’ or the ‘grey to white’ limit. A number of detentions above this ‘black to grey’ limit means significantly worse than average, where a number of detentions below the
‘grey to white’ limit means significantly better than average. When the amount of detentions for a particular flag State is positioned between the two, the flag State will find itself on the grey list. The formula is applicable for sample sizes of 30 or more inspections over a 3-year period. To sort results on the black or white list, simply alter the target and repeat the calculation. Flags which are still significantly above this second target are worse than the flags which are not. This process can be repeated, to create as many refinements as desired. (Of course the maximum detention rate remains 100%!) To make the flags’ performance comparable, the excess factor (EF) is introduced. Each incremental or decremental step corresponds with one whole EF-point of difference. Thus the excess factor EF is an indication for the number of times the yardstick has to be altered and recalculated. Once the excess factor is determined for all flags, the flags can be ordered by EF. The excess factor can be found in the last column the black, grey or white list. The target (yardstick) has been set on 7% and the size of the increment and decrement on 3%. The Black – Grey – White lists have been calculated in accordance with the above principles. The graphical representation of the system, below, is showing the direct relations between the number of inspected ships and the number of detentions. Both axis have a logarithmic character.
Number of inspections
Nu
mb
er o
f d
eten
tio
ns
0
10
100
1000
30 50 100 250 500 1000 2000
EF=4 EF=3 EF=2 EF=1 Black EF=0 White EF=-1 EF=-2

MEMORANDUM OF UNDERSTANDING ON PORT STATE CONTROL IN THE ASIA-PACIFIC REGION
52
Example flag on Black list: Ships of Cambodia were subject to 5,131 inspections of which 814 resulted in a detention. The "black to grey limit" is 390 detentions. The excess factor is 3.68. N = total inspections P = 7% Q= 3% Z = 1.645 How to determine the black to grey limit:
)1(5.0 ppNzpNu greytoblack
93.007.0131,5645.15.007.0131,5 greytoblacku
u = 390
The excess factor is 3.68. This means that ‘p’ has to be adjusted in the formula. The black to grey limit has
an excess factor of 1, so to determine the new value for ‘p’, ‘q’ has to be multiplied with 2.68, and the
outcome has to be added to the normal value for ‘p’:
p + 2.68q = 0.07 + (2.68 0.03) = 0.1504
8496.01504.0131,5645.15.01504.0131,5 orexcessfactu
uexcessfactor = 814 Example flag on Grey list: Ships of Tuvalu were subject to 421 inspections, of which 35 resulted in a detention. The "black to grey limit" is 39 and the "grey to white limit" is 20. The excess factor is 0.80. How to determine the black to grey limit:
93.007.0421645.15.007.0421 greytoblacku
ublack-to-grey = 39 How to determine the grey to white limit:
)1(5.0 ppNzpNu greytowhite
93.007.0421645.15.007.0421 greytowhiteu uwhite-to-grey = 20

MEMORANDUM OF UNDERSTANDING ON PORT STATE CONTROL IN THE ASIA-PACIFIC REGION
53
To determine the excess factor the following formula is used: ef = (Detentions – white to grey limit)/(grey to black limit – white to grey limit) ef = (35-20.36)/(38.58-20.36) ef = 0.80 Example flag on White list: Ships of the Bahamas were subject to 1,976 inspections of which 57 resulted in detention. The "grey to white limit" is 119 detentions. The excess factor is -1.14. How to determine the grey to white limit:
)1(5.0 ppNzpNu greytowhite
93.007.0976,1645.15.007.0976,1 greytowhiteu uwhite-to-grey = 119 The excess factor is -1.14. This means that ‘p’ has to be adjusted in the formula. The grey to white limit has an excess factor of 0, so to determine the new value for ’p’, ‘q’ has to be multiplied with -1.14, and the outcome has to be added to the normal value for ‘p’: p + (-1.14) = 0.07 + (-1.14 0.03) = 0.0358
9642.00358.0976,1645.15.00358.0976,1 orexcessfactu uexcessfactor = 57
According to the decision by the Port State Control Committee, flags involving 30-49 port State inspections
with nil detentions are listed on top of the White List.

MEMORANDUM OF UNDERSTANDING ON PORT STATE CONTROL IN THE ASIA-PACIFIC REGION
54
TOKYO MOU SECRETARIAT
The Secretariat (Tokyo MOU Secretariat) of the Memorandum of Understanding
on Port State Control in the Asia-Pacific Region is located in Tokyo, Japan. The
Secretariat may be approached for further information or inquiries on the
operation of the Memorandum.
ADDRESS OF THE SECRETARIAT
The address of the Tokyo MOU Secretariat
reads:
Tokyo MOU Secretariat
Ascend Shimbashi 8F
6-19-19 Shimbashi
Minato-ku, Tokyo
Japan 105-0004
Tel: +81-3-3433-0621
Fax: +81-3-3433-0624
E-mail: [email protected]
STAFF OF THE SECRETARIAT
The staff of the Secretariat consist of:
Mitsutoyo Okada
Secretary
Ikuo Nakazaki
Deputy Secretary
Ning Zheng
Technical Officer
Fumiko Akimoto
Projects Officer