annual report of the u.s. shareholder … the u.s. shareholder-owned electric utility industry ......
TRANSCRIPT

FINANCIAL REVIEW2012ANNUAL REPORT OF THE U.S. SHAREHOLDER-OWNEDELECTRIC UTILITY INDUSTRY
Comparison of the EEI Index, S&P 500,
and DJIA Total Return 1/1/08–12/31/12
(Dollars)
2012
20082009
20102011
50
100
150
200
Capital Spending —Trailing 12 Months
0
10
20
30
40
50
60
70
80
90
100
‘09Q1
($ Billions)
‘09Q2
‘09Q3
‘09Q4
‘10Q4
‘10Q1
‘10Q2
‘10Q3
‘11Q4
‘11Q1
‘11Q2
‘11Q3
‘12Q4
83.281.6
80.4
74.1
90.586.284.882.2
74.273.4
74.8 76.0 78.2 78.6
76.174.6
‘12Q1
‘12Q2
‘12Q3
‘07Q4
76.680.5 84.0 82.8
‘08Q1
‘08Q2
‘08Q3
‘08Q4
77.6

FINANCIAL REVIEW2012ANNUAL REPORT OF THE U.S. SHAREHOLDER-OWNEDELECTRIC UTILITY INDUSTRY
About EEI and the Financial Review
The Edison Electric Institute (EEI) is the Washington, D.C.-based association of shareholder-owned electric compa-nies, whose members represent approximately 70% of the U.S. electric power industry. The 2012 Financial Review is a comprehensive source for critical financial data covering 51 shareholder-owned electric companies whose stocks are publicly traded on major U.S. stock exchanges. The Review also includes data on seven additional companies that provide regulated electric service in the United States but are not listed on U.S. stock exchanges for one of the following reasons—they are subsidiaries of an independent power producer; they are subsidiaries of foreign-owned companies; or they were acquired by other investment firms. These 58 companies are referred to throughout the publication as the U.S. Shareholder-Owned Electric Utilities. Please refer to page 103 for a list of these companies.

EEI 2012 FINANCIAL REVIEW iii
ContentsHighlights of 2012 ....................................................................................... iv
Abbreviations and Acronyms ....................................................................... iv
Company Categories ....................................................................................v
President’s Letter ........................................................................................ 1
Industry Financial Performance ................................................................... 5
Income Statement ................................................................................ 5
Balance Sheet .................................................................................... 10
Cash Flow Statement .......................................................................... 14
Dividends ........................................................................................... 20
Electricity Sales and Revenues ............................................................ 24
Rate Case Summary ........................................................................... 31
Business Strategies ................................................................................... 41
Business Segmentation ...................................................................... 41
Mergers and Acquisitions ................................................................... 46
Construction ....................................................................................... 53
Fuel Sources ...................................................................................... 62
Capital Markets ......................................................................................... 69
Stock Performance ............................................................................. 69
Credit Ratings..................................................................................... 76
Policy Overview ......................................................................................... 85
Introduction........................................................................................ 85
Defend My Dividend Campaign ........................................................... 85
Environmental Roundup ..................................................................... 86
Dodd-Frank Update............................................................................ 86
Pension Reform Legislation ................................................................. 86
Cybersecurity ..................................................................................... 87
Superstorm Sandy .............................................................................. 87
U.S./International Convergence Projects ............................................. 88
Rate-Regulated Accounting ................................................................ 88
Other Highlights ................................................................................. 88
Accounting Issues .............................................................................. 89
Major FERC Initiatives ......................................................................... 90
Finance and Accounting Division ............................................................... 99
Earnings Table ........................................................................................ 102
List of U.S. Shareholder-Owned Electric Utilities ....................................... 103

iv EEI 2012 FINANCIAL REVIEW
Highlights of 2012
Note: Percent changes may reflect rounding.r = revised p = preliminary
U.S. SHAREHOLDER-OWNED ELECTRIC UTILITIES
FINANCIAL ($ Millions) 2012 2011r % ChangeTotal Operating Revenues 345,566 369,802 (6.6%)
Utility Plant (Net) 839,963 786,199 6.8%
Total Capitalization 771,988 730,299 5.7%
Earnings Excluding Non-Recurring and
Extraordinary Items 34,081 32,638 4.4%
Dividends Paid, Common Stock 19,858 19,411 2.3%
ELECTRIC OPERATIONS
Electricity Sales (GWh) 2,297,818 p 2,379,197 (3.4%)
Installed Generating Capacity (MW) 610,034 p 607,644 0.4%
Average Number of Electricity Customers (Thousands) 100,431p 100,914 (0.5%)
AFUDC Allowance for Funds Used During Construction
Btu British Thermal Unit
CFTC Commodity Futures Trading Commission
CPI Consumer Price Index
DOE Department of Energy
DOJ Department of Justice
DPS Dividends per share
EEI Edison Electric Institute
EIA Energy Information Administration
EITF Emerging Issues Task Force
EPA Environmental Protection Agency
EPS Earnings per share
FASB Financial Accounting Standards Board
FERC Federal Energy Regulatory Commission
GDP Gross Domestic Product
GW Gigawatt
GWh Gigawatt-hour
IPP Independent Power Producer
IRS Internal Revenue Service
ISO Independent System Operator
ITC Independent Transmission Company
kWh Kilowatt-hour
M&A Mergers & Acquisitions
MW Megawatt
MWh Megawatt-hour
NARUC National Association of Regulatory Utility Commissioners
NERC North American Electric Reliability Corporation
NOx Nitrogen Oxides
NOAA National Oceanic & Atmospheric Administration
NRC Nuclear Regulatory Commission
O&M Operations and Maintenance
PSC Public Service Commission
PUC Public Utility Commission
PUHCA Public Utility Holding Company Act
PURPA Public Utility Regulatory Policies Act
ROE Return on Equity
RTO Regional Transmission Organization
SEC Securities and Exchange Commission
SO2 Sulfur Dioxide
T&D Transmission & Distribution
Abbreviations and Acronyms
Company Categories
Three categories are used throughout this publication that group companies on their percentage oftotal assets that are regulated. These categories are used to provide an informative framework fortracking financial trends:
Regulated: Greater than 80% of total assets are regulated
Mostly Regulated: 50% to 80% of total assets are regulated
Diversified: Less than 50% of total assets are regulated
EEI 2012 FINANCIAL REVIEW v


EEI 2012 FINANCIAL REVIEW 1
President’s Letter2012 Financial Review
Electricity is the power that con-nects us and makes our lives better. It runs our homes, our businesses, our cities, and, more and more, various modes of transportation. By enabling the digital age, electricity helps us to share information, enter-tainment, and even ourselves in ways that would have been unimaginable just a short time ago. And by stimu-lating innovation, electricity will continue to improve our lives—and will do so in an increasingly efficient and environmentally sensitive manner.
Today, the nation’s electric power industry is creating a platform for the future. We’re using new tech-nologies; we’re promoting increased electrification, particularly in the transportation sector; and we’re de-veloping innovative strategies to en-sure that America continues to have the power it needs, when it needs it.
As you will see inside this year’s Financial Review, the strong financial foundation we’re building is essential for achieving our vision. For the year ending March 31, 2013, the EEI Index returned an average of 16.3 percent compared to the 14.0-per-cent return posted by the S&P 500, and the Dow Jones Industrial Aver-age’s 13.3-percent return. For the 10 years ending December 31, 2012, the EEI Index’s 166-percent return outpaced the Dow Jones Industrial’s 103 percent, S&P 500’s 99 percent, and NASDAQ’s 124 percent.
All 51 EEI Index companies paid a dividend in 2012, the second time on record that this has occurred. Strong dividend yields continue to help support utility stocks. The in-dustry’s dividend yield on March 31, 2013, stood at 3.9 percent, and 37 utilities increased their dividend last year, extending the industry’s nine-year trend of widespread increases.
Tax Reform
Importantly, the fiscal cliff legisla-tion enacted in January permanently links the tax rates for dividends and capital gains. Through the Defend My Dividend campaign, EEI and our member companies, in partner-ship with other dividend-paying al-lies, worked to educate lawmakers and industry stakeholders about the importance of low dividend tax rates that are on par with the tax rates for capital gains. This multi-faceted campaign was dynamic—with ac-tivities ranging from CEO and CFO congressional fly-ins, to grassroots mobilization, media and social me-dia outreach, and more.
Congress is now debating whether to tackle comprehensive tax reform this year, which could impact normal-ization, treatment of excess deferred taxes, deductibility of interest on cor-porate debt, and the tax rate on divi-dends. EEI and our member compa-nies are working to educate lawmakers on the tax-writing committees about our industry’s key policy priorities.
Capital Expenditures
Financial strength is critical for funding what will be record levels of capital investment going forward. Our latest projections show that the industry plans an average an-nual investment of about $85 billion through 2015. These investment dollars are developing a smarter grid; maintaining existing infrastructure, as well as expanding transmission lines; building more renewable en-ergy projects; and meeting a wide va-riety of environmental requirements. Notably, 2012 actual spending of $90.5 billion was an increase of 15 percent over the previous year.
Transmission Investment
Looking specifically at transmis-sion and distribution investment, our latest data shows that sharehold-er-owned electric companies and stand-alone transmission companies invested a record $30.3 billion in the nation’s transmission and distri-bution infrastructure in 2011. The transmission component totaled

2 EEI 2012 FINANCIAL REVIEW
PRESIDENT’S LETTER
$11.1 billion—an 8.4-percent in-crease over the $10.2 billion (nomi-nal $) spent in 2010.
This increase was due, in large part, to replacing and upgrading existing transmission lines, develop-ing new lines to meet electricity load growth in certain parts of the coun-try, and interconnecting new sources of generation onto the grid. Looking forward, we project that our mem-bers will invest an additional $54.6 billion in transmission through 2015 (real $2011). An adequate return on equity (ROE) for these investments is essential to access capital to build new transmission.
Recently, however, some state attor-neys general, environmental and con-sumer groups, as well as state public utility commissions and other stake-holders, have taken issue with the au-thorized ROEs for our members.
In response, EEI is advocating that the Federal Energy Regulatory Commission (FERC) balance the need to promote investment in long-life transmission infrastructure with short-term, cyclical movements in the capital markets. Returns com-mensurate with prevailing risk are necessary to continue to attract suffi-cient capital to sustain needed trans-mission investment levels.
Cybersecurity
Of course, as important as it is to build new transmission and distri-bution lines, it’s equally important to keep them safe and secure. As we automate and digitize our critical infrastructure, protecting the electric
grid from cyber and physical threats is a top priority.
Cybersecurity is not new to the electric power industry though—it has been a growing focus over the past decade. The industry employs threat mitigation actions that emphasize preparation, prevention, response, and recovery in its operations. The industry also partners with federal agencies, including FERC, the De-partment of Homeland Security, and the Department of Energy (DOE) to improve sector-wide resilience for cy-ber threats. And, it collaborates with the National Institute of Standards and Technology, the North Ameri-can Electric Reliability Corporation, and federal intelligence and law en-forcement agencies to strengthen its cybersecurity capabilities.
On Capitol Hill, as Congress struggles to determine a path for-ward on cybersecurity legislation, EEI continues to work with our companies to advocate for a bill that preserves the existing regulatory structure and facilitates information sharing between the government and private sector. We’re urging leaders in Congress to respect the electric sec-tor’s existing regulatory structure and standards-writing process to protect against vulnerabilities in the elec-tric system. In addition to close col-laboration as an industry, we’re also working directly with government partners to more thoroughly under-stand the threat environment and, thus, better protect our systems.
While the industry supports pas-sage of cybersecurity legislation, it is not waiting for congressional action to enhance its cyber defenses. The
electric power industry is engaged in a number of other comprehen-sive and ongoing activities aimed at safeguarding the electric grid from threats.
Electricity Generation
Last spring, soaring produc-tion and an unusually warm win-ter sent natural gas prices plunging to less than $2 per thousand cubic feet (MCF). While wholesale natu-ral gas prices have doubled over the past year to around $4 per MCF, the trend of low prices has significant fi-nancial and operational implications for the industry’s generating capac-ity. The key question is: Can natu-ral gas be a reliable, affordable, and stable fuel for the electric generation fleet, as coal has been for decades?
Today’s low natural gas prices have affected all of our generation sources, and they’ve made even the most cost-competitive renewable en-ergy projects less competitive. The low prices also have spurred a num-ber of natural gas-related issues that we’re addressing, including pipeline scheduling and infrastructure issues and state regulatory and legislative is-sues regarding long-term contracting.
In looking at power plant con-struction last year, natural gas capac-ity accounted for 21,305 megawatts (MW) of the more than 30,000 MW added in 2012. This was more than three times the amount of natu-ral gas capacity announced in 2011 (6,628 MW).

EEI 2012 FINANCIAL REVIEW 3
PRESIDENT’S LETTER
In addition to natural gas, more than 13,000 MW of wind capac-ity were added to the grid in 2012 or about 3,000 MW more than the previous annual record set in 2009. The photovoltaic industry also had a record year, adding more than 2,000 MW or 20 percent more than the previous year.
Last year was a record for capac-ity retirements too. The industry retired more than 9,000 MW of coal-based generating capacity in 2012—an amount comparable to the coal retirements of the last five years combined. Looking ahead, we have tracked announcements that total more than 60,000 MW of coal plant retirements scheduled between 2010 and 2022.
Nuclear power today represents about 20 percent of the country’s electric generation and will remain an important part of the generation mix going forward. Last year, South-ern Company earned the EEI Edison Award, the electric power industry’s most prestigious honor, for the im-mense progress it made toward building two new reactors at the site of subsidiary Georgia Power’s Plant Vogtle Units 3 and 4. At a number of existing reactors across the coun-try, owners also are seeking 20-year license extensions. Many other plant owners are increasing their generat-ing capacity through power uprates.
Our overall goal remains a bal-anced and diversified generating portfolio combining all genera-tion technologies and fuels. All fuel sources will be essential for ensuring a reliable, affordable electricity sup-ply in the future.
Environment
On the environmental front, there are several key rulemakings that di-rectly affect the utility industry. The MATS (Mercury and Air Tox-ics Standards) rule from 2012 will require extensive retrofit controls to reduce emissions of mercury and other air emissions. A large portion of our coal-based fleet is working to meet these standards by 2015, and the U.S. Environmental Protection Agency (EPA) predicts a compliance cost of about $10 billion per year.
EPA’s Clean Water Act section 316(b) cooling water intake struc-tures proposal has been in develop-ment for years, with a final rule due under court order by June 2013. In 2011, EPA published a draft rule that would affect the vast majority of America’s existing steam-electric generating facilities, including nu-clear and coal-based power plants, and a wide range of manufacturing and industrial facilities. EEI and our members are advocating that EPA adopt a common-sense and scientifi-cally defensible multi-pronged ap-proach for addressing impingement and entrainment that is reasonable, environmentally protective, and eco-nomically justifiable.
EPA’s regulation of greenhouse gas (GHG) emissions from power plants is another key issue for us. In spring 2012, EPA proposed strict GHG emissions limits for new power plants that effectively preclude the build-ing of new coal-based power plants, since only a new coal plant using carbon capture and storage technol-ogy could meet such a standard. EPA
also is expected to develop GHG emissions limits for existing sources under the new source performance standards in the Clean Air Act.
We must provide environmental protections, but also protect our cus-tomers from steep rate increases and ensure a reliable electricity supply. To achieve this triple bottom line, we’ll continue to seek agreements that give us as much flexibility as possible to achieve the stated environmental goals.
We’re proud of the work we’ve al-ready done to comply with existing air quality rules. Since 1990, annual emmissions of both sulfur dioxide (SO
2) and nitrogen oxides (NOx)
have been cut more than 75 percent. EPA’s MATS rule will cut our SO
2
emissions by almost 90 percent by 2015, and mercury emissions will drop by 90 percent. As of 2012, our carbon emissions also are down by approximately 15 percent below 2005 levels.
Energy Efficiency
Our efforts to create an electric superhighway for the 21st century—one that merges the now separate power, digital, and telecommunica-tions systems into one intelligent smart grid—will enable the industry not only to put more clean genera-tion online, but also to do more with energy efficiency. Electric utilities al-ready are a major force in encourag-ing homes and businesses to become more energy efficient.
For 2011, the latest data available, electric utility efficiency programs
4 EEI 2012 FINANCIAL REVIEW
PRESIDENT’S LETTER
saved enough electricity to power more than 11 million homes for one year. Electric utilities also spent more than $5.7 billion in 2011 on efficiency—an 18-percent increase from 2010 levels—making electric utilities by far the largest U.S. ener-gy-efficiency providers.
Distributed Energy Resources
In strengthening the grid, we’re also enabling electricity and infor-mation to move two ways: from the utility to the customer—as it always has—and from the customer back to the utility. This capability is helping to encourage interest in distributed energy resources (DER), including distributed generation.
DER systems create opportunities and challenges for utilities. Integrat-ing increasing amounts of DER needs to be done in a way that ensures that reliability and safety are maintained, which requires new investment in distribution systems. Because exist-ing state regulatory and incentive mechanisms mirror the needs and workings of the current system, it’s also important that increasing levels of DER are accommodated in a way that is fair to customers with—as well as without—DER.
In 2012, we began a dialogue with regulators through the Nation-al Association of Regulatory Utility Commissioners, the National As-sociation of State Utility Consumer
Advocates, and through the Critical Consumer Issues Forum (an orga-nization that includes regulators, utilities, and consumer advocates) to develop a framework to assist poli-cymakers and other stakeholders in evaluating issues related to DER. Our goal is to ensure that the proper policies are in place so that the inte-gration of DER occurs safely, fairly, and reliably.
Transportation Electrification
Energy efficiency and the smart grid are part of the electric power in-dustry’s focus today—using less elec-tricity where we can, and using more where we should. A great example of using more where we should is in transportation. Transportation is the last sector of our economy to adopt widespread use of electricity, but the time has come and the opportunity is huge.
Through a new campaign—The Electric Generation—and a broader electrification effort, EEI is working with our member companies to turn the promise of electric transportation into a reality. Fleet vehicles, cranes, and many other types of commercial transport are running more cleanly, efficiently, and affordably by relying on electricity as a transportation fuel.
Electrifying the transportation sector will improve the nation’s en-ergy security dramatically, and also have a positive impact on both the environment and the economy.
Conclusion
I’m optimistic about the poten-tial for electricity to continue to brighten our future. I’m even more optimistic about the path we’re on to deliver it. Every day, our industry is powering the people and the world is changing. Our companies and the more than 500,000 people in our workforce are changing with it, rein-venting ourselves and the way we go about every aspect of our work.
We know that the future will bring new challenges—both natural and man-made. However, given the challenges we faced in 2012, includ-ing the extreme weather conditions our companies faced during Su-perstorm Sandy and its subsequent restoration work, I have confidence that we’ll overcome them.
We recognize the critical nature of the challenges that lie before us, and we know that our work won’t be easy. But by forging ahead together as an industry, I know that we’ll not only succeed, but we’ll power even more innovations in the future.
Thomas R. Kuhn President Edison Electric Institute

EEI 2012 FINANCIAL REVIEW 5
Industry FinancialPerformance
Income Statement
2012 Electric Output Drops 1.8%As shown in the table U.S. Electric
Output, total electric output in the U.S. fell by 1.8% in 2012. A slow-growth economy and little year-to-year benefit from weather combined with several other factors to cause the slight decline. As shown in the table U.S. Weather, cooling degree days nationwide were 22% above the historical average, although they were only 1% above the prior year’s level. Winter temperatures were warmer than average throughout the country. Summer temperatures were significantly above average, although they were slightly higher than in the previous year.
Seven of the nine U.S. regions saw lower output in 2012. For the sec-ond straight year, the Rocky Moun-tain and Pacific Southwest regions saw the only increases. Electric out-put data is compiled by the Edison Electric Institute on a weekly basis and represents all electricity placed on the grid in the lower 48 states by shareholder-owned electric utilities, rural electric cooperatives, govern-ment power projects and indepen-dent power producers.
The 1.8% overall reduction in de-mand in 2012 was indicative of the year’s weak economy. U.S. real gross
Note: Represents all power placed on grid for distribution to end customers; does not include Alaska or Hawaii.
Source: EEI Business Information Group
U.S. Electric Output (GWh)Periods Ending December 31
Region 2012 2011 % Change
New England 128,410 129,755 (1.0%)
Mid Atlantic 445,943 453,903 (1.8%)
Central Industrial 686,335 707,131 (2.9%)
West Central 334,322 338,822 (1.3%)
Southeast 1,006,292 1,024,219 (1.8%)
South Central 670,257 689,926 (2.9%)
Rocky Mountain 272,156 269,629 0.9%
Pacific Northwest 155,411 161,230 (3.6%)
Pacific Southwest 292,281 290,436 0.6%
Total United States 3,991,408 4,065,051 (1.8%)
Source: EEI Business Information Group
EEI U.S. Electric Output – Regions
PACIFICNORTHWEST
PACIFICSOUTHWEST
ROCKYMOUNTAIN
SOUTHCENTRAL
WESTCENTRAL CENTRAL
INDUSTRIAL
SOUTHEAST
MIDDLEATLANTIC
NEWENGLAND

6 EEI 2012 FINANCIAL REVIEW
INDUSTRY FINANCIAL PERFORMANCE
nearly $1.4 billion. The Business Segmentation section (see Business Strategies) provides a detailed reve-nue breakdown by business segment.
Energy Operating Expenses Decline 15.8%
Total energy operating expenses fell by $23.6 billion, or 15.8%, from the prior year’s level. The two com-ponents of the total—total electric generation cost (-13.2%) and gas cost (28.9%)—both showed de-clines in 2012.
Consolidated Income Statement U.S. SHAREHOLDER-OWNED ELECTRIC UTILITIES
12 Months Ended
($ Millions) 12/31/2012 12/31/2011r % Change
Energy Operating Revenues $345,566 $369,802 (6.6%) Energy Operating Expenses Total Electrical Generation Cost 108,166 124,609 (13.2%)Gas Cost 17,649 24,832 (28.9%)Total Energy Operating Expenses 125,815 149,441 (15.8%) Revenues less energy operating expenses 219,751 220,360 (0.3%) Other Operating Expenses Operations & maintenance 91,209 89,705 1.7% Depreciation & Amortization 37,440 35,831 4.5% Taxes (not income) - Total 16,370 16,174 1.2% Other Operating Expenses 10,247 11,396 (10.1%)Total Operating Expenses 281,082 302,548 (7.1%) Operating Income 64,484 67,254 (4.1%)
Other Recurring Revenue Partnership Income 547 1,072 (49.0%)Allowance for Equity Funds Used for Construction 1,561 1,546 1.0% Other Revenue 2,101 2,011 4.5% Total Other Recurring Revenue 4,208 4,629 (9.1%) Non-Recurring Revenue Gain on Sale of Assets 382 891 (57.1%)Other Non-Recurring Revenue 299 946 (68.4%)Total Non-Recurring Revenue 681 1,837 (62.9%) Interest expense 23,971 23,608 1.5% Other expenses 415 1,510 (72.5%)Asset Writedowns 9,881 2,743 260.2% Other Non-Recurring Expenses 2,044 851 140.0% Total Non-Recurring Expenses 11,924 3,594 231.8% Net Income Before Taxes 33,064 45,007 (26.5%) Provision for Taxes 10,226 14,126 (27.6%)Dividends on Preferred Stock of Subsidiary - - NM Other Minority Interest Expense - - NM Minority Interest Expense - - NM Trust Preferred Security Payments - - NM Other After-tax Items - - NM Total Minority Interest and Other After-tax Items - - NM Net Income Before Extraordinary Items 22,838 30,881 (26.0%) Discontinued Operations (1,732) (1,011) 71.3% Change in Accounting Principles - - NM Early Retirement of Debt - - NM Other Extraordinary Items - 960 (100.0%)Total Extraordinary Items (1,732) (51) NM Net Income 21,106 30,830 (31.5%) Preferred Dividends Declared 5 8 (36.2%)Other Preferred Dividends after Net Income 5 14 (61.7%)Other Changes to Net Income (16) (9) 79.8% Net Income Attributable to Noncontrolling Interests 465 437 NA Net Income Available to Common 20,615 30,362 (32.1%)Common Dividends 19,858 19,411 2.3%
r = revised NM = not meaningful
Source: SNL Financial and EEI Finance Department
we consider Duke’s 2011 revenue to be $23.48 billion for comparative purposes.
Based on business segmentation data, about $17.3 billion (or $14.5 billion, adjusting for M&A activ-ity) of the decrease in the industry’s Energy Operating Revenue came from the Mostly Regulated Electric segment. Revenue in the Regulated Electric segment declined by $5.6 billion, while the Competitive seg-ment showed a revenue decline of
domestic product (GDP) grew each quarter and rose 2.2% for the year as a whole, a modest improvement over 2011’s 1.8% growth rate. Elec-tric output has declined annually in five of the last seven years.
Industry Revenue Fell 6.6%As shown in the Consolidated
Income Statement, the industry’s total revenue fell by $24.2 billion, or 6.6%, in 2012. More than three-quarters of companies (44 of 58, or 76%) reported lower revenue. The average change was a 4.7% decrease, while 10 companies, or 17% of the industry, posted double-digit per-centage decreases. Edison Interna-tional was the only company to post a double-digit percentage increase, with a $1.2 billion (12%) year-to-year gain.
From 2008 through 2011, Exelon and Southern Company recorded the highest and second-highest an-nual revenue, respectively, of all companies. The merger of Duke and Progress on July 3, 2012 established a new leader, with $24.0 billion in combined 2012 revenue, after in-cluding Progress’ results for the first six months of the year. The industry’s 2012 income statement was impact-ed by significant merger and acqui-sition activity, primarily the Duke/Progress, Exelon/Constellation and Northeast Utilities/NSTAR com-binations. To facilitate more mean-ingful year-to-year comparisons of individual company results, we have combined income statement data for each merged pair of companies into a single entity for 2011. For ex-ample, actual 2011 revenue at Duke and Progress was $14.53 billion and $8.95 billion, respectively, whereas
A mean daily temperature (average of the daily maximum and minimum temperatures) of 65 degrees Fahrenheit is the base for both heating and cooling degree day computations. National averages are population weighted.
Source: National Oceanic and Atmospheric Administration, National Weather Service, Climate Prediction Center
U.S. WeatherJanuary – December 2012
Total Dev from % Dev from % Norm Change Last Year ChangeCooling Degree Days New England 611 194 47% 4 1% Mid-Atlantic 895 239 36% 9 1% East North Central 999 291 41% 102 11% West North Central 1,219 291 31% 99 9% South Atlantic 2,212 247 13% (121) (5%)East South Central 1,782 234 15% (35) (2%)West South Central 2,933 482 20% (238) (8%)Mountain 1,524 281 23% 138 10% Pacific 904 200 28% 185 26% United States 1,489 272 22% 11 1% Heating Degree Days New England 5,650 (995) (15%) (535) (9%)Mid-Atlantic 4,934 (1,009) (17%) (525) (10%)East North Central 5,427 (1,104) (17%) (809) (13%)West North Central 5,590 (1,194) (18%) (1,096) (16%)South Atlantic 2,333 (535) (19%) (285) (11%)East South Central 2,861 (762) (21%) (544) (16%)West South Central 1,712 (587) (26%) (523) (23%)Mountain 4,432 (800) (15%) (689) (13%)Pacific 2,988 (255) (8%) (408) (12%)United States 3,792 (755) (17%) (561) (13%)

EEI 2012 FINANCIAL REVIEW 7
INDUSTRY FINANCIAL PERFORMANCE
The revenue derived from natu-ral gas transmission and distribu-tion (i.e., delivery of natural gas to homes and businesses primarily for cooking and heating) is aggregated with all other revenue sources in the energy operating revenue line of the industry’s consolidated income state-ment. However, the cost associated with natural gas distribution is bro-ken out separately as gas cost. This is typically highest in the first quarter due to heating demand and lowest in the third due to the summer’s mini-mal heating needs.
Although gas distribution ac-counts for a smaller portion of the industry’s overall revenue and earn-ings than do electric operations, it helps balance the seasonal earnings stream for combined gas/electric dis-tribution companies due to the fact that residential gas demand peaks in the colder months while electricity demand peaks in the hot summer months for most U.S. utilities.
Operations and Maintenance (O&M) Expenses Rise 1.7%
Operations and maintenance (O&M) expenses increased 1.7% in 2012. Although this was less than half the pace of the previous two years, it resulted in a third consecu-tive year of rising O&M expenses. As a percent of the industry’s total operating expenses, O&M costs gradually decreased from 30% in 2002 to 24% in 2008. Beginning in 2009, this percentage began to rise, reaching 32% in 2012. The increase in O&M expenses in 2012 was expe-rienced fairly evenly throughout the industry; the median company saw O&M costs rise by 1.9%.
nearly $1.4 billion. The Business Segmentation section (see Business Strategies) provides a detailed reve-nue breakdown by business segment.
Energy Operating Expenses Decline 15.8%
Total energy operating expenses fell by $23.6 billion, or 15.8%, from the prior year’s level. The two com-ponents of the total—total electric generation cost (-13.2%) and gas cost (28.9%)—both showed de-clines in 2012.
Consolidated Income Statement U.S. SHAREHOLDER-OWNED ELECTRIC UTILITIES
12 Months Ended
($ Millions) 12/31/2012 12/31/2011r % Change
Energy Operating Revenues $345,566 $369,802 (6.6%) Energy Operating Expenses Total Electrical Generation Cost 108,166 124,609 (13.2%)Gas Cost 17,649 24,832 (28.9%)Total Energy Operating Expenses 125,815 149,441 (15.8%) Revenues less energy operating expenses 219,751 220,360 (0.3%) Other Operating Expenses Operations & maintenance 91,209 89,705 1.7% Depreciation & Amortization 37,440 35,831 4.5% Taxes (not income) - Total 16,370 16,174 1.2% Other Operating Expenses 10,247 11,396 (10.1%)Total Operating Expenses 281,082 302,548 (7.1%) Operating Income 64,484 67,254 (4.1%)
Other Recurring Revenue Partnership Income 547 1,072 (49.0%)Allowance for Equity Funds Used for Construction 1,561 1,546 1.0% Other Revenue 2,101 2,011 4.5% Total Other Recurring Revenue 4,208 4,629 (9.1%) Non-Recurring Revenue Gain on Sale of Assets 382 891 (57.1%)Other Non-Recurring Revenue 299 946 (68.4%)Total Non-Recurring Revenue 681 1,837 (62.9%) Interest expense 23,971 23,608 1.5% Other expenses 415 1,510 (72.5%)Asset Writedowns 9,881 2,743 260.2% Other Non-Recurring Expenses 2,044 851 140.0% Total Non-Recurring Expenses 11,924 3,594 231.8% Net Income Before Taxes 33,064 45,007 (26.5%) Provision for Taxes 10,226 14,126 (27.6%)Dividends on Preferred Stock of Subsidiary - - NM Other Minority Interest Expense - - NM Minority Interest Expense - - NM Trust Preferred Security Payments - - NM Other After-tax Items - - NM Total Minority Interest and Other After-tax Items - - NM Net Income Before Extraordinary Items 22,838 30,881 (26.0%) Discontinued Operations (1,732) (1,011) 71.3% Change in Accounting Principles - - NM Early Retirement of Debt - - NM Other Extraordinary Items - 960 (100.0%)Total Extraordinary Items (1,732) (51) NM Net Income 21,106 30,830 (31.5%) Preferred Dividends Declared 5 8 (36.2%)Other Preferred Dividends after Net Income 5 14 (61.7%)Other Changes to Net Income (16) (9) 79.8% Net Income Attributable to Noncontrolling Interests 465 437 NA Net Income Available to Common 20,615 30,362 (32.1%)Common Dividends 19,858 19,411 2.3%
r = revised NM = not meaningful
Source: SNL Financial and EEI Finance Department
8 EEI 2012 FINANCIAL REVIEW
INDUSTRY FINANCIAL PERFORMANCE
A $1.1 billion (10.1%) decline in other operating expenses was more than offset by a $1.6 billion (4.5%) increase in depreciation & amorti-zation. It should be noted that the consolidated industry O&M figure includes the electric, natural gas and other operating segments, and is in-fluenced by plant and business dives-titures.
Operating Income Falls 4.1%The industry’s aggregate Oper-
ating Income fell by $2.8 billion, or 4.1%, in 2012. The Regulated segment showed a gain $0.8 bil-lion, which was offset by declines of $2.3 billion and $1.2 billion for the Mostly Regulated and Deregulated segments. The Mostly Regulated segment’s decrease was driven by a $2.0 billion decline at Exelon.
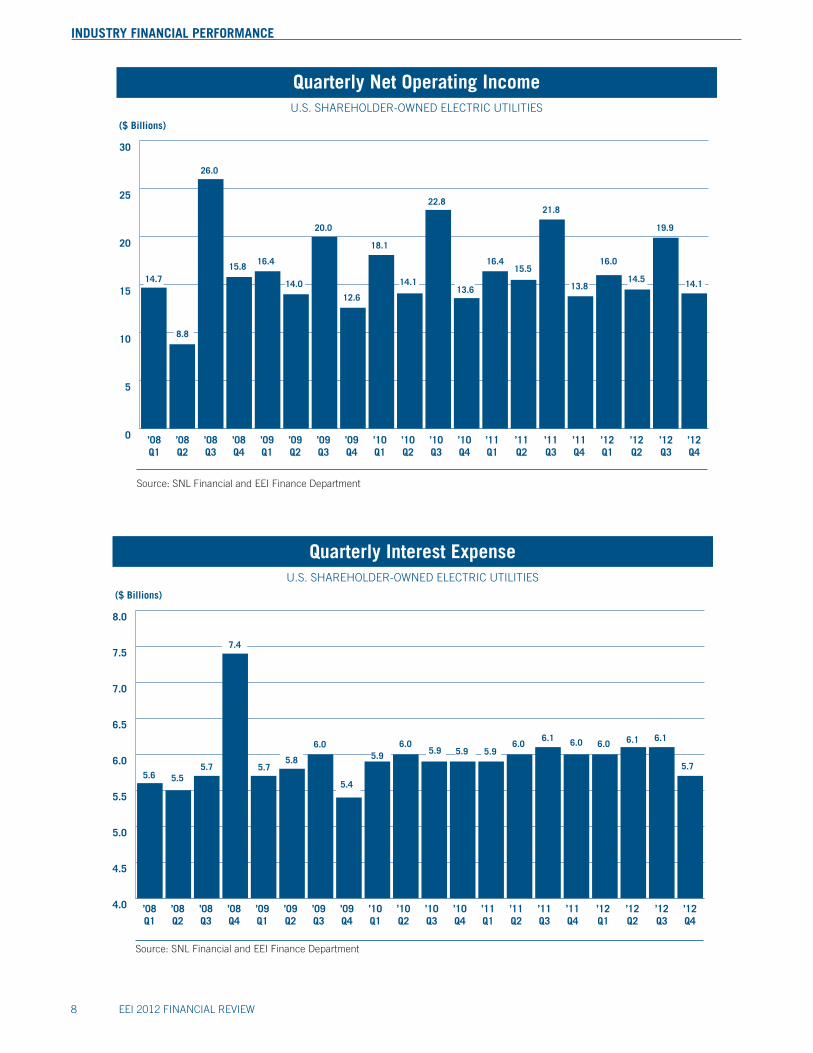
Interest Expense Up 1.5% Interest expense increased by
$363 million, or 1.5%, to $24.0
Quarterly Net Operating IncomeU.S. SHAREHOLDER-OWNED ELECTRIC UTILITIES
Source: SNL Financial and EEI Finance Department
’09Q1
’09Q2
’09Q3
’09Q4
($ Billions)
0
5
10
15
20
25
30
18.1
14.1
22.8
13.6
16.0
14.5
19.9
14.114.7
16.415.5
21.8
13.8
26.0
8.8
’10Q1
’10Q2
’10Q3
’10Q4
’11Q1
’11Q2
’11Q3
’11Q4
’12Q1
’12Q2
’12Q3
’12Q4
’08Q1
’08Q2
’08Q3
’08Q4
15.8 16.4
14.0
20.0
12.6
Quarterly Interest ExpenseU.S. SHAREHOLDER-OWNED ELECTRIC UTILITIES
($ Billions)
4.0
4.5
5.0
5.5
6.0
6.5
7.0
7.5
8.0
5.6 5.55.7
7.4
6.0
5.4
5.96.0
5.9 5.96.0
6.1 6.0
5.7
5.96.0 6.1 6.1
5.7
Source: SNL Financial and EEI Finance Department
’09Q1
’09Q2
’09Q3
’09Q4
’10Q1
’10Q2
’10Q3
’10Q4
’11Q1
’11Q2
’11Q3
’11Q4
’12Q1
’12Q2
’12Q3
’12Q4
’08Q1
’08Q2
’08Q3
’08Q4
5.8

EEI 2012 FINANCIAL REVIEW 9
INDUSTRY FINANCIAL PERFORMANCE
Non-Recurring and Extraordinary Items
As shown in the table Individual Non-Recurring and Extraordinary Items, the industry reported an $11.2 billion increase in the negative impact of non-recurring and extraordinary items Items in 2012 versus 2011. This was largely due to an increase in total non-recurring expenses, caused by a $7.1 billion increase in the magnitude of asset writedowns. Asset writedowns averaged $4.4 bil-lion (1.2% of Energy Operating Rev-enue) over the last decade, while the total for 2012 was $9.9 billion (2.9% of Energy Operating Revenue). The largest increases in writedowns oc-curred at Ameren ($2.5 billion), DPL ($1.8 billion), Dominion ($1.8 billion) and Energy Future Hold-ings ($0.8 billion). The industry’s aggregate gain on sale of assets for the previous five years averaged more
Individual Non-Recurring and Extraordinary Items 2003–2012
U.S. SHAREHOLDER-OWNED ELECTRIC UTILITIES
Net Gain (Loss) on Sale of AssetsOther Non-Recurring Revenue
Total Non-Recurring Revenue
Asset WritedownsOther Non-Recurring Charges
Total Non-Recurring Charges
Discontinued OperationsChange in Accounting PrinciplesEarly Retirement of DebtOther Extraordinary Items
Total Extraordinary Items
Total Non-Recurring and Extraordinary Items
2011r 2012 2003 2004 2005 2006
r = revised Note: Figures represent net industry totals. Totals may reflect rounding.
Source: SNL Financial and EEI Finance Department
($ Millions) 2007 2008 2009 2010
572 950 2,991 983 5,240 581 7,176 3,410 891 382 357 5,691 518 250 130 1,661 (494) 2,065 946 299 929 6,641 3,509 1,233 5,370 2,243 6,682 5,475 1,837 681
(6,578) (2,653) (2,849) (2,203) (215) (11,256) (2,022) (8,805) (2,743) (9,881) (469) (751) (1,793) (631) (1,091) (1,525) (822) (545) (851) (2,044)
(7,047) (3,404) (4,643) (2,833) (1,306) (12,781) (2,844) (9,350) (3,594) (11,924) (2,707) 742 (808) 2,194 599 759 (63) (476) (1,011) (1,732) 521 24 (180) 15 (158) – – – – – – – – – – – – – – – (19) (1,180) (245) – (79) 67 (5) 10 960 –
(2,206) (414) (1,233) 2,208 362 826 (68) (466) (51) (1,732) (8,324) 2,823 (2,366) 608 4,426 (9,713) 3,771 (4,341) (1,808) (12,975)
billion from $23.6 billion in 2011. Twenty-eight companies, or 49% of the industry, recorded an increase for this line item. Energy Future Hold-ings accounted for $217 million of the $363 million increase. The me-dian change was nearly zero (-0.2%). Interest expense as a percentage of energy operating revenues was 6.9% a decade ago. It gradually decreased to 5.4% in 2006 and has since climbed back to 6.9% for 2012. The pattern is consistent with the pace of construction programs across the industry, but a potentially stronger rise in this expense item in recent years has been held down by histori-cally low interest rates. The industry’s Regulated segment saw an increase in interest expense at 19 of 39 compa-nies (49%), while a similar percent-age of the Mostly Regulated segment (8 of 17 companies, or 47%) showed an increase.
A $1.1 billion (10.1%) decline in other operating expenses was more than offset by a $1.6 billion (4.5%) increase in depreciation & amorti-zation. It should be noted that the consolidated industry O&M figure includes the electric, natural gas and other operating segments, and is in-fluenced by plant and business dives-titures.
Operating Income Falls 4.1%The industry’s aggregate Oper-
ating Income fell by $2.8 billion, or 4.1%, in 2012. The Regulated segment showed a gain $0.8 bil-lion, which was offset by declines of $2.3 billion and $1.2 billion for the Mostly Regulated and Deregulated segments. The Mostly Regulated segment’s decrease was driven by a $2.0 billion decline at Exelon.
Interest Expense Up 1.5% Interest expense increased by
$363 million, or 1.5%, to $24.0
Quarterly Net Operating IncomeU.S. SHAREHOLDER-OWNED ELECTRIC UTILITIES
Source: SNL Financial and EEI Finance Department
’09Q1
’09Q2
’09Q3
’09Q4
($ Billions)
0
5
10
15
20
25
30
18.1
14.1
22.8
13.6
16.0
14.5
19.9
14.114.7
16.415.5
21.8
13.8
26.0
8.8
’10Q1
’10Q2
’10Q3
’10Q4
’11Q1
’11Q2
’11Q3
’11Q4
’12Q1
’12Q2
’12Q3
’12Q4
’08Q1
’08Q2
’08Q3
’08Q4
15.8 16.4
14.0
20.0
12.6
Quarterly Interest ExpenseU.S. SHAREHOLDER-OWNED ELECTRIC UTILITIES
($ Billions)
4.0
4.5
5.0
5.5
6.0
6.5
7.0
7.5
8.0
5.6 5.55.7
7.4
6.0
5.4
5.96.0
5.9 5.96.0
6.1 6.0
5.7
5.96.0 6.1 6.1
5.7
Source: SNL Financial and EEI Finance Department
’09Q1
’09Q2
’09Q3
’09Q4
’10Q1
’10Q2
’10Q3
’10Q4
’11Q1
’11Q2
’11Q3
’11Q4
’12Q1
’12Q2
’12Q3
’12Q4
’08Q1
’08Q2
’08Q3
’08Q4
5.8

10 EEI 2012 FINANCIAL REVIEW
INDUSTRY FINANCIAL PERFORMANCE
than $3.5 billion, or 0.9% of ener-gy operating revenue. In 2012, this item was only $0.4 billion, or 0.1% of energy operating revenue.
Consolidated Net Income FallsThe industry’s consolidated net
income fell to $21.1 billion in 2012, down $9.7 billion, or 31.5%, from $30.8 billion in 2011. The decrease was attributable to several factors, but it was heavily impacted by the jump in non-recurring and extraor-dinary items. There was a wide dis-persion in year-to-year comparisons at the company level. Thirty-one companies, or 53% of the industry, posted an increase in net income, with 16 companies, or 28%, report-ing double-digit percentage gains and 23 companies, or 40%, report-ing double-digit percentage losses.
Balance Sheet
The industry’s consolidated bal-ance sheet remained healthy in 2012, showing a small increase in overall leverage as the debt-to-capitalization ratio rose to 56.8% at year-end from 56.3% at year-end 2011 (see table, Capitalization Structure). Electric utilities were able to issue long-term debt at very low interest rates as Treasury yields fell for the sixth consecutive year (see chart, Utilities’ Cost of Debt). After reducing short-term borrowings in 2009, compa-nies increased short-term debt at a moderate pace during 2010, 2011 and 2012 (see chart, Short-term Debt 2003-2012).
Aggregate Non-Recurring and Extraordinary Items 2003-2012
U.S. SHAREHOLDER-OWNED ELECTRIC UTILITIES
r = revised Note: Totals may reflect rounding.
GainsLosses
Total
Source: SNL Financial and EEI Finance Department
2003 2004 2005 2006 2007 2008 2009 2010 2011r 2012 Total 3.3 10.4 4.1 4.1 6.3 3.4 6.9 5.7 1.8 0.7 46.6 11.6 8.7 6.5 3.5 2.3 13.1 3.1 10.0 3.6 11.9 74.3
(8.3) 1.7 (2.3) 0.6 4.0 (9.7) 3.8 (4.3) (1.8) (11.2) (27.7)
($ Billions)
2003 2004 2005 2006 2007 2008 2009 20100
3
6
9
12
15
2011r 2012
Losses
Gains
Top Net Non-Recurring and Extraordinary Gains (Losses) 2012
($ Millions)
U.S. SHAREHOLDER-OWNED ELECTRIC UTILITIES
Source: SNL Financial and EEI Finance Department
Company Gains Losses Net TotalAmeren – 2,578.0 2,578.0 Dominion 40.0 2,187.0 2,147.0 DPL – 1,817.2 1,817.2 Energy Future 4.0 1,569.0 1,565.0 Exelon – 746.0 746.0 Duke 38.0 666.0 628.0 PG&E – 423.0 423.0 MDU – 391.8 391.8 Entergy – 355.5 355.5 AEP 3.0 300.0 297.0
0
5
10
15
20
25
30
35
Net Income
2003-2012
r = revised
Source: SNL Financial and EEI Finance Department
2007 2009 2010 2011r 2012
($ Billions)
2003 2004
U.S. SHAREHOLDER-OWNED ELECTRIC UTILITIES
2005 2006 2008
32.7
27.7
30.8
21.1
15.6
26.125.2
31.2 32.2
19.8
2007 20122003 2004 2005 2006 2008 2009 2010 2011r0
5
10
15
20
25
30
35
Net Income Before Non-Recurringand Extraordinary Items 2003-2012
r = revised
Source: SNL Financial and EEI Finance Department
($ Billions)
U.S. SHAREHOLDER-OWNED ELECTRIC UTILITIES
23.4 23.2
30.627.827.5
29.5 28.9
32.0 32.634.1

EEI 2012 FINANCIAL REVIEW 11
INDUSTRY FINANCIAL PERFORMANCE
than $3.5 billion, or 0.9% of ener-gy operating revenue. In 2012, this item was only $0.4 billion, or 0.1% of energy operating revenue.
Consolidated Net Income FallsThe industry’s consolidated net
income fell to $21.1 billion in 2012, down $9.7 billion, or 31.5%, from $30.8 billion in 2011. The decrease was attributable to several factors, but it was heavily impacted by the jump in non-recurring and extraor-dinary items. There was a wide dis-persion in year-to-year comparisons at the company level. Thirty-one companies, or 53% of the industry, posted an increase in net income, with 16 companies, or 28%, report-ing double-digit percentage gains and 23 companies, or 40%, report-ing double-digit percentage losses.
Balance Sheet
The industry’s consolidated bal-ance sheet remained healthy in 2012, showing a small increase in overall leverage as the debt-to-capitalization ratio rose to 56.8% at year-end from 56.3% at year-end 2011 (see table, Capitalization Structure). Electric utilities were able to issue long-term debt at very low interest rates as Treasury yields fell for the sixth consecutive year (see chart, Utilities’ Cost of Debt). After reducing short-term borrowings in 2009, compa-nies increased short-term debt at a moderate pace during 2010, 2011 and 2012 (see chart, Short-term Debt 2003-2012).
Aggregate Non-Recurring and Extraordinary Items 2003-2012
U.S. SHAREHOLDER-OWNED ELECTRIC UTILITIES
r = revised Note: Totals may reflect rounding.
GainsLosses
Total
Source: SNL Financial and EEI Finance Department
2003 2004 2005 2006 2007 2008 2009 2010 2011r 2012 Total 3.3 10.4 4.1 4.1 6.3 3.4 6.9 5.7 1.8 0.7 46.6 11.6 8.7 6.5 3.5 2.3 13.1 3.1 10.0 3.6 11.9 74.3
(8.3) 1.7 (2.3) 0.6 4.0 (9.7) 3.8 (4.3) (1.8) (11.2) (27.7)
($ Billions)
2003 2004 2005 2006 2007 2008 2009 20100
3
6
9
12
15
2011r 2012
Losses
Gains
Top Net Non-Recurring and Extraordinary Gains (Losses) 2012
($ Millions)
U.S. SHAREHOLDER-OWNED ELECTRIC UTILITIES
Source: SNL Financial and EEI Finance Department
Company Gains Losses Net TotalAmeren – 2,578.0 2,578.0 Dominion 40.0 2,187.0 2,147.0 DPL – 1,817.2 1,817.2 Energy Future 4.0 1,569.0 1,565.0 Exelon – 746.0 746.0 Duke 38.0 666.0 628.0 PG&E – 423.0 423.0 MDU – 391.8 391.8 Entergy – 355.5 355.5 AEP 3.0 300.0 297.0
0
5
10
15
20
25
30
35
Net Income
2003-2012
r = revised
Source: SNL Financial and EEI Finance Department
2007 2009 2010 2011r 2012
($ Billions)
2003 2004
U.S. SHAREHOLDER-OWNED ELECTRIC UTILITIES
2005 2006 2008
32.7
27.7
30.8
21.1
15.6
26.125.2
31.2 32.2
19.8
2007 20122003 2004 2005 2006 2008 2009 2010 2011r0
5
10
15
20
25
30
35
Net Income Before Non-Recurringand Extraordinary Items 2003-2012
r = revised
Source: SNL Financial and EEI Finance Department
($ Billions)
U.S. SHAREHOLDER-OWNED ELECTRIC UTILITIES
23.4 23.2
30.627.827.5
29.5 28.9
32.0 32.634.1

12 EEI 2012 FINANCIAL REVIEW
INDUSTRY FINANCIAL PERFORMANCE
spending and related financing strat-egies, was unchanged in 2012. Given the year’s generally balanced ratings actions, the industry maintained
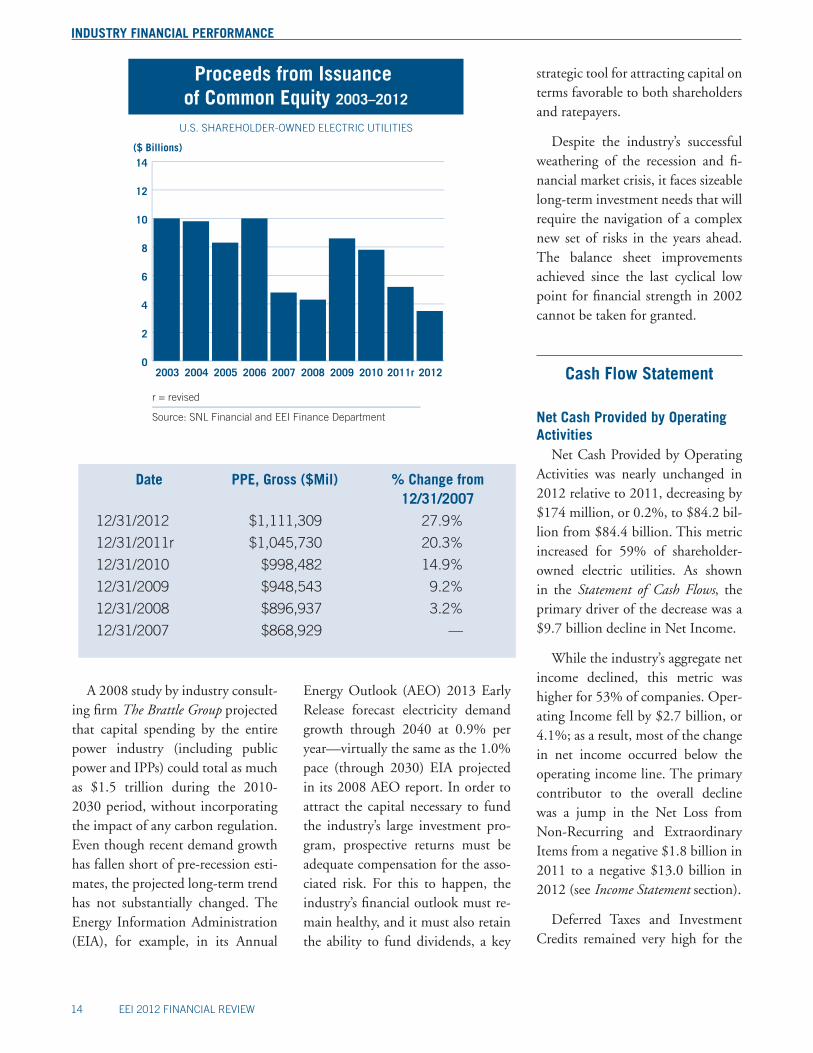
equity (see chart, Proceeds from Issu-ance of Common Equity). Industry credit quality, tied closely in recent years to the management of capital
The market for electric utilities’ corporate bonds remained strong. New-issue volume for five-, 10- and 30-year debt reached $34.0 billion, substantially higher than the $26.0 billion in 2011 and $26.8 billion in 2010. Spreads, or the difference be-tween the interest rates on new util-ity bonds and risk-free Treasuries of the same maturity, were essentially flat. For new 10-year bonds, spreads averaged 164 basis points (bps) in 2012 compared to 166 bps in 2011. The average coupon rate for 10-year bonds fell to just 3.4% in 2012 from 4.3% in 2011 and 4.7% in 2010. The quarterly average coupon rate for newly issued 10-year utility bonds in 2012’s final quarter was only 3.0%, the lowest in recent his-tory (EEI began tracking the sector’s 10-year bond rates in 2004).
Debt and Leverage RiseThe industry’s total consolidated
long-term debt increased in 2012 for the seventh consecutive year, rising $27.4 billion or 7.0%. As a result, the industry’s debt-to-capitalization ratio also rose, albeit modestly, to 56.8% at year-end 2012 from 56.3% at year-end 2011. This marked the first time in four years that the ratio increased. It was the larger utilities that accounted for most of the over-all change, as only 17 companies, or 30% of the industry, increased their leverage year-to-year. Total com-mon equity rose by $14.1 billion—a number roughly on par with that of the prior two years—partly offset-ting the additional debt. The balance sheet shows changes in equity result-ing from public offerings, which in-crease equity, and retained earnings or losses, which increase or decrease
Capitalization StructureU.S. SHAREHOLDER-OWNED ELECTRIC UTILITIES
Capitalization Structure 12/31/2012 12/31/2011r 12/31/2010
Common Equity 328,471 314,369 300,449
Preferred Equity & Noncontrolling Interests 5,074 4,856 4,541
Long-term Debt (current & non-current)* 438,443 411,074 399,981
Total 771,988 730,299 704,972
Common Equity % 42.5% 43.0% 42.6%
Preferred & Noncontrolling % 0.7% 0.7% 0.6%
Long-term Debt % 56.8% 56.3% 56.7%
Total 100.0% 100.0% 100.0%
* Long-term debt not adjusted for (i.e., includes) securitization bonds.r = revised
Source: SNL Financial and EEI Finance Department
Utility SpreadAverage Coupon (%)
Average 10-YearTreasury Yield (%)
Average SpreadOver Treasury (%)
Utilities’ Cost of Debt: 10-Year Treasury Yields and Bond Spreads (New Offerings)
2005
2006
2007
2008
2009
2010
2011
2012
Percent
1.00
2.00
3.00
4.00
5.00
6.00
7.00
8.00
9.00

EEI 2012 FINANCIAL REVIEW 13
INDUSTRY FINANCIAL PERFORMANCE
Capital Spending Needs Remain High
Despite the low- to no-growth environment for power demand that has persisted since the beginning of the 2008/2009 recession, recent company forecasts indicate that industry capex will likely remain strong well into the future. In addi-tion to investing in near-term gener-ation projects, primarily natural gas and renewables (see Construction), electric utilities are likely to seek to preserve fuel diversity by also invest-ing in traditional forms of baseload generation, such as coal and nuclear, when demand growth strengthens again along with economic growth. Considerable investment will also be needed to build transmission lines, as companies interconnect new sources of generation (includ-ing renewable resources) to the grid, replace aging lines and develop new ones to ensure reliability and relieve congestion.
an overall credit rating of BBB (us-ing Standard & Poor’s scale) for the ninth consecutive year (see Credit Ratings).
Total long-term debt (current and non-current) has risen by $88.2 bil-lion, or 25%, since year-end 2007, driven higher by the need to finance consistently high levels of capital spending. Industry capex climbed from a cyclical low of $41.1 billion in 2004 to a record high of $90.5 billion in 2012. EEI’s current capital spend-ing projections for the industry are $95.3 billion in 2013, $92.0 billion in 2014 and $85.0 billion in 2015.
Impact of Elevated Capex The impact of historically high
levels of capital spending is evident in the industry’s consolidated bal-ance sheet. Total property, plant and equipment in service (shown in the adjacent table) jumped nearly 28% from year-end 2007 to year-end 2012.
0
10
20
30
40
50
60
70
Short-term Debt 2003–2012
2010 2011r 20122003 2004 2005 2006 2007 2008 2009
($ Billions)
Source: SNL Financial and EEI Finance Department
U.S. SHAREHOLDER-OWNED ELECTRIC UTILITIES
Long-term Debt 2003–2012
r = revised
0
50
100
150
200
250
300
350
400
450
2010 2011r20122003 2004 2005 2006 2007 2008 2009
A rising level of construction work-in-progress (CWIP) also re-flects the industry’s elevated capi-tal spending. CWIP jumped from $33.8 billion at year-end 2006 to $58.8 billion at year-end 2008, then stabilized; it ranged from $59.4 bil-lion to $64.5 billion in 2009 through 2012. CWIP, along with adjustment clauses, interim rate increases and the use of projected costs in rate cases, is especially important during large construction cycles because it helps minimize regulatory lag.
Deferred taxes rose by $8.6 bil-lion, or 7.5%, to $123.0 billion at December 31, 2012 from $114.4 billion at December 31, 2011. Since 2008, deferred taxes have increased at a compound annual rate of 6.2%. This relatively fast pace relates to continued high capex and the impact of bonus depreciation beginning in 2008 (see Cash Flow Statement).
14 EEI 2012 FINANCIAL REVIEW
INDUSTRY FINANCIAL PERFORMANCE
strategic tool for attracting capital on terms favorable to both shareholders and ratepayers.
Despite the industry’s successful weathering of the recession and fi-nancial market crisis, it faces sizeable long-term investment needs that will require the navigation of a complex new set of risks in the years ahead. The balance sheet improvements achieved since the last cyclical low point for financial strength in 2002 cannot be taken for granted.
Cash Flow Statement
Net Cash Provided by Operating Activities
Net Cash Provided by Operating Activities was nearly unchanged in 2012 relative to 2011, decreasing by $174 million, or 0.2%, to $84.2 bil-lion from $84.4 billion. This metric increased for 59% of shareholder-owned electric utilities. As shown in the Statement of Cash Flows, the primary driver of the decrease was a $9.7 billion decline in Net Income.
While the industry’s aggregate net income declined, this metric was higher for 53% of companies. Oper-ating Income fell by $2.7 billion, or 4.1%; as a result, most of the change in net income occurred below the operating income line. The primary contributor to the overall decline was a jump in the Net Loss from Non-Recurring and Extraordinary Items from a negative $1.8 billion in 2011 to a negative $13.0 billion in 2012 (see Income Statement section).
Deferred Taxes and Investment Credits remained very high for the
Debt-to-Cap Ratio by Category 2012 vs. 2011rU.S. SHAREHOLDER-OWNED ELECTRIC UTILITIES
Note: Dec. 31, 2012 vs. Dec. 31, 2011. Refer to page v for category descriptions.*No change defined as less than 1.0%
Source: SNL Financial and EEI Finance Department
Regulated Mostly Regulated Diversified Total Industry Number % Number % Number % Number %Lower 11 30.6% 4 22.2% — — 15 26.3%Higher 16 44.4% 8 44.4% 1 33.3% 25 43.9%No Change* 9 25.0% 6 33.3% 2 66.7% 17 29.8%
Total 36 100% 18 100% 3 100% 57 100%
Capitalization Structure by Category 2012 vs. 2011rU.S. SHAREHOLDER-OWNED ELECTRIC UTILITIES
* Long-term debt not adjusted for (i.e., includes) securitization bonds.
r = revised
Refer to page v for category descriptions.
Source: SNL Financial and EEI Finance Department
Total Industry Regulated 2012Y 2011Yr Change 2012Y 2011Yr Change
Common Equity 328,471 314,369 14,102 152,982 156,652 (3,670)
Total Preferred Equity 5,074 4,856 217 1,846 2,119 (273)Long-term Debt (current & non-current)* 438,443 411,074 27,369 175,059 182,453 (7,393)
Total Capitalization 771,988 730,299 41,689 329,888 341,223 (11,336)
Common Equity % 42.5% 43.0% (0.5%) 46.4% 45.9% 0.5%
Preferred Equity % 0.7% 0.7% — 0.6% 0.6% (0.1%)
Long-term Debt % 56.8% 56.3% 0.5% 53.1% 53.5% (0.4%)Total 100.0% 100.0% — 100.0% 100.0% —
Mostly Regulated Diversified 2012Y 2011Yr Change 2012Y 2011Yr Change
Common Equity 182,286 154,185 28,101 (6,798) 3,531 (10,329)
Total Preferred Equity 3,111 2,321 790 117 417 (300)Long-term Debt (current & non-current)* 222,248 185,380 36,868 41,136 43,241 (2,106)
Total Capitalization 407,645 341,886 65,759 34,455 47,190 (12,735)
Common Equity % 44.7% 45.1% (0.4%) (19.7%) 7.5% (27.2%)
Preferred Equity % 0.8% 0.7% 0.1% 0.3% 0.9% (0.5%)
Long-term Debt % 54.5% 54.2% 0.3% 119.4% 91.6% 27.8% Total 100.0% 100.0% — 100.0% 100.0% —
Energy Outlook (AEO) 2013 Early Release forecast electricity demand growth through 2040 at 0.9% per year—virtually the same as the 1.0% pace (through 2030) EIA projected in its 2008 AEO report. In order to attract the capital necessary to fund the industry’s large investment pro-gram, prospective returns must be adequate compensation for the asso-ciated risk. For this to happen, the industry’s financial outlook must re-main healthy, and it must also retain the ability to fund dividends, a key
A 2008 study by industry consult-ing firm The Brattle Group projected that capital spending by the entire power industry (including public power and IPPs) could total as much as $1.5 trillion during the 2010-2030 period, without incorporating the impact of any carbon regulation. Even though recent demand growth has fallen short of pre-recession esti-mates, the projected long-term trend has not substantially changed. The Energy Information Administration (EIA), for example, in its Annual
Date PPE, Gross ($Mil) % Change from 12/31/2007
12/31/2012 $1,111,309 27.9%
12/31/2011r $1,045,730 20.3%
12/31/2010 $998,482 14.9%
12/31/2009 $948,543 9.2%
12/31/2008 $896,937 3.2%
12/31/2007 $868,929 —
2003
($ Billions)
r = revised
U.S. SHAREHOLDER-OWNED ELECTRIC UTILITIES
Proceeds from Issuance of Common Equity 2003–2012
2004
Source: SNL Financial and EEI Finance Department
2005 2006 2007 2008 20090
2
4
6
8
10
12
14
2010 2011r 2012

EEI 2012 FINANCIAL REVIEW 15
INDUSTRY FINANCIAL PERFORMANCE
strategic tool for attracting capital on terms favorable to both shareholders and ratepayers.
Despite the industry’s successful weathering of the recession and fi-nancial market crisis, it faces sizeable long-term investment needs that will require the navigation of a complex new set of risks in the years ahead. The balance sheet improvements achieved since the last cyclical low point for financial strength in 2002 cannot be taken for granted.
Cash Flow Statement
Net Cash Provided by Operating Activities
Net Cash Provided by Operating Activities was nearly unchanged in 2012 relative to 2011, decreasing by $174 million, or 0.2%, to $84.2 bil-lion from $84.4 billion. This metric increased for 59% of shareholder-owned electric utilities. As shown in the Statement of Cash Flows, the primary driver of the decrease was a $9.7 billion decline in Net Income.
While the industry’s aggregate net income declined, this metric was higher for 53% of companies. Oper-ating Income fell by $2.7 billion, or 4.1%; as a result, most of the change in net income occurred below the operating income line. The primary contributor to the overall decline was a jump in the Net Loss from Non-Recurring and Extraordinary Items from a negative $1.8 billion in 2011 to a negative $13.0 billion in 2012 (see Income Statement section).
Deferred Taxes and Investment Credits remained very high for the
Debt-to-Cap Ratio by Category 2012 vs. 2011rU.S. SHAREHOLDER-OWNED ELECTRIC UTILITIES
Note: Dec. 31, 2012 vs. Dec. 31, 2011. Refer to page v for category descriptions.*No change defined as less than 1.0%
Source: SNL Financial and EEI Finance Department
Regulated Mostly Regulated Diversified Total Industry Number % Number % Number % Number %Lower 11 30.6% 4 22.2% — — 15 26.3%Higher 16 44.4% 8 44.4% 1 33.3% 25 43.9%No Change* 9 25.0% 6 33.3% 2 66.7% 17 29.8%
Total 36 100% 18 100% 3 100% 57 100%
Capitalization Structure by Category 2012 vs. 2011rU.S. SHAREHOLDER-OWNED ELECTRIC UTILITIES
* Long-term debt not adjusted for (i.e., includes) securitization bonds.
r = revised
Refer to page v for category descriptions.
Source: SNL Financial and EEI Finance Department
Total Industry Regulated 2012Y 2011Yr Change 2012Y 2011Yr Change
Common Equity 328,471 314,369 14,102 152,982 156,652 (3,670)
Total Preferred Equity 5,074 4,856 217 1,846 2,119 (273)Long-term Debt (current & non-current)* 438,443 411,074 27,369 175,059 182,453 (7,393)
Total Capitalization 771,988 730,299 41,689 329,888 341,223 (11,336)
Common Equity % 42.5% 43.0% (0.5%) 46.4% 45.9% 0.5%
Preferred Equity % 0.7% 0.7% — 0.6% 0.6% (0.1%)
Long-term Debt % 56.8% 56.3% 0.5% 53.1% 53.5% (0.4%)Total 100.0% 100.0% — 100.0% 100.0% —
Mostly Regulated Diversified 2012Y 2011Yr Change 2012Y 2011Yr Change
Common Equity 182,286 154,185 28,101 (6,798) 3,531 (10,329)
Total Preferred Equity 3,111 2,321 790 117 417 (300)Long-term Debt (current & non-current)* 222,248 185,380 36,868 41,136 43,241 (2,106)
Total Capitalization 407,645 341,886 65,759 34,455 47,190 (12,735)
Common Equity % 44.7% 45.1% (0.4%) (19.7%) 7.5% (27.2%)
Preferred Equity % 0.8% 0.7% 0.1% 0.3% 0.9% (0.5%)
Long-term Debt % 54.5% 54.2% 0.3% 119.4% 91.6% 27.8% Total 100.0% 100.0% — 100.0% 100.0% —

16 EEI 2012 FINANCIAL REVIEW
INDUSTRY FINANCIAL PERFORMANCE
Consolidated Balance SheetU.S. SHAREHOLDER-OWNED ELECTRIC UTILITIES
($ Millions) 12/31/2012 12/31/2011r % Change $ Change PP&E in service, gross 1,111,309 1,045,730 6.3% 65,579 Accumulated depreciation 350,504 340,310 3.0% 10,194 Net property in service 760,805 705,420 7.9% 55,385
Construction work in progress 62,450 64,507 (3.2%) (2,057) Net nuclear fuel 14,640 14,037 4.3% 603Other property 2,069 2,235 (7.5%) (167) Net property & equipment 839,963 786,199 6.8% 53,764 Cash & cash equivalents 13,724 14,480 (5.2%) (756)Accounts receivable 35,430 37,371 (5.2%) (1,941)Inventories 26,180 25,892 1.1% 288 Other current assets 48,129 48,325 (0.4%) (196) Total current assets 123,462 126,068 (2.1%) (2,606) Total investments 74,482 70,621 5.5% 3,861 Other assets 226,564 216,600 4.6% 9,964 Total Assets 1,264,471 1,199,489 5.4% 64,982 Common equity 328,471 314,369 4.5% 14,102 Preferred equity 263 99 165.2% 164 Noncontrolling interests 4,811 4,757 1.1% 54 Total equity 333,545 319,225 4.5% 14,320 Short-term debt 24,277 19,879 22.1% 4,398 Current portion of long-term debt 30,537 24,042 27.0% 6,495 Short-term and current long-term debt 54,814 43,921 24.8% 10,893 Accounts payable 56,777 57,410 (1.1%) (633)Other current liabilities 36,237 39,765 (8.9%) (3,528) Current liabilities 147,828 141,096 4.8% 6,732 Deferred taxes 123,049 114,416 7.5% 8,633 Non-current portion of long-term debt 407,906 387,032 5.4% 20,874 Other liabilities 250,742 236,297 6.1% 14,445 Total liabilities 929,525 878,841 5.8% 50,684 Subsidiary preferred 1,397 1,371 1.9% 26 Other mezzanine 5 52 (90.5%) (47)Total mezzanine level 1,402 1,423 (1.5%) (21) Total Liabilities and Owner's Equity 1,264,471 1,199,489 5.4% 64,982
r = revised
Note: Balance items for all three periods have been adjusted due to M&A-related activity. In particular, the subsidiary NSTAR Electric is the proxy for the former NSTAR LLC holding company because NSTAR LLC filings are not available.
Source: SNL Financial and EEI Finance Department

EEI 2012 FINANCIAL REVIEW 17
INDUSTRY FINANCIAL PERFORMANCE
fifth straight year, although they de-clined by $2.5 billion, or 18.3%, to $11.3 billion in 2012 from $13.9 billion in 2011. Nevertheless, these totals remained well above the $2.3 billion level in 2007. In combina-tion with the industry’s elevated capital expenditures, the effect of bonus depreciation created a signifi-cant increase in deferred taxes over the period. In the case of 50% bo-nus depreciation, the accelerated depreciation schedule allows for an additional first-year depreciation deduction equal to 50% of the ad-justed basis of eligible property. The “50% bonus depreciation” clause was implemented in the Economic Stimulus Act of 2008, extended through 2009 as part of the Ameri-can Recovery and Reinvestment Act (ARRA) and through 2010 as part of the Small Business Jobs Act of 2010 (passed in September 2010). In December 2010, the Tax Relief, Unemployment Insurance Reau-thorization, and Job Creation Act was signed into law, providing for continued 50% bonus depreciation through 2012 (2013 for long-lived assets) and introducing 100% bonus depreciation (also referred to as “full and immediate expensing”) for qual-ified assets placed in service between September 8, 2010 and December 31, 2011.
Bonus depreciation has been in place, in degrees ranging from 30% to 100%, since September 11, 2001. This has supported the financing of the industry’s rising capex by re-ducing the need for outside capital, while also fulfilling the goal of cre-ating high quality jobs (both perma-nent and temporary).
Statement of Cash FlowsU.S. SHAREHOLDER-OWNED ELECTRIC UTILITIES
r = revised NM = not meaningful
$ Millions 12 Months Ended 12/31/2012 12/31/2011r % ChangeNet Income $21,106 $30,830 (31.5%)Depreciation and Amortization 41,504 38,608 7.5% Deferred Taxes and Investment Credits 11,334 13,877 (18.3%)Operating Changes in AFUDC (1,157) (1,133) 2.1% Change in Working Capital (1,305) 1,853 NM Other Operating Changes in Cash 12,760 381 NM Net Cash Provided by Operating Activities 84,242 84,416 (0.2%) Capital Expenditures (90,486) (78,610) 15.1% Asset Sales 11,519 17,652 (34.7%)Asset Purchases (13,993) (23,765) (41.1%)Net Non-Operating Asset Sales and Purchases (2,474) (6,112) (59.5%)Change in Nuclear Decommissioning Trust (880) (852) 3.3% Investing Changes in AFUDC 142 114 24.5% Other Investing Changes in Cash (597) 1,088 NM Net Cash Used in Investing Activities (94,295) (84,372) 11.8% Net Change in Short-term Debt 4,986 2,231 123.5% Net Change in Long-term Debt 21,739 11,964 81.7% Proceeds from Issuance of Preferred Equity 855 123 595.1% Preferred Share Repurchases (613) (400) 53.3% Net Change in Prefered Issues 242 (277) NM Proceeds from Issuance of Common Equity 3,529 5,227 (32.5%)Common Share Repurchases (821) (1,841) (55.4%) Net Change in Common Issues 2,708 3,386 (20.0%)Dividends Paid to Common Shareholders (20,423) (19,276) 6.0% Dividends Paid to Preferred Shareholders (150) (179) (16.2%)Other Dividends (67) (59) 12.4% Dividends Paid to Shareholders (20,640) (19,514) 5.8% Other Financing Changes in Cash (48) (1,130) (95.8%)Net Cash (Used in) Provided by Financing Activities 8,988 (3,340) NM Other Changes in Cash 23 (12) NM
Net increase (decrease) in cash and cash equivalents $(1,043) $(3,308) (68.5%) Cash and cash equivalents at beginning of period $14,766 $17,788 (17.0%) Cash and cash equivalents at end of period $13,724 $14,480 (5.2%)
Notes: 1. Dollar amounts and percentages may reflect rounding.
2. The consolidated financial statements aim to include information from all shareholder-owned U.S. electric utilities. Six of these companies have been acquired by other entities, including foreign-based firms and investment funds, in recent years.
Source: SNL Financial and EEI Finance Department
18 EEI 2012 FINANCIAL REVIEW
INDUSTRY FINANCIAL PERFORMANCE
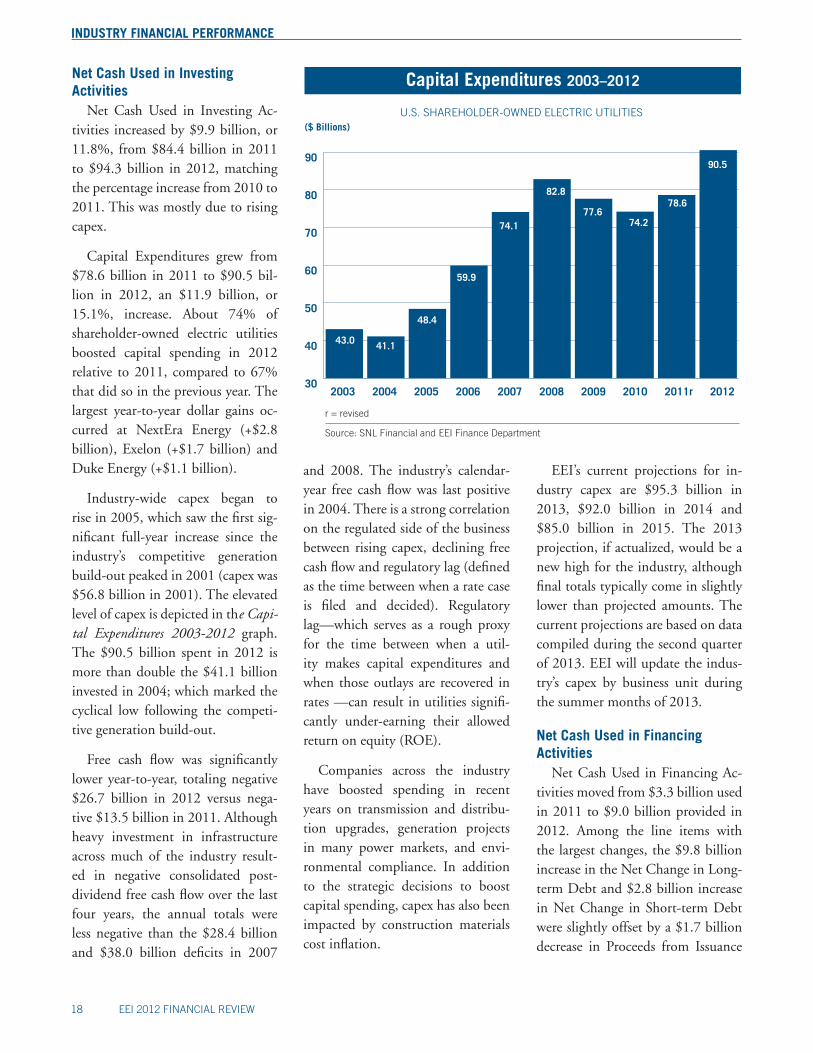
EEI’s current projections for in-dustry capex are $95.3 billion in 2013, $92.0 billion in 2014 and $85.0 billion in 2015. The 2013 projection, if actualized, would be a new high for the industry, although final totals typically come in slightly lower than projected amounts. The current projections are based on data compiled during the second quarter of 2013. EEI will update the indus-try’s capex by business unit during the summer months of 2013.
Net Cash Used in Financing Activities
Net Cash Used in Financing Ac-tivities moved from $3.3 billion used in 2011 to $9.0 billion provided in 2012. Among the line items with the largest changes, the $9.8 billion increase in the Net Change in Long-term Debt and $2.8 billion increase in Net Change in Short-term Debt were slightly offset by a $1.7 billion decrease in Proceeds from Issuance
and 2008. The industry’s calendar-year free cash flow was last positive in 2004. There is a strong correlation on the regulated side of the business between rising capex, declining free cash flow and regulatory lag (defined as the time between when a rate case is filed and decided). Regulatory lag—which serves as a rough proxy for the time between when a util-ity makes capital expenditures and when those outlays are recovered in rates —can result in utilities signifi-cantly under-earning their allowed return on equity (ROE).
Companies across the industry have boosted spending in recent years on transmission and distribu-tion upgrades, generation projects in many power markets, and envi-ronmental compliance. In addition to the strategic decisions to boost capital spending, capex has also been impacted by construction materials cost inflation.
20122003
Capital Expenditures 2003–2012
($ Billions)
r = revised
Source: SNL Financial and EEI Finance Department
2004 200530
40
50
60
70
80
90
2006
U.S. SHAREHOLDER-OWNED ELECTRIC UTILITIES
2007
43.0 41.1
48.4
59.9
74.1
2009
82.8
77.6
2008 2010 2011r
74.2
78.6
90.5
Net Cash Used in Investing Activities
Net Cash Used in Investing Ac-tivities increased by $9.9 billion, or 11.8%, from $84.4 billion in 2011 to $94.3 billion in 2012, matching the percentage increase from 2010 to 2011. This was mostly due to rising capex.
Capital Expenditures grew from $78.6 billion in 2011 to $90.5 bil-lion in 2012, an $11.9 billion, or 15.1%, increase. About 74% of shareholder-owned electric utilities boosted capital spending in 2012 relative to 2011, compared to 67% that did so in the previous year. The largest year-to-year dollar gains oc-curred at NextEra Energy (+$2.8 billion), Exelon (+$1.7 billion) and Duke Energy (+$1.1 billion).
Industry-wide capex began to rise in 2005, which saw the first sig-nificant full-year increase since the industry’s competitive generation build-out peaked in 2001 (capex was $56.8 billion in 2001). The elevated level of capex is depicted in the Capi-tal Expenditures 2003-2012 graph. The $90.5 billion spent in 2012 is more than double the $41.1 billion invested in 2004; which marked the cyclical low following the competi-tive generation build-out.
Free cash flow was significantly lower year-to-year, totaling negative $26.7 billion in 2012 versus nega-tive $13.5 billion in 2011. Although heavy investment in infrastructure across much of the industry result-ed in negative consolidated post-dividend free cash flow over the last four years, the annual totals were less negative than the $28.4 billion and $38.0 billion deficits in 2007

EEI 2012 FINANCIAL REVIEW 19
INDUSTRY FINANCIAL PERFORMANCE
of Common Equity and a $1.1 bil-lion rise in Dividends Paid to Com-mon Shareholders. Long-term debt has ramped up in recent years, show-ing net increases of $21.7 billion, $12.0 billion, $9.3 billion, $17.9 bil-lion and $33.0 billion in 2012, 2011, 2010, 2009 and 2008 respectively.
Given the industry’s elevated capi-tal spending, it is not surprising that long-term debt continues to rise af-ter the sizeable debt pay-downs from 2003 through mid-year 2006. Total long-term debt fell from $349.7 bil-lion at the end of 2003 to $322.8 bil-lion at June 30, 2006, and has since risen to $438.4 billion (including securitized debt) at December 31, 2012. Despite the very challenging debt market for most U.S. business sectors in late 2008 and early 2009, the electric utility industry was able to issue long-term debt throughout the period, due in large measure to its strong financial condition, predomi-nantly regulated business strategies and the importance of its product to our overall quality of life.
Proceeds from Issuance of Com-mon Equity fell by $1.7 billion or 32.5% in 2012 following a 32.9% decline in 2011. Common equity is-suance rose to $7.8 billion in 2010 and $8.6 billion in 2009 from $4.8 billion and $4.3 billion in 2007 and 2008, as companies sought the right debt/equity balance to fund elevated capital spending. From 2003 through 2006, annual issuance ranged from $8.3 billion to $10.0 billion. This metric rose from $5.0 billion and $5.6 billion in 2000 and 2001 to $13.1 billion in 2002, before set-tling in the $8 to $10 billion range. The industry’s strong stock market
0
10
20
30
40
50
60
70
80
90
100
Capital Spending —Trailing 12 MonthsU.S. SHAREHOLDER-OWNED ELECTRIC UTILITIES
‘09Q1
Source: SNL Financial and EEI Finance Department
($ Billions)
‘09Q2
‘09Q3
‘09Q4
‘10Q4
‘10Q1
‘10Q2
‘10Q3
‘11Q4
‘11Q1
‘11Q2
‘11Q3
‘12Q4
83.2 81.6 80.4
74.1
90.586.284.8
82.2
74.273.4 74.8 76.078.2 78.6
76.174.6
‘12Q1
‘12Q2
‘12Q3
‘07Q4
76.680.5
84.0 82.8
‘08Q1
‘08Q2
‘08Q3
‘08Q4
77.6
2010 2011r 20122003
($ Billions)
2004 2005 2006
Free Cash Flow (FCF) 2003–2012
U.S. SHAREHOLDER-OWNED ELECTRIC UTILITIES
2007 2008 2009
r = revised
Note: Totals may not equal sum of components due to rounding.
Source: SNL Financial and EEI Finance Department
-40
-35
-30
-25
-20
-15
-10
-5
0
5
10
($ Billions) 2003 2004 2005 2006 2007 2008 2009 2010 2011r 2012
Net Cash Provided by Operating Activities 57.0 58.1 50.2 69.4 61.1 61.3 82.9 77.7 84.4 84.2
Capital Expenditures (43.0) (41.1) (48.4) (59.9) (74.1) (82.8) (77.6) (74.2) (78.6) (90.5)
Dividends Paid to Common Shareholders (12.3) (13.2) (15.1) (16.1) (15.4) (16.5) (17.1) (18.0) (19.3) (20.5)
Free Cash Flow 1.7 3.8 (13.2) (6.6) (28.4) (38.0) (11.8) (14.4) (13.5) (26.7)

20 EEI 2012 FINANCIAL REVIEW
INDUSTRY FINANCIAL PERFORMANCE
during a year, this counts as one in the Raised column. Companies gen-erally use the same quarter each year for dividend changes, typically the first quarter for electric utilities.
Legislation Provides Permanent Dividend Tax Rates
On January 1, 2013, Congress passed the American Taxpayer Re-lief Act of 2012, which prevented the nation from going over the “fis-cal cliff.” As part of this legislation, dividend tax rates, which would have reverted to ordinary income tax lev-els in 2013, were kept low and were permanently linked to the tax rates for capital gains. The top tax rate for both dividends and capital gains is now 20 percent for couples earn-ing more than $450,000 ($400,000 for singles). For taxpayers below these income thresholds, dividends and capital gains will continue to be taxed at the current rates of 15 percent and 0 percent, depending on a filer’s income level. Starting in 2013, a 3.8-percent Medicare tax that was included in the 2010 health care legislation will be applied to all investment income for couples earn-ing more than $250,000 ($200,000 singles).
The continued low dividend tax rates remain important to the in-dustry’s ability to attract capital for investment in emissions reduction, new transmission lines, distribu-tion upgrades, and new generation in many power markets in the years ahead. Notably, parity between divi-dend and capital gains tax rates was preserved, thereby not creating a dis-advantage for dividend-paying com-panies in their capital-raising efforts.
2012 Dividend PatternsU.S. SHAREHOLDER-OWNED ELECTRIC UTILITIES
Source: EEI Finance Department
2011 Dividend PatternsU.S. SHAREHOLDER-OWNED ELECTRIC UTILITIES
No Change39%
Raised59%
Reinstated2%
No Change40%
Raised56%
Omitted2%
Reinstated2%
performance over the last decade, in addition to a widespread desire to strengthen debt-to-capitalization ra-tios, drove the higher stock issuance. Bonus depreciation has also helped finance the industry’s significant cap-ital needs in recent years.
Dividends
The shareholder-owned electric utility industry extended its nine-year-long trend of dividend increases during 2012, supported by favor-able tax rates on dividend income. The year closed with legislation that permanently set dividend tax rates based on income levels. The percent-age of companies that raised their dividend was 73%, up from 58% in 2011 and 60% in 2010. The 2012 result is the highest on record, based on data going back to 1988. The total of 37 companies with a positive
2010 2011r2003
Net Change in Long-term Debt 2003–2012
($ Billions)
2004 2005-25
-20
-15
-10
-5
0
5
10
15
20
25
30
35
40
2006
U.S. SHAREHOLDER-OWNED ELECTRIC UTILITIES
5.8
22.5
34.1
(21.5)
(6.9) 0.2
r = revised
Note: Based on data from industry’s consolidated balance sheet
Source: SNL Financial and EEI Finance Department
27.1
2007 2008
24.6
2009
19.615.9
2012
dividend action (i.e., a reinstatement or raise) was the highest since the 37 of 2008, 43 of 2007 and 41 of 2006, yet the smaller universe of industry companies in 2012 provided for the higher percentage of increases.
As of December 31, 2012, all of the 51 publicly traded companies in the EEI Index were paying a com-mon stock dividend. 2012 was the first year on record where every com-pany paid a dividend for the entire calendar year. This is based on our data set, which goes back to 1988. In 2012, one company reinstated its dividend and no companies reduced their dividend.
The Dividend Patterns table shows the industry’s aggregate divi-dend payments over the past 20 years. Each company is limited to one action per year. For example, if a company raised its dividend twice

EEI 2012 FINANCIAL REVIEW 21
INDUSTRY FINANCIAL PERFORMANCE
suspended its dividend following the devastating tornado that hit its ser-vice territory in May of 2011. Prior to the suspension, Empire District’s dividend was $0.32 per share.
Payout Ratio and Dividend YieldThe electric utility industry con-
tinues to pay out a higher percentage of earnings than does any other busi-ness sector, with a dividend payout ratio of 59.4% for the 12-month period ending December 31, 2012. (The industry’s payout ratio was 61.1% when measured as an un-weighted average of individual com-pany ratios; 59.4% represents an ag-gregate figure).
While the industry’s net income has fluctuated from year-to-year, its payout ratio has remained relatively
IDACORP, headquartered in Boise, Idaho, announced its second increase of the year on September 12, raising the quarterly dividend from $0.33 to $0.38, or 15.2%. This followed the company’s 10.0% increase in Q1 from $0.30 to 0.33, resulting in the overall 27.6% increase. San Diego’s Sempra Energy raised its quarterly dividend from $0.48 to $0.60, the second consecutive large increase by the parent company of San Diego Gas & Electric. This follows a 23.1% increase last year, the industry’s third largest jump in 2011.
Empire District Electric Reinstates Dividend
Empire District Electric, based in Joplin, Missouri, reinstated its quar-terly dividend at $0.25 per share in Q1 2012. The company temporarily
2012 Dividend Increases Average 7.2%
The industry’s average dividend in-crease during 2012 was 7.2%, with a range of 0.8% to 30.8% and a median increase of 3.8%. NV Energy (30.8% in Q2), IDACORP (aggregate 26.7% in Q1 and Q3) and Sempra Energy (25.0% in Q1) had the largest per-centage increases.
NV Energy, based in Las Ve-gas, Nevada, increased its quarterly dividend from $0.13 to $0.17. The company expected the increase to result in a dividend payout ratio of approximately 50% in 2012, and said it will target a range of 55% to 65% in the future. With the latest increase, NV Energy has more than doubled its dividend since reinstat-ing it in July 2007 at $0.08 per share.
during a year, this counts as one in the Raised column. Companies gen-erally use the same quarter each year for dividend changes, typically the first quarter for electric utilities.
Legislation Provides Permanent Dividend Tax Rates
On January 1, 2013, Congress passed the American Taxpayer Re-lief Act of 2012, which prevented the nation from going over the “fis-cal cliff.” As part of this legislation, dividend tax rates, which would have reverted to ordinary income tax lev-els in 2013, were kept low and were permanently linked to the tax rates for capital gains. The top tax rate for both dividends and capital gains is now 20 percent for couples earn-ing more than $450,000 ($400,000 for singles). For taxpayers below these income thresholds, dividends and capital gains will continue to be taxed at the current rates of 15 percent and 0 percent, depending on a filer’s income level. Starting in 2013, a 3.8-percent Medicare tax that was included in the 2010 health care legislation will be applied to all investment income for couples earn-ing more than $250,000 ($200,000 singles).
The continued low dividend tax rates remain important to the in-dustry’s ability to attract capital for investment in emissions reduction, new transmission lines, distribu-tion upgrades, and new generation in many power markets in the years ahead. Notably, parity between divi-dend and capital gains tax rates was preserved, thereby not creating a dis-advantage for dividend-paying com-panies in their capital-raising efforts.
2012 Dividend PatternsU.S. SHAREHOLDER-OWNED ELECTRIC UTILITIES
Source: EEI Finance Department
2011 Dividend PatternsU.S. SHAREHOLDER-OWNED ELECTRIC UTILITIES
No Change39%
Raised59%
Reinstated2%
No Change40%
Raised56%
Omitted2%
Reinstated2%

22 EEI 2012 FINANCIAL REVIEW
INDUSTRY FINANCIAL PERFORMANCE
electric utilities helped support their share prices in recent years, especially during this extended low interest rate environment. The EEI Index rose by a modest 2.1% in 2012, following returns of 20.0%, 7.0% and 10.7% in 2011, 2010 and 2009 respectively.
Business Category ComparisonsAs shown in the Category Compar-
ison - Dividend Payout Ratio table, the Mostly Regulated category of companies paid out the highest por-tion of earnings for the 12 months ended December 31, 2012, with
2. Companies with negative ad-justed earnings are eliminated.
3. Companies with a payout ratio in excess of 200% are elimi-nated.
The industry’s average dividend yield was 4.3% on December 31, 2012, leading all other U.S. business sectors. We calculate the industry’s aggregate dividend yield using an un-weighted average of the 51 pub-licly traded EEI Index companies’ yields. Strong dividend yields among
Sector Comparison, Dividend YieldAs of December 31, 2012
Note: EEI Index Companies' yield based on LTM cash dividends paid; other sectors' yields based on 2012E dividends.
Source: AltaVista Research, SNL Financial, and EEI Finance Department
Sector Dividend Yield (%)EEI Index Companies 4.3.%Utilities 4.4%Consumer Staples 3.3%Materials 2.5%Industrial 2.4%Health Care 2.2%Energy 2.1%Financial 2.1%Technology 2.1%Consumer Discretionary 1.6%
Sector ComparisonDividend Payout Ratio
For 12-month period ending 12/31/12
* For this table, EEI (1) sums dividends and (2) sums earnings of all index companies and then (3) divides to determine the comparable DPR.
Note: EEI Index Companies’ payout ratio based on LTM income before nonrecurring and extraordinary items.
Source: AltaVista Research, SNL Financial, and EEI Finance Department
Sector Payout Ratio (%)EEI Index Companies* 59.4%Utilities 62.2%Consumer Staples 46.7%Materials 37.2%Industrial 32.5%Health Care 28.4%Consumer Discretionary 26.2%Energy 24.5%Financial 23.9%Technology 23.7%
consistent after eliminating non-recurring and extraordinary items from earnings. From 2000-2012, the annual payout ratio (un-weighted) has ranged from 61.1% to 69.6%, with the highest result coming in 2009 due to the weak economy and weather’s impact on earnings. We use the following approach when calculating the industry’s dividend payout ratio:
1. Non-recurring and extraordi-nary items are eliminated from earnings.
1993–Dividend Patterns 2012
U.S. SHAREHOLDER-OWNED ELECTRIC UTILITIES
*Omitted in current year. This number is not included in the Not Paying column.
***Excludes companies that omitted or reinstated dividends
Note: Dividend percent changes are based on year-end comparisons.
Source: EEI Finance Department and SNL Financial
**Prior to 2000 = total industry dividends/total industry earnings, starting in 2000 = average of all companies paying a dividend.
Average of the Increased Dividend Actions *** 5.8% 18.7% 8.4% 9.2% 7.4% 9.4% 7.2% 8.2% 6.8% 7.2%
Average of the Declining Dividend Actions *** (38.4%) (47.4%) (40.0%) NA NA (45.7%) (46.4%) NA (100.0%) NA
2003 2004 2005 2006 2007 2008 2009 2010 2011 2012
**
19931994199519961997199819992000200120022003200420052006200720082009201020112012
Dividend Raised No Change Lowered Omitted* Reinstated Not Paying Total Payout Ratio 65 29 1 – 1 4 100 80.5% 54 37 6 – – 3 100 79.8% 52 40 3 – – 3 98 75.3% 48 44 2 1 1 2 98 70.7% 40 45 6 2 – 3 96 84.2% 40 37 7 – – 5 89 82.1% 29 45 4 – 3 2 83 74.9% 26 39 3 1 – 2 71 63.9% 21 40 3 2 – 3 69 64.1% 26 27 6 3 – 3 65 67.5% 26 24 7 2 1 5 65 63.7% 35 22 1 – – 7 65 67.9% 34 22 1 1 2 5 65 66.5% 41 17 – – – 6 64 63.5% 40 15 – – 3 3 61 62.1% 36 20 1 – 1 1 59 66.8% 31 23 3 – – 1 58 69.6% 34 22 – – – 1 57 62.0% 31 22 – 1 1 – 55 62.8% 30 20 – – 1 – 51 61.1%

EEI 2012 FINANCIAL REVIEW 23
INDUSTRY FINANCIAL PERFORMANCE
a dividend payout ratio of 67.3%. This compares to 59.1% for the Regulated group. The Regulated cat-egory had the highest payout ratio in eight of the previous nine calendar years, only surpassed by the Mostly Regulated category in 2009. The Diversified category had a dividend payout ratio of 43.5% for the 12 months ended December 31, 2012, but only two companies factored into this calculation (one of the three Diversified companies is not pub-licly traded). As seen in the Category Comparison, Dividend Yield table, the Mostly Regulated category had the highest dividend yield of 4.4% on December 31, 2012, compared to the Regulated category’s 4.2% and Diversified’s 4.0%.
Free Cash Flow Deficit Continues in 2012
The industry’s free cash flow re-mained in negative territory in 2012, following seven straight years of negative results. Free cash flow was a negative $26.7 billion in 2012, com-pared to a negative $13.5 in 2011. The vast majority of the decline is due to an $11.9 billion, or 15.1%, increase in capital expenditures. Common dividends paid increased $1.0 billion, or 6.0%, while net cash provided by operations was nearly unchanged. The industry’s capital spending remains historically high due to elevated levels of investment in environmental compliance, trans-mission and distribution upgrades, and new generation capacity.
EEI’s latest projections for indus-try capex are $95.3 billion in 2013, $92.0 billion in 2014 and $85.0 bil-lion in 2015. This revision is based on a review in May 2013 of the latest capex projections for our entire uni-verse of companies.
2. Companies with negative ad-justed earnings are eliminated.
3. Companies with a payout ratio in excess of 200% are elimi-nated.
The industry’s average dividend yield was 4.3% on December 31, 2012, leading all other U.S. business sectors. We calculate the industry’s aggregate dividend yield using an un-weighted average of the 51 pub-licly traded EEI Index companies’ yields. Strong dividend yields among
Sector Comparison, Dividend YieldAs of December 31, 2012
Note: EEI Index Companies' yield based on LTM cash dividends paid; other sectors' yields based on 2012E dividends.
Source: AltaVista Research, SNL Financial, and EEI Finance Department
Sector Dividend Yield (%)EEI Index Companies 4.3.%Utilities 4.4%Consumer Staples 3.3%Materials 2.5%Industrial 2.4%Health Care 2.2%Energy 2.1%Financial 2.1%Technology 2.1%Consumer Discretionary 1.6%
Sector ComparisonDividend Payout Ratio
For 12-month period ending 12/31/12
* For this table, EEI (1) sums dividends and (2) sums earnings of all index companies and then (3) divides to determine the comparable DPR.
Note: EEI Index Companies’ payout ratio based on LTM income before nonrecurring and extraordinary items.
Source: AltaVista Research, SNL Financial, and EEI Finance Department
Sector Payout Ratio (%)EEI Index Companies* 59.4%Utilities 62.2%Consumer Staples 46.7%Materials 37.2%Industrial 32.5%Health Care 28.4%Consumer Discretionary 26.2%Energy 24.5%Financial 23.9%Technology 23.7%

24 EEI 2012 FINANCIAL REVIEW
INDUSTRY FINANCIAL PERFORMANCE
1.3%, 3.1% and 0.4% in the first through fourth quarters, respectively. GDP growth for full-year 2012 to-taled 2.2%, continuing the positive trend of 1.8% and 2.4% growth in 2011 and 2010 and contrasting with contractions of 3.1% and 0.3% in 2009 and 2008.
Three-and-a-half years after the worst recession since the Great De-pression, the economy has yet to ful-ly regain the strength it had achieved before the downturn. By almost any measure, a lingering gap remains: there are three million fewer persons employed than at the start of the recession in December 2007, U.S. industrial production is down 1.3% from pre-recession levels, and hous-ing sales in 2012 were 15% below what they were in 2007. While there has been tangible movement in clos-ing this gap over the last few years, the progress has been slow and un-even. This anemic rebound contin-ues to impact electricity sales in each of the three retail sectors.
Electricity sales by U.S. sharehold-er-owned utilities fell 3.4% in 2012, a decline driven in part by the year’s sub-par economic growth rate but also by a very mild winter, which decreased the use of electricity for heating. While cooling degree days remained much higher than normal, they were close to flat year-to-year. Heating degree days fell 12.9% from the prior year’s level and were 16.6% lower than normal. Notably, total cooling degree days fell between 2% and 8% in the South Atlantic, East South Central and West South Cen-tral; together these regions include 32% of all electricity customers na-tionwide.
dends rose by $1.3 billion, or 7.2%. From 2003 through 2012, total in-dustry-wide dividends rose 66% to $20.4 billion from $12.3 billion.
Electricity Sales and Revenues
Overview of 2012Nationwide electricity sales are
driven by the strength and nature of U.S. economic growth, weather-related heating and cooling demand, and the price of electricity. In 2012, U.S. real (inflation-adjusted) gross domestic product (GDP), as mea-sured by the Bureau of Economic Analysis, again increased in each quarter of the year—growing 2.0%,
While some analysts define free cash flow as the difference between cash flow from operations and capi-tal expenditures, we also deduct common dividends due to the utility industry’s strong tradition of divi-dend payments. Aggregate pre-divi-dend free cash flow fell into negative territory in 2012, at negative $6.3 billion, following a positive $5.8 bil-lion result in 2011. This metric had fallen to a negative $21.5 billion in 2008 from a negative $13.0 billion in 2007 (the industry’s first deficit year since 2001).
Total aggregate industry-wide cash dividends paid to common shareholders rose by $1.1 billion, or 6.0%, in 2012 compared to the year-ago period. In the prior year, divi-
Category Comparison, Dividend YieldAs of December 31, 2012
1Refer to page v for category descriptions.Source: EEI Finance Department and SNL Financial
Category1 Dividend Yield
EEI Index 4.3%Regulated 4.2%Mostly Regulated 4.4%Diversified 4.0%
Category Comparison – Dividend Payout Ratio
* Removing Duke's payout ratio of 151% would produce a category ratio of 54.6%1 Refer to page v for category descriptions.
Note: In addition to the impact of dividend strategies and company earnings, the dividend payout ratios for each category are also affected by the movement of companies between categories and by dividend reinstatements and cancellations.
Source: EEI Finance Department, SNL Financial, and company annual reports
EEI Index 67.9 66.5 63.3 62.1 66.8 69.6 62.0 62.8 61.1Regulated 78.3 68.4 71.5 65.0 71.2 68.2 64.1 63.4 59.1Mostly Regulated 59.0 65.0 56.6 63.5 66.7 72.2 60.7 63.1 67.3Diversified 56.7 64.3* 54.5 45.5 44.6 69.2 49.7 54.7 43.5
Category1 2004 2005 2006 2007 2008 2009 2010 2011 2012

EEI 2012 FINANCIAL REVIEW 25
INDUSTRY FINANCIAL PERFORMANCE
Dividend SummaryAs of December 31, 2012
U.S. SHAREHOLDER-OWNED ELECTRIC UTILITIES
Company Name StockCompany Category
AnnualizedDividends
PayoutRatio
Yield(%)
LastAction To From
DateAnnounced
ALLETE, Inc. ALE R $1.84 71.2% 4.5% Raised $1.84 $1.78 2012 Q1
Alliant Energy Corporation LNT R $1.80 58.5% 4.1% Raised $1.80 $1.70 2012 Q1
Ameren Corporation AEE R $1.60 23.8% 5.2% Raised $1.60 $1.54 2011 Q4
American Electric Power Company, Inc. AEP R $1.88 58.8% 4.4% Raised $1.88 $1.84 2011 Q4
Avista Corporation AVA R $1.16 79.6% 4.8% Raised $1.16 $1.10 2012 Q1
Black Hills Corporation BKH MR $1.48 75.7% 4.1% Raised $1.48 $1.46 2012 Q1
CenterPoint Energy, Inc. CNP MR $0.81 76.9% 4.2% Raised $0.81 $0.79 2012 Q1
CH Energy Group, Inc. CHG R $2.22 66.4% 3.4% Raised $2.22 $2.16 2011 Q3
Cleco Corporation CNL R $1.35 48.2% 3.4% Raised $1.35 $1.25 2012 Q4
CMS Energy Corporation CMS R $0.96 67.0% 3.9% Raised $0.96 $0.84 2012 Q1
Consolidated Edison, Inc. ED R $2.42 62.1% 4.4% Raised $2.42 $2.40 2012 Q1
Dominion Resources, Inc. D MR $2.25 48.4% 4.3% Raised $2.25 $2.11 2012 Q4
DTE Energy Company DTE R $2.48 60.7% 4.1% Raised $2.48 $2.35 2012 Q2
Duke Energy Corporation DUK MR $3.06 73.8% 4.8% Raised $3.06 $3.00 2012 Q2
Edison International EIX R $1.35 32.2% 3.0% Raised $1.35 $1.30 2012 Q4
El Paso Electric Company EE R $1.00 42.8% 3.1% Raised $1.00 $0.88 2012 Q2
Empire District Electric Company EDE R $1.00 75.9% 4.9% Raised $1.00 – 2012 Q1
Entergy Corporation ETR R $3.32 48.1% 5.2% Raised $3.32 $3.00 2010 Q2
Exelon Corporation EXC MR $2.10 89.6% 7.1% Raised $2.10 $2.00 2008 Q4
FirstEnergy Corp. FE MR $2.20 119.3% 5.3% Raised $2.20 $2.00 2007 Q4
Great Plains Energy Inc. GXP R $0.87 62.0% 4.3% Raised $0.87 $0.85 2012 Q4
Hawaiian Electric Industries, Inc. HE D $1.24 53.3% 4.9% Raised $1.24 $1.22 1998 Q1
IDACORP, Inc. IDA R $1.52 40.8% 3.5% Raised $1.52 $1.32 2012 Q3
Integrys Energy Group, Inc. TEG R $2.72 72.8% 5.2% Raised $2.72 $2.68 2009 Q1
MDU Resources Group, Inc. MDU D $0.67 33.8% 3.2% Raised $0.67 $0.65 2011 Q4
MGE Energy, Inc. MGEE MR $1.58 56.0% 3.1% Raised $1.58 $1.53 2012 Q4
NextEra Energy, Inc. NEE MR $2.40 57.2% 3.5% Raised $2.40 $2.20 2012 Q1
NiSource Inc. NI MR $0.96 66.3% 3.9% Raised $0.96 $0.92 2012 Q2
Northeast Utilities NU R $1.37 62.4% 3.5% Raised $1.37 $1.18 2012 Q2
NorthWestern Corporation NWE R $1.48 44.3% 4.3% Raised $1.48 $1.44 2012 Q1
NV Energy, Inc. NVE R $0.68 36.4% 3.7% Raised $0.68 $0.52 2012 Q2
OGE Energy Corp. OGE MR $1.67 40.9% 3.0% Raised $1.67 $1.57 2012 Q4
Otter Tail Corporation OTTR MR $1.19 57.6% 4.8% Raised $1.19 $1.17 2008 Q1
Pepco Holdings, Inc. POM MR $1.08 92.2% 5.5% Raised $1.08 $1.04 2008 Q1
PG&E Corporation PCG R $1.82 59.5% 4.5% Raised $1.82 $1.68 2010 Q1
Pinnacle West Capital Corporation PNW R $2.18 53.7% 4.3% Raised $2.18 $2.10 2012 Q4
PNM Resources, Inc. PNM R $0.58 37.5% 2.8% Raised $0.58 $0.50 2012 Q1
Portland General Electric Company POR R $1.08 57.9% 3.9% Raised $1.08 $1.06 2012 Q2
PPL Corporation PPL MR $1.44 51.7% 5.0% Raised $1.44 $1.40 2012 Q1

26 EEI 2012 FINANCIAL REVIEW
INDUSTRY FINANCIAL PERFORMANCE
EEI reports electricity customers, sales and revenues for all U.S. share-holder-owned electric utilities—adding several smaller companies to the universe covered in our Income Statement, Balance Sheet and Cash Flow Statement analyses.
Electricity Sales and DeliveriesElectricity sales—defined as the
amount of energy (in gigawatt-hours) sold by shareholder-owned electric utilities to end custom-ers—fell again in 2012, decreasing 3.4% for the year after falling 4.0% in 2011. Electricity sales rose 4.2%
Electricity Sales & Revenues 2011–2012U.S. SHAREHOLDER-OWNED ELECTRIC UTILITIES
r = revised p = preliminary Note: Amounts and percentages may reflect rounding.* For 2011, the Energy Information Administration conducted a special survey of the Transportation Sector and revised the number of customers count due to reporting errors in the past.
Source: EEI Business Information Group
12 Months Ended 12 Months Ended % Change 12/31/2012p 12/31/2011r
NUMBER OF CUSTOMERS (Avg.)
Residential 87,603,147 88,149,193 (0.6%)Commercial 12,431,246 12,366,484 0.5% Industrial 396,788 397,787 (0.3%)Other * 76 73 3.8% Total Customers 100,431,257 100,913,537 (0.5%)
ELECTRICITY SALES (GWh)
Residential 855,386 900,129 (5.0%)Commercial 899,927 923,072 (2.5%)Industrial 539,547 553,044 (2.4%)Other 2,958 2,952 0.2% Total Sales 2,297,818 2,379,197 (3.4%)
ELECTRICITY DELIVERIES (GWh)
Residential 890,742 924,572 (3.7%)Commercial 982,333 986,605 (0.4%)Industrial 649,655 657,964 (1.3%)Other 6,834.66 6,883.65 (0.7%)Total Deliveries 2,529,564 2,576,025 (1.8%)
REVENUES ($ Million)
Residential 107,986 109,969 (1.8%)Commercial 93,904 97,066 (3.3%)Industrial 40,107 38,685 3.7% Other 363 388 (6.4%)Total Revenues 242,360 246,108 (1.5%)
Categories: R = Regulated: greater than 80% of total assets are regulated MR = Mostly Regulated: 50-80% of total assets are regulated D = Diversified: less than 50% of total assets are regulated Annualized Dividend: Per share amounts are annualized declared figures as of 12/31/12. Payout Ratio: Dividends paid for 12 months ended 12/31/12 divided by net income before extraordinary and nonrecurring items for 12 months ended 12/31/12. Dividend Yield: Annualized Dividends Per Share at 12/31/12 divided by stock price at market close on 12/31/12. “NM” applies to companies with negative earnings or payout ratios greater than 200%. Source: EEI Finance Department and SNL Financial
Dividend Summary (cont.)As of December 31, 2012
U.S. SHAREHOLDER-OWNED ELECTRIC UTILITIES
Company Name StockCompany Category
AnnualizedDividends
PayoutRatio
Yield(%)
LastAction To From
DateAnnounced
Public Service Enterprise Group Incorporated PEG MR $1.42 51.0% 4.6% Raised $1.42 $1.37 2012 Q1
SCANA Corporation SCG MR $1.98 61.2% 4.3% Raised $1.98 $1.94 2012 Q1
Sempra Energy SRE MR $2.40 59.9% 3.4% Raised $2.40 $1.92 2012 Q1
Southern Company SO R $1.96 70.7% 4.6% Raised $1.96 $1.89 2012 Q2
TECO Energy, Inc. TE R $0.88 73.0% 5.3% Raised $0.88 $0.86 2012 Q1
UIL Holdings Corporation UIL R $1.73 84.4% 4.8% Raised $1.73 $1.69 1996 Q1
Unitil Corporation UTL R $1.38 90.0% 5.3% Raised $1.38 $1.36 1999 Q1
UNS Energy UNS R $1.72 76.6% 4.1% Raised $1.72 $1.68 2012 Q1
Vectren Corporation VVC R $1.42 72.5% 4.8% Raised $1.42 $1.40 2012 Q4
Westar Energy, Inc. WR R $1.32 55.4% 4.6% Raised $1.32 $1.28 2012 Q1
Wisconsin Energy Corporation WEC R $1.36 50.8% 3.7% Raised $1.36 $1.20 2012 Q4
Xcel Energy Inc. XEL R $1.08 53.8% 4.0% Raised $1.08 $1.04 2012 Q2
Industry Average 61.1% 4.3%
and fell 4.5%, respectively, in 2010 and 2009. On an absolute basis (i.e., not adjusted for weather), electricity sales in 2012 were down 6.2% ver-sus sales ten years prior, in 2002 (see chart, Annual Electricity Sales 2002-2012).
Residential, commercial and in-dustrial sales decreased by 5.0%, 2.5% and 2.4%, respectively, in 2012. While all categories of cus-tomers contributed to 2012’s sales decline, residential customers repre-sented more than half (55%) of the contraction. This segment typically
represents about 37% of sales and a somewhat larger percentage of total revenue (see charts Electricity Sales by Class of Service and Revenues by Class of Service). 2011 saw similar changes as sales fell across the board; howev-er, in 2011, industrial sales account-ed for most of the total contraction (54%).
The continued contraction in in-dustrial sales was inconsistent with the continued, if moderate, growth in U.S. industrial production, which increased 3.6% in 2012 after rising 3.4% in 2011 and 5.7% in 2010.

EEI 2012 FINANCIAL REVIEW 27
INDUSTRY FINANCIAL PERFORMANCE
The relatively larger increase in 2010 helped drive a 7.8% jump in indus-trial electricity sales in that year. In-dustrial production declined sharply in 2009 and 2008 (by 11.3% and 3.4%, respectively), after growing an average of 2.3% annually from 2003 through 2007.
Electricity deliveries—defined as the amount of energy (in gigawatt-hours) distributed by shareholder-owned utilities over their trans-mission and distribution (T&D) networks—decreased by 1.8% in 2012. Electricity consumers in de-regulated states can buy generation from competitive energy companies, but competitive generation is dis-tributed (or delivered) by regulated utilities within exclusive service ter-ritories. The fact that electricity de-liveries (-1.8%) fell less than electric-ity sales (-3.4%) in 2012 indicates that American homes and businesses relied proportionally less on share-holder-owned utilities for electricity generation.
EEI’s Business Information Group also tracks demand on a weekly ba-sis, compiling data showing the combined electric output from shareholder-owned utilities, rural electric cooperatives and govern-ment power projects in the contigu-ous United States. For this broader group of power producers, 2012’s output of 3,991,408 gigawatt-hours (GWh) represented a 1.8% decrease from 2011. This marked the fourth time in the last five years that an-nual electric output was lower than the previous year’s total. The only annual increase during the last five years occurred in 2010, when elec-tric output was up 3.9% from 2009’s
region had a year-to-year increase of 0.9%, and the Pacific Southwest re-gion experienced an increase of 0.6% over 2011.
Weather TrendsThe National Oceanic and Atmo-
spheric Administration (NOAA)’s National Climactic Data Center
Annual Electricity Sales 2002-2012
U.S. SHAREHOLDER-OWNED ELECTRIC UTILITIES
2008 2009 2010 2012p2002 2003 2004 2005
(Sales [GWh])
r = revised p = preliminary
Source: EEI Business Information Group
2006 20071,900,000
2,000,000
2,100,000
2,200,000
2,300,000
2,400,000
2,500,000
2,600,000
2,700,000
2011r
Electricity Sales By Class of Service 2012p
U.S. SHAREHOLDER-OWNED ELECTRIC UTILITIES
Revenues By Class of Service 2012p
U.S. SHAREHOLDER-OWNED ELECTRIC UTILITIES
Source: EEI Business Information Group
Residential37.2%
Commercial39.2%
Industrial23.5%
Other0.1%
Residential44.7%
Commercial39.4%
Other0.2%
Industrial15.7%
p = preliminary
total. On a regional basis, all but two of the regions experienced decreases in electric output in 2012 relative to 2011. The Pacific Northwest region saw the largest year-to-year output decrease in 2012 at 3.6%, with the South Central and Central Industrial regions showing the next highest de-crease at 2.9%. The Rocky Mountain
EEI reports electricity customers, sales and revenues for all U.S. share-holder-owned electric utilities—adding several smaller companies to the universe covered in our Income Statement, Balance Sheet and Cash Flow Statement analyses.
Electricity Sales and DeliveriesElectricity sales—defined as the
amount of energy (in gigawatt-hours) sold by shareholder-owned electric utilities to end custom-ers—fell again in 2012, decreasing 3.4% for the year after falling 4.0% in 2011. Electricity sales rose 4.2%
Electricity Sales & Revenues 2011–2012U.S. SHAREHOLDER-OWNED ELECTRIC UTILITIES
r = revised p = preliminary Note: Amounts and percentages may reflect rounding.* For 2011, the Energy Information Administration conducted a special survey of the Transportation Sector and revised the number of customers count due to reporting errors in the past.
Source: EEI Business Information Group
12 Months Ended 12 Months Ended % Change 12/31/2012p 12/31/2011r
NUMBER OF CUSTOMERS (Avg.)
Residential 87,603,147 88,149,193 (0.6%)Commercial 12,431,246 12,366,484 0.5% Industrial 396,788 397,787 (0.3%)Other * 76 73 3.8% Total Customers 100,431,257 100,913,537 (0.5%)
ELECTRICITY SALES (GWh)
Residential 855,386 900,129 (5.0%)Commercial 899,927 923,072 (2.5%)Industrial 539,547 553,044 (2.4%)Other 2,958 2,952 0.2% Total Sales 2,297,818 2,379,197 (3.4%)
ELECTRICITY DELIVERIES (GWh)
Residential 890,742 924,572 (3.7%)Commercial 982,333 986,605 (0.4%)Industrial 649,655 657,964 (1.3%)Other 6,834.66 6,883.65 (0.7%)Total Deliveries 2,529,564 2,576,025 (1.8%)
REVENUES ($ Million)
Residential 107,986 109,969 (1.8%)Commercial 93,904 97,066 (3.3%)Industrial 40,107 38,685 3.7% Other 363 388 (6.4%)Total Revenues 242,360 246,108 (1.5%)
Categories: R = Regulated: greater than 80% of total assets are regulated MR = Mostly Regulated: 50-80% of total assets are regulated D = Diversified: less than 50% of total assets are regulated Annualized Dividend: Per share amounts are annualized declared figures as of 12/31/12. Payout Ratio: Dividends paid for 12 months ended 12/31/12 divided by net income before extraordinary and nonrecurring items for 12 months ended 12/31/12. Dividend Yield: Annualized Dividends Per Share at 12/31/12 divided by stock price at market close on 12/31/12. “NM” applies to companies with negative earnings or payout ratios greater than 200%. Source: EEI Finance Department and SNL Financial
Dividend Summary (cont.)As of December 31, 2012
U.S. SHAREHOLDER-OWNED ELECTRIC UTILITIES
Company Name StockCompany Category
AnnualizedDividends
PayoutRatio
Yield(%)
LastAction To From
DateAnnounced
Public Service Enterprise Group Incorporated PEG MR $1.42 51.0% 4.6% Raised $1.42 $1.37 2012 Q1
SCANA Corporation SCG MR $1.98 61.2% 4.3% Raised $1.98 $1.94 2012 Q1
Sempra Energy SRE MR $2.40 59.9% 3.4% Raised $2.40 $1.92 2012 Q1
Southern Company SO R $1.96 70.7% 4.6% Raised $1.96 $1.89 2012 Q2
TECO Energy, Inc. TE R $0.88 73.0% 5.3% Raised $0.88 $0.86 2012 Q1
UIL Holdings Corporation UIL R $1.73 84.4% 4.8% Raised $1.73 $1.69 1996 Q1
Unitil Corporation UTL R $1.38 90.0% 5.3% Raised $1.38 $1.36 1999 Q1
UNS Energy UNS R $1.72 76.6% 4.1% Raised $1.72 $1.68 2012 Q1
Vectren Corporation VVC R $1.42 72.5% 4.8% Raised $1.42 $1.40 2012 Q4
Westar Energy, Inc. WR R $1.32 55.4% 4.6% Raised $1.32 $1.28 2012 Q1
Wisconsin Energy Corporation WEC R $1.36 50.8% 3.7% Raised $1.36 $1.20 2012 Q4
Xcel Energy Inc. XEL R $1.08 53.8% 4.0% Raised $1.08 $1.04 2012 Q2
Industry Average 61.1% 4.3%

28 EEI 2012 FINANCIAL REVIEW
INDUSTRY FINANCIAL PERFORMANCE
3,792 HDDs was 17% below aver-age. NOAA’s Electric Home Heated Customer Weighted HDDs showed a slightly less significant decline of 15% year-to-year.
Electricity RevenueRevenue from electricity sales and
deliveries to all customer classes to-taled $242.4 billion in 2012, 1.5% less than in 2011. Shareholder-owned electric utilities’ revenue from residential sales and deliveries fell 1.8%, which correlated with the 5.0% and 3.7% decreases, respec-tively, in electricity unit sales and de-liveries measured in gigawatt-hours. These decreases were partly offset by higher rates. The average residential rate for bundled energy and delivery service, which accounted for 93% of residential revenue in 2012, rose
2012 Weather Compared to 2011AS MEASURED BY DEVIATIONS BETWEEN THE TWO YEARS
Source: National Oceanic and Atmospheric Administration and National Weather Service
(250)
(200)
(150)
(100)
(50)
0
50
100
150
200
Number of Degree Days CoolingDeviationFrom Last
Year
HeatingDeviationFrom Last
Year
Jan Feb MarAprMay JunJul Aug Sep Oct Nov Dec
Total
Cooling Deviation from Last Year
Heating Deviation from Last Year
Jan Feb Mar Apr May Jun Jul Aug Sep Oct Nov Dec
(204)(120)(209)
(16)(76)
(3)(2)2 4
10 71
(18)
(561)
3 1 16
(10)26
(14) (3)
(17)(1)10 (3)3
11
NOAA’s Climate Prediction Cen-ter reported that the nation experi-enced 11 more Cooling Degree Days (CDDs) in 2012 than in 2011, a year-to-year increase of 0.7%, and that the year’s total of 1,489 CDDs was 22% above average (see chart, Heating and Cooling Degree Days and Percent Changes). CDDs are an indi-cator of demand for air condition-ing. Notably, however, total cooling degree days fell between 2% and 8% in the South Atlantic, East South Central and West South Central; to-gether these regions include 32% of all electricity customers nationwide.
Heating Degree Days (HDDs), conversely, are an indicator of heat-ing demand. The U.S. experienced 561, or 13%, fewer HDDs in 2012 than in 2011, while the year’s total of
reported in its State of the Climate National Overview and Global Analysis Reports that 2012’s annual average temperature for the contigu-ous 48 states was 3.2 degrees Fahr-enheit (F) above the 20th century average, making it the warmest year on record (i.e., since 1895). Glob-ally, the combined land and ocean surface temperature in 2012, at 1.03 degrees F above the 20th century av-erage, made it the 10th warmest year on record. Currently, the warmest year on record is 2010, which was 1.19 degrees F above average. In-cluding 2012, all 12 years to date in the 21st century (2001–2012) rank among the 14 warmest in the 133-year period of record (since 1880). Only one year during the 20th cen-tury–1998–was warmer than 2012.
Annual Electricity Sales 2002-2012
U.S. SHAREHOLDER-OWNED ELECTRIC UTILITIES
2008 2009 2010 2012p2002 2003 2004 2005
(Sales [GWh])
r = revised p = preliminary
Source: EEI Business Information Group
2006 20071,900,000
2,000,000
2,100,000
2,200,000
2,300,000
2,400,000
2,500,000
2,600,000
2,700,000
2011r

EEI 2012 FINANCIAL REVIEW 29
INDUSTRY FINANCIAL PERFORMANCE
3,792 HDDs was 17% below aver-age. NOAA’s Electric Home Heated Customer Weighted HDDs showed a slightly less significant decline of 15% year-to-year.
Electricity RevenueRevenue from electricity sales and
deliveries to all customer classes to-taled $242.4 billion in 2012, 1.5% less than in 2011. Shareholder-owned electric utilities’ revenue from residential sales and deliveries fell 1.8%, which correlated with the 5.0% and 3.7% decreases, respec-tively, in electricity unit sales and de-liveries measured in gigawatt-hours. These decreases were partly offset by higher rates. The average residential rate for bundled energy and delivery service, which accounted for 93% of residential revenue in 2012, rose
2012 Weather Compared to 2011AS MEASURED BY DEVIATIONS BETWEEN THE TWO YEARS
Source: National Oceanic and Atmospheric Administration and National Weather Service
(250)
(200)
(150)
(100)
(50)
0
50
100
150
200
Number of Degree Days CoolingDeviationFrom Last
Year
HeatingDeviationFrom Last
Year
Jan Feb MarAprMay JunJul Aug Sep Oct Nov Dec
Total
Cooling Deviation from Last Year
Heating Deviation from Last Year
Jan Feb Mar Apr May Jun Jul Aug Sep Oct Nov Dec
(204)(120)(209)
(16)(76)
(3)(2)2 4
10 71
(18)
(561)
3 1 16
(10)26
(14) (3)
(17)(1)10 (3)3
11
Electricity Sales By Class of Service 2012p
U.S. SHAREHOLDER-OWNED ELECTRIC UTILITIES
Revenues By Class of Service 2012p
U.S. SHAREHOLDER-OWNED ELECTRIC UTILITIES
Source: EEI Business Information Group
Residential37.2%
Commercial39.2%
Industrial23.5%
Other0.1%
Residential44.7%
Commercial39.4%
Other0.2%
Industrial15.7%
p = preliminary

30 EEI 2012 FINANCIAL REVIEW
INDUSTRY FINANCIAL PERFORMANCE
trial bundled service fell by 0.5%. The increase in total revenue was possible because revenues from en-ergy-only and delivery-only service, which together accounted for 23% of industrial sales, rose by 36% and 43%, respectively; these revenues are excluded from bundled rate cal-culations. The decrease in bundled-service rates contrasted with growth that averaged 1.6% per year from 2007 through 2011.
rates that were essentially flat. Simi-lar to, but more moderate than, the trend for residential rates, the aver-age rate for bundled commercial ser-vice rose an average of 1.6% per year from 2007 through 2011.
Revenue from industrial custom-ers rose 3.7% in 2012, in contrast to a decline in industrial sales and deliveries, which fell by 2.4% and 1.3%, respectively. At the same time, rates per kilowatt-hour for indus-
Revenue Per Kilowatt-hour Sold 2002-2012 Cents per Kilowatt-hour
U.S. SHAREHOLDER-OWNED ELECTRIC UTILITIES
r = revised p = preliminaryNote: Based on sales and revenue from bundled electricity sales only.
Source: EEI Business Information Group
Year Residential Commercial Industrial2002 8.53 7.45 4.64 2003 8.85 7.93 5.08 2004 9.07 7.98 5.22 2005 9.63 8.56 5.69 2006 10.64 9.28 6.06 2007 10.95 9.50 6.17 2008 11.50 10.01 6.65 2009 11.76 10.07 6.46 2010 11.81 9.85 6.47 2011r 12.00 10.01 6.55 2012p 12.19 10.02 6.52
Revenue Per Kilowatt-hour Sold 2002–2012U.S. SHAREHOLDER-OWNED ELECTRIC UTILITIES
r = revised p = preliminaryNote: Based on sales and revenue from bundled electricity sales only.
Source: EEI Business Information Group
4
5
6
7
8
9
10
11
12
13
(Cents per kWh)
Residential Commercial Industrial
2012p2002 2003 2004 2005 2006 2008 2009 20102007 2011r
1.6% for the year. Rates increased an average of 2.4% per year for the five years from 2007 through 2011 (see table, Revenue Per Kilowatt-hour Sold).
Revenue from commercial cus-tomers declined by a more substan-tial 3.3% in 2012. As with residential revenue, the decrease in commercial revenue was affected by decreases in unit sales and deliveries, which fell 2.5% and 0.4%, respectively, and
COOLING DEGREE DAYS PERCENTAGE CHANGEHEATING DEGREE DAYS
Jan–12 6 (3) 3 751 (166) (204) (33.3%) 100.0% (18.1%) (21.4%)
Feb–12 11 2 1 654 (101) (120) 22.2% 10.0% (13.4%) (15.5%)
Mar–12 36 18 16 377 (216) (209) 00.0% 80.0% (36.4%) (35.7%)
FIRST QUARTER 53 17 20 1,782 (483) (533) 47.2% 60.6% (21.3%) (23.0%)
Apr–12 47 17 (10) 300 (45) (16) 56.7% (17.5%) (13.0%) (5.1%)
May–12 146 49 26 90 (69) (76) 50.5% 21.7% (43.4%) (45.8%)
Jun–12 242 29 (14) 33 (6) (3) 13.6% (5.5%) (15.4%) (8.3%)
SECOND QUARTER 435 95 2 423 (120) (95) 27.9% 0.5% (22.1%) (18.3%)
Jul–12 408 87 (3) 2 (7) (2) 27.1% (0.7%) (77.8%) (50.0%)
Aug–12 330 40 (17) 8 (7) 2 13.8% (4.9%) (46.7%) 33.3%
Sep–12 183 28 (1) 72 (5) 4 18.1% (0.5%) (6.5%) 5.9%
THIRD QUARTER 921 155 (21) 82 (19) 4 20.2% (2.2%) (18.8%) 5.1%
Oct–12 56 3 10 270 (12) 10 5.7% 21.7% (4.3%) 3.8%
Nov–12 13 (2) (3) 540 1 71 (13.3%) (18.8%) 0.2% 15.1%
Dec–12 11 4 3 695 (122) (18) 57.1% 37.5% (14.9%) (2.5%)
FOURTH QUARTER 80 5 10 1,505 (133) 63 6.7% 14.3% (8.1%) 4.4%
2012 Totals 1,489 272 11 3,792 (755) (561) 22.4% 0.7% (16.6%) (12.9%)
Heating and Cooling Degree Days and Percent Changes January–December 2012
Heating Degree Days Percentage Change from Historical Norm
Cooling Degree Days Percentage Change from Historical Norm
A mean daily temperature (average of the daily maximum and minimum temperatures) of 65°F is the base for both heating and cooling degree day computations. National averages are population weighted.
Source: National Oceanic and Atmospheric Administration and National Weather Service
2003 2004 2005 2006 2007 2008 2009 2010 2011 2012
(2.4) (7.1) (6.5) (13.2) (5.6) (0.8) (0.9) (1.7) (4.5) (16.6)
5.3 3.5 18.7 15.8 14.5 5.3 1.6 19.9 21.5 22.4
Cooling Cooling Heating Heating Degree Degree Degree Degree Total Deviation Deviation Total Deviation Deviation Change Change Change Change From From From From From From From From Norm Last Yr Norm Last Yr Norm Last Yr Norm Last Yr

EEI 2012 FINANCIAL REVIEW 31
INDUSTRY FINANCIAL PERFORMANCE
Rate Case Summary
Shareholder-owned electric utili-ties filed 53 rate cases in 2012, three more than the 50 filed in the pre-vious year. While 2012’s total was slightly less than the 55 filed in 2010 and 66 in 2009, it surpassed that of any other year in recent decades. The current trend of elevated numbers of rate case filings largely reflects a con-struction cycle driven by the need to replace aging infrastructure and reduce the environmental impact of power generation. Capital expendi-ture recovery was the overwhelming motivation for rate case filings in 2012. Utilities’ desire to implement surcharges, trackers, riders, etc., was also a notable cause for filings, as was recovery of rising operations and maintenance (O&M) expenses. Many filings in 2012 reflected utili-ties’ attempts to deal with the effects of the weak economy, such as at-tempts to adjust for lower customer usage, to enhance low-income pro-grams and to support local econo-mies. However, these attempts were less frequent as the year progressed, perhaps signaling a lessening of eco-nomic distress.
The average ROE approved in 2012 was 10.15%, the lowest in re-cent decades. Falling interest rates account for much of the trend of de-clining approved ROEs. Attempts by state commissions to moderate rates during times of financial hardship for many customers have also con-tributed in recent years.
The average requested ROE for 2012 was 10.65%, also the lowest in decades. Average requested ROE has
rates that were essentially flat. Simi-lar to, but more moderate than, the trend for residential rates, the aver-age rate for bundled commercial ser-vice rose an average of 1.6% per year from 2007 through 2011.
Revenue from industrial custom-ers rose 3.7% in 2012, in contrast to a decline in industrial sales and deliveries, which fell by 2.4% and 1.3%, respectively. At the same time, rates per kilowatt-hour for indus-
Revenue Per Kilowatt-hour Sold 2002-2012 Cents per Kilowatt-hour
U.S. SHAREHOLDER-OWNED ELECTRIC UTILITIES
r = revised p = preliminaryNote: Based on sales and revenue from bundled electricity sales only.
Source: EEI Business Information Group
Year Residential Commercial Industrial2002 8.53 7.45 4.64 2003 8.85 7.93 5.08 2004 9.07 7.98 5.22 2005 9.63 8.56 5.69 2006 10.64 9.28 6.06 2007 10.95 9.50 6.17 2008 11.50 10.01 6.65 2009 11.76 10.07 6.46 2010 11.81 9.85 6.47 2011r 12.00 10.01 6.55 2012p 12.19 10.02 6.52
Revenue Per Kilowatt-hour Sold 2002–2012U.S. SHAREHOLDER-OWNED ELECTRIC UTILITIES
r = revised p = preliminaryNote: Based on sales and revenue from bundled electricity sales only.
Source: EEI Business Information Group
4
5
6
7
8
9
10
11
12
13
(Cents per kWh)
Residential Commercial Industrial
2012p2002 2003 2004 2005 2006 2008 2009 20102007 2011r

32 EEI 2012 FINANCIAL REVIEW
INDUSTRY FINANCIAL PERFORMANCE
0 2 4 6 8 10 12 14 16 18 20 22 24 26 28 30 32 34 36
Note: Based on sales and revenue from bundled electricity sales only.
Source: EEI Business Information Group
Residential Revenue Per Kilowatt-hour Sold 2011–revised
U.S. SHAREHOLDER-OWNED ELECTRIC UTILITIES
West South Central
East South Central
Mountain
South Atlantic
West North Central
Middle Atlantic
East North Central
Pacific
U.S. Total
New England
Alaska & Hawaii
(Census Division)
15.67
15.64
13.67
12.00
11.04
11.94
10.59
10.18
10.04
9.97
33.22
Residential Revenue Per Kilowatt-hour Sold 2012–preliminary
U.S. SHAREHOLDER-OWNED ELECTRIC UTILITIES
0 2 4 6 8 10 12 14 16 18 20 22 24 26 28 30 32 34 36
Cents/kWh
South Atlantic
West North Central
East South Central
Mountain
West South Central
East North Central
Pacific
New England
U.S. Total
Middle Atlantic
Alaska & Hawaii
(Census Division)
35.59
15.69
15.27
12.19
12.31
11.24
11.00
9.94
10.08
10.45
Cents/kWh
14.45

EEI 2012 FINANCIAL REVIEW 33
INDUSTRY FINANCIAL PERFORMANCE
due to increased borrowing costs by helping utilities reduce lag.
Filed CasesFor 2012 as a whole, capital in-
vestment was the predominant driver of rate case filings. Florida Power & Light filed to recover $9 billion it intends to spend between 2011 and 2013 to strengthen and improve Florida’s electric genera-tion and delivery system. Similarly, Baltimore Gas and Electric plans to invest more than $3 billion in infra-structure investments over the next five years. Carolina Power & Light filed for recovery of capital expen-ditures to modernize its generation fleet; this is the company’s first rate case filing in North Carolina in 25 years. The main reasons Pacific Gas and Electric gave for its filing in-cluded upgrading infrastructure and
lag. Therefore the decline in allowed ROEs across the industry may over-compensate, in some cases, for de-clining interest rates.
Commissions can allow utilities to shorten regulatory lag through the use of innovative rate approaches such as interim rate increases, ad-justment clauses and other recovery mechanisms, the use of projected costs in rate cases, and construction work in progress (CWIP). CWIP allows a utility to partly recover construction financing costs before a project comes online. These ap-proaches have the added benefit of helping to smooth the introduction of rate increases rather than forcing rates to suddenly jump after a case. Commissions and state legislatures can support utilities’ financial health and help curb future rate increases
followed a declining pattern similar to average awarded ROE, and for similar reasons.
Regulatory LagAverage regulatory lag for 2012
was 9.7 months, near the 10-month average of recent years. During in-dustry restructuring in the late 1990s and early 2000s, the volatility of reg-ulatory lag increased and the average duration rose to almost 13 months. Outside of this period, regulatory lag has been fairly consistent at around 10 months.
During times of rapidly rising spending, utilities attempt to recover rising costs by filing rate cases. How-ever, general regulatory practice bas-es rate cases primarily on historical costs, and preparing for and admin-istrating a case takes time. Costs con-tinue to rise and rates may already be outdated by the time the commis-sion decides the case and puts new rates into effect. EEI defines regula-tory lag as the time between a rate case filing and decision, because these events are specific and mea-sureable. We consider this a rough proxy for the time between when a utility needs recovery and when new rates take effect. Some analysts have argued that regulatory lag is actually longer if other delays are considered, such as the time needed to prepare for a case. This suggests an average regulatory lag closer to twice what our definition measures, or close to two years. However it is measured, lag obstructs utilities’ ability to earn their allowed return when costs are rising, and it can ultimately increase their borrowing costs. Electric utili-ties often fall short of achieving their allowed return due to regulatory
Number of Rate Cases Filed 1990-2012
Source: SNL Financial/Regulatory Research Assoc. and EEI Rate Department
0
5
10
15
20
25
Q4-9
1Q4
-92
Q4-9
3Q4
-94
Q4-9
5Q4
-96
Q4-9
7Q4
-98
Q4-9
9Q4
-00
Q4-0
1Q4
-02
Q4-0
3Q4
-04
Q4-0
5Q4
-06
Q4-1
0
Q4-9
0
Q4-0
7Q4
-08
Q4-0
9
Q4-1
2Q4
-11

34 EEI 2012 FINANCIAL REVIEW
INDUSTRY FINANCIAL PERFORMANCE
modernizing technology in order to enhance safety and reliability and to ensure that its customer service rivals the best in the industry.
A second major reason for filings in 2012 was the desire by utilities to implement surcharges, trackers and riders. Kansas City Power & Light in Missouri is seeking an interim en-ergy charge mechanism that would serve several functions, including providing a sharing mechanism for changes in off-system sales margins that result from meeting or exceed-ing certain levels of off-system sales. This is one of several tracking mech-anisms the company is seeking while it is prohibited from seeking a fuel adjustment clause before June 15, 2015. PPL Electric Utilities filed for a competitive enhancement rider to recover expenses associated with its customer education program and other initiatives designed to encour-age retail competition in Pennsylva-nia. Tucson Electric would also like a lost fixed recovery (decoupling) mechanism to help it recover costs associated with energy efficiency standards established by federal or other governmental agencies be-tween rate cases. Southwestern Pub-lic Service in Texas would like to establish surcharge mechanisms for partial recovery of municipal fran-chise fees, purchased power capacity costs, incremental transmission costs and incremental distribution invest-ment. The company would also like to establish a tracker mechanism for pension and post-employment benefit expenses. The New Mexico branch of the company would like to establish a renewable energy cost rider.
A third widespread cause of case filings in 2012 was rising O&M
Average Awarded ROE 1990-2012
Source: SNL Financial/Regulatory Research Assoc. and EEI Rate Department
9.5
10.0
10.5
11.0
11.5
12.0
12.5
13.0
13.5
Q4-1
0
Q4-9
0Q4
-91
Q4-9
2Q4
-93
Q4-9
4Q4
-95
Q4-9
6Q4
-97
Q4-9
8Q4
-99
Q4-0
0Q4
-01
Q4-0
2Q4
-03
Q4-0
4Q4
-05
Q4-0
6
(Percent)
Q4-0
7Q4
-08
Q4-0
9
Q4-1
2Q4
-11
Jan-
11
10-Year Treasury Yield1/1/03 through 12/31/12
Source: U.S. Federal Reserve
(Percent)
0
1
2
3
4
5
6
7
Jan-
10
Jan-
12
Jan-
03
Jan-
04
Jan-
05
Jan-
06
Jan-
07
Jan-
08
Jan-
09

EEI 2012 FINANCIAL REVIEW 35
INDUSTRY FINANCIAL PERFORMANCE
Similarly, Niagara Mohawk in its filing in New York noted that if it did not get its requested increase it would earn a 6.79% ROE. Duke Energy Ohio filed to recover elec-tric distribution investments that have increased to the point that the company expects its current rates to provide for only a 3.18% return on rate base.
Miscellaneous noteworthy fea-tures of filings in 2012 include: South Carolina Electric & Gas said that part of the reason for its filing was to recover for coal plant retire-ments and associated replacement generation costs and regulatory com-pliance costs, including environmen-tal projects and related expenses. Tuc-son Electric Power filed to establish a three-year energy efficiency pilot pro-gram under which energy efficiency investments would be considered regulatory assets and amortized over a four-year period. During the amortization period, the company would earn a return on the unamor-tized balances and recover the amorti-zation expense through the demand-side management surcharge. Empire District Electric in Missouri would like to recover the cost to restore ser-vice following a May 2011 tornado and the resulting loss of customers. In Baltimore Gas and Electric’s fil-ing, the company requested that the commission discontinue the 50-ba-sis-point downward adjustment of ROEs for utilities with decoupling mechanisms, because decoupling is more widespread than when first implemented by BG&E. Further, 70% of the peer companies BG&E proposed have some form of decou-pling, so the business risk should already be reflected. Pacific Gas and
expenses. Tucson Electric Power filed for recovery of investments made over the past five years to strength-en its distribution system, upgrade power plants and to recover operat-ing expenses related to cyber security enhancement and stricter environ-mental requirements. Higher O&M expenses account for $46 million of Consumer Energy’s requested in-crease of $148.3 million.
Many filings in 2012 reflected utilities’ attempts to deal with a struggling economy. The intent of PPL Electric Utilities’ request was, in part, to help the utility offset lower customer usage and a stagnant eco-nomic climate. Wisconsin Power and Light filed to freeze rates in 2013 and 2014. The company intends to defer collecting economic develop-ment discounts and remove employ-ee incentive compensation expenses and some O&M costs, among other deferrals and removals. The com-pany anticipates these actions will create a deficiency, but takes these actions to encourage further eco-nomic recovery. As a possible protec-tion against too great a shortfall, the company requested an earnings shar-ing mechanism that would allow the company to get rate recovery if the earned ROE falls below 8.5%, share equally with customers return asso-ciated with ROEs between 10.65% and 11.4%, and return to customers return associated with ROEs above 11.4%.
Another driver of 2012 rate cases was concern about returns. Florida Power & Light’s filing requested a 25-basis-point adder if the company maintains the lowest residential typi-cal bill in the state. The company filed partly to get a higher ROE.
Electric would like to establish bal-ancing accounts for major emer-gencies and new regulatory require-ments related to nuclear operations and hydro relicensing. In this case, for the first time, the commission will employ independent experts to review the filing to determine whether safety and security concerns have been addressed and if risk as-sessment and mitigation measures have been adequately incorporated. Southwestern Public Service in Texas would like to get rate recognition for incremental plant in service to reflect revised depreciation rates proposed by the company and to recover an-ticipated increases in costs associated with the company’s participation in the Southwest Power Pool. The company observed in its filing that it earned a 6.25% ROE on weather-normalized Texas operations.
Decided Cases
Return on Equity (ROE)In Lone Star Transmission’s first-
ever decision the commission ad-opted a 9.6% ROE finding that “the discounted cash flow model and the risk premium approach support an ROE of 9.60% . . . consistent with Lone Star’s business and regulatory risk.” The commission also approved a capital structure with a 40% eq-uity component, finding that such a structure would help Lone Star attract capital from investors. Com-mission chairperson Donna Nelson, in a partial dissent, said she would have approved a 45% equity com-ponent. In Kansas City Power & Light’s case in Kansas, the company had asked for a 10.4% ROE (later modified to 10.3%) and a $63.6 million increase and was awarded a 9.5% ROE and a $33.2 million

36 EEI 2012 FINANCIAL REVIEW
INDUSTRY FINANCIAL PERFORMANCE
with a much lower awarded ROE at 9.31% due to the commission’s cri-tiques of reliability and service qual-ity mentioned earlier.
In Entergy Texas’ case, the ad-ministrative law judges (ALJs) in the case recommended awarding the company a 9.8% ROE based on the ranges of ROEs suggested by interve-nors, the proxy group suggested by the company, and comments by one of the company’s witnesses. The ALJs also added 15 basis points to arrive at the 9.8% figure because of “un-settled economic conditions facing utilities.” The commission adopted the 9.8% figure but said, “The Com-mission disagrees with the ALJs that a utility’s return on equity should be determined using an adder to re-flect unsettled economic conditions facing utilities. The Commission agrees with the ALJs, however, that a return on equity of 9.8% will allow Entergy a reasonable opportunity to earn a reasonable return on invested capital . . . ”
O&M ExpensesThe commission noted in Lone
Star Transmission’s first rate case de-cision that the O&M amounts re-quested in the company’s filing were $10,484 per circuit mile, whereas the average O&M costs for incum-bent transmission service providers in Texas was $4,808. The commis-sion adopted $4,808, resulting in a disallowance of $4 million in revenue requirement. The commission used a similar methodology and logic to dis-allow some administrative and gen-eral expenses.
no apparent need to increase ROE in these circumstances.” In response to the company’s observation that it had under-earned authorized ROE for several years, the commission suggested an attrition adjustment in future cases. Staff recommended an expedited rate case framework. The commission said it would give “fair consideration” to such propos-als, particularly proposals that would break the current pattern of almost continual rate cases. The commis-sion said the frequency of rate cases over-taxes all participants, wearies customers and does not serve the public interest. The commission said it is looking for thoughtful solutions.
In Maryland, the commission re-jected Delmarva Power & Light’s 10.75% proposed ROE, noting significant differences between Del-marva and some of the companies in the proxy group. Some of the proxy group members had significantly higher growth rates and some owned their own generation. The commis-sion removed the highest and lowest ROEs from the proxy group and ar-rived at a median ROE of 10.265% and a mean ROE of 10.24%. From this, the commission determined that an ROE of 10.25% would be reason-able. However, the commission then lowered that ROE by 50 basis points because of the “risk stabilizing ef-fects” of the company’s decoupling mechanism. The commission then raised the ROE by six basis points for flotation costs (bringing the final awarded ROE to 9.81%). The Mary-land commission followed a similar process for another Pepco Holdings subsidiary, Potomac Electric Power. However, Potomac Electric ended up
increase. The lower awarded rate of return in the case accounted for $17 million of the difference. The com-mission adopted the lower ROE say-ing that it “strikes the proper balance of allowing KCP&L to access [the] capital markets while acknowledging the economic impact on ratepayers.” The commission also said that it was mindful that a 10% ROE has long been recognized as a floor by inves-tors, but chose 9.5% in part because it was below the ROE requested by the company, above the ROE sug-gested by the Citizens’ Utility Rate-payer Board, and at the upper end of the range recommended by commis-sion staff.
In the hearings preliminary to the Q2 order in Puget Sound Energy’s case in Washington, the commis-sion adopted a 9.8% ROE, well be-low the company’s final proposal of 10.75%. The commission based the decision on analysis by the Indus-trial Customers of Northwest Utili-ties (ICNU), which recommended a 9.7% ROE based on several varia-tions of the risk premium, capital assets pricing model and discounted cash flow methodologies. The com-mission determined that a return above the 10.1% ROE awarded to the company in the 2010 rate case was unwarranted because “market conditions and investor confidence have [not] changed sufficiently, or in a manner, that requires any increase, much less the ROE [the company] seeks. Rather Treasury and utility bond yields have decreased, and in-terest rates are expected to remain low for some time. Utility stocks enjoy favorable market sentiment in such an environment. There is

EEI 2012 FINANCIAL REVIEW 37
INDUSTRY FINANCIAL PERFORMANCE
Consolidated TaxesIn Atlantic City Electric’s case in
Q4, the Division of Rate Counsel (DRC) recommended that the com-pany flow to customers the benefits associated with Pepco Holdings’ (Atlantic City Electric’s parent) fil-ing of a consolidated federal income tax return. Commission staff found that the impact on company earn-ings of this recommendation would be unreasonably negative—reducing the company’s rate base by 43%, re-ducing earned ROE for shareholders to less than 2%, and would result in “lower stock prices, lower credit rat-ings, higher capital costs . . . [and customers’] ultimately paying higher rates for utility service.” Not sur-prisingly, the company agreed with staff and noted staff ’s opinion was “shared by the vast preponderance of this country’s utility regulators.” The settlement recommended the com-mission establish a generic proceed-ing on the issue.
Rate Adjustment MechanismsThe Hawaii commission allowed
Hawaiian Electric Light and Maui Electric to implement purchased power adjustment clauses, decou-pling mechanisms, cost-of-service recovery mechanisms and earnings sharing mechanisms. The cost-of-service recovery mechanisms rec-ognize, with some limitations, rate base additions, increases in O&M expenses, and depreciation and amortization expenses between rate cases. In Washington State, the commission rejected Puget Sound Energy’s attempt to initiate a con-servations savings adjustment (a limited form of decoupling) that the company hoped would mitigate the impact of customer participation in
Average Requested ROE 1990-2012
Source: SNL Financial/Regulatory Research Assoc. and EEI Rate Department
10.0
11.0
12.0
13.0
14.0
15.0(Percent)
Q4-9
0
Q4-9
1
Q4-9
2
Q4-9
3
Q4-9
4
Q4-9
5
Q4-9
6
Q4-9
7
Q4-9
8
Q4-9
9
Q4-0
0
Q4-0
1
Q4-0
2
Q4-0
3
Q4-0
4
Q4-0
5
Q4-0
6
Q4-0
7
Q4-0
8
Q4-0
9
Q4-1
0
Q4-1
1Q4
-12
Average Regulatory Lag 1990-2012
Source: SNL Financial/Regulatory Research Assoc. and EEI Rate Department
(Months)
Q4-0
7
Q4-1
0
Q4-1
2
Q4-1
1
Q4-9
0
Q4-9
2
Q4-9
1
Q4-9
3
Q4-9
4
Q4-9
5
Q4-9
6
Q4-9
7
Q4-9
8
Q4-9
9
Q4-0
0
Q4-0
1
Q4-0
2
Q4-0
3
Q4-0
4
Q4-0
5
Q4-0
6
0
5
10
15
20
25
30
Q4-0
8
Q4-0
9

38 EEI 2012 FINANCIAL REVIEW
INDUSTRY FINANCIAL PERFORMANCE
In Maryland, the commission awarded Potomac Electric Power a 9.31% ROE in part because of the commission’s perception that the company had “poor reliability per-formance” and demonstrated “his-toric system neglect.” These reflec-tions come in the aftermath of some extended storm outages. At the same time, the commission disallowed the company’s tree-trimming expenses as imprudent, thus reducing the com-pany’s revenue requirement by $10.5 million. The commission did allow recovery of $9.8 million (company requested $10.3 million) over five years of storm costs associated with Hurricane Irene.
Focus on Lone Star TransmissionLone Star Transmission got its
first decision in its first case in Q4. In this case the company argued that it faced significant risks as a new en-trant into the market. However the commission adopted the Adminis-trative Law Judges’ (ALJs’) determi-nation that the “regulatory scheme in Texas assists companies such as Lone Star in dealing with those risks and . . . offsets those risks. Texas has in place a structure that offers sig-nificant protections to transmission-only utilities. . . . Transmission-only utilities do not have any distribution assets, which lessens their exposure to loss, because they have fewer as-sets.” Further, the ALJs noted that transmission-only utilities’ custom-ers are other utilities, “which lessens their exposure to a loss because of a customer’s failure to pay.”
Focus on Kentucky Utilities and Louisville Gas & Electric
In approving a settlement for Ken-tucky Utilities and Louisville Gas &
the costs from ratepayers. The com-mission also said that more frequent rate cases would provide the oppor-tunity to examine the company’s financial outlook on a regular basis and determine an appropriate ROE. The commission also said “the RIM would create a substantial parallel stream of work for all parties on a constant, annual renewing basis. . . . Since there is no reliability basis on which to approve the RIM, then, the question is whether the Company’s finances compel it. We find that they do not.” In the District of Colum-bia, the commission disallowed a similar mechanism proposed by Po-tomac Electric Power, saying such a rider would weaken the commission’s oversight of the company’s reliabili-ty-related capital expenditures.
Storm Cost Prevention and RecoveryA settlement in California Pa-
cific Electric’s case included a cap of $2.5 million for vegetation man-agement expenses that the company must include as a separate item on customers’ bills. If the company does not spend the full amount, it must refund the difference to customers. Florida Power & Light’s settlement determined that future storm costs are recoverable on an interim basis, beginning 60 days from the filing of a cost recovery petition, but limited to $4 per 1000 kWh for the first year. If storm restoration costs exceed $800 million, the company can re-quest a waiver of the $4 limit.
In Rhode Island, Narragansett Electric’s settlement was revised, in the aftermath of Sandy, to add an additional $3 million in annual cus-tomer contribution to the company’s storm contingency fund for six years.
conservation programs. In rejecting the mechanism, the commission said that the company’s “proposed meth-ods for measuring load loss due to conservation and the level of cost under recovery related to this load are not precise enough” and would result in double recovery of certain lost revenues and annual rate in-creases.
In Michigan, the commission disallowed Consumers Energy’s re-quested decoupling mechanism, un-collectible expense true-up mecha-nism and customer choice incentive mechanism. The commission disal-lowed the decoupling mechanism based on a Michigan Court of Ap-peals decision that the commission does not have statutory authority to authorize a revenue decoupling mechanism. The commission found the company’s proposed uncollect-ible expense true-up mechanism “unnecessary” because a “state stat-ute, which permits the use of fore-casted test years and the implemen-tation of significant interim rate increases, mitigates any harm to utilities . . .” The commission denied the customer choice incentive mech-anism for lack of evidence that the state legislature intends to increase the 10% cap on electric choice sales. The Maryland commission disal-lowed reliability investment recov-ery mechanisms (RIMs) proposed by Delmarva Power & Light and Potomac Electric Power, saying that the companies do not have a regula-tory lag problem that would justify such a mechanism and that regula-tory lag can serve positive functions, such as ensuring that the company bears the risk of making prudent in-vestment decisions before recovering

EEI 2012 FINANCIAL REVIEW 39
INDUSTRY FINANCIAL PERFORMANCE
bution and certain smart-grid up-grades. The commission investigates the prudence and reasonableness of these expenditures and issues deci-sions annually. The formula rate plan calculations are to reflect the utilities’ capital structure, excluding goodwill, and incorporate a legislatively set formula for calculating ROE. The formula applies a 580-basis-point premium (590 the first year) to the 12-month-average 30-year Treasury bond yield. The formula rate plan allows the companies to recover pen-sion expense, costs related to funding pension assets, and certain incen-tive compensation expenses. If the companies’ earned returns vary by more than 50 basis points from the formula-derived returns, the compa-nies must refund to or collect from customers revenues representing the difference. The companies must also meet certain performance metrics or the ROEs will be reduced. The plans terminate if the average annual rate increase between 2012 and 2014 is more than 2.5%, or at the end of 2017, unless legislation extends the plan. The companies must together contribute $60 million to fund a low-income program for certain cus-tomers.
Focus on Virginia Electric & PowerThe order in a Virginia Electric
& Power case allows the company to implement a rider to recover costs of converting three coal-fired plants to burn biomass fuels, including a cash return on construction work in progress (CWIP). The 12.4% ROE includes a 200-basis-point premium through the first five years of the con-verted plants’ lives. The commission said, “We find the proposed Biomass Conversions are likely to be cost-
over their useful lives.” The com-mission further said that it expects a utility “to fully evaluate all major investments that have implications for the utility’s resource mix—in-cluding those where the investment will extend the useful life of an as-set and where a plant shutdown is an option—in its IRP [integrated re-source plan] . . . although the IRP is not a legal prerequisite for the utility to seek recovery of its investment in rates, we have repeatedly stated that the IRP process serves as a comple-ment to the rate-making process and reduces the uncertainty of recovery. . . . If a utility seeks rate recovery of a significant investment that has not been included in an IRP, we will hold the utility to the same level of vig-orous review required by the IRP to demonstrate prudence of the project. . . . The communications between [PacifiCorp] and this Commission with regard to the utility’s invest-ments related to its emission reduc-tion plan were not sufficient.”
Focus on Ameren Illinois and Commonwealth Edison
During 2012, Ameren Illinois and Commonwealth Edison made several filings and received several orders as part of the formula rate plan applicable to these companies. The plan requires Commonwealth Edison to invest at least $1.3 billion over a five-year period and Ameren Illinois to invest at least $265 mil-lion over a ten-year period in certain electric system upgrades, moderniza-tion projects and training facilities. The plan further requires Com-monwealth Edison to invest another $1.3 billion and Ameren Illinois to invest $360 million over a ten-year period in transmission and distri-
Electric, the commission noted that the utilities’ compliance plans call for $1.7 billion in investments over the next three years to meet certain emission control requirements. The commission called these expenses “very significant” and said that it will “closely monitor the progress of the environmental projects, the costs to be proposed to be recovered in the monthly [environmental cost recov-ery mechanism] filings, and the rea-sonableness of the ROE applicable to those capital expenditures.” The settlement also increased the fixed monthly residential customer ser-vice charge from $8.50 to $10.75, which the commission found rea-sonable. However some customers complained that such an increase will disincentivize them from mak-ing energy efficiency expenditures. Some customers complained that their bills would rise, even if they re-duced their energy usage.
Focus on PacifiCorp OregonIn Oregon, the commission disal-
lowed part of PacifiCorp’s environ-mental control investments at coal-fired generation plants and ordered the company to issue to custom-ers a one-year $17 million credit. The commission said the company “failed to reasonably examine alter-native courses of action and perform adequate analysis to support its in-vestments.” The commission also said “sufficient evidence exists” to support a 10% ($17 million) disal-lowance and that the “imprecision is due to an incomplete evidentiary record caused by [PacifiCorp’s] im-prudence.” In supporting the one-year credit, the commission said “this method will simplify the track-ing of recovery for these investments

40 EEI 2012 FINANCIAL REVIEW
INDUSTRY FINANCIAL PERFORMANCE
but not be limited to, multi-year rate plans; and 3) improving the Com-pany’s compliance with the financial reporting requirements under the Delaware Administrative Code.”
In Q1, the Idaho commission approved a settlement that finds a transmission line totally used and useful, after previously ruling that part of the line was not used and use-ful. The case was on appeal before the Idaho Supreme Court at the time of the settlement. The order approving the settlement requires PacifiCorp to dismiss the case and to delay the re-covery of the costs of the incremental transmission until the next rate case. The commission said, “this conces-sion benefits customers because it eliminates uncertainty inherent in lit-igation and postpones cost recovery.”
The order approving Northern States Power’s settlement in North Dakota required the company to submit a performance-based rate-making plan with metrics to measure and evaluate system reliability and with rate of return incentives to im-prove reliability.
A settlement in Arizona Public Service’s case in Q2 required the company to establish an experimen-tal rate service rider schedule that will allow third-party providers to provide wholesale power to the com-pany on behalf of large commercial and industrial customers. The com-pany would purchase and manage the generation for a management fee of $0.0006 per kilowatthour. Appli-cants must aggregate into a 10 MW group and the program is capped at 200 MW.
MiscellaneousThe Wisconsin commission grant-
ed Wisconsin Electric Power a $225 million two-step increase that will be partially offset with $60 million in credits from a renewable energy tax grant the company expects to receive under the National Defense Authori-zation Act following the completion of a biomass plant currently under construction.
Southern California Edison’s deci-sion required the company to track, in a separate account for separate re-view, O&M and capital expenditures related to the San Onofre Nuclear Generating Station because of the shutdown of that station.
The Kansas and Missouri com-missions use different methodolo-gies to allocate capacity-related costs and certain generation expenses to ratepayers, and consequently Kansas City Power & Light, which serves both states, is unable to achieve full recovery. The Kansas commission, in the context of the company’s rate case in Q4, suggested a joint proceeding to address the discrepancy.
In Delaware, Delmarva Power & Light’s settlement does not allow the company to implement its request-ed reliability infrastructure invest-ment recovery mechanism, revenue decoupling mechanism, nor a fully forecasted test year. However, the parties to the settlement are to meet to discuss “1) establishing metric(s) for the reporting and/or approval of reliability projects going forward so that customers are aware of how in-vestment in Delmarva’s plant in ser-vice benefits them in a quantifiable manner; 2) alternative regulatory methodologies that would include,
effective on a net present value basis. . . . The converted facilities will not adversely impact system reliability . . . and . . . Dominion’s forecasted fuel prices are reasonable for purposes of this proceeding. . . . We conclude that the Conversions will have a pos-itive impact on economic develop-ment within the Commonwealth.” In another case for the company in 2012, the commission granted the company a two-step increase for the Virginia City Hybrid Energy Center. The Center is a coal-fired generation facility that will use Virginia coal and environmentally advantageous technologies.
Focus on Public Service Company of Colorado
Public Service Colorado requested an interim rate increase under Colo-rado’s new law specifying that the commission has authority to grant such interim increases. However, the commission rejected the company’s request, saying it did not sufficiently demonstrate that the company’s fi-nancial well-being depended on the interim increase. The company re-filed, saying that an expiring whole-sale power contract at the same time that the company was continuing to provide the benefits of the contract to customers would reduce return on equity by 43 basis points in the first half of 2012. The commission rejected this second appeal, saying the company failed to prove that the commission’s previous rejection was flawed or illegal. The commis-sion subsequently allowed deferred accounting treatment of the revenue associated with the expired wholesale power contract in response to a com-pany request.

EEI 2012 FINANCIAL REVIEW 41
Business Strategies65.6% share of total assets, provided most of the industry’s asset growth. Regulated Electric revenue decreased 2.8%, correlating with the 1.8% de-cline in nationwide electric output, as indicated by EEI’s Weekly Electric Output. The slight decline reflected a still-sluggish economy, continued low natural gas prices, and no signifi-cant year-to-year boost from summer weather. Regulated Electric revenue fell 0.6% in 2011 due to these same general factors, following a 2.4% rise in 2010 and a 4.4% decline in 2009. Competitive Energy revenue fell
Business Segmentation
Revenue decreased in 2012 for the industry’s three largest busi-ness segments—Regulated Electric, Competitive Energy and Natural Gas Distribution. Assets grew for two of the three as Competitive En-ergy assets declined by nearly 6%. Continuing a multi-year trend, the industry’s regulated asset base grew in 2012 and accounted for a larger share of total assets. The Regulated Electric segment, which grew to a
$22.4 billion, or 26.0%, in 2012, posting the largest decline of all business segments in both dollar and percentage terms.
2012 Revenue by SegmentRegulated Electric revenue de-
creased by $6.8 billion, or 2.8%, to $233.1 billion from $240.0 billion in 2011. The segment’s share of to-tal industry revenue grew to 66.3% from 62.2% in 2011, totals that are now well above the 52.1% level of 2005.
Business Segmentation — RevenuesU.S. SHAREHOLDER-OWNED ELECTRIC UTILITIES
($ Millions) 2012 2011 Difference
Regulated Electric Competitive EnergyNatural Gas Distribution Natural Gas PipelineNatural Gas and Oil Exploration & ProductionOther
Eliminations/Reconciling Items
Total Revenues
% Change
Note: Difference and Percent Change columns may reflect rounding. Totals may reflect rounding.
Source: Based on segment reporting from SEC filings of 58 U.S. Shareholder-Owned Electric Utilities
233,149 239,977 (6,828) (2.8%) 63,769 86,211 (22,442) (26.0%) 33,356 39,526 (6,170) (15.6%) 6,273 6,146 128 2.1% 2,077 2,020 58 2.8% 13,097 1 1,818 1,279 10.8% (11,081) (12,235) 1,154 (9.4%) 340,640 373,462 (32,821) (8.8%)

42 EEI 2012 FINANCIAL REVIEW
BUSINESS STRATEGIES
Total regulated assets (Regulated Electric plus Natural Gas Distribu-tion) accounted for 73.3% of total industry assets at year-end 2012, up from 71.7% on December 31, 2011. This aggregate measure has grown steadily from 61.6% at year-end 2002, underscoring the indus-try’s significant regulated rate base growth in recent years and the fact that several companies sold off non-core businesses during the period.
Regulated ElectricRegulated Electric segment op-
erations include the generation, transmission and distribution of regulated electricity for residential, commercial and industrial custom-ers. Although this segment’s over-all revenues declined by 2.8%, the pattern of results across the indus-try was evenly split, with twenty-eight companies, or 49%, reporting higher regulated electric revenue in 2012. Four companies (7% of the
Source: EEI Finance Department and company annual reports
Revenue Breakdown 2011U.S. SHAREHOLDER-OWNED ELECTRIC UTILITIES
Revenue Breakdown 2012U.S. SHAREHOLDER-OWNED ELECTRIC UTILITIES
RegulatedElectric 66.3%
Natural Gas Distribution
9.5%Natural Gas Pipeline
1.8%
18.1%
Competitive Energy
Natural Gas and Oil Exploration & Production
0.6%
Other 3.7%
RegulatedElectric 62.2%
Natural Gas Distribution
10.2%Natural Gas Pipeline
1.6%
22.4%
Competitive Energy
Natural Gas and Oil Exploration & Production
0.5%
Other 3.1%
in 2005. The Business Segmentation - Revenues table presents the indus-try’s revenue breakdown by business segment. Eliminations and reconcil-ing items were added back to total revenue to arrive at the denominator for the segment percentage calcula-tions shown in the graphs Revenue Breakdown 2012 and 2011.
2012 Assets by SegmentRegulated Electric assets increased
from 63.8% of total industry assets at December 31, 2011 to 65.6% at December 31, 2012, rising by $65.3 billion, or 8.0%, over the year-end 2011 level. Competitive Energy as-sets declined by $12.1 billion, or 5.8%, the only category to show a decrease. Natural Gas Distribution had modest asset growth of $2.9 bil-lion, or 2.9%, while the two smaller natural-gas-related categories, Pipe-line and Exploration & Production, experienced high single-digit per-centage growth.
Business Segmentation — AssetsU.S. SHAREHOLDER-OWNED ELECTRIC UTILITIES
Note: Difference and Percent Change columns may reflect rounding. Totals may reflect rounding.
Source: Based on segment reporting from SEC filings of 57 U.S. Shareholder-Owned Electric Utilities
($ Millions) 12/31/12 12/31/11 Difference % Change
Regulated Electric 878,903 813,646 65,257 8.0%
Competitive Energy 197,321 209,374 (12,053) (5.8%)
Natural Gas Distribution 103,182 100,320 2,861 2.9%
Natural Gas Pipeline 32,311 29,434 2,877 9.8%
Natural Gas and Oil Exploration
& Production 6,048 5,646 402 7.1%
Other 121,350 116,471 4,880 4.2%
Eliminations/Reconciling Items (74,682) (75,322) 640 (0.8%)
Total Assets 1,264,434 1,199,569 64,865 5.4%
Natural Gas Distribution revenue declined by $6.2 billion, or 15.6%, from $39.5 billion in 2011 to $33.4 billion in 2012. Annual revenue here has historically fluctuated due to sig-nificant swings in natural gas prices.
Total regulated revenue—the sum of the Regulated Electric and Natural Gas Distribution segments—de-creased by $13.0 billion, or 4.7%, to $266.5 billion in 2012. The year-to-year change for this metric has varied in recent years, falling $2.1 billion (-0.8%) in 2011 and rising $4.1 billion (+1.5%) in 2010, after declining $20.6 billion (-6.9%) in 2009 and increasing $22.5 billion (+7.7%) in 2008 and $14.4 billion (+5.2%) in 2007. Despite the year-to-year dollar fluctuations, regulated operations have steadily grown as a percentage of total industry revenue in recent years. Total regulated rev-enue accounted for 75.8% of total industry revenue in 2012, extending a steady upward trend from 65.3%
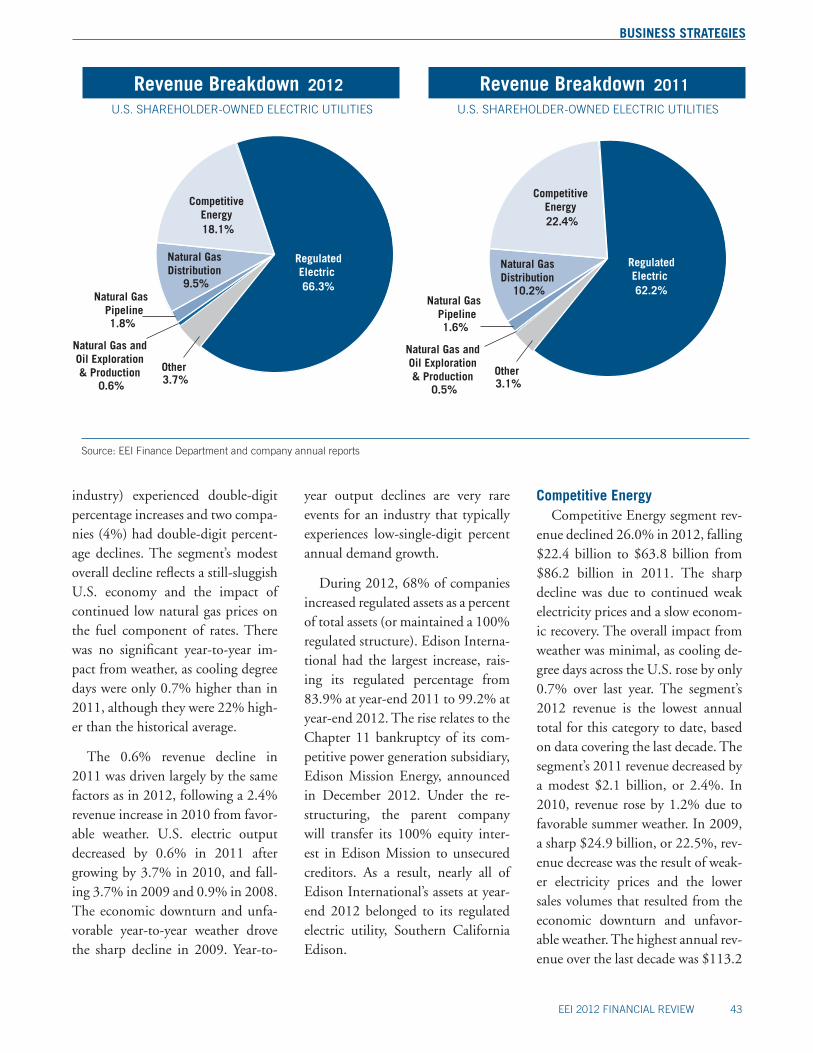
EEI 2012 FINANCIAL REVIEW 43
BUSINESS STRATEGIES
Total regulated assets (Regulated Electric plus Natural Gas Distribu-tion) accounted for 73.3% of total industry assets at year-end 2012, up from 71.7% on December 31, 2011. This aggregate measure has grown steadily from 61.6% at year-end 2002, underscoring the indus-try’s significant regulated rate base growth in recent years and the fact that several companies sold off non-core businesses during the period.
Regulated ElectricRegulated Electric segment op-
erations include the generation, transmission and distribution of regulated electricity for residential, commercial and industrial custom-ers. Although this segment’s over-all revenues declined by 2.8%, the pattern of results across the indus-try was evenly split, with twenty-eight companies, or 49%, reporting higher regulated electric revenue in 2012. Four companies (7% of the
Source: EEI Finance Department and company annual reports
Revenue Breakdown 2011U.S. SHAREHOLDER-OWNED ELECTRIC UTILITIES
Revenue Breakdown 2012U.S. SHAREHOLDER-OWNED ELECTRIC UTILITIES
RegulatedElectric 66.3%
Natural Gas Distribution
9.5%Natural Gas Pipeline
1.8%
18.1%
Competitive Energy
Natural Gas and Oil Exploration & Production
0.6%
Other 3.7%
RegulatedElectric 62.2%
Natural Gas Distribution
10.2%Natural Gas Pipeline
1.6%
22.4%
Competitive Energy
Natural Gas and Oil Exploration & Production
0.5%
Other 3.1%
Competitive EnergyCompetitive Energy segment rev-
enue declined 26.0% in 2012, falling $22.4 billion to $63.8 billion from $86.2 billion in 2011. The sharp decline was due to continued weak electricity prices and a slow econom-ic recovery. The overall impact from weather was minimal, as cooling de-gree days across the U.S. rose by only 0.7% over last year. The segment’s 2012 revenue is the lowest annual total for this category to date, based on data covering the last decade. The segment’s 2011 revenue decreased by a modest $2.1 billion, or 2.4%. In 2010, revenue rose by 1.2% due to favorable summer weather. In 2009, a sharp $24.9 billion, or 22.5%, rev-enue decrease was the result of weak-er electricity prices and the lower sales volumes that resulted from the economic downturn and unfavor-able weather. The highest annual rev-enue over the last decade was $113.2
industry) experienced double-digit percentage increases and two compa-nies (4%) had double-digit percent-age declines. The segment’s modest overall decline reflects a still-sluggish U.S. economy and the impact of continued low natural gas prices on the fuel component of rates. There was no significant year-to-year im-pact from weather, as cooling degree days were only 0.7% higher than in 2011, although they were 22% high-er than the historical average.
The 0.6% revenue decline in 2011 was driven largely by the same factors as in 2012, following a 2.4% revenue increase in 2010 from favor-able weather. U.S. electric output decreased by 0.6% in 2011 after growing by 3.7% in 2010, and fall-ing 3.7% in 2009 and 0.9% in 2008. The economic downturn and unfa-vorable year-to-year weather drove the sharp decline in 2009. Year-to-
year output declines are very rare events for an industry that typically experiences low-single-digit percent annual demand growth.
During 2012, 68% of companies increased regulated assets as a percent of total assets (or maintained a 100% regulated structure). Edison Interna-tional had the largest increase, rais-ing its regulated percentage from 83.9% at year-end 2011 to 99.2% at year-end 2012. The rise relates to the Chapter 11 bankruptcy of its com-petitive power generation subsidiary, Edison Mission Energy, announced in December 2012. Under the re-structuring, the parent company will transfer its 100% equity inter-est in Edison Mission to unsecured creditors. As a result, nearly all of Edison International’s assets at year-end 2012 belonged to its regulated electric utility, Southern California Edison.

44 EEI 2012 FINANCIAL REVIEW
BUSINESS STRATEGIES
the Natural Gas Pipeline business concentrates on the transmission and storage of natural gas for local dis-tribution companies, marketers and traders, electric power generators and natural gas producers. Added together, Natural Gas Distribution, Natural Gas Pipeline and Explora-tion & Production (E&P) activities produced $41.7 billion of the indus-try’s revenue in 2012, down from $47.7 billion in each of the prior two years. In percentage terms, the rev-enue contribution from natural gas activities decreased to 11.9% in 2012 from 12.3% in 2011.
The Natural Gas Pipeline and Natural Gas E&P segments were two of the top three in terms of percent growth in assets in 2012, gaining 9.8% and 7.1% respectively. Natu-ral Gas Pipeline assets grew by $2.9 billion in 2012, with all eight com-panies represented in this segment
remained depressed throughout the year, falling as low as $2/mmBtu. The 2012 drop in revenue follows declines of $701 million, or 1.7%, in 2011, $1.5 billion, or 3.6%, in 2010 and a much larger decline of $9.8 billion, or 19.1%, in 2009 due to sharply falling gas prices and the impact of the economic downturn. Natural gas prices peaked above $12/mmBtu in 2008, a year marked by very high price volatility. Overall, 32 of the 34 companies (94%) that report distribution revenue showed year-to-year revenue declines in 2012. In comparison, 62%, 75% and 91% of companies had year-to-year revenue declines in 2011, 2010 and 2009 respectively, while 89% ex-perienced gains in 2008.
Natural Gas Distribution includes the delivery of natural gas to homes, businesses and industrial customers throughout the United States, while
billion in 2008. Competitive Energy covers the generation and/or sale of electricity in competitive markets, including both wholesale and retail transactions. Wholesale buyers are typically electric utilities seeking to supplement generation capacity, along with regional power pools and large industrial customers. Competi-tive Energy also includes the trading and marketing of natural gas. Of the 34 companies that have Competitive Energy operations, only 11, or 32%, grew these assets during 2012, while only 21% had revenue gains.
Natural Gas DistributionNatural Gas Distribution rev-
enue fell by $6.2 billion, or 15.6%, in 2012, declining for the fourth straight year. The decrease was due to milder winter weather across the U.S., as measured by an over-all 12.9% decline in heating de-gree days. Natural gas prices also
Source: EEI Finance Department and company annual reports
Asset Breakdown As of December 31, 2012
U.S. SHAREHOLDER-OWNED ELECTRIC UTILITIES
RegulatedElectric 63.8%
Natural Gas Distribution
7.9%
Natural Gas Pipeline
2.3%
16.4%
Competitive Energy
Natural Gas and Oil Exploration & Production
0.5%
Other 9.1%
Asset Breakdown As of December 31, 2011
U.S. SHAREHOLDER-OWNED ELECTRIC UTILITIES
RegulatedElectric 65.6%
Natural Gas Distribution
7.7%
Natural Gas Pipeline
2.4%
14.7%
Competitive Energy
Natural Gas and Oil Exploration & Production
0.5%
Other 9.1%

EEI 2012 FINANCIAL REVIEW 45
BUSINESS STRATEGIES
showing year-to-year increases. Nat-ural Gas E&P assets rose by $402 million in 2012, with three of the four companies with assets in this category (Dominion, OGE Energy and MDU Resources) growing this business segment.
Over the longer term, the Pipeline and E&P segments have accounted for a declining share of total industry assets. This is due to a combination of growth in the other business seg-ments and divestitures within these two. Natural Gas Pipeline and Natu-ral Gas E&P fell from 3.7% and 2.1% shares of total assets on De-cember 31, 2003 to 2.4% and 0.5% on December 31, 2012, with their combined total assets down by $12.3 billion, or 24%, over this nine-year time frame.
2012 Year-End List of Companies by Category
Early in each calendar year we cre-ate a new list of shareholder-owned electric utility holding companies by business category based on year-end business segmentation data pre-sented in 10Ks and supplemented by discussions with parent companies. Our categories are as follows: Regu-lated (80% of holding company as-sets are regulated); Mostly Regulated (50%-79% of holding company as-sets are regulated); Diversified (less than 50% of holding company assets are regulated).
We use assets rather than revenue for determining categories because we think assets provide a clearer picture of strategic trends. In recent years, fluctuating natural gas prices have impacted revenue so greatly
List of Companies by Category at December 31, 2012
AlleteAlliant EnergyAmeren American Electric PowerAvista Black HillsCentral Vermont Public ServiceCH Energy GroupCleco CMS EnergyConsolidated EdisonDPL DTE EnergyDuke Energy
Edison InternationalEl Paso ElectricEmpire District ElectricEntergyGreat Plains EnergyIberdrola USAIDACORP Integrys Energy Group IPALCO EnterprisesNortheast UtilitiesNorthWestern EnergyNV EnergyPG&EPinnacle West Capital
PNM ResourcesPortland General Electric Puget EnergySouthernTECO EnergyUIL HoldingsUnitil UNS EnergyWestar EnergyWisconsin EnergyXcel Energy
Regulated (39)
CenterPoint EnergyDominion ResourcesExelonFirstEnergyHawaiian ElectricMGE Energy
MidAmerican Energy Holdings NextEra EnergyNiSourceOGE EnergyOtter Tail PowerPepco Holdings
PPL Public Service Enterprise GroupSCANASempra EnergyVectren
Mostly Regulated (17)
Energy Future Holdings
MDU ResourcesDiversified (2)
that some companies’ strategic ap-proach to business segmentation was distorted by reliance on revenue data alone. Comparing the list of compa-nies from year to year reveals com-pany migrations between categories and indicates the general trend in in-dustry business models. We also base our quarterly category financial data during the year on this list at the pre-vious year-end.
The overall trend toward a more regulated industry continued in 2012. The Regulated group totaled 39 companies at year-end, represent-ing 67% of the industry’s companies, up from 66% last year. Black Hills Energy and Duke Energy migrated from the Mostly Regulated to the Regulated category, while Vectren made the opposite switch. Black Hills’ regulated asset percentage grew from 72.7% at year-end 2011 to 84.5% at year-end 2012, mostly due to the removal of discontinued assets from the balance sheet. Duke’s increase from 76.7% to 86.2% re-lates to the company’s merger with Progress Energy, which carried a higher percentage of regulated assets than Duke.
The Mostly Regulated category added Vectren and Hawaiian Elec-tric (formerly in the Diversified cat-egory). Vectren’s move was simply a matter of straddling the Regulated/Mostly Regulated line, as its regu-lated asset percentage modestly de-clined from 81.5% to 79.5%. On a similar note, Hawaiian Electric’s reg-ulated percentage rose from 49.2% to 50.3%, moving it into the Mostly Regulated category.

46 EEI 2012 FINANCIAL REVIEW
BUSINESS STRATEGIES
Central Networks (a U.K. distribu-tion utility), and 2) Entergy’s De-cember 5 announcement that it would sell its transmission business (MidSouth Transco) to independent transmission company ITC Holdings.
NRG Acquires GenOnBy far the biggest deal of 2012
was a pure merchant power match-up. This was the July 22, 2012 an-nouncement that NRG Energy and GenOn sought to merge in a stock‐for‐stock tax‐free transaction, prospectively creating the largest competitive generator in the United States with a diverse fleet of approxi-mately 47,000 megawatts (MW), asset concentrations in the east-ern, Gulf Coast and western U.S., and a combined enterprise value of $18 billion. The combined com-pany would retain the NRG Energy name. GenOn shareholders would receive 0.1216 of a share of NRG common stock in exchange for each GenOn share, a 20.6% premium for GenOn’s shareholders based on the July 20 closing prices. The compa-nies cited deal drivers that hearkened back to the language surrounding the blockbuster merger announce-ments of the previous decade, in-cluding achievement of scale, scope, and market and fuel diversification in the competitive power industry. The companies said the combina-tion will result in at least $200 mil-lion per year in incremental earnings before interest, taxes, depreciation and amortization (EBITDA), which combined with $100 million of expected balance sheet efficiencies will boost free cash flow by $300 million in 2014, the first full year of combined operations.
of 2009, when nearly all merger talk was sidelined by the worst financial crisis since the Great Depression. The year’s five announced deals in-cluded: 1) Duke Energy and Prog-ress Energy’s January 10, 2011 an-nouncement that they intend to merge, creating what could become the nation’s largest utility; 2) AES Corporation’s April 20 announce-ment of its intent to acquire DPL, the holding company for regulated utility Dayton Power and Light; 3) Exelon and Constellation Energy’s April 28 announcement of their in-tent to merge; and 4) Gaz Metro’s July 11 bid to acquire Central Ver-mont Public Service (CVPS) after CVPS terminated a planned merger with Canadian distribution utility Fortis, which had been announced in late May. The year also included two announced transactions that do not make EEI’s M&A list because they do not involve the merger or acquisition of whole operating com-panies with regulated territories: 1) PPL’s March 1 bid to acquire
The total number of companies in the EEI universe fell from 61 at year-end 2011 to 58 at year-end 2012, the result of completed mergers in 2012. In addition to Progress Energy (Reg-ulated, acquired by Duke), NSTAR (Regulated, acquired by Northeast Utilities) and Constellation Energy (Diversified, acquired by Exelon) were removed from the group due to merger activity. At the close of 2012, there were 39 Regulated, 17 Mostly Regulated and 2 Diversified companies (see List of Companies by Category at December 31, 2012).
Mergers and Acquisitions
M&A activity, when defined as mergers or acquisitions of whole operating companies with a regu-lated service territory, pressed for-ward in 2011 at the same moderate pace achieved in 2010—with five announced deals each year—extend-ing the recovery from the deep freeze
0
5
10
15
20
25
30
Source: EEI Finance Department
Status of Mergers & Acquisitions 1995–2012
U.S. SHAREHOLDER-OWNED ELECTRIC UTILITIES
2010 2011 20121995 1996 1997 1998 1999 2000 2001
Completed (96 total)
Announced (119 total)
Withdrawn (27 total)
(Number of Mergers & Acquisitions)
20062002 2003 2004 2005 2007 2008 2009
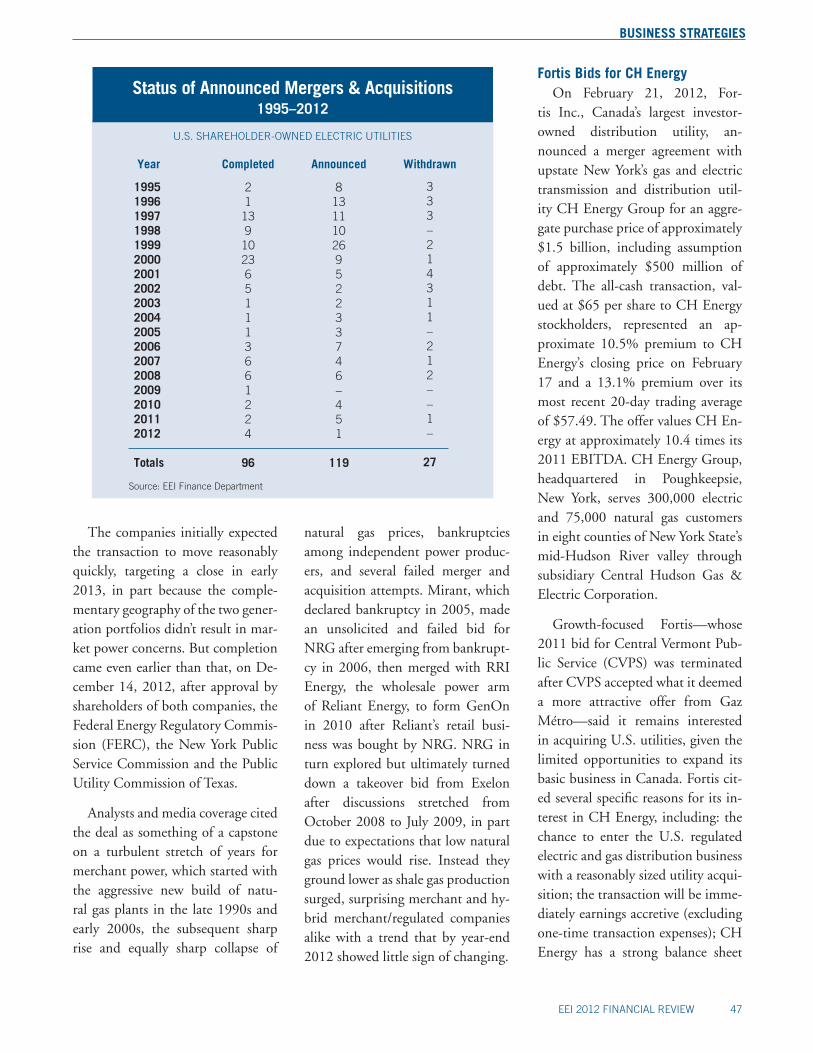
EEI 2012 FINANCIAL REVIEW 47
BUSINESS STRATEGIES
Fortis Bids for CH EnergyOn February 21, 2012, For-
tis Inc., Canada’s largest investor-owned distribution utility, an-nounced a merger agreement with upstate New York’s gas and electric transmission and distribution util-ity CH Energy Group for an aggre-gate purchase price of approximately $1.5 billion, including assumption of approximately $500 million of debt. The all-cash transaction, val-ued at $65 per share to CH Energy stockholders, represented an ap-proximate 10.5% premium to CH Energy’s closing price on February 17 and a 13.1% premium over its most recent 20-day trading average of $57.49. The offer values CH En-ergy at approximately 10.4 times its 2011 EBITDA. CH Energy Group, headquartered in Poughkeepsie, New York, serves 300,000 electric and 75,000 natural gas customers in eight counties of New York State’s mid-Hudson River valley through subsidiary Central Hudson Gas & Electric Corporation.
Growth-focused Fortis—whose 2011 bid for Central Vermont Pub-lic Service (CVPS) was terminated after CVPS accepted what it deemed a more attractive offer from Gaz Métro—said it remains interested in acquiring U.S. utilities, given the limited opportunities to expand its basic business in Canada. Fortis cit-ed several specific reasons for its in-terest in CH Energy, including: the chance to enter the U.S. regulated electric and gas distribution business with a reasonably sized utility acqui-sition; the transaction will be imme-diately earnings accretive (excluding one-time transaction expenses); CH Energy has a strong balance sheet
The companies initially expected the transaction to move reasonably quickly, targeting a close in early 2013, in part because the comple-mentary geography of the two gener-ation portfolios didn’t result in mar-ket power concerns. But completion came even earlier than that, on De-cember 14, 2012, after approval by shareholders of both companies, the Federal Energy Regulatory Commis-sion (FERC), the New York Public Service Commission and the Public Utility Commission of Texas.
Analysts and media coverage cited the deal as something of a capstone on a turbulent stretch of years for merchant power, which started with the aggressive new build of natu-ral gas plants in the late 1990s and early 2000s, the subsequent sharp rise and equally sharp collapse of
natural gas prices, bankruptcies among independent power produc-ers, and several failed merger and acquisition attempts. Mirant, which declared bankruptcy in 2005, made an unsolicited and failed bid for NRG after emerging from bankrupt-cy in 2006, then merged with RRI Energy, the wholesale power arm of Reliant Energy, to form GenOn in 2010 after Reliant’s retail busi-ness was bought by NRG. NRG in turn explored but ultimately turned down a takeover bid from Exelon after discussions stretched from October 2008 to July 2009, in part due to expectations that low natural gas prices would rise. Instead they ground lower as shale gas production surged, surprising merchant and hy-brid merchant/regulated companies alike with a trend that by year-end 2012 showed little sign of changing.
Status of Announced Mergers & Acquisitions1995–2012
U.S. SHAREHOLDER-OWNED ELECTRIC UTILITIES
Year
199519961997199819992000200120022003200420052006200720082009201020112012
Totals
21
139
1023651113661224
96
Completed
813111026952233746–451
119
Announced
333–214311–212––1–
27
Withdrawn
Source: EEI Finance Department
48 EEI 2012 FINANCIAL REVIEW
BUSINESS STRATEGIES
and 2) NSTAR’s agreement with the Massachusetts DER to purchase 129 megawatts of the capacity of the Cape Wind project, or an equivalent amount from renewable resources if Cape Wind does not go forward, if the DPU rejects the contract, or if the project is reduced in size. The companies also agreed to several oth-er measures supporting renewable energy development. Negotiations were subjected to some confusion by the Connecticut Public Utili-ties Regulatory Authority (PURA), which decided in 2011 that it did not have jurisdiction over the merger but said that it did in 2012 after re-ceiving pressure to weigh in from the state’s attorney general and Office of Consumer Counsel (OCC). Con-necticut approved the merger in ear-ly April after the companies agreed to a $25 million rate credit at NU’s Connecticut distribution utility (Connecticut Light and Power) and a rate freeze until December 2014, among other concessions. The deal was completed on April 10, 2012.
It was not state regulators or re-newable mandates that made the Duke/Progress matchup, announced in January 2011, stumble right out of the gate; instead it was competi-tive market power concerns. It took the companies three tries to forge a deal with the Federal Energy Regula-tory Commission (FERC), resulting in delays that almost triggered the merger agreement’s July 8, 2012 ter-mination date. Agreement with FERC was finally forged in late June 2012, allowing the deal to close on July 2. FERC first conditionally ap-proved the merger, which the two companies had hoped to close by
a chilly signal about potential conces-sions required should other regulated companies propose to merge. Yet these struggles stood in sharp con-trast to the relative ease with which First Energy and Allegheny won ap-proval from Pennsylvania, Maryland, Virginia and West Virginia regula-tors, closing their merger less than a year after its February 2010 an-nouncement. The message appeared to remain the same after years of stra-tegic jockeying for regulated utility M&A success: as the old saying goes, “all politics is local”.
In October 2010, NSTAR and Northeast Utilities announced a pro-posed “merger of equals”—a zero-premium transaction based on the idea that NSTAR’s strong cash flow and very strong balance sheet could support Northeast Utilities’ array of transmission investment oppor-tunities. The companies hoped the deal could close in approximately 12 months, but the merger ran into resistance early in 2011 when Massa-chusetts’ Department of Energy Re-sources (DER) asked the state’s De-partment of Public Utilities (DPU) to modify its threshold for merger approval from a “no net harm” stan-dard to a “net benefit” standard, to assure savings for state ratepayers. Late in 2011, the two companies extended their target date an addi-tional six months, finally securing approval from Massachusetts regula-tors in April 2012. The approval was based in part on two concessions: 1) agreement to a base distribution rate freeze through 2016 and a one-time rate credit of $21 million, for an overall savings of approximately $206 million over the next 10 years;
and Central Hudson has strong in-vestment-grade credit ratings; Cen-tral Hudson, a single-state utility, operates a well-maintained electric and gas distribution system, serv-ing a diversified, primarily residen-tial and commercial customer base; and, CH Energy operates principally under cost-of-service regulation with stable returns and timely recovery of costs related to purchased electricity and gas supply as well as transmis-sion and capital programs.
The acquisition needs approv-al from New York regulators and FERC, and the companies said they hoped to close the deal in early 2013. On January 28, 2013 the companies filed a settlement agreement with the New York State Public Service Commission which cited as “corner-stones” approximately $50 million of customer and community ben-efits, a one-year electric and natural gas customer delivery rate freeze, and customer protections that include the continuation of Central Hudson as a stand-alone company, reten-tion of the Central Hudson name, Poughkeepsie headquarters and all employees, and the utility’s substan-tial civic and community presence in the mid-Hudson valley.
NSTAR/NU and Duke/Progress Deals Struggle to Close
Two proposed combinations in the eastern U.S.—NSTAR/North-east Utilities and Duke/Progress Energy—encountered considerable turbulence during 2012 while at-tempting to navigate demands of state regulators, politicians and other interveners. Each deal closed during the year, yet each required 18 diffi-cult months of negotiations that sent
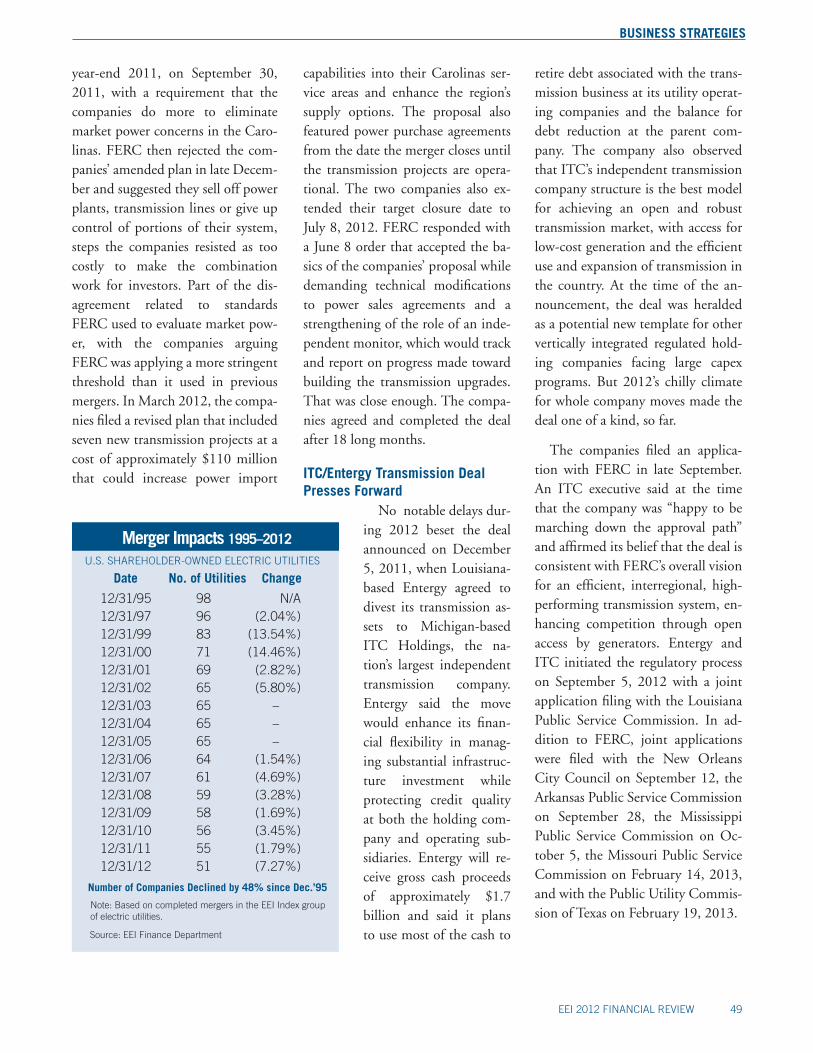
EEI 2012 FINANCIAL REVIEW 49
BUSINESS STRATEGIES
retire debt associated with the trans-mission business at its utility operat-ing companies and the balance for debt reduction at the parent com-pany. The company also observed that ITC’s independent transmission company structure is the best model for achieving an open and robust transmission market, with access for low-cost generation and the efficient use and expansion of transmission in the country. At the time of the an-nouncement, the deal was heralded as a potential new template for other vertically integrated regulated hold-ing companies facing large capex programs. But 2012’s chilly climate for whole company moves made the deal one of a kind, so far.
The companies filed an applica-tion with FERC in late September. An ITC executive said at the time that the company was “happy to be marching down the approval path” and affirmed its belief that the deal is consistent with FERC’s overall vision for an efficient, interregional, high-performing transmission system, en-hancing competition through open access by generators. Entergy and ITC initiated the regulatory process on September 5, 2012 with a joint application filing with the Louisiana Public Service Commission. In ad-dition to FERC, joint applications were filed with the New Orleans City Council on September 12, the Arkansas Public Service Commission on September 28, the Mississippi Public Service Commission on Oc-tober 5, the Missouri Public Service Commission on February 14, 2013, and with the Public Utility Commis-sion of Texas on February 19, 2013.
capabilities into their Carolinas ser-vice areas and enhance the region’s supply options. The proposal also featured power purchase agreements from the date the merger closes until the transmission projects are opera-tional. The two companies also ex-tended their target closure date to July 8, 2012. FERC responded with a June 8 order that accepted the ba-sics of the companies’ proposal while demanding technical modifications to power sales agreements and a strengthening of the role of an inde-pendent monitor, which would track and report on progress made toward building the transmission upgrades. That was close enough. The compa-nies agreed and completed the deal after 18 long months.
ITC/Entergy Transmission Deal Presses Forward
No notable delays dur-ing 2012 beset the deal announced on December 5, 2011, when Louisiana-based Entergy agreed to divest its transmission as-sets to Michigan-based ITC Holdings, the na-tion’s largest independent transmission company. Entergy said the move would enhance its finan-cial flexibility in manag-ing substantial infrastruc-ture investment while protecting credit quality at both the holding com-pany and operating sub-sidiaries. Entergy will re-ceive gross cash proceeds of approximately $1.7 billion and said it plans to use most of the cash to
Merger Impacts 1995–2012U.S. SHAREHOLDER-OWNED ELECTRIC UTILITIES
Number of Companies Declined by 48% since Dec.’95
Source: EEI Finance Department
Note: Based on completed mergers in the EEI Index groupof electric utilities.
Date No. of Utilities Change
12/31/95 98 N/A12/31/97 96 (2.04%)12/31/99 83 (13.54%)12/31/00 71 (14.46%)12/31/01 69 (2.82%)12/31/02 65 (5.80%)12/31/03 65 – 12/31/04 65 – 12/31/05 65 – 12/31/06 64 (1.54%)12/31/07 61 (4.69%)12/31/08 59 (3.28%)12/31/09 58 (1.69%)12/31/10 56 (3.45%)12/31/11 55 (1.79%)12/31/12 51 (7.27%)
year-end 2011, on September 30, 2011, with a requirement that the companies do more to eliminate market power concerns in the Caro-linas. FERC then rejected the com-panies’ amended plan in late Decem-ber and suggested they sell off power plants, transmission lines or give up control of portions of their system, steps the companies resisted as too costly to make the combination work for investors. Part of the dis-agreement related to standards FERC used to evaluate market pow-er, with the companies arguing FERC was applying a more stringent threshold than it used in previous mergers. In March 2012, the compa-nies filed a revised plan that included seven new transmission projects at a cost of approximately $110 million that could increase power import

Mer
gers
& A
cqui
sitio
ns A
nnou
ncem
ents
U
pdat
ed th
roug
h De
cem
ber
31, 2
012
U.S
. SH
AR
EHO
LDER
-OW
NED
ELE
CTR
IC U
TILI
TIES
Ann’
cdBu
yer
Selle
r/Ac
quir
ed/M
erge
dSt
atus
New
Co
mpa
nyDa
teCo
mpl
eted
Mon
ths
to
Com
plet
eBu
s.Te
rms
Tran
s. V
al. (
$M)
2/20
/12
Fort
is In
c.C
H E
nerg
y G
roup
PEE
Forti
s pa
ys $
65.0
0/sh
are
CH
Ene
rgy
Gro
up &
ass
umes
$62
4 m
m d
ebt
1,59
3.2
7/11
/11
Gaz
Met
ro L
PC
entr
al V
erm
ont P
ublic
Ser
vice
C
6/2
7/12
12
GE
Gaz
Mét
ro p
ays
$35.
25/C
VPS
shar
e &
ass
umes
$22
6 m
m d
ebt
704.
2
5/27
/11
Fort
is In
c.C
entr
al V
erm
ont P
ublic
Ser
vice
W
7/11
/11
EE
Fort
is p
ays
$35.
10/s
hare
cas
h &
ass
umes
$22
6.4
mm
deb
t70
1.6
4/28
/11
Exel
on C
orp.
Con
stel
latio
n En
ergy
Gro
up
C
3/12
/12
11
EEC
EG re
ceiv
es 0
.93
EXC
sha
res/
CEG
sha
re. E
XC a
ssum
es $
2.9
bill
debt
10,6
23.2
4/19
/11
AES
Cor
pora
tion
DP
L In
c.C
11
/28/
117
EEA
ES p
ays
$30.
0/sh
are
cash
& a
ssum
es a
ppro
x. $
1.1
bill
of d
ebt
4,61
3.2
1/8/
11D
uke
Ener
gyP
rogr
ess
Ener
gyC
7/
3/12
1
8EE
0.87
083
Duk
e sh
ares
(af
ter
1-3
reve
rse
split
) fo
r ea
ch P
rogr
ess
shar
e +
as
sum
e $1
2.1
billi
on n
et d
ebt
32,0
00
10/1
6/10
Nor
thea
st U
tiliti
esN
STA
RC
4/10
/12
18EE
1.31
2 N
U s
hare
s fo
r ea
ch N
STA
R s
hr, p
lus
$3.3
6 bi
ll as
sum
e de
bt
7,56
6.7
4/28
/10
PP
L C
orp.
E.O
N U
.S.
C11
/1/1
06
EE$6
.83
billi
on c
ash
+ $
764.
0 m
illio
n in
ass
umed
deb
t7,
625.
0
3/12
/10
Emer
a In
cM
aine
& M
ariti
mes
C12
/21/
109
EE$7
6 m
m c
ash
+ $
28.6
mm
deb
t + $
13.8
mm
pos
tret
irem
ent b
enefi
ts11
7.4
2/10
/10
Firs
tEne
rgy
Alle
ghen
y En
ergy
C
2/25
/11
12EE
$4.3
bill
ion
in e
quity
+ $
4.7
billi
on in
ass
umed
deb
t9,
273.
2
9/17
/08
Ber
kshi
re H
atha
way
Con
stel
latio
n En
ergy
Gro
up In
c.
W12
/17/
08
PE
$4.7
bill
cas
h +
$4.
4 bi
ll ne
t deb
t and
adj
ustm
ents
9,15
2.5
7/25
/08
Sem
pra
Ener
gyEn
ergy
Sout
h In
c.
C10
/1/0
83
EG$4
99 m
illio
n ca
sh +
283
mill
ion
debt
771.
9
7/1/
08M
DU
Res
ourc
es G
roup
, Inc
.In
term
ount
ain
Gas
Co.
C
10/1
/08
3EG
$245
mill
ion
cash
+ $
82 m
illio
n de
bt32
7.0
6/25
/08
Duk
e En
ergy
Cat
amou
nt E
nerg
y C
orp.
C
9/15
/08
3EP
$240
mill
ion
cash
+ $
80 m
illio
n as
sum
ed d
ebt
320.
0
2/15
/08
Uni
til C
orp.
N
orth
en U
tiliti
es, I
nc./
Gra
nite
St
ate
Gas
Tra
nsm
issi
on, I
nc.
C12
/1/0
810
EG$1
60 m
illio
n ca
sh16
0.0
1/12
/08
PN
M R
esou
rces
, Inc
.C
ap R
ock
Hol
ding
Cor
p.W
7/22
/08
EE
202.
5
10/2
6/07
Mac
quar
ie C
onso
rtiu
mP
uget
Ene
rgy
C2/
6/09
16EE
$3.5
bill
ion
cash
+ $
3.02
bill
ion
net d
ebt
6,52
0.2
6/25
/07
Iber
drol
a S.
A.
Ener
gy E
ast C
orp.
C9/
16/0
815
EE$4
.5 b
illio
n ca
sh +
$4.
1 bi
llion
net
deb
t 8,
600.
0
2/26
/07
KK
R &
Tex
as P
acifi
c G
roup
TXU
Cor
p.1
CEn
ergy
Fut
ure
H
oldi
ngs
Cor
p.10
/10/
078
PE
$31.
8 bi
llion
cas
h +
$12
.1 b
illio
n ne
t deb
t43
,882
.0
2/7/
07B
lack
Hill
s C
orp.
/ G
reat
Pla
ins
Ener
gy In
c.2
Aqu
ila In
c. (
CO
ele
c. u
til. +
CO
, K
S, N
E, IA
gas
util
s. )
C7/
14/0
817
EG$9
40 m
illio
n ca
sh +
wor
king
cap
ital a
nd o
ther
adj
ustm
ents
940.
0
7/8/
06M
DU
Res
ourc
es G
roup
, Inc
.C
asca
de N
atur
al G
as C
orpo
ratio
nC
7/2/
0712
EG$3
05.2
mm
in c
ash
+ (
$173
.6 in
deb
t - $
13.0
in c
ash
equi
vale
nts)
465.
8
7/8/
06W
PS
Res
ourc
es C
orpo
ratio
nP
eopl
es E
nerg
y C
orpo
ratio
nC
Inte
grys
Ene
rgy
Gro
up2/
21/0
77
EG$2
.47
billi
on2,
472.
4
7/5/
06M
acqu
arie
Con
sort
ium
Duq
uesn
e Li
ght H
oldi
ngs
C5/
31/0
710
EE$1
.59
billi
on c
ash
+ $
1.09
bill
ion
tota
l deb
t2,
674.
4
6/22
/06
Gaz
Met
ro L
PG
reen
Mou
ntai
n P
ower
Cor
p.C
4/12
/07
10EE
$187
mill
ion
in c
ash
+ (
$100
.8 d
ebt -
$9.
1mm
in c
ash
equi
vale
nts)
279.
5
5/11
/06
ITC
Hol
ding
s C
orp
Mic
higa
n El
ectr
ic T
rans
mis
sion
C
o.C
10/1
0/06
5EE
$485
.6m
m c
ash
+ $
70m
m c
omm
on s
tock
+ $
311m
m a
ssum
ed d
ebt
866.
6
4/25
/06
Bab
cock
and
Bro
wn
Infr
astr
uctu
reN
orth
Wes
tern
Cor
p.W
7/24
/07
EE$2
.2 b
illio
n ca
sh2,
200.
0
2/27
/06
Nat
iona
l Grid
Key
Span
Cor
p.C
8/24
/07
18EE
$7.4
bill
ion
cash
+ $
4.5
billi
on lo
ng-t
erm
deb
t11
,877
.5
12/1
9/05
FPL
Gro
up In
c.C
onst
ella
tion
Ener
gy In
c.W
10/2
5/06
EE$1
1.3
billi
on e
quity
+ $
4.1
billi
on n
et d
ebt a
nd p
ensi
on li
abili
ties
15,3
11.5
5/24
/05
Mid
Am
eric
an E
nerg
y H
oldi
ngs
Co.
Pac
ifico
rpC
3/21
/06
10EE
$5.1
bill
ion
cash
+ $
4.3
billi
on in
net
deb
t and
pre
ferr
ed s
tock
9,30
0.0
5/9/
05D
uke
Ener
gy C
orp.
Cin
ergy
Cor
p.C
4/3/
0611
EE$9
.1 b
illio
n eq
uity
+ $
5.5
billi
on n
et d
ebt a
nd p
ensi
on li
abili
ties
14,6
00.0
12/2
0/04
Exel
on C
orp.
Pub
lic S
ervi
ce E
nter
pris
e G
roup
W
9/14
/06
EE$1
2.3
billi
on in
equ
ity +
$13
.4 b
illio
n in
net
deb
t and
pen
sion
liab
ilitie
s25
,700
.0
7/25
/04
PN
M R
esou
rces
TNP
Ent
erpr
ises
C6/
6/05
12EE
$189
mill
ion
in s
tock
and
cas
h an
d $8
35 m
illio
n in
deb
t1,
024.
0
2/3/
04A
mer
en C
orp
Illin
ois
Pow
er3
C10
/1/0
48
EE$1
.9 b
illio
n in
deb
t, pr
ef s
tock
, & o
ther
liab
+ $
400
mill
ion
in c
ash
2,30
0.0
11/2
4/03
Sagu
aro
Util
ity G
roup
L.P
.U
niSo
urce
Ene
rgy
W12
/30/
04P
E$8
50 m
illio
n ca
sh +
$2
billi
on in
deb
t2,
850.
0
11/3
/03
Exel
on C
orp.
Illin
ois
Pow
erW
11/2
2/03
EE$2
75 m
illio
n ca
sh +
$1.
8 bi
llion
in d
ebt +
$15
0 m
illio
n pr
omis
sory
not
e
2,22
5.0
4/30
/02
Aqu
ila In
cC
ogen
trix
Ene
rgy
Inc
W8/
2/02
EIP
P$4
15 m
illio
n ca
sh +
$1.
125
billi
on in
ass
umed
deb
t1,
540.
0
4/29
/02
Am
eren
Cor
pC
ILC
OR
P4
C1/
31/0
39
EE$5
41 m
illio
n ca
sh +
$78
1 in
ass
umed
deb
t + $
41 m
illio
n in
pre
f sto
ck1,
400.
0
10/8
/01
Nor
thw
est N
atur
al G
asP
ortla
nd G
ener
alW
5/16
/02
GE
$1.5
5 bi
llion
cas
h +
$25
0mm
in s
tock
1,80
0.0
9/20
/01
Duk
e En
ergy
Wes
tcoa
st E
nerg
yC
3/14
/02
6EG
Equi
ty +
cas
h va
lued
at $
27.9
0 pe
r W
estc
oast
sha
re8,
500.
0
9/10
/01
Dom
inio
n R
esou
rces
Loui
s D
reyf
us N
atur
al G
as
C11
/1/0
12
EG$8
90m
m c
ash
+ $
900m
m s
tock
+$5
05m
m d
ebt
2,29
5.0
2/20
/01
Ener
gy E
ast
RG
S En
ergy
C6/
28/0
216
EE$1
.4 b
ill. c
ash
& e
quity
+ $
1.0
bill.
net
deb
t2,
400.
0
2/12
/01
PEP
CO
Con
ectiv
C8/
1/02
18EE
$2.2
bill
cas
h &
equ
ity +
$2.
8 bi
ll. n
et d
ebt
5,00
0.0
11/9
/00
PN
MW
este
rn R
esou
rces
5W
1/8/
02EE
Stoc
k tr
ansf
er4,
442.
0
10/2
/00
Nor
thW
este
rnM
onta
na P
ower
6C
2/15
/02
16EE
$1.1
bill
ion
in c
ash
1,10
0.0
9/5/
00N
atio
nal G
rid G
roup
N
iaga
ra M
ohaw
kC
1/31
/02
16EE
$19
per
shar
e8,
900.
0
8/8/
00Fi
rstE
nerg
yG
PU
Inc.
C11
/7/0
115
EE$3
5.60
per
sha
re12
,000
.0
7/31
/00
FPL
Gro
upEn
terg
yW
4/2/
01EE
1/1
- FP
L, 0
.585
/1 -
ETR
27,0
00.0
7/17
/00
AES
Cor
pora
tion
IPA
LCO
C3/
27/0
18
IPP
E$2
5 pe
r sh
are
3,0
40.0
6/30
/00
NS
Pow
erB
ango
r H
ydro
CEm
era
10/1
0/01
16EE
$26.
50 p
er s
hare
206.
0
5/30
/00
WP
S R
esou
rces
Wis
cons
in F
uel a
nd L
ight
C4/
2/01
11EG
1.73
sha
res
of W
PSR
55.0
2/28
/00
Pow
erG
en p
lcLG
&E
C12
/11/
0010
EE$2
4.85
per
sha
re5,
400.
0
11/1
0/99
Ener
gy E
ast
Ber
kshi
re E
nerg
y R
esou
rces
C9/
1/00
10EG
$38
per
shar
e13
6.0
11/8
/99
Sier
ra P
acifi
c R
esou
rces
Por
tland
Gen
eral
W4/
26/0
1EE
$2.1
bill
ion
3,10
0.0
11/4
/99
Key
Span
East
ern
Ente
rpris
esC
11/9
/00
12EG
$64
per
shar
e2,
500.
0
10/2
5/99
Ber
kshi
re H
atha
way
Mid
Am
eric
an E
nerg
yC
3/14
/00
5P
E$3
5.05
per
sha
re9,
000.
0
10/1
3/99
Con
solid
ated
Edi
son
Nor
thea
st U
tiliti
esW
3/15
/01
EE$2
5 pe
r sh
are
7,50
0.0
10/5
/99
DTE
Ene
rgy
MC
N E
nerg
yC
5/31
/01
19EG
$28.
50 p
er s
hare
4,60
0.0
9/23
/99
Pec
o En
ergy
Co.
Uni
com
Cor
p.C
Exel
on10
/23/
0013
EE0.
95/1
- U
CM
, 1/1
- P
E31
,800
.0
9/9/
99A
llegh
eny
Ener
gyW
est V
irgin
ia P
ower
C1/
4/00
4EE
$75
mill
ion
75.0
8/23
/99
Car
olin
a P
ower
& L
ight
Flor
ida
Pro
gres
sC
Pro
gres
s En
ergy
11
/30/
0015
EE$5
4 pe
r sh
are
8,00
0.0
6/30
/99
Ener
gy E
ast
CTG
Res
ourc
esC
9/1/
0015
EG$4
1 pe
r sh
are
575.
0
6/28
/99
Wis
cons
in E
nerg
y C
orp.
Wic
or In
c.C
4/26
/00
10EG
$31.
50 p
er s
hare
1,27
5.0
6/15
/99
Ener
gy E
ast
CM
P G
roup
, Inc
.C
9/1/
0015
EE$2
9.50
per
sha
re
1,22
8.0
6/15
/99
Nor
thea
st U
tiliti
esYa
nkee
Gas
C3/
1/00
9EG
$45
per
shar
e67
9.0
6/14
/99
Dyn
egy
Illin
ova
C2/
2/00
7IP
PE
0.69
/1 -
DYN
, 1/1
- IL
N2,
000.
0
6/14
/99
Indi
ana
Ener
gySi
gCor
pC
Vect
ren
3/31
/00
9G
E1.
33/1
- S
IG, 1
/1-
IEI
1,90
0.0
6/7/
99N
isou
rce
Inc.
Col
umbi
a En
ergy
C11
/1/0
017
EG$7
4/sh
are
6,20
0.0
5/25
/99
S.W
. Acq
uisi
tion
Cor
p.TN
P C
orpo
ratio
nC
4/7/
0011
PE
$74
per
shar
e10
0.0
5/17
/99
OG
E En
ergy
Tran
sok
LLC
C7/
1/99
2EG
$701
mill
ion
701.
0
5/11
/99
Util
icor
p U
nite
dEm
pire
Dis
tric
t Ele
ctric
W1/
3/01
EE$2
9.50
per
sha
re in
cas
h or
sto
ck76
5.0
4/23
/99
Ener
gy E
ast
Con
nect
icut
Ene
rgy
C2/
9/00
9EG
$42
per
shar
e, 5
0% c
ash
and
1.43
-1.8
2/1
- C
NE
617.
0
3/25
/99
Nor
ther
n St
ates
Pow
erN
ew C
entu
ry E
nerg
ies
CXc
el E
nerg
y8/
17/0
017
EE1.
55/1
- N
CE,
1/1
- N
SP6,
000.
0
3/5/
99U
tilic
orp
Uni
ted
St. J
osep
h P
ower
& L
ight
Co.
C12
/29/
0021
EE$2
3 pe
r sh
are
277.
0
2/22
/99
Dom
inio
n R
esou
rces
Con
solid
ated
Nat
ural
Gas
Co.
C1/
28/0
011
EG$6
6.60
per
sha
re6,
400.
0
2/17
/99
SCA
NA
Cor
pP
SC O
f Nor
th C
arol
ina
C2/
10/0
012
EG$3
3 pe
r sh
are
or 1
.02-
1.45
sha
res
of S
CG
9,00
0.0
2/1/
99N
atio
nal G
rid U
SA/N
EES
East
ern
Util
ities
Ass
ocia
tes
C4/
19/0
014
EE$3
1 pe
r sh
are
in c
ash
634.
0
2/1/
99Se
mpr
a En
ergy
KN
Ene
rgy
W6/
1/99
EG$2
5 pe
r sh
are
6.0
01-N
ov-9
8C
P&
LN
orth
Car
olin
a N
atur
al G
as C
orp.
C7/
1/99
9EG
$35
per
shar
e in
CP
L co
mm
on s
tock
354.
0
1 TX
U (
now
Ene
rgy
Futu
re H
oldi
ngs
Cor
p.)
was
acq
uire
d by
the
Texa
s En
ergy
Fut
ure
Hol
ding
s Li
mite
d P
artn
ersh
ip (
TEF)
on
10/1
0/20
07.
TE
F w
as fo
rmed
by
a gr
oup
of in
vest
ors
led
by K
ohlb
erg
Kra
vis
Rob
erts
and
Tex
as P
acifi
c G
roup
to fa
cilit
ate
the
mer
ger.
2 A
mer
en p
urch
ased
Illin
ois
Pow
er fr
om D
yneg
y C
orpo
ratio
n. D
yneg
y C
orp
acqu
ired
Illin
ois
Pow
er in
Feb
ruar
y 20
00.
3 A
mer
en p
urch
ased
CIL
CO
RP
from
AES
Cor
pora
tion.
AES
Cor
p ac
quire
d C
ILC
OR
P in
O
ctob
er 1
999.
4 P
NM
pur
chas
ed W
este
rn R
esou
rces
’ ele
ctric
ope
ratio
ns in
clud
ing
gene
ratio
n,
tran
smis
sion
, and
dis
trib
utio
n.
5 N
orth
Wes
tern
Cor
pora
tion
purc
hase
d M
onta
na P
ower
’s e
lect
ric a
nd n
atur
al g
as tr
ansm
issi
on
and
dist
ribut
ion
asse
ts.
NA
= A
cqui
red
com
pany
priv
atel
y he
ld o
r no
dat
a av
aila
ble
Sour
ce: E
EI F
inan
ce D
epar
tmen
t and
SN
L Fi
nanc
ial
C =
Com
plet
edW
= W
ithdr
awn
PN
= P
endi
ngE
= E
lect
ricG
= G
as
O =
Oil
IPP
= In
depe
nden
t
Pow
er P
rodu
cer
P =
Priv
atiz
ed
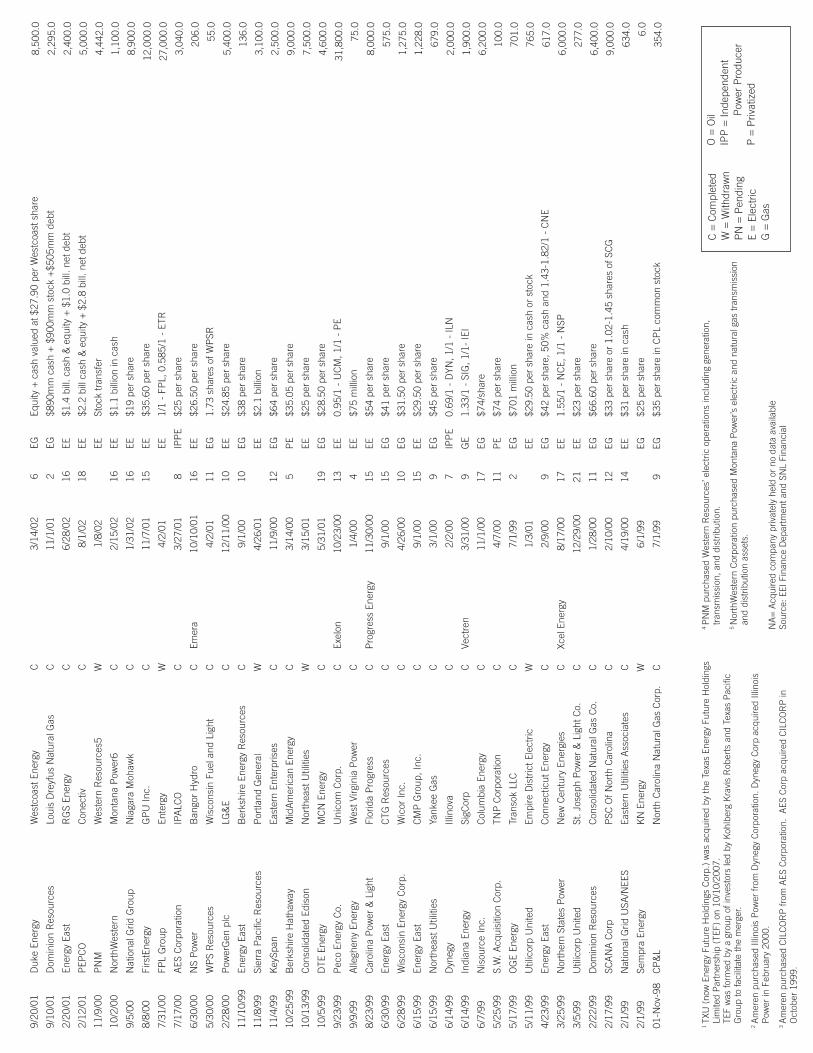

52 EEI 2012 FINANCIAL REVIEW
BUSINESS STRATEGIES
investors—the second half of the year brought a quickening in the pace of individual power plant transactions and talk that the chill in plant sales caused by a mismatch between buyer offers and seller asks may be ending. The prolonged depressed state of nat-ural gas prices and competitive power prices has made new build more ex-pensive than buying used. And finan-cial buyers, such as private equity and hedge funds, are looking to buy at the low point in the cycle, profiting from the hold until power prices and plant values rise with coal plant retire-ments, reserve margin tightening and hopefully a stronger economy. Sur-viving IPPs, looking to unload plants held through the boom/bust cycle of the past several years, were cited as probable sellers. Regulated utilities, as well as public power companies, could be buyers too, looking to own plants rather than purchase power if the plant investment cost is right. The stocks of regulated utilities gen-erally outperformed those of hybrid regulated/competitive companies for much of the past three years. And analysts and news reports suggested boards of many largely regulated and hybrid utilities are looking hard at whether they need to own mer-chant plants. One news report cited an estimate that 80 to 100 gigawatts overall of unregulated assets are ready to “shake loose” and move over the next five years, if buyers and sellers can agree on price. Of course, for that to happen it’s likely that economic growth will have to strengthen, power demand will have to grow and com-petitive power prices will have to rise. When that will happen is anybody’s guess.
equipment and facilities throughout a contiguous service territory, regula-tory savings and improved purchas-ing leverage with vendors and service providers. The companies stressed that savings will be achieved primar-ily through retirements and natural turnover instead of layoffs. The com-panies emphasized that CVPS’s his-toric commitment to its hometown of Rutland will remain part of the new utility’s corporate culture. The merged company will locate its head-quarters for Operations and Energy Innovation in Rutland and empha-sized support for economic develop-ment projects there, including renew-able energy initiatives, which helped secure backing for the merger from Rutland’s political leadership. The June 27 completion date was consis-tent with the six to 12 month time frame cited by the companies when the deal was announced. CVPS is the largest electricity distribution com-pany in Vermont, serving 160,000 customers in 163 towns and mu-nicipalities. It has been awarded the national Emergency Recovery Award from the Edison Electric Institute on four occasions, and has been ranked among the most reliable U.S. com-panies by Forbes magazine for more than five years.
Plant-Level Deals Begin to MoveEven as whole company deal activ-
ity was stalled by a host of issues—from European macroeconomic struggles that have sidelined foreign buyers, to low natural gas price and related depressed stocks of hybrid regulated/competitive holding com-panies, to challenges with the deal economics needed to get regulatory support and make financial sense for
However, early 2013 brought news of concern by the Southwest Power Pool’s (SPP) transmission owners about the impact of the plan to place Entergy’s transmis-sion assets under the control of the Midwest ISO (MISO). State regula-tors in Texas and Louisiana said the two companies haven’t shown the transaction will not have an adverse impact on rates. The Arkansas com-mission cited worries about the ROE of the spun-off assets, while the Ten-nessee Valley Authority weighed in with concerns about the impact on its system operations and rate payers once Entergy’s assets are controlled by MISO. The companies are hop-ing to close the deal sometime in 2013—a schedule consistent with expectations when the merger was announced in late 2011—pending receipt of all required regulatory ap-provals.
Gaz Métro Completes Acquisition of Central Vermont Public Service
June 27, 2012 witnessed the com-pletion of a deal announced one year earlier, on July 12, 2011, when Cen-tral Vermont Public Service (CVPS) said it had terminated an agreement to be acquired by one Canadian util-ity (Fortis) and that it had agreed to be acquired by another (Quebec-based distribution utility Gaz Métro, owner of neighboring utility Green Mountain Power). The acquisition enabled the combining of CVPS and Green Mountain Power Corporation (GMP) into a single utility serving Vermonters. CVPS cited as motiva-tion for the match customer ben-efits valued at $144 million over the next decade. These included more efficient distribution of resources,

EEI 2012 FINANCIAL REVIEW 53
BUSINESS STRATEGIES
Construction
Generation
New CapacityThe electric utility industry add-
ed 30,352 MW in 2012, the most new capacity added in one year since 2003 and a 35% increase over 2011. The shareholder-owned elec-tric utilities brought 13,325 MW online, split between new builds (7,236 MW) and expansions at ex-isting plant sites (6,089 MW). It proved to be a banner year for re-newable energy, with wind and solar
New Capacity Online (MW) 2008-2012
p = preliminary r = revised
Note: Totals may reflect rounding. Historical data subject to revision.
Source: Ventyx, Inc., The Velocity Suite and EEI Finance Department
U.S. Shareholder- Owned Electric Entire2012p Utilities Industry New Plant 7,236 18,834Plant expansions 6,089 11,518Total 13,325 30,352 2011r New Plant 1,977 10,961Plant expansions 5,296 11,544Total 7,272 22,505 2010r New Plant 3,221 8,337Plant expansions 5,847 12,256Total 9,068 20,593 2009r New Plant 5,182 13,710Plant expansions 6,676 11,712Total 11,858 25,422 2008r New Plant 3,263 12,084Plant expansions 5,590 8,904Total 8,852 20,988
composing half of all new capacity added to the grid. The year also saw substantial new gas-fired capacity added to the grid (8,841 MW) as well as coal capacity (4,525 MW), as plants announced several years ago came to fruition. The shareholder-owned electric utilities added 5,716 MW of new natural gas capacity and 2,025 MW of new coal capacity last year. The new capacity is distribut-ed around the U.S., with most new additions located in the southeast (SERC region). Duke Energy Corp. and Southern Company led the ad-ditions in this region by adding new
natural gas units at several sites of re-tiring coal units.
It was a record breaking year for wind, with new additions totaling 12,351 MW as developers rushed to get facilities online before the wind production tax credit (PTC) was scheduled to expire on December 31, 2012. Early in January 2013, Congress passed legislation extend-ing the PTC for one additional year, until the end of 2013. The share-holder-owned electric utilities added a total of 4,222 MW of wind across 17 states, with California, Kansas, and Iowa seeing the most new ca-pacity. NextEra Energy Inc. led the way, with new wind capacity totaling 1,378 MW.
Solar capacity additions continue to grow rapidly, with 2,882 MW added in 2012, a 79% increase over 2011. The shareholder-owned elec-tric utilities built and owned 564 MW of this total, led by Sempra Energy with 238 MW and Con-solidated Edison Inc. with 88 MW. The growth in 2012 was driven pri-marily by the completion of several utility scale solar projects, including the 144 MW Mesquite Solar facility in Arizona and the 94 MW Cop-per Valley Solar project in Nevada, both owned by Sempra Energy. The Mesquite Solar facility was a benefi-ciary of a $337 million loan guaran-tee from the Department of Energy. While the shareholder-owned elec-tric utilities added new solar capacity in 12 states, Arizona, California, and Nevada accounted for 80% of the new capacity additions.

54 EEI 2012 FINANCIAL REVIEW
BUSINESS STRATEGIES
Shareholder- Entire Shareholder- Entire Shareholder- Entire Shareholder- Entire Shareholder- Entire Owned Industry Owned Industry Owned Industry Owned Industry Owned Industry 2008r 2008r 2009r 2009r 2010r 2010r 2011r 2011r 2012p 2012p
(MW)
New Capacity Online by Fuel Type 2008-2012
p = preliminaryr = revised Note: Other includes diesel, fuel oil, landfill gas, pet coke, solar/PV, waste heat, water, wood, biomass, and fuel cells.Entire Industry includes all new capacity placed on the grid by shareholder-owned electric utilities, independent power producers, municipals,co-ops, government authorities and corporations. Data includes expansions and new plants.Prior year data revised to incorporate additional data on solar projects.
Source: Ventyx, Inc., The Velocity Suite and EEI Finance Department
0
5,000
10,000
15,000
20,000
25,000
30,000
U.S. Shareholder-Owned Elecric Utilities Entire IndustryFuel Type Online Online Online Online Online Online Online Online Online Online 2008r 2009r 2010r 2011r 2012p 2008r 2009r 2010r 2011r 2012p
Coal 790 1,998 4,848 689 2,025 1,390 3,566 6,692 1,909 4,525
Natural Gas 4,687 6,249 2,313 4,283 5,716 9,105 10,627 7,072 10,299 8,841
Nuclear 422 245 154 341 588 454 245 154 353 770
Wind 2,857 3,146 1,496 1,546 4,222 9,206 9,451 5,126 7,464 12,351
Solar — 40 100 322 564 305 418 772 1,614 2,882
Other 96 180 157 90 209 528 1,115 777 866 983
Total 8,852 11,858 9,068 7,272 13,325 20,988 25,422 20,593 22,505 30,352
Coal
Natural Gas
Nuclear
Wind
Solar
Other

EEI 2012 FINANCIAL REVIEW 55
BUSINESS STRATEGIES
0
1,000
2,000
3,000
4,000
5,000
6,000
7,000
8,000
9,000
2012p2011r201020092008
Regulated
competitive
(MW)
Notes: Plant category based on designated operating companyowner. Totals may reflect rounding.p: preliminaryr: revised
Source: Ventyx, Inc., The Velocity Suite and EEI Finance Department
U.S. SHAREHOLDER-OWNED ELECTRIC UTILITIES
New Capacity Online – Regulated vs. Competitive
2008 2009 2010 2011r 2012p
Total Competitive 3,558 4,320 3,233 1,530 4,916
Total Regulated 5,294 7,538 5,835 5,742 8,409
Total 8,852 11,858 9,068 7,272 13,325
Competitive
Regulated
New Capacity Online by Region 2008-2012
p = preliminaryr = revised Note: Data includes new plants and expansions of existing plants, including nuclear uprates. Totals may reflect rounding. ReliabilityFirst Corporation (RFC) began operations on 1/1/06 and includes ECAR, MAAC, and MAIN.
Source: Ventyx, Inc., The Velocity Suite and EEI Finance Department
U.S. SHAREHOLDER-OWNED ELECTRIC UTILITIES
2008 2009 2010r 2011r 2012p Region Online Cancelled Online Cancelled Online Cancelled Online Cancelled Online CancelledECAR — — — — — — — — — —ERCOT 1,095 729 2,589 3,935 1,229 — — 465 304 —FRCC — — 4,117 — 20 2,390 1,250 — 255 —HCC — — 5 — 113 — — — 21 —MAAC — — — — — — — — — —MAIN — — — — — — — — — —MRO 2,531 300 1,060 504 351 532 373 500 881 1,078NPCC 92 8 124 3 1 39 350 245 —RFC 775 867 486 1,288 741 3,175 1,458 93 2,202 1,618SERC 1,134 — 567 4,131 1,770 605 2,635 — 5,091 44SPP 670 150 740 630 2,347 80 431 — 1,590 150WECC 2,556 2,910 2,287 4,519 2,495 504 1,083 2,202 2,741 10,230Total 8,852 4,956 11,858 15,131 9,068 7,287 7,272 3,609 13,325 13,121

56 EEI 2012 FINANCIAL REVIEW
BUSINESS STRATEGIES
eration and the relatively low capital costs associated with building a natu-ral gas plant compared to other base-load sources. In addition, low natural gas prices are expected to remain low for the foreseeable future, increasing the attractiveness of the fuel. Though there remains 1,162 MW of new coal
The 5,099 MW of natural gas capac-ity announced in 2012 is the highest level announced in five years, and a 49% increase over the amount an-nounced in 2011. The rise in an-nouncements for natural gas capac-ity is primarily driven by increasing regulatory constraints on coal gen-
CancelationsIn 2012, the shareholder-owned
electric utilities canceled plans for 13,121 MW of capacity, exceeding the total amount canceled in the prior two years combined. More than two-thirds of the canceled capacity is solar (8,834 MW), the majority of which is several large solar thermal facilities originally planned for the west. Con-centrated Solar Power (CSP) projects have struggled to compete economi-cally given the rapid decline in recent years of Photovoltaic (PV) prices as well as low natural gas prices. A 500 MW integrated gasification com-bined cycle (IGCC) plant in Utah and a handful of natural gas and wind projects around the country were also canceled.
AnnouncementsThe shareholder-owned electric
utilities announced plans for 6,108 MW of new capacity last year, about 19% less than what was announced in 2011 and far less than amounts announced in prior years. Not sur-prising, 84% of the announced ca-pacity was for natural gas plants.
New vs. Cancelled Capacity by Fuel Type (MW)
p = preliminaryr = revised Note: Totals may reflect rounding. Data includes new plants and expansions of existing plants, including nuclear uprates. Other = diesel, fuel oil, landfill gas, pet coke, solar/PV, waste heat, water, wood, biomass, and fuel cells.
Source: Ventyx, Inc., The Velocity Suite and EEI Finance Department
U.S. SHAREHOLDER-OWNED ELECTRIC UTILITIES
Fuel Type Online Canceled Online Canceled Online Canceled Online Canceled Online Canceled 2008 2008 2009 2009 2010 2010 2011r 2011r 2012p 2012pCoal 790 2,759 1,998 3,634 4,848 1,428 689 — 2,025 500Natural Gas 4,687 1,810 6,249 4,508 2,313 3,290 4,283 1,140 5,716 1,426Nuclear 422 — 245 6,100 154 1,600 341 — 588 36Solar/Photovoltaics — — 40 — 100 46 322 250 564 8,834Wind 2,857 262 3,146 889 1,496 827 1,546 2,206 4,222 2,318Other 96 125 180 — 157 96 90 13 209 6Total 8,852 4,956 11,858 15,131 9,068 7,287 7,272 3,609 13,325 13,121
2012 New Capacity Announcements by Fuel Type
U.S. SHAREHOLDER-OWNED ELECTRIC UTILITIES
Note: Other includes biomass, diesel/fuel oil, fuel cells, landfill gas, pet coke, solar/PV, waste heat, water, wood. Totals may reflect rounding.
Source: Ventyx, Inc., The Velocity Suite and EEI Finance Department
Hydro11 MW
Natural Gas5,099 MW
Other25 MW
Wind521 MW Solar
453 MW
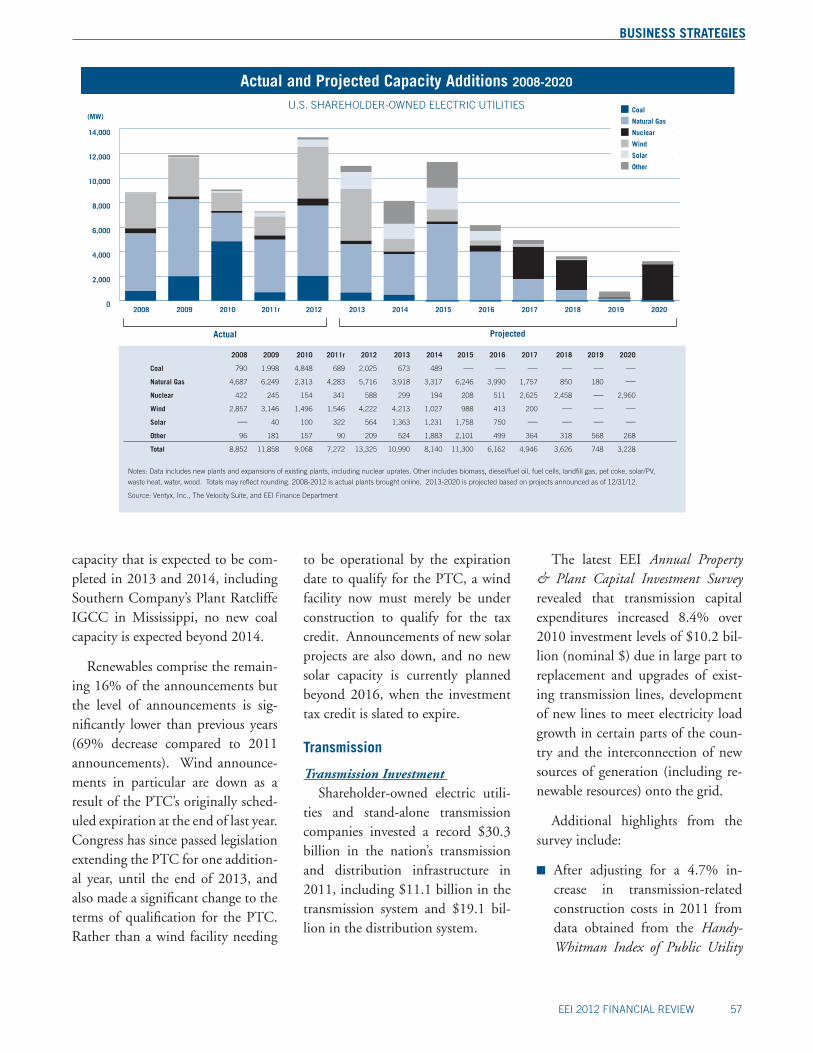
EEI 2012 FINANCIAL REVIEW 57
BUSINESS STRATEGIES
The latest EEI Annual Property & Plant Capital Investment Survey revealed that transmission capital expenditures increased 8.4% over 2010 investment levels of $10.2 bil-lion (nominal $) due in large part to replacement and upgrades of exist-ing transmission lines, development of new lines to meet electricity load growth in certain parts of the coun-try and the interconnection of new sources of generation (including re-newable resources) onto the grid.
Additional highlights from the survey include:
■ After adjusting for a 4.7% in-crease in transmission-related construction costs in 2011 from data obtained from the Handy-Whitman Index of Public Utility
to be operational by the expiration date to qualify for the PTC, a wind facility now must merely be under construction to qualify for the tax credit. Announcements of new solar projects are also down, and no new solar capacity is currently planned beyond 2016, when the investment tax credit is slated to expire.
Transmission
Transmission Investment Shareholder-owned electric utili-
ties and stand-alone transmission companies invested a record $30.3 billion in the nation’s transmission and distribution infrastructure in 2011, including $11.1 billion in the transmission system and $19.1 bil-lion in the distribution system.
(MW)U.S. SHAREHOLDER-OWNED ELECTRIC UTILITIES
Actual and Projected Capacity Additions 2008-2020
Notes: Data includes new plants and expansions of existing plants, including nuclear uprates. Other includes biomass, diesel/fuel oil, fuel cells, landfill gas, pet coke, solar/PV,
waste heat, water, wood. Totals may reflect rounding. 2008-2012 is actual plants brought online. 2013-2020 is projected based on projects announced as of 12/31/12.
Source: Ventyx, Inc., The Velocity Suite, and EEI Finance Department
Actual Projected
0
2,000
4,000
6,000
8,000
10,000
12,000
14,000
2008 2009 2010 2011r 2012 2013 2014 2015 2016 2017 2018 2019 2020
2008 2009 2010 2011r 2012 2013 2014 2015 2016 2017 2018 2019 2020
Coal 790 1,998 4,848 689 2,025 673 489 — — — — — —Natural Gas 4,687 6,249 2,313 4,283 5,716 3,918 3,317 6,246 3,990 1,757 850 180 —Nuclear 422 245 154 341 588 299 194 208 511 2,625 2,458 — 2,960
Wind 2,857 3,146 1,496 1,546 4,222 4,213 1,027 988 413 200 — — —Solar — 40 100 322 564 1,363 1,231 1,758 750 — — — —Other 96 181 157 90 209 524 1,883 2,101 499 364 318 568 268
Total 8,852 11,858 9,068 7,272 13,325 10,990 8,140 11,300 6,162 4,946 3,626 748 3,228
Coal
Natural Gas
Nuclear
Wind
Solar
Other
capacity that is expected to be com-pleted in 2013 and 2014, including Southern Company’s Plant Ratcliffe IGCC in Mississippi, no new coal capacity is expected beyond 2014.
Renewables comprise the remain-ing 16% of the announcements but the level of announcements is sig-nificantly lower than previous years (69% decrease compared to 2011 announcements). Wind announce-ments in particular are down as a result of the PTC’s originally sched-uled expiration at the end of last year. Congress has since passed legislation extending the PTC for one addition-al year, until the end of 2013, and also made a significant change to the terms of qualification for the PTC. Rather than a wind facility needing

58 EEI 2012 FINANCIAL REVIEW
BUSINESS STRATEGIES
Company Site Early Site Permit Design Expected Construction & (State) (ESP) (# of Units) Operating License SubmittalDTE Energy Co. Fermi (MI) — ESBWR (1) September 2008
Dominion Resources Inc. North Anna (VA) Approved November 2007 APWR (1) November 2007
Duke Energy Corp. William States Lee (SC) — AP1000 (2) December 2007
Energy Future Holdings Inc. (Luminant) Comanche Peak (TX) — APWR (2) September 2008
Exelon Corp. Clinton (IL) Approved March 2007 TBD TBD
Florida Power & Light Turkey Point (FL) TBD AP1000 (2) June 2009
PPL Corp. / UniStar Bell Bend (PA) — EPR (1) October 2008
Progress Energy Shearon Harris (NC) — AP1000 (2) February 2008
Progress Energy Levy County (FL) — AP1000 (2) July 2008
PSEG Lower Alloways Creek (NJ) Submitted May 2010 TBD TBD
SCANA Corp. V.C. Summer (SC) — AP1000 (2) Approved March 2012
Southern Co. Vogtle (GA) Approved August 2009 AP1000 (2) Approved February 2012
UniStar Calvert Cliffs (MD) — EPR (1) July 2007 & March 2008
Note: As of September 2012
Proposed New Nuclear PlantsU.S. SHAREHOLDER-OWNED ELECTRIC UTILITIES
Source: Nuclear Energy Institute, Nuclear Regulatory Commission and EEI Finance Department
Legend: TBD: To Be Determined AP1000: Reactor designed by WestinghouseAPWR: Advanced Pressurized Water Reactor
EPR: Pressurized Water Reactor designed by FramatomeESBWR: Economic Simplified Boiling Water ReactorThose in italics represent COL applications that have been approved so far.
Stage of Projected Capacity Additions
Note: Data as of 12/31/12. Other includes biomass, diesel/fuel oil, fuel cells, landfill gas, pet coke, solar/PV, waste heat, water, wood. Totals may reflect rounding. Data represents projects being developed with a projected in service date through 2020.
Source: Ventyx, Inc., The Velocity Suite and EEI Finance Department
U.S. SHAREHOLDER-OWNED ELECTRIC UTILITIES
by MW Fuel Proposed Feasibility Application Pending Permitted Site Prep Under Construction Testing TotalCoal 30 — — — — 533 600 1,162Natural Gas 3,466 1,051 5,181 4,901 690 4,909 60 20,258Nuclear 389 — 6,432 680 614 1,092 47 9,254Wind 4,355 125 731 1,107 — 39 — 6,357Solar 954 — 1,838 1,246 258 670 — 4,966Other 1,070 2,295 723 2,230 3 197 — 6,517Total 10,263 3,471 14,905 10,163 1,565 7,439 707 48,514

EEI 2012 FINANCIAL REVIEW 59
BUSINESS STRATEGIES
A supportive regulatory environ-ment with conducive policies can as-sist in overcoming the risks and chal-lenges associated with developing, constructing, operating and main-taining transmission. For example, without an assurance that federal regulatory policies will be inherently dependable and applied consistently, investors may not be willing to bear the risk associated with investing in critical energy infrastructure, includ-ing transmission. In this regard, in-vestors must have the opportunity to earn a sufficient and stable rate of return.
Regional Transmission ExpansionSeveral regions have recently ap-
proved plans for additional invest-ment in the transmission system.
ISO-NE released its Regional Sys-tem Plan in November 2012, high-lighting 256 transmission projects, valued at about $6.0 billion, in vari-ous stages of development from the early stages of conception through under construction and nearly com-pleted. This includes several pro-posed transmission lines included in Maine’s Power Reliability Program, the New England East-West Solu-tion, and the Long-Term Lower Southeastern Massachusetts Project.
MISO’s board of directors ap-proved their annual transmission expansion plan at the end of 2011, which includes $6.5 billion in new transmission projects through 2021. The projects are expected to improve reliability and to connect additional renewable energy to the grid.
In New York, the Governor cre-ated an Energy Highway Task Force and asked the task force to make
0
2,000
4,000
6,000
8,000
10,000
12,000
14,000
16,000
2006 2008 2009 2010
($ Millions [Real $2011])
2012p 2013p 2014p
Planned*Actual
Actual and Planned Transmission Investment 2006-2015
2011
p = preliminary
Note: The Handy-Whitman Index of Public Utility Construction Costs used to adjust actual investment for inflation from year to year. Forecasted investment data are adjusted for inflation using the GDP Deflator.
*Planned total industry expenditures are preliminary and estimated from 85% response rate to EEI’s Electric Transmission Capital Budget & Forecast Survey. Actual expenditures from EEI’s Annual Property & Plant Capital Investment Survey and from the FERC Form 1 reports.
Source: Edison Electric Institute, Business Information Group
8,627
10,680
15,15213,973
12,424
9,4608,876
10,314
2007 2015p
11,070
13,075
sion construction between 2012 and 2015 (Real $2011). If realized, this planned investment would repre-sent a 39% increase over actual total transmission investment from 2007 to 2010. The forecasted data sug-gest that transmission investment should peak in 2013 before taper-ing off somewhat in 2014 and 2015 as major transmission projects are completed in California, Texas, and in the Midwestern states. Post 2013 investment is also impacted by the recent modification, delay or cancel-lation of major transmission projects, primarily attributable to load growth forecast revisions. Nevertheless, the expected investment by EEI’s mem-bers during 2014 and 2015 is signifi-cantly higher than in 2011.
Construction Costs, actual trans-mission expenditures increased 3.7% (2011 $) as compared to 2010 investment levels.
■ The level of industry transmis-sion investment in 2011 is 96% higher than investment made in 2000 (after adjusting for cost in-creases) and over this same time period, the industry has made a cumulative investment of $97.4 billion in transmission.
■ The industry is projected to spend $13-14 billion on transmission capital expenditures in 2012.
Going forward, investor-owned utilities and stand-alone transmis-sion companies are planning to in-vest nearly $55 billion in transmis-

60 EEI 2012 FINANCIAL REVIEW
BUSINESS STRATEGIES
bution system. In addition, many companies increased distribution investment in 2011 to repair or re-place lines caused by damage from weather events including Hurricane Irene and the Halloween snowstorm. Adjusting for a 4.9% increase in dis-tribution-related construction costs in 2011, distribution investment in-creased 7.9% (2011 $) as compared to 2010 distribution investment lev-els. Since the beginning of 2000, the industry has invested $237 billion (2011 $) in the nation’s distribution system. The industry projected to spend $20 billion on distribution capital expenditures in 2012.
Capital expenditures on distribu-tion infrastructure projects have fluc-tuated greatly over the years as the distribution sector is closely tied to economic and population growth. In addition, line repair and restoration costs from severe weather-related events can have a significant impact on capital expenditures depending on the frequency and severity of the storms in any given year.
The electric power sector is facing significant capital spending in the distribution sector. The reasons for this are numerous and include the normal turnover of infrastructure in-vestments and the increased replace-ment costs of those assets due to the development of new and better tech-nologies, but also the need to harden the grid and to decrease restoration response times, as well as the need to prepare the distribution system for new ways to utilize it and the inte-gration of increasing amounts of new distributed resources being developed by both consumers and utilities.
approved a 5-year plan that is an-ticipated to result in $1.7 billion in transmission expansion projects. The bulk of the investment is focused on enhancing reliability, but the projects will also enable additional renewable capacity to connect to the grid so that the states within SPP are able to meet their renewable goals.
To help achieve the state’s 33 per-cent renewable portfolio standard (RPS) target by 2020, CAISO has proposed to add a new category of transmission projects that will fa-cilitate the necessary expansion of the electric grid to support renew-able, variable resources. The CAISO 2012-2013 Transmission Plan iden-tified 36 transmission projects with an estimated cost of $1.35 billion needed to maintain system reliability and five smaller policy-driven up-grades. In addition, consistent with previous plans, CAISO expects that no new major transmission projects are required to be approved by the region (other than those already ap-proved and under development) to support achievement of California’s 33 percent RPS given the transmis-sion projects already approved or progressing through California Pub-lic Utilities Commission approval process.
Distribution
Distribution Investment Distribution investment in 2011
amounted to $19.1 billion, an in-crease of 13.7% over 2010 distri-bution investment of $16.9 billion (nominal $) as utilities ramped up development of automated meter in-frastructure (AMI) and other Smart Grid activities related to the distri-
recommendations to upgrade and modernize the state’s electric system through a combination of generation and transmission projects utilizing both public and private investments. The plan put forth by the task force leverages nearly $6 billion in public and private funding, including more than $1.0 billion for transmission projects that will increase the capac-ity of the system by 1,000 MW, as well as additional grid upgrades to enhance reliability and enable the expansion of renewable generation. As a first step as part of this plan, the New York Power Authority has approved a $726 million project for repair and improvements to its trans-mission system in western, central and northern New York.
In their 2012 Regional Transmis-sion Expansion Plan (RTEP), PJM has identified $2.4 billion in trans-mission upgrades needed to address reliability concerns associated with the deactivation of 104 generating units expected between May 2012 and the end of 2015. PJM projects that additional deactivation requests will be received in 2013, necessitat-ing additional analyses and transmis-sion upgrades. The PJM board also voted to remove the Mid-Atlantic Power Pathway (MAPP) and Po-tomac Appalachian Transmission Highline (PATH) projects from the RTEP due to updated analysis that showed that these projects would not be needed for several years. How-ever, as the region braces for record coal-fired generator retirements, PJM has approved 777 local reliabil-ity transmission upgrades, equal to approximately $5 billion.
In SPP, the board of directors has

EEI 2012 FINANCIAL REVIEW 61
BUSINESS STRATEGIES
Fuel Sources for Electric Generation 2003–2012
U.S. ELECTRIC UTILITY AND NON-UTILITY
U.S. Electric Utility: Owns and/or operates facilities within the United States, its territories, or Puerto Rico for the generation, transmission, distribution, or sale of electric energy primarily for use by the public. This includes shareholder-owned utilities, public power, and cooperatives.
Non-Utility Power Producer: Non-utility power producers include qualifying cogenerators, qualifying small power producers, and other non-utility generators (including independent power producers) without a designated franchised service area.
Source: U.S. Department of Energy, Energy Information Administration (EIA)
0
10
20
30
40
50
60
Coal
Nuclear
Natural Gas
Oil
Conventional Hydro
Other Renewables
2012p2011r201020072003 2004 2005 2006 2008 2009
p: preliminary
Fuel Sources for Net Electric Generation U.S. ELECTRIC UTILITY AND NON-UTILITY
Note: Totals may not equal 100.0% due to rounding.p: preliminary
U.S. Electric Utility: Owns and/or operates facilities within the United States, its territories, or Puerto Rico for the generation, transmission, distribution, or sale of electric energy primarily for use by the public. This includes shareholder-owned utilities, public power, and cooperatives.
Non-Utility Power Producer: Non-utility power producers include qualifying cogenerators, qualifying small power producers, and other non-utility generators (including independent power producers) without a designated franchised service area.
Source: Energy Information Administration
2012p 2011r
Coal 37.4% 42.3%
Gas 30.4% 24.7%
Nuclear 19.0% 19.3%
Oil 0.6% 0.7%
Hydro 6.8% 7.8%
Renewables 5.4% 4.7%
Biomass 1.4% 1.4%
Geothermal 0.4% 0.4%
Solar 0.1% 0.04%
Wind 3.4% 2.9%
Other fuels 0.5% 0.4%
Total 100% 100%

62 EEI 2012 FINANCIAL REVIEW
BUSINESS STRATEGIES
CoalCoal remained the nation’s pri-
mary fuel for electricity generation in 2012, but its share of overall out-put, which has steadily declined for 10 years, fell sharply. Coal’s share dropped to 37.4% from 42.3% the year before. Record low natural gas prices and flat demand for electricity during much of the year contributed to a 12.5% reduction in coal-fired generation.
Coal prices receded from the lev-els reached during the 2009-2011 period, when strong export demand pushed prices higher. The aver-age spot price of Central Appala-chian coal in 2012 was $66.06 per ton compared to $78.84 per ton in
gas, boosting natural gas-fired genera-tion.
Coal saw its share of total gen-eration reduced to 37.4% in 2012 (it was 42.3% as recently as 2009). In contrast, natural gas generation has increased considerably and ac-counted for 30.4% of total genera-tion compared to 24.7% in 2011. Wind- and solar-powered generation also rose strongly in 2012. These continued to be the fastest-growing sources of output, with production up 17.2% and 140%, respectively, for the year. Their growth brought the non-hydro renewables’ share of the electricity mix up to 5.4% in 2012 from 4.7% in 2011.
Average Cost of Fossil Fuels 2003-2012
(Cents/mmBtu)U.S. ELECTRIC UTILITIES
0
500
1,000
1,500
2,000
2,500
p=preliminary
U.S. Electric Utility: Owns and/or operates facilities within the United States, its territories, or Puerto Rico for the generation, transmission, distribution, or sale of electric energy primarily for use by the public. This includes shareholder-owned utilities, public power, and cooperatives.
Source: U.S. Department of Energy, Energy Information Administration (EIA)
2011r 2012p2003 2004 2005 2006 2007 2008 2009 2010
OILCOAL GAS
0
10
20
30
40
50
60
70
80
90
Average Cost to Produce Electricity
2007-2012
U.S. Electric Utility: Owns and/or operates facilities within the United States, its territories, or Puerto Rico for the generation, transmission, distribution, or sale of electric energy primarily for use by the public. This includes shareholder-owned utilities, public power, and cooperatives.
Non-Utility Power Producer: Non-utility power producers include qualifying cogenerators, qualifying small power producers, and other non-utility generators (including independent power producers) without a designated franchised service area.
* 2012 results are preliminary and based on modeled data from Ventyx, Inc., The Velocity Suite
Source: Ventyx, Inc., The Velocity Suite
Coal
Nat
ural
Gas
Nuc
lear
Hyd
ro
Cost of Fuel Non-Fuel O&M
($/MWh)
U.S. ELECTRIC UTILITY AND NON-UTILITY
2010r 2011 2012*2007 2008 2009r
Coal
Nat
ural
Gas
Nuc
lear
Hyd
ro
Coal
Nat
ural
Gas
Nuc
lear
Hyd
ro
Coal
Nat
ural
Gas
Nuc
lear
Hyd
ro
Coal
Nat
ural
Gas
Nuc
lear
Hyd
ro
Coal
Nat
ural
Gas
Nuc
lear
Hyd
ro
Fuel Sources
Persistently low U.S. natural gas prices and sluggish demand for elec-tricity continued to be the primary forces affecting fuel markets in 2012. One of the year’s most prominent developments was the widespread fuel switching from coal to natural gas that occurred during the spring and summer, as natural gas prices hit a record low. The year also saw a record level of new wind and solar generation added to the grid, as well as indications that nuclear energy’s future had brightened in relation to the outlook following the Japa-nese earthquake and tsunami in the spring of 2011.
Of the years since 2008, only 2010 produced year-to-year growth in electricity generation, helped by weather and improving economic conditions. In 2012, mild weather contributed to yet another year in which electricity demand fell. Based on data from the U.S. Energy Infor-mation Administration (EIA), elec-tric generation decreased by 1.1%, setting output back to 2005’s level.
Natural gas prices remained at historically low levels throughout much of the year. Spot prices started the year at $2.70 per million Btu, reached a record low in April at $1.95, then bounced back to end the year at $3.34 per million Btu. The supply/demand imbalance in natural gas markets put the Henry Hub spot price below coal’s energy-equivalent Central Appalachia price for almost a year, from October 2011 to Sep-tember 2012. This pushed plant operators in all regions of the country to shift dispatch from coal to
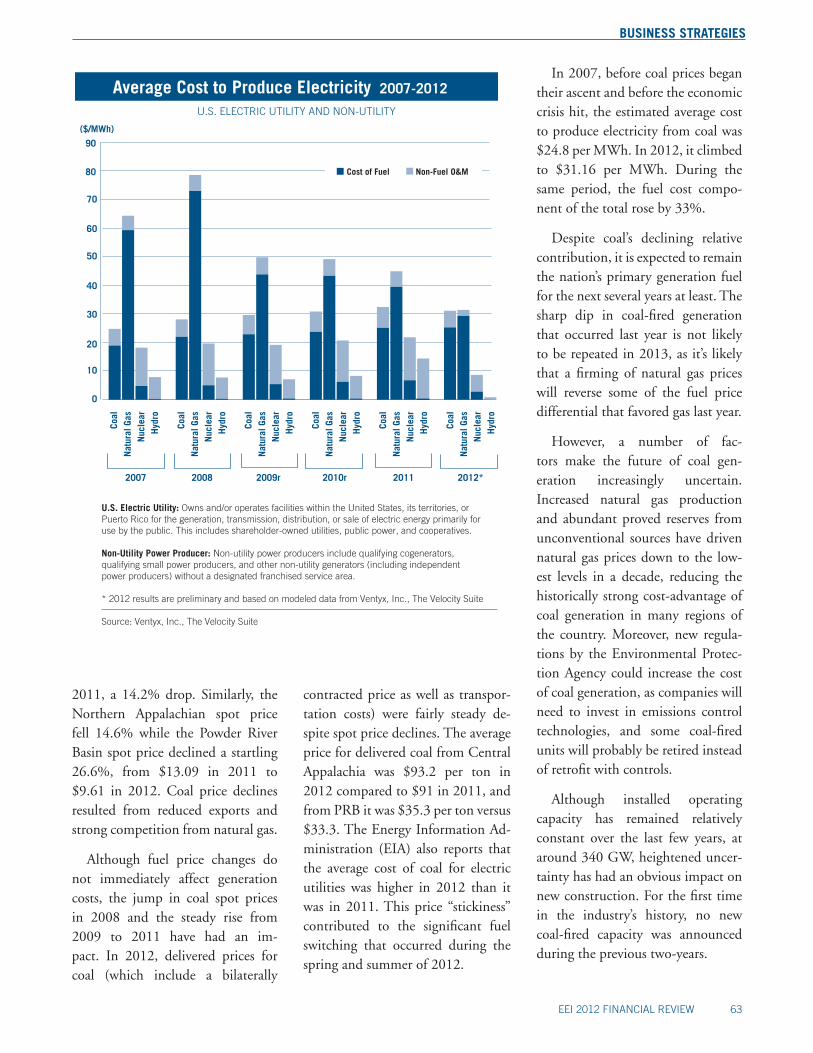
EEI 2012 FINANCIAL REVIEW 63
BUSINESS STRATEGIES
In 2007, before coal prices began their ascent and before the economic crisis hit, the estimated average cost to produce electricity from coal was $24.8 per MWh. In 2012, it climbed to $31.16 per MWh. During the same period, the fuel cost compo-nent of the total rose by 33%.
Despite coal’s declining relative contribution, it is expected to remain the nation’s primary generation fuel for the next several years at least. The sharp dip in coal-fired generation that occurred last year is not likely to be repeated in 2013, as it’s likely that a firming of natural gas prices will reverse some of the fuel price differential that favored gas last year.
However, a number of fac-tors make the future of coal gen-eration increasingly uncertain. Increased natural gas production and abundant proved reserves from unconventional sources have driven natural gas prices down to the low-est levels in a decade, reducing the historically strong cost-advantage of coal generation in many regions of the country. Moreover, new regula-tions by the Environmental Protec-tion Agency could increase the cost of coal generation, as companies will need to invest in emissions control technologies, and some coal-fired units will probably be retired instead of retrofit with controls.
Although installed operating capacity has remained relatively constant over the last few years, at around 340 GW, heightened uncer-tainty has had an obvious impact on new construction. For the first time in the industry’s history, no new coal-fired capacity was announced during the previous two-years.
contracted price as well as transpor-tation costs) were fairly steady de-spite spot price declines. The average price for delivered coal from Central Appalachia was $93.2 per ton in 2012 compared to $91 in 2011, and from PRB it was $35.3 per ton versus $33.3. The Energy Information Ad-ministration (EIA) also reports that the average cost of coal for electric utilities was higher in 2012 than it was in 2011. This price “stickiness” contributed to the significant fuel switching that occurred during the spring and summer of 2012.
2011, a 14.2% drop. Similarly, the Northern Appalachian spot price fell 14.6% while the Powder River Basin spot price declined a startling 26.6%, from $13.09 in 2011 to $9.61 in 2012. Coal price declines resulted from reduced exports and strong competition from natural gas.
Although fuel price changes do not immediately affect generation costs, the jump in coal spot prices in 2008 and the steady rise from 2009 to 2011 have had an im-pact. In 2012, delivered prices for coal (which include a bilaterally
country to shift dispatch from coal to gas, boosting natural gas-fired genera-tion.
Coal saw its share of total gen-eration reduced to 37.4% in 2012 (it was 42.3% as recently as 2009). In contrast, natural gas generation has increased considerably and ac-counted for 30.4% of total genera-tion compared to 24.7% in 2011. Wind- and solar-powered generation also rose strongly in 2012. These continued to be the fastest-growing sources of output, with production up 17.2% and 140%, respectively, for the year. Their growth brought the non-hydro renewables’ share of the electricity mix up to 5.4% in 2012 from 4.7% in 2011.
Average Cost of Fossil Fuels 2003-2012
(Cents/mmBtu)U.S. ELECTRIC UTILITIES
0
500
1,000
1,500
2,000
2,500
p=preliminaryThe years 2003 and beyond include data for electric utilities, independent power producers, and commercial and industrial combined heat and power producers.
U.S. Electric Utility: Owns and/or operates facilities within the United States, its territories, or Puerto Rico for the generation, transmission, distribution, or sale of electric energy primarily for use by the public. This includes shareholder-owned utilities, public power, and cooperatives.
Source: U.S. Department of Energy, Energy Information Administration (EIA)
2011r 2012p2003 2004 2005 2006 2007 2008 2009 2010
OILCOAL GAS
0
10
20
30
40
50
60
70
80
90
Average Cost to Produce Electricity
2007-2012
U.S. Electric Utility: Owns and/or operates facilities within the United States, its territories, or Puerto Rico for the generation, transmission, distribution, or sale of electric energy primarily for use by the public. This includes shareholder-owned utilities, public power, and cooperatives.
Non-Utility Power Producer: Non-utility power producers include qualifying cogenerators, qualifying small power producers, and other non-utility generators (including independent power producers) without a designated franchised service area.
* 2012 results are preliminary and based on modeled data from Ventyx, Inc., The Velocity Suite
Source: Ventyx, Inc., The Velocity Suite
Coal
Nat
ural
Gas
Nuc
lear
Hyd
ro
Cost of Fuel Non-Fuel O&M
($/MWh)
U.S. ELECTRIC UTILITY AND NON-UTILITY
2010r 2011 2012*2007 2008 2009r
Coal
Nat
ural
Gas
Nuc
lear
Hyd
ro
Coal
Nat
ural
Gas
Nuc
lear
Hyd
ro
Coal
Nat
ural
Gas
Nuc
lear
Hyd
ro
Coal
Nat
ural
Gas
Nuc
lear
Hyd
ro
Coal
Nat
ural
Gas
Nuc
lear
Hyd
ro

64 EEI 2012 FINANCIAL REVIEW
BUSINESS STRATEGIES
idly declining since 2008, when shale gas production began to surge. Last year, imports declined by yet another 9% and were barely above the 1998 level. Imports from Canada continue to account for the majority of natu-ral gas imported (94%), but they too declined almost 5% in 2012. Overall LNG imports were almost cut in half. At the same time, exports of natural gas have been increasing substantially. In 2011, exports rose by 32% and in 2012 by 7.5%, the majority of which went by pipeline to Mexico and Canada.
The growth of natural gas reserves, high levels of production, the oversup-ply situation and low spot market pric-es have caused some LNG developers to consider options for re-exporting and/or expanding their terminals to add liquefaction and storage facili-ties. Thus far, FERC has authorized Freeport (TX), Cameron (LA), Sabine Pass (LA) and Cove Point (MD) to re-export LNG. DOE has approved several terminals to liquefy and export domestically produced gas to coun-tries with which the U.S has a free trade agreement. It has also authorized the Sabine Pass project to export to non-Free Trade Agreement countries. Another dozen projects are waiting for DOE approval, which (as required by law) must take into consideration the cumulative impact of LNG exports on the U.S. economy.
NuclearThe U.S. continues to be the
world’s largest producer of nuclear power. With 103 electricity-gen-erating nuclear reactors, the U.S accounts for more than 30% of worldwide nuclear generation of electricity. Although overall output declined slightly in 2012, nuclear en-
where increased production could not be absorbed by demand, resulting in a significant oversupply situation. In April, with low heating and cooling needs throughout the nation, Henry Hub spot price fell below $2, to $1.95 per million Btu. The cost of natural gas to utilities went from $5/million Btu to $3.76, a 25% decrease over 12 months.
The decrease in natural gas prices in 2012 reduced the average cost to produce electricity, which went from $39.57/MWh in 2011 to $29.35/MWh in 2012. In 2008, the average cost to produce electricity from natu-ral gas was $78.43/MWh.
The natural gas domestic energy balance has a natural effect on imports. Imports of natural gas have been rap-
Natural GasNatural gas’ share of total electricity
generation jumped to 30.4% in 2012 from 24.7% in 2011. In absolute terms, natural gas generation increased by a staggering 21.4% in 2012.
Production and consumption each broke another record and exceeded 25,000 Bcf, almost 5% higher than in 2011. Despite the growth in con-sumption and a lower level of imports, the now almost-chronic oversupply of natural gas continued throughout the year, bringing prices down to record lows.
The average Henry Hub spot price was $2.76 per million Btu, down from $4 per million Btu in 2011. This 31% decrease was primarily due to a continually imbalanced market,
NYMEX-Henry Hub Natural Gas Close Prices2003-2012
($/MMBtu)
0
2
4
6
8
10
12
14
16
Source: NYMEX & SNL Financial
Jan-10
Jul-10
Jan-03
Jul-03
Jan-04
Jul-04
Jan-05
Jul-05
Jan-06
Jul-06
Jan-07
Jul-07
Jan-08
Jul-08
Jan-09
Jul-09
Jan-12
Jul-12Dec
-12Jul
-11Jan
-11

EEI 2012 FINANCIAL REVIEW 65
BUSINESS STRATEGIES
Existing and Proposed U.S. LNG TerminalsAs of December 31, 2012
Constructed:1. Everett, MA: 1.035 Bcfd (DOMAC -SUEZ LNG)2. Cove Point, MD: 1.8 Bcfd (Dominion -Cove Point LNG) (a)3. Elba Island, GA: 1.6 Bcfd (El Paso -Southern LNG)4. Lake Charles, LA: 2.1 Bcfd (Southern Union -Trunkline LNG)5. Gulf of Mexico, LA: 0.5 Bcfd (Gulf Gateway Energy Bridge -ExcelerateEnergy)6. Offshore Boston, MA: 0.8 Bcfd (Northeast Gateway -ExcelerateEnergy)7. Freeport, TX: 1.5 Bcfd (Cheniere/Freeport LNG Dev.) (a)8. Sabine Pass, LA: 4 Bcfd (Sabine Pass Cheniere LNG) (a)9. Hackberry, LA: 1.8 Bcfd (Cameron LNG -Sempra Energy) (a)10. Offshore Boston, MA: 0.4 Bcfd (Neptune LNG -SUEZ LNG)11. Golden Pass, TX: 2.0 Bcfd (Golden Pass -ExxonMobil) (b) (d)12. Pascagoula, MS: 1.5 Bcfd (Gulf LNG Energy LLC, El Paso/Crest/Sonangol)
Approved by FERC:13. Freeport, TX: 2.5 Bcfd (Cheniere/Freeport LNG Dev.) – Expansion14. Port Lavaca, TX: 1.0 Bcfd (Calhoun LNG -Gulf Coast LNG Partners)15. Baltimore, MD: 1.5 Bcfd (AES Sparrows Point – AES Corp.)
Approved by MARAD/Coast Guard16. Main Pass, LA: 1.0 Bcfd (Main Pass McMoRanExp.)17. Port Dolphin, FL: 1.2 Bcfd (Hoëgh LNG – Port Dolphin Energy)18. TORP LNG: 1.4 Bcfd (Bienville Offshore Energy Terminal – TORP)
Proposed to FERC19. Astoria, OR: 1.5 Bcfd (Oregon LNG)20. Robbinston, ME: 0.5 Bcfd (Downeast LNG – Kestrel Energy)21. Corpus Christi, TX: 0.4 Bcfd (Cheniere – Corpus Christi LNG)
Export terminalsUnder Construction22. Sabine Pass, LA: 2.6 Bcfd (Sabine Pass Cheniere LNG) (b) (c)
Proposed to FERC23. Freeport, TX: 1.8 Bcfd (Freeport LNG Dev./FLNG Liquefaction) (b) (d)24. Corpus Christi, TX: 2.1 Bcfd (Cheniere - Corpus Christi LNG) (b) (d)25. Coos Bay, OR: 0.9 Bcfd (Jordan Cove Energy Project) (b) (d)26. Lake Charles, LA: 2.4 Bcfd (Southern Union -Trunkline LNG) (b) (d)27. Lake Charles, LA: 1.07 Bcfd (Magnolia LNG) (b) (d)28. Hackberry, LA: 1.7 Bcfd (Cameron LNG -Sempra Energy) (b) (d)29. Cove Point, MD: 0.75 Bcfd (Dominion -Cove Point LNG) (b) (d)30. Astoria, OR: 1.3 Bcfd (Oregon LNG)31. Lavaca Bay, TX: 1.38 Bcfd (Excelerate Liquefaction) (b) (d)32. Sabine Pass, LA: 1.3 Bcfd (Sabine Pass Liquefaction) (b) (d)33. Elba Island, GA: 0.5 Bcfd (Southern LNG) (b) (d)
Proposed to MARAD/Coast Guard34. Main Pass, LA: 3.22 Bcfd (Main Pass McMoRanExp.) (b) (d)
(a) Authorized to re-export(b) Approved by DOE to export to FTA countries(c) Approved by DOE to export to non-FTA countries(d) Under DOE review for exports to non-FTA countries
Sources: U.S. Department of Energy, Office of Fossil Energy; Federal Energy Regulatory Commission; Ventyx Inc., The Velocity Suite.
15
14, 31
9, 28
21, 24
2, 29
20
3, 33
1
7, 13, 23 11
12
25
4, 26, 27
19, 30
8, 22, 32
5
16, 34
106
17
18
Map label Storage Facility Name1 Everett2,31,39 Dominion Cove Point3,13 Elba Island4,30,38 Lake Charles5,41 Gulf Gateway Energy Bridge6 Northeast Gateway7,29,34,37 Freeport8,28,35 Sabine Pass9,33,40 Cameron LNG10 Neptune LNG Deepwater Port11 Golden Pass LNG12 Gulf LNG Energy LLC14,36 Corpus Christi LNG15 Freeport LNG Expansion16 Cameron LNG Expansion17 Calhoun LNG18 Broadwater Energy19 AES Sparrows Point20,32 Jordan Cove Energy Project21 Main Pass Energy Hub22 Port Dolphin LNG Project23 Torp LNG Terminal (Beinville)24 Oregon LNG25 Calais LNG Project26 Downeast LNG27 Liberty Natural Gas LNG
Holding Company Name Facility StateInternational Power MADominion Resources Inc MDEl Paso Corp GASouthern Union Co LAExcelerate Energy LLC LAExcelerate Energy LLC MAFreeport LNG Development TXCheniere Energy Inc LASempra Energy LAInternational Power MAExxonMobil Corp TXTRC Companies Inc MSCheniere Energy Inc TXFreeport LNG Development TXSempra Energy LAGulf Coast LNG Partners TXBroadwater Energy LLC VSAES Corp (The) MDJordan Cove Energy Project LP ORMcMoran Exploration Co LAHoegh LNG As FLTorp Technology ALOregon LNG ORCalais LNG Project Co LLC MEDowneast LNG MEExcalibur Energy (USA) Inc NJ

66 EEI 2012 FINANCIAL REVIEW
BUSINESS STRATEGIES
provides a tax credit of up to 30% of the capital invested in a project, is set to expire at the end of 2016.
Traditionally, state policies have also been important in ensuring the existence of favorable economics for non-hydro renewable resources. State renewable energy electricity standards (RES) have been a major driver of renewable energy develop-ment, yet some states are examining their RES policies with an eye on re-straining costs.
Low natural gas prices have been an additional challenge since 2010. Given the reduced costs of natural gas generation, the need, cost-at-tractiveness and financing available for many renewable projects have all been diminished.
Despite these challenges, renew-able energy (wind and solar in par-ticular) continues to thrive. Solar generation grew by 140% in 2012, and new wind capacity reached a re-cord 13,124 MW; it was the single-largest source of new capacity added to the grid.
OilOil accounted for 0.6% of U.S.
electric generation in 2012, down from 0.7% the previous year, and about half the total was generated in Hawaii. Since 2006, oil, which had previously generated about 3% of the nation’s electricity, began playing a declining role in the U.S. electric fuel portfolio. Its share has fallen steadily, and it has been the smallest contributor to electricity generation since then.
Persistently high oil prices since 2006 have been an important factor
announced it will close the Chrys-tal River plant in Florida, which has been out of service for repairs since 2009, and there is speculation that Edison International may perma-nently close the San Onofre Nuclear Generating Station, shut down since January 2012.
Renewable EnergyRenewable fuel sources, includ-
ing hydropower, accounted for a near-record 12.2% of total U.S. elec-tric generation in 2012. Non-hydro generation hit another record, grow-ing to 5.4% of the generation mix from 4.7% in 2011. This increase was mainly due to a 17% increase in wind output, which represented 64% of total non-hydro renewable generation in 2012.
Renewable energy continues to ex-perience strong support, but changes to some incentive mechanisms have presented the industry with new chal-lenges. At the end of 2011, Congress did not extended section 1603 (Pay-ments for Specified Energy Property in Lieu of Tax Credits), the “Cash Grant” program, established by the 2009 American Recovery and Rein-vestment Act. The program, which had been extended for one year in 2010, was allowed to expire. The federal production tax credit (PTC), which provides a tax credit of $22/MWh for the first ten years of opera-tion, was set to expire at the end of 2012 for wind, biomass and geother-mal resources, but was extended for an additional year. Given a change in rules, this extension will be a de facto multi-year extension as projects will be able to claim the PTC if they start construction in 2013. The federal investment tax credit (ITC), which
29 States and D.C. have Renewable Energy Portfolio Standards (RPS)
RPS
Voluntary standards or goals
Pilot or study
**
*
Updated March 2013
Abbreviations: EE- Energy Efficiency; RE- Renewable Energy
Notes: An RPS requires a percent of an electric provider’s energy sales (MWh) or installed capacity (MW) to come from renewable resources. Most specify sales (MWh). Map percents are final years’ targets. *TVA’s goal is not state policy; it calls for 50% zero- or low-carbon generation by 2020. ** Nebraska’s two largest public power districts have renewable goals.
Source: Federal Energy Regulatory Commission, http://www.ferc.gov/market-oversight/othr-mkts/renew/othr-rnw-rps.pdf; Database of State Incentives for Renewables and Efficiency, http://www.dsireusa.org
AK: 50% by 2025AZ: 15% by 2025CA: 33% by 2020CO: 30% by 2020
10% - co-ops, munisCT: 27% by 2020DC: 20% by 2020DE: 25% by 2026FL: Solar Pilot 2010-2014HI: 40% by 2030IA: 105 MW; 1 GW wind goal by 2010IL: 25% by 2025;
wind 75% of RPSIN: 10% by 2025KS: 20% by 2020LA: 350 MW by 2012-13MA: 15% new by 2020, then 1% annually;
2 GW wind goal by 2020
MD: 20% by 2022 ME: 30% by 2010; 10% new by 2017;
8 GW wind goal by 2030MI: 10% MWh and 1,100 MW by 2015MN: 25% by 2025;
30% by 2020 – XcelMO: 15% by 2021MT: 15% by 2015NC: 12.5% by 2021 – IOUs
10% by 2018 – co-ops, munisND: 10% by 2010NE: Public Power Districts: 10% by 2020NH: 26.8% by 2025NJ: 20.38% RE by 2021 and
4.1% solar by 2028NM: 20% by 2020 – IOUs 10% - co-opsNV: 25% by 2025NY: 29% by 2015
OH: 12.5% by 2024OK: 15% by 2015OR: 25% by 2025
5-10% - smaller utilitiesPA: 18% by 2021RI: 16% by end 2020SD: 10% by 2015TVA: 50% by 2020TX: 5,880 MW by 2015;
500 MW non-wind goalUT: 20% by 2025VA: 15% by 2025VT: 20% by 2017;
all growth to 2012 from RE and EEWA: 15% by 2020WI: 10% by 2015WV: 25% by 2025
ergy accounted for 19% of total U.S. electric generation compared with 19.3% in 2011.
Two years after Japan’s humanitar-ian disaster and nuclear crisis follow-ing the March 11, 2011 earthquake and tsunami, the world’s nuclear in-dustry is still grappling with the con-sequences, reviewing nuclear policies and assessing the safety of nuclear fleets. Despite nuclear power’s gener-ation cost and environmental advan-tages, its future in the U.S. has been hindered by the lack of a strategy for dealing with the long-term storage of spent fuel.
After the crisis in the Japan, there was increased scrutiny of nuclear plants and industry critics suggested that some nuclear plants be closed. Yet, in February 2012, the Nuclear Regulatory Commission (NRC) ap-proved Southern Company’s plan for two new nuclear reactors at its Vogtle plant in Georgia. These were the first nuclear reactors approved in decades. A month later, in March, the NRC approved SCANA’s Vir-gil C. Summer Nuclear Station, consisting of two reactors in South Carolina. Moreover, over 60 nuclear reactors have recently been granted 20-year license extensions, including five that were renewed in 2010-2011 and one in 2012.
Despite these positive trends, nuclear power has not been immune to developments in U.S. energy markets. Economic conditions in wholesale markets caused Dominion Power to announce the closure of the Kewaunee plant in Wisconsin; the 556 MW plant was retired in early May 2013. Also, Duke Energy has

EEI 2012 FINANCIAL REVIEW 67
BUSINESS STRATEGIES
announced it will close the Chrys-tal River plant in Florida, which has been out of service for repairs since 2009, and there is speculation that Edison International may perma-nently close the San Onofre Nuclear Generating Station, shut down since January 2012.
Renewable EnergyRenewable fuel sources, includ-
ing hydropower, accounted for a near-record 12.2% of total U.S. elec-tric generation in 2012. Non-hydro generation hit another record, grow-ing to 5.4% of the generation mix from 4.7% in 2011. This increase was mainly due to a 17% increase in wind output, which represented 64% of total non-hydro renewable generation in 2012.
Renewable energy continues to ex-perience strong support, but changes to some incentive mechanisms have presented the industry with new chal-lenges. At the end of 2011, Congress did not extended section 1603 (Pay-ments for Specified Energy Property in Lieu of Tax Credits), the “Cash Grant” program, established by the 2009 American Recovery and Rein-vestment Act. The program, which had been extended for one year in 2010, was allowed to expire. The federal production tax credit (PTC), which provides a tax credit of $22/MWh for the first ten years of opera-tion, was set to expire at the end of 2012 for wind, biomass and geother-mal resources, but was extended for an additional year. Given a change in rules, this extension will be a de facto multi-year extension as projects will be able to claim the PTC if they start construction in 2013. The federal investment tax credit (ITC), which
29 States and D.C. have Renewable Energy Portfolio Standards (RPS)
RPS
Voluntary standards or goals
Pilot or study
**
*
Updated March 2013
Abbreviations: EE- Energy Efficiency; RE- Renewable Energy
Notes: An RPS requires a percent of an electric provider’s energy sales (MWh) or installed capacity (MW) to come from renewable resources. Most specify sales (MWh). Map percents are final years’ targets. *TVA’s goal is not state policy; it calls for 50% zero- or low-carbon generation by 2020. ** Nebraska’s two largest public power districts have renewable goals.
Source: Federal Energy Regulatory Commission, http://www.ferc.gov/market-oversight/othr-mkts/renew/othr-rnw-rps.pdf; Database of State Incentives for Renewables and Efficiency, http://www.dsireusa.org
AK: 50% by 2025AZ: 15% by 2025CA: 33% by 2020CO: 30% by 2020
10% - co-ops, munisCT: 27% by 2020DC: 20% by 2020DE: 25% by 2026FL: Solar Pilot 2010-2014HI: 40% by 2030IA: 105 MW; 1 GW wind goal by 2010IL: 25% by 2025;
wind 75% of RPSIN: 10% by 2025KS: 20% by 2020LA: 350 MW by 2012-13MA: 15% new by 2020, then 1% annually;
2 GW wind goal by 2020
MD: 20% by 2022 ME: 30% by 2010; 10% new by 2017;
8 GW wind goal by 2030MI: 10% MWh and 1,100 MW by 2015MN: 25% by 2025;
30% by 2020 – XcelMO: 15% by 2021MT: 15% by 2015NC: 12.5% by 2021 – IOUs
10% by 2018 – co-ops, munisND: 10% by 2010NE: Public Power Districts: 10% by 2020NH: 26.8% by 2025NJ: 20.38% RE by 2021 and
4.1% solar by 2028NM: 20% by 2020 – IOUs 10% - co-opsNV: 25% by 2025NY: 29% by 2015
OH: 12.5% by 2024OK: 15% by 2015OR: 25% by 2025
5-10% - smaller utilitiesPA: 18% by 2021RI: 16% by end 2020SD: 10% by 2015TVA: 50% by 2020TX: 5,880 MW by 2015;
500 MW non-wind goalUT: 20% by 2025VA: 15% by 2025VT: 20% by 2017;
all growth to 2012 from RE and EEWA: 15% by 2020WI: 10% by 2015WV: 25% by 2025

68 EEI 2012 FINANCIAL REVIEW
BUSINESS STRATEGIES
Global demand for oil is expected to continue to grow as economic growth leads to increased consump-tion, particularly in developing countries, driven by rapid economic and population growth. Subsidies provided to end users have helped to mitigate the effect of high crude oil prices, leading to sustained and in-creasing demand and countering de-creasing demand in developed coun-tries. The U.S. electric power sector appears to be shielded against any di-rect impact on generation costs from oil price spikes and supply disrup-tions, given its limited use of oil as a generation fuel and its diversified fuel mix. The volatility of world oil prices will, nonetheless, remain a concern for all sectors of the economy.
contributing to the decline. While crude oil prices averaged $15 to $25/barrel in the mid-1990s, the price of oil began an upward climb in the early 2000s. West Texas Intermedi-ate crude spot prices peaked at over $145/barrel in mid-July 2008. Prices in 2011 and 2012 fluctuated gener-ally within a range of $85-$105 per barrel.
As has historically been the case, crude oil prices in the U.S. will re-main subject to the dynamics of the international oil market, itself influ-enced by a diverse range of forces in-cluding: changes in global demand, supply constraints in oil producing regions, the level of stocks and spare capacity in industrialized countries, geopolitical risks, and the relative strength of the dollar versus other currencies.

EEI 2012 FINANCIAL REVIEW 69
Capital MarketsStock Performance
The EEI Index slightly trailed the Dow Jones Industrials and S&P 500 for the fourth quarter of 2012, a three-month-period that saw market sentiment swing abruptly from initial pessimism about flagging economic growth to optimism that another ag-gressive program of Federal Reserve monetary support (announced in early December) would set the stage for renewed economic strength in 2013. After losing ground through October and into early November, markets rallied sharply through yearend, finishing a volatile quar-ter with little net change. The Dow Jones Industrials returned a positive 0.2% while the S&P 500 returned –0.4%. The tech-heavy Nasdaq lost about 3%. The EEI Index produced a –2.5% return.
The fourth quarter capped off a year, however, in which the EEI Index (and utility stocks in gen-eral) were decided market laggards. Buoyed by massive monetary policy support from the Federal Reserve, as well as indications that Europe’s Central Bank stood ready to support financially troubled and debt-laden sovereign borrowers such as Italy and Spain, markets were on a tear for the year. The S&P 500 and Dow Jones Industrials posted total returns of 16.0% and 10.2%, respectively, while the Nasdaq Composite about
2012 Index Comparison
* Price gain/(loss) only. Other indices show total return.
Source: EEI Finance Department and SNL Financial
EEI Index 2.09Dow Jones Industrials 10.24
S&P 500 16.00
Nasdaq Composite Index* 15.91
Comparison of the EEI Index, S&P 500, and DJIA Total Return 1/1/08– 12/31/12
REFLECTS REINVESTED DIVIDENDS
All returns are annual.Note: Assumes $100 invested at closing prices December 31, 2007.
Source: EEI Finance Department and SNL Financial
(Dollars)
DJIAS&P 500 IndexEEI Index
20122008 2009 2010 201150
100
150
200

70 EEI 2012 FINANCIAL REVIEW
CAPITAL MARKETS
equaled the S&P 500 with a 15.9% gain. The EEI Index, by contrast, clawed out a 2.1% return, placing it next to last among the ten major market sectors for the year. Only the broader utilities sector was weaker, with a 1.8% return.
The EEI Index’s relative perfor-mance, however, had very little to do
with any major shift in what are gen-erally stable industry business fun-damentals. Instead, in a year charac-terized by such strong market gains, underperformance by the defensive utility sector is not surprising. Regu-lated utilities offer slow but steady earnings growth, strong dividend yields and the prospect for divi-dend increases over time—a favored
formula for conservative, income-hungry investors and a safe harbor in market storms caused by fears of recession and collapsing profits else-where in the economy. These are not characteristics that support sharp gains when bullish spirits dominate markets and when investors fa-vor companies and industries with stronger potential for profit growth, as was the case in 2012.
Indeed, the EEI Index and utili-ties have trailed the broad market av-erages in three of the four years since the 2008/2009 financial crisis—a period generally characterized by a sharp market recovery from crisis-in-duced losses. Conversely, the EEI In-dex outperformed the major indices from 2004 through 2008. In 2008, when the financial crisis hit with a vengeance, the EEI Index lost nearly 25%, but still did relatively better than major averages, which fell 30% to 40%. This five-year stretch was historically unusual, relating less to broad macroeconomic trends than the industry’s restoration of financial strength and stability, following the tumult of deregulation in the late 1990s and early 2000s, and its re-turn to its traditional regulated busi-ness models (with competitive gen-eration playing a role for a number of holding companies).
The transition was largely com-plete by the time the financial crisis hit, and the underperformance since then has less to do with industry changes than the rebound in the stocks of companies in other sec-tors, where stock market losses in the depths of the crisis were more severe and earnings more leveraged to eco-nomic growth. The one year out of
*Price gain/loss only. Other indices show total return.For the Category comparison, we take straight (i.e., not market-cap-weighted) averages.
Source: EEI Finance Department, SNL Financial, and company annual reports
Index Q1 Q2 Q3 Q4EEI Index (1.37) 6.62 (0.42) (2.51)Dow Jones Industrial Average 8.84 (1.85) 2.95 0.24 S&P 500 12.59 (2.75) 6.35 (0.38)Nasdaq Composite* 18.67 (5.06) 6.18 (3.10)
Category Q1 Q2 Q3 Q4All Companies (0.58) 5.57 0.92 (1.04)Regulated (0.45) 5.85 0.98 (1.58)Mostly Regulated (0.96) 5.61 1.85 (0.68)Diversified 1.01 5.20 (2.16) (3.07)
2012 Returns By Quarter
Sector Comparison 2012 Total Shareholder Return
Source: Dow Jones & Company and EEI Finance Department
Sector Total Return %Financials 26.85%Consumer Services 24.16%Healthcare 19.26%Telecommunications 18.79%Industrials 17.87%Consumer Goods 12.80%Technology 12.08%Basic Materials 10.49%Oil & Gas 4.71%EEI Index 2.09%Utilities 1.76%

EEI 2012 FINANCIAL REVIEW 71
CAPITAL MARKETS
for the years 2013 through 2017 fell from a range of $7-$8/mmBtu at year-end 2009 to just above $4/mmBtu at year-end 2012. A num-ber of utilities with significant com-petitive generation revenue have seen their share prices fall 25% to 50% since late 2007, due nearly entirely to the dramatic fall in natural gas prices and the resultant impact on electric-ity prices, competitive power revenue and profits.
Lower natural gas prices have had a far more benign impact on the regulated segment of the indus-try. Since regulated utilities typically pass changes in fuel costs through to end customers, lower natural gas fuel costs have led to lower utility bills than would have otherwise been the case, without impacting profit mar-gins. This has been a positive devel-opment for regulated utilities seeking rate increases to fund what have been historically high capital investment programs in transmission, new gen-eration, environmental controls and other system investments. Cheaper natural gas has supported the ability of these regulated companies to fund capex programs while keeping re-quired rate increases to a minimum.
Power Demand Growth StallsA second but far more incremen-
tal change in the fundamentals fac-ing the industry has been a slow ratcheting down in the expected growth rate for electricity demand nationwide. Influenced in part by the growing implementation of en-ergy efficiency measures, the secular decline in industrial output as a con-tributor to U.S. economic growth and the tepid economic recovery from the 2008/2009 financial crisis
changer that no company manage-ment can control. This is the sharp decline in natural gas prices made possible by the use of fracking and horizontal drilling techniques to re-cover shale gas across previously un-economic fields in the southern and eastern United States. Natural gas has, in recent years, been the mar-ginal price setting fuel in many com-petitive power markets (only recently usurped by coal in selective areas due to gas price declines). The collapse in natural gas spot prices since 2007 has been stunning, as shown in the Natural Gas Spot Prices chart, declin-ing from peaks above $10/mmBtu to below $3/mmBtu in 2012. The natural gas futures curve shown in the NYMEX Natural Gas Futures chart offers a different but equally stark perspective; the forward curve
the past four when utilities did out-perform was 2011, when markets were jolted by concerns about un-expected softness in U.S. economic growth, a potential breakup of the euro currency and default by Greece, and the summer drama of the U.S. debt limit debate which prompted a reduction in S&P’s credit rating for U.S. debt. A steep fall in market interest rates—the 10-year Treasury fell from above 3.5% to under 2% during the year—also boosted utility shares. The EEI Index gained 20% on the year versus 0% to 8% returns by the major averages.
Natural Gas Price CollapseThere has been one macroeco-
nomic development in recent years that has broadly impacted industry fundamentals, an unexpected game
Natural Gas Spot Prices - Henry Hub 12/31/07 through 12/31/12
($/mmBtu)
Jan-
12Ap
r-12
Jul-1
2Oc
t-12
Jan-
08Ap
r-08
Jul-0
8Oc
t-08
Jan-
09Ap
r-00
Jul-0
-9Oc
t-09
Jan-
10Ap
r-10
Jul-1
0Oc
t-10
Jan-
11Ap
r-11
Jul-1
1Oc
t-11
Source: SNL FinancialJa
n-13
0
4
8
12
16
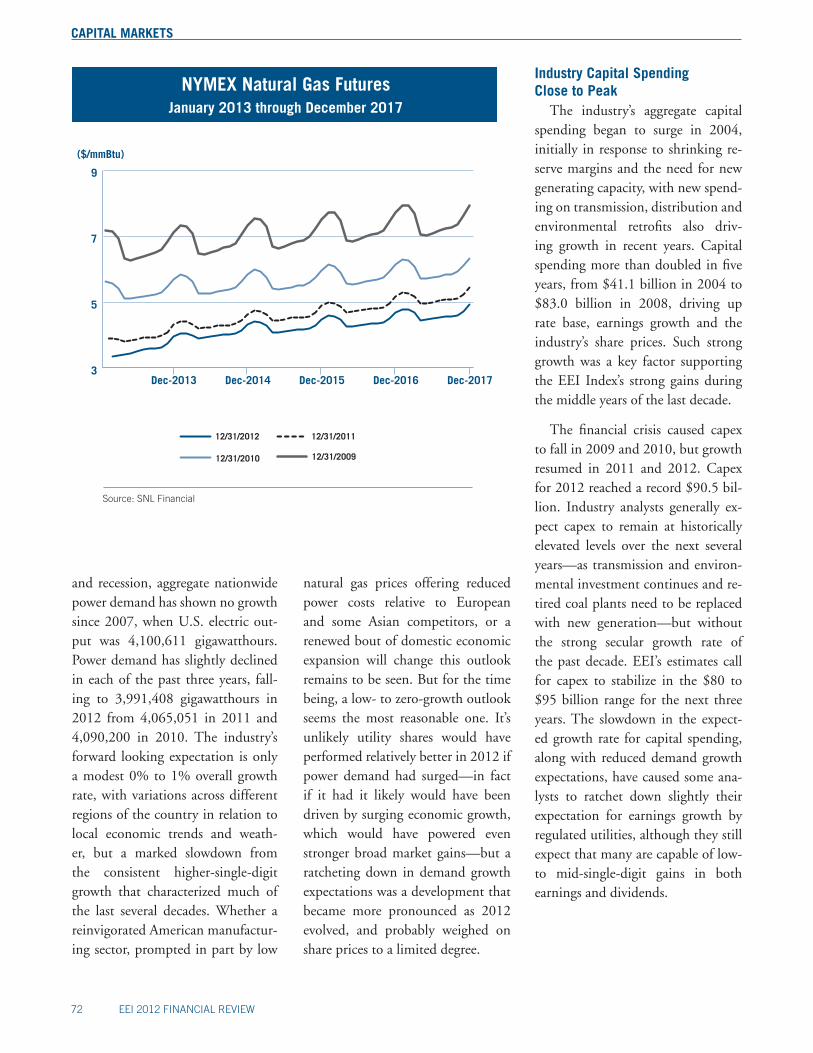
72 EEI 2012 FINANCIAL REVIEW
CAPITAL MARKETS
Industry Capital Spending Close to Peak
The industry’s aggregate capital spending began to surge in 2004, initially in response to shrinking re-serve margins and the need for new generating capacity, with new spend-ing on transmission, distribution and environmental retrofits also driv-ing growth in recent years. Capital spending more than doubled in five years, from $41.1 billion in 2004 to $83.0 billion in 2008, driving up rate base, earnings growth and the industry’s share prices. Such strong growth was a key factor supporting the EEI Index’s strong gains during the middle years of the last decade.
The financial crisis caused capex to fall in 2009 and 2010, but growth resumed in 2011 and 2012. Capex for 2012 reached a record $90.5 bil-lion. Industry analysts generally ex-pect capex to remain at historically elevated levels over the next several years—as transmission and environ-mental investment continues and re-tired coal plants need to be replaced with new generation—but without the strong secular growth rate of the past decade. EEI’s estimates call for capex to stabilize in the $80 to $95 billion range for the next three years. The slowdown in the expect-ed growth rate for capital spending, along with reduced demand growth expectations, have caused some ana-lysts to ratchet down slightly their expectation for earnings growth by regulated utilities, although they still expect that many are capable of low- to mid-single-digit gains in both earnings and dividends.
natural gas prices offering reduced power costs relative to European and some Asian competitors, or a renewed bout of domestic economic expansion will change this outlook remains to be seen. But for the time being, a low- to zero-growth outlook seems the most reasonable one. It’s unlikely utility shares would have performed relatively better in 2012 if power demand had surged—in fact if it had it likely would have been driven by surging economic growth, which would have powered even stronger broad market gains—but a ratcheting down in demand growth expectations was a development that became more pronounced as 2012 evolved, and probably weighed on share prices to a limited degree.
NYMEX Natural Gas Futures January 2013 through December 2017
Source: SNL Financial
($/mmBtu)
12/31/2011
12/31/2010
12/31/2012
3
5
7
9
Dec-2017Dec-2016Dec-2015Dec-2014Dec-2013
12/31/2009
and recession, aggregate nationwide power demand has shown no growth since 2007, when U.S. electric out-put was 4,100,611 gigawatthours. Power demand has slightly declined in each of the past three years, fall-ing to 3,991,408 gigawatthours in 2012 from 4,065,051 in 2011 and 4,090,200 in 2010. The industry’s forward looking expectation is only a modest 0% to 1% overall growth rate, with variations across different regions of the country in relation to local economic trends and weath-er, but a marked slowdown from the consistent higher-single-digit growth that characterized much of the last several decades. Whether a reinvigorated American manufactur-ing sector, prompted in part by low

EEI 2012 FINANCIAL REVIEW 73
CAPITAL MARKETS
Continued Low Interest Rates Benefit Industry
Persistently low interest rates re-main a favorable trend benefitting utilities. Not only because interest expense is kept low, but also because low interest rates support utility share prices, which are seen as bond substitutes with dividend growth potential. This was particularly true during 2011—the one year of the past four when the EEI Index out-performed the market—as the 10-year Treasury yield fell from 3.5% to under 2.0%.
Despite concerns about the size of the federal debt and deficit that spur warnings by economists and partisan wrangling among Washington poli-ticians, U.S. Treasury interest rates in 2012 remained at 60-year lows. Late in 2012, the U.S. Federal Reserve
committed to a policy of near-zero short-term rates until unemploy-ment falls below 6.5% or inflation rises above the Fed’s 2.5% threshold level. Unless today’s weak economy finds an unexpected source of surg-ing growth, near-zero short-term yields seem here to stay for the time being. The outlook for longer-term rates, where utilities borrow to fund investment programs, is less tied to Fed policy than to market forces. But there seems little sign that today’s be-nign borrowing conditions are about to change for the worse. Such has been a popular economic forecast for years, and one continually con-founded by events. Eventually, inter-est rates will rise. When they do, the industry’s borrowing costs will go up and the valuation of dividend-paying utility shares will likely compress. This may occur later this year or it
may not happen for many years. In the meantime, the industry’s strong dividend yield (at 4.3% for the EEI Index as of December 31, 2012) will give the industry a valuation floor, defending share prices if the market as a whole turns down.
Dividend Deal Struck at YearendThe future for dividend tax rates
was a source of speculation and con-cern throughout much of 2012. Fear of a significant rise in dividend tax rates, as the Bush-era tax cuts expire, was cited by some analysts as a weight on utility share prices. But the last days of 2012 brought an agreement by Congress, as part of the “fiscal cliff ” negotiations, to permanently set the top tax rate for both divi-dends and capital gains at 20% for couples earning more than $450,000 ($400,000 for singles). For taxpayers below these thresholds, dividends and capital gains will continue to be taxed at the current rates of 0% and 15%, depending on a filer’s income level. Dividend-seeking investors are crucial sources of capital for the in-dustry, and the preservation of parity between capital gains and dividend tax rates ensures that companies who rely on dividends to attract invest-ment capital are not disadvantaged relative to those who do not.
Stable Business Models, Strong Yields Support Shares
With the industry business mod-els now set on regulated or mostly regulated structures, and with slow growth in dividends as the main ap-peal for investors, periodic reversals of stock market fortune, driven by changing economic prospects and investor sentiments, seem likely to
10-Year Treasury Yield1/1/02 through 12/31/12
Source: U.S. Federal Reserve
(Percent)
0
1
2
3
4
5
6
7
Jan-12Jan-11Jan-10Jan-09Jan-08Jan-07Jan-06Jan-05Jan-04Jan-03Jan-02

74 EEI 2012 FINANCIAL REVIEW
CAPITAL MARKETS
50
75
100
125
150
175
200
Diversified
Mostly Regulated
Regulated
EEI Index
20122011201020092008
Comparative Category Total Annual Returns 2008-2012
U.S. SHAREHOLDER-OWNED ELECTRIC UTILITIES, VALUE OF $100 INVESTED AT CLOSE ON 12/31/2007
EEI Index
Regulated
Mostly Regulated
Diversified
Cumulative Return assumes $100 invested at closing prices on December 31, 2007.
Source: EEI Finance Department and SNL Financial
(Dollars)
2008 2009 2010 2011 2012EEI Index Annual Return (%) (20.93) 14.13 11.87 21.39 4.82 EEI Index Cumulative Return ($) 79.07 90.24 100.95 122.54 128.45
Regulated EEI Index Annual Return (15.59) 14.25 15.75 22.30 4.72 Regulated EEI Index Cumulative Return 84.41 96.44 111.63 136.52 142.96
Mostly Regulated EEI Index Annual Return (27.00) 15.58 8.51 19.52 5.81 Mostly Regulated EEI Index Cumulative Return 73.00 84.38 91.55 109.42 115.78
Diversified EEI Index Annual Return (33.90) 8.07 (5.16) 21.36 0.78 Diversified EEI Index Cumulative Return 66.10 71.43 67.75 82.21 82.85
2012 Category Comparison
Category
EEI Index 4.82 Regulated 4.72 Mostly Regulated 5.81 Diversified 0.78
Return (%)
* Returns shown here are unweighted averages of constituent company returns. The EEI Index return shown in the 2012 Index Comparison table is cap-weighted.
Source: EEI Finance Department, SNL Financial, and company annual reports
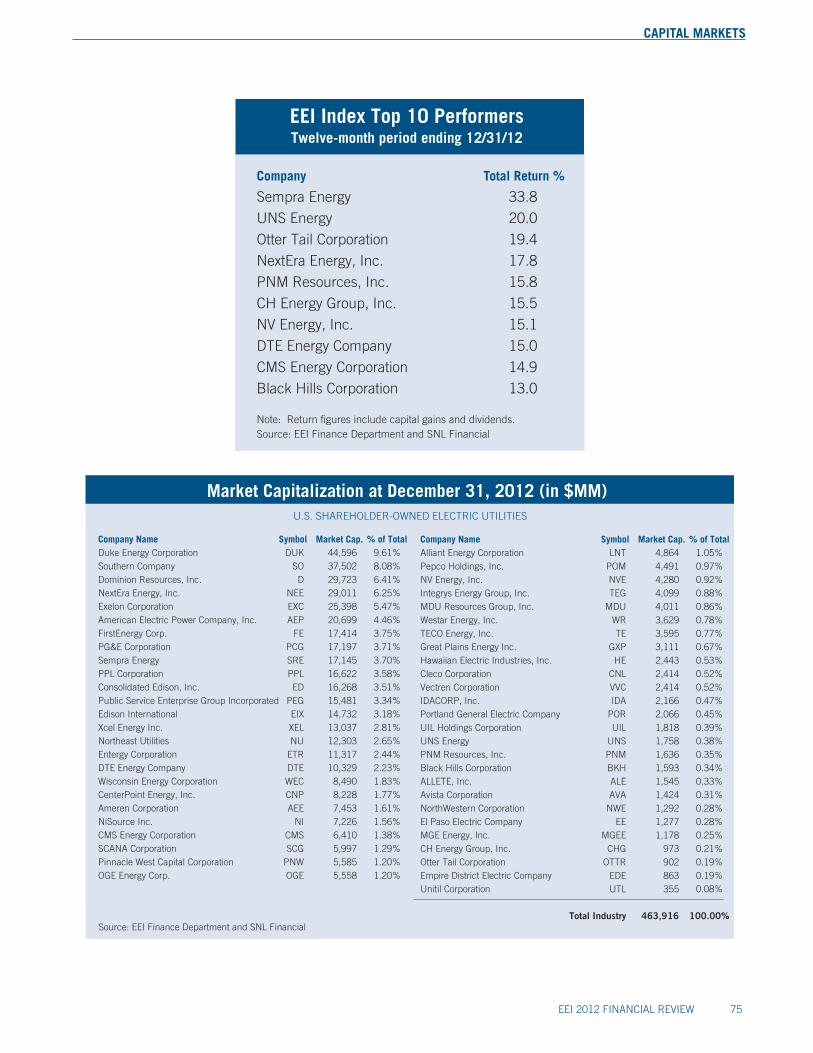
EEI 2012 FINANCIAL REVIEW 75
CAPITAL MARKETS
Market Capitalization at December 31, 2012 (in $MM)U.S. SHAREHOLDER-OWNED ELECTRIC UTILITIES
Source: EEI Finance Department and SNL Financial
Company Name Symbol Market Cap. % of Total Duke Energy Corporation DUK 44,596 9.61%Southern Company SO 37,502 8.08%Dominion Resources, Inc. D 29,723 6.41%NextEra Energy, Inc. NEE 29,011 6.25%Exelon Corporation EXC 25,398 5.47%American Electric Power Company, Inc. AEP 20,699 4.46%FirstEnergy Corp. FE 17,414 3.75%PG&E Corporation PCG 17,197 3.71%Sempra Energy SRE 17,145 3.70% PPL Corporation PPL 16,622 3.58%Consolidated Edison, Inc. ED 16,268 3.51%Public Service Enterprise Group Incorporated PEG 15,481 3.34%Edison International EIX 14,732 3.18%Xcel Energy Inc. XEL 13,037 2.81%Northeast Utilities NU 12,303 2.65%Entergy Corporation ETR 11,317 2.44%DTE Energy Company DTE 10,329 2.23%Wisconsin Energy Corporation WEC 8,490 1.83%CenterPoint Energy, Inc. CNP 8,228 1.77%Ameren Corporation AEE 7,453 1.61%NiSource Inc. NI 7,226 1.56%CMS Energy Corporation CMS 6,410 1.38%SCANA Corporation SCG 5,997 1.29%Pinnacle West Capital Corporation PNW 5,585 1.20%OGE Energy Corp. OGE 5,558 1.20%
Company Name Symbol Market Cap. % of Total Alliant Energy Corporation LNT 4,864 1.05% Pepco Holdings, Inc. POM 4,491 0.97%NV Energy, Inc. NVE 4,280 0.92%Integrys Energy Group, Inc. TEG 4,099 0.88%MDU Resources Group, Inc. MDU 4,011 0.86%Westar Energy, Inc. WR 3,629 0.78%TECO Energy, Inc. TE 3,595 0.77%Great Plains Energy Inc. GXP 3,111 0.67%Hawaiian Electric Industries, Inc. HE 2,443 0.53%Cleco Corporation CNL 2,414 0.52%Vectren Corporation VVC 2,414 0.52%IDACORP, Inc. IDA 2,166 0.47%Portland General Electric Company POR 2,066 0.45%UIL Holdings Corporation UIL 1,818 0.39%UNS Energy UNS 1,758 0.38%PNM Resources, Inc. PNM 1,636 0.35%Black Hills Corporation BKH 1,593 0.34%ALLETE, Inc. ALE 1,545 0.33%Avista Corporation AVA 1,424 0.31%NorthWestern Corporation NWE 1,292 0.28%El Paso Electric Company EE 1,277 0.28%MGE Energy, Inc. MGEE 1,178 0.25%CH Energy Group, Inc. CHG 973 0.21%Otter Tail Corporation OTTR 902 0.19%Empire District Electric Company EDE 863 0.19%Unitil Corporation UTL 355 0.08%
Total Industry 463,916 100.00%
EEI Index Top 10 PerformersTwelve-month period ending 12/31/12
Company Total Return %
Sempra Energy 33.8
UNS Energy 20.0
Otter Tail Corporation 19.4
NextEra Energy, Inc. 17.8
PNM Resources, Inc. 15.8
CH Energy Group, Inc. 15.5
NV Energy, Inc. 15.1
DTE Energy Company 15.0
CMS Energy Corporation 14.9
Black Hills Corporation 13.0
Note: Return figures include capital gains and dividends. Source: EEI Finance Department and SNL Financial

76 EEI 2012 FINANCIAL REVIEW
CAPITAL MARKETS
continue. While analysts still cite utility price/earnings ratios as near the high end of their historical range, strong dividend yields and generally healthy industry fundamentals give utility shares considerable price sup-port relative to the lower yields avail-able from bonds.
Credit Ratings
The industry’s average credit rat-ing in 2012 remained BBB for the ninth consecutive year, and the year’s 76 ratings changes reflected a pace that was on par with the relatively light activity of the prior four years (see table, Rating Agency Activity). The year’s actions were evenly bal-anced, as 39 downgrades just out-numbered 37 upgrades. Since EEI captures upgrades and downgrades at the subsidiary level, multiple ac-tions under a single parent holding company are counted in the up-grade/downgrade totals (see chart and table, Credit Rating Agency Up-grades and Downgrades and chart, Direction of Ratings Actions).
The year’s upgrades centered on the achievement of stronger regula-tory relationships and risk reduction through decreased exposure to com-petitive businesses—the latter theme produced positive ratings actions in 2010, 2011 and 2012. Downgrades resulted from exposure to competi-tive operations, high leverage and, in one case, from deteriorating regula-tory relations following the merger of Duke Energy and Progress Ener-gy. Additionally, a challenging power market and fiscal environment in Spain led to downgrades of Iberdrola S.A. and subsidiary Iberdrola USA on two occasions.
200
250
300
350
400
450
500
550
($ Billions)
2007 2008 2009 2010 2011r 20122003 2004 2005
EEI Index Market Capitalization 2003–2012
Note: Results are as of December 31 of each year.
Source: EEI Finance Department and SNL Financial
2006
EEI Index Market CapitalizationDecember 31, 2007–December 31, 2012
Source: EEI Finance Department and SNL Financial
($ Billions)
200
250
300
350
400
450
500
550
Q2-12Q3-12
Q4-07Q1-12
Q1-08Q2-08
Q3-08Q4-08
Q1-09Q2-09
Q3-09Q4-09
Q1-10Q2-10
Q3-10Q4-10
Q1-11Q2-11
Q3-11Q4-11
Q4-12
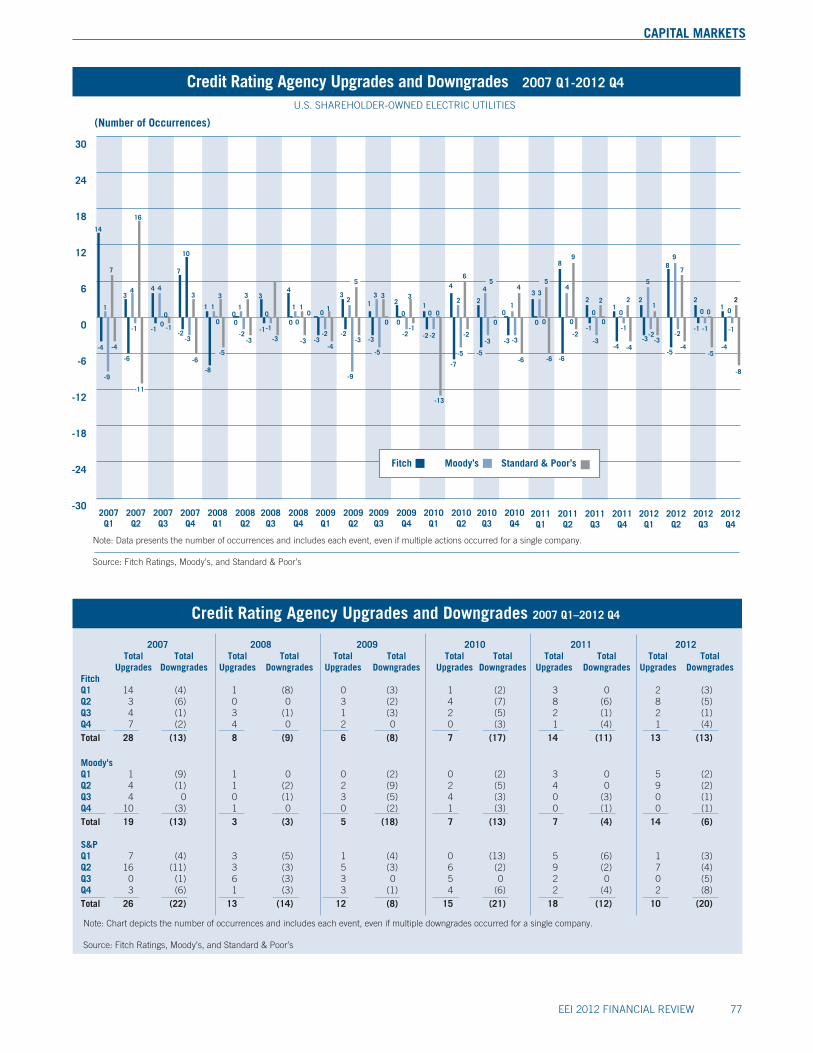
EEI 2012 FINANCIAL REVIEW 77
CAPITAL MARKETS
-30
-24
-18
-12
-6
0
6
12
18
24
30
Note: Data presents the number of occurrences and includes each event, even if multiple actions occurred for a single company.
Source: Fitch Ratings, Moody’s, and Standard & Poor’s
Credit Rating Agency Upgrades and Downgrades 2007 Q1-2012 Q4
(Number of Occurrences)
2007Q1
2007Q2
2007Q3
2007Q4
2008Q1
2008Q2
2008Q3
2008Q4
2009Q1
2009Q2
2009Q3
2009Q4
2010Q1
2010Q2
2010Q3
2010Q4
2011Q1
2011Q2
2011Q3
2011Q4
2012Q1
2012Q2
2012Q3
2012Q4
0
2
4
-2
-6-7
0
2
-2
1
-3
4
1
6
4
0
-3
-13
-2-3
16
-4 -4
-6
-1 -10 -1
-2-3
-6
34 4 4
0
7
3
10
7
1
14
-9
1
-8
1
0
3
-5
00
1
-2
3
-3
3
-1
0
-1
-3
4
0
1
0
1
-3
0
-2-3
10
-4
3
-9
-2
2
-3
1
-3
33
0
2
-2
0
3
0
-1
-11
-5
5
0
-5
5
-5
0
3
0 0
-4
-1
3
8
-1
-3
12
0
2
0
2
9
4
-2
0
-6
-4
2
-3
5
-2
1
-3
8
-5
9
-2
-4
-1 -1
-5-4
-1
-8
2
010
2
7
0
-6
5
Note: Chart depicts the number of occurrences and includes each event, even if multiple downgrades occurred for a single company.
Source: Fitch Ratings, Moody’s, and Standard & Poor’s
Credit Rating Agency Upgrades and Downgrades 2007 Q1–2012 Q4
2007 2008 2009 2010 2011 2012 Total Total Total Total Total Total Total Total Total Total Total Total Upgrades Downgrades Upgrades Downgrades Upgrades Downgrades Upgrades Downgrades Upgrades Downgrades Upgrades DowngradesFitch Q1 14 (4) 1 (8) 0 (3) 1 (2) 3 0 2 (3)Q2 3 (6) 0 0 3 (2) 4 (7) 8 (6) 8 (5)Q3 4 (1) 3 (1) 1 (3) 2 (5) 2 (1) 2 (1)Q4 7 (2) 4 0 2 0 0 (3) 1 (4) 1 (4)Total 28 (13) 8 (9) 6 (8) 7 (17) 14 (11) 13 (13)
Moody's Q1 1 (9) 1 0 0 (2) 0 (2) 3 0 5 (2) Q2 4 (1) 1 (2) 2 (9) 2 (5) 4 0 9 (2)Q3 4 0 0 (1) 3 (5) 4 (3) 0 (3) 0 (1)Q4 10 (3) 1 0 0 (2) 1 (3) 0 (1) 0 (1)Total 19 (13) 3 (3) 5 (18) 7 (13) 7 (4) 14 (6)
S&P Q1 7 (4) 3 (5) 1 (4) 0 (13) 5 (6) 1 (3)Q2 16 (11) 3 (3) 5 (3) 6 (2) 9 (2) 7 (4)Q3 0 (1) 6 (3) 3 0 5 0 2 0 0 (5)Q4 3 (6) 1 (3) 3 (1) 4 (6) 2 (4) 2 (8)Total 26 (22) 13 (14) 12 (8) 15 (21) 18 (12) 10 (20)

78 EEI 2012 FINANCIAL REVIEW
CAPITAL MARKETS
Q2 Actions Reflect Merger, Europe and Regulatory Relations
Ratings changes in the second quarter included two parent com-pany-level upgrades and two down-grades.
On April 5, S&P implemented several ratings actions concerning Northeast Utilities and NSTAR to reflect their imminent merger. The agency upgraded Northeast Utili-ties and its subsidiaries Connecticut Light & Power Co., Public Service Co. of New Hampshire, Western Massachusetts Electric Co. and Yan-kee Gas Services Co. by one notch, to A- from BBB+. S&P downgraded NSTAR and its subsidiaries NSTAR Electric Co. and NSTAR Gas Co. by two notches, to A- from A+. The ac-tions resolved S&P’s positive ratings watch on Northeast Utilities and negative watch on NSTAR, both ini-tiated on October 18, 2010.
Under the terms of the merger, NSTAR was renamed NSTAR LLC and became a subsidiary and intra-holding company of Northeast Utili-ties. S&P set a Stable outlook for the consolidated entities, citing the abili-ty of the merged company’s regulated electric and gas businesses to produce consistent cash flow with low oper-ating risk. S&P described the com-bined company’s business risk profile as “excellent” because of its relatively low operating risk, “reliable and ef-ficient operations, solid competitive standing, and geographic, economic and regulatory diversity,” as well as regulatory jurisdictions that were better than average. The agency de-scribed the company’s financial risk profile as “significant” because of debt leverage that S&P expected to
Early in 2013, approximately 87% of the industry’s rating outlooks at the parent level were Stable, 9% were Positive or Watch-Positive and 4% were Negative or Watch-Negative.
The industry’s average credit rat-ing is based on the unweighted aver-age of all parent company ratings (see pie charts of Bond Ratings at Decem-ber 31, 2012 and prior years). A sum-mary of the year’s parent-level ratings actions by quarter follows below.
Reduced Merchant Exposure Prompts Q1 Upgrade
The sole ratings action in the first quarter of 2012 at the parent com-pany level was Standard & Poor’s (S&P) January 24 upgrade of In-tegrys Energy Group’s corporate credit rating by one notch, to A- from BBB+. S&P’s action was driven primarily by the restructuring and
Bond Ratings December 31, 2012as rated by Standard & Poor’s
U.S. SHAREHOLDER-OWNED ELECTRIC UTILITIES
A or higher5%
Below BBB-9%
BBB-20%
BBB29%
A- 14%
BBB+23%
Bond Ratings December 31, 2010as rated by Standard & Poor’s
U.S. SHAREHOLDER-OWNED ELECTRIC UTILITIES
A or higher6%
Below BBB-8%
BBB-23%
BBB24%
A- 15%
BBB+24%
Bond Ratings December 31, 2011as rated by Standard & Poor’s
U.S. SHAREHOLDER-OWNED ELECTRIC UTILITIES
A or higher7%
Below BBB-8%
BBB-20%
BBB27%
A- 14%
BBB+24%
Bond Ratings December 31, 2001as rated by Standard & Poor’s
U.S. SHAREHOLDER-OWNED ELECTRIC UTILITIES
A25%
Below BBB-8%
BBB-10%
BBB14%
A- 17%
BBB+26%
Note: Rating applies to utility holding company entity.
Source: Standard & Poor’s, SNL Financial, EEI Finance Department, and company annual reports
reduction in size of Integrys’ unregu-lated businesses and the company’s continued success managing regu-latory relations. Additionally, S&P noted improved financial metrics as a result of increased cash flow from regulated operations, cost manage-ment efforts and bonus depreciation. S&P said it expected that Integrys’ credit metrics, such as funds from operations to debt, would weaken in the intermediate term due to the weak economy, the phase-out of bo-nus depreciation, and increased capi-tal spending for environmental capex and the company’s natural gas main replacement program. S&P moved Integrys’ ratings outlook from Posi-tive to Stable and stated that, in its base-case scenario, modestly weaker metrics would not be enough to merit a ratings downgrade.
Total Actions Upgrade %
Direction of Rating Actions
Source: Fitch Ratings, Moody’s, and Standard & Poor’s
59.1%
48.7%
U.S. SHAREHOLDER-OWNED ELECTRIC UTILITIES
66
76
20122003 2004 2005 2006 2007 2008 2009
253
46.4%
110
13.8%
60.3%
121
60.9%
110
60.3%
121
57
40.4%
50
48.0%
36.3%
80
2010 2011
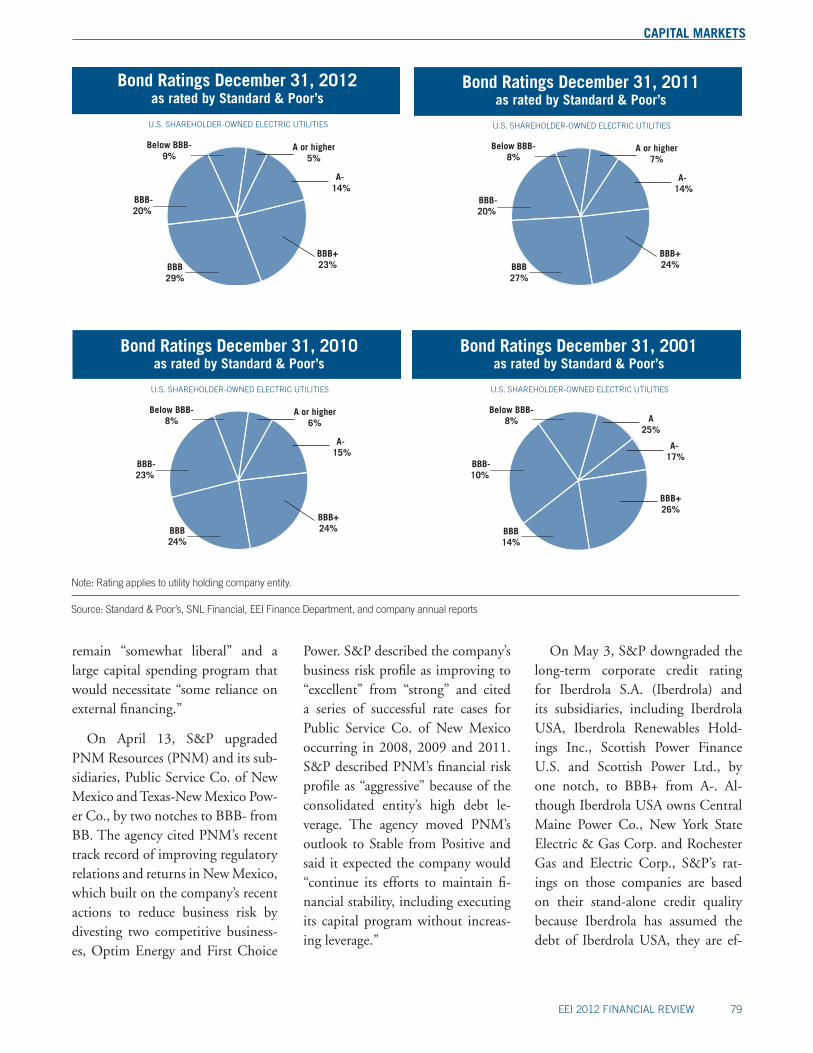
EEI 2012 FINANCIAL REVIEW 79
CAPITAL MARKETS
On May 3, S&P downgraded the long-term corporate credit rating for Iberdrola S.A. (Iberdrola) and its subsidiaries, including Iberdrola USA, Iberdrola Renewables Hold-ings Inc., Scottish Power Finance U.S. and Scottish Power Ltd., by one notch, to BBB+ from A-. Al-though Iberdrola USA owns Central Maine Power Co., New York State Electric & Gas Corp. and Rochester Gas and Electric Corp., S&P’s rat-ings on those companies are based on their stand-alone credit quality because Iberdrola has assumed the debt of Iberdrola USA, they are ef-
Power. S&P described the company’s business risk profile as improving to “excellent” from “strong” and cited a series of successful rate cases for Public Service Co. of New Mexico occurring in 2008, 2009 and 2011. S&P described PNM’s financial risk profile as “aggressive” because of the consolidated entity’s high debt le-verage. The agency moved PNM’s outlook to Stable from Positive and said it expected the company would “continue its efforts to maintain fi-nancial stability, including executing its capital program without increas-ing leverage.”
remain “somewhat liberal” and a large capital spending program that would necessitate “some reliance on external financing.”
On April 13, S&P upgraded PNM Resources (PNM) and its sub-sidiaries, Public Service Co. of New Mexico and Texas-New Mexico Pow-er Co., by two notches to BBB- from BB. The agency cited PNM’s recent track record of improving regulatory relations and returns in New Mexico, which built on the company’s recent actions to reduce business risk by divesting two competitive business-es, Optim Energy and First Choice
Early in 2013, approximately 87% of the industry’s rating outlooks at the parent level were Stable, 9% were Positive or Watch-Positive and 4% were Negative or Watch-Negative.
The industry’s average credit rat-ing is based on the unweighted aver-age of all parent company ratings (see pie charts of Bond Ratings at Decem-ber 31, 2012 and prior years). A sum-mary of the year’s parent-level ratings actions by quarter follows below.
Reduced Merchant Exposure Prompts Q1 Upgrade
The sole ratings action in the first quarter of 2012 at the parent com-pany level was Standard & Poor’s (S&P) January 24 upgrade of In-tegrys Energy Group’s corporate credit rating by one notch, to A- from BBB+. S&P’s action was driven primarily by the restructuring and
Bond Ratings December 31, 2012as rated by Standard & Poor’s
U.S. SHAREHOLDER-OWNED ELECTRIC UTILITIES
A or higher5%
Below BBB-9%
BBB-20%
BBB29%
A- 14%
BBB+23%
Bond Ratings December 31, 2010as rated by Standard & Poor’s
U.S. SHAREHOLDER-OWNED ELECTRIC UTILITIES
A or higher6%
Below BBB-8%
BBB-23%
BBB24%
A- 15%
BBB+24%
Bond Ratings December 31, 2011as rated by Standard & Poor’s
U.S. SHAREHOLDER-OWNED ELECTRIC UTILITIES
A or higher7%
Below BBB-8%
BBB-20%
BBB27%
A- 14%
BBB+24%
Bond Ratings December 31, 2001as rated by Standard & Poor’s
U.S. SHAREHOLDER-OWNED ELECTRIC UTILITIES
A25%
Below BBB-8%
BBB-10%
BBB14%
A- 17%
BBB+26%
Note: Rating applies to utility holding company entity.
Source: Standard & Poor’s, SNL Financial, EEI Finance Department, and company annual reports

80 EEI 2012 FINANCIAL REVIEW
CAPITAL MARKETS
produce more challenging regulatory relations over the near to intermedi-ate term. Additionally, S&P noted that Duke Energy Indiana faces a significant challenge showing satis-factory performance at its Edward-sport integrated gasification com-bined cycle plant, which is nearing completion and the first of its kind in the industry. In setting the new Duke Energy’s outlook to Negative, S&P resolved the negative watch on Duke and its subsidiaries and the ‘developing’ watch on Progress and its subsidiaries initiated on July 3. S&P indicated that the companies’ revised ratings assumed constructive regulatory outcomes in North Caro-lina and a credit-neutral outcome in Florida for Crystal River 3.
Competitive Markets, Europe and Debt Force Q4 Downgrades
There were three downgrades during fourth quarter at the parent company-level.
On November 8, S&P lowered its corporate credit ratings on DPL Inc. and operating subsidiary Day-ton Power and Light by two notch-es, to BB from BBB-. The action came roughly one year after S&P downgraded the companies by three notches in response to the sale of
Leadership Uncertainty Results in Q3 Downgrade
There was one parent company downgrade during the third quarter. On July 25, S&P lowered its corpo-rate credit ratings for Duke Energy Corp. and its subsidiaries Duke En-ergy Ohio Inc., Duke Energy Indi-ana Inc., Duke Energy Carolinas LLC, Cinergy Corp. and Duke En-ergy Kentucky Inc. by one notch, to BBB+ from A-. At the same time, the agency affirmed its ratings for Prog-ress Energy Inc. and its subsidiaries Carolina Power & Light Co. (d/b/a Progress Energy Carolinas Inc.) and Florida Power Corp. (d/b/a Progress Energy Florida Inc.) at BBB+.
The changes were driven by what S&P said was a significant rise in reg-ulatory risk following an unexpected change in executive leadership subse-quent to Duke’s merger with Prog-ress. S&P cited several key regulatory issues that the combined company, Duke Energy, would need to resolve in the near term: two major rate cases in North Carolina and a decision on whether to repair or retire the Crys-tal River 3 nuclear plant in Florida. S&P implied that the suddenness of the executive changes, and sub-sequent investigation by the North Carolina Utilities Commission, will
fectively under the direct control of Iberdrola, and “none individually is a significant source of cash flow for the holding company.”
S&P cited as its basis for the downgrade the deteriorating eco-nomic conditions in Spain; Iberdro-la’s Spanish utilities provide about 47% of the group’s revenue. S&P emphasized that regulatory and po-litical risks could arise if the Spanish government were to pursue policies designed “to extract cash from power utilities” in the country. In addi-tion, S&P referred to increasingly challenging and volatile conditions in Spain’s deregulated and oversup-plied electricity market. S&P cited as stabilizing and offsetting factors Iberdrola’s significant size and its geographic diversity deriving from vertically integrated utility business-es in the U.K., U.S. and Latin Amer-ica. In setting Iberdrola’s outlook at Stable, S&P said it expected the company would be able to maintain key credit ratios despite the likely continuation of a difficult industry and economic environment over the near to medium term.
Source: Fitch Ratings, Moody’s, Standard & Poor’s, SNL Financial, and EEI Finance Department
Total Ratings Changes 2004 2005 2006 2007 2008 2009 2010 2011 2012Fitch 34 22 31 41 17 14 24 25 26Moody's 42 46 39 32 6 23 20 11 20Standard & Poor's 34 53 40 48 27 20 36 30 30
Total 110 121 110 121 50 57 80 66 76
U.S. SHAREHOLDER-OWNED ELECTRIC UTILITIES
Rating Agency Activity

EEI 2012 FINANCIAL REVIEW 81
CAPITAL MARKETS
large maturities in 2014 through 2017, S&P stated that “refinancing risk is dominant” and that the indus-try view was that natural gas prices would need to rise to about $6 to $8/mmBtu to support refinancing. At December 31, S&P had not yet revised its rating on EFH from SD.
Looking Ahead: Regulatory Constructs Are Key
Last year in this space, we took note of recent comments by Stan-dard & Poor’s on the emergence of a new, credit-supportive merger model. Mergers such as those of FirstEnergy/Allegheny Energy, PPL Corp./E.ON U.S., Northeast Utili-ties/NSTAR, as well as the Duke/Progress and Exelon/Constellation deals, featured one or more ele-ments of contiguous service territo-ries, modest and achievable savings claims, more-reasonable equity pre-miums, and swift and constructive regulatory approvals. However, as discussed in Mergers and Acquisi-tions, limited deal activity in 2012 meant limited opportunity to test the new model. At the same time, an unexpected leadership change at Duke Energy, following its merger with Progress, had an immediate, detrimental effect on the combined company’s business risk via its regu-latory relations, at least in the eyes of S&P.
In light of these developments, in early 2013 S&P and Moody’s placed their focus on fundamental risks that lie ahead for a regulated electric sec-tor whose creditworthiness they view as stable to improving. In outlook re-ports dated February 6 and April 19, Moody’s and S&P each described how low fuel prices were playing an
setting Iberdrola and Iberdrola USA’s outlooks to Stable, S&P expected that Iberdrola would maintain a con-solidated adjusted FFO to debt ratio of 18%. The agency said that Span-ish political outcomes, either positive or negative, and company manage-ment’s commitment to conservative financial policies, were likely to be factors in any future ratings changes.
On December 6, S&P lowered its corporate credit ratings on En-ergy Future Holdings Corp. (EFH) to ‘SD,’ or Selective Default, from CCC. The move resulted from the company’s completion of a distressed debt exchange in which it executed a private transaction with lenders that served to reduce its debt level and an-nual interest burden and remove ma-turities in the 2014 to 2017 window, during which EFH subsidiary Texas Competitive Electric Holdings Co. LLC would need to manage approxi-mately $20 billion in maturing debt.
S&P explained that, under its cri-teria, the agency lowers to SD the corporate credit rating of a company that commences a distressed debt ex-change when it completes the offer. Shortly thereafter, S&P revises the rating to reflect credit fundamentals and the effect, if any, of the exchange.
In a related summary of Energy Future Holdings on December 27, S&P described how the company’s financial challenges were rooted in a 2007 leveraged buyout that was, in essence, a bet on the future of power prices in Texas. However, the finan-cial crisis and its effect on the econ-omy, as well as the shale gas boom, have conspired to depress those pric-es, at least through 2012. With very
DPL to AES Corp. and the planned assumption of an additional $1.25 billion in debt by DPL. In this in-stance, the downgrade resulted from business rather than financial factors. S&P pointed to increasing competi-tion and lower wholesale power pric-es that would “continue to materially reduce” DPL’s profit margins, as well as the rising proportion of cash flow derived from DPL’s unregulated re-tail business, which S&P said would result from DPL’s transition to mar-ket rates for its generation output in Ohio.
In setting its outlook on DPL to Stable, S&P emphasized that credit metrics were likely to drive any fu-ture ratings changes. The agency said it would look for consolidated ad-justed funds from operations (FFO) to debt of 8% to 10% over the fol-lowing 12 to 18 months. S&P said that a ratio consistently lower than 8% could lead to a downgrade, while a ratio consistently higher than 15% could support an upgrade.
On November 28, approximately six months after downgrading Iber-drola S.A. (Iberdrola) and its subsid-iaries by one notch, S&P again low-ered the companies’ corporate credit ratings by one notch, to BBB from BBB+. The agency said that its fore-cast of the consolidated entity’s credit ratios had worsened and was no lon-ger commensurate with a BBB+ rat-ing. As before, while this action af-fected the ratings of Iberdrola USA, it did not affect the ratings of its vari-ous U.S. utility subsidiaries. S&P commended Iberdrola S.A.’s moves to reduce its exposure to Spain and to reduce debt, indicating that these were moderating factors. In again

82 EEI 2012 FINANCIAL REVIEW
CAPITAL MARKETS
important role in moderating base rate increases occurring throughout the industry as a result of high levels of capital spending. When fuel pric-es inevitably rise, the agencies see as a core risk the preservation of what are now generally good regulatory relationships.
As the industry invests to meet environmental mandates and renew-able energy standards, as well as to
maintain and improve the quality of transmission and distribution infra-structure, rate base will continue to increase faster than depreciation and base rates will need to rise. Moody’s and S&P stated that the utilities best-prepared for continued base rate increases are those whose state commissions provide mechanisms that reduce or minimize regulatory lag, such as construction work-in-
progress (CWIP); trackers or rid-ers for pension, storm and envi-ronmental costs; and decoupling. Both agencies emphasized that these mechanisms are particularly benefi-cial given the lack of strong demand growth since the 2008-2009 reces-sion.
Besides low demand (see Electric-ity Customers, Sales and Revenues), the industry’s financial environment
is characterized by very low interest rates and falling awarded returns on equity (see Rate Case Summary). The continuation of a zero short-term rate policy and aggressive quantita-tive easing by the Federal Reserve has led some financial market par-ticipants to expect a build-up of in-flationary pressures that will force interest rates to rise when, or perhaps even before, the Fed’s programs run their course. Moody’s has cited rising rates as an additional risk to utilities’ creditworthiness. The agency ex-pressed concern that state regulators would continue to reduce awarded ROEs even as interest rates start to climb, reducing cash flow as capital spending persists while financing costs increase. While 2012’s ratings actions underscored the benefits of more-regulated utility business models and improving regulatory relations in a low-fuel-price environ-ment, bigger challenges on the regu-latory front are likely to lie ahead.
Ratings by Company CategoryThe table S&P Utility Credit Rat-
ings Distribution by Company Category presents the distribution of credit ratings over time for the sharehold-er-owned electric utilities organized into Regulated, Mostly Regulated and Diversified categories. Ratings are based on S&P long-term issuer ratings at the holding company lev-el, with only one rating assigned per company. At December 31, 2012, the categories had the following average ratings: Regulated = BBB, Mostly Regulated = BBB+, and Diversified = BB.
S&P Utility Credit Ratings Distribution by Company CategoryU.S. SHAREHOLDER-OWNED ELECTRIC UTILITIES
Note: Totals may not equal 100.0% due to rounding.
Refer to page v for category descriptions.
Source: Standard & Poor's, SNL Financial, and EEI Finance Department
2007 2008 2009 2010 2011 2012 # % # % # % # % # % # %
Regulated A or higher 5 13% 3 8% 3 7% 3 9% 3 8% 2 6%A- 2 5% 4 10% 6 15% 5 14% 5 14% 6 17%BBB+ 10 26% 9 23% 9 22% 6 17% 7 19% 5 14%BBB 8 21% 9 23% 11 27% 11 31% 13 35% 13 36%BBB- 7 18% 9 23% 8 20% 6 17% 5 14% 6 17%Below BBB- 6 16% 5 13% 4 10% 4 11% 4 11% 4 11%
Total 38 100% 39 100% 41 100% 35 100% 37 100% 36 100%
Mostly Regulated A or higher 1 5% 1 5% 2 11% 1 5% 1 5% 1 6%A- 3 16% 5 26% 2 11% 3 15% 3 16% 2 12%BBB+ 4 21% 2 11% 5 26% 6 30% 6 32% 7 41%BBB 6 32% 8 42% 6 32% 4 20% 3 16% 3 18%BBB- 4 21% 3 16% 4 21% 6 30% 6 32% 4 24%Below BBB- 1 5% 0 0% 0 0% 0 0% 0 0% 0 0%
Total 19 100% 19 100% 19 100% 20 100% 19 100% 17 100%
Diversified A or higher 0 0% 0 0% 0 0% 0 0% 0 0% 0 0%A- 2 22% 0 0% 0 0% 0 0% 0 0% 0 0%BBB+ 3 33% 2 29% 1 17% 2 40% 1 25% 1 33%BBB 1 11% 2 29% 2 33% 0 0% 0 0% 0 0% BBB- 2 22% 2 29% 2 33% 2 40% 2 50% 1 33%Below BBB- 1 11% 1 14% 1 17% 1 20% 1 25% 1 33%
Total 9 100% 7 100% 6 100% 5 100% 4 100% 3 100%
Long-Term Credit Rating Scales U.S. SHAREHOLDER-OWNED ELECTRIC UTILITIES
Investment Grade
Moody’s Standard & Poor’s FitchAaa Aa1 Aa2 Aa3 A1 A2 A3 Baa1 Baa2 Baa3 Ba1 Ba2 Ba3 B1 B2 B3 Caa1 Caa2 Caa3 Ca C C Source: Fitch Ratings, Moody’s, and Standard & Poor’s
Speculative Grade
Default
AAA AA+ AA AA- A+ A A- BBB+ BBB BBB- BB+ BB BB- B+ B B- CCC+ CCC CCC- CC C D
AAA
AA+AAAA-
A+AA-
BBB+BBBBBB-
BB+BBBB-
B+BB-
CCC+CCCCCC-
CC
C
D
Moody’s Standard & Poor’s Fitch
Moody’s Standard & Poor’s Fitch
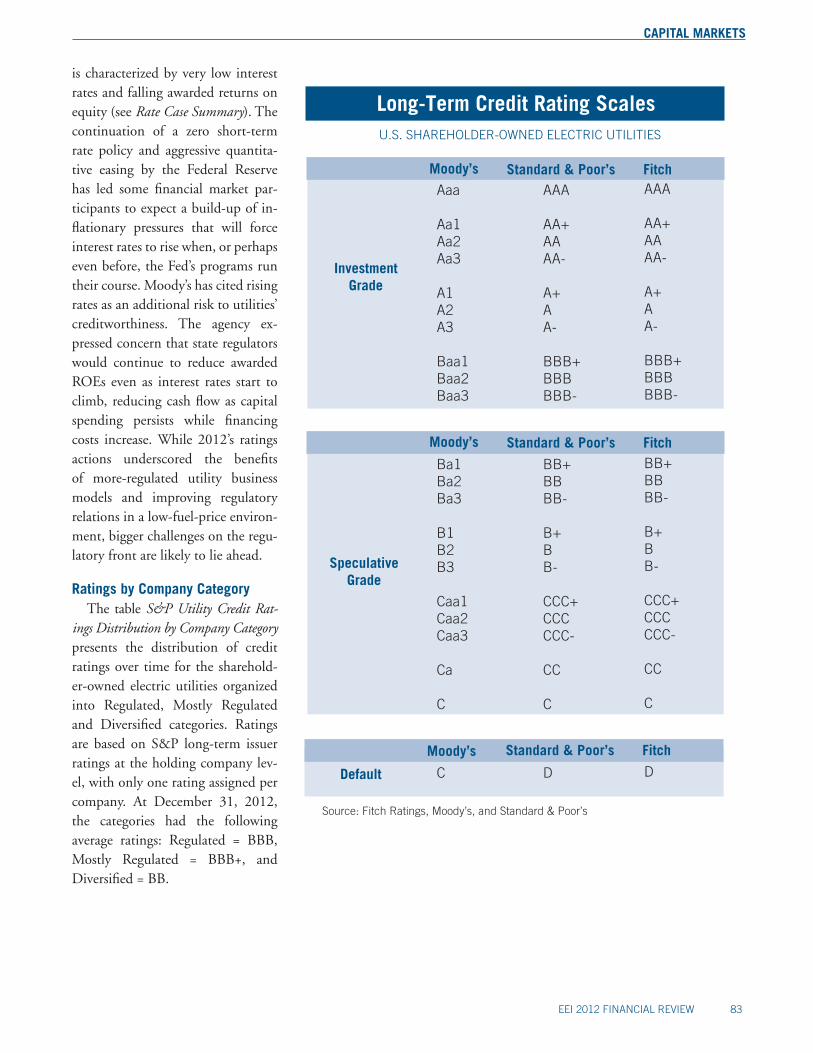
EEI 2012 FINANCIAL REVIEW 83
CAPITAL MARKETS
is characterized by very low interest rates and falling awarded returns on equity (see Rate Case Summary). The continuation of a zero short-term rate policy and aggressive quantita-tive easing by the Federal Reserve has led some financial market par-ticipants to expect a build-up of in-flationary pressures that will force interest rates to rise when, or perhaps even before, the Fed’s programs run their course. Moody’s has cited rising rates as an additional risk to utilities’ creditworthiness. The agency ex-pressed concern that state regulators would continue to reduce awarded ROEs even as interest rates start to climb, reducing cash flow as capital spending persists while financing costs increase. While 2012’s ratings actions underscored the benefits of more-regulated utility business models and improving regulatory relations in a low-fuel-price environ-ment, bigger challenges on the regu-latory front are likely to lie ahead.
Ratings by Company CategoryThe table S&P Utility Credit Rat-
ings Distribution by Company Category presents the distribution of credit ratings over time for the sharehold-er-owned electric utilities organized into Regulated, Mostly Regulated and Diversified categories. Ratings are based on S&P long-term issuer ratings at the holding company lev-el, with only one rating assigned per company. At December 31, 2012, the categories had the following average ratings: Regulated = BBB, Mostly Regulated = BBB+, and Diversified = BB.
S&P Utility Credit Ratings Distribution by Company CategoryU.S. SHAREHOLDER-OWNED ELECTRIC UTILITIES
Note: Totals may not equal 100.0% due to rounding.
Refer to page v for category descriptions.
Source: Standard & Poor's, SNL Financial, and EEI Finance Department
2007 2008 2009 2010 2011 2012 # % # % # % # % # % # %
Regulated A or higher 5 13% 3 8% 3 7% 3 9% 3 8% 2 6%A- 2 5% 4 10% 6 15% 5 14% 5 14% 6 17%BBB+ 10 26% 9 23% 9 22% 6 17% 7 19% 5 14%BBB 8 21% 9 23% 11 27% 11 31% 13 35% 13 36%BBB- 7 18% 9 23% 8 20% 6 17% 5 14% 6 17%Below BBB- 6 16% 5 13% 4 10% 4 11% 4 11% 4 11%
Total 38 100% 39 100% 41 100% 35 100% 37 100% 36 100%
Mostly Regulated A or higher 1 5% 1 5% 2 11% 1 5% 1 5% 1 6%A- 3 16% 5 26% 2 11% 3 15% 3 16% 2 12%BBB+ 4 21% 2 11% 5 26% 6 30% 6 32% 7 41%BBB 6 32% 8 42% 6 32% 4 20% 3 16% 3 18%BBB- 4 21% 3 16% 4 21% 6 30% 6 32% 4 24%Below BBB- 1 5% 0 0% 0 0% 0 0% 0 0% 0 0%
Total 19 100% 19 100% 19 100% 20 100% 19 100% 17 100%
Diversified A or higher 0 0% 0 0% 0 0% 0 0% 0 0% 0 0%A- 2 22% 0 0% 0 0% 0 0% 0 0% 0 0%BBB+ 3 33% 2 29% 1 17% 2 40% 1 25% 1 33%BBB 1 11% 2 29% 2 33% 0 0% 0 0% 0 0% BBB- 2 22% 2 29% 2 33% 2 40% 2 50% 1 33%Below BBB- 1 11% 1 14% 1 17% 1 20% 1 25% 1 33%
Total 9 100% 7 100% 6 100% 5 100% 4 100% 3 100%
Long-Term Credit Rating Scales U.S. SHAREHOLDER-OWNED ELECTRIC UTILITIES
Investment Grade
Moody’s Standard & Poor’s FitchAaa Aa1 Aa2 Aa3 A1 A2 A3 Baa1 Baa2 Baa3 Ba1 Ba2 Ba3 B1 B2 B3 Caa1 Caa2 Caa3 Ca C C Source: Fitch Ratings, Moody’s, and Standard & Poor’s
Speculative Grade
Default
AAA AA+ AA AA- A+ A A- BBB+ BBB BBB- BB+ BB BB- B+ B B- CCC+ CCC CCC- CC C D
AAA
AA+AAAA-
A+AA-
BBB+BBBBBB-
BB+BBBB-
B+BB-
CCC+CCCCCC-
CC
C
D
Moody’s Standard & Poor’s Fitch
Moody’s Standard & Poor’s Fitch

84 EEI 2012 FINANCIAL REVIEW
CAPITAL MARKETS

EEI 2012 FINANCIAL REVIEW 85
companies, including electric com-panies, and would have harmed the nation’s economy.
On January 1, 2013, Congress passed legislation to address tax hikes and automatic spending cuts that were set to take effect this year. The “American Taxpayer Relief Act” per-manently links dividend and capital gains tax rates, and sets the top tax rate for both at 20 percent for cou-ples earning more than $450,000 ($400,000 for singles). For taxpay-ers below these thresholds, dividends and capital gains will continue to be taxed at the current rates of 0 per-cent and 15 percent, depending on a filer’s income level.
The Defend My Dividend campaign was successful and multi-faceted. Among its tactics and activi-ties, DMD:
■ Mobilized a grassroots base of employees, shareholders, retir-ees, and other concerned citizens to generate more than 300,000 e-mails and phone calls to Members of Congress;
■ Organized several CEO and CFO fly-ins to Washington;
■ Engaged in extensive national, local, and social media outreach, resulting in numerous broadcast appearances, articles, and op-eds in support of our position; and
Policy OverviewIntroduction
In 2012, EEI and its member companies were at the center of key policy debates on Capitol Hill, as well as at the U.S. Environmental Protection Agency (EPA), Federal Energy Regulatory Commission (FERC), Commodity Futures Trad-ing Commission (CFTC), Depart-ment of Energy (DOE), and other federal agencies.
We engaged on a range of critical issues, including dividend taxes and the fiscal cliff; Dodd-Frank imple-mentation; cybersecurity; storm re-sponse and restoration; distributed energy resources; FERC regulatory policy and adequate transmission returns on equity (ROEs); electric and natural gas coordination issues; electric transportation; energy effi-ciency; and key environmental rule-makings that have great significance for our industry.
Our work together toward com-mon policy objectives strengthens the industry and demonstrates the Power by Association that EEI rep-resents. The following summary pro-vides a snapshot of the legislative and regulatory challenges affecting the electric power industry in 2012. In no way is it a comprehensive list of all of the challenges that we faced last year, or that we are tackling this year.
Please visit EEI’s Web site, www.eei.org, for our latest policy positions and activities.
Defend My Dividend Campaign
One of EEI’s and the industry’s top public policy priorities is protect-ing dividend tax rates. In early 2012, EEI launched the Defend My Divi-dend (DMD) campaign with the support of our member companies and their employees, retirees, and shareholders. A number of other or-ganizations, including dividend-pay-ing companies like Verizon and UPS, and the members of the Alliance for Savings and Investment, partnered with DMD to educate lawmakers and industry stakeholders about the importance of low dividend tax rates that are on par with the tax rates for capital gains.
Absent congressional legislation, the top tax rate on capital gains would have increased from 15 per-cent to 23.8 percent in 2013, while the maximum tax rate on dividends would have skyrocketed from 15 per-cent to 43.4 percent, hurting seniors and the millions of other Americans who directly or indirectly own stocks that pay dividends. Raising dividend tax rates also would have disadvan-taged the largest dividend-paying

86 EEI 2012 FINANCIAL REVIEW
POLICY OVERVIEW
Pension Reform Legislation
The sustained steps that the fed-eral government has taken in recent years to hold down interest rates to spur economic growth have trans-lated into very high estimates of pension liability. This, in turn, has resulted in immediate, excessive, and unnecessary required pension contri-butions.
Given these challenges, EEI par-ticipated in a collaborative effort that secured a favorable pension funding stabilization provision in legislation enacted in July 2012. This creates a permanent rule that disregards inter-est rates for any period to the extent that the rate for that period is not within 10 percent of the 25-year average interest rate. Without this change, funding requirements in the near-term would have been far greater than necessary to meet long-term pension obligations, creating significant economic inefficiencies and forcing employers to divert im-portant resources to fulfill an artifi-cial obligation.
Given the particular challenges facing member companies’ pen-sion- and healthcare-related benefits plans, EEI worked with companies to provide comprehensive bench-marking data on pension and other benefit issues ranging from actuarial assumptions to cost-saving measures and regulatory support.
continues to advocate that coal ash be regulated as non-hazardous waste and is working to build con-gressional support for legislation.
■ Improved final particulate matter national ambient air quality stan-dards (NAAQS) that do not ad-dress visibility and include better monitoring requirements.
■ Improved regional haze decision-making in some states.
■ The agency’s efforts to regulate greenhouse gas (GHG) emissions from new and existing fossil fuel-based units under the new source performance standards in the Clean Air Act.
■ Other key environmental issues, including Clean Water Act juris-diction, effluent limitation guide-lines, water quality standards, and siting and natural resources issues.
Dodd-Frank Update
Another issue that EEI continues to focus on is ensuring that the CFTC and other regulatory agencies pre-serve the legislative intent of the 2010 Dodd-Frank financial reform law to avoid burdening end users. In 2012, we achieved significant improvements in final rules on the definitions of swap and swap dealer and implementation of the end-user exception, among others. These pre-served and strengthened the end-user exemption, ensuring that EEI members are not miscast as swap dealers and that most utility transac-tions are not regulated as swaps. EEI is now focused on helping member companies as they begin the compli-ance process.
■ Educated stakeholders on the benefits of keeping dividend tax rates low and linked to capital gains tax rates.
The DMD victory was a huge win for customers, shareholders, our industry, and our efforts to raise capital.
Environmental Roundup
Last year, a number of environ-mental regulations took center stage, and EEI and our members worked closely with EPA on issues that will affect our industry’s operations on the air, water, and land in the future. Activities were focused on:
■ EPA’s pending rule for power plant cooling water intake struc-tures under Section 316(b) of the Clean Water Act. With a final rule due in June 2013, EEI continues to advocate that EPA’s Section 316(b) rule be both environmen-tally protective and cost-effective, and that EPA not use the national “willingness-to-pay” survey results as a cost-benefit justification for the rule or in individual permit proceedings.
■ Mercury and air toxics standards (MATS) implementation issues, especially for a handful of utili-ties that are looking to secure additional time to comply with the regulations. A large portion of our coal-based fleet is working to meet these standards by 2015, and EPA predicts a compliance cost of about $10 billion per year.
■ A final coal ash rule, under which EPA is considering whether to regulate this combustion byprod-uct as a hazardous waste. EEI

EEI 2012 FINANCIAL REVIEW 87
POLICY OVERVIEW
Superstorm Sandy
Last October, Superstorm Sandy hit more than 20 states, leaving widespread devastation in her wake and reinforcing just how essential electricity is. Sandy brought together the electric power industry as never before. Through our industry’s mu-tual assistance network, 80 elec-tric utilities and tens of thousands of utility workers from around the country and Canada came together to work around the clock to restore power to 10 million customers.
As an industry, we also created an unprecedented industry-government partnership, working in close coor-dination with the White House, the Departments of Energy, Defense, Homeland Security, and Trans-portation, along with the Federal Emergency Management Agency, and state and local governments. This partnership helped to eliminate bureaucratic roadblocks and to expedite restoration efforts.
Although we’ll never be able to fully inoculate ourselves against Mother Nature, electric utilities are continuing to work with regulators, policymakers, and consumer advo-cates on the most effective ways to make their systems more resilient.
tive responsibilities in addressing high-impact infrastructure risks and potential threats. More than 70 senior executives from our industry participated in a classified cyber briefing in September, demonstrat-ing the commitment between gov-ernment and the private sector.
A preliminary framework is now in place to plan, exercise, and coor-dinate efforts to protect the power grid from cyber attacks, acts of war, or widespread natural disasters.
Later this year, a working group of senior Administration officials and industry representatives will begin to focus on recovery and response in the face of a catastrophic, “national- level” outage, as well as the impor-tance of identifying roles and respon-sibilities before a disaster.
In 2012, EEI also:
■ Advocated in support of the in-dustry’s cybersecurity legislative priorities with House and Sen-ate leadership, resulting in House passage of information-sharing legislation;
■ Developed a Threat Scenario Project with member companies to identify the top security threats to the industry and provide guid-ance on mitigation measures;
■ Coordinated member company review and improvements to the North American Electric Reliability Corporation’s latest Critical Infra-structure Protection Standards.
Cybersecurity
Environmental and financial is-sues were not the only challenges that the industry faced last year. As the grid becomes more dependent on digital technologies, protecting it against cyber attacks becomes more and more important too. Getting actionable information from our government is paramount. The best defense is leveraging the expertise of an industry-government partnership.
EEI is working with the Admin-istration and government agencies to ensure that any new policy ini-tiatives focus government authority on responding to specific, imminent threats. The industry’s policy posi-tions were reflected in the Executive Order that President Obama issued in February 2013.
The Order, which seeks to ad-vance cybersecurity preparedness in the absence of legislation, directs the National Institute for Standards and Technology (NIST) to convene owners and operators of critical in-frastructure across all sectors. EEI is participating in this process to ensure the electric utility sector’s existing regulatory framework is preserved as NIST produces recommendations for standards, guidelines, and best practices to improve the security of critical infrastructure sectors.
In 2012, EEI also initiated exec-utive-level coordination with the Departments of Homeland Secu-rity and Energy to clarify the respec-
88 EEI 2012 FINANCIAL REVIEW
POLICY OVERVIEW
and ensure operational reliability of the utility system.
■ EEI worked with the FCC to ensure that smart meters are not subject to universal service fund fees of $1 per connection per month.
■ Through its Distribution 2020 initiative, EEI worked to build support for increased investments in the distribution system, and continues to engage at the state level on policies related to net me-tering, interconnection charges, standby rates, and utility partici-pation in distributed energy re-source markets.
■ EEI led outreach efforts at FERC and engaged commissioners on the importance of regulatory cer-tainty on adequate ROE allow-ances and incentives policy.
■ EEI worked to ensure that Utility Energy Service Contracts are not scored by the federal government.
■ EEI collaborated with the Department of Defense on energy security and bypass issues to ensure that microgrids planned for military bases are compatible with local utility interconnection requirements and systems.
■ EEI worked closely with the natural gas industry and hosted several dialogues with natural gas producers in an ongoing effort to help ensure utility access to firm natural gas supply, including long-term contracts.
■ EEI highlighted the industry’s workforce development initiatives under way through the Center for Energy Workforce Development and Troops to Energy Jobs.
2025 reflect EEI’s advocacy for incentives for electric vehicles (EVs) and recognition of the im-mediate GHG reductions associ-ated with using EVs over conven-tional and natural gas vehicles.
■ EEI advocated for policies that advance the widespread commer-cialization of electric transporta-tion technologies and preserve existing federal electric transpor-tation programs, and educated policymakers about the energy security and environmental ben-efits of EVs.
■ EEI continued to lead industry advocacy efforts in support of increased funding for LIHEAP, the Low Income Home Energy Assistance Program.
■ EEI secured favorable “robocall” guidance from the Federal Com-munications Commission (FCC), overruling previous interpreta-tions of the Telephone Consumer Protection Act that prevented utilities from making automated calls (including debt collection calls) to wireless devices.
■ EEI worked to ensure that public safety spectrum legislation enacted in February included language to allow utilities to participate in a new nationwide, interoperable communications network for first responders.
■ EEI rolled out a major smart grid communications campaign to refocus customer attitudes on advanced metering infrastructure.
■ Through its participation in the Smart Grid Interoperability Pan-el, EEI continued to advocate for cost-effective data access policies that protect consumer privacy
U.S./International Convergence Projects
EEI continued to coordinate member company initiatives to evaluate, respond to, and address in-dustry-specific concerns arising from efforts by the Financial Accounting Standards Board (FASB) and the International Accounting Standards Board (IASB) to converge their accounting standards for Revenue Recognition and Lease Accounting.
Rate-Regulated Accounting
EEI has led a coalition effort to educate the FASB, Securities and Exchange Commission (SEC), and FERC of the need to assure that US GAAP include a standard on rate-regulated accounting in the event that International Financial Report-ing Standards are adopted or en-dorsed in the U.S. Additionally, EEI is working jointly with other indus-try associations to participate actively in the IASB’s project on Accounting for Rate-Regulated Activities.
Other Highlights
EEI’s 2012 policy-related activi-ties and results also include:
■ Anticipating that Congress may address comprehensive tax reform in 2013, EEI worked to edu-cate lawmakers about key issues, including normalization, excess deferred taxes, accelerated depre-ciation, and deductibility of interest on corporate debt.
■ EPA’s final GHG vehicle stan-dards for model years 2017-

EEI 2012 FINANCIAL REVIEW 89
POLICY OVERVIEW
Securities & Exchange Commission (SEC)
The SEC staff published its final staff report on its “Work Plan for the Consideration of Incorporating International Financial Reporting Standards (IFRS) into the Financial Reporting System for U.S. Issuers” in July 2012. The SEC staff did not make a recommendation to the SEC about whether IFRS should or should not be adopted, and neither the SEC nor its staff has provided any indication as to if or when the Commission will take further action. The report noted that a large major-ity of U.S. market participants do not support adoption of IFRS as is-sued by the IASB. The endorsement mechanism previously articulated by the staff, in which IFRS would be ad-opted as US GAAP over time with selected changes if required, contin-ues to be favored.
International Accounting Standards Board (IASB)
The IASB reactivated its previously cancelled project on Accounting for Rate-Regulated Activities. The proj-ect was taken up as a result of the IASB’s agenda consultation, and a Discussion Paper is expected to be issued in 2013. The IASB also decided to issue an interim standard that would permit some form of grand-fathering of existing gap accounting for the effects of rate regulation for those entities that have not yet adopted IFRS.
Accounting Issues
Financial Accounting Standards Board (FASB)
The FASB continued to work during 2012 on three major con-vergence projects with the Interna-tional Accounting Standards Board. The Boards substantially finalized their converged standard on Revenue Recognition and expect to issue it in 2013. The Boards re-deliberated many issues on the Leases project and decided to re-expose a proposed Accounting Standards Update in 2013 as well. EEI Accounting Com-mittees actively worked to raise and provide recommended solutions to issues affecting our industry within these projects. Work by the FASB on the various facets of the Financial Instruments projects was largely deferred.
In July 2012, the FASB issued a Discussion Paper on a Disclosure Framework project. This step is a precursor to the potential issuance of a proposed Accounting Standards Update that may address, among other things, the content, organiza-tion, and format of financial state-ment disclosures; if and how greater flexibility in the type of disclosures is appropriate; articulating objectives for judgments underlying whether and how to make disclosures; and the volume of disclosures, as well as the interaction of footnotes with other disclosures. in public company reports.

90 EEI 2012 FINANCIAL REVIEW
POLICY OVERVIEW
Major FERC Initiatives 2006-2012
BUSINESS PRACTICE STANDARDS FOR ELECTRIC UTILITIESMAJOR PROPOSALS: RM05-5-000• FERCproposedtoincorporatebyreference
thefirstsetofstandardsforbusinesspracticeforelectricutilitiesdevelopedbytheWholeElectricQuadrant(WEQ)oftheNorthAmericanEnergyStandardsBoard(NAESB).TheproposedrulewouldincludeOASISbusinesspracticestandards,OASISstandardsandcommunicationsprotocolsandanOASISdictionary.FERCalsoproposedthateachelectricutility’sOATTincludetheapplicableWEQstandards.
• FERCfurtherproposedtoincorporatedefinitionsofdemandresponseresourcesinthedefinitionsofcertainancillaryservices,andlaterproposedtoincorporatestandardsthatidentifyoperationalinformationandperformanceevaluationmethods.
• FERCdidnotproposetoincorporateNAESB’sStandardsofConductstandards.
MAJOR IMPLICATIONS:• Eachelectricutility’sOATTmustincludethe
applicableWEQstandards.Forstandardsthatdonotrequireimplementingtariffrevisions,theutilitywouldbepermittedtoincorporatetheWEQstandardbyreferenceinitstariff.
• Onceincorporated,compliancewillbemandatoryforalljurisdictionalutilitiesandfornon-jurisdictionalutilitiesvoluntarilyfollowingFERC’sopenaccessrequirementsunderreciprocity.
FERC MILESTONES • April15,2010FERCissuedOrderNo.
676-FrevisingitsregulationstoincorporatebyreferencebusinesspracticestandardsforcertaindemandresponseservicesinwholesalemarketsadministeredbyRTO/ISOsadoptedbytheNorthAmericanEnergyStandardsBoard.Standards for Business Practices and Communications Protocols for Public Utilities,131FERC¶61,022(2010).
• February18,2010,FERCissuedanOrderclarifyingaspectsofOrderNo.676-Eanddenyingrehearing.StandardsforBusinessPracticesandCommunications Protocols for Public Utilities, 130 FERC ¶ 61,116 (2010).
• November24,2009,inDocketNo.RM05-5-13,FERCissuedOrderNo.676-Erevisingitsregulationstoincorporatebyreferencetheversion2.1ofcertainstandardsadoptedbytheNorthAmericanEnergyStandardsBoard.Standards for Business Practices and Communications Protocols for Public Utilities,129FERC¶61,162(2009).
• OnSeptember30,2008,inDocketNos.RM05-5-005andRM05-5-006,FERCissuedOrderNo.676-DwhichclarifiesOrderNo.
676-C.Standards for Business Practices and Communications Protocols for Public Utilities, 124FERC¶61,070(2008).
• OnJuly21,2008,inDocketNo.RM05-5-005,FERCissuedOrderNo.676-C,revisingitsregulationstoincorporatebyreferencethelatestversion(Version001)ofcertainstandardsadoptedbytheWholesaleElectricQuadrant(WEQ)oftheNorthAmericanEnergyStandardsBoard.Standards for Business Practices and Communications Protocols for Public Utilities, 124FERC¶61,070(2008).
• December20,2007,inDocketNos.RM96-1-028andRM05-5-001,FERCissuedOrderNo.698-AclarifyingOrderNo.698anddenyingrequestsforrehearing.Standards for Business Practices and Communications Protocols for Public Utilities,121FERC¶61,264(2007).
• June25,2007,inDocketNos.RM96-1-027andRM05-5-001,FERCissuedOrderNo.698,amendingitsopenaccessregulationsgoverningbusinesspracticesandelectroniccommunicationswithinterstategaspipelinesandpublicutilitiestoimprovecommunicationsschedulinggas-firedgeneratorsandincorporatingcertainNorthAmericanEnergyStandardsBoardregulations.Standards for Business Practices and Communications Protocols for Public Utilities,119FERC¶61,317(2007).
• April19,2007,inDocketNo.RM05-5-003,FERCissuedOrderNo.676-B,amendingitsregulationstoincorporate,byreference,revisionstotheCoordinateInterchangebusinesspracticestandardsadoptedbytheWholesaleElectricQuadrantoftheNorthAmericanStandardsBoardthatidentifyprocessesandcommunicationsnecessarytocoordinateenergytransfersacrossboundariesbetweenloadandgenerationbalancingentities. Standards for Business Practices and Communications Protocols for Public Utilities, 119FERC¶61,049(2007).
• February20,2007,inDocketNo.RM05-5-003,FERCissuedaNOPRproposingtoincorporatetheCoordinateInterchangebusinesspracticestandardsadoptedbytheWholesaleElectricQuadrantoftheNorthAmericanEnergyStandardsBoardintoFERC’sregulations.TheCoordinateInterchangestandardsidentifytheprocessesandcommunicationsnecessarytocoordinateenergytransfersbetweenloadandgenerationbalancingentities.Standards for Business Practices and Communications Protocols for Public Utilities,118FERC¶61,135(2007).
• September21,2006,inDocketNo.RM05-5-002,FERCissuedOrderNo.676-A,denyingrehearingofOrderNo.676.Standards for
Business Practices and Communications Protocols for Public Utilities,116FERC¶61,255(2006).
• April25,2006,FERCissuedOrderNo.676thatadoptsbyreferenceanumberoftheNAESBWEQbusinesspracticesstandards.Standards for Business Practices and Communications Protocols for Public Utilities, 115FERC¶61,102(2006).
• May9,2005,FERCissuedNOPRtoreviseitregulationstoincorporatebyreferencestandardsforbusinesspracticeforelectricutilitiesdevelopedbyWEQofNAESB.Standards for Business Practices and Communications Protocols for Public Utilities, 111FERC¶61,204(2005).
CREDIT REFORM IN ORGANIZED WHOLESALE MARKETS: DOCKET NO. RM10-13-000• FERCissuedaFinalRuleamendingits
regulationstoimprovethemanagementofriskanduseofcreditinorganizedwholesalemarkets.
MAJOR IMPLICATIONS:• EachRTOandISOwillberequiredtosubmit
tariffrevisionstocomplywiththefollowing:
• Establishbillingperiodsofnomorethansevendaysafterissuanceofbills;
• Reduceextensionofunsecuredcredittonomorethan$50millionpermarketparticipant,$100millionpercorporatefamily;
• EliminateunsecuredcreditforFTRpositions;
• Specificationofminimumparticipationcriteriatobeeligibletoparticipateintheorganizedwholesalemarket;
• SpecificationofconditionsunderwhichtheISO/RTOwillrequestadditionalcollateralduetoamaterialadversechange;and
• Limittotieperiodtopostadditionalcollateral.
FERC MILESTONES:• June16,2011,inDocketNo.RM10-13-002,
FERCissuedOrderNo.741-BreaffirmingitsdeterminationsinOrderNo.741-A.Credit Reforms In Organized Wholesale Markets,135FERC¶61,242(2011).
• February17,2011,inDocketNo.RM10-13-001,FERCissuedOrderNo.741-AdenyinginpartandgrantingrehearingandclarificationofOrderNo.741.Credit Reforms in Organized Markets,133FERC¶61,060(2010).
• October21,2010,inDocketNo.RM10-13-000,FERCissuedOrderNo.741.Credit Reforms in Organized Markets,133FERC¶61,060(2010).

EEI 2012 FINANCIAL REVIEW 91
POLICY OVERVIEW
DEMAND COMPENSATION IN ORGANIZED WHOLESALE ENERGY MARKETS: DOCKET NO. RM10-17-000• FERCissuedaFinalRuleamendingits
regulationstoensurethatwhenademandresponseresourcesparticipateinwholesaleenergymarketsadministeredbyRTOsandISOshasthecapabilitytobalancesupplyanddemandandwhendispatchofthatdemandresponseresourceiscost-effectiveasdeterminedbythenetbenefitstestdescribedintherule,thatdemandresponseresourceiscompensatedatthelocationalmarginalprice(LMP).
MAJOR IMPLICATIONS:• Demandresponseresourceswhichclear
intheday-aheadmarketwillreceivethemarket-clearingLMPascompenstionwhenitiscost-effectivetodosoasdeterminedbyanetbenefitstest.
• EachISO/RTOwillimplementanetbenefitstestdescribedintheordertodetermineifdemandresponseiscosteffective.
• ISO/RTOsaredirectedtoreviewtheirverificationrequirementstobesuretheycanverifythatdemandresponseresourceshaveperformed.
• RequireISO/RTOstomakecompliancefilingsdemonstratingthattheircurrentcostallocationmethodologiesappropriatelyallocatescoststothosethatbenefitorproposedrevisionsthatconformtothisrequirement.
FERC MILESTONES:• February29,2012,inDocketNo.RM10-
17-002,FERCissuedOrderNo.745-BreaffirmingitsdeterminationsinOrderNo.745-A.Demand Response Compensation in Organized Wholesale Markets, 138FERC¶61,148(2012).
• December15,2011,inDocketNo.RM10-17-001,FERCissuedOrderNo.745-AgrantingclarificationtothelimitedextentofaddressingtheapplicabilityofOrderNo.745tocircumstanceswhenitisnotcost-effectivetodispatchdemandresponseresources.Demand Response Compensation in Organized Wholesale Markets,137FERC¶61,215(2011).
• March15,2011,FERCissuedOrderNo.745inDocketNo.RM10-17-000.Demand Response Compensation in Organized Wholesale Markets,134FERC¶61,187(2011).
FREQUENCY REGULATION COMPENSATION IN THE ORGANIZED WHOLESALE POWER MARKETSMAJOR PROPOSALS: DOCKET NOS: RM11-7-000 AND AD10-11-000• Foundthatcurrentcompensationmethods
forregulationserviceinRTOandISOmarketsfailtoacknowledgetheinherentlygreateramountoffrequencyregulationservicebeing
providedbyfaster-rampingresources.Inaddition,certainpracticesofsomeRTOsandISOsresultineconomicallyinefficienteconomicdispatchoffrequencyregulationresources.
• FERCrequiresRTOsandISOstocompensatefrequencyregulationresourcesbasedontheactualserviceprovided,includingacapacitypaymentthatincludesthemarginalunit’sopportunitycostsandapaymentforperformancethatreflectsthequantityoffrequencyregulationserviceprovidedbyaresourcewhentheresourceisaccuratelyfollowingthedispatchsignal.
MAJOR IMPLICATIONS:• RequiresthatallRTOsandISOswith
centrallyprocuredfrequencyregulationresourcesmustprovideformarginalresource’sopportunitycostsintheirtariffs.Further,thisuniformclearingpricemustbemarket-based,derivedfrommarket-participantbasedbidsfortheprovisionoffrequencyregulationcapacity.
• RTOsandISOsarerequiredtocalculatecross-productopportunitycosts,whichreflecttheforegoneopportunitytoparticipateintheenergyorancillaryservicesmarkets,andincludeitineachresource’soffertosupplyfrequencyregulationcapacity,forusewhendeterminingthemarketclearingpriceandwhichresourcesclear.
• RTOsandISOsmayallowforinter-temporalopportunitycoststobeincludedinaresource’soffertosellfrequencyregulationservice,withtherequirementthatthecostsbeverifiable.
• FERCrequiresuseofamarket-basedprice,ratherthananadministratively-determinedprice,onwhichtobasethefrequencyregulationperformancepayment.
• RTOsandISOsarerequiredtoaccountforfrequencyregulationresources’accuracyinfollowingtheAutomaticGeneratorControldispatchsignalwhendeterminingtheperformancepaymentcompensation.However,FERCwillnotmandateacertainmethodforhowaccuracyismeasured.
FERC MILESTONES:• February16,2012,inDocketNo.RM11-7-
001andAD10-11-001,FERCissuedOrderNo.755-AreaffirmingitsdeterminationsinOrderNo.755.Frequency Regulation Compensation in the Organized Wholesale Power Markets,138FERC¶61,123(2012).
• October20,2011,FERCissuedOrderNo.755inDocketNo.RM11-7-000.Frequency Regulation Compensation in the Organized Wholesale Power Markets,137FERC¶61,064(2011).
LONG-TERM TRANSMISSION RIGHTSMAJOR PROPOSALS: DOCKET NOS. RM06-8-000 AND AD05-7-000• FERCadoptedsevenofeightproposed
guidelinesforindependenttransmissionorganizationstofollowindevelopingaframeworkforprovidinglong-termfirmtransmissionrights(LTFTRs)inorganizedelectricitymarkets.
• FERCproposedtoallowforregionalflexibilitytoaccountfordifferentmarketdesignsandregionaldifferenceswhendevelopingtheframeworkforLTFTRs.
• FERCproposedthatLTFTRswouldberequiredtobeavailablewithtermlengthssufficienttomeettheneedsofload-servingentitieswithlong-termpowersupplyarrangements(eitherexistingorplanned)usedtomeettheirserviceobligations.
• FERCrequiredtransmissionorganizationssubjecttotheruletoeitherfiletariffsheetsmakingLTFTRsavailablewhichsatisfythesevencriteria,orfileanexplanationofhowcurrenttariffsheetsandrateschedulesmeetthesecriteria.
MAJOR IMPLICATIONS:• FERCwouldrequirethatLTFTRsbeavailable
toentitiesthatpayforupgradesorbuildexpansions.
• IfatransmissionorganizationcannotaccommodateallrequestsforLTFTRsoverexistingtransmissioncapacity,FERCwouldrequirethatpreferencebegiventoload-servingentitieswithlong-termpowersupplyarrangementsusedtomeetserviceobligations.
FERC MILESTONES:• March20,2009,InDocketNo.RM06-8-
002,FERCissuedOrderNo.681-B,grantingcertainclarificationsconcerningallocationoflong-termfirmtransmissionrightstoexternalloadservingentitiesanddenyrequestsforrehearing.Long-Term Firm Transmission Rights in Organized Electricity Markets,126FERC¶61,254(2009).
• February25,2008,inDocketNos.ER07-476-000andRM06-8-000,FERCacceptedinpartandrejectedinpartthecompliancefilingofISO-NEandNewEnglandPowerPoolproposingamendmentstotheISO-NEOATT.Long-Term Firm Transmission Rights in Organized Electricity Markets,122FERC¶61,173(2008).
• February4,2007,inDocketNo.ER07-521-000,theNewYorkIndependentSystemOperator,Inc.,submittedacompliancefilinginresponsetoOrderNos.681and681-A.
• January29,2007,inDocketNo.ER07-475-000,theCaliforniaIndependentSystemOperatorCorporationsubmittedacompliancefilinginresponsetoOrderNos.681and681-A.
92 EEI 2012 FINANCIAL REVIEW
POLICY OVERVIEW
• January29,2007,inDocketNo.ER07-476-000,theISONewEngland,Inc.,submittedacompliancefilinginresponsetoOrderNos.681and681-A.
• November16,2006,inDocketNo.RM06-8-001,FERCissuedOrderNo.681-A,clarifyinganddenyingrehearingofOrderNo.681.Long-Term Firm Transmission Rights in Organized Electricity Markets,117FERC¶61,201(2006).
• July20,2006,inDocketNo.RM06-8-000,FERCissuedOrderNo.681approvingsevenoftheeightproposedguidelinesforindependenttransmissionorganizationstofollowindevelopingproposalsforprovidinglong-termfirmtransmissionrights.Long-Term Firm Transmission Rights in Organized Electricity Markets,116FERC¶61,077(2006).
• February2,2006,FERCissuedNOPR,inDocketNo.RM06-8-000,proposingeightguidelinesforindependenttransmissionorganizationstofollowindevelopingaframeworkforprovidinglong-termfirmtransmissionrightsinorganizedelectricitymarkets. Long-Term Firm Transmission Rights in Organized Electricity Markets,114FERC¶61,097(2006).
• May11,2005,inDocketNo.AD05-7-000,FERCissuednoticeinvitingcommentsonestablishinglong-termtransmissionrightsinmarketswithlocationalpricing. Notice Inviting Comments On Establishing Long-Term Transmission Rights in Markets With Locational Pricing and Staff Paper, Long-Term Transmission Rights Assessment,DocketNo.AD05-7-000(May11,2005).
OATT REFORMMAJOR PROPOSALS: DOCKET NO. RM05-25-000• FERChasindicateditspreliminaryview
isthattheOATTshouldbereformedtoreflectlessonslearnedinnearlyadecadeofexperiencewithopenaccesstransmissionservice.
• FERChasindicatedconcernthatthepublicutilities’OATTshavebeenimplementedinvariousways,andgreaterclarificationandotherreformsoftheOATTmaybenecessarytoavoidunduediscriminationorpreferentialtermsandconditions.
MAJOR IMPLICATIONS:• Thefinalruleacknowledgesthatitisbestto
continuetorequirefunctionalunbundlingratherthancorporateunbundling,andFERCdeclinedtoentertainproposalsthatwouldhaverequiredstructuralchangesorthatmighthaverequiredthecreationofnewmarketstructures.
• ThefinalruledeemsthatindustryconsensusisthebestmeanstodevelopconsistentandtransparentmethodsforcalculatingAvailableTransferCapability(ATC)inordertoaddress
concernsoverdenialsoftransmissionservice.
• Thefinalruletakesaprincipled,non-prescriptiveapproachtoopen,coordinated,andtransparenttransmissionplanning.FERCacknowledgedtheimportanceofbothregionalandlocalplanningprocesses,andagreedwithEEIthatatransmissionprovidermusthavetheultimateauthorityonitstransmissionplananditscommitmenttobuildtransmissionfacilities.Moreover,thefinalrulerecognizesthatitisnotnecessarytoimposeathird-partyentitytoconducttransmissionplanningandthattransmissionprovidersmustbeabletorecoverthecostsofplanning.
• Thefundamentalstructureoftransmissionservices(network/point-to-point)ismaintained.However,thefinalrulerecognizesthatitisnotnecessarytomandatetheprovisionofhourlyfirmtransmissionserviceandthattransmissionprovidersonlymustprovideplanningredispatchandconditionalfirmservicewhendoingsowouldnotimpairreliability(orifplanningredispatchwouldinterferewithexistingfirmservice).
• Thefinalrulemakestransmissionplanningmorerational;transmissioncustomersmusttakeatermofserviceforfiveyearsinordertoobtaintherighttorollovertheirserviceforanadditionaltermoffiveyears.Transmissioncustomersmustprovideatleastoneyear’snoticethattheywillrollovertheirservice.
• FERCrequiredrules,standardsandpracticesgoverningtransmissionservicetobeincludedinpublicutilityOATTs,thussubjecttoFERCfiling,noticeandcomment,andFERCreview.
FERC MILESTONES:• November19,2009,inDocketNos.
RM05-17-005andRM05-25-005,FERCissuedOrderNo.890-D,affirmingitsdeterminationsinpreviousordersandclarifyingtherequirementtoun-designatenetworkresourcesusedtoserveoff-systemsales.Preventing Undue Discrimination and Preference in Transmission Services,129FERC¶61,126(2009).
• March19,2009,inDocketNos.RM05-17-004andRM05-25-004,FERCissuedOrderNo.890-Cclarificationofthedegreeofconsistencyrequiredinthecalculationofavailabletransfercapabilitybytransmissionprovidersanddeniesrehearingregardingtherequirementtoundesignatenetworkresourcesusedtoserveoff-systemsales.Preventing Undue Discrimination and Preference in Transmission Services,123FERC¶61,299(2008).
• June23,2008,inDocketNos.RM05-17-003andRM05-25-003,FERCissuedOrderNo.890-Bclarifyingthedegreeofconsistencyrequiredinthecalculationofavailabletransfercapabilitybytransmission
providersanddeniesrehearingregardingtherequirementtoundesignatenetworkresourcesusedtoserveoff-systemsales.Preventing Undue Discrimination and Preference in Transmission Services,123FERC¶61,299(2008).
• December28,2007,inDocketNos.RM05-17-001and002andRM05-25-000,FERCissuedOrderNo.890-A,grantingrequestsforrehearingandclarificationtostrengthentheproformaOATTtoensureitpreventsunduediscrimination,toprovidereducedopportunitiesforunduediscrimination,andtoincreasetransparency.Preventing Undue Discrimination and Preference in Transmission Services,121FERC¶61,297(2007).
• February16,2007,inDocketNos.RM05-17-000andRM05-25-000,FERCissuedOrderNo.890,FinalRule. Preventing Undue Discrimination and Preference in Transmission Services,118FERC¶61,119(2007).
• September19,2005,inDocketNo.RM05-25-000,FERCissuedNoticeofInquiryinvitingcomments(andaskingover100questions)ontheneedtoreformtheOrderNo.888OATTandpublicutilities’OATTstoensuretheprovisionoftariffedtransmissionserviceisjustandreasonable. Preventing Undue Discrimination and Preference in Transmission Services,112FERC¶61,299(2005).
RELIABILITY: ESTABLISHMENT OF RULES CONCERNING CERTIFICATION OF THE ELECTRIC RELIABILITY ORGANIZATION; AND PROCEDURES FOR THE ESTABLISHMENT, APPROVAL, AND ENFORCEMENT OF ELECTRIC RELIABILITY STANDARDS MAJOR PROPOSALS: DOCKET NOS. AD06-6-000, RM01-10-000, RM05-30-000, AND RM06-16-000• PursuanttoEPAct2005,FERCproposed
criteriafortheestablishmentofanElectricReliabilityOrganization(ERO)thatwillenforcereliabilitystandardsundertheregulatoryreviewofFERC.
• FERCacceptedNERC’sdefinitionofBulkPowerSystemoverthedefinitionproposedintheNOPRinordertopreventuncertaintyinthemarkets.
• FERCdirectedNERCtouseitscomplianceregistryprocesstoensuretherearenogapsorredundanciesamongtheentitiesresponsibleforspecificreliabilitycriteria.
• FERCdeclinedtoadoptatrialperiodduringwhichpenaltieswillnotbeenforced.InsteadFERCdirectedNERCtoinitiateenforcementactionsonlyinthecaseofthemostegregiousviolationsofthestandardsthroughDecember31,2007.

EEI 2012 FINANCIAL REVIEW 93
POLICY OVERVIEW
MAJOR IMPLICATIONS:• Establishesanewnationalregimeof
mandatoryreliabilitystandardssubjecttoFERCreviewandoversight.Compliancewithreliabilitystandardsbecomealegalrequirementsubjecttosubstantialcivilpenalties.
• Establishesaprocessforcertifyingasingle,independentERO.EROmustdemonstrateindependencefromusers,ownersandoperatorswhileassuringfairstakeholderrepresentationinkeyareas.
• Providessomeregionalflexibilityandvariabilitybyallowing“regionalentities”toproposereliabilitystandardsthroughtheERO,andallowtheEROtodelegatecompliancemonitoringandenforcementtoregionalentities.ThedelegationissubjecttoFERCapprovalandperiodicreview.
• EachproposedreliabilitystandardmustbesubmittedbytheEROtoFERCforapprovalonacase-by-casebasis.FERCwillnotdefertotheEROoraRegionalEntitywithrespecttotheeffectofaproposedReliabilityStandardoncompetition.FERCmayremandtotheEROforfurtherconsiderationaproposedReliabilityStandardthatFERCdisapproves.
• TheFinalRuleprovidesaprocessforuser,owneroroperatorofthetransmissionfacilitiesofaTransmissionOrganizationtonotifyFERCofapossibleconflictforatimelyresolutionbyFERC.
• TheEROoraRegionalEntitythatisdelegatedenforcementauthoritymayimposeapenaltyonauser,owneroroperatoroftheBulk-PowerSystemforaviolationofaReliabilityStandard.TheFinalRuleestablishesasingleappealattheEROorRegionalEntityleveltoensureinternalconsistencyintheimpositionofpenaltiesbytheEROortheRegionalEntity.
FERC MILESTONES:• March16,2007,FERCissuedOrderNo.
693,FinalRuleregardingMandatoryReliabilityStandardsfortheBulk-PowerSystemwhichapproved83ofthe107mandatoryreliabilitystandardsproposedbyNERC.Mandatory Reliability Standards for the Bulk-Power System,118FERC¶61,218(2007).
• April18,2006,FERCissuedanoticeannouncingrulemakingprocessforprocessingtheproposedReliabilityStandardssubmittedbyNERC.Mandatory Reliability Standards for the Bulk-Power System,115FERC¶61,060(2006).
• March30,2006,FERCissuedOrderNo.672-AwhichreaffirmeditsdeterminationsinOrderNo.672concerningtherulesfortheEROandproceduresforelectricreliabilitystandards,butclarifiedcertainprovisions,
andgrantedrehearinginpartregardingTransmissionOrganizationoptionsincasesofpotentialconflictsofaReliabilityStandardwithaFERCorder. Rules Concerning Certification of the Electric Reliability Organization; and Procedures for the Establishment, Approval, and Enforcement of Electric Reliability Standards,114FERC¶61,328(2006).
• February3,2006,FERCissuedOrderNo.672toimplementprovisionsinEPAct2005byestablishingcriteriathatanentitymustsatisfytoqualifyasanERO.TheFinalRulealsoestablishesproceduresunderwhichtheEROmayproposenewormodifiedReliabilityStandardsforFERCreviewandproceduresgoverninganenforcementactionforviolationofaReliabilityStandard.Rules Concerning Certification of the Electric Reliability Organization; and Procedures for the Establishment, Approval, and Enforcement of Electric Reliability Standards,114FERC¶61,104(2006).
• September1,2005,FERCissuedanoticeofproposedrulemakingondevelopingandimplementingtheprocessesandproceduresunderEPAct2005fortheCommissiontodevelopandundertakewithregardtotheformationandfunctionsoftheEROandRegionalEntities.Rules Concerning Certification of the Electric Reliability Organization; and Procedures for the Establishment, Approval, and Enforcement of Electric Reliability Standards,112FERC¶61,239(2005).
STANDARDS OF CONDUCTMAJOR PROPOSALS: DOCKET NO. RM01-10-000; RM07-1-000• FERChasconductedtechnicalconferences
andworkshopstodiscussStandardsofConductforTransmissionProvidersunderOrderNo.2004.
• FERChasproposedpermanentregulationsregardingthestandardsofconductconsistentwiththedecisionsoftheU.S.CourtofAppealsoftheDistrictofColumbiainNational Fuel Gas Supply Corp. v. FERC,468F.3d831(2006),regardingnaturalgaspipelines.FERCissolicitingcommentsregardingcomparablechangesforelectricutilitytransmissionproviders:specifically,whetherornotthestandardsofconductshouldgoverntherelationshipbetweenelectricutilitytransmissionprovidersandtheirenergyaffiliate.
MAJOR IMPLICATIONS:• Transmissionprovidersarepermittedto
communicateessentialinformationtoaffiliatedandnon-affiliatednuclearpowerplantstopreservepowergridreliability.
FERC MILESTONES:• April8,2011,inDocketNo.RM07-1-003,
FERCissuedOrderNo.717-D,clarifyingthat
anemployeewhoperofrmsasystemimpactstudyreatransmissionsservicerequest,thatpersonisatransmissionfunctionemployee.Standards of Conduct for Transmission Providers,135FERC¶61,017(2011).
• April16,2010,inDocketNo.RM07-1-002,FERCissuedOrderNo.717-C,furtherclarifying“marketingfunctionemployee.”Standards of Conduct for Transmission Providers,129FERC¶61,045(2010).
• November16,2009,inDocketNo.RM07-1-002,FERCissuedOrderNo.717-B,clarifyingwhetheranemployeewhoisnotmakingbusinessdecisionsaboutcontractnon-pricetermsandconditionsisconsidereda“marketingfunctionemployee.”Standards of Conduct for Transmission Providers,129FERC¶61,123(2009).
• October15,2009,inDocketNo.RM07-1-001,FERCissuedOrderNo.717-A,clarifying:1)theapplicabilityoftheStandardsofConducttotransmissionownerswithnomarketingaffiliatetransactions;2)whethertheIndependentFunctioningRuleappliestobalancingauthorityemployees;3)whichactivitiesoftransmissionormarketingfunctionemployeesaresubjecttotheRule;4)whetherlocaldistributioncompaniesmakingoff-systemsalesonnonaffiliatedpipepipelinesaresubjecttotheStandards;5)WhethertheStandarsapplytoapipeline’ssaleofitsownproduction;6)applicabilityoftheStandardstoassetmanagementagreements;7)whetherincidentalpurchasestoremaininbalanceorsalesofunneededgassupplysubjectthecompanytotheStandards;8)applicabilityoftheNoConduitRule;and9)applicabilityoftheTransparencyRule.Standards of Conduct for Transmission Providers,129FERC¶61,043(2009).
• October16,2008,inDocketNo.RM07-1-000,FERCissuedOrderNo.717,amendingitsregulationsadoptedonaninterimbasisinOrderNo.690,inordertomakethemclearerandtorefocustherulesontheareaswherethereisthegreatestpotentialforabuse.TheFinalRuleisdesignedto(1)fostercompliance,(2)facilitateCommissionenforcement,and(3)conformtheStandardsofConducttothedecisionoftheU.S.CourtofAppealsfortheD.C.CircuitinNational Fuel Gas Supply Corporation v. FERC,468F.3d831(D.C.Cir.2006).Specifically,theFinalRuleeliminatestheconceptofenergyaffiliatesandeliminatesthecorporateseparationapproachinfavoroftheemployeefunctionalapproachusedinOrderNos.497and889.Standards of Conduct for Transmission Providers,125FERC¶61,064(2008).
• March21,2008,inDocketNo.RM07-1-000,FERCissuedaNoticeofProposedRulemakingproposingtoreviseitsStandardsofConductfortransmissionproviderstomakethemclearerandtorefocustherules
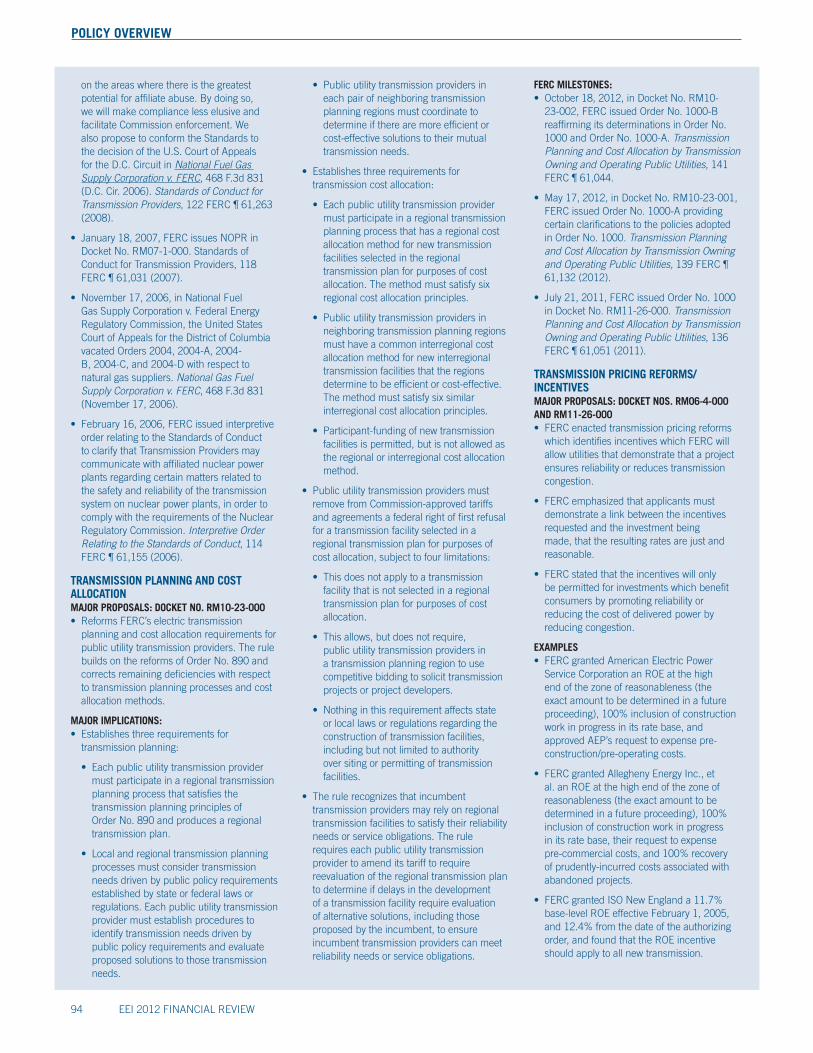
94 EEI 2012 FINANCIAL REVIEW
POLICY OVERVIEW
ontheareaswherethereisthegreatestpotentialforaffiliateabuse.Bydoingso,wewillmakecompliancelesselusiveandfacilitateCommissionenforcement.WealsoproposetoconformtheStandardstothedecisionoftheU.S.CourtofAppealsfortheD.C.CircuitinNational Fuel Gas Supply Corporation v. FERC,468F.3d831(D.C.Cir.2006).Standards of Conduct for Transmission Providers,122FERC¶61,263(2008).
• January18,2007,FERCissuesNOPRinDocketNo.RM07-1-000.StandardsofConductforTransmissionProviders,118FERC¶61,031(2007).
• November17,2006,inNationalFuelGasSupplyCorporationv.FederalEnergyRegulatoryCommission,theUnitedStatesCourtofAppealsfortheDistrictofColumbiavacatedOrders2004,2004-A,2004-B,2004-C,and2004-Dwithrespecttonaturalgassuppliers.National Gas Fuel Supply Corporation v. FERC,468F.3d831(November17,2006).
• February16,2006,FERCissuedinterpretiveorderrelatingtotheStandardsofConducttoclarifythatTransmissionProvidersmaycommunicatewithaffiliatednuclearpowerplantsregardingcertainmattersrelatedtothesafetyandreliabilityofthetransmissionsystemonnuclearpowerplants,inordertocomplywiththerequirementsoftheNuclearRegulatoryCommission.Interpretive Order Relating to the Standards of Conduct,114FERC¶61,155(2006).
TRANSMISSION PLANNING AND COST ALLOCATIONMAJOR PROPOSALS: DOCKET NO. RM10-23-000• ReformsFERC’selectrictransmission
planningandcostallocationrequirementsforpublicutilitytransmissionproviders.TherulebuildsonthereformsofOrderNo.890andcorrectsremainingdeficiencieswithrespecttotransmissionplanningprocessesandcostallocationmethods.
MAJOR IMPLICATIONS:• Establishesthreerequirementsfor
transmissionplanning:
• EachpublicutilitytransmissionprovidermustparticipateinaregionaltransmissionplanningprocessthatsatisfiesthetransmissionplanningprinciplesofOrderNo.890andproducesaregionaltransmissionplan.
• Localandregionaltransmissionplanningprocessesmustconsidertransmissionneedsdrivenbypublicpolicyrequirementsestablishedbystateorfederallawsorregulations.Eachpublicutilitytransmissionprovidermustestablishprocedurestoidentifytransmissionneedsdrivenbypublicpolicyrequirementsandevaluateproposedsolutionstothosetransmissionneeds.
• Publicutilitytransmissionprovidersineachpairofneighboringtransmissionplanningregionsmustcoordinatetodetermineiftherearemoreefficientorcost-effectivesolutionstotheirmutualtransmissionneeds.
• Establishesthreerequirementsfortransmissioncostallocation:
• Eachpublicutilitytransmissionprovidermustparticipateinaregionaltransmissionplanningprocessthathasaregionalcostallocationmethodfornewtransmissionfacilitiesselectedintheregionaltransmissionplanforpurposesofcostallocation.Themethodmustsatisfysixregionalcostallocationprinciples.
• Publicutilitytransmissionprovidersinneighboringtransmissionplanningregionsmusthaveacommoninterregionalcostallocationmethodfornewinterregionaltransmissionfacilitiesthattheregionsdeterminetobeefficientorcost-effective.Themethodmustsatisfysixsimilarinterregionalcostallocationprinciples.
• Participant-fundingofnewtransmissionfacilitiesispermitted,butisnotallowedastheregionalorinterregionalcostallocationmethod.
• PublicutilitytransmissionprovidersmustremovefromCommission-approvedtariffsandagreementsafederalrightoffirstrefusalforatransmissionfacilityselectedinaregionaltransmissionplanforpurposesofcostallocation,subjecttofourlimitations:
• Thisdoesnotapplytoatransmissionfacilitythatisnotselectedinaregionaltransmissionplanforpurposesofcostallocation.
• Thisallows,butdoesnotrequire,publicutilitytransmissionprovidersinatransmissionplanningregiontousecompetitivebiddingtosolicittransmissionprojectsorprojectdevelopers.
• Nothinginthisrequirementaffectsstateorlocallawsorregulationsregardingtheconstructionoftransmissionfacilities,includingbutnotlimitedtoauthorityoversitingorpermittingoftransmissionfacilities.
• Therulerecognizesthatincumbenttransmissionprovidersmayrelyonregionaltransmissionfacilitiestosatisfytheirreliabilityneedsorserviceobligations.Therulerequireseachpublicutilitytransmissionprovidertoamenditstarifftorequirereevaluationoftheregionaltransmissionplantodetermineifdelaysinthedevelopmentofatransmissionfacilityrequireevaluationofalternativesolutions,includingthoseproposedbytheincumbent,toensureincumbenttransmissionproviderscanmeetreliabilityneedsorserviceobligations.
FERC MILESTONES:• October18,2012,inDocketNo.RM10-
23-002,FERCissuedOrderNo.1000-BreaffirmingitsdeterminationsinOrderNo.1000andOrderNo.1000-A.Transmission Planning and Cost Allocation by Transmission Owning and Operating Public Utilities,141FERC¶61,044.
• May17,2012,inDocketNo.RM10-23-001,FERCissuedOrderNo.1000-AprovidingcertainclarificationstothepoliciesadoptedinOrderNo.1000.Transmission Planning and Cost Allocation by Transmission Owning and Operating Public Utilities, 139FERC¶61,132(2012).
• July21,2011,FERCissuedOrderNo.1000inDocketNo.RM11-26-000.Transmission Planning and Cost Allocation by Transmission Owning and Operating Public Utilities,136FERC¶61,051(2011).
TRANSMISSION PRICING REFORMS/INCENTIVESMAJOR PROPOSALS: DOCKET NOS. RM06-4-000 AND RM11-26-000• FERCenactedtransmissionpricingreforms
whichidentifiesincentiveswhichFERCwillallowutilitiesthatdemonstratethataprojectensuresreliabilityorreducestransmissioncongestion.
• FERCemphasizedthatapplicantsmustdemonstratealinkbetweentheincentivesrequestedandtheinvestmentbeingmade,thattheresultingratesarejustandreasonable.
• FERCstatedthattheincentiveswillonlybepermittedforinvestmentswhichbenefitconsumersbypromotingreliabilityorreducingthecostofdeliveredpowerbyreducingcongestion.
EXAMPLES• FERCgrantedAmericanElectricPower
ServiceCorporationanROEatthehighendofthezoneofreasonableness(theexactamounttobedeterminedinafutureproceeding),100%inclusionofconstructionworkinprogressinitsratebase,andapprovedAEP’srequesttoexpensepre-construction/pre-operatingcosts.
• FERCgrantedAlleghenyEnergyInc.,etal.anROEatthehighendofthezoneofreasonableness(theexactamounttobedeterminedinafutureproceeding),100%inclusionofconstructionworkinprogressinitsratebase,theirrequesttoexpensepre-commercialcosts,and100%recoveryofprudently-incurredcostsassociatedwithabandonedprojects.
• FERCgrantedISONewEnglanda11.7%base-levelROEeffectiveFebruary1,2005,and12.4%fromthedateoftheauthorizingorder,andfoundthattheROEincentiveshouldapplytoallnewtransmission.

EEI 2012 FINANCIAL REVIEW 95
POLICY OVERVIEW
• FERCconditionallygrantedDusquesneLightCompanyanROEof100basispoints,subjecttoahearing,100%inclusionofconstructionworkinprogressinitsratebase,and100%recoveryofprudently-incurredcostsassociatedwithabandonedprojects.
MAJOR IMPLICATIONS:• Incentivesavailablefortraditionalutilities
aswellasadditionalincentivesforstand-alonetransmissioncompanies,ortranscos,thatinclude:(a)arateofreturnonequitysufficienttoattractnewinvestment;(b)arecoveryinratebaseof100%ofprudentlyincurredtransmission-relatedconstructionworkinprogress(CWIP)toincreasecashflow;(c)allowinghypotheticalcapitalstructurestoprovidetheflexibilityneededtomaintainviabilityofnewcapacityprojects;(d)acceleratingrecoveryofdepreciationexpense;(e)recoveryofallprudentdevelopmentcostsincaseswhereconstructionoffacilitiesmaybeabandonedorcanceledduetocircumstancesbeyondthecontroloftheutility;(f)allowingdeferredcostrecovery;and(g)providingahigherrateofreturnonequityforutilitiesthatjointransmissionorganizations.
• Apublicutilitywouldhavetodemonstratethatthenewfacilitieswouldimproveregionalreliabilityandreducetransmissioncongestioninorderforittoreceiveanincentivebasedrateofreturnonequity.
• Theruleallowsforrecoveryofcostsassociatedwithjoiningatransmissionorganization,electricreliabilityorganizationsandinfrastructuredevelopmentinNationalInterestTransmissionCorridors.
• Inordertoencouragetheformationoftranscos,FERCauthorizedtranscostoproposeanacquisitionpremium,andanAccumulatedDeferredIncomeTaxesincentiveforcompaniessellingtransmissionassetstoatransco.FERCstatedthatitwouldallowareturnonequity(ROE)sufficienttoencouragetranscoformation,andthatprovisionoftheROEincentivewouldnotprecludeatranscofromseekingotherapprovedincentives.
FERC MILESTONES:• Forinformationregardingspecificrequests
forincentive-basedratetreatments,pleaseseeFERC’sTransmissionInvestmentOrderspage:https://www.ferc.gov/industries/electric/indus-act/trans-invest/orders.asp
• November15,2012,inDocketNo.RM11-26-000,FERCissueditsPolicyStatementonPromotingTransmissionThroughPricingReformbyclarifyingthatitwouldnolongerrelyonthe“routinevs.non-routine”analysisaspartofitsnexustestandthusrequiredapplicantstodemonstratethatthetotalpackageofincentivesrequestedistailoredtoaddressdemonstrablerisksandchallenges.TheCommissionalsoexpects
incentivesapplicantstoseektoreducetheriskoftransmissioninvestmentnototherwiseaccountedforinitsbaseROEbyusingrisk-reducingincentivesbeforeseekinganincentiveROEbasedonaproject’srisksandchallenges.Promoting Transmission Through Pricing Reform,141FERC¶61,129(2012).
• May19,2011,inDocketNo.RM11-26-000,FERCissuedaNoticeofInquirygiventhechangesintheelectricindustry,theCommission’sexperiencetodateapplyingOrderNo.679,andtheongoingneedtoensurethatincentivesregulationsandpoliciesareencouragingthedevelopmentoftransmissioninfrastructure.Promoting Transmission Investment Through Pricing Reform,135FERC¶61,146(2011).
• December21,2010,inDocketNos.PA11-11-000,PA11-13-000andPA11-14-000respectively,FERCannounceditwouldauditcompliancewithOrderNos.679,679-Aand679-B,andtheconditionsplacedwhenFERCgrantedincentives.
• April19,2007,inDocketNo.RM06-4-002,FERCissuedOrderNo.679-B,denyingrehearingandclarifyingOrderNo.679-A.Promoting Transmission Investment Through Pricing Reform,119FERC¶61,062(2007).
• December22,2006,inDocketNo.RM06-4-001,FERCissuedOrderNo.679-A,reaffirminginpartandgrantingrehearinginpartofOrderNo.679.
• July20,2006,inDocketNo.RM06-4-000,FERCissuedOrderNo.679,Promoting Transmission Investment Through Pricing Reform,116FERC¶61,199(2006).
• November18,2005,inDocketNo.RM06-4-000,FERCissuedaNOPRtoamenditsregulationstoestablishincentive-basedratetreatmentsfortransmissionofelectricenergyininterstatecommercebypublicutilities.Promoting Transmission Investment through Pricing Reform,113FERC¶61,182(2005).
MARKET-BASED RATES FOR WHOLESALE SALES OF ELECTRIC ENERGY, CAPACITY AND ANCILLARY SERVICES BY PUBLIC UTILITIESMAJOR PROPOSALS: DOCKET NO. RM04-7-000• Replacesexistingfour-pronganalysiswitha
two-parttestcoveringhorizontalandverticalmarketpower.
• Currentinterimmarketpowerscreenswouldbemadeapermanentpartofthehorizontal(generation)marketpoweranalysis.
• Newly-constructedgenerationwouldnolongerbeexemptedfromthemarketpoweranalysis.
• Provideforastandardmarket-basedratetariffofgeneralapplicability.
• “Affiliateabuse”wouldceasetobeaseparateprongofthemarketpoweranalysis,buttheCommissionproposedtocodify
existingpoliciesgoverningsalesbetweenpublicutilitiesandaffiliatedentities.
• Certainsmallpowersellerswouldnotberequiredtosubmitregularlyscheduledtriennialreviews;otherholdersofMBRauthoritywouldfiletriennialreviewsonascheduleorganizedbyregions.
MAJORIMPLICATIONS:• Thenativeloadproxyformarketpower
screenswouldbechangedfromtheminimumpeakdayintheseasontotheaveragepeaknativeload.
• TheDeliveredPriceTestwouldberetainedforcompaniesfailingtheinitialmarketpowerscreens.
• MaintaininganOpenAccessTransmissionTariff(OATT)wouldcontinuetobesufficienttomitigateanyverticalmarketpower;violationsoftheOATTmaybegroundsforrevocationofMBRauthority.
• Considerationof“otherbarrierstoentry”wouldbeconsideredaspartoftheverticalmarketpowerassessment.
• Bothlargerandsmallsellerswouldremainundertherequirementtofilechangeinstatusreports.
• Corporateentitieswouldhaveasingle,consolidatedMBRtariff.
FERCMILESTONES:• March18,2010,inDocketNo.RM04-7-
008,FERCissuedOrderNo.697-D,grantinginpartyanddenyinginpartrequestsforrehearingofOrderNo.697-C.Market-Based Rates for Wholesale Sales of Electric Energy, Capacity and Ancillary Services by Public Utilities,130FERC¶61,206(2010).
• June18,2009,inDocketNo.RM04-7-006,FERCissuedOrderNo697-C,grantinginpartyanddenyinginpartrequestsforclarificationofOrderNo.697-B.Market-Based Rates for Wholesale Sales of Electric Energy, Capacity and Ancillary Services by Public Utilities,127FERC¶61,284(2009).
• December19,2008,inDocketNo.RM04-7-005,FERCissuedOrderNo.697-Bgrantingrehearingandclarificationregardingcertainrevisionstoitsregulationsandtothestandardsforobtainingandretainingmarket-basedrateauthorityforsalesofenergy,capacityandancillaryservicestoensurethatsuchsalesarejustandreasonable.Market-Based Rates for Wholesale Sales of Electric Energy, Capacity and Ancillary Services by Public Utilities,125FERC¶61,326(2008).
• April21,2008,inDocketNo.RM04-7-001,FERCissuedOrderNo.697-Agrantingrehearingandclarificationregardingcertainrevisionstoitsregulationsandtothestandardsforobtainingandretainingmarket-basedrateauthorityforsalesofenergy,capacityandancillaryservicestoensurethat
96 EEI 2012 FINANCIAL REVIEW
POLICY OVERVIEW
• TheNOPRproposestorequireRTOstosupportlong-termpowercontractingbyallowingmarketparticipantstopostoffersontheirwebsite.
• TheNOPRproposestoexpandtherulesregardingtheMarketMonitoringUnit’s(MMU)interactionwiththeirRT,requiretheRTOtomateriallysupporttheMMU,removetheMMUfromtariffadministration,andreducetimeperiodbeforeenergybidandofferdataarereleasedtothepublic.
• TheNOPRproposescriteriatoensureRTOresponsivenesstocustomersandstakeholders,suchas:inclusiveness,fairnessinbalancingdiverseinterests,representationofminoritypositionsandongoingresponsiveness.
FERC MILESTONES:• December17,2009,inDocketNo.RM07-
19-002,FERCIssuedOrderNo.719.BaffirmingitsdeterminationsinOrdersNos.719and719-A.Wholesale Competition in Regions with Organized Electric Markets,129FERC¶61,252(2009).
• July16,2009,inDocketNo.RM07-19-001,FERCissuedOrderNo719-A,affirmingandgrantingclarificationofOrderNo.719.Wholesale Competition in Regions with Organized Electric Markets,128FERC¶61,059(2009).
• October17,2008,inDocketNos.AD07-7-000andRM07-19-000,FERCissuedOrderNo.719amendingitsregulationsundertheFederalPowerActtoimprovetheoperationoforganizedwholesaleelectricmarketsintheareasof:(1)demandresponseandmarketpricingduringperiodsofoperatingreserveshortage;(2)long-termpowercontracting;(3)market-monitoringpolicies;and(4)theresponsivenessofregionaltransmissionorganizations(RTOs)andindependentsystemoperators(ISOs)totheircustomersandotherstakeholders,andultimatelytotheconsumerswhobenefitfromandpayforelectricityservices.Wholesale Competition in Regions with Organized Electric Markets,125FERC¶61,071(2008).
• February22,2008,FERCissuedaNoticeofProposedRulemaking. Wholesale Competition in Regions with Organized Electric Markets,122FERC¶61,167(2008).
THIRD-PARTY PROVISION OF ANCILLARY SERVICES; ACCOUNTING AND FINANCIAL REPORTING FOR NEW ELECTRIC STORAGE TECHNOLOGIESMAJOR PROPOSALS: DOCKETS RM11-24-000 AND AD10-13-000• FERCproposestoreviseitsAvista Corp.
policygoverningthesaleofancillaryservicesatmarket-basedratestopublicutilitytransmissionprovidersandreflectsuchreformsinParts35and37oftheCommission’sregulations.
• FERCissuedaPolicyStatementandActionPlanseekingcommentstoexpeditethedevelopmentofinteroperabilitystandardsandimplementationofprojectsfordevelopmentoftheSmartGrid.
MAJOR IMPLICATIONS:• FERCproposestoassistNISTexpedite
developmentofSmartGridstandards,Theproposalprioritizescybersecurityandinteroperabilitystandards.Otherkeystandardsincludewide-areasituationalawareness,demandresponse,andelectricitystorage.
• ThePolicyStatementprioritizesdevelopmentofinteroperabilitystandardsontwocross-cuttingissues(systemsecurityandinter-systemcommunications)andfourkeygridfunctionalities:
1.wide-areasituationalawareness;2.demandresponse;3.electricstorage;and4.electrictransportation.
• ThePolicyStatementalsopermitsutilitiestorequestaccelerateddepreciationandabandonmentauthorityunderitsInterimRatePolicy.
FERC MILESTONES:• July16,2009,inDocketNo.PL09-4-000,
FERCissuedaSmartGridPolicyStatementprovidingguidanceonsmartgridstandards.Smart Grid Policy,128FERC¶61,060(2009).
• March19,2009,inDocketNo.PL09-4-000,FERCissuedaSmartGridProposedPolicyStatementandActionPlanseekingcomments. Smart Grid Policy,126FERC¶61,253(2009).
WHOLESALE COMPETITION IN REGIONS WITH ORGANIZED ELECTRIC MARKETSMAJOR PROPOSALS: DOCKETS AD07-7, AD07-8, RM07-19• FERCproposedtoamenditsregulations
toimproveoperationofwholesaleelectricmarketswithregardsto:(1)demandresponseandmarketpricesduringoperatingreserveshortages;(2)long-termpowercontracting;(3)market-monitoringpolicies;and(4)RTOandISOresponsivenesstostakeholdersandcustomers.
• FERCheldthreetechnicalconferencesonimprovingwholesalecompetitionin2007.
MAJOR IMPLICATIONS:• TheNOPRproposestoallowRTOstoaccept
bidsfromdemandresponseresourcesforcertainancillaryservices,toeliminatechargesforvoluntarilytakinglessenergyinreal-timemarketsthanpurchasedintheday-aheadmarkets,allowdemandresponsetobebidbyaretailcustomeraggregator,andtoallowmarket-clearingpricestoreachlevelsthatallowforrebalancesofsupplyanddemandduringperiodsofoperatingreserveshortages.
suchsalesarejustandreasonable.Market-Based Rates for Wholesale Sales of Electric Energy, Capacity and Ancillary Services by Public Utilities, 123FERC¶61,055(2008).
• December14,2007,FERCissuedanorderclarifyingtheeffectivecompliancedate,whichentitiesarerequiredtofileandwhatdataarerequiredformarketpoweranalyses,anddetailsof“seller-specifictermsandconditions”forOrderNo.697.Market-Based Rates for Wholesale Sales of Electric Energy, Capacity and Ancillary Services by Public Utilities,121FERC¶61,260(2007).
• June21,2007,FERCissuedOrderNo.697.Market-Based Rates for Wholesale Sales of Electric Energy, Capacity and Ancillary Services by Public Utilities,119FERC¶61,295(2007).
• August14,2006,FERCissuednoticegrantingEEI’srequestforanextensionoftimetofilereplycomments.
• May19,2006,FERCissuedaNOPRproposingtoamenditspoliciesregardingthegrantingofmarket-baserateauthorityandtoformallyincorporateFERC’sfour-prongmarketpoweranalysisintotheFERC’sregulatorycode.Market-Based Rates for Wholesale Sales of Electric Energy, Capacity and Ancillary Services by Public Utilities,115FERC¶61,210(2006).
PROMOTING A COMPETITIVE MARKET FOR CAPACITY REASSIGNMENT: DOCKET NO. RM10-22-000• FERCissuedaFinalRuleliftingtheprice
capforallelectrictransmissioncustomersreassigningtransmissioncapacitytohelpfacilitatethedevelopmentofamarketforelectrictransmissioncapacityreassignmentsasacompetitivealternativetotransmissioncapacityacquireddirectlyfromthetransmissionowner.
MAJOR IMPLICATIONS:• Thepricecapforallreassignmentsofelectric
transmissioncapacityareliftedeffectiveOctober1,2010
• Transmissionproviderswillneedtorevisesection23oftheproformaOATTandfilethemwithFERC.
FERC MILESTONES:• May19,2011,inDocketNo.RM10-22-
001,FERCissuedOrderNo.739-AdenyingrehearingandaffirmingitsdeterminationsinOrderNo.739.Promoting a Competitive Market for Capacity Reassignment,135FERC¶61,137(2011).
• September20,2010,inDocketNo.RM10-22-000,FERCissuedOrderNo.739.Promoting a competitive Market for Capacity Reassignment,132FERC¶61,238(2010).
SMART GRID POLICYMAJOR PROPOSALS: DOCKET NO. PL09-4-000

EEI 2012 FINANCIAL REVIEW 97
POLICY OVERVIEW
• FERCproposestorequireeachpublicutilitytransmissionprovidertoincludeprovisionsinitsOATTexplaininghowitwilldetermineRegulationandFrequencyResponsereserverequirementsinamannerthattakesintoaccountthespeedandaccuracyofresourcesused.
• FERCalsoproposestorevisetheaccountingandreportingrequirementsunderitsUniformSystemofAccountsforpublicutilitiesandlicenseesanditsforms,statements,andreports,containedinFERCFormNo.1,AnnualReportofMajorElectricUtilities,LicenseesandOthers,FERCFormNo.1-F,AnnualReportforNonmajorPublicUtilitiesandLicensees,andFERCFormNo.3-Q,QuarterlyFinancialReportofElectricUtilities,Licensees,andNaturalGasCompanies,tobetteraccountforandreporttransactionsassociatedwiththeuseofenergystoragedevicesinpublicutilityoperations.
MAJOR IMPLICATIONS:• TheNOPRproposestorevisetheregulations
governingmarket-basedrateauthorizationstoprovidethatsellerspassingexistingmarket-basedrateanalysesinagivengeographicmarketshouldbegrantedarebuttablepresumptionthattheylackhorizontalmarketpowerforsalesofEnergyImbalanceandGeneratorImbalanceancillaryservicesinthatmarket.
• TheNOPRproposestorequireeachpublicutilitytransmissionprovidertopubliclypostonitsOASISinformationastotheaggregateamount(MWorMVAR,asapplicable)ofeachancillaryservicethatithashistoricallyrequired,includinganygeographiclimitationsitmayfaceinmeetingsuchancillaryservicerequirements.
• TheNOPRproposestopermitsellersunableorunwillingtoperformthemarketpowerstudyforancillaryservicestoproposepricecapsatorbelowwhichsalesofRegulationandFrequencyResponse,ReactiveSupplyandVoltageControl,OperatingReserve-Spinning,orOperatingReserve-SupplementalservicewouldbeallowedwherethepurchasingentityisapublicutilitypurchasingancillaryservicestosatisfyitsownOATTrequirementstoofferancillaryservicestoitsowncustomers.
• TheNOPRproposestoallowapplicantstoengageinsalestoapublicutilitythatispurchasingancillaryservicestosatisfyitsOATTrequirementstoofferancillaryservicestoitsowncustomerswherethesaleismadepursuanttoacompetitivesolicitationthatmeetsspecificrequirements.
• TheNOPRproposestorequirethateachpublicutilitytransmissionprovidersubmitprovisionsforinclusioninitsOATTthattakeintoaccountthespeedandaccuracyofregulationresourcesindeterminingits
RegulationandFrequencyResponsereserverequirements.
• TheNOPRproposestoaddnewelectricplantandO&Mexpenseaccountstorecordtheinstalledcostandoperatingandmaintenancecostofenergystorageassetsandanewaccounttorecordthecostofpowerpurchasedforuseinenergystorageoperations.
FERC MILESTONES:• June22,2012,inDocketNos.RM11-24-
000andAD10-13-000,FERCissuedaNoticeofProposedRulemaking.Third-Party Provision of Ancillary Services; Accounting and Financial Reporting for New Electric Storage Technologies,139FERC¶61,245(2102).

98 EEI 2012 FINANCIAL REVIEW
POLICY OVERVIEW
EEI 2012 FINANCIAL REVIEW 99
Introduction to Depreciation for Utilities and Other Industries
This text contains a basic explana-tion of the fundamentals and prac-tices of electric and gas utility ac-counting. The completion of a new edition is scheduled for 2014. With current accounting standards, regula-tory requirements and industry trends, the revised textbook will include new chapters on Asset Retirement Obligations (AROs) and Internal Control & Reporting Requirements (Sarbanes-Oxley Act of 2002).
Industry directories published by the Finance and Accounting Division:
■ Electric Utility Investor Relations Executives Directory
■ Accounting and Internal Audit Directory
For more information, please visit the EEI website at: www.eei.org.
Finance andAccounting Division
The Business Services and Fi-nance Division is part of EEI’s Busi-ness Operations Group. This divi-sion provides the leadership and management for advocating indus-try policies and technical research and enhancing the capabilities of individual members through educa-tion and information sharing. The division’s leadership is used in areas that affect the financial health of the shareholder-owned electric utility industry, such as finance, account-ing, taxation, internal auditing, in-vestor relations, risk management, budgeting and financial forecasting. If you need research information about these issue areas, please con-tact an EEI Business Services and Fi-nance Division staff member (listed in this section). Under the direction of both the Finance and the Ac-counting Executive Advisory Com-mittees, the division provides staff representatives to work with issue area committees. These committees give member company personnel a forum for information exchange and training and an opportunity to com-ment on legislative and regulatory proposals.
Publications
Quarterly Financial UpdatesA series of financial reports on the
shareholder-owned segment of the electric utility industry. Quarterly reports include stock performance, dividends, credit ratings, construc-tion, fuel, and rate case summary, as well as the industry’s consolidated fi-nancial statements.
Financial ReviewAn annual report that provides
a review of the financial perfor-mance of the shareholder-owned electric utility industry. The report also includes a policy overview sec-tion giving an update on legislative, regulatory, environmental, and other related developments.
EEI IndexQuarterly stock performance of
the U.S. shareholder-owned electric utilities. The index, which measures total return and provides company rankings for one- and five-year peri-ods, is widely used in company proxy statements and for overall industry benchmarking.

100 EEI 2012 FINANCIAL REVIEW
FINANCE AND ACCOUNTING DIVISION
EEI Corporate Accounting and Property Accounting & Valuation Committees
Provides a forum for members to discuss current issues and challenges and exchange ideas in the electric and natural gas utility industries—convenes twice a year for two and one half days. The meetings are open to members of the Committees and other employees of EEI/AGA mem-ber companies. Contact Jamie Kent for more information.
Tax SchoolProvides tax professionals a
forum to discuss developing tax issues impacting our member companies. This two and half day training is held every other year. Contact Mark Agnew for more information.
Accounting Courses
Introduction to Public Utility Accounting
This 4-day program concentrates on the fundamentals of public utility accounting. It focuses on provid-ing basic knowledge and a forum for understanding the elements of the utility business. It is intended pri-marily for recently hired electric and gas utility staff in the areas of accounting, auditing, and finance. Contact Randall Hartman or Jamie Kent for more information.
Advanced Public Utility Accounting
This intensive, 4-day course focuses on complex and specific advanced accounting and industry topics. It addresses current accounting issues including those related to de-regulation and competition, as they affect regulated companies in the changing and increasingly competi-tive environment of the electric and
electric utility industry. Contact Debra Henry for more information.
Financial Analysts SeminarThis two-day seminar is held
every two years. It is for financial and security analysts new to the industry. Contact Debra Henry for more information.
Accounting Leadership Conference
This annual meeting, held jointly with AGA as well as with the Chief Audit Executives, covers current accounting, finance, business, and management issues for the Chief Accounting Officers and key accounting leadership of EEI member companies. Contact Randall Hart-man for more information.
Chief Audit Executives ConferenceThis annual conference provides
a forum for EEI and AGA Chief Audit Executives and other manage-ment professionals to discuss issues and challenges and exchange ideas on utility-specific internal audit-ing topics. The conference is open to members of the Committees and other employees of EEI/AGA mem-ber companies. Contact Jamie Kent for more information.
EEI Accounting Standards Committee
Provides a forum for technical accounting, accounting research, financial reporting, and other interested member-company account-ing leaders and staff, to update their knowledge on emerging accounting standards, implementation issues associated with newly issued stan-dards, and other technical and business issues. Contact Randall Hartman for more information.
Conference Highlights
Annual Financial ConferenceThis three-day conference is the
premier annual fall gathering of utili-ties and the financial community; it is attended by more than 1,200 senior executives, including many utility CEOs and CFOs, investment analysts, and commercial and invest-ment bankers. The General Sessions cover topics of strategic interest to the financial community. Contact Debra Henry for more information.
International Utility ConferenceThis two-day conference, held each
winter in London, provides a forum for global utility executives, security analysts, and other investors to meet in a common area for the purpose of information exchange on industry issues and competitive strategies across multiple markets. Contact Debra Henry for more information.
Annual Finance Meeting (will not be holding this meeting after May 2013)
This meeting is held in the spring in New York City. Attendance is lim-ited to member company utility ex-ecutives and Wall Street security ana-lysts. Topics revolve around emerging industry issues and their financial implications. The meeting facilitates investors meeting with utility execu-tives on an individual basis. Contact Debra Henry for more information.
Investor Relations MeetingThis one-day meeting is held in
the spring. It is a forum for util-ity investor relations executives that provides key information on evolv-ing industry issues and identifies best practices within and outside the
EEI 2012 FINANCIAL REVIEW 101
FINANCE AND ACCOUNTING DIVISION
details, please contact either Debra Henry at 202/508-5496 or Charnita Garvin at 202/508-5057.
UPCOMING MEETINGS OF INTEREST
November 10-13, 2013 48th EEI Financial ConferenceOrlando World Center Marriott Resort Orlando, FL
November 10, 2013
EEI Treasury Task Force(Closed meeting, admittance by invitation only) Orlando World Center Marriott Resort Orlando, FL
Chief Financial Officers Forum(Closed meeting, admittance by invitation only) Orlando World Center Marriott Resort Orlando, FL
December 5, 2013
Electric Utility Investor Relations Group Planning Meeting(Closed meeting, admittance by invitation only) Omni Berkshire Place New York, New York
Wall Street Advisory Group Meeting(Closed meeting, admittance by invitation only) Omni Berkshire Place New York, New York
February 12, 2014
EEI Wall Street BriefingUniversity Club New York, New York
March 9-12, 2014
EEI International Utility ConferenceLondon Hilton on Park Lane London, United Kingdom
Accounting Staff:Randall Hartman Director, Accounting (202) 508-5494 [email protected]
Jamie Kent Manager, Accounting (202) 508-5570 [email protected]
Kim King Administrative Assistant (202) 508-5493 [email protected]
Finance Staff:Mark Agnew Director, Financial Analysis (202) 508-5049 [email protected]
Aaron Trent Manager, Financial Analysis (202) 508-5526 [email protected]
Bill Pfister Senior Financial Analyst (202) 508-5531 [email protected]
Investor Relations Staff:Debra Henry Manager, Investor Relations & Conference Services (202) 508-5496 [email protected]
Charnita Garvin Investor Relations Specialist (202) 508-5057 [email protected]
Edison Electric Institute Schedule Of Upcoming
Meetings
To assist in planning your schedule, here are finance-related meetings that may be of interest to you. For further
gas utility industries. Contact Ran-dall Hartman or Jamie Kent for more information.
Finance & Accounting for Non-financial Utility Professionals
This seminar is designed for non-financial utility professionals at the mid and senior management levels who want a better understanding of Finance and Accounting. It provides two days of comprehensive train-ing that cover the basic elements of Finance and Accounting. Contact Jamie Kent for more information.
Property Accounting & Depreciation Training Seminar
This is a 2-day seminar that pro-vides an introduction to property accounting and depreciation in the electric and natural gas utility indus-tries. Contact Jamie Kent for more information.
Utility Internal Auditor’s TrainingProvides utility staff auditors and
directors with the fundamentals of public utility auditing and specific utility audit/accounting issues in-cluding advanced internal auditing topics – convenes for two and one half days. Contact Jamie Kent for more information.
The EEI Business Services And Finance Division Staff
Richard McMahon Vice President, Energy Supply and Finance (202) 508-5571 [email protected]
Irene Ybadlit Administrative Assistant (202) 508-5502 [email protected]

102 EEI 2012 FINANCIAL REVIEW
FINANCE AND ACCOUNTING DIVISION
($ Millions)
Earnings Twelve Months Ending December 31
U.S. SHAREHOLDER-OWNED ELECTRIC UTILITIES
Earnings Excluding Non-Recurring and Extraordinary Items 34,081 32,638 Non-Recurring Items (pre-tax) Gain on Sale of Assets 382 891 Other Non-Recurring Revenues 299 946 Asset Write-downs (9,881) (2,743)Other Non-Recurring Expenses (2,044) (851)
Total Non-Recurring Items (11,243) (1,757) Extraordinary Items (net of taxes) Discontinued Operations (1,732) (1,011)Change in Accounting Principles — — Early Retirement of Debt — — Other Extraordinary Items — 960 Total Extraordinary Items (1,732) (51) Net Income 21,106 30,830 Total Non-Recurring and Extraordinary Items (12,975) (1,808)
2012 2011r
r = revised Note: Totals may reflect rounding. Source: SNL Financial and EEI Finance Department

EEI 2012 FINANCIAL REVIEW 103
FINANCE AND ACCOUNTING DIVISION
U.S. Shareholder-Owned Electric UtilitiesAllete, Inc.
Alliant Energy Corporation
Ameren Corporation
American Electric Power Company, Inc.
Avista Corporation
Black Hills Corporation
CenterPoint Energy, Inc.
Central Vermont Public Service Corporation
CH Energy Group, Inc.
Cleco Corporation
CMS Energy Corporation
Consolidated Edison, Inc.
Dominion Resources, Inc.
DPL, Inc.
DTE Energy Company
Duke Energy Corporation
Edison International
El Paso Electric Company
Empire District Electric Company
Energy Future Holdlings Corp. (formerly TXU Corp.)
Entergy Corporation
Exelon Corporation
FirstEnergy Corporation
Great Plains Energy, Inc.
Hawaiian Electric Industries, Inc.
Iberdrola USA, Inc.
IDACORP, Inc.
IPALCO Enterprises, Inc.
Integrys Energy Group, Inc.
MDU Resources Group, Inc.
MGE Energy, Inc.
MidAmerican Energy Company
NextEra Energy, Inc.
NiSource, Inc.
Northeast Utilities
NorthWestern Corporation
NV Energy, Inc.
OGE Energy Corporation
Otter Tail Corporation
Pepco Holdings, Inc.
PG&E Corporation
Pinnacle West Capital Corporation
PNM Resources, Inc.
Portland General Electric Company
PPL Corporation
Public Service Enterprise Group Inc.
Puget Energy, Inc.
SCANA Corporation
Sempra Energy
Southern Company
TECO Energy, Inc.
UIL Holdings Corporation
Unitil Corporation
UNS Energy Corporation
Vectren Corporation
Westar Energy, Inc.
Wisconsin Energy Corporation
Xcel Energy, Inc.
Note: Includes the 51 publicly traded electric utility holding companies plus an additional 7 electric utilities (shown in italics) that are not listed on U.S. stock exchanges for one of the following reasons - they are subsidiar-ies of an independent power producer; they are subsidiaries of foreign-owned companies; or they were acquired by other investment firms.
(At 12/31/12)

The Edison Electric Institute (EEI) is the association of U.S. shareholder-owned electric companies. Our members serve 95% of the ultimate customers in the shareholder-owned seg-ment of the industry, and represent approximately 70% of the U.S. electric power industry. We also have as Affiliate mem-bers more than 80 International electric companies, and as Associate members more than 200 industry suppliers and related organizations.
Organized in 1933, EEI works closely with all of its mem-bers, representing their interests and advocating equitable policies in legislative and regulatory arenas.
EEI provides public policy leadership, critical industry data, market opportunities, strategic business intelligence, one-of-a-kind conferences and forums, and top-notch products and services.
For more information on EEI programs and activities, products and services, or membership, visit our Web site at www.eei.org.