annual report of the brussels tourism observatory. pierre 1 hotels-youth accommodation 1 guest rooms...
TRANSCRIPT

2016
Annual report of the
Brussels tourism
observatory
Introduction
1. Accommodation• Tourist offer
• Hotel occupancy
• Breaks and stays
2. Congresses and meetings• Congresses and meetings
• Major fairs
3. Tourism cultural services• Museums & attractions
• Guided tours
4. Transport• Aerial transport
• Urban mobility
5. Quality of tourist services• Satisfaction of visitors
• Brussels Quality Academy
6. Sustainable tourism• Eco-labels
• Exemplary buildings
• Green spaces
2
Summary

3
Introduction

4
Key figures
3,00 M-15%
Hotel arrivals
5,50 M-19%
Overnight stays
5
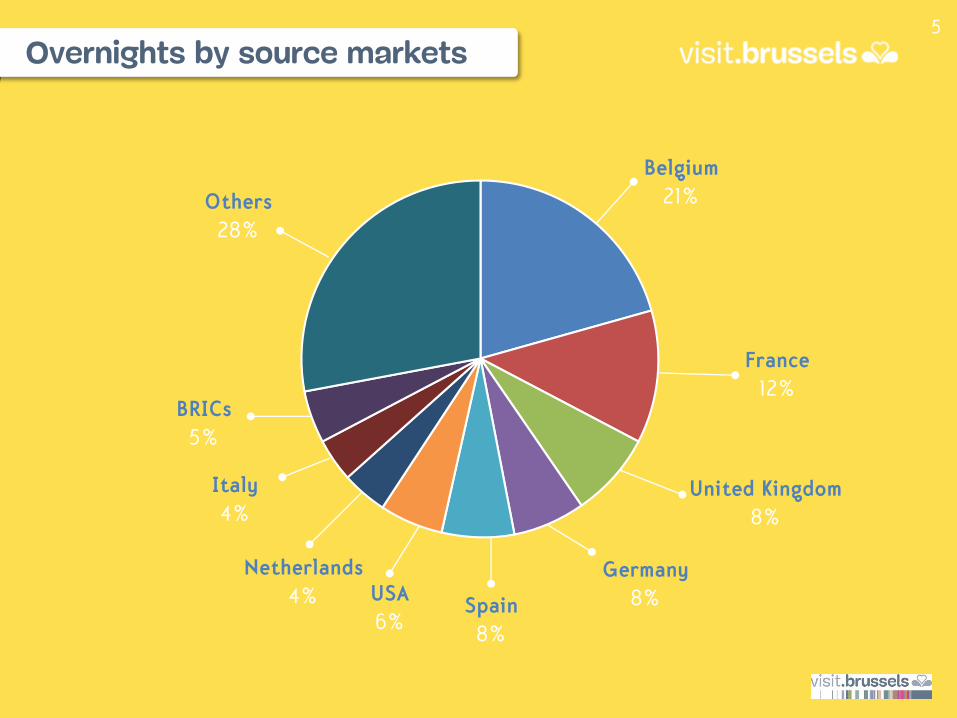
Overnights by source markets
Belgium
21%
France
12%
United Kingdom
8%
Germany
8%Spain
8%
Others
28%
BRICs
5%
USA
6%
Netherlands
4%
Italy
4%

6
Accommodation offer
282
Tourist
accommodation
Available
accommodation
opportunities37.472
Eco-labelled
accommodation52
106€
58%
Occupancy rates
Average price
per hotel room
RevPAR
65€
7
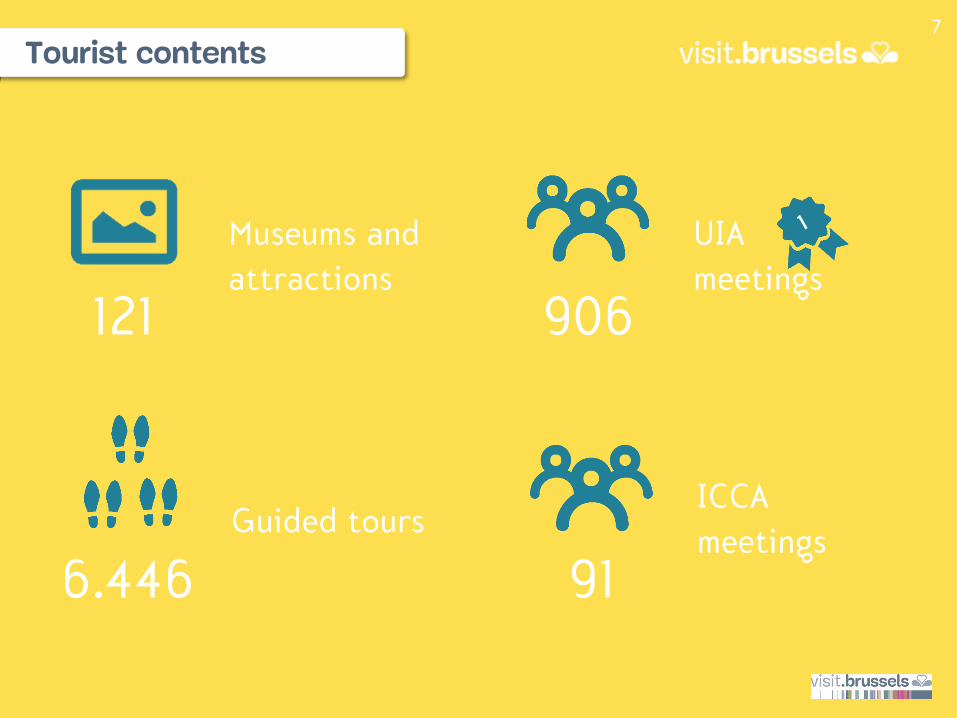
Tourist contents
121
Museums and
attractions
6.446
Guided tours
906
UIA
meetings
91
ICCA
meetings

8
1
Tourist accomodation
9
Tourist offer
Brussels is a cosmopolitan city in which tourism plays an important role. To keep up with demanddue to its status as a major European capital city, Brussels has a plentiful and varied hotel offer,which will be presented in this chapter.
The details and numbers concerning the number of establishments in Brussels is provided by theFPS Economy.
Furthermore, over-the-counter renting of furnished accommodation is an important part of thecity’s accommodation offer, which is why we have decided to include an analysis of this recentphenomenon in this annual report.
To do so, we have used the estimated number of AirBnB lodgings in Brussels according to the“insideAirBnB” website. The data was collected on the platform in january 2017.

Hotels
Source: DGS
206
Establishments
18.141
Rooms
37.472
Beds
Youth accommodation
Source: DGS
8
Establishments
211
Rooms
1.224
Beds
Guest rooms
Source: DGS
68
Establishments
152
Rooms
357
Beds
Furnished
accommodation
Source: inside airbnb
6.287
Lodgings
7.600
Rooms
-
Beds
Notes:
1. Data: DGS, BHA and visit.brussels2. The inside Airbnb figures were taken by Tom Slee (tomslee.net) from the Airbnb website in January 2017
10
Tourist offer - region

Brussels
95 hotels
3 youth accommodation
12 guest rooms
1.521 furnished lodgings
St-Gilles
25 hotels
- youth accommodation
7 guest rooms
566 furnished lodgings
Ixelles
22 hotels
- youth accommodation
7 guest rooms
893 furnished lodgings
St-Josse
15 hotels
1 youth accommodation
- guest rooms
117 furnished lodgings
Anderlecht
10 hotels
- youth accommodation
3 guest rooms
137 furnished lodgings
Schaerbeek
9 hotels
- youth accommodation
8 guest rooms
366 furnished lodgings
Etterbeek
5 hotels
- youth accommodation
9 guest rooms
276 furnished lodgings
Evere
4 hotels
- youth accommodation
- guest rooms
20 furnished lodgings
Woluwe
Saint Lambert
5 hotels
- youth accommodation
2 guest rooms
123 furnished lodgings
Molenbeek
3 hotels
2 youth accommodation
- guest rooms
124 furnished lodgings
11
Tourist offer – by commune (1)
Notes:
1. Data: DGS, BHA and visit.brussels2. The inside Airbnb figures were taken by Tom Slee (tomslee.net) from the Airbnb website in January 2017

Ganshoren
1 hotels
- youth accommodation
1 guest rooms
7 furnished lodgings
Forest
2 hotels
- youth accommodation
2 guest rooms
253 furnished lodgings
Watermael-
Boitsfort
2 hotels
- youth accommodation
4 guest rooms
51 furnished lodgings
Uccle
2 hotels
- youth accommodation
4 guest rooms
205 furnished lodgings
Woluwe
St. Pierre
1 hotels
- youth accommodation
1 guest rooms
91 furnished lodgings
Jette
1 hotels
- youth accommodation
1 guest rooms
43 furnished lodgings
Berchem
Ste. Agathe
- hotels
- youth accommodation
1 guest rooms
11 furnished lodgings
Auderghem
- hotels
1 youth accommodation
6 guest rooms
66 furnished lodgings
Koekelberg
1 hotels
1 youth accommodation
1 guest rooms
33 furnished lodgings
12
Tourist offer – by commune (2)
Notes:
1. Data: DGS, BHA and visit.brussels2. The inside Airbnb figures were taken by Tom Slee (tomslee.net) from the Airbnb website in January 2017

13
Nom du projet Commentaires Commune Taille Date
Le Quinze Grand Place Rebranding of Saint Michel hotel Brussels 15 RoomsJanuary 2016
(open)
Tangla Hotel (4****) Renovation of Sodehotel (4****)Woluwe-Saint-Lambert
(UCL St Luc)187 Rooms
April 2016
(open)
Radisson RED Rebranding of Radisson Blu Ixelles 149 RoomsApril 2016
(open)
Hilton Garden Inn Brussels Louise Rebranding of Cascade Inn Saint-Gilles 143 Rooms June 2016 (open)
easyHotel Brussels City Centre New hotel Brussels 107 Rooms November 2016 (open)
Corinthia Grand Hotel Astoria (5*****) Renovation of Astoria hotelBrussels
(Rue Royale)121 Rooms (previously 109) 2019
Gésu (5*****) New hotel Saint-Josse75 rooms + 77 apartments +
conference rooms and car parkQ1 2019
Okko project Transformation of CBC building at Grand-Place Brussels 150 Rooms 2020-21
Bacardi – Martini project New hotel Molenbeek-Saint-Jean 70 Rooms n/a
Nexity - Orion International New hotelEtterbeek
(Rue Belliard)110 Rooms n/a
Neo Global project at Heysel Heyzel Plateau - LaekenMin. 500 Rooms
5,000-seat convention centren/a
Hotel projets (2016 and future projects)

14
Hotel occupancy
It is no surprise that 2016 was a difficult year for the Brussels hotel industry. While the Lockdownfrom November 2015 still had impact on tourism figures, February started to show some sign ofrecovery. After the terror attacks of March, one week before Easter holidays, the occupancy rateof the hotels of the Brussels Region strongly dropped compared to 2015, before showing signsof recovery in October.
The occupancy rates, average prices and the revenue per available room are taken from thereports distributed by MKG researchers.
Mkg used a panel of 94 hotels (totaling 14.699 Rooms) from May to December and 96establishements in Novembee et December (totaling 15.052 Rooms),
It’s important to note that weekend and mid-week figures should not be compared to the globalresults. In fact, the data is based on a restricted panel which varied from week to week and wasmade up of around 60 establishments.
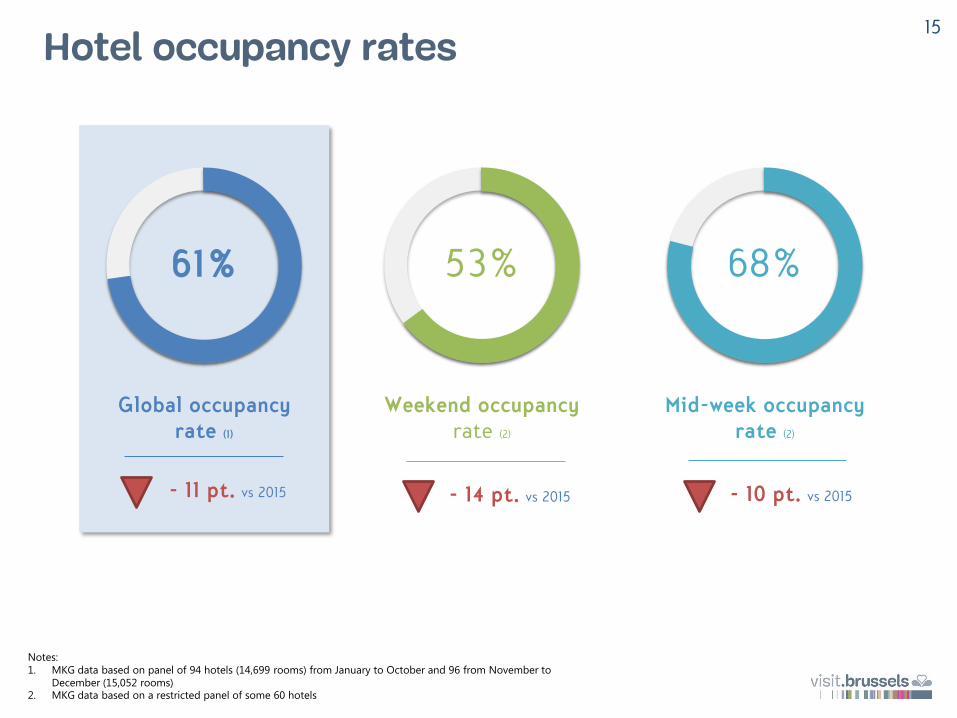
Mid-week occupancyrate (2)
68%
Global occupancyrate (1)
61%
Weekend occupancyrate (2)
53%
- 11 pt. vs 2015 - 14 pt. vs 2015 - 10 pt. vs 2015
15
Hotel occupancy rates
Notes:
1. MKG data based on panel of 94 hotels (14,699 rooms) from January to October and 96 from November to
December (15,052 rooms)2. MKG data based on a restricted panel of some 60 hotels
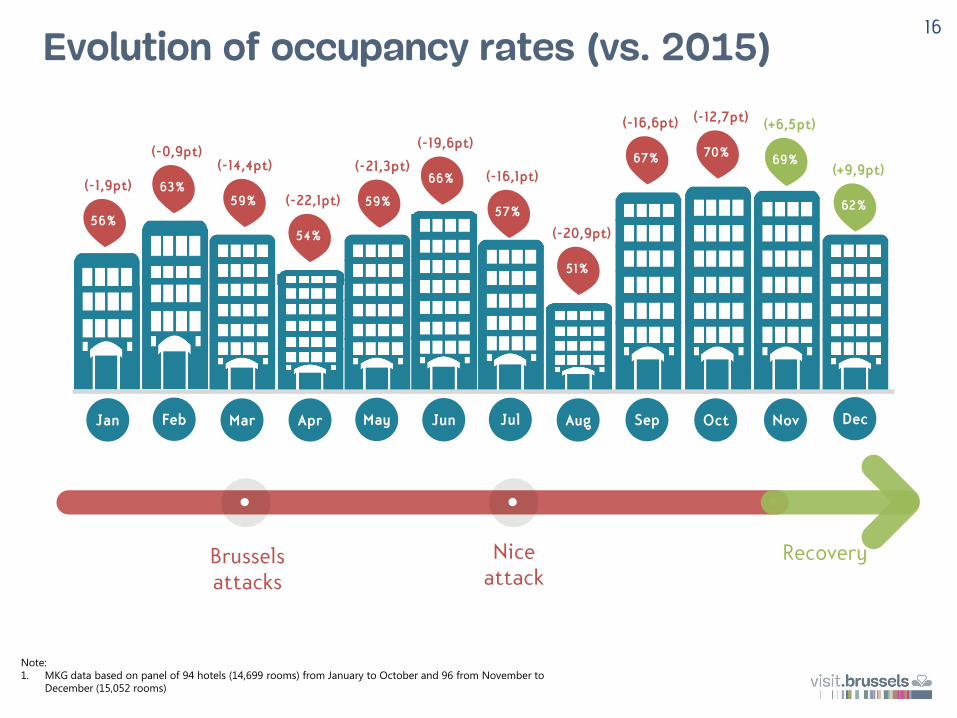
Jan Feb Mar Apr May Jun Jul Aug Sep Oct Nov Dec
Recovery
56%
(-1,9pt) 63%
(-0,9pt)
59%
(-14,4pt)
54%
(-22,1pt) 59%
(-21,3pt)66%
(-19,6pt)
57%
(-16,1pt)
51%
(-20,9pt)
67%
(-16,6pt)
70%
(-12,7pt)
16
Brussels attacks
Nice attack
69%
(+6,5pt)
62%
(+9,9pt)
Evolution of occupancy rates (vs. 2015)
Note:
1. MKG data based on panel of 94 hotels (14,699 rooms) from January to October and 96 from November to
December (15,052 rooms)

Rogier -Botanique
55%-13pt.
Louise
62%-9pt.
European quarter
69%-2pt.
Midi -Lemonnier
65%-11pt.
GrandPlace
65%-12pt.
BrusselsAirport
63%-9,5pt.
Around thering road
60,5%-4,5pt.
17
Hotel occupancy rates – by neighbourhood
Notes:
1. MKG data based on panel of 94 hotels (14,699 rooms) from January to October and 96 from November to
December (15,052 rooms)2. The neighbourhood hexagons are only for illustration and do not represent their precise locations or borders

65% 58% 56%
- 9,7 pt. vs 2015 - 11,7 pt. vs 2015 + 1 pt. vs 2015
18
Hotel occupancy rates – by category
Note:
1. MKG data based on panel of 94 hotels (14,699 rooms) from January to October and 96 from November to
December (15,052 rooms)

113€
Global average price (1)
106€ 78€
-€1 vs 2015 - €2 vs 2015 - €6 vs 2015
19
Average hotel prices
Notes:
1. MKG data based on panel of 94 hotels (14,699 rooms) from January to October and 96 from November to
December (15,052 rooms)2. MKG data based on a restricted panel of some 60 hotels
Average weekend
price (2)
Average mid-weekprice (2)

Jan Feb Mar Apr May Jun Jul Aug Sep Oct Nov Dec
€119
(+0,3%)
€99
(-4,2%)€103
(+2,4%) €109,5
(+4%)
€127
(+7,8%)
€104
(-0,8%)
€111
(-7,6%)
€82
(-2,8%)
€77
(+0,4%)
€110
(-12%)
€111
(-6,3%)
€113,5
(+1,5%)
20
Brussels
Attacks
Nice
Attack
Evolution of average prices (vs. 2015)
Note:
1. MKG data based on panel of 94 hotels (14,699 rooms) from January to October and 96 from November to
December (15,052 rooms)
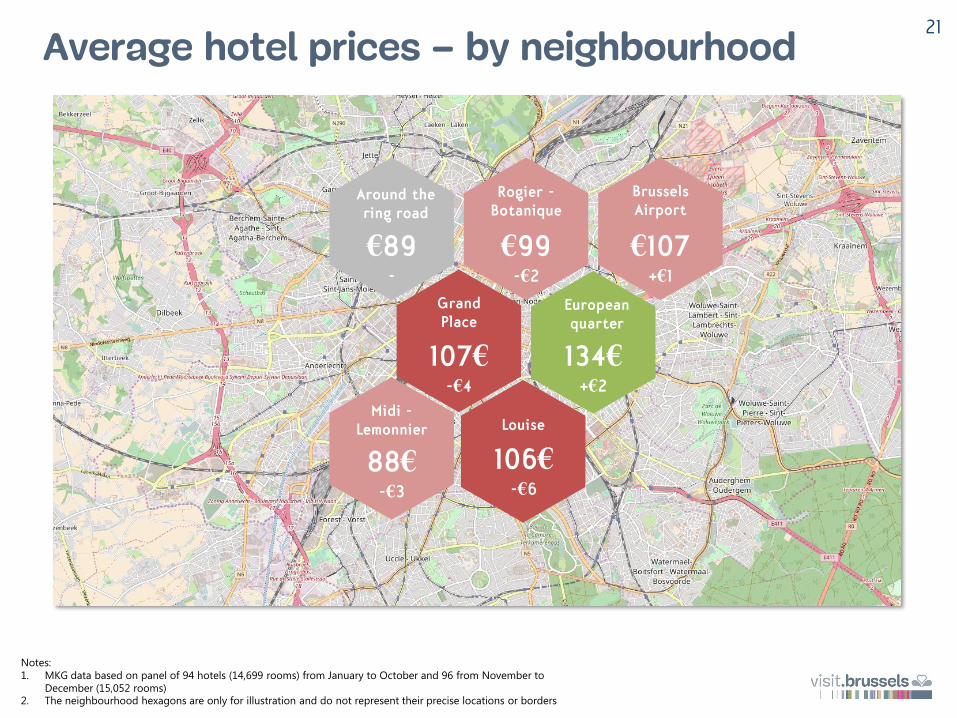
Rogier -Botanique
€99-€2
Louise
106€-€6
European quarter
134€+€2
Midi -Lemonnier
88€-€3
GrandPlace
107€-€4
BrusselsAirport
€107+€1
Around the ring road
€89-
21
Average hotel prices – by neighbourhood
Notes:
1. MKG data based on panel of 94 hotels (14,699 rooms) from January to October and 96 from November to
December (15,052 rooms)2. The neighbourhood hexagons are only for illustration and do not represent their precise locations or borders
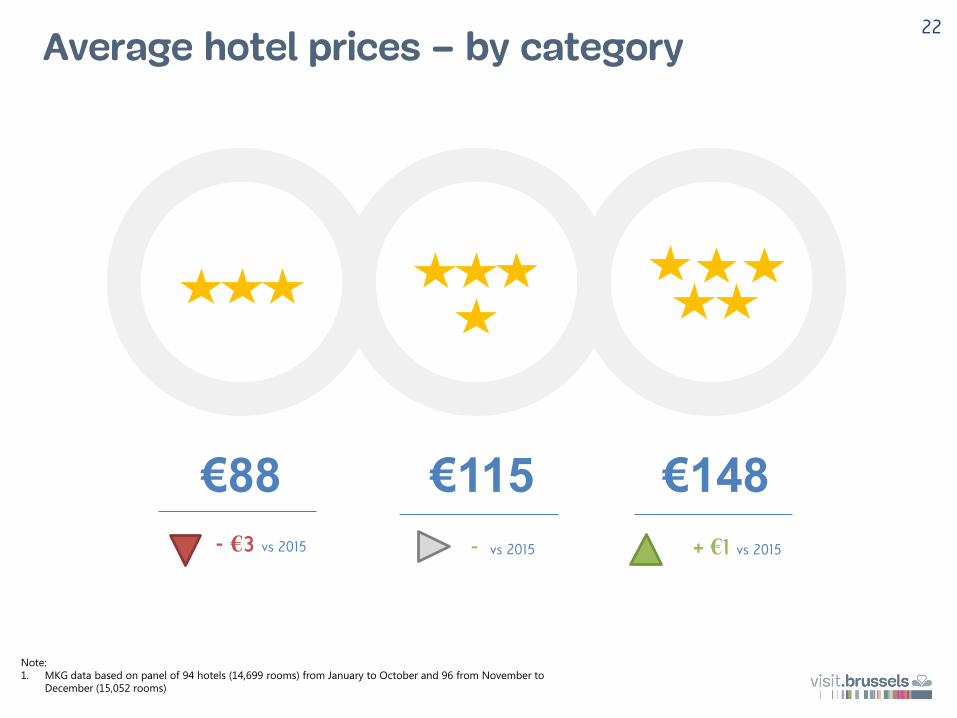
€88 €115 €148
- €3 vs 2015 - vs 2015 + €1 vs 2015
22
Average hotel prices – by category
Note:
1. MKG data based on panel of 94 hotels (14,699 rooms) from January to October and 96 from November to
December (15,052 rooms)
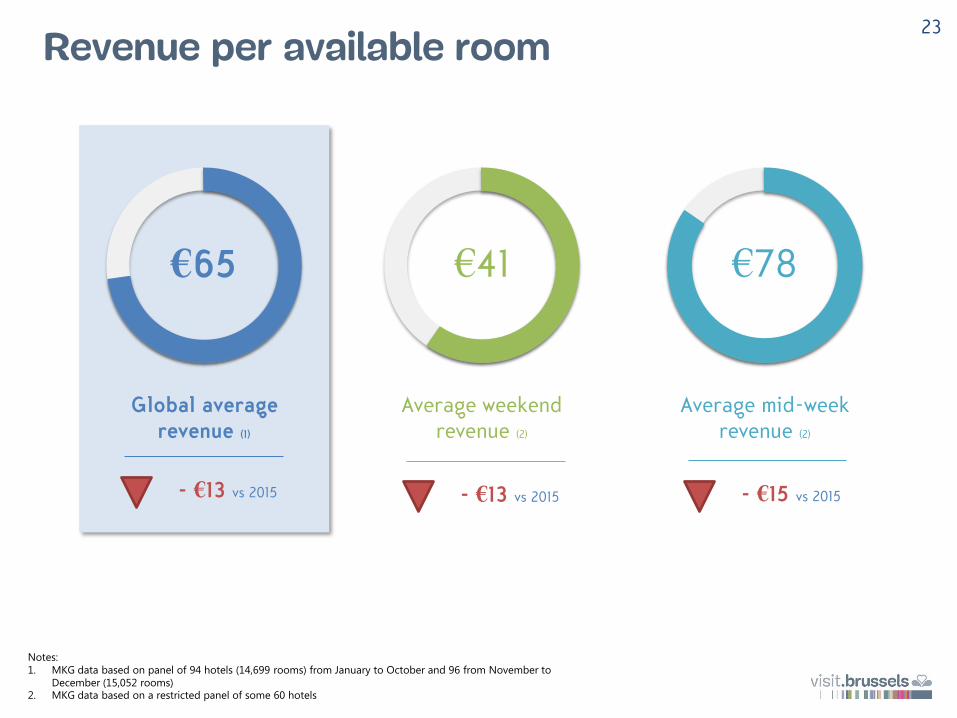
€78€65 €41
- €13 vs 2015 - €13 vs 2015 - €15 vs 2015
23
Notes:
1. MKG data based on panel of 94 hotels (14,699 rooms) from January to October and 96 from November to
December (15,052 rooms)2. MKG data based on a restricted panel of some 60 hotels
Revenue per available room
Global average revenue (1)
Average weekendrevenue (2)
Average mid-week revenue (2)

Jan Feb Mar Apr May Jun Jul Aug Sep Oct Nov Dec
Nice attack
RecoveryBrussels Attacks
€70,6
(-19,3%)
€61,5
(+14,1%)
€58,3
(-1%)
€69,1
(+ 2,5%)
€68,6
(-23,6%)
€61,1
(-27,1%)
€73,3
(-28,7%)
€46,4
(-24,3%)
€39
(-28,4%)
€73,5
(-29,5%) €77,3
(-20,7%)
€78,7
(+12%)
24
Evolution of revenue per room (vs. 2015)
Note:
1. MKG data based on panel of 94 hotels (14,699 rooms) from January to October and 96 from November to
December (15,052 rooms)

Rogier -Botanique
€54-€15
Louise
€65-€14
European quarter
€78-€13
Midi -Lemonnier
€57-€12
GrandPlace
€70-€15
BrusselsAirport
€67-€9
Around thering road
€54-€4
25
Revenue per room – by neighbourhood
Notes:
1. MKG data based on panel of 94 hotels (14,699 rooms) from January to October and 96 from November to
December (15,052 rooms)2. The neighbourhood hexagons are only for illustration and do not represent their precise locations or borders
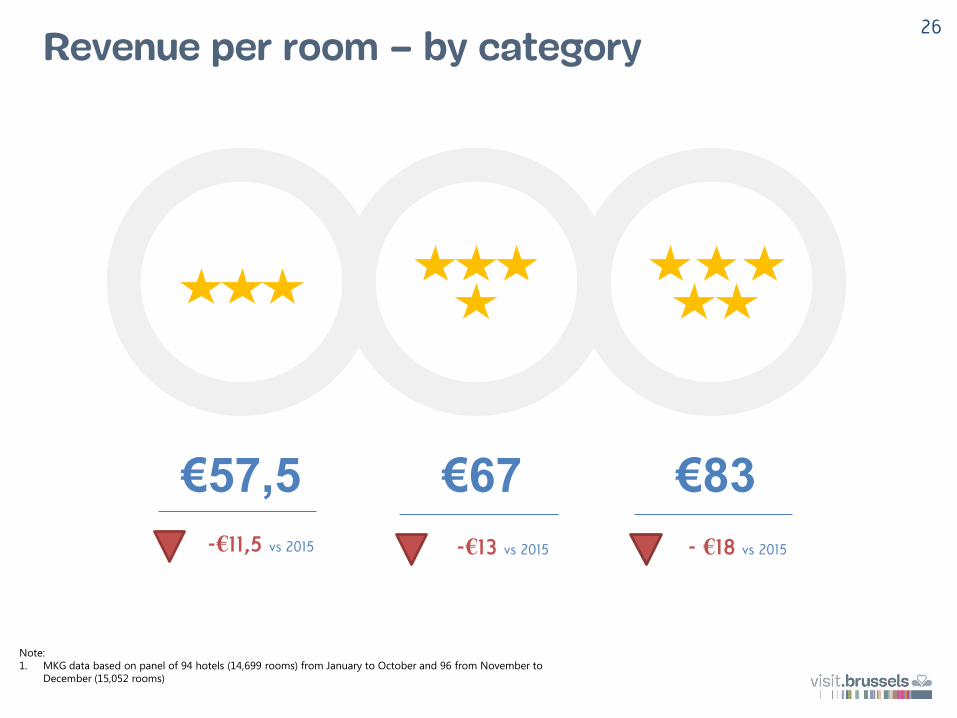
€57,5 €67 €83
-€11,5 vs 2015 -€13 vs 2015 - €18 vs 2015
26
Revenue per room – by category
Note:
1. MKG data based on panel of 94 hotels (14,699 rooms) from January to October and 96 from November to
December (15,052 rooms)

27
Breaks and stays
Data of breaks and stays in Belgium is collected from licensed establishments in all three of thecountry’s regions by SPF Economy.
Every month the establishments provide information of their visitors’ countries of origin, numbers,number of nights stayed in the establishment and the nature of their trip.
Following a change to the Arrêté royal du 12 janvier 2015 law, the reach of the data collected bySPF Economy has been reduced. For Brussels, 18 establishments with a total of 815 rooms havebeen cut from the panel.
To better reflect the actual situation, and allow for a better comparison with previous years,these 815 rooms were included in this report.
To do so , the number of overnight stays was estimated according to the occupancy figures foreach month given to us by MKG (see previous chapter). The number of travelers per overnightstay was estimated to be 1.1 per room per night for business trips and 2.3 for leisure stays.
In addition, for confidentiality reasons, SPF Economy no longer provides us with the figures forarrivals and overnight stays per hotel category.

3,00M
2016201420132012201120102009
3,42M
3,29M
3,17M
3,00M
2,78M
3,18M
28
2015
3,53M
Breaks and stays – evolution of arrivals
Note:
1. Data from SPF Economy, corrected by visit.brussels

5,50M
2016201420132012201120102009
6,61M6,27M
5,99M5,97M
5,56M
5,20M
29
6,79M
2015
Note:
1. Data from SPF Economy, corrected by visit.brussels
Breaks and stays – evolution of overnight stays
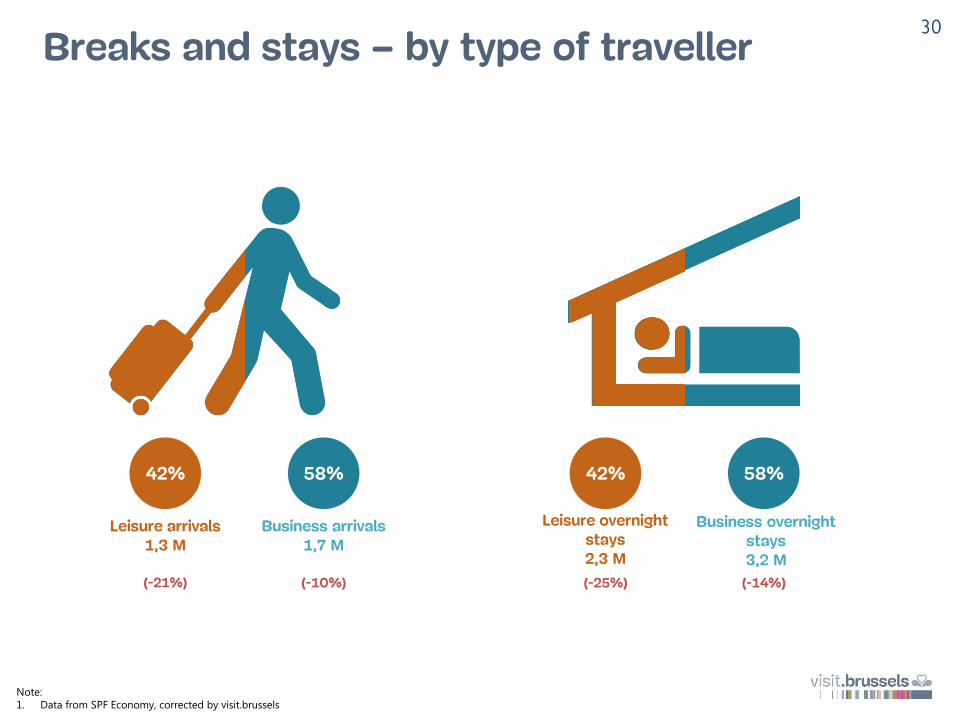
58%
Business arrivals1,7 M
42%
Leisure arrivals1,3 M
58%
Business overnightstays3,2 M
42%
Leisure overnightstays2,3 M
30
(-25%) (-14%)(-21%) (-10%)
Note:
1. Data from SPF Economy, corrected by visit.brussels
Breaks and stays – by type of traveller

3,5%
Youthaccommodation
105,2 k
0,4%
Guest rooms11,99 k
96,1%
Hotels2,88 M
3,7%
Youthaccommodation
202,99 k
0,5%
Guest rooms27,42 k
95,8%
Hotels5,27 M
31
(-4%) (-15%) (-24%) (-4%) (-19%) (-22%)
Note:
1. Data from SPF Economy, corrected by visit.brussels
Breaks and stays – by type of accommodation

Jan Feb Mar Apr May Jun Jul Aug Sep Oct Nov Dec
213k 243k 232k 215k 246k 257k 238k 215k 268k 296k 285k 295k
400k 435k 434k 400k 439k 463k 447k 419k 485k 538k 504k 532k-8.4% -2.2% -22.8% -33.9% -33.3% -28.2% -27.5% -35.5% -23.4% -17.6% +11.1% +23.5%
-6.2% -0.4% -21.3% -31.4% -29.1% -24.1% -24.0% -30.3% -18.2% -14.3% +16,7% +28,1%
32
Note:
1. Data from SPF Economy, corrected by visit.brussels
Breaks and stays – evolution of arrivals and overnight stays

4%110k
2%71k
1%26k
1%25k
1%19k
24%761k
Belgium
France
Germany
Netherlands
United Kingdom
USA Others
Spain
Italy
China
Brazil
Russia
India
23%690k
13%391k
8%236k
7%205k
6%168k
5%151k
5%149k
33
Notes:
1. Data from SPF Economy, corrected by visit.brussels
2. Pictographs of countries courtesy of icons8.com
Tourists on breaks and stays – major markets
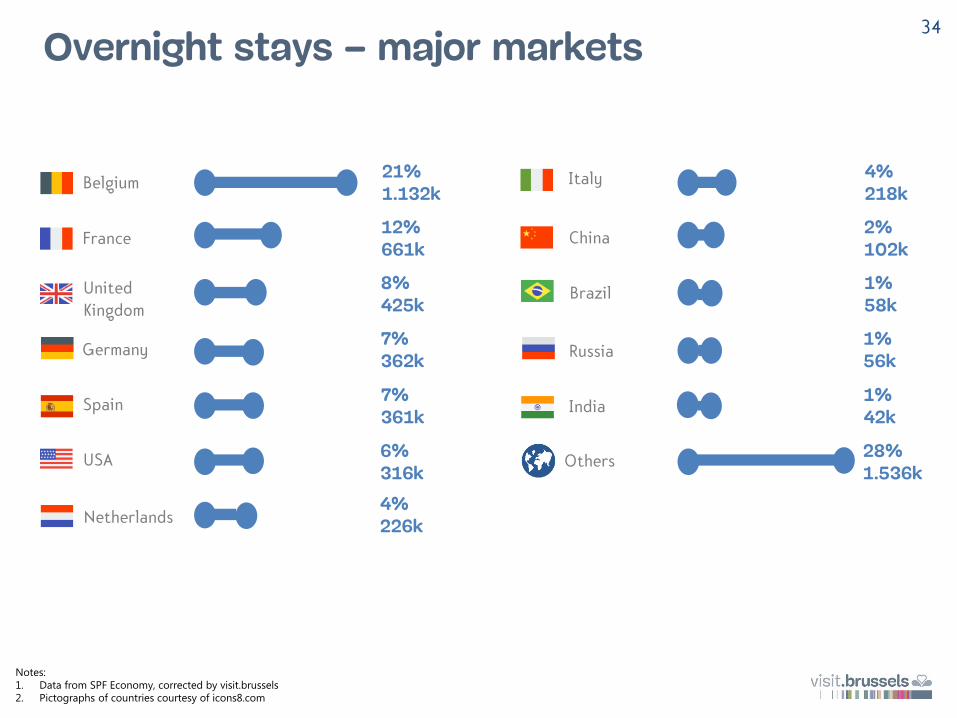
4%218k
2%102k
1%58k
1%56k
1%42k
28%1.536k
Belgium
France
Germany
Netherlands
United
Kingdom
USA Others
Spain
Italy
China
Brazil
Russia
India
21%1.132k
12%661k
8%425k
7%362k
7%361k
6%316k
4%226k
34
Notes:
1. Data from SPF Economy, corrected by visit.brussels
2. Pictographs of countries courtesy of icons8.com
Overnight stays – major markets

Belgium
France
Germany
United
Kingdom
36% 64%
47% 53%
41% 59%
41% 59%
44% 56%
USA
Spain
Italy
Netherlands
Others
China
Brazil
Russia
India
60% 40%
37% 63%
40% 60%
64% 36%
49% 51%
41% 59%
40% 60%
57% 43%
35
Leisure Business Leisure Business
Notes:
1. Data from SPF Economy, corrected by visit.brussels
2. Pictographs of countries courtesy of icons8.com
Overnight stays – types of stay

Overnight stays per commune
Note:
1. Data from SPF Economy
36
Autres
Brussels1 54%
Saint-Josse-ten-Noode2 11%
Saint-Gilles3 11%
Ixelles4 7%
Molenbeek-Saint-Jean5 5%
Etterbeek6 3%
Anderlecht7 2%
Evere8 2%
Woluwe-Saint-Lambert9 1%
Schaerbeek10 1%
2%
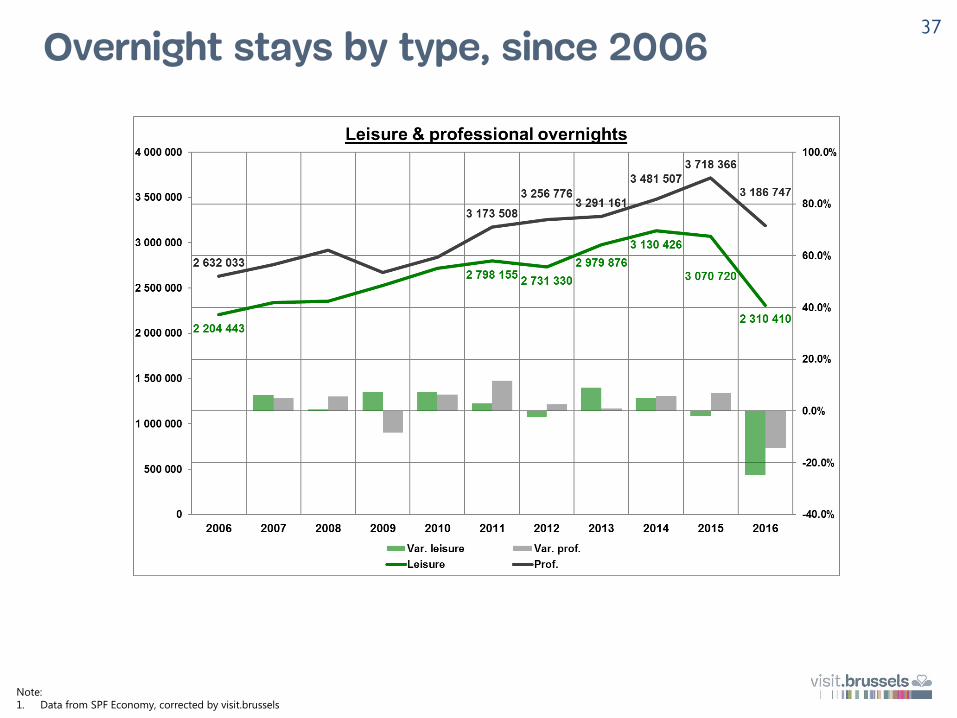
Overnight stays by type, since 200637
Note:
1. Data from SPF Economy, corrected by visit.brussels
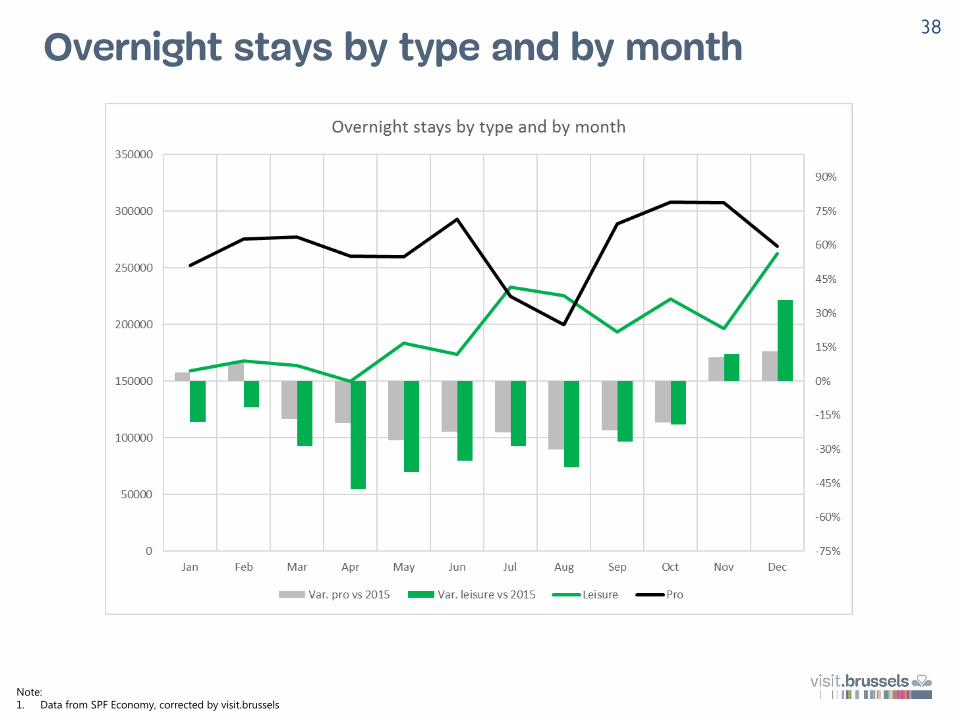
38
Note:
1. Data from SPF Economy, corrected by visit.brussels
Overnight stays by type and by month

39
Note:
1. Data from SPF Economy, corrected by visit.brussels
Overnight stays by month & type of accommodation

Belgium France
40
Notes:
1. Data from SPF Economy, corrected by visit.brussels
2. Pictographs of countries courtesy of icons8.com
Overnight stays – evolution of the markets

United Kingdom Germany
41
Notes:
1. Data from SPF Economy, corrected by visit.brussels
2. Pictographs of countries courtesy of icons8.com
Overnight stays – evolution of the markets

USASpain
42
Notes:
1. Data from SPF Economy, corrected by visit.brussels
2. Pictographs of countries courtesy of icons8.com
Overnight stays – evolution of the markets
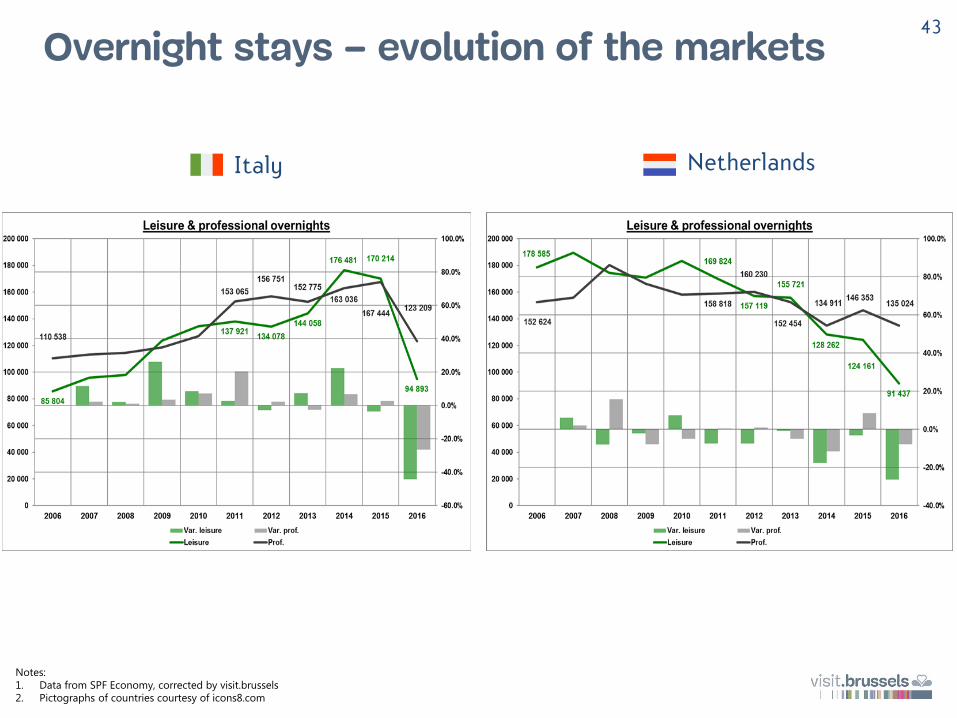
NetherlandsItaly
43
Notes:
1. Data from SPF Economy, corrected by visit.brussels
2. Pictographs of countries courtesy of icons8.com
Overnight stays – evolution of the markets
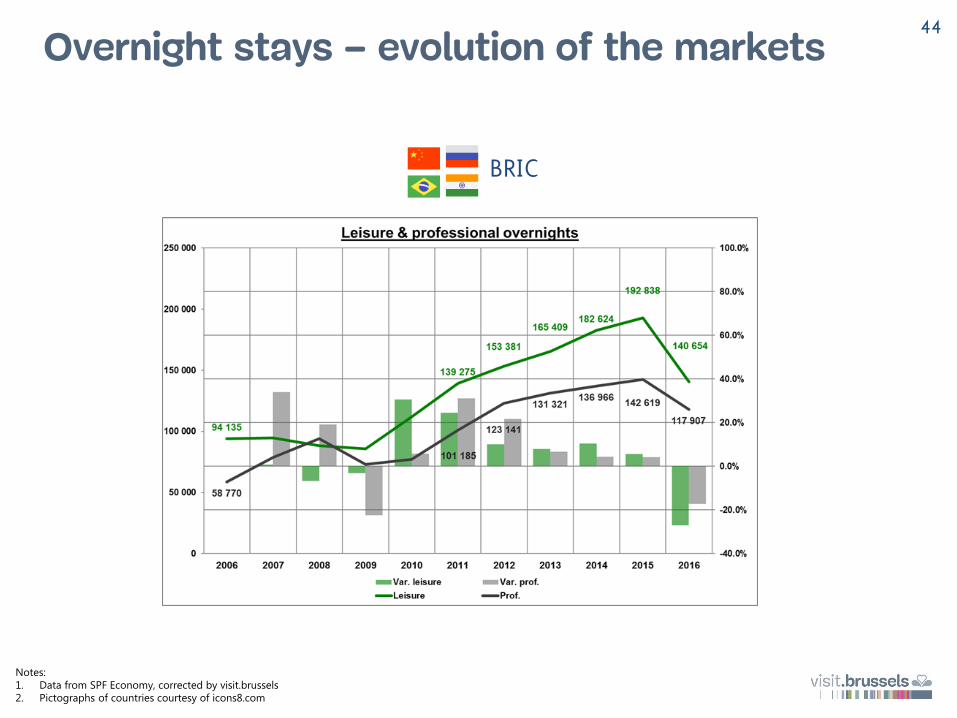
BRIC
44
Notes:
1. Data from SPF Economy, corrected by visit.brussels
2. Pictographs of countries courtesy of icons8.com
Overnight stays – evolution of the markets
45
2
Congresses &meetings

46
Congresses & meetings
In 2016, Brussels became the first destination for the organisation of international congressesand meetings worldwide. This position is connected to the city’s status as the capital of Europe,but also comes from the quality of the infrastructure and services on offer for organisers.
Information and data relating to congress and meetings venues comes from visit.brussels’ annual“Let’s meet” brochure.
The number of meetings recorded by the Union of International Associations (UIA) includes type A and type B meetings. The criteria are:
• Minimum 300 participants (type B)• Minimum 50 participants (type A)• Minimum 40% foreign participants (type B)• Minimum 5 nationalities present (type B)• Minimum duration: 3 days (Type B)
Those recorded by the International Congress & Convention Association (ICCA) fulfil thefollowing criteria:
• Gather at least 50 participants• To be organised in at least three different countries• Encounters with at least three different nationalities
Note:
1. Source: Let’s Meet in Brussels 2017
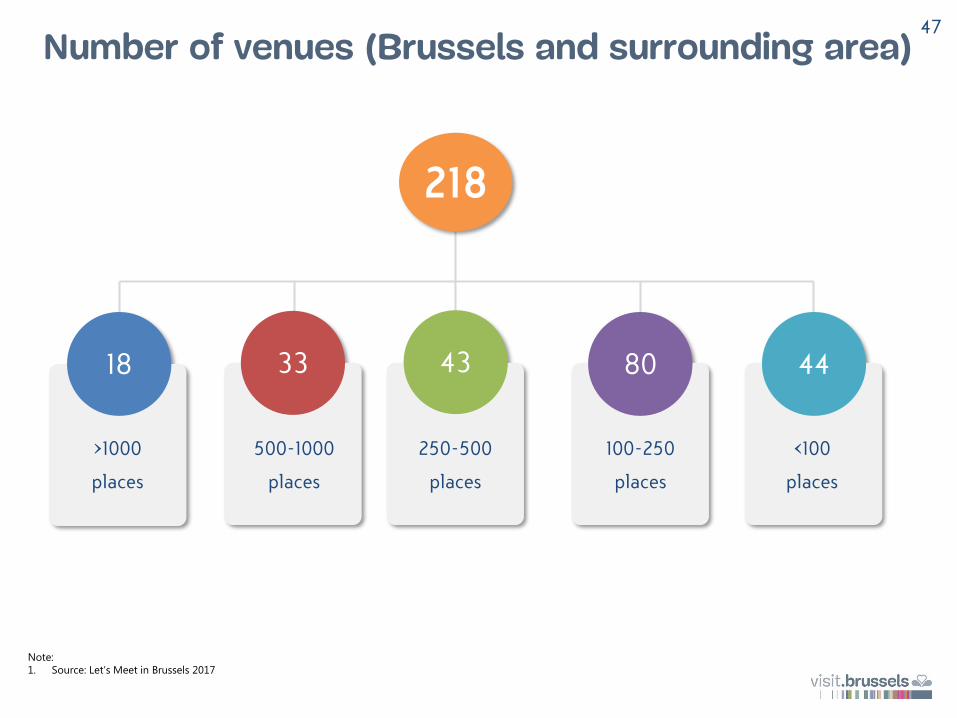
218
18 33 80 44
>1000
places
43
500-1000
places
250-500
places
100-250
places
<100
places
47
Number of venues (Brussels and surrounding area)
Note:
1. Source: Let’s Meet in Brussels 2017
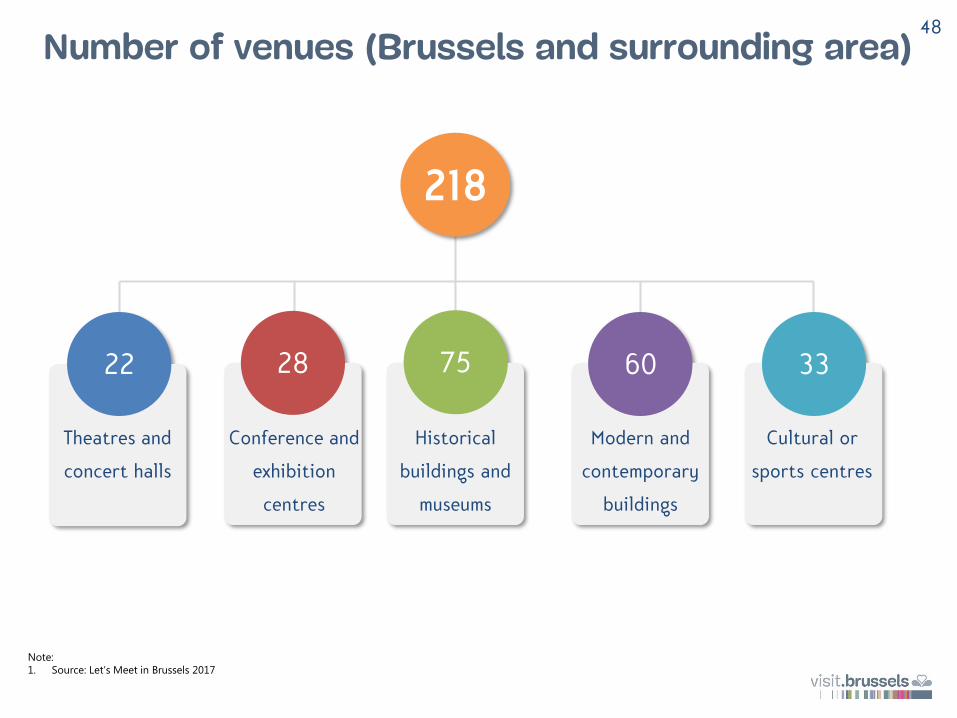
218
22 28 60 3375
48
Number of venues (Brussels and surrounding area)
Theatres and
concert halls
Conference and
exhibition
centres
Historical
buildings and
museums
Modern and
contemporary
buildings
Cultural or
sports centres

Note:
1. Source: Let’s Meet in Brussels 2017
43 54 11
49
Number of hotels with convention hall(s)

Note:
1. Source: UIA ranking, (type A+B)
Paris342 (-20)
4
Brussels906 (+241)
1
Singapore888 (+152)
2
Vienna304 (-4)
5
Seoul526 (+32)
3
50
Number of international associations gatherings (UIA)
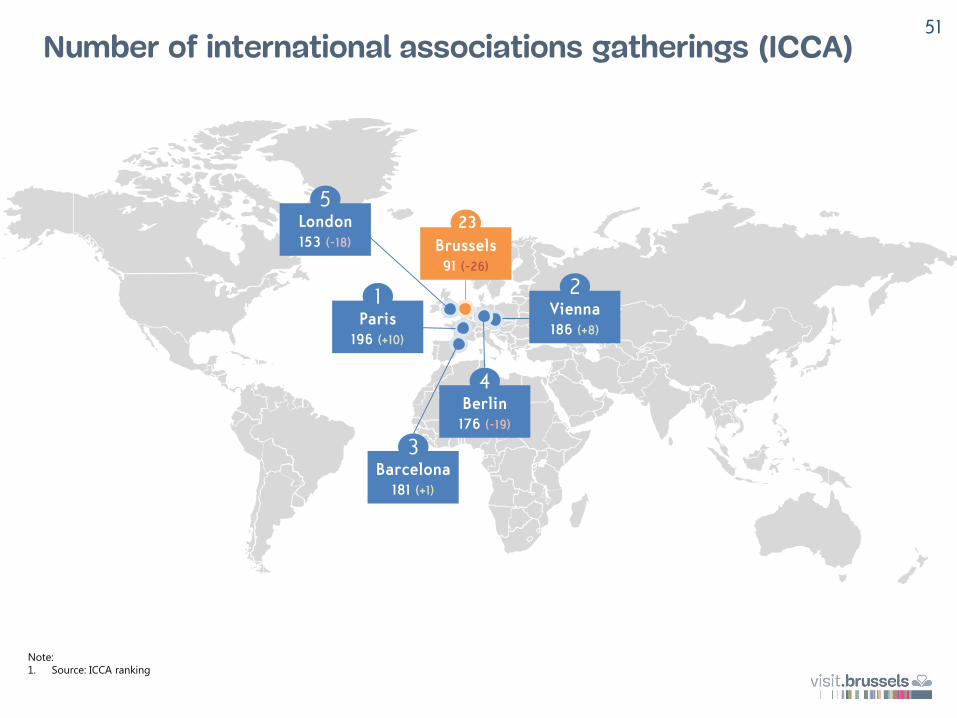
Note:
1. Source: ICCA ranking
Paris196 (+10)
1
Brussels91 (-26)
Vienna186 (+8)
2
Berlin176 (-19)
4
23
Barcelona181 (+1)
3
London153 (-18)
5
51
Number of international associations gatherings (ICCA)

52
Major fairs
Numerous fairs are organised in Brussels, both for professionals and the general public. Theseevents take place, more often than not, at Brussels Expo or Tour et Taxis and can benefit fromthe support and advice of visit.brussels.
The figures presented in this section were relayed by events organisers, via the press or on theevents’ websites.
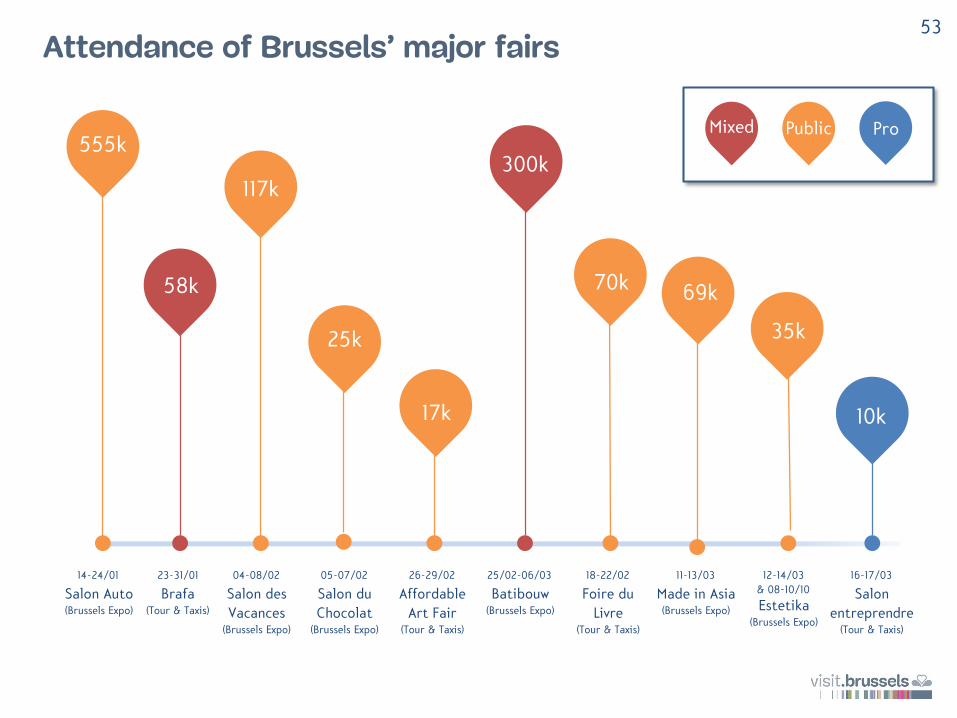
14-24/01
Salon Auto(Brussels Expo)
55k
23-31/01
Brafa(Tour & Taxis)
555k
58k
117k
04-08/02
Salon des
Vacances(Brussels Expo)
25k
05-07/02
Salon du
Chocolat(Brussels Expo)
17k
26-29/02
Affordable
Art Fair(Tour & Taxis)
300k
25/02-06/03
Batibouw(Brussels Expo)
18-22/02
Foire du
Livre(Tour & Taxis)
70k 69k
11-13/03
Made in Asia(Brussels Expo)
35k
12-14/03
& 08-10/10
Estetika(Brussels Expo)
16-17/03
Salon
entreprendre(Tour & Taxis)
10k
Mixed Public Pro
53
Attendance of Brussels’ major fairs

55k
26-28/04
Seafood(Brussels Expo)
25k25k
97,5k
22-24/05
Art Brussels(Tour & Taxis)
29k
24-26/05
Realty(Tour & Taxis)
13k
15-23/10
Salon de
l’alimentation(Brussels Expo)
121k
21-24/10
Megavino(Brussels Expo)
18,3k
06-09/11
Salon du
meuble(Brussels Expo)
19-27/11
Cocoon(Brussels Expo)
Mixed Public Pro
25k
6,6k
25k
75k
54
Attendance of Brussels’ major fairs (2)

55
3
Tourism culturalservices

56
Museums & attractions
Brussels has an exceptional cultural offer. Visitors and inhabitants can enjoy 120 diverse museums and attractions, some of which have become symbols for the whole of Belgium.
The number of museums is based on a list provided by the Conseil Bruxellois des Musées(Brussels’ Museums Council) on its website.
Figures for Brussels’ museums and attractions are estimated based on the collection of attendance numbers (for permanent collections and temporary exhibitions) of a panel of museums and attractions:
MIM, MIMA, Maurice Carême Museum, Charlier Museum, Maison du Roi, Brussels Aquarium, René Magritte Museum,
BELvue, Belgian Comic Strip Centre, Maison Autrique, Belgian Museum of Free-Masonry, Costume and Lace
Museum, Cinquantenaire Museum, Atomium, Cacoa and Chocolate Museum, Marc Sleen Museum, Combine
Coudenberg-BELVue, Schaerbeek Beer Museum, Autoworld, Children’s Museum, Museum of the National Bank of
Belgium, Parlamentarium, BIP - Experience Brussels, Toy Museum, Mini-Europe, Editions Jacques Brel, BOZAR,
Royal Institute of Natural Sciences, La Fonderie, Planetarium, Bruxella 1238, Sewers Museum, Museum of Old
Techniques, Maison Horta, Train World, Halle Gate Museum, Coudenberg and Océade.
Attendance of major temporary exhibitions and recurring cultural events was relayed by the organisers. The Brussels Card results were collected by visit.brussels.

20162015
3.36M
2.77M
Jan Fev Mar Avr Mai Jun Jul Aou Sep Oct Nov Dec
237k 231k
213k209k
162k
241k
279k
193k
257k
273k279k
190k
(-7.0%)
(-6.1%)(-21.3%)
(-36.2%)(-37.2%)
(-33.5%)
(-25.2%)
(+20.8%)(+27.1%)
(-18.1%)
(-9.7%)
(-29.5%)
57
Museums & attractions – evolution of visitors (vs. 2015)
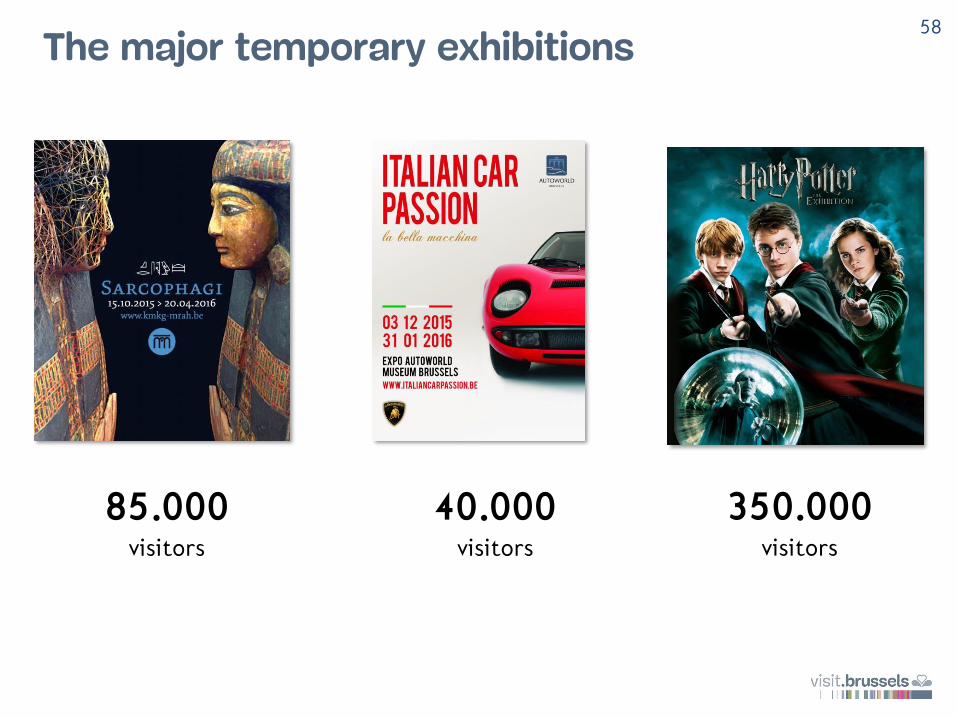
85.000visitors
40.000visitors
350.000visitors
58
The major temporary exhibitions

Fev Mar Avr Mai Jun Jul Aou Sep Oct Nov Dec
672
410
556
683
1293
1632
516
736
673771
644
59
Jan
448
Note:
1. Data from Brussels Card
Brussels Card – analysis of sales figures
The Brussels Card, in its current
format, was launched in mid-
February 2015. It gives holders:
• Free access to 30+ museums
• Discounts to tourist attractions
• Discounts in museum restaurants,
bars…
• Discounts in Brussels shops
In 2016, a total of 8,868 were
purchased (about 39% less
than in 2015).

Brussels Card – analysis of use
Notes:
1. Data from Brussels Card
2. Pictographs of countries courtesy of icons8.com
100 different nationalities
France
United Kingdom
Spain
USA
Belgium
Germany
Italy
Japan
Netherlands
Canada
14%
7%
6%
6%
5%
5%
4%
3%
2%
2%
3,58 visits per card buyer
1 Royal Museum of Fine Arts
2
Choco-Story3
4 Museum of the City of Brussels
Autoworld5
Museum of Belgian Brewers6
7
BELvue Museum8
Museum of Natural Sciences9
Royal Museum of the Armed Forces10
60
Musical Instruments Museum
MOOF

16 kunique visitors
35 k
visitors
18.5 k
visitors
115 k
spectators
52 k
spectators
42 k
visitors
40 k
spectators
61
Recurring paid events
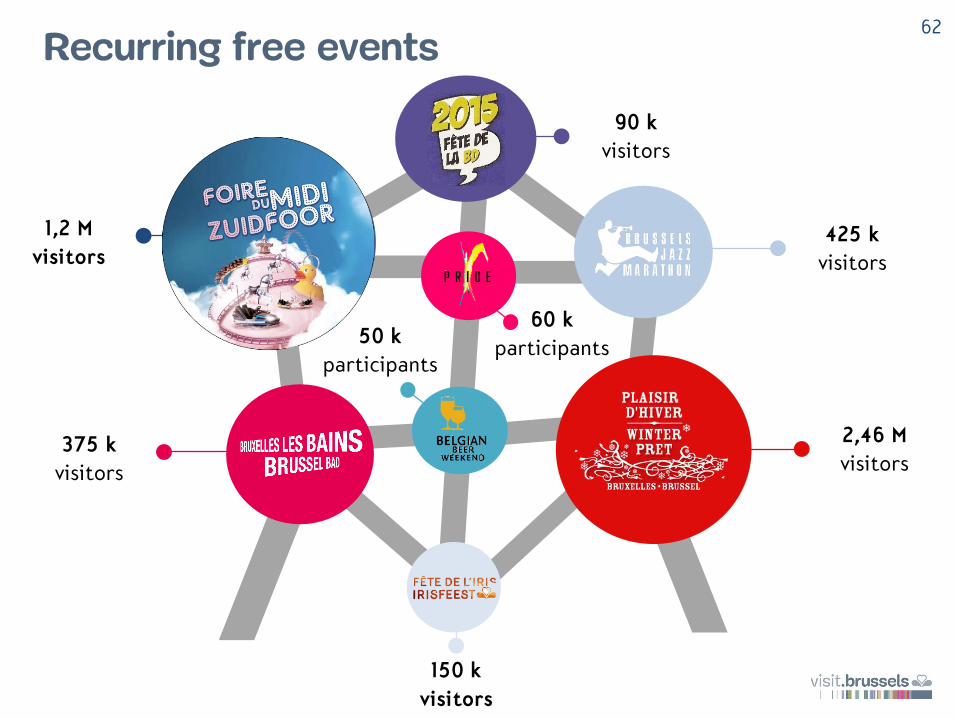
50 k
participants
60 k
participants
90 k
visitors
150 k
visitors
1,2 M
visitors
375 k
visitors
425 k
visitors
2,46 M
visitors
62
Recurring free events
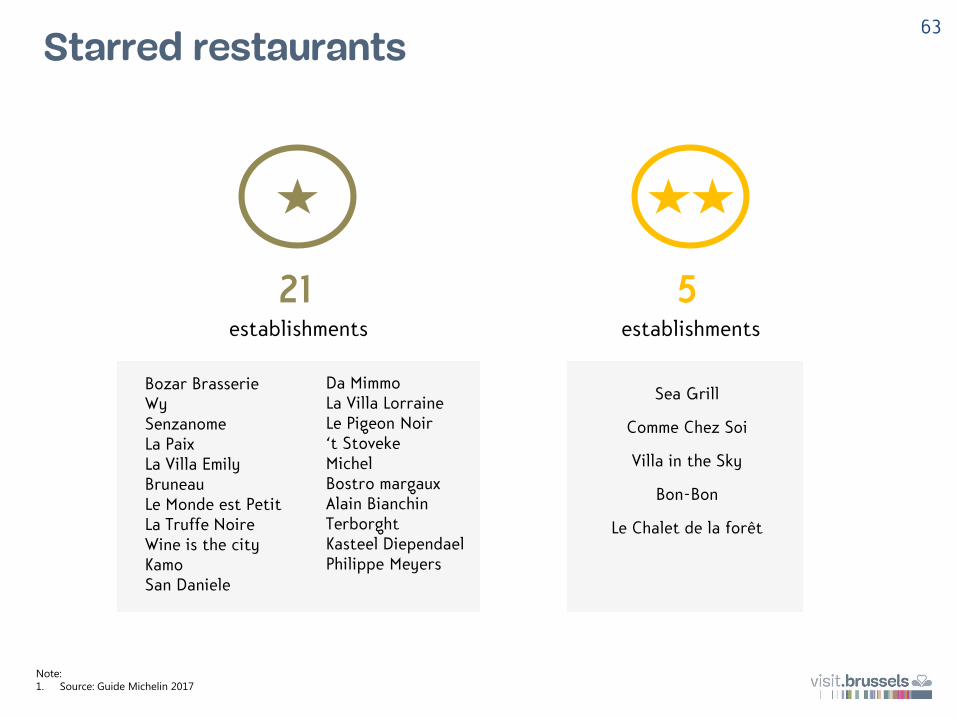
Starred restaurants63
21establishments
5establishments
Bozar BrasserieWySenzanomeLa PaixLa Villa EmilyBruneauLe Monde est PetitLa Truffe NoireWine is the cityKamoSan Daniele
Da MimmoLa Villa LorraineLe Pigeon Noir‘t StovekeMichelBostro margauxAlain BianchinTerborghtKasteel DiependaelPhilippe Meyers
Sea Grill
Comme Chez Soi
Villa in the Sky
Bon-Bon
Le Chalet de la forêt
Note:
1. Source: Guide Michelin 2017
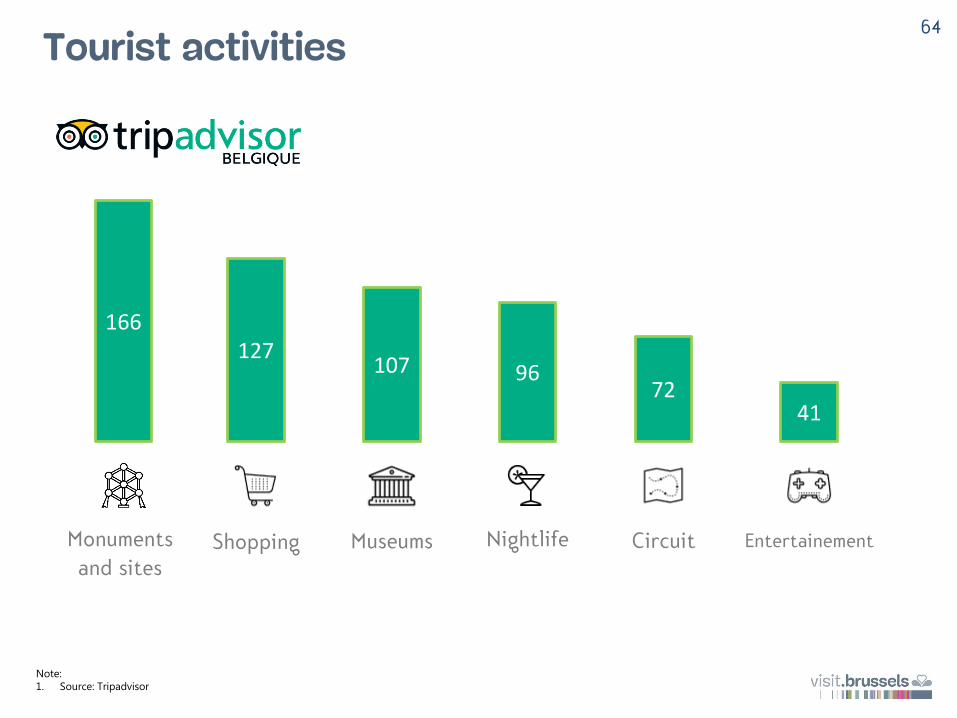
Tourist activities64
Note:
1. Source: Tripadvisor
Monuments
and sites
166
Shopping
127
Museums
107 96
Nightlife Circuit
72
Entertainement
41
65
Guided tours
Several organisms offer guided tours to visitors in Brussels. Furthermore, some locals, throughthe Greeters network, offer their preception of the capital through free tourism encounters and experiences.
The figures presented here have come from the visit.brussels guided tours barometer.
This report was put together using data collected from a panel of guided tour organisms in Brussels.
The panel collected data from the following 19 organisms:
Arau, Arkadia, Brukselbinnenstebuiten, Brussels on Wheels, Brussels Sight Jogging, Bruxelles Bavard, CAP-ERIA,
Cercle des Guides-Nature du Brabant, Discover-B, La Fonderie, Guides Bruxelles Belgique, Itinéraires, Klare Lijn,
Laeken Découverte, Once in Brussels, Pro Velo, Q-rius, Tochten van Hoop, Voir et Dire Bruxelles.

20162015
157k
130k
Jan Feb Mar Apr May Jun Jul Aug Sep Oct Nov Dec
5,6k
6,6k
8k
13,8k
17,3k
14,7k
5,1k5,7k
23,6k
13,2k
9,7k
6,7k(+3,5%)
(+25,4%)
(-25,1%)
(-5,6%)
(-5,9%)
(-16,5%)
(-36,6%) (-35,9%)
(-23,1%)
(-37,4%)
(+9,8%)
(+1,1%)
66
Guided tours – evolution of visitor numbers (vs. 2015)

Guided tours – greeters
Visitors by country of origin
France 40 %
Belgium 18 %
USA 11 %
Germany 20 %
Italy 6 %
Spain 8 %
Canada 6 %
United Kingdom 4 %
67
Note:
1. The distribution according to the country of origin is based on data between September and December only
Greeters are Brussels volunteers who are
passionate about their city. They
introduce visitors to “their” Brussels:
their favorite spots, their advice and
their anecdotes. The Greeters of Brussels
offer visitors a unique and authentic
experience filled with encounters,
exchange and discovery.
In 2016, the Greeters network carried
out 513 Greets and welcomed visitors in
12 different languages.

68
4
Transport & mobility

69
Air transport
Visitors coming to Brussels by plane arrive primarily at one of two airports: Brussels Airport inZaventem and Brussels South Airport, in Charleroi.
Brussels Airport, Belgium’s largest airport, welcomes both passenger and cargo flights. It hasthree runways and flies to almost every continent. It is notably one of the main ways to reachcentral Africa from Europe.
When it comes to passenger flights, Charleroi airport, the country’s second-largest airport,welcomes mostly low-cost airlines. It has one runway and is used primarily to fly to Europe andNorthern Africa.
These two airports represent two major entry points for tourists travelling to Brussels. In thischapter we will analyse the figures provided by both airports.

Note:
1. Source: Brussels Airport / Brussels South Charleroi Airport
21,8 Mpassengers
7,3 Mpassengers
70
-7% +5%
Number of passengers in the airports

Note:
1. Source: Brussels Airport / Brussels South Charleroi Airport
71
Evolution of number of passengers by airport

Note:
1. Source: Brussels Airport
72
Passengers per month at Brussels Airport

Note:
1. Source: Brussels Airport
73
80%
20%
Types of passenger at Brussels Airport
Passengers for whomBrussels is their startingpoint or destination
Transit passengers

Note:
1. Source: Brussels Airport
74
29 july
16 sept.
25 july.
1 aug.
9 sept.
86.571 passengers
86.125 passengers
85.818 passengers
85.431 passengers
84.327 passengers
1
2
3
4
5
4 apr.
5 apr.
22 mar.
6 apr.
7 apr.
3.368 passengers
8.699 passengers
9.444 passengers
16.143 passengers
19.763 passengers
1
2
3
4
5
Busiest and quietest days at Brussels Airport
Note:
1. Source: Brussels Airport
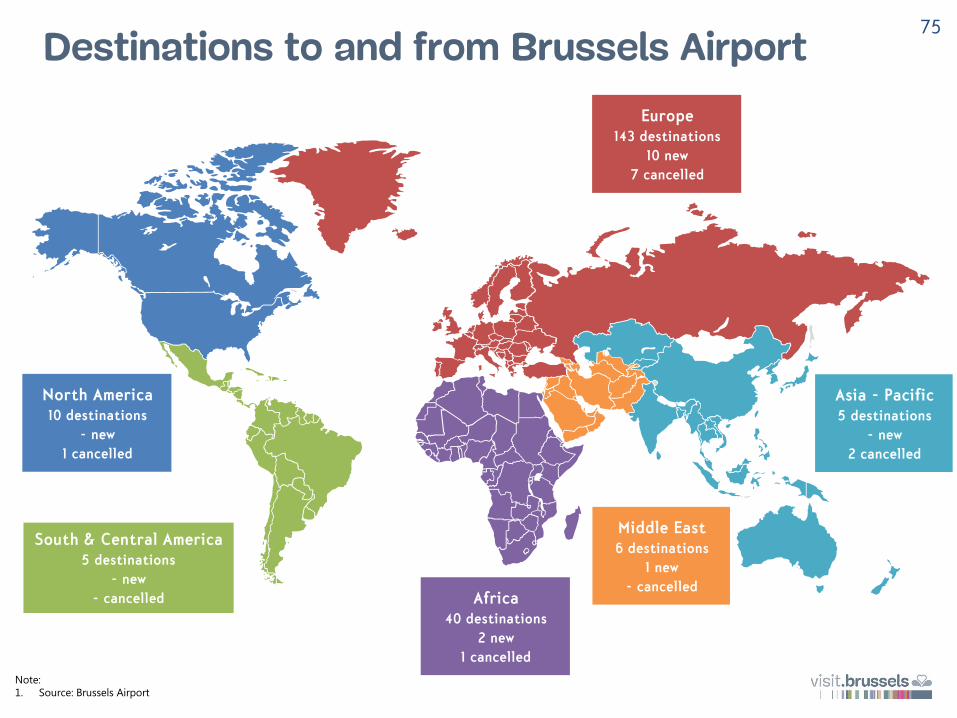
Europe143 destinations
10 new
7 cancelled
Africa40 destinations
2 new
1 cancelled
South & Central America5 destinations
- new
- cancelled
North America10 destinations
- new
1 cancelled
Asia - Pacific5 destinations
- new
2 cancelled
Middle East6 destinations
1 new
- cancelled
75
Destinations to and from Brussels Airport

Note:
1. Source: Brussels Airport
Barcelona889k (+3%)
1
Madrid763k (-5%)
2
Lisbon698k (-4%)
5
Rome713k (-10%)
3
London587k (-19%)
6
Geneva545k (-4%)
7
Milan492k (-9%)
9
Malaga499k (+8%)
10
Berlin703k (+38%)
4Frankfurt518k (+10%)
76
8
Top 10 destinations to and from Brussels Airport – Europe

Note:
1. Source: Brussels Airport
New-York441k (-27%)
1
Tel-Aviv267k (-8%)
2Washington
212k (-4%)
3
Dubai187k (-11%)
4
Montreal175k (-3%)
5
Abu Dhabi144k (-16%)
7
Casablanca142k (-11%)
8
Pékin108k (-5%)
9Doha157k (+6%)
6
77
10Bangkok101k (+1%)
Top 10 destinations to and from Brussels Airport – Outside Europe

78
Urban mobility
As it is for all modern metropoles, mobility is crucial to the Brussel-Capital Region. Offeringproper transport facilities is also a key factor for the city’s attractiveness to tourists. The“Bruxelles Mobilité” regional agency defines the city’s mobility strategies and manages the publictransport network.
This section presents the key figures concerning the city’s public transport offer, as well as theaccessibility of key infrastructures to Persons with Reduced Mobility (PMR).

Mobility – public transports
Note:
1. Source: STIB et Villo
360 5000 40k 70k 1,57M
stations bikes long-term
subscribers
short-
term
rentals
40
km
139
km
445
km2200 370M
metro
lines
tram
lines
bus
lines
stops trips
79

Mobility – railways
Note:
1. Source: SNCB 2015
80
32 222 k
stations travellers
per day(mid-week)
Top 10 travellers/day (mid-week)
1 Brussels-North
2 Brussels-Midi
Brussels-Central3
4 Brussels-Luxembourg
Brussels-Schuman5
Etterbeek6
Schaerbeek7
Jette8
Merode9
Bockstael10
63.104
62.545
61.099
7.109
6.501
4.894
3.180
2.824
900
899

Mobility – accessibility
Notes:
1. Source data: Brussels Pour Tous, Let’s Meet 2016 and STIB
2. Source pictographs: Candice Gras
81
100
38
114
24
34
69
Equipped to transport wheelchairs
Taxis
Equipped with lifts
Metro stations
Accessible to PRM
SNCB stations
Accessible to PRM
Theatres and show venues
Accessible to PRM
Museums
Accessible to PRM
Hotels and hostels

82
5
Quality of thedestination

83
Visitor satisfaction
Global tourism is a more and more competitive market. To best position itself in this market,Brussels needs to pay constant attention to the satisfaction of its visitors. Because of this,visit.brussels carries out visitor satisfaction surveys every month, as part of the creation of a planfor tourism quality in Brussels. The satisfaction survey is available on the visit.brussels website.
The questionnaire is voluntarily filled in by tourists to Brussels. Interviews are also randomlycarried out in the tourist quarters. In total, 429 people completed the survey in 2016.
It’s important to note that the sample, therefore, does not fully represent Brussels’ touristpopulation. Business tourists are under-represented. Nevertheless, trends observed in the figuresgive an interesting insight into the opinion of tourists and their priorities when they travel.

33%
57%
8%
2%
46%
42%
7%
4%
55%
28%
10%
6%
57%
30%
8%
5%
84
+5pts *
-10pts ***
+3pts **
+2pts **
+1pt.
+2pts * +2pts**
+1pts
+3pts
+1pts
+6pts
-8pts**
-4pts. -6pts**
-
-
*** = significant at 99% ** = significant at 95% * = significant at 90%
Global satisfaction of visitors
General satisfaction Overall my stay lived up to expectations
I hope to return to Brussels I would recommend Brussels to my peers

1
2
3
4
5
1
2
3
4
5
Ease of parking
Accessibility for persons with reduced
mobility
Climate
Cleanliness of public spaces
Accommodation is confortable
Host staff is welcoming and ready to help
Diversity of the restaurants
Bars, cafés & clubs
85
Top highest scorers5 Top lowest scorers5
Marks for different tourism elements in Brussels given by visitors
Information available in my language
Mobile technology availability
(Wi-Fi…)
86
Brussels Quality Academy
As part of the creation of a plan for quality tourism, an awareness campaign called the “BrusselsQuality Academy” provides training sessions for members of the Brussels’ tourism sector. Theaim is to raise awareness of the Brussels-Capital Region’s treasures and special features.
Most of the sessions are open to all members of the tourism sector and certain, morespecialised, training courses are aimed at specific providers (hotels, catering, etc.). The themesare wide-ranging and can cover Brussels’ museums, Art Nouveau, the Brussels identity,surrealism, etc. In all, a total of 41 sessions were organized in 2016.

Brussels Quality Academy 2016 – Training courses organised87
Sessions29
Hours87
Participations670
General sessions:
Sessions8
Hours24
Participations130
Brussels Experts (hotels)
Sessions4
Hours32
Participations52
Horeca courses:
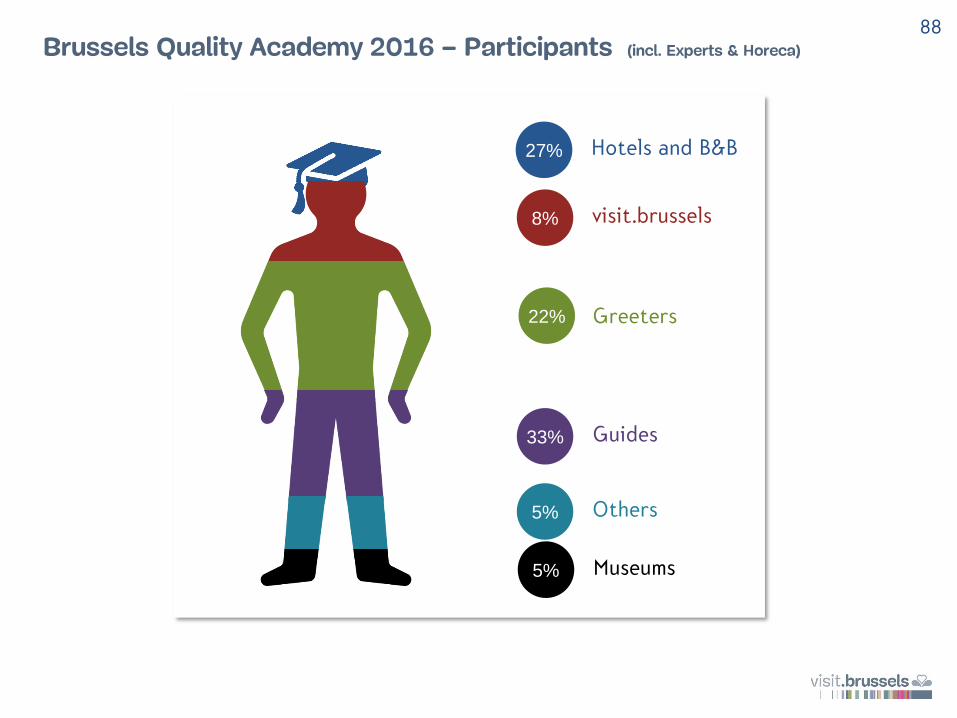
Brussels Quality Academy 2016 – Participants (incl. Experts & Horeca)
88
Hotels and B&B27%
visit.brussels8%
Greeters22%
Guides33%
Others5%
Museums5%

89
6
Sustainable tourism

The eco-labels90
The international “Green Key”
The Green Key is the international eco-label chosen by 2,500 tourism establishments in 53 countries around the world.
It is awarded annually to the tourism facilities, hotels, guest rooms, youth hostels, campsites, conference centres and
attractions based on criteria related to general environmental management; waste, water, energy and green space
management; environmental education, mobility, …
Through these criteria, the Green Key programme aims to promote sustainable development within tourist infrastructures.
The regional “Entreprise éco-dynamique” (Eco-dynamic company) label
It is awarded to Brussels companies and associations - whether small or large, public or private - that have put in place
environmental management practices.
Some of these practices included rational waste management, constant efforts to save energy, incentives and facilities to
promote less polluting forms of mobility, etc.
Companies and associations can be awarded one, two or three stars depending on their accomplishments. Bridges and links
are organised with the Green Key label.
Eco-management and Audit System (EMAS)
The Eco-Management and Audit Scheme (EMAS) is a premium management instrument for companies and other organisations
to evaluate, report, and improve their environmental performance.
The system has existed since 1995. Back then it was only for companies in industrial sectors.
Since 2001, the EMAS has been accessible to all sectors of the economy, including the private and public services.
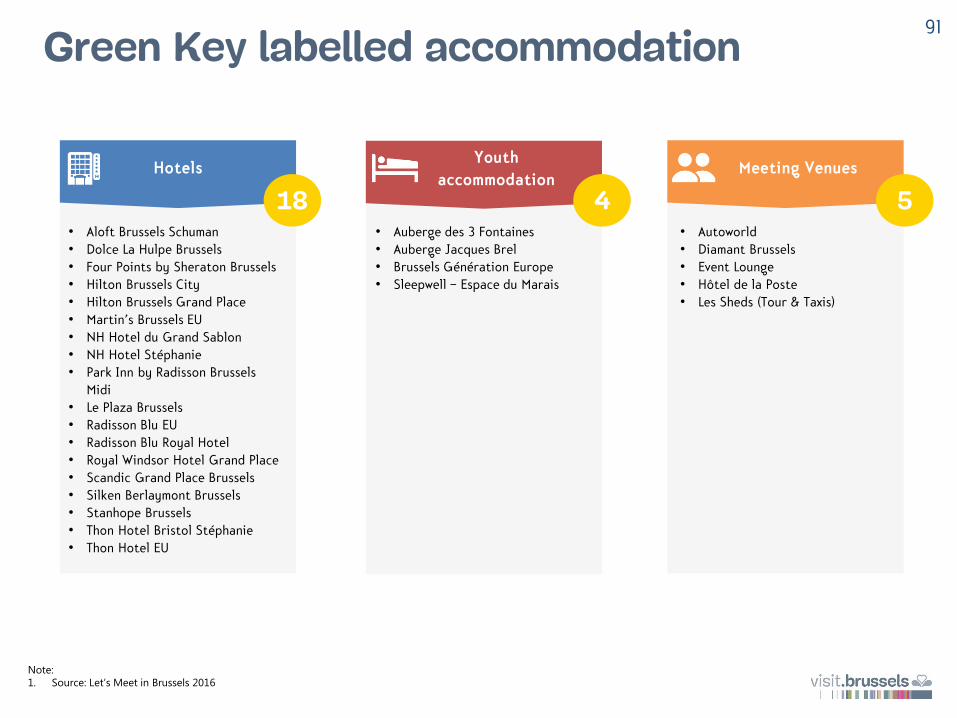
Hotels Meeting Venues
• Aloft Brussels Schuman
• Dolce La Hulpe Brussels
• Four Points by Sheraton Brussels
• Hilton Brussels City
• Hilton Brussels Grand Place
• Martin’s Brussels EU
• NH Hotel du Grand Sablon
• NH Hotel Stéphanie
• Park Inn by Radisson Brussels
Midi
• Le Plaza Brussels
• Radisson Blu EU
• Radisson Blu Royal Hotel
• Royal Windsor Hotel Grand Place
• Scandic Grand Place Brussels
• Silken Berlaymont Brussels
• Stanhope Brussels
• Thon Hotel Bristol Stéphanie
• Thon Hotel EU
• Auberge des 3 Fontaines
• Auberge Jacques Brel
• Brussels Génération Europe
• Sleepwell – Espace du Marais
• Autoworld
• Diamant Brussels
• Event Lounge
• Hôtel de la Poste
• Les Sheds (Tour & Taxis)
18 4 5
91
Note:
1. Source: Let’s Meet in Brussels 2016
Green Key labelled accommodation
Youth
accommodation

Hotels Meeting Venues
• Martin’s Brussels EU
• Martin’s Grand Hotel
• Silken Berlaymont Brussels
• Four Points by Sheraton Brussels
• Hilton Brussels Grand Place
• Le Plaza Brussels
• Radisson Blu EU
• Radisson Blu Royal
• Royal Windsor Hotel Grand Place
• Sheraton Brussels
• Stanhope Brussels
• Thon Hotel EU
• La Légende
• The Dominican
• Rocco Forte Amigo
Sleepwell – Espace du Marais• Banque Nationale de Belgique
• Ancienne Belgique
• BOZAR
• La Monnaie
• Musée des Sciences Naturelles
• Musée du Tram
• Les Sheds (Tour & Taxis)
15 1 7
92
Note:
1. Source: Let’s Meet in Brussels 2016
Eco-dynamic company eco-labelled accommodation
Youth
accommodation

Note:
1. Source: Let’s Meet in Brussels 2016
Hotels Meeting Venues
• Martin’s Château du Lac
• Martin’s Grand Hotel
• Martin’s Brussels EU
• Martin’s Lido
4 0 0
93
EMAS-labelled accommodation
Youth
accommodation

94
Exemplary buildings
Since 2007, the Brussels-Capital Region has announced calls for projects in an attempt to enhance and promote the construction or renovation of “Bâtiments Exemplaires” or “Exemplary Buildings”.
The objective is to show that it’s possible to obtain great energy saving and environmentally friendly results with a reasonable budget.
In 2007, the Brussels-Capital Region didn’t yet have a single passive building. Following the calls for projects, the surface area of passive buildings in Brussels should pass 350,000 m² in 2017.
Exemplary buildings in which you can rent a room:
• Cygnes-Digue - Maison de quartier Malibran• Mundo-B • Philanthropy House (Bâtiment Exemplaire Royale 94)• Hotel Meininger (Bâtiment Exemplaire Belle-Vue)• Hotel Belvue (Bâtiment Exemplaire Quai du Hainaut)

Exemplary buildings95
243projects
62 Hasurface
33M €regional
support
96
Green spaces
Brussels is a particularly green capital city. The preservation of these spaces is of course anecessity for both their ecological richness and the quality of life of Brussels’ inhabitants.
Furthermore, there presence also brings other advantages, notably their recreational,landscaping and town-planning aspects. These advantages are draws for tourists staying inBrussels.
Green spaces are, however, under pressure and it is therefore important to have at one’s disposalthe tools and strategy necessary to defend and showcase them. These missions andresponsibilities lie with the “Bruxelles Environnement” agency.
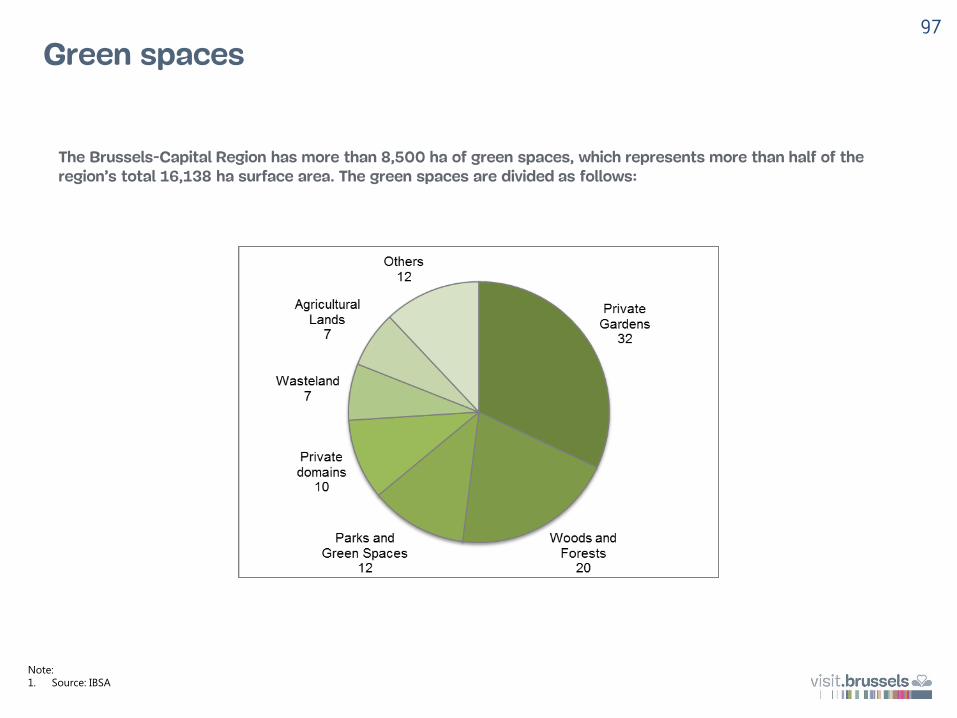
Green spaces
Note:
1. Source: IBSA
97
The Brussels-Capital Region has more than 8,500 ha of green spaces, which represents more than half of the region’s total 16,138 ha surface area. The green spaces are divided as follows:

Green spaces
Nature reserves Forest reservesArcheological reserves
Le MoeraskeLe marais de Ganshoren
Le marais de JetteLe Poelbos
Le bois du LaerbeekLe Zavelenberg
La roselière du Parc des SourcesLa réserve naturelle du Rouge-Cloître
Le Vallon des Enfants NoyésLe Vallon du Vuylbeek
Le Vallon des Trois-FontainesLa mare du Pinnebeek
Le VogelzangbeekLe Kinsendael-Kriekenput
La réserve archéologique des Tumuli
La réserve archéologique de « Boitsfort-Etang »
La réserve naturelle du Rouge-Cloître
La réserve forestière du Gripensdelle
14 2 2
98