annual report - ministry for the environment
TRANSCRIPT

C.11
Annual Report Pūrongo ā�Tau
Presented to the House of Representatives pursuant to section 44 of the Public Finance Act 1989
2019/20

Published in November 2020 by the Ministry for the Environment Manatū Mō Te Taiao
23 Kate Sheppard Place, Thorndon PO Box 10362, Wellington 6143, New Zealand
Publication number: ME 1545
Crown copyright © 2020This work is licenced under the Creative Commons Attribution 3.0 New Zealand licence. You are free to copy, distribute, and adapt the work, as long as you attribute the work to the Ministry for the Environment and abide by the other licence terms. To view a copy of this licence, visit http://creativecommons.org/licenses/by/3.0/nz/.
Please note you may not use any departmental or governmental emblem, logo, or coat of arms in any way that infringes any provision of the Flags, Emblems, and Names Protection Act 1981. Use the wording ‘Ministry for the Environment’ in your attribution, not the Ministry for the Environment logo.
This document is available on the Ministry for the Environment website: www.mfe.govt.nz.

Contents
02 Secretary for the Environment
04 Highlights from 2019/20
06 Part one: About us Kōrero mō mātou
26 Part two: Our performance Ngā mahi kua mahia
76 Partthree:Ourfinances Kōrero pūtea

02 ANNUAL REPORT 2019/20
Secretary for the Environment
Kei te tangi a Ranginui
Kei te tangi a Papatūānuku
Kei te rere ngā roimata
Rere ki uta. Rere ki tai.
Kei hea ngā kaitiaki mō
Te Mana o te Wai
Te Mauri o te Wai?
Whakarongo mai!
Whakaoratia!
Hei oranga wairua!
Hei oranga tangata!
Hei oranga mō Aotearoa katoa.
Tu Tumu Whakarae mō Te Taiao
We live in one of the most incredible places on earth, and our natural environment is Aotearoa New Zealand’s greatest taonga. The Ministry for the Environment’s role is to provide policy advice and help implement decisions that protect and improve our natural and built environment, halt environmental degradation, and also mitigate against, and build resilience to, climate impacts. We advise the government on the system for managing natural resources, including rules and policies that regulate activities on land and sea, and the growth of our towns and cities. Our role requires us to think decades ahead, recognising that the full environmental implications of the choices we make today only become clear generations later.
As a Treaty partner to Māori, we are increasing our efforts to incorporate the knowledge and perspectives iwi and Māori bring as kaitiaki and tangata whenua within the work we do. We also support regional New Zealand to implement these policies.
The 2019/20 year has been fundamentally shaped by the global COVID-19 pandemic. The Ministry has been part of the government response on COVID-19 including in passing the COVID-19 Recovery (Fast-track Consenting) Act 2020 and leading the delivery of the cross agency Jobs for Nature programme. We continue to advise on the recovery strategy for New Zealand to ensure it achieves longer term priorities to improve environmental outcomes and transition to a low-emissions economy.
Even with COVID-19, the Ministry has had a successful year in landing significant programmes of work that will have a lasting positive impact for the environment. In November 2019, the Zero Carbon Bill passed into legislation and, soon after, New Zealand’s first-ever Climate Change Commission was established to guide our country’s response to climate change. Significant changes to the Emissions Trading Scheme were introduced with the passing of the Climate Change Response (Emissions Trading Reform) Amendment Act in June 2020.
The Essential Freshwater package, delivered in May 2020, aims to halt the degradation of our lakes, rivers and streams. The Ministry delivered it with guidance from four external advisory

03INTRODUCTION
groups, bringing in perspectives from Māori, the farming and not-for profit sectors, as well as regional councils and scientists. The process involved a new way of working, bringing in perspectives at the front-end of policy development, while engaging with all of New Zealand through an extensive consultation process.
The expansion of the National Waste Levy is a key initiative to move New Zealand towards a low-waste economy with a world-class recycling and resource recovery system employing thousands of New Zealanders.
During the year, we also worked closely with the Ministry of Housing and Urban Development as it established Kāinga Ora – Homes and Communities. The Urban Development Act we developed came into effect in August 2020. The Act provides Kāinga Ora with access to the tools, certainty and coordination needed to enable complex, transformational development that will improve the sustainability of New Zealand’s urban areas.
Wider reform of the Resource Management system is underway, following the delivery of the Resource Management Review Panel’s report.
In the second half of the financial year, much of the Ministry’s important mahi was delivered by people who were working from home. As participants in the public sector’s ‘flexible by default’ programme, our people were well-placed to manage the remote working required as part of the government’s COVID response. The Fast-track Consenting legislation was legislation developed at pace by Ministry teams, as the government introduced a short-term consenting process to fast track projects that will boost employment and economic recovery. I’m very proud of the way our people responded to the challenges of working away from the office while they also managed personal and family responsibilities.
There is much to learn from our country’s COVID-19 response that can be applied to making significant shifts for the environment and climate change. By working together and
leveraging all our efforts it’s possible to see how we might make the shifts required. Like other countries, New Zealand is still busy navigating the impacts of COVID-19 and, while we have had success in our immediate response to the global pandemic, it is important to make sure our economic recovery creates resilience to future issues. If we are to leave a planet in which our mokopuna’s mokopuna can thrive, we must make certain that the precious taonga of our environment is at the heart of all our future decision-making.
Nāku noa, nā
Vicky Robertson
Secretary for the Environment
Our primordial Sky Father weeps,
As our Earth Mother mourns,
Their tears flowing forth,
Manifest in the mountain waters that percolate down to the sea.
Where are the earthly protectors of the water's authority?
The guardians of its essence?
Pay heed to the abuses of our time and reinvigorate the water's power of life,
As sustenance for our spirit,
As wellbeing for our person,
and as health and prosperity for a vibrant New Zealand for all.

04 ANNUAL REPORT 2019/20
Highlights from 2019/20
July 2019
Ban on single-use plastic shopping bags comes into effect.
Our 2018/19 emissions were successfully certified with the Toitū carbon reduce programme.
September 2019
Initiated work to co-design a container return scheme for NZ.
October 2019
Published our Marine Environment 2019 report, together with Stats NZ.
Callaghan Innovation’s C-Prize Challenge 2019 was launched, with the Ministry as a partner. It focused on teams with world-leading solutions to environmental problems.
November 2019
Zero Carbon Act passed – a key framework to reduce emissions by 2050.
Supported and informed the Parliamentary Commissioner for the Environment’s review of the environmental reporting system. Began working with councils, iwi, science partners on next steps.
December 2019
Public consultation underway on the National Policy Statement on Indigenous Biodiversity (Nov-Mar).
Climate Change Commission established to guide NZ’s response to climate change.
New remuneration system and collective bargaining settled with a three-year term.
January 2020
Kigali Amendment to the Montreal Protocol came into effect on 1st January 2020.
Freshwater Climate Waste/hazardous Resource management system Environmental reporting Strategy and stewardship Organisational health performance Strategic partnerships
August 2019
Climate change action plan released for the low-emissions economy.
A joined-up public consultation began for: freshwater package, hazardous substances, highly productive soils, urban development, product stewardship.
November 2019 (Continued)
Resource Management Amendment Bill – submissions and hearings.

05INTRODUCTION
April 2020
Published our Freshwater 2020 report with new data and more analysis.
Callaghan Innovation’s C-Prize Bootcamp: the Ministry advised the innovating teams.
March 2020
COVID-19 response – level four lockdown, all staff began working from home.
Work began on fast-track consenting for infrastructure projects in response to COVID economic impact.
$11m funding approved for 37 projects to minimise waste.
May 2020
Essential Freshwater package (Te Mana o te Wai) delivered – to halt degradation of freshwater and make improvements within five years.
Budget 2020 announced a $1.3 billion Jobs for Nature programme to create jobs, and protect and restore the environment. The Ministry was allocated $433 million for freshwater improvements.
June 2020
Climate Change Response (Emissions Trading Reform) Amendment Act passed; major changes to the ETS.
Resource Management Review Panel released final report to the Minister for the Environment, with recommendations for a reformed environmental management system.
Enactment of the Resource Management Amendment Act 2020.
June 2020 (Continued)
COVID-19 Recovery (Fast-track Consenting) Act 2020 (note: the bill was introduced on 16 June, and enacted on 9 July 2020).
NPS-Urban Development gazetted 23 July, but much of the work was done in previous 12 months.
Aotearoa Circle’s Fenwick Forum brought together 219 participants in three events. Explored how COVID-19 recovery plans could benefit the restoration and protection of New Zealand’s natural capital. A focus on food, transport and energy systems.
February 2020
Issued consultation document on proposed amendments to the National Environmental Standard for Air Quality.


About us Kōrero mō mātouAn overview of the Ministry for the Environment, Manatū Mō Te Taiao
01
Key topics
08 Te Pūrengi – Our leadership team
09 Our ministers
10 Our purpose and strategic direction
12 OurteaoMāoristrategy–partneringwithMāorifor success
14 Our response to COVID-19
16 Our funding
18 Ourorganisationalhealthandcapability
22 Oursustainabilitystrategy–walkingthetalk

08 ANNUAL REPORT 2019/20
Te Pūrengi Our leadership team
Amanda Moran Deputy Secretary Organisational Performance/Chief Operating Officer
Natasha Lewis Deputy Secretary, Strategy and Stewardship
Dr Alison Collins Kaitohutohu Mātanga Pūtaiao Matua, Chief Science Advisor
Martin Workman Acting Deputy Secretary, Sustainable Land Use Delivery
Jeremy Corban Chief Advisor to the Chief Executive
Sam Buckle Deputy Secretary, Resource Efficiency, Water and Land Use Policy
Melanie Mark-Shadbolt Kaihautū, Chief Māori Advisor
Janine Smith Deputy Secretary, Natural and Built System and Climate Mitigation
Anne Haira Deputy Secretary Partnerships and Customers, and Climate Adaptation and Evidence
As a Ministry, one of our key strengths is our people and we have a great depth in capability and leadership across the organisation. This allows us to be agile and flexible to support the shaping and delivery of our priorities.
Vicky Robertson Secretary for the Environment

09ABOUT US
During 2019/20 we worked with ministers across two portfolios: Environment and Climate Change.
Our ministers
Minister for the Environment Hon David Parker
Minister for Climate Change Hon James Shaw
Associate Minister for the Environment Hon Nanaia Mahuta
Associate Minister for the Environment Hon Eugenie Sage

10 ANNUAL REPORT 2019/20
Our purpose and strategic direction
Our purpose, our vision
Aotearoa – he whenua mana kura mō te tangata
We want Aotearoa to be the most liveable place in the world
A wealth of natural resources have supported New Zealand to grow into a prosperous country with a high standard of living. The economy has been built on our environment, and for many, it is why people want to live, work and visit here.
Our vision is to make Aotearoa New Zealand the most liveable place in the world – putting people at the heart of our work and recognising how crucial the environment is in the lives of New Zealanders. The Ministry takes a long-term view because, typically, the full impact of the choices made today only becomes clear generations later.
Our purpose and how we workThe changes we are seeking can take a long time, sometimes decades or more, to improve the natural environment. The Ministry’s goals are long term, and the liveability targets section of this document outlines our progress. In the shorter term – months and years – our mahi aims to:
• give evidence-based advice, with a clear point of view, to help governments decide on policy
• act as a steward for the environment by considering how today’s decisions will influence the environment and the quality of life for generations to come
• connect with all New Zealanders to make sure our perspective is grounded and relevant
• collaborate with mana whenua on strategies and working partnerships which reflect the relationship of Māori with their rohe, and deliver a prosperous taiao that all New Zealanders can appreciate
• work with policy-makers to ensure the intent turns into meaningful action and better results
• partner with others to tap into momentum for change and support their projects
• provide data and evidence to help all New Zealanders make informed decisions, so our environment, economy and people thrive
• provide funding and advice for community projects to improve water quality, reduce waste, and other goals
• coordinate responses to environmental emergencies.
Our guiding principles
Two key principles underpin everything we do: Policy Plus and Partnering with Purpose.
Policy PlusWe are committed to exploring new methods of analysis and achieving our objectives outside traditional regulatory tools. We call this Policy Plus. It includes:
• actively shaping the agenda – giving information and advice with a strong, clear point of view
• advising with impact – using storytelling, insights from data, real-life examples, and the views of end users, including everyday New Zealanders
• focusing on supporting the decisions Ministers need to make – understanding their goals and how they can reach them
• solving problems through non-regulatory interventions, visual tools and more
• harnessing our diverse views and the skills of our workforce – not boxing ourselves into a limited set of solutions
• seeing the whole system and acting as broker – connecting people who are motivated and have complementary goals and skills.

11ABOUT US
Partnering with purposePartnerships are an essential part of our work. The Treaty of Waitangi is the founding document of our country, promising partnership between Māori and the Crown as we manage New Zealand together.
We work with agencies, including Te Arawhiti, the Crown agency dedicated to the Māori-Crown relationship, to ensure we meet our Treaty obligations and support the redress of natural resources. Through these arrangements we:
• uphold the promises of the Crown
• create partnerships for more fruitful opportunities and longer-lasting outcomes for Māori, the Crown and te taiao (the environment).
We also partner with many people and organisations to:
• improve freshwater quality, soil and ecosystems
• move to a resilient, low-emissions economy
• have healthy air and sustainable, liveable cities
• lead the world in our ocean management.
We recognise that good partnerships are built on:
• clear objectives that line up with the values and goals of everyone involved
• involving others early on, and asking others to do the same, before ideas and solutions become set
• recognising and respecting what our partners can and can’t do
• recognition, respect and constructive challenge.
We are striving to do this well and make it a core part of the way we pursue environmental outcomes.
Our priorities
We have organised our work around five priorities – strategic themes
– to meet the environmental challenges we face as a country.
Together these themes form a ‘One Ministry for the Environment’ work programme focused on results.
1. Transition Leading Aotearoa New Zealand’s transition to a sustainable, low-emissions, circular economy. This joins up our work in science and environmental reporting, with a cross-cutting or long-term focus, for strong direction.
2. Environmental management system Bringing a holistic approach to policies and regulations on where and how we live.
3. Sustainable land use Improving land-use practices to reduce effects on climate, freshwater and ecological values.
4. Partnering and mobilising action Motivating action to positively influence New Zealanders’ attitudes and behaviour towards the environment.
5. A stronger and more integrated Ministry Investing in our people and systems to support future success.

12 ANNUAL REPORT 2019/20
Partnering with Māori for successTe Manatū Mō Te Taiao understands that Māori, as Treaty partners and tangata whenua, play an important role in addressing our urgent environmental issues. Recognising the vital links between tangata whenua and te taiao, mātauranga Māori guides us in our efforts to live in harmony with nature.
The way we live and make a living is having an adverse impact on our environment. The lessons from mātauranga Māori can help us find solutions for Aotearoa.
For the past two years, Te Manatū Mō Te Taiao has been on a journey to build better Treaty relationships. Our strategy reflects this. It sets out our approach for coordinated, long-term engagement with Māori, and integrates Māori views into our programmes.
As the lead public agency working on environmental policy, we play a key role in supporting the relationship Māori have with their whenua and to their wai. We strive for excellence, and acknowledge we have more work to do here – starting by improving the Ministry’s capability in te ao Māori.
1 With consent of Tā Mason Durie.
Despite the new working from home environment at the beginning of 2020, Te Ōhu Māori (the Māori Secretariat) was able to offer activities for staff to join and continue our capability building journey. Our progress included:
• Kōrero Taiao – a speaker series to promote an understanding of te ao Māori
• Treaty workshops about the Māori-Crown relationship and our position today after 250+ years
• anti-racism and discrimination forums – our staff want the Ministry to be inclusive and foster diversity; this includes how we value individual views and unique experiences.
These are only a few examples of how we are strengthening our knowledge of te ao Māori.
Te Ao Hurihuri – transformational gains
During the year we developed the Te Ao Hurihuri programme, launched in mid-2020. The framework has been adopted1 from the ‘Pae Ora – Healthier Futures’ model, developed by esteemed academic and Māori leader, Professor Sir Mason Durie. It enables our people and organisation to be confident, competent and effective in working with our Treaty partners to enhance their kaitiakitanga.
Te Ao Hurihuri reflects the analogy of a waka and its paddles. Each paddle represents an ‘ora’ – a measure of wellbeing or health. These drive the organisation to transform in a coordinated way, for lasting gains. The table sets out the goals.
Our te ao Māori strategy

13ABOUT US
PAE ORA ELEMENTS(ORA – PADDLES)
MINISTRY MEANING TE AO HURIHURI GOALS FOR EFFECTIVEENGAGEMENT WITH MĀORI
Mana Ora Healthy Māori-Crown relationships
Accountability to public sector leads – Public Service Commission/Te Arawhiti/Te Taura Whiri i Te Reo
Kaitiaki Ora Healthier Māori public servants
Strengthening leadership opportunities for Te Ropū Māori o Te Manatū Mō Te Taiao
Whānau Ora Healthy actions of change Providing programmes, training and tools for Ministry staff to become competent in engaging with the Treaty partners
Wai Ora Healthier organisation Reviewing and redefining the Ministry’s directorates and their work programme
Mauri Ora Healthy individuals Recording the cultural competence of each staff member so they can engage effectively
Hau Ora Healthy outcomes Assessing the health of our relationships with Treaty partners and competencies in engaging with these groups
Taiao Ora – the Waka Healthy environment Measuring the natural environment as a benefactor of a healthy Māori-Crown relationship – where kaitiakitanga flourishes.
Key steps
• Kaitiaki Ora is a strong focus as we empower our Māori staff to plan their careers and take on leadership roles. Strengthening work opportunities and reviewing our recruitment and retention strategies will bring about this change. We are building a public service that better supports the Māori-Crown relationship; Māori staff are the catalyst to reaching this goal.
• The Ministry will be working with other lead government agencies such as Te Arawhiti (the Office for Māori Crown Relations), Public Service Commission (Te Kawa Mataaho), Te Puni Kōkiri (the Ministry of Māori Development) and
Te Taura Whiri i Te Reo (the Māori Language Commission) to ensure that we are well positioned to meet the new legislative requirements for the public sector when working with Māori.
• Maihi Karauna is the Government’s plan for monitoring and evaluating the use and growth of te reo Māori in all public service departments. It complements Maihi Māori, the revitalisation of iwi and Māori.
• We recognise that we must strengthen our reo and tikanga. We have started working closely with Te Taura Whiri i Te Reo, and have employed a Ministry kaiako (instructor) to provide a programme that will align with Maihi Karauna.
• Within Te Ao Hurihuri, the Pae Ora elements require champions to promote the change. Our champions will have the skills to embed the strategy across our organisation. They recognise and value the place of Māori, as tangata whenua, acknowledging their significant contributions to New Zealand.
Te ao Māori is unique to New Zealand’s national identity. By equally valuing the contributions of our Treaty partners, this land can and will flourish for all.

14 ANNUAL REPORT 2019/20
The COVID-19 pandemic saw New Zealand close its borders to anyone not a citizen or permanent resident on 19 March 2020. From 26 March 2020 the country moved to level four, the highest alert level.
Impact on work programmesDuring the level four lockdown we began planning for a fast-track consenting process, which developed into the COVID-19 Recovery (Fast-track Consenting) Act 2020. Enacted on 9 July 2020, this gives temporary powers to speed up consents for projects to boost growth and support the transition to a low-emissions, sustainable and resilient economy. This will accelerate starting work on a range of projects that are ready to go, support certainty of ongoing employment and investment across New Zealand, and continue to promote the sustainable management of natural and physical resources.
Jobs For Nature was launched – a $1.3 billion programme of broad environmental funding. This is part of the COVID-19 recovery package, to run over four years. The aim is to provide up to 11,000 jobs and economic support for people and communities across Aotearoa, while ensuring environmental benefits (improvements to freshwater, biosecurity and biodiversity). We are among the government agencies administering this funding, and are working alongside an independent reference group to oversee the programme.
We also received funding via the COVID-19 Response and Recovery Fund for a number of significant waste infrastructure projects across the country, including the upgrade of seven high-tech recycling plants from Northland to Canterbury. This will make for safer workplaces and
speed up the separation of different materials, such as paper and plastics. It also promotes a far better recycling and resource recovery system, along with an important focus on new jobs.
We worked closely with local government and the waste sector to ensure minimal impact on waste collection and recycling during the lockdown periods.
For ongoing work, the pandemic had a moderate impact on progressing some aspects.
• National Policy Statement (NPS) for Indigenous Biodiversity: Public consultation closed in March, followed by a summary of submissions and policy analysis. As a result of COVID-19, delivery of this NPS was extended to April 2021.
• National Environmental Standards for Air Quality: Public consultation was extended to 31 July 2020.
• The Resource Management Review Report, led by former High Court Judge Hon Tony Randerson QC, was delayed as a result of COVID-19. The final report was delivered to the Minister for the Environment in late June 2020.
• Wastewater regulation: Some policy work and engagement was affected by the Government’s focus on the COVID-19 response, but we commissioned a report on the current and emerging issues facing the wastewater sector.
Our response to COVID-19

15ABOUT US
Organisational responseOur Business Continuity and Response Team immediately put our people and their safety first when the state of national emergency was announced. As a participant in the public sector’s ‘flexible-by-default’ programme, the Ministry was well placed to manage remote working.
Regular communications with staff and external stakeholders kept us in close but virtual contact. We also seconded staff into the National Crisis Management Centre as well as working with the Ministry of Business, Innovation and Employment hub.
The Ministry expanded guidance for working from home and made sure that people had the equipment they needed.
We welcomed a number of new people to the Ministry during lockdown and the following weeks, with an updated and fully online induction process helping new starters join their teams and begin work.

16 ANNUAL REPORT 2019/20
Vote EnvironmentThe figure below shows 2019/20 expenditure in Vote Environment divided into:
• departmental funding for our work programme
• non-departmental funding administered on behalf of ministers and distributed externally (eg, for clean-up projects).
• It also includes funding for: – Environmental Protection Authority
– Climate Change Commission
– New Zealand Emissions Trading Scheme. This covers allocation of emission units to industry to mitigate the scheme’s effects on international competitiveness, and to owners of post-1989 forests who choose to enter the scheme to earn units as their forests grow and sequester carbon.
We show these two types of funding separately because of their size and significance.
Our funding
* In addition, Departmental funding was provided to support the Commission. The total funding in 2019/20 was $8.209m for the Commission.
All figures $000.
$4,209 Climate Change Commission*
1%
$27,367 Environmental Protection Authority
3%
$77,401 Non-Departmental
9%
$91,690 Departmental
11%
$651,936 Emissions Trading Scheme
76%

17ABOUT US
All figures $000.
Departmental funding Other non-departmental funding
$662 Independent Climate Change Commission Set Up
1%
$1,020 International advice
1%
$1,581 Administering grants
2%
$1,606 Marine policy advice
2%
$1,629 Ministerial servicing
2%
$1,738 Treaty policy advice
2%
$11,418 Waste minimisation & environmental hazards advice
12%
$15,906 Water policy advice
17%
$27,182 Climate change policy advice
30%
$28,948 Resource management advice
31%
$667 International obligations
1%
$1,181 Contaminated sites
2%
$2,421 Climate change
3%
$6,073 Community funding
8%
$9,639 Treaty obligations
12%
$27,046 Water initiatives
35%
$30,374 Waste minimisation
39%

18 ANNUAL REPORT 2019/20
AVERAGES
39 years39 years
AGE
3.2 years3.5 years
LENGTH OF SERVICE
2018/192019/20
Our organisational health and capability
Our peopleThe Ministry is transforming to meet a challenging and expanding work programme to improve environmental outcomes. In the final few months of the year, we also responded to the COVID-19 pandemic, which included the entire workforce working from home for an extended period. Our People to Projects initiative – introduced last year – allowed us to be flexible and deploy staff to priority areas as part of the COVID-19 response, as well as meet other needs.
Over the year we recorded an increase in headcount resulting from several changes.
• Additional funding was allocated through Budget 2019 to continue to build regulatory frameworks, capabilities and tools; to transition to more sustainable land use and a lower emissions economy; and to strengthen the integrity of the environmental management system.
• Unplanned turnover dropped by 8.5 percentage points, contributing to a higher headcount.
Diversity and inclusion
We know that to achieve our goals our workforce needs to reflect, and better connect with, a wide range of New Zealanders. We launched our Diversity and Inclusion strategy in 2019 and in 2020 assessed our progress and refreshed our goals, looking to 2022.
Since launching the strategy in 2019, we have:
• achieved the Rainbow Tick, confirming our organisation as a welcoming and inclusive space for our LGBTQIA+ community
• increased the flexibility of our workforce, including where people can work from and how they structure their work time
• reduced our gender pay gap to 6.7% (as at 30 June 2020)
• improved recruitment to attract more diverse applicants, and retain that diversity
• introduced new ways to increase diversity and inclusion, in our processes (through Kei te pēhea taku haere?, our performance approach) and in capability (through Te Ao Hurihuri, a five-year programme for capability and confidence in te ao Māori).
Our strategy identifies four goals. We will continue to aim for these through short- and long-term initiatives over 2020-2022. The goals sit alongside Papa Pounamu, the diversity and inclusion strategy and commitment for the Public Service from the Public Service Commission.

19ABOUT US
FOCUS AREAS FOR KEY SUCCESSES HOW ARE WE ACHIEVING THIS?
Demonstrate inclusive leadership: Our leaders are skilled at working with differences, managing conflict, and creating an inclusive culture that surfaces and builds on diverse views to create better solutions.
Papa Pounamu po:Leadership
Build relationships
Bias
• Our leaders visibly champion diversity and inclusion, by sponsoring diverse network groups, speaking to the importance of diversity and inclusion, and actively joining initiatives
• Use an inclusive leadership model through leader-led discussions
• All leaders participate in unconscious bias training
Harness diverse thinking: We’re skilled at seeking out and incorporating diverse perspectives and managing the tensions and conflict that comes with this. We can then find innovative solutions and take people with us.
Papa Pounamu po:Employee networks
• Partner with CreativeHQ to measure our innovation capabilities and identify ways to increase this
• Grow and support communities of practice in specialist areas
• Continue to partner effectively with Māori/iwi and other stakeholders to strengthen our advice
Create an inclusive culture: All our people feel included and can bring their whole selves to work. We have strong cultural capability, particularly in te ao Māori. We support and enable our diversity networks to thrive.
Papa Pounamu po:Employee networks
Cultural competency
• Retain our Rainbow Tick
• Implement Mana Aki, a multi-cultural competency programme
• Scope and begin to apply LEAD, a 5-step plan for employing differently-abled people
• Annually support and resource 10 staff events to celebrate and promote our diversity
Embed organisational practices that make the most of our diverse talents: Our policies, practices and processes are fair, free from discrimination, and attract and retain a more diverse workforce.
Papa Pounamu po:Bias
• Apply our gender pay gap action plan
• Achieve the Gender Tick
• Implement the outcomes from our Future of Work programme
• Include unconscious bias training in our induction programme

20 ANNUAL REPORT 2019/20
Gender pay gap
We released our gender pay gap action plan in June 2020. The plan builds on previous work in reducing the gap by setting out our principles and actions for 2020/21. This ensures our continued commitment to closing this gap among our people.
Our priorities are:
• equal pay – we will continue to identify, address and fix instances where inequality in pay is affecting our people
• flexible work by default – we will continue to make flexible options equally available to all our people
• our people practices – we will continue to identify areas for improvement in our current practices
• gender-balanced leadership – we will continue to monitor balance across all leadership levels.
View our gender pay gap action plan on our website.
Focusing on health, safety and wellbeing
This last year we added a dedicated health, safety and wellbeing position, which helped the Ministry take action on key initiatives. We were well positioned to support the COVID-19 internal response, and in particular the wellbeing of our people in a pandemic.
Government Health and Safety Lead programme
The Ministry is a member of the Government Health and Safety Lead programme, which has fostered cross-agency connections to develop best practice in health, safety and wellbeing.
As a member, we took part in the summer health and safety internship, supporting up and coming university students with an interest in health and safety. The interns gain valuable practical experience, and as a Ministry we support the profession by mentoring an individual and helping them to learn and grow.
POSITION NUMBERS
2018/192019/20
FULL-TIME STAFF AS AT 30 JUNE
UNPLANNED TURNOVER PART-TIME STAFF
491.8371.6
16.3%24.8%
16.1%12%

21ABOUT US
Health and safety representatives
We continue to build our health and safety representative cohort and capability. Our representatives have supported our health, safety and wellbeing focus, and helped identify areas for improvement at a division and an organisational level. They are active members of our Health and Safety Committee.
Equal employment opportunities
We provide equal opportunities through recruitment and selection, career development and progression, training and employment conditions.
Our flexible working policy allows staff to balance their obligations at work and beyond.
ALL STAFF
MANAGEMENT
GENDER
2018/19
2018/19
2019/20
2019/20
0.26%
–
1.2%
–
GENDER DIVERSE/ UNKNOWN
62.3%64.5%
59.2%57.1%
FEMALE
35.2%36.6%
40.8%42.9%
MALE

22 ANNUAL REPORT 2019/20
Walking the talkAs the Ministry for the Environment we know we need to put our sustainability principles into action. This includes getting our own house in order and sharing our actions to improve our performance.
Sustainability for us as an organisation means operating within our baseline, minimising our environmental footprint and giving our people what they need to thrive.
During 2019/20 we completed our first Sustainability Strategy, which included the following achievements. We:
• measured and reported our carbon footprint (including external verification)
• reduced our total energy use (kWh) in Environment House Wellington by 21 per cent per square metre (target: 10 per cent)
• reduced our travel emissions by 52 per cent (target: 20 per cent) – we were on track to meet the target but exceeded it due to the COVID-19 travel restrictions
• measured and reported on our non-financial and financial results via our annual report and intranet
• added sustainable procurement principles to contracts (we help lead this for the Government to progress our outcomes)
• added sustainability criteria to the funds we administer
• developed and launched our Te Ao Māori Strategy
• enacted a Diversity and Inclusion Policy
• achieved Rainbow Tick certification
• promoted sustainability principles in our everyday actions and advice.
We also made significant progress in other ways.
• Reduced gender pay gap – we decreased our gender pay gap significantly to 6.7 per cent, which is much lower than the public sector average (10.5 per cent). We have a Gender Pay Gap Action Plan to further reduce the gap.
• We reduced our waste to landfill by 50 per cent – up from a 33 per cent drop in the 2019 audit. We were unable to conduct a full waste audit in early 2020 due to COVID-19. Our waste reduction programme continues and our next audit will check progress towards our goal in the coming months.
• Staff volunteering day – we developed the programme and have deferred it due to COVID-19.
• Building our voice – reporting on various targets was affected by changes in how we measure engagement, reputation and brand. We are seeing a significant increase in other indicators such as social media following, number of submissions, and stakeholder meetings.
• Our performance for responding to requests under the Official Information Act 1982 is covered in Ministerial Servicing, part 2 of this report.
When the level four lockdown began in late March we adapted quickly to a new work environment: most people were working from home and there was limited travel, which was reflected in the lower emissions data.
Callaghan Innovation C-Prize Partnership case studyThis year we partnered with Callaghan Innovation, New Zealand’s innovation agency, on their annual C-Prize – a competition for teams with world-leading innovative solutions to environmental problems. The 2019/20 challenge was to find innovative, tech-based ways to positively impact climate change, fresh clean water, and resource use. It was inspiring to get involved and help others in research and development. The Ministry participated in the judging, and the ingenuity, passion and commitment of the finalists was impressive. The C-prize was won by Zincovery in Christchurch for their technology to tackle the problem of the hundreds of thousands of tonnes of zinc and acid released into landfill and wastewater every year through the steel galvanisation.
Our sustainability strategy

23ABOUT US
0
50
100
150
200
250
Jul Aug Sep Oct Nov Dec Jan Feb Mar Apr May Jun
tCO
2e
2017/18
2018/19
2019/20
FIGURE 2: TOTAL EMISSIONS (tCO2e) – COMPARISON BY MONTH
FIGURE 1: TOTAL EMISSIONS (tCO2e)
tCO
2e
2017/18 2018/19 2019/200
200
400
600
800
1,000
1,200
1,400

24 ANNUAL REPORT 2019/20
FIGURE 3: TRANSPORT EMISSIONS (tCO2e) 2017/18 – 2019/20
0
100
200
300
400
500
600
700
800
2019/2020
2018/2019
2017/2018
Ground transport
Domestic air travel
International air travel
tCO
2e
900
Reducing our emissionsWe committed to measuring, reducing and reporting on our emissions profile, and having it externally verified, in our Sustainability Strategy. We are proud to have achieved Toitū Carbon reduce certification for the third consecutive year.
In 2019/2020 we emitted 660.31 tCO2e, 49 per cent lower than the previous year (1287.33 tCO2e), and half the level of the base year 2017/18 (1324.12 tCO2e ) – see figure 1.
Our travel
Before COVID-19, our tCO2e from July 2019 to February 2020 was 25 per cent lower than in previous years (figure 2). This achievement is due to a concentrated effort in reducing our emissions, particularly from air travel. The impacts of COVID-19 are visible from March onwards, when emissions dropped steeply while our full work programme continued.
We are committed to reducing the amount we travel and improving the ways we travel, to reduce our carbon emissions and costs.
We have a variety of measures to cut our travel emissions and use sustainable options by:
• guiding staff on sustainable travel options and behaviours, especially for air travel
• rolling out better video conference technology to work remotely far more effectively, and to meet with stakeholders around the country
• providing a low-emissions fleet of an e-bike, bikes and scooters for staff to attend meetings around the city
• booking hybrid or electric vehicles where appropriate.

25ABOUT US
FIGURE 4: TOTAL GROSS GHG EMISSIONS PER FTE2
0.00
0.50
1.00
1.50
2.00
2.50
3.00
3.50
4.00
2017/18 2018/19 2019/20
FTE: 360 FTE: 414 FTE: 504
tCO
2e pe
r FTE
2 Our annual emissions reporting period is from 01 July to 30 June of the following year. For auditing, we require FTE numbers in the fourth quarter of each year. These may differ from the FTE numbers in the Organisational Health section of this report, which are based on FTE numbers as at 30 June.
The bulk of our emissions come from two areas: international and domestic air travel. As figure 3 shows, we significantly decreased our international travel emissions. This is the first year our domestic air travel emissions have been greater than international emissions.
Despite growing our full-time equivalent (FTE) staff numbers over the past three years, our overall greenhouse gas (GHG) emissions and emissions per FTE have decreased (figure 4).
This is largely thanks to our conscious efforts to cut travel emissions, as well as due to the impact of COVID-19 on travel since March. COVID-19 has taught us a great deal about working effectively online. It has also allowed us to change our travel behaviour, and to work with stakeholders in new ways.


Our performance Ngā mahi kua mahiaHow we performed in 2019/20. The first section shows the longer-term results we want for New Zealand. The second section describes our day-to-day work programme performance.
02
Key topics
28 Our liveability targets and measures
48 Measuring our operating performance

28 ANNUAL REPORT 2019/20
To track progress in making New Zealand the most liveable place in the world, we have developed a set of ‘headline’ targets and measurements.
These measurements were included in our Statement of Intent 2017–2021, and determine where we want to be by 2030. We are updating the statement to reflect the current approach to reporting. Where we cannot give updated data for the current measures, we explain why, and note when and where updated data will be available in the table on the following page.
Context of our liveability standardsThese measurements sit alongside the Ministry’s wider environmental reporting under the Environmental Reporting Act 2015.
We are updating our performance framework to align closely with our environmental reporting framework. This will expand the number of measures to track progress, and widen the context for how we are tracking.
This change will ensure the annual report focuses on how we are meeting our strategic intentions for wider environmental reporting.
Our liveability targets and measures

29OUR PERFORMANCE
Liveability targets
DOMAIN LONG-TERM GOAL TARGET 2019/20 INFORMATION
Air – Āngi
New Zealand is a world leader in managing risks to human health and the environment from poor air quality.
By 2030: Health impacts from human-made sources of air pollution are reduced 35% from 2012 levels.
Results for this target are updated every three years. We will next report on this in Our Air 2021.
Atmosphere and climate – Kōhauhau and āhua o ngā rangi
New Zealand has an innovative and productive economy, with fewer greenhouse gas emissions, and is resilient to the physical and economic impacts of climate change and adverse climatic events.
By 2030: New Zealand’s greenhouse gas emissions intensity (per unit of gross domestic product) is half that of 1990.
The emissions intensity of the economy has decreased by 44% since 1990.
Freshwater – Wai
New Zealand increases the value from, and improves the quality of, our freshwater.
By 2021: No native freshwater fish3 decline from ‘not threatened’ to ‘at risk’, or from ‘at risk’ to ‘threatened’ from the 2013 assessment.By 2030: 80% of rivers and lakes4 are swimmable5; by 2040: 90% of rivers and lakes are swimmable.
Data is updated every five years – not available for 2019/20.Our Freshwater 2020 reports 2013-17 data for the percentage of river length not suitable for swimming by catchment: 94% of urban land-cover 76% of pastoral land-cover 27% of exotic forest land-cover.
Land – Whenua
New Zealand improves the quality of our soils and terrestrial ecosystems, and increases value from our land-based resources.
By 2030: Estimated annual erosion from managed grassland is reduced by 50% (42 million tonnes per year) from the 2012 baseline (84 million tonnes per year).
Environment Aotearoa 2019 reported on existing indicators. Environment Aotearoa 2022 will update these. See the Land Cover Database version 5 for thematic classification of New Zealand’s land cover.
Marine – Wai tai
New Zealand is a world leader in the sustainable management of marine ecosystems that support its marine life, society and economy.
By 2030: Marine ecosystems are more resilient because a representative 10% of ecosystems in each biogeographic region of the territorial sea are marine-protected areas.
No change: the Government is considering policy reform and there are no new marine protected areas.
Urban – Tāone
New Zealand is a leader of environmentally sustainable cities, leveraging the benefits cities offer while reducing the costs and impacts that they impose.
By 2047: Housing supply in all high-growth urban areas keeps pace with demand.Auckland Council issues at least 400,000 building consents for new dwellings (around 13,500 per year).
In the year to 30 June 2020 Auckland Council issued 14,780 consents for new dwellings.
3 Fish includes taxonomically indeterminate and determinate taxa.
4 These targets are included in the National Policy Statement for Freshwater Management. They apply to large rivers and lakes of sufficient size/depth for recreation. This is defined as: rivers that are fourth order or above using the methods in the River Environment Classification system, NIWA, Version 1; and lakes with a perimeter of 1.5 kilometres or more.
5 ‘Swimmable’ means you can be confident that you can swim (ie, put your head underwater) with a low chance of getting sick. In lakes and rivers the predicted average infection risk from E. coli is 3% or less. For at least half the time, the estimated risk is <1 in 1000 (0.1% risk). In lakes and lake-fed rivers, there is a ‘moderate’ risk from cyanobacteria.

30 ANNUAL REPORT 2019/20
Air – Āngi Domain goal: New Zealand is a world leader in managing risks to human health and the environment from poor air quality.
TARGET 2018/19 RESULT 2019/20 RESULT
By 2030: Health impacts from human-made sources of air pollution are reduced by 35% on 2012 levels.
Our Air 2018 was published on 18 October 2018.
According to data modelled in 2018, the year to 30 June 2016 saw 27 premature adult deaths per 100,000 New Zealanders from exposure to PM10 in New Zealand6 – 8% lower than the year to 30 June 2006.
Results for this target are updated every three years. We will be reporting next on this in Our Air 2021.
Our role
6 Health and Air Pollution in New Zealand (HAPINZ) Exposure Model (Kuschel et al, 2012); Emission Impossible Ltd.
The Ministry for the Environment provides good policy advice to ensure the air is safe and that people’s physical wellbeing is protected. We also work with other government agencies, councils, iwi, community and advisory groups for a shared understanding of the issues, the impacts on people and the environment, and to achieve better outcomes.
It is encouraging that many people are already taking steps to improve air quality, including:
• using high-efficiency heating, such as heat pumps, pellet burners or wood burners with low emissions
• storing wood under cover and burning only seasoned, dry wood, using efficient burning techniques
• not burning treated timber, to avoid releasing toxins such as arsenic
• avoiding outdoor burning of rubbish and plants, instead using recycling or rubbish disposal facilities, and composting and mulching
• reducing transport emissions by cycling, walking, using public transport or vehicles with low or no emissions.
Our achievements in air There has been no new national data since last year – Environment Aotearoa 2019 used data from Our Air 2018. The next report is due in October 2021.
The quality of our air is generally good and has improved since the 2004 National Environmental Standards for Air Quality. It is difficult to mark a trend, as there are only three data points (2006, 2012 and 2016), and differing methodologies make comparison difficult.
Air pollution is a problem in parts of the country, especially during winter when wood burners are used for home heating (figure 5). Many councils have significantly improved air quality in their regions, under the national standards, and we continue to work with them to build on this progress.
Amending the air regulations
The National Environmental Standards (NES) for Air Quality (2004) is the main tool for managing air quality. It sets a guaranteed level of health protection for all New Zealanders and is part of the resource management system.
In October 2018 the Associate Minister for the Environment announced a project to amend the standards to enhance human health outcomes and limit short- and long-term exposure to particulate matter pollution from human-made sources. The amendments would also enable New Zealand to meet its obligations under the Minamata Convention on Mercury.
During the 2019/2020 year we released a discussion document proposing amendments to the regulations, for public consultation. We engaged with local government, industry and some iwi organisations. Work has continued past the end of the 2019/20 year, aiming for implementation by late 2021.

31OUR PERFORMANCE
Supporting local authorities to apply the air quality standards
We help councils understand their responsibilities under the regulations. Councils monitor and manage air quality in their regions as follows.
• Regional councils and unitary authorities have drawn up plans for managing activities that discharge contaminants into the air.
• territorial authorities observe and enforce the NES for Air Quality by ensuring wood burners comply with design standards. In some cases, they administer bylaws for managing discharges to air.
In 2019/20, we supported regional authorities to manage air quality by:
• processing five applications under regulation 16A of the NES for Air Quality for exceedances of the
ambient air quality standards in exceptional circumstances
• processing an application to notify a new air shed in the New Zealand Gazette
• engaging with Bay of Plenty Regional Council and the Whareroa Marae community in the Mount Maunganui industrial area.
Working with other government agencies to improve air quality
Other central government agencies manage various sources of air pollutants in New Zealand.
The Ministry of Transport is responsible for the government policy on managing air pollution from transport, which includes the Land Transport Rule (Vehicle Exhaust Emissions 2007). The New Zealand Transport
Agency implements these policies, plans the state highway system, and undertakes land transport planning. In 2019/20, we contributed to the Government Policy Statement on Land Transport 2021.
The Ministry of Business, Innovation and Employment manages air pollution via different channels such as administering the Building Act 2004 and the Building Code. The code sets out standards for installing home heating appliances. In 2019/20 we contributed to the frameworks for managing industrial process heat.
FIGURE 5: SOURCES OF PM10 IN NEW ZEALAND, 2015

32 ANNUAL REPORT 2019/20
7 The 2018/19 result was the first to be calculated with the current methodology – see footnote 4. The change in method increased the result by 2% since the previous 2017/18 annual report, which reported 41%.
8 Emissions intensity is now calculated by taking gross greenhouse gas emissions in year i and dividing by GDP in year i+1. This reflects the fact that GDP in year i is measured from April 1 of year i-1 to March 31 of year i, while the Greenhouse Gas Inventory reports emissions for the previous calendar year. The latest 2019/20 GDP statistic is for the year ended 31 March 2020. The latest Greenhouse Gas Inventory (April 2020) reports emissions for the 2018 calendar year.
Atmosphere and climate – Kōhauhau me āhua o ngā rangiDomain goal: New Zealand has an innovative and productive economy, with fewer greenhouse gas emissions, and is resilient to the physical and economic impacts of climate change and adverse climatic events
TARGET 2018/19 RESULT 2019/20 RESULT
By 2030: New Zealand’s greenhouse gas emissions intensity (per unit of gross domestic product) is half the 1990 level.
New Zealand’s 2017 emissions intensity7 was 43% below the 1990 level.
The emissions intensity8 of the economy has decreased by 44% since 1990.
Our roleThe Ministry is the lead agency on domestic climate change policy, working closely with other government agencies and key stakeholders such as local government, for a well-coordinated, effective approach.
We need to meet our international target through domestic emissions reductions, removal of carbon dioxide by forests, and purchasing international emissions reductions with high environmental integrity.
The three main parts of the response to reduce emissions are:
• durable institutional arrangements to set a long-term direction and keep us on track towards targets, including support for innovation and investment
• effective emissions pricing
• policies and regulations for lower emissions in specific sectors, and a just and inclusive transition.
We are working to integrate the lower emissions pathway into the Government’s overarching economic strategy. An effective response to climate change must mesh with other strategic work, such as industry policy, science and innovation. This work aims for a more productive, sustainable and inclusive economy.
Ministry for the Environment
We lead the development, coordination and implementation of ‘whole-of-government’ climate change policy.
• We advise to the Minister for Climate Change on:
– New Zealand’s greenhouse gas emissions reduction targets
– emissions budgets
– emissions reduction plans
– national adaptation plans.
• We report on greenhouse gas emissions under the UN Framework Convention on Climate Change and the Kyoto Protocol.
• We manage policy development for the New Zealand Emissions Trading Scheme (NZ ETS).

33OUR PERFORMANCE
• We coordinate central government’s adaptation work programme.
• We support the Minister for Climate Change in their response to the Climate Change Commission’s advice and progress reports.
Other government agencies and Crown entities also have responsibilities for climate change in New Zealand. Below is a summary of the main ones.
Climate Change Commission
The Climate Change Commission is an independent Crown entity that advises the Government on climate change mitigation and adaptation. It also monitors progress towards the new 2050 target emissions budgets and implementation of a National Adaptation Plan.
Environmental Protection Authority (EPA)
The EPA administers the NZ ETS, including compliance, reporting and market information. It also operates the New Zealand Emission Unit Register.
Ministry of Transport
The Ministry of Transport leads work on biofuels, electric vehicles, other alternative fuels and technologies, and the energy efficiency of commercial fleets.
Ministry for Primary Industries
The Ministry for Primary Industries contributes to government policy on climate change, including:
• policy development and implementation of the NZ ETS
• adaptation to climate change
• other funding and research on agriculture and forestry policy.
Ministry of Business, Innovation and Employment
The Ministry of Business, Innovation and Employment is responsible for energy policy. Other activities include research on carbon capture and storage, energy information and modelling.
The Ministry also promotes New Zealand’s innovation system by advising the Government on science and technology policy, some of which relates to climate change or low-emissions technology. It invests money in science and research (including on climate change) on behalf of the Government.
Energy Efficiency and Conservation Authority
The Energy Efficiency and Conservation Authority supports and promotes energy efficiency and energy conservation, and renewable sources of energy in New Zealand.
New Zealand Ministry of Foreign Affairs and Trade
The New Zealand Ministry of Foreign Affairs and Trade leads New Zealand’s international climate change negotiations. A number of other agencies contribute to this work.
The New Zealand Treasury
The New Zealand Treasury provides information, research and economic perspectives on climate change policy.
Department of Conservation
The Department of Conservation conserves New Zealand’s natural and historical heritage. It also manages large tracts of native forest, and advises on climate change policy related to conservation.
Local government authorities (regional, district and unitary)
Local government authorities are mainly responsible for regulating resource use in New Zealand, and for promoting the environmental, social, cultural and economic wellbeing of communities. They must have regard to the effects of climate change. Many actively promote emissions-reduction policies and measures, and adaptation actions in their regions.

34 ANNUAL REPORT 2019/20
Our achievements in atmosphere and climate
Tackling climate change and leaving a better New Zealand for future generations
The Government is continuing to help reduce emissions and adapt to the effects of climate change as it moves to a low-emissions and climate-resilient economy. It collects data and tracks progress towards national and international climate change targets, to build a robust, scientific basis for policy.
Setting a framework for a low-emissions, climate-resilient future
In 2019/20 we focused on creating a framework for reducing emissions and adapting to climate change. Our attention since the end of June 2020 has been on applying that framework.
Climate Change Response (Zero Carbon) Amendment Act and independent Climate Change CommissionNew Zealand is on the path to a low-emissions, climate-resilient future. As part of this, a new domestic emissions reduction target by 2050 was set into law with the Climate Change Response (Zero Carbon) Amendment Act in November 2019.
An independent Climate Change Commission was established in mid-December 2019 to advise the Government on mitigation and adaptation, and to monitor progress towards the new 2050 target emissions budgets and the implementation of a national adaptation plan.
National Climate Change Risk Assessment We worked with local government, iwi and the private sector to prepare New Zealand’s first National Climate Change Risk Assessment, released in August 2020. This identifies the most significant risks we face from climate change across five domains, and will inform a national adaptation plan.
Nationally Determined ContributionThe Minister for Climate Change has asked the Climate Change Commission to review New Zealand’s Nationally Determined Contribution (NDC), to ensure it is compatible with limiting global warming to 1.5°C.
International carbon markets
At the UN Climate Change Conference COP 25, the Ministry for the Environment and the Ministry for Foreign Affairs and Trade supported Minister for Climate Change Hon James Shaw to co-facilitate negotiations on Article 6 of the Paris Agreement, which covers international carbon markets.
In December 2019, Cabinet adopted the Framework for International Carbon Market Cooperation, which outlines how the Government would work with potential overseas partners.
Climate Implications of Policy Assessment (CIPA)Agencies are required to analyse and report on greenhouse gas emissions for all policy proposals that go to Cabinet and meet certain criteria.
Under CIPA, emissions analysis for Cabinet is quality assured by the Ministry for robust estimates, prepared with good practice techniques. The Ministry can help with analysis and in some cases analyse emissions under the CIPA technical support function.
The main goal of CIPA is to alert ministers to the implications of a decision for New Zealand’s future greenhouse gas emissions.
In July 2020 CIPA’s emissions threshold was lowered after a review and report back to Cabinet.
Further work is underway on a tool or methods to consider the effects of climate change in investment and policy decisions and in regulatory system reviews. The CIPA framework could expand to include climate change adaptation as well as mitigation.
The Emissions Trading Scheme Reform ActA significant step towards achieving Aotearoa’s emissions targets was the Climate Change Response (Emissions Trading Reform) Bill, passed in June 2020.
The Government also released the provisional emissions budget, a cap on allowable emissions that will help drive emissions down to meet those budgets, and price controls.
The Government response to the Productivity Commission’s low-emissions economy reportThe Government released its Climate Action Plan in August 2019 in response to the Productivity Commission’s inquiry into the low-emissions economy. The commission’s report provided an evidence base for Aotearoa New Zealand’s transition to a low-emissions economy.

35OUR PERFORMANCE
Implementing the framework for reducing emissions and adapting to climate change
The Emissions Reduction Plan The Climate Change Response (Zero Carbon) Amendment Act 2019 requires the Government to prepare plans for how we will meet emissions budgets and progress towards the 2050 target.
The Government is working on the first Emissions Reduction Plan (ERP), which is due by the end of 2021. The ERP will include policies and strategies for certain sectors (transport, building and construction, agriculture and forestry, waste, energy), other policies and strategies to reduce emissions, and ways to mitigate the impact that reducing emissions will have on people.
National Adaptation Plan Work on the National Adaptation Plan is underway, and will need to be completed by August 2022. The plan will be an all-of government strategy and action plan, and will guide action on climate change adaptation between 2022 and 2026. It will respond to and prepare for the risks in New Zealand’s first climate change risk assessment.
The Government will work with iwi/Māori, local government and others to draw up the plan. New Zealanders will also get an opportunity to have their say.
Climate-related Financial DisclosuresFinancial entities and listed companies are now required to report on climate change risks, after Climate-related Financial Disclosures was announced in September 2020.
The aim is for business and investment decisions to routinely consider climate change risks and opportunities. The mandatory regime would be introduced through the Financial Markets Conduct Act (2013). If it is approved by Parliament, financial entities could be required to make disclosures in 2023 at the earliest.
Action on agricultural emissions He Waka Eke Noa Primary Sector Climate Action Partnership is a new partnership between the Government and primary sector organisations to equip farmers and growers with the knowledge, tools and support to reduce emissions and adapt to a changing climate.
Formed in April 2020, the partnership to help equip farmers to measure, manage and reduce on-farm agricultural greenhouse gas emissions and adapt to climate change. This in turn will promote sustainable food and fibre production for future generations.
The five-year programme will help farmers and growers to:
• include mitigation of greenhouse gas emissions and adaptation to climate change in their farm business and environment plans by 2025
• calculate their net greenhouse gas emissions and be motivated to take action on climate change through a pricing mechanism for emissions by 2025.

36 ANNUAL REPORT 2019/20
Freshwater – WaiDomain goal: New Zealand improves the value from, and quality of, our freshwater.
TARGET 2016/17 BASELINE 2019/20 RESULT
By 2030: 80% of rivers and lakes9 are swimmable10.
By 2040: 90% of rivers and lakes are swimmable.
71% of rivers and lakes are swimmable.
Updated every three years – not available for 2019/20.11
Our Freshwater 2020 reports 2013-17 data for the percentage of river length not suitable for swimming by catchment:
94% of urban land-cover
76% of pastoral land-cover
27% of exotic forest land-cover.
By 2021: No native freshwater fish12 decline from ‘not threatened’ to ‘at risk’, or from ‘at risk’ to ‘threatened’ from the 2013 assessment.
A 2017 assessment of 57 native fish species found:
22 were threatened
17 were at risk.
Updated every five years – not available for 2019/20.
Our role
9 These targets are in the NPS for Freshwater Management. They apply to large rivers and lakes that are of sufficient size/depth for recreation. This is defined as: rivers that are fourth order or above using the methods in the River Environment Classification system, National Institute of Water and Atmospheric Research, Version 1; and lakes with a perimeter of 1.5 kilometres or more.
10 ‘Swimmable’ means you can be confident when visiting lakes and rivers that you can swim (ie, put your head underwater) with a low chance of getting sick. In lakes and rivers the predicted average infection risk from E. coli is 3% or less. For at least half the time, the estimated risk is <1 in 1000 (0.1% risk). In lakes and lake-fed rivers, there is a ‘moderate’ risk from cyanobacteria.
11 The 2016/17 baseline was established via a complex modelling and data acquisition exercise using decades of monitoring data. This was a one-off analysis designed for the purpose of target development, and a comparable analysis that is suitable for tracking short-term progress against the target was not developed due to changes in Ministerial priorities.
12 Fish includes indeterminate and determinate taxa.
We and the Ministry for Primary Industries are responsible for developing and implementing the freshwater management system, along with regional and unitary councils.
The focus over the past year has been on freshwater quality and setting new national direction and other regulatory tools – the Essential Freshwater package – to protect and then restore water quality and ecosystem health.
The next steps are the efficient implementation of the Essential
Freshwater package, which requires ongoing collaboration between central government, Māori, all councils, the primary sector, land users, stakeholders and communities.
We are also continuing to encourage ‘non-regulatory’ initiatives which complement policy and regulation, including:
• using good practice everywhere – farms, forests, urban development and discharges (point sources of pollutants) as well as water infrastructure
• driving more fundamental change where good practices won’t be enough
• better targeting of government support for landowners and others to change
• investing in developing and disseminating practical solutions
• continuously improving the accuracy of discharge monitoring, modelling and measurement.

37OUR PERFORMANCE
Our achievements in freshwater
Essential freshwater – Te Mana o te Wai
In the past year we completed new national direction to clean up our rivers, streams, lakes and wetlands. The Essential Freshwater package aims to:
• stop further degradation of our freshwater
• start making immediate improvements so water quality improves within five years
• reverse past damage to bring our waterways and ecosystems to a healthy state within a generation.
Central to the Essential Freshwater package is the concept of Te Mana o te Wai.
Te Mana o te Wai recognises the vital importance of water. It expresses the special connection that New Zealanders have with freshwater. By protecting the health of freshwater we protect the health and wellbeing of people and our ecosystems.
Councils are required to give effect to Te Mana o te Wai by prioritising the health and wellbeing of our waterways, including:
• halting further loss of natural wetlands and streams
• setting higher health standards at swimming sites
• better stock exclusion measures
• controlling high-risk farm practices such as winter grazing and feedlots
• setting stricter controls on nitrogen pollution, a stricter bottom line for nitrate toxicity, and new bottom lines on other measures of waterway health
• requiring urban waterways to be cleaned up, and new protections for urban streams
• preserving and restoring the connectivity of New Zealand fish species’ habitats
• requiring mandatory and enforceable farm environment plans
• mandating real-time measuring and reporting of data on water use.
Working with Māori and stakeholders A multi-agency Water Taskforce worked with four advisory groups on the Essential Freshwater package.
• Te Kāhui Wai Māori brought the insight, skills and perspectives of Māori experts with experience and leadership in the primary sector and agribusiness, freshwater science and mātauranga Māori, local government, resource management law and policy, as well as whānau, hapū and iwi advocacy. It helped the taskforce to understand the principles and obligations of Te Mana o te Wai, and to shift the focus to structural and system reform to effect it.
• The Freshwater Leaders Group brought expertise and input from leaders in the primary sector and agribusiness, environmental non-governmental organisations and the community. It was the sounding board for the proposals, and challenged analysis.
• The Science and Technical Advisory Group provided expertise on the technical and scientific basis of proposals, including advice on options to improve water quality, achieve healthy rivers, lakes and aquifers, and protect wetlands and estuaries.
• The Regional Sector Water Subgroup contributed the views and experiences of regional councils, which manage freshwater for their communities. The group provided insights from their substantial experience with the challenges and opportunities of applying regional plans, the current NPS for Freshwater Management and various Treaty settlements related to freshwater management.
In 2019, extensive national public consultation was held and the Water Taskforce received a record 17,500 submissions on the package.
An Independent Advisory Panel chaired by retired Environment Court Judge David Sheppard assessed the submissions, and recommended detailed refinements to address submitters’ concerns.
In-depth and extensive economic, scientific and social impact analysis was commissioned post-consultation from many leading expert agencies. This work was also peer-reviewed.
The four advisory groups also advised as the details in the regulations were finalised.
The regulations (for the National Policy Statement for Freshwater Management 2020, National Environmental Standards for Freshwater 2020, stock exclusion, and measurement and reporting of water takes) were finalised after the 2019/20 year, and came into effect on 3 September 2020.

38 ANNUAL REPORT 2019/20
Jobs for Nature
Budget 2020 provided $1.1 billion for the Jobs for Nature programme as part of the COVID-19 recovery package. With another $200 million from previous years this made a total of $1.3 billion. The programme is part of the Government’s work to protect and restore the environment, and to support local communities, businesses and regional economic recovery.
The Ministry was allocated $433 million for new jobs in regional environmental projects to improve freshwater. From Vote Environment, $162 million was immediately available to restore wetlands, rivers and streams, regenerate native bush and control pests and weeds.
This included $62 million for 22 council projects across the country, and $100 million for the six-year Kaipara Moana Remediation Programme to halt degradation of New Zealand’s largest harbour and estuary.
A Jobs for Nature Reference Group, with a cross-agency secretariat, is preparing an investment plan for investment-ready projects that have lasting environmental benefits and prioritise community and iwi/whānau partnerships.
Swimmability
To supplement the network of recreational monitoring sites across New Zealand, we use modelling to infer the proportion of rivers and lakes that meet the swimmability criterion (based on the presence of E. coli, a bacteria that indicates faecal pollution). The E. coli average infection rate when swimming in lakes and rivers is less than 3 per cent. For at least half the time the risk is less than one in 1000, and a ‘moderate’ risk from cyanobacteria.
13 River water quality: E. coli. No date. Retrieved from https://statisticsnz.shinyapps.io/river_water_quality_ecoli (6 September 2019).
There are updated requirements for primary recreational contact sites in the NPS for Freshwater Management 2020. Councils must:
• identify places where people recreate
• manage E. coli levels at those places to a new national bottom line that is a higher quality than the previous NPS-FM
• prepare action plans that set out how and when they will reduce E. coli levels at those locations.
In 2017 a baseline of 71 per cent was estimated from modelling using data from 1975 until 2013 (the date range for individual monitoring sites varied). As with all modelling there is uncertainty about the estimates, and there has not been enough time to show meaningful change.
The information we do have is the updated 10-year trends of E. coli at monitored recreational sites, but the most recent data is the same as last year: 2008–2017.
Measured data for 10-year trends (2008–17) showed that most sites had “likely” or “very likely” trends (77 per cent of sites). The remainder did not have trends that could be determined.
Of the sites with trends that could be determined:
• the number with improving trends (decline in E. coli concentrations) was about equal to the number with worsening trends (306 and 281 respectively)
• exotic forest land-cover had the greatest proportion of sites with improving trends (76 per cent). Urban land-cover had the greatest proportion of sites with worsening trends (57 per cent).
Regarding rates of change at these sites:
• sites with improving trends had a greater median rate of change than those with worsening trends
• urban land-cover sites had the greatest median rate of change for both improving and worsening.
The freshwater target for swimmability is a long-term measure. Figure 6 shows the 10-year trend for E. coli concentration levels for monitored river sites, as an indicator of progress on swimmability.13
Native fish
Environmental reporting now includes the Fish Index of Biotic Integrity (IBI) as an indicator it reports on. The Fish IBI is a measure of the condition of freshwater fish communities. There are no other measures we are aware of, except that all improvements to freshwater quality benefit native fish.
Three waters – drinking water, wastewater, stormwater
We continued to support improvements to regulatory arrangements for Three Waters infrastructure. This included progressing a proposed new NES for Wastewater Discharges and Overflows, and amendments to the NES for Drinking Water, as signalled in the Action for Healthy Waterways discussion document of 2019.
However, because of the COVID response, action on wastewater regulation was delayed. We did commission a report on the current and emerging issues facing the wastewater sector, such as trade waste practices, climate change considerations, iwi/Māori values and land-based disposal.

39OUR PERFORMANCE
E. coliRiversTrend likelihoodMeasured2008–2017
Very likely improving Likely improving Indeterminate Likely worsening Very likely worsening
FIGURE 6: E. COLI RIVERS TREND LIKELIHOOD MEASURED 2008-2017

40 ANNUAL REPORT 2019/20
Land – WhenuaDomain goal: New Zealand improves the quality of our soils and terrestrial ecosystems and increases value from our land-based resources.
TARGET 2018/19 RESULT 2019/20 RESULT
By 2030: Estimated annual erosion from managed grassland is reduced by 50% (42 million tonnes per year), from the 2012 baseline (84 million tonnes per year).
Total estimated soil erosion from managed grassland at 2012 was 84 million tonnes per year.
The Ministry, in partnership with DOC and MPI, has commissioned an update of the Land Cover Database version 5. This is due by the end of 2019. This data set will aid future assessments of erosion reduction from changes to land cover since the previous version.
Environment Aotearoa 2019 reported on existing indicators, to be updated in Environment Aotearoa 2022.
The Land Cover Database version 5 is now available, showing thematic classification of New Zealand’s land cover.
Our roleMost aspects of the Ministry’s work in this area relate to soil, how we use land, and the impacts of that use. Our work on urban, water and marine outcomes all benefits or relates in some way to land and land use.
The Ministry is responsible for several statutes governing our land. These are supported by statutory instruments (regulations, national policy statements, and national environmental standards), non-statutory guidance, funding mechanisms, research, collaborative bodies and other initiatives.
Our responsibilities for managing land are broad. They include managing resource use, hazardous substances and waste, as well as climate change adaptation.
• The Resource Management Act 1991 (RMA) is New Zealand’s primary environmental management legislation, managing competing demands for land and other natural resources.
• The Hazardous Substances and New Organisms Act 1996 is a framework for managing risks to the environment from hazardous substances and new organisms. The Act and its regulations form a rigorous regime, controlling hazardous substances to prevent harm to people and the environment.
• The Waste Minimisation Act 2008 aims to decrease waste disposal, protecting the environment from harm and encouraging waste minimisation. Taking a circular economy approach benefits our environment, society, economy and culture.
• The NES for Assessing and Managing Contaminants in Soil to Protect Human Health is an RMA regulation carried out by councils. It ensures contaminated soil is identified and assessed before land is developed. If necessary, the land is remediated or contaminants
are contained to make it safe for human use.
• The Contaminated Sites Remediation Fund helps regional councils address priority contaminated sites.
Unitary, regional and territorial councils play a major role in managing soil and land use through regional and district plans under the RMA, and non-regulatory measures (such as farmer training and rates rebates for good practice).
Other government agencies also play a role in land.
• The Ministry for Primary Industries’ (MPI) work intersects with land outcomes, including maximising export opportunities from land-based activities, improving primary industry practice, and protecting New Zealand from biological risk. We often partner with MPI to deliver on both agencies’ outcomes.

41OUR PERFORMANCE
• The Department of Conservation (DOC) administers public conservation land, which covers about 30 per cent of New Zealand. DOC is the lead agency for the Conservation Act 1987 and the Conservation General Policy, and its biodiversity work extends onto private land. The Minister for Conservation is also responsible for the New Zealand Coastal Policy Statement, which can drive better land use to manage effects on the coast.
Our achievements in land Currently there are significant gaps in data coverage, consistency and scale. This prevents a complete picture of the state of, pressures on, and impacts from land and how it is used. Our Land 2018 has the most recent information, and will be updated in April 2021.
• The health and quality of our freshwater and coastal marine environment are driven by land use, through the impact of sediment and accumulation of contaminants and nutrients in waterbodies.
• New Zealand’s unique biodiversity relies on the land. We have lost many indigenous environments, and what’s left doesn’t represent original ecosystems. Many indigenous plants and animals are at risk of extinction, and, for a large proportion, this risk is increasing.
• Choices about how we use land, such as for forestry and pastoral agriculture, affect how we mitigate and adapt to climate change.
• The future capability of our land is affected by current and past contamination. New Zealand relies heavily on natural resources for economic prosperity and wellbeing. Land is a significant component
of our natural capital-asset base. To ensure ongoing prosperity, we need to use resources carefully, while maintaining and enhancing the resilience of our land-based ecosystems.
During the year, the Ministry worked on improving land outcomes in many ways. The Government’s climate and freshwater policy reforms are particularly relevant. When fully implemented, these will significantly affect market, regulatory and local government settings that influence land use and management. As well as directly addressing our erosion target, we also worked on biodiversity, contaminated sites and substance management, and soil policies.
Protecting our valuable land
The proposed National Policy Statement for Highly Productive Land (NPS-HPL) will improve the way highly productive land is managed under the RMA.
The NPS-HPL will ensure we do not lose highly productive land for food and fibre production to developments, without considering other options. Consultation closed in October 2019 and the Ministry for the Environment and Ministry for Primary Industries continue to address the issues raised in the submissions. This is to ensure that the NPS-HPL is effective and promotes the sustainable management of productive land.
At the time of completing this annual report, final advice on the NPS-HPL was being prepared for ministerial and cabinet approval. If approved, it is anticipated that the NPS-HPL will take effect in the first half of 2021.
The National Policy Statement for Indigenous BiodiversityAssociate Minister for Environment Hon Nanaia Mahuta extended the timeframe for the NPS for Indigenous Biodiversity. This gives the joint project team time to prepare a plan for the roll-out of the finalised policy statement, and to address feedback from consultation.
PFAS (per- and poly-fluoroalkyl substances)We lead this all-of-government programme, which runs across several of our work areas. A primary objective is coordinating action from many stakeholders – national and international government agencies, local government, industry and affected communities – to promote confidence and a nationally consistent approach.
We completed comprehensive site reports for Ohakea Base in September 2019 and Woodbourne Base in December 2019. The testing investigated the contamination of ground, water and biota associated with the use and storage of products containing PFAS.
PFAS was found in soil and water, and in water in the surrounding environment and neighbouring properties at both bases. A three-dimensional groundwater flow and transport model helped to estimate how the plumes may evolve in the future. Modelling the plumes’ behaviour has shown they are currently stable and their extent is likely to remain relatively constant for the foreseeable future.
Climate change, freshwater and urban development reforms are covered in the Atmosphere and Climate Change, Freshwater and Urban sections.

42 ANNUAL REPORT 2019/20
Marine – Wai taiDomain goal: New Zealand is a world leader in the sustainable management of marine ecosystems that support New Zealand’s marine life, society and the economy.
TARGET 2016/17 BASELINE 2019/20 RESULT
By 2030: The resilience of marine ecosystems improves because a representative 10% of ecosystems in each biogeographic region of our territorial sea are marine protected areas.
Proportions range from 0% in the Three Kings, Chatham and Snares islands, to 99% in the sub-Antarctic Islands and 100% in the Kermadec Islands, averaging 12% of total territorial sea, as at December 2016.
No change because the Government is considering policy reform and there are no new marine protected areas.
Our role Everyone has a role in protecting our marine environment, as what we do on the land and in the sea is causing increasing pressure. This includes the effects of climate change (acidification and warming), sediment and pollution from land-based activities, and seabed trawling and dredging. Many of our native marine birds and mammals are threatened or at risk of extinction, with constant pressure from introduced species.
Our role is to provide good policy advice – in collaboration with the Department of Conservation and Ministry for Primary Industries – and support other agencies, iwi, and the community to build the resilience of marine habitats to withstand these pressures.
This includes setting up effective protection, including Marine Protected Areas, to maintain coastal and marine ecosystem health and productivity while safeguarding social and economic development. Protected areas work best when they form a representative and adaptable network.
The resilience of marine ecosystems also depends on a broader approach to best practice science and management. Marine Protected Areas are more effective as part of integrated management that considers other pressures on the marine environment. Extending beyond the artificial boundaries of such areas are the effects of land use, including the discharge of pollutants and plastics to coasts, and anthropogenic-driven ocean acidification and warming.
This makes the Ministry’s work in other areas relevant, including the Essential Freshwater work to reduce sediment and pollution, which flows to the ocean.
How we measure our progress against the target
In 2011 the Convention on Biological Diversity set global targets, commonly known as the Aichi Biodiversity Targets, which New Zealand supports.
Target 11 encourages states to conserve “10 per cent of coastal and marine areas, especially areas of particular importance for biodiversity and ecosystem services ... through
effectively and equitably managed, ecologically representative and well-connected systems of protected areas and other effective area-based conservation measures”.
To aid reporting against New Zealand’s target, the Department of Conservation is working with the Ministry for Primary Industries and Ministry for the Environment on assessing our protected areas against International Union for Conservation of Nature guidelines for best practice.
Marine Protected Areas
The most recent information is in New Zealand’s Sixth National Report to the UN Convention on Biological Diversity (2014-18) and shows:
• 17,697 km2 (0.4%) of marine and coastal area is in Marine Protected Areas that meet the strictest definition of International Union for the Conservation of Nature (IUCN) categories (protected as 100% no-take marine reserves)
• another 1,268,369 km2 of the marine and coastal area is protected by a variety of measures

43OUR PERFORMANCE
• 27.4% of the marine and coastal area is protected from fishing impacts on the benthic marine environment
• 2.6% is seamounts protected from trawl impacts
• 0.7% of the marine and coastal area is in Marine Mammal Sanctuaries
• 0.1% of the marine and coastal area is in type 2 marine protection (a measure that meets the domestic protection standard for marine protected areas; the minimum protection for this type is to prohibit bottom trawling, Danish seining and dredging, either commercial or amateur).
Our achievements in marine Our Marine Environment 2019 was published in October 2019 by Ministry for the Environment and Stats NZ and includes the information below on trawling, dredging, bycatch and coastal water quality.
The Department of Conservation continues to lead national Marine Protected Area reform work with help from Ministry for Primary Industries and Ministry for the Environment. DOC and MPI have completed public consultation on proposals for a network of marine reserves and MPAs along the south-east coast of the South Island.
14 CA408/2017 Attorney-General v The Trustees of The Motiti Rohe Moana Trust and Ors. Regional councils can “include objectives, policies and methods (including rules) in its proposed Regional Coastal Environment Plan in spatially defined parts of the coastal marine area that avoid, limit or discourage fishing techniques or methods with a sole or dominant purpose to achieve any of all of the following:
a) Maintain indigenous biological diversity;
b) Protect areas of significant indigenous vegetation and significant habitats of indigenous fauna in the coastal marine area;
c) Preserve the natural character of the coastal environment (including the coastal marine area);
d) Recognise and provide for the relationship of Maori and their culture and traditions with the ancestral waters and taonga;
e) Have particular regard to the exercise of kaitiakitanga;
f) Have particular regard to the intrinsic values of ecosystems;
g) Take into account the duty of active protection of tainga, including restoration of mauri, as part of the principles of the Treaty of Waitangi.”
Regional councils are identifying proposals to improve marine protection through their regional plans.14 Four regional plans (proposed, in mediation, or implemented) have Marine Protected Area content.
The recent independent review of the resource management system identified reforms that will make marine ecosystems more resilient. The review proposes a Natural and Built Environments Act and a Strategic Planning Act to replace the RMA.
These Acts would aim to enhance the quality of the environment, identifying limits and achieving positive outcomes, setting strategic goals, and facilitating integrated management. We are exploring opportunities from the review to improve marine outcomes, and to use spatial planning for more integrated protection, including aligning land and coastal management.
Trawling, dredging and bycatch
We are seeing less trawling and dredging, and the bycatch (accidental capture of species from fishing) has decreased. Decreases in bycatch could be partly due to mitigation such as sea lion exclusion devices.
In 2018, 84 per cent of routinely assessed stocks were considered to be fished within safe limits, an improvement on 81 per cent in 2009. But it remains that fishing has long-term and wide-ranging effects on species and habitats.
Coastal marine water quality
Coastal water quality has mostly improved but is highly variable. Notably, 72 per cent of sites showed an improving trend for total phosphorus, possibly because of a lower level of phosphorus in rivers.

44 ANNUAL REPORT 2019/20
Urban – Tāone Domain goal: New Zealand is a leader of environmentally sustainable cities, leveraging the benefits cities offer while reducing the costs and impacts they impose.
TARGET 2018/19 RESULT 2019/20 RESULT
By 2047: Housing supply in all high-growth urban areas keeps pace with demand.
Auckland Council issues at least 400,000 building consents for new dwellings (around 13,500 per year).
Auckland Council issued 14,032 consents for new dwellings in the year to 30 June 2019.
Auckland Council issued 14,780 consents for new dwellings in the year to 30 June 2020.
Our roleMore than 80 per cent of New Zealanders live in cities or towns with populations over 20,000. Cities and towns are where almost 90 per cent of our population grew between 2008 and 2018. Resources are used in urban areas significantly more than anywhere else. This in turn means greater environmental impacts from that use. The quality of our urban environments is a huge influence on the wellbeing of New Zealanders overall.
Cities and towns are not just buildings and roads. They include natural habitats – they’re an integral part of the ecosystems they’re in. People too are part of these. How we behave and live our lives affects these habitats and ecosystems, and vice versa.
As the agency responsible for protecting and enhancing New Zealand’s environment, we have an important role in managing the growth and change in our cities and towns. This mainly involves policy oversight of urban planning and environmental management in urban and non-urban areas. The Resource Management Act (RMA) gives us most of the mandate for this work, which we carry out in partnership with local councils, mana whenua and other government agencies.
We oversee urban planning and environmental management, using a system-wide perspective to create sustainable, liveable cities. This includes changing systems to improve housing and urban development.
Our role includes:
• jointly leading, with the Ministry of Housing and Urban Development, the Urban Growth Agenda, to make housing more affordable and create high-quality, thriving and resilient communities
• as one aspect of the agenda, looking at how planning helps or hinders quality intensification, and setting a framework for spatial planning to promote development and quality built environments
• working on the implementation of the new National Policy Statement (NPS) on Urban Development and helping councils apply the NPS on Urban Development Capacity
• contributing to Kāinga Ora – Homes and Communities monitoring, evaluating and reporting on planning outcomes in national urban areas

45OUR PERFORMANCE
• supporting local authorities improve urban planning; guiding and working with stakeholders to build capability and share knowledge to achieve national direction
• working with other agencies in the Auckland Policy Office to reach government objectives in our biggest city
The urban domain takes a systems approach to issues and opportunities, but the outcomes in other domains also apply to urban areas. Urban residents should be able to enjoy clean waterways and a protected marine environment, breathe fresh air, and contribute to climate change goals. Various interventions across these domains also promote liveable, sustainable cities.
Our achievements in urban Resource management reform The Government is working to improve our resource management system. It is focusing on the Resource Management Act 1991 (RMA) – the main law governing the use of our land, water and air resources.
The RMA sets out how we should manage our environment. It is based on the principle of sustainable management – considering effects of activities on the environment now and in the future, when making resource management decisions.
The Resource Management Amendment Bill got Royal Assent on 30 June 2020. It will reduce complexity and improve environmental outcomes for freshwater and climate change.
We are considering wider changes to the resource management system following the Resource Management Review Panel’s recommendations, released in July 2020.
The Government released New Directions for Resource Management in New Zealand on 29 July 2020. This was a comprehensive review of the RMA.
The review mainly addressed the RMA, its interface with specific legislation, and a new role for spatial planning. The independent Resource Management Review Panel was led by Hon Tony Randerson, QC.
The report made many significant recommendations, including replacing the RMA with two separate pieces of legislation; a Natural and Built Environments Act; and a Strategic Planning Act. Also recommended were: greater use of national direction by the Environment Minister, a more streamlined process for council plan-making and a more efficient resource consent process.
Also proposed were a new, separate law to address climate change adaptation and the managed retreat from areas threatened with flooding.
The panel’s view was that any future system should give effect to the principles of Te Tiriti and set a clearer role for mana whenua in decision-making. The proposals for reform were informed by consultation with stakeholders and iwi/Maori over the last year.
The panel released an Issues and Options paper in November 2019; the written and verbal feedback helped inform the review. A series of regional hui in February 2020 also yielded valuable input that shaped the panel’s thinking. Advisory groups also contributed to the panel’s report. Decisions are due from the incoming government on how to take the reforms forward.

46 ANNUAL REPORT 2019/20
COVID-19 Recovery (Fast-track Consenting) Act 2020The COVID-19 Recovery (Fast-track Consenting) Act came into effect on 9 July 2020. It gave the Government temporary powers to speed up the consenting process for eligible development and infrastructure projects to aid economic recovery after the pandemic.
Planning for successful cities
The National Policy Statement on Urban Development The National Policy Statement on Urban Development (NPS-UD) passed into law in July 2020 and helps our fastest growing cities make room for their rising populations. It direct councils – particularly in the five high-growth centres of Auckland, Hamilton, Tauranga, Wellington and Christchurch – to free up their planning rules while focusing on well-functioning neighbourhoods and communities.
The new approach to planning will allow better connections to transport and other amenities, so our cities can flourish and better support their residents.
Urban Development ActThe Urban Development Act passed into law in July 2020 and provides a new way for urban development to transform our urban areas, lift living standards, and enable New Zealanders to live in homes that are well connected to the jobs, transport, community facilities and green spaces that they want and need.
Amendments to National Environmental Standard for Air QualityThe Government has proposed some amendments to the National Environmental Standards for Air Quality (NES-AQ), for better control of the release of fine particles into our air.
The amendments include controls on mercury emissions. These would help us meet our obligations under the Minamata Convention on Mercury.
Consultation closed on 31 July 2020 and we have continued to analyse submissions on the NES-AQ has continued into the new financial year, due to the extended consultation during the COVID lockdown. With iwi partners, councils and key stakeholders we have continued to refine the amendments after feedback and advice.
Three Waters reviewThe Government is reviewing Three Waters to improve the regulation and supply of drinking water, wastewater and stormwater (three waters) to promote New Zealand’s prosperity, health, safety and environment.
We continue work on this cross-government initiative, led by the Minister of Local Government, through the Department of Internal Affairs (DIA). We focus on the environmental performance of wastewater and stormwater infrastructure, and the role of the RMA in managing risks to drinking water.
The review also responds to the recommendations of the Government inquiry into the 2016 Havelock North drinking water outbreak.
We advanced a proposed new NES for Wastewater Discharges and Overflows, as signalled in the Action for Healthy Waterways discussion document of 2019. We also consulted on changes to the NES for Drinking Water.
We supported an independent group of urban water practitioners who produced a guide to applying Ngā Wai Manga in urban areas. The report – Ngā Wai Manga – the Urban Water Principles (Ngā Wai Manga) – sets out a vision for urban water by protecting and enhancing Te Mana me te Mauri o te Wai.
Reducing waste The Government is leading the transition to a circular economy by significant investment in waste minimisation, confronting the long-term challenge of waste, and with bold new onshore waste and recycling initiatives.
The recently announced new and upgraded waste recycling infrastructure can create thousands of jobs for New Zealanders in our cities, towns and regions.
Single-use plastic bag banThe ban on single-use plastic bags came into force on 1 July 2019 — a significant milestone in the effort to reduce plastic in our environment.
Before the ban, we educated businesses about the ban and provided an online toolkit. Businesses were given six months to phase out the bags before it came into force.
People can report businesses still giving out single-use plastic bags, using an online form on the Ministry’s website.
Waste levy expansionExpanding the national waste levy is a key step towards a low-waste economy, with world-class recycling and resource recovery that employs thousands of New Zealanders.

47OUR PERFORMANCE
On 15 July 2020 the Government announced plans to:
• expand the waste levy to cover additional landfill types, including construction and demolition fills (progressively from 1 July 2022)
• progressively increase over four years the levy for landfills that take household waste from the current $10 per tonne – set in 2009 – to $60 per tonne in 2024
• collect better data about the waste we create, and how we dispose of it, so we can manage it better
• invest the extra revenue from the waste levy in projects to reduce waste, such as building New Zealand-based recycling facilities.
Product stewardship The Government has stepped up action on environmentally harmful products – including plastic packaging, tyres and e-waste – before they become waste.
As part of the wider plan to reduce the rubbish ending up in landfills, on 29 July 2020 the Government announced six ‘priority products’ for regulated product stewardship schemes under the Waste Minimisation Act. The products are:
• plastic packaging
• tyres
• electrical and electronic products (e-waste)
• agrichemicals and their containers
• refrigerants
• farm plastics.
The decision to require product stewardship follows a public consultation in 2019, with public support for the Government to take stronger action on these products.
These schemes put the responsibility for waste and what happens to products at the end of their useful life on manufacturers, importers, retailers and users, rather than on communities, councils, neighbourhoods and nature.
Container Return SchemeWork continued on the Container Return Scheme (CRS), announced in September 2019. We reached an agreement to start the investigation and design – learning from the best international models but meeting New Zealand’s geographic and social needs.
A CRS would require beverage containers – such as plastic polyethylene terephthalate (PET) bottles – to carry a refundable deposit, for example 10 cents. The deposit is redeemed when the container is returned to a collection depot or other drop-off point. It will mean recovery of millions of containers each year for reuse and recycling.
Waste Minimisation Fund The 2020 round had a streamlined approach with new signals supporting the COVID-19 response, encouraging applications that create jobs, essential waste sector organisations (such as food recovery) and advancing product stewardship.
The 2020 WMF funding round closed on 22 May 2020 and an independent panel assessed expressions of interest (EOIs).
The Associate Minister for the Environment has selected EOIs to move to the application stage, and the Ministry for the Environment is notifying organisations of their status.
Responding to COVID-19As part of Budget 2020, the Government established the $50 billion COVID-19 Response and Recovery Fund (CRRF) for responding to and recovering from COVID-19. Of that funding, $124.3 million has been set aside for recycling and recovery projects across New Zealand that will reduce waste to landfill. These include waste recycling and reprocessing plants, landfill weighbridges for better waste data collection, upgraded material recovery facilities, and resource recovery plants. These investments will be delivered over the next 24 months, administered by the Ministry.
Fifteen specified projects have been funded and will be delivered in partnership with either private companies or local government.
This up-front funding and investment fills some major gaps in New Zealand’s waste infrastructure network. It creates significant job opportunities in a number of regions during the COVID-19 recovery period. It also supports the expansion and increases to the waste disposal levy.
These initiatives will complement other Ministry waste and resource efficiency measures, such as standardised kerb-side collection, product stewardship, the container return scheme and long-term waste infrastructure investment.

48 ANNUAL REPORT 2019/20
Measuring our operating performanceIn this section we report on financial and non-financial performance against our appropriations.
In accordance with Cabinet’s directive to consolidate appropriations for modernising the public finance system, the Ministry has consolidated its departmental appropriations into two output classes for the 2020/21 financial year: ‘Improving New Zealand’s Environment’ and ‘Managing Climate Change in New Zealand’. Part 3 outlines the 2020/21 forecast for these outputs.
Ministerial servicesThis appropriation is for supporting ministers, especially in their accountability to Parliament and the public.
Financial performance
2018/19 Actual
$000
2019/20 Budget
$000
2019/20 Revised budget
$000
2019/20 Actual
$000RevenueCrown 1,701 2,150 1,750 1,750
Departmental 1 20 – –
Other – 13 13 –
Total revenue 1,702 2,183 1,763 1,750
Total expenses 1,650 2,183 1,763 1,629
Net surplus (deficit) 52 – – 121
At Main Estimates, the 2019/20 budget for this output class was $2.183 million. During the year, this appropriation decreased by $420,000 to $1.763 million due to:
• a reprioritisation of $400,000 to the Waste Management and Minimisation to continue work on the transition to a circular economy
• a reduction of $20,000 due to changes in third-party revenue.
Actual expenditure for 2019/20 was lower than the revised budget. This represents cost savings.

49OUR PERFORMANCE
How we performedThis appropriation is limited to services enabling ministers to fulfil their portfolio responsibilities (other than policy decision-making).
Quality of advice
PERFORMANCE MEASURE2018/19 PERFORMANCE
2019/20 TARGET
2019/20 PERFORMANCE
Percentage of all regulatory impact statements (RIAs) that partially or fully meet quality assurance criteria
100%
(73% fully met quality assurance criteria). There were none that did not meet criteria.
At least 90%
(70% fully met criteria)
100%
(65% fully met quality assurance criteria). There were none that did not meet criteria.
The satisfaction of the Minister for the Environment and the Minister for Climate Change with the advice service, as per the common satisfaction survey
75%
Includes results from two ministers
At least 80% 75%
Includes results from three ministers
Explanation
Regulatory impact assessment statements (RIAs)Although 100 per cent of RIAs met or partially met the quality assurance criteria, less than 70 per cent fully met them. The main reasons for partial meets were: not enough information on costs and impacts, lack of formal or proper consultation, narrow problem definitions and incomplete impacts due to information and data constraints. The comparison between some of the preferred options and the alternatives was also not clear in some cases.
Ministerial services
PERFORMANCE MEASURE2018/19 PERFORMANCE
2019/20 TARGET 2019/20 PERFORMANCE
Percentage of Ministerial Official Information Act requests submitted within the timeframes agreed with the Minister’s office
89% 95% 91.50%
Percentage of responses to departmental Official Information Act requests sent within statutory deadlines
95% 95% 96.30%

50 ANNUAL REPORT 2019/20
Explanation
Ministerial servicesOfficial Information Act (OIA) request volumes in 2019/20 continued to increase from previous financial years.
Our focus has been ensuring the public has access to information as the business and its wider work programme continues to grow. Information is high quality, timely and follows best practice.
Our transparency programme supports this focus area. We proactively release OIA responses, briefings of high public interest, and weekly reports to our ministers on our website.
Our OIA responses are becoming more timely as we focus on educating and upskilling our staff through formal and informal training, as well as anticipating and planning for higher volumes of public engagement.
Quality of advice results Since 2015/16 we have reported performance against our quality of advice standard by multi-category appropriation. Results are listed under each of these appropriations.
The Ministry has continued its improvement over recent years against an ambitious target by using updated tools. It has provided support at crucial stages of commissioning and peer review, and through processes that combine advice for authors with development for people providing the support.
Per c
ent
70
60
50
40
30
20
10
0
55 %
49% 49%54%
61%66% 68%
61%
69%
2011/12 2012/13 2013/14 2014/15 2015/16 2016/17 2017/18 2018/19 2019/20
FIGURE 7 MFE PERFORMANCE AGAINST QUALITY OF ADVICE STANDARD
(The target is that 70% of briefing notes and Cabinet papers score 7 or better: from 70 to 100 papers are assessed each year, 15-20% of the total)

51OUR PERFORMANCE
Climate change This multi-category appropriation is for providing quality policy advice to ministers on domestic and international climate change issues.
Financial performance
Departmental Output Expense: Domestic Climate Change Programme Policy Advice
2018/19 Actual
$000
2019/20 Budget
$000
2019/20 Revised budget
$000
2019/20 Actual
$000RevenueCrown 16,161 13,445 19,395 19,395
Departmental 298 42 102 79
Other 58 25 25 73
Total revenue 16,517 13,512 19,522 19,547
Total expenses 14,639 13,512 19,522 19,006
Net surplus (deficit) 1,878 – – 541
At Main Estimates, the 2019/20 budget for this output class was $13.512 million. During the year, this class increased by $6.010 million to $19.522 million.
This increase was due to:
• a draw-down of $4 million of the Sustainable Land Use – Climate Change Commission and government response contingency funding
• an expense transfer of $1.950 million from 2018/19 to continue work on the Interim Climate Change Committee and developing the National Climate Change Risk Assessment
• an increase of $60,000 due to changes in third-party revenue.
Actual expenditure for 2019/20 was lower than the revised budget, due to delays in work programmes to design and procure a managed auction service for the sale of New Zealand Units and the Long Term Low Emissions Development Strategy (LT-LEDS)

52 ANNUAL REPORT 2019/20
Departmental Output Expense: International Climate Change Programme Policy Advice
2018/19 Actual
$000
2019/20 Budget
$000
2019/20 Revised budget
$000
2019/20 Actual
$000RevenueCrown 4,902 3,892 4,642 4,642
Departmental 198 37 53 87
Other 24 24 24 7
Total revenue 5,124 3,953 4,719 4,736
Total expenses 5,080 3,953 4,719 4,698
Net surplus (deficit) 44 – – 38
At Main Estimates, the 2019/20 budget for this output class was $3.953 million. During the year, this class increased by $766,000 to $4.719 million.
This increase was due to:
• a reprioritisation of $750,000 from other departmental output expense appropriations to progress work programmes on climate change
• an increase of $16,000 due to changes in third-party revenue.
Departmental Output Expense: Synthetic Greenhouse Gas Levy
2018/19 Actual
$000
2019/20 Budget
$000
2019/20 Revised budget
$000
2019/20 Actual
$000RevenueCrown 45 49 49 49
Departmental – – – –
Other – – – –
Total revenue 45 49 49 49
Total expenses 45 49 49 20
Net surplus (deficit) – – – 29

53OUR PERFORMANCE
Departmental Output Expense: Carbon Monitoring Programme
2018/19 Actual
$000
2019/20 Budget
$000
2019/20 Revised budget
$000
2019/20 Actual
$000RevenueCrown 4,150 2,167 2,917 2,917
Departmental 4 13 6 5
Other 5 7 7 5
Total revenue 4,159 2,187 2,930 2,927
Total expenses 4,114 2,187 2,930 3,458
Net surplus (deficit) 45 – – -531
At Main Estimates, the 2019/20 budget for this output class was $2.187 million. During the year, this class increased by $743,000 to $2.930 million.
This increase was due to reprioritising $750,000 from other departmental output expense appropriations to advance work on LUCAS mapping and the geospatial system upgrade. This was partially offset by a decrease of $7,000 due to changes in third-party revenue.
Actual expenditure for 2019/20 was higher than the revised budget to progress work on LUCAS mapping.
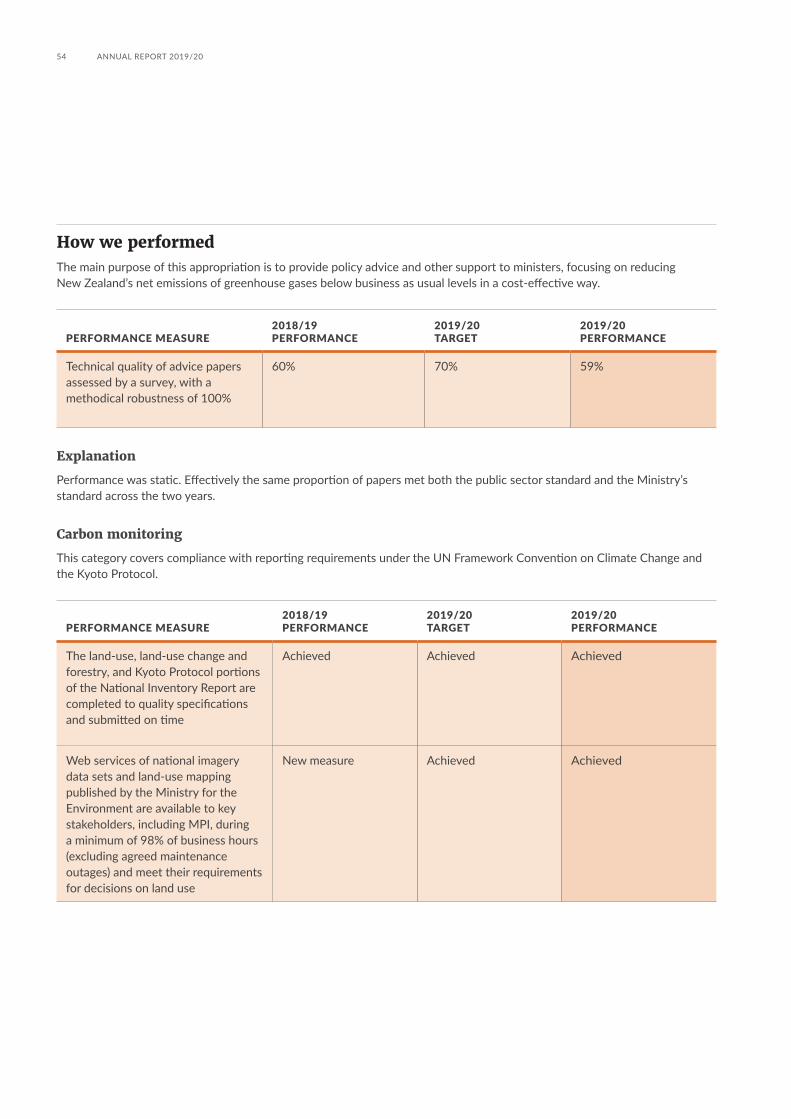
54 ANNUAL REPORT 2019/20
How we performedThe main purpose of this appropriation is to provide policy advice and other support to ministers, focusing on reducing New Zealand’s net emissions of greenhouse gases below business as usual levels in a cost-effective way.
PERFORMANCE MEASURE2018/19 PERFORMANCE
2019/20 TARGET
2019/20 PERFORMANCE
Technical quality of advice papers assessed by a survey, with a methodical robustness of 100%
60% 70% 59%
Explanation
Performance was static. Effectively the same proportion of papers met both the public sector standard and the Ministry’s standard across the two years.
Carbon monitoring
This category covers compliance with reporting requirements under the UN Framework Convention on Climate Change and the Kyoto Protocol.
PERFORMANCE MEASURE2018/19 PERFORMANCE
2019/20 TARGET
2019/20 PERFORMANCE
The land-use, land-use change and forestry, and Kyoto Protocol portions of the National Inventory Report are completed to quality specifications and submitted on time
Achieved Achieved Achieved
Web services of national imagery data sets and land-use mapping published by the Ministry for the Environment are available to key stakeholders, including MPI, during a minimum of 98% of business hours (excluding agreed maintenance outages) and meet their requirements for decisions on land use
New measure Achieved Achieved

55OUR PERFORMANCE
Domestic climate change policy advice
This category covers quality policy advice on domestic climate change issues.
PERFORMANCE MEASURE
2018/19 PERFORMANCE
2019/20 TARGET
2019/20 PERFORMANCE
Support the enactment of the Zero Carbon Bill through high-quality policy advice and support for the Select Committee process
New measure 31 December 2019
Achieved
Deliver a Long-term Low-emissions Development Strategy for New Zealand
New measure 31 December 2019
Not achieved
Explanation
There have been delays due to a revised scope of the Long-term Low-emissions Development Strategy, and postponing completion of the strategy until after the 2020 general election. This work is on track for delivery in 2021.
International climate change policy advice
This category covers quality policy advice on international climate change.
PERFORMANCE MEASURE
2018/19 PERFORMANCE
2019/20 TARGET
2019/20 PERFORMANCE
New Zealand meets agreed deadlines for international reporting on its greenhouse gas emissions and progress towards its targets15
100% 100% 100%
Participate in international climate change meetings and negotiations to ensure New Zealand’s interests are represented, consistent with the Government’s priorities
New measure Achieved Achieved
Explanation
There have been no international negotiations since early 2020 due to the COVID-19 pandemic. New Zealand, however, continues to participate in the international climate change meetings on a virtual ‘on-line’ basis.
15 The performance measure wording has been simplified since the 2018/19 annual report.

56 ANNUAL REPORT 2019/20
Synthetic greenhouse gas levy
This category covers the efficient administration of the synthetic greenhouse gas levy collection system.
PERFORMANCE MEASURE
2018/19 PERFORMANCE
2019/20 TARGET
2019/20 PERFORMANCE
Administer the funding for the ongoing costs of collecting the synthetic greenhouse gas levy by the NZ Transport Agency and NZ Customs Service in accordance with the Memoranda of Understanding
Achieved Achieved Achieved
Independent Climate Change Commission set-up costsThis appropriation is limited to the set-up costs for an independent Climate Change Commission.
2018/19 Actual
$000
2019/20 Budget
$000
2019/20 Revised budget
$000
2019/20 Actual
$000RevenueCrown 516 – 718 718
Departmental – – – –
Other – – – –
Total revenue 516 – 718 718
Total expenses 248 – 718 662
Net surplus (deficit) 268 – – 56
This appropriation was funded by an expense transfer of $718,000 for 2019/20 to continue the work on establishing an independent Climate Change Commission.
This increase was due to:
• a reprioritisation of $450,000 from other departmental output expense
• an expense transfer of $268,000 from 2018/19.

57OUR PERFORMANCE
How we performed
PERFORMANCE MEASURE
2018/19 PERFORMANCE
2019/20 TARGET
2019/20 PERFORMANCE
Establishment team sets up an independent Climate Change Commission
New measure Achieved Achieved
Improving environmental management This multi-category appropriation is for providing quality advice, with a focus on improving environmental management frameworks.
Departmental Output Expense: Treaty Settlements and Environmental Accords Policy Advice
2018/19 Actual
$000
2019/20 Budget
$000
2019/20 Revised budget
$000
2019/20 Actual
$000RevenueCrown 2,149 1,874 1,874 1,874
Departmental 13 17 52 42
Other 5 9 9 4
Total revenue 2,167 1,900 1,935 1,920
Total expenses 2,127 1,900 1,935 1,738
Net surplus (deficit) 40 – – 182
At Main Estimates, the 2019/20 budget for this output class was $1.9 million. During the year, this class increased by $35,000 to $1.935 million due to changes in third-party revenue forecast.
Actual expenditure for 2019/20 was lower than the revised budget. This represents cost savings.

58 ANNUAL REPORT 2019/20
Departmental Output Expense: Marine Environment Policy Advice
2018/19 Actual
$000
2019/20 Budget
$000
2019/20 Revised budget
$000
2019/20 Actual
$000RevenueCrown 1,426 3,891 1,891 1,891
Departmental 28 18 4 4
Other 6 10 10 3
Total revenue 1,460 3,919 1,905 1,898
Total expenses 1,425 3,919 1,905 1,606
Net surplus (deficit) 35 – – 292
At Main Estimates, the 2019/20 budget for this output class was $3.919 million. During the year, this class decreased by $2.014 million to $1.905 million due to:
• a reprioritisation of $2 million for the Waste Management and Minimisation to continue policy work on the transition to a circular economy
• a decrease of $14,000 due to changes in third-party revenue.
Actual expenditure for 2019/20 was lower than the revised budget because drafting the regulations under the Economic Exclusive Zone Act took longer than anticipated; a final exposure draft was released for comment in June 2020.

59OUR PERFORMANCE
Departmental Output Expense: Resource Management Implementation
2018/19 Actual
$000
2019/20 Budget
$000
2019/20 Revised budget
$000
2019/20 Actual
$000RevenueCrown 12,927 13,131 13,131 13,131
Departmental 75 85 789 776
Other 131 44 44 180
Total revenue 13,133 13,260 13,964 14,087
Total expenses 13,054 13,260 13,964 16,365
Net surplus (deficit) 79 – – (2,278)
At Main Estimates, the 2019/20 budget for this output class was $13.260 million. During the year, this class increased by $704,000 to $13.964 million due to changes in third-party revenue forecast.
Actual expenditure for 2019/20 was higher than anticipated due to the cost of progressing the resource management reforms.
Departmental Output Expense: Resource Management Policy Advice
2018/19 Actual
$000
2019/20 Budget
$000
2019/20 Revised budget
$000
2019/20 Actual
$000RevenueCrown 7,699 11,522 11,697 11,697
Departmental 115 80 45 118
Other 97 44 44 34
Total revenue 7,911 11,646 11,786 11,849
Total expenses 7,683 11,646 11,786 12,583
Net surplus (deficit) 228 – – (734)
At Main Estimates, the 2019/20 budget for this output class was $11.646 million. During the year, this class increased by $140,000 to $11.786 million.
This increase was due to an expense transfer of $175,000 from 2018/19 for the review of the Resource Management Act (RMA). This was partially offset by a decrease of $35,000 due to changes in the third-party revenue forecast.
Actual expenditure for 2019/20 was higher than the revised budget due to progressing the review of the RMA.

60 ANNUAL REPORT 2019/20
Departmental Output Expense: Water Management Implementation
2018/19 Actual
$000
2019/20 Budget
$000
2019/20 Revised budget
$000
2019/20 Actual
$000RevenueCrown 2,075 5,757 5,307 5,307
Departmental 20 55 6 4
Other 9 25 25 18
Total revenue 2,104 5,837 5,338 5,329
Total expenses 2,026 5,837 5,338 4,374
Net surplus (deficit) 78 – – 955
At Main Estimates, the 2019/20 budget for this output class was $5.837 million. During the year, this class decreased by $499,000 to $5.338 million due to:
• a reprioritisation of $450,000 to other departmental output expenses, mainly for climate change work
• a decrease of $49,000 due to changes in third-party revenue.
Actual expenditure for 2019/20 was lower than the revised budget due to delays in the freshwater projects and in procuring suppliers to identify and map at-risk catchments. The Ministry has sought an in-principle expense transfer to continue the work in 2020/21.

61OUR PERFORMANCE
Departmental Output Expense: Water Management Policy Advice
2018/19 Actual
$000
2019/20 Budget
$000
2019/20 Revised budget
$000
2019/20 Actual
$000RevenueCrown 10,258 15,277 14,327 14,327
Departmental 92 75 22 18
Other 22 135 135 15
Total revenue 10,372 15,487 14,484 14,360
Total expenses 10,054 15,487 14,484 11,532
Net surplus (deficit) 318 – – 2,828
At Main Estimates, the 2019/20 budget for this output class was $15.487 million. During the year, this class decreased by $1.003 million to $14.484 million due to:
• a reprioritisation of $1.500 million to other departmental output expenses, mainly for climate change work
• a decrease of $53,000 due to changes in third-party revenue.
This decrease was partially offset by an expense transfer of $550,000 from 2018/19 to progress the water conservation orders and set up Kahui Wai Maori – the Māori Freshwater Forum.
Actual expenditure for 2019/20 was lower than the revised budget, due to delays in the nutrient allocation system design for freshwater. The greater part of the work will now happen in 2020/21. The Ministry has sought an in-principle expense transfer to continue the work in 2020/21.
Non-Departmental Output Expense: Water Science and Economics
2018/19 Actual
$000
2019/20 Budget
$000
2019/20 Revised budget
$000
2019/20 Actual
$000ExpensesWater science and economics 2,129 2,150 2,422 1,719
At Main Estimates, the 2019/20 budget for this output class was $2.150 million. During the year, this class increased by $272,000 to $2.422 million due to an expense transfer from 2018/19.
Actual expenditure for 2019/20 was lower than the revised budget, due to delays caused by limited capacity in the research sector to meet the deadline, and delays in contracting due to legal negotiations with suppliers on standard terms and conditions. The Ministry has sought an expense transfer to continue the work in 2020/21.

62 ANNUAL REPORT 2019/20
How we performed
PERFORMANCE MEASURE
2018/19 PERFORMANCE
2019/20 TARGET
2019/20 PERFORMANCE
Technical quality of advice papers (assessed by a survey with a methodical robustness of 100%)
58% 70% 76%
Treaty settlements and environmental accords policy adviceThis category is limited to providing advice (including second opinion advice and contributions to advice led by other agencies) to help ministers decide on policy for environmental accords with Māori and Treaty settlements involving natural resources; contributing to negotiations with iwi and affected parties on environmental issues as part of developing deeds of settlement.
PERFORMANCE MEASURE
2018/19 PERFORMANCE
2019/20 TARGET
2019/20 PERFORMANCE
Number of negotiations supported
13 15 15
Marine environment policy adviceThis category is limited to providing advice (including second opinion and contributions to advice led by other agencies) to help ministers decide on policy for the marine environment.
PERFORMANCE MEASURE
2018/19 PERFORMANCE
2019/20 TARGET
2019/20 PERFORMANCE
Introduce regulations for decommissioning offshore oil and gas installations under the Exclusive Economic Zone Act
New measure 30 June 2020 Not achieved
Explanation
An exposure draft of the Decommissioning Regulations under the Exclusive Economic Zone and Continental Shelf (Environmental Effects) Act was released for targeted consultation in June 2020. Gazetting of the regulations was expected before the 2020 general election. This has been delayed so we can consider the feedback from consultation. It is likely that the regulations will be gazetted in 2021.

63OUR PERFORMANCE
Resource management implementationThis category is limited to implementing tools, frameworks and institutions; and giving advice, support, information and guidance to the public, practitioners and wider natural resource sector on resource management policy and practices.
PERFORMANCE MEASURE
2018/19 PERFORMANCE
2019/20 TARGET
2019/20 PERFORMANCE
Percentage of stakeholder survey respondents who consider reports published under the Environmental Reporting Act ‘useful’ or ‘very useful’ to their work
New measure 90% Not measured due to COVID-19
Number of pieces of guidance to support effective implementation of national direction
8 5 Partly achieved
Two documents:
1. Step-by-step guide to National Planning Standards
2. Consequential amendments guide
Support five to 10 local authorities reviewing plans to apply the planning standards (activities and outcomes reported to the Minister through the annual planning standards implementation report)
New measure 30 June 2020 Achieved
Supported 21 local authorities (plus 100 email queries)
Finalise amendments to the National Policy Statement Urban Development Capacity (NPS-UDC (under the Urban Planning Pillar of the Urban Growth Agenda) to deliver a new NPS-UD
New measure 30 June 2020 Achieved
Support local authorities in high-growth areas to apply the NPS-UDC (activities and outcomes reported to the Minister through the annual NPS-UDC implementation report)
New measure 30 June 2020 Not achieved
The Ministry publishes national monitoring system data within six months of receiving the complete data set from local authorities
New measure Achieved Achieved
Produce environmental reports required by the Environmental Reporting Act
New measure Two Achieved
Two domain reports: Our Marine Environment 2019 and Our Water 2020

64 ANNUAL REPORT 2019/20
Explanation
Resource management implementationWe prepared two guides for the national planning standards and supported 21 local authorities. The Ministry’s focus for 2019/20 was on the wider national direction work programme, including developing and consulting on new instruments – for which we are currently creating guides. The Ministry released the following six consultation documents during 2019/20: NPS Highly Productive Land, NPS Indigenous Biodiversity, amendments to the NES Air Quality, NES for the outdoor storage of tyres, the essential freshwater work package (NPS Freshwater Management, NES Freshwater, and a section 360 regulation), and NPS Urban Development.
Supporting local authorities to implement NPS-UDCWe gave ad-hoc support in implementing the NPS-UDC, as requested from territorial authorities, and the focus of efforts went into completing the revised NPS-UD and supporting councils in developing revised policy.
Resource management policy adviceThis category is limited to giving advice (including second opinion and contributions to advice led by other agencies) to help ministers decide on policy for managing natural and physical resources.
PERFORMANCE MEASURE
2018/19 PERFORMANCE
2019/20 TARGET
2019/20 PERFORMANCE
Minimum six weeks public consultation for all national direction workstreams
No public consultation on national direction workstreams in 2018/19
100% 100%
Provide advice and recommendations to the Minister on urban growth under the Urban Growth Agenda
New measure 30 June 2020 Achieved
Provide advice to the Minister on options for more comprehensive reform of the resource management system
New measure 30 June 2020 Achieved

65OUR PERFORMANCE
Water management implementationThis category is limited to water management policy and practices.
PERFORMANCE MEASURE
2018/19 PERFORMANCE
2019/20 TARGET
2019/20 PERFORMANCE
Produce catchment case studies to help communities, iwi/hapū and central and local government prepare plans to improve the health of waterways in at-risk catchments
New measure 5 Not achieved
Explanation
Activities under this category have been rolled into the Essential Freshwater package – with a wider plan for the At-risk Catchments workstream.
The At-risk Catchments team has identified three exemplar catchments (Kaipara, Pelorus/Te Hoiere and Manuherekia). They will work in partnership with our Treaty partners, local and central government and stakeholders and community to invest in catchments that have serious issues, and research how to make significant national environmental improvements at pace.

66 ANNUAL REPORT 2019/20
Water Management Policy Advice
This category is limited to giving advice (including second opinion and contributions to advice led by other agencies) to help ministers decide on policy for the quality, flow and availability of freshwater.
PERFORMANCE MEASURE
2018/19 PERFORMANCE
2019/20 TARGET
2019/20 PERFORMANCE
Advise on improving water quality
New measure 30 June 2020 Achieved
Progress a package of freshwater reforms to develop or update regulatory instruments where possible
New measure 30 June 2020 Achieved
Non-Departmental Output Expenses
Water science and economicsThis category is limited to analysis of water science and economic impact, and guidance to support development of the National Objectives Framework.
PERFORMANCE MEASURE
2018/19 PERFORMANCE
2019/20 TARGET
2019/20 PERFORMANCE
Percentage of completed water science and economics projects that achieved stated objectives
100%
All contracts have been completed and achieved stated objectives
80% 80%
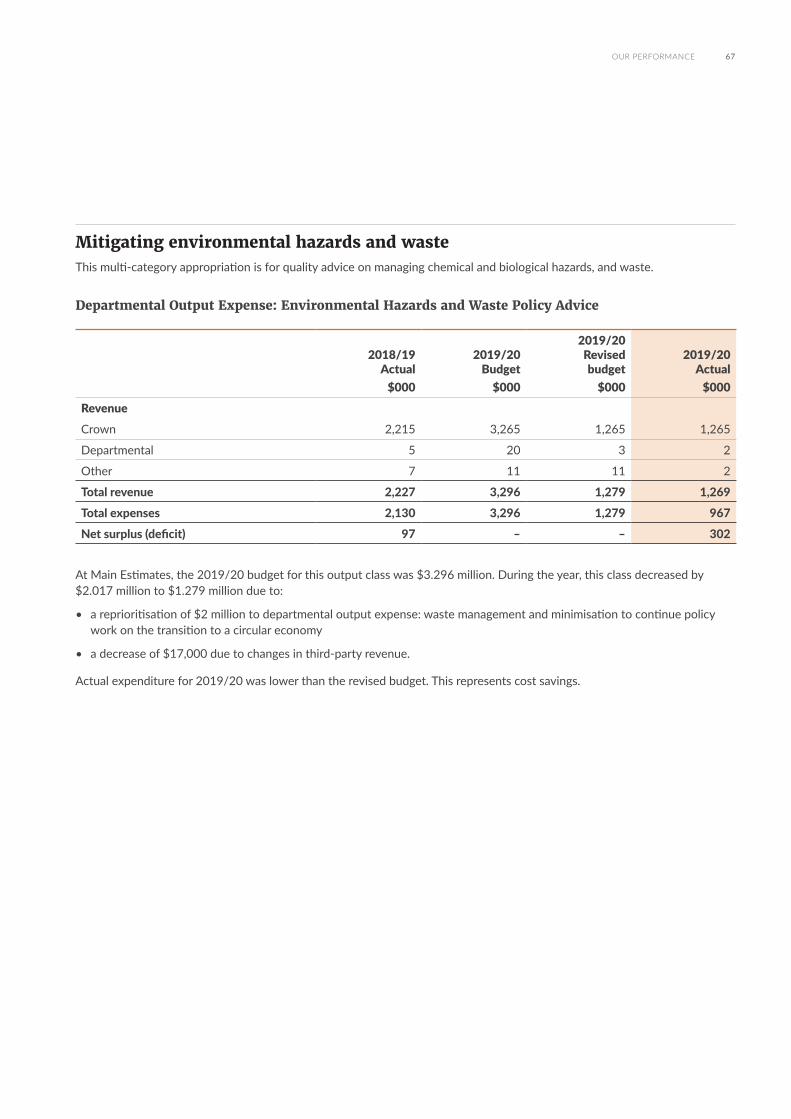
67OUR PERFORMANCE
Mitigating environmental hazards and waste This multi-category appropriation is for quality advice on managing chemical and biological hazards, and waste.
Departmental Output Expense: Environmental Hazards and Waste Policy Advice
2018/19 Actual
$000
2019/20 Budget
$000
2019/20 Revised budget
$000
2019/20 Actual
$000RevenueCrown 2,215 3,265 1,265 1,265
Departmental 5 20 3 2
Other 7 11 11 2
Total revenue 2,227 3,296 1,279 1,269
Total expenses 2,130 3,296 1,279 967
Net surplus (deficit) 97 – – 302
At Main Estimates, the 2019/20 budget for this output class was $3.296 million. During the year, this class decreased by $2.017 million to $1.279 million due to:
• a reprioritisation of $2 million to departmental output expense: waste management and minimisation to continue policy work on the transition to a circular economy
• a decrease of $17,000 due to changes in third-party revenue.
Actual expenditure for 2019/20 was lower than the revised budget. This represents cost savings.

68 ANNUAL REPORT 2019/20
Departmental Output Expense: Waste Management and Minimisation
2018/19 Actual
$000
2019/20 Budget
$000
2019/20 Revised budget
$000
2019/20 Actual
$000RevenueCrown 1,769 585 5,135 5,135
Departmental 12 19 22 16
Other 18 18 18 13
Total revenue 1,799 622 5,175 5,164
Total expenses 1,781 622 5,175 5,441
Net surplus (deficit) 18 – – -277
At Main Estimates, the 2019/20 budget for this output class was $622,000. During the year, this class increased by $4.553 million to $5.175 million. This increase was due to:
• a reprioritisation of $4.550 million from other departmental output expenses to continue policy work on the transition to a circular economy
• an increase of $3,000 due to changes in third-party revenue.
Actual expenditure for 2019/20 was higher than the revised budget due to progressing policy work on the transition to a circular economy.
How we performedThe single main purpose of this appropriation is to provide policy advice and other support to ministers on reducing harm from natural, chemical and biological hazards and from waste, through more effective management frameworks.
PERFORMANCE MEASURE
2018/19 PERFORMANCE
2019/20 TARGET
2019/20 PERFORMANCE
Technical quality of advice papers (assessed by a survey with a methodical robustness of 100%)
75% 70% 64%
Explanation
For the second year, 100% of the papers assessed in this appropriation met the public sector standard of 3, which represents adequate. However, in 2019/20 only 7 of 11 papers met the Ministry’s standard of 3.5, compared to 6 of 8 in 2018/19.

69OUR PERFORMANCE
Environmental hazards and waste policy adviceThis category is limited to giving advice (including second opinion and contributions to advice led by other agencies) to help ministers decide on policy for the risks from environmental hazards and waste, including international agreements, conventions and obligations.
PERFORMANCE MEASURE
2018/19 PERFORMANCE
2019/20 TARGET
2019/20 PERFORMANCE
Advise ministers on potential amendments to the Hazardous Substances and New Organisms Act 1996 and related regulations
New measure 30 June 2020 Achieved
Recommend policy to expand the waste levy
New measure 30 June 2020 Achieved
Waste management and minimisationThis category is limited to operational advice, implementation of tools, frameworks and institutions, and support, information and guidance to stakeholders on waste management and minimisation.
PERFORMANCE MEASURE
2018/19 PERFORMANCE
2019/20 TARGET
2019/20 PERFORMANCE
Secretariat functions for the Waste Advisory Board follow the board’s terms of reference
Achieved
The board and the Minister agreed to updated terms of reference
Achieved Achieved

70 ANNUAL REPORT 2019/20
Environmental Management Obligations and Programmes This multi-category appropriation is for finding solutions to environmental problems through community involvement and international cooperation.
Departmental Output Expense: Domestic Obligations and Programmes
2018/19 Actual
$000
2019/20 Budget
$000
2019/20 Revised budget
$000
2019/20 Actual
$000RevenueCrown 1,156 1,528 2,328 2,328
Departmental 75 17 6 5
Other 184 15 15 9
Total revenue 1,415 1,560 2,349 2,342
Total expenses 1,375 1,560 2,349 1,581
Net surplus (deficit) 40 – – 761
At Main Estimates, the 2019/20 budget for this output class was $1.560 million. During the year, this class increased by $0.789 million to $2.349 million.
This increase was due to a reprioritisation of $800,000 from departmental output expense: policy advice on international obligations and institutions to provide the resources to contract, manage and monitor third-party funding. This was partially offset by a decrease of $11,000 due to changes in third-party revenue forecast.
Actual expenditure for 2019/20 was lower than anticipated during the revised budget.

71OUR PERFORMANCE
Departmental Output Expense: International Obligations and Institutions Policy Advice
2018/19 Actual
$000
2019/20 Budget
$000
2019/20 Revised budget
$000
2019/20 Actual
$000RevenueCrown 900 1,830 880 880
Departmental 2 70 3 2
Other 3 7 7 2
Total revenue 905 1,907 890 884
Total expenses 878 1,907 890 1,020
Net surplus (deficit) 27 – – -136
At Main Estimates, the 2019/20 budget for this output class was $1.907 million. During the year, this class decreased by $1.017 million to $0.890 million due to:
• a reprioritisation of $800,000 to departmental output expense: domestic obligations and programmes to provide the resources to contract, manage and monitor third-party funding
• a reprioritisation of $150,000 to waste management and minimisation to continue policy work on the transition to a circular economy
• a decrease of $67,000 due to changes in third-party revenue.
Actual expenditure for 2019/20 was higher than anticipated during the revised budget.
How we performedThe single main purpose of this appropriation is to provide policy advice and other support to ministers to find better solutions to environmental problems by supporting community involvement and action, and international cooperation.
PERFORMANCE MEASURE
2018/19 PERFORMANCE
2019/20 TARGET
2019/20 PERFORMANCE
Technical quality of advice papers (assessed by a survey with a methodical robustness of 100%)
67% 70% Target not met (only one paper assessed)

72 ANNUAL REPORT 2019/20
Domestic obligations and programmesThis category is limited to contributing to and monitoring domestic environmental management, and educational programmes promoting awareness of environmental issues.
PERFORMANCE MEASURE
2018/19 PERFORMANCE
2019/20 TARGET
2019/20 PERFORMANCE
Stage 116 of the Community Environment Fund is completed in under 60 working days
No funding round in 2018/19
Achieved No funding round in 2019/20
The Ministry reviews the Contaminated Sites Remediation Fund Priority List and provides it to the Minister for the Environment
Achieved 30 June 2020 Achieved
International obligations and institutions policy adviceThis category is limited to giving advice (including second opinion and contributions to policy advice led by other agencies) to help ministers decide on policy for advice on international environmental arrangements, agreements and partnerships; contributing to negotiations with international parties on environmental issues in line with international arrangements, agreements and partnerships.
PERFORMANCE MEASURE
2018/19 PERFORMANCE
2019/20 TARGET
2019/20 PERFORMANCE
Ratify the Kigali Amendment to the Montreal Protocol
New measure 1 January 2020 Achieved
16 Stage 1 begins when applications close, and ends when assessment of applications is complete and funding recommendations are made to the Minister.

73OUR PERFORMANCE
Waste minimisation administrationThis appropriation is for the effective and efficient administration of the functions required under the Waste Minimisation Act 2008.
Departmental Output Expense: Waste Minimisation Administration
2018/19 Actual
$000
2019/20 Budget
$000
2019/20 Revised budget
$000
2019/20 Actual
$000RevenueCrown 5,906 5,906 6,706 6,706
Departmental – – – –
Other – – – –
Total revenue 5,906 5,906 6,706 6,706
Total expenses 3,766 5,906 6,706 5,010
Net surplus (deficit) 2,140 – - 1,696
At Main Estimates, the 2019/20 budget for this output class was $5.906 million. During the year, this class increased by $0.800 million to $6.706 million.
This increase was due to a fiscally neutral transfer from the Contestable Waste Minimisation Fund, which is a non-departmental output expense. The increase is to meet the cost of implementing a new funds management system and managing and monitoring a higher number of projects funded through the Contestable Waste Minimisation Fund.
Actual expenditure for 2019/20 was lower than the revised budget due to delays in implementing the new funds management system and administering other waste minimisation projects. Under the Waste Minimisation Act 2008, there is no provision for the return of a year-end surplus from the Waste Minimisation Fund to the Crown. Any year-end surplus must remain in the fund.
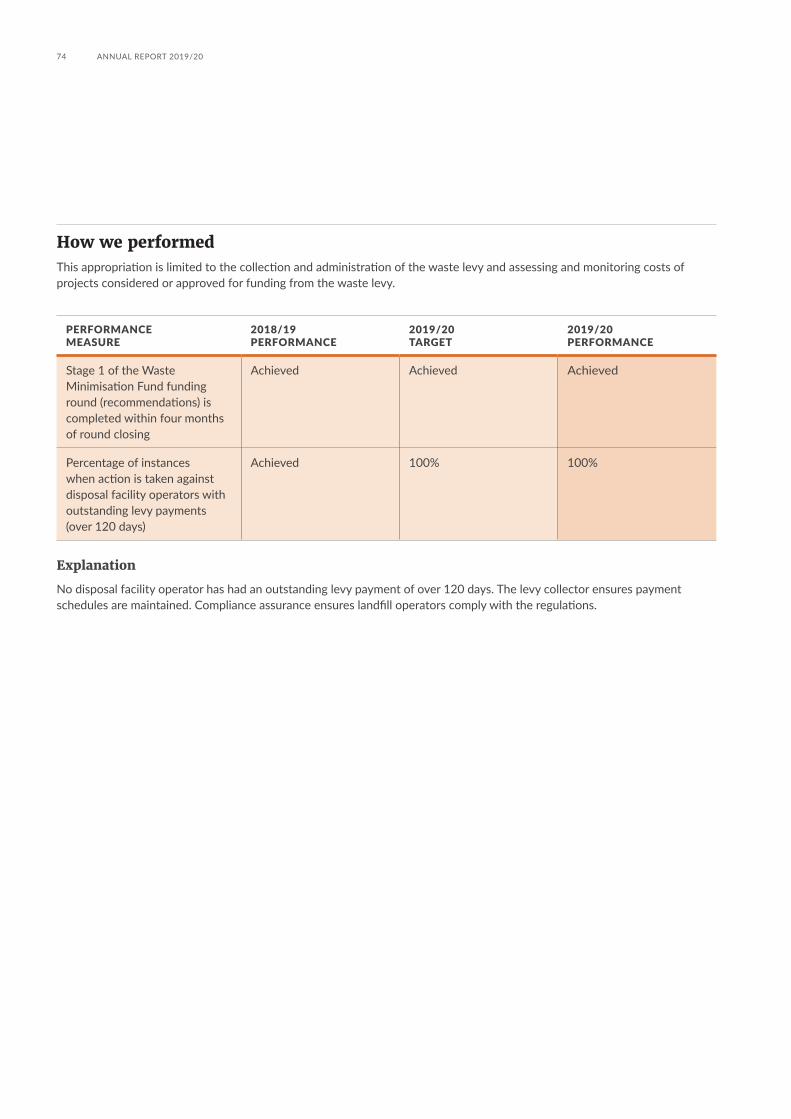
74 ANNUAL REPORT 2019/20
How we performedThis appropriation is limited to the collection and administration of the waste levy and assessing and monitoring costs of projects considered or approved for funding from the waste levy.
PERFORMANCE MEASURE
2018/19 PERFORMANCE
2019/20 TARGET
2019/20 PERFORMANCE
Stage 1 of the Waste Minimisation Fund funding round (recommendations) is completed within four months of round closing
Achieved Achieved Achieved
Percentage of instances when action is taken against disposal facility operators with outstanding levy payments (over 120 days)
Achieved 100% 100%
Explanation
No disposal facility operator has had an outstanding levy payment of over 120 days. The levy collector ensures payment schedules are maintained. Compliance assurance ensures landfill operators comply with the regulations.

75OUR PERFORMANCE
Capital expenditureThis appropriation is for the renewal, upgrade and/or redesign of assets to support the Ministry’s service.
2018/19 Actual
$000
2019/20 Budget
$000
2019/20 Revised budget
$000
2019/20 Actual
$000
2020/21 Unaudited
forecast$000
Expenditure is in accordance with the Ministry’s capital asset management planProperty, plant and equipment 303 200 700 549 825
Intangibles 353 1,000 500 106 1,500
Total 656 1,200 1,200 655 2,325
Actual expenditure for 2019/20 was lower than the revised budget due to delays in work programmes including Public Cloud Adoption/Migration, Microsoft 365 and Enterprise Content Management Replacement. The work programme has already started, but most of it will flow through to the 2020/21 financial year.


Our finances Kōrero pūteaIn part three we report on the financial resources we have used to deliver our services. This part also includes an independent audit report on our annual report.
03
Key topics
78 Financial statements
106 Non-departmental statements and schedules
125 Statement of expenses and capital expenditure
133 Independent Auditor’s Report

78 ANNUAL REPORT 2019/20
Financial statements for the Ministry for the Environmentfortheyearended30June2020

79OUR FINANCES
Performance indicators fortheyearended30June2020
Unit2019/20
Actual
2019/20 Revised Budget*
Operating results
Revenue: Crown $000 94,012 94,012
Revenue: Departmental and other $000 1,523 1,500
Output expenses $000 91,690 95,512
Gain on sale of assets $000 – 5
Net surplus $000 3,845 5
Working capital
Net current assets $000 6,040 5,774
Current ratio Ratio 1.43 1.60
Resource utilisation
Plant and equipment
Plant and equipment at year end $000 695 845
Value per employee $000 1.41 1.74
Additions as % of plant and equipment % 78.99 82.84
Plant and equipment as % of total assets % 3.25 4.79
Intangible assets
Intangible assets at year end $000 703 1,336
Value per employee $000 1.43 2.75
Additions as % of intangible assets % 15.08 37.43
Intangible assets as % of total assets % 3.28 7.58
Taxpayers’ funds
Level at year end $000 6,242 6,242
Level per employee $000 12.69 12.84
Net cash flows
Surplus/(deficit) from operating activities $000 6,400 7,237
Surplus/(deficit) from investing activities $000 (654) (1,445)
Surplus/(deficit) from financing activities $000 (5,137) (5,137)
Net increase/(decrease) in cash held $000 609 655
Human resources
Staff turnover % 16.3 14.8
Average length of service Years 3.2 3.0
Total staff (full time equivalent) No. 492 486
*The statement of accounting policies provides explanations of these figures which are not subject to audit.

80 ANNUAL REPORT 2019/20
Statement of comprehensive revenue and expense fortheyearended30June2020
Notes
2018/19 Actual
$000
2019/20 Budget*
$000
2019/2020 Actual
$000
2020/21 Forecast*
$000Revenue
Funding from the Crown 75,955 86,269 94,012 108,286
Other revenue 2 1,507 955 1,523 955
Gains – 5 – 5
Total revenue 77,462 87,229 95,535 109,246
Expenses
Personnel costs 3 42,386 51,883 51,569 71,912
Depreciation and amortisation expense 9, 10 1,111 1,165 1,012 1,173
Capital charge 4 360 360 360 596
Finance cost 5 – – 119 –
Other expenses 6 28,218 33,816 38,630 35,560
Total expenses 72,075 87,224 91,690 109,241
Net surplus and total comprehensive revenue and expense 5,387 5 3,845 5
*The statement of accounting policies provides explanations of these figures which are not subject to audit.
Explanations of significant variances against budget are detailed in note 19.
The accompanying accounting policies and notes form part of these financial statements.

81OUR FINANCES
Statement of financial position asat30June2020
Notes
2018/19 Actual
$000
2019/20 Budget*
$000
2019/2020 Actual
$000
2020/21 Forecast*
$000AssetsCurrent assets
Cash and cash equivalents 7 3,288 3,765 3,897 6,960
Receivables 8 17,128 9,800 16,032 11,100
Pre-payments 170 300 89 100
Total current assets 20,586 13,865 20,018 18,160
Non-current assets
Plant and equipment 9 621 517 695 1,089
Intangible assets 10 1,135 1,989 703 2,442
Total non-current assets 1,756 2,506 1,398 3,531
Total assets 22,342 16,371 21,416 21,691
Liabilities
Current liabilities
Payables 11 6,417 5,465 4,692 6,831
Return of operating surplus 12 5,387 5 3,845 5
Provisions 13 777 – 896 –
Employee entitlements 14 2,833 2,693 4,545 3,719
Total current liabilities 15,414 8,163 13,978 10,555
Non-current liabilities
Employee entitlements 14 936 866 1,196 1,196
Total non-current liabilities 936 866 1,196 1,196
Total liabilities 16,350 9,029 15,174 11,751
Net assets 5,992 7,342 6,242 9,940
Equity
Taxpayers’ funds 5,992 7,342 6,242 9,940
Total equity 5,992 7,342 6,242 9,940
*The statement of accounting policies provides explanations of these figures which are not subject to audit.
Explanations of significant variances against budget are detailed in note 19.
The accompanying accounting policies and notes form part of these financial statements.

82 ANNUAL REPORT 2019/20
Statement of changes in equity fortheyearended30June2020
Notes
2018/19 Actual
$000
2019/20 Budget*
$000
2019/2020 Actual
$000
2020/21 Forecast*
$000Balance at 1 July 5,992 5,992 5,992 6,242
Comprehensive revenue and expense
Surplus for the year 5,387 5 3,845 5
Total comprehensive revenue 5,387 5 3,845 5
Return of operating surplus to the Crown 12 (5,387) (5) (3,845) (5)
Capital contribution – 1,350 250 3,698
Balance at 30 June 5,992 7,342 6,242 9,940
*The statement of accounting policies provides explanations of these figures which are not subject to audit.
The accompanying accounting policies and notes form part of these financial statements.

83OUR FINANCES
Statement of cash flows fortheyearended30June2020
Notes
2018/19 Actual
$000
2019/20 Budget*
$000
2019/20 Actual
$000
2020/21 Forecast*
$000Cash flows from operating activities
Receipts from the Crown 70,356 86,269 95,022 113,285
Receipts from other revenue 2,112 955 1,459 888
Payments to suppliers (27,462) (34,680) (39,748) (35,038)
Payments to employees (42,176) (51,796) (49,599) (71,912)
Payments for capital charge (540) (360) (180) (776)
Goods and services tax (net) 723 – (554) 86
Net cash flow from operating activities 3,013 388 6,400 6,533
Cash flows from investing activities
Receipts from sale of plant and equipment – 5 – 5
Purchase of plant and equipment (302) (200) (549) (825)
Purchase of intangible assets (353) (1,000) (105) (2,481)
Net cash flow from investing activities (655) (1,195) (654) (3,301)
Cash flows from financing activities
Capital contribution received – 1,350 250 3,698
Return of operating surplus (2,227) (5) (5,387) (3,870)
Net cash flow from financing activities (2,227) 1,345 (5,137) (172)
Net increase/(decrease) in cash 131 538 609 3,060
Cash at the beginning of the year 3,157 3,227 3,288 3,900
Cash at the end of the year 3,288 3,765 3,897 6,960
*The statement of accounting policies provides explanations of these figures which are not subject to audit.
The GST (net) component of operating activities reflects the net GST paid and received with the Inland Revenue Department. The GST (net) component has been presented on a net basis, as the gross amounts do not provide meaningful information for financial statement purposes and to be consistent with the presentation basis of the other primary financial statements.
The accompanying accounting policies and notes form part of these financial statements.

84 ANNUAL REPORT 2019/20
Statement of cash flows fortheyearended30June2020(continued)
17 Creditors and accruals for capital expenditure are excluded when calculating this increase or decrease.
Reconciliation of net surplus to net cash flow from operating activities
2018/19 Actual $000
2019/20 Actual $000
Net surplus 5,387 3,845
Add/(less) non-cash items:
Depreciation and amortisation expense 1,111 1,012
Restoration costs – 119
Total non-cash items 1,111 1,131
Add/(less) items classified as investing or financing activities
(Gains)/losses on disposal of plant and equipment 5 –
Add/(less) movements in statement of financial position items
(Increase)/decrease in receivables (4,945) 1,096
(Increase)/decrease in pre-payments 36 81
Increase/(decrease) in payables17 1,209 (1,725)
Increase/(decrease) in provisions (32) –
Increase/(decrease) in employee entitlements 242 1,972
Total net movement in working capital items (3,490) 1,424
Net cash flow from operating activities 3,013 6,400
The accompanying accounting policies and notes form part of these financial statements.

85OUR FINANCES
Statement of commitments asat30June2020
Capital commitments
Capital commitments are the aggregate amount of capital expenditure contracted for the acquisition of plant, and equipment and intangible assets that have not been paid for or not recognised as a liability at balance date.
Non-cancellable operating lease commitments
The Ministry leases plant and equipment in the normal course of its business. The majority of these are for premises and photocopiers in Wellington and Auckland, which have a non-cancellable leasing period ranging from one to six years.
The Ministry’s non-cancellable operating leases have varying terms, escalation clauses, and renewal rights. There are no restrictions placed on the Ministry by any of its leasing arrangements.
The total amount of future sub-lease payments expected to be received under non-cancellable sub-leases at the balance date are $206,066 (2018/19: $62,965).
2018/19 Actual
$000
2019/20 Actual
$000Capital commitments
Intangible assets 142 194
Total capital commitments 142 194
Operating leases as lessee
The future aggregate minimum lease payments to be paid under non-cancellable operating leases are as follows:
Not later than one year 2,020 2,165
Later than one year but not later than five years – 4,206
Later than five years – –
Total non-cancellable operating lease commitments 2,020 6,371
Total commitments 2,162 6,565
Statement of contingent liabilities and contingent assets asat30June2020
Contingent liabilities
There were three potential liabilities in relation to legal matters, with a total contingent liability of up to $270,000 as at 30 June 2020 (2018/19: four potential liabilities in relation to legal matters at up to $290,000).
Contingent assets
There were no contingent assets as at 30 June 2020 (2018/19: nil).

86 ANNUAL REPORT 2019/20
Notes to the financial statements
1. Statement of accounting policies for the year ended 30 June 2020
Reporting entity
The Ministry for the Environment (the Ministry) is a government department as defined by section 2 of the Public Finance Act 1989 and is domiciled and operates in New Zealand. The relevant legislation governing the Ministry’s operations includes the Public Finance Act 1989 and the Environment Act 1986. The Ministry’s ultimate parent is the New Zealand Crown.
In addition, the Ministry has reported on Crown activities, which it administers.
The primary objective of the Ministry is to provide advice to the Government on the New Zealand environment and international matters that affect the environment. The Ministry does not operate to make financial returns. Accordingly, the Ministry has designated itself as a public benefit entity (PBE) for the purpose of financial reporting.
The financial statements of the Ministry are for the year ended 30 June 2020. The financial statements were authorised for issue by the Chief Executive of the Ministry on 12 November 2020.
Basis of preparation
The financial statements have been prepared on a going concern basis, and the accounting policies have been applied consistently throughout the period.
Statement of compliance
These financial statements have been prepared in accordance with the requirements of the Public Finance Act 1989, which includes the requirement to comply with the New Zealand generally accepted accounting practices (NZ GAAP) and Treasury instructions. They comply with Tier 1 Public Benefit Entity (PBE) accounting standards and other applicable financial reporting standards, as appropriate for public benefit entities.
Measurement base
The financial statements have been prepared on the basis of historical cost.
Function and presentation of currency
The financial statements are presented in New Zealand dollars and all values are rounded to the nearest thousand dollars ($000) unless otherwise stated. The functional currency of the Ministry is New Zealand dollars.
Accounting policies
The accounting policies set out below have been applied consistently to all periods presented in these financial statements.
The accrual basis of accounting has been used unless otherwise stated.
Accounting standard adopted for the year ended 30 June 2020In line with the Financial Statements of the Government, the Ministry has adopted PBE IPSAS 34-38 Interest in other entities from 1 July 2019. This standard replaces the existing standards for interests in other entities (PBE IPSAS 6-8). The application of the new PBE standard has no effect on the financial statements as a result of this change.
All other accounting policies adopted in these financial statements are consistent with those of the previous financial year.

87OUR FINANCES
Accounting standards issued and not yet effective and not early adoptedStandards and amendments, issued but not yet effective, that have not been early adopted are:
Amendment to PBE IPSAS 2 Statement of Cash FlowsAn amendment to PBE IPSAS 2 Statement of Cash Flows requires entities to provide disclosures that enable users of financial statements to evaluate changes in liabilities arising from financing activities, including both changes arising from cash flows and non-cash changes. This amendment is effective for annual periods beginning on or after 1 January 2021, with early application permitted. The Ministry does not intend to early adopt the amendment.
PBE IPSAS 41 Financial InstrumentsThe XRB issued PBE IPSAS 41 Financial Instruments in March 2019. This standard supersedes PBE IFRS 9 Financial Instruments, which was issued as an interim standard. It is effective for reporting periods beginning on or after 1 January 2022. Although the Ministry has not assessed the effect of the new standard, it does not expect any significant changes as the requirements are similar to PBE IFRS 9.
PBE FRS 48 Service Performance ReportingPBE FRS 48 replaces the service performance reporting requirements of PBE IPSAS 1 and is effective for reporting periods beginning on or after 1 January 2021. The Ministry has not yet determined how application of PBE FRS 48 will affect its statement of performance.
Significant accounting policies
Budgeting and forecasting figuresThe budget figures are those included in the Estimates of Appropriations (Budget) for the year ending 30 June 2020 (the Budget is 2019 Budget Economic and Fiscal Update (BEFU 2019) out-year 1 figures) and were published in the 2018/19 annual report.
The budget figures have been prepared in accordance with NZ GAAP, using accounting policies that are consistent with those adopted in preparing these financial statements and are based on PBE accounting standards.
The forecast figures are those included in the 2020 Pre-election Economic and Fiscal Update (PREFU 2020) forecast out-year 1 figures for the year ending 30 June 2021.
The forecast figures are unaudited and have been prepared in accordance with the requirements of the Public Finance Act 1989, and comply with Tier 1 PBE accounting standards and other applicable financial reporting standards, as appropriate for public benefit entities. They are to be used in the future for reporting historical general purpose financial statements.
The Chief Executive is responsible for the forecast financial statements, including the appropriateness of the assumptions underlying them and all other required disclosures. The forecast financial statements were approved for issue by the Chief Executive on 23 July 2020.
The forecast figures contained in these financial statements reflect the Ministry’s purpose and activities and are based on a number of assumptions on what may occur during the year 2020/21. Events and circumstances may not occur as expected. Factors that could lead to material differences between the forecast financial statements and the 2020/21 actual financial statements include changes to the baseline forecast through new initiatives, or technical adjustments.

88 ANNUAL REPORT 2019/20
Significant assumptions – forecast figures
The forecast figures have been compiled on the basis of existing government policies and Ministerial expectations at the time the PREFU 2020 was finalised.
The main assumptions were as follows.
• The Ministry’s activities will remain substantially the same as the previous year, based on the Government's current priorities. These priorities include the major themes of waste minimisation, climate change policy, resource management, and water management.
• Personnel costs were based on 640 full-time equivalent staff, which takes into account staff turnover.
• Operating costs were based on historical experience and various other factors that were believed to be reasonable under the circumstances.
• The estimates and underlying assumptions are reviewed on an ongoing basis. Revisions to accounting estimates are recognised in the period in which the estimate is revised if the revision affects only that period, or in the period of the revisions and future periods if the revision affects both current and future periods.
• Estimated year-end information for 2019/20 was used as the opening position for the 2020/21 forecasts.
Expenses
Cost allocationThe Ministry derives the cost of outputs using a cost allocation system. Direct costs are charged directly to the Ministry’s outputs. Indirect costs are charged to outputs based on a primary cost driver of salaried full-time equivalents. There were no material changes to the cost allocation model during the 2019/20 year.
Direct costs are those costs directly attributed to an output. Indirect costs are those costs that cannot be directly associated with a specific output. For the year ended 30 June 2020, direct costs accounted for 60 per cent of the Ministry’s costs (2018/19: 51 per cent) and indirect costs accounted for 40 per cent of the Ministry’s costs (2018/19: 49 per cent).
Foreign currency
Transactions in foreign currencies are initially translated at the foreign exchange rate at the date of the transaction.
Monetary assets and liabilities denominated in foreign currencies at balance date are translated to New Zealand dollars at the foreign exchange rate at balance date. Foreign exchange gains or losses arising from translation of monetary assets and liabilities are recognised in the statement of comprehensive revenue and expense.
Statement of cash flows
Cash means cash balances on hand and cash held in bank accounts.
Operating activities include cash received from all income sources of the Ministry and the cash payments made for the supply of goods and services.
Investing activities are those activities relating to the acquisition and disposal of non-current assets.
Financing activities comprise capital injections by, or repayment of capital to, the Crown.

89OUR FINANCES
Goods and Services Tax (GST)
All items in the financial statements, including appropriation statements, are stated exclusive of GST, except where otherwise stated. Receivables and payables in the statement of financial position are stated inclusive of GST. Where GST is not recoverable as an input tax, then it is recognised as part of the related asset or expense. The GST payable or receivable at balance date is included in payables or receivables in the statement of financial position.
Income tax
The Ministry is a public authority and consequently is exempt from the payment of income tax. Accordingly, no provision has been made for income tax.
Critical accounting estimates and assumptions
The preparation of financial statements in conformity with PBE accounting standards requires judgements, estimates and assumptions that affect the application of policies and reported amounts of assets, liabilities, revenue and expenses.
The estimates and associated assumptions are based on historical experience and other factors that are considered to be reasonable under the circumstances. Actual results may differ from these estimates.
The estimates and underlying assumptions are reviewed on an ongoing basis. Revisions to accounting estimates are recognised in the period in which the estimates are revised, if the revisions affect only that period, or in the period of the revisions and future periods if the revisions affect both current and future periods.
Judgements that have a significant effect on the financial statements and estimates with a significant risk of material adjustments in the next year are discussed in the notes to the financial statements.
Note 14 provides the key assumptions used in determining the estimates for long service leave and retirement gratuities.
Note 10 provides the key assumptions used in determining the useful life of software.
Commitments
Commitments are future expenses and liabilities to be incurred on contracts that have been entered into as at balance date. Information on non-cancellable capital and lease commitments are reported in the statement of commitments.
Contingencies
Contingent liabilities and contingent assets are reported at the point at which the contingency is evident or when a present liability is unable to be measured with sufficient reliability to be recorded in the financial statements (unquantifiable liability). Contingent liabilities, including unquantifiable liabilities, are disclosed if the possibility that they will crystallise is not remote. Contingent assets are disclosed if it is probable that the benefits will be realised.
Comparatives
When presentation or classification of items in the financial statements is amended or accounting policies are changed voluntarily, comparative figures are restated to ensure consistency with the current year.
COVID-19
The COVID-19 pandemic saw New Zealand close its borders to anyone not a citizen or permanent resident. From 26 March 2020 the country moved to level four, the highest alert level and lockdown. For more information of the impact on the Ministry's work programme refer to page 14 of the annual report.

90 ANNUAL REPORT 2019/20
2. Revenue
Accounting policy
Revenue CrownRevenue from the Crown is measured based on the Ministry’s funding entitlement for the reporting period. The funding entitlement is established by Parliament when it passes the Appropriation Acts for the financial year. The amount of revenue recognised takes into account any amendments to appropriations approved in the Appropriation (Supplementary Estimates) Act for the year and certain other unconditional funding adjustments formally approved prior to balance date.
There are no conditions attached to the funding from the Crown. However, the Ministry can incur expenses only within the scope and limits of its appropriations.
The fair value of Revenue Crown has been determined to be equivalent to the funding entitlement.
Revenue otherThe Ministry derives revenue through the provision of services to third parties. Such revenue is recognised when earned and is reported in the financial period to which it relates.
Breakdown of other revenue
2018/19 Actual
$000
2019/20 Actual
$000Departmental 938 1,158
Other 569 365
Total other revenue 1,507 1,523
3. Personnel costs
Accounting policySalaries and wagesSalaries and wages are recognised as an expense as employees provide services.
Superannuation schemesDefined contribution schemesEmployee contributions to the State Sector Retirement Savings Scheme, KiwiSaver, and the Government Superannuation Fund are accounted for as defined contribution superannuation schemes and are expensed in the surplus or deficit as incurred.

91OUR FINANCES
Breakdown of personnel costs
2018/19 Actual
$000
2019/20 Actual
$000Salaries and wages 40,107 45,507
Employer contributions to defined contribution plans 1,258 1,484
ACC Levy 84 35
Net employee entitlements 902 4,485
Other 35 58
Total personnel costs 42,386 51,569
4. Capital charge
Accounting policy
The capital charge is recognised as an expense in the financial year to which the charge relates.
Further information
The Ministry pays a capital charge to the Crown on its equity as at 30 June and 31 December each year. The capital charge rate for the year ended 30 June 2020 was 6 per cent (2018/19: 6 per cent).
5. Finance costs
2018/19 Actual $000
2019/20 Actual
$000Restoration costs (note 13) – 119
Total finance costs – 119

92 ANNUAL REPORT 2019/20
6. Other expenses
Accounting policy
Operating leasesAn operating lease is a lease where the lessor does not transfer substantially all the risks and rewards of ownership of an asset. Lease payments under an operating lease are recognised as an expense in a systematic manner over the term of the lease.
Lease incentives received are recognised evenly over the term of the lease as a reduction in rental expense.
Grants/subsidiesWhere grants and subsidies are discretionary until payment, the expense is recognised when the payment is made. Otherwise, the expense is recognised when the specified criteria have been fulfilled and notice has been given to the recipient.
Other expensesOther expenses are recognised as goods and services are received.
Breakdown of other expenses and further information
2018/19 Actual $000
2019/20 Actual
$000Audit fees for the financial statement audit 224 224
Operating lease expenses 2,425 2,477
Advertising and publicity 609 802
Contributions and sponsorship 859 871
External resources:
Advisory groups 207 443
Services provided by other government agencies 3,801 2,555
Data/imagery 329 208
Annual outsourced specialist services 3,729 5,585
Other contractors and consulting fees 7,957 16,742
Contracted research 327 442
General and administration 3,807 4,360
Net loss on disposal of property, plant and equipment 5 –
Other expenses 3,939 3,921
Total other operating expenses 28,218 38,630

93OUR FINANCES
7. Cash and cash equivalents
Accounting policy
Cash and cash equivalents include cash on hand, deposits held on call with banks, and other short-term highly liquid investments with original maturities of three months or less.
Breakdown of cash and cash equivalents and further information
2018/19 Actual $000
2019/20 Actual
$000Cash at bank and on hand 3,288 3,897
While cash and cash equivalents at 30 June 2020 are subject to the expected credit loss requirements of PBE IFRS 9, no loss allowance has been recognised because the estimated loss allowance for credit losses is trivial.
8. Receivables
Accounting policy
Receivables are initially measured at their face value, less an allowance for expected credit losses. The Ministry applies the simplified expected credit loss model of recognising lifetime expected credit losses for receivables.
In measuring expected credit losses, short-term receivables have been assessed on a collective basis as they possess shared credit risk characteristics. They have been grouped based on the days past due.
Short-term receivables are written off when there is no reasonable expectation of recovery. Indicators that there is no reasonable expectation of recovery include the debtor being in liquidation.
Breakdown of receivables and further information
2018/19 Actual $000
2019/20 Actual
$000Receivables from non-exchange transactions
Debtor Crown 17,009 15,999
Total receivables from non-exchange transactions 17,009 15,999
Receivables from exchange transactions
Debtors other 119 33
Total receivable from exchange transactions 119 33
Total receivables 17,128 16,032
There have been no changes during the reporting in the estimation techniques or significant assumptions used in measuring the loss allowance.

94 ANNUAL REPORT 2019/20
The allowance for credit losses at 30 June 2020 and 1 July 2019 was determined as follows:
30 June 2020 Receivable days past due
CurrentMore than
30 daysMore than
60 daysMore than
90 days TotalExpected credit loss rate 0% 0% 0% 0% –
Gross carrying amount ($000) 16,032 0 0 0 16,032
Lifetime expected credit loss ($000) 0 0 0 0 0
1 July 2019 Receivable days past due
CurrentMore than
30 daysMore than
60 daysMore than
90 days TotalExpected credit loss rate 0% 0% 0% 0% –
Gross carrying amount ($000) 17,121 7 0 0 17,128
Lifetime expected credit loss ($000) 0 0 0 0 0
The movement in the allowance for credit losses is as follows:
2018/19 Actual $000
2019/20 Actual
$000Allowance for credit losses as at 1 July calculated under PBE IPSAS 29 – –
PBE IFRS 9 expected credit loss adjustment – –
Opening allowance for credit losses as at 1 July – –
Increase in loss allowance made during the year 421 –
Receivables written off during the year (421) –
Balance at 30 June – –

95OUR FINANCES
9. Plant and equipment
Accounting policy
Plant and equipment consists of furniture and fittings (including leasehold improvements), office equipment and computer hardware. Plant and equipment are recognised and disclosed at cost less accumulated depreciation and impairment losses.
AdditionsIndividual assets, or group of assets, are capitalised if their cost is greater than $1,500. The value of an individual asset that is less than $1,500 and is part of a group of similar assets is capitalised.
Work in progress is recognised at cost less impairment and is not depreciated.
DisposalsGains and losses on disposals are determined by comparing the proceeds with the carrying amount of the asset. Gains and losses arising from disposal of plant and equipment are recognised in the statement of comprehensive revenue and expense in the period in which the transaction occurs. Any balance attributable to the disposed asset in the asset revaluation reserve is transferred to retained earnings.
DepreciationDepreciation is provided on a straight-line basis on all plant and equipment, at a rate that will write off the cost (or valuation) of the assets, over their useful lives. The depreciation charge for each period is recognised in the statement of comprehensive revenue and expense. The useful lives and associated depreciation rates of major classes of assets have been estimated as follows:
Asset classUseful life
(years) Depreciation rate
(%)Furniture and fittings 5–13 8.39–20.0
Office equipment 5 20.0
Computer hardware 3–4 25.0–33.33
Leasehold improvements (included in furniture and fittings) are capitalised and depreciated over the unexpired period of the lease or the estimated remaining useful lives of the improvements, whichever is shorter. Items classified as furniture and fittings but not deemed to be part of leasehold improvements are depreciated over their useful lives.
Impairment Plant and equipment that have a finite useful life are reviewed for impairment whenever events or changes in circumstances indicate that the carrying amount may not be recoverable. An impairment loss is recognised in the statement of comprehensive revenue and expense for the amount by which the asset’s carrying amount exceeds its recoverable amount. The recoverable amount is the higher of an asset’s fair value less costs to sell and value in use.
Value in use is depreciated replacement cost for an asset where the future economic benefits or service potential of the asset are not primarily dependent on the asset’s ability to generate net cash inflows and where the Ministry would, if deprived of the asset, replace its remaining future economic benefits or service potential.

96 ANNUAL REPORT 2019/20
Breakdown of plant and equipment and further information
Furniture and fittings
$000
Office equipment
$000
Computer hardware
$000Total$000
Cost
Balance at 1 July 2018 2,714 353 2,650 5,717
Additions – 13 336 349
Add: Closing work in progress – – – –
Less: Opening work in progress – – (46) (46)
Disposals – (4) (795) (799)
Balance at 30 June 2019 2,714 362 2,145 5,221
Balance at 1 July 2019 2,714 362 2,145 5,221
Additions – 3 493 496
Add: Closing work in progress – – 53 53
Less: Opening work in progress – – – –
Disposals – – – –
Balance at 30 June 2020 2,714 365 2,691 5,770
Accumulated depreciation and impairment losses
Balance at 1 July 2018 2,424 337 1,982 4,743
Depreciation expense 175 14 462 651
Elimination on disposal – (3) (791) (794)
Balance at 30 June 2019 2,599 348 1,653 4,600
Balance at 1 July 2019 2,599 348 1,653 4,600
Depreciation expense 87 5 383 475
Elimination on disposal – – – –
Balance at 30 June 2020 2,686 353 2,036 5,075
Carrying amounts
At 1 July 2018 290 16 668 974
At 30 June/1 July 2019 115 14 492 621
At 30 June 2020 28 12 655 695
RestrictionsThere are no restrictions over the title of the Ministry’s plant and equipment, nor are any plant and equipment pledged as security for liabilities.
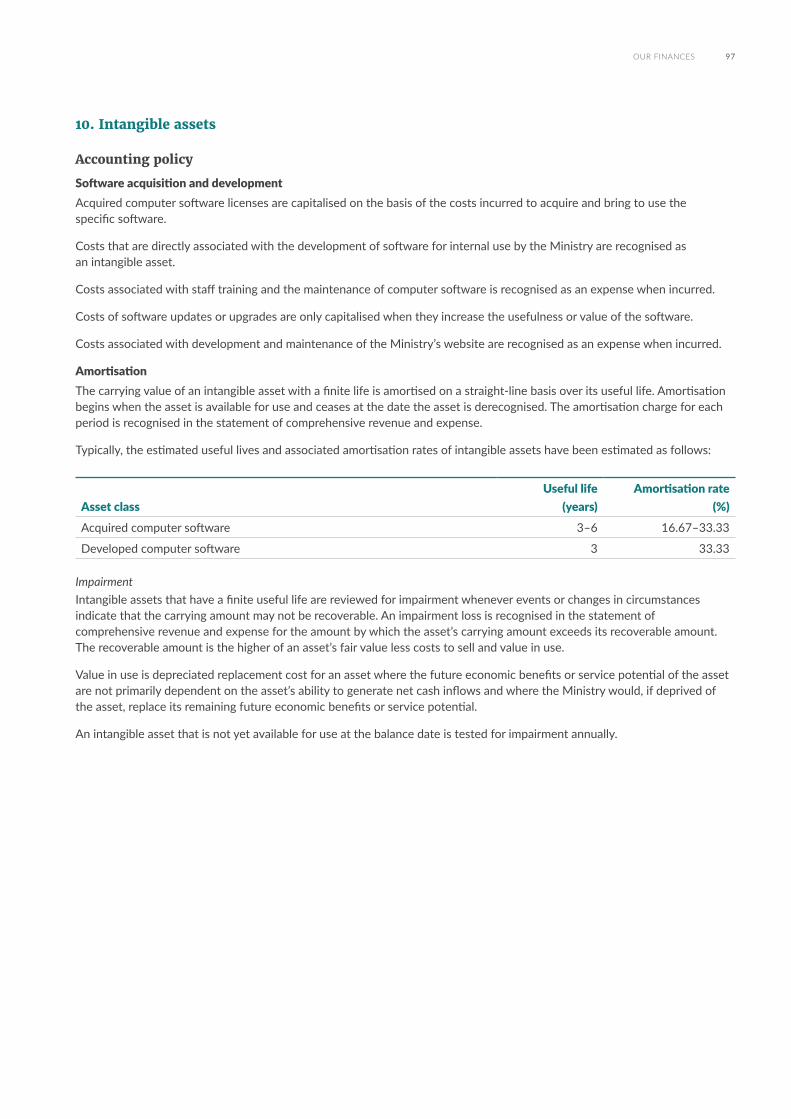
97OUR FINANCES
10. Intangible assets
Accounting policy
Software acquisition and developmentAcquired computer software licenses are capitalised on the basis of the costs incurred to acquire and bring to use the specific software.
Costs that are directly associated with the development of software for internal use by the Ministry are recognised as an intangible asset.
Costs associated with staff training and the maintenance of computer software is recognised as an expense when incurred.
Costs of software updates or upgrades are only capitalised when they increase the usefulness or value of the software.
Costs associated with development and maintenance of the Ministry’s website are recognised as an expense when incurred.
AmortisationThe carrying value of an intangible asset with a finite life is amortised on a straight-line basis over its useful life. Amortisation begins when the asset is available for use and ceases at the date the asset is derecognised. The amortisation charge for each period is recognised in the statement of comprehensive revenue and expense.
Typically, the estimated useful lives and associated amortisation rates of intangible assets have been estimated as follows:
Asset classUseful life
(years)Amortisation rate
(%)Acquired computer software 3–6 16.67–33.33
Developed computer software 3 33.33
Impairment Intangible assets that have a finite useful life are reviewed for impairment whenever events or changes in circumstances indicate that the carrying amount may not be recoverable. An impairment loss is recognised in the statement of comprehensive revenue and expense for the amount by which the asset’s carrying amount exceeds its recoverable amount. The recoverable amount is the higher of an asset’s fair value less costs to sell and value in use.
Value in use is depreciated replacement cost for an asset where the future economic benefits or service potential of the asset are not primarily dependent on the asset’s ability to generate net cash inflows and where the Ministry would, if deprived of the asset, replace its remaining future economic benefits or service potential.
An intangible asset that is not yet available for use at the balance date is tested for impairment annually.

98 ANNUAL REPORT 2019/20
Critical accounting estimates and assumptions
Useful lives of softwareThe useful life of software is determined at the time the software is acquired and brought into use and is reviewed at each reporting date for appropriateness. For computer software licences, the useful life represents management’s view of the expected period over which the Ministry will receive benefits from the software, but not exceeding the licence term. For internally generated software developed by the Ministry, the useful life is based on historical experience with similar systems as well as anticipation of future events that may impact the useful life, such as changes in technology.
Breakdown of intangible assets and further informationMovements in the carrying value for each class of intangible asset are as follows:
Acquired software
$000
Acquired software licences
$000
Internally generated
software (others)
$000
Internally generated
software (LUCAS)
$000Total $000
Cost
Balance at 1 July 2018 3,443 25 1,429 1,843 6,740
Additions 340 – – – 340
Add: Closing work in progress 106 – – – 106
Less: Opening work in progress (93) – – – (93)
Balance at 30 June 2019 3,796 25 1,429 1,843 7,093
Balance at 1 July 2019 3,796 25 1,429 1,843 7,093
Additions 143 – – – 143
Add: Closing work in progress 69 – – – 69
Less: Opening work in progress (106) – – – (106)
Balance at 30 June 2020 3,902 25 1,429 1,843 7,199
Accumulated amortisation and impairment losses
Balance at 1 July 2018 2,296 25 1,334 1,843 5,498
Amortisation expense 460 – – – 460
Balance at 30 June 2019 2,756 25 1,334 1,843 5,958
Balance at 1 July 2019 2,756 25 1,334 1,843 5,958
Amortisation expense 537 – 1 – 538
Balance at 30 June 2020 3,293 25 1,335 1,843 6,496
Carrying amounts
At 1 July 2018 1,147 – 95 – 1,242
At 30 June/1 July 2019 1,040 – 95 – 1,135
At 30 June 2020 609 – 94 – 703
RestrictionsThere are no restrictions over the title of the Ministry’s intangible assets, nor are any intangible assets pledged as security for liabilities.

99OUR FINANCES
11. Payables
Accounting policy
Creditors and other payables are non-interest bearing and are normally settled within 30 days, therefore payables are recorded at the amount payable.
Breakdown of payables and further information
2018/19 Actual $000
2019/20 Actual
$000Payables under exchange transactions
Creditors 2,946 1,571
Accrued expenses 2,507 2,711
Total payables under exchange transactions 5,453 4,282
Payables under non-exchange transactions
GST payable 964 410
Total payables 6,417 4,692
12. Return of operating surplus
2018/19 Actual $000
2019/20 Actual
$000Net surplus 5,387 3,845
Total return of operating surplus 5,387 3,845
The return of the operating surplus to the Crown is required to be paid by 31 October of each year.
13. Provisions
Accounting policy
A provision is recognised for future expenditure of uncertain amount or timing when:
• there is a present obligation (either legal or constructive) as a result of a past event
• it is probable that an outflow of resources embodying economic benefits or service potential will be required to settle the obligation
• a reliable estimate can be made of the amount of the obligation.
Provisions are not recognised for net deficits from future operating activities.
Provisions are measured at the present value of the expenditure expected to be required to settle the obligation using a pre-tax discount rate based on market yields on government bonds at balance date with terms to maturity that match, as closely as possible, the estimated timing of the future cash outflows. The increase in the provision due to the passage of time is recognised as an interest expense and is included in ‘finance costs’ (see note 5).

100 ANNUAL REPORT 2019/20
Breakdown of provisions and further information
2018/19 Actual $000
2019/20 Actual
$000Current portion
Restoration costs 777 896
Total current portion 777 896
Non-current portion
Restoration costs – –
Total provisions 777 896
Movements for each class of provision are as follows:
Restoration costs$000
Holiday pay
$000Total$000
Balance at 1 July 2018 777 32 809
Additional provisions made – – –
Amounts used – (32) (32)
Unused amounts reversed – – –
Balance at 30 June 2019 777 – 777
Balance at 1 July 2019 777 – 777
Additional provisions made (note 5) 119 – 119
Amounts used – – –
Unused amounts reversed – – –
Balance at 30 June 2020 896 – 896
Provisions represent
• restoration costs in respect of the Ministry’s leased premises. The Ministry is required at the expiry of the lease term to make good any damage caused to the premises and to remove any signage, fixtures and fittings installed by the Ministry
• holiday pay costs arising from a review of the application of the Holidays Act 2003 to annual leave payments.

101OUR FINANCES
14. Employee entitlements
Accounting policy
Short-term employee entitlementsEmployee entitlements that are due to be settled within 12 months after the end of the period in which the employee renders the related service are measured based on accrued entitlements at current rates of pay.
These include salaries and wages accrued up to balance date, annual leave earned but not yet taken at balance date, long service leave, and retirement gratuities expected to be settled within 12 months.
Long-term employee entitlementsEmployee entitlements that are due to be settled beyond 12 months after the end of the reporting period in which the employee renders the related service, such as long service leave and retirement gratuities, are calculated on an actuarial basis. The calculations are based on:
• likely future entitlements accruing to staff, based on years of service, years to entitlement, the likelihood that staff will reach the point of entitlement, and contractual entitlements information
• the present value of the estimated future cash flows.
Presentation of employee entitlementsSalaries and wages accrued, annual leave, vested long service leave, and non-vested long service leave and retirement gratuities expected to be settled within 12 months of balance date are classified as a current liability. All other employee entitlements are classified as a non-current liability.
Superannuation schemes
Obligations for contributions to defined contribution schemes such as the State Sector Retirement Savings Scheme, KiwiSaver, and the Government Superannuation Fund are recognised as an expense in the statement of comprehensive revenue and expense as incurred.
Critical accounting estimates and assumptions
Long service leave and retirement gratuitiesThe measurement of the long service leave and retirement gratuities obligations depends on a number of factors that are determined on an actuarial basis using a number of assumptions. Two key assumptions used in calculating this liability include the discount rate and the salary inflation factor. Any changes in these assumptions will affect the carrying amount of the liability.
Expected future payments are discounted using discount rates derived from the yield curve of New Zealand government bonds. The discount rates used have maturities that match, as closely as possible, the estimated future cash outflows. The rates used range from 0.22 per cent to 1.63 per cent (2018/19: 1.03 per cent to 2.23 per cent) and a long-term salary growth of 2.72 per cent (2018/19: 2.92 per cent) were used. The discount rates and salary inflation factor used are those advised by the Treasury.
If the discount rate were to differ by 1 per cent from the Ministry’s estimates, with all other factors held constant, the carrying amount of the liability and the surplus/deficit would be an estimated $7,000 higher/lower.
If the salary inflation factor were to differ by 1 per cent from the Ministry’s estimates, with all other factors held constant, the carrying amount of the liability and the surplus/deficit would be an estimated $7,000 higher/lower.

102 ANNUAL REPORT 2019/20
Breakdown of employee entitlements
2018/19 Actual $000
2019/20 Actual
$000Current portion
Salary accruals 307 826
Annual leave 2,231 3,357
Long service leave and retirement gratuities 295 362
Total current portion 2,833 4,545
Non-current portion
Long service leave and retirement gratuities 936 1,196
Total employee entitlements 3,769 5,741
15. Capital management
Accounting policy
The Ministry’s capital is its equity, which comprise taxpayers’ funds and is represented by net assets.
The Ministry manages its revenues, expenses, assets, liabilities, and general financial dealings prudently. The Ministry’s equity is largely managed as a by-product of managing revenue, expenses, assets, liabilities, and compliance with the government budget processes, Treasury instructions, and the Public Finance Act.
The objective of managing the Ministry’s equity is to ensure that the Ministry effectively achieves its goals and objectives for which it has been established while remaining a going concern.
16. Related party transactions
The Ministry is a wholly owned entity of the Crown. The Government significantly influences the roles of the Ministry as well as being its major source of revenue.
Related party disclosures have not been made for transactions with related parties that are within a normal supplier or client/recipient relationship on terms and condition no more or less favourable than those that it is reasonable to expect the Ministry would have adopted in dealing with the party at arm’s length in the same circumstances.
The Ministry enters into transactions with government departments, Crown entities, and state-owned enterprises on an arm’s length basis. Transactions with other government agencies are not disclosed as related party transactions when they are consistent with the normal operating arrangements between government agencies and undertaken on the normal terms and conditions for such transactions.
Key management personnel compensation
2018/19 Actual
2019/20 Actual
Environmental Leadership Team, including the Chief Executive
Remuneration $2,158,335 $2,807,074
Full-time equivalent staff 7.2 9.1
The 2018/19 figure is restated to ensure consistency with the current year.
The above key management personnel compensation excludes the remuneration and other benefits received by the Minister for the Environment and the Minister for Climate Change. The Ministers’ remuneration and other benefits are not received only for their role as a member of key management personnel of the Ministry. The Ministers’ remuneration and other benefits are set by the Remuneration Authority under the Members of Parliament (Remuneration and Services) Act 2013 and are paid under Permanent Legislative Authority, and not paid by the Ministry.
The above compensation also takes into account the salary sacrificed by the Chief Executive at the end of the financial year relating to COVID-19.

103OUR FINANCES
17. Events after the balance sheet date
No significant events which may impact on the results have occurred between year end and the signing of these financial statements.
18. Financial instruments
Financial instrument categories
The carrying amounts of financial assets and financial liabilities in each of the categories are as follows:
2018/19 Actual $000
2019/20 Actual
$000Financial assets measured at amortised cost
Cash and cash equivalents 3,288 3,897
Receivables 119 33
Total financial assets measured at amortised cost 3,407 3,930
Financial liabilities measured at amortised cost
Payables (excluding GST payable) 5,453 4,282
Financial instrument risks
The Ministry’s activities expose it to a variety of financial instrument risks, including market risk, credit risk, and liquidity risk. The Ministry has policies to manage the risks associated with financial instruments and seeks to minimise exposure from financial instruments. These policies do not allow any transactions that are speculative in nature to be entered into.
Market risk
Currency riskCurrency risk is the risk that the fair value or future cash flows of a financial instrument will fluctuate because of changes in foreign exchange rates.
The Ministry makes purchases of goods and services overseas that require it to enter into transactions denominated in foreign currencies and as a result, exposure to currency risk arises. This is considered to be immaterial and accordingly, no sensitivity analysis has been completed.
Fair value interest rate riskInterest rate risk is the risk that the return on invested funds will fluctuate due to changes in market interest rates.
The Ministry has no significant exposure to interest rate risk because it has no interest-bearing financial instruments.
Credit riskCredit risk is the risk that a third party will default on its obligations to the Ministry, causing the Ministry to incur a loss.
In the normal course of its business, credit risk arises from receivables and deposits with banks.
The Ministry is permitted to deposit funds only with Westpac, a registered bank. Westpac bank has a high credit rating of AA- (Standard and Poor’s credit rating). For its other financial instruments, the Ministry does not have significant concentrations of credit risk.
The Ministry’s maximum credit exposure for each class of financial instrument is represented by the total carrying amount of cash and cash equivalents, and receivables. There is no collateral held as security against these financial instruments, including those instruments that are overdue or impaired.
Cash and cash equivalents (note 7) and receivables (note 8) are subject to the expected credit loss model prescribed by PBE IFRS 9. The notes for these items provide relevant information on impairment.

104 ANNUAL REPORT 2019/20
Liquidity riskManagement of liquidity riskLiquidity risk is the risk that the Ministry will encounter difficulty raising liquid funds to meet commitments as they fall due.
As part of meeting its liquidity requirements, the Ministry closely monitors its forecast cash requirements with expected cash draw-downs from the New Zealand Debt Management Office. The Ministry maintains a target level of available cash to meet liquidity requirements.
Contractual maturity analysis of financial liabilitiesThe table below analyses the Ministry’s financial liabilities that will be settled based on the remaining period at the balance sheet date to the contractual maturity date. The amounts disclosed are the contractual undiscounted cash flows.
Carrying amount
$000
Contractual cash flows
$000
Less than 6 months
$000
6 months – 1 year
$000
1–5 years$000
More than 5 years
$0002020
*Payables (note 11) 4,282 4,282 4,282 – – –
2019
*Payables (note 11) 5,453 5,453 5,453 – – –
(* Excluding GST payable)
19. Explanations of major variances against budget
Explanations for major variances from the Ministry’s original 2019/20 budget figures are:
(i) Statement of comprehensive income
2019/20 Actual
$000
2019/20 Budget
$000
2019/20 Variance
$000Revenue Crown 94,012 86,269 7,743
Revenue other 1,523 955 568
Contribution and Sponsorship 871 285 586
External resources 25,975 17,513 8,462
General and administration 4,360 6,234 (1,874)
Other operating costs 3,291 6,225 (2,304)
Revenue Crown: The actual Crown revenue was higher than budget mainly due to:
• a transfer of funding from 2018/19 for progressing work on the Comprehensive Review of the Resource Management Act, part of resource management reforms
• a transfer of funding from 2018/19 for progressing work on processing applications for water conservation orders
• a transfer of funding from 2018/19 for progressing work on developing a National Climate Change Risk Assessment
• a transfer of funding from 2018/19 for progressing work on the establishment of an Independent Climate Change Commission
• additional funding allocated for costs of collecting and administering waste levies and monitoring projects funded by the levy
• additional funding allocated for the establishment and operational costs of the Climate Change Commission prior to it being a legally operating entity.

105OUR FINANCES
Revenue other: The actual other revenue was higher than budget primarily due to: revenue received from other agencies for staff secondments, international travel reimbursements, and other services provided by the Ministry.
Contribution and sponsorship: The actual expense was higher than budget due to the Ministry providing additional contributions towards the Sustainable Business EMBARK and other climate change related programmes.
External resources: The actual external resources costs were higher than budget because additional resources were used for progressing resource management and water management reforms and the climate change work programme.
General Admin and other operating costs: The actual expenses were lower than budget due to travel restrictions and lower other office expenses due to COVID-19 lockdown.
(ii) Statement of financial position
2019/20 Actual
$000
2019/20 Budget
$000
2019/20 Variance
$000Receivables 16,032 9,800 6,232
Intangible assets 703 1,989 (1,286)
Payables 4,692 5,465 (773)
Employee entitlements 5,741 3,559 2,182
Receivables: The higher level of receivables primarily relates to amounts receivable from the Crown. Funds drawn down by the Ministry during the year differed from budget, leaving an increased amount receivable at year-end.
Intangible assets: The actual intangible assets position was lower than budget due to delays in work programmes including Public Cloud Adoption/Migration, Microsoft 365 and Enterprise Content Management Replacement.
Payables: The actual payables were lower than budget due to lower than expected year-end accruals. Also a larger number of 2019/20 liabilities were paid out prior to year-end than expected.
Employee entitlements: The higher level of employee entitlements primarily relates to increase in annual leave payable due to travel restrictions and salary accruals at the year end.
(iii) Statement of cash flows
2019/20 Actual
$000
2019/20 Budget
$000
2019/20 Variance
$000Receipts from the Crown 95,022 86,269 8,753
Receipts from revenue other 1,459 955 504
Payments to suppliers (39,748) (34,680) 5,068
Explanations for variances in the Statement of cash flows are explained above.
106 ANNUAL REPORT 2019/20
Non-departmental statements and schedules for the year ended 30 June 2020
The following non-departmental statements and schedules record the revenue, expenses, assets, liabilities, commitments, contingent liabilities, and contingent assets the Ministry manages on behalf of the Crown.

107OUR FINANCES
Schedule of non-departmental revenue fortheyearended30June2020
2018/19 Actual
$000
2019/20 Mains
Forecast*$000
2019/20 Actual
$000
2020/21 Forecast*
$000Revenue
Royalties 773 750 506 750
Levies 41,546 40,100 38,774 45,500
Emissions trading 846,396 1,054,518 1,043,163 1,151,562
Emissions Trading Scheme penalty revenue 674 – 116 –
Grants refund 3 – – –
Total non-departmental revenue 889,392 1,095,368 1,082,559 1,197,812
*The statement of accounting policies provides explanations of these figures which are not subject to audit.
Explanations of significant variances against budget are detailed in note 9.
Schedule of non-departmental capital receipts fortheyearended30June2020
The Ministry on behalf of the Crown has no capital receipts (2018/19: $nil).
The accompanying accounting policies and notes form part of these financial statements. For a full understanding of the Crown’s financial position and the results of its operations for the year, refer to the consolidated Financial Statements of the Government for the year ended 30 June 2020.

108 ANNUAL REPORT 2019/20
Schedule of non-departmental expenses fortheyearended30June2020
Notes
2018/19 Actual
$000
2019/20 Mains
Forecast*$000
2019/20 Actual
$000
2020/21 Forecast*
$000Expenses
Grants and settlements 42,963 67,290 54,621 162,005
Promotions 800 800 1,000 800
Subscriptions and contributions to international forums 1,074 1,185 1,126 1,215
Crown entity funding 25,517 26,117 30,977 36,812
Levy disbursement 18,489 18,000 16,973 20,000
Allocation of New Zealand Units 543,251 565,922 649,943 746,935
Net changes in carbon price of New Zealand Units 6 224,494 – 1,094,732 –
GST input expense 11,166 15,916 13,359 31,933
Other 3,062 2,327 5,615 1,677
Total non-departmental expenses 870,816 697,557 1,868,346 1,001,377
*The statement of accounting policies provides explanations of these figures which are not subject to audit.
Explanations of significant variances against budget are detailed in note 9.
The accompanying accounting policies and notes form part of these financial statements. For a full understanding of the Crown’s financial position and the results of its operations for the year, refer to the consolidated Financial Statements of the Government for the year ended 30 June 2020.
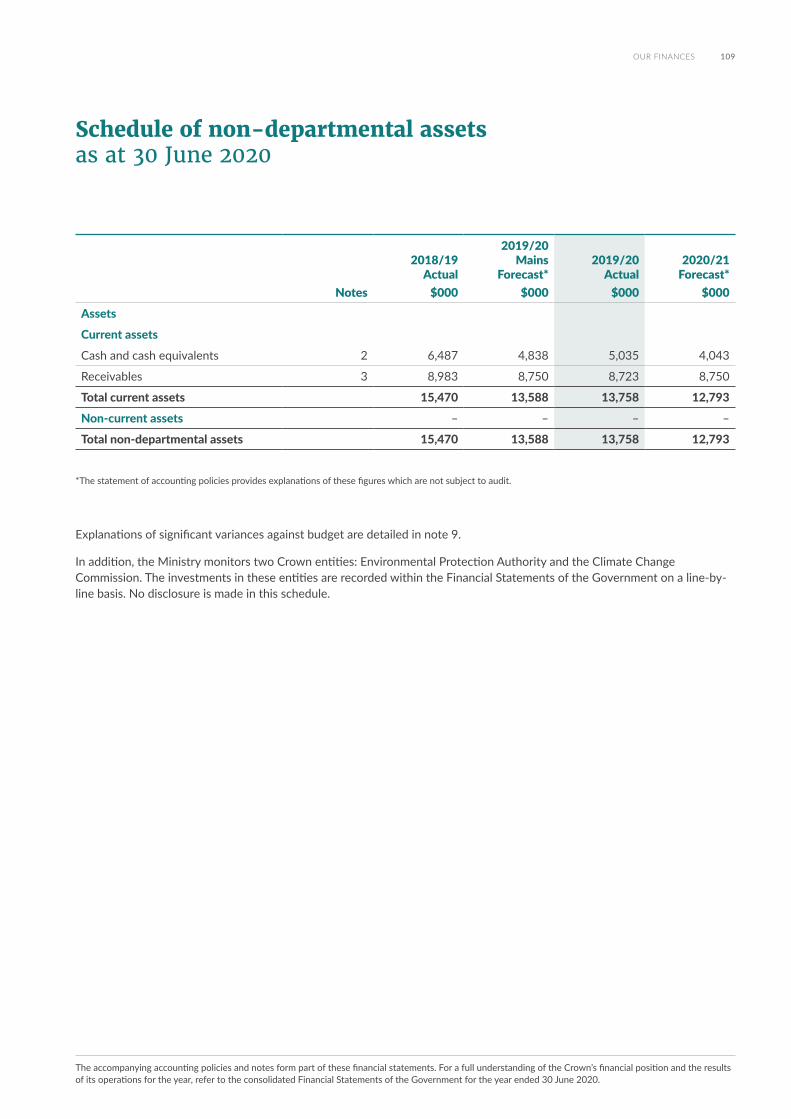
109OUR FINANCES
Schedule of non-departmental assets asat30June2020
Notes
2018/19 Actual
$000
2019/20 Mains
Forecast*$000
2019/20 Actual
$000
2020/21 Forecast*
$000Assets
Current assets
Cash and cash equivalents 2 6,487 4,838 5,035 4,043
Receivables 3 8,983 8,750 8,723 8,750
Total current assets 15,470 13,588 13,758 12,793
Non-current assets – – – –
Total non-departmental assets 15,470 13,588 13,758 12,793
*The statement of accounting policies provides explanations of these figures which are not subject to audit.
Explanations of significant variances against budget are detailed in note 9.
In addition, the Ministry monitors two Crown entities: Environmental Protection Authority and the Climate Change Commission. The investments in these entities are recorded within the Financial Statements of the Government on a line-by-line basis. No disclosure is made in this schedule.
The accompanying accounting policies and notes form part of these financial statements. For a full understanding of the Crown’s financial position and the results of its operations for the year, refer to the consolidated Financial Statements of the Government for the year ended 30 June 2020.

110 ANNUAL REPORT 2019/20
Schedule of non-departmental liabilities asat30June2020
Notes
2018/19 Actual
$000
2019/20 Mains
Forecast*$000
2019/20 Actual
$000
2020/21 Forecast*
$000Liabilities
Current liabilities
Payables 4 50,096 45,461 63,071 45,463
Provisions 6 2,883,678 2,182,284 3,803,735 3,519,823
Total current liabilities 2,933,774 2,227,745 3,866,806 3,565,286
Non-current liabilities
Payables 4 109,503 104,489 104,489 99,164
Total non-current liabilities 109,503 104,489 104,489 99,164
Total non-departmental liabilities 3,043,277 2,332,234 3,971,295 3,664,450
*The statement of accounting policies provides explanations of these figures which are not subject to audit.
Explanations of significant variances against budget are detailed in note 9.
Schedule of non-departmental commitments asat30June2020
The Ministry, on behalf of the Crown, has no non-cancellable capital or lease commitments (2018/19: $nil).
The accompanying accounting policies and notes form part of these financial statements. For a full understanding of the Crown’s financial position and the results of its operations for the year, refer to the consolidated Financial Statements of the Government for the year ended 30 June 2020.

111OUR FINANCES
Schedule of non-departmental contingent liabilities and contingent assets asat30June2020
Unquantifiable contingent liabilities and contingent assets
Environmental liabilitiesUnder common law and various statutes, the Crown may have responsibility to remedy adverse effects on the environment arising from Crown activities.
Liabilities for contaminated sites are recognised in accordance with PBE IPSAS 19: Provisions, Contingent Liabilities and Contingent Assets. Obligations for the clean up of contaminated sites expressed in announcements or legislation are not recognised where they are executory in nature or have not created a valid expectation in other parties that the Crown will discharge the obligation.
New Zealand Emissions Trading Scheme
Post-1989 forest land
Owners of post-1989 forest land (or those with a registered interest in the forest on the land) may voluntarily become participants in the New Zealand Emissions Trading Scheme (NZ ETS), and in so doing are entitled to receive New Zealand Units (NZUs) for the increase in carbon stock in their forests.
Those landowners who have not registered their post-1989 forest land or who have deregistered from the scheme have until the end of 2022 (the third five-year period beginning 1 January 2018 to 31 December 2022) to decide whether to re-register post-1989 forest land and receive NZUs for the period beginning from 1 January 2018. If they re-register, they can claim NZUs for all the carbon stored in their forest from 1 January 2018, subject to review and approval of their applications.
Participants also have various legal obligations including the surrender of units if the carbon stocks in their registered forest areas fall below a previously reported level (for example, due to harvesting or fire). However, the surrender liability is capped at the amount of units previously received by the participant for that area of forest land (if any).
Assets and liabilities relating to the post-1989 forestry sector have only been recognised in these non-departmental financial statements and schedules to the extent that participants have registered in the scheme at 30 June 2020.
Pre-1990 forest landPre-1990 forest land is an area that was forest land on 31 December 1989, and that on 31 December 2007 is still forest land and is covered by predominantly exotic forest species.
Subject to various exemptions, if an area of more than two hectares of pre-1990 forest land is deforested in any five-year period from 1 January 2008, the landowner becomes a mandatory participant in the NZ ETS. The landowner must submit an emissions return and either surrender units or pay cash at a rate of $25 per NZU for emissions resulting from deforestation.
At 30 June 2020, there may be some deforestation which has not yet been reported to the Crown.
Quantifiable contingent liabilities
Sand royaltiesCustomary marine title holders under the Marine Coastal Area (Takutai Moana) Act 2011 could have payments issued to them retrospectively with regard to sand and shingle royalties, if the royalty is taken in the customary marine title area. The amount could be between $500,000 and $2 million (2018/19: Between $500,000 and $2 million).
The Ministry on behalf of the Crown has no other contingent liability or assets (2018/19: $nil).
The accompanying accounting policies and notes form part of these financial statements. For a full understanding of the Crown’s financial position and the results of its operations for the year, refer to the consolidated Financial Statements of the Government for the year ended 30 June 2020.

112 ANNUAL REPORT 2019/20
Notes to the non-departmental statements and schedules
1.Statement of accounting policies for the year ended 30 June 2020
Reporting entity
These non-departmental statements and schedules present financial information on public funds managed by the Ministry on behalf of the Crown.
These non-departmental balances are consolidated into the Financial Statements of the Government. For a full understanding of the Crown’s financial position, results of operations, and cash flows for the year, refer to the Financial Statements of the Government for the year ended 30 June 2020.
Basis of preparation
These non-departmental statements and schedules have been prepared in accordance with the Government’s accounting policies as set out in the Financial Statements of the Government, and in accordance with relevant Treasury instructions and Treasury circulars.
Measurements and recognition rules applied in the preparation of these non-departmental statements and schedules are consistent with New Zealand generally accepted accounting practice (Tier 1 Public Sector Public Benefit Entity Accounting Standards) as appropriate for public benefit entities.
Accounting policies
The accounting policies set out below have been applied consistently to all periods presented in these financial statements.
The accrual basis of accounting has been used unless otherwise stated.
The following particular accounting policies have been applied:
Significant accounting policies
Budgeting and forecasting figuresThe budget figures are those included in the Estimates of Appropriations (Budget) for the year ending 30 June 2020 and the Supplementary Estimates of Appropriations (Revised Budget) for the year ending 30 June 2020 (the Budget is 2019 Budget Economic and Fiscal Update (BEFU 2019) out-year 1 figures and the Revised Budget is SUPPS 2020 out-year 0 figures).
The budget figures have been prepared in accordance with NZ GAAP, using accounting policies that are consistent with those adopted in preparing these financial statements and are based on PBE standards.
The Budget figures used in these financial statements for the New Zealand Emissions Trading Scheme (NZ ETS) surrender of units and allocation of NZUs were valued using market prices per carbon unit at the time of the Budget forecast. Similarly, the liability provision for the NZ ETS was valued using market price per carbon unit at the time of Budget forecast. Budget (mains forecast) figure for the appropriation of Allocation of New Zealand Units is based on NZ$25 per carbon unit and the budget (revised forecast) figure for the appropriation of Allocation of New Zealand Units is based on NZ$35 per carbon unit to mitigate the risk of breaching the appropriation.
The forecast figures are those included in the Pre-election Economic and Fiscal Update (PREFU 2020 forecast) out-year 1 figures for the year ending 30 June 2021 except for the figures used in these financial statements for the NZ ETS surrender of units and allocation of NZUs. These are valued using market prices per carbon unit at the time of the BEFU 2020 forecast. Similarly, the liability provision for the NZ ETS is valued using market prices per carbon unit at the time of BEFU 2020 forecast. The forecast figure for the appropriation of Allocation of New Zealand Units was valued at NZ$35 per carbon unit.
The forecast figures are unaudited and have been prepared in accordance with the requirements of the Public Finance Act 1989, and comply with Tier 1 PBE accounting standards and other applicable financial reporting standards, as appropriate for public benefit entities. They are to be used in the future for reporting historical general purpose financial statements.

113OUR FINANCES
The forecast figures contained in these financial statements reflects the Ministry’s purpose and activities and are based on a number of assumptions on what may occur during the year 2020/21. Events and circumstances may not occur as expected. Factors that could lead to material differences between the forecast financial statements and the 2020/21 actual financial statements include changes to the baseline forecast through new initiatives, or technical adjustments.
New Zealand Emissions Trading SchemeThe NZ Emissions Trading Scheme (NZ ETS) is New Zealand’s primary response to global climate change. It puts a price on greenhouse gases to provide an incentive to reduce emissions, invest in energy efficiency, and plant trees.
The purpose of the scheme is to help reduce New Zealand’s emissions to below business-as-usual levels and help New Zealand meet its international obligations under the United Nations Framework Convention on Climate Change and the Kyoto Protocol. This is achieved by establishing a price on emissions, which creates a financial incentive for emitters to reduce their emissions.
In operation since 2008, the mandatory NZ ETS currently covers emissions from forestry, stationary energy, industrial processes and liquid fossil fuels, which are collectively responsible for roughly 50 per cent of New Zealand’s emissions. Emissions from waste are covered by the NZ ETS from 2013, while emissions from synthetic gases are covered by the NZ ETS or a levy from 2013. Since 1 January 2012, the agricultural sector has had mandatory reporting obligations under the NZ ETS.
The New Zealand Emissions Trading Scheme is the system in which New Zealand Units (NZUs) are traded. Under the NZ ETS, certain sectors are required to acquire and surrender NZUs or other eligible emission units to account for their direct greenhouse gas emissions or the emissions associated with their products.
Detailed information can be found on the Ministry for the Environment’s website.
The Ministry collects forecast information in relation to the allocation and surrender of units from different agencies.
• The Ministry for Primary Industries provides information on post-1989 and Permanent Forest Sink Initiative allocation, deforestation and deregistration forecast.
• The Ministry of Business, Innovation and Employment provides information for surrender of units for Liquid fossil fuels and Stationary energy and industrial processes.
• The Environmental Protection Authority provides information on allocation of units to industrial sectors and other removable activities.
• The Ministry for the Environment provides surrender forecast for Synthetic Greenhouse Gases (SGG) and the Waste sectors; and allocation forecast for SGG, Waste sectors, and the Negotiated Greenhouse Agreements.
Revenue
The Ministry collects revenue on behalf of the Crown. This revenue includes the Waste Disposal Levy which is legislated under the Waste Minimisation Act 2008, the Synthetic Greenhouse Gas Levy under the Climate Change Response Act 2002, and the Climate Change (Synthetic Greenhouse Gas Levies) Regulations 2013 and from the surrender of units under the New Zealand Emissions Trading Scheme (NZ ETS).
The Waste Disposal Levy revenue is recognised in the month when waste is disposed at landfill.
The Synthetic Greenhouse Gas Levy revenue is recognised in the month when it is collected by the New Zealand Transport Agency.
Revenue (including accruals) arising from the NZ ETS is recognised when a participant makes emissions or a liability to the Crown is incurred.

114 ANNUAL REPORT 2019/20
Expenses
Grant expenditureNon-discretionary grants are those grants awarded if the grant application meets the specified criteria. They are recognised as expenditure when an application that meets the specified criteria for the grant has been received.
Discretionary grants are those grants where the Ministry has no obligation to award on receipt of the grant application.
For discretionary grants without substantive conditions, the total committed funding over the life of the funding agreement is recognised as expenditure when the grant is approved by the relevant committee or body and the approval has been communicated to the applicant for example, Environmental Legal Assistance.
Grants with substantive conditions are recognised as an expense at the earlier of the grant payment date or when the grants conditions have been satisfied.
Allocation of New Zealand Units (NZUs) under the NZ ETSExpenses (including accruals) arising from the allocation of NZUs under the NZ ETS is recognised as follows.
• For NZUs issued as one-off compensation (such as the pre-1990 forestry allocation), expenditure is recognised at the point that the participant has provided all relevant information to the Government to show they have met the criteria and rules for the issue of NZUs and are entitled to them under the NZ ETS.
• For NZUs issued for carbon sequestration (such as post-1989 forestry) or as annual compensation for NZ ETS costs (such as the industrial allocation), expenditure is recognised when the carbon is sequestered (based on forecasts of sequestration for registered participants in the scheme at each reporting date) or as the emissions compensated by the industrial allocation occur.
The methodology used to approximate the price at the date of each transaction is the lower of the monthly average NZU price and the spot NZU price at the end of each month.
Levy disbursement Expenses arising from waste levy disbursements are recognised in the month the waste is disposed at landfill. Under the Waste Minimisation Act 2008, 50 per cent of the levy collected must be distributed to territorial local authorities.
Settlement expenditureAn expense and an associated provision is recognised for settlement agreements with Waikato River iwi and other iwi on the initialling of the deeds of settlement by the Crown and the relevant iwi.
Foreign exchange Foreign currency transactions are translated into New Zealand dollars using the exchange rates prevailing at the dates of the transactions. Foreign exchange gains and losses resulting from the settlement of such transactions and from the translation at year-end exchange rates of the monetary assets and liabilities denominated in foreign currencies are recognised in the schedule of non-departmental revenue or expenses.
Goods and services tax All items in the financial statements, including appropriation statements, are stated exclusive of GST, except for receivables and payables, which are stated on a GST inclusive basis. In accordance with the Treasury instructions, GST is returned on revenue received on the behalf of the Crown, where applicable. However, an input tax deduction is not claimed on non-departmental expenditure. Instead, the amount of GST applicable to non-departmental expenditure is recognised as a separate expense and eliminated against GST revenue on consolidation of the Financial Statements of the Government.
Commitments Future expenses and liabilities to be incurred on non-cancellable contracts that have been entered into as at balance date are disclosed as commitments to the extent that there are equally unperformed obligations.
Cancellable commitments that have penalty or exit costs explicit in the agreement on exercising that option to cancel are included in the statement of commitments at the lower of the remaining contractual commitment and the value of that penalty or exit cost.

115OUR FINANCES
Contingent liabilitiesContingent liabilities are disclosed at the point at which the contingency is evident.
Critical accounting estimates and assumptionsThe preparation of financial statements in conformity with PBE accounting standards requires judgements, estimates and assumptions that affect the application of policies and reported amounts of assets, liabilities, revenue and expenses.
The estimates and associated assumptions are based on historical experience and various other factors that are considered to be reasonable under the circumstances. Actual results may differ from these estimates.
The estimates and underlying assumptions are reviewed on an ongoing basis. Revisions to accounting estimates are recognised in the period in which the estimates are revised, if the revisions affect only that period, or in the period of the revisions and future periods if the revisions affect both current and future periods.
Judgements that have a significant effect on the financial statements and estimates with a significant risk of material adjustments in the next year are discussed in the notes to the financial statements.
Note 6 provides the key assumptions used in determining the provision for the allocation of NZUs.
2. Cash and cash equivalents
Accounting policy
Cash and cash equivalents include cash on hand, deposits held on call with banks, and other short-term highly liquid investments with original maturities of three months or less.
Breakdown of cash and cash equivalents and further information
2018/19 Actual
$000
2019/20 Actual
$000Cash at bank and on hand 6,487 5,035
While cash and cash equivalents at 30 June 2020 are subject to the expected credit loss requirements of PBE IFRS 9, no loss allowance has been recognised because the estimated loss allowance for credit losses is trivial.

116 ANNUAL REPORT 2019/20
3. Receivables
Accounting policy
Receivables are initially measured at their face value, less an allowance for expected credit losses. The Ministry applies the simplified expected credit loss model of recognising lifetime expected credit losses for receivables.
In measuring expected credit losses, short-term receivables have been assessed on a collective basis as they possess shared credit risk characteristics. They have been grouped based on the days past due.
Short-term receivables are written off when there is no reasonable expectation of recovery. Indicators that there is no reasonable expectation of recovery include the debtor being in liquidation.
Breakdown of receivables and further information
2018/19 Actual
$000
2019/20 Actual
$000Receivables 5,992 7,439
Fines and penalties receivable 77 49
Accrued revenue 3,664 3,020
Total receivables 9,733 10,508
Less allowance for credit losses (750) (1,785)
Total receivables – non-exchange 8,983 8,723
The expected credit loss rates for receivables at 30 June 2020 and 1 July 2019 are based on the payment profile of revenue on credit over the prior 12 months at the measurement date and the corresponding historical credit losses experienced for that period. Judgement is also applied to determine whether historical loss rates are expected to continue into the future, and any adjustment to the loss rates due to current and forward-looking macroeconomic factors that might affect the recoverability of receivables.
There have been no changes during the reporting in the estimation techniques or significant assumptions used in measuring the loss allowance.

117OUR FINANCES
The allowance for credit losses at 30 June 2020 and 1 July 2019 was determined as follows:
Receivable days past due
30 June 2020 CurrentMore than
30 daysMore than
60 daysMore than
90 days TotalExpected credit loss rate 0% 0% 0% 0% –
Gross carrying amount ($000) 8,674 1 0 48 8,674
Lifetime expected credit loss ($000) 0 0 0 0 0
Receivable days past due
1 July 2019 CurrentMore than
30 daysMore than
60 daysMore than
90 days TotalExpected credit loss rate 0% 0% 0% 0% –
Gross carrying amount ($000) 8,943 0 3 37 8,983
Lifetime expected credit loss ($000) 0 0 0 0 0
The movement in the allowance for credit losses is as follows:
2018/19 Actual
$000
2019/20 Actual
$000Allowance for credit losses as at 1 July calculated under PBE IPSAS 29 – –
PBE IFRS 9 expected credit loss adjustment – –
Opening allowance for credit losses as at 1 July – –
Increase in loss allowance made during the year 750 1,785
Receivables written off during the year (750) (1,785)
Balance at 30 June – –

118 ANNUAL REPORT 2019/20
4. Payables
Accounting policy
Short-term payables are recorded at the amount payable.
Breakdown of payables and further information
2018/19 Actual
$000
2019/20 Actual
$000Current payables are represented by:
Waikato River Co-management 5,708 5,708
Waikato River Clean-up Fund 6,904 6,904
Te Pou Tupua 590 590
Transitional Support for Local Government and Iwi 2,795 4,006
GST payable 517 530
Other payables 33,582 45,333
Total current portion 50,096 63,071
Non-current payables are represented by:
Waikato River Co-management 33,382 30,748
Waikato River Clean-up Fund 74,304 72,015
Te Pou Tupua 1,817 1,726
Total non-current portion 109,503 104,489
Total payables – non-exchange 159,599 167,560
The carrying value of payables approximates their fair value.
Payables are non-interest bearing and are normally settled within 30 days except for the Waikato River Co-management and the Waikato River Clean-up Fund. These payments are settled on the due dates.
Recognition of future discounted cash flows for the Waikato River Funds
Payables Total2020–2021
$0002022–2025
$0002026–2030
$0002031–2035
$0002036–2038
$000 $000Co-management
Nominal 6,000 25,000 18,000 – – 49,000
Discount (292) (5,241) (7,011) – – (12,544)
Recognised 5,708 19,759 10,989 – – 36,456
Clean up
Nominal 7,333 36,665 36,665 36,665 14,675 132,003
Discount (429) (7,689) (15,042) (20,507) (9,417) (53,084)
Recognised 6,904 28,976 21,623 16,158 5,258 78,919
The table above reconciles the cash outflows that will occur over the next 18 years.

119OUR FINANCES
Recognition of future discounted cash flows for the Whanganui River Funds
Payables Total2020–2021
$0002021–2025
$0002026–2030
$0002031–2034
$000 $000Te Pou Tupua
Nominal 600 1,000 1,000 600 3,200
Discount (10) (191) (382) (301) (884)
Recognised 590 809 618 299 2,316
The table above reconciles the cash outflows that will occur over the next 14 years.
5. Financial instruments
The carrying amounts of financial assets and financial liabilities in each of the categories are as follows:
2018/19 Actual
$000
2019/20 Actual
$000Financial assets measured at amortised cost
Cash and cash equivalents 6,487 5,035
Receivables (excludes fines and penalties receivable) 8,906 8,674
Total financial assets measured at amortised cost 15,393 13,709
Financial liabilities measured at amortised cost
Payables (excluding GST payable) 159,082 167,030
Credit risk
Credit risk is the risk that a third party will default on its obligation, causing a loss to be incurred. Credit risk arises from deposits with banks and receivables.
The Ministry is permitted to deposit funds only with Westpac, a registered bank. Westpac bank has a high credit rating of AA- (Standard and Poor’s credit rating). For its other financial instruments, the Ministry does not have significant concentrations of credit risk.
The maximum credit exposure for each class of financial instrument is represented by the total carrying amount of cash and cash equivalents and net receivables. There is no collateral held as security against these financial instruments, including those instruments that are overdue or impaired. Other than Westpac bank, there are no significant concentrations of credit risk.
Cash and cash equivalents (note 2) and receivables (note 3) are subject to the expected credit loss model prescribed by PBE IFRS 9. The notes for these items provide relevant information on impairment.

120 ANNUAL REPORT 2019/20
6. Provisions
Accounting policyA provision is recognised for future expenditure of uncertain amount or timing when there is a present obligation (either legal or constructive) as a result of a past event, it is probable that an outflow of future economic benefits will be required to settle the obligation, and a reliable estimate can be made of the amount of the obligation. Provisions are not recognised for future operating losses.
Provisions are measured at the present value of the expenditure expected to be required to settle the obligation using a pre-tax discount rate that reflects current market assessments of the time value of money and the risks specific to the obligation. The increase in the provision due to the passage of time is recognised as a finance cost.
The provision for the allocation of NZUs is remeasured using the current spot price at each reporting date.
2018/19 Actual
$000
2019/20 Actual
$000Current portion
Allocation of New Zealand Units 2,883,678 3,803,735
Total current portion 2,883,678 3,803,735
Non-current portion – –
Total provisions 2,883,678 3,803,735
Transitional Support for Local Government and Iwi
$000
Allocation of New Zealand Units
$000Total $000
Balance at 1 July 2018 1,575 2,541,706 2,543,281
Additional provisions made 1,620 543,251 544,871
Amounts used (400) (425,779) (426,179)
Amounts transferred (2,795) – (2,795)
(Gains)/losses – 224,500 224,500
Balance at 30 June 2019 – 2,883,678 2,883,678
Balance at 1 July 2019 – 2,883,678 2,883,678
Additional provisions made – 649,943 649,943
Amounts used – (824,618) (824,618)
(Gains)/losses – 1,094,732 1,094,732
Balance at 30 June 2020 – 3,803,735 3,803,735

121OUR FINANCES
Provision for NZ ETS credits
2018/19 Units in
million
2018/19 Amount in
$million
2019/20 Units in
million
2019/20 Amount in
$millionOpening provision 120.5 2,541 124.5 2,883
New provision recognised during the period 22.5 543 22.4 650
Provision used during the period (18.5) (426) (28.4) (824)
(Gains)/losses – 225 – 1,095
Closing provision 124.5 2,883 118.5 3,804
Allocation of New Zealand UnitsThe New Zealand Emissions Trading Scheme (NZ ETS) was established to encourage a reduction in greenhouse gas emissions. The NZ ETS creates a limited number of tradable units (the NZ Unit) which the Government can allocate freely or sell to entities. The allocation of NZ Units creates a provision. An expense is recognised in relation to the allocation of free units. The provision is reduced, and revenue recognised, as NZ Units are surrendered to the Crown by emitters. Emitters can also use the NZ$25 price option to settle their emission obligation.
The Ministry has classified the provision for allocation of NZ Units as a current liability, because it does not have an unconditional right to defer settlement of the liability for at least 12 months after the reporting date. Based on forecasts of ETS activity, expected recovery/settlement is expected to occur as follows:
• within 12 months: $1,341.748 million (2018/19: $950.997 million)
• after more than 12 months: $2,461.987 million (2018/19: $1,932.681 million).
The carbon price of NZ$32.10 (2018/19: NZ$23.15) has been used to value NZ Units. This price is determined based on the current quoted NZ Units spot price at the end of the reporting date published by OM Financial Limited and reported on their CommTrade carbon website.
Details of current climate change policies are listed at on the Ministry for the Environment’s website.
New Zealand’s obligation under the Kyoto Protocol New Zealand has fully complied with its CP1 commitments and met obligations under the Kyoto Protocol with a surplus of 123.7 million units.
New Zealand’s remaining CP1 surplus units demonstrate good environmental integrity and have no market value as they cannot be traded (2018/19: $nil). However, New Zealand will recognise some of these surplus units to meet its 2020 emissions reduction target.
New Zealand’s 2020 target under the UNFCCCNew Zealand’s unconditional target is to reduce emissions to 5 per cent below 1990 gross GHG levels for the period 2013 to 2020. New Zealand chose to take its 2020 emission reduction target under the United Nations Framework Convention on Climate Change (UNFCCC) and not under the Kyoto Protocol, as it did for the 2008 to 2012 first commitment period (CP1). However, New Zealand continues to apply the Kyoto Protocol framework of rules in tracking progress towards its target.
Because the 2020 target was taken under the UNFCCC, it does not place any legally binding fiscal liability on the Crown. Therefore, this does not give rise to an obligation under PBE IPSAS 19: Provisions, Contingent Liabilities, and Contingent Assets.
However, the Ministry continues to report progress towards this target through its 2020 net position web page and in Progress towards our international climate-change commitments web page.
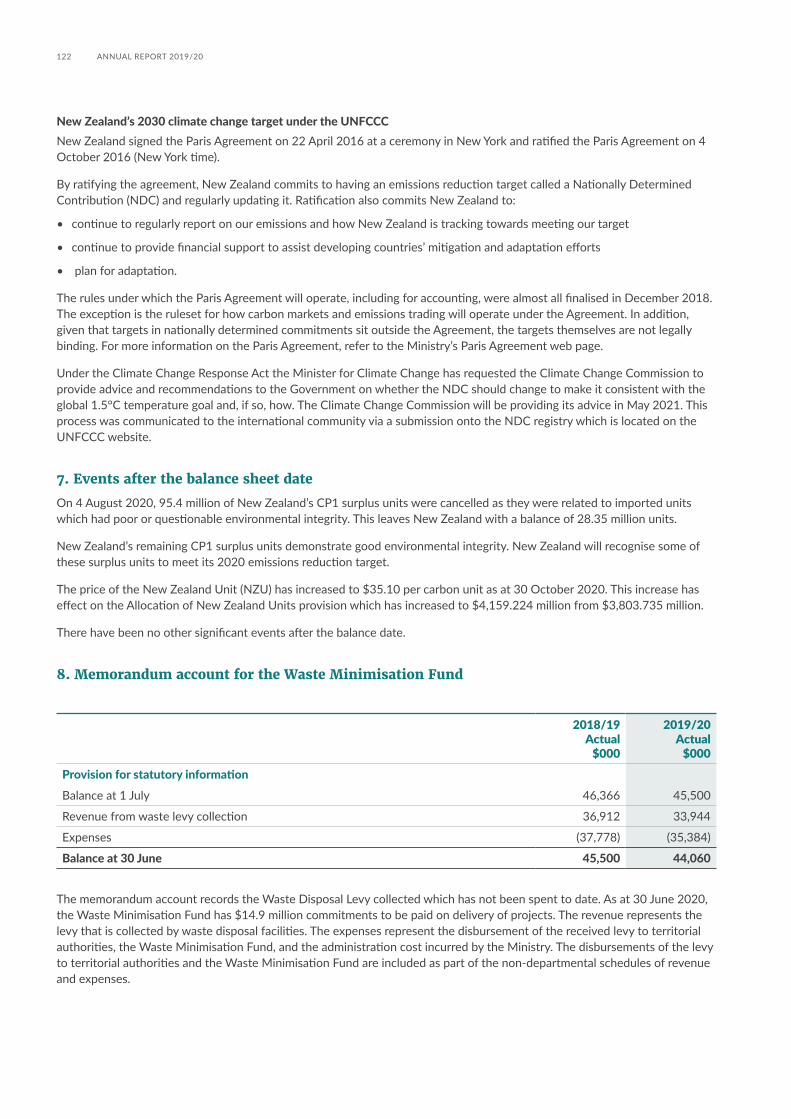
122 ANNUAL REPORT 2019/20
New Zealand’s 2030 climate change target under the UNFCCCNew Zealand signed the Paris Agreement on 22 April 2016 at a ceremony in New York and ratified the Paris Agreement on 4 October 2016 (New York time).
By ratifying the agreement, New Zealand commits to having an emissions reduction target called a Nationally Determined Contribution (NDC) and regularly updating it. Ratification also commits New Zealand to:
• continue to regularly report on our emissions and how New Zealand is tracking towards meeting our target
• continue to provide financial support to assist developing countries’ mitigation and adaptation efforts
• plan for adaptation.
The rules under which the Paris Agreement will operate, including for accounting, were almost all finalised in December 2018. The exception is the ruleset for how carbon markets and emissions trading will operate under the Agreement. In addition, given that targets in nationally determined commitments sit outside the Agreement, the targets themselves are not legally binding. For more information on the Paris Agreement, refer to the Ministry’s Paris Agreement web page.
Under the Climate Change Response Act the Minister for Climate Change has requested the Climate Change Commission to provide advice and recommendations to the Government on whether the NDC should change to make it consistent with the global 1.5°C temperature goal and, if so, how. The Climate Change Commission will be providing its advice in May 2021. This process was communicated to the international community via a submission onto the NDC registry which is located on the UNFCCC website.
7. Events after the balance sheet date
On 4 August 2020, 95.4 million of New Zealand’s CP1 surplus units were cancelled as they were related to imported units which had poor or questionable environmental integrity. This leaves New Zealand with a balance of 28.35 million units.
New Zealand’s remaining CP1 surplus units demonstrate good environmental integrity. New Zealand will recognise some of these surplus units to meet its 2020 emissions reduction target.
The price of the New Zealand Unit (NZU) has increased to $35.10 per carbon unit as at 30 October 2020. This increase has effect on the Allocation of New Zealand Units provision which has increased to $4,159.224 million from $3,803.735 million.
There have been no other significant events after the balance date.
8. Memorandum account for the Waste Minimisation Fund
2018/19 Actual
$000
2019/20 Actual
$000Provision for statutory information
Balance at 1 July 46,366 45,500
Revenue from waste levy collection 36,912 33,944
Expenses (37,778) (35,384)
Balance at 30 June 45,500 44,060
The memorandum account records the Waste Disposal Levy collected which has not been spent to date. As at 30 June 2020, the Waste Minimisation Fund has $14.9 million commitments to be paid on delivery of projects. The revenue represents the levy that is collected by waste disposal facilities. The expenses represent the disbursement of the received levy to territorial authorities, the Waste Minimisation Fund, and the administration cost incurred by the Ministry. The disbursements of the levy to territorial authorities and the Waste Minimisation Fund are included as part of the non-departmental schedules of revenue and expenses.

123OUR FINANCES
9. Explanations of major variances against mains forecast
Explanations for major variances from the Ministry’s non-departmental mains forecast figures are as follows:
(i) Schedule of non-departmental revenue
2019/20 Actual
$000
2019/20 Mains
Forecast $000
Variance $000
Levies 38,773 40,100 (1,327)
Emissions trading 1,043,163 1,054,518 (11,355)
Levies: Levies include the revenue collected from the waste disposal landfill facility operators and the Synthetic Greenhouse Gas Levy collected by the New Zealand Transport Agency.
The revenue collected from the waste disposal levy was lower than mains forecast due to COVID-19 related decreased activity reported by landfill facility operators.
Emissions trading: The actual revenue from surrendering units under the New Zealand Emissions Trading Scheme from emitters was lower than mains forecast primarily due to lower than forecast units surrendered by the industrial sector. This decrease was partially offset an increase in the price of New Zealand Units.
There were no other significant variances to mains forecast.
(ii) Schedule of non-departmental expenses
2019/20 Actual
$000
2019/20 Mains
Forecast $000
Variance $000
Grants and settlements 54,621 67,290 (12,669)
Crown entity funding 30,977 26,117 4,860
Allocations of New Zealand Units 649,943 565,922 84,021
Net changes in carbon price of New Zealand Units 1,094,732 – 1,094,732
Others 5,615 2,327 3,288
Grants and settlements: Expenditure on grants and settlements were lower than mains forecast primarily due to the following.
• Community Environment Fund: Expenditure was lower than mains forecast due to projects experiencing delays. An expense transfer of funding from 2019/20 to 2020/21 is sought to ensure each project has sufficient funds to complete their programme of work that support the implementation of freshwater and resource management reforms, and other initiatives. This transfer represents the rephasing of funds to match the expected delivery of project milestones.
• Contestable Waste Minimisation Fund: Expenditure was lower than mains forecast due to projects experiencing delays. Further, each year there is a time lag between the Waste Disposal Levy and the funding round opening. Baseline updates are used to match expected spend over the forecast period, once it is known following the funding round.
• Contaminated Sites Remediation Fund: Expenditure was lower than mains forecast due to projects experiencing delays because of significant weather events and seasonal climate conditions. An expense transfer of funding from 2019/20 to 2020/21 is sought to ensure each project has sufficient funds to complete their programme of work.
• Fresh Start for Fresh Water: Rotorua Te Arawa Lakes Programme: Expenditure was lower than mains forecast. This is because actual deliverables for the project were lower than anticipated for the financial year 2019/20. An expense transfer of funding from 2019/20 to 2020/21 is sought to ensure this project has sufficient funds to complete the programme of work.

124 ANNUAL REPORT 2019/20
• The Freshwater Improvement Fund: Expenditure was lower than mains forecast. These are large scale environmental projects that can be susceptible to delays because of external factors such as significant weather events and seasonal climate conditions, contractual obligations and supplier/contractor availability. An expense transfer of funding from 2019/20 to 2020/21 is sought to ensure each project has sufficient funds to complete their programme of work.
Crown entity funding: Crown entity funding relates to the Environmental Protection Authority and the Climate Change Commission.
During the year, the Ministry received additional funding upon the establishment of the Climate Change Commission.
Allocation of New Zealand Units: Expenditure for Allocation of New Zealand Units was higher than mains forecast primarily due to an increase in the price of New Zealand Units. Further, fewer units were allocated to industrial sectors and other removal activities than forecast. However this was partially offset by higher than forecast units allocated to post- 1989 forestry sector.
Net changes in carbon price of New Zealand units: The actual expense recognised is in relation to changes in carbon price of New Zealand Units. These changes are considered as a remeasurement under the Public Finance Act 1989 and do not require appropriation.
Others: This includes expenditure related to Water science and economics, Impairment of debt related and Loss on Sale of New Zealand Units appropriations.
Expenditure was higher than mains forecast due to the provision of impairment of debt relating to Climate Change activities and recognising loss on sale of New Zealand units because participants using the fixed price option for surrendering units.
(iii) Schedule of non-departmental liabilities
2019/20 Actual
$000
2019/20 Mains
Forecast$000
Variance$000
Payables 167,560 149,950 17,610
Provisions 3,803,735 2,182,284 1,621,451
Payables: The actual payables were higher than mains forecast due to higher than anticipated accruals for both Grants and settlements.
Provisions: Provisions relate to Allocation of New Zealand Units. This was higher than mains forecast primarily due to increase in the price of New Zealand Units. Further, fewer units were allocated to industrial sectors and other removal activities than forecast. However this was partially offset by higher than forecast units allocated to post- 1989 forestry sector.

125OUR FINANCES
Statement of expenses and capital expenditure fortheyearended30June2020
The following statements report information about the expenses and capital expenditure incurred against each appropriation administered by the Ministry for the year ended 30 June 2020.

126 ANNUAL REPORT 2019/20
Statement of budgeted and actual expenses and capital expenditure incurred against appropriations fortheyearended30June2020
Annual and permanent appropriations for Vote Environment
18 This includes adjustments made in the Supplementary Estimates and transfers under the Public Finance Act 1989.
19 Departmental appropriations amounts exclude remeasurement of $240,054 (2018/19: $236,135).
20 The numbers in this column represent where the end-of-year performance information has been reported for each appropriation administered by the Ministry, as detailed below:
1. The Ministry’s annual report. 2. To be reported by the Minister for the Environment in a report appended to this annual report. 3. To be reported by the Climate Change Commission in their annual report. 4. To be reported by the Environmental Protection Authority in their annual report. 5. No reporting due to an exemption obtained under section 15D of the Public Finance Act.
2018/19 Expenditure
$000
2019/20 Budget*
$000
2019/20 Revised
Budget*18 $000
2019/20 Expenditure19
$000
2020/21 Forecast*
$000
Location of end-of-year
performance information20
Departmental output expenses
Improving New Zealand’s Environment – – – – 83,956
Managing Climate Change in New Zealand – – – – 19,379
Independent Climate Change Committee Set Up Costs 248 – 718 662 – 1
Ministerial Services 1,650 2,183 1,763 1,629 – 1
Waste Minimisation Administration 3,766 5,906 6,706 5,010 – 1
Total departmental output expenses 5,664 8,089 9,187 7,301 103,335
Departmental capital expenditure
Capital Expenditure – Permanent Legislative Authority under section 24(1) of the Public Finance Act 1989 656 1,200 1,200 654 2,325 1
Total departmental capital expenditure 656 1,200 1,200 654 2,325
Non-departmental output expenses
Administration of New Zealand Units held on Trust 177 177 177 177 177 5
Climate Change Commission – Advisory and Monitoring Function – – 3,610 3,610 8,535 3
Community Environment Fund 1,501 3,172 2,634 1,846 – 5
Contaminated Sites Remediation Fund 1,975 3,617 2,434 1,181 10,708 5
Contestable Waste Minimisation Fund 15,523 20,797 19,997 13,401 – 2
Emissions Trading Scheme 6,392 6,392 6,392 6,392 6,392 4

127OUR FINANCES
2018/19 Expenditure
$000
2019/20 Budget*
$000
2019/20 Revised
Budget*18 $000
2019/20 Expenditure19
$000
2020/21 Forecast*
$000
Location of end-of-year
performance information20
Environmental Protection Authority functions – – – – 21,885
Environmental Protection Authority: Decision Making Functions 12,383 12,448 13,073 13,073 – 4
Environmental Protection Authority: Monitoring and Enforcement Functions 6,742 7,277 7,902 7,902 – 4
Environmental Training Programmes 1,900 1,900 2,419 2,419 1,900 5
Promotion of Sustainable Land Management 800 800 1,000 1,000 800 5
Te Mana o Te Wai – Restoring the Life-giving Capacity of Fresh Water 1,037 500 679 286 – 5
The Freshwater Improvement Fund 5,068 15,500 19,499 19,058 – 2
Water science and economics – – – – 1,500
Total non-departmental output expenses 53,498 72,580 79,816 70,345 51,897
Non-departmental other expenses
Allocation of New Zealand Units 543,251 551,298 824,390 649,943 814,415 2
Climate Change Development Fund 300 300 300 300 300 5
Environmental Legal Assistance 432 600 650 808 750 5
Exclusive Economic Zone Major Prosecutions Fund – – 500 – – 5
Framework Convention on Climate Change 135 140 170 159 170 5
Fresh Start for Fresh Water: Waikato River Clean-up Fund 5,178 5,044 5,044 5,044 4,902 2
Impairment of Debt relating to Climate Change Activities 750 47,500 147,000 1,785 147,000 5
Impairment of Debt relating to Environment Activities – 1,500 1,500 – 1,500 5
International Subscriptions 108 152 152 118 152 5
Loss on Sale of New Zealand Units 6 189,300 189,300 1,993 208,995 5
Te Pou Tupua 109 109 109 109 106 5
Transitional Support for Local Government and Iwi 1,620 – 1,211 1,211 – 5
United Nations Environment Programme 531 593 593 549 593 5
Waikato River Co-governance 910 910 910 910 1,195 5
Waikato River Co-management 2,519 2,365 2,365 2,365 2,202 5
Waste Disposal Levy Disbursement to Territorial Authorities 18,489 18,000 20,000 16,973 – 2
Total non-departmental other expenses 574,338 817,811 1,194,194 682,267 1,182,280

128 ANNUAL REPORT 2019/20
2018/19 Expenditure
$000
2019/20 Budget*
$000
2019/20 Revised
Budget*18 $000
2019/20 Expenditure19
$000
2020/21 Forecast*
$000
Location of end-of-year
performance information20
non-departmental capital expenditure
Capital Contribution to the Environmental Protection Authority – 1,250 – – 1,509 5
Climate Change Commission: Capital Contribution – – 599 599 – 3
Total non-departmental capital expenditure – 1,250 599 599 1,509
Multi-category appropriations
Waste Minimisation MCA – – – – 46,703
Departmental output expenses
Waste Minimisation Administration – – – – 5,906
Non-departmental output expenses
Contestable Waste Minimisation Fund – – – – 20,797
Non-departmental other expenses
Waste Disposal Levy Disbursements to Territorial Local Authorities – – – – 20,000
Waste and Resource Recovery (MCA) – – – – 86,323
Non-departmental output expenses
Waste Minimisation and Resource Recovery Initiatives – – – – 53,323
Non-Departmental Capital Expenditure
Waste and Resource Recovery Infrastructure – – – – 33,000
Climate Change MCA 23,878 19,701 27,220 27,182 – 1
Departmental output expenses
Carbon Monitoring Programme 4,114 2,187 2,930 3,458 –
Domestic Climate Change Programme Policy Advice 14,639 13,512 19,522 19,006 –
International Climate Change Programme Policy Advice 5,080 3,953 4,719 4,698 –
Synthetic Greenhouse Gas Levy 45 49 49 20 –
Environmental Management Obligations and Programmes MCA 2,253 3,467 3,239 2,601 – 1
Departmental output expenses
Domestic Obligations and Programmes 1,375 1,560 2,349 1,581 –
International Obligations and Institutions Policy Advice 878 1,907 890 1,020 –

129OUR FINANCES
2018/19 Expenditure
$000
2019/20 Budget*
$000
2019/20 Revised
Budget*18 $000
2019/20 Expenditure19
$000
2020/21 Forecast*
$000
Location of end-of-year
performance information20
Improving Environmental Management MCA 38,498 54,199 51,834 49,917 – 1
Departmental output expenses
Developing and Implementing Treaty Settlements and Environmental Accords Policy Advice 2,127 1,900 1,935 1,738 –
Marine Environment Policy Advice 1,425 3,919 1,905 1,606 –
Resource Management Implementation 13,054 13,260 13,964 16,365 –
Resource Management Policy Advice 7,683 11,646 11,786 12,583 –
Water Management Implementation 2,026 5,837 5,338 4,374 –
Water Management Policy Advice 10,054 15,487 14,484 11,532 –
Non-departmental output expenses
Water science and economics 2,129 2,150 2,422 1,719 –
Mitigating Environmental Hazards and Waste MCA 3,911 3,918 6,454 6,408 – 1
Departmental output expenses
Environmental Hazards and Waste Policy Advice 2,130 3,296 1,279 967 –
Waste Management and Minimisation 1,781 622 5,175 5,441 –
Total multi-category appropriations 68,540 81,285 88,747 86,108 133,026
Total annual and permanent appropriations 702,696 982,215 1,373,743 847,274 1,474,372
*The statement of accounting policies provides explanations of these figures which are not subject to audit.
Remeasurement
In 2019/20, the Crown has reported a remeasurement loss of $1,095 million in relation in the provision of the allocation of New Zealand Units under the Emissions Trading Scheme (2018/19: $255 million).
The remeasurement of the provisions takes account of the revisions in the price of emission units. In accordance with section 4(2)(a) of Part One of the Public Finance Amendment Act 2004, changes in assets and liabilities due to remeasurements do not require appropriations.

130 ANNUAL REPORT 2019/20
Statement of budgeted and actual expenses and capital expenditure incurred against appropriations fortheyearended30June2020(continued)
Details of multi-year appropriations
On 1 July 2015, a multi-year appropriation, Fresh Start for Fresh Water: Rotorua Te Arawa Lakes Programme was established in Vote Environment, non-departmental output expenses for maintaining and improving the water quality of the Rotorua Lakes. This appropriation expires on 30 June 2020.
2018/19 Actual
$000
2019/20 Revised Budget*
$000
2019/20 Actual
$000Appropriation for non-departmental output expenses:
Fresh Start for Fresh Water: Rotorua Te Arawa Lakes Programme**
Cumulative expenses to 1 July 5,824 11,015 11,015
Current year expenses 5,191 11,985 5,983
Cumulative expenses to 30 June 11,015 23,000 16,998
Remaining appropriation 11,985 – 6,002
Total appropriation 23,000 23,000 23,000
*The statement of accounting policies provides explanations of these figures which are not subject to audit.
**The year-end information for the above multi-year appropriation is reported by the Minister for the Environment in a report appended to this annual report.

131OUR FINANCES
Statement of expenses and capital expenditure incurred without, or in excess of, appropriation or other authority fortheyearended30June2020
A breach of appropriation occurred in Vote Environment, Non-Departmental Other Expense: Environmental Legal Assistance, in part due to higher volumes of grant applicants. In addition, the changes to authority through the March Baseline Update did not account for the increased expenditure. Due to the timing of when the issue was identified, there was no mechanism to seek additional authority. This has resulted in actual expenditure exceeding by $158,352. (2018/19: $488,624 in the Waste Disposal Levy Disbursements to Territorial Local Authorities)
Statement of expenses and capital expenditure incurred outside of scope of an appropriation and without other authority fortheyearended30June2020
The Ministry pays 50 per cent of the Waste Disposal Levy collected to territorial authorities quarterly, to fund activities in their waste management and minimisation plans (WMMP). In order to be eligible for payment, territorial authorities must have reviewed their WMMPs within the statutorily required timeframe. Over the last five financial years, the ministry made payments to territorial authorities where they have not reviewed their WMMPs within the statutorily required timeframe. This resulted in excess expenditure of $3.114 million over the five year period from the 2015/16 to 2019/20 financial years. Given the timespan, it was not possible to quantify the amount of unappropriated expenses prior to the 2015/16 financial year.
These expenditure breaches will be validated under Section 26C of the Public Finance Act 1989 and explanations for the breach tabled in Parliament.
All other expenses in relation to the activities of, or appropriations administered by, the Ministry during 2019/20 were within appropriation.
Statement of departmental capital injections fortheyearended30June2020
The Ministry received capital injection of $0.250 million for the year ended 30 June 2020 (2018/19: $nil).
Statement of departmental capital injections without, or in excess of, authorityfortheyearended30June2020
The Ministry has not received any capital injections during the year without, or in excess of, authority.

132 ANNUAL REPORT 2019/20
Statement of responsibility
I am responsible, as Chief Executive of the Ministry for the Environment (the Ministry), for:
• the preparation of the Ministry’s financial statements, and statements of expenses and capital expenditure, and for the judgements expressed in them
• having in place a system of internal control designed to provide reasonable assurance as to the integrity and reliability of financial reporting
• ensuring that end-of-year performance information on each appropriation administered by the Ministry is provided in accordance with sections 19A to 19C of the Public Finance Act 1989, whether or not that information is included in this annual report
• the accuracy of any end-of-year performance information prepared by the Ministry, whether or not that information is included in the annual report.
In my opinion:
• the financial statements fairly reflect the financial position of the Ministry as at 30 June 2020 and its operations for the year ended on that date
• the forecast financial statements fairly reflect the forecast financial position of the Ministry as at 30 June 2021 and its operations for the year ending on that date.
Vicky Robertson Chief Executive
12 November 2020
133OUR FINANCES
Independent Auditor’s ReportTo the readers of Ministry for the Environment’s annual report for the year ended 30 June 2020
The Auditor-General is the auditor of Ministry for the Environment (the Ministry). The Auditor-General has appointed me, Rehan Badar, using the staff and resources of Audit New Zealand, to carry out, on his behalf, the audit of:
• the financial statements of the Ministry on pages 80 to 105, that comprise the statement of financial position, statement of commitments, statement of contingent liabilities and contingent assets as at 30 June 2020, the statement of comprehensive revenue and expense, statement of changes in equity, and statement of cash flows for the year ended on that date and the notes to the financial statements that include accounting policies and other explanatory information;
• the performance information prepared by the Ministry for the year ended 30 June 2020 on pages 28 to 75;
• the statements of expenses and capital expenditure of the Ministry for the year ended 30 June 2020 on pages 126 to 131; and
• the schedules of non-departmental activities which are managed by the Ministry on behalf of the Crown on pages 107 to 124 that comprise:
– the schedules of assets; liabilities; commitments; and contingent liabilities and assets as at 30 June 2020;
– the schedules of expenses; and revenue for the year ended 30 June 2020; and
– the notes to the schedules that include accounting policies and other explanatory information.
Opinion
In our opinion:
• the financial statements of the Ministry on pages 80 to 105:
– present fairly, in all material respects:
° its financial position as at 30 June 2020; and
° its financial performance and cash flows for the year ended on that date; and
– comply with generally accepted accounting practice in New Zealand in accordance with Public Benefit Entity Reporting Standards.
• the performance information of the Ministry on pages 28 to 75:
– presents fairly, in all material respects, for the year ended 30 June 2020:
° what has been achieved with the appropriation; and
° the actual expenses or capital expenditure incurred compared with the appropriated or forecast expenses or capital expenditure; and
– complies with generally accepted accounting practice in New Zealand.
• the statements of expenses and capital expenditure of the Ministry on pages 126 to 131 are presented fairly, in all material respects, in accordance with the requirements of section 45A of the Public Finance Act 1989.
• the schedules of non-departmental activities which are managed by the Ministry on behalf of the Crown on pages 107 to 124 present fairly, in all material respects, in accordance with the Treasury Instructions:
– the assets; liabilities; commitments; and contingent liabilities and assets as at 30 June 2020; and
– expenses; and revenue for the year ended 30 June 2020.
134 ANNUAL REPORT 2019/20
Our audit was completed on 12 November 2020. This is the date at which our opinion is expressed.
The basis for our opinion is explained below, and we draw attention to the impact of COVID-19 on the Ministry. In addition, we outline the responsibilities of the Chief Executive and our responsibilities relating to the information to be audited, we comment on other information, and we explain our independence.
Emphasis of matter – Impact of COVID-19
Without modifying our opinion, we draw your attention to the disclosures about the impact of COVID-19 on the Ministry as set out in notes 1 and 19 to the financial statements, note 9 to the schedules of non-departmental activities, pages 28 to 75 of the performance information and page 14 and 15 of the annual report.
Basis for our opinion
We carried out our audit in accordance with the Auditor-General’s Auditing Standards, which incorporate the Professional and Ethical Standards and the International Standards on Auditing (New Zealand) issued by the New Zealand Auditing and Assurance Standards Board. Our responsibilities under those standards are further described in the Responsibilities of the auditor section of our report.
We have fulfilled our responsibilities in accordance with the Auditor-General’s Auditing Standards.
We believe that the audit evidence we have obtained is sufficient and appropriate to provide a basis for our audit opinion.
Responsibilities of the Chief Executive for the information to be audited
The Chief Executive is responsible on behalf of the Ministry for preparing:
• financial statements that present fairly the Ministry’s financial position, financial performance, and its cash flows, and that comply with generally accepted accounting practice in New Zealand.
• performance information that presents fairly what has been achieved with each appropriation, the expenditure incurred as compared with expenditure expected to be incurred, and that complies with generally accepted accounting practice in New Zealand.
• statements of expenses and capital expenditure of the Ministry that are presented fairly, in accordance with the requirements of the Public Finance Act 1989.
• schedules of non-departmental activities, in accordance with the Treasury Instructions, that present fairly those activities managed by the Ministry on behalf of the Crown.
The Chief Executive is responsible for such internal control as is determined is necessary to enable the preparation of the information to be audited that is free from material misstatement, whether due to fraud or error.
In preparing the information to be audited, the Chief Executive is responsible on behalf of the Ministry for assessing the Ministry’s ability to continue as a going concern. The Chief Executive is also responsible for disclosing, as applicable, matters related to going concern and using the going concern basis of accounting, unless there is an intention to merge or to terminate the activities of the Ministry, or there is no realistic alternative but to do so.
The Chief Executive’s responsibilities arise from the Public Finance Act 1989.
Responsibilities of the auditor for the information to be audited
Our objectives are to obtain reasonable assurance about whether the information we audited, as a whole, is free from material misstatement, whether due to fraud or error, and to issue an auditor’s report that includes our opinion.
Reasonable assurance is a high level of assurance, but is not a guarantee that an audit carried out in accordance with the Auditor-General’s Auditing Standards will always detect a material misstatement when it exists. Misstatements are differences or omissions of amounts or disclosures, and can arise from fraud or error. Misstatements are considered material if, individually or in the aggregate, they could reasonably be expected to influence the decisions of readers, taken on the basis of the information we audited.
For the budget information reported in the information we audited, our procedures were limited to checking that the information agreed to the Ministry’s Statement of Intent 2017-2021, Estimates of Appropriations and as updated in the Supplementary Estimates of Appropriations 2019/20, and the 2019/20 forecast financial figures included in the Ministry’s 2018/19 Annual report.
We did not evaluate the security and controls over the electronic publication of the information we audited.
As part of an audit in accordance with the Auditor-General’s Auditing Standards, we exercise professional judgement and maintain professional scepticism throughout the audit. Also:
• We identify and assess the risks of material misstatement of the information we audited, whether due to fraud or error, design and perform audit procedures responsive to those risks, and obtain audit evidence that is sufficient and appropriate to provide a basis for our opinion. The risk of not detecting a material misstatement resulting from fraud is higher than for one resulting from error, as fraud may involve collusion, forgery, intentional omissions, misrepresentations, or the override of internal control.

135OUR FINANCES
• We obtain an understanding of internal control relevant to the audit in order to design audit procedures that are appropriate in the circumstances, but not for the purpose of expressing an opinion on the effectiveness of the Ministry’s internal control.
• We evaluate the appropriateness of accounting policies used and the reasonableness of accounting estimates and related disclosures made by the Chief Executive.
• We evaluate the appropriateness of the reported performance information within the Ministry’s framework for reporting its performance.
• We conclude on the appropriateness of the use of the going concern basis of accounting by the Chief Executive and, based on the audit evidence obtained, whether a material uncertainty exists related to events or conditions that may cast significant doubt on the Ministry’s ability to continue as a going concern. If we conclude that a material uncertainty exists, we are required to draw attention in our auditor’s report to the related disclosures in the information we audited or, if such disclosures are inadequate, to modify our opinion. Our conclusions are based on the audit evidence obtained up to the date of our auditor’s report. However, future events or conditions may cause the Ministry to cease to continue as a going concern.
• We evaluate the overall presentation, structure and content of the information we audited, including the disclosures, and whether the information we audited represents the underlying transactions and events in a manner that achieves fair presentation.
We communicate with the Chief Executive regarding, among other matters, the planned scope and timing of the audit and significant audit findings, including any significant deficiencies in internal control that we identify during our audit.
Our responsibilities arise from the Public Audit Act 2001.
Other information
The Chief Executive is responsible for the other information. The other information comprises the information included on pages 1 to 136, but does not include the information we audited, and our auditor’s report thereon.
Our opinion on the information we audited does not cover the other information and we do not express any form of audit opinion or assurance conclusion thereon.
Our responsibility is to read the other information. In doing so, we consider whether the other information is materially inconsistent with the information we audited or our knowledge obtained in the audit, or otherwise appears to be materially misstated. If, based on our work, we conclude that there is a material misstatement of this other information, we are required to report that fact. We have nothing to report in this regard.
Independence
We are independent of the Ministry in accordance with the independence requirements of the Auditor-General’s Auditing Standards, which incorporate the independence requirements of Professional and Ethical Standard 1 (Revised): Code of Ethics for Assurance Practitioners issued by the New Zealand Auditing and Assurance Standards Board.
Other than in our capacity as auditor, we have no relationship with, or interests, in the Ministry.
Rehan Badar Audit New Zealand On behalf of the Auditor-General Wellington, New Zealand

HEAD OFFICE Environment House 23 Kate Sheppard Place Wellington New Zealand
POSTAL ADDRESS PO Box 10362 Wellington 6143 New Zealand
TELEPHONE AND EMAIL Freephone: 0800 499 700 Telephone: +64 4 439 7400 Email: [email protected]
WEBSITE www.mfe.govt.nz
AUDITOR Audit New Zealand Wellington New Zealand (on behalf of the Auditor-General)
BANKERS Westpac