annual report - leo pharma considered and adopted the annual report of leo pharma a/s for the...
TRANSCRIPT

Annual Report 2015
LEO Pharma A/S
— we help peopleachieve healthy skin
This Annual Report is an extract of the Company’sstatutory annual report pursuant to Section 149of the Danish Financial Statements Act. The statutoryannual report will be submitted to the DanishBusiness Authority, and a copy may be obtained viathe Authority’s website www.cvr.dk.
Contents Contents
2 LEO PHARMA A NNUA L REPO RT 2 0 1 5 3
MANAGEMENT’S STATEMENT
Management’s Statement . . . . . . . . . . . . . . . . . . . . . . . . . . . . . . . . . . . . . . . . . . . . . . . . . . . . . . . . . . . . . . . . . . . . . . . . . . . . . . . . . . . . . . . . . . . . . . . . . . . . . . . . . . . . . . . . . . . . . . . . . . . . . . . . . . . . . . . . . . . . . . . . . . . . 4
MANAGEMENT’S REVIEW
Company information . . . . . . . . . . . . . . . . . . . . . . . . . . . . . . . . . . . . . . . . . . . . . . . . . . . . . . . . . . . . . . . . . . . . . . . . . . . . . . . . . . . . . . . . . . . . . . . . . . . . . . . . . . . . . . . . . . . . . . . . . . . . . . . . . . . . . . . . . . . . . . . . . . . . . . . . . . . 6 Financial highlights . . . . . . . . . . . . . . . . . . . . . . . . . . . . . . . . . . . . . . . . . . . . . . . . . . . . . . . . . . . . . . . . . . . . . . . . . . . . . . . . . . . . . . . . . . . . . . . . . . . . . . . . . . . . . . . . . . . . . . . . . . . . . . . . . . . . . . . . . . . . . . . . . . . . . . . . . . . . . . . 9 Management’s Review . . . . . . . . . . . . . . . . . . . . . . . . . . . . . . . . . . . . . . . . . . . . . . . . . . . . . . . . . . . . . . . . . . . . . . . . . . . . . . . . . . . . . . . . . . . . . . . . . . . . . . . . . . . . . . . . . . . . . . . . . . . . . . . . . . . . . . . . . . . . . . . . . . . . . . . .10
FINANCIAL STATEMENTS 2015
Consolidated Financial Statements . . . . . . . . . . . . . . . . . . . . . . . . . . . . . . . . . . . . . . . . . . . . . . . . . . . . . . . . . . . . . . . . . . . . . . . . . . . . . . . . . . . . . . . . . . . . . . . . . . . . . . . . . . . . . . . . . . . . . . . . . . . . . . . . . . .27 Parent Company Financial Statements . . . . . . . . . . . . . . . . . . . . . . . . . . . . . . . . . . . . . . . . . . . . . . . . . . . . . . . . . . . . . . . . . . . . . . . . . . . . . . . . . . . . . . . . . . . . . . . . . . . . . . . . . . . . . . . . . . . . . . . . . . . . .53 Independent Auditor’s Report . . . . . . . . . . . . . . . . . . . . . . . . . . . . . . . . . . . . . . . . . . . . . . . . . . . . . . . . . . . . . . . . . . . . . . . . . . . . . . . . . . . . . . . . . . . . . . . . . . . . . . . . . . . . . . . . . . . . . . . . . . . . . . . . . . . . . . . . . . . .70
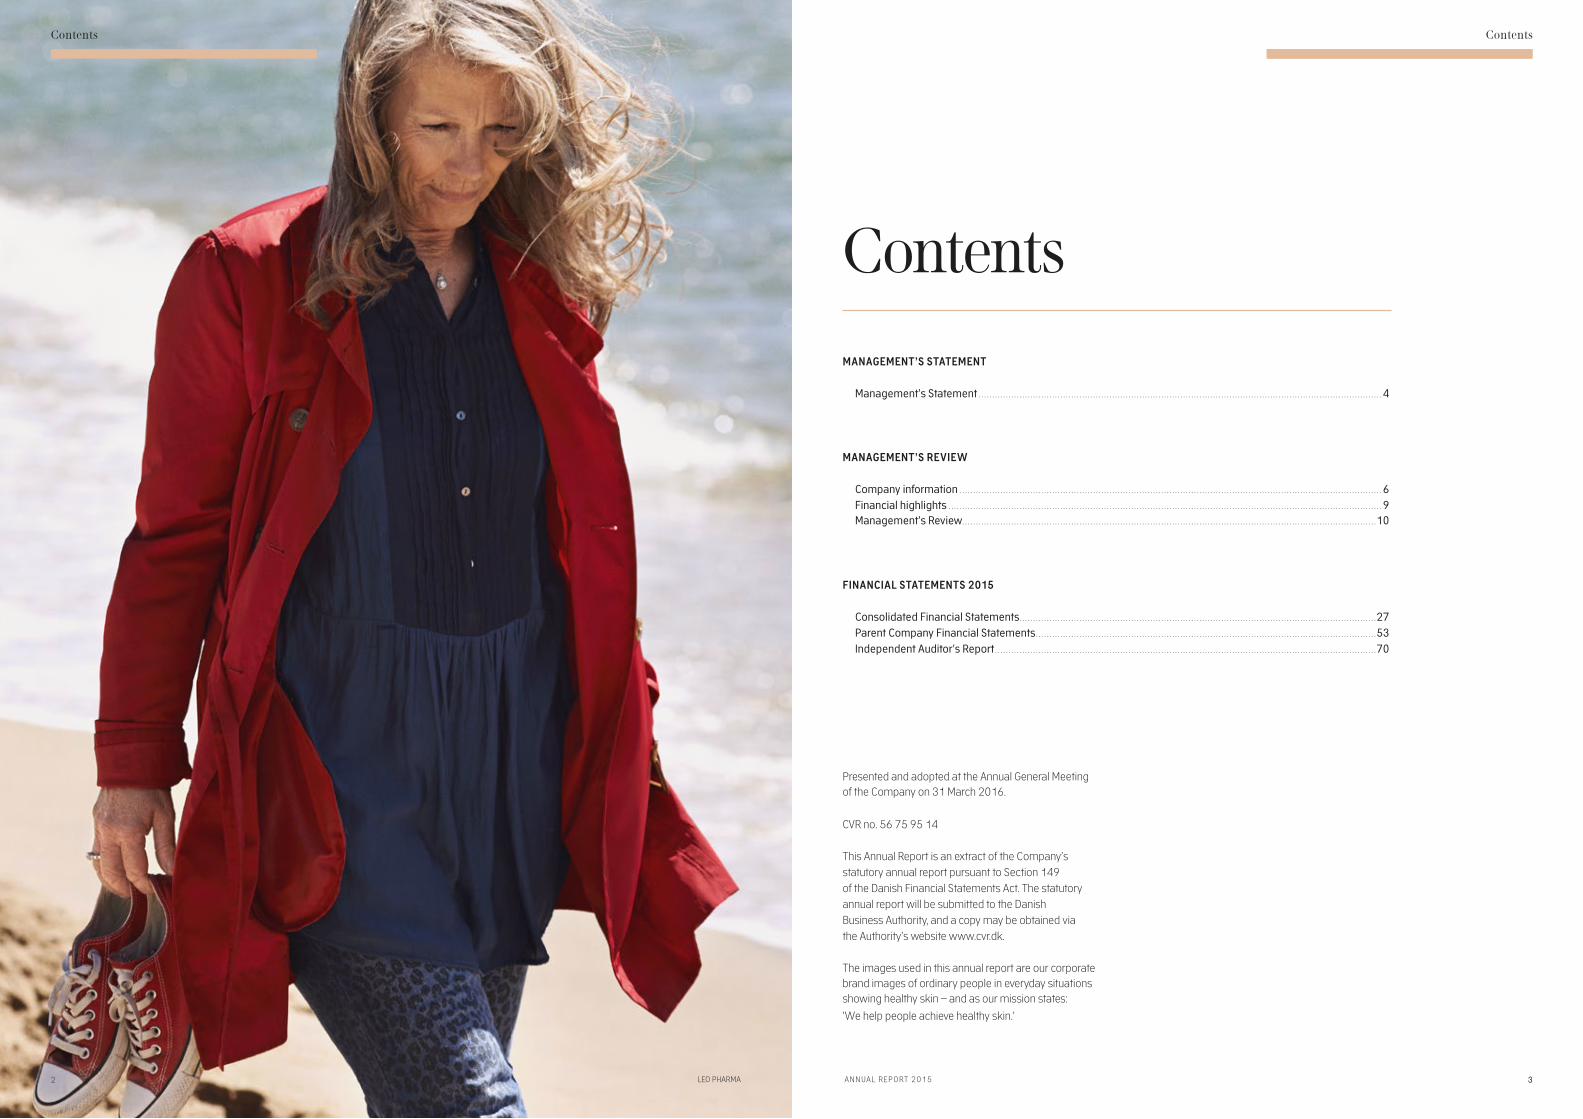
Presented and adopted at the Annual General Meeting of the Company on 31 March 2016.
CVR no. 56 75 95 14
The images used in this annual report are our corporate brand images of ordinary people in everyday situations showing healthy skin – and as our mission states:
'We help people achieve healthy skin.'
3
Contents

Our mission
Our vision
— we help people achieve healthy skin
— we are the preferred dermatology care partner improving people’s lives around the world
Management’s Statement
4 LEO PHARMA
Management’s Statement
A NNUA L REPO RT 2 0 1 5 5
Management’s StatementThe Executive Board and Board of Directors have today considered and adopted the Annual Report of LEO Pharma A/S for the financial year 1 January – 31 December 2015.
The Annual Report has been prepared in accordance with the Danish Financial Statements Act.
In our opinion, the Consolidated Financial Statements and the Financial Statements of the Parent Company give a true and fair view of the financial position at 31 December 2015 of the Group and the Company, and of the results of the Group’s and the Company’s operations and the consolidated cash flows for 2015.
In our opinion, Management’s Review includes a true and fair account of the matters addressed in the Review.
We recommend that the Annual Report be adopted at the Annual General Meeting.
EXECUTIVE BOARD:
Gitte P. Aabo Anders Kronborg President, CEO CFO
BOARD OF DIRECTORS:
Jukka Pertola Patrik O. Dahlén Jens Bo Olesen Chairman Vice Chairman
Peder Holk Nielsen Ingelise Saunders John R. Weeks
Jannie Kogsbøll Karin Attermann Lotte Hjortshøj Larsen
Ballerup, 31 March 2016
Company information
6 LEO PHARMA
Company information
A NNUA L REPO RT 2 0 1 5 7
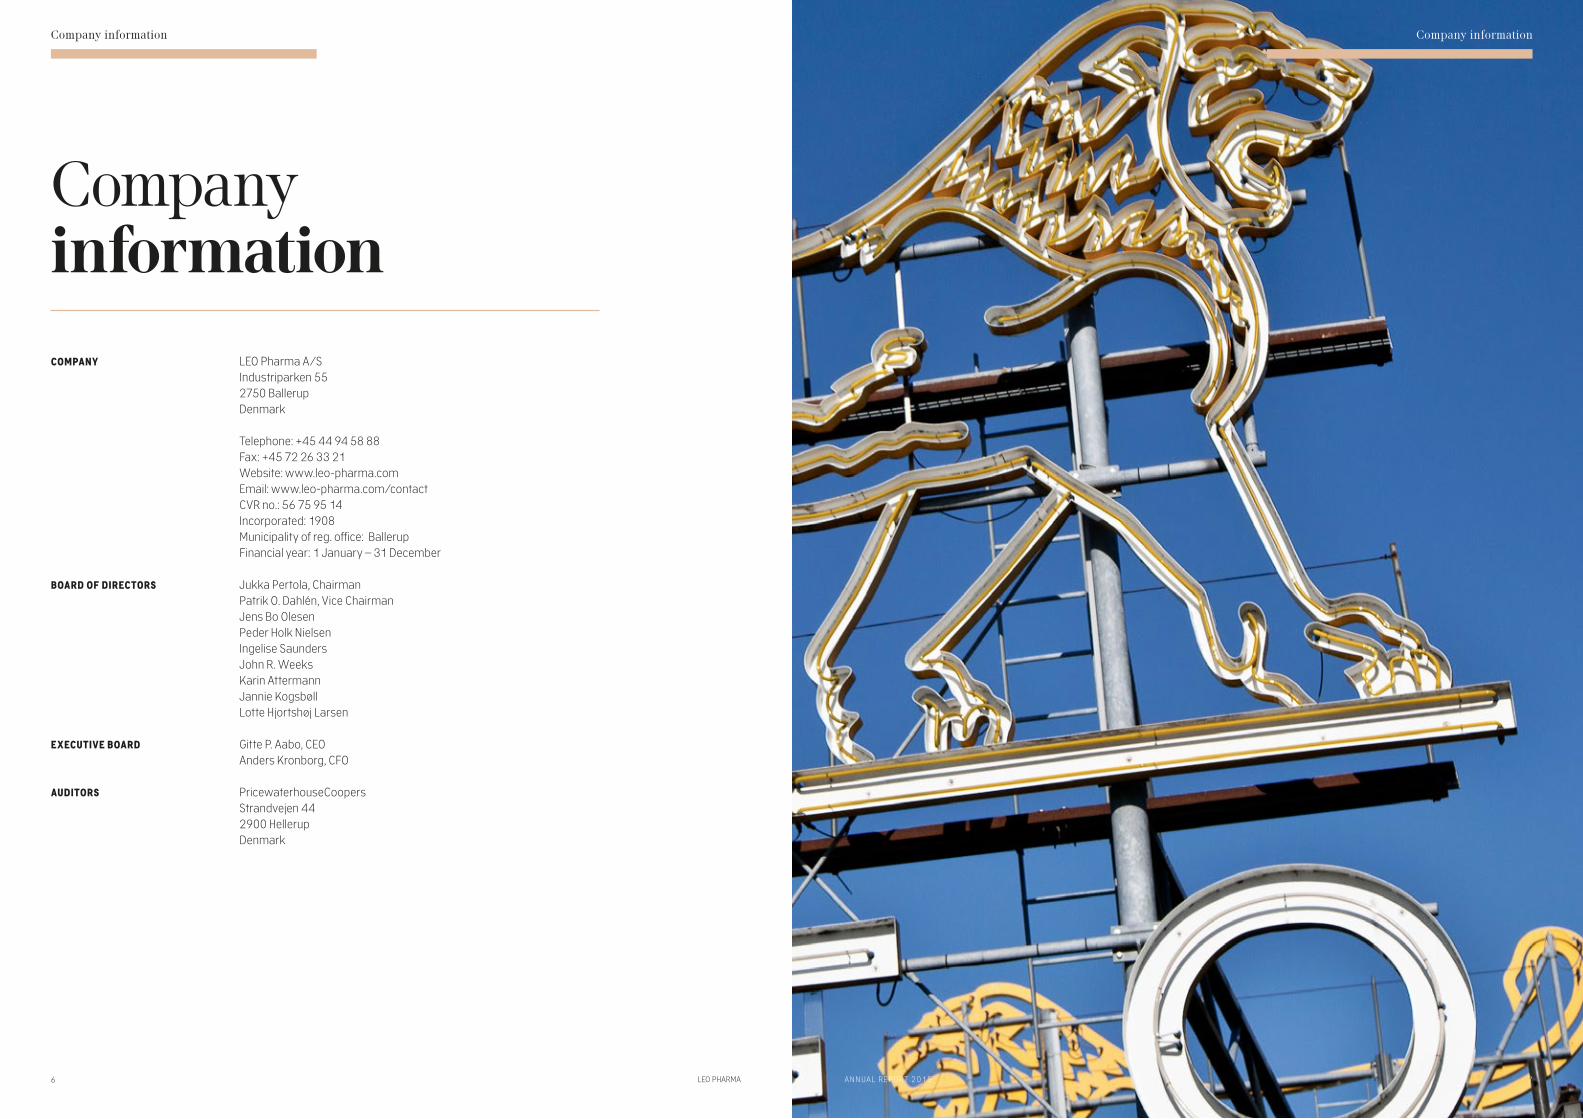
Company informationCOMPANY LEO Pharma A/S Industriparken 55 2750 Ballerup Denmark
Telephone: +45 44 94 58 88 Fax: +45 72 26 33 21 Website: www.leo- pharma.com Email: www.leo-pharma.com/contact CVR no.: 56 75 95 14 Incorporated: 1908 Municipality of reg. office: Ballerup Financial year: 1 January – 31 December
BOARD OF DIRECTORS Jukka Pertola, Chairman Patrik O. Dahlén, Vice Chairman Jens Bo Olesen Peder Holk Nielsen Ingelise Saunders John R. Weeks Karin Attermann Jannie Kogsbøll Lotte Hjortshøj Larsen
EXECUTIVE BOARD Gitte P. Aabo, CEO Anders Kronborg, CFO
AUDITORS PricewaterhouseCoopers Strandvejen 44 2900 Hellerup
Denmark
8 LEO PHARMA A NNUA L REPORT 2015 9
Financial highlightsFinancial highlights
Financial highlights
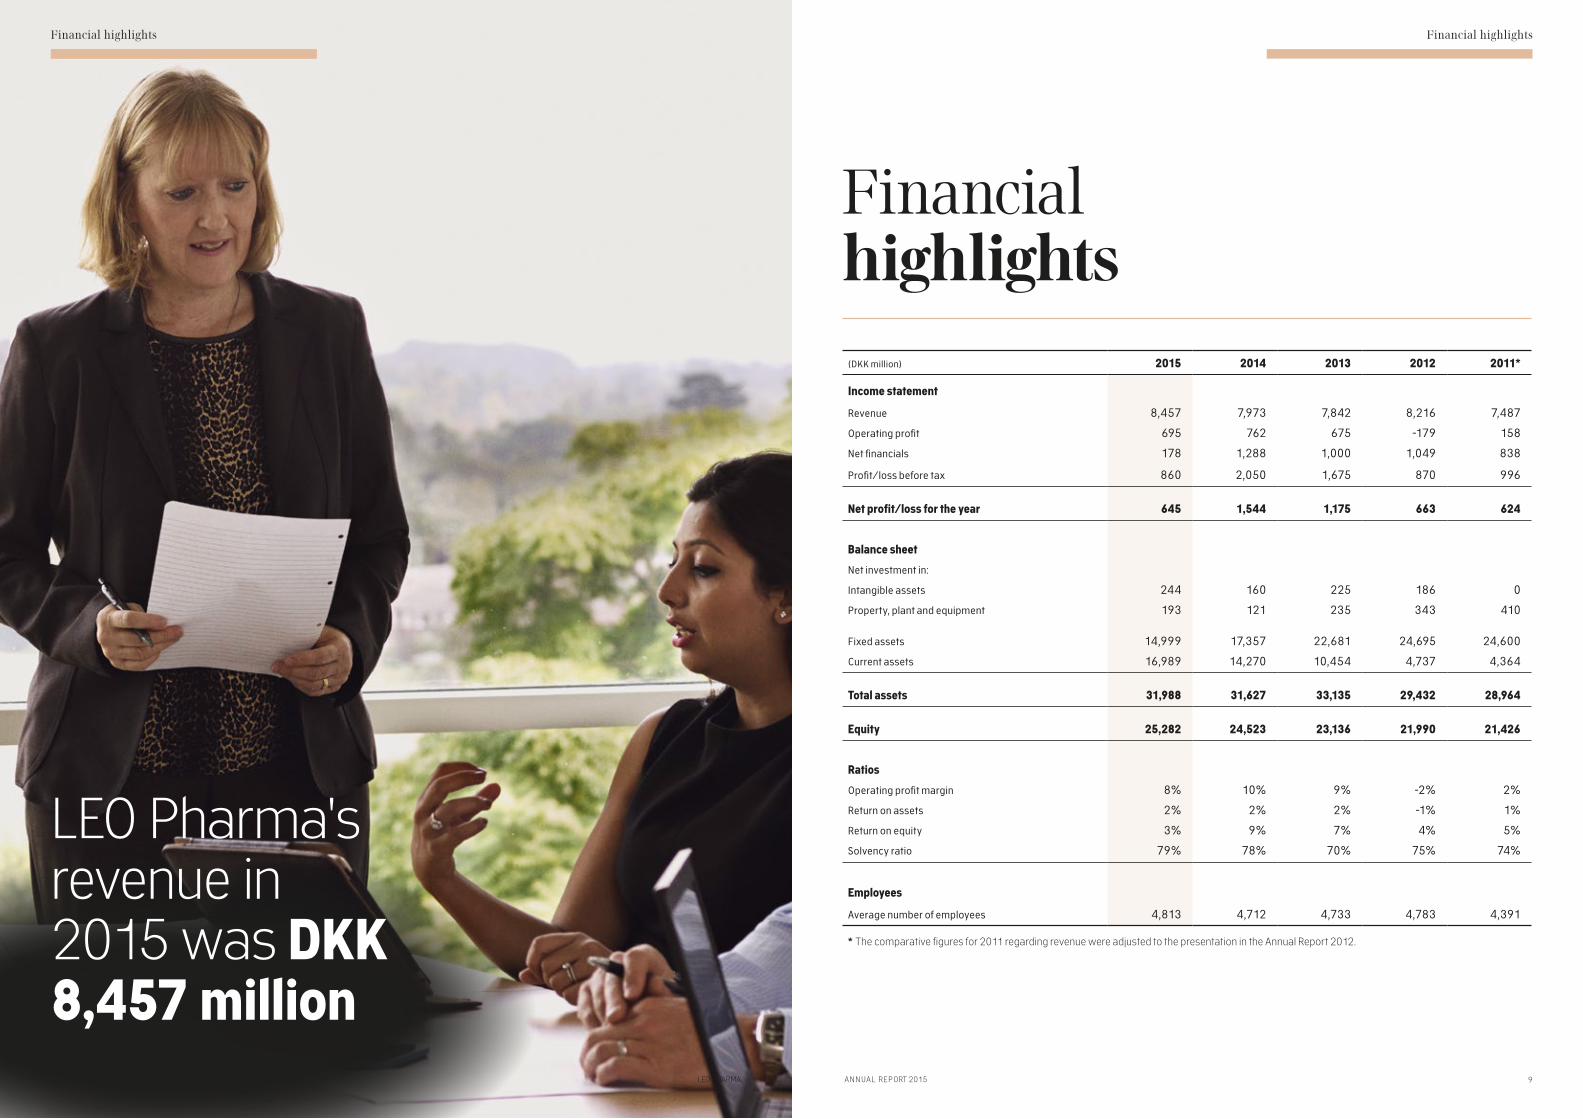
(DKK million) 2015 2014 2013 2012 2011*
Income statement
Revenue 8,457 7,973 7,842 8,216 7,487
Operating profit 695 762 675 -179 158
Net financials 178 1,288 1,000 1,049 838
Profit/loss before tax 860 2,050 1,675 870 996
Net profit/loss for the year 645 1,544 1,175 663 624
Balance sheet
Net investment in:
Intangible assets 244 160 225 186 0
Property, plant and equipment 193 121 235 343 410
Fixed assets 14,999 17,357 22,681 24,695 24,600
Current assets 16,989 14,270 10,454 4,737 4,364
Total assets 31,988 31,627 33,135 29,432 28,964
Equity 25,282 24,523 23,136 21,990 21,426
Ratios
Operating profit margin 8% 10% 9% -2% 2%
Return on assets 2% 2% 2% -1% 1%
Return on equity 3% 9% 7% 4% 5%
Solvency ratio 79% 78% 70% 75% 74%
Employees
Average number of employees 4,813 4,712 4,733 4,783 4,391
* The comparative figures for 2011 regarding revenue were adjusted to the presentation in the Annual Report 2012.
LEO Pharma's revenue in 2015 was DKK 8,457 million

10 LEO PHARMA
Management’s Review
A NNUA L REPORT 2015 11
Management’s Review
10
Dermatology LEO Pharma offers integrated care solutions to people suffering from psoriasis, eczema, actinic keratosis, acne and skin infections. We develop drugs, devices, delivery systems and digital health technologies. We also offer solutions for conditions that require supportive treatment, such as throm-bosis, kidney disease and cancer.
Management’s Review 2015 was the year LEO Pharma embarked on our ‘Helping SARAH – LEO towards 2020’ journey – a new strategy which was launched in December 2014. With the ambitious aspiration to help more than 100 million people in 2020, LEO Pharma has committed itself to looking at new and innovative solutions and keeping engaging in partnerships to reach its goal.
LEO Pharma wants to offer solutions in all aspects of life for people living with skin diseases, to assist them in taking control of their condition and improve their quality of life.
We have set out on a mission to help people achieve healthy skin; in addition to our products, we offer patients a growing list of solutions and services. As part of our 2020 strategy, we have established LEO Innovation Lab, a separate business unit opera- ting independently outside our traditional business.
LEO Innovation Lab works to improve the well-being of people living with psoriasis by developing digital solutions and services.
Generic competition is today a market condition when running a pharmaceutical business with strong products and solutions, and 2015 was no exception. This year we upheld our patents for Daivobet® Ointment in court rulings in the UK and Canada.
The result for 2015 is considered satisfactory.
We aspire to help more than 100 million people in 2020.

12 LEO PHARMA A NNUA L REPORT 2015 13
Management’s ReviewManagement’s Review
LEO Pharma wants to be the preferred dermatology care partner improving people’s lives around the world. To support our strategic journey – ‘Helping SARAH – LEO towards 2020’ – we are changing our mindset and way of working in order to better under-stand patients, markets and the external diversity of the world SARAH, the patient, lives in.
LEO Pharma has already taken the first steps in order to change. With the aim of making employees understand patients better, an internal campaign was launched to teach all LEO people about skin, skin diseases and the people who live with them. Employees’ understanding of patients and the world they live in is the prerequisite for developing new solutions that can make a difference to people in their everyday lives.
One way of helping patients is to make the world aware of the different conditions and remove some of the stigma related to skin diseases. Therefore, LEO Pharma continues to put patients on the agenda at any given opportunity. In June, LEO Pharma was invited to speak about the importance of patient lead-ership at the first ever International Dermatology Patient Organisation Conference (IDPOC) in Vancouver.
In July, LEO Pharma’s efforts to ensure that pso- riasis is acknowledged as a priority disease area for the US FDA’s Patient-Focused Drug Development
LEO Pharma’s transfor-mationUnderstanding SARAH and the world she lives in
Initiative were rewarded. This was the first time that LEO Pharma had commented on an FDA Patient Initiative, enhancing our relationship with both the FDA and patient organisations. Influencing the decision to get psoriasis identified as a priority area by the FDA is a major milestone in our efforts to engage in dialogue with the FDA and further strengthen our relationship with the FDA by demonstrating our focus on people with skin diseases.
On World Psoriasis Day in October, LEO Pharma initiated a global social media event, creating aware-ness and providing facts about the disease by involving employees in the campaign. LEO Pharma also showed its support on World Thrombosis Day in the same month.
Enabling patients and healthcare professionals to make informed decisions about treatment is an important part of helping people control their disease. Since 2014, LEO Pharma has ensured that the latest clinical trial information is available on its corporate website – information that helps advance the scientific understanding of the disease areas covered by the clinical trials sponsored by LEO Pharma. LEO Pharma’s efforts to become more transparent regarding public access to our clinical trial information are increasingly being acknowledged by the public.
2015 was also the year when LEO Pharma launched the Daivobet® gel Applicator. The applicator makes it easier for people to apply Daivobet® gel to difficult- to-reach areas. The applicator is the first of the drug devices LEO Pharma plans to bring to patients, and at the same time, the first solution developed directly based on dialogue with patients.
Enstilar® Foam, another new LEO solution, was approved by the FDA in October 2015 and is ready for launch in the US in 2016. Psoriasis patients suffering from itching may have difficulty falling asleep or be woken up frequently as a result of itching, significantly impacting their quality of life. A study conducted by LEO Pharma, PSO-FAST trial (PSOriasis vulgaris, a Four-week, vehicle-controlled, efficacy And Safety Trial), shows that Enstilar® can provide significant improvements in health-related quality of life by treating the itching and itch-related sleep loss that affect so many patients1,2. While itching as a symptom tends to be neglected in favour of the visible plaques associated with psoriasis, itching can be directly related to decreased quality of life, due to the added stress and embarrassment it causes.
1. Life with psoriasis: Under-
standing the itch. National
Psoriasis Foundation. Ac-
cessed on 15 April 2015.
http://www.psoriasis.org/
life-with-psoriasis/under-
standing-the-itch.
2. Leonardi C, et al. Fixed-
combination calcipotriene
0.005%/ betamethasone
dipropionate 0.064% aero-
sol foam provides rapid itch
relief and improvements
in itch-related sleep loss
in psoriasis patients (PSO-
FAST study).
One way of helping patients is to make the world aware of the different conditions and remove some of the stigma related to skin diseases. There fore, LEO Pharma continues to put patients on the agenda at any given opportunity.

14 LEO PHARMA
Management’s Review
A NNUA L REPORT 2015 15
Management’s Review
In 2015, LEO Pharma continued to invest in strategic partnerships, internal research and development (R&D) and patient-focused initiatives. We entered into several new partnerships that will strengthen our position and commitment to dermatology and, at the same time, represent significant growth opportunities. Our new partners include arGEN-X N.V. and NeoPharm.
Signing the agreement with arGEN-X N.V. gave LEO Pharma exclusive access to an existing arGEN-X antibody currently in preclinical development for inflammation-related skin diseases, and by partner- ing with NeoPharm, LEO Pharma entered the emollients market.
The most recent partnership was the signing of a contract with Astellas Pharma Inc., resulting in the acquisition of a broad portfolio of dermatology solutions. The transaction, which totals EUR 675 million, will be the largest in LEO Pharma’s more than 100-year history in terms of incremental turn- over. The first steps to include the products will be taken as soon as approval has been given by the competition authorities, which is expected in the first quarter of 2016.
LEO Pharma also invested in the privately owned SkinVision B.V., a derma-focused mobile app company based in the Netherlands. The aim is to be at the forefront of digital healthcare trends in order to deliver innovative and value-added services to people living with skin diseases. With this investment, LEO Pharma has become a significant minority owner of SkinVision B.V.
LEO Pharma’s investment in LEO Innovation Lab signals a willingness to do things differently to bring more digital solutions into the portfolio, especially within digital patient solutions, in order to get new holistic solutions to patients faster.
TRANSFORMING THE BUSINESS AND RENEWING GOVERNANCE In addition to the increased focus on patients and the external environment surrounding patients, LEO Pharma is also changing its organisation and the way we work. The changes are being made to bring markets and insights into focus, reduce internal complexity and ensure we run a competitive and sustainable business for many years into the future.
In August, the successors to the retiring Chairman, Poul Rasmussen, were announced, completing a
process that began several years ago in order to strengthen governance at LEO Pharma. Lars Olsen (former Executive Vice President, Global Sales and Marketing, LEO Pharma A/S) has taken over as Chair-man of the LEO Foundation, and Jukka Pertola (for-mer Vice Chairman, Board of Directors, LEO Pharma A/S) has taken over as Chairman of LEO Pharma A/S, both as of 1 January 2016.
In September, LEO Pharma announced a new governance set-up and new leadership teams. Group Management and the Global Management Team were restructured under the names Executive Leadership Team (ELT) and Global Leadership Team (GLT) respectively, with new structures, functions and teams.
The changes brought new profiles to the man- agement teams and will better position LEO Pharma to respond to the needs of patients in their local healthcare contexts, strengthen the strategic direction and enhance the treatment offerings. The changes reflect LEO Pharma’s strengthened focus on managing an increasingly diverse external environ-ment, while reducing internal complexity. LEO Pharma aims to create a simpler, more agile and seamless organisation with greater innovation, empowerment and collaboration at all levels.
As a result, LEO Pharma’s previous six regions were combined into three, and the heads of Region EUROPE+, Region INTERNATIONAL and Region US are now members of ELT. This aims to ensure that decisions more closely reflect the reality of patients and markets.
LEO Pharma’s investment in the LEO Innovation Lab signals a willingness to do things differently to bring more digital solutions into the portfolio ... in order to get new holistic solutions to patients faster
We enteredinto several new partner-ships that will strengthenour position and commit-ment to dermatology.
16 LEO PHARMA A NNUA L REPORT 2015 17
Management’s ReviewManagement’s Review
Basis for future earnings Research and development The cost of research and development in 2015 was DKK 1,184 million (2014: DKK 1,193 million), which is in line with 2014 and constitutes 14% of total revenue.
Dermatology PSORIASISIn 2015, LEO Pharma launched the Daivobet® gel Applicator in 12 markets in Europe. The Daivobet® gel Applicator marks the first treatment developed together with psoriasis patients, aiming to improve real-life effectiveness by providing better application control. The Taclonex® Topical Suspension Applicator (US brand for Daivobet® gel Applicator) was approved by the FDA and will be launched in the US in 2016.
Enstilar®, a novel foam treatment, was submitted to both the FDA and the EMA. Approved by the FDA in 2015, the solution will be launched in the US in 2016. Additional approvals, including EMA approval, and launches are expected in 2016. In the clinical development programme, Enstilar® demonstrated statistically significantly superior efficacy to both Daivobet® Ointment and gel, which is due to the foam formulation being easier to apply to larger skin areas.
Daivobet® gel is planned to enter phase III in Japan in early 2016, to follow the successful launch of Daivobet® Ointment, which became the market leader in the Japanese topical psoriasis market in less than a year after its July 2014 launch.
THROMBOSISIn 2015, LEO Pharma submitted the label extension for the treatment of cancer-associated venous thrombotic events based on data from the CATCH study. CATCH is the largest study in the world to investigate the efficacy of a low-molecular-weight
heparin (innohep®) in the treatment of deep venous thrombosis and pulmonary emboli in cancer patients. The CATCH study was published in JAMA on 18 August 2015.
ACNEIn 2015, LEO Pharma obtained the CE mark and launched Kleresca® in the first clinic in the UK. Kleresca® is a novel biophotonic treatment for acne. It marks LEO Pharma’s first offering of a medical device therapy as a result of the joint venture agreement signed in 2014 between LEO Pharma and Canada-based KLOX Technologies Inc. Expansion into further clinics and markets is planned in 2016.
ECZEMAThe JAK (Janus Kinase) inhibitor licensed from Japan Tobacco is progressing to phase II in early 2016 for four different indications.
A new topical eczema solution based on a new chemical entity developed by LEO Pharma progressed to phase II, with the efficacy readout expected in early 2016. This novel treatment aims to deliver a non- steroidal treatment for sensitive skin, including treatment for children suffering from atopic dermatitis, and has the potential to become the first in a class of new treatments.
ACTINIC KERATOSIS During 2015, Picato® was approved and launched in several new markets across the world to help many more people living with actinic keratosis. The Picato® EU Summary of Product Characteristics has success-fully been updated with repeat treatment and inclusion of data on the sequential use of Picato® following cryo therapy. In the US, the FDA also updated the Picato® label to reflect the good results of repeated treatment with Picato®.
A novel ingenol derivative aiming at offering a flexible, patient-friendly solution for field treatment
of actinic keratosis on the face, scalp and chest in areas up to 250 cm2 delivered strong efficacy data from the phase II programme in the third quarter of 2015. The phase III programme was initiated in November 2015.
The benefits of the novel ingenol-derived compounds are being explored in new indications, including non-melanoma skin cancer, genital warts and acne.
HUMAN CAPITAL LEO Pharma’s employees are the Company’s greatest asset. Thanks to our global team of people from differ-
ent cultures and backgrounds, LEO Pharma is a work-place where innovation thrives and people grow.
In September, LEO Pharma’s latest global engage-ment survey, LEO Voice, was conducted, obtaining an impressive response rate of 90.3%. Ten out of the 17 categories scored higher than and the rest on par with the 2013 survey. As many as 16 out of the 17 catego-ries were higher than or on par with global pharma industry norms. In 2016, the global organisation will work on both global initiatives and local actions.
LEO Pharma’s latest global engagementsurvey, LEO Voice, was conducted, obtaining animpressive response rate of 90.3%

18 LEO PHARMA A NNUA L REPORT 2015 19
Management’s ReviewManagement’s Review
Region EUROPE+
Region INTERNATIONAL
Region US
70%
20%
10%
REVENUELEO Pharma’s revenue in 2015 amounted to DKK 8,457 million – an increase of DKK 484 million or 6% compared to 2014 and 0.5% in local currencies.
LEO Pharma launched the Daivobet® gel Applicator in a number of European markets in 2015, whereas generic competition for Kaleorid® and Centyl® in the Nordic markets impacted revenue negatively. The development compared to 2014 was negatively impacted by the full-year effect of the loss of exclusivity on Taclonex® Ointment in the US in the second quarter of 2014.
Revenue in the US accounted for 10% of LEO Pharma’s total revenue, which is on par with 2014. US revenue decreased by 3% in local currency compared to 2014 due to the full-year impact of loss of exclusivity.
The increase in revenue is related to the full-year effect of the continued launches of Picato® and the increased use of innohep® in cancer-associated thrombosis.
OPERATING EXPENSESTotal operating expenses in 2015 amounted to DKK 5,607 million (2014: DKK 5,166 million). This represents an increase in operating expenses of DKK 441 million in 2015 compared to 2014. This is mainly due to an increase in sales and distribution costs as well as in administrative costs.
Sales and distribution costs increased by DKK 254 million from DKK 3,183 million in 2014 to DKK 3,437 million in 2015. The increase is mainly due to staff expenses, new launches and digital communication.
Administrative costs increased by DKK 206 million from DKK 796 million in 2014 to DKK 1,002 million in 2015. The increase is mainly due to staff expenses and additional use of consultants related to strategic projects.
LEO Pharma focuses continuously on operational ex-cellence and efficient business processes, enabling the Company to invest its resources where they matter most: helping SARAH.
The new global ERP business platform, GLOBE, is still being rolled out at LEO Pharma, with the production sites next in line and the rest of the LEO affiliates being enrolled in smaller groups subsequently.
Depreciation, amortisation and impairment losses decreased to DKK 446 million from DKK 581 million in 2014. Amortisation and impairment losses of intangible assets amounted to DKK 185 million (2014: DKK 295 million), which includes an impairment loss of DKK 14 million (2014: DKK 107 million) relating to development projects and intellectual property rights.
At year-end, LEO Pharma had 4,959 employees (2014: 4,679), of whom 1,731 were employed in Denmark (2014: 1,567). The average number of employees increased by 101 employees compared to 2014.
Revenue by patient solutions
The LEO world
Revenue by region
Actinic keratosis
Eczema/skin infection
Psoriasis
Thrombosis
Other
5%
16%
41%
28%
10%
Region EUROPE+
Region INTERNATIONAL
Region US
Countries where our solutions are not available
Region EUROPE+
Region INTERNATIONAL
Region US
70%
20%
10%
Actinic keratosis
Eczema/skin infection
Psoriasis
Thrombosis
Other
5%
16%
41%
28%
10%
Financial results for 2015
20 LEO PHARMA
Management’s Review
A NNUA L REPORT 2015 21
Management’s Review
OPERATING PROFIT Operating profit decreased by DKK 67 million to DKK 695 million from DKK 762 million in 2014. Operating profit is in line with expectations for 2015.
NET FINANCIAL INCOME In 2015, net financial income decreased by DKK 1,110 million to DKK 178 million. DKK 362 million of the decrease was due to the reduced performance of the Low Volatility Stocks, Covered Bonds and Investment-Grade Corporate Bonds. The interest income and capital gains on Danish mortgage bonds were DKK 289 million (2014: DKK 817 million). The net financial result was also negatively impacted by DKK 223 million as a result of complying with the hedging policy valid until November 2015, as this policy resulted in a 12-month average hedged period. The negative result primarily arose from the hedging of USD, GBP, CAD and SAR.
The market value of LEO Pharma’s bond holdings amounted to DKK 11,576 million as at 31 December 2015 (2014: DKK 14,346 million). The decrease is due to drawn bonds that have been reinvested in the asset classes mentioned below. LEO Pharma’s Low
Volatility Stocks, Covered Bonds and Investment- Grade Corporate Bonds had a market value of DKK 11,462 million by the end of 2015 (2014: DKK 8,442 million).
SATISFACTORY EARNINGSLEO Pharma generated a net profit of DKK 645 million in 2015 compared to DKK 1,544 million in 2014. The effective tax rate for LEO Pharma was 25% (2014: 25%), which is in line with expectations.
Net investments in intangible assets amounted to DKK 244 million in 2015 (2014: DKK 160 million) and concerned the investments in arGEN-X as well as continued investment in a SAP-based ERP system being rolled out globally.
In 2015, LEO Pharma invested (net) DKK 193 million (2014: DKK 121 million) in property, plant and equipment. These investments mainly concerned the expansion and optimisation of production facilities to ensure capacity for future growth in volumes of LEO Pharma’s solutions and the preparations for the launch of new patient solutions in 2016.
Operating activities generated a positive cash flow of DKK 770 million (2014: DKK 1,041 million). LEO Pharma achieved a 3% return on equity (2014: 9%) and equity of DKK 25,282 million at the end of the year (2014: DKK 24,523 million). Based on these results, LEO Pharma entered 2016 with a solvency ratio of 79% (2014: 78%).
LEO Pharma’s revenue in 2015 increased by 6% compared to 2014.
22 LEO PHARMA A NNUA L REPORT 2015 23
Management’s ReviewManagement’s Review
Special business and financial risksOPERATING RISKSLEO Pharma continually works to ensure a reasonable balance between risk exposure and value creation. Therefore, LEO Pharma regularly enters into long-term agreements for the supply of raw materials and other critical input for the Group’s production.
MARKET RISKS LEO Pharma makes considerable efforts to protect its intellectual property rights at all times, both for new and existing products, and to ensure that we conduct our business without infringing the rights of others.
FOREIGN EXCHANGE RISKS The greatest foreign exchange risk is associated with the following currencies: USD, GBP, CAD, AUD, SAR, CNY, NOK and SEK. These currencies together accounted for 77% of LEO Pharma’s foreign exchange position in 2015.
New hedging principles were initiated in December 2015. This means that hedging will no longer be done based on forecast cash flow from operations but will be done based on the expected cash flows from realised transactions. The Group's hedging is centralised at Parent Company level. LEO Pharma does not hedge net investments in foreign affiliates.
LIQUIDITY RISKS At LEO Pharma, we have a unique opportunity to put patients first thanks to our foundation owner-ship. Because LEO Pharma is 100% owned by the LEO Foundation, we are first and foremost accountable to patients, and all profits are reinvested in LEO Pharma
and grants to international dermatological research projects and activities from the LEO Foundation.
LEO Pharma has a high solvency ratio and thus encounters no significant liquidity risks.
INTEREST RATE RISKS Interest rate risks occur in connection with our investments in various asset classes. LEO Pharma invests in Low Volatility Stocks, Investment-Grade Corporate Bonds and Covered Bonds, all with high ratings.
The interest rate risk on our held-to-maturity portfolio of Danish mortgage bonds is partly offset by the interest rate risk of our debt portfolio. Interest rate swaps are used to hedge the interest rate for each loan in our debt portfolio.
CREDIT RISKS LEO Pharma’s credit risk consists of two components.
The first component is the risk related to payment terms for LEO Pharma’s customers. In 2014, LEO Pharma tightened its global credit policy, and combined with increased focus on credit policy, this means that the Company is in a good position to avoid future losses on bad debts.
The second component is the counterparty risk related to LEO Pharma’s banking partners. The counterparty risk is estimated to be low due to the high ratings of the partners.
There are not considered to be any material risks relating to individual customers or business partners.

Our ambition is to help as many people suffering from skin diseases as possible. — LEO Pharma
24 LEO PHARMA
Management’s Review
A NNUA L REPORT 2015 25
Management’s Review
Expectations for 2016In 2016, LEO Pharma expects single-digit organic revenue growth, driven by the launch of Enstilar® in the US and the full-year impact of the launch of the Daivobet® gel Applicator in Europe. The acquisition of the dermatology portfolio from Astellas Pharma Inc. will have a positive impact on the top line; however, the transaction awaits final approval from the competition authorities. Pre-tax profit is expected to increase. The Company’s result will be challenged by continued pressure for price reductions and the potential loss of exclusivity for Daivobet® Ointment in Europe.
In 2016, LEO Pharma plans to continue the search for business development opportunities in line with the Company’s mission.
Our ambition is to help as many people suffering from skin diseases as possible. LEO Pharma will continue its focus on aligning and developing its organisational structure to meet the challenges facing the industry and reduce internal complexity.
ELEMENTS OF UNCERTAINTY LEO Pharma will continue its focus on proactively aligning and developing its organisation to address changes in the market place and ensure that its resources are invested where they matter the most: helping SARAH.
OWNERSHIP STRUCTURE LEO Pharma is a wholly owned subsidiary of the LEO Foundation, Industriparken 55, 2750 Ballerup, Denmark.
EVENTS AFTER THE BALANCE SHEET DATE No events have occurred in the period from the bal-ance sheet date until the presentation of the financial statements that materially affect the assessment of the Annual Report.
Remuneration Committee The Company has appointed a Remuneration Committee. The members of the Committee are:
Jukka Pertola, ChairmanJohn R. Weeks
The Committee’s task is to establish the terms and conditions of employment for the Company’s top management.
Corporate social responsibility LEO Pharma A/S's compliance with Sections 99a and 99b of the Danish Financial State- ments Act is reported in a separate Corporate Social Responsibility (CSR) report available at www.leo-pharma.com/csr-report-2015
In 2016, LEO Pharma plans to continue the search for business development opportunities in line with the Company’s mission.

Consolidated Financial Statements
26 LEO PHARMA
Consolidated Financial Statements
27A NNUA L REPORT 2015
FINANCIAL STATEMENTS
Income statement . . . . . . . . . . . . . . . . . . . . . . . . . . . . . . . . . . . . . . . . . . . . . . . . . . . . . . . . . . . . . . . . . . . . . . . . . . . . . . . . . . . . . . . . . . . . . 29 Balance sheet at 31 December . . . . . . . . . . . . . . . . . . . . . . . . . . . . . . . . . . . . . . . . . . . . . . . . . . . . . . . . . . . . . . . . . . . . . . . . . . . . . . . . 30 Cash flow statement . . . . . . . . . . . . . . . . . . . . . . . . . . . . . . . . . . . . . . . . . . . . . . . . . . . . . . . . . . . . . . . . . . . . . . . . . . . . . . . . . . . . . . . . . . . 32 Consolidated statement of equity . . . . . . . . . . . . . . . . . . . . . . . . . . . . . . . . . . . . . . . . . . . . . . . . . . . . . . . . . . . . . . . . . . . . . . . . . . . . . . 33
NOTES
Note 1 – Revenue . . . . . . . . . . . . . . . . . . . . . . . . . . . . . . . . . . . . . . . . . . . . . . . . . . . . . . . . . . . . . . . . . . . . . . . . . . . . . . . . . . . . . . . . . . . . . . 36 Note 2 – Other external expenses . . . . . . . . . . . . . . . . . . . . . . . . . . . . . . . . . . . . . . . . . . . . . . . . . . . . . . . . . . . . . . . . . . . . . . . . . . . . . . 36 Note 3 – Staff expenses . . . . . . . . . . . . . . . . . . . . . . . . . . . . . . . . . . . . . . . . . . . . . . . . . . . . . . . . . . . . . . . . . . . . . . . . . . . . . . . . . . . . . . . . 37 Note 4 – Amortisation, depreciation and impairment losses . . . . . . . . . . . . . . . . . . . . . . . . . . . . . . . . . . . . . . . . . . . . . . . . . . . . 37 Note 5 – Financial income . . . . . . . . . . . . . . . . . . . . . . . . . . . . . . . . . . . . . . . . . . . . . . . . . . . . . . . . . . . . . . . . . . . . . . . . . . . . . . . . . . . . . . 38 Note 6 – Financial expenses . . . . . . . . . . . . . . . . . . . . . . . . . . . . . . . . . . . . . . . . . . . . . . . . . . . . . . . . . . . . . . . . . . . . . . . . . . . . . . . . . . . 38 Note 7 – Tax on profit for the year . . . . . . . . . . . . . . . . . . . . . . . . . . . . . . . . . . . . . . . . . . . . . . . . . . . . . . . . . . . . . . . . . . . . . . . . . . . . . . 38 Note 8 – Intangible assets . . . . . . . . . . . . . . . . . . . . . . . . . . . . . . . . . . . . . . . . . . . . . . . . . . . . . . . . . . . . . . . . . . . . . . . . . . . . . . . . . . . . . 39 Note 9 – Property, plant and equipment . . . . . . . . . . . . . . . . . . . . . . . . . . . . . . . . . . . . . . . . . . . . . . . . . . . . . . . . . . . . . . . . . . . . . . . . 40 Note 10 – Other securities . . . . . . . . . . . . . . . . . . . . . . . . . . . . . . . . . . . . . . . . . . . . . . . . . . . . . . . . . . . . . . . . . . . . . . . . . . . . . . . . . . . . . 41 Note 11 – Share capital . . . . . . . . . . . . . . . . . . . . . . . . . . . . . . . . . . . . . . . . . . . . . . . . . . . . . . . . . . . . . . . . . . . . . . . . . . . . . . . . . . . . . . . . 41 Note 12 – Deferred tax . . . . . . . . . . . . . . . . . . . . . . . . . . . . . . . . . . . . . . . . . . . . . . . . . . . . . . . . . . . . . . . . . . . . . . . . . . . . . . . . . . . . . . . . . 41 Note 13 – Pension assets and pension obligations . . . . . . . . . . . . . . . . . . . . . . . . . . . . . . . . . . . . . . . . . . . . . . . . . . . . . . . . . . . . 42 Note 14 – Other provisions . . . . . . . . . . . . . . . . . . . . . . . . . . . . . . . . . . . . . . . . . . . . . . . . . . . . . . . . . . . . . . . . . . . . . . . . . . . . . . . . . . . . . 42 Note 15 – Other adjustments . . . . . . . . . . . . . . . . . . . . . . . . . . . . . . . . . . . . . . . . . . . . . . . . . . . . . . . . . . . . . . . . . . . . . . . . . . . . . . . . . . 42 Note 16 – Contingencies . . . . . . . . . . . . . . . . . . . . . . . . . . . . . . . . . . . . . . . . . . . . . . . . . . . . . . . . . . . . . . . . . . . . . . . . . . . . . . . . . . . . . . . 43 Note 17 – Financial instruments . . . . . . . . . . . . . . . . . . . . . . . . . . . . . . . . . . . . . . . . . . . . . . . . . . . . . . . . . . . . . . . . . . . . . . . . . . . . . . . 43 Note 18 – Related parties . . . . . . . . . . . . . . . . . . . . . . . . . . . . . . . . . . . . . . . . . . . . . . . . . . . . . . . . . . . . . . . . . . . . . . . . . . . . . . . . . . . . . . 43 Note 19 – Companies in the LEO Pharma Group . . . . . . . . . . . . . . . . . . . . . . . . . . . . . . . . . . . . . . . . . . . . . . . . . . . . . . . . . . . . . . . . 44 Note 20 – Accounting policies . . . . . . . . . . . . . . . . . . . . . . . . . . . . . . . . . . . . . . . . . . . . . . . . . . . . . . . . . . . . . . . . . . . . . . . . . . . . . . . . . . 46
Consolidated Financial Statements Group
Consolidated Financial Statements
29A NNUA L REPORT 2015
Consolidated Financial Statements
28 LEO PHARMA
(DKK million) Note 2015 2014
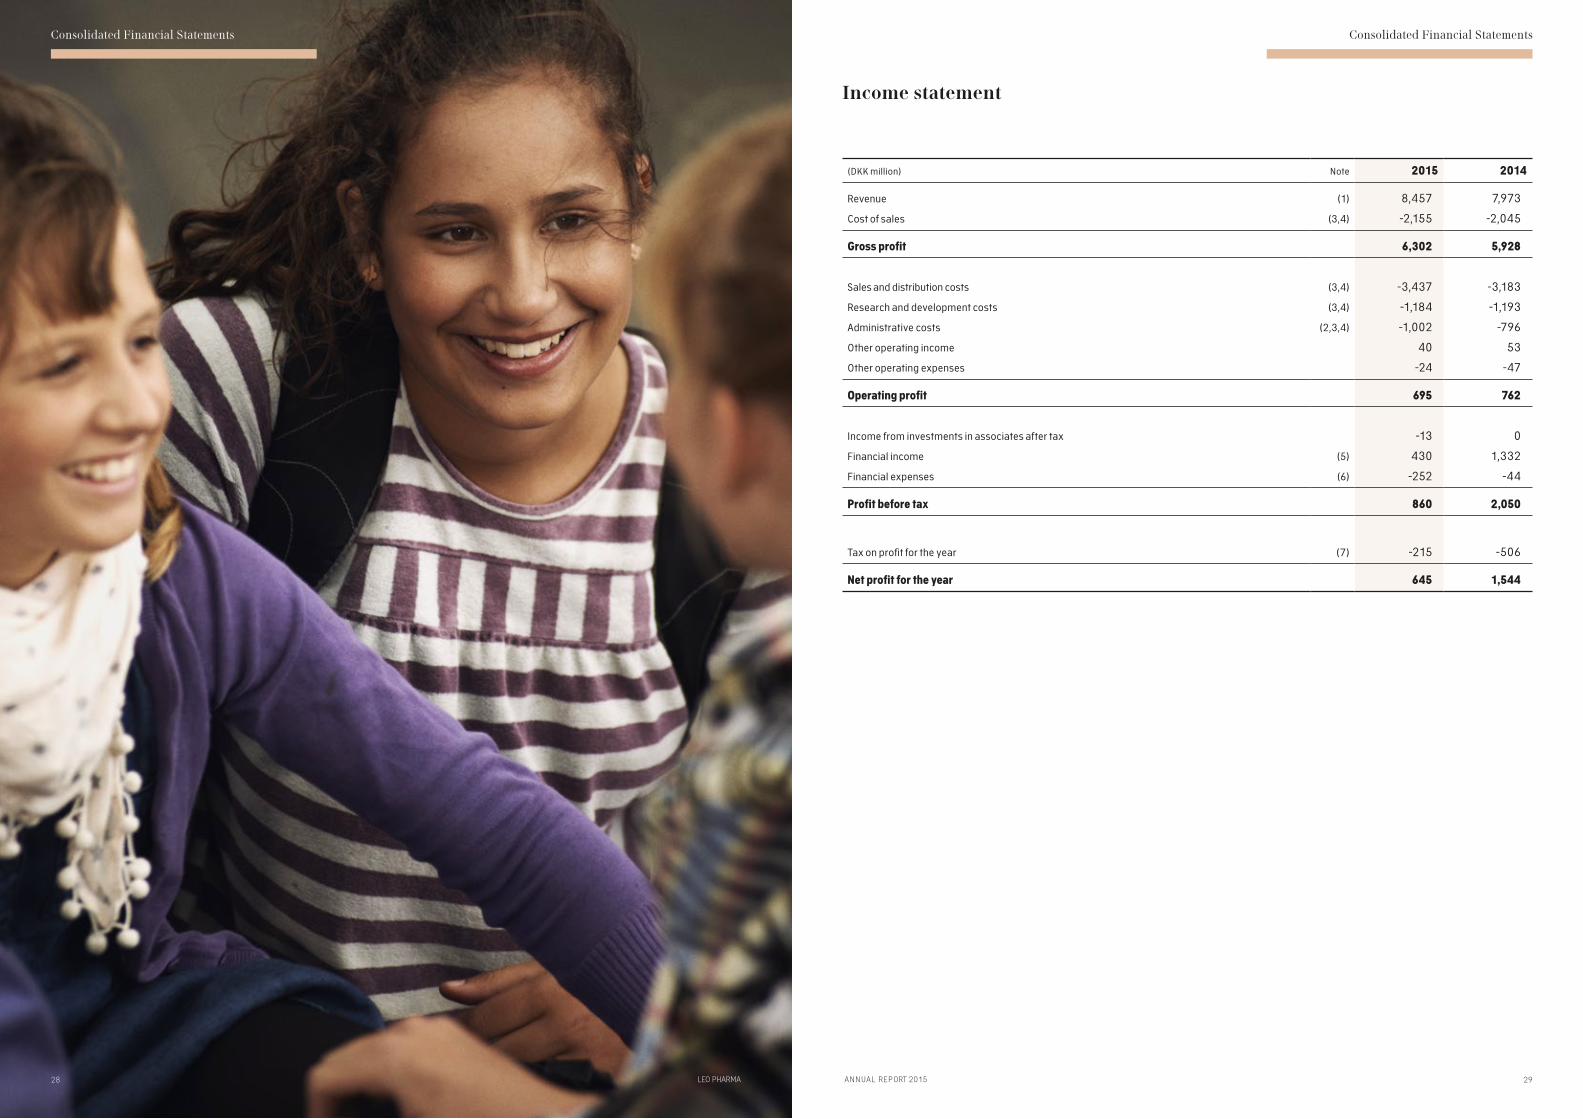
Revenue (1) 8,457 7,973
Cost of sales (3,4) -2,155 -2,045
Gross profit 6,302 5,928
Sales and distribution costs (3,4) -3,437 -3,183
Research and development costs (3,4) -1,184 -1,193
Administrative costs (2,3,4) -1,002 -796
Other operating income 40 53
Other operating expenses -24 -47
Operating profit 695 762
Income from investments in associates after tax -13 0
Financial income (5) 430 1,332
Financial expenses (6) -252 -44
Profit before tax 860 2,050
Tax on profit for the year (7) -215 -506
Net profit for the year 645 1,544
Income statement
Consolidated Financial Statements Consolidated Financial Statements
30 31LEO PHARMA A NNUA L REPORT 2015
Balance sheet at 31 December
ASSETS
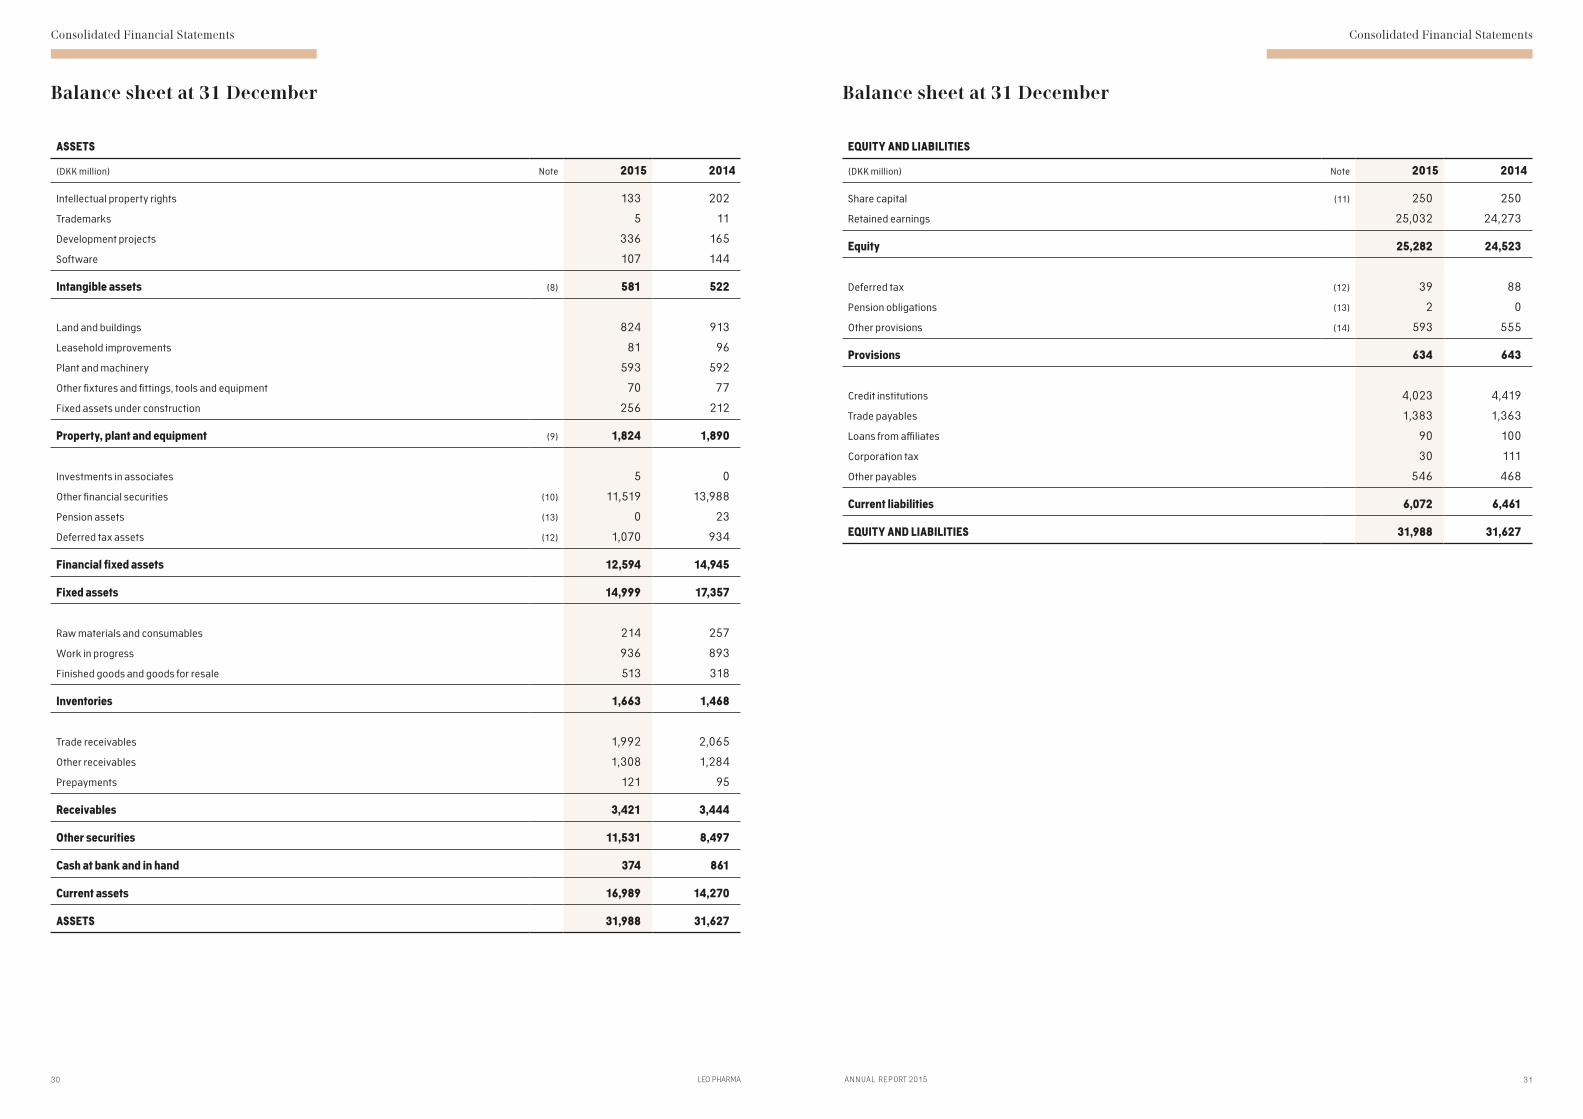
(DKK million) Note 2015 2014
Intellectual property rights 133 202
Trademarks 5 11
Development projects 336 165
Software 107 144
Intangible assets (8) 581 522
Land and buildings 824 913
Leasehold improvements 81 96
Plant and machinery 593 592
Other fixtures and fittings, tools and equipment 70 77
Fixed assets under construction 256 212
Property, plant and equipment (9) 1,824 1,890
Investments in associates 5 0
Other financial securities (10) 11,519 13,988
Pension assets (13) 0 23
Deferred tax assets (12) 1,070 934
Financial fixed assets 12,594 14,945
Fixed assets 14,999 17,357
Raw materials and consumables 214 257
Work in progress 936 893
Finished goods and goods for resale 513 318
Inventories 1,663 1,468
Trade receivables 1,992 2,065
Other receivables 1,308 1,284
Prepayments 121 95
Receivables 3,421 3,444
Other securities 11,531 8,497
Cash at bank and in hand 374 861
Current assets 16,989 14,270
ASSETS 31,988 31,627
EQUITY AND LIABILITIES
(DKK million) Note 2015 2014
Share capital (11) 250 250
Retained earnings 25,032 24,273
Equity 25,282 24,523
Deferred tax (12) 39 88
Pension obligations (13) 2 0
Other provisions (14) 593 555
Provisions 634 643
Credit institutions 4,023 4,419
Trade payables 1,383 1,363
Loans from affiliates 90 100
Corporation tax 30 111
Other payables 546 468
Current liabilities 6,072 6,461
EQUITY AND LIABILITIES 31,988 31,627
Balance sheet at 31 December

Consolidated Financial Statements Consolidated Financial Statements
32 33LEO PHARMA A NNUA L REPORT 2015
(DKK million) Note 2015 2014
Profit before tax 860 2,050
Adjustments:
Depreciation, amortisation and impairment losses 446 581
Unrealised exchange rate adjustment 100 46
Value adjustment, securities -133 -695
Corporation tax paid -538 -747
Pension obligations 23 -27
Other provisions -15 -66
Other adjustments (15) 202 -115
Change in working capital:
Change in inventories and receivables -458 -202
Change in trade payables and other payables 283 216
CASH FLOWS FROM OPERATING ACTIVITIES 770 1,041
Investments in intangible assets, net -241 -214
Investments in property, plant and equipment, net -181 -99
Other securities -438 3,040
Acquisition of companies -19 0
CASH FLOWS FROM OPERATING ACTIVITIES -879 2,727
Change in bank debt -378 -3,386
CASH FLOWS FROM FINANCING ACTIVITIES -378 -3,386
CHANGE IN CASH AND CASH EQUIVALENTS -487 382
Cash and cash equivalents at 1 January 861 479
Cash and cash equivalents at 31 December 374 861
The figures in the cash flow statement cannot be directly derived from the figures in the Consolidated Financial Statements .
Cash flow statement
32
Consolidated statement of equity
(DKK million) Share capitalRetained earnings Total
Equity at 1 January 2015 250 24,273 24,523
Net profit for the year 0 645 645
Adjustment of financial instruments 0 85 85
Exchange rate adjustment 0 49 49
Tax on changes in equity 0 -20 -20
Equity at 31 December 2015 250 25,032 25,282
Equity at 1 January 2014 250 22,886 23,136
Net profit for the year 0 1,544 1,544
Adjustment of financial instruments 0 -167 -167
Exchange rate adjustment 0 23 23
Tax on changes in equity 0 -7 -7
Other movements 0 -6 -6
Equity at 31 December 2014 250 24,273 24,523

Notes – Group Notes – Group
34 35LEO PHARMA A NNUA L REPORT 2015
Notes Group

Notes – Group Notes – Group
36 37LEO PHARMA A NNUA L REPORT 2015
NOTE 1 – REVENUE
(DKK million) 2015 2014
Geographical segments
Sales in Denmark 215 271
Sales outside Denmark 8,242 7,702
Total 8,457 7,973
Segmentation – business areas
Healthcare 8,457 7,973
Total 8,457 7,973
NOTE 2 – OTHER EXTERNAL EXPENSES
(DKK million) 2015 2014
Fees to auditors appointed at the annual general meeting
Statutory audit -7 -6
Tax advisory services -10 -6
Other services -3 -3
Total -20 -15
NOTE 3 – STAFF EXPENSES
(DKK million) 2015 2014
Wages and salaries -2,640 -2,506
Pensions -291 -231
Social security expenses -230 -226
Other employee expenses -204 -207
Capitalised staff expenses 30 37
Total -3,335 -3,133
Included in:
Cost of sales -676 -704
Sales and distribution costs -1,755 -1,689
Research and development costs -471 -445
Administrative costs -433 -295
Total -3,335 -3,133
Average number of full-time employees 4,813 4,712
Remuneration to the Board of Directors -4 -4
Remuneration to the Executive Board -27 -40
An amount of DKK 21 .3 million included in the remuneration to the Executive Board in 2014 relates to changed conditions for post-employment benefits .
NOTE 4 – AMORTISATION, DEPRECIATION AND IMPAIRMENT LOSSES
(DKK million) 2015 2014
Amortisation -171 -188
Depreciation -260 -286
Impairment losses -15 -107
Total -446 -581
Included in:
Cost of sales -225 -235
Sales and distribution costs -14 -13
Research and development costs -89 -170
Administrative costs -118 -163
Total -446 -581

Notes – Group Notes – Group
38 39LEO PHARMA A NNUA L REPORT 2015
NOTE 5 – FINANCIAL INCOME
(DKK million) 2015 2014
Interest income on bonds 327 580
Capital gains, financial assets 90 725
Exchange rate gains 0 10
Other financial income 13 17
Total 430 1,332
NOTE 6 – FINANCIAL EXPENSES
(DKK million) 2015 2014
Interest expenses to affiliates 0 -2
Exchange rate losses -223 0
Other financial expenses -29 -42
Total -252 -44
NOTE 7 – TAX ON PROFIT FOR THE YEAR
(DKK million) 2015 2014
Current tax for the year -381 -384
Change in deferred tax 156 -127
Adjustment relating to previous years 10 5
Total -215 -506
Tax on changes in equity -20 -7
Tax in affiliates totalled DKK 288 million (2014: DKK 231 million) .
NOTE 8 – INTANGIBLE ASSETS
(DKK million)
Intellectual
property rights Trademarks
Development
projects Software
Total
intangible assets
Cost at 1 January 2015 5,135 30 1,820 154 7,139
Exchange rate adjustment 3 0 0 0 3
Additions during the year 0 0 246 0 246
Disposals during the year 0 0 -2 0 -2
Cost at 31 December 2015 5,138 30 2,064 154 7,386
Amortisation at 1 January 2015 -4,933 -19 -1,655 -10 -6,617
Exchange rate adjustment -3 0 0 0 -3
Amortisation for the year -61 -6 -67 -37 -171
Impairment losses for the year -8 0 -6 0 -14
Amortisation at 31 December 2015 -5,005 -25 -1,728 -47 -6,805
CARRYING AMOUNT AT 31 DECEMBER 2015 133 5 336 107 581
Cost at 1 January 2014 5,184 30 1,771 0 6,985
Exchange rate adjustment -2 0 -4 0 -6
Additions during the year 83 0 54 77 214
Disposals during the year -54 0 0 0 -54
Transfers -76 0 -1 77 0
Cost at 31 December 2014 5,135 30 1,820 154 7,139
Amortisation at 1 January 2014 -4,809 -12 -1,504 0 -6,325
Exchange rate adjustment 2 0 1 0 3
Amortisation for the year -90 -7 -81 -10 -188
Impairment losses for the year -36 0 -71 0 -107
Amortisation at 31 December 2014 -4,933 -19 -1,655 -10 -6,617
CARRYING AMOUNT AT 31 DECEMBER 2014 202 11 165 144 522
Development projects amounted to DKK 336 million (2014: DKK 165 million), of which development projects in progress represented DKK 299 million (2014: DKK 53 million) .
Notes – Group Notes – Group
40 41LEO PHARMA A NNUA L REPORT 2015
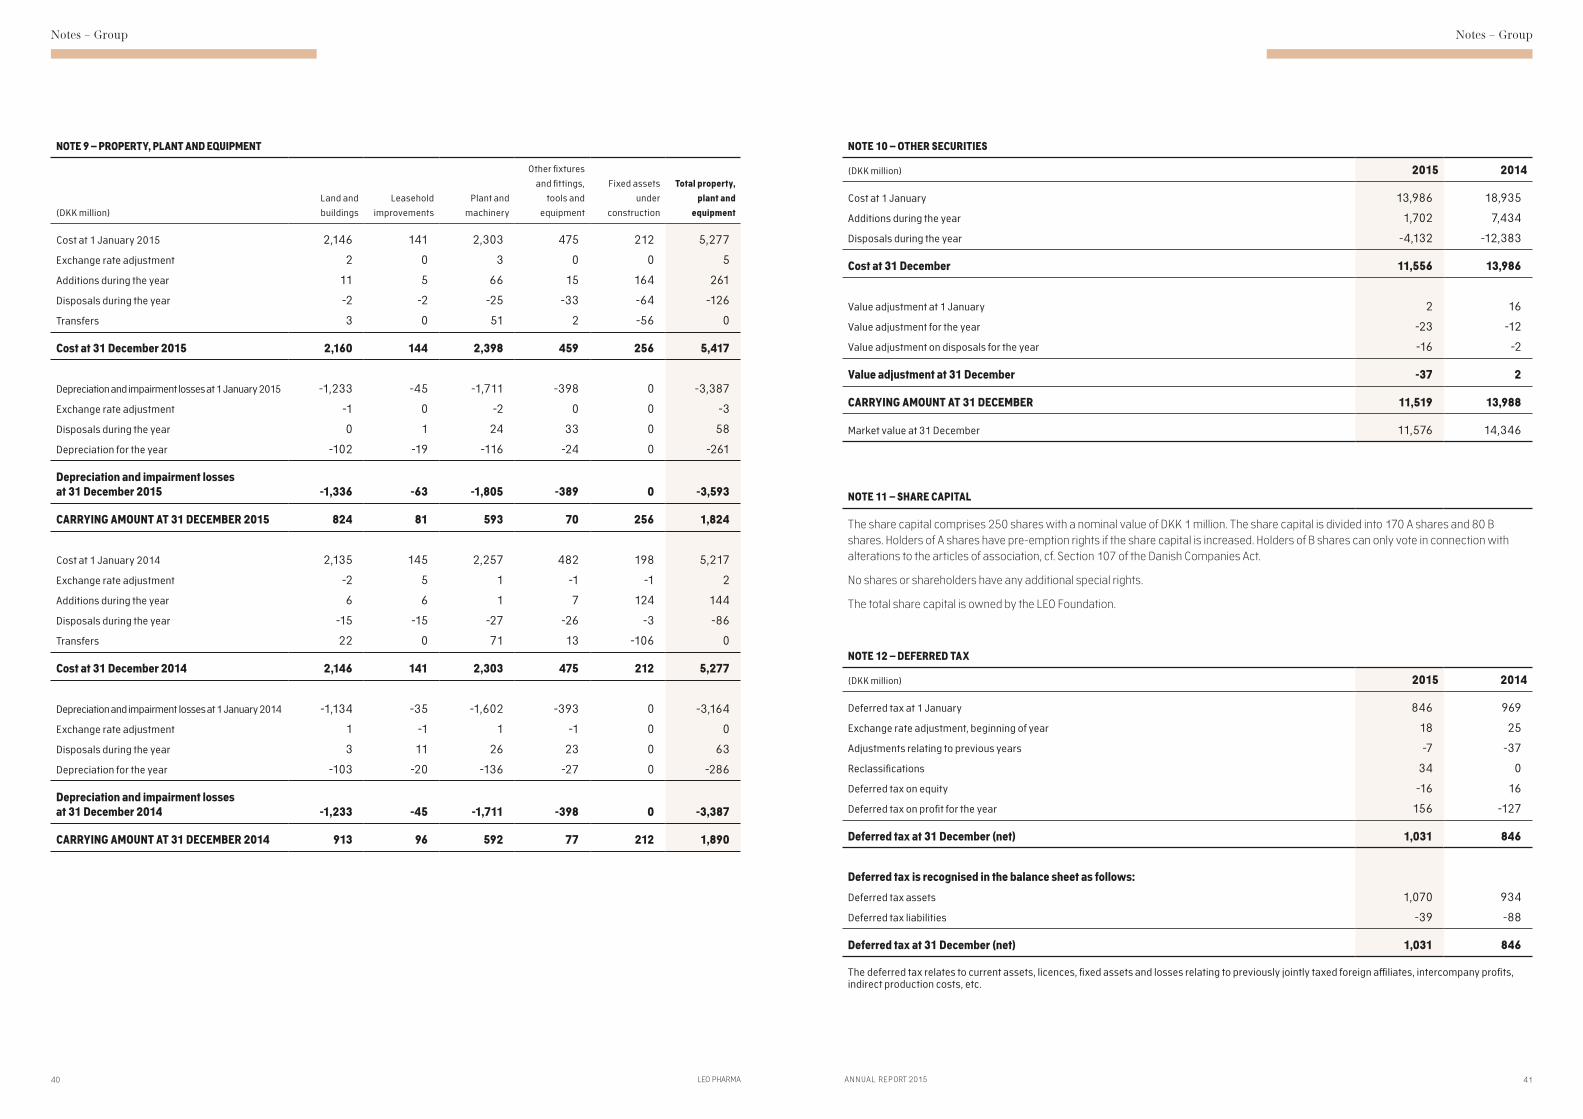
NOTE 9 – PROPERTY, PLANT AND EQUIPMENT
(DKK million)
Land and
buildings
Leasehold
improvements
Plant and
machinery
Other fixtures
and fittings,
tools and
equipment
Fixed assets
under
construction
Total property,
plant and
equipment
Cost at 1 January 2015 2,146 141 2,303 475 212 5,277
Exchange rate adjustment 2 0 3 0 0 5
Additions during the year 11 5 66 15 164 261
Disposals during the year -2 -2 -25 -33 -64 -126
Transfers 3 0 51 2 -56 0
Cost at 31 December 2015 2,160 144 2,398 459 256 5,417
Depreciation and impairment losses at 1 January 2015 -1,233 -45 -1,711 -398 0 -3,387
Exchange rate adjustment -1 0 -2 0 0 -3
Disposals during the year 0 1 24 33 0 58
Depreciation for the year -102 -19 -116 -24 0 -261
Depreciation and impairment losses at 31 December 2015 -1,336 -63 -1,805 -389 0 -3,593
CARRYING AMOUNT AT 31 DECEMBER 2015 824 81 593 70 256 1,824
Cost at 1 January 2014 2,135 145 2,257 482 198 5,217
Exchange rate adjustment -2 5 1 -1 -1 2
Additions during the year 6 6 1 7 124 144
Disposals during the year -15 -15 -27 -26 -3 -86
Transfers 22 0 71 13 -106 0
Cost at 31 December 2014 2,146 141 2,303 475 212 5,277
Depreciation and impairment losses at 1 January 2014 -1,134 -35 -1,602 -393 0 -3,164
Exchange rate adjustment 1 -1 1 -1 0 0
Disposals during the year 3 11 26 23 0 63
Depreciation for the year -103 -20 -136 -27 0 -286
Depreciation and impairment losses at 31 December 2014 -1,233 -45 -1,711 -398 0 -3,387
CARRYING AMOUNT AT 31 DECEMBER 2014 913 96 592 77 212 1,890
NOTE 10 – OTHER SECURITIES
(DKK million) 2015 2014
Cost at 1 January 13,986 18,935
Additions during the year 1,702 7,434
Disposals during the year -4,132 -12,383
Cost at 31 December 11,556 13,986
Value adjustment at 1 January 2 16
Value adjustment for the year -23 -12
Value adjustment on disposals for the year -16 -2
Value adjustment at 31 December -37 2
CARRYING AMOUNT AT 31 DECEMBER 11,519 13,988
Market value at 31 December 11,576 14,346
NOTE 11 – SHARE CAPITAL
The share capital comprises 250 shares with a nominal value of DKK 1 million. The share capital is divided into 170 A shares and 80 B shares. Holders of A shares have pre-emption rights if the share capital is increased. Holders of B shares can only vote in connection with alterations to the articles of association, cf. Section 107 of the Danish Companies Act.
No shares or shareholders have any additional special rights.
The total share capital is owned by the LEO Foundation.
NOTE 12 – DEFERRED TAX
(DKK million) 2015 2014
Deferred tax at 1 January 846 969
Exchange rate adjustment, beginning of year 18 25
Adjustments relating to previous years -7 -37
Reclassifications 34 0
Deferred tax on equity -16 16
Deferred tax on profit for the year 156 -127
Deferred tax at 31 December (net) 1,031 846
Deferred tax is recognised in the balance sheet as follows:
Deferred tax assets 1,070 934
Deferred tax liabilities -39 -88
Deferred tax at 31 December (net) 1,031 846
The deferred tax relates to current assets, licences, fixed assets and losses relating to previously jointly taxed foreign affiliates, intercompany profits, indirect production costs, etc .
Notes – Group
43A NNUA L REPORT 2015
Notes – Group
42 LEO PHARMA
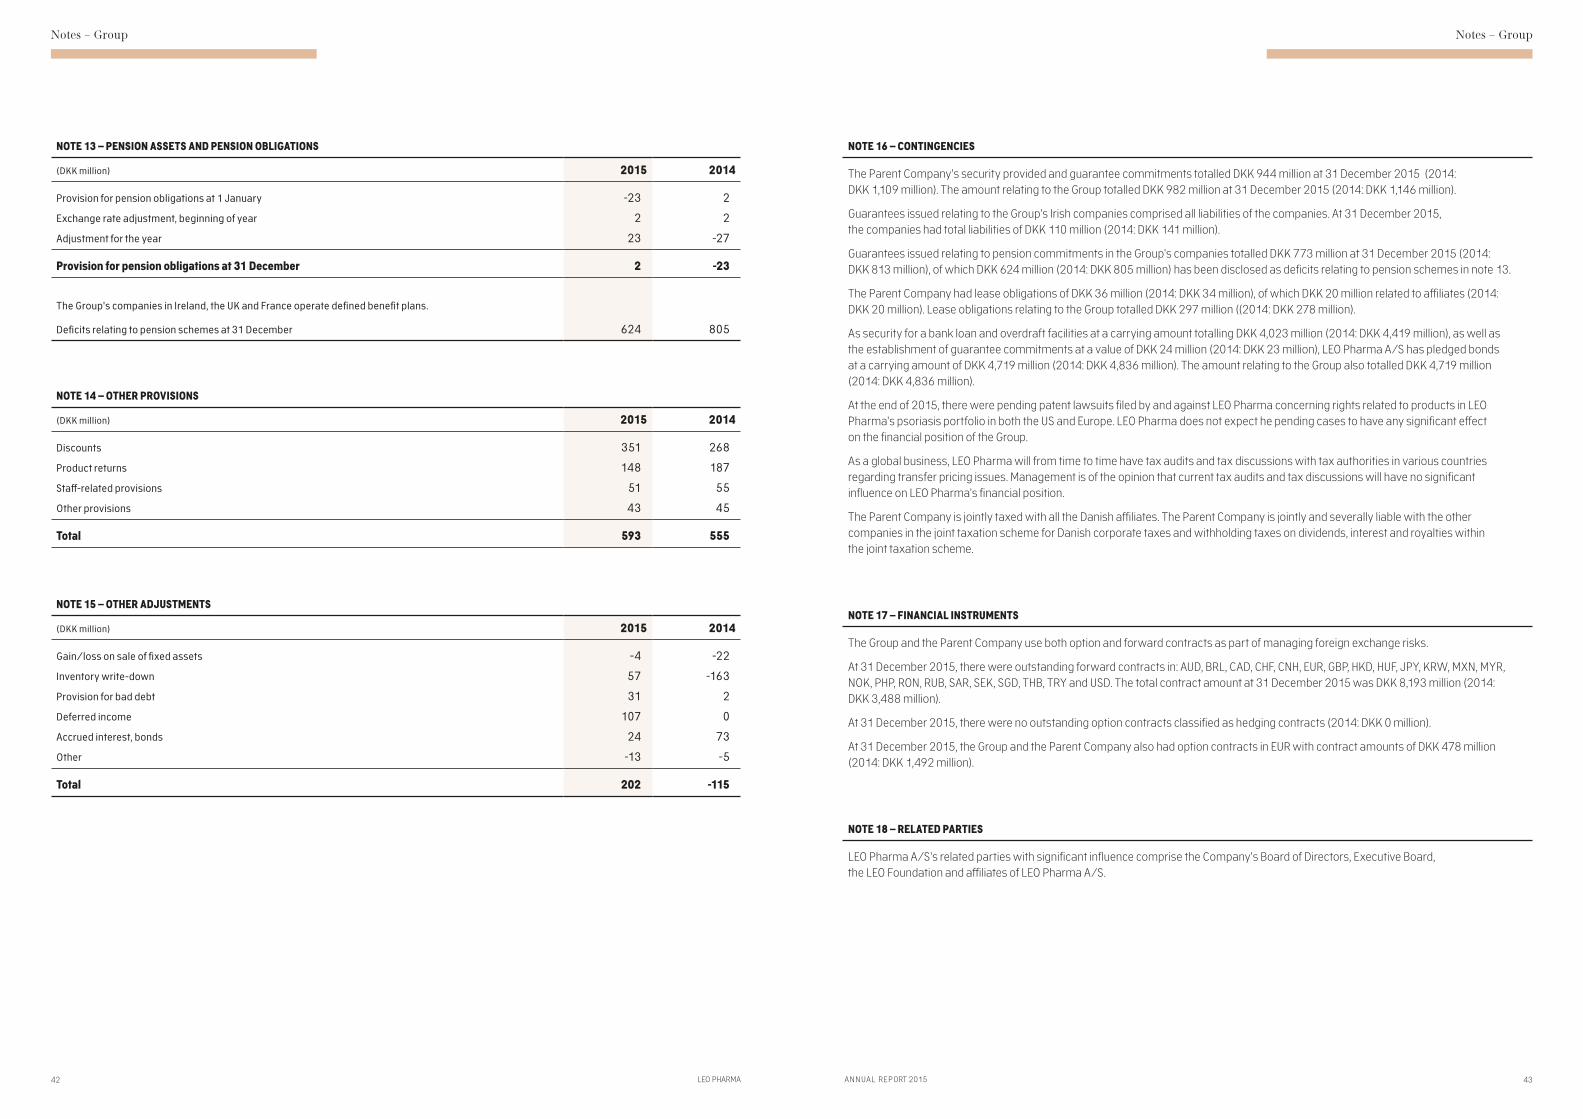
NOTE 13 – PENSION ASSETS AND PENSION OBLIGATIONS
(DKK million) 2015 2014
Provision for pension obligations at 1 January -23 2
Exchange rate adjustment, beginning of year 2 2
Adjustment for the year 23 -27
Provision for pension obligations at 31 December 2 -23
The Group's companies in Ireland, the UK and France operate defined benefit plans . Deficits relating to pension schemes at 31 December 624 805
NOTE 14 – OTHER PROVISIONS
(DKK million) 2015 2014
Discounts 351 268
Product returns 148 187
Staff-related provisions 51 55
Other provisions 43 45
Total 593 555
NOTE 15 – OTHER ADJUSTMENTS
(DKK million) 2015 2014
Gain/loss on sale of fixed assets -4 -22
Inventory write-down 57 -163
Provision for bad debt 31 2
Deferred income 107 0
Accrued interest, bonds 24 73
Other -13 -5
Total 202 -115
NOTE 16 – CONTINGENCIES
The Parent Company's security provided and guarantee commitments totalled DKK 944 million at 31 December 2015 (2014: DKK 1,109 million). The amount relating to the Group totalled DKK 982 million at 31 December 2015 (2014: DKK 1,146 million).
Guarantees issued relating to the Group's Irish companies comprised all liabilities of the companies. At 31 December 2015, the companies had total liabilities of DKK 110 million (2014: DKK 141 million).
Guarantees issued relating to pension commitments in the Group's companies totalled DKK 773 million at 31 December 2015 (2014: DKK 813 million), of which DKK 624 million (2014: DKK 805 million) has been disclosed as deficits relating to pension schemes in note 13.
The Parent Company had lease obligations of DKK 36 million (2014: DKK 34 million), of which DKK 20 million related to affiliates (2014: DKK 20 million). Lease obligations relating to the Group totalled DKK 297 million ((2014: DKK 278 million).
As security for a bank loan and overdraft facilities at a carrying amount totalling DKK 4,023 million (2014: DKK 4,419 million), as well as the establishment of guarantee commitments at a value of DKK 24 million (2014: DKK 23 million), LEO Pharma A/S has pledged bonds at a carrying amount of DKK 4,719 million (2014: DKK 4,836 million). The amount relating to the Group also totalled DKK 4,719 million (2014: DKK 4,836 million).
At the end of 2015, there were pending patent lawsuits filed by and against LEO Pharma concerning rights related to products in LEO Pharma's psoriasis portfolio in both the US and Europe. LEO Pharma does not expect he pending cases to have any significant effect on the financial position of the Group.
As a global business, LEO Pharma will from time to time have tax audits and tax discussions with tax authorities in various countries regarding transfer pricing issues. Management is of the opinion that current tax audits and tax discussions will have no significant influence on LEO Pharma's financial position.
The Parent Company is jointly taxed with all the Danish affiliates. The Parent Company is jointly and severally liable with the other companies in the joint taxation scheme for Danish corporate taxes and withholding taxes on dividends, interest and royalties within the joint taxation scheme.
NOTE 17 – FINANCIAL INSTRUMENTS
The Group and the Parent Company use both option and forward contracts as part of managing foreign exchange risks.
At 31 December 2015, there were outstanding forward contracts in: AUD, BRL, CAD, CHF, CNH, EUR, GBP, HKD, HUF, JPY, KRW, MXN, MYR, NOK, PHP, RON, RUB, SAR, SEK, SGD, THB, TRY and USD. The total contract amount at 31 December 2015 was DKK 8,193 million (2014: DKK 3,488 million).
At 31 December 2015, there were no outstanding option contracts classified as hedging contracts (2014: DKK 0 million).
At 31 December 2015, the Group and the Parent Company also had option contracts in EUR with contract amounts of DKK 478 million (2014: DKK 1,492 million).
NOTE 18 – RELATED PARTIES
LEO Pharma A/S's related parties with significant influence comprise the Company's Board of Directors, Executive Board, the LEO Foundation and affiliates of LEO Pharma A/S.

Notes – Group
44 LEO PHARMA
Notes – Group
45A NNUA L REPORT 2015
NOTE 19 – COMPANIES IN THE LEO PHARMA GROUP
Affiliates Reg . office Ownership Currency
Nominal capital
(thousand)
SARL LEO Pharma Algeria 100% DZD 2,000
PBL Australia Pty Ltd Australia 100% AUD 100
Peplin Operations Pty Ltd Australia 100% AUD 24,000
LEO Pharma Pty Ltd Australia 100% AUD 5,500
LEO Pharma GmbH Austria 100% EUR 76
LEO Pharma NV Belgium 100% EUR 273
LEO Pharma LTDA. Brazil 100% BRL 4,500
LEO Pharma Inc. Canada 100% CAD 8,400
LEO Pharma Consultancy company limited China 100% USD 3,600
LEO Pharma s.r.o. Czech Republic 100% CZK 350
Løvens Kemiske Fabriks Handelsaktieselskab Denmark 100% DKK 30,000
Aktieselskabet af 30. april 2003 Denmark 100% DKK 3,500
LEO Pharma OY Finland 100% EUR 151
Laboratoires LEO S.A. France 100% EUR 9,000
LEO Pharma GmbH Germany 100% EUR 750
LEO Pharmaceutical Hellas S.A. Greece 100% EUR 8,551
LEO Laboratories Ltd. Ireland 100% EUR 30,394
Wexport Ltd. Ireland 100% EUR 2,600
LEO Pharma Holding Ltd. Ireland 100% EUR 100
LEO Pharma S.p.A. Italy 100% EUR 620
LEO Pharma K.K. Japan 100% JPY 10,000
LEO Pharmaceuticals, S. de R. L. de C. V. Mexico 100% MXN 7,922
LEO Pharma LLC Morocco 100% MAD 100
LEO Pharma BV Netherlands 100% EUR 227
LEO Pharma Ltd. New Zealand 100% NZD 85
LEO Pharma AS Norway 100% NOK 3,000
LEO Pharma Sp. z o.o. Poland 100% PLN 95
LEO Farmacêuticos Lda. Portugal 100% EUR 626
LEO Pharmaceutical Products LLC Russia 100% RUB 16,500
LEO Pharma Asia PTE Ltd. Singapore 100% SGD 100
LEO Pharma Ltd South Korea 100% KRW 1,800,000
Laboratorios LEO Pharma S.A. Spain 100% EUR 1,214
LEO Pharma AB Sweden 100% SEK 1,000
Lövens Läkemedel AB Sweden 100% SEK 100
LEO Pharmaceutical Products Sarath Ltd. Switzerland 100% CHF 50
LEO Pharma SARL Tunisia 100% TND 10
LEO Pharma İlaç Ticaret Anonim Şirketi Turkey 100% TRY 1,300
LEO Laboratories Ltd. United Kingdom 100% GBP 12,000
LEO Pharma Inc. USA 100% USD 2,500
Peplin Inc. USA 100% USD 15
Associate
SkinVision B.V. Netherlands 26.32% EUR 30

Notes – Group Notes – Group
46 47LEO PHARMA A NNUA L REPORT 2015
NOTE 20 – ACCOUNTING POLICIES
The Consolidated Financial Statements of LEO Pharma for 2015 have been prepared in accordance with the provisions of the Danish Financial Statements Act applying to large enterprises of reporting class C.
LEO Pharma has decided to change the presentation of the income statement from 'by nature' to 'by function'. Consequently, comparative figures in the income statement have been restated. The change relates only to presentation of the income statement and has no impact on either result for the year or the balance sheet.
The accounting policies applied are unchanged from last year.
RECOGNITION AND MEASUREMENTRevenues are recognised in the income statement as earned. Furthermore, value adjustments of financial assets and liabil-ities measured at fair value or amortised cost are recognised. Moreover, all expenses incurred to achieve the earnings for the year are recognised in the income statement, including depreciation, amortisation and impairment losses and provisions, as well as reversals due to changed accounting estimates of amounts that have previously been recognised in the income statement.
Assets are recognised in the balance sheet when it is probable that future economic benefits attributable to the asset will flow to the Company and the value of the asset can be measured reliably.
Liabilities are recognised in the balance sheet when it is probable that future economic benefits will flow out of the Company and the value of the liability can be measured reliably.
Assets and liabilities are initially measured at cost. Subsequently, assets and liabilities are measured as described for each item below.
Certain financial assets and liabilities are measured at amortised cost, which involves the recognition of a constant effective interest rate over the maturity period. Amortised cost is calculated as original cost less any repayments, and with addition/deduction of the cumulative amortisation of any difference between cost and the nominal amount. In this way, capital losses and gains are allocated over the maturity period.
Recognition and measurement take into account predictable losses and risks occurring before the presentation of the Annual Report that confirm or invalidate circumstances and conditions existing at the balance sheet date.
The measurement currency is Danish kroner (DKK). All other currencies are regarded as foreign currencies.
CONSOLIDATED FINANCIAL STATEMENTSThe Consolidated Financial Statements comprise the Parent Company, LEO Pharma A/S, and affiliates in which LEO Pharma A/S,
directly or indirectly holds more than 50% of the votes or otherwise exercises control.
The Consolidated Financial Statements are prepared by combining the Financial Statements of the Parent Company and all affi- liates with subsequent elimination of intercompany transactions, intercompany shareholdings and balances, as well as unrealised profits from intercompany transactions.
The Financial Statements of all companies have been prepared according to the same accounting policies as applied by the Parent Company.
Enterprises acquired during the year and newly formed enter-prises are consolidated from the date of acquisition or formation. Enterprises that are sold or wound up during the year are included in the consolidated income statement until the date of disposal or until the business was wound up. Comparative figures are not restated for newly acquired, sold or wound-up enterprises.
FOREIGN CURRENCY TRANSLATIONOn recognition, transactions in foreign currencies are translated at the exchange rates at the transaction dates. Exchange differences arising between the transaction date rates and the rates at the payment dates are recognised in financial income and expenses in the income statement.
Receivables, payables and other monetary items in foreign currencies are translated at the exchange rates at the balance sheet date. Any differences between the exchange rates at the balance sheet date and the rate at the time when the receivable or the payable arises, or on recognition in the most recent Financial Statements, are recognised in financial income and expenses in the income statement.
Fixed assets acquired in foreign currencies are measured at the transaction-date rates.
On recognition of foreign affiliates, income statements are translated at the average exchange rates for the period, and balance sheet items are translated at the exchange rates at the balance sheet date.
Exchange adjustments arising on the translation of the opening equity of foreign affiliates at the exchange rates at the balance sheet date and on the translation of the income statement from average exchange rates to the exchange rates at the balance sheet date are recognised directly in equity.
DERIVATIVE FINANCIAL INSTRUMENTSDerivative financial instruments are recognised in the balance sheet at cost and are subsequently remeasured to their fair val-ues at the end of the reporting period. Positive and negative fair
NOTE 20 – ACCOUNTING POLICIES
values of derivative financial instruments are recognised in other receivables and other payables respectively.
Changes in the fair values of derivative financial instruments that are designated and qualify as fair value hedges of a recognised asset or a recognised liability are recognised in the income statement, as are any changes in the fair value of the hedged asset or the hedged liability.
Changes in the fair values of financial and derivative financial instruments that are designated and qualify as hedges of future cash flows are recognised as other receivables and other payables and as financial hedges in equity. Income and expenses relating to such hedging transactions are transferred from equity on realisation of the hedged item and recognised as financial income and expenses.
REVENUERevenue from the sale of goods for resale and finished goods is recognised in the income statement when the sale is considered effected based on the following criteria:
• Delivery and transfer of risk have taken place before year-end• The sales price can be measured reliably and payment has
been received or may with reasonable certainty be expected to be received
Revenue is recognised exclusive of VAT and net of discounts relating to sales.
Revenue includes licence income and royalties from outlicensed products as well as milestone payments and other revenues in connection with partnerships. These revenues are recognised when it is probable that future economic benefits will flow to the Company and these benefits can be measured reliably.
COST OF SALESCost of sales comprises costs incurred to achieve the revenue for the year. Cost of sales includes direct and indirect costs of raw materials and consumables; salaries; maintenance, depreciation and impairment of production plant; and costs and expenses relating to the operation, administration and management of factories. Also included are inventory write-downs.
SALES AND DISTRIBUTION COSTSSales and distribution costs comprise costs relating to the sale and distribution of products, including salaries, sales commissions, advertising and marketing costs, depreciation and impairment, etc.
RESEARCH AND DEVELOPMENT COSTSResearch and development costs comprise costs, including salaries, depreciation of operating assets, amortisation and write-down of development projects and equipment directly or
indirectly attributable to the Group’s research and development activities.
ADMINISTRATIVE COSTSAdministrative costs comprise expenses incurred for management and administration. Administrative costs include office expenses, salaries, depreciation and impairment, losses on trade receivables, etc.
OTHER OPERATING INCOME AND EXPENSESOther operating income and expenses comprise items secondary to the principal activities. Other operating income includes non- recurring income from the sale of rights and gains on the sale of fixed assets, etc.
As a main rule, the sale of rights, etc. is recognised as income at the time of sale. If the sale results in an obligation for the Company, the income is accrued over the duration of the obligation, and in the case of sales where the income is dependent on future events, the amount is recognised as income when the event occurs.
FINANCIAL INCOME AND EXPENSESFinancial income and expenses comprise interest, realised and unrealised exchange adjustments, price adjustment of securities, as well as extra payments and repayments under the on-account taxation scheme.
TAX ON PROFIT/LOSS FOR THE YEARTax for the year comprises current tax and changes in deferred tax for the year. The tax attributable to the profit for the year is recognised in the income statement, whereas the tax attributable to equity transactions is recognised directly in equity. Any changes in deferred tax due to changes in tax rates are recognised in the income statement.
INTANGIBLE ASSETSIntangible assets are measured at cost less accumulated depreciation and impairment. Amortisation is provided on a straight-line basis over the expected useful lives of the assets. The amortisation profile is adjusted for the risk relating to the underlying asset, so that up to 33% of the amortisation is brought forward from the second half of the asset’s expected useful life to the first half. Amortisation and impairment are recognised in the income statement as cost of sales, sales and distribution costs, and administrative costs. The expected useful lives are as follows:
Intellectual property rights, trademarks and development projects 3-20 years
Software 5 years
Notes – Group Notes – Group
48 49LEO PHARMA A NNUA L REPORT 2015
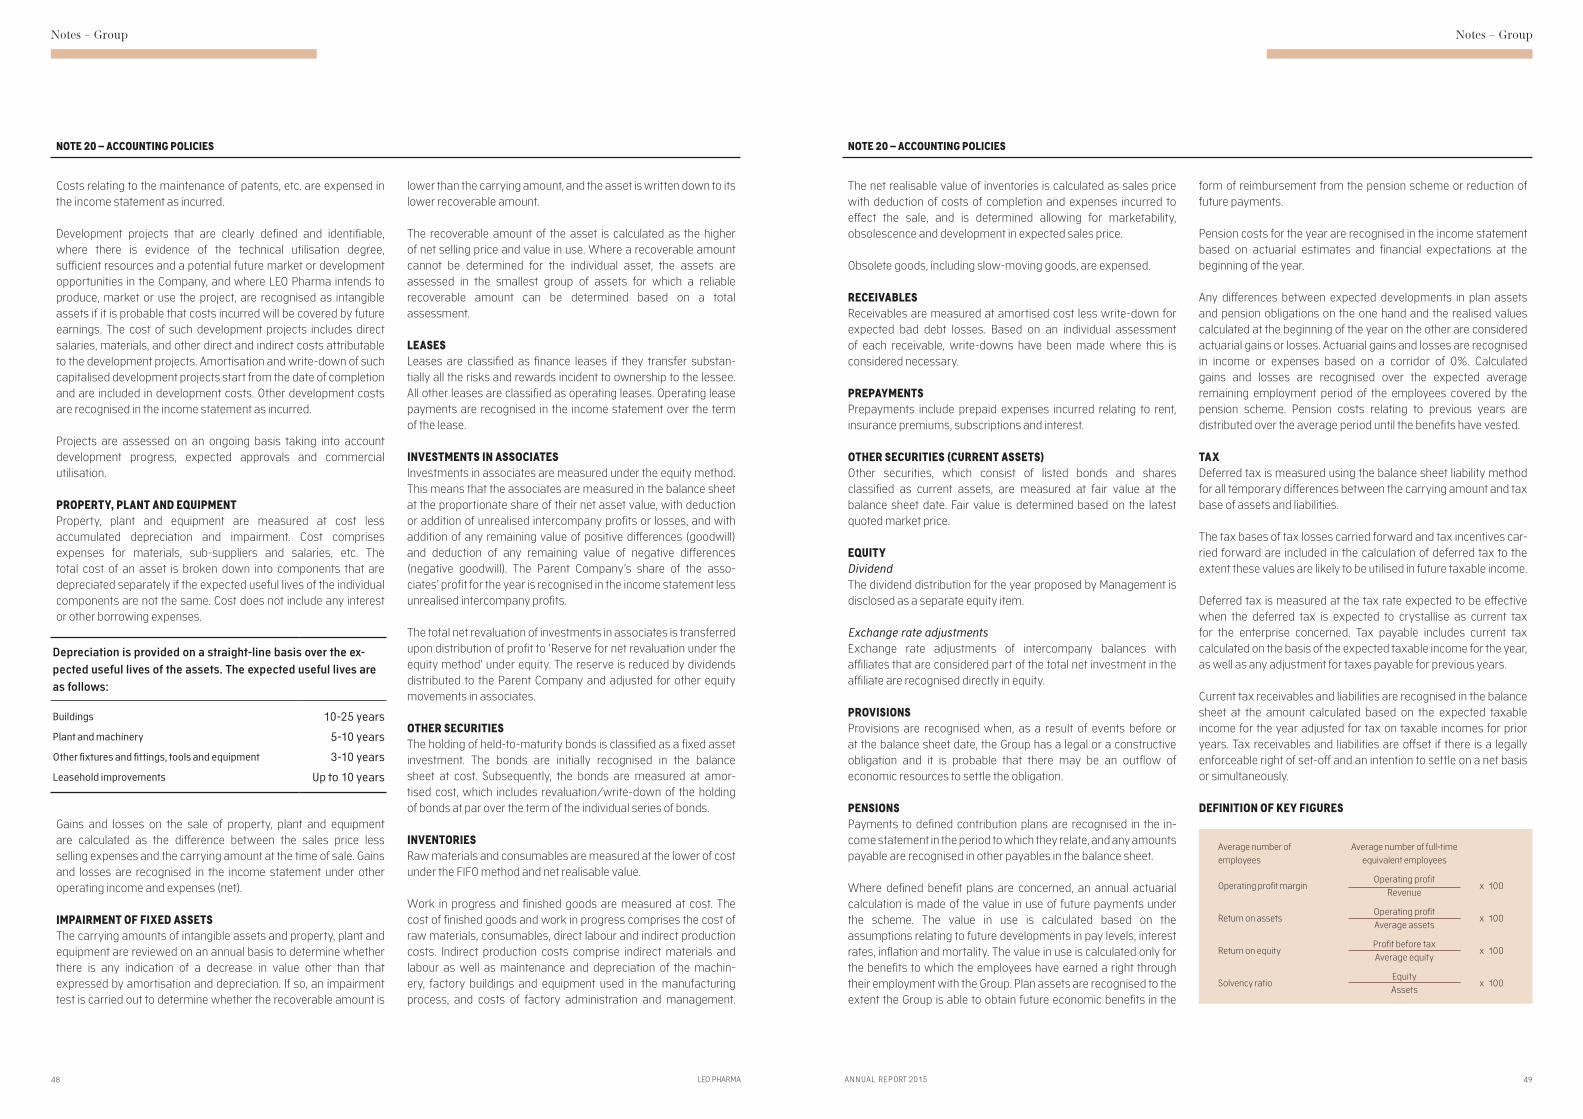
Costs relating to the maintenance of patents, etc. are expensed in the income statement as incurred.
Development projects that are clearly defined and identifiable, where there is evidence of the technical utilisation degree, sufficient resources and a potential future market or development opportunities in the Company, and where LEO Pharma intends to produce, market or use the project, are recognised as intangible assets if it is probable that costs incurred will be covered by future earnings. The cost of such development projects includes direct salaries, materials, and other direct and indirect costs attributable to the development projects. Amortisation and write-down of such capitalised development projects start from the date of completion and are included in development costs. Other development costs are recognised in the income statement as incurred.
Projects are assessed on an ongoing basis taking into account development progress, expected approvals and commercial utilisation.
PROPERTY, PLANT AND EQUIPMENTProperty, plant and equipment are measured at cost less accumulated depreciation and impairment. Cost comprises expenses for materials, sub-suppliers and salaries, etc. The total cost of an asset is broken down into components that are depreciated separately if the expected useful lives of the individual components are not the same. Cost does not include any interest or other borrowing expenses.
Gains and losses on the sale of property, plant and equipment are calculated as the difference between the sales price less selling expenses and the carrying amount at the time of sale. Gains and losses are recognised in the income statement under other operating income and expenses (net).
IMPAIRMENT OF FIXED ASSETSThe carrying amounts of intangible assets and property, plant and equipment are reviewed on an annual basis to determine whether there is any indication of a decrease in value other than that expressed by amortisation and depreciation. If so, an impairment test is carried out to determine whether the recoverable amount is
lower than the carrying amount, and the asset is written down to its lower recoverable amount.
The recoverable amount of the asset is calculated as the higher of net selling price and value in use. Where a recoverable amount cannot be determined for the individual asset, the assets are assessed in the smallest group of assets for which a reliable recoverable amount can be determined based on a total assessment.
LEASESLeases are classified as finance leases if they transfer substan-tially all the risks and rewards incident to ownership to the lessee. All other leases are classified as operating leases. Operating lease payments are recognised in the income statement over the term of the lease.
INVESTMENTS IN ASSOCIATESInvestments in associates are measured under the equity method. This means that the associates are measured in the balance sheet at the proportionate share of their net asset value, with deduction or addition of unrealised intercompany profits or losses, and with addition of any remaining value of positive differences (goodwill) and deduction of any remaining value of negative differences (negative goodwill). The Parent Company’s share of the asso- ciates’ profit for the year is recognised in the income statement less unrealised intercompany profits.
The total net revaluation of investments in associates is transferred upon distribution of profit to 'Reserve for net revaluation under the equity method' under equity. The reserve is reduced by dividends distributed to the Parent Company and adjusted for other equity movements in associates.
OTHER SECURITIESThe holding of held-to-maturity bonds is classified as a fixed asset investment. The bonds are initially recognised in the balance sheet at cost. Subsequently, the bonds are measured at amor-tised cost, which includes revaluation/write-down of the holding of bonds at par over the term of the individual series of bonds.
INVENTORIESRaw materials and consumables are measured at the lower of cost under the FIFO method and net realisable value.
Work in progress and finished goods are measured at cost. The cost of finished goods and work in progress comprises the cost of raw materials, consumables, direct labour and indirect production costs. Indirect production costs comprise indirect materials and labour as well as maintenance and depreciation of the machin-ery, factory buildings and equipment used in the manufacturing process, and costs of factory administration and management.
NOTE 20 – ACCOUNTING POLICIES
Depreciation is provided on a straight-line basis over the ex- pected useful lives of the assets. The expected useful lives are as follows:
Buildings 10-25 years
Plant and machinery 5-10 years
Other fixtures and fittings, tools and equipment 3-10 years
Leasehold improvements Up to 10 years
The net realisable value of inventories is calculated as sales price with deduction of costs of completion and expenses incurred to effect the sale, and is determined allowing for marketability, obsolescence and development in expected sales price.
Obsolete goods, including slow-moving goods, are expensed.
RECEIVABLESReceivables are measured at amortised cost less write-down for expected bad debt losses. Based on an individual assessment of each receivable, write-downs have been made where this is considered necessary.
PREPAYMENTS Prepayments include prepaid expenses incurred relating to rent, insurance premiums, subscriptions and interest.
OTHER SECURITIES (CURRENT ASSETS)Other securities, which consist of listed bonds and shares classified as current assets, are measured at fair value at the balance sheet date. Fair value is determined based on the latest quoted market price.
EQUITY DividendThe dividend distribution for the year proposed by Management is disclosed as a separate equity item.
Exchange rate adjustmentsExchange rate adjustments of intercompany balances with affiliates that are considered part of the total net investment in the affiliate are recognised directly in equity.
PROVISIONSProvisions are recognised when, as a result of events before or at the balance sheet date, the Group has a legal or a constructive obligation and it is probable that there may be an outflow of economic resources to settle the obligation.
PENSIONSPayments to defined contribution plans are recognised in the in-come statement in the period to which they relate, and any amounts payable are recognised in other payables in the balance sheet.
Where defined benefit plans are concerned, an annual actuarial calculation is made of the value in use of future payments under the scheme. The value in use is calculated based on the assumptions relating to future developments in pay levels, interest rates, inflation and mortality. The value in use is calculated only for the benefits to which the employees have earned a right through their employment with the Group. Plan assets are recognised to the extent the Group is able to obtain future economic benefits in the
form of reimbursement from the pension scheme or reduction of future payments.
Pension costs for the year are recognised in the income statement based on actuarial estimates and financial expectations at the beginning of the year.
Any differences between expected developments in plan assets and pension obligations on the one hand and the realised values calculated at the beginning of the year on the other are considered actuarial gains or losses. Actuarial gains and losses are recognised in income or expenses based on a corridor of 0%. Calculated gains and losses are recognised over the expected average remaining employment period of the employees covered by the pension scheme. Pension costs relating to previous years are distributed over the average period until the benefits have vested.
TAXDeferred tax is measured using the balance sheet liability method for all temporary differences between the carrying amount and tax base of assets and liabilities.
The tax bases of tax losses carried forward and tax incentives car-ried forward are included in the calculation of deferred tax to the extent these values are likely to be utilised in future taxable income.
Deferred tax is measured at the tax rate expected to be effective when the deferred tax is expected to crystallise as current tax for the enterprise concerned. Tax payable includes current tax calculated on the basis of the expected taxable income for the year, as well as any adjustment for taxes payable for previous years.
Current tax receivables and liabilities are recognised in the balance sheet at the amount calculated based on the expected taxable income for the year adjusted for tax on taxable incomes for prior years. Tax receivables and liabilities are offset if there is a legally enforceable right of set-off and an intention to settle on a net basis or simultaneously.
DEFINITION OF KEY FIGURES
NOTE 20 – ACCOUNTING POLICIES
Average number of employees
Average number of full-time equivalent employees
Operating profit marginOperating profit
Revenuex 100
Return on assetsOperating profit Average assets
x 100
Return on equityProfit before tax Average equity
x 100
Solvency ratioEquity Assets
x 100
Notes – Group
50 LEO PHARMA
Notes – Group
51A NNUA L REPORT 2015
SEGMENT REPORTINGRevenue is broken down geographically and by business area.
CASH FLOW STATEMENT FOR THE GROUPThe cash flow statement is prepared according to the indirect method based on profit before tax. The statement shows cash flows from operating, investing and financing activities, as well as cash and cash equivalents at the end of the year.
Cash flows from operating activities are calculated as the Group’s profit for the year before extraordinary items and tax, adjusted for non-cash operating items such as depreciation, amortisation and impairment losses, as well as changes in working capital. Working capital comprises inventories, trade receivables and trade payables, etc.
Cash flows from investing activities comprise payments from acquisitions and disposals of intangible assets, property, plant and equipment as well as fixed asset investments.
Cash flows from financing activities comprise payments from the raising and repayment of short-term and long-term debt, and payments to and from shareholders.
Cash and cash equivalents comprise only cash at bank and in hand.
NOTE 20 – ACCOUNTING POLICIES

52
Parent Company Financial Statements
LEO PHARMA 53
Parent Company Financial Statements
A NNUA L REPORT 2015
FINANCIAL STATEMENTS
Income statement . . . . . . . . . . . . . . . . . . . . . . . . . . . . . . . . . . . . . . . . . . . . . . . . . . . . . . . . . . . . . . . . . . . . . . . . . . . . . . . . . . . . . . . . . . . . . 55 Balance sheet at 31 December . . . . . . . . . . . . . . . . . . . . . . . . . . . . . . . . . . . . . . . . . . . . . . . . . . . . . . . . . . . . . . . . . . . . . . . . . . . . . . . . 56 Statement of equity . . . . . . . . . . . . . . . . . . . . . . . . . . . . . . . . . . . . . . . . . . . . . . . . . . . . . . . . . . . . . . . . . . . . . . . . . . . . . . . . . . . . . . . . . . . . 58
NOTES
Note 1 – Revenue . . . . . . . . . . . . . . . . . . . . . . . . . . . . . . . . . . . . . . . . . . . . . . . . . . . . . . . . . . . . . . . . . . . . . . . . . . . . . . . . . . . . . . . . . . . . . . 62 Note 2 – Staff expenses . . . . . . . . . . . . . . . . . . . . . . . . . . . . . . . . . . . . . . . . . . . . . . . . . . . . . . . . . . . . . . . . . . . . . . . . . . . . . . . . . . . . . . . . 62 Note 3 – Amortisation, depreciation and impairment losses . . . . . . . . . . . . . . . . . . . . . . . . . . . . . . . . . . . . . . . . . . . . . . . . . . . . 63 Note 4 – Financial income . . . . . . . . . . . . . . . . . . . . . . . . . . . . . . . . . . . . . . . . . . . . . . . . . . . . . . . . . . . . . . . . . . . . . . . . . . . . . . . . . . . . . . 63 Note 5 – Financial expenses . . . . . . . . . . . . . . . . . . . . . . . . . . . . . . . . . . . . . . . . . . . . . . . . . . . . . . . . . . . . . . . . . . . . . . . . . . . . . . . . . . . 63 Note 6 – Tax on profit for the year . . . . . . . . . . . . . . . . . . . . . . . . . . . . . . . . . . . . . . . . . . . . . . . . . . . . . . . . . . . . . . . . . . . . . . . . . . . . . . 63 Note 7 – Intangible assets . . . . . . . . . . . . . . . . . . . . . . . . . . . . . . . . . . . . . . . . . . . . . . . . . . . . . . . . . . . . . . . . . . . . . . . . . . . . . . . . . . . . . 64 Note 8 – Property, plant and equipment . . . . . . . . . . . . . . . . . . . . . . . . . . . . . . . . . . . . . . . . . . . . . . . . . . . . . . . . . . . . . . . . . . . . . . . . 65 Note 9 – Investments in affiliates . . . . . . . . . . . . . . . . . . . . . . . . . . . . . . . . . . . . . . . . . . . . . . . . . . . . . . . . . . . . . . . . . . . . . . . . . . . . . . . 66 Note 10 – Other securities . . . . . . . . . . . . . . . . . . . . . . . . . . . . . . . . . . . . . . . . . . . . . . . . . . . . . . . . . . . . . . . . . . . . . . . . . . . . . . . . . . . . . 66 Note 11 – Deferred tax assets . . . . . . . . . . . . . . . . . . . . . . . . . . . . . . . . . . . . . . . . . . . . . . . . . . . . . . . . . . . . . . . . . . . . . . . . . . . . . . . . . 67 Note 12 – Other provisions . . . . . . . . . . . . . . . . . . . . . . . . . . . . . . . . . . . . . . . . . . . . . . . . . . . . . . . . . . . . . . . . . . . . . . . . . . . . . . . . . . . . . 67 Note 13 – Other notes . . . . . . . . . . . . . . . . . . . . . . . . . . . . . . . . . . . . . . . . . . . . . . . . . . . . . . . . . . . . . . . . . . . . . . . . . . . . . . . . . . . . . . . . . . 67 Note 14 – Accounting policies . . . . . . . . . . . . . . . . . . . . . . . . . . . . . . . . . . . . . . . . . . . . . . . . . . . . . . . . . . . . . . . . . . . . . . . . . . . . . . . . . . 68
Financial Statements Parent Company
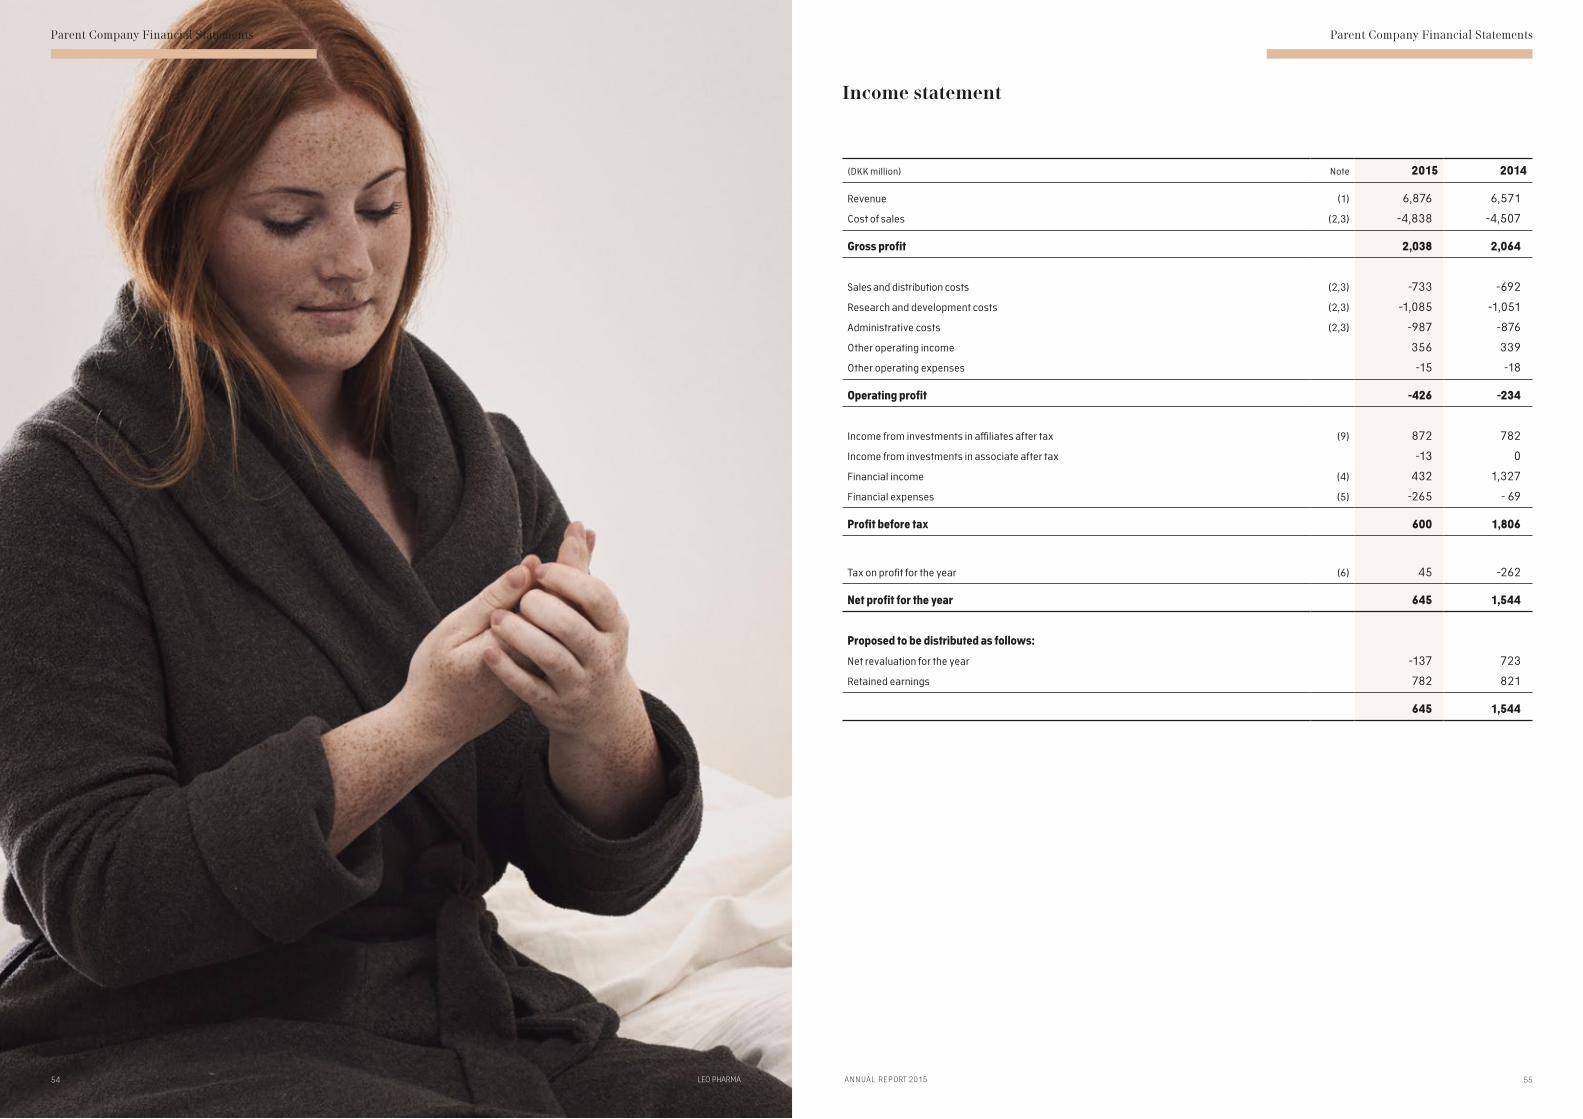
55
Parent Company Financial Statements
A NNUA L REPORT 201554
Parent Company Financial Statements
LEO PHARMA
Income statement
(DKK million) Note 2015 2014
Revenue (1) 6,876 6,571
Cost of sales (2,3) -4,838 -4,507
Gross profit 2,038 2,064
Sales and distribution costs (2,3) -733 -692
Research and development costs (2,3) -1,085 -1,051
Administrative costs (2,3) -987 -876
Other operating income 356 339
Other operating expenses -15 -18
Operating profit -426 -234
Income from investments in affiliates after tax (9) 872 782
Income from investments in associate after tax -13 0
Financial income (4) 432 1,327
Financial expenses (5) -265 - 69
Profit before tax 600 1,806
Tax on profit for the year (6) 45 -262
Net profit for the year 645 1,544
Proposed to be distributed as follows:
Net revaluation for the year -137 723
Retained earnings 782 821
645 1,544

56 57
Parent Company Financial Statements Parent Company Financial Statements
LEO PHARMA A NNUA L REPORT 2015
Balance sheet at 31 December
ASSETS
(DKK million) Note 2015 2014
Intellectual property rights 133 202
Trademarks 5 11
Development projects 299 59
Software 107 144
Intangible assets (7) 544 416
Land and buildings 415 464
Leasehold improvements 3 3
Plant and machinery 257 246
Other fixtures and fittings, tools and equipment 58 67
Fixed assets under construction 159 122
Property, plant and equipment (8) 892 902
Investments in associates 5 0
Investments in affiliates (9) 5,019 4,310
Other financial securities (10) 11,519 13,988
Deferred tax assets (11) 160 124
Financial fixed assets 16,703 18,422
Fixed assets 18,139 19,740
Raw materials and consumables 34 36
Work in progress 311 264
Finished goods and goods for resale 333 224
Inventories 678 524
Trade receivables 822 736
Loans to affiliates 566 282
Receivables from affiliates 2,355 3,074
Other receivables 1,442 1,384
Prepayments 70 54
Receivables 5,255 5,530
Other securities 11,531 8,497
Cash at bank and in hand 0 318
Current assets 17,464 14,869
ASSETS 35,603 34,609
EQUITY AND LIABILITIES
(DKK million) Note 2015 2014
Share capital (13) 250 250
Net revaluation, affiliates 1,779 997
Retained earnings 23,253 23,276
Equity 25,282 24,523
Other provisions (12) 44 46
Provisions 44 46
Credit institutions 4,022 4,410
Bank loans 84 0
Trade payables 671 762
Loans from affiliates 3,464 2,189
Payables to affiliates 1,792 2,493
Corporation tax 0 4
Other payables 244 182
Current liabilities 10,277 10,040
EQUITY AND LIABILITIES 35,603 34,609
Balance sheet at 31 December
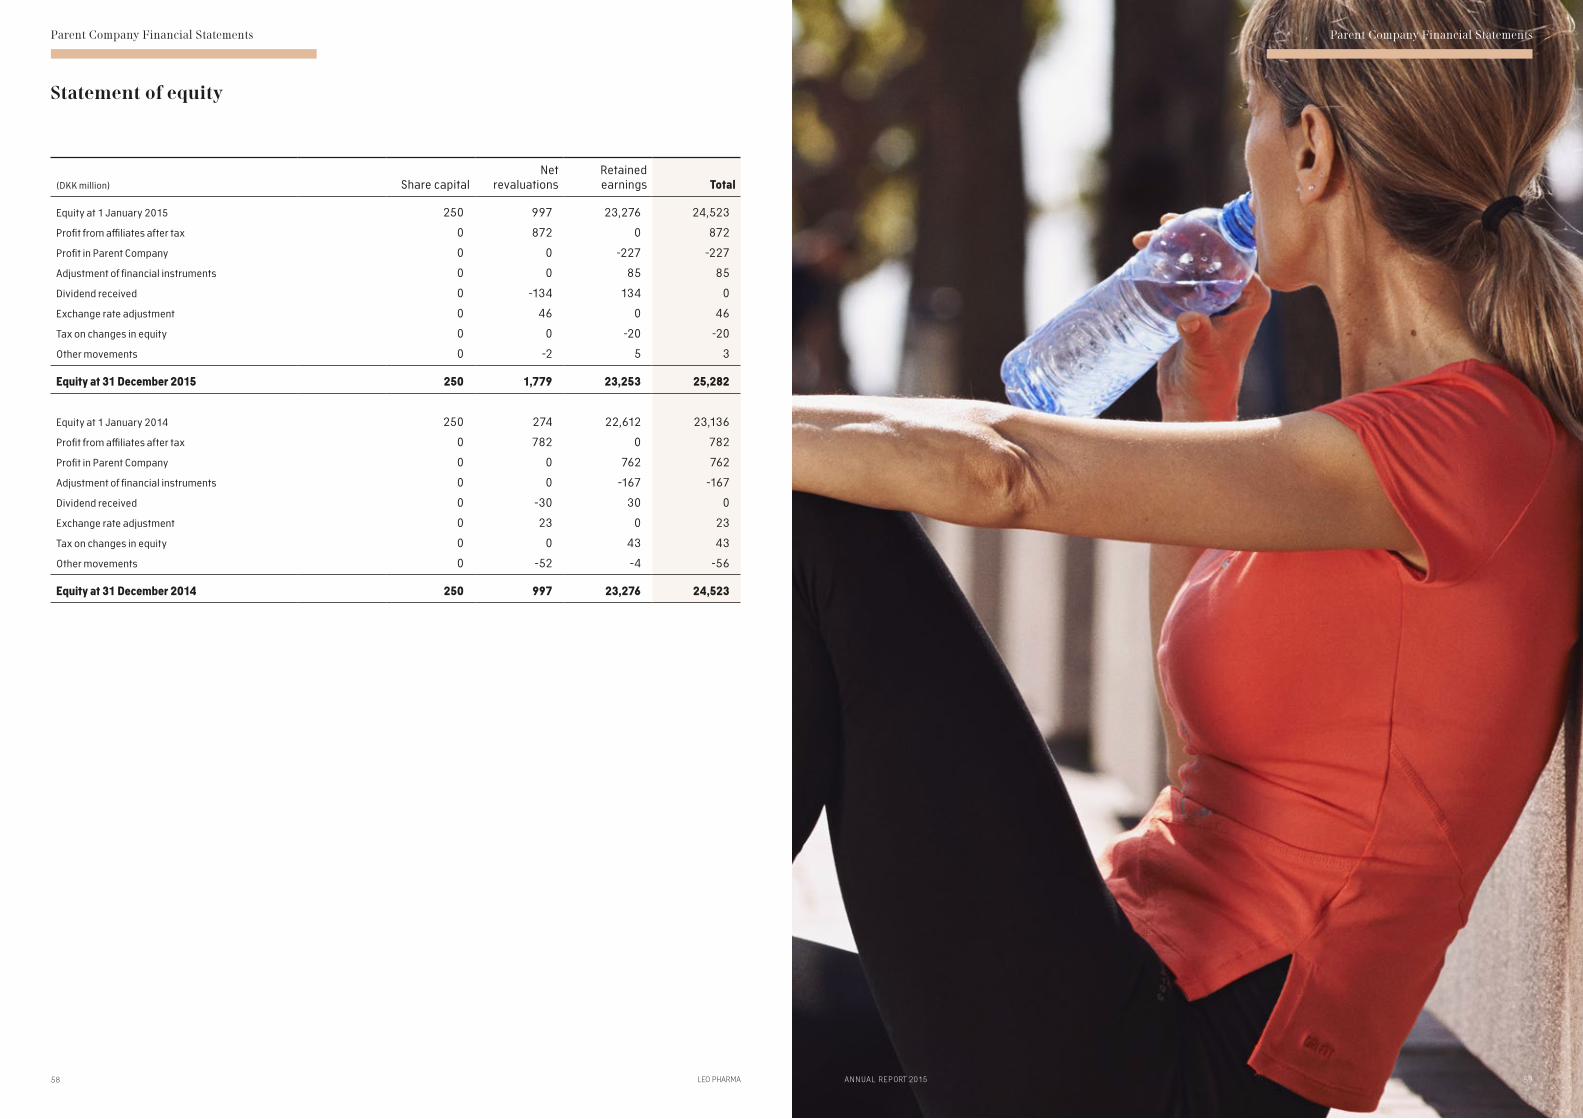
58
Parent Company Financial Statements
LEO PHARMA 59
Parent Company Financial Statements
A NNUA L REPORT 2015
(DKK million) Share capitalNet
revaluationsRetained earnings Total
Equity at 1 January 2015 250 997 23,276 24,523
Profit from affiliates after tax 0 872 0 872
Profit in Parent Company 0 0 -227 -227
Adjustment of financial instruments 0 0 85 85
Dividend received 0 -134 134 0
Exchange rate adjustment 0 46 0 46
Tax on changes in equity 0 0 -20 -20
Other movements 0 -2 5 3
Equity at 31 December 2015 250 1,779 23,253 25,282
Equity at 1 January 2014 250 274 22,612 23,136
Profit from affiliates after tax 0 782 0 782
Profit in Parent Company 0 0 762 762
Adjustment of financial instruments 0 0 -167 -167
Dividend received 0 -30 30 0
Exchange rate adjustment 0 23 0 23
Tax on changes in equity 0 0 43 43
Other movements 0 -52 -4 -56
Equity at 31 December 2014 250 997 23,276 24,523
Statement of equity

60 61
Notes – Parent Company Notes – Parent Company
LEO PHARMA A NNUA L REPORT 2015
Notes Parent Company
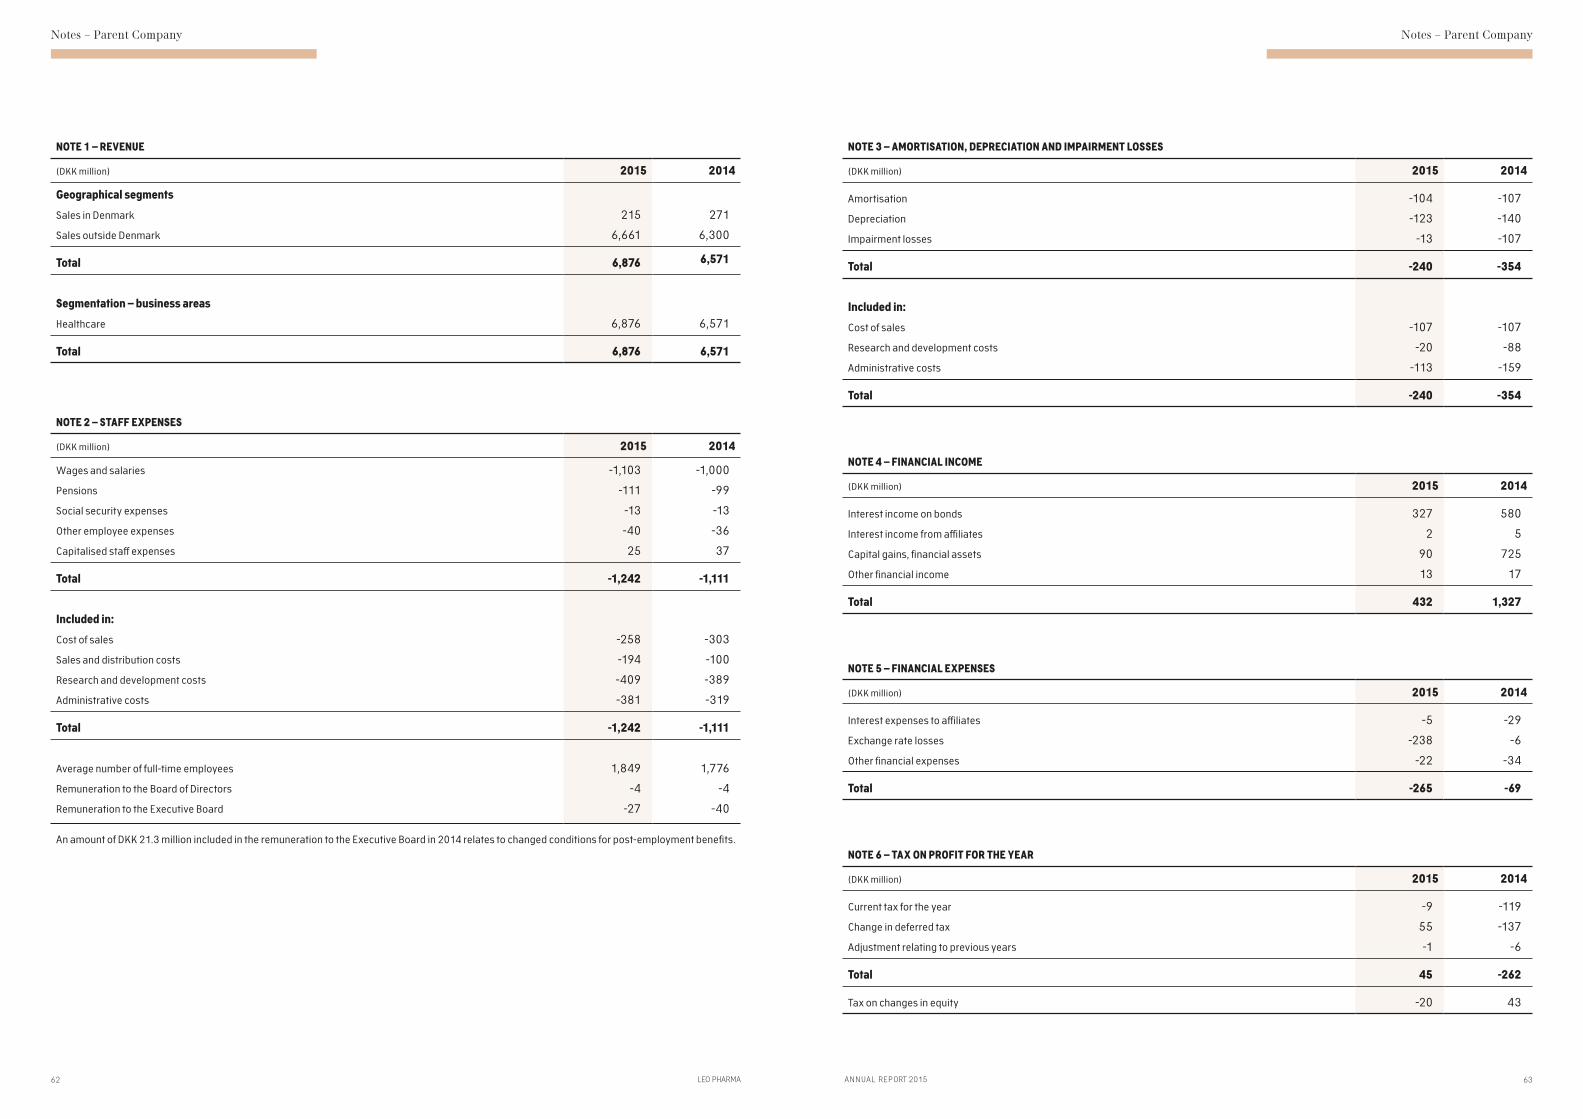
62 63
Notes – Parent Company Notes – Parent Company
LEO PHARMA A NNUA L REPORT 2015
NOTE 1 – REVENUE
(DKK million) 2015 2014
Geographical segments
Sales in Denmark 215 271
Sales outside Denmark 6,661 6,300
Total 6,876 6,571
Segmentation – business areas
Healthcare 6,876 6,571
Total 6,876 6,571
NOTE 2 – STAFF EXPENSES
(DKK million) 2015 2014
Wages and salaries -1,103 -1,000
Pensions -111 -99
Social security expenses -13 -13
Other employee expenses -40 -36
Capitalised staff expenses 25 37
Total -1,242 -1,111
Included in:
Cost of sales -258 -303
Sales and distribution costs -194 -100
Research and development costs -409 -389
Administrative costs -381 -319
Total -1,242 -1,111
Average number of full-time employees 1,849 1,776
Remuneration to the Board of Directors -4 -4
Remuneration to the Executive Board -27 -40
An amount of DKK 21 .3 million included in the remuneration to the Executive Board in 2014 relates to changed conditions for post-employment benefits .
NOTE 3 – AMORTISATION, DEPRECIATION AND IMPAIRMENT LOSSES
(DKK million) 2015 2014
Amortisation -104 -107
Depreciation -123 -140
Impairment losses -13 -107
Total -240 -354
Included in:
Cost of sales -107 -107
Research and development costs -20 -88
Administrative costs -113 -159
Total -240 -354
NOTE 4 – FINANCIAL INCOME
(DKK million) 2015 2014
Interest income on bonds 327 580
Interest income from affiliates 2 5
Capital gains, financial assets 90 725
Other financial income 13 17
Total 432 1,327
NOTE 5 – FINANCIAL EXPENSES
(DKK million) 2015 2014
Interest expenses to affiliates -5 -29
Exchange rate losses -238 -6
Other financial expenses -22 -34
Total -265 -69
NOTE 6 – TAX ON PROFIT FOR THE YEAR
(DKK million) 2015 2014
Current tax for the year -9 -119
Change in deferred tax 55 -137
Adjustment relating to previous years -1 -6
Total 45 -262
Tax on changes in equity -20 43

64 65
Notes – Parent Company Notes – Parent Company
LEO PHARMA A NNUA L REPORT 2015
NOTE 7 – INTANGIBLE ASSETS
(DKK million)
Intellectual
property rights Trademarks
Development
projects Software
Total
intangible assets
Cost at 1 January 2015 5,138 30 130 154 5,452
Additions during the year 0 0 246 0 246
Cost at 31 December 2015 5,138 30 376 154 5,698
Amortisation at 1 January 2015 -4,936 -19 -71 -10 -5,036
Amortisation for the year -61 -6 0 -37 -104
Impairment losses for the year -8 0 -6 0 -14
Amortisation at 31 December 2015 -5,005 -25 -77 -47 -5,154
CARRYING AMOUNT AT 31 DECEMBER 2015 133 5 299 107 544
Cost at 1 January 2014 5,185 30 77 0 5,292
Additions during the year 83 0 54 77 214
Disposals during the year -54 0 0 0 -54
Transfers -76 0 -1 77 0
Cost at 31 December 2014 5,138 30 130 154 5,452
Amortisation at 1 January 2014 -4,810 -12 0 0 -4,822
Amortisation for the year -90 -7 0 -10 -107
Impairment losses for the year -36 0 -71 0 -107
Amortisation at 31 December 2014 -4,936 -19 -71 -10 -5,036
CARRYING AMOUNT AT 31 DECEMBER 2014 202 11 59 144 416
Development projects amounted to DKK 299 million (2014: DKK 59 million), of which development projects in progress represented DKK 299 million (2014: DKK 53 million) .
NOTE 8 – PROPERTY, PLANT AND EQUIPMENT
(DKK million)
Land and
buildings
Leasehold
improvements
Plant and
machinery
Other fixtures
and fittings,
tools and
equipment
Fixed assets
under
construction
Total property,
plant and
equipment
Cost at 1 January 2015 1,053 3 1,136 404 122 2,718
Additions during the year 3 1 9 9 92 114
Disposals during the year -2 0 -6 -31 0 -39
Transfers 2 0 51 2 -55 0
Cost at 31 December 2015 1,056 4 1,190 384 159 2,793
Depreciation and impairment losses at 1 January 2015 -589 0 -890 -337 0 -1,816
Disposals during the year 0 0 7 30 0 37
Depreciation for the year -52 -1 -50 -19 0 -122
Depreciation and impairment losses at 31 December 2015 -641 -1 -933 -326 0 -1,901
CARRYING AMOUNT AT 31 DECEMBER 2015 415 3 257 58 159 892
Cost at 1 January 2014 1,052 0 1,134 402 79 2,667
Reclassification of company to affiliate 0 1 0 0 0 1
Additions during the year 0 2 0 7 72 81
Disposals during the year 0 0 -10 -18 -3 -31
Transfers 1 0 12 13 -26 0
Cost at 31 December 2014 1,053 3 1,136 404 122 2,718
Depreciation and impairment losses at 1 January 2014 -537 0 -834 -329 0 -1,700
Disposals during the year 0 0 9 15 0 24
Depreciation for the year -52 0 -65 -23 0 -140
Depreciation and impairment losses at 31 December 2014 -589 0 -890 -337 0 -1,816
CARRYING AMOUNT AT 31 DECEMBER 2014 464 3 246 67 122 902

66 67
Notes – Parent Company Notes – Parent Company
LEO PHARMA A NNUA L REPORT 2015
NOTE 9 – INVESTMENTS IN AFFILIATES
(DKK million) 2015 2014
Cost at 1 January 3,313 3,313
Additions 2 0
Disposals -75 0
Cost at 31 December 3,240 3,313
Value adjustment at 1 January 997 274
Share of profit/loss for the year 872 782
Dividend -134 -30
Exchange rate adjustment 46 23
Other adjustments -2 -52
Value adjustment at 31 December 1,779 997
CARRYING AMOUNT AT 31 DECEMBER 5,019 4,310
NOTE 10 – OTHER SECURITIES
(DKK million) 2015 2014
Cost at 1 January 13,986 18,935
Additions during the year 1,702 7,434
Disposals during the year -4,132 -12,383
Cost at 31 December 11,556 13,986
Value adjustment at 1 January 2 16
Value adjustment for the year -23 -12
Value adjustment on disposals for the year -16 -2
Value adjustment at 31 December -37 2
CARRYING AMOUNT AT 31 DECEMBER 11,519 13,988
Market value at 31 December 11,576 14,346
NOTE 11 – DEFERRED TAX ASSETS
(DKK million) 2015 2014
Deferred tax assets at 1 January 124 222
Adjustments relating to previous years -3 23
Deferred tax on equity -16 16
Deferred tax on profit for the year 55 -137
Deferred tax assets at 31 December 160 124
The deferred tax relates to current assets, licences, fixed assets and losses relating to previously jointly taxed foreign affiliates, intercompany profits, indirect production costs, etc .
NOTE 12 – OTHER PROVISIONS
(DKK million) 2015 2014
Staff-related provisions 29 30
Other provisions 15 16
Total 44 46
NOTE 13 – OTHER NOTES
For Share capital, please refer to note 11 in the Consolidated Financial Statements.
For Contingencies, please refer to note 16 in the Consolidated Financial Statements.
For Financial instruments, please refer to note 17 in the Consolidated Financial Statements.
For Related parties, please refer to note 18 in the Consolidated Financial Statements.

68
Notes – Parent Company
LEO PHARMA 69
Notes – Parent Company
A NNUA L REPORT 2015
PARENT COMPANY FINANCIAL STATEMENTS
NOTE 14 – ACCOUNTING POLICIES
The Financial Statements of the Parent Company, LEO Pharma A/S, for 2015 have been prepared in accordance with the provisions of the Danish Financial Statements Act applying to large enterprises of reporting class C.
LEO Pharma has decided to change the presentation of the income statement from 'by nature' to 'by function'. Consequently, comparative figures in the income statement have been restated. The change relates only to presentation of the income statement and has no impact on either result for the year or the balance sheet.
The accounting policies applied are unchanged from last year and are the same as for the consolidated financial statements with the following additions. For a description of the accounting policies of the Group, please refer to the Consolidated Financial Statements on page 46. CASH FLOW STATEMENTNo separate cash flow statement has been prepared for the Parent Company as per the exemption clause of section 86(4) of the Danish Financial Statements Act.
TAXThe Parent Company is jointly taxed with all Danish affiliates.
The jointly taxed Danish affiliates settle the tax with the Parent Company. The current Danish tax is allocated between the jointly taxed companies in proportion to their taxable income.
INVESTMENTS IN AFFILIATESInvestments in affiliates are measured under the equity method. This means that the affiliates are measured in the balance sheet at the proportionate share of their net asset value, with deduction or addition of unrealised intercompany profits or losses, and with addition of any remaining value of positive differences (goodwill) and deduction of any remaining value of negative differences (negative goodwill). The Parent Company’s share of the affiliates’ profit for the year is recognised in the income statement less unrealised intercompany profits.
The total net revaluation of investments in affiliates is transferred upon distribution of profit to 'Reserve for net revaluation under the equity method' under equity. The reserve is reduced by dividends distributed to the Parent Company and adjusted for other equity movements in affiliates.
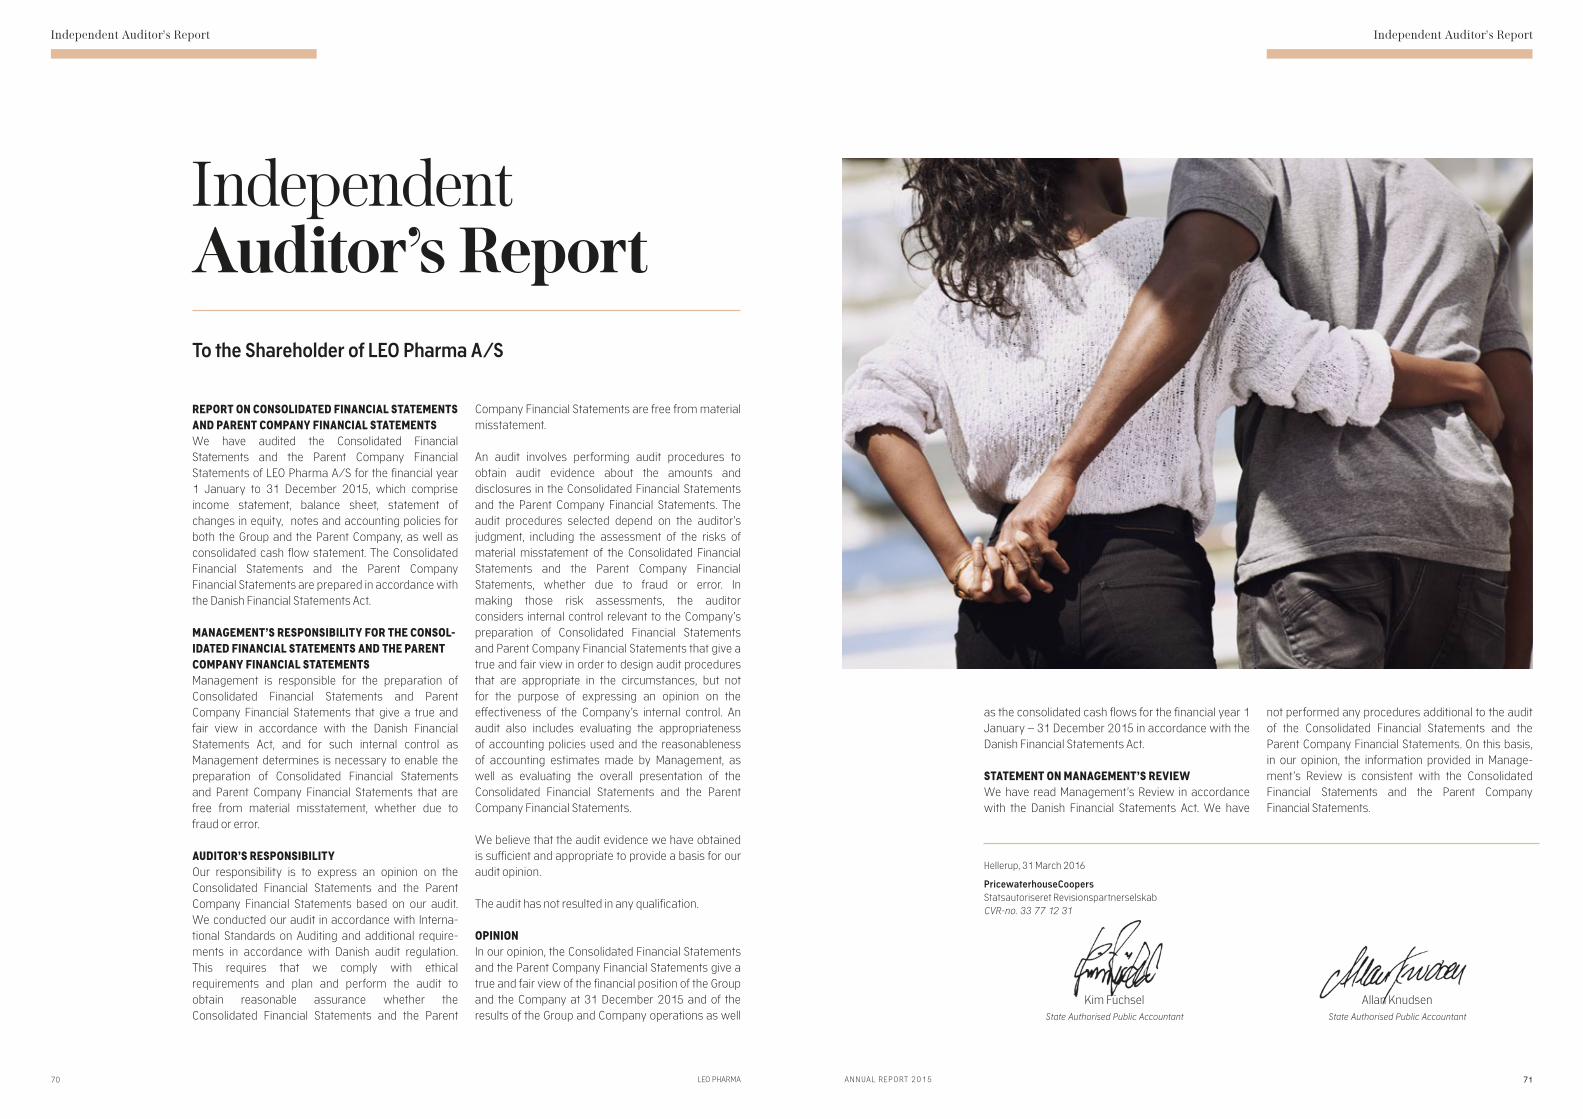
Independent Auditor’s Report Independent Auditor’s Report
70 LEO PHARMA A NNUA L REPO RT 2 0 1 5 7171
Allan Knudsen State Authorised Public Accountant
Kim Füchsel State Authorised Public Accountant
Independent Auditor’s ReportTo the Shareholder of LEO Pharma A/S
REPORT ON CONSOLIDATED FINANCIAL STATEMENTS AND PARENT COMPANY FINANCIAL STATEMENTSWe have audited the Consolidated Financial Statements and the Parent Company Financial Statements of LEO Pharma A/S for the financial year 1 January to 31 December 2015, which comprise income statement, balance sheet, statement of changes in equity, notes and accounting policies for both the Group and the Parent Company, as well as consolidated cash flow statement. The Consolidated Financial Statements and the Parent Company Financial Statements are prepared in accordance with the Danish Financial Statements Act.
MANAGEMENT’S RESPONSIBILITY FOR THE CONSOL-IDATED FINANCIAL STATEMENTS AND THE PARENT COMPANY FINANCIAL STATEMENTSManagement is responsible for the preparation of Consolidated Financial Statements and Parent Company Financial Statements that give a true and fair view in accordance with the Danish Financial Statements Act, and for such internal control as Management determines is necessary to enable the preparation of Consolidated Financial Statements and Parent Company Financial Statements that are free from material misstatement, whether due to fraud or error.
AUDITOR’S RESPONSIBILITY Our responsibility is to express an opinion on the Consolidated Financial Statements and the Parent Company Financial Statements based on our audit. We conducted our audit in accordance with Interna-tional Standards on Auditing and additional require-ments in accordance with Danish audit regulation. This requires that we comply with ethical requirements and plan and perform the audit to obtain reasonable assurance whether the Consolidated Financial Statements and the Parent
Company Financial Statements are free from material misstatement.
An audit involves performing audit procedures to obtain audit evidence about the amounts and disclosures in the Consolidated Financial Statements and the Parent Company Financial Statements. The audit procedures selected depend on the auditor’s judgment, including the assessment of the risks of material misstatement of the Consolidated Financial Statements and the Parent Company Financial Statements, whether due to fraud or error. In making those risk assessments, the auditor considers internal control relevant to the Company’s preparation of Consolidated Financial Statements and Parent Company Financial Statements that give a true and fair view in order to design audit procedures that are appropriate in the circumstances, but not for the purpose of expressing an opinion on the effectiveness of the Company’s internal control. An audit also includes evaluating the appropriateness of accounting policies used and the reasonableness of accounting estimates made by Management, as well as evaluating the overall presentation of the Consolidated Financial Statements and the Parent Company Financial Statements.
We believe that the audit evidence we have obtained is sufficient and appropriate to provide a basis for our audit opinion.
The audit has not resulted in any qualification.
OPINION In our opinion, the Consolidated Financial Statements and the Parent Company Financial Statements give a true and fair view of the financial position of the Group and the Company at 31 December 2015 and of the results of the Group and Company operations as well
as the consolidated cash flows for the financial year 1 January – 31 December 2015 in accordance with the Danish Financial Statements Act.
STATEMENT ON MANAGEMENT’S REVIEW We have read Management’s Review in accordance with the Danish Financial Statements Act. We have
not performed any procedures additional to the audit of the Consolidated Financial Statements and the Parent Company Financial Statements. On this basis, in our opinion, the information provided in Manage-ment’s Review is consistent with the Consolidated Financial Statements and the Parent Company Financial Statements.
Hellerup, 31 March 2016 PricewaterhouseCoopers Statsautoriseret Revisionspartnerselskab CVR-no. 33 77 12 31

The LEO wordmark and the LEO logo are registered trademarks of LEO Pharma A/S© March/2016 LEO Pharma A/S
Phone +45 4494 5888CVR no . 56759514www .leo-pharma .com
LEO Pharma A/SIndustriparken 552750 BallerupDenmark