annual report guidance notes version 6 31st … · annual report guidance notes version 6 ... the...
TRANSCRIPT
0
PLANNING PERFORMANCE FRAMEWORK
ANNUAL REPORT GUIDANCE NOTES
VERSION 6
31st March 2017
1
INTRODUCTION The Planning Performance Framework is entering its sixth reporting year in a strong position,
largely due to the commitment to continuous improvement and high quality reporting
shown by authorities. Heads of Planning Scotland remains committed to the effective use of
the framework in the drive towards consistently high quality planning services across the
country.
The PPF has been designed to be flexible and to evolve as experience grows. The updates
incorporated into this guidance and the 2016/17 template are from feedback from the HOPS
peer review partnerships held in November 2016 and the PPF workshops held in March
2017. Please note that while it is recommended to use the template in Section 2 to compile
the report it is not mandatory. Authorities may deviate from the template if they feel that it
is appropriate.
The most significant changes in 2017 are:
The addition of a timetable for key dates in the process
Layout of the document, statistics have been moved to Section 4 (National Headline Indicators) and Section 5 (Official Statistics) to improve the reading of the document
The addition and removal of some national headline indicators
Methods of recording some of the development management national headline indicators
The guidance provided in Section 3 covers the PPF report and Performance Markers. These
markers were agreed in 2013 through the Ministerial High Level Group on Performance and
it is essential that your PPF report provides the information needed by the Scottish
Government to consider your performance against the markers. This is your opportunity to
provide the evidence and explanations in support of the performance story illustrated by the
statistics. The text box at in Part 4 and Part 5 of Section 3 are available for presenting this
evidence.
HoPS is supporting performance improvement through benchmarking, particularly in terms
of the four elements of high quality planning services set out in Part 1, this is a change from
the previous eight elements, as HOPS and the Scottish Government decided that several of
the markers could be consolidated to remove repetition. Authorities are encouraged to work
within their SOLACE Benchmarking Family1 and to refer to this work and associated
outcomes in their PPF report. Members are encouraged to use the Heads of Planning
Scotland Members Knowledge Hub Group for discussion and collaboration.
1 Family 1 – Eilean Siar, Argyll & Bute, Shetland Islands, Highland, Orkney Islands, Dumfries &
Galloway, Aberdeenshire, Scottish Borders (Cairngorms NPA are also part of this group)
Family 2 – Perth & Kinross, Stirling, Moray, South Ayrshire, East Ayrshire, North Ayrshire, East
Lothian, Fife (Loch Lomond & Trossachs NPA are also part of this group)
Family 3 – Angus, Clackmannanshire, Midlothian, South Lanarkshire, Inverclyde, Renfrewshire, West
Lothian, East Renfrewshire
Family 4 – North Lanarkshire, Falkirk, East Dunbartonshire, Aberdeen City, City of Edinburgh, West
Dunbartonshire, Dundee City, Glasgow City

2
The PPF document can be used as promotional tool or an audit document or both. It is
encouraged that local authority leadership is consulted to get a steer on how they envisage
the PPF to be used. Many authorities take their PPF report to committee. HOPS recommend
the report is taken to committee after feedback has been provided by the Scottish
Government.
If you have any comments on the Planning Performance Framework or the guidance, or
would like information about how to access the Knowledge Hub, please email
3
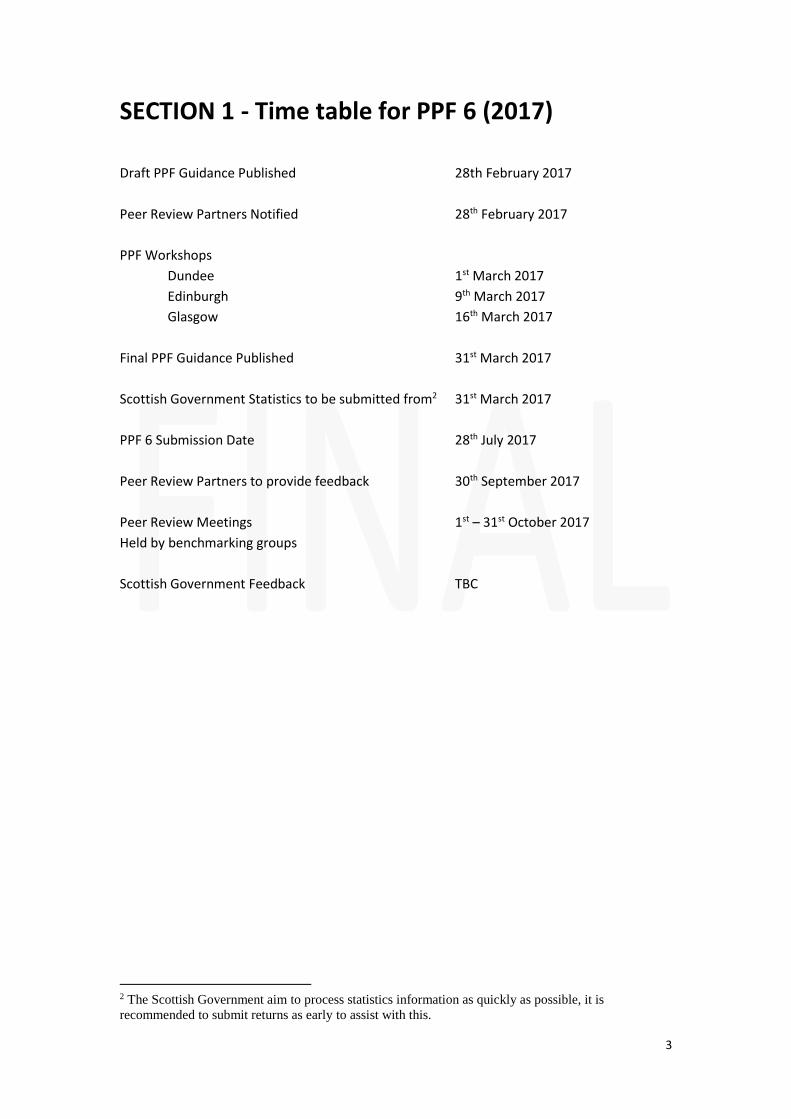
SECTION 1 - Time table for PPF 6 (2017) Draft PPF Guidance Published 28th February 2017
Peer Review Partners Notified 28th February 2017
PPF Workshops
Dundee 1st March 2017
Edinburgh 9th March 2017
Glasgow 16th March 2017
Final PPF Guidance Published 31st March 2017
Scottish Government Statistics to be submitted from2 31st March 2017
PPF 6 Submission Date 28th July 2017
Peer Review Partners to provide feedback 30th September 2017
Peer Review Meetings 1st – 31st October 2017
Held by benchmarking groups
Scottish Government Feedback TBC
2 The Scottish Government aim to process statistics information as quickly as possible, it is
recommended to submit returns as early to assist with this.

4
SECTION 2 – Annual Report Template
PLANNING PERFORMANCE FRAMEWORK [insert authority logo here]
ANNUAL REPORT 2016-17
5
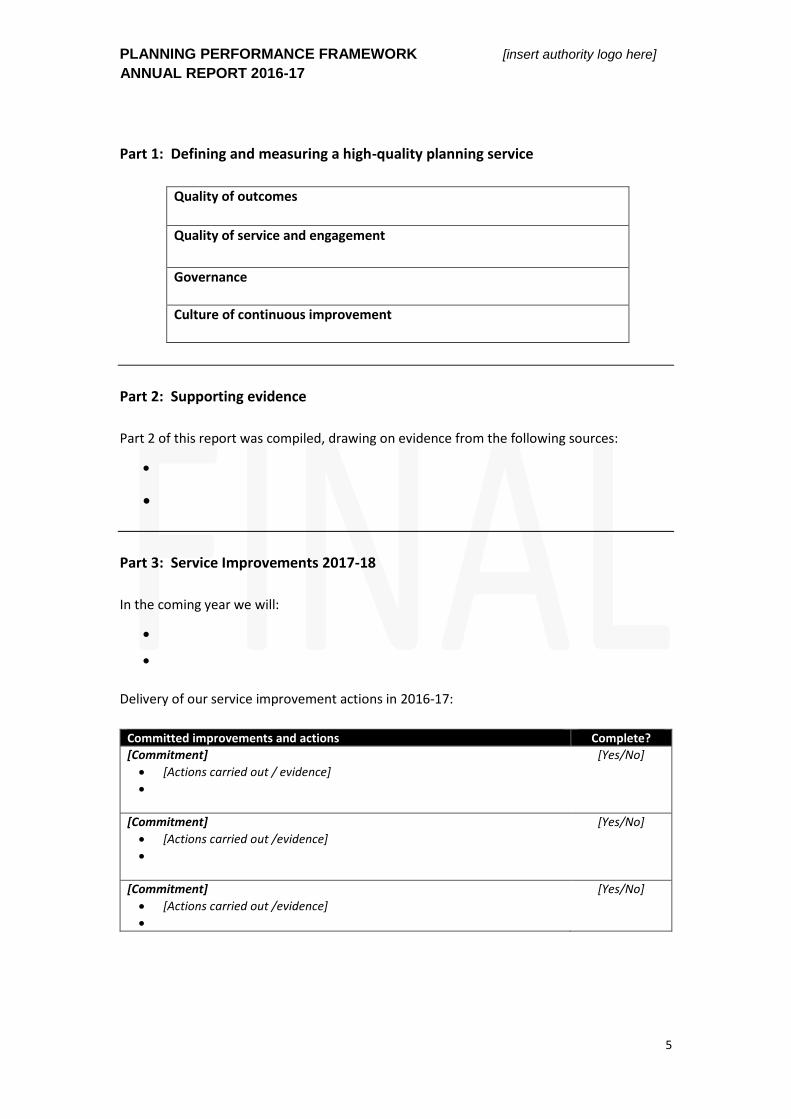
Part 1: Defining and measuring a high-quality planning service
Quality of outcomes
Quality of service and engagement
Governance
Culture of continuous improvement
Part 2: Supporting evidence
Part 2 of this report was compiled, drawing on evidence from the following sources:
Part 3: Service Improvements 2017-18
In the coming year we will:
Delivery of our service improvement actions in 2016-17:
Committed improvements and actions Complete?
[Commitment]
[Actions carried out / evidence]
[Yes/No]
[Commitment]
[Actions carried out /evidence]
[Yes/No]
[Commitment]
[Actions carried out /evidence]
[Yes/No]
6
PLANNING PERFORMANCE FRAMEWORK
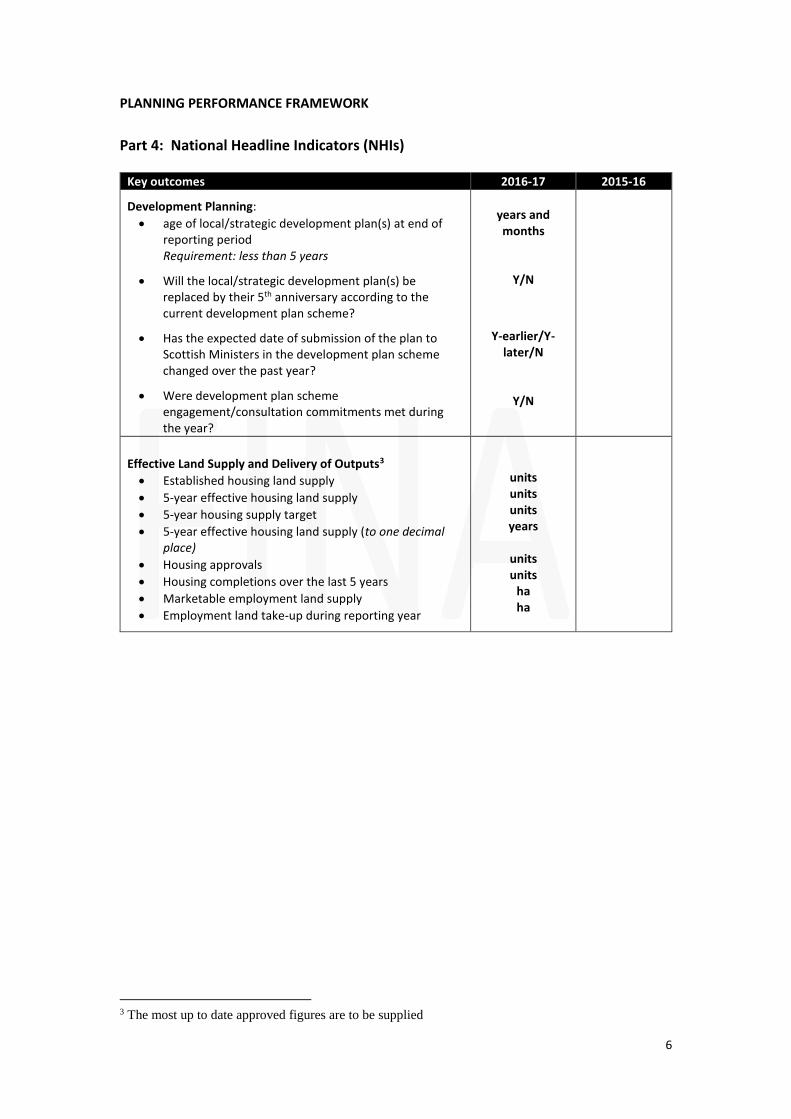
Part 4: National Headline Indicators (NHIs)
Key outcomes 2016-17 2015-16
Development Planning:
age of local/strategic development plan(s) at end of reporting period Requirement: less than 5 years
Will the local/strategic development plan(s) be replaced by their 5th anniversary according to the current development plan scheme?
Has the expected date of submission of the plan to Scottish Ministers in the development plan scheme changed over the past year?
Were development plan scheme engagement/consultation commitments met during the year?
years and months
Y/N
Y-earlier/Y-
later/N
Y/N
Effective Land Supply and Delivery of Outputs3
Established housing land supply
5-year effective housing land supply
5-year housing supply target
5-year effective housing land supply (to one decimal place)
Housing approvals
Housing completions over the last 5 years
Marketable employment land supply
Employment land take-up during reporting year
units units units years
units units
ha ha
3 The most up to date approved figures are to be supplied
7
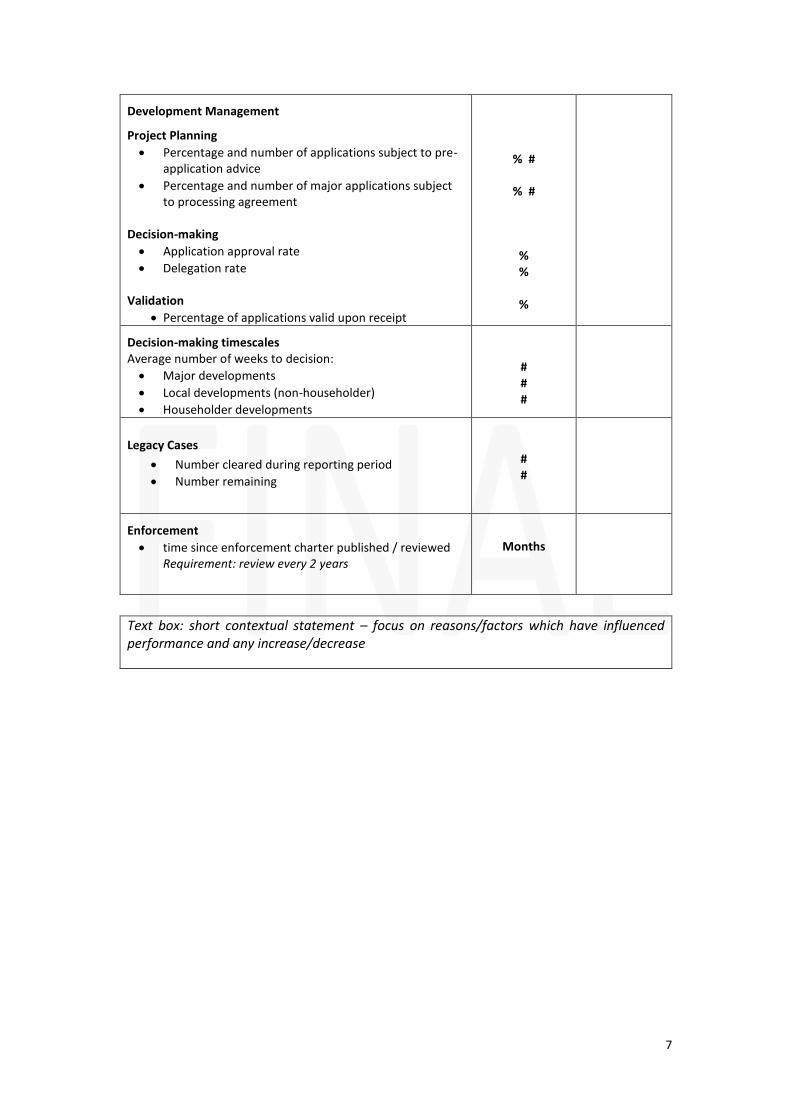
Development Management
Project Planning
Percentage and number of applications subject to pre-application advice
Percentage and number of major applications subject to processing agreement
Decision-making
Application approval rate
Delegation rate Validation
Percentage of applications valid upon receipt
% #
% #
% %
%
Decision-making timescales Average number of weeks to decision:
Major developments
Local developments (non-householder)
Householder developments
# # #
Legacy Cases
Number cleared during reporting period
Number remaining
# #
Enforcement
time since enforcement charter published / reviewed Requirement: review every 2 years
Months
Text box: short contextual statement – focus on reasons/factors which have influenced performance and any increase/decrease
8
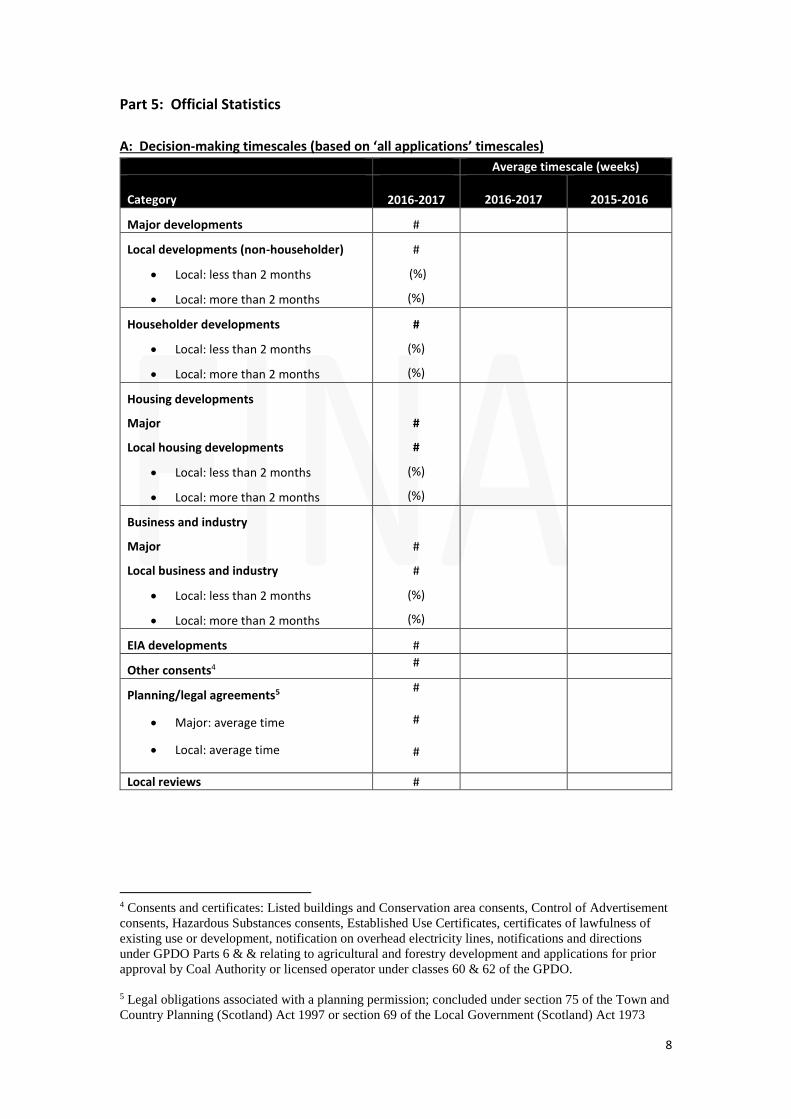
Part 5: Official Statistics
A: Decision-making timescales (based on ‘all applications’ timescales)
Average timescale (weeks)
Category
2016-2017 2016-2017 2015-2016
Major developments #
Local developments (non-householder)
Local: less than 2 months
Local: more than 2 months
#
(%)
(%)
Householder developments
Local: less than 2 months
Local: more than 2 months
#
(%)
(%)
Housing developments
Major
Local housing developments
Local: less than 2 months
Local: more than 2 months
#
#
(%)
(%)
Business and industry
Major
Local business and industry
Local: less than 2 months
Local: more than 2 months
#
#
(%)
(%)
EIA developments #
Other consents4 #
Planning/legal agreements5
Major: average time
Local: average time
#
#
#
Local reviews #
4 Consents and certificates: Listed buildings and Conservation area consents, Control of Advertisement
consents, Hazardous Substances consents, Established Use Certificates, certificates of lawfulness of
existing use or development, notification on overhead electricity lines, notifications and directions
under GPDO Parts 6 & & relating to agricultural and forestry development and applications for prior
approval by Coal Authority or licensed operator under classes 60 & 62 of the GPDO.
5 Legal obligations associated with a planning permission; concluded under section 75 of the Town and
Country Planning (Scotland) Act 1997 or section 69 of the Local Government (Scotland) Act 1973
9
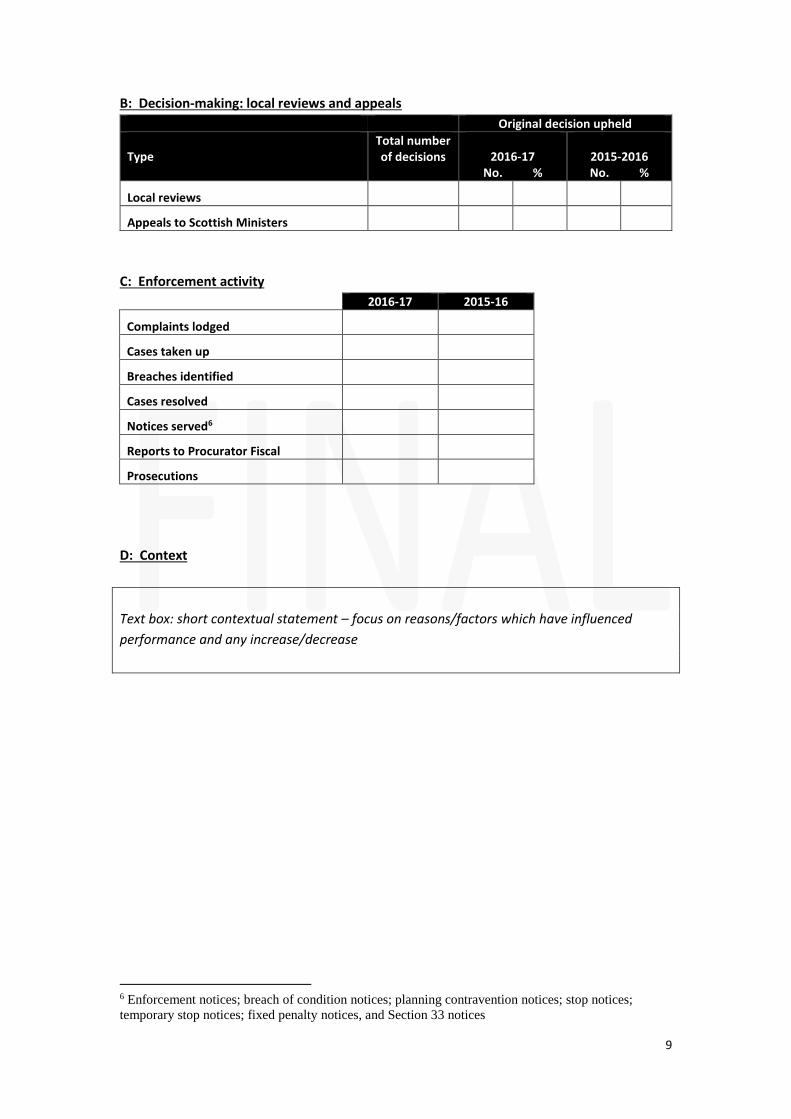
B: Decision-making: local reviews and appeals
Original decision upheld
Type Total number of decisions 2016-17
No. % 2015-2016 No. %
Local reviews
Appeals to Scottish Ministers
C: Enforcement activity
2016-17 2015-16
Complaints lodged
Cases taken up
Breaches identified
Cases resolved
Notices served6
Reports to Procurator Fiscal
Prosecutions
D: Context
Text box: short contextual statement – focus on reasons/factors which have influenced
performance and any increase/decrease
6 Enforcement notices; breach of condition notices; planning contravention notices; stop notices;
temporary stop notices; fixed penalty notices, and Section 33 notices
10
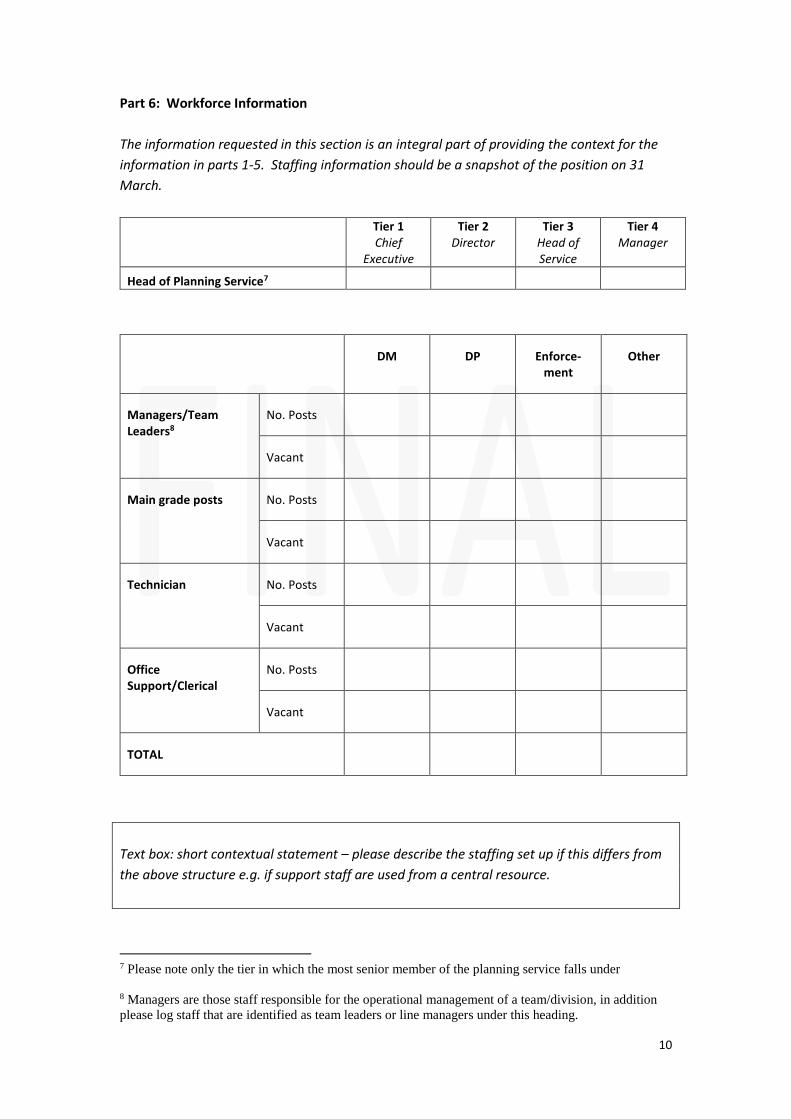
Part 6: Workforce Information
The information requested in this section is an integral part of providing the context for the
information in parts 1-5. Staffing information should be a snapshot of the position on 31
March.
Tier 1 Chief
Executive
Tier 2 Director
Tier 3 Head of Service
Tier 4 Manager
Head of Planning Service7
DM DP Enforce-ment
Other
Managers/Team Leaders8
No. Posts
Vacant
Main grade posts No. Posts
Vacant
Technician No. Posts
Vacant
Office Support/Clerical
No. Posts
Vacant
TOTAL
Text box: short contextual statement – please describe the staffing set up if this differs from
the above structure e.g. if support staff are used from a central resource.
7 Please note only the tier in which the most senior member of the planning service falls under
8 Managers are those staff responsible for the operational management of a team/division, in addition
please log staff that are identified as team leaders or line managers under this heading.
11
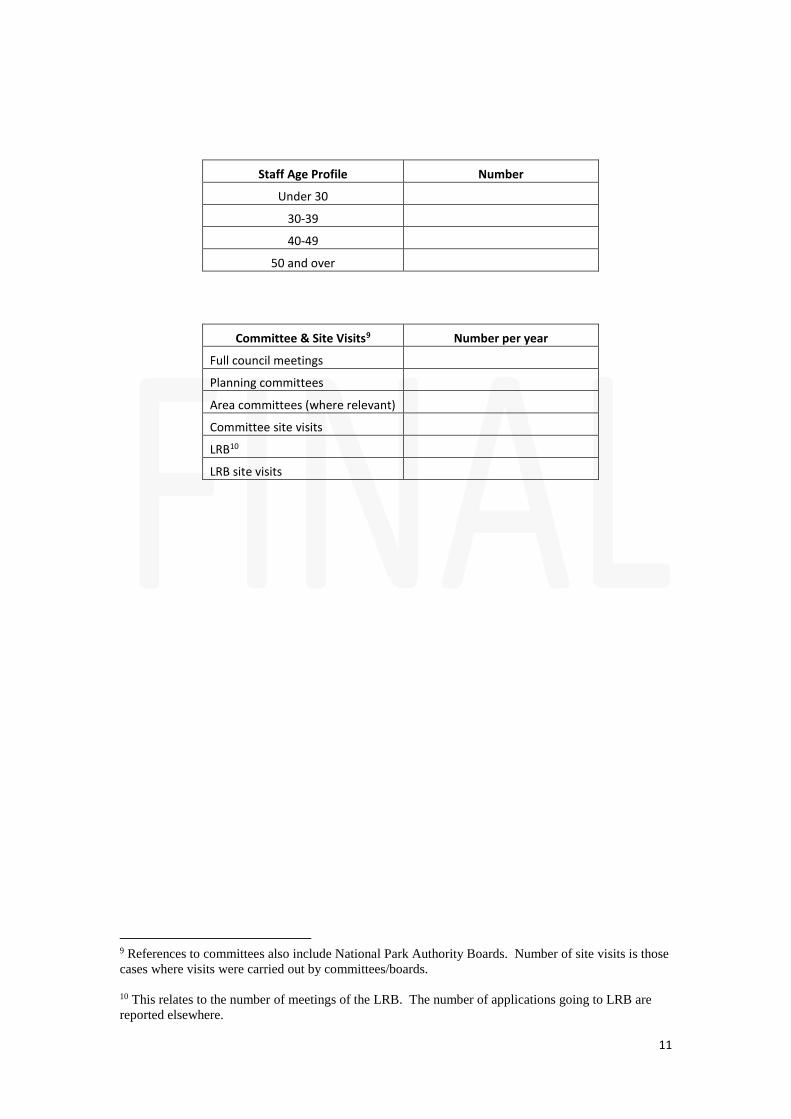
Staff Age Profile Number
Under 30
30-39
40-49
50 and over
Committee & Site Visits9 Number per year
Full council meetings
Planning committees
Area committees (where relevant)
Committee site visits
LRB10
LRB site visits
9 References to committees also include National Park Authority Boards. Number of site visits is those
cases where visits were carried out by committees/boards.
10 This relates to the number of meetings of the LRB. The number of applications going to LRB are
reported elsewhere.

12
SECTION 3 – Guidance Notes
13
Submission of the Report to the Scottish Government
Your annual PPF Report must be submitted to the Scottish Government planning mailbox at: [email protected]
The deadline for submission of reports is Friday the 28th July 2017
The decision to put your report to committee is for each authority to consider however the timing of this should not mean your report is late in being submitted.
What makes an excellent planning performance framework?
Clarity on Why
1. Political support and buy-in to the achievements of the Planning Service by obtaining
Committee approval and discussion, including the sharing of the Scottish Government’s
feedback comments and RAG markings.
How?
2. Effective leadership and buy in from senior management, a project management
approach to preparation and staff inclusive participation.
3. Relevant staff with a knowledge and understanding of other PPFs with an emphasis on
how they showcase continuous improvements and what their particular aspects of best
practice are for adoption.
4. A coherent report structure which presents the “journey of improvement” undertaken by
the local planning authority over the last 5 years.
5. A PPF which is concise, well presented, easy to read with proportionate and appropriate
use of tables, graphs, photographs and case studies which is submitted on time. Selective
and relevant use of case studies to evidence achievements made and improvements
introduced by the Planning Service.
6. The PPF format identifies a clear target audience with different and customised versions
of the PPF for different stakeholder groups e.g. Community Councils, Developers etc.
Post PPF Preparation
7. Participation in and using feedback from HOPS peer review meetings and benchmarking
group discussions to enhance and inform your next PPF.
8. PPF links in to the wider corporate processes and performance management initiatives
across the Council.
9. Wider use of the PPF to assist in Team development days or staff training e.g. a visit to
another LPA to check out their case studies on site.
14
Part 1: Defining and measuring a high-quality planning service
PPF Report Structure
The measures in this section have been reduced in number to allow more concise reports.
The peer review exercise carried out for the 2014-15 PPF reports through benchmarking
groups in autumn 2015 produced recommendations to simplify this part of the reports.
The former 8 sub-headings are now combined into 4 sub-headings.
1. Quality of outcomes – to include the previous headings:
a. High quality development on the ground
2. Quality of service and engagement – to include the previous headings:
a. Open for business
b. Certainty
c. Communications, engagement and customer service
3. Governance – to include the previous headings:
a. Efficient and effective decision-making
b. Effective management structures
c. Financial management and local governance
4. Culture of continuous improvement – this should focus on improvements and
changes since the last PPF report.
This is not a prescribed format for every PPF report but rather a guide to key areas of
evidence expected to be included in the report. Some consistency in format is useful to
assist the assessment of performance and benchmarking activity.
General guidance
Part 1 of the PPF report is where the qualitative evidence of performance should be
provided. A good PPF will tell the story of your service’s performance in the past year by:
being concise and focused – use lots of hyperlinks and references but keep the
explanation short. Ensure that the narrative explains which measure of a quality
planning service that you are addressing. Where relevant, link this to the key
markers of performance.
thinking about your audience – the PPF reports are now more directed towards a
range of local stakeholders than as an audit report for Scottish Government scrutiny.
It should read like an annual report. Ask for feedback from stakeholders and include
quotations.
using lots of case studies – these assist stakeholders’ understanding of a quality
service and provide a rich resource for identifying good practice through
benchmarking with partners. Use a case study to evidence different measures of
performance by cross referencing rather than by repetition.
15
showing the journey of improvement – link back to the targets you set for the year
and forwards to your next year targets. Be prepared to be honest and critical,
identifying areas where you can do better and address these in your service
improvement plan for the year ahead (Part 4 of the PPF).
Sub-headings
These are not prescribed lists. They are suggestions of performance evidence which have
been drawn from benchmarking comparisons. They represent examples of possible areas
which may be covered in each section but there may be other factors of performance that
you consider are more appropriate to report under each of the sub-headings for your
specific area.
Quality of outcomes
The focus is on demonstrating the added value delivered by planning. Consider examples to
illustrate performance, such as:
in the context of the development plan, use case studies to show how planning
policies and guidance have delivered high quality development on the ground
the role of urban design panels, local award schemes, feedback from independent
sources.
local environmental improvements, regeneration and town centres activities and
enhancements.
Quality of service and engagement
Evidence under this subheading should demonstrate the planning service’s positive actions
to support sustainable economic growth, initiatives to work consistently with stakeholders
and deliver a positive customer experience, such as:
evidence of success from development plan action programmes, pre-application
processes, policy in practice
protocols and relationship management to ensure reliability of advice and working
timescales with stakeholders
clear project management for development planning
communications strategy with customer service charters, customer surveys and
local forums
Governance
Performance measures under this subheading should illustrate how structures and
processes are proportionate, effective and fit for purpose, such as:
alignment of staffing resource, procurement and innovative working practices to
address priorities
strong collaboration between services, corporate working processes, shared services
or joint working arrangements
training of officers and members to support corporate working,
16
use of lean processes to deliver efficiencies
feedback from stakeholders about outcomes from ways of working.
Culture of continuous improvement
Demonstrating a culture of continuous improvement should focus on how the past 12
months’ builds on evidence in the previous PPF and:
addresses the areas set out in the service improvement plan.
evidences ongoing training of staff, management and members in priority areas
clear vision and programme as basis for service improvements.
Part 2: Supporting evidence
Explain (briefly) what information the authority has drawn on in compiling this report, such
as:
what customer input there has been which has influenced the report and/or authority actions;
whether there has been any audit or management/process reviews, and the relevant findings;
partnership work with others;
formal and informal benchmarking;
other Council reports and initiatives;
Include hyperlinks in the Supporting Evidence section and in the body of the main report,
where possible.
Part 3: Service improvements
Service improvements in the coming year
Keep the focus on improvement activity rather than carrying out core/routine work or tasks
Be clear about Service Improvement actions and their purpose - there should be a flow of information through the report from problem to solution.
Aim to ensure that Service Improvement Commitments are SMART (Specific, Measurable, Achievable, Relevant and Time-Related).
State key commitments and actions for future service improvements, drawing on the results
and findings from sections 1-2 and Appendix I. There is no maximum or minimum number
of commitments to be made here – but it might be best to have a small number, focused on
specific and practical service improvements.
Delivery of service improvement actions committed in previous year
Based on the service improvement plan from the previous year, report on the commitments
made and the specific actions carried out in relation to each commitment, including any
evidence of the results of those actions.
17
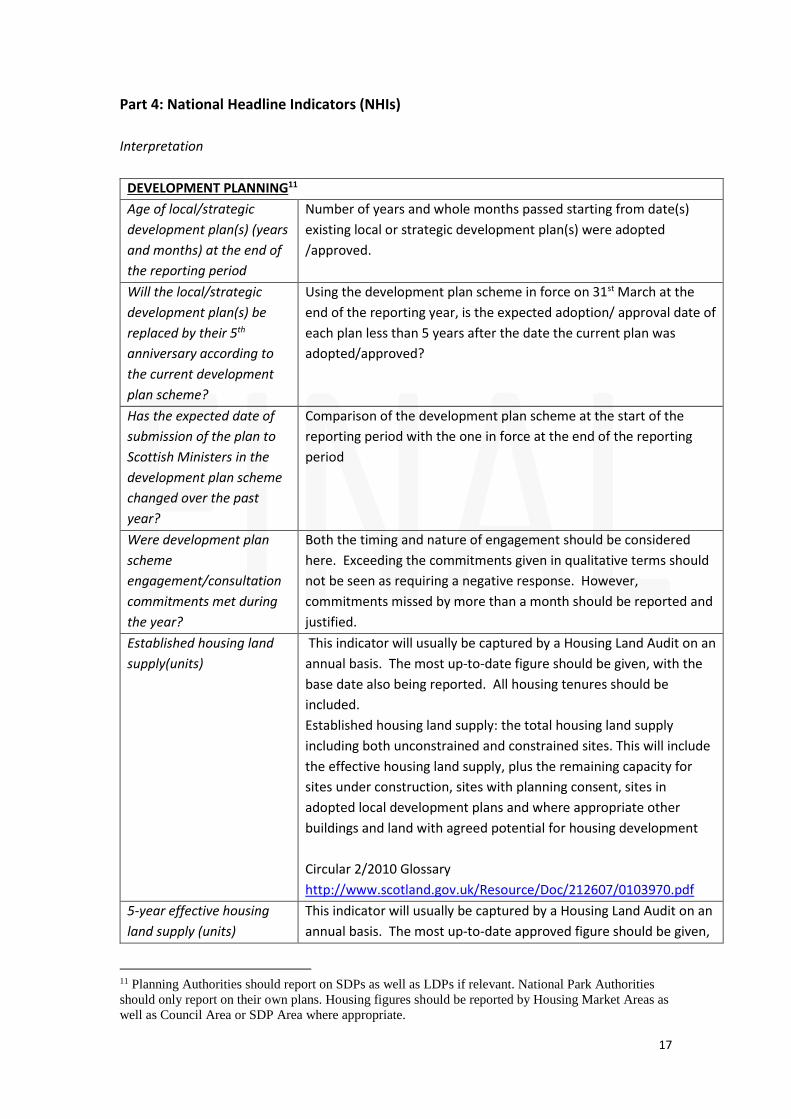
Part 4: National Headline Indicators (NHIs)
Interpretation
DEVELOPMENT PLANNING11
Age of local/strategic
development plan(s) (years
and months) at the end of
the reporting period
Number of years and whole months passed starting from date(s)
existing local or strategic development plan(s) were adopted
/approved.
Will the local/strategic
development plan(s) be
replaced by their 5th
anniversary according to
the current development
plan scheme?
Using the development plan scheme in force on 31st March at the
end of the reporting year, is the expected adoption/ approval date of
each plan less than 5 years after the date the current plan was
adopted/approved?
Has the expected date of
submission of the plan to
Scottish Ministers in the
development plan scheme
changed over the past
year?
Comparison of the development plan scheme at the start of the
reporting period with the one in force at the end of the reporting
period
Were development plan
scheme
engagement/consultation
commitments met during
the year?
Both the timing and nature of engagement should be considered
here. Exceeding the commitments given in qualitative terms should
not be seen as requiring a negative response. However,
commitments missed by more than a month should be reported and
justified.
Established housing land
supply(units)
This indicator will usually be captured by a Housing Land Audit on an
annual basis. The most up-to-date figure should be given, with the
base date also being reported. All housing tenures should be
included.
Established housing land supply: the total housing land supply
including both unconstrained and constrained sites. This will include
the effective housing land supply, plus the remaining capacity for
sites under construction, sites with planning consent, sites in
adopted local development plans and where appropriate other
buildings and land with agreed potential for housing development
Circular 2/2010 Glossary
http://www.scotland.gov.uk/Resource/Doc/212607/0103970.pdf
5-year effective housing
land supply (units)
This indicator will usually be captured by a Housing Land Audit on an
annual basis. The most up-to-date approved figure should be given,
11 Planning Authorities should report on SDPs as well as LDPs if relevant. National Park Authorities
should only report on their own plans. Housing figures should be reported by Housing Market Areas as
well as Council Area or SDP Area where appropriate.
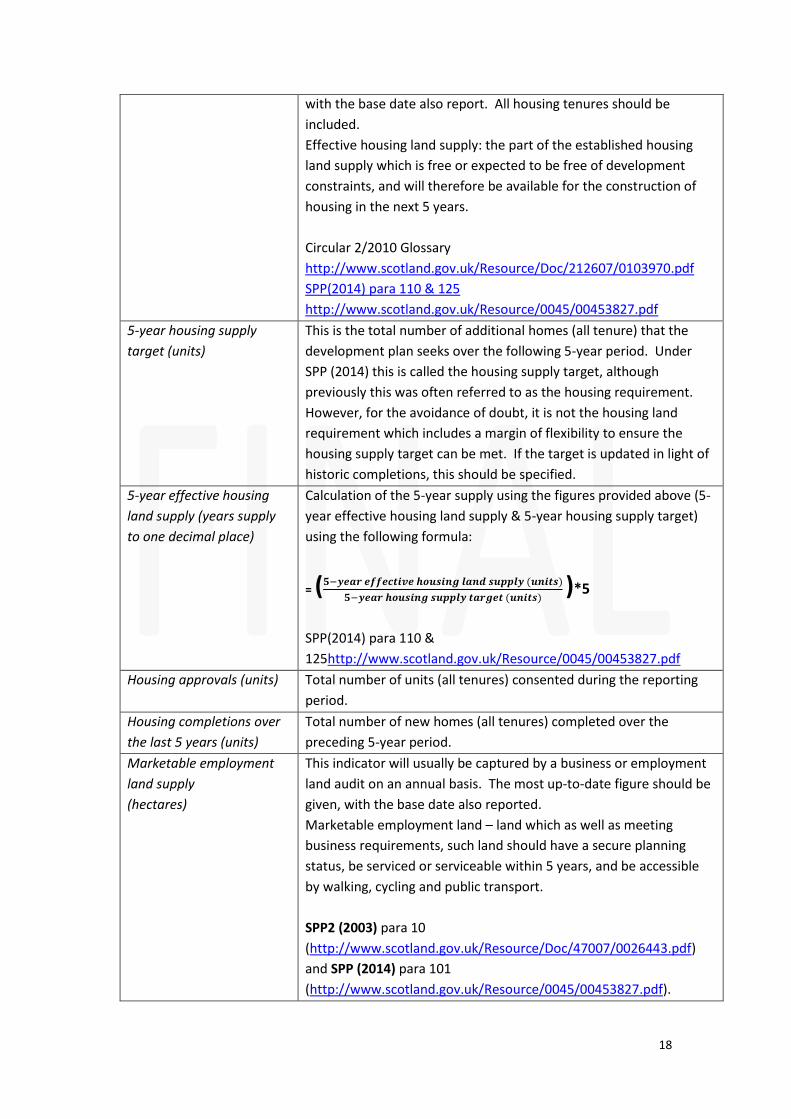
18
with the base date also report. All housing tenures should be
included.
Effective housing land supply: the part of the established housing
land supply which is free or expected to be free of development
constraints, and will therefore be available for the construction of
housing in the next 5 years.
Circular 2/2010 Glossary
http://www.scotland.gov.uk/Resource/Doc/212607/0103970.pdf
SPP(2014) para 110 & 125
http://www.scotland.gov.uk/Resource/0045/00453827.pdf
5-year housing supply
target (units)
This is the total number of additional homes (all tenure) that the
development plan seeks over the following 5-year period. Under
SPP (2014) this is called the housing supply target, although
previously this was often referred to as the housing requirement.
However, for the avoidance of doubt, it is not the housing land
requirement which includes a margin of flexibility to ensure the
housing supply target can be met. If the target is updated in light of
historic completions, this should be specified.
5-year effective housing
land supply (years supply
to one decimal place)
Calculation of the 5-year supply using the figures provided above (5-
year effective housing land supply & 5-year housing supply target)
using the following formula:
= (𝟓−𝒚𝒆𝒂𝒓 𝒆𝒇𝒇𝒆𝒄𝒕𝒊𝒗𝒆 𝒉𝒐𝒖𝒔𝒊𝒏𝒈 𝒍𝒂𝒏𝒅 𝒔𝒖𝒑𝒑𝒍𝒚 (𝒖𝒏𝒊𝒕𝒔)
𝟓−𝒚𝒆𝒂𝒓 𝒉𝒐𝒖𝒔𝒊𝒏𝒈 𝒔𝒖𝒑𝒑𝒍𝒚 𝒕𝒂𝒓𝒈𝒆𝒕 (𝒖𝒏𝒊𝒕𝒔) )*5
SPP(2014) para 110 &
125http://www.scotland.gov.uk/Resource/0045/00453827.pdf
Housing approvals (units) Total number of units (all tenures) consented during the reporting
period.
Housing completions over
the last 5 years (units)
Total number of new homes (all tenures) completed over the
preceding 5-year period.
Marketable employment
land supply
(hectares)
This indicator will usually be captured by a business or employment
land audit on an annual basis. The most up-to-date figure should be
given, with the base date also reported.
Marketable employment land – land which as well as meeting
business requirements, such land should have a secure planning
status, be serviced or serviceable within 5 years, and be accessible
by walking, cycling and public transport.
SPP2 (2003) para 10
(http://www.scotland.gov.uk/Resource/Doc/47007/0026443.pdf)
and SPP (2014) para 101
(http://www.scotland.gov.uk/Resource/0045/00453827.pdf).
19
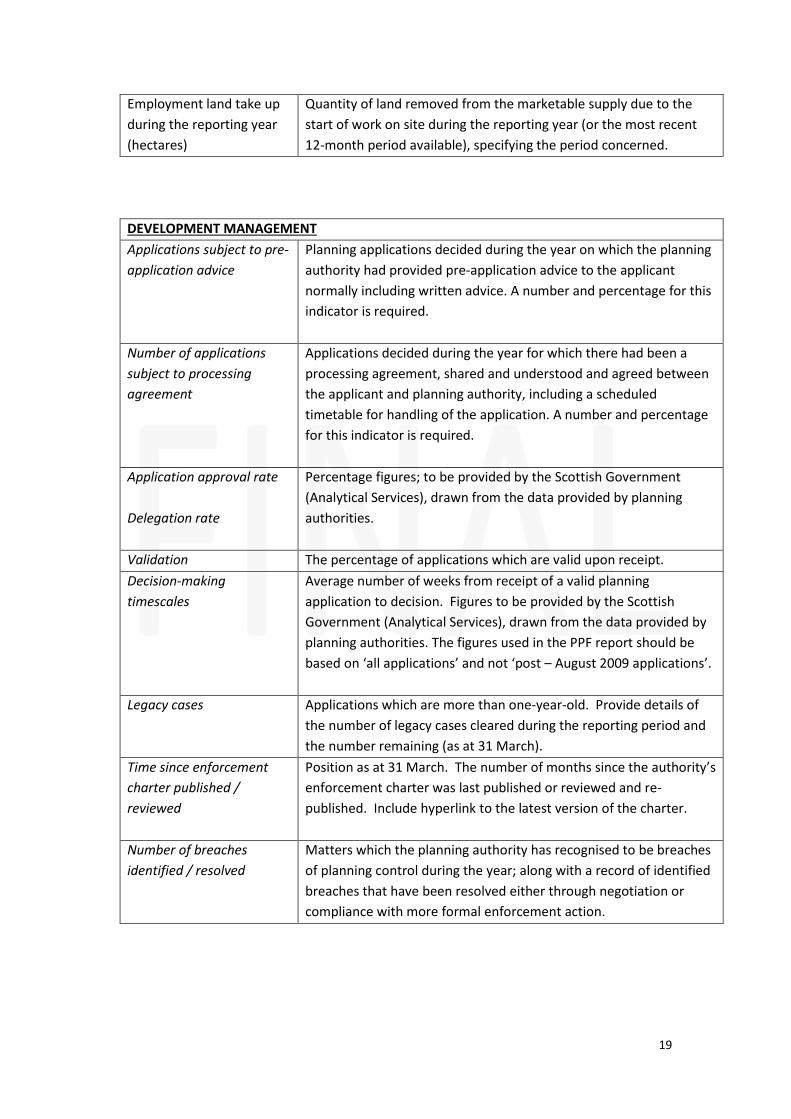
Employment land take up
during the reporting year
(hectares)
Quantity of land removed from the marketable supply due to the
start of work on site during the reporting year (or the most recent
12-month period available), specifying the period concerned.
DEVELOPMENT MANAGEMENT
Applications subject to pre-
application advice
Planning applications decided during the year on which the planning
authority had provided pre-application advice to the applicant
normally including written advice. A number and percentage for this
indicator is required.
Number of applications
subject to processing
agreement
Applications decided during the year for which there had been a
processing agreement, shared and understood and agreed between
the applicant and planning authority, including a scheduled
timetable for handling of the application. A number and percentage
for this indicator is required.
Application approval rate
Delegation rate
Percentage figures; to be provided by the Scottish Government
(Analytical Services), drawn from the data provided by planning
authorities.
Validation The percentage of applications which are valid upon receipt.
Decision-making
timescales
Average number of weeks from receipt of a valid planning
application to decision. Figures to be provided by the Scottish
Government (Analytical Services), drawn from the data provided by
planning authorities. The figures used in the PPF report should be
based on ‘all applications’ and not ‘post – August 2009 applications’.
Legacy cases Applications which are more than one-year-old. Provide details of
the number of legacy cases cleared during the reporting period and
the number remaining (as at 31 March).
Time since enforcement
charter published /
reviewed
Position as at 31 March. The number of months since the authority’s
enforcement charter was last published or reviewed and re-
published. Include hyperlink to the latest version of the charter.
Number of breaches
identified / resolved
Matters which the planning authority has recognised to be breaches
of planning control during the year; along with a record of identified
breaches that have been resolved either through negotiation or
compliance with more formal enforcement action.

20
Text box
You can use the text box below the NHIs table to provide a short contextual statement,
focussing on reasons/factors which have influenced your authority’s performance and any
increase or decrease on past results. Authorities should focus on decision making timescales,
however this text box can also be used to provide relevant context for the development land
supply and delivery figures, such as the area or percentage of land covered by environmental
designations or national parks. It should be used to explain any obvious ‘jumps’ in figures
between years whether this is housing land supply, housing approvals or other changes
which would benefit from further context.
21
Part 5: Official Statistics
Guidance from the Scottish Government
Decision-making timescales
Information on decision-making timescales for planning and other applications will be
provided by the Scottish Government (Analytical Services), drawn from the data provided by
planning authorities. The figures used in the PPF report must be based on the ‘all
applications’ timescale. You can simply copy/paste in the 2016-17 full year table we publish
for the authority on the Scottish Government website. You can use the information you
receive prior to its publication on the web.
www.gov.scot/Topics/Statistics/Browse/Planning/Publications
It is important that the statistics give an accurate and reliable account of the timescales for
handling applications. There will be an opportunity for planning authorities, when providing
their data to the Scottish Government, to highlight particular cases where substantial, and
clearly unavoidable, delays have occurred. Additionally, the planning authority should
highlight at that time any applications where there has been written agreement between
the authority and the applicant that no action should be taken on the application during a
specified period. The figures provided by the Scottish Government for this section may
therefore have been reasonably adjusted to provide a more accurate marker of
performance.
For applications where the authority and applicant have agreed a timescale different from
the 2 month and 4 month targets, for example where there are processing agreements in
place, the statistics on decision times will be adjusted to reflect these agreements.
Local reviews and appeals
Information on local review and appeal decisions will be provided by the Scottish
Government (Analytical Services), drawn from the data provided by planning authorities.
Enforcement activity
Enter the number of potential breaches of planning control investigated, the number of
formal notices served, the number of reports passed to the Procurator Fiscal and the
number of prosecutions led. Cases taken up are those where parties were formally notified
in writing that enforcement action may be taken by the authority under Sections 127 – 137
of the T&CP (Scotland) Act 1997.

22
Part 6: Workforce Information
The Workforce Information section is designed to be a snapshot of the authority’s workforce
at 31st March 2017, not an exhaustive HR exercise. The information required is intended to
be basic information which should not be in anyway arduous or difficult to complete. It
should be a head count of staff and as the notes suggest, where members of staff work over
different policy areas they should be counted in the policy area where they have spent more
time working.
Financial information is no longer required.
23
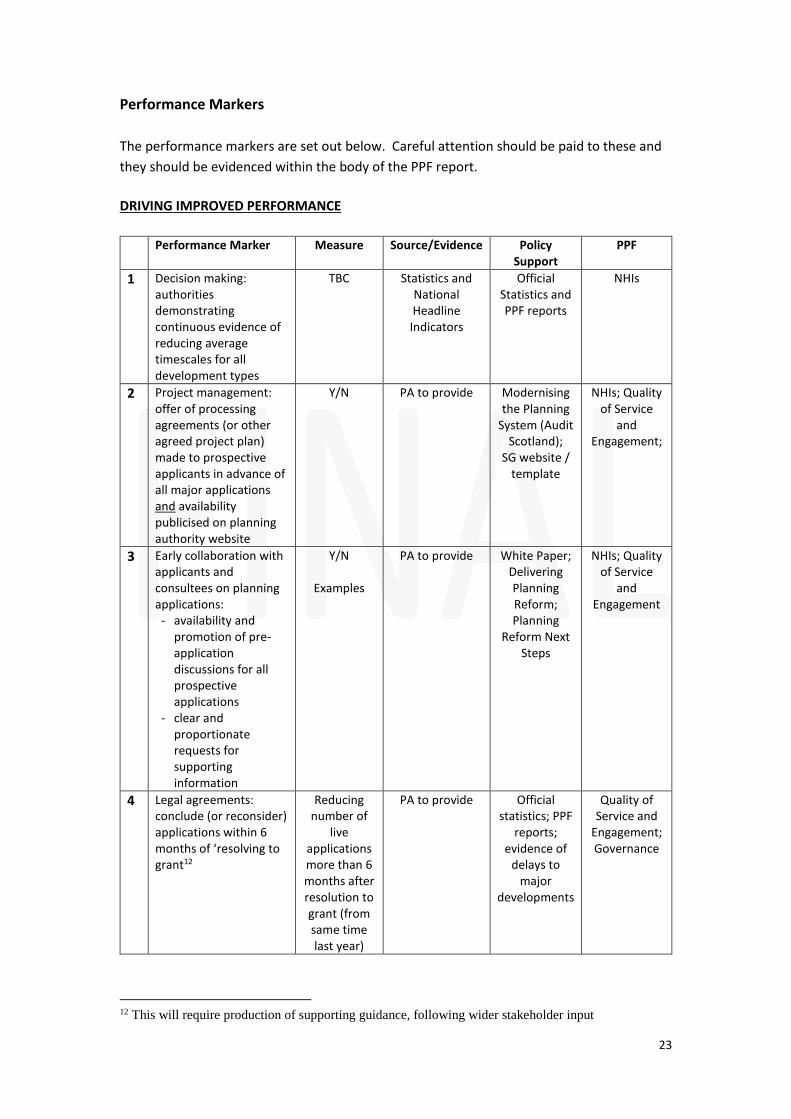
Performance Markers
The performance markers are set out below. Careful attention should be paid to these and
they should be evidenced within the body of the PPF report.
DRIVING IMPROVED PERFORMANCE
Performance Marker Measure Source/Evidence Policy Support
PPF
1 Decision making: authorities demonstrating continuous evidence of reducing average timescales for all development types
TBC
Statistics and National Headline Indicators
Official Statistics and PPF reports
NHIs
2 Project management: offer of processing agreements (or other agreed project plan) made to prospective applicants in advance of all major applications and availability publicised on planning authority website
Y/N PA to provide Modernising the Planning
System (Audit Scotland);
SG website / template
NHIs; Quality of Service
and Engagement;
3 Early collaboration with applicants and consultees on planning applications: - availability and
promotion of pre-application discussions for all prospective applications
- clear and proportionate requests for supporting information
Y/N
Examples
PA to provide White Paper; Delivering Planning Reform; Planning
Reform Next Steps
NHIs; Quality of Service
and Engagement
4 Legal agreements: conclude (or reconsider) applications within 6 months of ‘resolving to grant12
Reducing number of
live applications more than 6 months after resolution to grant (from same time last year)
PA to provide Official statistics; PPF
reports; evidence of
delays to major
developments
Quality of Service and
Engagement; Governance
12 This will require production of supporting guidance, following wider stakeholder input
24
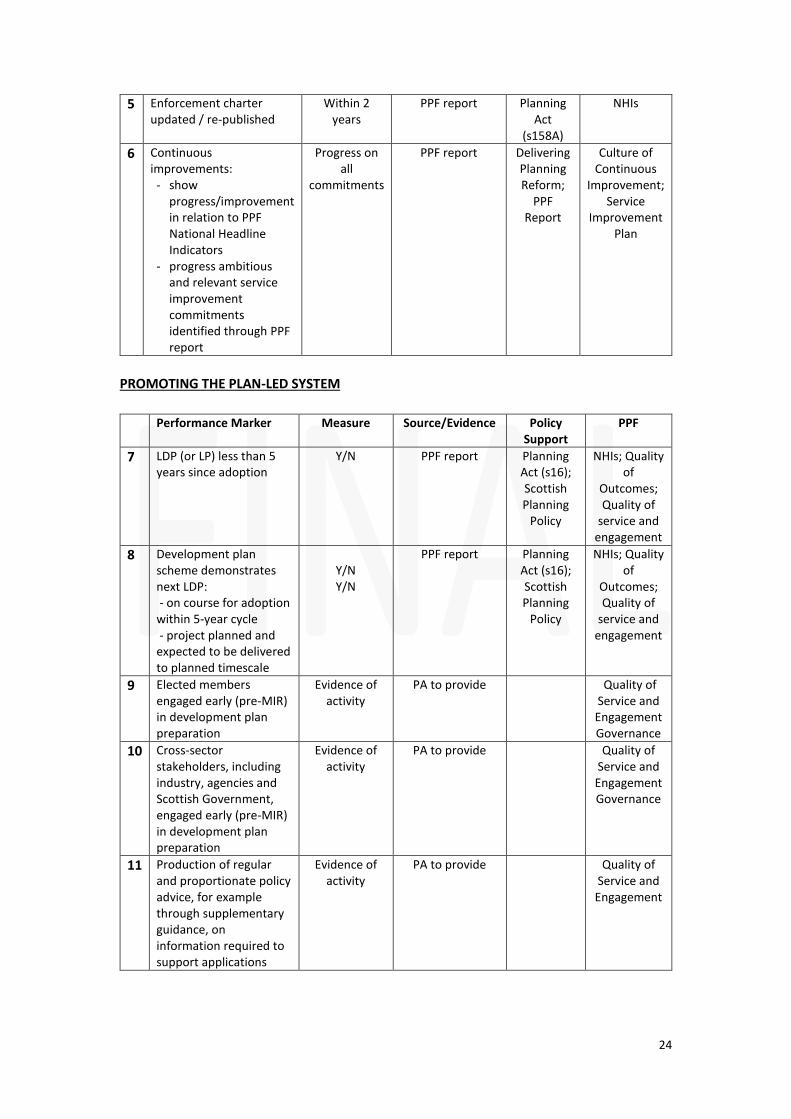
5 Enforcement charter updated / re-published
Within 2 years
PPF report Planning Act
(s158A)
NHIs
6 Continuous improvements: - show
progress/improvement in relation to PPF National Headline Indicators
- progress ambitious and relevant service improvement commitments identified through PPF report
Progress on all
commitments
PPF report Delivering Planning Reform;
PPF Report
Culture of Continuous
Improvement; Service
Improvement Plan
PROMOTING THE PLAN-LED SYSTEM
Performance Marker Measure Source/Evidence Policy Support
PPF
7 LDP (or LP) less than 5 years since adoption
Y/N PPF report Planning Act (s16); Scottish Planning
Policy
NHIs; Quality of
Outcomes; Quality of
service and engagement
8 Development plan scheme demonstrates next LDP: - on course for adoption within 5-year cycle - project planned and expected to be delivered to planned timescale
Y/N Y/N
PPF report Planning Act (s16); Scottish Planning
Policy
NHIs; Quality of
Outcomes; Quality of
service and engagement
9 Elected members engaged early (pre-MIR) in development plan preparation
Evidence of activity
PA to provide Quality of Service and Engagement Governance
10 Cross-sector stakeholders, including industry, agencies and Scottish Government, engaged early (pre-MIR) in development plan preparation
Evidence of activity
PA to provide Quality of Service and Engagement Governance
11 Production of regular and proportionate policy advice, for example through supplementary guidance, on information required to support applications
Evidence of activity
PA to provide Quality of Service and Engagement
25
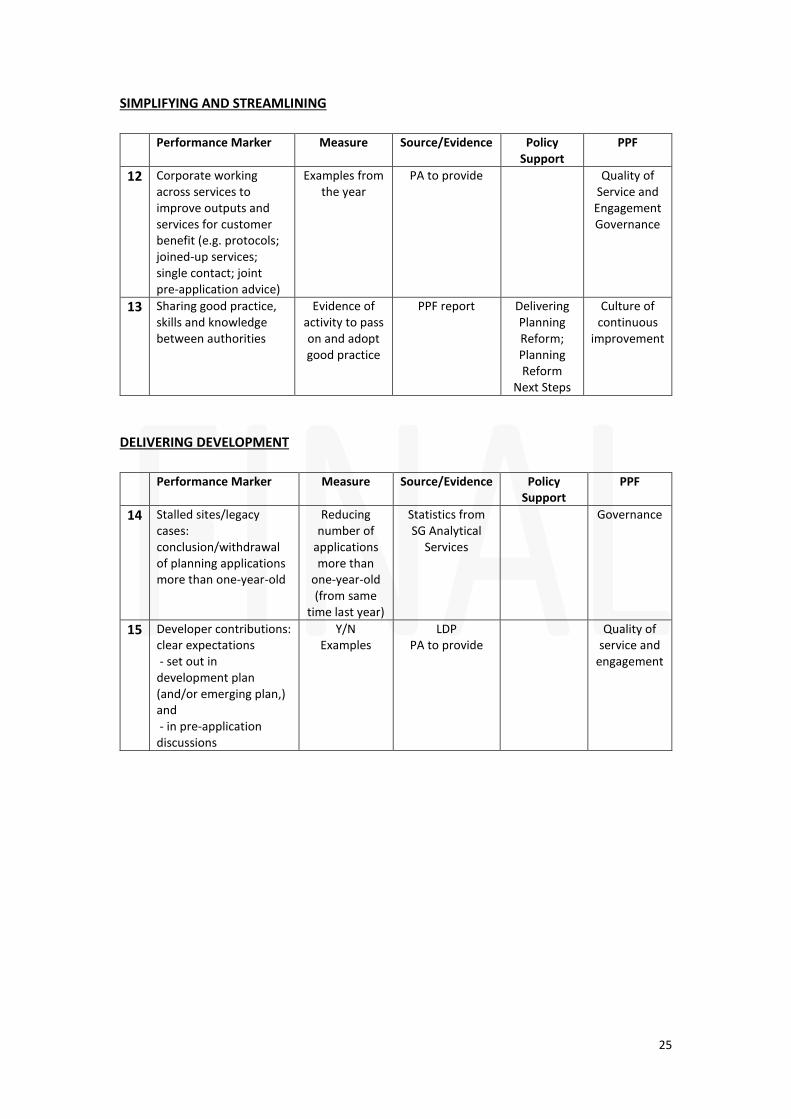
SIMPLIFYING AND STREAMLINING
Performance Marker Measure Source/Evidence Policy Support
PPF
12 Corporate working across services to improve outputs and services for customer benefit (e.g. protocols; joined-up services; single contact; joint pre-application advice)
Examples from the year
PA to provide Quality of Service and Engagement Governance
13 Sharing good practice, skills and knowledge between authorities
Evidence of activity to pass on and adopt good practice
PPF report Delivering Planning Reform; Planning Reform
Next Steps
Culture of continuous
improvement
DELIVERING DEVELOPMENT
Performance Marker Measure Source/Evidence Policy Support
PPF
14 Stalled sites/legacy cases: conclusion/withdrawal of planning applications more than one-year-old
Reducing number of
applications more than
one-year-old (from same
time last year)
Statistics from SG Analytical
Services
Governance
15 Developer contributions: clear expectations - set out in development plan (and/or emerging plan,) and - in pre-application discussions
Y/N Examples
LDP PA to provide
Quality of service and
engagement
26
Further information is provided below on markers 11 and 15, which call for evidence on
policy advice and examples of developer contribution expectations respectively
Marker 11 – Regular and Proportionate Policy Advice
Authorities need to provide clear evidence and information to demonstrate how this is being
achieved and delivered. This could include the following:
A description of published guidance and advice with reference to particular examples. If you have specific advice on information required to support applications, explain what this is and how it is proportionate. If applicable, provide evidence of where policy advice or guidance has been developed in response to particular issues. This could include feedback from customers, market conditions or to improve matters such as efficiency, certainty and consistency.
Include feedback/customer testimonies, where possible.
Use case studies/examples, where possible, to help demonstrate how the policy advice is regular and proportionate.
Provide evidence that the policy complies with Circular 3/2012 and key themes promoted
If you have protocols in place (for example a shared service), be sure to explain them.
Marker 15 – Developer Contributions
Authorities need to be clear on how the LDP and supplementary guidance ensures this.
Evidence could include the following:
Examples/reference to the LDP policy/supplementary guidance specifically covering this and how it is clear, with a description of how it is applied in practice
Aim to include reference to Circular 3/2012 on planning obligations and how the policy/supplementary guidance aligns with this.
Explain and provide some evidence of how developer contributions are set out and achieved at pre-application stage – examples, case studies, customer feedback and testimony.