annual report - e q report queensland state school reporting ... krystal cole sophie norton . 5...
TRANSCRIPT

1
Farleigh State School
2016 ANNUAL REPORT
Queensland State School Reporting
Inspiring minds. Creating opportunities. Shaping Queensland’s future. Every student succeeding. State Schools Strategy 2016-2020
Department of Education and Training

2
Contact Information
Postal address: CMB Farleigh 4741
Phone: (07) 4959 8229
Email: [email protected]
Webpages: Additional reporting information pertaining to Queensland state schools is located on the My School website and the Queensland Government data website.
Contact Person: Martyn Price
3
School Overview
Farleigh State School is nestled in a rural retreat just off the Bruce Highway eight minutes north of Mackay, and caters for students from Prep to Grade 6. Farleigh State School boasts wonderful play areas, gardens, fruit trees and facilities. Farleigh prides itself in not only providing excellence in teaching in a friendly, safe, well-resourced and attractive environment, but strives to ensure that every child is given the opportunity to be the best they can be; academically, socially, emotionally and physically. An enrolment of approximately 24 students allows for two multi-age classes where quality teaching and learning focuses on small groups and individual students. All staff at Farleigh State School aim to ensure every student’s needs are met, that each child experiences high quality learning programs, has the opportunity to access school excursions and extra-curricular activities such as robotics, board games, sports and activities. Our school motto is ‘United We Achieve’.
Principal’s Foreward
Introduction
Farleigh State School has had many successes in 2016 that we, as a school, are very proud of. We have initiated many wonderful programs to not only improve our academic achievements, but also the emotional and social wellbeing of our students.
Farleigh has a culture of high expectations, but in an environment where the individual can feel empowered, and is allowed to flourish and develop their own identity. In the later part of 2016, a greater focus was placed on individual reading and comprehension skills, supported by our I4S funding through the acquisition of extra support staff. Students receive daily reading and comprehension with individual practice sessions, via the utilisation of programs such as ‘The Daily Five’, ‘Café Reading’ and our spelling program ‘Sound Waves’. Our students have demonstrated improvement in their reading capabilities, with significant gains being made in a number of students who can now read one year or more, above their age appropriate level. These results are supported by regular data collection.
The school has improved its interactions with the local, and wider community. We held, and attended, a number of events such as:
• ANZAC Day Memorial Service in Farleigh, where students recited a poem. • Palm Fete, organised by Farleigh P & C • Cluster Sports Day • End of Year Awards and Concert Night • School Camps • Whitsunday Voices • Farleigh State School Playgroup
Farleigh has also invested in the purchase of robotics and coding equipment, so we are able to fully implement the new ‘Digital Technologies’ component of the Australian Curriculum.
This report contains our progress and results from 2016, as well as our future outlook in 2017.

4
School Progress towards its goals in 2016
The table below is colour coordinated. Please follow the key below: Not Implemented Implementing Implemented
Writing
Strategy – Developing the capability of staff to demonstrate Visible Learning in writing.
Actions Targets Timelines Responsible Officer/s
Develop the capacity of the ‘Road to Success’ strategy through professional development. 100% Throughout
2016. Kara Riley Sarah Schatkowski
Demonstrate capability of the ‘Road to Success’ strategy through Visible Learning.
100% Every term. Kara Riley Sarah Schatkowski
Strategy – Consolidating the ‘Road to Success’ cues to inform student assessment success.
Actions Targets Timelines Responsible Officer/s
Students familiarise themselves with the ‘Road to Success’ display.
100% Throughout 2016.
Students
Provide students with the opportunity to work collaborate to annotate exemplars. 100% Every term.
Kara Riley Sarah Schatkowski Students
Staff assisting students to recognise ‘Road to Success’ cues.
50% Throughout 2016.
Kara Riley Sarah Schatkowski Students.
Quality Teaching Strategy- Developing the capability of staff to deliver/engage in Explicit Instruction at a mastery level.
Actions Targets Timelines Responsible Officer/s
Develop the mastery of EI through professional development avenues such as cluster sharing, observations, EI modules etc.
60% At least once a term.
Kara Riley Sarah Schatkowski Traccee Ramsamy Krystal Cole Sophie Norton
Development of performance frameworks that reflect the mastery of EI.
100% Biannually.
Kara Riley Sarah Schatkowski Traccee Ramsamy Krystal Cole Sophie Norton
Strategy- Utilising current research and best practise to inform the delivery of pedagogy.
Actions Targets Timelines Responsible Officer/s
Engage staff with current research ie ‘Towards A Moving’ John Fleming and ‘Explicit Instruction : effective and efficient teaching’ by Anita Archer.
100% Throughout 2016.
Kara Riley Sarah Schatkowski Traccee Ramsamy Krystal Cole Sophie Norton

5
Strategy- Embedding a culture of high quality observation and feedback.
Actions Targets Timelines Responsible Officer/s
Use of current research on the protocols of feedback eg. John Hattie.
100% Throughout 2016.
Kara Riley/Martyn Price Sarah Schatkowski Traccee Ramsamy Krystal Cole Sophie Norton
Harness the power of high quality feedback to students, by identifying and employing clear methodology, including annotations in workbooks. Ensure that there is a clear connection between the intended curriculum, explicit teaching, verbal feedback, annotation and goal setting.
60% Throughout 2016.
Kara Riley/Martyn Price Sarah Schatkowski Traccee Ramsamy Krystal Cole Sophie Norton
Community Engagement
Strategy- Engaging the community with the intent to form partnerships.
Actions Targets Timelines Responsible Officer/s
Continuation of Playgroup/ Pre-Prep program. 100% Throughout 2016.
Kara Riley Martyn Price Traccee Ramsamy Sophie Norton
Encourage community to access school events, classroom activities and structured learning activities.
100% Throughout 2016.
Kara Riley Martyn Price
Seek opportunities to engage local partnerships. Throughout 2016.
Kara Riley Martyn price
Strategy- Utilising the local community, business and industry in decision making.
Actions Targets Timelines Responsible Officer/s
Initiate contact with local business and industry. Throughout 2016.
Kara Riley P and C
Consolidate existing partnerships with local business and industry.
Throughout 2016.
Kara Riley P and C
Openly welcome local businesses and industry to school events.
Throughout 2016.
Kara Riley P and C
Future Outlook
STRATEGY ONE – Building a deeper understanding of Australian Curriculum: English
Actions Targets Timelines Responsible
Officer/s Modify (adapt/adopt) GTMJs for multi-age contexts and building teacher capacity around unit metalanguage.
100% of teachers are familiar with how to modify GTMJs for multi-age contexts
End of each term
HOC Teachers
Formalise the cluster moderation and feedback process.
T1 afternoon &
HOC Principal

6
T4 SFD Collaborative planning - a consistent whole school/cluster approach to planning.
Ongoing HOC Teachers
STRATEGY Two – Literacy Priorities: Embed a balanced school wide reading program
Actions Targets Timelines Responsible Officer/s
Deliver oral language activities that target phonological and phonemic awareness
100% of students, via our spelling program ‘Sound Waves’, and via in house PD for staff.
Start 2017 Teachers Aides
Embed a shared understanding and pedagogical practice of the 5 reading procedures i.e. Reading aloud to students, Modelled Reading, Shared Reading, Guided Reading, Independent Reading.
100% of students via ‘The Daily Five’ and “Café Reading’. Teachers to become proficient in the delivery of the above programs, including appropriate displays and goal setting, via in house PD.
Ongoing 2017
Teachers Aides
Embed comprehension strategies, such as Sheena Cameron
100% of students On going 2017
Teachers Aides
Use the reading procedures as a focus for Instructional Leadership to build teacher capacity through observation and feedback.
100% of teaching staff
On going 2017
Teachers Aides
Continue to resource reading agenda and the success to date over a sustained period. Testing to occur every 3 weeks to ensure appropriate progress is being maintained.
90% of students reading at one year above their current reading age.
On going 2017
Teachers Aides
STRATEGY THREE – Building teacher capacity around student self-reported grades, goal setting and feedback to students in a variety of ways (individual, group, whole class) in relation to Australian Curriculum English.
Actions Targets Timelines Responsible
Officer/s Gather appropriate research around effective self-reported grades, feedback, self reported grades and goal setting (ie. Hattie) and develop school wide models.
100% of students who can clearly articulate what action is required in response to feedback given and can effectively self-reported on expected grades. Each teacher is observed and receives feedback around their use of school wide models for feedback, self-
Semester 1 Teachers Martyn Price
Provide appropriate professional development opportunities for teachers around student self-reported grades, feedback and goal setting.
Semester 2 Teachers Aides Martyn Price
7
reported grades and goal setting.
Our School at a Glance
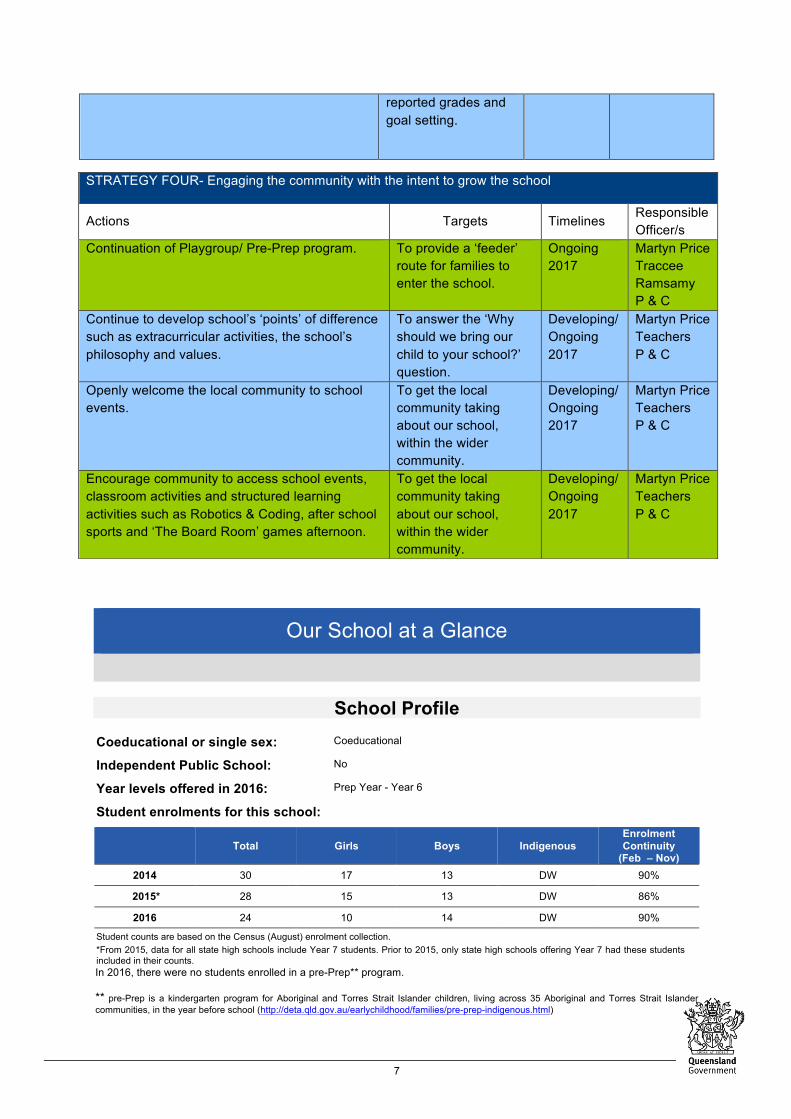
School Profile
Coeducational or single sex: Coeducational
Independent Public School: No
Year levels offered in 2016: Prep Year - Year 6
Student enrolments for this school:
Total Girls Boys Indigenous Enrolment Continuity
(Feb – Nov) 2014 30 17 13 DW 90%
2015* 28 15 13 DW 86%
2016 24 10 14 DW 90%
Student counts are based on the Census (August) enrolment collection. *From 2015, data for all state high schools include Year 7 students. Prior to 2015, only state high schools offering Year 7 had these students included in their counts. In 2016, there were no students enrolled in a pre-Prep** program. ** pre-Prep is a kindergarten program for Aboriginal and Torres Strait Islander children, living across 35 Aboriginal and Torres Strait Islander communities, in the year before school (http://deta.qld.gov.au/earlychildhood/families/pre-prep-indigenous.html)
STRATEGY FOUR- Engaging the community with the intent to grow the school
Actions Targets Timelines Responsible Officer/s
Continuation of Playgroup/ Pre-Prep program. To provide a ‘feeder’ route for families to enter the school.
Ongoing 2017
Martyn Price Traccee Ramsamy P & C
Continue to develop school’s ‘points’ of difference such as extracurricular activities, the school’s philosophy and values.
To answer the ‘Why should we bring our child to your school?’ question.
Developing/ Ongoing 2017
Martyn Price Teachers P & C
Openly welcome the local community to school events.
To get the local community taking about our school, within the wider community.
Developing/ Ongoing 2017
Martyn Price Teachers P & C
Encourage community to access school events, classroom activities and structured learning activities such as Robotics & Coding, after school sports and ‘The Board Room’ games afternoon.
To get the local community taking about our school, within the wider community.
Developing/ Ongoing 2017
Martyn Price Teachers P & C

8
Characteristics of the Student Body Overview Farleigh State School offers two multi-age classes, Prep-3 and 4-6 and families in the Farleigh Area are largely from the rural sector, with an additional percentage of families enjoying the rural lifestyle with affordable accommodation in a number of rental properties. There are a number of families also who travel from Mackay City to Farleigh State School so their children can benefit from the small school environment.
Average Class Sizes The following table shows the average class size information for each phase of schooling.
AVERAGE CLASS SIZES
Phase 2014 2015* 2016
Prep – Year 3 12 10 13
Year 4 – Year 6 16 16 12
*From 2015, data for all state high schools include Year 7 students. Prior to 2015, only state high schools offering Year 7 had these students included in their counts.
Curriculum Delivery Our Approach to Curriculum Delivery
• Farleigh has in place a range of curriculum programs covering all eight of the Key learning Areas.
• Our staff liaise with six other primary schools that form our professional cluster group to ensure continuity across the curriculum.
• Our students study Japanese as our LOTE subject. • A visiting specialist delivers Health and Physical Education lessons. • The school uses a range of assessments including NAPLAN, PM Reading benchmarks and
Probe Reading Assessments.
Co-curricular Activities Despite Farleigh being a small school, students are offered some excellent opportunities to participate in a wide range of extra-curricular activities. In 2016 these included:
• Robotics • ‘The Board Room’, a board games program to help children develop their social skills. • A range of sporting opportunities, such as tennis, swimming lessons, basketball, table tennis,
softball, athletics and lawn bowls. • Student Council ‘Glow’ Disco. • Affiliated Queensland Playgroup onsite weekly run by an employed Teacher Aide. • Half and full day excursions and school camps. • Cluster Sports Days. • Community based projects, such as ANZAC Day and Remembrance Day. • End of year Concert and Award ceremony. • Whitsunday Voices.
How Information and Communication Technologies are used to Assist Learning A ratio of 1:1 computers to students allow regular access to all computer-based ICTs such as the Internet, Microsoft Office programs, photo editing and coding. Students use Information and Communication Technologies to communicate and collaborate, explore the processes of inquiry and research across KLA’s and enhancing their skills to match what will be required as digital citizens of the future.

9
Social Climate Overview All Parents, Staff and Teachers were satisfied with the overall school climate at Farleigh State School in 2016. We believe every child matters every day and each child has the ability to achieve, therefore we differentiate the curriculum to meet the needs of the child. High expectations are set through our school policies and we expect parents, teachers and the Admin team to work together to support the student to achieve their very best. At Farleigh State School we have a zero tolerance on bullying, and/or cyber bullying which is addressed in our Responsible Behaviour Plan.
The satisfaction of parents is high and they particularly believe their children are safe and expectations are high at Farleigh State School.
Student satisfaction is high particularly and the students feel happy and safe at Farleigh State School. Staff morale reflects the targeted PD schedule put into place and the feedback provide to staff.
Parent, Student and Staff Satisfaction Parent opinion survey
Performance measure Percentage of parents/caregivers who agree# that: 2014 2015 2016 their child is getting a good education at school (S2016) 86% 100% 100%
this is a good school (S2035) 86% 100% 100%
their child likes being at this school* (S2001) 86% 100% 100%
their child feels safe at this school* (S2002) 100% 100% 100%
their child's learning needs are being met at this school* (S2003) 71% 100% 100%
their child is making good progress at this school* (S2004) 71% 100% 100%
teachers at this school expect their child to do his or her best* (S2005) 100% 100% 100%
teachers at this school provide their child with useful feedback about his or her school work* (S2006) 86% 80% 88%
teachers at this school motivate their child to learn* (S2007) 86% 80% 100%
teachers at this school treat students fairly* (S2008) 86% 80% 75%
they can talk to their child's teachers about their concerns* (S2009) 86% 100% 100%
this school works with them to support their child's learning* (S2010) 86% 100% 100%
this school takes parents' opinions seriously* (S2011) 71% 100% 100%
student behaviour is well managed at this school* (S2012) 71% 100% 100%
this school looks for ways to improve* (S2013) 71% 80% 88%
this school is well maintained* (S2014) 100% 100% 100%
Student opinion survey
Performance measure Percentage of students who agree# that: 2014 2015 2016
they are getting a good education at school (S2048) 93% 93% 100%
they like being at their school* (S2036) 100% 93% 100%
they feel safe at their school* (S2037) 100% 100% 100%

10
Performance measure Percentage of students who agree# that: 2014 2015 2016
their teachers motivate them to learn* (S2038) 93% 100% 100%
their teachers expect them to do their best* (S2039) 93% 100% 100%
their teachers provide them with useful feedback about their school work* (S2040) 93% 100% 100%
teachers treat students fairly at their school* (S2041) 93% 93% 86%
they can talk to their teachers about their concerns* (S2042) 92% 93% 100%
their school takes students' opinions seriously* (S2043) 93% 93% 100%
student behaviour is well managed at their school* (S2044) 93% 87% 100%
their school looks for ways to improve* (S2045) 93% 100% 100%
their school is well maintained* (S2046) 93% 100% 100%
their school gives them opportunities to do interesting things* (S2047) 100% 100% 100%
Staff opinion survey
Performance measure Percentage of school staff who agree# that: 2014 2015 2016
they enjoy working at their school (S2069) 100% 100% 100%
they feel that their school is a safe place in which to work (S2070) 100% 100% 100%
they receive useful feedback about their work at their school (S2071) 100% 100% 100%
they feel confident embedding Aboriginal and Torres Strait Islander perspectives across the learning areas (S2114)
100% 100% 100%
students are encouraged to do their best at their school (S2072) 100% 100% 100%
students are treated fairly at their school (S2073) 100% 100% 100%
student behaviour is well managed at their school (S2074) 100% 100% 100%
staff are well supported at their school (S2075) 100% 100% 100%
their school takes staff opinions seriously (S2076) 100% 100% 100%
their school looks for ways to improve (S2077) 100% 100% 100%
their school is well maintained (S2078) 100% 100% 100%
their school gives them opportunities to do interesting things (S2079) 100% 100% 100%
* Nationally agreed student and parent/caregiver items # ‘Agree’ represents the percentage of respondents who Somewhat Agree, Agree or Strongly Agree with the statement. DW = Data withheld to ensure confidentiality.
Parent and community engagement As a small school, teachers are in regular contact with parents. This includes:
• Formal Parent-Teacher interviews are offered twice a year, but informal discussions are offered all year round.
• Meeting and greeting parents when they drop off/pick up their child/children before and after school.
• Parent volunteers for The Breakfast Club, Tuckshop, camps and school excursions. • During fund raising ventures, such as Palm Fete and also at working bees. • P & C meetings • Formal reporting twice a year, once in Semester 1 and once in Semester 2. • End of year concerts. • Achievers Day

11
Respectful relationships programs Farleigh State School recognizes the importance of respectful relationships in our school and community. By utilising the Australian Curriculum and resources accompanying the Health curriculum, students are educated about healthy, respectful relationships and taught skills to develop in this area. The school has developed and implemented a program or programs that focus on appropriate, respectful and healthy relationships. School Disciplinary Absences The following table shows the count of incidents for students recommended for each type of school disciplinary absence reported at the school.
SCHOOL DISCIPLINARY ABSENCES
Type 2014* 2015** 2016
Short Suspensions – 1 to 5 days 0 0 0
Long Suspensions – 6 to 20 days 0 0 0
Exclusions 0 0 0
Cancellations of Enrolment 0 0 0
* Caution should be used when comparing post 2013 SDA data as amendments to EGPA disciplinary provisions and changes in methodology created time series breaks in 2014 and 2015. **From 2015, Exclusion represents principal decisions to exclude rather than recommendations for exclusion. From 2015 where a principal decided not to exclude, a small number of recommendations for exclusions have been counted as a long suspension. Exclusions, Cancellations and Long & Charge Suspensions may be upheld or set aside through an appeals process.
Environmental Footprint Reducing the school’s environmental footprint Data is sourced from school's annual utilities return and is reliant on the accuracy of these returns.
The previously installed solar panels have helped reduce the quarterly electricity bill, as have teachers actively ensuring lights, fans and air-conditioning are turned off when leaving the classroom. Recycling bins allow for all recyclable items – paper, cardboard, plastics bottles, tins etc. to be recovered.
ENVIRONMENTAL FOOTPRINT INDICATORS
Years Electricity kWh
Water kL
2013-2014 23,465 164
2014-2015 21,959 329
2015-2016 21,068 175
The consumption data is compiled from sources including ERM, Ergon reports and utilities data entered into OneSchool by each school. The data provides an indication of the consumption trend in each of the utility categories which impact on the school’s environmental footprint.
School Funding School income broken down by funding source School income, reported by financial year accounting cycle using standardized national methodologies and broken down by funding source is available via the My School website at http://www.myschool.edu.au/.
To access our income details, click on the My School link above. You will then be taken to the My School website with the following ‘Find a school’ text box.

12
Where it states ‘School name’, type in the name of the school you wish to view, select the school from the drop-down list and select <GO>. Read and follow the instructions on the next screen; you will be asked to confirm that you are not a robot then by clicking continue, you acknowledge that you have read, accepted and agree to the Terms of Use and Privacy Policy before being given access to the school’s profile webpage.
School financial information is available by selecting ‘School finances’ in the menu box in the top left corner of the school’s profile webpage. If you are unable to access the internet, please contact the school for a paper copy of income by funding source.
Our Staff Profile
Workforce Composition
Staff composition, including Indigenous staff The staff figures below are based on Equal Employment Opportunity (EEO) 2015 census. In accordance with the EEO privacy provisions and to ensure confidentiality, the ‘less than 5’ rule has been applied in schools whose Indigenous staff numbers are less than five.
2016 WORKFORCE COMPOSITION
Description Teaching Staff Non-Teaching Staff Indigenous Staff
Headcounts 3 4 <5
Full-time Equivalents 1 3 <5
Qualification of all teachers
TEACHER* QUALIFICATIONS
Highest level of qualification Number of classroom teachers and school leaders at the school
Doctorate
Masters
Graduate Diploma etc.** 1
Bachelor degree 2
Diploma

13
TEACHER* QUALIFICATIONS
Highest level of qualification Number of classroom teachers and school leaders at the school
Certificate
*Teaching staff includes School Leaders **Graduate Diploma etc. includes Graduate Diploma, Bachelor Honours Degree, and Graduate Certificate.
Professional Development
Expenditure On and Teacher Participation in Professional Development
The total funds expended on teacher professional development in 2016 were $8107
The major professional development initiatives are as follows:
• Literacy Solutions Workshop • Principal’s Conference • NSIST Peer Review Training • Thrass Training • SBMAQ Cleaners Training • John Collins Writing Program
The proportion of the teaching staff involved in professional development activities during 2016 was 100%.
Staff Attendance and Retention Staff attendance
AVERAGE STAFF ATTENDANCE (%)
Description 2014 2015 2016
Staff attendance for permanent and temporary staff and school leaders. 97% 95% 96%
Proportion of Staff Retained from the Previous School Year From the end of the previous school year, 84% of staff was retained by the school for the entire 2016.

14
Performance of Our Students
Key Student Outcomes
Student Attendance Student attendance The table below shows the attendance information for all students at this school:
STUDENT ATTENDANCE 2016
Description 2014 2015 2016
The overall attendance rate* for the students at this school (shown as a percentage). 90% 95% 96%
The attendance rate for Indigenous students at this school (shown as a percentage). 91% 95% 96%
*The student attendance rate is generated by dividing the total of full-days and part-days that students attended, and comparing this to the total of all possible days for students to attend, expressed as a percentage.
The overall student attendance rate in 2016 for all Queensland Primary schools was 93%.
AVERAGE STUDENT ATTENDANCE RATE* (%) FOR EACH YEAR LEVEL Year Level Prep Year
1 Year
2 Year
3 Year
4 Year
5 Year
6 Year
7 Year
8 Year
9 Year 10
Year 11
Year 12
2014 89% 91% 86% 93% 89% 93% 87%
2015 96% 95% 93% DW 96% 93% 95%
2016 97% 95% 99% 95% DW 97% 96%
*Attendance rates effectively count attendance for every student for every day of attendance in Semester 1. The student attendance rate is generated by dividing the total of full-days and part-days that students attended, and comparing this to the total of all possible days for students to attend, expressed as a percentage. DW = Data withheld to ensure confidentiality.
Student Attendance Distribution The proportions of students by attendance range:
Description of how non-attendance is managed by the school Non-attendance is managed in state schools in line with the DET procedures, Managing Student Absences and Enforcing Enrolment and Attendance at State Schools and Roll Marking in State Schools, which outline processes for managing and recording student attendance and absenteeism.
9
9
14
44
13
31
22
78
55
25
0% 20% 40% 60% 80% 100%
2016
2015
2014
Proportion of Students
Attendance Rate: 0% to <85% 85% to <90% 90% to <95% 95% to 100%

15
Prolonged and regular absences are brought to the attention of the Principal. Parents are contacted either by phone (first step) or via mail to ascertain reasons for absences. Parents are requested to complete ‘reasons for absence’ forms whenever a child is away. Where absences are not explained, an end of term note is forwarded to families seeking explanations for absences. Rolls are marked daily: am and pm, and reasons for absences are noted via a code. Parents with absent children are called prior to 9.00am to clarify why their are not attending school.
NAPLAN Our reading, writing, spelling, grammar and punctuation, and numeracy results for the Years 3, and 5, are available via the My School website at http://www.myschool.edu.au/.
To access our NAPLAN results, click on the My School link above. You will then be taken to the My School website with the following ‘Find a school’ text box.
Where it states ‘School name’, type in the name of the school you wish to view, select the school from the drop-down list and select <GO>. Read and follow the instructions on the next screen; you will be asked to confirm that you are not a robot then by clicking continue, you acknowledge that you have read, accepted and agree to the Terms of Use and Privacy Policy before being given access to the school’s profile webpage.
School NAPLAN information is available by selecting ‘NAPLAN’ in the menu box in the top left corner of the school’s profile webpage. If you are unable to access the internet, please contact the school for a paper copy of our school’s NAPLAN results.