annual report creating sustainable value annual report … · annual report 2016 annual report 2016...
TRANSCRIPT
Hen
kel A
nnua
l Rep
ort
2016
Annual Report 2016
Creating sustainable value
The Company 2 Foreword
6 Report of the Supervisory Board
12 Henkel 2020+
14 Management Board
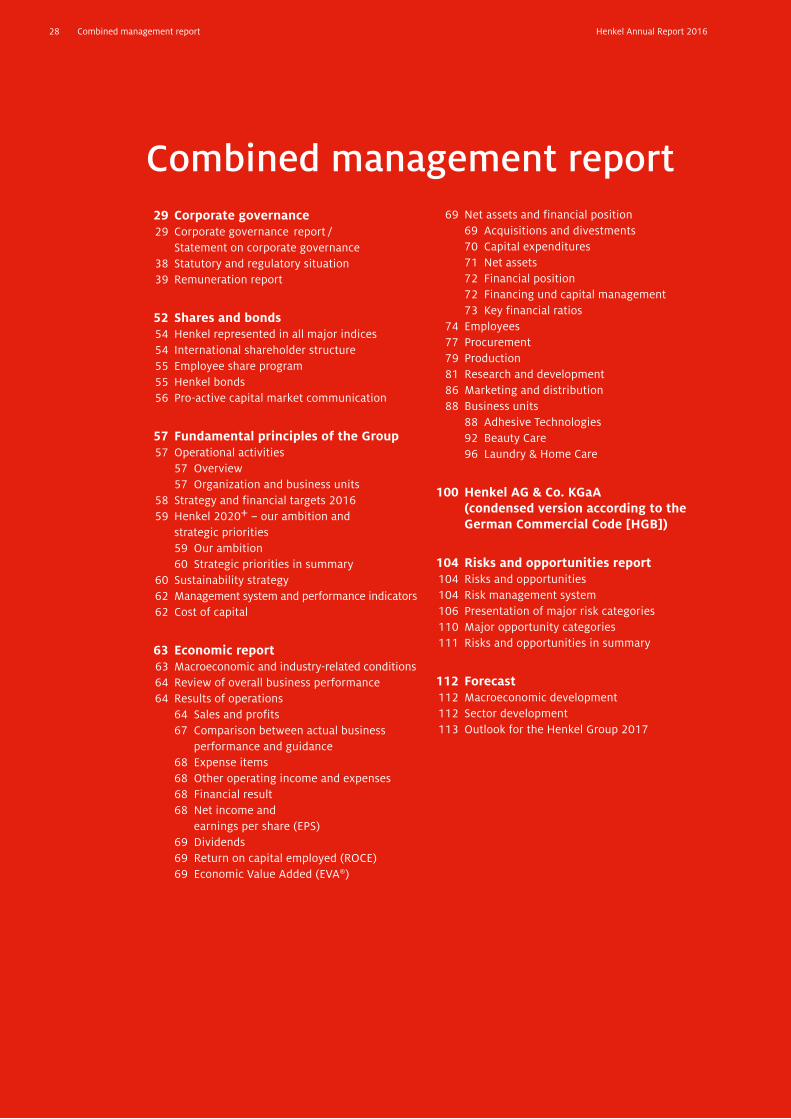
Combined management report 28 Management report subindex
29 Corporate governance
52 Shares and bonds
57 Fundamental principles of the Group
63 Economic report
88 Business units
100 Henkel AG & Co. KGaA (condensed version according to the German Commercial Code [HGB])
104 Risks and opportunities report
112 Forecast
Consolidated financial statements
114 Consolidated financial statements subindex
116 Consolidated statement of financial position
118 Consolidated statement of income
118 Consolidated statement of comprehensive income
119 Consolidated statement of changes in equity
120 Consolidated statement of cash flows
121 Notes to the consolidated financial statements
179 Subsequent events
180 Independent Auditor’s Report
183 Responsibility statement by the Personally Liable Partner
184 Corporate management bodies of Henkel AG & Co. KGaA
Further information 188 Quarterly breakdown of key financials
189 Multi-year summary
190 Index of tables and graphs
192 Glossary
194 Credits
195 Contacts Financial calendar
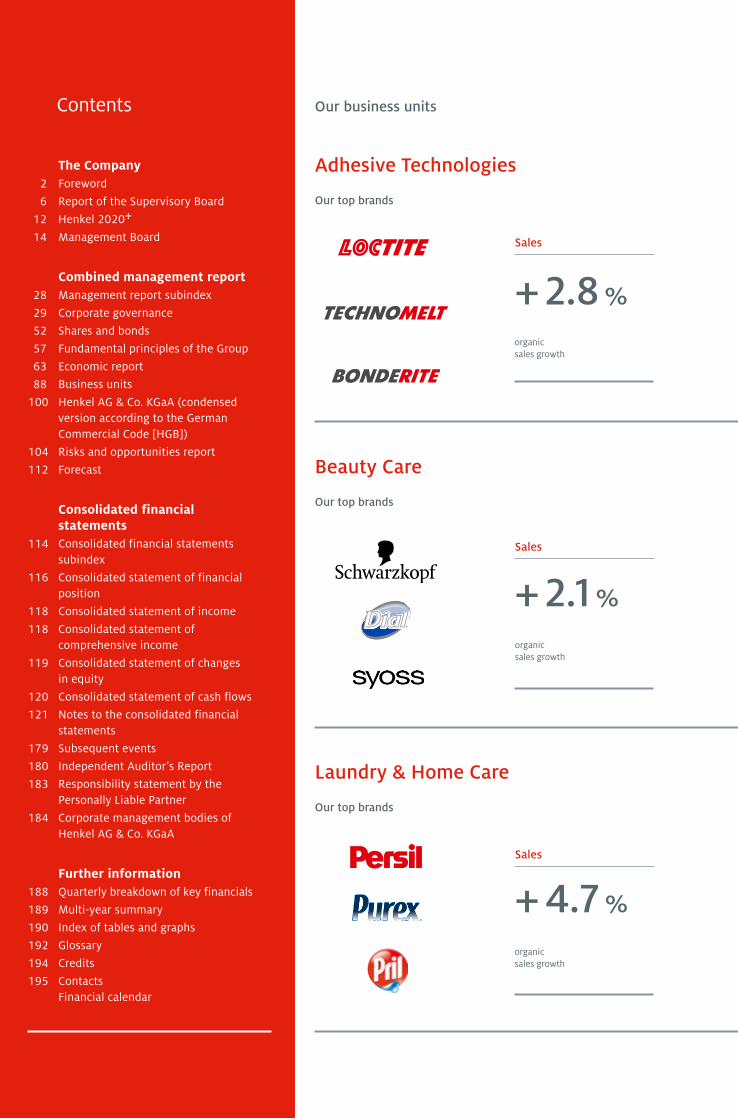
Contents Our business units
Laundry & Home Care
Our top brands
+ 4.7 %organic sales growth
Sales
Beauty Care
Our top brands
+ 2.1 %organic sales growth
Sales
Adhesive Technologies
Our top brands
+ 2.8 %organic sales growth
Sales
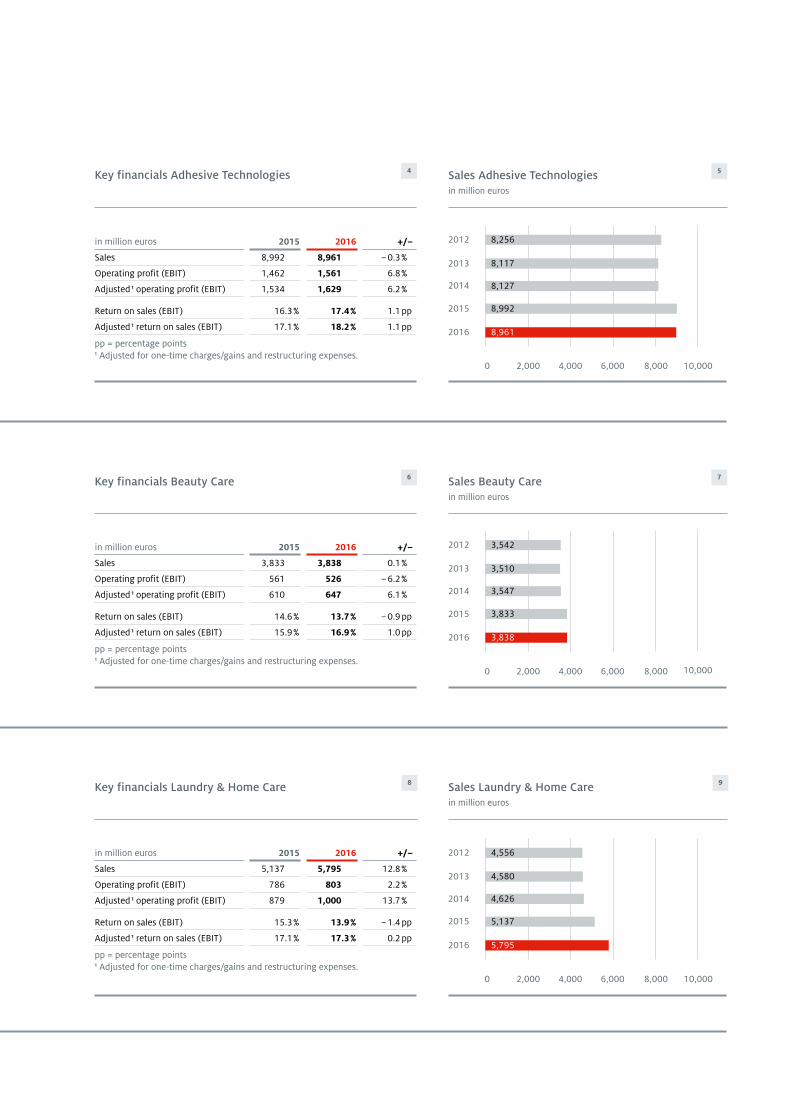
in million euros 2015 2016 +/–
Sales 5,137 5,795 12.8 %
Operating profit (EBIT) 786 803 2.2 %
Adjusted 1 operating profit (EBIT) 879 1,000 13.7 %
Return on sales (EBIT) 15.3 % 13.9 % – 1.4 pp
Adjusted 1 return on sales (EBIT) 17.1 % 17.3 % 0.2 pp
pp = percentage points1 Adjusted for one-time charges/gains and restructuring expenses.
Key financials Laundry & Home Care
8 9
4,626
4,556
5,137
4,580
5,795
Sales Laundry & Home Care in million euros
0 2,000 4,000 6,000 8,000
2014
2013
2012
2015
2016
10,000
in million euros 2015 2016 +/–
Sales 3,833 3,838 0.1 %
Operating profit (EBIT) 561 526 – 6.2 %
Adjusted 1 operating profit (EBIT) 610 647 6.1 %
Return on sales (EBIT) 14.6 % 13.7 % – 0.9 pp
Adjusted 1 return on sales (EBIT) 15.9 % 16.9 % 1.0 pp
pp = percentage points1 Adjusted for one-time charges/gains and restructuring expenses.
Key financials Beauty Care 6
3,547
3,542
3,833
3,510
3,838
Sales Beauty Care 7 in million euros
0 2,000 4,000 6,000 8,000
2014
2012
2015
2016
2013
10,000
in million euros 2015 2016 +/–
Sales 8,992 8,961 – 0.3 %
Operating profit (EBIT) 1,462 1,561 6.8 %
Adjusted 1 operating profit (EBIT) 1,534 1,629 6.2 %
Return on sales (EBIT) 16.3 % 17.4 % 1.1 pp
Adjusted 1 return on sales (EBIT) 17.1 % 18.2 % 1.1 pp
pp = percentage points1 Adjusted for one-time charges/gains and restructuring expenses.
Key financials Adhesive Technologies 4
8,127
8,256
8,992
8,117
8,961
Sales Adhesive Technologies 5 in million euros
0 2,000 4,000 6,000 8,000
2014
2013
2012
2015
2016
10,000
2016 2016
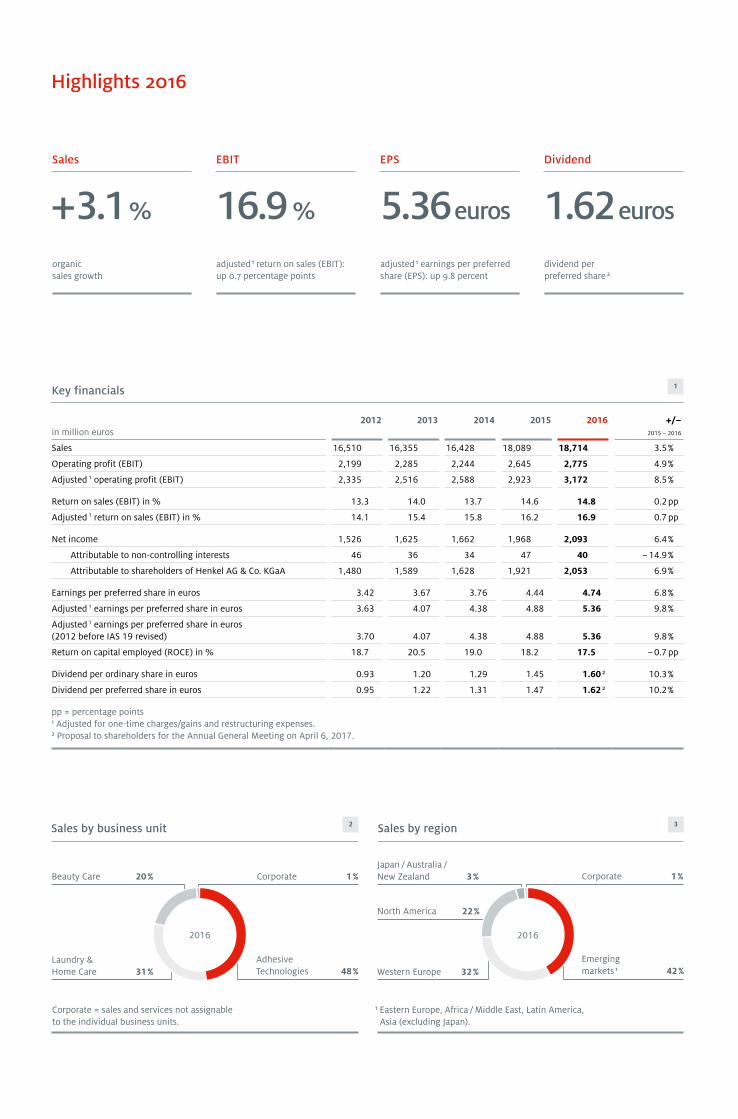
Highlights 2016
Sales
+ 3.1 %organic sales growth
EBIT
16.9 %adjusted 1 return on sales (EBIT): up 0.7 percentage points
EPS
5.36 euros
adjusted 1 earnings per preferred share (EPS): up 9.8 percent
Dividend
1.62 euros
dividend per preferred share 2
1Key financials
in million euros2012 2013 2014 2015 2016 +/–
2015 – 2016
Sales 16,510 16,355 16,428 18,089 18,714 3.5 %
Operating profit (EBIT) 2,199 2,285 2,244 2,645 2,775 4.9 %
Adjusted 1 operating profit (EBIT) 2,335 2,516 2,588 2,923 3,172 8.5 %
Return on sales (EBIT) in % 13.3 14.0 13.7 14.6 14.8 0.2 pp
Adjusted 1 return on sales (EBIT) in % 14.1 15.4 15.8 16.2 16.9 0.7 pp
Net income 1,526 1,625 1,662 1,968 2,093 6.4 %
Attributable to non-controlling interests 46 36 34 47 40 – 14.9 %
Attributable to shareholders of Henkel AG & Co. KGaA 1,480 1,589 1,628 1,921 2,053 6.9 %
Earnings per preferred share in euros 3.42 3.67 3.76 4.44 4.74 6.8 %
Adjusted 1 earnings per preferred share in euros 3.63 4.07 4.38 4.88 5.36 9.8 %
Adjusted 1 earnings per preferred share in euros (2012 before IAS 19 revised) 3.70 4.07 4.38 4.88 5.36 9.8 %
Return on capital employed (ROCE) in % 18.7 20.5 19.0 18.2 17.5 – 0.7 pp
Dividend per ordinary share in euros 0.93 1.20 1.29 1.45 1.60 2 10.3 %
Dividend per preferred share in euros 0.95 1.22 1.31 1.47 1.62 2 10.2 %
pp = percentage points1 Adjusted for one-time charges/gains and restructuring expenses. 2 Proposal to shareholders for the Annual General Meeting on April 6, 2017.
2 3
Adhesive Technologies 48 %
Laundry & Home Care 31 %
Beauty Care 20 %
Sales by business unit Sales by region
Corporate 1 %
Emerging markets 1 42 %Western Europe 32 %
Japan / Australia / New Zealand 3 %
North America 22 %
Corporate 1 %
Corporate = sales and services not assignable to the individual business units.
1 Eastern Europe, Africa / Middle East, Latin America, Asia (excluding Japan).
Our values
We put our customers and consumers at the center of what we do.
We value, challenge and reward our people.
We drive excellent sustainable financial performance.
We are committed to leadership in sustainability.
We shape our future with a strong entrepreneurial spirit based on our family business tradition.
Our vis ion
Leading with our innovations, brands and technologies.
Our mission
Serving our customers and consumers worldwide as the most trusted partner with leading positions in all relevant markets and categories – as a passionate team united by shared values.
Creating sustainable value
Our purpose

2 Henkel Annual Report 2016
“ Our ambition is to generate more profitable growth and to become more customer-focused, innovative, agile and digital.”
Hans Van Bylen
Chairman of the Management Board
3Henkel Annual Report 2016
2016 was a very special year for Henkel. We celebrated our 140th birthday, agreed and closed the second-largest acquisition in our company’s history, achieved new record levels of sales and earnings, met our financial targets for the year – and at the end of 2016, we announced our ambitions and strategic priorities for 2020 and beyond.
We are committed to continue our successful development and create sustainable value based on a strong foundation: We hold top positions with our different businesses in key markets, categories and industry segments around the world and a well-diversified portfolio with strong brands and leading technologies. We have an excellent track record of financial performance and a strong reputation in the financial markets. As a recognized leader in sustainability, we drive progress along the entire value chain – from our suppliers to our customers and consumers. All of this is only possible thanks to a highly engaged and passionate global team, united by a common purpose and strong values.
Strong performance in 2016
In fiscal 2016, we achieved new record levels for sales and earnings and met our financial targets for the year in a challenging and volatile market environment. Our shares again out-performed the DAX.
Henkel Group sales grew to 18,714 million euros compared to 18,089 million euros in the previous year. Organic sales growth was 3.1 percent. Adjusted ¹ earnings before interest and taxes (EBIT) grew by 8.5 percent to 3,172 million euros compared to 2,923 million euros. Adjusted return on sales improved to 16.9 percent compared to 16.2 percent. Adjusted earnings per preferred share grew to 5.36 euros, an increase of 9.8 percent compared to 4.88 euros in the previous year.
All three business units again delivered solid organic growth and further improved their results in 2016. Emerging markets generated total sales of 7,814 million euros and strong organic growth of 6.8 percent. We also achieved positive organic sales growth in our mature markets.
At our Annual General Meeting on April 6, 2017, we will propose to our shareholders a dividend payment of 1.62 euros per preferred share. This represents an increase of 10.2 percent compared to the 1.47 euros paid out in 2016.
In summary, 2016 was a very important and successful year for Henkel: We delivered a strong business performance, strengthened our company and laid the foundation to continue our successful development in the future.
2016 was also a special year for me, personally. In January, the Shareholders’ Committee decided to name me as new Chairman of the Management Board of Henkel. After more than 30 years with the company and more than 10 years on the Management Board, I was honored by the trust expressed through this appointment. On May 1, 2016, I took on my new role, committed to continue the successful development of our company in the future together with our strong global team.
At this point, I would also like to thank Kasper Rorsted, Chairman of the Management Board of Henkel from 2008 until 2016, for his significant contribution to Henkel’s successful evolution during this period. Under his leadership, our company has become more competitive, more efficient and more successful.
organic sales growth.
+ 3.1 %
adjusted 1 return on sales.
16.9 %
adjusted 1 earnings per preferred share.
+ 9.8 %
1 Adjusted for one-time charges/gains and restructuring expenses.
4 Henkel Annual Report 2016
Strategy cycle 2013 – 2016
The fiscal year 2016 also marks the end of our strategy cycle 2013 – 2016. For this period, Henkel had defined ambitious financial targets of 20 billion euros in total sales, 10 billion euros of which in emerging markets, and a compound annual growth rate (CAGR) of 10 percent in adjusted earnings per preferred share.
Henkel delivered a strong business performance over the past four years. We delivered good organic sales growth in key markets, gaining market share thanks to our strong brands and innovations. However, we faced substantial negative currency impacts over the four-year period, mostly in emerging markets. The translation to our reporting currency, the euro, had a net negative effect in excess of 1 billion euros on our global sales and of around 1.5 billion euros on our emerging markets sales ambition.
As we continuously improved efficiency, we were able to deliver 9.7 percent adjusted earnings per preferred share CAGR over the period 2013 – 2016 despite significant negative currency impacts on our earnings. This is a very strong performance which differentiates Henkel from its key competitors in both the consumer and the industrial businesses.
Strengthening Henkel
In June 2016, we announced the acquisition of The Sun Products Corporation, based in Wilton, Connecticut, USA, for a total value of around 3.2 billion euros. This is the second-largest acqui-sition in our company’s history. On September 1, we closed the transaction and started the integration process, which is now well underway. The acquisition of The Sun Products Corpora-tion marks a step change for our Laundry & Home Care business, adds highly attractive and established brands to our portfolio and propels Henkel to a strong number 2 position in the United States, the world’s largest laundry and home care market, as well as in Canada.
Shaping our successful future: Henkel 2020+
We are proud of our unique company culture, expressed by our purpose, vision, mission and values, which create a clear framework for how we do business, run our company and act responsibly in everything we do.
We want to create sustainable value – for all our stakeholders. This purpose unites our employees and is complemented by a set of strong values: customers and consumers, people, financial performance, sustainability, and family business.
5Henkel Annual Report 2016
Through to 2020 and beyond, our ambition for Henkel is to generate more profitable growth and to become more customer-focused, innovative, agile and digital. In addition, we will pro-mote sustainability in our business activities along the entire value chain, reinforcing our long-standing commitment to leadership in sustainability.
Over the next four years, we aim to generate average organic sales growth of between 2 and 4 percent. For adjusted earnings per preferred share, our target is a compound annual growth rate (CAGR) of 7 to 9 percent. This ambition for EPS growth includes the impact of currency developments but excludes major acquisitions and share buy-backs. In addition, we will strive to improve our adjusted EBIT margin. We are also aiming for further expansion of our free cash flow.
In order to achieve our ambitions, we have defined four clear strategic priorities: drive growth, accelerate digitalization, increase agility and fund growth. Together with our values, these priorities define our focus areas through to 2020.
We thank you for your continued trust and support
On behalf of the Management Board, I would like to thank all our employees around the world for their passion and relentless focus on driving business success, engaging with our customers and consumers, developing innovative solutions and strengthening our brands. Their commit-ment makes the difference for our success.
We are grateful to our supervisory bodies for their valuable advice and would also like to thank you, our shareholders, for your continued trust and support. And finally, we would like to thank our customers and consumers around the world for their confidence in our company, our strong brands and leading technologies.
We are fully committed to creating sustainable value for you.
Düsseldorf, January 30, 2017
Sincerely,
Hans Van Bylen
Chairman of the Management Board
6 Henkel Annual Report 2016Report of the Supervisory Board
“ Given our successful business performance and clear strategic priorities, we believe that Henkel is well equipped to face the future.”
Dr. Simone Bagel-Trah
Chairwoman of the Shareholders’ Committee and the Supervisory Board
7Henkel Annual Report 2016 Report of the Supervisory Board
The economic and political environment in which Henkel operates again proved to be challenging in 2016, with widespread uncertainty prevailing. Global economic growth was no more than moderate overall, and some emerging markets lost momentum. Fluctuations on the currency markets were again severe. In spite of these general conditions, we are very satisfied with developments in fiscal 2016. Henkel’s business performance was again strong, with both sales and profits reaching new all-time highs. All of our business units contributed to this success with organic sales growth and a marked improvement in earning power.
In the 140th year since it was founded, Henkel is extremely well placed with its diversified portfolio, leading positions in its markets and categories, and its strong brands and innovative technologies.
On behalf of the Supervisory Board, I would like to thank all of our employees at Henkel for their dedicated commitment and help in securing the continuing successful development of our company. My thanks are equally due to the members of the Management Board who have steered the company successfully through these challenging times. I am also grateful to our employees’ representatives and works councils for their unwavering constructive support in growing the company.
Last but not least, I extend my special thanks to you, our shareholders, for your continued confidence in our company, its management and employees, and our brands and technologies over this past fiscal year.
Ongoing dialog with the Management Board
In fiscal year 2016, the Supervisory Board continued to discharge its duties diligently in accordance with the legal statutes, Articles of Association and rules of procedure governing our actions. In particular, we consistently monitored the work of the Management Board, advising and supporting it in its stewardship, in the strategic development of the corporation, and in decisions relating to matters of major importance.
In 2016, the Management Board and Supervisory Board continued to cooperate through extensive dialog founded on mutual trust and confidence. The Man-age ment Board kept us regularly and extensively informed of all major issues affecting the corporation’s business and our Group companies with prompt written and oral reports. Specifically, the Management Board reported on the business situation, operational development, business policy, profitability issues, our short-term and long-term corporate, financial and personnel plans, as well as capital expenditures and organizational measures. Quarterly reports focused on the sales and profits of Henkel Group as a whole, with further analysis by business unit and region. The members of the Supervisory Board consistently had sufficient opportunity to critically review and address the issues raised by each of these reports and to provide their individual guidance in both the Audit Committee and in plenary Supervisory Board meetings.
Outside of Supervisory Board meetings, the Chairman of the Audit Committee and I, as Chairwoman of the Supervisory Board, remained in regular contact with individual members of the Management Board or with the Management Board as a whole. This procedure ensured that we were constantly aware of current business developments and significant events. The other members were informed of major issues no later than by the next Supervisory Board or committee meeting.
8 Henkel Annual Report 2016Report of the Supervisory Board
The Supervisory Board and the Audit Committee each held four regular meetings in the reporting year. One extraordinary meeting of the Supervisory Board was also convened. Attendance at the Supervisory Board and committee meetings was around 95 per-cent and around 83 percent respectively.
There were no indications of conflicts of interest involving Management Board or Supervisory Board members that required immediate disclosure to the Supervisory Board and reporting to the Annual General Meeting.
Major issues discussed at Supervisory Board meetings
In each of our meetings, we discussed the reports submitted by the Management Board, conferring with it on the development of the corporation and on strategic issues. We also discussed the overall eco-nomic situation and Henkel’s business performance.
In our meeting on February 23, 2016, we focused on approving the annual and consolidated financial statements for 2015, including the risk report and corporate governance report. We also discussed the findings from the Supervisory Board efficiency audit, and approved both the 2016 Declaration of Compli-ance and our proposals for resolution by the 2016 Annual General Meeting. A detailed report of this was included in our last Annual Report. At the same meeting, we discussed the performance of our busi-ness units, the initiatives of our Finance division, and personnel management in Western Europe.
Key items on the agenda for our meeting on April 11, 2016 included the constitution of the Supervisory Board and general business performance in the first few months of the year, together with the status of our ONE!Global Supply Chain project and the initia-tives and actions that were put in place in the indi-vidual regions to strengthen our global team, such as improved recruitment concepts, flexible work time models, job rotations and training programs. We also addressed the integration of our newly acquired companies.
Our meeting on September 23, 2016 included a detailed discussion of the acquisition and integra-tion of The Sun Products Corporation, a laundry and home care company based in Wilton, Connecticut, USA, and of business performance and market trends in North America. We also addressed issues relating to Henkel’s future strategic direction.
In an extraordinary meeting on November 16, 2016, we concentrated specifically on our new strategic priorities that will shape the company up to 2020 and beyond, on the implementation of these priori-ties in the individual business units and on our financial ambition for the period between 2017 and 2020.
Our meeting on December 9, 2016 focused on the expected results for 2016 and our assets and financial planning for fiscal 2017. We also discussed in detail the associated budgets of our business units based on comprehensive documentation. The challenges that our people face as a result of increasing digitali-zation formed a further topic for discussion.
Supervisory Board committees
In order to enable us to efficiently comply with the duties incumbent upon us according to legal statute and our Articles of Association, we have established an Audit Committee and a Nominations Committee. The Audit Committee was chaired in the year under review by Prof. Dr. Theo Siegert, who complies with the statutory requirements of impartiality and exper-tise in the fields of accounting or auditing and brings experience in the application of accounting principles and internal control procedures. For more details on the responsibilities and composition of these com-mittees, please refer to the corporate governance report on pages 29 to 38 and the membership lists on page 185 of this Annual Report.
9Henkel Annual Report 2016 Report of the Supervisory Board
Committee activities
Following the appointment of the external auditor by the 2016 Annual General Meeting, it was mandated by the Audit Committee to audit the annual financial statements and the consolidated financial state-ments, and to review the interim financial reports for 2016. The audit fee and focus areas of the audit were also established. The Audit Committee again obtained the necessary validation of auditor inde-pendence for the performance of these tasks. The auditor has informed the Audit Committee that there are no circumstances that might give rise to a conflict of interest in the execution of its duties.
The Audit Committee met four times in the year under review. The Chairman of the Audit Committee also remained in regular contact with the auditor outside of the meetings. The meetings and resolu-tions were prepared through the provision of reports and other information by the Management Board. The Chair of the Committee reported promptly and in full to the plenary Supervisory Board on the con-tent and results of each of the Committee meetings.
The company and Group accounts, including the interim (quarterly and half-year) financial reports were discussed at all Audit Committee meetings, with all matters arising being duly examined with the Management Board. The three meetings at which we discussed and approved the interim financial reports were attended by the auditor. The latter reported on the results of the reviews and on the main issues and occurrences relevant to the work of the Audit Committee. There were no objections raised in response to these reports.
The Audit Committee also focused in greater detail on the accounting process and the efficacy and fur-ther development of the Group-wide Internal Control and Risk Management systems. The efficiency of the risk management system was reviewed, based on
the risk reports of previous years. In addition, the Audit Committee received the report of the General Counsel & Chief Compliance Officer regarding major litigations and compliance within the Group, as well as the status report of the Head of Internal Audit, and approved the audit plan prepared and submitted by Internal Audit. This extends to examining the func-tional efficiency and efficacy of the Internal Control System and our compliance organization. Another key item on the agenda was implementation of the EU Audit Reform: We revised the catalog of permissi-ble non-audit-related services that an auditor may provide, and defined relevant approval processes, including monetary caps. The Audit Committee like-wise discussed treasury risks and their management.
At its meeting on February 20, 2017, attended by the auditor, the Audit Committee discussed the annual and consolidated financial statements for fiscal 2016, including the audit reports, the associated pro-posal for appropriation of profit, and the risk report, and prepared the corresponding resolutions for the Supervisory Board. It also recommended that the Supervisory Board should propose to the Annual General Meeting the election of KPMG as auditor for fiscal year 2017. A declaration from the auditor asserting its independence was again duly received, accompanied by details pertaining to non-audit ser-vices rendered in fiscal 2016 and those envisioned for fiscal 2017. There was no evidence of any bias or partiality on the part of the auditor.
As in previous years, other members of the Supervi-sory Board took part as guests in this specifically accounting-related meeting of the Audit Committee.
As already reported, the members of the Nomina-tions Committee prepared the resolution for the Supervisory Board relating to its recommendations for the election of new shareholder representatives at the 2016 Annual General Meeting.
10 Henkel Annual Report 2016Report of the Supervisory Board
Corporate governance and declaration of compliance
The Supervisory Board again dealt with questions of corporate governance in the reporting year. Details of Henkel’s corporate governance can be found in the management report on corporate governance (pages 29 to 38 of this Annual Report), with which we fully acquiesce.
At our meeting on February 21, 2017, we discussed and approved the joint Declaration of Compliance for 2017 to be submitted by the Management Board, Shareholders’ Committee and Supervisory Board, as specified in the German Corporate Governance Code [DCGK]. The full wording of the current and previous declarations of compliance can be found on the com-pany website.
Annual and consolidated financial statements / Audit
In its capacity as auditor appointed for 2016 by the Annual General Meeting, KPMG examined the annual financial statements prepared by the Management Board in accordance with the provisions of the Ger-man Commercial Code [HGB], and the consolidated financial statements, together with the consolidated management report, which has been combined with the management report for Henkel AG & Co. KGaA for 2016. The consolidated financial statements were prepared in accordance with International Financial Reporting Standards (IFRS) as endorsed by the Euro-pean Union (EU), and in accordance with the supple-mentary German statutory provisions pursuant to Section 315a (1) of the HGB. The consolidated financial statements in their present form exempt us from the requirement to prepare consolidated financial state-ments in accordance with German law.
KPMG conducted its audits in accordance with Sec-tion 317 of the HGB and German generally accepted standards for the audit of financial statements pro-mulgated by the Institute of Public Auditors in Germany [Institut der Wirtschaftsprüfer, IDW]. Unqualified audit opinions were issued for both the annual and the consolidated financial statements.
The annual financial statements, consolidated finan-cial statements and combined management report, the audit reports of KPMG and the recommendations
by the Management Board for the appropriation of the profit made by Henkel AG & Co. KGaA were pre-sented in good time to all members of the Super-visory Board. We examined these documents and discussed them at our meeting on February 21, 2017. This was attended by the auditor, which reported on its main audit findings. We received and approved the audit reports. The Chair of the Audit Committee provided the plenary session of the Supervisory Board with a detailed account of the treatment of the annual financial statements and the consolidated financial statements by the Audit Committee. Having received the final results of the review conducted by the Audit Committee and concluded our own exam-ination, we see no reason for objection to the afore-mentioned documents. We have agreed to the results of the audit. The assessment by the Management Board of the position of the company and the Group coincides with our own appraisal. At our meeting on February 21, 2017, we concurred with the recom-mendations of the Audit Committee and therefore approved the annual financial statements, the con-solidated financial statements and the combined management report as prepared by the Management Board.
Additionally, we discussed and approved the proposal by the Management Board to pay out of the unappro-priated profit of Henkel AG & Co. KGaA a dividend of 1.60 euros per ordinary share and of 1.62 euros per preferred share, and to carry the remainder and the amount attributable to the treasury shares held by the company at the time of the Annual General Meeting forward to the following year. This proposal takes into account the financial and earnings posi-tion of the corporation, its medium-term financial and investment planning, and the interests of our shareholders.
In our meeting on February 21, 2017, we also ratified our proposal for resolution by the Annual General Meeting relating to the appointment of the external auditor for the next fiscal year, based on the recom-mendations of the Audit Committee. Neither the recommendation by the Audit Committee nor the Supervisory Board’s proposal to elect KPMG as auditor for 2017 were unduly influenced by any third party; nor were agreements reached that might have restricted the choice of possible auditors.
11Henkel Annual Report 2016 Report of the Supervisory Board
Risk management
Risk management issues were examined not only by the Audit Committee but also the plenary Supervisory Board, with emphasis on the risk management system in place at Henkel and any major individual risks of which we needed to be notified. There were no iden-tifiable risks that might jeopardize the continued existence of the corporation as a going concern. The structure and function of the risk early warning system were also integral to the audit performed by KPMG, which found no cause for reservation. It is also our considered opinion that the risk management system corresponds to the statutory requirements and is fit for the purpose of early identification of developments that could endanger the continuation of the corporation as a going concern.
Changes in the Supervisory Board and Management Board
A number of changes took place in the composition of the Supervisory Board and Management Board, some of which we already reported on last year.
Béatrice Guillaume-Grabisch resigned from the Supervisory Board effective end of business on March 31, 2016. Boris Canessa and Ferdinand Groos left the Supervisory Board following the routine election of new shareholder representatives by the 2016 Annual General Meeting. Johann-Christoph Frey, Benedikt-Richard Freiherr von Herman and Timotheus Höttges were newly appointed to the Supervisory Board; all other shareholder represen-tatives were re-elected.
During its constituent meeting, I was elected to chair the Supervisory Board, and Winfried Zander was confirmed as Vice Chair. We also made new appoint-ments to the Audit and Nominations Committees.
Effective January 1, 2017, Mayc Nienhaus, employee representative, left the Supervisory Board and was replaced by Angelika Keller.
Kasper Rorsted left the company on April 30, 2016, at his own request. Hans Van Bylen was appointed new Chairman of the Management Board with effect from May 1, 2016.
Hans Van Bylen started his successful career at Henkel back in 1984 and has many years of experience man-aging different businesses of Henkel at international level. Prior to his appointment as Chairman of the Management Board, he had held responsibility on the Management Board for our Beauty Care business unit since 2005.
Pascal Houdayer, who had previously held the position of Corporate Senior Vice President in the Laundry & Home Care business unit since 2011, was appointed to the Management Board effective March 1, 2016, and succeeded Hans Van Bylen as Executive Vice President with lead responsibility for the Beauty Care business unit as of May 1, 2016.
We thanked the departing members of the Super-visory Board and Management Board – some of whom had been members for many years – for their successful dedication to the interests of the company. Our particular thanks go to Kasper Rorsted, who spent eight of his eleven years on the Management Board as Chairman, for driving Henkel’s successful business performance.
We are delighted to close fiscal 2016 on a successful note. At the same time, we expect 2017 and beyond to pose further challenges for both our employees and the company’s management. Given our successful business performance and clear strategic priorities, we believe that Henkel is well equipped to face the future.
We thank you for your ongoing trust and support.
Düsseldorf, February 21, 2017
On behalf of the Supervisory Board
Dr. Simone Bagel-Trah
(Chairwoman)
Drive Growth
Accelerate Digitalization
Increase Agility
Fund Growth
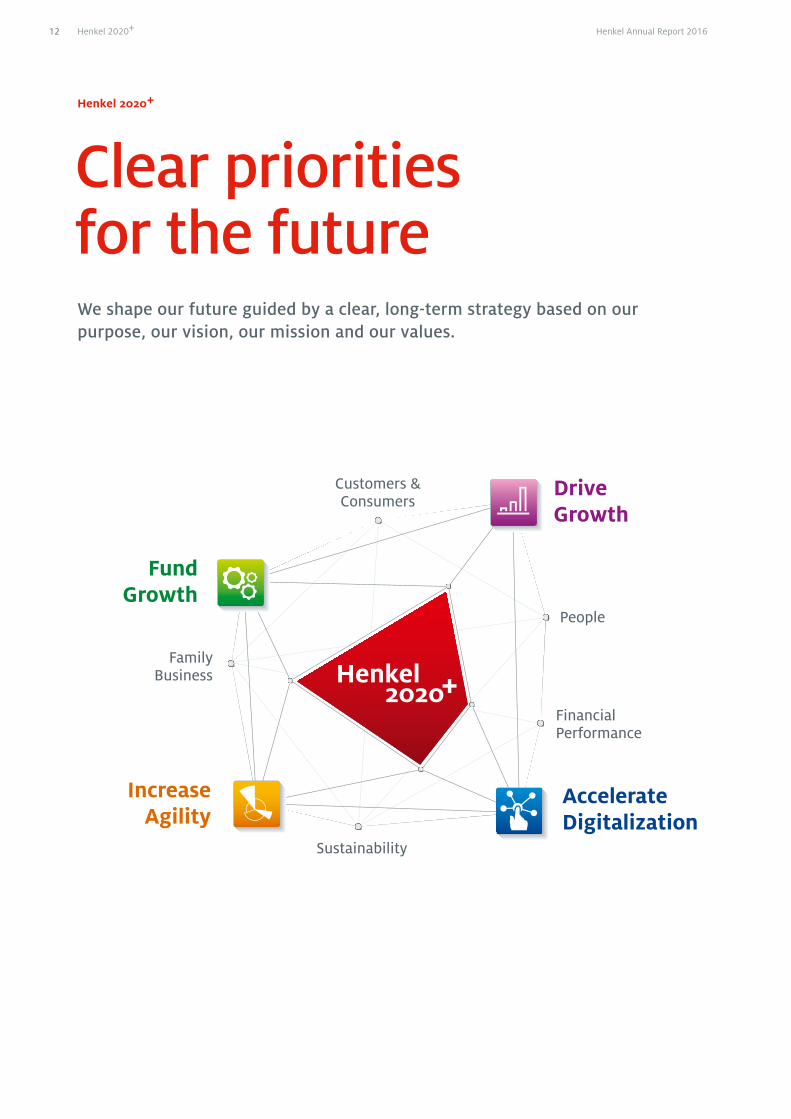
We shape our future guided by a clear, long-term strategy based on our purpose, our vision, our mission and our values.
Clear priorities for the future
Henkel 2020+
12 Henkel Annual Report 2016Henkel 2020+
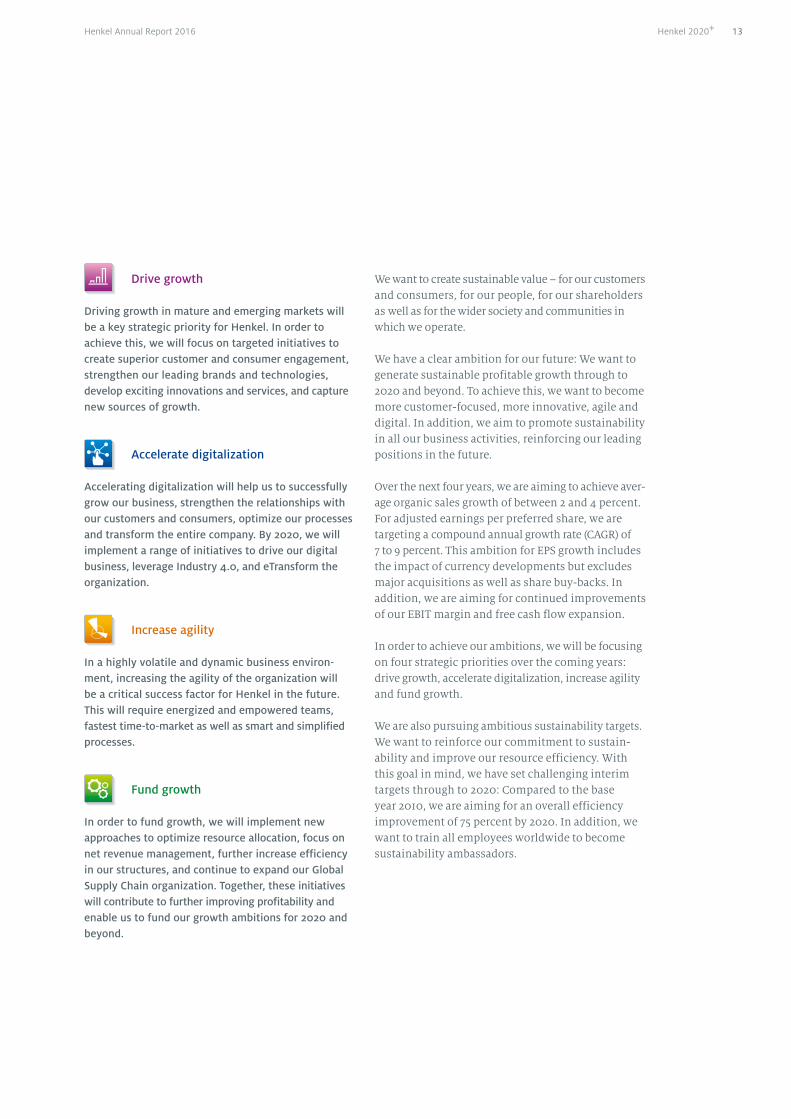
Drive growth
Driving growth in mature and emerging markets will be a key strategic priority for Henkel. In order to achieve this, we will focus on targeted initiatives to create superior customer and consumer engagement, strengthen our leading brands and technologies, develop exciting innovations and services, and capture new sources of growth.
Accelerate digitalization
Accelerating digitalization will help us to successfully grow our business, strengthen the relationships with our customers and consumers, optimize our processes and transform the entire company. By 2020, we will implement a range of initiatives to drive our digital business, leverage Industry 4.0, and eTransform the organization.
Increase agility
In a highly volatile and dynamic business environ-ment, increasing the agility of the organization will be a critical success factor for Henkel in the future. This will require energized and empowered teams, fastest time-to-market as well as smart and simplified processes.
Fund growth
In order to fund growth, we will implement new approaches to optimize resource allocation, focus on net revenue management, further increase efficiency in our structures, and continue to expand our Global Supply Chain organization. Together, these initiatives will contribute to further improving profitability and enable us to fund our growth ambitions for 2020 and beyond.
We want to create sustainable value – for our customers and consumers, for our people, for our shareholders as well as for the wider society and communities in which we operate.
We have a clear ambition for our future: We want to generate sustainable profitable growth through to 2020 and beyond. To achieve this, we want to become more customer-focused, more innovative, agile and digital. In addition, we aim to promote sustainability in all our business activities, reinforcing our leading positions in the future.
Over the next four years, we are aiming to achieve aver-age organic sales growth of between 2 and 4 percent. For adjusted earnings per preferred share, we are targeting a compound annual growth rate (CAGR) of 7 to 9 percent. This ambition for EPS growth includes the impact of currency developments but excludes major acquisitions as well as share buy-backs. In addition, we are aiming for continued improvements of our EBIT margin and free cash flow expansion.
In order to achieve our ambitions, we will be focusing on four strategic priorities over the coming years: drive growth, accelerate digitalization, increase agility and fund growth.
We are also pursuing ambitious sustainability targets. We want to reinforce our commitment to sustain-ability and improve our resource efficiency. With this goal in mind, we have set challenging interim targets through to 2020: Compared to the base year 2010, we are aiming for an overall efficiency improvement of 75 percent by 2020. In addition, we want to train all employees worldwide to become sustainability ambassadors.
13Henkel Annual Report 2016 Henkel 2020+
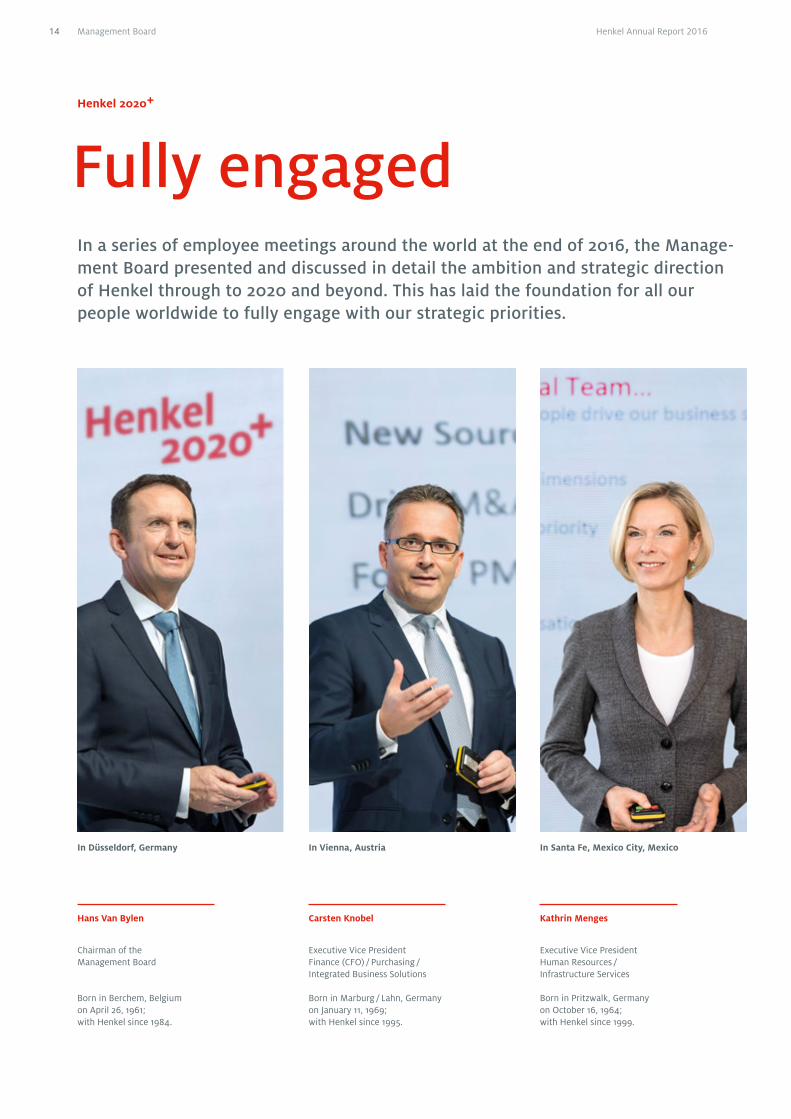
Fully engaged
Hans Van Bylen
Chairman of the Management Board
Born in Berchem, Belgium on April 26, 1961; with Henkel since 1984.
In Düsseldorf, Germany
Kathrin Menges
Executive Vice President Human Resources / Infra structure Services
Born in Pritzwalk, Germany on October 16, 1964; with Henkel since 1999.
In Santa Fe, Mexico City, Mexico
Carsten Knobel
Executive Vice President Finance (CFO) / Purchasing / Integrated Business Solutions
Born in Marburg / Lahn, Germany on January 11, 1969; with Henkel since 1995.
In Vienna, Austria
In a series of employee meetings around the world at the end of 2016, the Manage-ment Board presented and discussed in detail the ambition and strategic direction of Henkel through to 2020 and beyond. This has laid the foundation for all our people worldwide to fully engage with our strategic priorities.
Henkel 2020+
Management Board14 Henkel Annual Report 2016
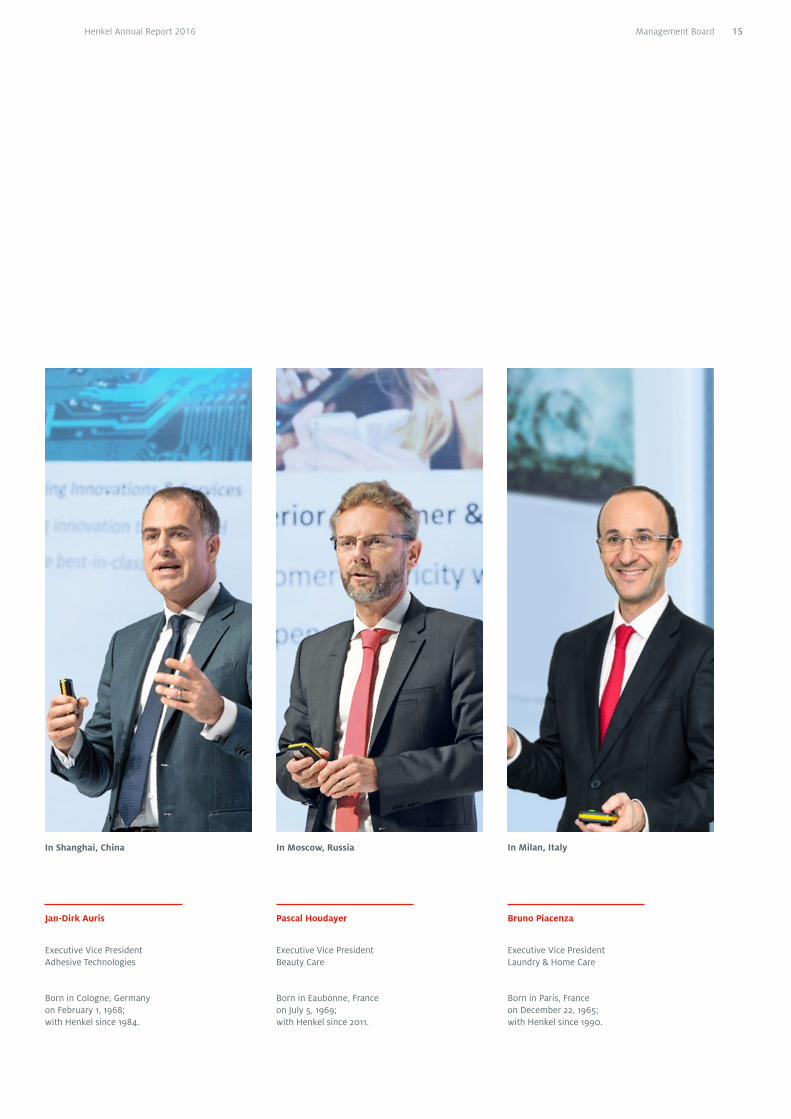
Jan-Dirk Auris
Executive Vice President Adhesive Technologies
Born in Cologne, Germany on February 1, 1968; with Henkel since 1984.
In Shanghai, China
Pascal Houdayer
Executive Vice President Beauty Care
Born in Eaubonne, France on July 5, 1969; with Henkel since 2011.
In Moscow, Russia
Bruno Piacenza
Executive Vice President Laundry & Home Care
Born in Paris, France on December 22, 1965; with Henkel since 1990.
In Milan, Italy
Management Board 15Henkel Annual Report 2016
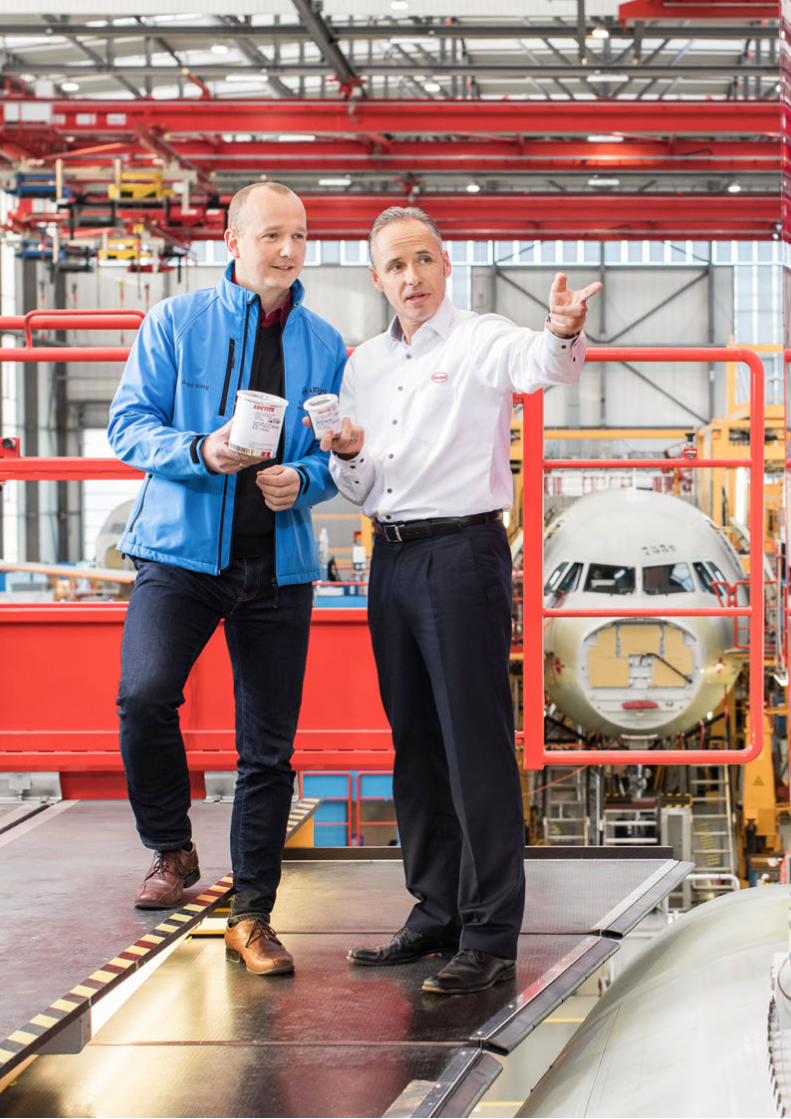
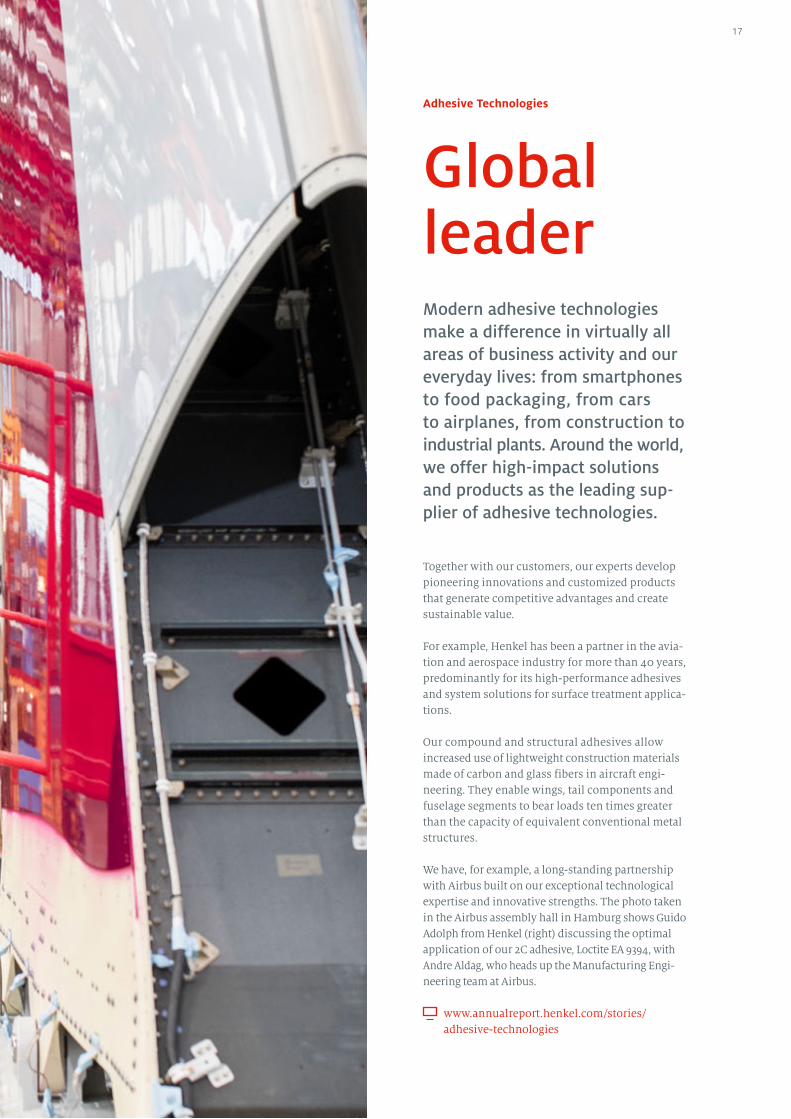
Adhesive Technologies
Global leaderModern adhesive technologies make a difference in virtually all areas of business activity and our everyday lives: from smartphones to food packaging, from cars to airplanes, from construction to industrial plants. Around the world, we offer high-impact solutions and products as the leading sup-plier of adhesive technologies.
Together with our customers, our experts develop pioneering innovations and customized products that generate competitive advantages and create sustainable value.
For example, Henkel has been a partner in the avia-tion and aerospace industry for more than 40 years, predominantly for its high- performance adhesives and system solutions for surface treatment applica-tions.
Our compound and structural adhesives allow increased use of lightweight construction materials made of carbon and glass fibers in aircraft engi-neering. They enable wings, tail components and fuselage segments to bear loads ten times greater than the capacity of equivalent conventional metal structures.
We have, for example, a long-standing partnership with Airbus built on our exceptional technological expertise and innovative strengths. The photo taken in the Airbus assembly hall in Hamburg shows Guido Adolph from Henkel (right) discussing the optimal application of our 2C adhesive, Loctite EA 9394, with Andre Aldag, who heads up the Manufacturing Engi-neering team at Airbus.
www.annualreport.henkel.com/stories/ adhesive-technologies
17

Beauty Care
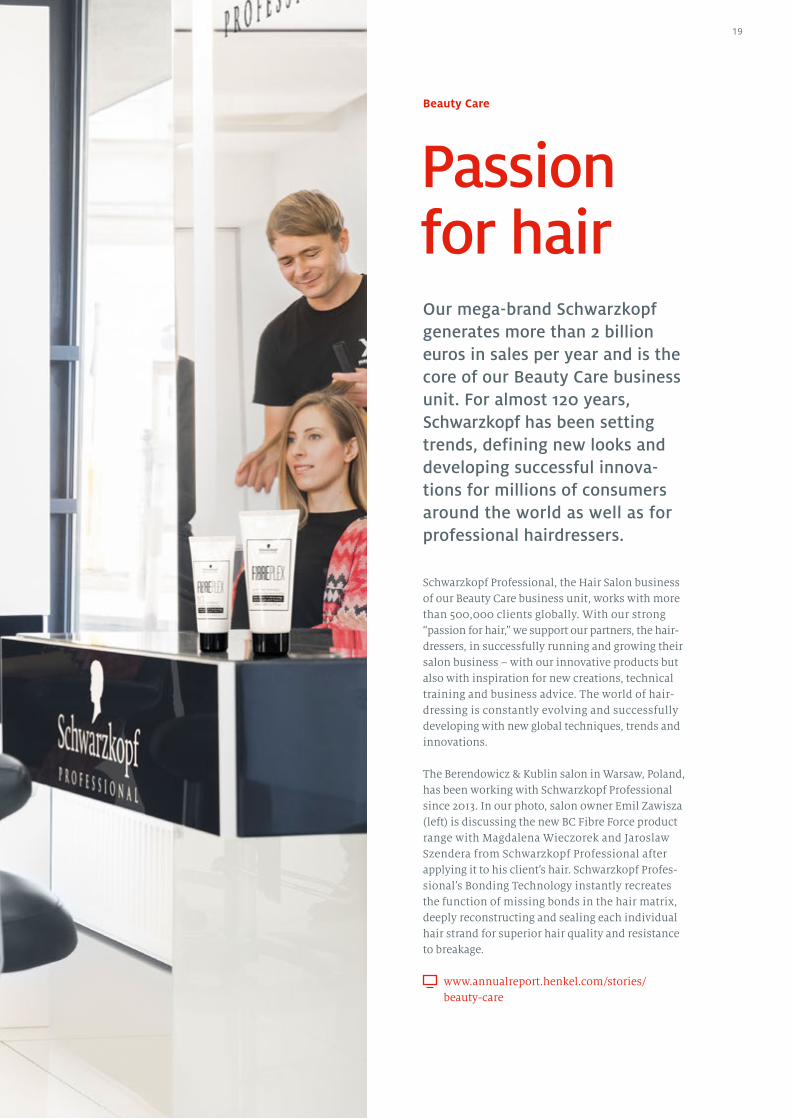
Passion for hairOur mega-brand Schwarzkopf generates more than 2 billion euros in sales per year and is the core of our Beauty Care business unit. For almost 120 years, Schwarzkopf has been setting trends, defining new looks and developing successful innova-tions for millions of consumers around the world as well as for professional hairdressers.
Schwarzkopf Professional, the Hair Salon business of our Beauty Care business unit, works with more than 500,000 clients globally. With our strong “passion for hair,” we support our partners, the hair-dressers, in successfully running and growing their salon business – with our innovative products but also with inspiration for new creations, technical training and business advice. The world of hair-dressing is constantly evolving and successfully developing with new global techniques, trends and innovations.
The Berendowicz & Kublin salon in Warsaw, Poland, has been working with Schwarzkopf Professional since 2013. In our photo, salon owner Emil Zawisza (left) is discussing the new BC Fibre Force product range with Magdalena Wieczorek and Jaroslaw Szendera from Schwarzkopf Professional after applying it to his client’s hair. Schwarzkopf Profes-sional’s Bonding Technology instantly recreates the function of missing bonds in the hair matrix, deeply reconstructing and sealing each individual hair strand for superior hair quality and resistance to breakage.
www.annualreport.henkel.com/stories/beauty-care
19
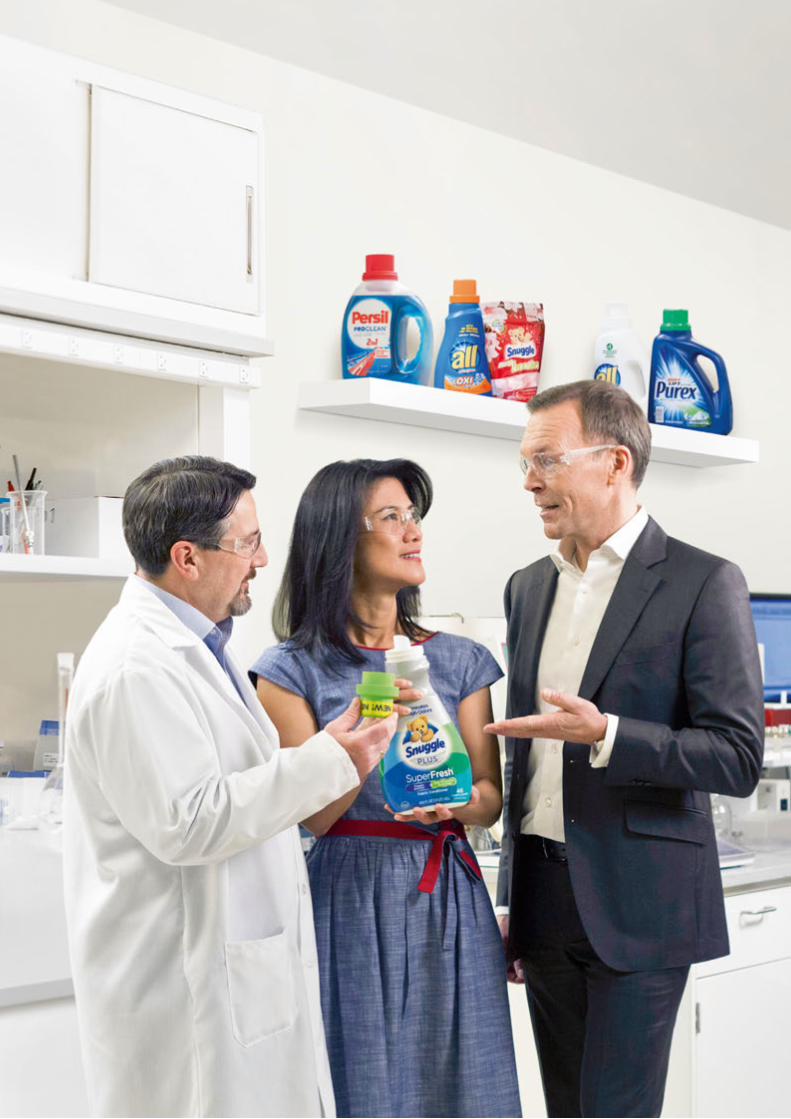
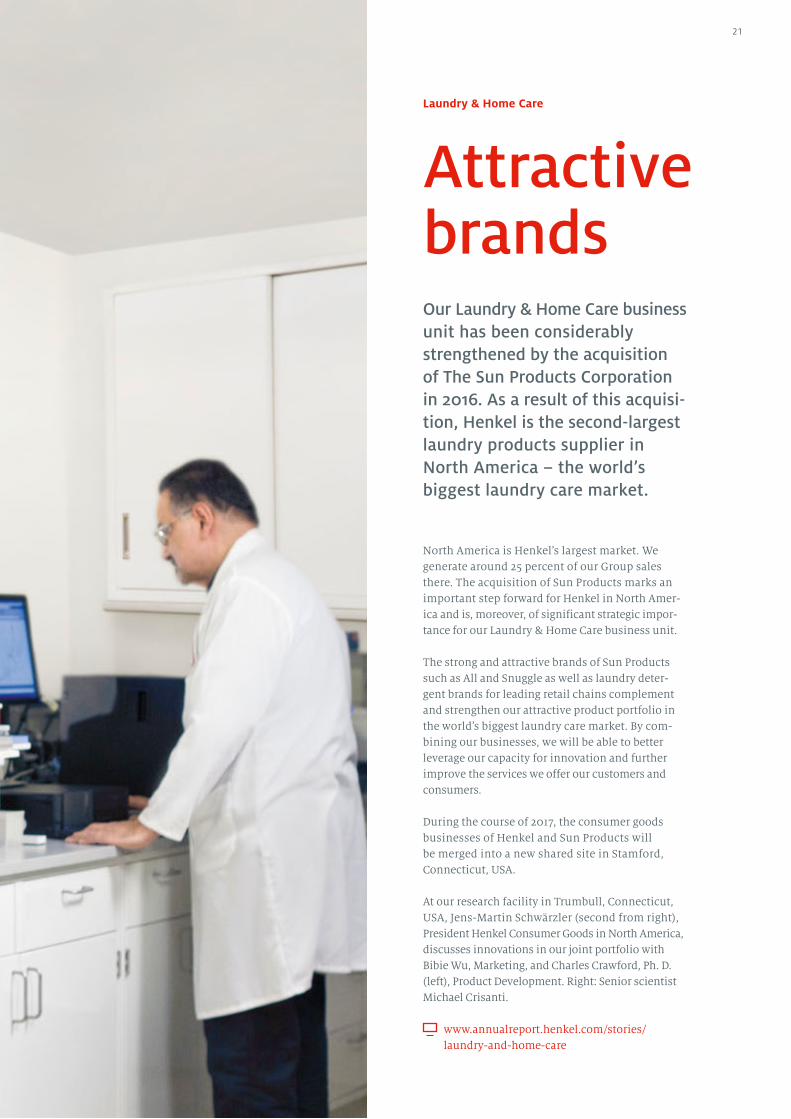
Attractive brands
North America is Henkel’s largest market. We generate around 25 percent of our Group sales there. The acquisition of Sun Products marks an important step forward for Henkel in North Amer-ica and is, moreover, of significant strategic impor-tance for our Laundry & Home Care business unit.
The strong and attractive brands of Sun Products such as All and Snuggle as well as laundry deter-gent brands for leading retail chains complement and strengthen our attractive product portfolio in the world’s biggest laundry care market. By com-bining our businesses, we will be able to better leverage our capacity for innovation and further improve the services we offer our customers and consumers.
During the course of 2017, the consumer goods businesses of Henkel and Sun Products will be merged into a new shared site in Stamford, Connecticut, USA.
At our research facility in Trumbull, Connecticut, USA, Jens-Martin Schwärzler (second from right), President Henkel Consumer Goods in North America, discusses innovations in our joint portfolio with Bibie Wu, Marketing, and Charles Crawford, Ph. D. (left), Product Development. Right: Senior scientist Michael Crisanti.
www.annualreport.henkel.com/stories/ laundry-and-home-care
Our Laundry & Home Care business unit has been considerably strengthened by the acquisition of The Sun Products Corporation in 2016. As a result of this acquisi-tion, Henkel is the second-largest laundry products supplier in North America – the world’s biggest laundry care market.
Laundry & Home Care
21

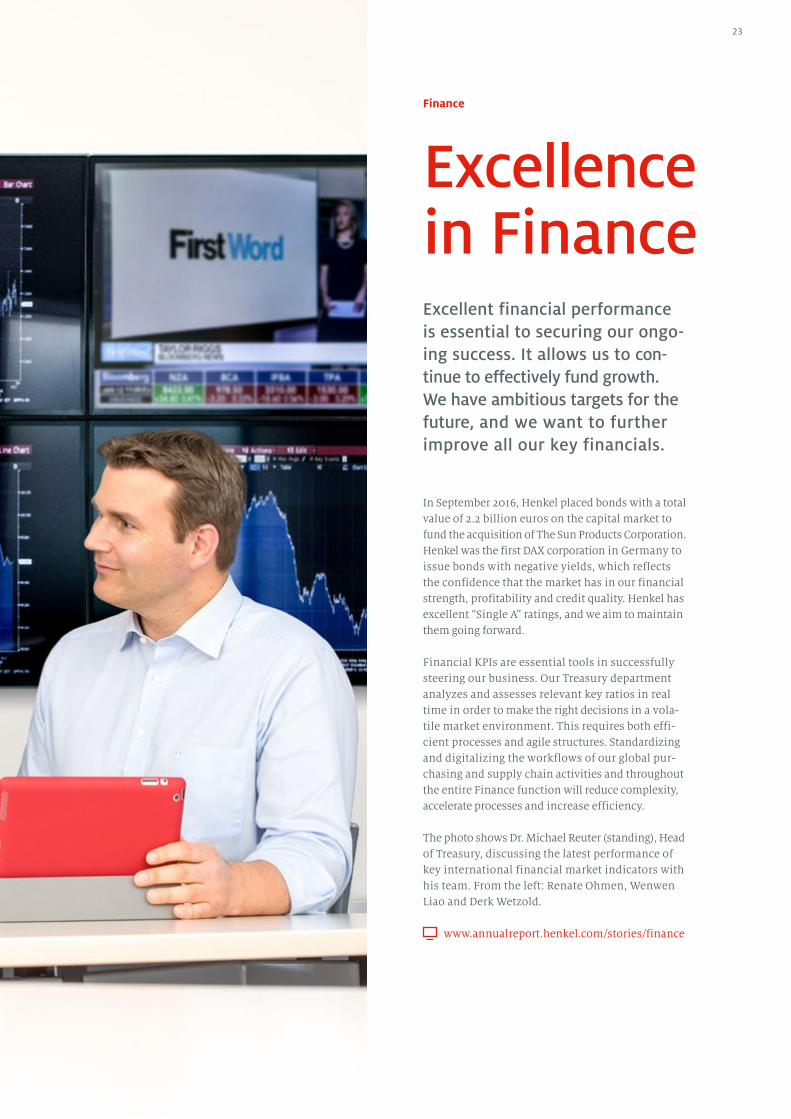
Finance
Excellence in Finance
In September 2016, Henkel placed bonds with a total value of 2.2 billion euros on the capital market to fund the acquisition of The Sun Products Corporation. Henkel was the first DAX corporation in Germany to issue bonds with negative yields, which reflects the confidence that the market has in our financial strength, profitability and credit quality. Henkel has excellent “Single A” ratings, and we aim to maintain them going forward.
Financial KPIs are essential tools in successfully steering our business. Our Treasury department analyzes and assesses relevant key ratios in real time in order to make the right decisions in a vola-tile market environment. This requires both effi-cient processes and agile structures. Standardizing and digitalizing the workflows of our global pur-chasing and supply chain activities and throughout the entire Finance function will reduce complexity, accelerate processes and increase efficiency.
The photo shows Dr. Michael Reuter (standing), Head of Treasury, discussing the latest performance of key international financial market indicators with his team. From the left: Renate Ohmen, Wenwen Liao and Derk Wetzold.
www.annualreport.henkel.com/stories/finance
Excellent financial performance is essential to securing our ongo-ing success. It allows us to con-tinue to effectively fund growth. We have ambitious targets for the future, and we want to further improve all our key financials.
23

People
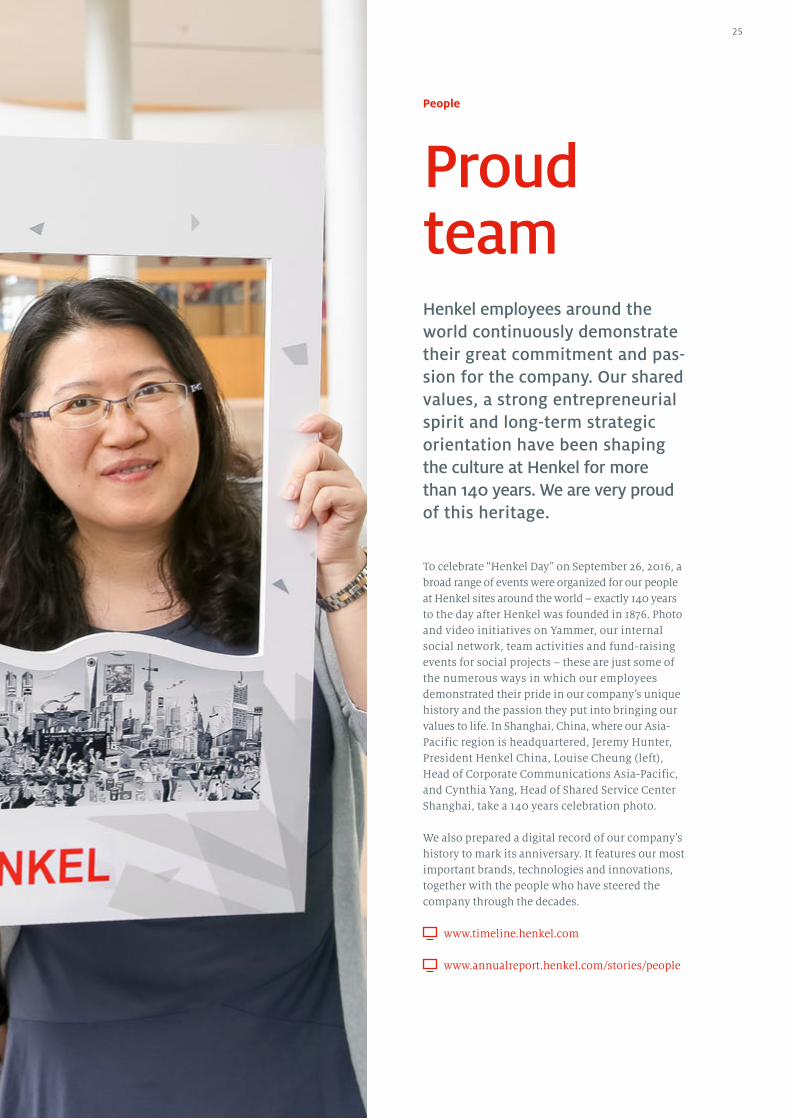
Proud team
To celebrate “Henkel Day” on September 26, 2016, a broad range of events were organized for our people at Henkel sites around the world – exactly 140 years to the day after Henkel was founded in 1876. Photo and video initiatives on Yammer, our internal social network, team activities and fund-raising events for social projects – these are just some of the numerous ways in which our employees demonstrated their pride in our company’s unique history and the passion they put into bringing our values to life. In Shanghai, China, where our Asia- Pacific region is headquartered, Jeremy Hunter, President Henkel China, Louise Cheung (left), Head of Corporate Communications Asia-Pacific, and Cynthia Yang, Head of Shared Service Center Shanghai, take a 140 years celebration photo.
We also prepared a digital record of our company’s history to mark its anniversary. It features our most important brands, technologies and innovations, together with the people who have steered the company through the decades.
www.timeline.henkel.com
www.annualreport.henkel.com/stories/people
Henkel employees around the world continuously demonstrate their great commitment and pas-sion for the company. Our shared values, a strong entrepreneurial spirit and long-term strategic orientation have been shaping the culture at Henkel for more than 140 years. We are very proud of this heritage.
25
Sustainability
New ways
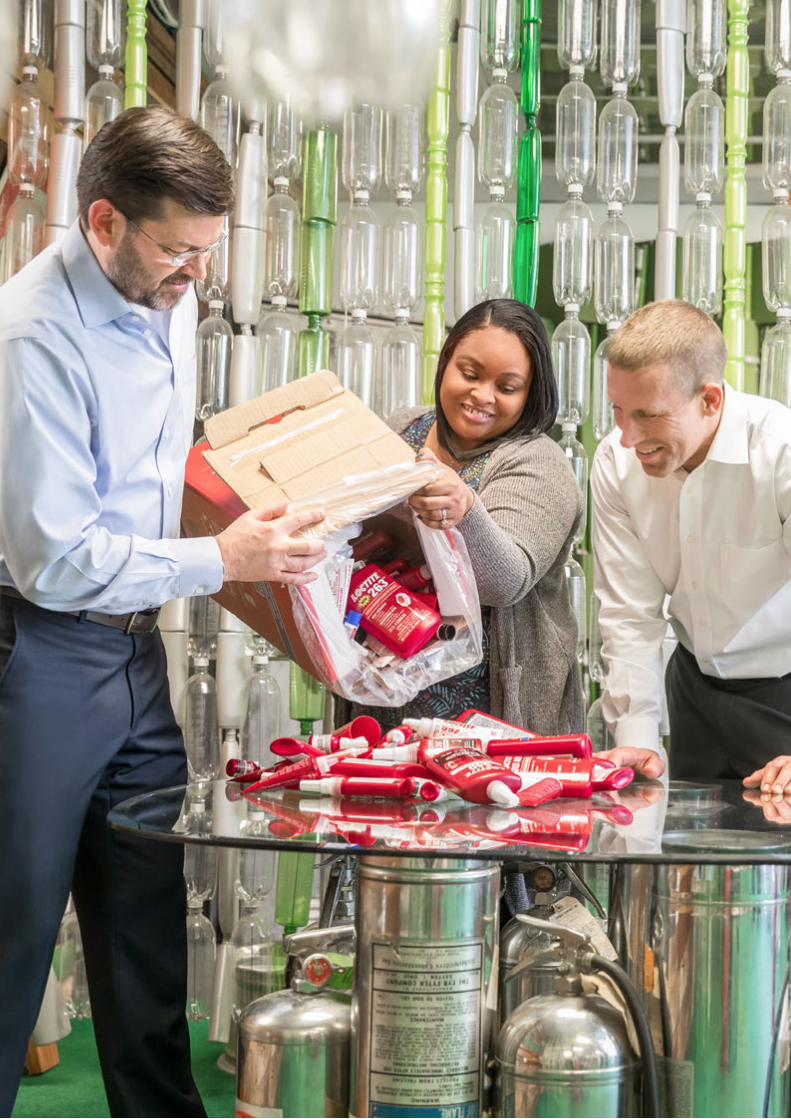
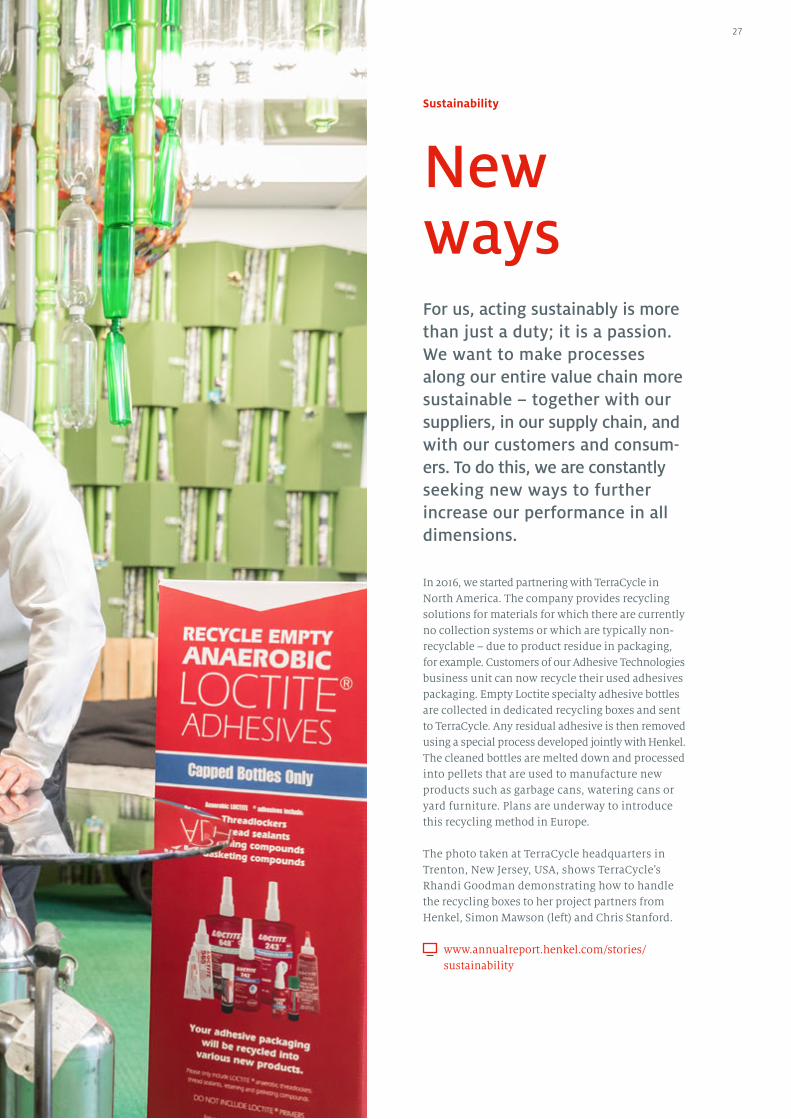
In 2016, we started partnering with TerraCycle in North America. The company provides recycling solutions for materials for which there are currently no collection systems or which are typically non- recyclable – due to product residue in packaging, for example. Customers of our Adhesive Technologies business unit can now recycle their used adhesives packaging. Empty Loctite specialty adhesive bottles are collected in dedicated recycling boxes and sent to TerraCycle. Any residual adhesive is then removed using a special process developed jointly with Henkel. The cleaned bottles are melted down and processed into pellets that are used to manufacture new products such as garbage cans, watering cans or yard furniture. Plans are underway to introduce this recycling method in Europe.
The photo taken at TerraCycle headquarters in Trenton, New Jersey, USA, shows TerraCycle’s Rhandi Goodman demonstrating how to handle the recyc ling boxes to her project partners from Henkel, Simon Mawson (left) and Chris Stanford.
www.annualreport.henkel.com/stories/ sustainability
For us, acting sustainably is more than just a duty; it is a passion. We want to make processes along our entire value chain more sustainable – together with our suppliers, in our supply chain, and with our customers and consum-ers. To do this, we are constantly seeking new ways to further increase our performance in all dimensions.
27
Combined management report 29 Corporate governance 29 Corporate governance report /
Statement on corporate governance 38 Statutory and regulatory situation 39 Remuneration report
52 Shares and bonds 54 Henkel represented in all major indices 54 International shareholder structure 55 Employee share program 55 Henkel bonds 56 Pro-active capital market communication
57 Fundamental principles of the Group 57 Operational activities 57 Overview 57 Organization and business units 58 Strategy and financial targets 2016 59 Henkel 2020+ – our ambition and
strategic priorities 59 Our ambition 60 Strategic priorities in summary 60 Sustainability strategy 62 Management system and performance indicators 62 Cost of capital
63 Economic report 63 Macroeconomic and industry-related conditions 64 Review of overall business performance 64 Results of operations 64 Sales and profits 67 Comparison between actual business
performance and guidance 68 Expense items 68 Other operating income and expenses 68 Financial result 68 Net income and
earnings per share (EPS) 69 Dividends 69 Return on capital employed (ROCE) 69 Economic Value Added (EVA®)
69 Net assets and financial position 69 Acquisitions and divestments 70 Capital expenditures 71 Net assets 72 Financial position 72 Financing und capital management 73 Key financial ratios 74 Employees 77 Procurement 79 Production 81 Research and development 86 Marketing and distribution 88 Business units 88 Adhesive Technologies 92 Beauty Care 96 Laundry & Home Care
100 Henkel AG & Co. KGaA (condensed version according to the German Commercial Code [HGB])
104 Risks and opportunities report 104 Risks and opportunities 104 Risk management system 106 Presentation of major risk categories 110 Major opportunity categories 111 Risks and opportunities in summary
112 Forecast 112 Macroeconomic development 112 Sector development 113 Outlook for the Henkel Group 2017
28 Combined management report Henkel Annual Report 2016
Corporate governance at Henkel AG & Co. KGaA
The Management Board, the Shareholders’ Commit-tee and the Supervisory Board are committed to ensuring that the management and stewardship of the corporation are conducted in a responsible and transparent manner aligned to achieving a long-term increase in shareholder value. With this in mind, they have pledged themselves to the following three principles: • Value creation as the foundation of our
management approach• Sustainability achieved through the application
of socially responsible management principles• Transparency supported by an active and open
information policy
Corporate governance report / Statement on corporate governance
The German Corporate Governance Code [DCGK] was introduced in order to promote confidence in the man-agement and oversight of listed German corporations. It sets out the nationally and internationally recognized regulations and standards of responsible corporate gov-ernance applicable in Germany. The DCGK is aligned to the statutory provisions applicable to a German joint stock corporation (“Aktien gesellschaft” [AG]). It is applied analogously by Henkel AG & Co. KGaA (the cor-poration). For a better understanding of Henkel’s situa-tion, this report describes the principles underlying the management and control structure of the corporation. It also outlines the special features distinguishing us from an AG which derive from our specific legal form and our Articles of Association. The primary rights of sharehold-ers of Henkel AG & Co. KGaA are likewise explained. The report takes into account the recommendations of the DCGK and contains all disclosures and explanations required according to Sections 289 (4), 289a and 315 (4) and (5) of the German Commercial Code [HGB].
Legal form / Special statutory features of Henkel AG & Co. KGaA Henkel is a “Kommanditgesellschaft auf Aktien” [KGaA]. A KGaA is a company with a legal identity (legal entity) in which at least one partner has unlimited liability with respect to the company’s creditors (personally liable partner). The other part-ners’ liability is limited to their shares in the capital stock and they are thus not liable for the company’s debts (limited partners per Section 278 (1) German Stock Corporation Act [AktG]).
In terms of its legal structure, a KGaA is a mixture of a joint stock corporation [AG] and a limited partner-ship [KG], with a leaning toward stock corporation law. The differences with respect to an AG are pri-marily as follows: The duties of the executive board of an AG are performed at Henkel AG & Co. KGaA by Henkel Management AG – acting through its Man-agement Board – as the sole Personally Liable Partner (Sections 278 (2) and 283 AktG in conjunction with Art. 11 of our Articles of Association).
The rights and duties of the supervisory board of a KGaA are more limited compared to those of the supervisory board of an AG. Specifically, the supervi-sory board is not authorized to appoint personally liable partners, preside over the partners’ contractual arrangements, impose procedural rules on the man-agement board, or rule on business transactions. A KGaA is not required to appoint a director of labor affairs, even if, like Henkel, the company is bound to abide by Germany’s Codetermination Act of 1976.
The general meeting of a KGaA essentially has the same rights as the shareholders’ meeting of an AG. For example, it votes on the appropriation of earn-ings, elects members of the supervisory board (shareholder representatives), and formally approves the supervisory board’s actions. It appoints the audi-tor and also votes on amendments to the articles of association and measures that change the company’s capital, which are implemented by the management board. Additionally, as stipulated by the legal form, it also votes on the adoption of the annual financial statements of the company, formally approves the actions of the personally liable partner(s), and elects and approves the actions of the members of the share-holders’ committee as established under the articles of association. Resolutions passed in general meeting require the approval of the personally liable partner(s) where they involve matters which, in the case of a partnership, require the authorization of the person-ally liable partners and also that of the limited part-ners (Section 285 (2) AktG) or relate to the adoption of annual financial statements (Section 286 (1) AktG).
According to our Articles of Association, in addition to the Supervisory Board, Henkel also has a standing Shareholders’ Committee comprising a minimum of five and a maximum of 10 members, all of whom are elected by the Annual General Meeting (Art. 27 of the Articles of Association). The Shareholders’ Committee is required in particular to perform the following functions (Section 278 (2) AktG in conjunction with Sections 114 and 161 HGB, and Articles 8, 9 and 26 of the Articles of Association):
Combined management report 29Henkel Annual Report 2016
29 Corporate governance52 Shares and bonds57 Fundamental principles
of the Group63 Economic report
100 Henkel AG & Co. KGaA (condensed version according to the German Commercial Code [HGB])
104 Risks and opportunities report112 Forecast
Com
bine
d m
anag
emen
t re
port
• It acts in place of the Annual General Meeting in guiding the business activities of the corporation.
• It decides on the appointment and dismissal of the Personally Liable Partner(s).
• It holds both the power of representation and executive powers over the legal relationships prevailing between the corporation and Henkel Management AG, the Personally Liable Partner.
• It exercises the voting rights of the corporation in the Annual General Meeting of Henkel Manage-ment AG, thereby choosing its three-member Supervisory Board which, in turn, appoints and dismisses the members of the Management Board.
• It issues rules of procedure incumbent upon Henkel Management AG.
Capital stock denominations / Shareholder rights /Amendments to the Articles of AssociationThe capital stock of the corporation amounts to 437,958,750 euros. It is divided into a total of 437,958,750 bearer shares of no par value, of which 259,795,875 are ordinary bearer shares (nominal pro-portion of capital stock: 1 euro per ordinary share or a total of 259,795,875 euros, representing 59.3 percent) and 178,162,875 are preferred bearer shares (nominal proportion of capital stock: 1 euro per preferred share or a total of 178,162,875 euros, representing 40.7 percent). All shares are fully paid in. Multiple share certificates for shares may be issued. In accor-dance with Art. 6 (4) of the Articles of Association, there is no right to individual share certificates.
Each ordinary share grants to its holder one vote (Art. 21 (1) of the Articles of Association). The pre-ferred shares grant to their holders all shareholder rights apart from the right to vote (Section 140 (1) AktG). The preferred shares carry the following preferen-tial right in the distribution of profit (Section 139 (1) AktG in conjunction with Art. 35 (2) of the Articles of Association) unless otherwise resolved by the Annual General Meeting: • The holders of preferred shares receive a preferred
dividend in the amount of 0.04 euros per preferred share. If the profit to be distributed in a fiscal year is insufficient for payment of a preferred dividend of 0.04 euros per preferred share, the arrears are paid without interest from the profit of the follow-ing years, with older arrears to be paid in full before more recent arrears and the preferred divi-dend from the profit of a particular fiscal year paid only after the clearance of all arrears. The holders of ordinary shares then receive a preliminary divi-dend from the remaining unappropriated profit of 0.02 euros per ordinary share, with the residual amount being distributed to the holders of ordi-nary and preferred shares in accordance with the
proportion of the capital stock attributable to them.
• If the preferred dividend is not paid out either in part or in whole in a year, and the arrears are not paid off in the following year together with the full preferred share dividend for that second year, the holders of preferred shares are accorded voting rights until such arrears are paid (Section 140 (2) AktG). Cancellation or limitation of this preferred dividend requires the consent of the holders of preferred shares (Section 141 (1) AktG).
The shareholders exercise their rights in the Annual General Meeting as per the relevant statutory provi-sions and the Articles of Association of Henkel AG & Co. KGaA. In particular, they may exercise their right to vote (ordinary shares only) – either personally, by postal vote, through a legal representative or through a proxyholder nominated by the corporation (Section 134 (3) and (4) AktG in conjunction with Art. 21 (2 and 3) of the Articles of Association) – and are also enti-tled to submit motions on the resolution proposals of management, speak on agenda items, and raise pertinent questions and motions (Sections 126 (1) and 131 AktG in conjunction with Art. 23 (2) of the Articles of Association). The ordinary Annual Gen-eral Meeting usually takes place within the first four months of the fiscal year.
Shareholders whose shares jointly represent at least one twentieth of the capital stock – corresponding to 21,897,938 ordinary or preferred shares or a combina-tion of both – may request that a general meeting of shareholders be called. If their proportionate amount of the capital stock jointly amounts to 500,000 euros – corresponding to 500,000 ordinary or preferred shares or a combination of both – they may request that items be placed on the agenda and published (Section 122 (1 and 2) AktG). In addition, shareholders whose combined share of the capital stock amounts to 100,000 euros or more may, subject to certain condi-tions, request that a special auditor be appointed by the court to examine certain matters (Section 142 (2) AktG).
Through the use of electronic communications, par-ticularly the internet, the corporation makes it easy for shareholders to participate in the Annual General Meeting. It also enables them to be represented by proxyholders nominated by the corporation for exer-cising their voting rights. The reports, documents and information required by law for the Annual Gen-eral Meeting, including the financial statements and annual reports, are made available on the internet, as are the agenda for the Annual General Meeting and any countermotions or nominations for election by shareholders that require publication.
Combined management report30 Henkel Annual Report 2016

Unless otherwise mandated by statute or the Articles of Association, the resolutions of the Annual General Meeting are adopted by simple majority of the votes cast. If a majority of capital is required by statute, resolutions are adopted by simple majority of the voting capital represented (Art. 24 of the Articles of Association). This also applies to changes in the Arti-cles of Association. However, modifications to the object of the corporation require a three-quarters’ majority (Section 179 (2) AktG). The Supervisory Board and Shareholders’ Committee have the author-ity to resolve purely formal modifications of and amendments to the Articles of Association (Art. 34 of the Articles of Association). By resolution of the Annual General Meeting, the Supervisory Board is also authorized to amend Articles 5 and 6 of the Arti-cles of Association with respect to each use of the Authorized Capital and upon expiration of the term of the authorization.
Authorized Capital / Share buy-back / Treasury sharesAccording to Art. 6 (5) of the Articles of Association, there is an Authorized Capital. The Personally Lia-ble Partner is authorized, with the approval of the Shareholders’ Committee and of the Supervisory Board, to increase the capital stock of the corpora-tion until April 12, 2020, by up to a nominal total of 43,795,875 euros through the issue of up to 43,795,875 new preferred shares with no voting rights against cash and/or payment in kind. The authorization can be used in full or also in one or several partial amounts. The proportion of capital stock represented by shares issued against payment in kind on the basis of this authorization must not exceed a total of 10 percent of the capital stock existing at the time the authorization takes effect.
The Personally Liable Partner is authorized, with the approval of the Shareholders’ Committee and of the Supervisory Board, to set aside the pre-emptive rights of shareholders in the case of a capital increase against payment in kind, particularly for the purpose of business combinations or the (direct or indirect) acquisition of entities, operations, parts of businesses, equity interests or other assets, including claims against the corporation or compa-nies dependent upon it within the meaning of Section 17 AktG.
If capital is increased against payment in cash, all shareholders are essentially assigned pre-emptive rights. However, these may be set aside in three cases, subject to the approval of the Shareholders’ Committee and of the Supervisory Board: (1) in order to dispose of fractional amounts; (2) to grant to credi-
tors/holders of bonds with warrants or conversion rights or a conversion obligation issued by the cor-poration or one of the companies dependent upon it, pre-emptive rights corresponding to those that would accrue to such creditors/bondholders follow-ing exercise of their warrant or conversion rights or on fulfillment of their conversion obligations; or (3) if the issue price of the new shares is not signifi-cantly below the quoted market price at the time of issue price fixing.
In addition, the Personally Liable Partner is authorized to purchase ordinary and/or preferred shares of the corporation at any time until April 12, 2020, up to a maximum nominal proportion of the capital stock of 10 percent. This authorization can be exercised for any legal purpose. To the exclusion of the pre-emptive rights of existing shareholders, treasury shares may, in particular, be transferred to third parties for the pur-pose of acquiring entities or participating interests of entities. Treasury shares may also be sold to third par-ties against payment in cash, provided that the selling price is not significantly below the quoted market price at the time of share disposal. Treasury shares may likewise be used to satisfy warrants or conversion rights granted by the corpo ration. The Personally Liable Partner has also been authorized, with the approval of the Shareholders’ Committee and of the Supervisory Board, to cancel treasury shares without the need for further resolution by the Annual General Meeting.
Insofar as shares are issued or used to the exclusion of pre-emptive rights, the proportion of capital stock represented by such shares shall not exceed 10 percent.
Concerning the number of treasury shares and their use, please refer to the disclosures provided in the notes to the consolidated financial statements under Note 10 on pages 139 and 140.
Restrictions with respect to voting rights or the transfer of sharesTreasury shares held by the company do not convey any rights, including voting rights (Section 71b AktG). Voting rights conveyed by the relevant shares are also excluded by law in the instances listed in Sec-tion 136 AktG.
A share-pooling agreement has been concluded between members of the families of the descendants of company founder Fritz Henkel, pursuant to which the members agree on how to exercise the voting rights conveyed by their relevant ordinary shares in Henkel AG & Co. KGaA. The agreement also contains
Combined management report 31Henkel Annual Report 2016
29 Corporate governance52 Shares and bonds57 Fundamental principles
of the Group63 Economic report
100 Henkel AG & Co. KGaA (condensed version according to the German Commercial Code [HGB])
104 Risks and opportunities report112 Forecast
restrictions with respect to transfers of the ordinary shares covered (Art. 7 of the Articles of Association).
Henkel preferred shares acquired by employees through the Employee Share Program, including bonus shares acquired without additional payment, are subject to a company-imposed contractual lock-up period of three years, which begins on the first day of the respective participation period. Essentially, the shares should not be sold before the end of this period. If employee shares are sold during the lock-up period, the bonus shares are forfeited.
Contractual agreements also exist with members of the Management Board governing lock-up periods for Henkel preferred shares which they are required to purchase out of their variable annual cash remu-neration (for additional information, please see the remuneration report on pages 39 to 51).
Major shareholdersAccording to notifications received by the corpora-tion on December 17, 2015, a total of 61.02 percent of the voting rights are held by members of the Henkel family share-pooling agreement. (For additional information, please see the disclosures provided in the notes to the consolidated financial statements under Note 40 on page 177.) No other direct or indi-rect investment in capital stock exceeding 10 percent of the voting rights has been reported to us or is known to us.
Shares with special rightsThere are no shares carrying multiple voting rights, preference voting rights, maximum voting rights or special controlling rights.
Management BoardThe Supervisory Board of Henkel Management AG is responsible for the appointment and dismissal of members of the Management Board of Henkel Management AG (Management Board). The appoint-ments are for a maximum tenure of five years. A reappointment or extension of the tenure is permit-ted for a maximum period of five years in each case (Section 84 AktG).
The Management Board is composed of at least two members in accordance with Art. 7 (1) of the Articles of Association of Henkel Management AG. The Supervisory Board of Henkel Management AG is also responsible for determining the number of members on the Management Board. The Supervisory Board of Henkel Management AG can appoint a member of the Management Board as Chairperson.
As the executive body of the Group, the Management Board is bound to uphold the interests of the busi-ness and is responsible for ensuring a sustainable increase in shareholder value. The members of the Management Board are responsible for managing Henkel’s business operations in their entirety. The individual Management Board members are assigned, in accordance with a business distribution plan, areas of competence for which they bear lead responsibil-ity. The members of the Management Board cooperate closely as colleagues, informing one another of all major occurrences within their areas of competence and conferring on all actions that may affect several such areas. Further details relating to cooperation and the division of operational responsibilities within the Management Board are regulated by the rules of pro-cedure issued by the Supervisory Board of Henkel Management AG. The Management Board reaches its decisions by a simple majority of the votes cast. In the event of a tie, the Chairperson has the casting vote.
It is the duty of the Management Board to prepare the annual financial statements of Henkel AG & Co. KGaA, the consolidated and interim financial state-ments and also the corresponding management reports. The Management Board is responsible for management of the overall business including plan-ning, coordination, allocation of resources, financial control, and risk management. It must also ensure compliance with legal provisions, regulatory require-ments and internal company guidelines, and take steps to ensure that Group companies also observe them.
Supervisory Board and Shareholders’ Committee; other committeesIt is the responsibility of the Supervisory Board to advise and supervise the Management Board in the performance of its business management duties. The Supervisory Board regularly discusses business per-formance and planning with the Management Board. It reviews the annual financial statements of Henkel AG & Co. KGaA and the Group’s consolidated financial statements as well as the associated management reports, taking into account the reviews and audit reports submitted by the auditor. It also votes on the proposal of the Management Board regarding the appropriation of profit and submits to the Annual General Meeting a proposal indicating its recommen-dation for the appointment of the external auditor.
As a general rule, the Supervisory Board meets four times per year. It passes resolutions by a simple majority of the votes cast. In the event of a tie, the Chairperson has the casting vote. The Supervisory Board has established an Audit Committee and a Nominations Committee.
of voting rights are held by members of the Henkel family share-pool-ing agreement.
61.02 %
Combined management report32 Henkel Annual Report 2016
The Audit Committee is made up of three share-holder and three employee representative members of the Supervisory Board. Each member is elected by the Supervisory Board based on nominations of their fellow shareholder or fellow employee representa-tives on the Board. The Chairperson of the Audit Committee is elected based on a proposal of the shareholder representative members. It is a statutory requirement that at least one independent member of the Supervisory Board has expertise in the fields of accounting or auditing. The Chairperson of the Audit Committee in 2016, Prof. Dr. Theo Siegert, who is not the Chairperson of the Supervisory Board nor a present or former member of the Management Board, satisfies these requirements.
The Audit Committee, which generally meets four times a year, prepares the proceedings and resolu-tions of the Supervisory Board relating to the adop-tion of the annual financial statements and the con-solidated financial statements, and also the auditor appointment proposal to be made to the Annual General Meeting. It issues audit mandates to the auditor and defines the focal areas of the audit as well as deciding on the fee for the audit and other advisory services provided by the auditor. It moni-tors the independence and qualifications of the audi-tor, requiring the latter to submit a declaration of independence which it then evaluates. Furthermore, the Audit Committee monitors the accounting pro-cess and assesses the effectiveness of the Internal Control System, the Risk Management System and the Internal Auditing and Review System. It is like-wise involved in compliance issues. The Group’s Internal Audit function reports regularly to the Audit Committee. It discusses with the Management Board – with the external auditor in attendance – the quarterly reports and the financial report for the half year, prior to their publication.
The Nominations Committee comprises the Chair-person of the Supervisory Board and two further shareholder representatives elected by the Supervi-sory Board based on nominations of the sharehold-ers’ representatives. The Chairperson of the Super-visory Board is also Chairperson of the Nominations Committee. The Nominations Committee prepares the resolutions of the Supervisory Board on election proposals to be presented to the Annual General Meeting for the election of members to the Supervi-sory Board (shareholder representatives).
The Shareholders’ Committee generally meets six times per year and holds a joint conference with the Management Board lasting several days. The Share-holders’ Committee reaches its decisions by a simple
majority of the votes cast. It has established Finance and Human Resources Subcommittees that likewise meet six times per year, as a rule. Each subcommittee comprises five of the members of the Shareholders’ Committee.
The Finance Subcommittee deals primarily with financial matters, questions of financial strategy, financial position and structure, taxation and accounting policy, as well as risk management within the corporation. It also performs the neces-sary preparatory work for decisions to be made by the Shareholders’ Committee in matters for which decision authority has not been delegated to it.
The Human Resources Subcommittee deals primar-ily with personnel matters relating to members of the Management Board, with issues pertaining to human resources strategy, and with remuneration. It performs the necessary preparatory work for deci-sions to be made by the Shareholders’ Committee in matters for which decision authority has not been delegated to it. The Subcommittee also addresses issues concerned with succession planning and management potential within the individual busi-ness units, taking into account relevant diversity aspects.
At regular intervals, the Supervisory Board and the Shareholders’ Committee hold an internal review to determine the efficiency with which they and their committees/subcommittees carry out their duties. This self-assessment is performed on the basis of an extensive checklist, whereupon points relating to corporate governance and improvement opportuni-ties are also discussed.
Conflicts of interest must be disclosed in an appro-priate manner to the Supervisory Board or Share-holders’ Committee, particularly those that may arise as the result of a consultancy or committee function performed in the service of customers, suppliers, lenders or other business partners. Members encountering material conflicts of interest that are not of a merely temporary nature are required to resign their mandate.
Some members of the Supervisory Board and of the Shareholders’ Committee are or were in past years holders of senior managerial positions in other com-panies. If and when Henkel pursues business activi-ties with these companies, the same arm’s length principles apply as those applicable to transactions with and between unrelated third parties. In our view, such transactions do not affect the impartiality of the members in question.
Combined management report 33Henkel Annual Report 2016
29 Corporate governance52 Shares and bonds57 Fundamental principles
of the Group63 Economic report
100 Henkel AG & Co. KGaA (condensed version according to the German Commercial Code [HGB])
104 Risks and opportunities report112 Forecast
Interaction between Management Board, Supervisory Board and Shareholders’ CommitteeThe Management Board, Supervisory Board and Shareholders’ Committee work in close cooperation for the benefit of the corporation.
The Management Board agrees the strategic direction of the corporation with the Shareholders’ Committee and discusses with it the status of strategy imple-mentation at regular intervals.
In keeping with good corporate governance, the Man-agement Board informs the Supervisory Board and the Shareholders’ Committee regularly, and in a timely and comprehensive fashion, of all relevant issues con-cerning business policy, corporate planning, profit-ability, the business development of the corporation and our major affiliated companies, and also matters relating to risk exposure and risk management.
For transactions of fundamental significance, the Shareholders’ Committee has established a right of veto in the procedural rules governing the actions of Henkel Management AG in its function as sole Personally Liable Partner (Art. 26 of the Articles of Association). This covers, in particular, decisions or measures that materially change the net assets, financial position or results of operations of the corporation. The Management Board complies with these rights of consent of the Shareholders’ Commit-tee and also duly submits to the decision authority of the corporation’s Annual General Meeting.
Principles of corporate governance / ComplianceThe members of the Management Board conduct the corporation’s business with the care of a prudent and conscientious business director in accordance with legal requirements, the Articles of Association of Henkel Management AG and the Articles of Associa-tion of Henkel AG & Co. KGaA, the rules of procedure governing the actions of the Management Board, the provisions contained in the individual contracts of employment of its members, and also the compliance guidelines and resolutions adopted by and within the Management Board.
Corporate management principles which go beyond the statutory requirements are derived from our pur-pose, our vision, our mission and our values. For our corporation to be successful, it is essential that we share a common approach to entrepreneurship. We have defined a clear strategic framework with a long-term horizon. It guides us in making the right deci-sions and helps us to concentrate on our strategic priorities and focus strictly on our ambition for the future.
We want to create value – for our customers and our consumers, for our people, for our shareholders as well as for the wider society and communities in which we operate.
Our purpose: • Creating sustainable value.
Our vision: • Leading with our innovations, brands and
t echnologies.
Our mission: • Serving our customers and consumers worldwide
as the most trusted partner with leading positions in all relevant markets and categories – as a pas-sionate team united by shared values.
Our values:• We put our customers and consumers at the
center of what we do.• We value, challenge and reward our people.• We drive excellent sustainable financial
performance.• We strive to continually extend our leadership
in sustainability.• We shape our future with a strong entrepreneurial
spirit based on our family business tradition.
The corporate management bodies of Henkel and our employees worldwide are guided by this purpose, this vision, this mission, and these values. They reaffirm our ambition to meet the highest ethical standards in everything we do. And they guide our employees in all the day-to-day decisions they make, providing a compass for their conduct and actions.
Henkel is committed to ensuring that all business transactions are conducted in an ethically irre-proachable, legal fashion. Consequently, Henkel expects all our employees not only to respect the corporation’s internal rules and all relevant laws, but also to avoid conflicts of interest, to protect Henkel’s assets and to respect the social values of the coun-tries and cultural environments in which the corpo-ration does business. The Management Board has therefore issued a series of Group-wide codes and standards with precepts that are binding worldwide. These regulatory instruments are periodically reviewed and amended as appropriate, evolving in step with the changing legal and commercial condi-tions that affect Henkel as a globally active corpora-tion. The Code of Conduct supports our employees in ethical and legal issues. The Leadership Principles, for example, define the scope of responsibilities for managers. The Code of Corporate Sustainability
Combined management report34 Henkel Annual Report 2016

describes the principles that drive our sustainable, socially responsible approach to business. This code also enables Henkel to meet the commitments derived from the United Nations Global Compact.
Ensuring compliance in the sense of adherence to laws and regulations is an integral component of our business processes. Henkel has established a Group-wide compliance organization with locally and regionally responsible compliance officers led by a globally responsible General Counsel & Chief Compliance Officer (CCO). The General Counsel & CCO, supported by the Corporate Compliance Office and the interdisciplinary Compliance & Risk Com-mittee, manages and controls compliance-related activities undertaken at the corporate level, coordi-nates training courses, oversees fulfillment of both internal and external regulations, and takes appro-priate action in the event of compliance violations.
The local and regional compliance officers are responsible for organizing and overseeing the train-ing activities and implementation measures tailored to the specific requirements of their locations. They report to the Corporate Compliance Office. The Gen-eral Counsel & CCO reports regularly to the Manage-ment Board and to the Audit Committee of the Super-visory Board on identified compliance violations.
The issue of compliance is also a permanent item in the target agreements signed by all managerial staff of Henkel. Due to their position, it is particularly incumbent on them to set the right example for their subordinates, to effectively communicate the compliance rules and to ensure that these are obeyed through the implementation of suitable organizational measures.
The procedures to be followed in the event of com-plaints or suspicion of malpractice also constitute an important element of the compliance policy. In addition to our internal reporting system and com-plaint registration channels, employees may also, for the purpose of reporting serious violations to the Cor porate Compliance Office, anonymously use a compliance hotline operated by an external ser-vice provider. The Head of the Corporate Compli-ance Office is mandated to initiate the necessary follow-up procedures.
Our corporate compliance activities are focused on antitrust law and the fight against corruption. In our Code of Conduct, the corporate guidelines based upon it, and other publications, the Management Board clearly expresses its rejection of all violations of the principles of compliance, particularly anti-
trust violations and corruption. We do not tolerate such violations in any way. For Henkel, bribery, anticompetitive agreements, or any other violations of laws are no way to initiate or conduct business.
A further compliance-relevant area relates to capital market law. Supplementing the legal provisions, internal codes of conduct have been put in place to regulate the treatment of information that has the potential to affect share prices. The corporation has an Ad Hoc Committee comprised of representatives from various departments. In order to ensure that all insider information is handled as required by law, this Committee reviews developments and events for their possible effect on share prices, determin-ing the need to issue reports to the capital markets on an ad hoc basis. There are also rules that go beyond the legal requirements, governing the behavior of the members of the Management Board, the Super-visory Board and the Shareholders’ Committee, and also employees of the corporation who, due to their function or involvement in projects, have access to insider information.
Transparency / CommunicationAn active and open communication policy ensuring prompt and continuous information dissemination is a major component of the value-based manage-ment approach at Henkel. Hence shareholders, shareholder associations, participants in the capital market, financial analysts, the media and the public at large are kept informed of the current situation and major business changes relating to the Henkel Group. All stakeholders are treated equally in this respect. All such information is also promptly made available on the internet.
Up-to-date information is likewise incorporated in the regular financial reporting undertaken by the corporation. The dates of the major recurring publi-cations, and also the dates for the press conference on the preceding fiscal year and the Annual General Meeting, are announced in our financial calendar, which is also available on the internet.
The corporation’s advancements and targets in rela-tion to the environment, safety, health and social responsibility are published annually in our Sustain-ability Report. Shareholders, the media and the public at large are further provided with comprehen-sive information through press releases and infor-mation events, while occurrences with the potential to materially affect the price of Henkel shares are communicated in the form of ad hoc announce ments.
Combined management report 35Henkel Annual Report 2016
29 Corporate governance52 Shares and bonds57 Fundamental principles
of the Group63 Economic report
100 Henkel AG & Co. KGaA (condensed version according to the German Commercial Code [HGB])
104 Risks and opportunities report112 Forecast
Further information on corporate governance can be found in the section “Principles of corporate governance / Compliance” on pages 34 and 35. The composition of the Management Board is shown on page 187. For more details on the composition of the Supervisory Board and the Shareholders’ Committee or the (sub)committees established by the Supervi-sory Board and Shareholders’ Committee, please refer to pages 184 to 186. Details of the compensation of the Management Board, the Supervisory Board and the Shareholders’ Committee can be found in the remuneration report on pages 39 to 51.
Targets for the proportion of women on the Management Board and in the first two manage-ment levels below the Management Board In accordance with Sections 76 (4) and 111 (5) AktG, targets must be set for the proportion of women on the Management Board and in the first two manage-ment levels below the Management Board. If the pro-portion of women is below 30 percent at the time the targets are set, the targets may not be below the pro-portion already achieved. Deadlines for achievement of the targets must be established at the same time. Each deadline must be within five years and the first deadline can be no later than June 30, 2017.
Proportion of women on the Management BoardIn September 2015, for the first time, the Supervisory Board of Henkel Management AG established a target for the proportion of women on the Management Board of 17 percent in agreement with the recommen-dations of the Shareholders’ Committee and its Human Resources Subcommittee. This target applied until December 31, 2016.
The proportion of women on the Management Board at December 31, 2016 was 17 percent; as such, the tar-get was met.
The Supervisory Board of Henkel Management AG has again established a target, as recommended by the Shareholders’ Committee and its Human Resources Subcommittee, for the proportion of women on the Management Board of 17 percent, taking into account the current composition and an appropriate Management Board size for the corpora-tion. This proportion will apply, and the target will be met, in the period through to December 31, 2021.
Proportion of women in the management levels below the Management BoardIn September 2015, for the first time, the Management Board established the following targets for the first two levels of management below the Management Board in consideration of the current personnel mix.
In accordance with the legal requirements, the point of reference for the definition of the management levels was based exclusively on Henkel AG & Co. KGaA and not the Henkel Group – regardless of Henkel’s globally aligned management organization. As a result, the figures include only employees of Henkel AG & Co. KGaA with management responsi-bility who report directly to the Management Board (management level 1) and those who report to management level 1 (management level 2).
Separately from the targets for the first two levels of management below the Management Board of Henkel AG & Co. KGaA – and mindful of our globally aligned management organization – it is our goal to increase our ratio of women at all levels of manage-ment at Henkel in the long term. In 2016, we were again able to raise the proportion of women in man-agement worldwide – to around 34 percent overall at December 31, 2016.
The following targets were set for achievement by December 31, 2016:• First management level: Proportion of 17 percent
women• Second management level: Proportion of 28 per-
cent women
As of December 31, 2016, the target of 17 percent for the first management level of Henkel AG & Co. KGaA had been exceeded by around 5 percentage points and the target of 28 percent for the second manage-ment level had been met.
Since our organization is globally structured, and we promote career opportunities internationally, some management executives were assigned from Henkel AG & Co. KGaA to other Group companies, and vice versa, during the reporting period. This may also cause shifts in the proportion of women in the rele-vant management levels at Henkel AG & Co. KGaA. Equally, the result is not dependent on whether the proportion of women in management overall has changed or, as explained above, even increased at the global level.
Based on the current personnel mix, the Manage-ment Board has established new targets for the first two levels of management below the Management Board. These targets are expected to be achieved by December 31, 2021:• First management level: Proportion of 25 percent
women• Second management level: Proportion of 30 per-
cent women
Combined management report36 Henkel Annual Report 2016
In accordance with the legal requirements, the point of reference for the definition of the management lev-els was based exclusively on Henkel AG & Co. KGaA and not the Henkel Group. As a result, the figures include only employees of Henkel AG & Co. KGaA with management responsibility who report directly to the Management Board (management level 1) and those who report to management level 1 (manage-ment level 2).
Objectives regarding Supervisory Board compositionGiven Henkel’s position as a listed corporation subject to the Codetermination Act, the Supervisory Board of Henkel AG & Co. KGaA must consist of at least 30 percent women and at least 30 percent men (Section 96 (2) AktG).
In consideration of the specific situation of the corporation, the Supervisory Board has, in addition to the statutory requirements listed above, estab-lished the objectives described below with respect to its composition in accordance with Item 5.4.1 of the German Corporate Governance Code [DCGK]. These objectives will be taken into account by the Supervisory Board when proposing election candi-dates to the Annual General Meeting for all re-elect-able and ad hoc replacement Supervisory Board positions:• The members of the Supervisory Board should,
generally speaking, offer the knowledge, skills and relevant experience necessary in order to properly perform their duties. In particular, experience and expertise are required in one or several of the fields of corporate management, accounting, financial control/risk management, corporate gov-ernance/compliance, research and development, production/engineering, and marketing/sales/ distribution, as is knowledge of the industrial or consumer businesses and of the primary markets in which Henkel is active. Members of the Super-visory Board should also have sufficient time at their disposal in order to carry out their mandate.
• The international activities of the corporation should be appropriately reflected in the composi-tion of the Supervisory Board. Thus, it aims to include several members with an international background. The mix of candidates proposed for election should also contain an appropriate num-ber of women. Efforts will therefore be made for upcoming new and ad hoc replacement elections to achieve a proportion higher than the minimum 30 percent required by law.
• In addition, the Supervisory Board should have an appropriate number of independent members. Specifically, the Supervisory Board should contain
no more than two former members of the Manage-ment Board, no persons who perform board or committee functions or act as consultants for major competitors, and no persons whose business or personal relationship with the corporation or members of the Management Board could give rise to material conflicts of interest that are not of a merely temporary nature. Assuming that the exer-cise of their Supervisory Board mandate by the employee representatives as such cannot be the basis for doubt as to whether the independence criteria as defined by Item 5.4.2 of the DCGK are fulfilled, the Supervisory Board should include at least 13 members who are independent as defined by the DCGK. Consistent with the corporation’s tra-dition as an open family business, possession of a controlling interest or attribution of a controlling interest due to membership in the Henkel family share-pooling agreement is not viewed as a cir-cumstance that creates a conflict of interest in the meaning above. However, irrespective of this, at least three of the shareholder representatives on the Supervisory Board should, as a rule, be neither members of the Henkel family share-pooling agreement nor members of the Shareholders’ Committee nor members of the Supervisory Board of Henkel Management AG.
• No persons shall be proposed for election at the Annual General Meeting who, at the time of the election, have already reached their 70th birthday. Also, as a rule, no persons should be proposed who, at the time of the election, have already served more than two full terms of office on the Supervisory Board. However, to ensure continuity, members may also serve on the Supervisory Board for longer periods of time in individual cases. Consistent with the tradition of Henkel AG & Co. KGaA as an open family business, this applies particularly to members of the Henkel family share- pooling agreement.
Combined management report 37Henkel Annual Report 2016
29 Corporate governance52 Shares and bonds57 Fundamental principles
of the Group63 Economic report
100 Henkel AG & Co. KGaA (condensed version according to the German Commercial Code [HGB])
104 Risks and opportunities report112 Forecast
The statutory minimums listed above, or objectives within the meaning of the DCGK, were achieved in the year under review.
Among the 16 members of the Supervisory Board are ten men and six women. Shareholder representatives consist of six men and two women, while the employee representatives consist of four men and four women. This represents an overall ratio on the Supervisory Board of around 62 percent men and 38 percent women. Throughout the entire year under review, each gender was represented by at least 30 percent among both the shareholder representa-tives and the employee representatives.
Overall, the Supervisory Board has at its disposal the knowledge, skills and technical abilities needed to properly and effectively perform its duties. In addi-tion, several members of the Supervisory Board offer international business experience or other interna-tional expertise. No individual on the Supervisory Board exceeds the specified maximum age.
None of the Supervisory Board members elected by the Annual General Meeting is a former Management Board member, or performs board or committee func-tions or acts as a consultant for major competitors, and none are persons whose business or personal relationship with the corporation or members of the Management Board could give rise to material con-flicts of interest that are not of a merely temporary nature. Four of the eight shareholder representatives are not members of the Henkel family share- pooling agreement, and seven of the eight shareholder repre-sentatives are neither members of the Shareholders’ Committee nor members of the Supervisory Board of Henkel Management AG.
Application of the German Corporate Governance CodeTaking into account the special features arising from our legal form and Articles of Association, Henkel AG & Co. KGaA complies with the recommendations (“shall” provisions) of the DCGK, latest edition, with one exception: So as to protect the legitimate interests and privacy of those members of the corporate man-agement bodies who are also members of the Henkel family, in deviation from Item 6.3 of the DCGK as amended on May 5, 2015, the shareholdings of those members exceeding one percent of the shares issued by the corporation have not been and will not be dis-closed unless required by law. The DCGK requires disclosure of shareholdings upward of one percent. In accordance with the Declaration of Compliance, the following information is reported concerning the aggregate shareholdings of all members of a
corporate body, taking the relevant provisions for attri-bution into account: The aggregate holdings of the members of the Supervisory Board and of the members of the Shareholders’ Committee exceed in each case one percent of the shares issued by the corporation. The members of the Management Board together hold less than one percent of the shares issued by the corporation.
Henkel also complies with all non-compulsory suggestions (“may/should” provisions) of the DCGK, in keeping with our legal form and the special stat-utory features anchored in our Articles of Association.
The corresponding declarations of compliance together with the reasons for deviations from recommendations can be found on our website at
www.henkel.com/ir
Managers’ transactionsIn accordance with Article 19 (1) of the Market Abuse Regulation, members of the Management Board, the Supervisory Board and the Shareholders’ Committee, and parties related to same, are obliged to disclose notifiable transactions involving shares in Henkel AG & Co. KGaA or their derivative financial instruments where the value of such transactions by the member, or a party related to the member, attains or exceeds 5,000 euros in a calendar year. The transactions reported to the corporation in the past fiscal year were properly disclosed and can be seen on the website
www.henkel.com/ir
Statutory and regulatory situation
As a globally active corporation, our business is sub-ject to various national rules and regulations, includ-ing relevant trade regulations governing imports and exports, customs provisions and price or currency restrictions, as well as – within the European Union (EU) – increasingly to harmonized laws applying throughout the EU. Trade restrictions, such as export controls, embargoes or economic sanctions, must also be observed in some countries. In addition, some of our activities are subject to rules and regula-tions derived from approvals, licenses, certificates or permits.
Our manufacturing operations are bound by rules and regulations with respect to the registration, eval-uation, usage, storage, transportation and handling of certain substances and also in relation to emissions, wastewater, effluent and other waste. The construc-tion and operation of production facilities and other plant and equipment are governed by framework
Around
female member-ship on the Super-visory Board.
38 %
Combined management report38 Henkel Annual Report 2016
rules and regulations – including those relating to legacy remediation.
Product-specific regulations of relevance to us relate in particular to ingredients and input materials, safety in manufacturing, the handling of products and their contents, and the packaging and marketing of these items. The control mechanisms include statutory material-related regulations, usage prohibi-tions or restrictions, procedural requirements (test and inspection, identification marking, provision of warning labels, etc.), and product liability law.
Our internal standards are geared to ensuring compli-ance with statutory regulations and the safety of our manufacturing facilities and products. The associated requirements have been incorporated within, and implemented throughout, our management systems, and are subject to a regular audit and review regime. This includes monitoring and evaluating relevant statutory and regulatory requirements and changes in a prompt and timely fashion.
Remuneration report
This remuneration report provides an outline of the compensation system for the Management Board, Henkel Management AG as the Personally Liable Partner, the Supervisory Board and the Sharehold-ers’ Committee of Henkel AG & Co. KGaA, and the Super visory Board of Henkel Management AG; it also explains the level and structure of the remu-neration paid.
The report takes into account the recommendations of the German Corporate Governance Code [DCGK] and contains all disclosures and explanations pur-suant to the provisions of the German Commercial Code [HGB] and the appropriate principles of Ger-man Accounting Standards [DRS], and as required by International Financial Reporting Standards (IFRS). The remuneration report forms part of the combined management report for Henkel AG & Co. KGaA and the Group; the associated information has not therefore been additionally disclosed in the notes to the consolidated financial statements.
1. Remuneration of members of the Management Board
Regulation, structure and amountsThe compensation for members of the Management Board of Henkel Management AG is set by the Super-visory Board of Henkel Management AG in consulta-tion with the Human Resources Subcommittee of the
Shareholders’ Committee. The Supervisory Board of Henkel Management AG is comprised of three mem-bers of the Shareholders’ Committee.
The structure and amounts of Management Board remuneration are aligned to the size and interna-tional activities of the corporation, its economic and financial position, its performance and future pros-pects, the normal levels of remuneration encoun-tered in comparable companies, and also the general compensation structure within the corporation. The compensation package is further determined on the basis of the functions, responsibilities and personal performance of the individual executives, and the performance of the Management Board as a whole. The variable annual remuneration components have been devised such that they take into account both positive and negative developments. The overall remuneration mix is designed to be internationally competitive while also providing an incentive for sustainable business development and a sustainable increase in shareholder value in a dynamic environment.
The Supervisory Board of Henkel Management AG regularly reviews the compensation system as well as the appropriateness of the compensation, based on the aforementioned criteria. In doing so, Manage-ment Board remuneration is analyzed relative to the compensation paid to senior management and the staff as a whole, both overall and over time, whereby the Supervisory Board of Henkel Management AG determines the boundaries between senior manage-ment and relevant staff members.
Members of the Management Board receive remu-neration consisting of non-performance-related components and variable, performance-related components. The non-performance-related compen-sation is made up of their fixed salary together with various in-kind and other benefits (other emol-uments). The performance-related compensation has two parts. The first is a variable annual cash pay-ment (short-term incentive or “STI”), 65 percent of which is short-term variable cash remuneration and 35 percent of which is long-term variable cash remu-neration in the form of an investment financed by the recipient in Henkel preferred shares (share defer-ral). The second is a variable cash payment based on the long-term performance of the business (long-term incentive or “LTI”). The remuneration targeting long-term performance thus consists of the share deferral and the LTI.
If all performance targets are met in full (“at target”), around 21 percent of the remuneration (excluding
Combined management report 39Henkel Annual Report 2016
29 Corporate governance52 Shares and bonds57 Fundamental principles
of the Group63 Economic report
100 Henkel AG & Co. KGaA (condensed version according to the German Commercial Code [HGB])
104 Risks and opportunities report112 Forecast
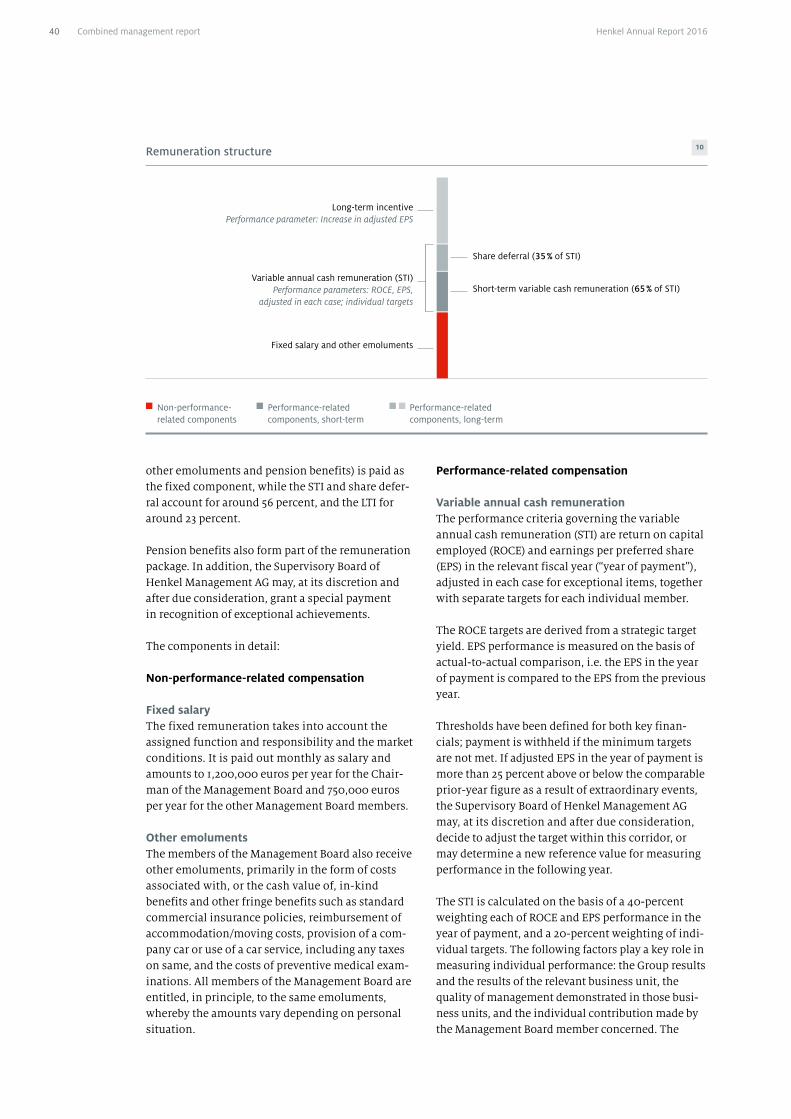
Remuneration structure
Fixed salary and other emoluments
Variable annual cash remuneration (STI)Performance parameters: ROCE, EPS,
adjusted in each case; individual targets
Long-term incentivePerformance parameter: Increase in adjusted EPS
Short-term variable cash remuneration (65 % of STI)
Share deferral (35 % of STI)
10
Non-performance- related components
Performance-related components, long-term
Performance-related components, short-term
Performance-related compensation
Variable annual cash remunerationThe performance criteria governing the variable annual cash remuneration (STI) are return on capital employed (ROCE) and earnings per preferred share (EPS) in the relevant fiscal year (“year of payment”), adjusted in each case for exceptional items, together with separate targets for each individual member.
The ROCE targets are derived from a strategic target yield. EPS performance is measured on the basis of actual-to-actual comparison, i.e. the EPS in the year of payment is compared to the EPS from the previous year.
Thresholds have been defined for both key finan-cials; payment is withheld if the minimum targets are not met. If adjusted EPS in the year of payment is more than 25 percent above or below the comparable prior-year figure as a result of extraordinary events, the Supervisory Board of Henkel Management AG may, at its discretion and after due consideration, decide to adjust the target within this corridor, or may determine a new reference value for measuring performance in the following year.
The STI is calculated on the basis of a 40-percent weighting each of ROCE and EPS performance in the year of payment, and a 20-percent weighting of indi-vidual targets. The following factors play a key role in measuring individual performance: the Group results and the results of the relevant business unit, the quality of management demonstrated in those busi-ness units, and the individual contribution made by the Management Board member concerned. The
other emoluments and pension benefits) is paid as the fixed component, while the STI and share defer-ral account for around 56 percent, and the LTI for around 23 percent.
Pension benefits also form part of the remuneration package. In addition, the Supervisory Board of Henkel Management AG may, at its discretion and after due consideration, grant a special payment in recognition of exceptional achievements.
The components in detail:
Non-performance-related compensation
Fixed salaryThe fixed remuneration takes into account the assigned function and responsibility and the market conditions. It is paid out monthly as salary and amounts to 1,200,000 euros per year for the Chair-man of the Management Board and 750,000 euros per year for the other Management Board members.
Other emolumentsThe members of the Management Board also receive other emoluments, primarily in the form of costs associated with, or the cash value of, in-kind benefits and other fringe benefits such as standard commercial insurance policies, reimbursement of accommodation/moving costs, provision of a com-pany car or use of a car service, including any taxes on same, and the costs of preventive medical exam-inations. All members of the Management Board are entitled, in principle, to the same emoluments, whereby the amounts vary depending on personal situation.
Combined management report40 Henkel Annual Report 2016
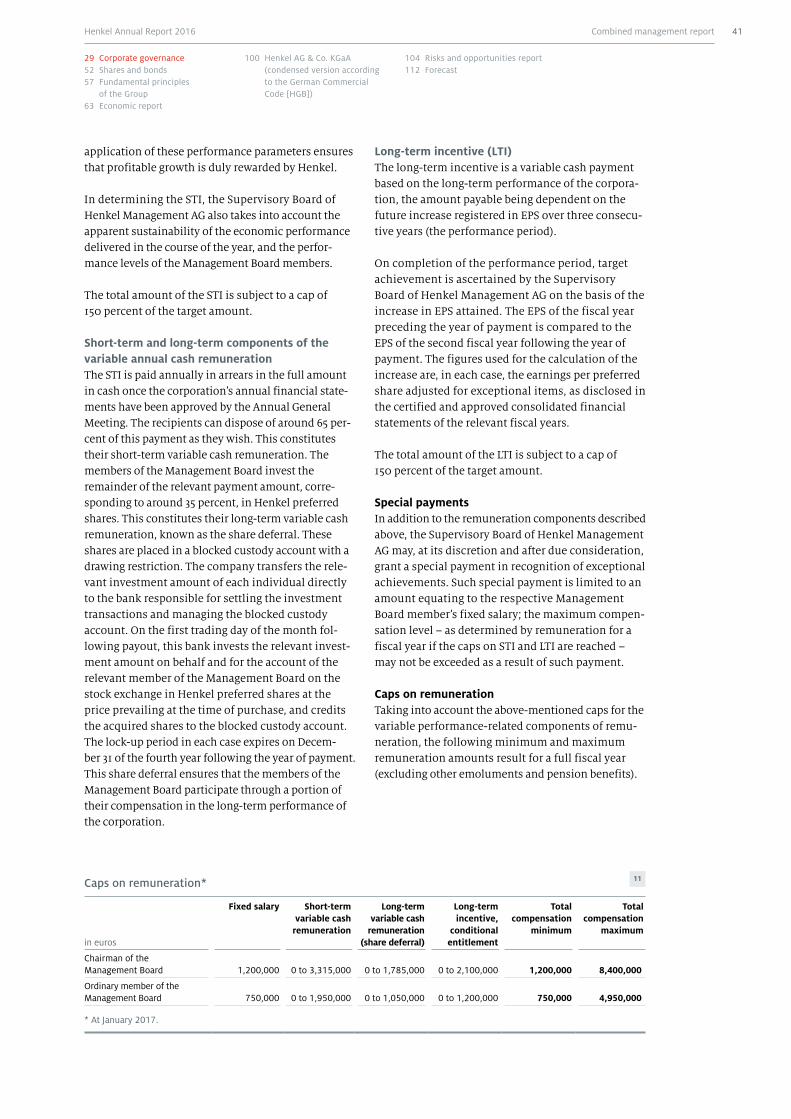
application of these performance parameters ensures that profitable growth is duly rewarded by Henkel.
In determining the STI, the Supervisory Board of Henkel Management AG also takes into account the apparent sustainability of the economic performance delivered in the course of the year, and the perfor-mance levels of the Management Board members.
The total amount of the STI is subject to a cap of 150 percent of the target amount.
Short-term and long-term components of the variable annual cash remuneration The STI is paid annually in arrears in the full amount in cash once the corporation’s annual financial state-ments have been approved by the Annual General Meeting. The recipients can dispose of around 65 per-cent of this payment as they wish. This constitutes their short-term variable cash remuneration. The members of the Management Board invest the remainder of the relevant payment amount, corre-sponding to around 35 percent, in Henkel preferred shares. This constitutes their long-term variable cash remuneration, known as the share deferral. These shares are placed in a blocked custody account with a drawing restriction. The company transfers the rele-vant investment amount of each individual directly to the bank responsible for settling the investment transactions and managing the blocked custody account. On the first trading day of the month fol-lowing payout, this bank invests the relevant invest-ment amount on behalf and for the account of the relevant member of the Management Board on the stock exchange in Henkel preferred shares at the price prevailing at the time of purchase, and credits the acquired shares to the blocked custody account. The lock-up period in each case expires on Decem-ber 31 of the fourth year following the year of payment. This share deferral ensures that the members of the Management Board participate through a portion of their compensation in the long-term performance of the corporation.
Long-term incentive (LTI)The long-term incentive is a variable cash payment based on the long-term performance of the corpora-tion, the amount payable being dependent on the future increase registered in EPS over three consecu-tive years (the performance period).
On completion of the performance period, target achievement is ascertained by the Supervisory Board of Henkel Management AG on the basis of the increase in EPS attained. The EPS of the fiscal year preceding the year of payment is compared to the EPS of the second fiscal year following the year of payment. The figures used for the calculation of the increase are, in each case, the earnings per preferred share adjusted for exceptional items, as disclosed in the certified and approved consolidated financial statements of the relevant fiscal years.
The total amount of the LTI is subject to a cap of 150 percent of the target amount.
Special paymentsIn addition to the remuneration components described above, the Supervisory Board of Henkel Management AG may, at its discretion and after due consideration, grant a special payment in recognition of exceptional achievements. Such special payment is limited to an amount equating to the respective Management Board member’s fixed salary; the maximum compen-sation level – as determined by remuneration for a fiscal year if the caps on STI and LTI are reached – may not be exceeded as a result of such payment.
Caps on remunerationTaking into account the above-mentioned caps for the variable performance-related components of remu-neration, the following minimum and maximum remuneration amounts result for a full fiscal year (excluding other emoluments and pension benefits).
Caps on remuneration* 11
in euros
Fixed salary Short-term variable cash
remuneration
Long-term variable cash
remuneration (share deferral)
Long-term incentive,
conditional entitlement
Total compensation
minimum
Total compensation
maximum
Chairman of the Management Board 1,200,000 0 to 3,315,000 0 to 1,785,000 0 to 2,100,000 1,200,000 8,400,000
Ordinary member of the Management Board 750,000 0 to 1,950,000 0 to 1,050,000 0 to 1,200,000 750,000 4,950,000
* At January 2017.
Combined management report 41Henkel Annual Report 2016
29 Corporate governance52 Shares and bonds57 Fundamental principles
of the Group63 Economic report
100 Henkel AG & Co. KGaA (condensed version according to the German Commercial Code [HGB])
104 Risks and opportunities report112 Forecast
Pension benefits (retirement pensions and survivors’ benefits)The company has been operating a purely defined contribution system since January 1, 2015. Accord-ingly, members of the Management Board now receive a superannuation lump-sum payment comprised of the total contributions to the plan during their time in office. The annual contributions – based on a full fis-cal year – are 750,000 euros for the Chairman and 450,000 euros each for the other members of the Management Board.
An entitlement to pension benefits arises on retire-ment, on termination of the employment relationship on or after attainment of the statutory retirement age, in the event of death, or in the event of permanent complete incapacity for work. If a member of the Man-agement Board has received no pension benefits prior to their death, the superannuation lump sum accu-mulated up to time of death is paid out to the surviv-ing spouse or surviving children.
Provisions governing termination of position on the Management BoardIf an active member of the Management Board who was first appointed prior to 2009 retires, or dies while still in office, payment of their fixed remuneration continues for a further six months, but not beyond their 65th birthday. In the event of death in service, the payments are made to the surviving spouse or entitled dependent children.
In the event that a member’s position on the Manage-ment Board is terminated prematurely by mutual agreement, the executive contract provides for a sev-erance settlement amounting to the remuneration for the remaining contractual term (fixed remuneration plus variable annual remuneration) in the form of a discounted lump-sum payment. These severance payments are limited to a maximum of two years’ compensation (severance payment cap) and may not extend over a period that exceeds the residual term of the executive contract. Members are not entitled to severance payment if an executive contract is termi-nated by mutual agreement at the request of the member or because that member has been dismissed by the corporation for good cause or reason. In the event that the sphere of responsibility/executive function is altered or restricted to such an extent that it is no longer comparable to the position prior to the change or restriction, the affected members of the Management Board are entitled to resign from office and request premature termination of their contract. In such case, members are entitled to sever-ance payments amounting to not more than two years’ compensation.
Upon an executive’s departure from the Management Board, the STI is paid on a time-proportion basis on the ordinary payment date after the end of the fiscal year in which the appointment ends. If not already expired, lock-up periods for the share deferral end six months after departure. This applies accordingly to entitlements under the LTI. However, entitlements from any tranche whose performance period has not yet ended at the date of departure are forfeited with-out replacement if the departure is based on good cause or reason that would have justified revocation of the appointment or termination of the employ-ment contract.
In addition, the executive contracts include a post- contractual non-competition clause with a term of two years. Members of the Management Board are entitled to a discretionary payment totaling 50 per-cent of the annual compensation after allowing for any severance payments, which is payable in 24 monthly installments unless the Supervisory Board of Henkel Management AG waives the non-competition clause. Similarly, any earnings from new extra-contractual activities during the non-com-petition period shall be offset against this discretion-ary payment to the extent that such earnings and dis-cretionary payment together exceed the actual compensation paid in the last fully ended fiscal year by 10 percent or more. No entitlements exist in the event of premature termination of executive duties resulting from a change in control.
Other provisionsThe corporation maintains directors and officers insur-ance (D&O insurance) for directors and officers of the Henkel Group. For members of the Management Board there is a deductible amounting to 10 percent per loss event, subject to a maximum for a fiscal year of one and a half times their annual fixed remuneration.
Remuneration of the members of the Management Board for fiscal 2016 Excluding pension entitlements, the total compensa-tion paid to members of the Management Board for the performance of their duties for and on behalf of Henkel AG & Co. KGaA and its subsidiaries during the year under review amounted to 26,503,197 euros (pre-vious year: 25,804,019 euros). Fixed salaries accounted for 5,075,000 euros (previous year: 4,950,000 euros), other emoluments for 422,137 euros (previous year: 360,477 euros), short-term variable cash remunera-tion for 10,143,939 euros (previous year: 9,810,801 euros), long-term variable cash remuneration – share deferral – for 5,462,121 euros (previous year: 5,282,741 euros), and the long-term incentive for 5,400,000 euros (previous year: 5,400,000 euros). In accordance with
Combined management report42 Henkel Annual Report 2016
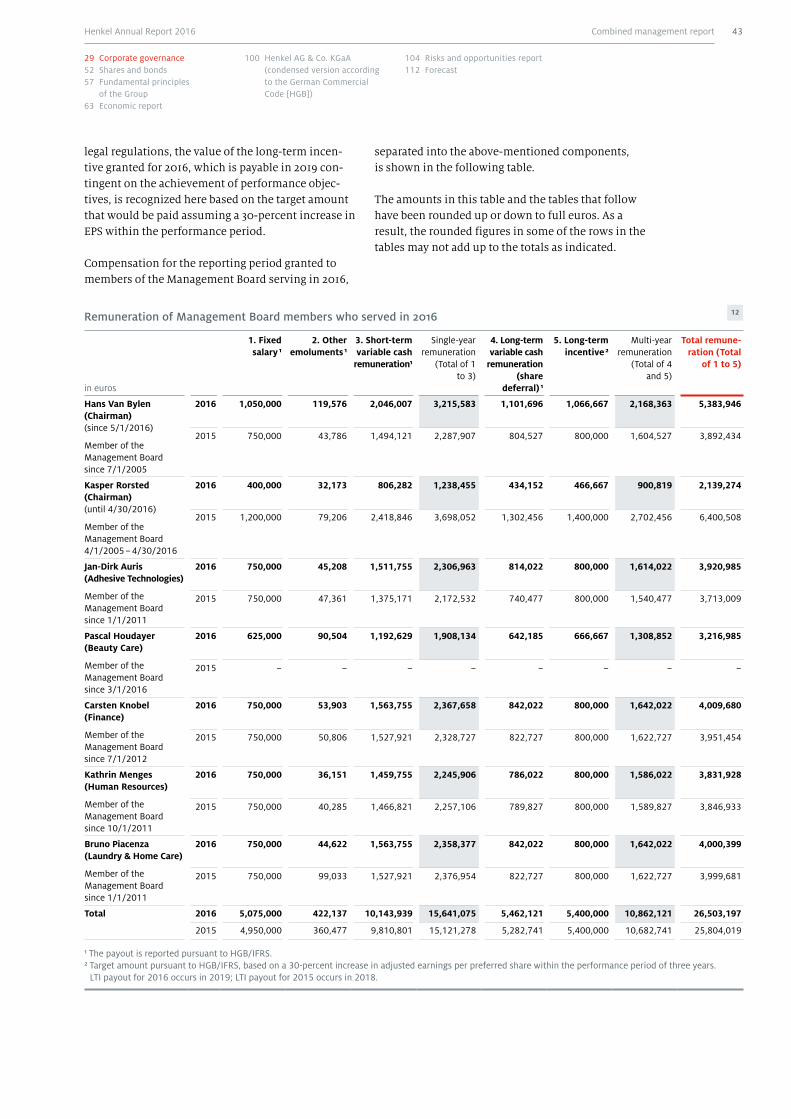
legal regulations, the value of the long-term incen-tive granted for 2016, which is payable in 2019 con-tingent on the achievement of performance objec-tives, is recognized here based on the target amount that would be paid assuming a 30-percent increase in EPS within the performance period.
Compensation for the reporting period granted to members of the Management Board serving in 2016,
Remuneration of Management Board members who served in 2016 12
in euros
1. Fixed salary 1
2. Other emoluments 1
3. Short-term variable cash
remuneration1
Single-year remuneration
(Total of 1 to 3)
4. Long-term variable cash
remuneration (share
deferral) 1
5. Long-term incentive 2
Multi-year remuneration
(Total of 4 and 5)
Total remune-ration (Total
of 1 to 5)
Hans Van Bylen (Chairman) (since 5/1/2016)
Member of the Management Board since 7/1/2005
2016 1,050,000 119,576 2,046,007 3,215,583 1,101,696 1,066,667 2,168,363 5,383,946
2015 750,000 43,786 1,494,121 2,287,907 804,527 800,000 1,604,527 3,892,434
Kasper Rorsted (Chairman) (until 4/30/2016)
Member of the Management Board 4/1/2005 – 4/30/2016
2016 400,000 32,173 806,282 1,238,455 434,152 466,667 900,819 2,139,274
2015 1,200,000 79,206 2,418,846 3,698,052 1,302,456 1,400,000 2,702,456 6,400,508
Jan-Dirk Auris (Adhesive Technologies)
Member of the Management Board since 1/1/2011
2016 750,000 45,208 1,511,755 2,306,963 814,022 800,000 1,614,022 3,920,985
2015 750,000 47,361 1,375,171 2,172,532 740,477 800,000 1,540,477 3,713,009
Pascal Houdayer (Beauty Care)
Member of the Management Board since 3/1/2016
2016 625,000 90,504 1,192,629 1,908,134 642,185 666,667 1,308,852 3,216,985
2015 – – – – – – – –
Carsten Knobel (Finance)
Member of the Management Board since 7/1/2012
2016 750,000 53,903 1,563,755 2,367,658 842,022 800,000 1,642,022 4,009,680
2015 750,000 50,806 1,527,921 2,328,727 822,727 800,000 1,622,727 3,951,454
Kathrin Menges (Human Resources)
Member of the Management Board since 10/1/2011
2016 750,000 36,151 1,459,755 2,245,906 786,022 800,000 1,586,022 3,831,928
2015 750,000 40,285 1,466,821 2,257,106 789,827 800,000 1,589,827 3,846,933
Bruno Piacenza (Laundry & Home Care)
Member of the Management Board since 1/1/2011
2016 750,000 44,622 1,563,755 2,358,377 842,022 800,000 1,642,022 4,000,399
2015 750,000 99,033 1,527,921 2,376,954 822,727 800,000 1,622,727 3,999,681
Total 2016 5,075,000 422,137 10,143,939 15,641,075 5,462,121 5,400,000 10,862,121 26,503,197
2015 4,950,000 360,477 9,810,801 15,121,278 5,282,741 5,400,000 10,682,741 25,804,019
1 The payout is reported pursuant to HGB/IFRS.2 Target amount pursuant to HGB/IFRS, based on a 30-percent increase in adjusted earnings per preferred share within the performance period of three years.
LTI payout for 2016 occurs in 2019; LTI payout for 2015 occurs in 2018.
separated into the above-mentioned components, is shown in the following table.
The amounts in this table and the tables that follow have been rounded up or down to full euros. As a result, the rounded figures in some of the rows in the tables may not add up to the totals as indicated.
Combined management report 43Henkel Annual Report 2016
29 Corporate governance52 Shares and bonds57 Fundamental principles
of the Group63 Economic report
100 Henkel AG & Co. KGaA (condensed version according to the German Commercial Code [HGB])
104 Risks and opportunities report112 Forecast
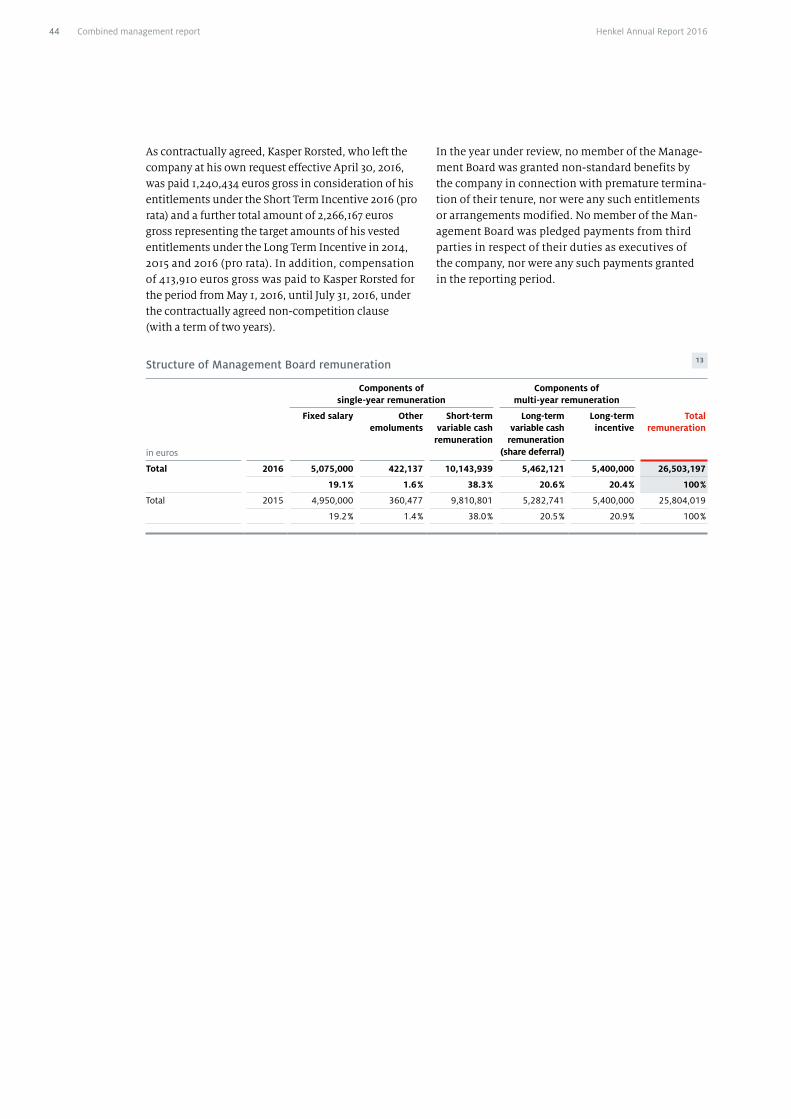
As contractually agreed, Kasper Rorsted, who left the company at his own request effective April 30, 2016, was paid 1,240,434 euros gross in consideration of his entitlements under the Short Term Incentive 2016 (pro rata) and a further total amount of 2,266,167 euros gross representing the target amounts of his vested entitlements under the Long Term Incentive in 2014, 2015 and 2016 (pro rata). In addition, compensation of 413,910 euros gross was paid to Kasper Rorsted for the period from May 1, 2016, until July 31, 2016, under the contractually agreed non-competition clause (with a term of two years).
In the year under review, no member of the Manage-ment Board was granted non-standard benefits by the company in connection with premature termina-tion of their tenure, nor were any such entitlements or arrangements modified. No member of the Man-agement Board was pledged payments from third parties in respect of their duties as executives of the company, nor were any such payments granted in the reporting period.
Structure of Management Board remuneration 13
in euros
Components of single-year remuneration
Components of multi-year remuneration
Fixed salary Other emoluments
Short-term variable cash
remuneration
Long-term variable cash
remuneration (share deferral)
Long-term incentive
Total remuneration
Total 2016 5,075,000 422,137 10,143,939 5,462,121 5,400,000 26,503,197
19.1 % 1.6 % 38.3 % 20.6 % 20.4 % 100 %
Total 2015 4,950,000 360,477 9,810,801 5,282,741 5,400,000 25,804,019
19.2 % 1.4 % 38.0 % 20.5 % 20.9 % 100 %
Combined management report44 Henkel Annual Report 2016

Pension benefits The figures calculated in accordance with the German Commercial Code [HGB] and International Accounting Standard (IAS) 19 for service cost for entitlements acquired in the reporting year and the present value of total pension benefits accruing to the end of the fiscal year are shown in the following table:
For pension obligations to former members of the Management Board and the former management of Henkel KGaA, as well as the former management of its legal predecessor and surviving dependents, 100,771,135 euros (previous year: 98,729,434 euros) is deferred. Amounts paid to such recipients during the year under review totaled 7,127,205 euros (previ-ous year: 7,163,382 euros).
Disclosures in accordance with the German Corporate Governance Code [DCGK]In accordance with the recommendations of the DCGK, the following tables show a) the benefits granted for fiscal 2016, including
the maximum and minimum achievable compensation for variable remuneration components, and
b) the allocation for fiscal 2016.
Service cost / Present value of pension benefits 14
HGB IAS
in euros
Service cost for pension benefits
in the reporting year
Present value of pension benefits
as of December 31
Service cost for pension benefits
in the reporting year
Present value of pension benefits
as of December 31
Hans Van Bylen 2016 664,026 6,319,207 664,043 6,958,733
2015 460,637 5,506,250 460,637 5,937,632
Kasper Rorsted (until 4/30/2016)
2016 302,133 7,138,814 306,093 7,295,824
2015 791,760 7,057,239 798,237 7,116,328
Jan-Dirk Auris 2016 458,482 3,147,578 458,996 3,325,032
2015 456,041 2,628,382 456,927 2,746,697
Pascal Houdayer(since 3/1/2016)
2016 379,457 623,140 379,457 623,496
2015 – – – –
Carsten Knobel 2016 457,974 2,492,714 459,243 2,658,267
2015 455,659 1,994,619 457,887 2,103,255
Kathrin Menges 2016 457,067 2,557,853 457,533 2,652,810
2015 454,902 2,051,174 455,704 2,113,541
Bruno Piacenza 2016 456,353 2,555,923 456,400 2,562,467
2015 454,174 2,045,361 454,174 2,049,561
Total 2016 3,175,492 24,835,229 3,181,765 26,076,629
2015 3,073,173 21,283,025 3,083,566 22,067,014
Combined management report 45Henkel Annual Report 2016
29 Corporate governance52 Shares and bonds57 Fundamental principles
of the Group63 Economic report
100 Henkel AG & Co. KGaA (condensed version according to the German Commercial Code [HGB])
104 Risks and opportunities report112 Forecast
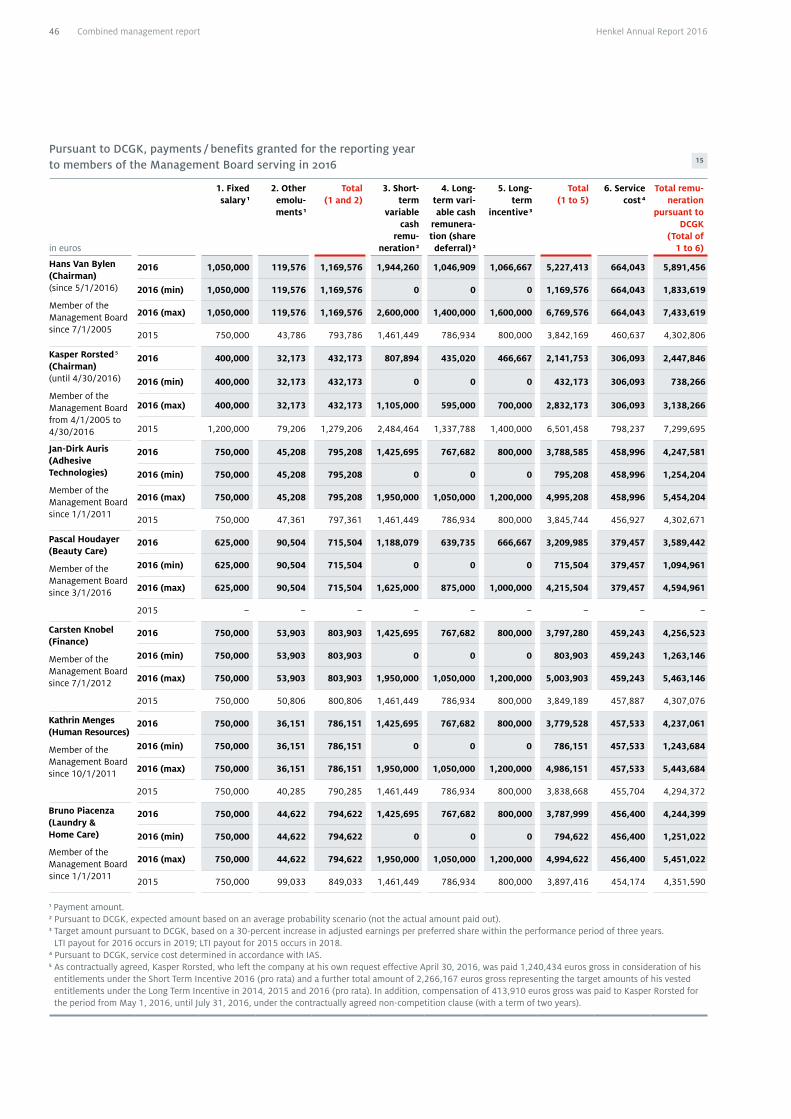
Pursuant to DCGK, payments / benefits granted for the reporting year to members of the Management Board serving in 2016 15
in euros
1. Fixed salary 1
2. Other emolu-ments 1
Total (1 and 2)
3. Short-term
variable cash
remu-neration 2
4. Long-term vari-able cash
remunera-tion (share deferral) 2
5. Long-term
incentive 3
Total (1 to 5)
6. Service cost 4
Total remu-neration
pursuant to DCGK
(Total of 1 to 6)
Hans Van Bylen (Chairman) (since 5/1/2016)
Member of the Management Board since 7/1/2005
2016 1,050,000 119,576 1,169,576 1,944,260 1,046,909 1,066,667 5,227,413 664,043 5,891,456
2016 (min) 1,050,000 119,576 1,169,576 0 0 0 1,169,576 664,043 1,833,619
2016 (max) 1,050,000 119,576 1,169,576 2,600,000 1,400,000 1,600,000 6,769,576 664,043 7,433,619
2015 750,000 43,786 793,786 1,461,449 786,934 800,000 3,842,169 460,637 4,302,806
Kasper Rorsted 5 (Chairman) (until 4/30/2016)
Member of the Management Board from 4/1/2005 to 4/30/2016
2016 400,000 32,173 432,173 807,894 435,020 466,667 2,141,753 306,093 2,447,846
2016 (min) 400,000 32,173 432,173 0 0 0 432,173 306,093 738,266
2016 (max) 400,000 32,173 432,173 1,105,000 595,000 700,000 2,832,173 306,093 3,138,266
2015 1,200,000 79,206 1,279,206 2,484,464 1,337,788 1,400,000 6,501,458 798,237 7,299,695
Jan-Dirk Auris (Adhesive Technologies)
Member of the Management Board since 1/1/2011
2016 750,000 45,208 795,208 1,425,695 767,682 800,000 3,788,585 458,996 4,247,581
2016 (min) 750,000 45,208 795,208 0 0 0 795,208 458,996 1,254,204
2016 (max) 750,000 45,208 795,208 1,950,000 1,050,000 1,200,000 4,995,208 458,996 5,454,204
2015 750,000 47,361 797,361 1,461,449 786,934 800,000 3,845,744 456,927 4,302,671
Pascal Houdayer (Beauty Care)
Member of the Management Board since 3/1/2016
2016 625,000 90,504 715,504 1,188,079 639,735 666,667 3,209,985 379,457 3,589,442
2016 (min) 625,000 90,504 715,504 0 0 0 715,504 379,457 1,094,961
2016 (max) 625,000 90,504 715,504 1,625,000 875,000 1,000,000 4,215,504 379,457 4,594,961
2015 – – – – – – – – –
Carsten Knobel (Finance)
Member of the Management Board since 7/1/2012
2016 750,000 53,903 803,903 1,425,695 767,682 800,000 3,797,280 459,243 4,256,523
2016 (min) 750,000 53,903 803,903 0 0 0 803,903 459,243 1,263,146
2016 (max) 750,000 53,903 803,903 1,950,000 1,050,000 1,200,000 5,003,903 459,243 5,463,146
2015 750,000 50,806 800,806 1,461,449 786,934 800,000 3,849,189 457,887 4,307,076
Kathrin Menges (Human Resources)
Member of the Management Board since 10/1/2011
2016 750,000 36,151 786,151 1,425,695 767,682 800,000 3,779,528 457,533 4,237,061
2016 (min) 750,000 36,151 786,151 0 0 0 786,151 457,533 1,243,684
2016 (max) 750,000 36,151 786,151 1,950,000 1,050,000 1,200,000 4,986,151 457,533 5,443,684
2015 750,000 40,285 790,285 1,461,449 786,934 800,000 3,838,668 455,704 4,294,372
Bruno Piacenza (Laundry & Home Care)
Member of the Management Board since 1/1/2011
2016 750,000 44,622 794,622 1,425,695 767,682 800,000 3,787,999 456,400 4,244,399
2016 (min) 750,000 44,622 794,622 0 0 0 794,622 456,400 1,251,022
2016 (max) 750,000 44,622 794,622 1,950,000 1,050,000 1,200,000 4,994,622 456,400 5,451,022
2015 750,000 99,033 849,033 1,461,449 786,934 800,000 3,897,416 454,174 4,351,590
1 Payment amount.2 Pursuant to DCGK, expected amount based on an average probability scenario (not the actual amount paid out).3 Target amount pursuant to DCGK, based on a 30-percent increase in adjusted earnings per preferred share within the performance period of three years.
LTI payout for 2016 occurs in 2019; LTI payout for 2015 occurs in 2018.4 Pursuant to DCGK, service cost determined in accordance with IAS.5 As contractually agreed, Kasper Rorsted, who left the company at his own request effective April 30, 2016, was paid 1,240,434 euros gross in consideration of his
entitlements under the Short Term Incentive 2016 (pro rata) and a further total amount of 2,266,167 euros gross representing the target amounts of his vested entitlements under the Long Term Incentive in 2014, 2015 and 2016 (pro rata). In addition, compensation of 413,910 euros gross was paid to Kasper Rorsted for the period from May 1, 2016, until July 31, 2016, under the contractually agreed non-competition clause (with a term of two years).
Combined management report46 Henkel Annual Report 2016
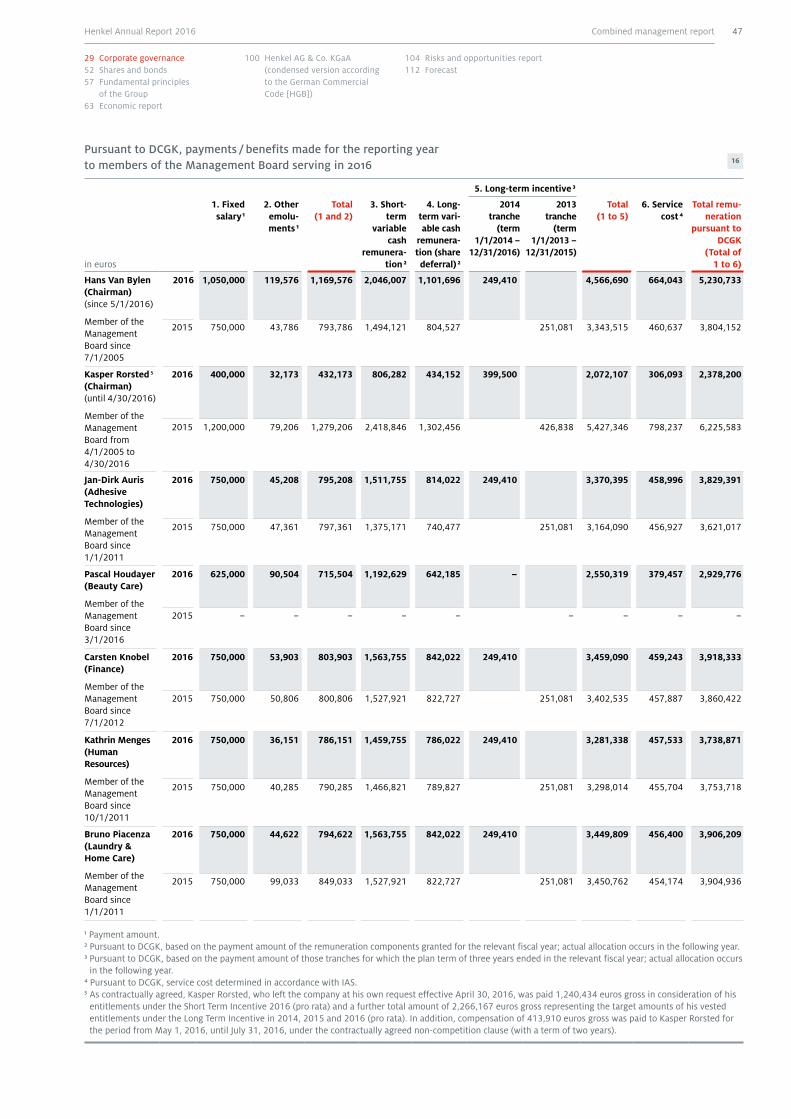
Pursuant to DCGK, payments / benefits made for the reporting year to members of the Management Board serving in 2016 16
5. Long-term incentive 3
in euros
1. Fixed salary 1
2. Other emolu-ments 1
Total (1 and 2)
3. Short-term
variable cash
remunera-tion 2
4. Long-term vari-able cash
remunera-tion (share deferral) 2
2014 tranche
(term 1/1/2014 –
12/31/2016)
2013 tranche
(term 1/1/2013 –
12/31/2015)
Total (1 to 5)
6. Service cost 4
Total remu-neration
pursuant to DCGK
(Total of 1 to 6)
Hans Van Bylen (Chairman) (since 5/1/2016)
Member of the Management Board since 7/1/2005
2016 1,050,000 119,576 1,169,576 2,046,007 1,101,696 249,410 4,566,690 664,043 5,230,733
2015 750,000 43,786 793,786 1,494,121 804,527 251,081 3,343,515 460,637 3,804,152
Kasper Rorsted 5 (Chairman) (until 4/30/2016)
Member of the Management Board from 4/1/2005 to 4/30/2016
2016 400,000 32,173 432,173 806,282 434,152 399,500 2,072,107 306,093 2,378,200
2015 1,200,000 79,206 1,279,206 2,418,846 1,302,456 426,838 5,427,346 798,237 6,225,583
Jan-Dirk Auris (Adhesive Technologies)
Member of the Management Board since 1/1/2011
2016 750,000 45,208 795,208 1,511,755 814,022 249,410 3,370,395 458,996 3,829,391
2015 750,000 47,361 797,361 1,375,171 740,477 251,081 3,164,090 456,927 3,621,017
Pascal Houdayer (Beauty Care)
Member of the Management Board since 3/1/2016
2016 625,000 90,504 715,504 1,192,629 642,185 – 2,550,319 379,457 2,929,776
2015 – – – – – – – – –
Carsten Knobel (Finance)
Member of the Management Board since 7/1/2012
2016 750,000 53,903 803,903 1,563,755 842,022 249,410 3,459,090 459,243 3,918,333
2015 750,000 50,806 800,806 1,527,921 822,727 251,081 3,402,535 457,887 3,860,422
Kathrin Menges (Human Resources)
Member of the Management Board since 10/1/2011
2016 750,000 36,151 786,151 1,459,755 786,022 249,410 3,281,338 457,533 3,738,871
2015 750,000 40,285 790,285 1,466,821 789,827 251,081 3,298,014 455,704 3,753,718
Bruno Piacenza (Laundry & Home Care)
Member of the Management Board since 1/1/2011
2016 750,000 44,622 794,622 1,563,755 842,022 249,410 3,449,809 456,400 3,906,209
2015 750,000 99,033 849,033 1,527,921 822,727 251,081 3,450,762 454,174 3,904,936
1 Payment amount.2 Pursuant to DCGK, based on the payment amount of the remuneration components granted for the relevant fiscal year; actual allocation occurs in the following year.3 Pursuant to DCGK, based on the payment amount of those tranches for which the plan term of three years ended in the relevant fiscal year; actual allocation occurs
in the following year.4 Pursuant to DCGK, service cost determined in accordance with IAS.5 As contractually agreed, Kasper Rorsted, who left the company at his own request effective April 30, 2016, was paid 1,240,434 euros gross in consideration of his
entitlements under the Short Term Incentive 2016 (pro rata) and a further total amount of 2,266,167 euros gross representing the target amounts of his vested entitlements under the Long Term Incentive in 2014, 2015 and 2016 (pro rata). In addition, compensation of 413,910 euros gross was paid to Kasper Rorsted for the period from May 1, 2016, until July 31, 2016, under the contractually agreed non-competition clause (with a term of two years).
Combined management report 47Henkel Annual Report 2016
29 Corporate governance52 Shares and bonds57 Fundamental principles
of the Group63 Economic report
100 Henkel AG & Co. KGaA (condensed version according to the German Commercial Code [HGB])
104 Risks and opportunities report112 Forecast
2. Remuneration of Henkel Management AG for assumption of personal liability, and reimbursement of expenses to same
For assumption of personal liability and manage-ment responsibility, Henkel Management AG in its function as Personally Liable Partner receives an annual payment of 50,000 euros (= 5 percent of its capital stock) plus any value-added tax (VAT) due, said fee being payable irrespective of any profit or loss made.
Henkel Management AG may also claim reimburse-ment from or payment by the corporation of all expenses incurred in connection with the manage-ment of the corporation’s business, including the remuneration and pensions paid to its corporate management bodies.
3. Remuneration of members of the Supervisory Board and of the Shareholders’ Committee of Henkel AG & Co. KGaA
Regulation, structure and amounts The remuneration for the Supervisory Board and the Shareholders’ Committee is determined by the Annual General Meeting; the corresponding provi-sions are contained in Articles 17 and 33 of the Arti-cles of Association.
Each member of the Supervisory Board and of the Shareholders’ Committee receives a fixed fee of 70,000 euros and 100,000 euros per year respec-tively. The Chairs of the Supervisory Board and the Shareholders’ Committee each receive double this amount, and the Vice Chair in each case one and a half times the aforementioned amount.
Members of the Shareholders’ Committee who are also members of one or more subcommittees of the Shareholders’ Committee each receive additional remuneration of 100,000 euros; if they chair one or more subcommittees, they receive 200,000 euros.
Members of the Supervisory Board who are also members of one or more committees each receive additional remuneration of 35,000 euros; if they chair one or more committees, they receive 70,000 euros. Activity in the Nominations Commit-tee is not remunerated separately.
The higher remuneration allocated to the members of the Shareholders’ Committee as compared to the Supervisory Board takes into account that, under the Articles of Association, the Shareholders’ Committee participates in the management of the corporation.
Combined management report48 Henkel Annual Report 2016
Other provisionsThe members of the Supervisory Board or a committee receive an attendance fee amounting to 1,000 euros for each meeting in which they participate. If several meetings take place on one day, the attendance fee is only paid once. In addition, the members of the Supervisory Board and of the Shareholders’ Commit-tee are reimbursed expenses incurred in connection with their positions. The members of the Supervisory Board are also reimbursed the value-added tax (VAT) payable on their total remunerations and reimbursed expenses.
The corporation maintains directors and officers insurance for directors and officers of the Henkel Group. For members of the Supervisory Board and Shareholders’ Committee there is a deductible amounting to 10 percent per loss event, subject to a maximum for the fiscal year of one and a half times their annual fixed remuneration.
Remuneration of members of the Supervisory Board and of the Shareholders’ Committee for fiscal 2016Total remuneration paid to the members of the Supervisory Board for the year under review (fixed fee, attendance fee, remuneration for committee activity) amounted to 1,572,896 euros plus VAT (previous year: 1,546,000 euros plus VAT). Of this amount, fixed fees accounted for 1,222,896 euros, attendance fees for 85,000 euros, and remuneration for committee activity (including associated atten-dance fees) for 265,000 euros.
Total remuneration paid to the members of the Shareholders’ Committee for the year under review (fixed fee and remuneration for subcommittee activity) amounted to 2,350,000 euros (previous year: 2,350,000 euros). Of this amount, fixed fees were 1,150,000 euros and remuneration for subcom-mittee activity 1,200,000 euros.
In the year under review, no compensation or bene-fits were paid or granted for personally performed services, including in particular advisory or interme-diation services.
The remuneration of the individual members of the Supervisory Board and of the Shareholders’ Commit-tee, broken down according to the above-mentioned components, is presented in the tables on the follow-ing pages.
Combined management report 49Henkel Annual Report 2016
29 Corporate governance52 Shares and bonds57 Fundamental principles
of the Group63 Economic report
100 Henkel AG & Co. KGaA (condensed version according to the German Commercial Code [HGB])
104 Risks and opportunities report112 Forecast
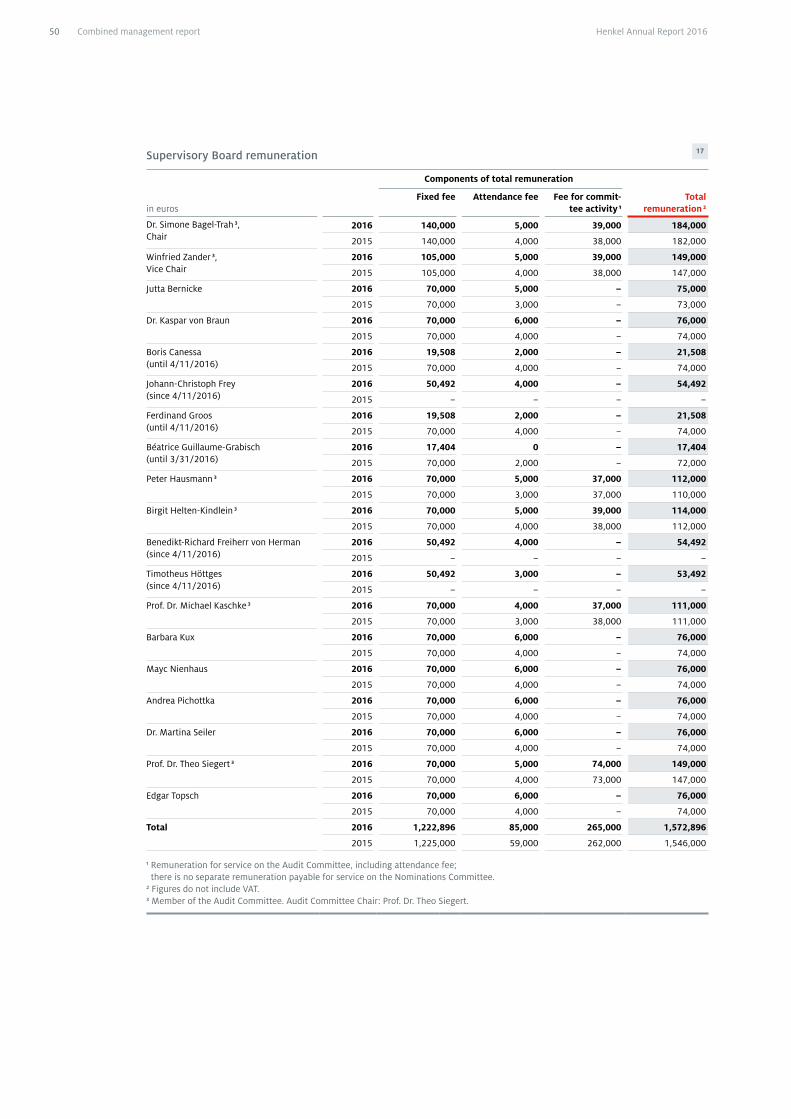
Supervisory Board remuneration 17
Components of total remuneration
in eurosFixed fee Attendance fee Fee for commit-
tee activity 1Total
remuneration 2
Dr. Simone Bagel-Trah 3, Chair
2016 140,000 5,000 39,000 184,000
2015 140,000 4,000 38,000 182,000
Winfried Zander 3, Vice Chair
2016 105,000 5,000 39,000 149,000
2015 105,000 4,000 38,000 147,000
Jutta Bernicke 2016 70,000 5,000 – 75,000
2015 70,000 3,000 – 73,000
Dr. Kaspar von Braun 2016 70,000 6,000 – 76,000
2015 70,000 4,000 – 74,000
Boris Canessa (until 4/11/2016)
2016 19,508 2,000 – 21,508
2015 70,000 4,000 – 74,000
Johann-Christoph Frey (since 4/11/2016)
2016 50,492 4,000 – 54,492
2015 – – – –
Ferdinand Groos (until 4/11/2016)
2016 19,508 2,000 – 21,508
2015 70,000 4,000 – 74,000
Béatrice Guillaume-Grabisch (until 3/31/2016)
2016 17,404 0 – 17,404
2015 70,000 2,000 – 72,000
Peter Hausmann 3 2016 70,000 5,000 37,000 112,000
2015 70,000 3,000 37,000 110,000
Birgit Helten-Kindlein 3 2016 70,000 5,000 39,000 114,000
2015 70,000 4,000 38,000 112,000
Benedikt-Richard Freiherr von Herman (since 4/11/2016)
2016 50,492 4,000 – 54,492
2015 – – – –
Timotheus Höttges (since 4/11/2016)
2016 50,492 3,000 – 53,492
2015 – – – –
Prof. Dr. Michael Kaschke 3 2016 70,000 4,000 37,000 111,000
2015 70,000 3,000 38,000 111,000
Barbara Kux 2016 70,000 6,000 – 76,000
2015 70,000 4,000 – 74,000
Mayc Nienhaus 2016 70,000 6,000 – 76,000
2015 70,000 4,000 – 74,000
Andrea Pichottka 2016 70,000 6,000 – 76,000
2015 70,000 4,000 – 74,000
Dr. Martina Seiler 2016 70,000 6,000 – 76,000
2015 70,000 4,000 – 74,000
Prof. Dr. Theo Siegert 3 2016 70,000 5,000 74,000 149,000
2015 70,000 4,000 73,000 147,000
Edgar Topsch 2016 70,000 6,000 – 76,000
2015 70,000 4,000 – 74,000
Total 2016 1,222,896 85,000 265,000 1,572,896
2015 1,225,000 59,000 262,000 1,546,000
1 Remuneration for service on the Audit Committee, including attendance fee; there is no separate remuneration payable for service on the Nominations Committee.
2 Figures do not include VAT.3 Member of the Audit Committee. Audit Committee Chair: Prof. Dr. Theo Siegert.
Combined management report50 Henkel Annual Report 2016
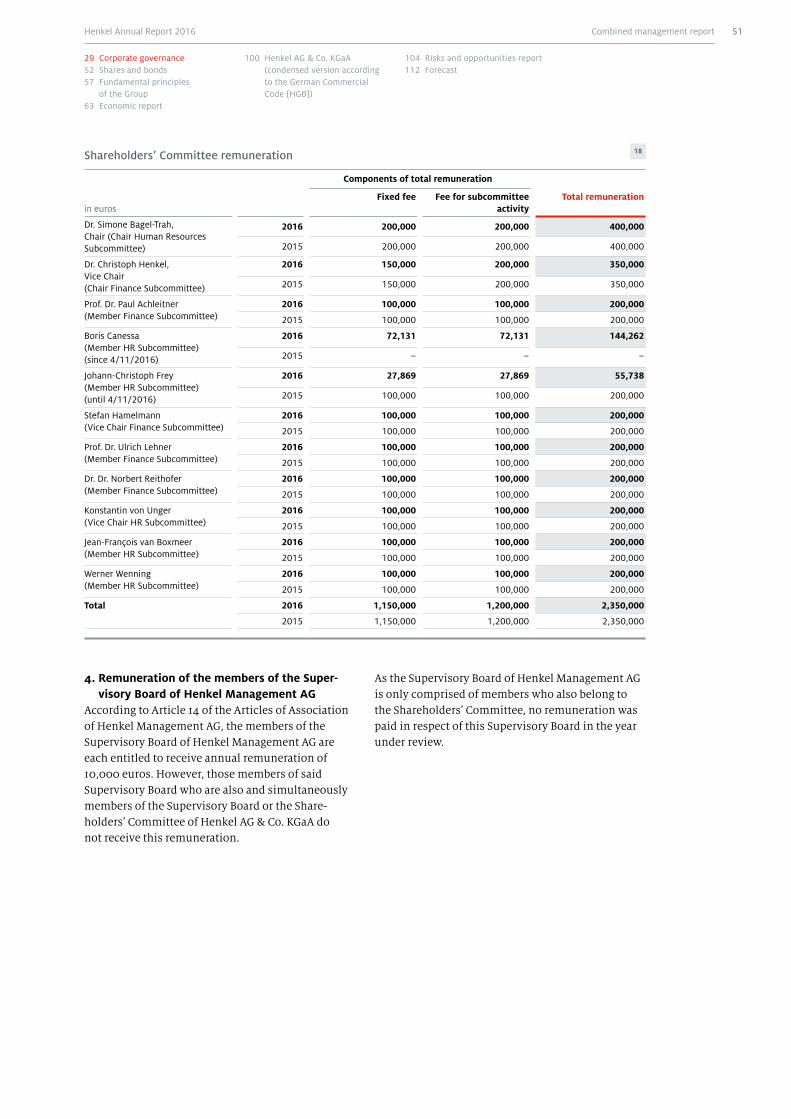
Shareholders’ Committee remuneration 18
Components of total remuneration
in eurosFixed fee Fee for subcommittee
activityTotal remuneration
Dr. Simone Bagel-Trah, Chair (Chair Human Resources Subcommittee)
2016 200,000 200,000 400,000
2015 200,000 200,000 400,000
Dr. Christoph Henkel, Vice Chair (Chair Finance Subcommittee)
2016 150,000 200,000 350,000
2015 150,000 200,000 350,000
Prof. Dr. Paul Achleitner (Member Finance Subcommittee)
2016 100,000 100,000 200,000
2015 100,000 100,000 200,000
Boris Canessa (Member HR Subcommittee) (since 4/11/2016)
2016 72,131 72,131 144,262
2015 – – –
Johann-Christoph Frey (Member HR Subcommittee) (until 4/11/2016)
2016 27,869 27,869 55,738
2015 100,000 100,000 200,000
Stefan Hamelmann (Vice Chair Finance Subcommittee)
2016 100,000 100,000 200,000
2015 100,000 100,000 200,000
Prof. Dr. Ulrich Lehner (Member Finance Subcommittee)
2016 100,000 100,000 200,000
2015 100,000 100,000 200,000
Dr. Dr. Norbert Reithofer (Member Finance Subcommittee)
2016 100,000 100,000 200,000
2015 100,000 100,000 200,000
Konstantin von Unger (Vice Chair HR Subcommittee)
2016 100,000 100,000 200,000
2015 100,000 100,000 200,000
Jean-François van Boxmeer (Member HR Subcommittee)
2016 100,000 100,000 200,000
2015 100,000 100,000 200,000
Werner Wenning (Member HR Subcommittee)
2016 100,000 100,000 200,000
2015 100,000 100,000 200,000
Total 2016 1,150,000 1,200,000 2,350,000
2015 1,150,000 1,200,000 2,350,000
4. Remuneration of the members of the Super-visory Board of Henkel Management AG
According to Article 14 of the Articles of Association of Henkel Management AG, the members of the Supervisory Board of Henkel Management AG are each entitled to receive annual remuneration of 10,000 euros. However, those members of said Supervisory Board who are also and simultaneously members of the Supervisory Board or the Share- holders’ Committee of Henkel AG & Co. KGaA do not receive this remuneration.
As the Supervisory Board of Henkel Management AG is only comprised of members who also belong to the Shareholders’ Committee, no remuneration was paid in respect of this Supervisory Board in the year under review.
Combined management report 51Henkel Annual Report 2016
29 Corporate governance52 Shares and bonds57 Fundamental principles
of the Group63 Economic report
100 Henkel AG & Co. KGaA (condensed version according to the German Commercial Code [HGB])
104 Risks and opportunities report112 Forecast
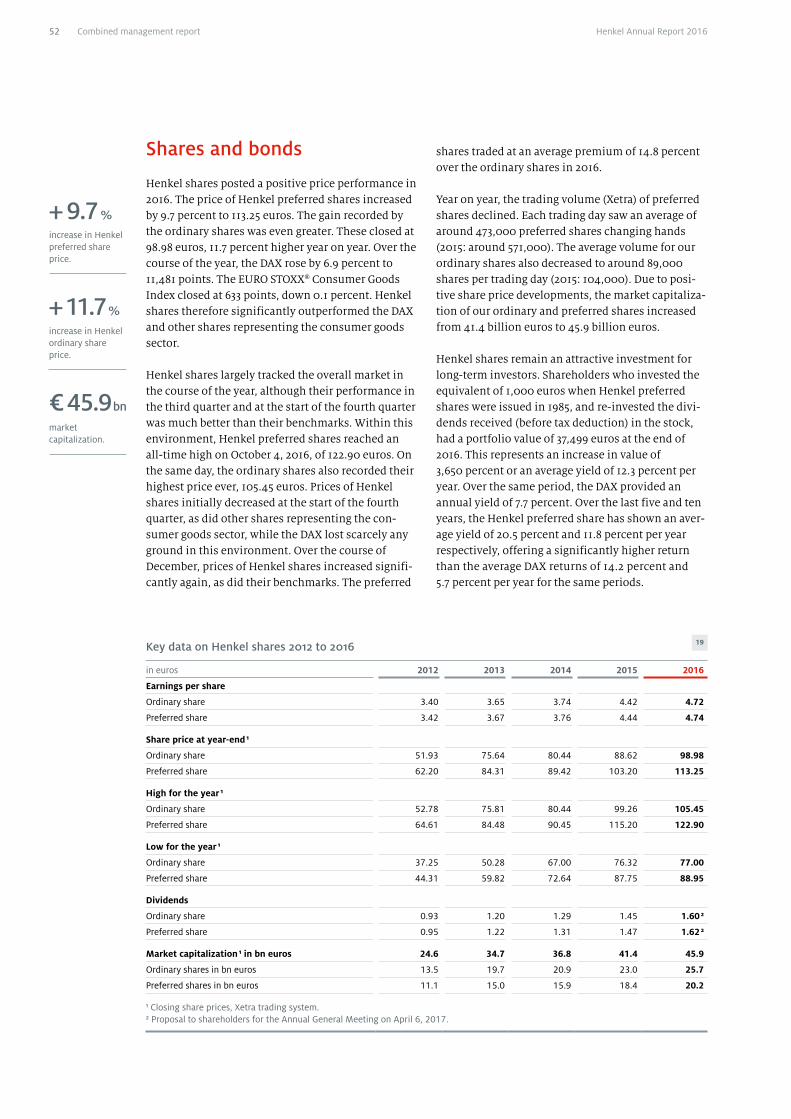
Shares and bonds
Henkel shares posted a positive price performance in 2016. The price of Henkel preferred shares increased by 9.7 percent to 113.25 euros. The gain recorded by the ordinary shares was even greater. These closed at 98.98 euros, 11.7 percent higher year on year. Over the course of the year, the DAX rose by 6.9 percent to 11,481 points. The EURO STOXX® Consumer Goods Index closed at 633 points, down 0.1 percent. Henkel shares therefore significantly outperformed the DAX and other shares representing the consumer goods sector.
Henkel shares largely tracked the overall market in the course of the year, although their performance in the third quarter and at the start of the fourth quarter was much better than their benchmarks. Within this environment, Henkel preferred shares reached an all-time high on October 4, 2016, of 122.90 euros. On the same day, the ordinary shares also recorded their highest price ever, 105.45 euros. Prices of Henkel shares initially decreased at the start of the fourth quarter, as did other shares representing the con-sumer goods sector, while the DAX lost scarcely any ground in this environment. Over the course of December, prices of Henkel shares increased signifi-cantly again, as did their benchmarks. The preferred
shares traded at an average premium of 14.8 percent over the ordinary shares in 2016.
Year on year, the trading volume (Xetra) of preferred shares declined. Each trading day saw an average of around 473,000 preferred shares changing hands (2015: around 571,000). The average volume for our ordinary shares also decreased to around 89,000 shares per trading day (2015: 104,000). Due to posi-tive share price developments, the market capitaliza-tion of our ordinary and preferred shares increased from 41.4 billion euros to 45.9 billion euros.
Henkel shares remain an attractive investment for long-term investors. Shareholders who invested the equivalent of 1,000 euros when Henkel preferred shares were issued in 1985, and re-invested the divi-dends received (before tax deduction) in the stock, had a portfolio value of 37,499 euros at the end of 2016. This represents an increase in value of 3,650 percent or an average yield of 12.3 percent per year. Over the same period, the DAX provided an annual yield of 7.7 percent. Over the last five and ten years, the Henkel preferred share has shown an aver-age yield of 20.5 percent and 11.8 percent per year respectively, offering a significantly higher return than the average DAX returns of 14.2 percent and 5.7 percent per year for the same periods.
Key data on Henkel shares 2012 to 2016 19
in euros 2012 2013 2014 2015 2016
Earnings per share
Ordinary share 3.40 3.65 3.74 4.42 4.72
Preferred share 3.42 3.67 3.76 4.44 4.74
Share price at year-end 1
Ordinary share 51.93 75.64 80.44 88.62 98.98
Preferred share 62.20 84.31 89.42 103.20 113.25
High for the year 1
Ordinary share 52.78 75.81 80.44 99.26 105.45
Preferred share 64.61 84.48 90.45 115.20 122.90
Low for the year 1
Ordinary share 37.25 50.28 67.00 76.32 77.00
Preferred share 44.31 59.82 72.64 87.75 88.95
Dividends
Ordinary share 0.93 1.20 1.29 1.45 1.60 2
Preferred share 0.95 1.22 1.31 1.47 1.62 2
Market capitalization 1 in bn euros 24.6 34.7 36.8 41.4 45.9
Ordinary shares in bn euros 13.5 19.7 20.9 23.0 25.7
Preferred shares in bn euros 11.1 15.0 15.9 18.4 20.2
1 Closing share prices, Xetra trading system.2 Proposal to shareholders for the Annual General Meeting on April 6, 2017.
+ 9.7 %
+ 11.7 %
increase in Henkel preferred share price.
increase in Henkel ordinary share price.
€ 45.9 bn
market capitalization.
Combined management report52 Henkel Annual Report 2016
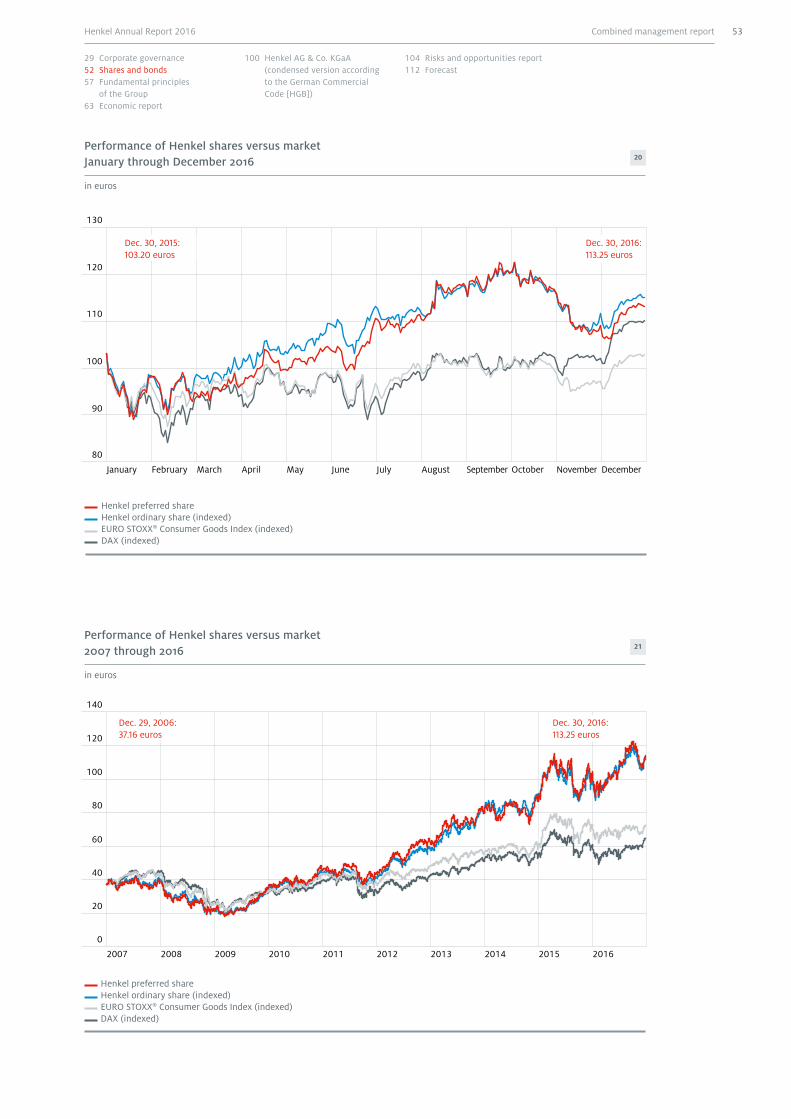
120
130
80
100
90
110
100
120
140
0
20
40
60
80
2007 2008 2009 2010 2011 2012 2013 2014 2015 2016
Performance of Henkel shares versus market January through December 2016 20
in euros
Performance of Henkel shares versus market 2007 through 2016 21
in euros
AugustJanuary February March April May June July September October November December
Henkel preferred share
EURO STOXX® Consumer Goods Index (indexed)Henkel ordinary share (indexed)
DAX (indexed)
Henkel preferred share
EURO STOXX® Consumer Goods Index (indexed)Henkel ordinary share (indexed)
DAX (indexed)
Dec. 30, 2016: 113.25 euros
Dec. 30, 2015: 103.20 euros
Dec. 29, 2006: 37.16 euros
Dec. 30, 2016: 113.25 euros
Combined management report 53Henkel Annual Report 2016
29 Corporate governance52 Shares and bonds57 Fundamental principles
of the Group63 Economic report
100 Henkel AG & Co. KGaA (condensed version according to the German Commercial Code [HGB])
104 Risks and opportunities report112 Forecast
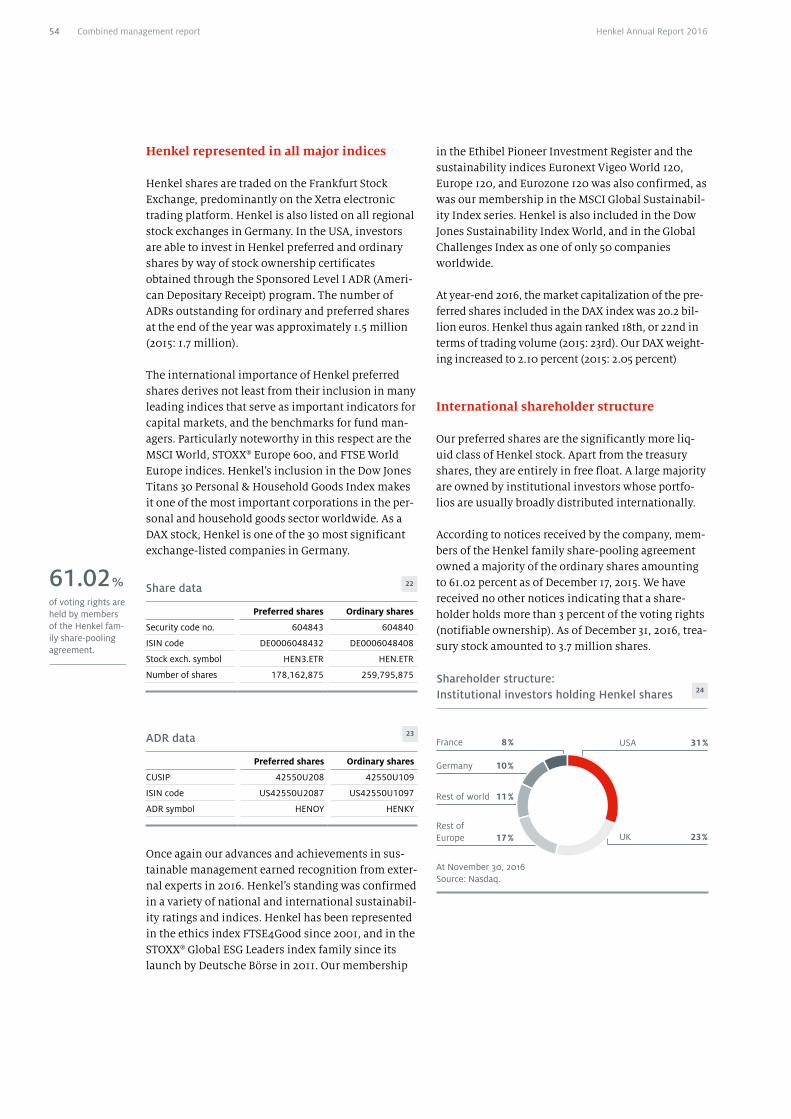
Henkel represented in all major indices
Henkel shares are traded on the Frankfurt Stock Exchange, predominantly on the Xetra electronic trading platform. Henkel is also listed on all regional stock exchanges in Germany. In the USA, investors are able to invest in Henkel preferred and ordinary shares by way of stock ownership certificates obtained through the Sponsored Level I ADR (Ameri-can Depositary Receipt) program. The number of ADRs outstanding for ordinary and preferred shares at the end of the year was approximately 1.5 million (2015: 1.7 million).
The international importance of Henkel preferred shares derives not least from their inclusion in many leading indices that serve as important indicators for capital markets, and the benchmarks for fund man-agers. Particularly noteworthy in this respect are the MSCI World, STOXX® Europe 600, and FTSE World Europe indices. Henkel’s inclusion in the Dow Jones Titans 30 Personal & Household Goods Index makes it one of the most important corporations in the per-sonal and household goods sector worldwide. As a DAX stock, Henkel is one of the 30 most significant exchange-listed companies in Germany.
Share data 22
Preferred shares Ordinary shares
Security code no. 604843 604840
ISIN code DE0006048432 DE0006048408
Stock exch. symbol HEN3.ETR HEN.ETR
Number of shares 178,162,875 259,795,875
ADR data 23
Preferred shares Ordinary shares
CUSIP 42550U208 42550U109
ISIN code US42550U2087 US42550U1097
ADR symbol HENOY HENKY
Once again our advances and achievements in sus-tainable management earned recognition from exter-nal experts in 2016. Henkel’s standing was confirmed in a variety of national and international sustainabil-ity ratings and indices. Henkel has been represented in the ethics index FTSE4Good since 2001, and in the STOXX® Global ESG Leaders index family since its launch by Deutsche Börse in 2011. Our membership
in the Ethibel Pioneer Investment Register and the sustainability indices Euronext Vigeo World 120, Europe 120, and Eurozone 120 was also confirmed, as was our membership in the MSCI Global Sustainabil-ity Index series. Henkel is also included in the Dow Jones Sustainability Index World, and in the Global Challenges Index as one of only 50 companies worldwide.
At year-end 2016, the market capitalization of the pre-ferred shares included in the DAX index was 20.2 bil-lion euros. Henkel thus again ranked 18th, or 22nd in terms of trading volume (2015: 23rd). Our DAX weight-ing increased to 2.10 percent (2015: 2.05 percent)
International shareholder structure
Our preferred shares are the significantly more liq-uid class of Henkel stock. Apart from the treasury shares, they are entirely in free float. A large majority are owned by institutional investors whose portfo-lios are usually broadly distributed internationally.
According to notices received by the company, mem-bers of the Henkel family share-pooling agreement owned a majority of the ordinary shares amounting to 61.02 percent as of December 17, 2015. We have received no other notices indicating that a share-holder holds more than 3 percent of the voting rights (notifiable ownership). As of December 31, 2016, trea-sury stock amounted to 3.7 million shares.
of voting rights are held by members of the Henkel fam-ily share-pooling agreement.
61.02 %
France 8 %
Germany 10 %
Shareholder structure: Institutional investors holding Henkel shares 24
USA 31 %
At November 30, 2016Source: Nasdaq.
Rest of Europe 17 %
Rest of world 11 %
UK 23 %
Combined management report54 Henkel Annual Report 2016
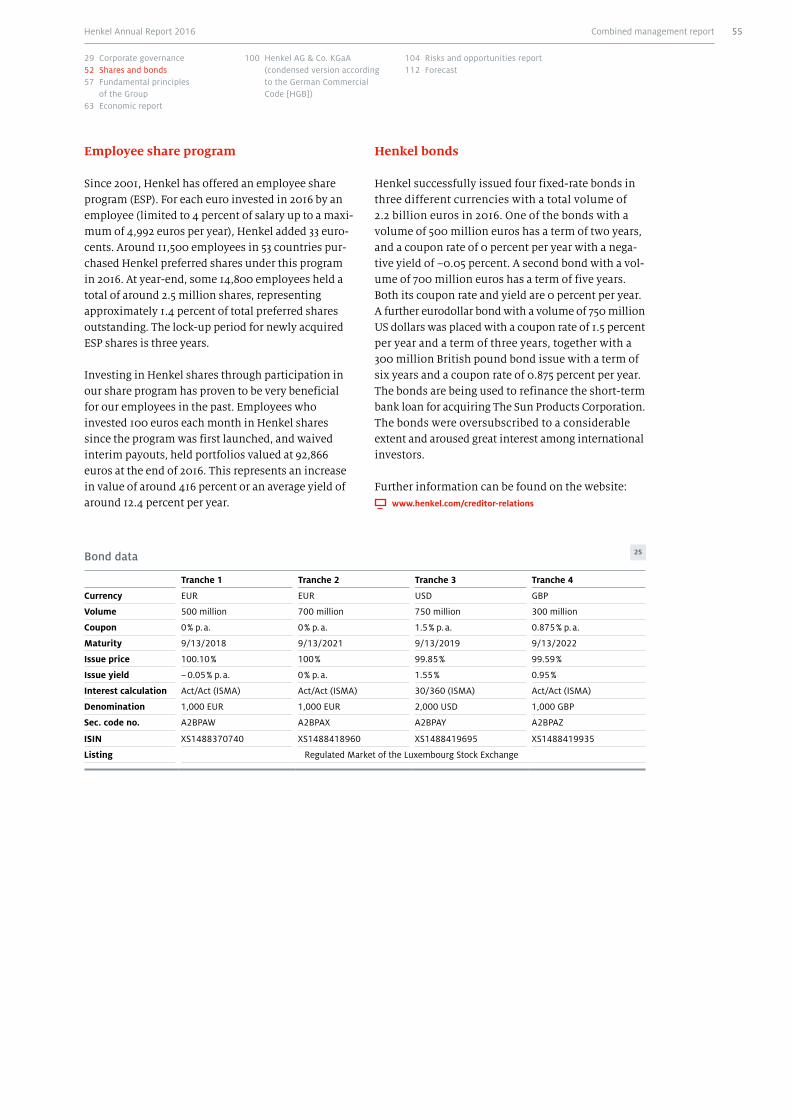
Employee share program
Since 2001, Henkel has offered an employee share program (ESP). For each euro invested in 2016 by an employee (limited to 4 percent of salary up to a maxi-mum of 4,992 euros per year), Henkel added 33 euro-cents. Around 11,500 employees in 53 countries pur-chased Henkel preferred shares under this program in 2016. At year-end, some 14,800 employees held a total of around 2.5 million shares, representing approximately 1.4 percent of total preferred shares outstanding. The lock-up period for newly acquired ESP shares is three years.
Investing in Henkel shares through participation in our share program has proven to be very beneficial for our employees in the past. Employees who invested 100 euros each month in Henkel shares since the program was first launched, and waived interim payouts, held portfolios valued at 92,866 euros at the end of 2016. This represents an increase in value of around 416 percent or an average yield of around 12.4 percent per year.
Henkel bonds
Henkel successfully issued four fixed-rate bonds in three different currencies with a total volume of 2.2 billion euros in 2016. One of the bonds with a volume of 500 million euros has a term of two years, and a coupon rate of 0 percent per year with a nega-tive yield of –0.05 percent. A second bond with a vol-ume of 700 million euros has a term of five years. Both its coupon rate and yield are 0 percent per year. A further eurodollar bond with a volume of 750 million US dollars was placed with a coupon rate of 1.5 percent per year and a term of three years, together with a 300 million British pound bond issue with a term of six years and a coupon rate of 0.875 percent per year. The bonds are being used to refinance the short-term bank loan for acquiring The Sun Products Corporation. The bonds were oversubscribed to a considerable extent and aroused great interest among international investors.
Further information can be found on the website:
www.henkel.com/creditor-relations
Bond data 25
Tranche 1 Tranche 2 Tranche 3 Tranche 4
Currency EUR EUR USD GBP
Volume 500 million 700 million 750 million 300 million
Coupon 0 % p. a. 0 % p. a. 1.5 % p. a. 0.875 % p. a.
Maturity 9/13/2018 9/13/2021 9/13/2019 9/13/2022
Issue price 100.10 % 100 % 99.85 % 99.59 %
Issue yield – 0.05 % p. a. 0 % p. a. 1.55 % 0.95 %
Interest calculation Act/Act (ISMA) Act/Act (ISMA) 30/360 (ISMA) Act/Act (ISMA)
Denomination 1,000 EUR 1,000 EUR 2,000 USD 1,000 GBP
Sec. code no. A2BPAW A2BPAX A2BPAY A2BPAZ
ISIN XS1488370740 XS1488418960 XS1488419695 XS1488419935
Listing Regulated Market of the Luxembourg Stock Exchange
Combined management report 55Henkel Annual Report 2016
29 Corporate governance52 Shares and bonds57 Fundamental principles
of the Group63 Economic report
100 Henkel AG & Co. KGaA (condensed version according to the German Commercial Code [HGB])
104 Risks and opportunities report112 Forecast
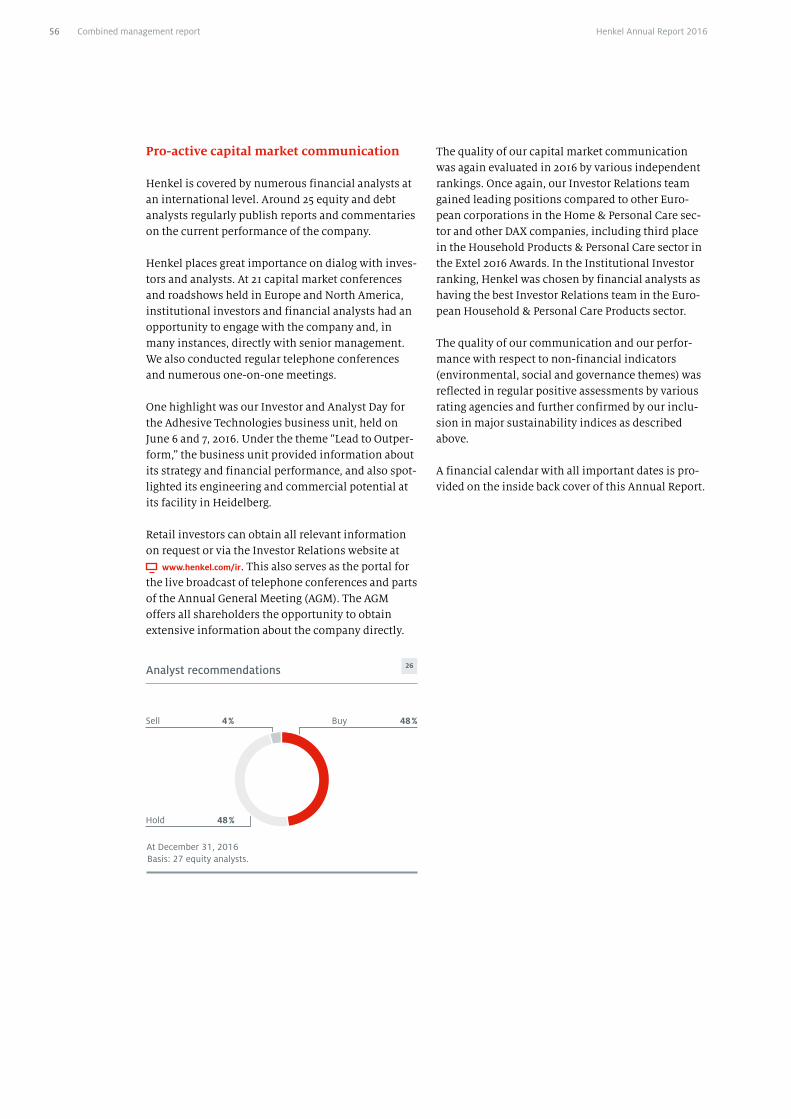
Pro-active capital market communication
Henkel is covered by numerous financial analysts at an international level. Around 25 equity and debt analysts regularly publish reports and commentaries on the current performance of the company.
Henkel places great importance on dialog with inves-tors and analysts. At 21 capital market conferences and roadshows held in Europe and North America, institutional investors and financial analysts had an opportunity to engage with the company and, in many instances, directly with senior management. We also conducted regular telephone conferences and numerous one-on-one meetings.
One highlight was our Investor and Analyst Day for the Adhesive Technologies business unit, held on June 6 and 7, 2016. Under the theme “Lead to Outper-form,” the business unit provided information about its strategy and financial performance, and also spot-lighted its engineering and commercial potential at its facility in Heidelberg.
Retail investors can obtain all relevant information on request or via the Investor Relations website at
www.henkel.com/ir. This also serves as the portal for the live broadcast of telephone conferences and parts of the Annual General Meeting (AGM). The AGM offers all shareholders the opportunity to obtain extensive information about the company directly.
The quality of our capital market communication was again evaluated in 2016 by various independent rankings. Once again, our Investor Relations team gained leading positions compared to other Euro-pean corporations in the Home & Personal Care sec-tor and other DAX companies, including third place in the Household Products & Personal Care sector in the Extel 2016 Awards. In the Institutional Investor ranking, Henkel was chosen by financial analysts as having the best Investor Relations team in the Euro-pean Household & Personal Care Products sector.
The quality of our communication and our perfor-mance with respect to non-financial indicators (environmental, social and governance themes) was reflected in regular positive assessments by various rating agencies and further confirmed by our inclu-sion in major sustainability indices as described above.
A financial calendar with all important dates is pro-vided on the inside back cover of this Annual Report.
Sell 4 %
Analyst recommendations 26
At December 31, 2016 Basis: 27 equity analysts.
Buy 48 %
Hold 48 %
Combined management report56 Henkel Annual Report 2016
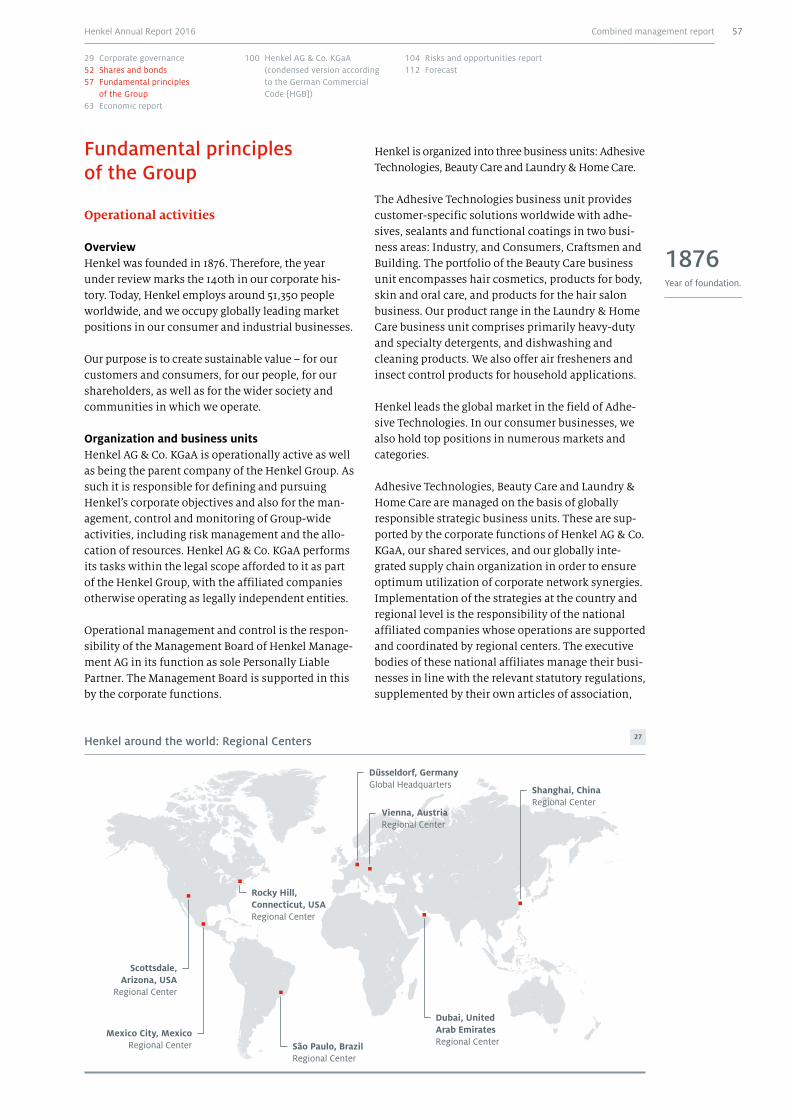
Fundamental principles of the Group
Operational activities
OverviewHenkel was founded in 1876. Therefore, the year under review marks the 140th in our corporate his-tory. Today, Henkel employs around 51,350 people worldwide, and we occupy globally leading market positions in our consumer and industrial businesses.
Our purpose is to create sustainable value – for our customers and consumers, for our people, for our shareholders, as well as for the wider society and communities in which we operate.
Organization and business units Henkel AG & Co. KGaA is operationally active as well as being the parent company of the Henkel Group. As such it is responsible for defining and pursuing Henkel’s corporate objectives and also for the man-agement, control and monitoring of Group-wide activities, including risk management and the allo-cation of resources. Henkel AG & Co. KGaA performs its tasks within the legal scope afforded to it as part of the Henkel Group, with the affiliated companies otherwise operating as legally independent entities.
Operational management and control is the respon-sibility of the Management Board of Henkel Manage-ment AG in its function as sole Personally Liable Partner. The Management Board is supported in this by the corporate functions.
Henkel is organized into three business units: Adhesive Technologies, Beauty Care and Laundry & Home Care.
The Adhesive Technologies business unit provides customer-specific solutions worldwide with adhe-sives, sealants and functional coatings in two busi-ness areas: Industry, and Consumers, Craftsmen and Building. The portfolio of the Beauty Care business unit encompasses hair cosmetics, products for body, skin and oral care, and products for the hair salon business. Our product range in the Laundry & Home Care business unit comprises primarily heavy-duty and specialty detergents, and dishwashing and cleaning products. We also offer air fresheners and insect control products for household applications.
Henkel leads the global market in the field of Adhe-sive Technologies. In our consumer businesses, we also hold top positions in numerous markets and categories.
Adhesive Technologies, Beauty Care and Laundry & Home Care are managed on the basis of globally responsible strategic business units. These are sup-ported by the corporate functions of Henkel AG & Co. KGaA, our shared services, and our globally inte-grated supply chain organization in order to ensure optimum utilization of corporate network synergies. Implementation of the strategies at the country and regional level is the responsibility of the national affiliated companies whose operations are supported and coordinated by regional centers. The executive bodies of these national affiliates manage their busi-nesses in line with the relevant statutory regulations, supplemented by their own articles of association,
Year of foundation.
1876
Henkel around the world: Regional Centers 27
Scottsdale, Arizona, USA
Regional Center
Rocky Hill, Connecticut, USA Regional Center
São Paulo, BrazilRegional Center
Dubai, United Arab Emirates Regional Center
Shanghai, China Regional Center
Vienna, AustriaRegional Center
Düsseldorf, Germany Global Headquarters
Mexico City, Mexico Regional Center
Combined management report 57Henkel Annual Report 2016
29 Corporate governance52 Shares and bonds57 Fundamental principles
of the Group63 Economic report
100 Henkel AG & Co. KGaA (condensed version according to the German Commercial Code [HGB])
104 Risks and opportunities report112 Forecast
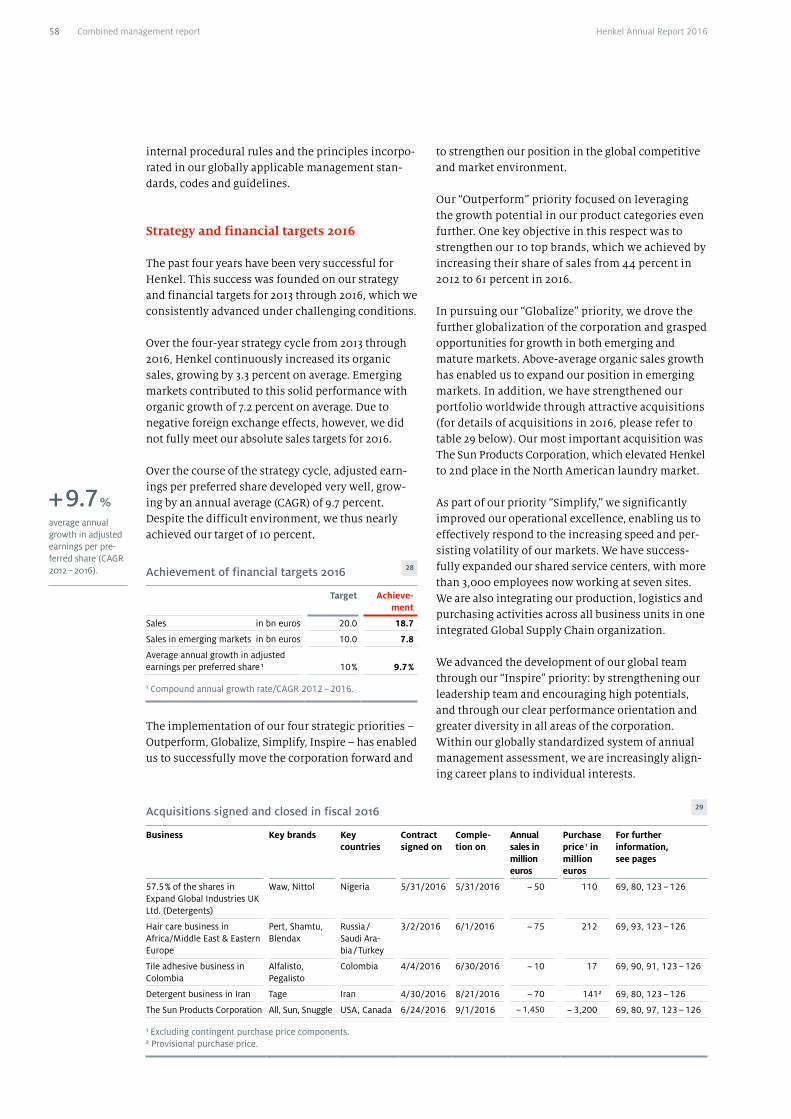
internal procedural rules and the principles incorpo-rated in our globally applicable management stan-dards, codes and guidelines.
Strategy and financial targets 2016
The past four years have been very successful for Henkel. This success was founded on our strategy and financial targets for 2013 through 2016, which we consistently advanced under challenging conditions.
Over the four-year strategy cycle from 2013 through 2016, Henkel continuously increased its organic sales, growing by 3.3 percent on average. Emerging markets contributed to this solid performance with organic growth of 7.2 percent on average. Due to negative foreign exchange effects, however, we did not fully meet our absolute sales targets for 2016.
Over the course of the strategy cycle, adjusted earn-ings per preferred share developed very well, grow-ing by an annual average (CAGR) of 9.7 percent. Despite the difficult environment, we thus nearly achieved our target of 10 percent.
Achievement of financial targets 2016 28
Target Achieve-ment
Sales in bn euros 20.0 18.7
Sales in emerging markets in bn euros 10.0 7.8
Average annual growth in adjusted earnings per preferred share 1 10 % 9.7 %
1 Compound annual growth rate/CAGR 2012 – 2016.
The implementation of our four strategic priorities – Outperform, Globalize, Simplify, Inspire – has enabled us to successfully move the corporation forward and
to strengthen our position in the global competitive and market environment.
Our “Outperform” priority focused on leveraging the growth potential in our product categories even further. One key objective in this respect was to strengthen our 10 top brands, which we achieved by increasing their share of sales from 44 percent in 2012 to 61 percent in 2016.
In pursuing our “Globalize” priority, we drove the further globalization of the corporation and grasped opportunities for growth in both emerging and mature markets. Above-average organic sales growth has enabled us to expand our position in emerging markets. In addition, we have strengthened our portfolio worldwide through attractive acquisitions (for details of acquisitions in 2016, please refer to table 29 below). Our most important acquisition was The Sun Products Corporation, which elevated Henkel to 2nd place in the North American laundry market.
As part of our priority “Simplify,” we significantly improved our operational excellence, enabling us to effectively respond to the increasing speed and per-sisting volatility of our markets. We have success-fully expanded our shared service centers, with more than 3,000 employees now working at seven sites. We are also integrating our production, logistics and purchasing activities across all business units in one integrated Global Supply Chain organization.
We advanced the development of our global team through our “Inspire” priority: by strengthening our leadership team and encouraging high potentials, and through our clear performance orientation and greater diversity in all areas of the corporation. Within our globally standardized system of annual management assessment, we are increasingly align-ing career plans to individual interests.
Acquisitions signed and closed in fiscal 2016 29
Business
Key brands
Key countries
Contract signed on
Comple-tion on
Annual sales in million euros
Purchase price 1 in million euros
For further information, see pages
57.5 % of the shares in Expand Global Industries UK Ltd. (Detergents)
Waw, Nittol Nigeria 5/31/2016 5/31/2016 ~ 50 110 69, 80, 123 – 126
Hair care business in Africa/Middle East & Eastern Europe
Pert, Shamtu, Blendax
Russia / Saudi Ara-bia / Turkey
3/2/2016 6/1/2016 ~ 75 212 69, 93, 123 – 126
Tile adhesive business in Colombia
Alfalisto, Pegalisto
Colombia 4/4/2016 6/30/2016 ~ 10 17 69, 90, 91, 123 – 126
Detergent business in Iran Tage Iran 4/30/2016 8/21/2016 ~ 70 1412 69, 80, 123 – 126
The Sun Products Corporation All, Sun, Snuggle USA, Canada 6/24/2016 9/1/2016 ~ 1,450 ~ 3,200 69, 80, 97, 123 – 126
1 Excluding contingent purchase price components.2 Provisional purchase price.
+ 9.7 %
average annual growth in adjusted earnings per pre-ferred share (CAGR 2012 – 2016).
Combined management report58 Henkel Annual Report 2016
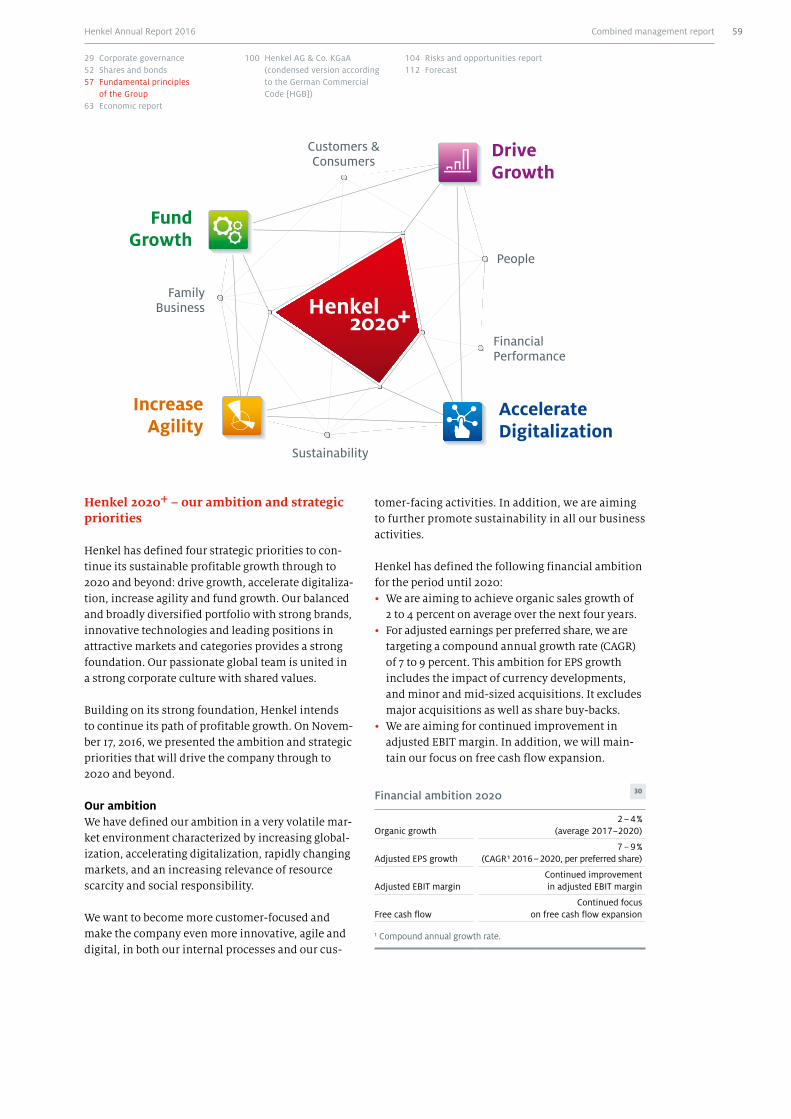
Henkel 2020+ – our ambition and strategic priorities
Henkel has defined four strategic priorities to con-tinue its sustainable profitable growth through to 2020 and beyond: drive growth, accelerate digitaliza-tion, increase agility and fund growth. Our balanced and broadly diversified portfolio with strong brands, innovative technologies and leading positions in attractive markets and categories provides a strong foundation. Our passionate global team is united in a strong corporate culture with shared values.
Building on its strong foundation, Henkel intends to continue its path of profitable growth. On Novem-ber 17, 2016, we presented the ambition and strategic priorities that will drive the company through to 2020 and beyond.
Our ambitionWe have defined our ambition in a very volatile mar-ket environment characterized by increasing global-ization, accelerating digitalization, rapidly changing markets, and an increasing relevance of resource scarcity and social responsibility.
We want to become more customer-focused and make the company even more innovative, agile and digital, in both our internal processes and our cus-
tomer-facing activities. In addition, we are aiming to further promote sustainability in all our business activities.
Henkel has defined the following financial ambition for the period until 2020:• We are aiming to achieve organic sales growth of
2 to 4 percent on average over the next four years. • For adjusted earnings per preferred share, we are
targeting a compound annual growth rate (CAGR) of 7 to 9 percent. This ambition for EPS growth includes the impact of currency developments, and minor and mid-sized acquisitions. It excludes major acquisitions as well as share buy-backs.
• We are aiming for continued improvement in adjusted EBIT margin. In addition, we will main-tain our focus on free cash flow expansion.
Financial ambition 2020 30
Organic growth2 – 4 %
(average 2017–2020)
Adjusted EPS growth7 – 9 %
(CAGR 1 2016 – 2020, per preferred share)
Adjusted EBIT marginContinued improvement in adjusted EBIT margin
Free cash flowContinued focus
on free cash flow expansion
1 Compound annual growth rate.
Drive Growth
Accelerate Digitalization
Increase Agility
Fund Growth
Combined management report 59Henkel Annual Report 2016
29 Corporate governance52 Shares and bonds57 Fundamental principles
of the Group63 Economic report
100 Henkel AG & Co. KGaA (condensed version according to the German Commercial Code [HGB])
104 Risks and opportunities report112 Forecast
Alongside organic growth, acquisitions will continue to be an integral part of our strategy. Our assessment of potential acquisitions is based on whether the targets are available, fit Henkel’s strategy, and are financially attractive. The focus in the Adhesive Technologies business unit is on expanding techno-logy leadership, whereas in the Beauty Care and Laundry & Home Care business units, we will be striving to strengthen our categories.
Strategic priorities in summary
Drive growth
Driving growth in mature and emerging markets will be a key strategic priority for Henkel. In order to achieve this, we will focus on targeted initiatives to create superior customer and consumer engage-ment, strengthen our leading brands and technolo-gies, develop exciting innovations and services, and capture new sources of growth.
Accelerate digitalization
Accelerating digitalization will help us to successfully grow our business, strengthen the relationships with our customers and consumers, optimize our processes and transform the entire company. By 2020, we will implement a range of initiatives to drive our digital business, leverage Industry 4.0, and eTransform the organization.
Increase agility
In a highly volatile and dynamic business environment, increasing the agility of the organization will be a critical success factor for Henkel in the future. This will require energized and empowered teams, fastest time-to-market as well as smart and simplified processes.
Fund growth
In order to fund growth, we will implement new approaches to optimize resource allocation, focus on net revenue management, further increase effi-ciency in our structures, and continue to expand our Global Supply Chain organization. Together, these initiatives will contribute to further improving profit-ability and enable us to fund our growth ambitions for 2020 and beyond.
Sustainability strategy
Sustainability as one of our corporate valuesOur commitment to leadership in sustainability is anchored in our corporate values. We want to create more value – for our customers and consumers, for the communities we operate in, and for our company – while, at the same time, reducing our environmen-tal footprint. We aim to pioneer new solutions for sustainable development while continuing to shape our business responsibly and increasing our eco-nomic success. Our sustainability strategy provides a clear framework for this aim and reflects the high expectations of our stakeholders.
Our focal areasWe are concentrating our activities on six focal areas that reflect the key challenges of sustainable devel-opment as they relate to our operations. Three of them describe how we want to deliver more value – for our customers and consumers, our shareholders and our company – for example, by enhancing occu-pational health and safety, and encouraging social progress. The three other focal areas describe the ways in which we want to reduce our environmental footprint, for instance through reduced water and energy use and less waste.
Key drivers for the coming yearsWe are convinced that our focus on sustainability is more important than ever before, and that it sup-ports our growth, improves our cost efficiency, and reduces risks. We already have a strong foundation on which to build, and can demonstrate a successful track record. To reflect the growing importance of sustainability for our stakeholders and our long-term economic success, we defined three key drivers in 2016 that will help us to advance sustainability at Henkel over the coming years.
Strengthen foundationIn order to reconcile people’s desire to live well with the resource limits of the planet, and to allow us to build on our economic success, we will have to sig-nificantly improve our efficiency. In light of the global challenges of sustainable development, Henkel has set itself a long-term goal: Taking 2010 as the base year, our aim by 2030 is to triple the value we create through our business operations in rela-tion to the environmental footprint of our products and services. We call this goal “Factor 3.”
To reach this goal by 2030, we will have to improve our efficiency by an average of 5 to 6 percent each year. We managed to meet and even exceed some of the interim targets for the first five years through to
Combined management report60 Henkel Annual Report 2016

F A C T O R
Social Progress
Performance
Deliver more value
at a reduced footprint
Safety andHealth
Energy and Climate
Materials and Waste
Water and Wastewater
2015. On the road to our long-term goal of “Factor 3,” we intend to improve our performance in these areas still further over the coming years. To this end, we have defined medium-term targets through to 2020 (see chart below). For the period up to 2020, we intend to improve the relationship between the value we create and our environmental footprint by 75 per-cent overall, taking 2010 as the base year.
At the same time, we are going to further improve our reporting and measurement systems to enable an integrated approach to assessing and managing progress toward our 20-year target for 2030 across our entire company and value chain. Our ongoing dialog with stakeholders and experts, as well as per-formance benchmarking, are part of the underlying basis of our work.
Boost engagementWhen it comes to implementing our sustainability strategy, our people play a key role – through their dedication, skills and knowledge. They make their own contributions to sustainable development, both in their daily business lives and as members of soci-ety. They interface with our customers and drive innovation – and give Henkel its unique identity.
This is why we have set ourselves the goal of engag-ing all of our employees as sustainability ambassa-dors. The program was launched in 2012 to encour-age our employees to become even more involved in the issue of sustainability. Since then, Henkel has trained more than 10,000 sustainability ambassa-dors in 79 countries. At the same time, we want to encourage our people to make a contribution as ambassadors at our sites, as well as by engaging with our customers, in schools and in our communities.
Maximize impactWe want to strengthen our contribution toward over-coming major global challenges, and to maximize the impact we can achieve through our operations, our brands, and our technologies.
In light of the Paris agreement on climate change from December 2015 and the clear need to reduce emissions, Henkel is striving to become a climate- positive company. As a first step, we are aiming – by 2030 – to reduce the CO2 footprint of our production by 75 percent, and to help our customers and con-sumers save 50 million metric tons of CO2 by 2020.
Equally, Henkel is striving to encourage social prog-ress and work with partners to create shared value
Targets 2020 1Achieved 2016 1
+ 42 % + 75 %overall efficiency
more net sales per ton of product
+ 8 % + 22 %
safer per million hours worked
+ 17 % + 40 %
less water per ton of product
– 23 % – 30 %
less waste per ton of product
– 26 %2 – 30 %
less energy / CO2 emissions per ton of product
– 22 % – 30 %
More details and back-ground reading on the subject of sustainability can be found in our Sustainability Report on the internet.
www.henkel.com/sustainabilityreport
Our focal areas and targets 31
1 Compared to 2010 as the base year.2 Waste generated by our production sites, excluding construction and demolition waste.
Sustainability Report
2016
Combined management report 61Henkel Annual Report 2016
29 Corporate governance52 Shares and bonds57 Fundamental principles
of the Group63 Economic report
100 Henkel AG & Co. KGaA (condensed version according to the German Commercial Code [HGB])
104 Risks and opportunities report112 Forecast
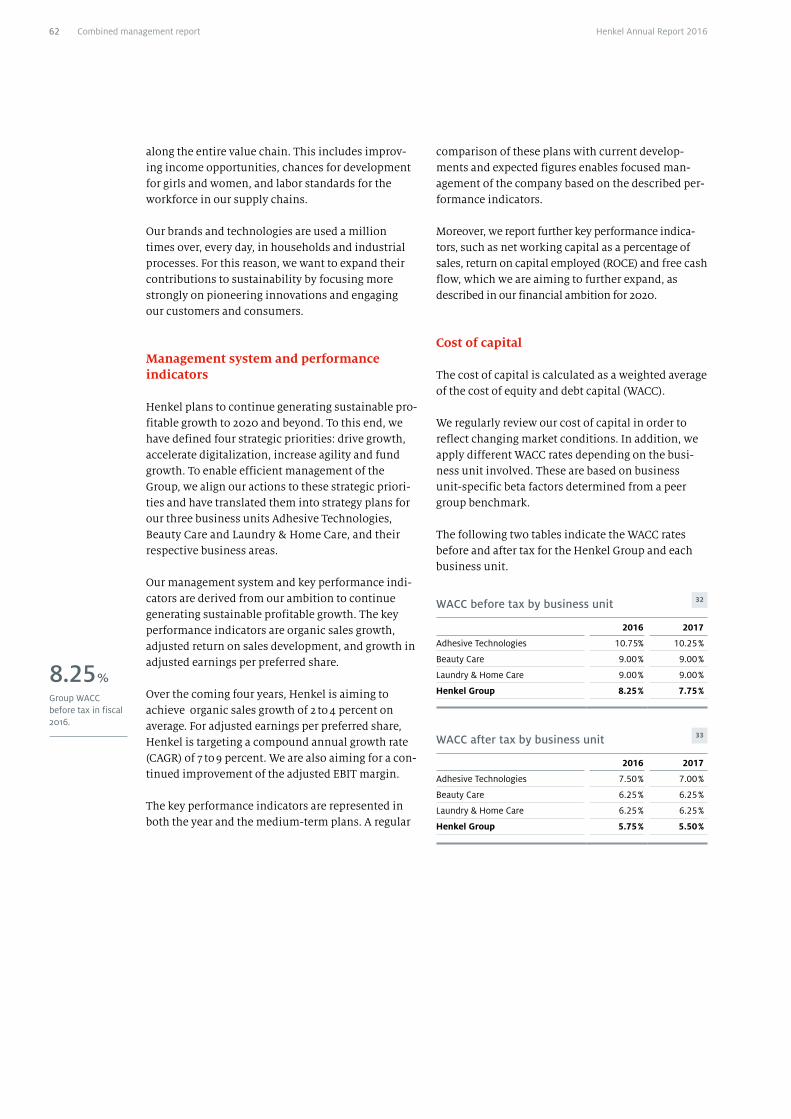
along the entire value chain. This includes improv-ing income opportunities, chances for development for girls and women, and labor standards for the workforce in our supply chains.
Our brands and technologies are used a million times over, every day, in households and industrial processes. For this reason, we want to expand their contributions to sustainability by focusing more strongly on pioneering innovations and engaging our customers and consumers.
8.25 %
Group WACC before tax in fiscal 2016.
comparison of these plans with current develop-ments and expected figures enables focused man-agement of the company based on the described per-formance indicators.
Moreover, we report further key performance indica-tors, such as net working capital as a percentage of sales, return on capital employed (ROCE) and free cash flow, which we are aiming to further expand, as described in our financial ambition for 2020.
Cost of capital
The cost of capital is calculated as a weighted average of the cost of equity and debt capital (WACC).
We regularly review our cost of capital in order to reflect changing market conditions. In addition, we apply different WACC rates depending on the busi-ness unit involved. These are based on business unit-specific beta factors determined from a peer group benchmark.
The following two tables indicate the WACC rates before and after tax for the Henkel Group and each business unit.
WACC before tax by business unit 32
2016 2017
Adhesive Technologies 10.75% 10.25 %
Beauty Care 9.00 % 9.00 %
Laundry & Home Care 9.00 % 9.00 %
Henkel Group 8.25 % 7.75 %
WACC after tax by business unit 33
2016 2017
Adhesive Technologies 7.50 % 7.00 %
Beauty Care 6.25 % 6.25 %
Laundry & Home Care 6.25 % 6.25 %
Henkel Group 5.75 % 5.50 %
Management system and performance indicators
Henkel plans to continue generating sustainable pro-fitable growth to 2020 and beyond. To this end, we have defined four strategic priorities: drive growth, accelerate digitalization, increase agility and fund growth. To enable efficient management of the Group, we align our actions to these strategic priori-ties and have translated them into strategy plans for our three business units Adhesive Technologies, Beauty Care and Laundry & Home Care, and their respective business areas.
Our management system and key performance indi-cators are derived from our ambition to continue generating sustainable profitable growth. The key performance indicators are organic sales growth, adjusted return on sales development, and growth in adjusted earnings per preferred share.
Over the coming four years, Henkel is aiming to achieve organic sales growth of 2 to 4 percent on average. For adjusted earnings per preferred share, Henkel is targeting a compound annual growth rate (CAGR) of 7 to 9 percent. We are also aiming for a con-tinued improvement of the adjusted EBIT margin.
The key performance indicators are represented in both the year and the medium-term plans. A regular
Combined management report62 Henkel Annual Report 2016
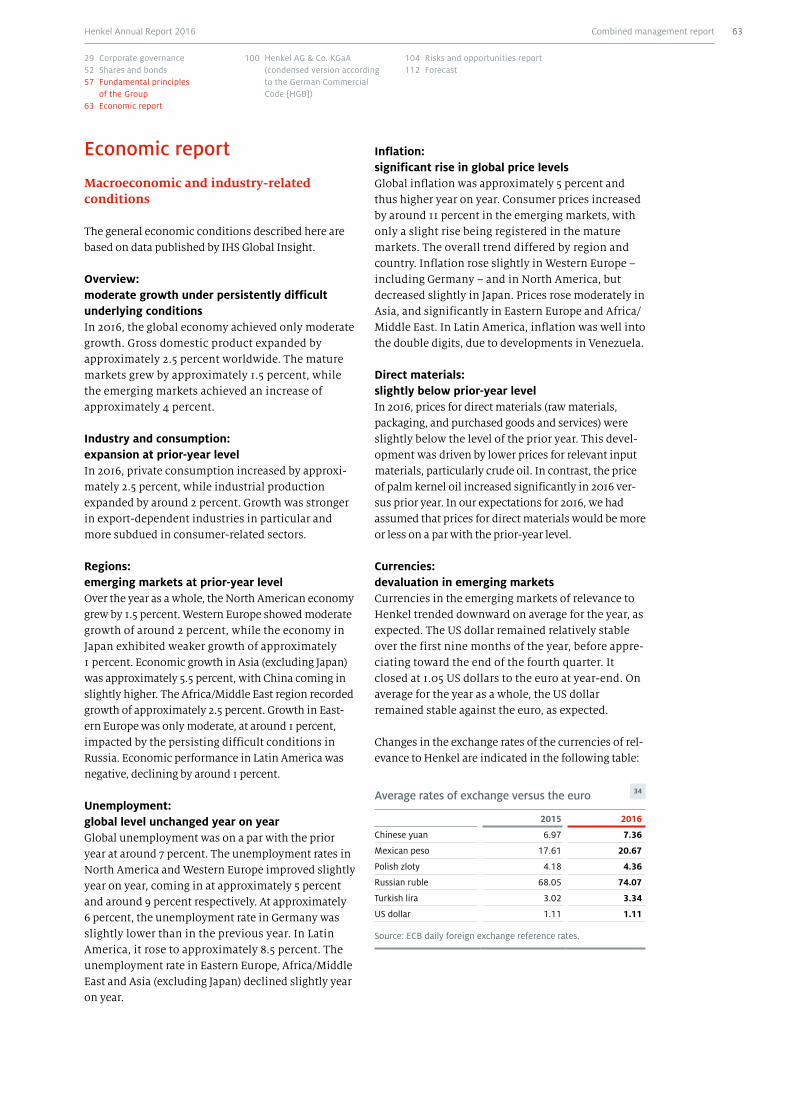
Inflation: significant rise in global price levelsGlobal inflation was approximately 5 percent and thus higher year on year. Consumer prices increased by around 11 percent in the emerging markets, with only a slight rise being registered in the mature markets. The overall trend differed by region and country. Inflation rose slightly in Western Europe – including Germany – and in North America, but decreased slightly in Japan. Prices rose moderately in Asia, and significantly in Eastern Europe and Africa/Middle East. In Latin America, inflation was well into the double digits, due to developments in Venezuela.
Direct materials: slightly below prior-year levelIn 2016, prices for direct materials (raw materials, packaging, and purchased goods and services) were slightly below the level of the prior year. This devel-opment was driven by lower prices for relevant input materials, particularly crude oil. In contrast, the price of palm kernel oil increased significantly in 2016 ver-sus prior year. In our expectations for 2016, we had assumed that prices for direct materials would be more or less on a par with the prior-year level.
Currencies: devaluation in emerging marketsCurrencies in the emerging markets of relevance to Henkel trended downward on average for the year, as expected. The US dollar remained relatively stable over the first nine months of the year, before appre-ciating toward the end of the fourth quarter. It closed at 1.05 US dollars to the euro at year-end. On average for the year as a whole, the US dollar remained stable against the euro, as expected.
Changes in the exchange rates of the currencies of rel-evance to Henkel are indicated in the following table:
Average rates of exchange versus the euro 34
2015 2016
Chinese yuan 6.97 7.36
Mexican peso 17.61 20.67
Polish zloty 4.18 4.36
Russian ruble 68.05 74.07
Turkish lira 3.02 3.34
US dollar 1.11 1.11
Source: ECB daily foreign exchange reference rates.
Economic report
Macroeconomic and industry-related conditions
The general economic conditions described here are based on data published by IHS Global Insight.
Overview: moderate growth under persistently difficult underlying conditions In 2016, the global economy achieved only moderate growth. Gross domestic product expanded by approximately 2.5 percent worldwide. The mature markets grew by approximately 1.5 percent, while the emerging markets achieved an increase of approximately 4 percent.
Industry and consumption: expansion at prior-year levelIn 2016, private consumption increased by approxi-mately 2.5 percent, while industrial production expanded by around 2 percent. Growth was stronger in export-dependent industries in particular and more subdued in consumer-related sectors.
Regions: emerging markets at prior-year levelOver the year as a whole, the North American economy grew by 1.5 percent. Western Europe showed moderate growth of around 2 percent, while the economy in Japan exhibited weaker growth of approximately 1 percent. Economic growth in Asia (excluding Japan) was approximately 5.5 percent, with China coming in slightly higher. The Africa/Middle East region recorded growth of approximately 2.5 percent. Growth in East-ern Europe was only moderate, at around 1 percent, impacted by the persisting difficult conditions in Russia. Economic performance in Latin America was negative, declining by around 1 percent.
Unemployment: global level unchanged year on yearGlobal unemployment was on a par with the prior year at around 7 percent. The unemployment rates in North America and Western Europe improved slightly year on year, coming in at approximately 5 percent and around 9 percent respectively. At approximately 6 percent, the unemployment rate in Germany was slightly lower than in the previous year. In Latin America, it rose to approximately 8.5 percent. The unemployment rate in Eastern Europe, Africa/Middle East and Asia (excluding Japan) declined slightly year on year.
Combined management report 63Henkel Annual Report 2016
29 Corporate governance52 Shares and bonds57 Fundamental principles
of the Group63 Economic report
100 Henkel AG & Co. KGaA (condensed version according to the German Commercial Code [HGB])
104 Risks and opportunities report112 Forecast
Development by sector:moderate rise in global consumptionPrivate consumer spending grew moderately at a rate of approximately 2.5 percent. Consumer spending in mature markets increased by approximately 2 per-cent year on year. Consumers in North America increased their spending by around 3 percent. In Western Europe, consumer spending grew by approximately 2 percent compared to the previous year. Consumers in emerging markets spent around 3 percent more.
Industrial production increase at prior year levelIndustrial production grew by around 2 percent in 2016 and was thus more or less on a par with the pre-vious year.
A particularly important customer sector for Henkel, the transport industry, saw production expand by around 3 percent. Output in the electronics sector rose by around 4 percent and in the metal industry by around 2 percent. Growth was subdued in con-sumer-related sectors, such as the global packaging industry which recorded an increase of around 1 per-cent. The construction industry grew by approxi-mately 3 percent.
Developments in industrial production differed from one region to the next. Manufacturing increased in North America and Western Europe by approxi-mately 1 percent. At approximately 4 percent, growth in industrial production in the emerging markets was slightly higher year on year. Industrial produc-tion increased by approximately 3 percent in Africa/Middle East and by approximately 5 percent in Asia (excluding Japan), while continuing to decline in Latin America. Eastern Europe recorded an increase of around 2 percent in industrial production.
showed strong organic growth, with sales increasing by 6.8 percent. Organic sales growth in the mature markets was positive.
We increased adjusted ¹ gross margin by 0.1 percent-age points to 48.4 percent. Savings from cost reduc-tion measures and efficiency improvements, selec-tive price increases and slightly lower prices for direct materials (raw materials, packaging, and pur-chased goods and services) more than offset the neg-ative impact of foreign exchange rate movements and acquisition effects.
As a result of our cost discipline and the adjustment of our structures to our markets and customers, we were able to further improve our profitability once again year on year. Adjusted return on sales increased by 0.7 percentage points in 2016, reaching a new all-time high of 16.9 percent (2015: 16.2 percent).
Adjusted earnings per preferred share grew to 5.36 euros, a significant increase of 9.8 percent over the 2015 figure of 4.88 euros.
We were able to improve net working capital as a percentage of sales by 0.3 percentage points to 3.5 percent.
We generated free cash flow of 2,205 million euros. We closed the year with a net financial position of –2,301 million euros (2015: 335 million euros).
Results of operations
Sales and profitsSales in fiscal 2016 increased year on year to 18,714 mil-lion euros. The development of currency move-ments had a negative effect on sales of 3.6 percent. Adjusted for foreign exchange effects, sales grew by 7.1 percent. Acquisitions/divestments contributed to this performance with a 4.0-percent increase in sales, mainly as a result of our purchase of The Sun Products Corporation.
With growth of 3.1 percent, organic sales, i.e. sales adjusted for foreign exchange and acquisitions/divestments, showed a solid increase. This was mainly driven by volume.
+3.1%
organic sales growth.
1 Adjusted for one-time charges/gains and restructuring expenses.
Review of overall business performance
In a challenging economic environment, Henkel continued the success of the previous year with a solid business performance and increased sales to 18,714 million euros.
Organically we achieved a sales increase of 3.1 per-cent. Our businesses in the emerging markets
Combined management report64 Henkel Annual Report 2016
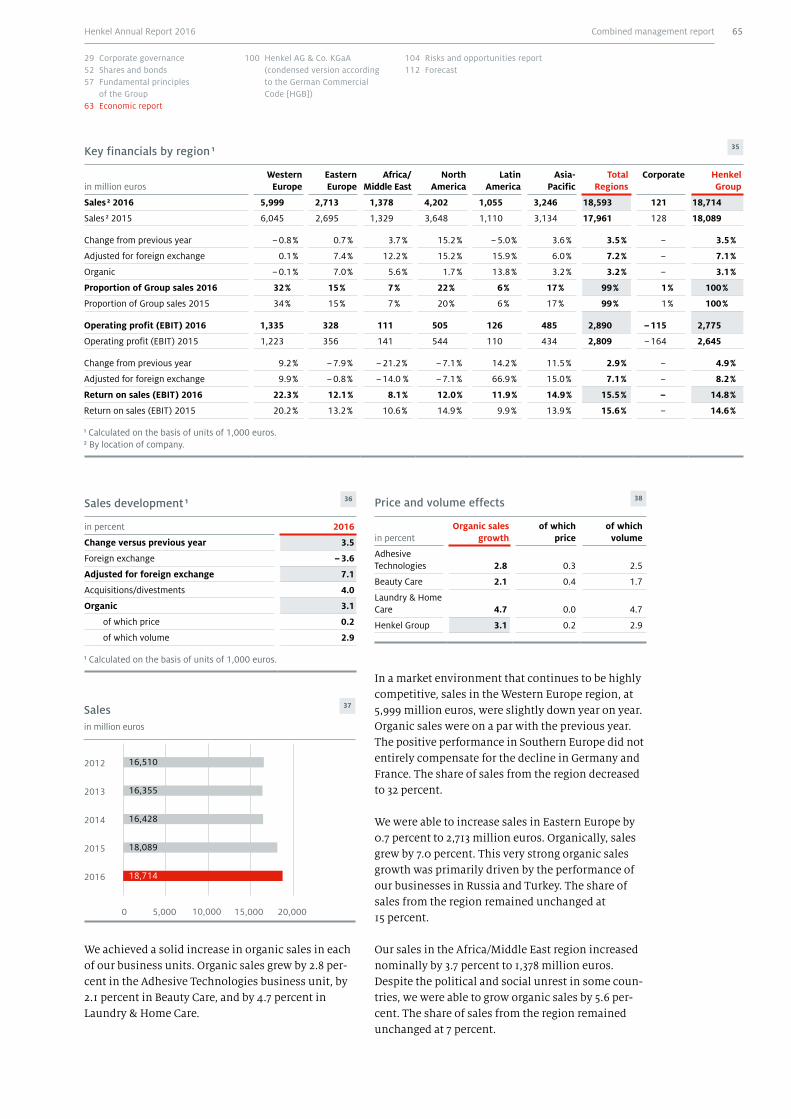
2012
2013
2014
2015
2016
5,000 10,000 15,000 20,0000
16,355
16,428
18,089
18,714
Sales 37
in million euros
16,510
Price and volume effects 38
in percentOrganic sales
growthof which
priceof which
volume
Adhesive Technologies 2.8 0.3 2.5
Beauty Care 2.1 0.4 1.7
Laundry & Home Care 4.7 0.0 4.7
Henkel Group 3.1 0.2 2.9
In a market environment that continues to be highly competitive, sales in the Western Europe region, at 5,999 million euros, were slightly down year on year. Organic sales were on a par with the previous year. The positive performance in Southern Europe did not entirely compensate for the decline in Germany and France. The share of sales from the region decreased to 32 percent.
We were able to increase sales in Eastern Europe by 0.7 percent to 2,713 million euros. Organically, sales grew by 7.0 percent. This very strong organic sales growth was primarily driven by the performance of our businesses in Russia and Turkey. The share of sales from the region remained unchanged at 15 percent.
Our sales in the Africa/Middle East region increased nominally by 3.7 percent to 1,378 million euros. Despite the political and social unrest in some coun-tries, we were able to grow organic sales by 5.6 per-cent. The share of sales from the region remained unchanged at 7 percent.
We achieved a solid increase in organic sales in each of our business units. Organic sales grew by 2.8 per-cent in the Adhesive Technologies business unit, by 2.1 percent in Beauty Care, and by 4.7 percent in Laundry & Home Care.
Key financials by region 1 35
in million eurosWestern
EuropeEastern Europe
Africa/ Middle East
North America
Latin America
Asia- Pacific
Total Regions
Corporate Henkel Group
Sales 2 2016 5,999 2,713 1,378 4,202 1,055 3,246 18,593 121 18,714
Sales 2 2015 6,045 2,695 1,329 3,648 1,110 3,134 17,961 128 18,089
Change from previous year – 0.8 % 0.7 % 3.7 % 15.2 % – 5.0 % 3.6 % 3.5 % – 3.5 %
Adjusted for foreign exchange 0.1 % 7.4 % 12.2 % 15.2 % 15.9 % 6.0 % 7.2 % – 7.1 %
Organic – 0.1 % 7.0 % 5.6 % 1.7 % 13.8 % 3.2 % 3.2 % – 3.1 %
Proportion of Group sales 2016 32 % 15 % 7 % 22 % 6 % 17 % 99 % 1 % 100 %
Proportion of Group sales 2015 34 % 15 % 7 % 20 % 6 % 17 % 99 % 1 % 100 %
Operating profit (EBIT) 2016 1,335 328 111 505 126 485 2,890 – 115 2,775
Operating profit (EBIT) 2015 1,223 356 141 544 110 434 2,809 – 164 2,645
Change from previous year 9.2 % – 7.9 % – 21.2 % – 7.1 % 14.2 % 11.5 % 2.9 % – 4.9 %
Adjusted for foreign exchange 9.9 % – 0.8 % – 14.0 % – 7.1 % 66.9 % 15.0 % 7.1 % – 8.2 %
Return on sales (EBIT) 2016 22.3 % 12.1 % 8.1 % 12.0 % 11.9 % 14.9 % 15.5 % – 14.8 %
Return on sales (EBIT) 2015 20.2 % 13.2 % 10.6 % 14.9 % 9.9 % 13.9 % 15.6 % – 14.6 %
1 Calculated on the basis of units of 1,000 euros.2 By location of company.
Sales development 1 36
in percent 2016
Change versus previous year 3.5
Foreign exchange – 3.6
Adjusted for foreign exchange 7.1
Acquisitions/divestments 4.0
Organic 3.1
of which price 0.2
of which volume 2.9
1 Calculated on the basis of units of 1,000 euros.
Combined management report 65Henkel Annual Report 2016
29 Corporate governance52 Shares and bonds57 Fundamental principles
of the Group63 Economic report
100 Henkel AG & Co. KGaA (condensed version according to the German Commercial Code [HGB])
104 Risks and opportunities report112 Forecast
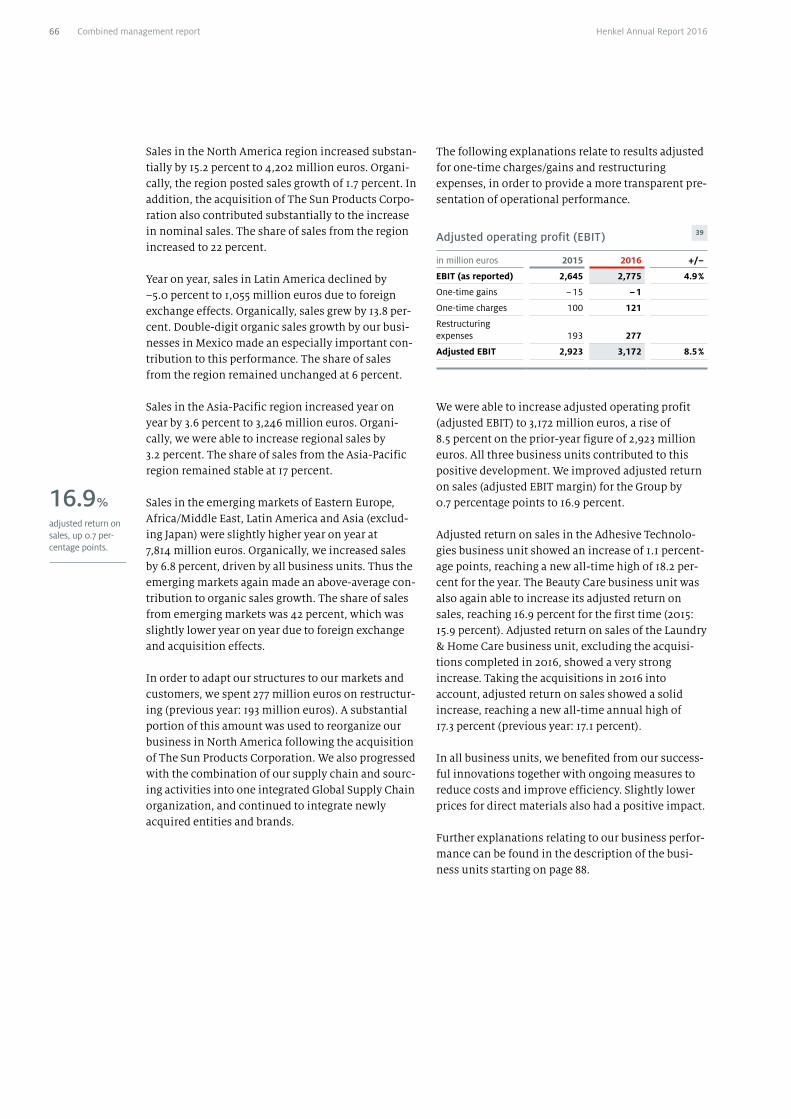
The following explanations relate to results adjusted for one-time charges/gains and restructuring expenses, in order to provide a more transparent pre-sentation of operational performance.
Adjusted operating profit (EBIT) 39
in million euros 2015 2016 +/–
EBIT (as reported) 2,645 2,775 4.9 %
One-time gains – 15 – 1
One-time charges 100 121
Restructuring expenses 193 277
Adjusted EBIT 2,923 3,172 8.5 %
We were able to increase adjusted operating profit (adjusted EBIT) to 3,172 million euros, a rise of 8.5 percent on the prior-year figure of 2,923 million euros. All three business units contributed to this positive development. We improved adjusted return on sales (adjusted EBIT margin) for the Group by 0.7 percentage points to 16.9 percent.
Adjusted return on sales in the Adhesive Technolo-gies business unit showed an increase of 1.1 percent-age points, reaching a new all-time high of 18.2 per-cent for the year. The Beauty Care business unit was also again able to increase its adjusted return on sales, reaching 16.9 percent for the first time (2015: 15.9 percent). Adjusted return on sales of the Laundry & Home Care business unit, excluding the acquisi-tions completed in 2016, showed a very strong increase. Taking the acquisitions in 2016 into account, adjusted return on sales showed a solid increase, reaching a new all-time annual high of 17.3 percent (previous year: 17.1 percent).
In all business units, we benefited from our success-ful innovations together with ongoing measures to reduce costs and improve efficiency. Slightly lower prices for direct materials also had a positive impact.
Further explanations relating to our business perfor-mance can be found in the description of the busi-ness units starting on page 88.
Sales in the North America region increased substan-tially by 15.2 percent to 4,202 million euros. Organi-cally, the region posted sales growth of 1.7 percent. In addition, the acquisition of The Sun Products Corpo-ration also contributed substantially to the increase in nominal sales. The share of sales from the region increased to 22 percent.
Year on year, sales in Latin America declined by –5.0 percent to 1,055 million euros due to foreign exchange effects. Organically, sales grew by 13.8 per-cent. Double-digit organic sales growth by our busi-nesses in Mexico made an especially important con-tribution to this performance. The share of sales from the region remained unchanged at 6 percent.
Sales in the Asia-Pacific region increased year on year by 3.6 percent to 3,246 million euros. Organi-cally, we were able to increase regional sales by 3.2 percent. The share of sales from the Asia-Pacific region remained stable at 17 percent.
Sales in the emerging markets of Eastern Europe, Africa/Middle East, Latin America and Asia (exclud-ing Japan) were slightly higher year on year at 7,814 million euros. Organically, we increased sales by 6.8 percent, driven by all business units. Thus the emerging markets again made an above-average con-tribution to organic sales growth. The share of sales from emerging markets was 42 percent, which was slightly lower year on year due to foreign exchange and acquisition effects.
In order to adapt our structures to our markets and customers, we spent 277 million euros on restructur-ing (previous year: 193 million euros). A substantial portion of this amount was used to reorganize our business in North America following the acquisition of The Sun Products Corporation. We also progressed with the combination of our supply chain and sourc-ing activities into one integrated Global Supply Chain organization, and continued to integrate newly acquired entities and brands.
adjusted return on sales, up 0.7 per-centage points.
16.9 %
Combined management report66 Henkel Annual Report 2016
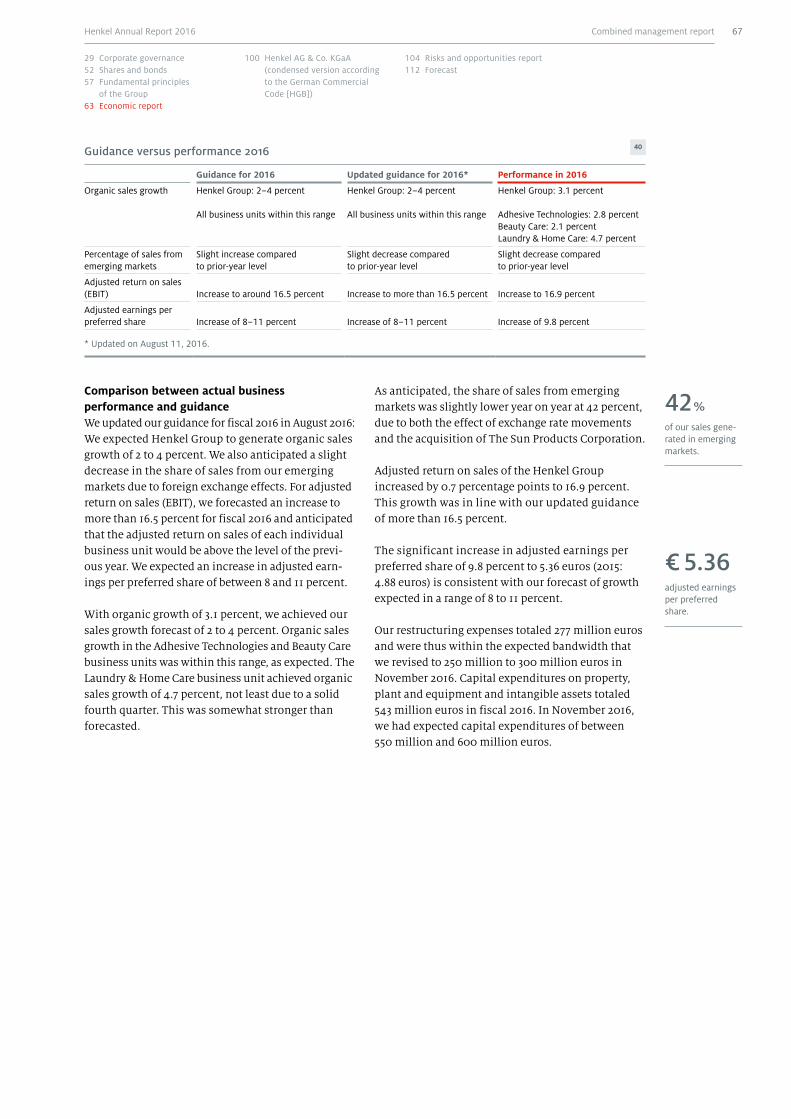
Comparison between actual business performance and guidance We updated our guidance for fiscal 2016 in August 2016:We expected Henkel Group to generate organic sales growth of 2 to 4 percent. We also anticipated a slight decrease in the share of sales from our emerging markets due to foreign exchange effects. For adjusted return on sales (EBIT), we forecasted an increase to more than 16.5 percent for fiscal 2016 and anticipated that the adjusted return on sales of each individual business unit would be above the level of the previ-ous year. We expected an increase in adjusted earn-ings per preferred share of between 8 and 11 percent.
With organic growth of 3.1 percent, we achieved our sales growth forecast of 2 to 4 percent. Organic sales growth in the Adhesive Technologies and Beauty Care business units was within this range, as expected. The Laundry & Home Care business unit achieved organic sales growth of 4.7 percent, not least due to a solid fourth quarter. This was somewhat stronger than forecasted.
As anticipated, the share of sales from emerging markets was slightly lower year on year at 42 percent, due to both the effect of exchange rate movements and the acquisition of The Sun Products Corporation.
Adjusted return on sales of the Henkel Group increased by 0.7 percentage points to 16.9 percent. This growth was in line with our updated guidance of more than 16.5 percent.
The significant increase in adjusted earnings per preferred share of 9.8 percent to 5.36 euros (2015: 4.88 euros) is consistent with our forecast of growth expected in a range of 8 to 11 percent.
Our restructuring expenses totaled 277 million euros and were thus within the expected bandwidth that we revised to 250 million to 300 million euros in November 2016. Capital expenditures on property, plant and equipment and intangible assets totaled 543 million euros in fiscal 2016. In November 2016, we had expected capital expenditures of between 550 million and 600 million euros.
Guidance versus performance 2016 40
Guidance for 2016 Updated guidance for 2016* Performance in 2016
Organic sales growth Henkel Group: 2–4 percent All business units within this range
Henkel Group: 2–4 percent All business units within this range
Henkel Group: 3.1 percent Adhesive Technologies: 2.8 percent Beauty Care: 2.1 percentLaundry & Home Care: 4.7 percent
Percentage of sales from emerging markets
Slight increase compared to prior-year level
Slight decrease compared to prior-year level
Slight decrease compared to prior-year level
Adjusted return on sales (EBIT) Increase to around 16.5 percent Increase to more than 16.5 percent Increase to 16.9 percent
Adjusted earnings per preferred share Increase of 8–11 percent Increase of 8–11 percent Increase of 9.8 percent
* Updated on August 11, 2016.
42 %
of our sales gene-rated in emerging markets.
€ 5.36adjusted earnings per preferred share.
Combined management report 67Henkel Annual Report 2016
29 Corporate governance52 Shares and bonds57 Fundamental principles
of the Group63 Economic report
100 Henkel AG & Co. KGaA (condensed version according to the German Commercial Code [HGB])
104 Risks and opportunities report112 Forecast
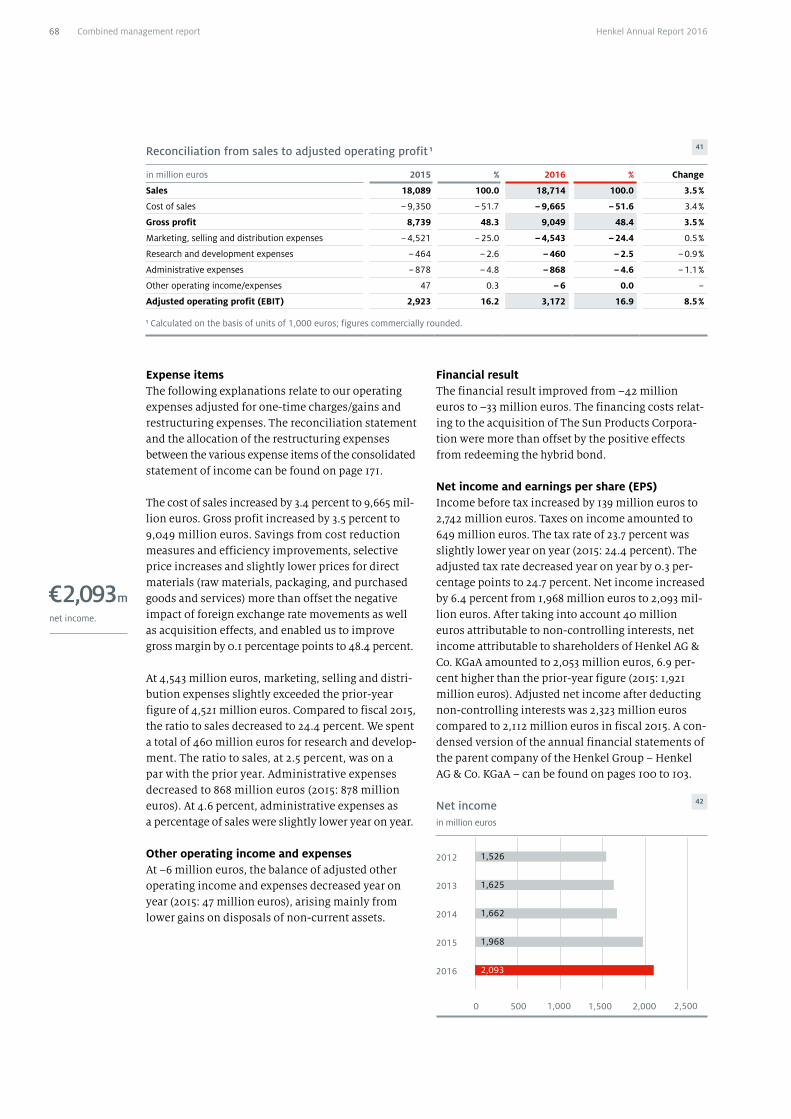
Reconciliation from sales to adjusted operating profit 1 41
in million euros 2015 % 2016 % Change
Sales 18,089 100.0 18,714 100.0 3.5 %
Cost of sales – 9,350 – 51.7 – 9,665 – 51.6 3.4 %
Gross profit 8,739 48.3 9,049 48.4 3.5 %
Marketing, selling and distribution expenses – 4,521 – 25.0 – 4,543 – 24.4 0.5 %
Research and development expenses – 464 – 2.6 – 460 – 2.5 – 0.9 %
Administrative expenses – 878 – 4.8 – 868 – 4.6 – 1.1 %
Other operating income/expenses 47 0.3 – 6 0.0 –
Adjusted operating profit (EBIT) 2,923 16.2 3,172 16.9 8.5 %
1 Calculated on the basis of units of 1,000 euros; figures commercially rounded.
Expense itemsThe following explanations relate to our operating expenses adjusted for one-time charges/gains and restructuring expenses. The reconciliation statement and the allocation of the restructuring expenses between the various expense items of the consolidated statement of income can be found on page 171.
The cost of sales increased by 3.4 percent to 9,665 mil-lion euros. Gross profit increased by 3.5 percent to 9,049 million euros. Savings from cost reduction measures and efficiency improvements, selective price increases and slightly lower prices for direct materials (raw materials, packaging, and purchased goods and services) more than offset the negative impact of foreign exchange rate movements as well as acquisition effects, and enabled us to improve gross margin by 0.1 percentage points to 48.4 percent.
At 4,543 million euros, marketing, selling and distri-bution expenses slightly exceeded the prior-year figure of 4,521 million euros. Compared to fiscal 2015, the ratio to sales decreased to 24.4 percent. We spent a total of 460 million euros for research and develop-ment. The ratio to sales, at 2.5 percent, was on a par with the prior year. Administrative expenses decreased to 868 million euros (2015: 878 million euros). At 4.6 percent, administrative expenses as a percentage of sales were slightly lower year on year.
Other operating income and expensesAt –6 million euros, the balance of adjusted other operating income and expenses decreased year on year (2015: 47 million euros), arising mainly from lower gains on disposals of non-current assets.
Financial resultThe financial result improved from –42 million euros to –33 million euros. The financing costs relat-ing to the acquisition of The Sun Products Corpora-tion were more than offset by the positive effects from redeeming the hybrid bond.
Net income and earnings per share (EPS)Income before tax increased by 139 million euros to 2,742 million euros. Taxes on income amounted to 649 million euros. The tax rate of 23.7 percent was slightly lower year on year (2015: 24.4 percent). The adjusted tax rate decreased year on year by 0.3 per-centage points to 24.7 percent. Net income increased by 6.4 percent from 1,968 million euros to 2,093 mil-lion euros. After taking into account 40 million euros attributable to non-controlling interests, net income attributable to shareholders of Henkel AG & Co. KGaA amounted to 2,053 million euros, 6.9 per-cent higher than the prior-year figure (2015: 1,921 million euros). Adjusted net income after deducting non-controlling interests was 2,323 million euros compared to 2,112 million euros in fiscal 2015. A con-densed version of the annual financial statements of the parent company of the Henkel Group – Henkel AG & Co. KGaA – can be found on pages 100 to 103.
€ 2,093 mnet income.
2012
2013
2014
2015
2016
500 1,000 1,500 2,0000
1,625
1,662
1,968
2,093
Net income 42
in million euros
1,526
2,500
Combined management report68 Henkel Annual Report 2016
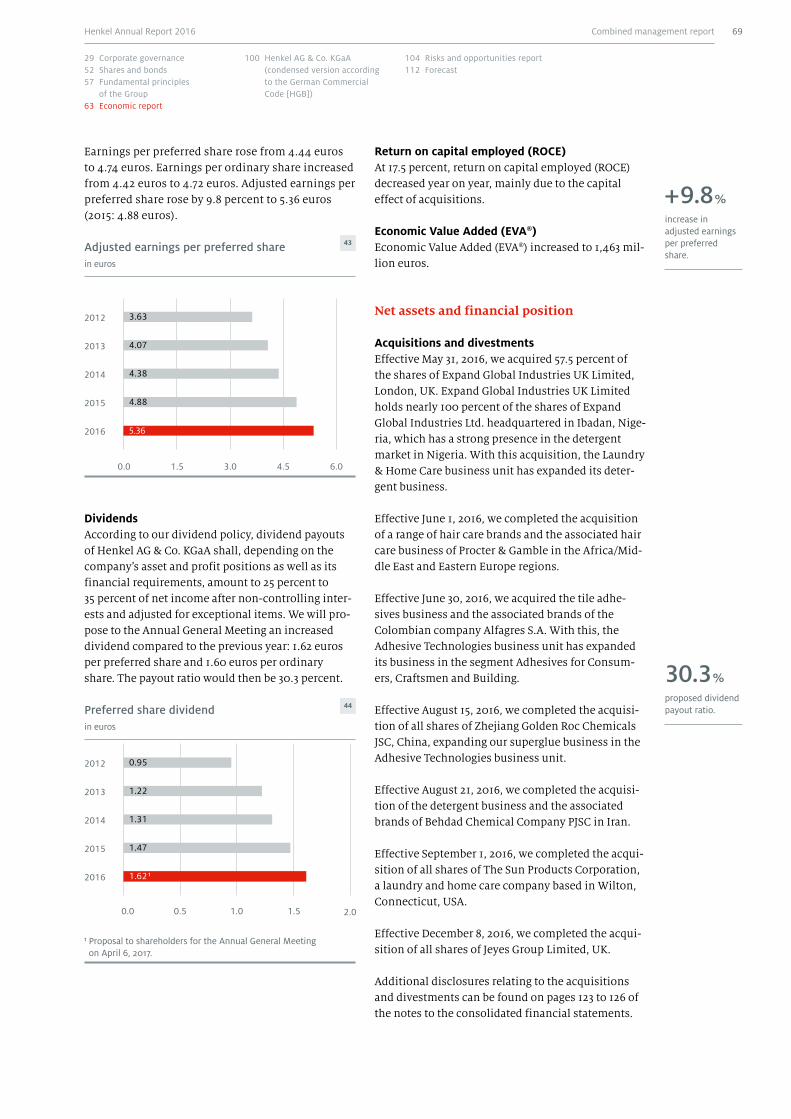
2012
2013
2014
2015
2016
1.5 3.0 4.5 6.00.0
4.07
4.38
4.88
5.36
Adjusted earnings per preferred share 43
in euros
3.63
Earnings per preferred share rose from 4.44 euros to 4.74 euros. Earnings per ordinary share increased from 4.42 euros to 4.72 euros. Adjusted earnings per preferred share rose by 9.8 percent to 5.36 euros (2015: 4.88 euros).
Return on capital employed (ROCE)At 17.5 percent, return on capital employed (ROCE) decreased year on year, mainly due to the capital effect of acquisitions.
Economic Value Added (EVA®)Economic Value Added (EVA®) increased to 1,463 mil-lion euros.
increase in adjusted earnings per preferred share.
+ 9.8 %
30.3 %
proposed dividend payout ratio.
2012
2013
2014
2015
1.22
1.31
1.47
Preferred share dividend 44
in euros
0.95
2016
0.5 1.0 1.50.0
1.62 1
1 Proposal to shareholders for the Annual General Meeting on April 6, 2017.
2.0
DividendsAccording to our dividend policy, dividend payouts of Henkel AG & Co. KGaA shall, depending on the company’s asset and profit positions as well as its financial requirements, amount to 25 percent to 35 percent of net income after non-controlling inter-ests and adjusted for exceptional items. We will pro-pose to the Annual General Meeting an increased dividend compared to the previous year: 1.62 euros per preferred share and 1.60 euros per ordinary share. The payout ratio would then be 30.3 percent.
Net assets and financial position
Acquisitions and divestments Effective May 31, 2016, we acquired 57.5 percent of the shares of Expand Global Industries UK Limited, London, UK. Expand Global Industries UK Limited holds nearly 100 percent of the shares of Expand Global Industries Ltd. headquartered in Ibadan, Nige-ria, which has a strong presence in the detergent market in Nigeria. With this acquisition, the Laundry & Home Care business unit has expanded its deter-gent business.
Effective June 1, 2016, we completed the acquisition of a range of hair care brands and the associated hair care business of Procter & Gamble in the Africa/Mid-dle East and Eastern Europe regions.
Effective June 30, 2016, we acquired the tile adhe-sives business and the associated brands of the Colombian company Alfagres S.A. With this, the Adhesive Technologies business unit has expanded its business in the segment Adhesives for Consum-ers, Craftsmen and Building.
Effective August 15, 2016, we completed the acquisi-tion of all shares of Zhejiang Golden Roc Chemicals JSC, China, expanding our superglue business in the Adhesive Technologies business unit.
Effective August 21, 2016, we completed the acquisi-tion of the detergent business and the associated brands of Behdad Chemical Company PJSC in Iran.
Effective September 1, 2016, we completed the acqui-sition of all shares of The Sun Products Corporation, a laundry and home care company based in Wilton, Connecticut, USA.
Effective December 8, 2016, we completed the acqui-sition of all shares of Jeyes Group Limited, UK.
Additional disclosures relating to the acquisitions and divestments can be found on pages 123 to 126 of the notes to the consolidated financial statements.
Combined management report 69Henkel Annual Report 2016
29 Corporate governance52 Shares and bonds57 Fundamental principles
of the Group63 Economic report
100 Henkel AG & Co. KGaA (condensed version according to the German Commercial Code [HGB])
104 Risks and opportunities report112 Forecast
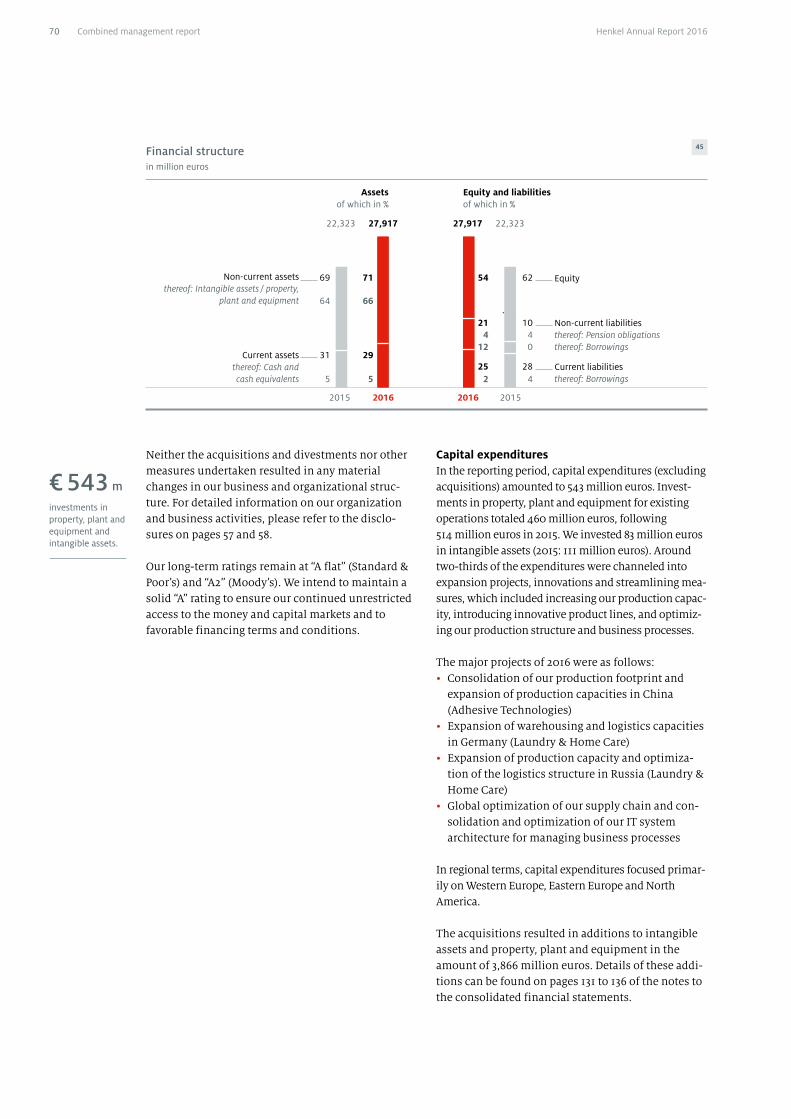
Neither the acquisitions and divestments nor other measures undertaken resulted in any material changes in our business and organizational struc-ture. For detailed information on our organization and business activities, please refer to the disclo-sures on pages 57 and 58.
Our long-term ratings remain at “A flat” (Standard & Poor’s) and “A2” (Moody’s). We intend to maintain a solid “A” rating to ensure our continued unrestricted access to the money and capital markets and to favorable financing terms and conditions.
Financial structure 45 in million euros
Assets of which in %
Equity and liabilities of which in %
27,917 22,32327,91722,323
Non-current liabilitiesthereof: Pension obligationsthereof: Borrowings
Current liabilitiesthereof: Borrowings
Non-current assetsthereof: Intangible assets / property,
plant and equipment
10
428
Equity62
40
21
225
54
412
69
64
Current assets thereof: Cash and cash equivalents
31
5
71
66
29
5
2016 201520162015
€ 543 minvestments in property, plant and equipment and intangible assets.
Capital expendituresIn the reporting period, capital expenditures (excluding acquisitions) amounted to 543 million euros. Invest-ments in property, plant and equipment for existing operations totaled 460 million euros, following 514 million euros in 2015. We invested 83 million euros in intangible assets (2015: 111 million euros). Around two-thirds of the expenditures were channeled into expansion projects, innovations and streamlining mea-sures, which included increasing our production capac-ity, introducing innovative product lines, and optimiz-ing our production structure and business processes.
The major projects of 2016 were as follows:• Consolidation of our production footprint and
expansion of production capacities in China (Adhesive Technologies)
• Expansion of warehousing and logistics capacities in Germany (Laundry & Home Care)
• Expansion of production capacity and optimiza-tion of the logistics structure in Russia (Laundry & Home Care)
• Global optimization of our supply chain and con-solidation and optimization of our IT system architecture for managing business processes
In regional terms, capital expenditures focused primar-ily on Western Europe, Eastern Europe and North America.
The acquisitions resulted in additions to intangible assets and property, plant and equipment in the amount of 3,866 million euros. Details of these addi-tions can be found on pages 131 to 136 of the notes to the consolidated financial statements.
Combined management report70 Henkel Annual Report 2016

Capital expenditures 2016 46
in million euros
Existing operations
Acquisitions Total
Intangible assets 83 3,589 3,672
Property, plant and equipment 460 277 737
Total 543 3,866 4,409
Compared to year-end 2015, equity including non-controlling interests increased by 1.4 billion euros to 15.2 billion euros. The individual compo-nents influencing equity development are shown in the consolidated statement of changes in equity on page 119. Equity rose with the addition of net income amounting to 2,093 million euros. The dividend dis-tribution in April 2016 and the adjustment of –138 mil-lion euros resulting from the remeasurement of the net liability from defined benefit pension plans led to a reduction in equity. Compared to year-end 2015, the equity ratio decreased by 7.5 percentage points to 54.4 percent due to the debt-financed acquisition of the shares of The Sun Products Corporation.
Non-current liabilities increased by 3.5 billion euros to 5.7 billion euros, mainly as a result of higher borrowings following the acquisition of the shares of The Sun Products Corporation, and a rise in other financial liabilities.
Current liabilities increased by 0.7 billion euros to 7.0 billion euros. The increase was substantially attributable to higher trade accounts payable and other provisions, partially offset by lower borrowings.
Effective December 31, 2016, our net financial posi-tion ¹ amounted to –2,301 million euros (December 31, 2015: 335 million euros). The change compared to the end of the previous year was primarily due to payments for acquisitions.
Net financial position 48
in million euros
2012 – 85
2013 959
2014 – 153
2015 335
2016 – 2,301
Corporate = sales and services not assignable to the individual business units. 1 Existing operations.
Beauty Care 13 %
Corporate 1 %
Laundry & Home Care 42 %
Adhesive Technologies 44 %
Capital expenditures by business unit 1 47
1 Cash and cash equivalents plus readily monetizable financial instruments classified as “available for sale” or using the “fair value option,” less borrowings, plus positive and less negative fair values of hedging transactions.
Net assetsCompared to year-end 2015, total assets rose by 5.6 billion euros to 27.9 billion euros.
Under non-current assets, intangible assets increased by 3,861 million euros, and property, plant and equipment by 226 million euros. The increase was mainly due to acquisitions. Capital expenditures of 460 million euros on assets in property, plant and equipment were partially offset by depreciation of 364 million euros.
Current assets increased from 6.9 billion euros to 8.2 billion euros. This was attributable in particular to higher trade accounts receivable and an increase in inventories. Cash and cash equivalents also increased by 213 million euros in the reporting period.
€ –2,301 mnet financial position.
Combined management report 71Henkel Annual Report 2016
29 Corporate governance52 Shares and bonds57 Fundamental principles
of the Group63 Economic report
100 Henkel AG & Co. KGaA (condensed version according to the German Commercial Code [HGB])
104 Risks and opportunities report112 Forecast
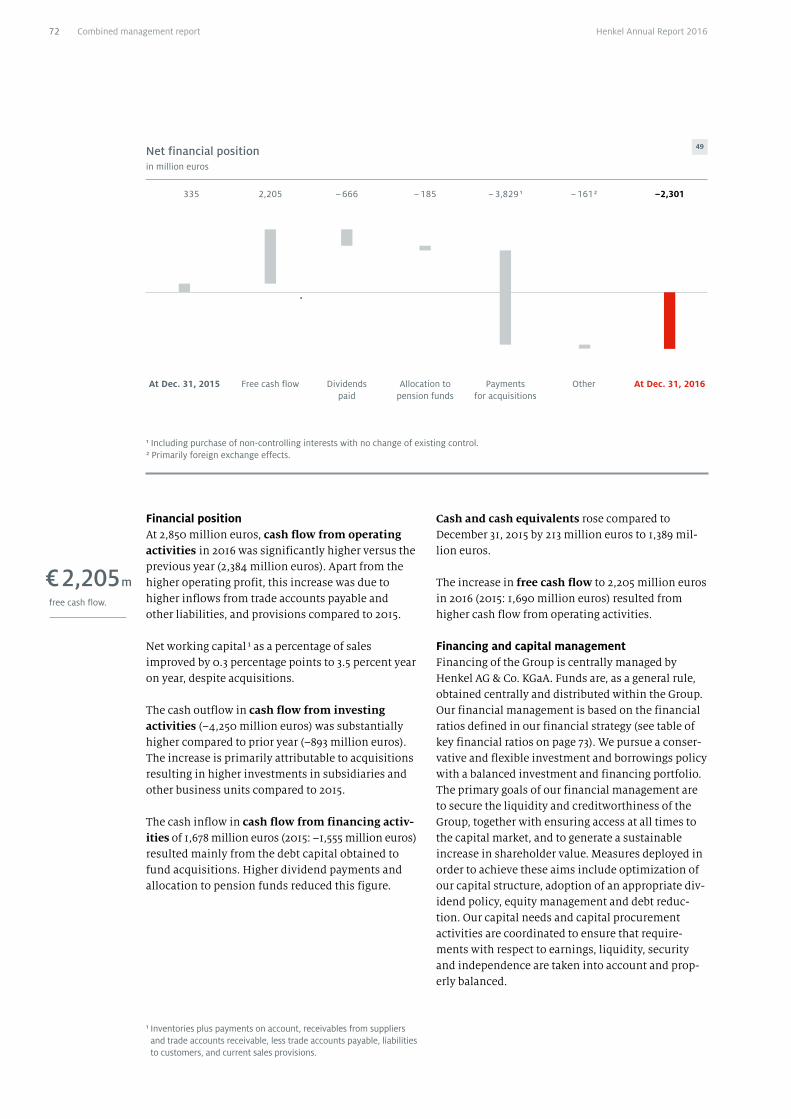
Financial positionAt 2,850 million euros, cash flow from operating activities in 2016 was significantly higher versus the previous year (2,384 million euros). Apart from the higher operating profit, this increase was due to higher inflows from trade accounts payable and other liabilities, and provisions compared to 2015.
Net working capital ¹ as a percentage of sales improved by 0.3 percentage points to 3.5 percent year on year, despite acquisitions.
The cash outflow in cash flow from investing activities (–4,250 million euros) was substantially higher compared to prior year (–893 million euros). The increase is primarily attributable to acquisitions resulting in higher investments in subsidiaries and other business units compared to 2015.
The cash inflow in cash flow from financing activ-ities of 1,678 million euros (2015: –1,555 million euros) resulted mainly from the debt capital obtained to fund acquisitions. Higher dividend payments and allocation to pension funds reduced this figure.
Net financial position in million euros
At Dec. 31, 2016At Dec. 31, 2015 Free cash flow Dividends paid
Allocation to pension funds
Payments for acquisitions
Other
49
1 Including purchase of non-controlling interests with no change of existing control.2 Primarily foreign exchange effects.
Cash and cash equivalents rose compared to December 31, 2015 by 213 million euros to 1,389 mil-lion euros.
The increase in free cash flow to 2,205 million euros in 2016 (2015: 1,690 million euros) resulted from higher cash flow from operating activities.
Financing and capital managementFinancing of the Group is centrally managed by Henkel AG & Co. KGaA. Funds are, as a general rule, obtained centrally and distributed within the Group. Our financial management is based on the financial ratios defined in our financial strategy (see table of key financial ratios on page 73). We pursue a conser-vative and flexible investment and borrowings policy with a balanced investment and financing portfolio. The primary goals of our financial management are to secure the liquidity and creditworthiness of the Group, together with ensuring access at all times to the capital market, and to generate a sustainable increase in shareholder value. Measures deployed in order to achieve these aims include optimization of our capital structure, adoption of an appropriate div-idend policy, equity management and debt reduc-tion. Our capital needs and capital procurement activities are coordinated to ensure that require-ments with respect to earnings, liquidity, security and independence are taken into account and prop-erly balanced.
€ 2,205 m
free cash flow.
1 Inventories plus payments on account, receivables from suppliers and trade accounts receivable, less trade accounts payable, liabilities to customers, and current sales provisions.
335 2,205 – 666 – 185 – 3,829 1 – 161 2 –2,301
Combined management report72 Henkel Annual Report 2016
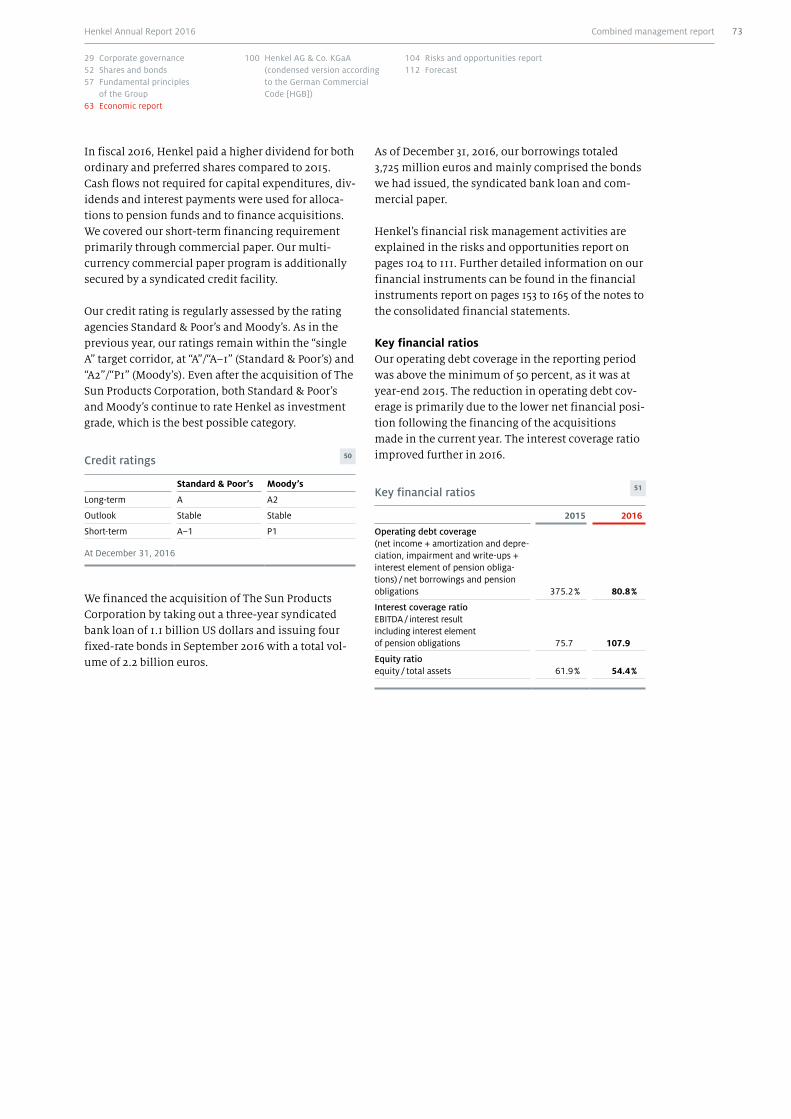
In fiscal 2016, Henkel paid a higher dividend for both ordinary and preferred shares compared to 2015. Cash flows not required for capital expenditures, div-idends and interest payments were used for alloca-tions to pension funds and to finance acquisitions. We covered our short-term financing requirement primarily through commercial paper. Our multi- currency commercial paper program is additionally secured by a syndicated credit facility.
Our credit rating is regularly assessed by the rating agencies Standard & Poor’s and Moody’s. As in the previous year, our ratings remain within the “single A” target corridor, at “A”/“A–1” (Standard & Poor’s) and “A2”/“P1” (Moody’s). Even after the acquisition of The Sun Products Corporation, both Standard & Poor’s and Moody’s continue to rate Henkel as investment grade, which is the best possible category.
Credit ratings 50
Standard & Poor’s Moody’s
Long-term A A2
Outlook Stable Stable
Short-term A–1 P1
At December 31, 2016
We financed the acquisition of The Sun Products Corporation by taking out a three-year syndicated bank loan of 1.1 billion US dollars and issuing four fixed-rate bonds in September 2016 with a total vol-ume of 2.2 billion euros.
As of December 31, 2016, our borrowings totaled 3,725 million euros and mainly comprised the bonds we had issued, the syndicated bank loan and com-mercial paper.
Henkel’s financial risk management activities are explained in the risks and opportunities report on pages 104 to 111. Further detailed information on our financial instruments can be found in the financial instruments report on pages 153 to 165 of the notes to the consolidated financial statements.
Key financial ratiosOur operating debt coverage in the reporting period was above the minimum of 50 percent, as it was at year-end 2015. The reduction in operating debt cov-erage is primarily due to the lower net financial posi-tion following the financing of the acquisitions made in the current year. The interest coverage ratio improved further in 2016.
Key financial ratios 51
2015 2016
Operating debt coverage (net income + amortization and depre-ciation, impairment and write-ups + interest element of pension obliga-tions) / net borrowings and pension obligations 375.2 % 80.8 %
Interest coverage ratio EBITDA / interest result including interest element of pension obligations 75.7 107.9
Equity ratio equity / total assets 61.9 % 54.4 %
Combined management report 73Henkel Annual Report 2016
29 Corporate governance52 Shares and bonds57 Fundamental principles
of the Group63 Economic report
100 Henkel AG & Co. KGaA (condensed version according to the German Commercial Code [HGB])
104 Risks and opportunities report112 Forecast
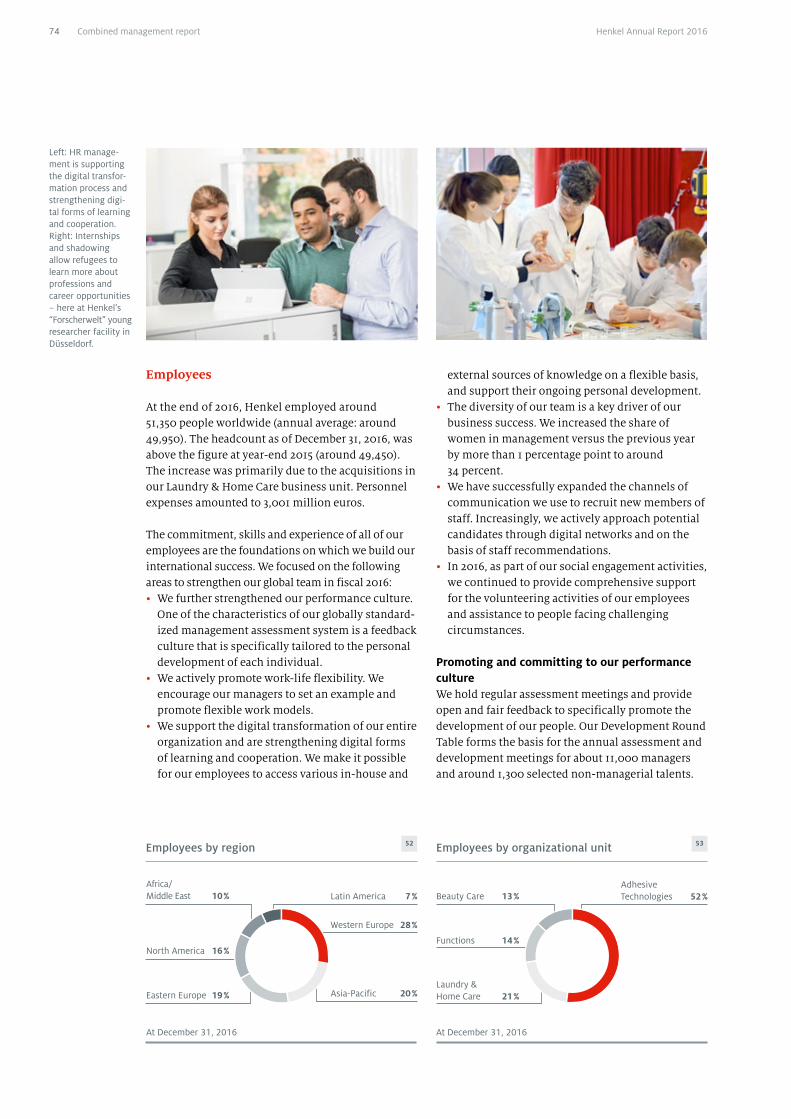
Employees
At the end of 2016, Henkel employed around 51,350 people worldwide (annual average: around 49,950). The headcount as of December 31, 2016, was above the figure at year-end 2015 (around 49,450). The increase was primarily due to the acquisitions in our Laundry & Home Care business unit. Personnel expenses amounted to 3,001 million euros.
The commitment, skills and experience of all of our employees are the foundations on which we build our international success. We focused on the following areas to strengthen our global team in fiscal 2016:• We further strengthened our performance culture.
One of the characteristics of our globally standard-ized management assessment system is a feedback culture that is specifically tailored to the personal development of each individual.
• We actively promote work-life flexibility. We encourage our managers to set an example and promote flexible work models.
• We support the digital transformation of our entire organization and are strengthening digital forms of learning and cooperation. We make it possible for our employees to access various in-house and
external sources of knowledge on a flexible basis, and support their ongoing personal development.
• The diversity of our team is a key driver of our business success. We increased the share of women in management versus the previous year by more than 1 percentage point to around 34 percent.
• We have successfully expanded the channels of communication we use to recruit new members of staff. Increasingly, we actively approach potential candidates through digital networks and on the basis of staff recommendations.
• In 2016, as part of our social engagement activities, we continued to provide comprehensive support for the volunteering activities of our employees and assistance to people facing challenging circumstances.
Promoting and committing to our performance cultureWe hold regular assessment meetings and provide open and fair feedback to specifically promote the development of our people. Our Development Round Table forms the basis for the annual assessment and development meetings for about 11,000 managers and around 1,300 selected non-managerial talents.
Left: HR manage-ment is supporting the digital transfor-mation process and strengthening digi-tal forms of learning and cooperation. Right: Internships and shadowing allow refugees to learn more about professions and career opportunities – here at Henkel’s “Forscherwelt” young researcher facility in Düsseldorf.
Employees by region 52 Employees by organizational unit 53
Latin America 7 %
Functions 14 %
Africa/ Middle East 10 % Beauty Care 13 %
North America 16 %
Eastern Europe 19 %Laundry & Home Care 21 %
At December 31, 2016 At December 31, 2016
Western Europe 28 %
Asia-Pacific 20 %
Adhesive Technologies 52 %
Combined management report74 Henkel Annual Report 2016
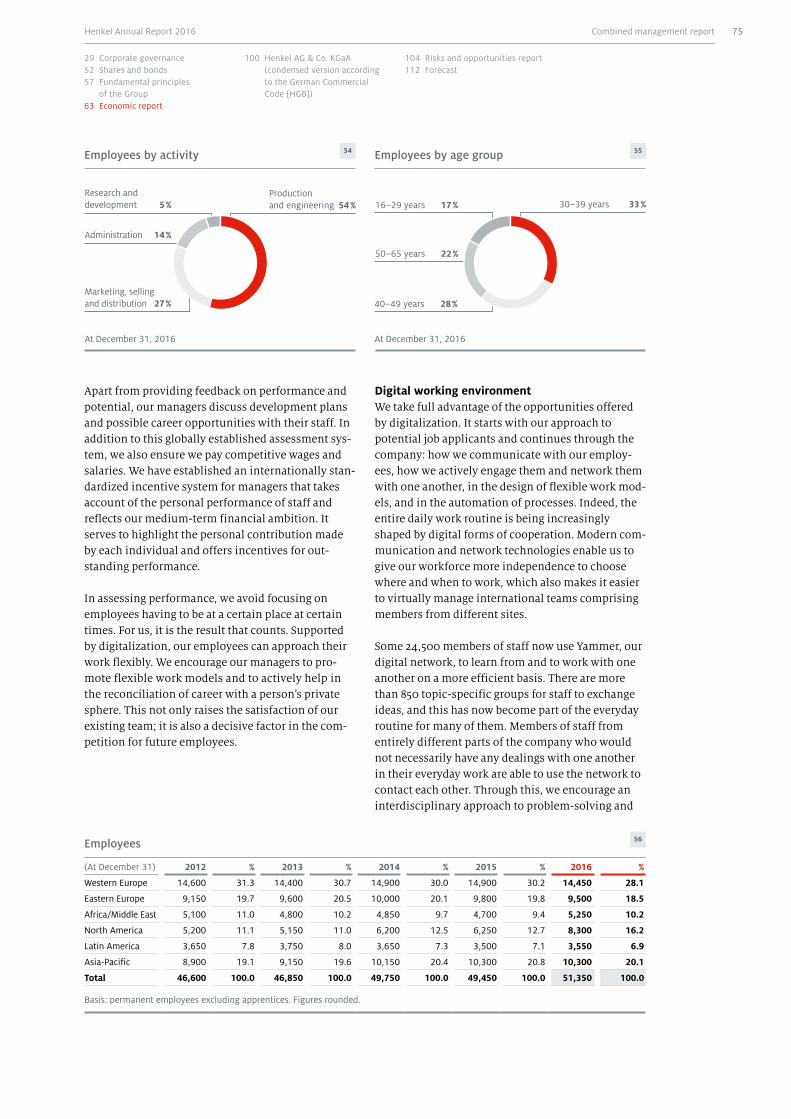
Apart from providing feedback on performance and potential, our managers discuss development plans and possible career opportunities with their staff. In addition to this globally established assessment sys-tem, we also ensure we pay competitive wages and salaries. We have established an internationally stan-dardized incentive system for managers that takes account of the personal performance of staff and reflects our medium-term financial ambition. It serves to highlight the personal contribution made by each individual and offers incentives for out-standing performance.
In assessing performance, we avoid focusing on employees having to be at a certain place at certain times. For us, it is the result that counts. Supported by digitalization, our employees can approach their work flexibly. We encourage our managers to pro-mote flexible work models and to actively help in the reconciliation of career with a person’s private sphere. This not only raises the satisfaction of our existing team; it is also a decisive factor in the com-petition for future employees.
Digital working environmentWe take full advantage of the opportunities offered by digitalization. It starts with our approach to potential job applicants and continues through the company: how we communicate with our employ-ees, how we actively engage them and network them with one another, in the design of flexible work mod-els, and in the automation of processes. Indeed, the entire daily work routine is being increasingly shaped by digital forms of cooperation. Modern com-munication and network technologies enable us to give our workforce more independence to choose where and when to work, which also makes it easier to virtually manage international teams comprising members from different sites.
Some 24,500 members of staff now use Yammer, our digital network, to learn from and to work with one another on a more efficient basis. There are more than 850 topic-specific groups for staff to exchange ideas, and this has now become part of the everyday routine for many of them. Members of staff from entirely different parts of the company who would not necessarily have any dealings with one another in their everyday work are able to use the network to contact each other. Through this, we encourage an interdisciplinary approach to problem-solving and
Employees by activity 54 Employees by age group 55
Research and development 5 % 16–29 years 17 %
Administration 14 %
50–65 years 22 %
Marketing, selling and distribution 27 % 40–49 years 28 %
At December 31, 2016 At December 31, 2016
Production and engineering 54 % 30–39 years 33 %
Employees 56
(At December 31) 2012 % 2013 % 2014 % 2015 % 2016 %
Western Europe 14,600 31.3 14,400 30.7 14,900 30.0 14,900 30.2 14,450 28.1
Eastern Europe 9,150 19.7 9,600 20.5 10,000 20.1 9,800 19.8 9,500 18.5
Africa/Middle East 5,100 11.0 4,800 10.2 4,850 9.7 4,700 9.4 5,250 10.2
North America 5,200 11.1 5,150 11.0 6,200 12.5 6,250 12.7 8,300 16.2
Latin America 3,650 7.8 3,750 8.0 3,650 7.3 3,500 7.1 3,550 6.9
Asia-Pacific 8,900 19.1 9,150 19.6 10,150 20.4 10,300 20.8 10,300 20.1
Total 46,600 100.0 46,850 100.0 49,750 100.0 49,450 100.0 51,350 100.0
Basis: permanent employees excluding apprentices. Figures rounded.
Combined management report 75Henkel Annual Report 2016
29 Corporate governance52 Shares and bonds57 Fundamental principles
of the Group63 Economic report
100 Henkel AG & Co. KGaA (condensed version according to the German Commercial Code [HGB])
104 Risks and opportunities report112 Forecast

to make better use of existing knowledge by promot-ing the exchange of ideas throughout the company.
Digital platforms give our employees fast and flexi-ble access to general training content. We encourage our workforce to integrate knowledge-building exer-cises into their everyday work routines. 2016 marked the first year in which we offered management- related Massive Open Online Courses (MOOCs) and webinars in collaboration with IESE Business School for live attendance by our employees around the globe. More than 200 people took advantage of this service.
Developing employees and providing specific trainingHenkel offers 25 apprenticeship and dual-track study programs in Germany. In 2016, we welcomed 159 new apprentices and students. Currently, close to 500 apprentices and students are working toward a professional qualification at Henkel in Germany.
We use different learning formats in providing training opportunities around the world so as to strengthen our global team. Based on their individ-ual needs and development plans, employees can choose general or function-specific seminars. One of the new modules added this year focuses on career orientation, training our staff to assess how they can best leverage their potential. We enhance the Henkel Global Academy with content from external provid-ers to give us more flexibility in offering the training content we need. One pilot project focuses primarily on video-based training sessions covering current digital issues such as digital marketing. Through this approach, we are able to help our employees to navigate the digital world efficiently and to grasp the opportunities associated with it.
Valuing diversityThe success of our business is driven by the diversity and individuality of our people. We are proud of our strong global team. We place great value on encour-aging diversity in an inclusive environment. The approach we adopt is holistic, embracing individual characteristics together with personal experience, knowledge and skills.
Promoting women in management is key to strength-ening the diversity within our company. In 2016, we were able to increase the share of women in manage-ment by more than 1 percentage point versus the previous year.
Women in management 57
2012 2013 2014 2015 2016
Henkel 32.6 % 32.9 % 33.2 % 33.6 % 33.1 %
Managers 30.5 % 31.6 % 32.5 % 33.1 % 34.3 %
Top managers 1 18.6 % 19.8 % 20.6 % 21.1 % 22.5 %
1 Corporate Senior Vice Presidents, management circles I and IIa.
The inclusive attitude of our staff is key to our suc-cessful international and intercultural collaboration. In their everyday dealings with colleagues from all over the world, our employees learn to adapt to one another. Hence Henkel also provides opportunities for international experience along an individual’s career path as a means of promoting new ways of thinking and the acceptance and adoption of new perspectives. It also enables us to nurture the perfor-mance capabilities of our people.
We place great importance on all employees behav-ing inclusively and making every personal effort to promote an inclusive work environment. During our global Diversity Weeks, we again organized numer-ous activities to highlight the diversity of our global team.
Recruiting top talent for HenkelWe compete internationally for the most talented professionals. The established channels of commu-nication used to recruit new members of staff have been successfully extended. We are making more use of digital networks to actively approach potential candidates. We are thus able to reach them directly and inspire them to work for Henkel through fast, personalized communication.
In many countries, we also make successful use of staff recommendations of potential candidates. Our staff know best which sort of people fit us and can enhance the performance capabilities of our company.
We remain in contact with highly qualified students and graduates whom we meet at our university events or whom we get to know during internships. We use our digital platforms to inform selected tal-ents about career opportunities and the latest news at our company. In 2016, our public social media channels focusing on career topics had more than 750,000 fans and followers.
Around
of our managers are women.
34 %
Combined management report76 Henkel Annual Report 2016
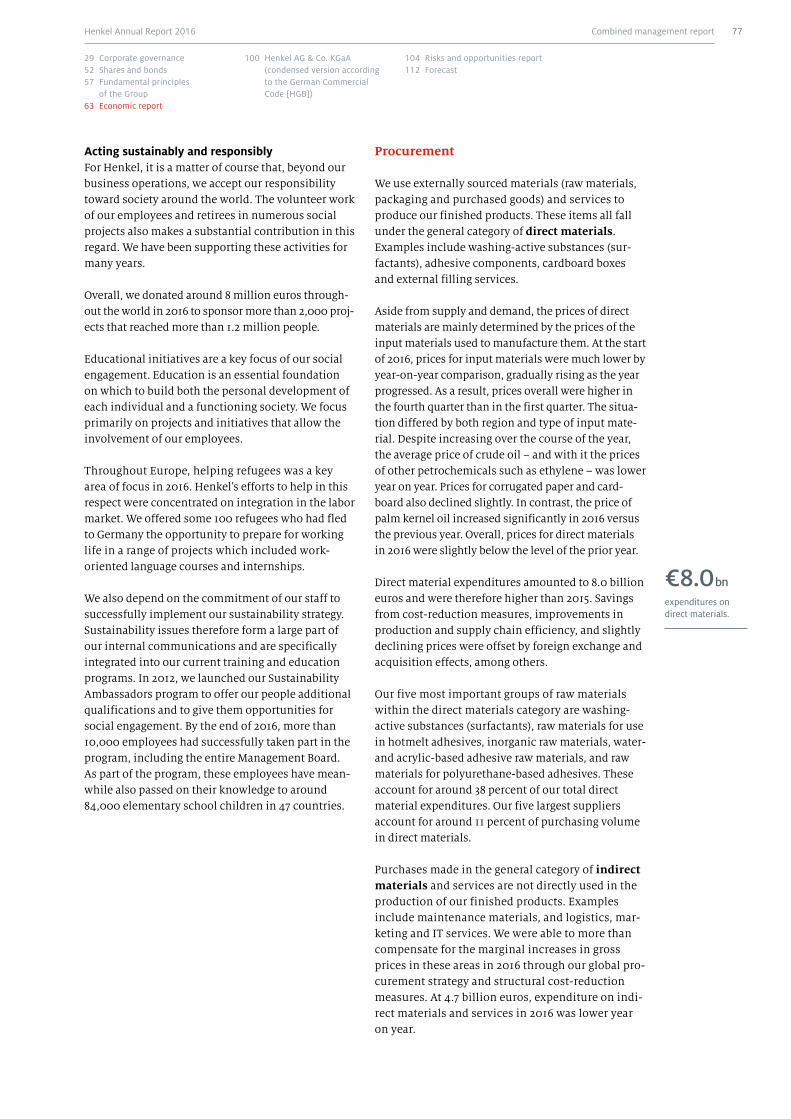
Procurement
We use externally sourced materials (raw materials, packaging and purchased goods) and services to produce our finished products. These items all fall under the general category of direct materials. Examples include washing-active substances (sur-factants), adhesive components, cardboard boxes and external filling services.
Aside from supply and demand, the prices of direct materials are mainly determined by the prices of the input materials used to manufacture them. At the start of 2016, prices for input materials were much lower by year-on-year comparison, gradually rising as the year progressed. As a result, prices overall were higher in the fourth quarter than in the first quarter. The situa-tion differed by both region and type of input mate-rial. Despite increasing over the course of the year, the average price of crude oil – and with it the prices of other petrochemicals such as ethylene – was lower year on year. Prices for corrugated paper and card-board also declined slightly. In contrast, the price of palm kernel oil increased significantly in 2016 versus the previous year. Overall, prices for direct materials in 2016 were slightly below the level of the prior year.
Direct material expenditures amounted to 8.0 billion euros and were therefore higher than 2015. Savings from cost-reduction measures, improvements in production and supply chain efficiency, and slightly declining prices were offset by foreign exchange and acquisition effects, among others.
Our five most important groups of raw materials within the direct materials category are washing- active substances (surfactants), raw materials for use in hotmelt adhesives, inorganic raw materials, water- and acrylic-based adhesive raw materials, and raw materials for polyurethane-based adhesives. These account for around 38 percent of our total direct material expenditures. Our five largest suppliers account for around 11 percent of purchasing volume in direct materials.
Purchases made in the general category of indirect materials and services are not directly used in the production of our finished products. Examples include maintenance materials, and logistics, mar-keting and IT services. We were able to more than compensate for the marginal increases in gross prices in these areas in 2016 through our global pro-curement strategy and structural cost-reduction measures. At 4.7 billion euros, expenditure on indi-rect materials and services in 2016 was lower year on year.
expenditures on direct materials.
€8.0 bn
Acting sustainably and responsiblyFor Henkel, it is a matter of course that, beyond our business operations, we accept our responsibility toward society around the world. The volunteer work of our employees and retirees in numerous social projects also makes a substantial contribution in this regard. We have been supporting these activities for many years.
Overall, we donated around 8 million euros through-out the world in 2016 to sponsor more than 2,000 proj-ects that reached more than 1.2 million people.
Educational initiatives are a key focus of our social engagement. Education is an essential foundation on which to build both the personal development of each individual and a functioning society. We focus primarily on projects and initiatives that allow the involvement of our employees.
Throughout Europe, helping refugees was a key area of focus in 2016. Henkel’s efforts to help in this respect were concentrated on integration in the labor market. We offered some 100 refugees who had fled to Germany the opportunity to prepare for working life in a range of projects which included work- oriented language courses and internships.
We also depend on the commitment of our staff to successfully implement our sustainability strategy. Sustainability issues therefore form a large part of our internal communications and are specifically integrated into our current training and education programs. In 2012, we launched our Sustainability Ambassadors program to offer our people additional qualifications and to give them opportunities for social engagement. By the end of 2016, more than 10,000 employees had successfully taken part in the program, including the entire Management Board. As part of the program, these employees have mean-while also passed on their knowledge to around 84,000 elementary school children in 47 countries.
Combined management report 77Henkel Annual Report 2016
29 Corporate governance52 Shares and bonds57 Fundamental principles
of the Group63 Economic report
100 Henkel AG & Co. KGaA (condensed version according to the German Commercial Code [HGB])
104 Risks and opportunities report112 Forecast
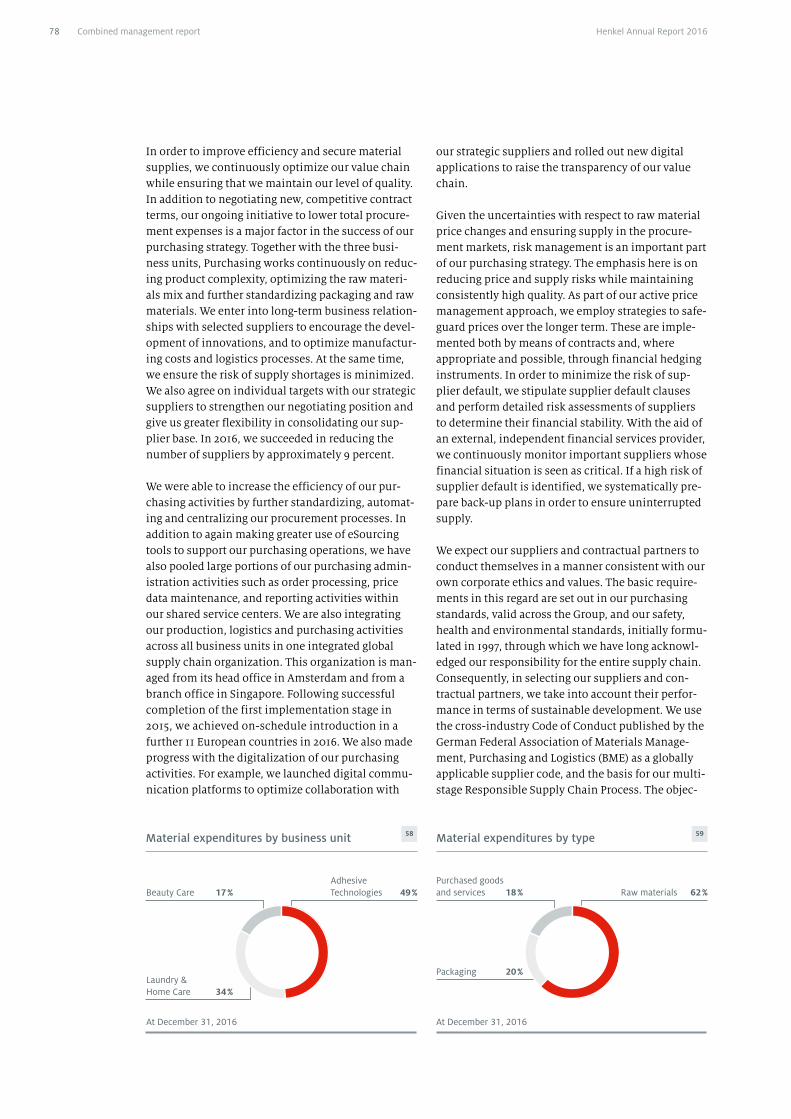
our strategic suppliers and rolled out new digital applications to raise the transparency of our value chain.
Given the uncertainties with respect to raw material price changes and ensuring supply in the procure-ment markets, risk management is an important part of our purchasing strategy. The emphasis here is on reducing price and supply risks while maintaining consistently high quality. As part of our active price management approach, we employ strategies to safe-guard prices over the longer term. These are imple-mented both by means of contracts and, where appropriate and possible, through financial hedging instruments. In order to minimize the risk of sup-plier default, we stipulate supplier default clauses and perform detailed risk assessments of suppliers to determine their financial stability. With the aid of an external, independent financial services provider, we continuously monitor important suppliers whose financial situation is seen as critical. If a high risk of supplier default is identified, we systematically pre-pare back-up plans in order to ensure uninterrupted supply.
We expect our suppliers and contractual partners to conduct themselves in a manner consistent with our own corporate ethics and values. The basic require-ments in this regard are set out in our purchasing standards, valid across the Group, and our safety, health and environmental standards, initially formu-lated in 1997, through which we have long acknowl-edged our responsibility for the entire supply chain. Consequently, in selecting our suppliers and con-tractual partners, we take into account their perfor-mance in terms of sustainable development. We use the cross-industry Code of Conduct published by the German Federal Association of Materials Manage-ment, Purchasing and Logistics (BME) as a globally applicable supplier code, and the basis for our multi-stage Responsible Supply Chain Process. The objec-
In order to improve efficiency and secure material supplies, we continuously optimize our value chain while ensuring that we maintain our level of quality. In addition to negotiating new, competitive contract terms, our ongoing initiative to lower total procure-ment expenses is a major factor in the success of our purchasing strategy. Together with the three busi-ness units, Purchasing works continuously on reduc-ing product complexity, optimizing the raw materi-als mix and further standardizing packaging and raw materials. We enter into long-term business relation-ships with selected suppliers to encourage the devel-opment of innovations, and to optimize manufactur-ing costs and logistics processes. At the same time, we ensure the risk of supply shortages is minimized. We also agree on individual targets with our strategic suppliers to strengthen our negotiating position and give us greater flexibility in consolidating our sup-plier base. In 2016, we succeeded in reducing the number of suppliers by approximately 9 percent.
We were able to increase the efficiency of our pur-chasing activities by further standardizing, automat-ing and centralizing our procurement processes. In addition to again making greater use of eSourcing tools to support our purchasing operations, we have also pooled large portions of our purchasing admin-istration activities such as order processing, price data maintenance, and reporting activities within our shared service centers. We are also integrating our production, logistics and purchasing activities across all business units in one integrated global supply chain organization. This organization is man-aged from its head office in Amsterdam and from a branch office in Singapore. Following successful completion of the first implementation stage in 2015, we achieved on-schedule introduction in a further 11 European countries in 2016. We also made progress with the digitalization of our purchasing activities. For example, we launched digital commu-nication platforms to optimize collaboration with
Material expenditures by business unit 58 Material expenditures by type 59
Beauty Care 17 %Purchased goods and services 18 %
Laundry & Home Care 34 %
Packaging 20 %
At December 31, 2016 At December 31, 2016
Adhesive Technologies 49 % Raw materials 62 %
Combined management report78 Henkel Annual Report 2016
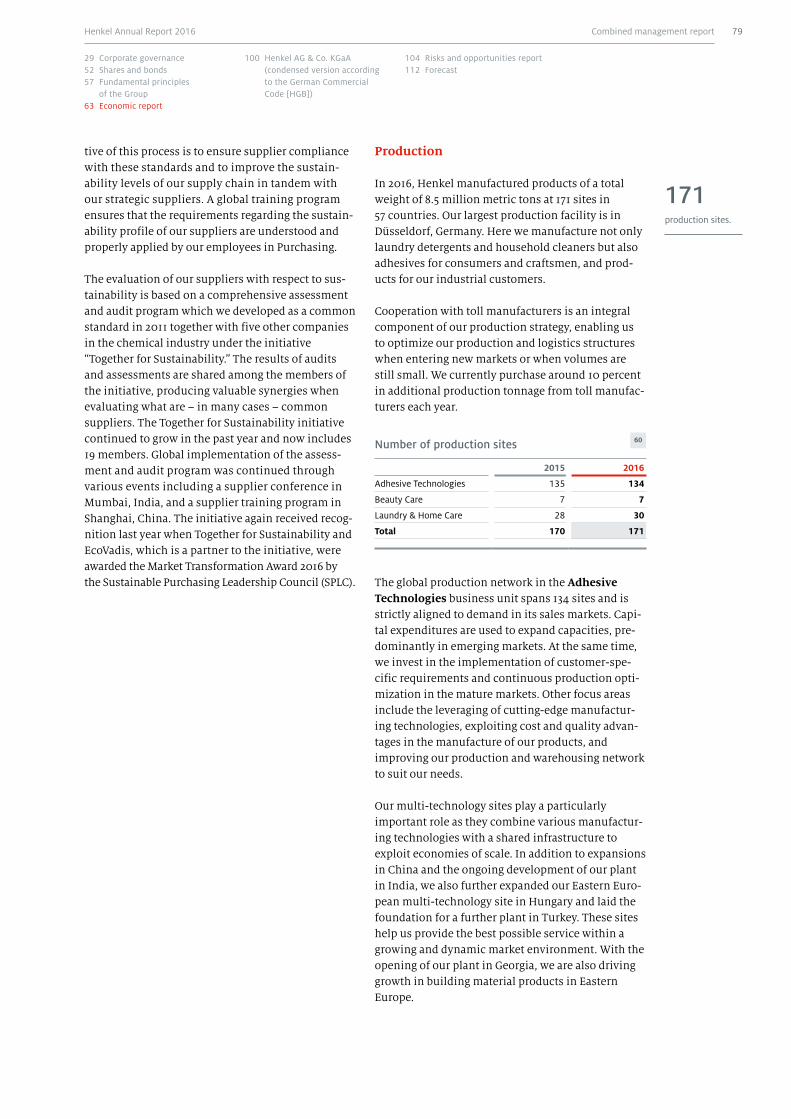
Production
In 2016, Henkel manufactured products of a total weight of 8.5 million metric tons at 171 sites in 57 countries. Our largest production facility is in Düsseldorf, Germany. Here we manufacture not only laundry detergents and household cleaners but also adhesives for consumers and craftsmen, and prod-ucts for our industrial customers.
Cooperation with toll manufacturers is an integral component of our production strategy, enabling us to optimize our production and logistics structures when entering new markets or when volumes are still small. We currently purchase around 10 percent in additional production tonnage from toll manufac-turers each year.
Number of production sites 60
2015 2016
Adhesive Technologies 135 134
Beauty Care 7 7
Laundry & Home Care 28 30
Total 170 171
The global production network in the Adhesive Technologies business unit spans 134 sites and is strictly aligned to demand in its sales markets. Capi-tal expenditures are used to expand capacities, pre-dominantly in emerging markets. At the same time, we invest in the implementation of customer-spe-cific requirements and continuous production opti-mization in the mature markets. Other focus areas include the leveraging of cutting-edge manufactur-ing technologies, exploiting cost and quality advan-tages in the manufacture of our products, and improving our production and warehousing network to suit our needs.
Our multi-technology sites play a particularly important role as they combine various manufactur-ing technologies with a shared infrastructure to exploit economies of scale. In addition to expansions in China and the ongoing development of our plant in India, we also further expanded our Eastern Euro-pean multi-technology site in Hungary and laid the foundation for a further plant in Turkey. These sites help us provide the best possible service within a growing and dynamic market environment. With the opening of our plant in Georgia, we are also driving growth in building material products in Eastern Europe.
tive of this process is to ensure supplier compliance with these standards and to improve the sustain-ability levels of our supply chain in tandem with our strategic suppliers. A global training program ensures that the requirements regarding the sustain-ability profile of our suppliers are understood and properly applied by our employees in Purchasing.
The evaluation of our suppliers with respect to sus-tainability is based on a comprehensive assessment and audit program which we developed as a common standard in 2011 together with five other companies in the chemical industry under the initiative “Together for Sustainability.” The results of audits and assessments are shared among the members of the initiative, producing valuable synergies when evaluating what are – in many cases – common suppliers. The Together for Sustainability initiative continued to grow in the past year and now includes 19 members. Global implementation of the assess-ment and audit program was continued through various events including a supplier conference in Mumbai, India, and a supplier training program in Shanghai, China. The initiative again received recog-nition last year when Together for Sustainability and EcoVadis, which is a partner to the initiative, were awarded the Market Transformation Award 2016 by the Sustainable Purchasing Leadership Council (SPLC).
production sites.
171
Combined management report 79Henkel Annual Report 2016
29 Corporate governance52 Shares and bonds57 Fundamental principles
of the Group63 Economic report
100 Henkel AG & Co. KGaA (condensed version according to the German Commercial Code [HGB])
104 Risks and opportunities report112 Forecast
Our solid organic growth brought about another increase in production volume. We are responding to this by carefully expanding our manufacturing capacities, with a particular eye on innovations and emerging markets. In 2016, we also continually enhanced the performance capabilities of our plants by rolling out the Henkel Production System to more countries as a means of further improving produc-tion organization and efficiency.
We successfully renewed the external certification of Group headquarters and all our existing plants, con-firming our compliance with international quality, environmental, safety and energy management stan-dards. Continuous improvements in sustainability enabled us to make significant progress in our focal areas of safety and resource conservation, aided in particular by the further expansion of our centralized real-time system for measuring and evaluating total resource use around the world. The business unit is also investing systematically in expanding the digital infrastructure of its production and warehousing systems.
As an important aspect in our promise of quality, our optimization efforts in all three business units aim to reduce the environmental footprint of our produc-tion activities. We focus in particular on cutting energy use, thereby contributing to climate protec-tion, on reducing material input and waste volume, and on lowering water usage and wastewater pollu-tion. New warehousing concepts and the production of packaging materials directly on-site where filling takes place reduce transport mileage and thus also contribute to climate protection.
Overall, our global programs in 2016 resulted in 44 percent of our sites reducing their energy use, 53 percent lowering their water usage, and 54 percent decreasing their waste footprint (excluding construc-tion and demolition waste).
Keeping our “Factor 3” goal in mind for the year 2030, we set concrete interim targets for our production sites for the five years from 2011 through 2015, which we managed to exceed. We are continuing our efforts to further improve our performance in these areas over the coming years, as we move toward our long-term goal of “Factor 3.” To this end, we have set medi-um-term targets for completion by 2020: Compared to the base year 2010, we want to raise occupational safety by 40 percent, and to reduce the direct and indirect carbon dioxide emissions of our production sites, the water we use and the waste we generate by 30 percent per ton of product in each case.
Optimized structures and workflows in our plants and the production network are key elements in an integrated and optimized supply chain. Our lean teams have not only put numerous optimization measures in place at our production sites; they have also improved integration into the overall process.
Again in 2016, our focus in the Beauty Care business unit was on further enhancing our agility and on delivering excellent customer service. In order to respond more quickly and flexibly to market changes, we are also driving forward implementation of Indus-try 4.0. The integration of our production, logistics and purchasing activities in our new Global Supply Chain organization has boosted the optimization and further development of our global processes. We have achieved a substantial improvement in our service level through increased integration of the planning processes across the entire supply chain as far as the interface with our customers. We have also focused on complexity control to raise efficiency when managing the product diversity that Beauty Care offers to meet the various needs of its global customer base.
In addition to capital expenditures at European sites, we also invested extensively in emerging markets to support organic growth. In particular, Eastern Europe saw further expansion of the factory in Russia and an increase in production capacities enabling us to sup-ply local markets with even greater speed and effi-ciency. Another focal point of our activity was the strategic further development of our production net-work in order to ensure long-term growth in emerging markets.
The motivation of our people, supported by the con-sistent implementation of our continuous improve-ment process HPS (Henkel Production System) has led to enhancements in both quality and productivity. Tailored to Henkel’s requirements, the “Lean Manage-ment Program” is serving to harmonize our cross- business systems with ever-increasing effect.
We further optimized the production network in our Laundry & Home Care business unit over the course of the year. This included the sale of our plants at Nemours in France and Ain Temouchent in Algeria. New sites were added through acquisitions in both emerging markets (Qazvin, Iran, and Ibadan, Nigeria) and in mature markets (Salt Lake City and Bowling Green, both USA). As a result, the produc-tion network spanned 30 plants in total as of the end of 2016.
Combined management report80 Henkel Annual Report 2016
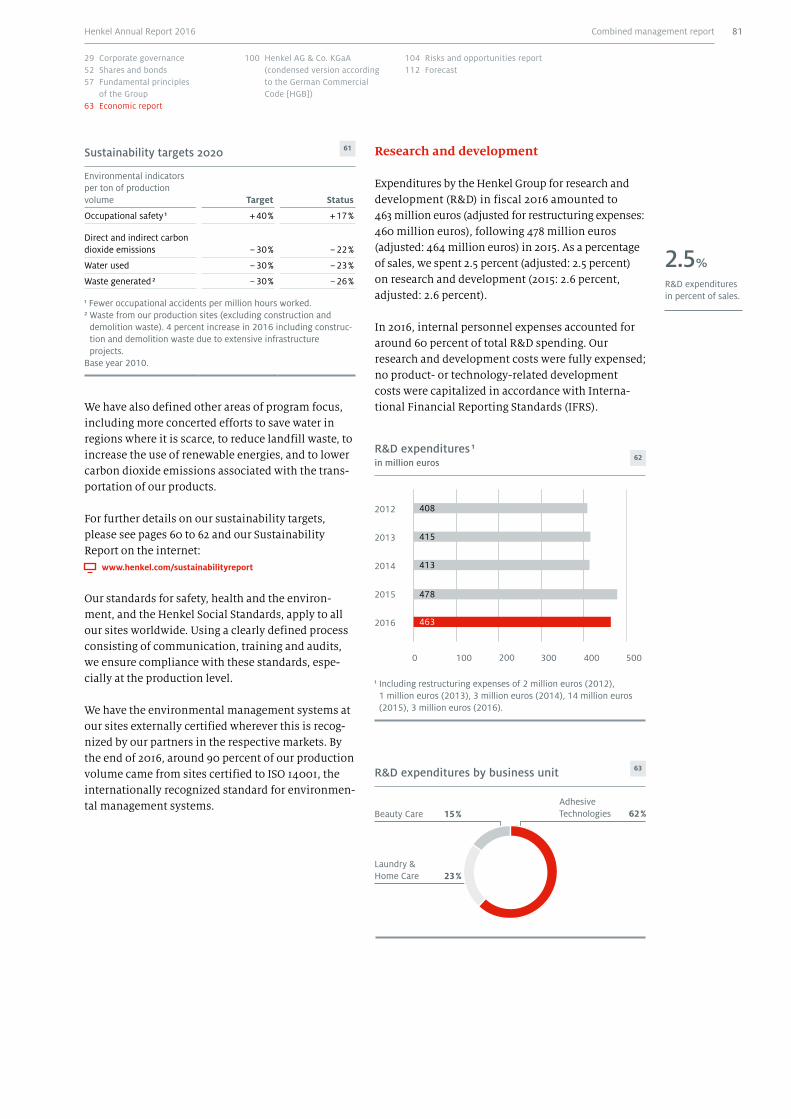
Research and development
Expenditures by the Henkel Group for research and development (R&D) in fiscal 2016 amounted to 463 million euros (adjusted for restructuring expenses: 460 million euros), following 478 million euros (adjusted: 464 million euros) in 2015. As a percentage of sales, we spent 2.5 percent (adjusted: 2.5 percent) on research and development (2015: 2.6 percent, adjusted: 2.6 percent).
In 2016, internal personnel expenses accounted for around 60 percent of total R&D spending. Our research and development costs were fully expensed; no product- or technology-related development costs were capitalized in accordance with Interna-tional Financial Reporting Standards (IFRS).
R&D expenditures by business unit 63
Beauty Care 15 %
Laundry & Home Care 23 %
Adhesive Technologies 62 %
R&D expenditures in percent of sales.
2.5 %
2012
2013
2014
2015
2016
100 200 300 400 5000
415
413
478
R&D expenditures 1 in million euros
62
408
463
1 Including restructuring expenses of 2 million euros (2012), 1 million euros (2013), 3 million euros (2014), 14 million euros (2015), 3 million euros (2016).
Sustainability targets 2020 61
Environmental indicators per ton of production volume Target Status
Occupational safety 1 + 40 % + 17 %
Direct and indirect carbon dioxide emissions – 30 % – 22 %
Water used – 30 % – 23 %
Waste generated 2 – 30 % – 26 %
1 Fewer occupational accidents per million hours worked.2 Waste from our production sites (excluding construction and
demolition waste). 4 percent increase in 2016 including construc-tion and demolition waste due to extensive infrastructure projects.
Base year 2010.
We have also defined other areas of program focus, including more concerted efforts to save water in regions where it is scarce, to reduce landfill waste, to increase the use of renewable energies, and to lower carbon dioxide emissions associated with the trans-portation of our products.
For further details on our sustainability targets, please see pages 60 to 62 and our Sustainability Report on the internet:
www.henkel.com/sustainabilityreport
Our standards for safety, health and the environ-ment, and the Henkel Social Standards, apply to all our sites worldwide. Using a clearly defined process consisting of communication, training and audits, we ensure compliance with these standards, espe-cially at the production level.
We have the environmental management systems at our sites externally certified wherever this is recog-nized by our partners in the respective markets. By the end of 2016, around 90 percent of our production volume came from sites certified to ISO 14001, the internationally recognized standard for environmen-tal management systems.
Combined management report 81Henkel Annual Report 2016
29 Corporate governance52 Shares and bonds57 Fundamental principles
of the Group63 Economic report
100 Henkel AG & Co. KGaA (condensed version according to the German Commercial Code [HGB])
104 Risks and opportunities report112 Forecast
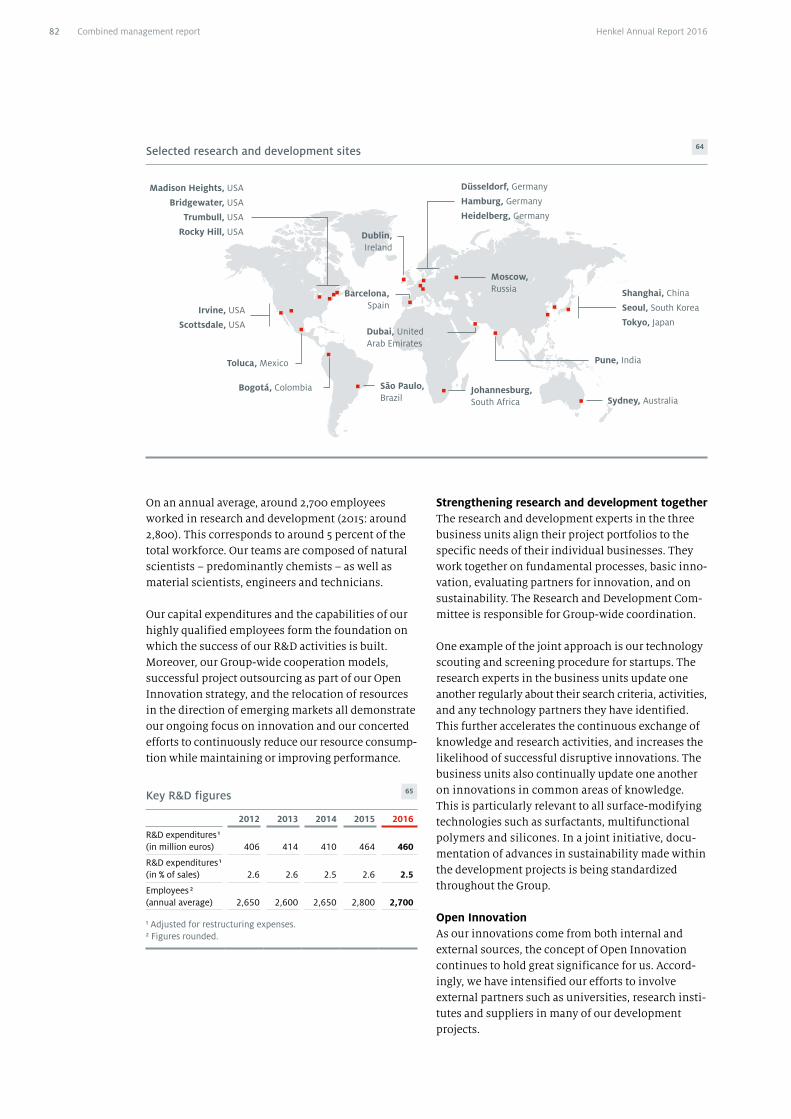
Strengthening research and development togetherThe research and development experts in the three business units align their project portfolios to the specific needs of their individual businesses. They work together on fundamental processes, basic inno-vation, evaluating partners for innovation, and on sustainability. The Research and Development Com-mittee is responsible for Group-wide coordination.
One example of the joint approach is our technology scouting and screening procedure for startups. The research experts in the business units update one another regularly about their search criteria, activities, and any technology partners they have identified. This further accelerates the continuous exchange of knowledge and research activities, and increases the likelihood of successful disruptive innovations. The business units also continually update one another on innovations in common areas of knowledge. This is particularly relevant to all surface-modifying technologies such as surfactants, multifunctional polymers and silicones. In a joint initiative, docu-mentation of advances in sustainability made within the development projects is being standardized throughout the Group.
Open InnovationAs our innovations come from both internal and external sources, the concept of Open Innovation continues to hold great significance for us. Accord-ingly, we have intensified our efforts to involve external partners such as universities, research insti-tutes and suppliers in many of our development projects.
On an annual average, around 2,700 employees worked in research and development (2015: around 2,800). This corresponds to around 5 percent of the total workforce. Our teams are composed of natural scientists – predominantly chemists – as well as material scientists, engineers and technicians.
Our capital expenditures and the capabilities of our highly qualified employees form the foundation on which the success of our R&D activities is built. Moreover, our Group-wide cooperation models, successful project outsourcing as part of our Open Innovation strategy, and the relocation of resources in the direction of emerging markets all demonstrate our ongoing focus on innovation and our concerted efforts to continuously reduce our resource consump-tion while maintaining or improving performance.
Key R&D figures 65
2012 2013 2014 2015 2016
R&D expenditures 1 (in million euros) 406 414 410 464 460
R&D expenditures 1 (in % of sales) 2.6 2.6 2.5 2.6 2.5
Employees 2 (annual average) 2,650 2,600 2,650 2,800 2,700
1 Adjusted for restructuring expenses.2 Figures rounded.
Selected research and development sites 64
Düsseldorf, Germany
Hamburg, Germany
Heidelberg, Germany
Dubai, United Arab Emirates
Shanghai, China
Seoul, South Korea
Tokyo, Japan
Madison Heights, USA
Bridgewater, USA
Trumbull, USA
Rocky Hill, USA
Johannesburg, South Africa
Pune, India
Dublin, Ireland
Irvine, USA
Scottsdale, USA
Toluca, Mexico
Moscow, Russia
Bogotá, Colombia São Paulo, Brazil
Barcelona, Spain
Sydney, Australia
Combined management report82 Henkel Annual Report 2016
access to external resources. These basic technologies are applied in the regional research and development sites to customer- and market-specific innovations. At the same time, the research and development staff in the regional sites obtain information about specific problems for the next generation of innovations, working in close contact with markets and customers. The new basic technologies needed for the relevant solutions are again developed centrally.
The following examples illustrate the contribution made by our regional research and development laboratories:• The Adhesive Technologies business unit offers its
customers cutting-edge technology development and comprehensive design and application sup-port. A global network of regional research and development centers combined with local devel-opment and technology laboratories enables cus-tomers to access innovations in a wide range of applications. Building on a broad portfolio of tech-nologies, products are quickly adapted to specific customer applications. Strategic global innovation programs effectively drive future growth.
• The increasing importance of the emerging mar-kets is also reflected in the R&D strategy of the Beauty Care business unit. In the regional testing and development centers in Shanghai, China, in Johannesburg, South Africa, and in Bogotá, Colom-bia, individual products are developed that take account of local distinctions and specific customer needs. Air pollution caused by particulate matter is a huge problem, especially in emerging mega cities. A range of hair care products under the Extra Care brand was developed specifically for the Asian market to reduce particulate deposits on hair and protect affected hair from damage.
• The Innovation Center of the Laundry & Home Care business unit in Dubai has succeeded in developing, for the first time, innovative liquid detergents with particularly effective, thermally stable enzymes for the Africa/Middle East region. Transport and storage in extreme temperatures cause classic enzymes to lose some of their perfor-mance capability, making them less effective at removing stains. The patent-pending, unique high-performance formulas contain tailored enzymes that remain stable, even at the higher temperatures that are common in the region. Our consumers thus benefit from superior effective-ness and optimum stain removal.
The following examples demonstrate the success achieved with our Open Innovation concept:• The Adhesive Technologies business unit pre-
sented its Supplier Innovation Award 2016 to US company NuSil, which specializes in innovative silicone technologies. NuSil has been a partner for many years, supplying customized polymers for numerous new customer solutions to various stra-tegic business units. These solutions range from thermally-conductive adhesives and gap fillers with a low volatile organic compound content, to transparent liquid adhesives for use in the auto-motive and electronics sectors and in medical technology.
• The Beauty Care business unit presented its Best Innovation Contributor Award 2016 to Innospec, a partner of many years, for its successful collabora-tion in the field of innovative shampoos that avoid the use of the standard surfactant, ether sulfate. Optimized combinations of surfactants have made it possible to formulate shampoos with very caring and, at the same time, good foaming properties. This technology was first used in some of our US salon brands before being adapted in 2016 for global use in hair-cleaning products marketed under the Bonacure brand in our Hair Salon busi-ness, and the Gliss Kur brand in our Branded Con-sumer Goods business.
• For the first time ever in 2016, the Laundry & Home Care business unit presented its Best Inno-vation Contributor Award and its Sustainability Award to one and the same development partner: BASF received both accolades in recognition of its special contribution to substituting phosphates in Somat, Henkel’s global brand of automatic dish-washing products. Up to 40 percent of the formu-las containing phosphates have been intelligently revised. The innovative formulas combine stan-dard ingredients with new phosphate substitutes and high-performance polymers. The latter have been tailored to specific needs in collaboration with Henkel’s research experts and guarantee superior performance in all respects: 100 percent performance and zero percent phosphate.
Research and development worldwideIn addition to its central research laboratories, Henkel maintains regional research and develop-ment sites in all regions around the world as hubs for innovative problem-solving. Worldwide research and development activity is managed globally by the business units. Research-intensive basic technolo-gies are developed at a central location with optimal
Combined management report 83Henkel Annual Report 2016
29 Corporate governance52 Shares and bonds57 Fundamental principles
of the Group63 Economic report
100 Henkel AG & Co. KGaA (condensed version according to the German Commercial Code [HGB])
104 Risks and opportunities report112 Forecast
material, the technology accelerates production processes and reduces waste. Our portfolio of sprayable sound deadeners also includes materials based on renewable oils, and has been extended to include a water-based acrylate system that is cur-rently being developed through to series produc-tion on a pilot system operated by BMW Group for the new BMW 3 series.
• In 1987, the first hairspray to be manufactured without chlorofluorocarbons (CFCs) was intro-duced on the German market under the Drei Wetter Taft brand. Since then, we have been striv-ing continuously to further improve the sustain-ability profile of such products. The tinplate used to make our Taft aerosol spray cans is derived from steel. A new method of manufacturing the cans, which we developed in partnership with our sup-plier Ardagh, now enables the manufacture of a stiffer type of tinplate which has made it possible to reduce the wall thickness and thus the weight of the cans by 18 percent. The new tin cans are thus bringing us considerably closer to our sustainabil-ity targets: They allow us to save up to 3,500 metric tons of CO2 and to use around 900,000 cubic meters less water each year. We plan to succes-sively translate the resulting reduction in material and water usage during the production phase to other formats in the future. Ardagh was nominated for the Sustainability Award 2016 for this contribu-tion to sustainability.
• The use of renewable raw materials is a key aspect of sustainable laundry detergents and household cleaners. In an exclusive cooperation project between Henkel and Aachen University – the Henkel Innovation Campus for Advanced Sustain-able Technologies, or HICAST for short –, we were able to make promising progress in the field of sustainable base raw materials. This work builds on cellulose, which is the most common organic compound on Earth. Intermediate products made from biomass serve as basic modules from which to develop innovative and sustainable ingredients for laundry detergents and household cleaners. We have managed to convert these intermediate prod-ucts into innovative surfactants with property pro-files that can be put to good commercial use. We have already applied for patent protection of sev-eral substances. This constitutes a key contribu-tion toward ensuring that the laundry detergents and household cleaners of the future use less resources and are properly sustainable.
Contributing to sustainabilityWorldwide, growth and quality of life need to be decoupled from resource use and emissions. Our contribution here lies in the development of innova-tive products and processes that consume less resources while offering the same or better perfor-mance. It is therefore both our duty and our desire to ensure that all new products contribute to sustain-able development in at least one of our six defined focal areas. These are systematically integrated within our innovation process. Early on, our research-ers must demonstrate the specific advantages of their project in regard to product performance, added value for our customers, resource efficiency, and social progress. We thus aim to combine product performance and quality with social and environ-mental responsibility. Our focus in this respect is on two goals. The first is to continuously improve the sustainability profile of the raw materials we use, in collaboration with our suppliers. The second is to help our customers and consumers reduce energy use and carbon dioxide emissions through our innovations.
Life cycle analyses, profiles of potential raw materi-als and packaging options, and our many years of experience in sustainable development help us to identify and evaluate improvement opportunities right from the start of the product development pro-cess. A key tool in this respect is our Henkel Sustain-ability#Master®. This evaluation system centers around a matrix based on the individual steps in our value chain and on our six focal areas. It shows which areas are most relevant from a sustainability perspective, and allows a transparent and quantifi-able comparison to be made between two products or processes.
Our scientists again made valuable contributions to the company’s success through their innovations in 2016. A selection of particularly outstanding research projects is provided in the examples below:• For Adhesive Technologies, a leading role in sus-
tainability constitutes a strategic competitive advantage: Groundbreaking product innovations and high-impact solutions offer our customers added value. Automotive manufacturers, for exam-ple, use our sprayable sound deadeners. The liq-uid material is sprayed onto the floor, doors or roof of a car body and weighs as much as 20 per-cent less than the bitumen mats otherwise used to dampen noise and vibrations. As robotic automa-tion allows pinpoint precision when applying the
Combined management report84 Henkel Annual Report 2016
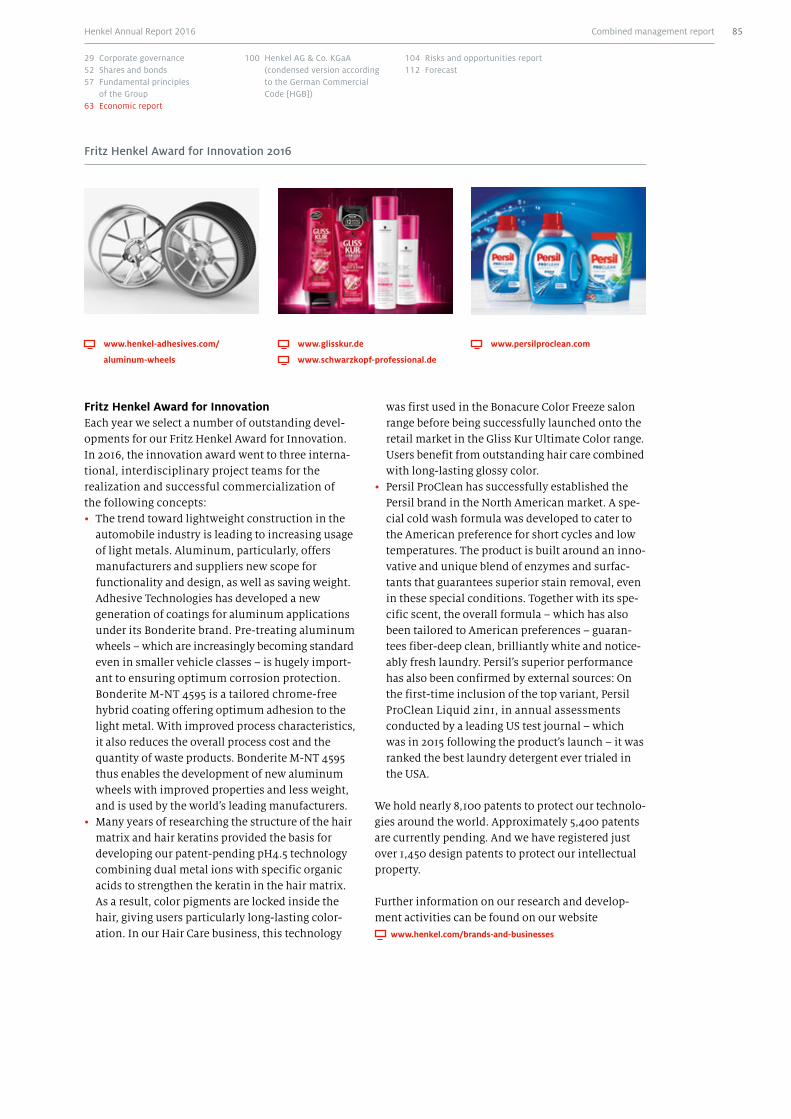
was first used in the Bonacure Color Freeze salon range before being successfully launched onto the retail market in the Gliss Kur Ultimate Color range. Users benefit from outstanding hair care combined with long-lasting glossy color.
• Persil ProClean has successfully established the Persil brand in the North American market. A spe-cial cold wash formula was developed to cater to the American preference for short cycles and low temperatures. The product is built around an inno-vative and unique blend of enzymes and surfac-tants that guarantees superior stain removal, even in these special conditions. Together with its spe-cific scent, the overall formula – which has also been tailored to American preferences – guaran-tees fiber-deep clean, brilliantly white and notice-ably fresh laundry. Persil’s superior performance has also been confirmed by external sources: On the first-time inclusion of the top variant, Persil ProClean Liquid 2in1, in annual assessments conducted by a leading US test journal – which was in 2015 following the product’s launch – it was ranked the best laundry detergent ever trialed in the USA.
We hold nearly 8,100 patents to protect our technolo-gies around the world. Approximately 5,400 patents are currently pending. And we have registered just over 1,450 design patents to protect our intellectual property.
Further information on our research and develop-ment activities can be found on our website
www.henkel.com/brands-and-businesses
Fritz Henkel Award for InnovationEach year we select a number of outstanding devel-opments for our Fritz Henkel Award for Innovation. In 2016, the innovation award went to three interna-tional, interdisciplinary project teams for the realization and successful commercialization of the following concepts:• The trend toward lightweight construction in the
automobile industry is leading to increasing usage of light metals. Aluminum, particularly, offers manufacturers and suppliers new scope for functionality and design, as well as saving weight. Adhesive Technologies has developed a new generation of coatings for aluminum applications under its Bonderite brand. Pre-treating aluminum wheels – which are increasingly becoming standard even in smaller vehicle classes – is hugely import-ant to ensuring optimum corrosion protection. Bonderite M-NT 4595 is a tailored chrome-free hybrid coating offering optimum adhesion to the light metal. With improved process characteristics, it also reduces the overall process cost and the quantity of waste products. Bonderite M-NT 4595 thus enables the development of new aluminum wheels with improved properties and less weight, and is used by the world’s leading manufacturers.
• Many years of researching the structure of the hair matrix and hair keratins provided the basis for developing our patent-pending pH4.5 technology combining dual metal ions with specific organic acids to strengthen the keratin in the hair matrix. As a result, color pigments are locked inside the hair, giving users particularly long-lasting color-ation. In our Hair Care business, this technology
www.persilproclean.com www.glisskur.de
www.schwarzkopf-professional.de
www.henkel-adhesives.com/
aluminum-wheels
Fritz Henkel Award for Innovation 2016
Combined management report 85Henkel Annual Report 2016
29 Corporate governance52 Shares and bonds57 Fundamental principles
of the Group63 Economic report
100 Henkel AG & Co. KGaA (condensed version according to the German Commercial Code [HGB])
104 Risks and opportunities report112 Forecast
In addition to digital communications, we strive to optimize our approach to consumers and craftsmen through the continued use of conventional advertis-ing coupled with measures to attract our target groups at the point of sale. Leveraging our close cus-tomer relationships and our comprehensive techni-cal expertise, we continue to offer tailored solutions and innovative branded products that provide sus-tainable added value for our customers.
Within the Beauty Care business unit, our focused portfolio of brands with unique, distinct brand equi-ties forms the basis for leading, consumer-relevant innovations in our Branded Consumer Goods and Hair Salon business. We develop new products and launch strategies with as much global synergy as is possible, while implementing them as locally as is necessary. Through our customer and consumer proximity, we are able to identify global trends at an early stage and quickly respond to these on an indi-vidual basis with innovative products. In consumer marketing, advancing digitalization alongside classic advertising and point of sale activities enables a sig-nificant increase in media efficiency. With personal-ized 1:1 experiences, we target the right consumer group with the right message in the right environ-ment and also accelerate efficient re-targeting.
We not only specifically choose which consumers we communicate with and by what means, but also which sales channels are of strategic relevance for us. We leverage our category leadership positions both in brick and mortar retail and in the field of eCommerce, also adding value for our online cus-tomers through our shopper knowledge and our expertise.
Having hosted more than 200 customer visits in our “Beauty Care Lighthouse,” which opened in Düssel-dorf in 2012, we have been able to consistently intensify our customer focus. The Lighthouse was thoroughly revamped in 2016 and now offers our customers from around the world an interactive experience of all our beauty competences with stronger focus on digitalization.
We are also committed in our Hair Salon business to close partnership and cooperation with our custom-ers. With our globally established Schwarzkopf Acad-emies, we offer value-adding services in the form of state-of-the-art seminars and ongoing further train-
Marketing and distribution
We put our customers and consumers at the center of what we do. We offer them maximum benefit, quality and service, together with attractive innova-tions, brands and technologies to create sustainable value.
As a market leader, Adhesive Technologies creates high-impact solutions worldwide through ground-breaking innovations and close partnerships with its customers. The portfolio is aligned to the globally specialized markets for adhesives, sealants and func-tional coatings.
We develop the marketing strategies for our strong brands and leading technologies at both the global and regional level. The measures derived from our planning are then implemented locally. Within our branding strategy, we consistently leverage our five global technology cluster brands in the industrial markets and our four brand platforms in the con-sumer business.
Our relationships with around 130,000 direct indus-try and retail customers are managed primarily by our own sales teams, while our retail customers service the needs of private users, craftsmen and smaller industrial customers.
We foster long-term relationships with our custom-ers through our team of around 6,500 technical experts. We therefore have an in-depth understand-ing of the various applications. In light of the signifi-cant complexity of many of our solutions and tech-nologies, technical customer service and thorough user training are of key importance. Our global pres-ence enables us to provide technical services to cus-tomers worldwide as well as in-depth product train-ing on site.
As part of our worldwide digitalization strategy, we have rolled out a global process for further improving the efficiency of our digital customer relationship management. This lead management system enables us to reach existing and potential customers very quickly to provide them with relevant technical and commercial information. In addition, we already offer our industrial customers a successful eCommerce platform in the shape of our Henkel POD. In future, we plan to further develop this approach, based on an integrated concept that focuses on our customers.
specialists serving our Adhesive Technologies customers.
direct industry and retail customers.
6,500
130,000
Around
Around
Combined management report86 Henkel Annual Report 2016
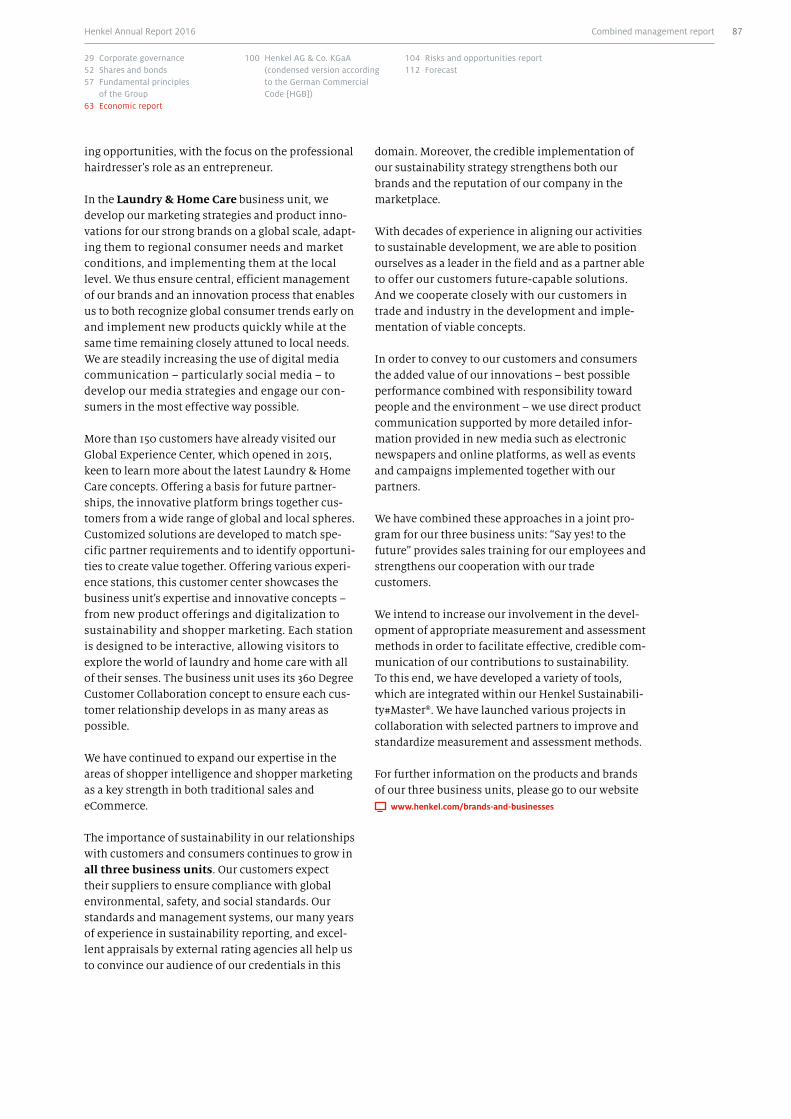
domain. Moreover, the credible implementation of our sustainability strategy strengthens both our brands and the reputation of our company in the marketplace.
With decades of experience in aligning our activities to sustainable development, we are able to position ourselves as a leader in the field and as a partner able to offer our customers future-capable solutions. And we cooperate closely with our customers in trade and industry in the development and imple-mentation of viable concepts.
In order to convey to our customers and consumers the added value of our innovations – best possible performance combined with responsibility toward people and the environment – we use direct product communication supported by more detailed infor-mation provided in new media such as electronic newspapers and online platforms, as well as events and campaigns implemented together with our partners.
We have combined these approaches in a joint pro-gram for our three business units: “Say yes! to the future” provides sales training for our employees and strengthens our cooperation with our trade customers.
We intend to increase our involvement in the devel-opment of appropriate measurement and assessment methods in order to facilitate effective, credible com-munication of our contributions to sustainability. To this end, we have developed a variety of tools, which are integrated within our Henkel Sustainabili-ty#Master®. We have launched various projects in collaboration with selected partners to improve and standardize measurement and assessment methods.
For further information on the products and brands of our three business units, please go to our website
www.henkel.com/brands-and-businesses
ing opportunities, with the focus on the professional hairdresser’s role as an entrepreneur.
In the Laundry & Home Care business unit, we develop our marketing strategies and product inno-vations for our strong brands on a global scale, adapt-ing them to regional consumer needs and market conditions, and implementing them at the local level. We thus ensure central, efficient management of our brands and an innovation process that enables us to both recognize global consumer trends early on and implement new products quickly while at the same time remaining closely attuned to local needs. We are steadily increasing the use of digital media communication – particularly social media – to develop our media strategies and engage our con-sumers in the most effective way possible.
More than 150 customers have already visited our Global Experience Center, which opened in 2015, keen to learn more about the latest Laundry & Home Care concepts. Offering a basis for future partner-ships, the innovative platform brings together cus-tomers from a wide range of global and local spheres. Customized solutions are developed to match spe-cific partner requirements and to identify opportuni-ties to create value together. Offering various experi-ence stations, this customer center showcases the business unit’s expertise and innovative concepts – from new product offerings and digitalization to sustainability and shopper marketing. Each station is designed to be interactive, allowing visitors to explore the world of laundry and home care with all of their senses. The business unit uses its 360 Degree Customer Collaboration concept to ensure each cus-tomer relationship develops in as many areas as possible.
We have continued to expand our expertise in the areas of shopper intelligence and shopper marketing as a key strength in both traditional sales and eCommerce.
The importance of sustainability in our relationships with customers and consumers continues to grow in all three business units. Our customers expect their suppliers to ensure compliance with global environmental, safety, and social standards. Our standards and management systems, our many years of experience in sustainability reporting, and excel-lent appraisals by external rating agencies all help us to convince our audience of our credentials in this
Combined management report 87Henkel Annual Report 2016
29 Corporate governance52 Shares and bonds57 Fundamental principles
of the Group63 Economic report
100 Henkel AG & Co. KGaA (condensed version according to the German Commercial Code [HGB])
104 Risks and opportunities report112 Forecast
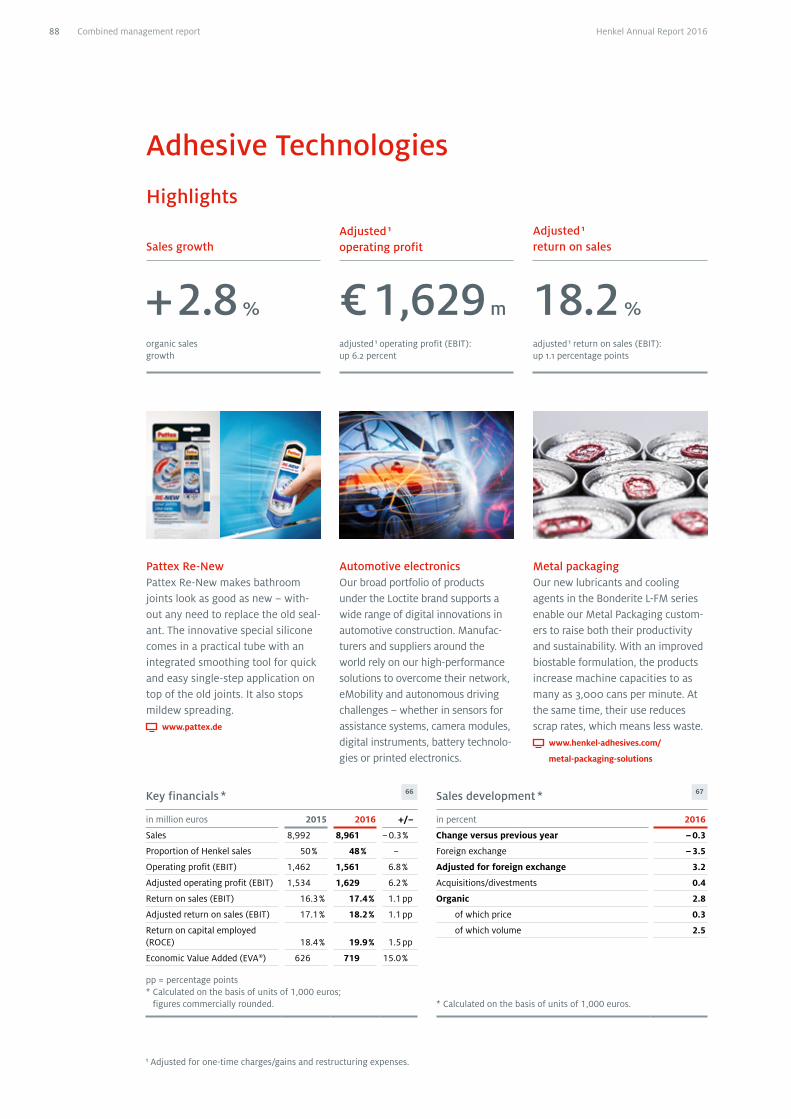
Adhesive Technologies
1 Adjusted for one-time charges/gains and restructuring expenses.
Automotive electronicsOur broad portfolio of products under the Loctite brand supports a wide range of digital innovations in automotive construction. Manufac-turers and suppliers around the world rely on our high-performance solutions to overcome their network, eMobility and autonomous driving challenges – whether in sensors for assistance systems, camera modules, digital instruments, battery technolo-gies or printed electronics.
Metal packaging Our new lubricants and cooling agents in the Bonderite L-FM series enable our Metal Packaging custom-ers to raise both their productivity and sustainability. With an improved biostable formulation, the products increase machine capacities to as many as 3,000 cans per minute. At the same time, their use reduces scrap rates, which means less waste.
www.henkel-adhesives.com/
metal-packaging-solutions
Pattex Re-NewPattex Re-New makes bathroom joints look as good as new – with-out any need to replace the old seal-ant. The inno vative special silicone comes in a practical tube with an integrated smoothing tool for quick and easy single-step application on top of the old joints. It also stops mildew spreading.
www.pattex.de
Sales growthAdjusted 1 operating profit
Adjusted 1 return on sales
organic sales growth
adjusted 1 operating profit (EBIT): up 6.2 percent
adjusted 1 return on sales (EBIT): up 1.1 percentage points
Key financials * 66
in million euros 2015 2016 +/–
Sales 8,992 8,961 – 0.3 %
Proportion of Henkel sales 50 % 48 % –
Operating profit (EBIT) 1,462 1,561 6.8 %
Adjusted operating profit (EBIT) 1,534 1,629 6.2 %
Return on sales (EBIT) 16.3 % 17.4 % 1.1 pp
Adjusted return on sales (EBIT) 17.1 % 18.2 % 1.1 pp
Return on capital employed (ROCE) 18.4 % 19.9 % 1.5 pp
Economic Value Added (EVA®) 626 719 15.0 %
pp = percentage points * Calculated on the basis of units of 1,000 euros;
figures commercially rounded.
Sales development * 67
in percent 2016
Change versus previous year – 0.3
Foreign exchange – 3.5
Adjusted for foreign exchange 3.2
Acquisitions/divestments 0.4
Organic 2.8
of which price 0.3
of which volume 2.5
* Calculated on the basis of units of 1,000 euros.
Highlights
€ 1,629 m 18.2 %+ 2.8 %
Combined management report88 Henkel Annual Report 2016
Economic environment
The economic environment for the Adhesive Tech-nologies business unit was characterized by subdued growth in the relevant markets, with expansion in the key industrial sectors lower than initially fore-casted due to continuing political and economic uncertainties. Although growth in emerging markets was only moderate, it continued to drive global eco-nomic development.
Despite this difficult market environment, the Adhe-sive Technologies business unit continued to grow, with overall sales outperforming market expansion, supported by its globally leading positions, active portfolio management and innovative product solutions.
Business activity and strategy
As a market leader, the Adhesive Technologies busi-ness unit creates high-impact solutions worldwide through groundbreaking innovations and close part-nerships with its customers. With our leading tech-nologies, strong brands and the competence of our global expert teams, we supply tailor-made products that create competitive advantages and sustainable value for our customers.
Our market leadership and global presence enable us to offer solutions and systems across all business areas and regions for adhesives, sealants and func-tional coatings. Our products are an essential part of industrial products and consumer goods, and make them better, safer and more sustainable. The acquisi-tion of leading technologies that complement our portfolio and offer synergy potential represents an additional attractive option for further profitable business expansion. Our acquisitions to date demon-strate our ability to consistently integrate newly acquired businesses quickly and successfully on the basis of our standardized business processes.
In the Packaging and Consumer Goods Adhesives business area, we work with major brand manufac-turers and international customers to develop inno-vative and sustainable solutions for food packaging and consumer goods. Our technical customer service makes comprehensive applications expertise glob-ally available. Strategically cooperating with partners along the value chain also makes a significant contri-
bution to creating more value and helping our cus-tomers to both satisfy the manifold needs of con-sumers and comply with regulations.
In the Transport and Metal business area, we provide our customers in the automotive, aircraft and aero-space, and metal processing industries with out-standing system solutions, a comprehensive tech-nology portfolio, and specialized technical services. We work closely with major international manufac-turers and their suppliers. Through our early involve-ment in design and development processes, we are able to create innovative, customized solutions to new challenges – for example, in lightweight con-struction or eMobility.
In the General Industry business area, we offer our customers a comprehensive portfolio of products for the manufacture and maintenance of durable goods. Our customers range from household appliance manufacturers through to operators of large-scale industrial plants, and service specialists operating in all branches of industry. In addition to providing direct support for our customers from industry, we can also tap into a global network of trained distribu-tion partners. We raise the value added for our cus-tomers while securing competitive advantages and growth by working with industrial clients on the development of high-impact adhesive solutions, and by regularly and systematically training users.
Our Electronics business area offers customers from the electronics industry a specialized portfolio of innovative high-technology adhesives and materials for the manufacture of microchips, electronic assem-blies and thermal management systems. We com-bine our expertise with targeted investments in our technology portfolio to develop new solutions for the growing challenges encountered in the fields of digital networking and the Internet of Things. Our global presence enables us to collaborate closely with development centers of major electronics firms and provide support for their production processes.
Our Adhesives for Consumers, Craftsmen and Build-ing business area markets an extensive range of brand-name products for private, trade and construc-tion users. We offer innovative products and specific system solutions based on our globally strong brands, and secure competitive advantages by quickly and efficiently translating the latest techno-logical developments from our industrial business
Top brands
Combined management report 89Henkel Annual Report 2016
29 Corporate governance52 Shares and bonds57 Fundamental principles
of the Group63 Economic report
100 Henkel AG & Co. KGaA (condensed version according to the German Commercial Code [HGB])
104 Risks and opportunities report112 Forecast
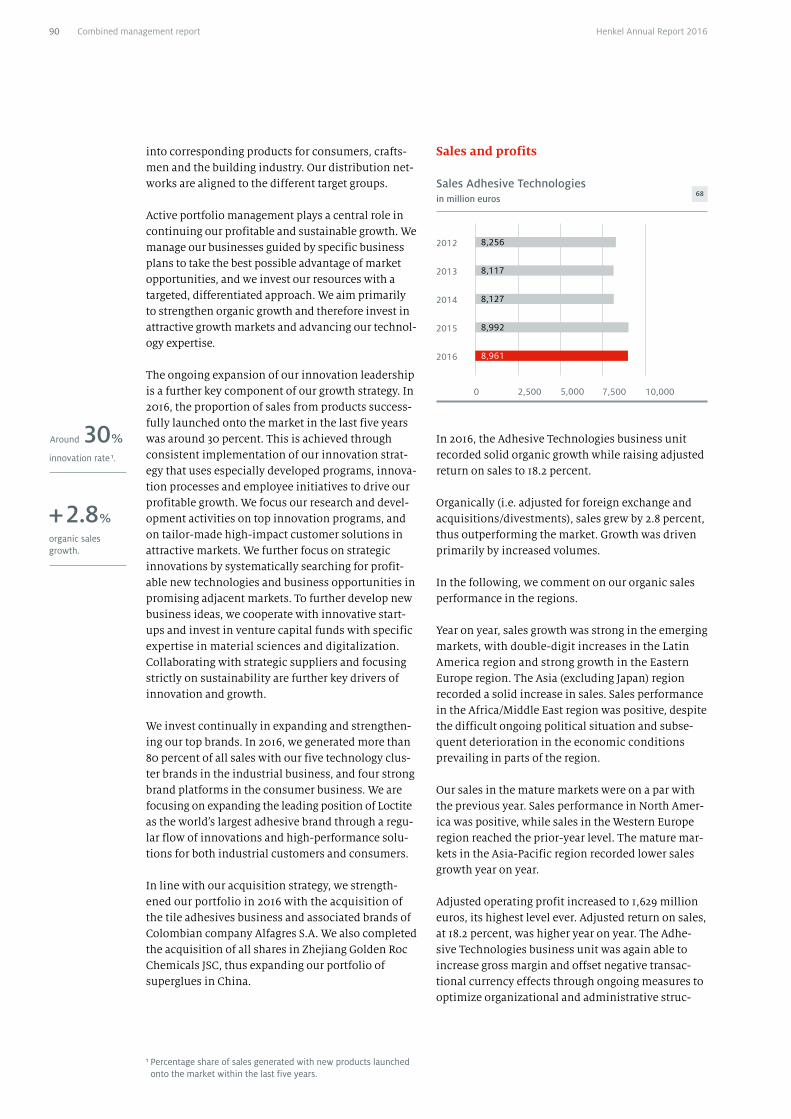
into corresponding products for consumers, crafts-men and the building industry. Our distribution net-works are aligned to the different target groups.
Active portfolio management plays a central role in continuing our profitable and sustainable growth. We manage our businesses guided by specific business plans to take the best possible advantage of market opportunities, and we invest our resources with a targeted, differentiated approach. We aim primarily to strengthen organic growth and therefore invest in attractive growth markets and advancing our technol-ogy expertise.
The ongoing expansion of our innovation leadership is a further key component of our growth strategy. In 2016, the proportion of sales from products success-fully launched onto the market in the last five years was around 30 percent. This is achieved through consistent implementation of our innovation strat-egy that uses especially developed programs, innova-tion processes and employee initiatives to drive our profitable growth. We focus our research and devel-opment activities on top innovation programs, and on tailor-made high-impact customer solutions in attractive markets. We further focus on strategic innovations by systematically searching for profit-able new technologies and business opportunities in promising adjacent markets. To further develop new business ideas, we cooperate with innovative start-ups and invest in venture capital funds with specific expertise in material sciences and digitalization. Collaborating with strategic suppliers and focusing strictly on sustainability are further key drivers of innovation and growth.
We invest continually in expanding and strengthen-ing our top brands. In 2016, we generated more than 80 percent of all sales with our five technology clus-ter brands in the industrial business, and four strong brand platforms in the consumer business. We are focusing on expanding the leading position of Loctite as the world’s largest adhesive brand through a regu-lar flow of innovations and high-performance solu-tions for both industrial customers and consumers.
In line with our acquisition strategy, we strength-ened our portfolio in 2016 with the acquisition of the tile adhesives business and associated brands of Colombian company Alfagres S.A. We also completed the acquisition of all shares in Zhejiang Golden Roc Chemicals JSC, thus expanding our portfolio of superglues in China.
Sales and profits
In 2016, the Adhesive Technologies business unit recorded solid organic growth while raising adjusted return on sales to 18.2 percent.
Organically (i.e. adjusted for foreign exchange and acquisitions/divestments), sales grew by 2.8 percent, thus outperforming the market. Growth was driven primarily by increased volumes.
In the following, we comment on our organic sales performance in the regions.
Year on year, sales growth was strong in the emerging markets, with double-digit increases in the Latin America region and strong growth in the Eastern Europe region. The Asia (excluding Japan) region recorded a solid increase in sales. Sales performance in the Africa/Middle East region was positive, despite the difficult ongoing political situation and subse-quent deterioration in the economic conditions prevailing in parts of the region.
Our sales in the mature markets were on a par with the previous year. Sales performance in North Amer-ica was positive, while sales in the Western Europe region reached the prior-year level. The mature mar-kets in the Asia-Pacific region recorded lower sales growth year on year.
Adjusted operating profit increased to 1,629 million euros, its highest level ever. Adjusted return on sales, at 18.2 percent, was higher year on year. The Adhe-sive Technologies business unit was again able to increase gross margin and offset negative transac-tional currency effects through ongoing measures to optimize organizational and administrative struc-
organic sales growth.
+ 2.8 %
innovation rate 1.
30 %Around
1 Percentage share of sales generated with new products launched onto the market within the last five years.
2012
2013
2014
2015
2016
2,500 5,000 7,500 10,0000
8,117
8,127
8,992
8,961
Sales Adhesive Technologies in million euros
68
8,256
Combined management report90 Henkel Annual Report 2016
tures and by enhancing production and supply chain efficiency. Lower prices for direct materials also had a positive impact.
At 11.0 percent, net working capital as a percentage of sales was below the already low level of the prior year. Return on capital employed (ROCE) increased year on year to 19.9 percent. Economic Value Added (EVA®) increased by 93 million euros versus the pre-vious year, to 719 million euros.
Business areas
In the following, we comment on the organic sales performance of our business areas.
Industrial AdhesivesSales in the Packaging and Consumer Goods Adhe-sives business area showed positive performance versus the previous year. Packaging adhesives for use in the food and beverage industries, and especially our leading food safety products, were an important contributor to this growth. We work closely in this field with international customers, globally active brand manufacturers, institutes and the authorities to enhance consumer safety around the globe. Our innovations are always tailored to growing consumer needs – for more convenience, for example – thereby strengthening the products and brands of our cus-tomers. New applications for our structural adhe-sives for furniture and building components enabled us to tap further growth potential.
We posted a strong increase in sales in our Transport and Metal business area. Our growth in this business area was driven primarily by our business with auto-motive manufacturers and their suppliers. Our broad product and technology portfolio enables us to pro-vide customized solutions for assemblies such as drive trains. In doing so, we enable our customers to develop lightweight construction, downsizing and eMobility innovations for both conventional and electric drive trains.
The General Industry business area posted a positive sales performance, again mainly due to activities involving customers in various industrial markets and the vehicle repair and maintenance sector. Working closely with our key accounts, we develop customized integrated solutions to reduce noise and improve thermal performance – in household appli-ances and consumer goods, for example. In addition to the improved performance capabilities of their products, our customers also benefit from greater automation, process efficiency and sustainability.
Sales development in the Electronics business area was positive year on year, driven mainly by our busi-ness with consumer electronics manufacturers and by thermal management products for the electronics industry. We are stimulating new growth with our high-impact solutions for the rapidly expanding automotive electronics market, to which we can sup-ply a broad portfolio of products that manufacturers and components suppliers are increasingly using in sensors, assistance systems, displays, and battery technology, enabling the development of new digital networks and driverless vehicle systems.
Adhesives for Consumers, Craftsmen and BuildingSales performance in the Adhesives for Consumers, Craftsmen and Building business area was positive. The increase was based in part on our construction industry business. Here we further strengthened our portfolio with the acquisition of the tile adhesives business and associated brands of Alfagres S.A. in Colombia. We also strengthened our position with respect to DIY products by strategically cooperating with one of our key European retail customers. This is enabling us to tap new local growth potential, especially in Eastern Europe.
Capital expenditures
Investment in property, plant and equipment totaled 187 million euros in 2016 (2015: 227 million euros), with the focus on expanding production capacity, mainly in the emerging markets, and building manu-facturing facilities aligned to specific customer requirements.
investments in property, plant and equipment.
€ 187 m
Combined management report 91Henkel Annual Report 2016
29 Corporate governance52 Shares and bonds57 Fundamental principles
of the Group63 Economic report
100 Henkel AG & Co. KGaA (condensed version according to the German Commercial Code [HGB])
104 Risks and opportunities report112 Forecast
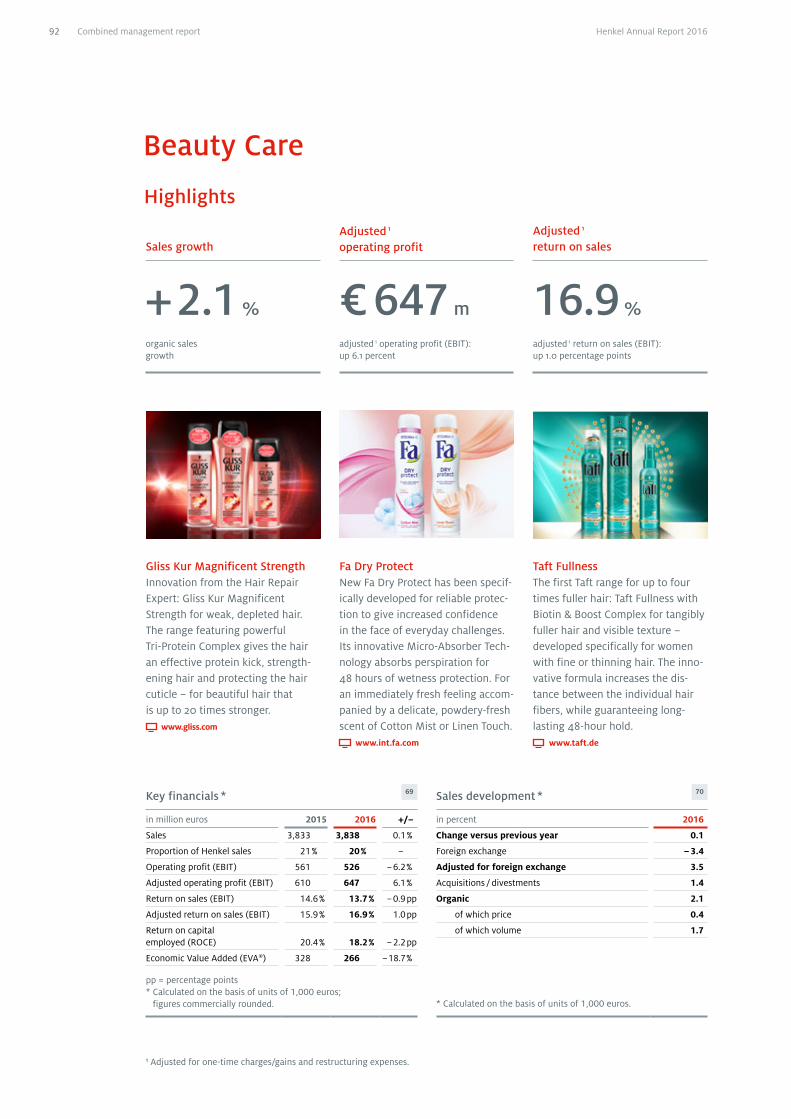
Taft FullnessThe first Taft range for up to four times fuller hair: Taft Fullness with Biotin & Boost Complex for tangibly fuller hair and visible texture – developed specifically for women with fine or thinning hair. The inno-vative formula increases the dis-tance between the individual hair fibers, while guaranteeing long- lasting 48-hour hold.
www.taft.de
Fa Dry ProtectNew Fa Dry Protect has been specif-ically developed for reliable protec-tion to give increased confidence in the face of everyday challenges. Its innovative Micro-Absorber Tech-nology absorbs perspiration for 48 hours of wetness protection. For an immediately fresh feeling accom-panied by a delicate, powdery-fresh scent of Cotton Mist or Linen Touch.
www.int.fa.com
Gliss Kur Magnificent StrengthInnovation from the Hair Repair Expert: Gliss Kur Magnificent Strength for weak, depleted hair. The range featuring powerful Tri-Protein Complex gives the hair an effective protein kick, strength-ening hair and protecting the hair cuticle – for beautiful hair that is up to 20 times stronger.
www.gliss.com
Beauty Care
Highlights
Sales growth
+ 2.1 %
Adjusted 1 operating profit
€ 647 m
Adjusted 1 return on sales
16.9 %organic sales growth
adjusted 1 operating profit (EBIT): up 6.1 percent
adjusted 1 return on sales (EBIT): up 1.0 percentage points
1 Adjusted for one-time charges/gains and restructuring expenses.
Key financials * 69
in million euros 2015 2016 +/–
Sales 3,833 3,838 0.1 %
Proportion of Henkel sales 21 % 20 % –
Operating profit (EBIT) 561 526 – 6.2 %
Adjusted operating profit (EBIT) 610 647 6.1 %
Return on sales (EBIT) 14.6 % 13.7 % – 0.9 pp
Adjusted return on sales (EBIT) 15.9 % 16.9 % 1.0 pp
Return on capital employed (ROCE) 20.4 % 18.2 % – 2.2 pp
Economic Value Added (EVA®) 328 266 – 18.7 %
pp = percentage points * Calculated on the basis of units of 1,000 euros;
figures commercially rounded.
Sales development * 70
in percent 2016
Change versus previous year 0.1
Foreign exchange – 3.4
Adjusted for foreign exchange 3.5
Acquisitions / divestments 1.4
Organic 2.1
of which price 0.4
of which volume 1.7
* Calculated on the basis of units of 1,000 euros.
Combined management report92 Henkel Annual Report 2016
Economic environment
In 2016, growth in the world cosmetics sector contin-ued to slow down in markets of key relevance, with developments in some major markets recessionary. Despite a difficult and highly competitive environ-ment, the Beauty Care business unit was able to out-pace market growth.
In our Branded Consumer Goods business, the mature markets in particular showed weak develop-ment. In Western Europe especially, the environ-ment was characterized by a further intensification of promotional activities, with rising price pressure and declining average prices. However, the markets in the North America region posted positive growth.
Within the emerging markets, the Africa/Middle East region exhibited continuing growth, although the rate was once again lower year on year. Business growth in Asia (excluding Japan) also slowed due t o weaker developments in relevant markets in China. The markets in Latin America showed a posi-tive development. The markets of the Eastern Europe region exhibited moderate growth under persistently difficult trading conditions.
The professional hairdressing market remained under pressure in 2016 as customers continued to exhibit restraint. Despite this difficult market environ-ment overall, we were again able to exceed the sales level of the previous year and to further extend our position as the world number 3 in the hair salon field.
Business activity and strategy
Worldwide, the Beauty Care business unit is success-fully active in the Branded Consumer Goods business area with Hair Cosmetics, Body Care, Skin Care and Oral Care, as well as in the professional Hair Salon business.
To further drive the growth of our Beauty Care busi-ness, we place the customer and the consumer at the center of everything we do. At the focus of our growth strategy are specific choices regarding customers
and channels, category prioritization and the central management of our global brands portfolio. This enables us to pursue targeted investments in segments offering above-average growth and profitability.
We strengthen our brand investments on a global scale through strict cost management, an improved portfolio structure, complexity reduction and premiumization.
At the center of our strategy is our drive for organic growth, supported in particular by innovations and our strong brands. Our innovation approach focuses on fewer but bigger, better and more margin-accre-tive innovations, with early recognition and identi-fication of relevant consumer trends, a conscious commitment to game-changing offerings and rapid international rollouts all key contributors to suc-cess. Again in 2016, we achieved an innovation rate of more than 45 percent.
By continuously strengthening our top brands, we were able to further boost the sales generated by our top 10 brands, with disproportionate growth in those segments of most importance to us. In 2016, our top 10 brands again contributed over 90 percent of our sales revenues. In addition to strengthening our brands, we focus particularly on the growth potential available in our key accounts.
We also intend to further leverage the potential of digitalization. With determined acceleration of the digital transformation process across all areas, we can better interact with consumers, transfer our shopper knowledge and category captaincies to digital channels, and organize manufacturing and logistics more efficiently.
We supplement organic growth with carefully selected acquisitions. In line with our strategy, we have expanded our portfolio in attractive categories through the acquisition of a range of leading hair care brands in Africa/Middle East and Eastern Europe.
1 Percentage share of sales generated with new products launched onto the market within the last three years.
Top brands
innovation rate 1.
Over 45 %
Combined management report 93Henkel Annual Report 2016
29 Corporate governance52 Shares and bonds57 Fundamental principles
of the Group63 Economic report
100 Henkel AG & Co. KGaA (condensed version according to the German Commercial Code [HGB])
104 Risks and opportunities report112 Forecast
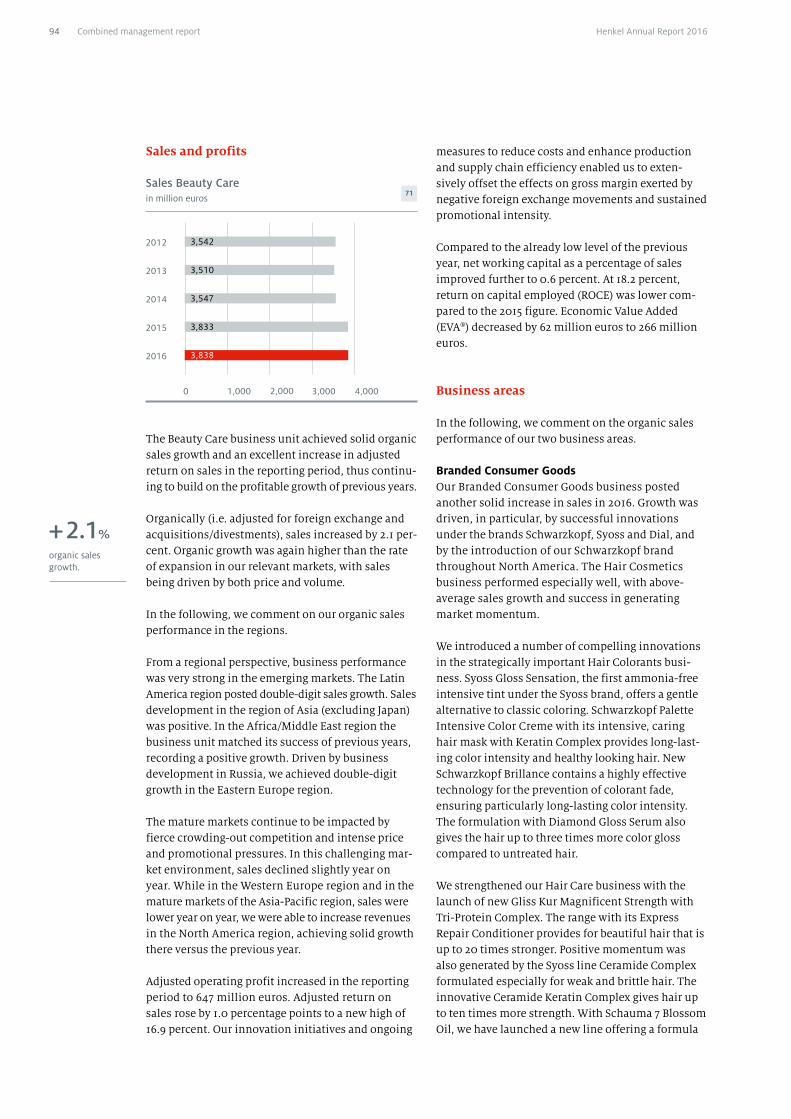
Sales and profits measures to reduce costs and enhance production and supply chain efficiency enabled us to exten-sively offset the effects on gross margin exerted by negative foreign exchange movements and sustained promotional intensity.
Compared to the already low level of the previous year, net working capital as a percentage of sales improved further to 0.6 percent. At 18.2 percent, return on capital employed (ROCE) was lower com-pared to the 2015 figure. Economic Value Added (EVA®) decreased by 62 million euros to 266 million euros.
Business areas
In the following, we comment on the organic sales performance of our two business areas.
Branded Consumer GoodsOur Branded Consumer Goods business posted another solid increase in sales in 2016. Growth was driven, in particular, by successful innovations under the brands Schwarzkopf, Syoss and Dial, and by the introduction of our Schwarzkopf brand throughout North America. The Hair Cosmetics business performed especially well, with above- average sales growth and success in generating market momentum.
We introduced a number of compelling innovations in the strategically important Hair Colorants busi-ness. Syoss Gloss Sensation, the first ammonia-free intensive tint under the Syoss brand, offers a gentle alternative to classic coloring. Schwarzkopf Palette Intensive Color Creme with its intensive, caring hair mask with Keratin Complex provides long-last-ing color intensity and healthy looking hair. New Schwarzkopf Brillance contains a highly effective technology for the prevention of colorant fade, ensuring particularly long-lasting color intensity. The formulation with Diamond Gloss Serum also gives the hair up to three times more color gloss compared to untreated hair.
We strengthened our Hair Care business with the launch of new Gliss Kur Magnificent Strength with Tri-Protein Complex. The range with its Express Repair Conditioner provides for beautiful hair that is up to 20 times stronger. Positive momentum was also generated by the Syoss line Ceramide Complex formulated especially for weak and brittle hair. The innovative Ceramide Keratin Complex gives hair up to ten times more strength. With Schauma 7 Blossom Oil, we have launched a new line offering a formula
Sales Beauty Care in million euros
71
2012
2013
2014
2015
2016
1,000 2,000 3,000 4,0000
3,510
3,547
3,833
3,838
3,542
organic sales growth.
+ 2.1%
The Beauty Care business unit achieved solid organic sales growth and an excellent increase in adjusted return on sales in the reporting period, thus continu-ing to build on the profitable growth of previous years.
Organically (i.e. adjusted for foreign exchange and acquisitions/divestments), sales increased by 2.1 per-cent. Organic growth was again higher than the rate of expansion in our relevant markets, with sales being driven by both price and volume.
In the following, we comment on our organic sales performance in the regions.
From a regional perspective, business performance was very strong in the emerging markets. The Latin America region posted double-digit sales growth. Sales development in the region of Asia (excluding Japan) was positive. In the Africa/Middle East region the business unit matched its success of previous years, recording a positive growth. Driven by business development in Russia, we achieved double-digit growth in the Eastern Europe region.
The mature markets continue to be impacted by fierce crowding-out competition and intense price and promotional pressures. In this challenging mar-ket environment, sales declined slightly year on year. While in the Western Europe region and in the mature markets of the Asia-Pacific region, sales were lower year on year, we were able to increase revenues in the North America region, achieving solid growth there versus the previous year.
Adjusted operating profit increased in the reporting period to 647 million euros. Adjusted return on sales rose by 1.0 percentage points to a new high of 16.9 percent. Our innovation initiatives and ongoing
Combined management report94 Henkel Annual Report 2016
that penetrates deep into the hair structure and repairs the hair at every layer. The Hair Care business was additionally boosted by the innovation Schwarz-kopf Men ZincPT, an anti-dandruff treatment for the male market. Used regularly, this offers men’s hair a reduction in visible dandruff of up to 100 percent combined with an immediate freshness kick.
Within the Hair Styling business, the Taft brand was able to further expand its leading market position. The new line, Taft Fullness, leaves hair noticeably fuller with visible texture and good manageability. The new Taft Power Electro series offers the strongest Taft hold ever. And within our trendsetting brand Got2b, we developed a new line of products under the name Glam Force, which offers 48 hours of ultra-strong, glamorous hold with protection against flyaways.
In Body Care, we profited from the success of the new Fa shower gels Coconut Water and Coconut Milk with coconut extract for a perfect combination of care and a refreshed feeling for the skin. The innova-tive antiperspirant Fa Dry Protect continued to show positive development. The formula based on Micro- Absorber technology offers an immediate feeling of dryness and 48 hours of protection from underarm wetness. North America saw the launch of the body care series Dial Soothing Care. The body wash with collagen is pH-neutral on the skin and imparts a soothing effect. Also launched onto the market was the deodorant stick Right Guard Xtreme Odor Com-bat, which successfully combats body odor for up to 96 hours.
The Skin Care business was expanded through the introduction of Diadermine Lift+ Super Corrector, our first anti-aging innovation capable of combating both existing and future pigmentation spots. We also offer a series especially formulated for mature dry skin in the form of the innovation Diadermine Nutrition Expert 3D.
Within the Oral Care business we have strengthened the freshness variants of the Theramed 2in1 line with improved formulations. The new technology creates a three times fresher feel while also ensuring a thor-ough antibacterial clean. We continue to set new standards for our Denivit brand: After just 10 days, the innovation Pro-Laser White removes up to 90 percent of stains discoloring the teeth.
Hair Salon businessThe professional hairdressing market remained under pressure in 2016 as customers continued to exhibit restraint. Nevertheless, our sales figures experienced positive development, with major con-tributions coming from, in particular, Schwarzkopf Professional and the brands Sexy Hair, Alterna and Kenra that we acquired in North America in 2014.
Within the Hair Care category, Schwarzkopf Profes-sional generated strong momentum with the BC Bonacure brand. New Schwarzkopf Professional BC Bonacure Repair Rescue with patented Reversilane technology durably restores hair fibers while sealing the hair surface with a protective shield. In the Colo-rants category, Schwarzkopf Professional launched new Igora Royal Highlifts with Fibre Bond technol-ogy onto the market. These products minimize hair breakage while producing the coolest blond tones from Igora of all time. In the Styling category, the brand Osis+ with its slogan “Made to Create” offers a complete product range for the creation of uniquely individual hair styles whenever required.
Capital expenditures
Investments focused on efficiency improvements and optimization in our production and distribution processes and the further expansion of our manufac-turing capacities, especially the scheduled expansion of our plant in Russia. Further capital expenditures went into the environmental sphere with the refur-bishment of the wastewater treatment facilities located at our factories in Slovenia and the USA. In all, we invested 54 million euros in property, plant and equipment compared to 61 million euros in the previous year.
investments in property, plant and equipment.
€ 54 m
Combined management report 95Henkel Annual Report 2016
29 Corporate governance52 Shares and bonds57 Fundamental principles
of the Group63 Economic report
100 Henkel AG & Co. KGaA (condensed version according to the German Commercial Code [HGB])
104 Risks and opportunities report112 Forecast
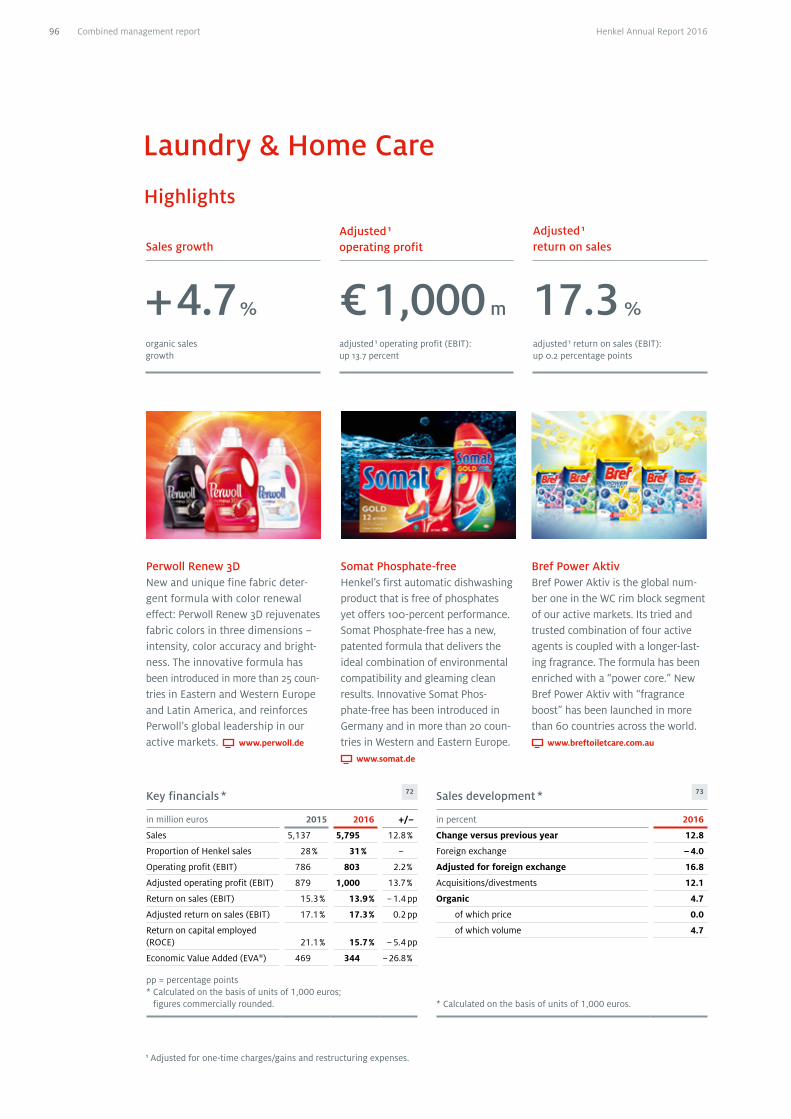
Somat Phosphate-freeHenkel’s first automatic dishwashing product that is free of phosphates yet offers 100-percent performance. Somat Phosphate-free has a new, patented formula that delivers the ideal combination of environmental compatibility and gleaming clean results. Innovative Somat Phos-phate-free has been introduced in Germany and in more than 20 coun-tries in Western and Eastern Europe.
www.somat.de
Perwoll Renew 3DNew and unique fine fabric deter-gent formula with color renewal effect: Perwoll Renew 3D rejuvenates fabric colors in three dimensions –intensity, color accuracy and bright-ness. The innovative formula has been introduced in more than 25 coun-tries in Eastern and Western Europe and Latin America, and reinforces Perwoll’s global leadership in our active markets. www.perwoll.de
Bref Power AktivBref Power Aktiv is the global num-ber one in the WC rim block segment of our active markets. Its tried and trusted combination of four active agents is coupled with a longer-last-ing fragrance. The formula has been enriched with a “power core.” New Bref Power Aktiv with “fragrance boost” has been launched in more than 60 countries across the world.
www.breftoiletcare.com.au
Laundry & Home Care
Highlights
Sales growth
+ 4.7 %
Adjusted 1 operating profit
€ 1,000 m
Adjusted 1 return on sales
17.3 %organic sales growth
adjusted 1 operating profit (EBIT): up 13.7 percent
adjusted 1 return on sales (EBIT): up 0.2 percentage points
1 Adjusted for one-time charges/gains and restructuring expenses.
Key financials * 72
in million euros 2015 2016 +/–
Sales 5,137 5,795 12.8 %
Proportion of Henkel sales 28 % 31 % –
Operating profit (EBIT) 786 803 2.2 %
Adjusted operating profit (EBIT) 879 1,000 13.7 %
Return on sales (EBIT) 15.3 % 13.9 % – 1.4 pp
Adjusted return on sales (EBIT) 17.1 % 17.3 % 0.2 pp
Return on capital employed (ROCE) 21.1 % 15.7 % – 5.4 pp
Economic Value Added (EVA®) 469 344 – 26.8 %
pp = percentage points * Calculated on the basis of units of 1,000 euros;
figures commercially rounded.
Sales development * 73
in percent 2016
Change versus previous year 12.8
Foreign exchange – 4.0
Adjusted for foreign exchange 16.8
Acquisitions/divestments 12.1
Organic 4.7
of which price 0.0
of which volume 4.7
* Calculated on the basis of units of 1,000 euros.
Combined management report96 Henkel Annual Report 2016
Economic environment
In 2016, the relevant world market for laundry and home care showed moderate growth. Despite renewed fierce price and promotional competition in our relevant markets, our growth again signifi-cantly outpaced the relevant global market in 2016. Both the sustained success of our strong brands and the successful global introduction of our innovations contributed to this solid performance.
Market performance in the mature markets was slightly positive. In Western Europe, the relevant market for laundry and home care products remained flat, while growth in North America was moderate.
Developments in the emerging markets varied. Our relevant markets in the Africa/Middle East region declined as a result of the challenging market envi-ronment. The market in Eastern Europe recorded solid growth. In Latin America, performance in the relevant market for laundry and home care products was also solid.
Business activity and strategy
The Laundry & Home Care business unit sells laun-dry detergents and household cleaners around the globe. The Laundry Care business includes not only heavy-duty and specialty detergents but also, in particular, fabric softeners, laundry additives, and other fabric care products. The product portfolio of our Home Care business encompasses hand and automatic dishwashing products, household clean-ers for the bathroom and WC, and surface, glass and specialty cleaners. We also offer air fresheners and insect control products for household applications.
Our aim is to continue generating profitable growth in the future through ongoing expansion of our cur-rent business and targeted acquisitions.
Our strategy of profitable growth is supported partic-ularly by our leading brands and technologies, and builds on winning innovations that offer added value for consumers. Key elements of our strategy also include our strategic partnerships with customers and the expansion of our digital business activities.
Prioritizing categories and centrally steering our global brand portfolio helps us to direct our invest-ments specifically toward those segments that offer growth and profitability, enabling us to generate above-average sales increases with our top brands and in our most important market segments. Invest-ments in our brands are also strengthened by further optimizing our use of resources.
In 2016, we generated more than 80 percent of our sales with our top 10 brand clusters. A brand cluster comprises individual global and local brands that share a common brand positioning internationally. By adopting this approach, we generate synergies in our marketing mix.
Our efficient marketing and distribution processes enable us to identify consumer trends at an early stage and bring a number of relevant innovations to market. Accordingly, successful product launches again contributed substantially to our positive finan-cial performance in the year under review. Our inno-vation rate in 2016 was 43 percent. Looking ahead, we plan to further strengthen our differentiation and increase our agility in a fiercely competitive environment.
Our global strategy builds on both organic growth and acquisitions. Our aim is to invest in attractive category positions so as to accelerate our growth in profitable segments. In 2016, we strengthened our business through attractive acquisitions in both emerging and mature markets, most importantly through that of The Sun Products Corporation, as a result of which we now rank number 2 in the North American laundry and home care market. Integration of our acquired businesses is proceeding successfully and according to plan.
innovation rate 1.
43 %
Top brands
1 Percentage share of sales generated with new products launched onto the market within the last three years.
Combined management report 97Henkel Annual Report 2016
29 Corporate governance52 Shares and bonds57 Fundamental principles
of the Group63 Economic report
100 Henkel AG & Co. KGaA (condensed version according to the German Commercial Code [HGB])
104 Risks and opportunities report112 Forecast
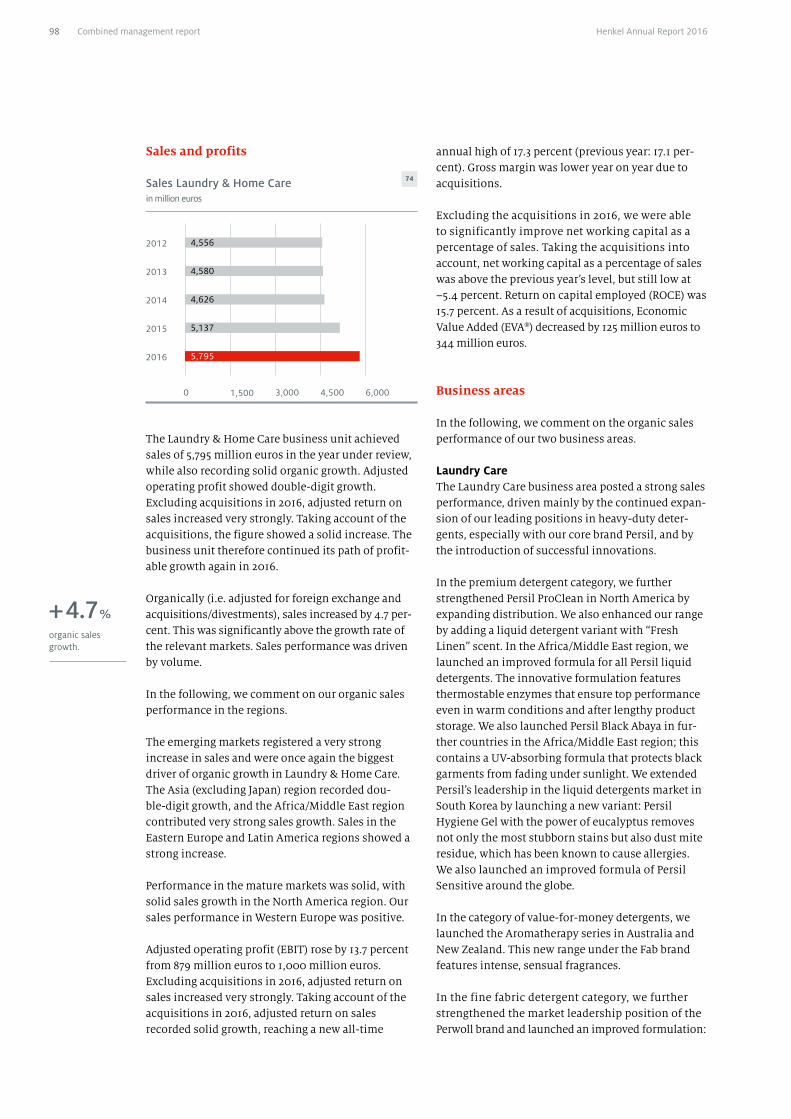
annual high of 17.3 percent (previous year: 17.1 per-cent). Gross margin was lower year on year due to acquisitions.
Excluding the acquisitions in 2016, we were able to significantly improve net working capital as a percentage of sales. Taking the acquisitions into account, net working capital as a percentage of sales was above the previous year’s level, but still low at –5.4 percent. Return on capital employed (ROCE) was 15.7 percent. As a result of acquisitions, Economic Value Added (EVA®) decreased by 125 million euros to 344 million euros.
Business areas
In the following, we comment on the organic sales performance of our two business areas.
Laundry CareThe Laundry Care business area posted a strong sales performance, driven mainly by the continued expan-sion of our leading positions in heavy-duty deter-gents, especially with our core brand Persil, and by the introduction of successful innovations.
In the premium detergent category, we further strengthened Persil ProClean in North America by expanding distribution. We also enhanced our range by adding a liquid detergent variant with “Fresh Linen” scent. In the Africa/Middle East region, we launched an improved formula for all Persil liquid detergents. The innovative formulation features thermostable enzymes that ensure top performance even in warm conditions and after lengthy product storage. We also launched Persil Black Abaya in fur-ther countries in the Africa/Middle East region; this contains a UV-absorbing formula that protects black garments from fading under sunlight. We extended Persil’s leadership in the liquid detergents market in South Korea by launching a new variant: Persil Hygiene Gel with the power of eucalyptus removes not only the most stubborn stains but also dust mite residue, which has been known to cause allergies. We also launched an improved formula of Persil Sensitive around the globe.
In the category of value-for-money detergents, we launched the Aromatherapy series in Australia and New Zealand. This new range under the Fab brand features intense, sensual fragrances.
In the fine fabric detergent category, we further strengthened the market leadership position of the Perwoll brand and launched an improved formulation:
2012
2013
2014
2015
2016
1,500 3,000 4,500 6,0000
4,580
4,626
5,137
5,795
Sales Laundry & Home Care 74
in million euros
4,556
Sales and profits
organic sales growth.
+ 4.7 %
The Laundry & Home Care business unit achieved sales of 5,795 million euros in the year under review, while also recording solid organic growth. Adjusted operating profit showed double-digit growth. Excluding acquisitions in 2016, adjusted return on sales increased very strongly. Taking account of the acquisitions, the figure showed a solid increase. The business unit therefore continued its path of profit-able growth again in 2016.
Organically (i.e. adjusted for foreign exchange and acquisitions/divestments), sales increased by 4.7 per-cent. This was significantly above the growth rate of the relevant markets. Sales performance was driven by volume.
In the following, we comment on our organic sales performance in the regions.
The emerging markets registered a very strong increase in sales and were once again the biggest driver of organic growth in Laundry & Home Care. The Asia (excluding Japan) region recorded dou-ble-digit growth, and the Africa/Middle East region contributed very strong sales growth. Sales in the Eastern Europe and Latin America regions showed a strong increase.
Performance in the mature markets was solid, with solid sales growth in the North America region. Our sales performance in Western Europe was positive.
Adjusted operating profit (EBIT) rose by 13.7 percent from 879 million euros to 1,000 million euros. Excluding acquisitions in 2016, adjusted return on sales increased very strongly. Taking account of the acquisitions in 2016, adjusted return on sales recorded solid growth, reaching a new all-time
Combined management report98 Henkel Annual Report 2016
investments in property, plant and equipment.
€ 210 m
Perwoll Renew 3D. The new formula rejuvenates colors in three dimensions: intensity, color accuracy and brightness. New Perwoll Renew 3D has been introduced in more than 30 countries throughout Europe and Latin America.
In the fabric softeners category, we improved the for-mulations of the variants available under the Vernel and Silan brands. As a result, the concentrates now keep laundry fresh and fragrant for up to ten weeks. The formula and fragrant appeal of the successful Soft & Oils range were further improved. We also added a new variant – Inspiring Orange Oil featuring a seductive fragrance – to the Soft & Oils range.
The pre-wash category provided further growth stim-ulus. For example, we started marketing Dylon – our internationally leading brand for fabric dyes – in additional countries. We also introduced our Colour Catcher sheets with their new 6 Protect formula in various European countries. Colour Catcher sheets have a water-soluble layer containing active stain removers to enhance washing performance even at 30 degrees Celsius.
Home CareSales in the Home Care business area were solid in 2016, driven mainly by the sustained success of our WC products. Hand dishwashing products also made an important contribution.
In WC products, we optimized the formula of our products sold under the Bref Power Aktiv brand. Bref Power Aktiv is number one in the WC rim block segment of our active markets. The products in the range are now available with an innovative “power core” loaded with 40 percent more perfume than the outer layer – for a longer-lasting, fresh fragrance boost. The new formula has been introduced in more than 60 countries worldwide. We also launched a new Power Aktiv variant in Eastern and Western Europe, and in South Korea, with Odor Stop technol-ogy. This special technology minimizes unpleasant odors to ensure a fresh, fragrant smell.
Nine months before a corresponding EU Regulation became applicable at the start of 2017, we introduced new Somat Phosphate-free in the automatic dish-washing category throughout Europe – with no phos-phates but with the usual top Somat performance. The new, patented formula is remarkable for its opti-mal combination of environmental compatibility and powerful cleaning performance.
We also introduced a new Somat dishwasher cleaner, the first and only one of its kind in the marketplace that can be used during a dishwashing cycle. This innovation saves both water and energy, thus con-tributing to sustainability.
In the hand dishwashing category, we launched an improved formula under the Pril brand in Europe. For the first time, new Pril Double Decruster features two enzymes and impressively removes even the most stubborn residue. The product is also fitted with an innovative flip-top cap that can be opened and closed with just one hand.
In the household cleaners category, we launched our successful spray surface cleaners in the countries around the Persian Gulf and in South Korea. Their innovative formulas act immediately on even stub-born stains, removing them effortlessly without leav-ing any residue. The products also have a pleasantly fresh smell.
In the insect control category, we launched two prod-ucts under the licensed Vape brand in Italy which are formulated with up to 90-percent natural ingredi-ents: one plug-in and one insect control lotion.
In our air fresheners category, we introduced a new range of sensitive fragrances featuring three different variants and types of product under the Renuzit brand in the USA.
Capital expenditures
In 2016, our capital expenditures for property, plant and equipment amounted to 210 million euros fol-lowing 217 million euros in 2015. Investments focused on expanding production capacity, enhanc-ing plant safety and quality systems, on innovations, and on optimizing our production processes. The biggest single investment was at our site in Düssel-dorf where Henkel expanded its largest automatic high bay warehouse.
Combined management report 99Henkel Annual Report 2016
29 Corporate governance52 Shares and bonds57 Fundamental principles
of the Group63 Economic report
100 Henkel AG & Co. KGaA (condensed version according to the German Commercial Code [HGB])
104 Risks and opportunities report112 Forecast
Henkel AG & Co. KGaA (condensed version according to the German Commercial Code [HGB])*
The annual financial statements of Henkel AG & Co.KGaA have been prepared in accordance with the rules and regulations of the German Commercial Code [HGB] and the German Stock Corporation Act [AktG]. The provisions of the German Accounting Directive Implementation Act [BilRUG] were applied for the first time in 2016. Deviations from the International Financial Reporting Standards (IFRS) applicable to the Group arise particularly with respect to the methods of recognition and measurement of intangible assets, financial instruments and provisions.
Operational activities
Henkel AG & Co. KGaA is operationally active in the three business units Adhesive Technologies, Beauty Care and Laundry & Home Care, as well as being the parent company of the Henkel Group. As such it is responsible for defining and pursuing Henkel’s corporate objectives and also for the management, control and monitoring of Group-wide activities, including risk management and the allocation of resources. As of year-end 2016, some 8,000 people were employed at Henkel AG & Co. KGaA.
The operating business of Henkel AG & Co. KGaA represents only a portion of the business activity of the entire Henkel Group and is managed across the Group by the business units, particularly on the basis of the performance indicators organic sales growth, adjusted return on sales (EBIT) and adjusted earnings per preferred share. Only the Group approach can provide complete insight into these key financials (see the discussion of the management system and performance indicators applicable to the Henkel Group on page 62).
The net assets, financial position and results of oper-ations of Henkel AG & Co. KGaA are influenced both by its own operating activity and by the operating activity of its subsidiaries on the basis of their divi-dend distributions. Thus the financial situation of Henkel AG & Co. KGaA generally corresponds to that of the Group as a whole, which is discussed in the section “Review of overall business performance” on page 64.
Results of operations
Sales and profitsBusiness performance at Henkel AG & Co. KGaA was solid in fiscal 2016, characterized by the reorganiza-tion of our supply chain activities within one glob-ally active corporation, and by a high level of com-petitive intensity.
At 3,676 million euros, sales of Henkel AG & Co. KGaA in 2016 were 8.0 percent lower year on year. As indi-cated in our guidance, the reorganization of our sup-ply chain activities into one globally active company resulted in a strong decline in sales with Group com-panies. In addition the sales figure for 2015 included 258 million euros from the sale of inventories to the global supply chain company that was not repeated in 2016. The negative effects on sales were, however, partly offset by application of the BilRUG regula-tions, which resulted in licensing income of 456 mil-lion euros being reclassified from other operating income to sales in 2016. In terms of financial result and unappropriated profit, we exceeded our forecast for 2016 of merely flat development. This improve-ment was mainly due to the lower interest expense for pension obligations and higher income from the financial assets held in the plan assets.
In fiscal 2016, the Adhesive Technologies business unit generated sales of 1,032 million euros, below the figure of the previous year. This decline in sales was driven in particular by the decrease in sales to affili-ated companies following the reorganization of the supply chain activities. In addition, the sales figure for 2015 includes a one-time gain of 114 million euros from the sale of inventories to the global supply chain company. The merger with Novamelt GmbH at the start of 2016 resulted in positive exter-nal sales growth.
The Beauty Care business unit achieved sales of 540 million euros in 2016, representing a decrease versus 2015. The main driver of this decline in sales was the relocation of export business with affiliated companies to the global supply chain company. In addition, the sale of inventories to the global supply chain company accounted for 75 million euros of sales in 2015, while there were no such transactions in fiscal 2016.
The Laundry & Home Care business unit generated sales of 928 million euros in 2016, which is below the figure for 2015. Positive domestic sales performance only partially offset the decline in sales relating to the
* The full financial statements of Henkel AG & Co. KGaA with the auditor’s unqualified opinion are filed with the commercial regis-ter and accessible on the internet at www.henkel.com/reports.
Combined management report100 Henkel Annual Report 2016
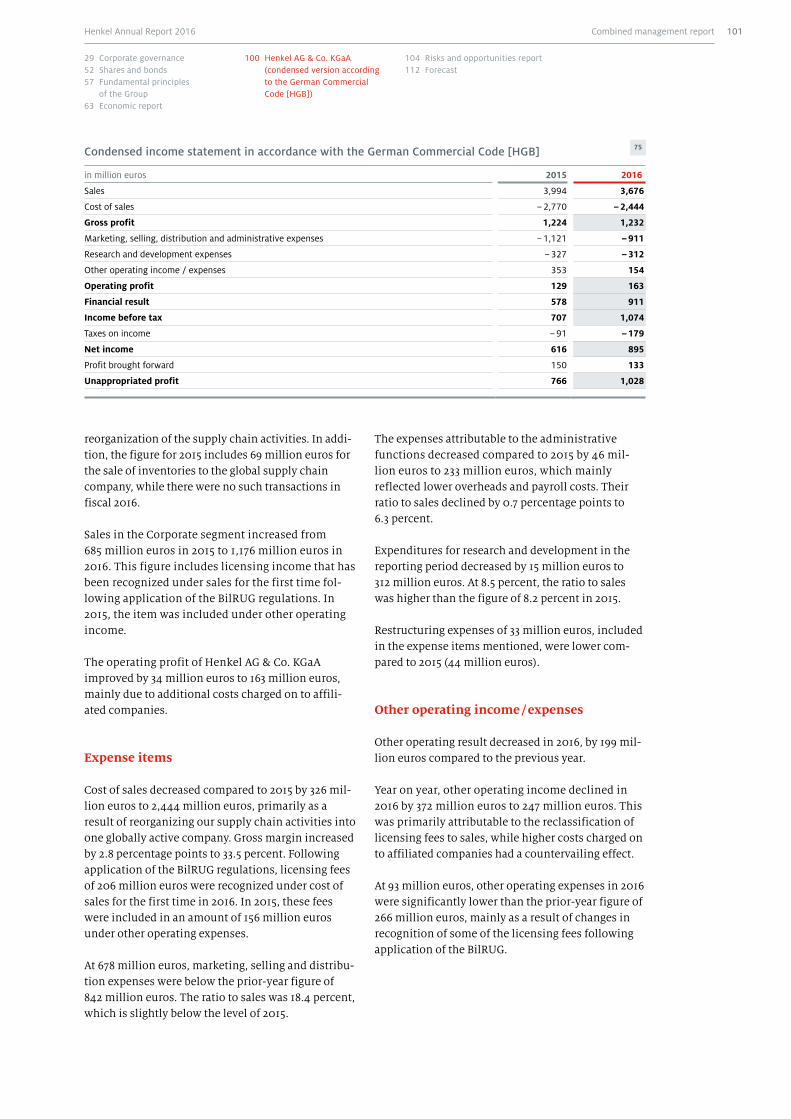
reorganization of the supply chain activities. In addi-tion, the figure for 2015 includes 69 million euros for the sale of inventories to the global supply chain company, while there were no such transactions in fiscal 2016.
Sales in the Corporate segment increased from 685 million euros in 2015 to 1,176 million euros in 2016. This figure includes licensing income that has been recognized under sales for the first time fol-lowing application of the BilRUG regulations. In 2015, the item was included under other operating income.
The operating profit of Henkel AG & Co. KGaA improved by 34 million euros to 163 million euros, mainly due to additional costs charged on to affili-ated companies.
Expense items
Cost of sales decreased compared to 2015 by 326 mil-lion euros to 2,444 million euros, primarily as a result of reorganizing our supply chain activities into one globally active company. Gross margin increased by 2.8 percentage points to 33.5 percent. Following application of the BilRUG regulations, licensing fees of 206 million euros were recognized under cost of sales for the first time in 2016. In 2015, these fees were included in an amount of 156 million euros under other operating expenses.
At 678 million euros, marketing, selling and distribu-tion expenses were below the prior-year figure of 842 million euros. The ratio to sales was 18.4 percent, which is slightly below the level of 2015.
The expenses attributable to the administrative functions decreased compared to 2015 by 46 mil-lion euros to 233 million euros, which mainly reflected lower overheads and payroll costs. Their ratio to sales declined by 0.7 percentage points to 6.3 percent.
Expenditures for research and development in the reporting period decreased by 15 million euros to 312 million euros. At 8.5 percent, the ratio to sales was higher than the figure of 8.2 percent in 2015.
Restructuring expenses of 33 million euros, included in the expense items mentioned, were lower com-pared to 2015 (44 million euros).
Other operating income / expenses
Other operating result decreased in 2016, by 199 mil-lion euros compared to the previous year.
Year on year, other operating income declined in 2016 by 372 million euros to 247 million euros. This was primarily attributable to the reclassification of licensing fees to sales, while higher costs charged on to affiliated companies had a countervailing effect.
At 93 million euros, other operating expenses in 2016 were significantly lower than the prior-year figure of 266 million euros, mainly as a result of changes in recognition of some of the licensing fees following application of the BilRUG.
Condensed income statement in accordance with the German Commercial Code [HGB] 75
in million euros 2015 2016
Sales 3,994 3,676
Cost of sales – 2,770 – 2,444
Gross profit 1,224 1,232
Marketing, selling, distribution and administrative expenses – 1,121 – 911
Research and development expenses – 327 – 312
Other operating income / expenses 353 154
Operating profit 129 163
Financial result 578 911
Income before tax 707 1,074
Taxes on income – 91 – 179
Net income 616 895
Profit brought forward 150 133
Unappropriated profit 766 1,028
Combined management report 101Henkel Annual Report 2016
29 Corporate governance52 Shares and bonds57 Fundamental principles
of the Group63 Economic report
100 Henkel AG & Co. KGaA (condensed version according to the German Commercial Code [HGB])
104 Risks and opportunities report112 Forecast
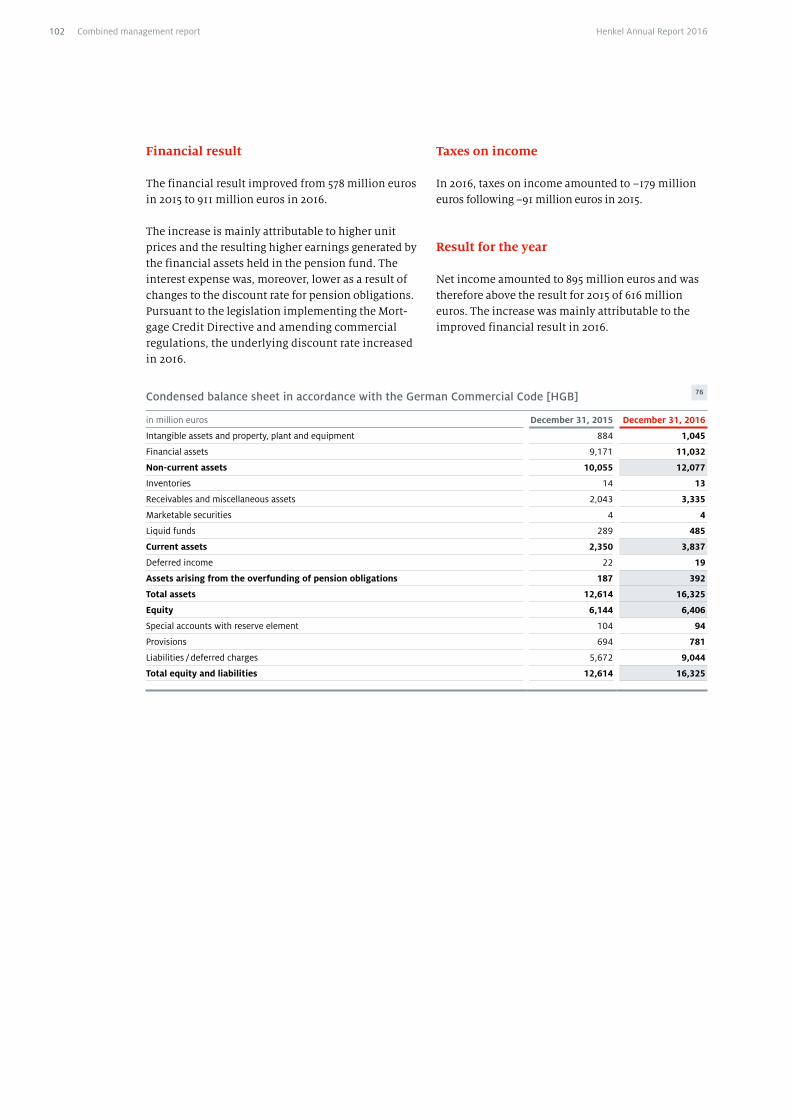
Financial result
The financial result improved from 578 million euros in 2015 to 911 million euros in 2016.
The increase is mainly attributable to higher unit prices and the resulting higher earnings generated by the financial assets held in the pension fund. The interest expense was, moreover, lower as a result of changes to the discount rate for pension obligations. Pursuant to the legislation implementing the Mort-gage Credit Directive and amending commercial regulations, the underlying discount rate increased in 2016.
Condensed balance sheet in accordance with the German Commercial Code [HGB] 76
in million euros December 31, 2015 December 31, 2016
Intangible assets and property, plant and equipment 884 1,045
Financial assets 9,171 11,032
Non-current assets 10,055 12,077
Inventories 14 13
Receivables and miscellaneous assets 2,043 3,335
Marketable securities 4 4
Liquid funds 289 485
Current assets 2,350 3,837
Deferred income 22 19
Assets arising from the overfunding of pension obligations 187 392
Total assets 12,614 16,325
Equity 6,144 6,406
Special accounts with reserve element 104 94
Provisions 694 781
Liabilities / deferred charges 5,672 9,044
Total equity and liabilities 12,614 16,325
Taxes on income
In 2016, taxes on income amounted to –179 million euros following –91 million euros in 2015.
Result for the year
Net income amounted to 895 million euros and was therefore above the result for 2015 of 616 million euros. The increase was mainly attributable to the improved financial result in 2016.
Combined management report102 Henkel Annual Report 2016

Net assets and financial position
As of December 31, 2016, the total assets of Henkel AG & Co. KGaA increased compared to year-end 2015 by 3,711 million euros to 16,325 million euros.
Non-current assets increased by 2,022 million euros compared to 2015, to 12,077 million euros. The increase in financial assets is primarily due to our acquisitions and various capital measures involving affiliated companies. In addition, a loan was issued to a US subsidiary in 2016.
Current assets increased in 2016 from 2,350 million euros to 3,837 million euros, primarily as a result of higher receivables from affiliated companies.
At 392 million euros, overfunding from offsetting the plan assets against the pension obligations was sig-nificantly higher year on year.
Equity increased from 6,144 million euros to 6,406 million euros. Provisions increased by 87 mil-lion euros to 781 million euros. The balance of pen-sion obligations and plan assets is reported in assets due to overfunding.
For details of issued capital and treasury stock, please refer to the disclosures in the notes to the con-solidated financial statements of Henkel AG & Co. KGaA.
Liabilities and deferred charges rose overall in 2016 by 3,372 million euros compared to 2015, mainly due to increased borrowings used to fund our acquisitions.
For an overview of the financing and capital man-agement of Henkel AG & Co. KGaA, please refer to the information about the Henkel Group on pages 72 and 73.
Risks and opportunities
The business performance of Henkel AG & Co. KGaA is essentially subject to the same risks and opportu-nities as that of the Henkel Group. With respect to the risks of its subsidiaries, Henkel AG & Co. KGaA is generally exposed in proportion to its shareholding in each case.
Due to the different discount rates for pension obli-gations under the German Commercial Code [HGB] and IFRS, the conclusion drawn from the risk assess-ment for the separate financial statements of Henkel AG & Co. KGaA differs from that of the Group. We assess the potential financial impact of this risk for Henkel AG & Co. KGaA as “major.”
Additional information regarding risks and opportu-nities and the risk management system can be found on the following pages 104 to 111.
Forecast
The performance of Henkel AG & Co. KGaA in its function as an operating holding company is influ-enced primarily by the development and dividend distributions of the companies in which it has shareholdings. We expect sales in 2017 to be on a par with the figure for 2016. The positive performance reported for the Group also impacts Henkel AG & Co. KGaA through dividend payments from subsid-iaries. Assuming continued positive development of the financial result, we expect the unappropriated profit generated in 2017 by Henkel AG & Co. KGaA to be flat or to increase slightly. This will enable our shareholders to participate to a reasonable extent in the Group’s net income, with retained earnings also available for utilization if necessary.
The forecast for the Henkel Group can be found on pages 112 and 113.
Combined management report 103Henkel Annual Report 2016
29 Corporate governance52 Shares and bonds57 Fundamental principles
of the Group63 Economic report
100 Henkel AG & Co. KGaA (condensed version according to the German Commercial Code [HGB])
104 Risks and opportunities report112 Forecast

Risks and opportunities report
Risks and opportunities
In the pursuit of our business activities, Henkel is exposed to multiple risks inherent in the global mar-ket economy. We deploy an array of effective moni-toring and control systems aligned to identifying risks at an early stage, evaluating the exposure, and introducing effective countermeasures. We have incorporated these instruments within a risk man-agement system as described below.
Entrepreneurial activity also involves identifying and exploiting opportunities as means of securing and extending the corporation’s competitiveness. The reporting aspect of our risk management system, however, does not encompass entrepreneurial opportunities. Early and regular identification, anal-ysis and exploitation of opportunities are performed at the Group level and within the individual business units. This is a fundamental component of our strat-egy. We perform in-depth analysis of the markets and our competitors, and study the relevant cost vari-ables and key success factors.
Risk management system
The risk management system at Henkel is integrated into the comprehensive planning, controlling, and reporting systems used in the subsidiaries, in the business units, and at Group level. Our early warning system and Internal Audit function are also import-ant components of our risk management system. Within the corporate governance framework, our internal control and compliance management sys-tems support our risk management capability. The risk reporting system encompasses the systematic identification, evaluation, documentation and com-munication of risks. We have defined the principles, processes and responsibilities relating to risk man-agement in a corporate standard that is binding on the Henkel Group. With the continuous development of our corporate standards and systems, we take into account updated findings.
Within our risk strategy framework, the assumption of calculated risk is an intrinsic part of our business. However, risks that endanger the existence of the company must be avoided. When it is not possible to avoid these critical risks, they must be reduced or transferred, for example through insurance. Risks are
controlled and monitored at the level of the subsid-iaries, the business units, and the Group. Risk man-agement is thus performed with a holistic, integra-tive approach to the systematic handling of risks.
We understand risks as potential future develop-ments or events that could lead to negative devia-tions from our guidance. Risks with a probability of occurrence of over 50 percent are taken into account in our guidance and short-term planning. As a rule, we estimate risks for the one-year forecast period.
The annual risk reporting process begins with identi-fying material risks using checklists based on defined operating (for example procurement and production) and functional (for example information technology and human resources) risk categories. We evaluate the risks in a two-stage process accord-ing to the probability of occurrence and potential loss. Included in the risk report are risks with a loss potential of at least 1 million euros or 10 percent of the net external sales of a country, where the proba-bility of occurrence is considered greater than zero.
The first step entails determining gross risk to the extent that this is possible. We then calculate the net risk, taking countermeasures into account. Initially, risks are compiled on a decentralized, per-country basis, with the assistance of regional coordinators. The locally collated risks are then analyzed by experts in the business units and corporate func-tions. In particular areas such as Corporate Treasury, risks are determined with the support of sensitivity analyses including value-at-risk computations. Risk analyses are then prepared for the respective execu-tive committees of the business units and corporate functions, and finally assigned to an area-specific risk inventory. The risk situation is subsequently reported to our Compliance & Risk Committee, the Management Board and the various supervising boards. Material unforeseen changes are reported immediately to the CFO and the Compliance & Risk Committee. Corporate Accounting is responsible for coordinating the overall process and analyzing the inventoried exposures.
The risk reporting process is supported by an intranet-based database which ensures transparent communication throughout the entire Group. Our Internal Audit function regularly reviews the quality and function of our risk management system. Within the framework of the 2016 audit of our annual financial statements, our external auditor examined the structure and function of our risk early
Combined management report104 Henkel Annual Report 2016
warning system in accordance with Section 317 (4) of the German Commercial Code [HGB] and confirmed its compliance.
The following describes the main features of the internal control and risk management system in relation to our accounting processes, in accordance with Section 315 (2) no. 5 HGB. Corresponding with the definition of our risk management system, the objective of our accounting processes lies in the identification, evaluation and management of all risks that jeopardize the regulatory preparation of our annual and consolidated financial statements. Accordingly, the internal control system’s function is to implement relevant principles, procedures and controls so as to ensure the financial statement clos-ing process is regulatory compliant. Within the orga-nization of the internal control system, the Manage-ment Board assumes overriding responsibility at Group level. The duly coordinated subsystems of the internal control system lie within the responsibility of the Corporate Accounting, Controlling, Corporate Treasury, Compliance and Regional Finance func-tions. Within these functions, there are a number of integrated monitoring and control levels. These are assessed by regular and comprehensive effectiveness tests performed by our Internal Audit function. Of the multifaceted control processes incorporated into the accounting process, several are important to highlight.
The basis for all our accounting processes is pro-vided by our corporate standard “Accounting,” which contains detailed accounting and reporting instruc-tions covering all material circumstances, including clear procedures for inventory valuation or how transfer prices applicable for intra-group transac-tions should be determined. This corporate standard is binding on the entire Group and is regularly updated and approved by the CFO. The local Presi-dents and Heads of Finance of all consolidated sub-sidiaries must confirm their compliance with this corporate standard on an annual basis.
Further globally binding procedural instructions affecting our accounting practice are contained in our corporate standards “Treasury” and “Invest-ments.” Through appropriate organizational mea-sures in conjunction with restrictive access to our information systems, we ensure segregation of duties in our accounting systems between trans-action entry on the one hand, and checking and approval on the other. Documentation relating to the operational accounting and closing processes
ensures that important tasks – such as the reconci-liation of receivables and payables on the basis of account balance confirmations – are clearly assigned. Additionally, binding authorization regulations exist governing the approval of contracts, credit notes and the like, with strict adherence to the principle of dual control as a mandatory requirement. This is also stipulated in our Group-wide corporate standards.
The significant risks for Henkel and the correspond-ing controls with respect to the regulatory prepara-tion of our annual and consolidated financial state-ments are collated in a central documentation pack. This documentation is reviewed and updated annu-ally by the respective process owners. The estab-lished systems are regularly reviewed with regard to their improvement and optimization potential. We consider these systems to be appropriate and effective.
The accounting activities for subsidiaries included in the consolidated financial statements are performed either locally by the subsidiary or through a shared service center, taking the corporate standards into account. The individual subsidiaries’ financial state-ments are transferred to our central consolidation system and checked at corporate level for correct-ness. After all consolidation steps have been com-pleted, the consolidated financial statements are prepared by Corporate Accounting in consultation with the specialist departments. Preparation of the combined management report is coordinated by Investor Relations in cooperation with each business unit and corporate function. The Management Board then compiles the consolidated financial statements and annual financial statements of Henkel AG & Co. KGaA, and the combined management report for the Group, and subsequently presents these documents to the Supervisory Board for approval.
Combined management report 105Henkel Annual Report 2016
29 Corporate governance52 Shares and bonds57 Fundamental principles
of the Group63 Economic report
100 Henkel AG & Co. KGaA (condensed version according to the German Commercial Code [HGB])
104 Risks and opportunities report112 Forecast
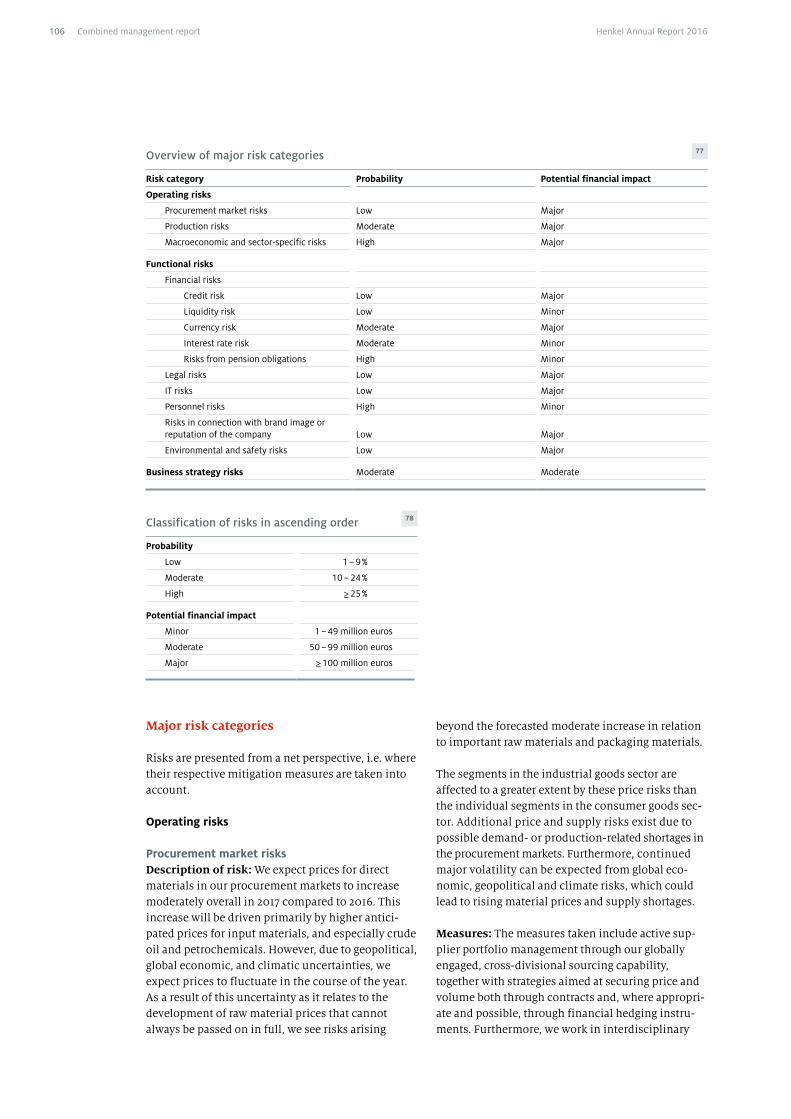
Overview of major risk categories 77
Risk category Probability Potential financial impact
Operating risks
Procurement market risks Low Major
Production risks Moderate Major
Macroeconomic and sector-specific risks High Major
Functional risks
Financial risks
Credit risk Low Major
Liquidity risk Low Minor
Currency risk Moderate Major
Interest rate risk Moderate Minor
Risks from pension obligations High Minor
Legal risks Low Major
IT risks Low Major
Personnel risks High Minor
Risks in connection with brand image or reputation of the company Low Major
Environmental and safety risks Low Major
Business strategy risks Moderate Moderate
Classification of risks in ascending order 78
Probability
Low 1 – 9 %
Moderate 10 – 24 %
High ≥ 25 %
Potential financial impact
Minor 1 – 49 million euros
Moderate 50 – 99 million euros
Major ≥ 100 million euros
Major risk categories
Risks are presented from a net perspective, i.e. where their respective mitigation measures are taken into account.
Operating risks
Procurement market risksDescription of risk: We expect prices for direct materials in our procurement markets to increase moderately overall in 2017 compared to 2016. This increase will be driven primarily by higher antici-pated prices for input materials, and especially crude oil and petrochemicals. However, due to geopolitical, global economic, and climatic uncertainties, we expect prices to fluctuate in the course of the year. As a result of this uncertainty as it relates to the development of raw material prices that cannot always be passed on in full, we see risks arising
beyond the forecasted moderate increase in relation to important raw materials and packaging materials.
The segments in the industrial goods sector are affected to a greater extent by these price risks than the individual segments in the consumer goods sec-tor. Additional price and supply risks exist due to possible demand- or production- related shortages in the procurement markets. Furthermore, continued major volatility can be expected from global eco-nomic, geopolitical and climate risks, which could lead to rising material prices and supply shortages.
Measures: The measures taken include active sup-plier portfolio management through our globally engaged, cross-divisional sourcing capability, together with strategies aimed at securing price and volume both through contracts and, where appropri-ate and possible, through financial hedging instru-ments. Furthermore, we work in interdisciplinary
Combined management report106 Henkel Annual Report 2016
teams within Research and Development, Supply Chain Management and Purchasing on devising alternative formulations and packaging forms so as to be able to respond flexibly to unforeseen fluctua-tions in raw material prices. We also avoid becoming dependent on individual suppliers to better secure the constant supply of the goods and services that we require. Finally, close collaboration with our strate-gic suppliers plays an exceptionally important role in our risk management. Further details regarding the assessment of supplier financial stability can be found in the section on “Procurement” on pages 77 to 79. The basis for our risk management approach is a comprehensive procurement information system aimed at ensuring permanent transparency with respect to our purchasing volumes.
Impact: Low probability rating, possible major impact on our earnings guidance.
Production risksDescription of risk: Henkel faces production risks in the event of low capacity utilization due to vol-ume decreases and unplanned operational interrup-tions, especially at our single-source sites.
Measures: We can offset the negative effects of pos-sible production outages through flexible production control and, where economically viable, insurance policies. Such production risks are minimized by ensuring high employee qualification, clearly defined safety standards, and regular plant and equipment maintenance. Capital expenditure deci-sions on property, plant and equipment are made in accordance with defined, differentiated responsibil-ity procedures and approval processes. They incor-porate all relevant specialist functions and are regu-lated in an internal corporate standard. Investments are analyzed in advance on the basis of detailed risk aspects. Further audits accompanying projects pro-vide the foundation for project management and risk reduction.
Impact: Moderate probability rating, possible major impact on our earnings guidance.
Macroeconomic and sector-specific risksDescription of risk: We remain exposed to macro-economic risks emanating from the uncertainties of the current geopolitical and economic environment. We currently see geopolitical risk arising in connec-tion with the increased number of conflict zones. A decline in the macroeconomic environment poses a risk to the industrial sector in particular. A downturn in consumer spending is relevant for the consumer goods segments. A further significant risk is posed by an increasingly competitive environment, as this could result in stronger price and promotional pres-sures in the consumer goods sector. As consolidation in the retail sector continues and private labels occupy a growing share of the market, crowding-out competition in the consumer goods sector could intensify. The risk of product substitution inherent in this could, in principle, affect all business units. Technological change associated with digitalization may involve risks for the success of our products and processes.
Measures: We focus on continuously strengthening our brands (see separate risk description on page 110) and consistently developing further innovations. We consider innovative products and processes to be a significant success factor for our company, enabling us to differentiate ourselves from the competition. We also pursue specific sales and marketing initia-tives, for example advertising and promotional activ-ities. In addition, we have the capability to react quickly to potential sales declines through flexible production control.
Impact: High probability rating, possible major impact on our sales and earnings guidance.
Functional risks
Financial risksDescription of risk: Henkel is exposed to financial risk in the form of credit risks, liquidity risks, cur-rency risks, interest rate risks, and risks arising from pension obligations.
Combined management report 107Henkel Annual Report 2016
29 Corporate governance52 Shares and bonds57 Fundamental principles
of the Group63 Economic report
100 Henkel AG & Co. KGaA (condensed version according to the German Commercial Code [HGB])
104 Risks and opportunities report112 Forecast
For the description of credit risks, liquidity risks, currency risks and interest rate risks, please refer to the notes to the consolidated financial statements on pages 160 to 165. For the risks arising from our pen-sion obligations, please see pages 147 to 149.
Measures: Risk-mitigating measures and the man-agement of these risks are also described in the notes to the consolidated financial statements on the pages mentioned.
Impact: We classify financial risks as follows:• Credit risk with a low probability of a major impact
on our earnings guidance • Liquidity risk with a low probability of a minor
impact on our earnings guidance• Currency risk with a moderate probability of a
major impact on our earnings guidance• Interest rate risk with a moderate probability of a
minor impact on our earnings guidance• Risks arising from our pension obligations with a
high probability of a minor impact on our earnings guidance, and with a moderate probability of a major impact on our equity
Legal and regulatory risksDescription of risk: As a globally active corporation we are exposed, in the course of our ordinary busi-ness activities, to a range of risks relating to litiga-tions and other actions, including government agency proceedings in which we are currently involved or may become involved in the future. These risks arise, in particular, in the fields of prod-uct liability, product deficiency, competition and cartel law, infringement of proprietary rights, patent law, tax law, environmental protection and legacy remediation. We cannot rule out the likelihood of negative rulings on current litigations and further litigations being initiated in the future. Legal uncer-tainty in some regions could also limit our ability to assert our rights.
Our business is subject to various national rules and regulations and – within the European Union (EU) – increasingly to harmonized laws applicable throughout the EU. In addition, some of our opera-tions are subject to rules and regulations derived from approvals, licenses, certificates or permits. Our manufacturing operations are bound by rules and regulations with respect to the registration, evalua-tion, usage, storage, transportation and handling of certain substances and also in relation to emissions, wastewater, effluent and other waste. The construc-tion and operation of production facilities and other plant and equipment are governed by framework rules and regulations, including those relating to leg-
acy remediation. Violation of such regulations may lead to legal proceedings or compromise our future business activities.
Changes to the regulatory environment in our rele-vant markets could influence our business activities, and thus adversely affect our assets, financial posi-tion and results of operations. Such changes might involve import and export controls, customs or other trade regulations, or pricing and foreign exchange restrictions.
Equally, as a globally active company, we maintain business relations with customers in countries that are subject to export control legislation, embargoes, economic sanctions or other forms of trade restric-tion. Changes to these regulations, new or extended sanctions, or corresponding initiatives by institu-tional investors or non-governmental organizations may result in restrictions being imposed on our busi-ness activities in these countries or, indirectly, in other countries, or may prevent us from acquiring or keeping customers and suppliers.
Measures: Our internal standards, guidelines, codes of conduct, and training measures are geared to ensuring compliance with the aforementioned statu-tory requirements and, for example, safeguarding our manufacturing facilities and products. These requirements have also been incorporated into our management systems and are regularly audited. Ensuring compliance with laws and regulations is an integral component of our business processes. This includes the early monitoring and evaluation of rele-vant statutory and regulatory requirements and changes. Henkel has further established a Group-wide compliance organization with locally and regionally responsible compliance officers led by a globally responsible General Counsel & Chief Com-pliance Officer (details can be found in the corporate governance report on pages 29 to 38). In addition, our corporate legal department maintains constant con-tact with local counsel. Current proceedings and potential risks are recorded in a separate reporting system. For certain legal risks, we have concluded insurance policies that are standard for the industry and that we consider to be appropriate. However, the outcome of proceedings is inherently difficult to foresee, especially in cases in which the claimant is seeking substantial or unspecified damages. In view of this, we are unable to predict what obligations may arise from such litigations. Consequently, major losses may result from litigations and proceedings that are not covered by our insurance policies or pro-visions. Potential damage to our reputation is not covered by insurance, nor is there any guarantee that
Combined management report108 Henkel Annual Report 2016
Henkel will acquire adequate insurance cover at rea-sonable terms and conditions in future.
Impact: Low probability rating, possible major impact on our earnings guidance.
Information technology risksDescription of risk: Information technology has strategic significance for Henkel. Our business pro-cesses rely to a great extent on internal and external IT services, applications, networks, and infrastruc-ture systems. The failure or disruption of critical IT services and the manipulation or loss of data consti-tute material risks for Henkel. The failure of com-puter networks or disruption of important IT appli-cations can impair critical business processes. The loss of confidential data, for example formulations, customer data or price lists, could benefit our com-petition. Henkel’s reputation could also be damaged by such loss.
Measures: The technical and organizational safe-guards for protecting information at Henkel are based on the international standards ISO 27001 and 27002. Major components include the classification of information, business processes, IT applications, and IT infrastructure safeguards with respect to con-fidentiality, availability, integrity, and data protec-tion requirements, as well as measures for avoiding risk. In addition, Henkel has put technical and orga-nizational measures in place to prevent, discover and defeat cyber attacks. As a member of Cyber Security Sharing and Analytics (CSSA) e.V., Henkel also main-tains regular contact with other major corporations to enable the early detection of threats and imple-mentation of effective countermeasures.
Our critical business processes operate through redundantly configured systems designed for high availability. Our data backup procedures reflect state-of-the-art technology and practice. We regularly review our restore and disaster recovery processes. We develop our systems using proven project man-agement and program modification procedures.
Access to buildings and areas containing IT systems, access to computer networks and applications, as well as user authorizations for our information sys-tems, are strictly limited to the minimum level nec-essary. For critical business processes, the required segregation of duties is enforced by technological means.
Our networks are protected against unauthorized external access where economically viable. Operat-ing systems and anti-virus software are automati-
cally updated to their latest version on a continual basis.
We inform and instruct our employees in the proper and secure use of information systems as part of their regular duties.
The implementation of our security measures is con-tinually reviewed by our Internal Audit function, other internal departments, and independent third parties.
Impact: Low probability rating, possible major impact on our earnings guidance.
Personnel risksDescription of risk: The motivation and the qualifi-cation of our employees are key drivers of Henkel’s business success. Therefore, it is strategically important to attract highly qualified professionals and executives and ensure they stay with the com-pany. In selecting and employing talent, we compete globally for qualified professionals and executives. In many of our markets, we see clear signs of increas-ingly tough competition for the most talented pro-fessionals and the impacts of demographic change. These developments expose us to the risk of losing valuable employees or of being unable to recruit rele-vant qualified professionals and executives.
Measures: We combat the risk of losing valuable employees through specifically devised personnel development programs and incentive systems. Sup-porting this is an established, thorough annual review process from which we derive individually tailored and future-viable qualification programs as well as performance-related remuneration systems. Further areas of our HR management focus include a global health management system and support for flexible work models to ensure better work-life flexibility.
We reduce the risk of not being able to recruit quali-fied professionals and executives by expanding our employer branding initiatives and through targeted cooperation with colleges and universities in all regions where we conduct business. Our attractive-ness as an employer is reinforced by our focus on promoting talent and specialized development programs.
Further information relating to our employees can be found on pages 74 to 77.
Impact: High probability rating, possible minor impact on our earnings guidance.
Combined management report 109Henkel Annual Report 2016
29 Corporate governance52 Shares and bonds57 Fundamental principles
of the Group63 Economic report
100 Henkel AG & Co. KGaA (condensed version according to the German Commercial Code [HGB])
104 Risks and opportunities report112 Forecast
Risks in connection with brand image or reputation of the companyDescription of risk: As a globally active corporation, Henkel is exposed to potential damage to its image in the event of negative reports in the media – including social media – regarding Henkel’s corpo-rate brand or individual product brands, particularly in the consumer goods sector. These could lead to a negative impact on sales.
Measures: We minimize these risks through the measures described under legal and regulatory risks (see pages 108 and 109). These are designed to ensure that our production facilities and products are safe. We also pursue a policy of pro-active public relations management that serves to reinforce the reputation of our corporate brand and individual product brands. These measures are supported by a global communication network, and international and local crisis management systems with regular train-ing sessions and crisis response planning.
Impact: Low probability rating, possible major impact on our sales and earnings guidance.
Environmental and safety risksDescription of risk: Henkel is a global manufactur-ing corporation and is therefore exposed to risks per-taining to the environment, safety, health, and social standards, manifesting in the form of personal injury, physical damage to goods, and reputational damage. Soil contamination and the associated remediation expense, as well as leakage or other technical failures, could give rise to direct costs for the corporation. Furthermore, indirect costs such as fines, claims for compensation or reputational dam-age may also be incurred.
Measures: We minimize these risks through the measures described under legal and regulatory risks (see pages 108 and 109), and through our auditing, advisory and training activities. We update these pre-ventive measures continuously in order to properly safeguard our facilities, assets and reputation. We ensure compliance with high technical standards, rules of conduct, and relevant statutory require-ments as a further means of preserving our assets, and that our corporate values – one of which is sus-tainability – are put into practice.
Impact: Low probability rating, possible major impact on our earnings guidance.
Business strategy risksDescription of risk: Business strategy risks can arise from our expectations for internal projects, acquisi-tions and strategic alliances failing to materialize. The associated capital expenditures may not gener-ate the originally anticipated value added due to internal or external influences. Individual projects could also be delayed or even halted by unforeseen events.
Measures: We combat these risks through compre-hensive project management. We limit exposure through financial viability assessments in the review, decision, and implementation phases. These assess-ments are performed by specialist departments, assisted by external consultants where appropriate. Project transparency and control are supported by our management systems.
Impact: Moderate probability rating, possible mod-erate impact on our earnings guidance.
Major opportunity categories
Entrepreneurial opportunities are identified and evaluated at Group level and in the individual busi-ness units, and duly incorporated into the strategy and planning processes. We understand the opportu-nities presented in the following as potential future developments or events that could lead to a positive deviation from our guidance. We also assess the probabilities of price-related procurement market and financial opportunities.
Procurement market opportunitiesDescription of opportunities: Countervailing the procurement market risks listed on pages 106 and 107, opportunities may also arise in which the influ-encing factors described in this section develop in a direction that is advantageous to Henkel.
Impact: Low probability rating, possible major impact on our earnings guidance.
Macroeconomic and sector-specific opportunitiesDescription of opportunities: Additional business opportunities would arise if the uncertain geopoliti-cal and macroeconomic situation in some regions, or the economic conditions in individual sectors, develop substantially better than expected.
Combined management report110 Henkel Annual Report 2016

Impact: The opportunities described could have a major impact on our sales and earnings guidance.
Financial opportunitiesDescription of opportunities: Countervailing the currency and interest rate risks indicated under financial risks, and the risks arising from pension obligations as described on pages 107 and 108, opportunities may also arise in which the influenc-ing factors described in this section develop in a direction that is advantageous to Henkel.
Impact: We classify financial opportunities as follows:• Currency opportunities with a high probability of a
major impact on our earnings guidance• Interest rate opportunities with a moderate proba-
bility of a minor impact on our earnings guidance• Opportunities arising from our pension obliga-
tions with a low probability of a minor impact on our earnings guidance, and with a moderate proba-bility of a major impact on our equity
Acquisition opportunitiesDescription of opportunities: Acquisitions are a key component of our strategy.
Impact: Large acquisitions could have a major impact on our earnings guidance.
Research and development opportunitiesDescription of opportunities: Opportunities aris-ing from our largely continuous innovation process are a key component of our strategy and are already accounted for in our guidance. There are additional opportunities in the event of product introductions that exceed our expectations of market acceptance, and in the development of exceptional innovations that have not yet been taken into account.
Impact: Innovations arising from future research and development could have a major impact on our sales and earnings guidance.
Risks and opportunities in summary
At the time this report was prepared, there were no identifiable risks related to future developments that could endanger the existence either of Henkel AG & Co. KGaA, or a material subsidiary included in the consolidation, or the Group, as a going concern. As we have no special-purpose vehicles, there is no risk that might originate from such a source.
Compared to the previous year, our expectation of the likelihood and/or of the possible financial impact of individual risk and opportunity categories has changed slightly. Overall, however, the risk and opportunities situation has not altered to any signifi-cant degree.
The system of risk categorization adopted by Henkel continues to indicate that the most significant expo-sure currently relates to the impact of macroeco-nomic and sector uncertainty together with financial risks, to which we are responding with the counter-measures described above. The Management Board remains confident that the earning power of the Group forms a solid foundation for future business development and provides the necessary resources to leverage our opportunities.
Combined management report 111Henkel Annual Report 2016
29 Corporate governance52 Shares and bonds57 Fundamental principles
of the Group63 Economic report
100 Henkel AG & Co. KGaA (condensed version according to the German Commercial Code [HGB])
104 Risks and opportunities report112 Forecast

Forecast
Macroeconomic development
Our assessment of future world economic develop-ment is based on data provided by IHS Global Insight.
Overview: moderate gross domestic product growth of approximately 3 percentGlobal economic growth is expected to remain no more than moderate in 2017. IHS expects gross domestic product to rise by approximately 3 percent.
The mature markets should grow by approximately 2 percent. The North American economy is expected to grow by approximately 2 percent, while Japan’s economy is forecasted to expand by approximately 1 percent. For Western Europe, IHS anticipates growth of approximately 1.5 percent.
The emerging markets are forecasted to achieve robust economic growth of approximately 4.5 per-cent in 2017, but developments are expected to vary widely between individual regions and countries. Economic output should increase by approximately 5.5 percent in Asia (excluding Japan), and by around 3 percent in the Africa/Middle East region. IHS expects positive performance of approximately 1 percent in Latin America in 2017. An increase of approximately 2 percent is forecasted for the Eastern Europe region.
Inflation: rise in global price levelsGlobal inflation of approximately 3.5 percent is predicted in 2017. While IHS expects a high degree of price stability for mature markets with a rise of approximately 2 percent, the inflation rate in emerging markets is forecasted to average around 5 percent.
Direct materials: increase in price levelsWe expect prices for raw materials, packaging and purchased goods and services to increase moderately compared to the previous year.
Currencies: continued high volatilityWe expect continued high volatility in the currency markets. We anticipate a slightly stronger average US dollar rate for 2017 compared to 2016. Conversely, major currencies in emerging markets could weaken.
Sector development
Consumption and the retail sector: growth of around 3 percentIHS predicts that global private consumption will increase by around 3 percent in 2017. Consumers in mature markets are likely to spend approximately 2 percent more than in the previous year. The emerg-ing markets should again demonstrate a somewhat higher propensity to spend, with a rise of approxi-mately 3.5 percent in 2017.
Industrial production index: growth of approximately 2.5 percentStarting in fiscal 2017, we will be using the industrial production index (IPX) as a reference for describing the market environment in which our Adhesive Technologies business unit operates. The index cov-ers the manufacturing, mining, utilities and con-struction sectors and is therefore an appropriate indicator for the market environment in which our industrial business operates.
Year on year, the industrial production index is expected to gain approximately 2.5 percent world-wide, with growth slightly below that of the world economy as a whole. Industrial production is fore-casted to expand by approximately 1.5 percent in the mature markets, and by approximately 4 percent in emerging markets.
Combined management report112 Henkel Annual Report 2016
Furthermore, we have the following expectations for 2017:• Restructuring expenses of 200 to 250 million euros• Investments in property, plant and equipment and
intangible assets of between 750 and 850 million euros
DividendsIn accordance with our dividend policy and depend-ing on the company’s asset and profit positions as well as its financial requirements, we expect a divi-dend payout by Henkel AG & Co. KGaA in the range of 25 percent to 35 percent of net income after non-con-trolling interests, and adjusted for exceptional items.
Capital expendituresIn fiscal 2017, we plan to increase our investments in property, plant and equipment and intangible assets to approximately 750 to 850 million euros. We intend to allocate our budget to expanding our businesses in emerging markets and mature markets in approxi-mately equal proportions. In line with our strategic priorities, considerable investments are planned in strengthening our innovation capabilities, and in expanding and further streamlining our production. Specific investments in IT infrastructure will drive the digitalization of our processes.
Outlook for the Henkel Group in 2017
We expect the Henkel Group to generate organic sales growth of 2 to 4 percent in fiscal 2017. Our expectation is that each business unit will generate organic sales growth within this range.
The starting point for our forecasted organic sales growth is our strong competitive position. We have consolidated and further developed this in recent years through our innovative strength, strong brands and leading market positions, as well as the quality of our portfolio.
We expect the contribution to the nominal sales growth of the Henkel Group from our acquisitions in 2016 to be in the mid-single-digit percentage range. The translation of sales in foreign currencies is expected to have a neutral or slightly negative effect.
In recent years we have introduced a number of mea-sures that have had a positive effect on our cost structure. Again this year, we intend to continue adapting our structures to constantly changing mar-ket conditions, and to maintain our strict cost disci-pline. Through optimization and standardization of processes, we can further improve our efficiency while simultaneously enhancing the quality of our customer service. Moreover, the optimization of our production and logistics networks will contribute to improving our cost structures.
These factors, together with the expected increase in sales, will have a positive effect on our earnings per-formance. For adjusted return on sales (EBIT), we anticipate an increase year on year to more than 17.0 percent. All three business units are expected to contribute to this positive development. We antici-pate an increase in adjusted earnings per preferred share of between 7 and 9 percent.
Combined management report 113Henkel Annual Report 2016
29 Corporate governance52 Shares and bonds57 Fundamental principles
of the Group63 Economic report
100 Henkel AG & Co. KGaA (condensed version according to the German Commercial Code [HGB])
104 Risks and opportunities report112 Forecast
116 Consolidated statement of financial position
118 Consolidated statement of income
118 Consolidated statement of comprehensive income
119 Consolidated statement of changes in equity
120 Consolidated statement of cash flows
121 Notes to the consolidated financial statements – Group segment report by business unit
122 Notes to the consolidated financial statements – Key financials by region
123 Notes to the consolidated financial statements – Accounting principles and methods applied in preparation of the consolidated financial statements
131 Notes to the consolidated financial statements – Notes to the consolidated statement of financial position
131 Intangible assets135 Property, plant and equipment137 Other financial assets137 Other assets138 Deferred taxes138 Inventories138 Trade accounts receivable139 Cash and cash equivalents139 Assets and liabilities held for sale139 Issued capital140 Capital reserve140 Retained earnings140 Other components of equity140 Non-controlling interests141 Provisions for pensions and similar obligations149 Income tax provisions and other provisions151 Borrowings152 Other financial liabilities152 Other liabilities152 Trade accounts payable153 Financial instruments report
Consolidated financial statements
114 Henkel Annual Report 2016Consolidated financial statements
166 Notes to the consolidated financial statements – Notes to the consolidated statement of income
166 Sales and principles of income recognition 166 Cost of sales166 Marketing, selling and distribution expenses166 Research and development expenses166 Administrative expenses167 Other operating income167 Other operating expenses167 Financial result168 Taxes on income170 Non-controlling interests
171 Notes to the consolidated financial statements – Other disclosures
171 Reconciliation of adjusted net income171 Payroll cost and employee structure172 Share-based payment plans172 Group segment report175 Earnings per share176 Consolidated statement of cash flows176 Contingent liabilities176 Lease and other unrecognized financial
commitments177 Voting rights / Related party disclosures177 Exercise of exemption options178 Remuneration of the corporate
management bodies178 Declaration of compliance with the Corporate
Governance Code [DCGK]178 Subsidiaries and other investments178 Auditor’s fees and services
179 Notes to the consolidated financial statements – Subsequent events
180 Independent Auditor’s Report
182 Recommendation for the approval of the annual financial statements and the appropriation of the profit of Henkel AG & Co. KGaA
183 Responsibility statement by the Personally Liable Partner
184 Corporate management bodies of Henkel AG & Co. KGaA
Consolidated financial statements 115Henkel Annual Report 2016
C
onso
lidat
ed f
inan
cial
sta
tem
ents
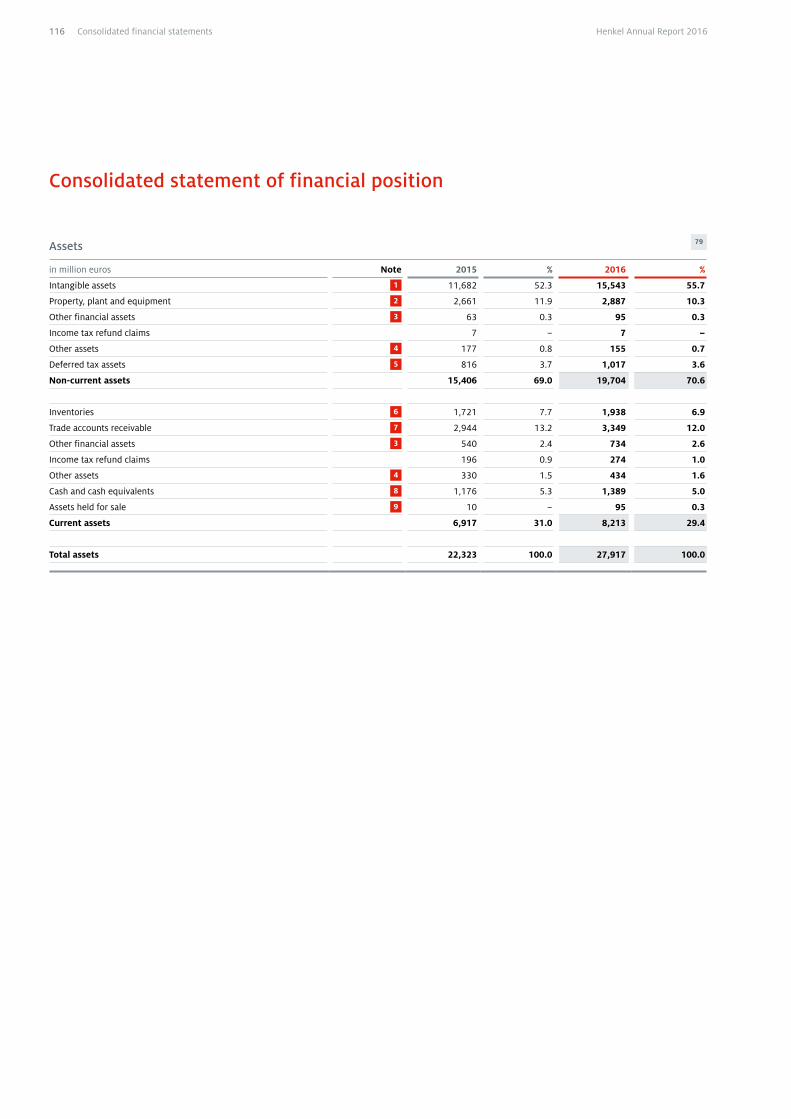
Consolidated statement of financial position
Assets 79
in million euros Note 2015 % 2016 %
Intangible assets 1 11,682 52.3 15,543 55.7
Property, plant and equipment 2 2,661 11.9 2,887 10.3
Other financial assets 3 63 0.3 95 0.3
Income tax refund claims 7 – 7 –
Other assets 4 177 0.8 155 0.7
Deferred tax assets 5 816 3.7 1,017 3.6
Non-current assets 15,406 69.0 19,704 70.6
Inventories 6 1,721 7.7 1,938 6.9
Trade accounts receivable 7 2,944 13.2 3,349 12.0
Other financial assets 3 540 2.4 734 2.6
Income tax refund claims 196 0.9 274 1.0
Other assets 4 330 1.5 434 1.6
Cash and cash equivalents 8 1,176 5.3 1,389 5.0
Assets held for sale 9 10 – 95 0.3
Current assets 6,917 31.0 8,213 29.4
Total assets 22,323 100.0 27,917 100.0
116 Henkel Annual Report 2016Consolidated financial statements
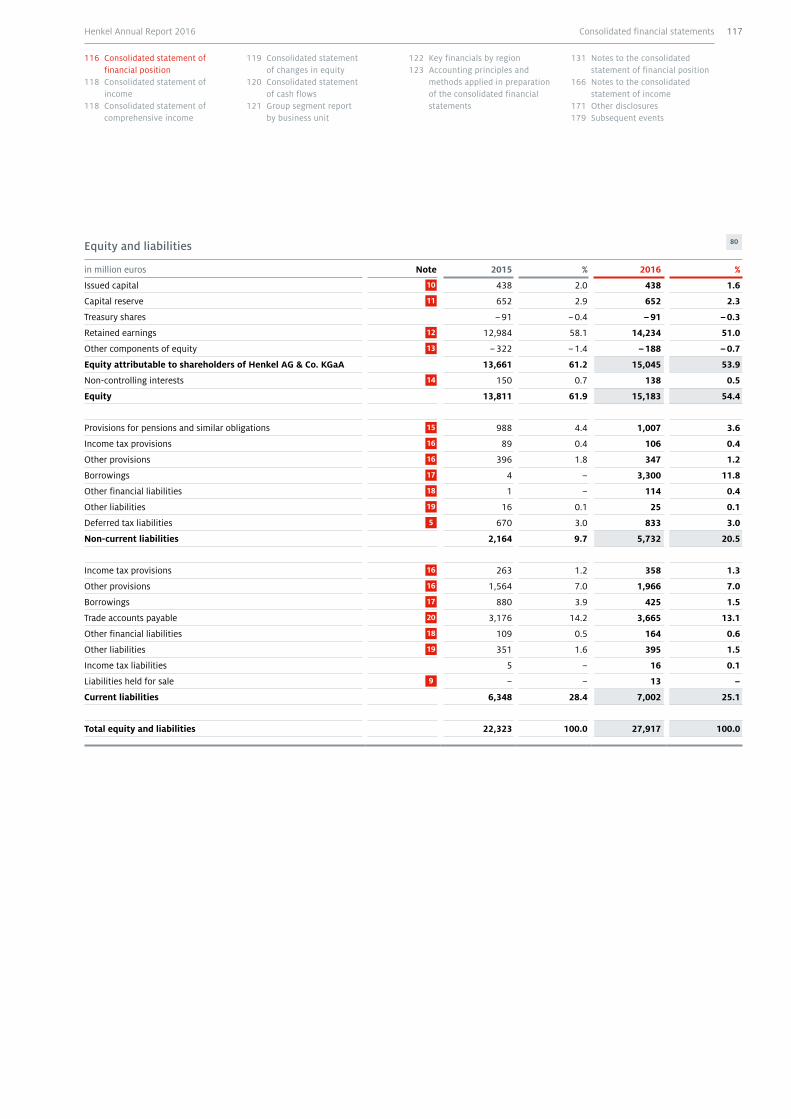
Equity and liabilities 80
in million euros Note 2015 % 2016 %
Issued capital 10 438 2.0 438 1.6
Capital reserve 11 652 2.9 652 2.3
Treasury shares – 91 – 0.4 – 91 – 0.3
Retained earnings 12 12,984 58.1 14,234 51.0
Other components of equity 13 – 322 – 1.4 – 188 – 0.7
Equity attributable to shareholders of Henkel AG & Co. KGaA 13,661 61.2 15,045 53.9
Non-controlling interests 14 150 0.7 138 0.5
Equity 13,811 61.9 15,183 54.4
Provisions for pensions and similar obligations 15 988 4.4 1,007 3.6
Income tax provisions 16 89 0.4 106 0.4
Other provisions 16 396 1.8 347 1.2
Borrowings 17 4 – 3,300 11.8
Other financial liabilities 18 1 – 114 0.4
Other liabilities 19 16 0.1 25 0.1
Deferred tax liabilities 5 670 3.0 833 3.0
Non-current liabilities 2,164 9.7 5,732 20.5
Income tax provisions 16 263 1.2 358 1.3
Other provisions 16 1,564 7.0 1,966 7.0
Borrowings 17 880 3.9 425 1.5
Trade accounts payable 20 3,176 14.2 3,665 13.1
Other financial liabilities 18 109 0.5 164 0.6
Other liabilities 19 351 1.6 395 1.5
Income tax liabilities 5 – 16 0.1
Liabilities held for sale 9 – – 13 –
Current liabilities 6,348 28.4 7,002 25.1
Total equity and liabilities 22,323 100.0 27,917 100.0
Consolidated financial statements 117Henkel Annual Report 2016
116 Consolidated statement of financial position
118 Consolidated statement of income
118 Consolidated statement of comprehensive income
119 Consolidated statement of changes in equity
120 Consolidated statement of cash flows
121 Group segment report by business unit
122 Key financials by region123 Accounting principles and
methods applied in preparation of the consolidated financial statements
131 Notes to the consolidated statement of financial position
166 Notes to the consolidated statement of income
171 Other disclosures179 Subsequent events
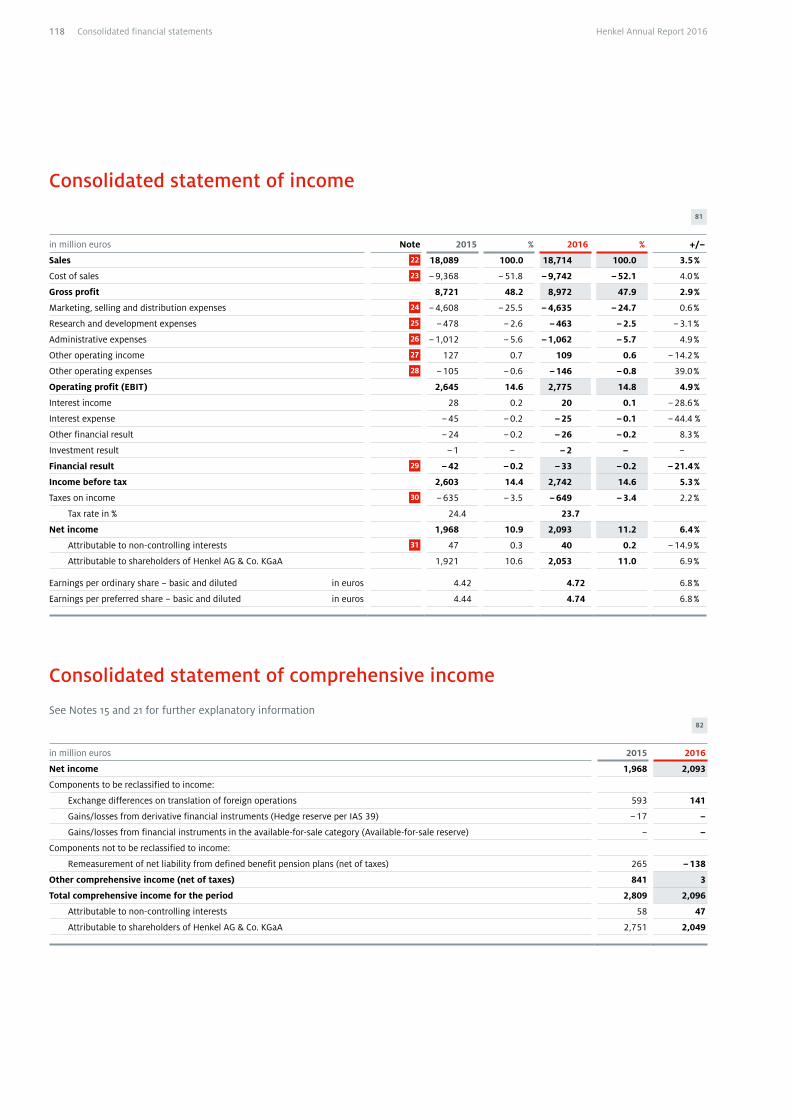
Consolidated statement of income
81
in million euros Note 2015 % 2016 % +/–
Sales 22 18,089 100.0 18,714 100.0 3.5 %
Cost of sales 23 – 9,368 – 51.8 – 9,742 – 52.1 4.0 %
Gross profit 8,721 48.2 8,972 47.9 2.9 %
Marketing, selling and distribution expenses 24 – 4,608 – 25.5 – 4,635 – 24.7 0.6 %
Research and development expenses 25 – 478 – 2.6 – 463 – 2.5 – 3.1 %
Administrative expenses 26 – 1,012 – 5.6 – 1,062 – 5.7 4.9 %
Other operating income 27 127 0.7 109 0.6 – 14.2 %
Other operating expenses 28 – 105 – 0.6 – 146 – 0.8 39.0 %
Operating profit (EBIT) 2,645 14.6 2,775 14.8 4.9 %
Interest income 28 0.2 20 0.1 – 28.6 %
Interest expense – 45 – 0.2 – 25 – 0.1 – 44.4 %
Other financial result – 24 – 0.2 – 26 – 0.2 8.3 %
Investment result – 1 – – 2 – –
Financial result 29 – 42 – 0.2 – 33 – 0.2 – 21.4 %
Income before tax 2,603 14.4 2,742 14.6 5.3 %
Taxes on income 30 – 635 – 3.5 – 649 – 3.4 2.2 %
Tax rate in % 24.4 23.7
Net income 1,968 10.9 2,093 11.2 6.4 %
Attributable to non-controlling interests 31 47 0.3 40 0.2 – 14.9 %
Attributable to shareholders of Henkel AG & Co. KGaA 1,921 10.6 2,053 11.0 6.9 %
Earnings per ordinary share – basic and diluted in euros 4.42 4.72 6.8 %
Earnings per preferred share – basic and diluted in euros 4.44 4.74 6.8 %
Consolidated statement of comprehensive income
See Notes 15 and 21 for further explanatory information
82
in million euros 2015 2016
Net income 1,968 2,093
Components to be reclassified to income:
Exchange differences on translation of foreign operations 593 141
Gains/losses from derivative financial instruments (Hedge reserve per IAS 39) – 17 –
Gains/losses from financial instruments in the available-for-sale category (Available-for-sale reserve) – –
Components not to be reclassified to income:
Remeasurement of net liability from defined benefit pension plans (net of taxes) 265 – 138
Other comprehensive income (net of taxes) 841 3
Total comprehensive income for the period 2,809 2,096
Attributable to non-controlling interests 58 47
Attributable to shareholders of Henkel AG & Co. KGaA 2,751 2,049
118 Henkel Annual Report 2016Consolidated financial statements
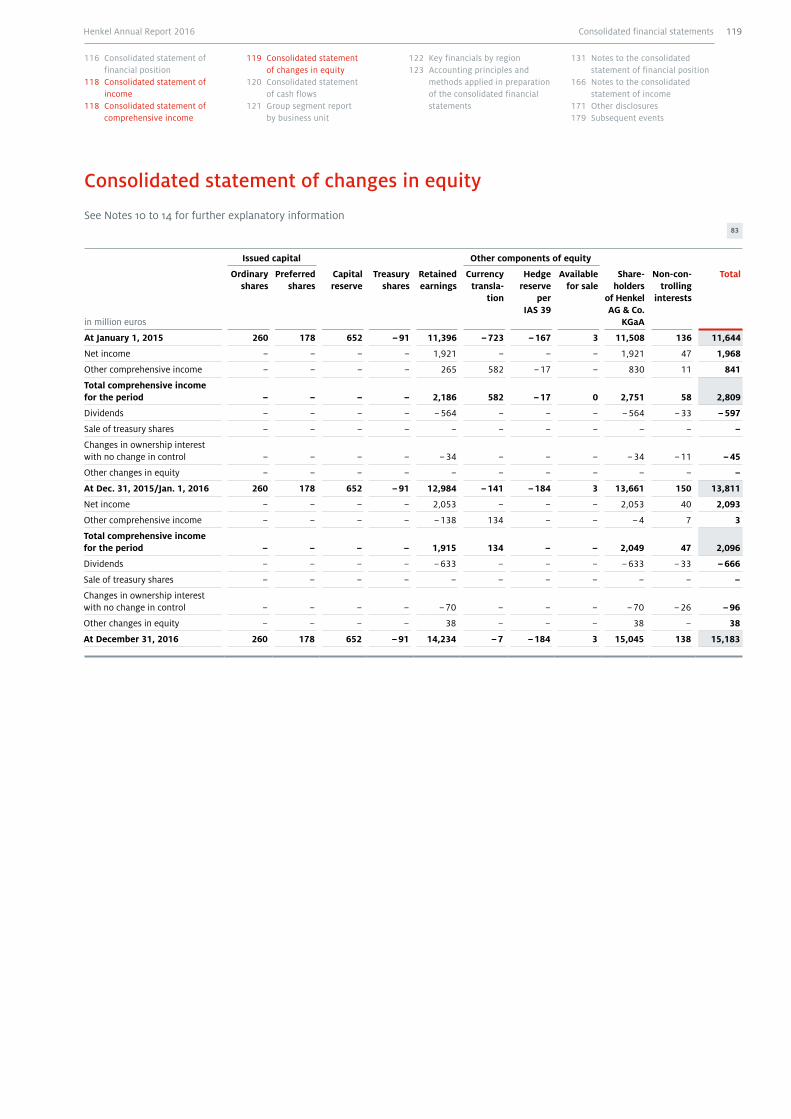
Consolidated statement of changes in equity
See Notes 10 to 14 for further explanatory information
83
in million euros
Issued capital Other components of equity
Ordinary shares
Preferred shares
Capital reserve
Treasury shares
Retained earnings
Currency transla-
tion
Hedge reserve
per IAS 39
Available for sale
Share-holders
of Henkel AG & Co.
KGaA
Non-con-trolling
interests
Total
At January 1, 2015 260 178 652 – 91 11,396 – 723 – 167 3 11,508 136 11,644
Net income – – – – 1,921 – – – 1,921 47 1,968
Other comprehensive income – – – – 265 582 – 17 – 830 11 841
Total comprehensive income for the period – – – – 2,186 582 – 17 0 2,751 58 2,809
Dividends – – – – – 564 – – – – 564 – 33 – 597
Sale of treasury shares – – – – – – – – – – –
Changes in ownership interest with no change in control – – – – – 34 – – – – 34 – 11 – 45
Other changes in equity – – – – – – – – – – –
At Dec. 31, 2015/Jan. 1, 2016 260 178 652 – 91 12,984 – 141 – 184 3 13,661 150 13,811
Net income – – – – 2,053 – – – 2,053 40 2,093
Other comprehensive income – – – – – 138 134 – – – 4 7 3
Total comprehensive income for the period – – – – 1,915 134 – – 2,049 47 2,096
Dividends – – – – – 633 – – – – 633 – 33 – 666
Sale of treasury shares – – – – – – – – – – –
Changes in ownership interest with no change in control – – – – – 70 – – – – 70 – 26 – 96
Other changes in equity – – – – 38 – – – 38 – 38
At December 31, 2016 260 178 652 – 91 14,234 – 7 – 184 3 15,045 138 15,183
Consolidated financial statements 119Henkel Annual Report 2016
116 Consolidated statement of financial position
118 Consolidated statement of income
118 Consolidated statement of comprehensive income
119 Consolidated statement of changes in equity
120 Consolidated statement of cash flows
121 Group segment report by business unit
122 Key financials by region123 Accounting principles and
methods applied in preparation of the consolidated financial statements
131 Notes to the consolidated statement of financial position
166 Notes to the consolidated statement of income
171 Other disclosures179 Subsequent events
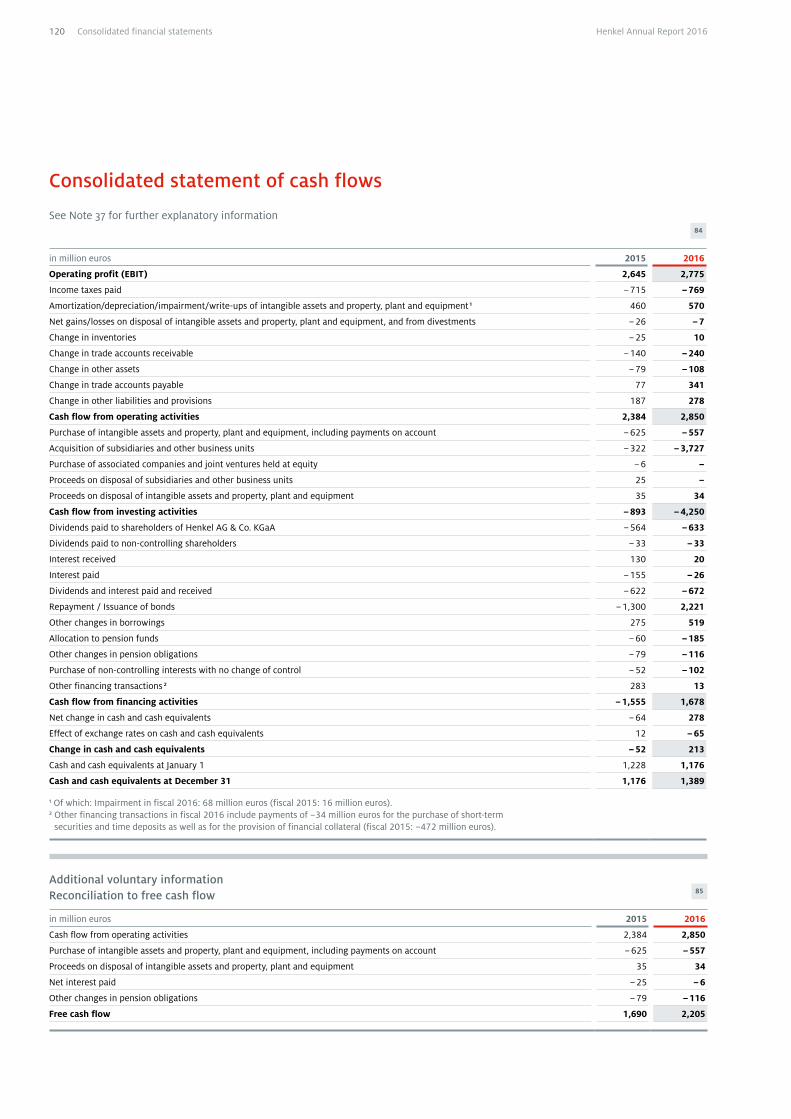
Consolidated statement of cash flows
See Note 37 for further explanatory information
84
in million euros 2015 2016
Operating profit (EBIT) 2,645 2,775
Income taxes paid – 715 – 769
Amortization/depreciation/impairment/write-ups of intangible assets and property, plant and equipment 1 460 570
Net gains/losses on disposal of intangible assets and property, plant and equipment, and from divestments – 26 – 7
Change in inventories – 25 10
Change in trade accounts receivable – 140 – 240
Change in other assets – 79 – 108
Change in trade accounts payable 77 341
Change in other liabilities and provisions 187 278
Cash flow from operating activities 2,384 2,850
Purchase of intangible assets and property, plant and equipment, including payments on account – 625 – 557
Acquisition of subsidiaries and other business units – 322 – 3,727
Purchase of associated companies and joint ventures held at equity – 6 –
Proceeds on disposal of subsidiaries and other business units 25 –
Proceeds on disposal of intangible assets and property, plant and equipment 35 34
Cash flow from investing activities – 893 – 4,250
Dividends paid to shareholders of Henkel AG & Co. KGaA – 564 – 633
Dividends paid to non-controlling shareholders – 33 – 33
Interest received 130 20
Interest paid – 155 – 26
Dividends and interest paid and received – 622 – 672
Repayment / Issuance of bonds – 1,300 2,221
Other changes in borrowings 275 519
Allocation to pension funds – 60 – 185
Other changes in pension obligations – 79 – 116
Purchase of non-controlling interests with no change of control – 52 – 102
Other financing transactions 2 283 13
Cash flow from financing activities – 1,555 1,678
Net change in cash and cash equivalents – 64 278
Effect of exchange rates on cash and cash equivalents 12 – 65
Change in cash and cash equivalents – 52 213
Cash and cash equivalents at January 1 1,228 1,176
Cash and cash equivalents at December 31 1,176 1,389
1 Of which: Impairment in fiscal 2016: 68 million euros (fiscal 2015: 16 million euros).2 Other financing transactions in fiscal 2016 include payments of –34 million euros for the purchase of short-term
securities and time deposits as well as for the provision of financial collateral (fiscal 2015: –472 million euros).
Additional voluntary information Reconciliation to free cash flow
85
in million euros 2015 2016
Cash flow from operating activities 2,384 2,850
Purchase of intangible assets and property, plant and equipment, including payments on account – 625 – 557
Proceeds on disposal of intangible assets and property, plant and equipment 35 34
Net interest paid – 25 – 6
Other changes in pension obligations – 79 – 116
Free cash flow 1,690 2,205
120 Henkel Annual Report 2016Consolidated financial statements
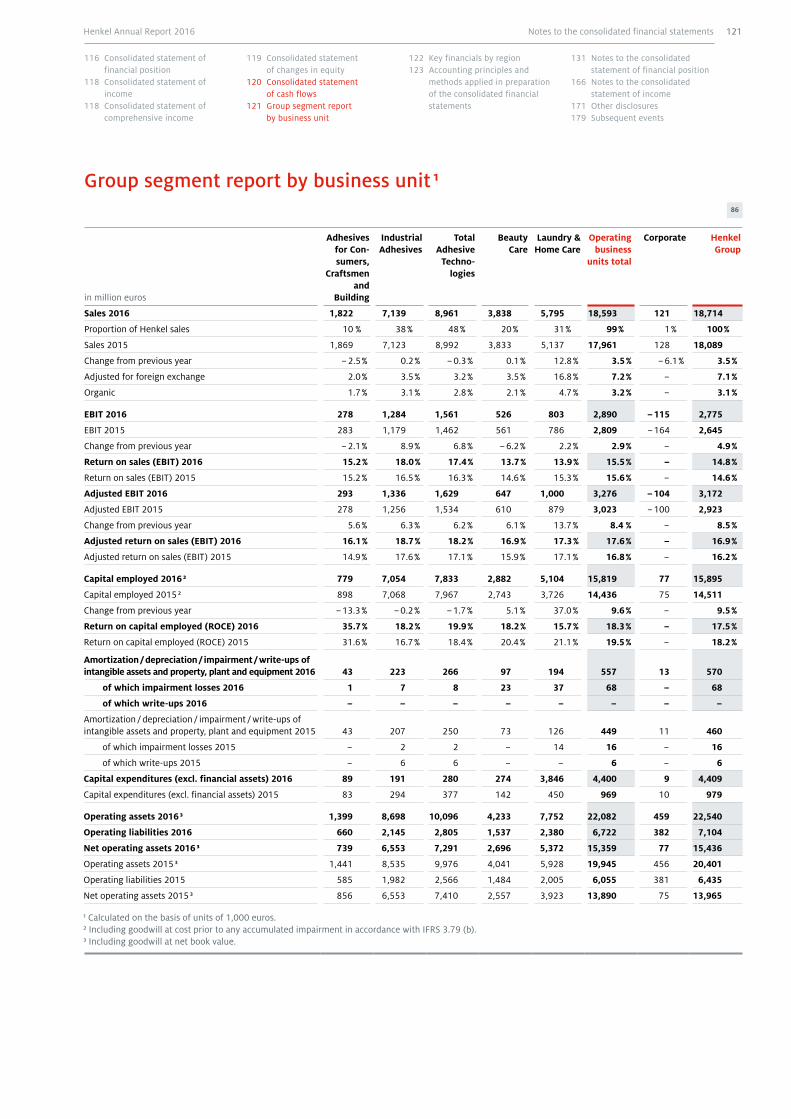
Group segment report by business unit 1
86
in million euros
Adhesives for Con-sumers,
Craftsmen and
Building
Industrial Adhesives
Total Adhesive
Techno-logies
Beauty Care
Laundry & Home Care
Operating business
units total
Corporate Henkel Group
Sales 2016 1,822 7,139 8,961 3,838 5,795 18,593 121 18,714
Proportion of Henkel sales 10 % 38 % 48 % 20 % 31 % 99 % 1 % 100 %
Sales 2015 1,869 7,123 8,992 3,833 5,137 17,961 128 18,089
Change from previous year – 2.5 % 0.2 % – 0.3 % 0.1 % 12.8 % 3.5 % – 6.1 % 3.5 %
Adjusted for foreign exchange 2.0 % 3.5 % 3.2 % 3.5 % 16.8 % 7.2 % – 7.1 %
Organic 1.7 % 3.1 % 2.8 % 2.1 % 4.7 % 3.2 % – 3.1 %
EBIT 2016 278 1,284 1,561 526 803 2,890 – 115 2,775
EBIT 2015 283 1,179 1,462 561 786 2,809 – 164 2,645
Change from previous year – 2.1 % 8.9 % 6.8 % – 6.2 % 2.2 % 2.9 % – 4.9 %
Return on sales (EBIT) 2016 15.2 % 18.0 % 17.4 % 13.7 % 13.9 % 15.5 % – 14.8 %
Return on sales (EBIT) 2015 15.2 % 16.5 % 16.3 % 14.6 % 15.3 % 15.6 % – 14.6 %
Adjusted EBIT 2016 293 1,336 1,629 647 1,000 3,276 – 104 3,172
Adjusted EBIT 2015 278 1,256 1,534 610 879 3,023 – 100 2,923
Change from previous year 5.6 % 6.3 % 6.2 % 6.1 % 13.7 % 8.4 % – 8.5 %
Adjusted return on sales (EBIT) 2016 16.1 % 18.7 % 18.2 % 16.9 % 17.3 % 17.6 % – 16.9 %
Adjusted return on sales (EBIT) 2015 14.9 % 17.6 % 17.1 % 15.9 % 17.1 % 16.8 % – 16.2 %
Capital employed 2016 2 779 7,054 7,833 2,882 5,104 15,819 77 15,895
Capital employed 2015 2 898 7,068 7,967 2,743 3,726 14,436 75 14,511
Change from previous year – 13.3 % – 0.2 % – 1.7 % 5.1 % 37.0 % 9.6 % – 9.5 %
Return on capital employed (ROCE) 2016 35.7 % 18.2 % 19.9 % 18.2 % 15.7 % 18.3 % – 17.5 %
Return on capital employed (ROCE) 2015 31.6 % 16.7 % 18.4 % 20.4 % 21.1 % 19.5 % – 18.2 %
Amortization / depreciation / impairment / write-ups of intangible assets and property, plant and equipment 2016 43 223 266 97 194 557 13 570
of which impairment losses 2016 1 7 8 23 37 68 – 68
of which write-ups 2016 – – – – – – – –
Amortization / depreciation / impairment / write-ups of intangible assets and property, plant and equipment 2015 43 207 250 73 126 449 11 460
of which impairment losses 2015 – 2 2 – 14 16 – 16
of which write-ups 2015 – 6 6 – – 6 – 6
Capital expenditures (excl. financial assets) 2016 89 191 280 274 3,846 4,400 9 4,409
Capital expenditures (excl. financial assets) 2015 83 294 377 142 450 969 10 979
Operating assets 2016 3 1,399 8,698 10,096 4,233 7,752 22,082 459 22,540
Operating liabilities 2016 660 2,145 2,805 1,537 2,380 6,722 382 7,104
Net operating assets 2016 3 739 6,553 7,291 2,696 5,372 15,359 77 15,436
Operating assets 2015 3 1,441 8,535 9,976 4,041 5,928 19,945 456 20,401
Operating liabilities 2015 585 1,982 2,566 1,484 2,005 6,055 381 6,435
Net operating assets 2015 3 856 6,553 7,410 2,557 3,923 13,890 75 13,965
1 Calculated on the basis of units of 1,000 euros.2 Including goodwill at cost prior to any accumulated impairment in accordance with IFRS 3.79 (b).3 Including goodwill at net book value.
Notes to the consolidated financial statements 121Henkel Annual Report 2016
116 Consolidated statement of financial position
118 Consolidated statement of income
118 Consolidated statement of comprehensive income
119 Consolidated statement of changes in equity
120 Consolidated statement of cash flows
121 Group segment report by business unit
122 Key financials by region123 Accounting principles and
methods applied in preparation of the consolidated financial statements
131 Notes to the consolidated statement of financial position
166 Notes to the consolidated statement of income
171 Other disclosures179 Subsequent events
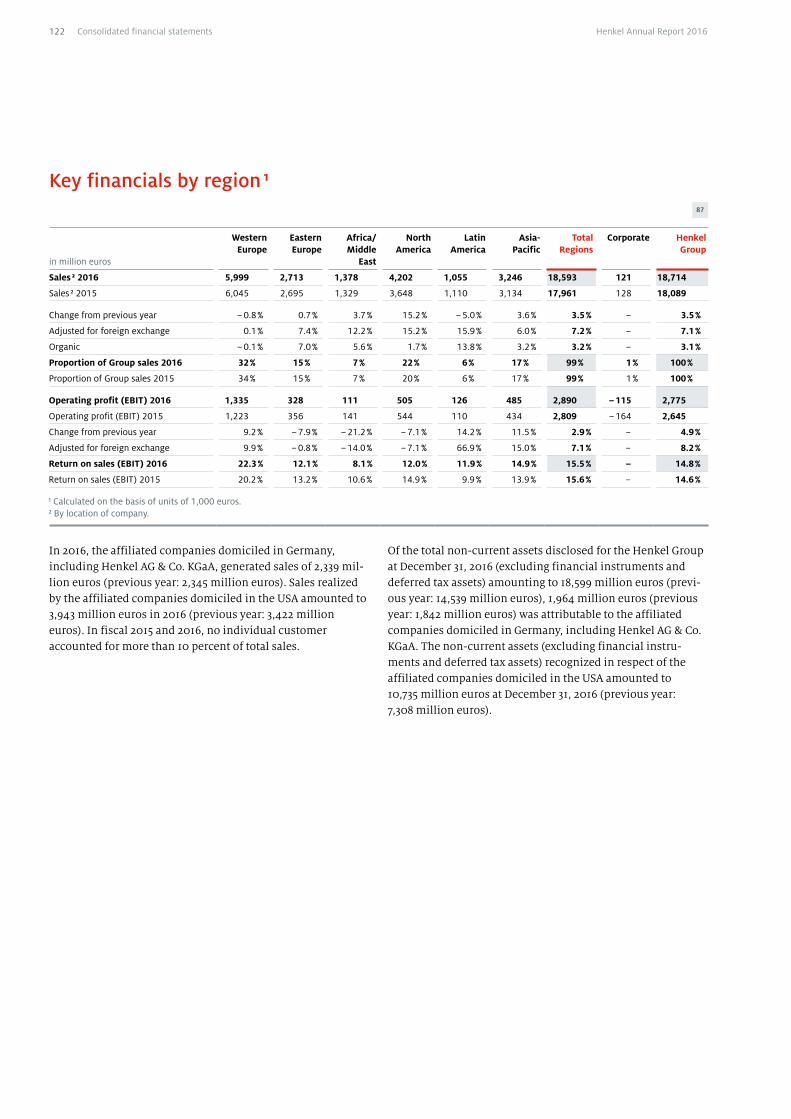
Key financials by region 1
87
in million euros
Western Europe
Eastern Europe
Africa/ Middle
East
North America
Latin America
Asia- Pacific
Total Regions
Corporate Henkel Group
Sales 2 2016 5,999 2,713 1,378 4,202 1,055 3,246 18,593 121 18,714
Sales 2 2015 6,045 2,695 1,329 3,648 1,110 3,134 17,961 128 18,089
Change from previous year – 0.8 % 0.7 % 3.7 % 15.2 % – 5.0 % 3.6 % 3.5 % – 3.5 %
Adjusted for foreign exchange 0.1 % 7.4 % 12.2 % 15.2 % 15.9 % 6.0 % 7.2 % – 7.1 %
Organic – 0.1 % 7.0 % 5.6 % 1.7 % 13.8 % 3.2 % 3.2 % – 3.1 %
Proportion of Group sales 2016 32 % 15 % 7 % 22 % 6 % 17 % 99 % 1 % 100 %
Proportion of Group sales 2015 34 % 15 % 7 % 20 % 6 % 17 % 99 % 1 % 100 %
Operating profit (EBIT) 2016 1,335 328 111 505 126 485 2,890 – 115 2,775
Operating profit (EBIT) 2015 1,223 356 141 544 110 434 2,809 – 164 2,645
Change from previous year 9.2 % – 7.9 % – 21.2 % – 7.1 % 14.2 % 11.5 % 2.9 % – 4.9 %
Adjusted for foreign exchange 9.9 % – 0.8 % – 14.0 % – 7.1 % 66.9 % 15.0 % 7.1 % – 8.2 %
Return on sales (EBIT) 2016 22.3 % 12.1 % 8.1 % 12.0 % 11.9 % 14.9 % 15.5 % – 14.8 %
Return on sales (EBIT) 2015 20.2 % 13.2 % 10.6 % 14.9 % 9.9 % 13.9 % 15.6 % – 14.6 %
1 Calculated on the basis of units of 1,000 euros.2 By location of company.
In 2016, the affiliated companies domiciled in Germany, including Henkel AG & Co. KGaA, generated sales of 2,339 mil-lion euros (previous year: 2,345 million euros). Sales realized by the affiliated companies domiciled in the USA amounted to 3,943 million euros in 2016 (previous year: 3,422 million euros). In fiscal 2015 and 2016, no individual customer accounted for more than 10 percent of total sales.
Of the total non-current assets disclosed for the Henkel Group at December 31, 2016 (excluding financial instruments and deferred tax assets) amounting to 18,599 million euros (previ-ous year: 14,539 million euros), 1,964 million euros (previous year: 1,842 million euros) was attributable to the affiliated companies domiciled in Germany, including Henkel AG & Co. KGaA. The non-current assets (excluding financial instru-ments and deferred tax assets) recognized in respect of the affiliated companies domiciled in the USA amounted to 10,735 million euros at December 31, 2016 (previous year: 7,308 million euros).
122 Henkel Annual Report 2016Consolidated financial statements
General information
The consolidated financial statements of Henkel AG & Co. KGaA (Düsseldorf Regional Court, HRB 4724), Düsseldorf, as of December 31, 2016, have been prepared in accordance with International Financial Reporting Standards (IFRS) and the rel-evant interpretations of the International Financial Reporting Interpretations Committee (IFRIC), as adopted per Regulation number 1606/2002 of the European Parliament and the Coun-cil, on the application of international accounting standards, in the European Union, and in compliance with Section 315a of the German Commercial Code [HGB]. The consolidated finan-cial statements are published in the electronic federal gazette.
The individual financial statements of the companies included in the consolidation are drawn up on the same accounting date, December 31, 2016, as that of Henkel AG & Co. KGaA.
Members of the KPMG organization or other independent firms of auditors instructed accordingly have audited the financial statements of the material companies included in the consolidation. The Management Board of Henkel Manage-ment AG – which is the Personally Liable Partner of Henkel AG & Co. KGaA – compiled the consolidated financial statements on January 30, 2017, and approved them for forwarding to the Supervisory Board and for publication.
The consolidated financial statements are based on the princi-ple of historical cost with the exception that certain financial instruments are accounted for at their fair values, and pension obligations are measured using the projected unit credit method. The functional currency of Henkel AG & Co. KGaA and the reporting currency of the Group is the euro. Unless other-wise indicated, all amounts are shown in million euros. In order to improve the clarity and informative value of the consolidated financial statements, certain items are combined in the consoli-dated statement of financial position, the consolidated state-ment of income and the consolidated statement of comprehen-sive income, and then shown separately in the notes.
Scope of consolidation
In addition to Henkel AG & Co. KGaA as the ultimate parent company, the consolidated financial statements at December 31, 2016, include eight German and 199 non-German compa-nies in which Henkel AG & Co. KGaA has a dominating influ-ence over financial and operating policies, based on the con-cept of control. The Group has a dominating influence on a company when it is exposed, or has rights, to variable returns
Accounting principles and methods applied in preparation of the consolidated financial statements
from its involvement with the company and has the ability to affect those returns through its power over the company. Com-panies in which the stake held represents less than half of the voting rights are fully consolidated if Henkel AG & Co. KGaA controls them, as defined in IFRS 10, through contractual agreements or the right to appoint corporate bodies.
Henkel AG & Co. KGaA prepares the consolidated financial statements for the largest and the smallest groups of compa-nies to which Henkel AG & Co. KGaA and its subsidiaries belong.
The following table shows the changes to the scope of consoli-dation in fiscal 2016:
Scope of consolidation 88
At January 1, 2016 202
Additions 17
Mergers – 8
Disposals – 3
At December 31, 2016 208
Further details can be found in the section “Acquisitions and divestments” below.
Subsidiaries which are of secondary importance to the Group and to the presentation of a true and fair view of our net assets, financial position and results of operations due to their inactivity or low level of activity are generally not included in the consolidated financial statements. The total assets of these companies represent less than 1 percent of the Group’s total assets; their total sales and income (net of taxes) are also less than 1 percent of the Group totals.
Acquisitions and divestments
AcquisitionsEffective May 31, 2016, we acquired 57.5 percent of the shares of Expand Global Industries UK Limited, London, UK. Expand Global Industries UK Limited holds nearly 100 percent of the shares of Expand Global Industries Ltd. headquartered in Ibadan, Nigeria, which has a strong presence in the detergent market in Nigeria. With this acquisition, the Laundry & Home Care business unit has expanded its detergent business. The acquisition is part of our strategy to further strengthen our presence in emerging markets. The purchase price was 110 million euros, settled in cash. With regard to the remain-
Notes to the consolidated financial statements 123Henkel Annual Report 2016
116 Consolidated statement of financial position
118 Consolidated statement of income
118 Consolidated statement of comprehensive income
119 Consolidated statement of changes in equity
120 Consolidated statement of cash flows
121 Group segment report by business unit
122 Key financials by region123 Accounting principles and
methods applied in preparation of the consolidated financial statements
131 Notes to the consolidated statement of financial position
166 Notes to the consolidated statement of income
171 Other disclosures179 Subsequent events
ing 42.5 percent of shares, put and call contracts have been entered into between Henkel and the seller. Henkel has decided to apply the anticipated acquisition method to account for the acquisition in the financial statements. Accordingly, acquisition of the outstanding non-controlling shares is already included as part of the first-time consolida-tion in the form of a contingent purchase price liability of 113 million euros. The purchase price of the outstanding non-controlling interests is based on the market value of the shares less net financial debt. Please refer to the details on pages 156 and 157 for Henkel’s estimated bandwidth of poten-tial fluctuations arising from changes in valuation parameters. A maximum payment was not agreed. Because the acquisition is recognized using the anticipated acquisition method, non-controlling interests from the acquired business are not disclosed in the statement of comprehensive income. Effects from foreign exchange and measurement of the contingent purchase price liability are recognized directly in equity and disclosed as other changes in the statement of changes in equity. Provisional goodwill was recognized in the amount of 199 million euros. Because the acquisition was completed in the course of the year, the allocation of the purchase price to the acquired assets and liabilities in accordance with IFRS 3 “Business combinations” is provisional. Tax-deductible good-will is not expected.
Effective June 1, 2016, we completed the acquisition of a range of hair care brands and the associated hair care business of Procter & Gamble in the Africa/Middle East and Eastern Europe regions. The acquisition is part of our strategy to fur-ther strengthen our presence in emerging markets. The pur-chase price was 212 million euros, settled in cash. Provisional goodwill was recognized in the amount of 160 million euros. Because the acquisition was completed in the course of the year, the allocation of the purchase price to the acquired assets and liabilities in accordance with IFRS 3 “Business combina-tions” is provisional. Goodwill of 54 million euros was recog-nized for tax purposes.
Effective June 30, 2016, we acquired the tile adhesives business and the associated brands of the Colombian company Alfagres S.A. With this, the Adhesive Technologies business unit has expanded its business in the segment Adhesives for Consum-ers, Craftsmen and Building. The acquisition is part of our strategy to further strengthen our presence in emerging mar-kets. We do not expect any material impact from this acquisi-tion on the net assets, financial position and results of opera-tions of Henkel.
Effective August 15, 2016, we completed the acquisition of all shares of Zhejiang Golden Roc Chemicals JSC, China, expand-ing our superglue business in the Adhesive Technologies busi-ness unit. The acquisition is part of our strategy to further strengthen our presence in emerging markets. We do not
expect any material impact from this acquisition on the net assets, financial position and results of operations of Henkel.
Effective August 21, 2016, we completed the acquisition of the detergent business and the associated brands of Behdad Chemical Company PJSC in Iran. The acquisition is part of our strategy to further strengthen our presence in emerging mar-kets. The provisional purchase price of 5,436 billion Iranian rials (around 141 million euros) was settled in cash. Provi-sional goodwill was recognized in the amount of 100 million euros. Because the acquisition was recently completed, the allocation of the purchase price to the acquired assets and lia-bilities in accordance with IFRS 3 “Business combinations” is provisional. We do not expect any material impact from this acquisition on the net assets, financial position and results of operations of Henkel.
Effective September 1, 2016, we completed the acquisition of all shares of The Sun Products Corporation, a laundry and home care company based in Wilton, Connecticut, USA. The transaction had a purchase price of around 3.6 billion US dol-lars including debt redeemed at closing of 1.7 billion US dol-lars, and is fully debt-financed. In fiscal 2015, the company generated sales of around 1.6 billion US dollars in the USA and Canada. Acquisition-related costs amounted to 17 million euros. This acquisition is part of our strategy to invest in attractive country category positions in mature markets. Provi-sional goodwill was recognized in the amount of 2.1 billion euros. This goodwill represents the offensive and defensive synergies that Henkel expects to gain by integrating The Sun Products Corporation into its organization, and reflects the growth potential of the acquired business. Because the acqui-sition was recently completed, the allocation of the purchase price to the acquired assets and liabilities in accordance with IFRS 3 “Business combinations” is provisional. If the acquired company had been included from January 1, 2016, sales for the Henkel Group for the reporting period January 1 to December 31, 2016, would be higher by 1,457 million euros and income (net of taxes) would be lower by 98 million euros, taking restruc-turing and integration costs into account. The actual contribu-tions of the company were 475 million euros to sales and –77 million euros to income (net of taxes). Tax- deductible goodwill is not expected.
Effective December 8, 2016, we completed the acquisition of all shares of Jeyes Group Limited, UK, thus expanding our business with WC products and household detergents in the Laundry & Home Care business unit. As specified in IFRS 10 “Consolidated financial statements,” the acquired business has not yet been consolidated as control has not yet passed to Henkel. First-time consolidation is expected for the second quarter of 2017. We do not expect any material impact from this acquisition on the net assets, financial position and results of operations of Henkel.
124 Henkel Annual Report 2016Consolidated financial statements
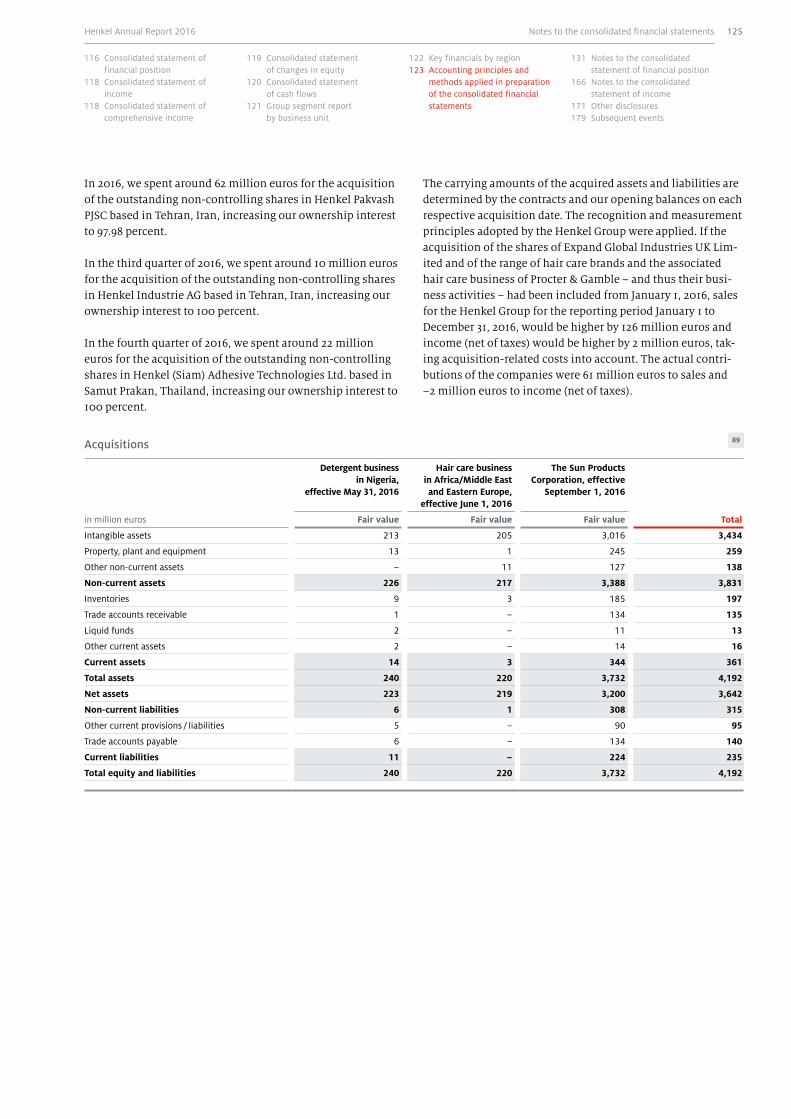
Acquisitions 89
Detergent business in Nigeria,
effective May 31, 2016
Hair care business in Africa/Middle East and Eastern Europe,
effective June 1, 2016
The Sun Products Corporation, effective
September 1, 2016
in million euros Fair value Fair value Fair value Total
Intangible assets 213 205 3,016 3,434
Property, plant and equipment 13 1 245 259
Other non-current assets – 11 127 138
Non-current assets 226 217 3,388 3,831
Inventories 9 3 185 197
Trade accounts receivable 1 – 134 135
Liquid funds 2 – 11 13
Other current assets 2 – 14 16
Current assets 14 3 344 361
Total assets 240 220 3,732 4,192
Net assets 223 219 3,200 3,642
Non-current liabilities 6 1 308 315
Other current provisions / liabilities 5 – 90 95
Trade accounts payable 6 – 134 140
Current liabilities 11 – 224 235
Total equity and liabilities 240 220 3,732 4,192
In 2016, we spent around 62 million euros for the acquisition of the outstanding non-controlling shares in Henkel Pakvash PJSC based in Tehran, Iran, increasing our ownership interest to 97.98 percent.
In the third quarter of 2016, we spent around 10 million euros for the acquisition of the outstanding non-controlling shares in Henkel Industrie AG based in Tehran, Iran, increasing our ownership interest to 100 percent.
In the fourth quarter of 2016, we spent around 22 million euros for the acquisition of the outstanding non-controlling shares in Henkel (Siam) Adhesive Technologies Ltd. based in Samut Prakan, Thailand, increasing our ownership interest to 100 percent.
The carrying amounts of the acquired assets and liabilities are determined by the contracts and our opening balances on each respective acquisition date. The recognition and measurement principles adopted by the Henkel Group were applied. If the acquisition of the shares of Expand Global Industries UK Lim-ited and of the range of hair care brands and the associated hair care business of Procter & Gamble – and thus their busi-ness activities – had been included from January 1, 2016, sales for the Henkel Group for the reporting period January 1 to December 31, 2016, would be higher by 126 million euros and income (net of taxes) would be higher by 2 million euros, tak-ing acquisition-related costs into account. The actual contri-butions of the companies were 61 million euros to sales and –2 million euros to income (net of taxes).
Notes to the consolidated financial statements 125Henkel Annual Report 2016
116 Consolidated statement of financial position
118 Consolidated statement of income
118 Consolidated statement of comprehensive income
119 Consolidated statement of changes in equity
120 Consolidated statement of cash flows
121 Group segment report by business unit
122 Key financials by region123 Accounting principles and
methods applied in preparation of the consolidated financial statements
131 Notes to the consolidated statement of financial position
166 Notes to the consolidated statement of income
171 Other disclosures179 Subsequent events

Reconciliation of the purchase price to provisional goodwill 90
in million euros 2016
Detergent business in Nigeria, effective May 31, 2016
Purchase price 110
Contingent purchase price 113
Fair value of the acquired assets and liabilities 24
Provisional goodwill 199
Hair care business in Africa/Middle East and Eastern Europe, effective June 1, 2016
Purchase price 212
Contingent purchase price 7
Fair value of the acquired assets and liabilities 59
Provisional goodwill 160
The Sun Products Corporation, effective September 1, 2016
Purchase price 3,197
Adjustment based on purchase agreement 3
Fair value of the acquired assets and liabilities 1,137
Provisional goodwill 2,063
Entities acquired are included in the consolidation for the first time as subsidiaries by offsetting the carrying amount of the respective parent company’s investment in them against their assets and liabilities. Contingent consideration is recognized at fair value as of the date of first-time consolidation. Subse-quent changes in value do not result in an adjustment to the valuation at the time of acquisition. Acquisition-related costs are not included in the purchase price. Instead, they are recog-nized through profit or loss in the period in which they occur.
In the recognition of acquisitions of less than 100 percent, non-controlling interests are measured at the fair value of the share of net assets that they represent. Contingent futures contracts on non-controlling interests are recognized using the anticipated acquisition method. Accordingly, the acquisi-tion of the outstanding non-controlling interests is already included as part of the first-time consolidation in the form of a contingent purchase price liability.
In subsequent years, the carrying amount of the Henkel AG & Co. KGaA investment is eliminated against the current (share of) equity in the subsidiary entities concerned.
Changes in the shareholdings of subsidiary companies result-ing in a decrease or an increase in the participating interests of the Group without loss of control are recognized within equity as changes in ownership without loss of control.
DivestmentsWe did not conclude the sale of any businesses in fiscal 2016.
Consolidation methods
The financial statements of Henkel AG & Co. KGaA and of the subsidiaries included in the consolidated financial statements were prepared on the basis of uniformly valid principles of recognition and measurement, applying the standardized year-end date adopted by the Group. Such entities are included in the consolidated financial statements as of the date on which the Group acquired control.
All receivables and liabilities, sales, income and expenses, as well as intra-group profits on transfers of non-current assets or inventories, are eliminated on consolidation.
The purchase method is used for capital consolidation. With business combinations, therefore, all hidden reserves and hid-den charges in the entity acquired are revalued at the time of acquisition, and all identifiable intangible assets are sepa-rately disclosed if they are clearly separable or if their recogni-tion arises from a contractual or other legal right. Any differ-ence arising between the acquisition cost and the (share of) net assets after purchase price allocation is recognized as goodwill. The goodwill of subsidiaries is measured in the functional currency of the subsidiary.
126 Henkel Annual Report 2016Consolidated financial statements

As soon as the control of a subsidiary is relinquished, all the assets and liabilities and the non-controlling interests, and also the accumulated currency translation gains or losses, are derecognized. In the event that Henkel continues to own non-controlling interests in the non-consolidated entity, these are measured at fair value. The result of deconsolidation is recognized under other operating income or expenses.
Companies recognized by the equity method
Associated companies and joint ventures are recognized by the equity method.
An associated company is a company over which the Group can exercise material influence on the financial and operating policies without controlling it. Material influence is generally assumed when the Group holds 20 percent or more of the vot-ing rights. Where a Group company conducts transactions with an associated company or a joint venture, the resulting profits or losses are eliminated in accordance with the share of the Group in that company.
The Group consolidates Dekel Investment Holdings Ltd. and Vitriflex, Inc. using the equity method. The carrying amount of the shareholdings recognized using the equity method as of December 31, 2016, was 7 million euros (previous year: 12 mil-lion euros).
Associated companies that are less relevant for the Group and for the presentation of a fair view of its net assets, financial posi-tion and results of operation, are never recognized using the equity method. They are always recognized at amortized cost.
Currency translation
The annual financial statements of the consolidated compa-nies, including the hidden reserves and hidden charges of Group companies recognized by the purchase method, good-will arising on consolidation, and the consolidated statement of cash flows, are translated into euros using the functional currency method outlined in International Accounting Stan-dard (IAS) 21 “The Effects of Changes in Foreign Exchange Rates.” The functional currency is the currency in which a foreign company predominantly generates funds and makes payments. As the functional currency for all the companies included in the consolidation is generally the local currency of the company concerned, assets and liabilities are translated at closing rates, while income and expenses are translated at the average rates for the year as an approximation of the actual rates at the date of the transaction. Equity items are recognized at historical exchange rates. The differences arising from using average rather than closing rates are taken to equity and shown as other components of equity or non-controlling interests, and remain neutral in respect of net income until the shares are divested.
In the subsidiaries’ annual financial statements, transactions in foreign currencies are converted at the rates prevailing at the time of the transaction. Financial assets and liabilities in foreign currencies are measured at closing rates through profit or loss. For the main currencies in the Group, the following exchange rates have been used based on 1 euro:
Currencies 91
ISO code
Average exchange rate Exchange rate on December 31
2015 2016 2015 2016
Chinese yuan CNY 6.97 7.36 7.06 7.32
Mexican peso MXN 17.61 20.67 18.91 21.77
Polish zloty PLN 4.18 4.36 4.26 4.41
Russian ruble RUB 68.05 74.07 80.67 64.30
Turkish lira TRY 3.02 3.34 3.18 3.71
US dollar USD 1.11 1.11 1.09 1.05
Notes to the consolidated financial statements 127Henkel Annual Report 2016
116 Consolidated statement of financial position
118 Consolidated statement of income
118 Consolidated statement of comprehensive income
119 Consolidated statement of changes in equity
120 Consolidated statement of cash flows
121 Group segment report by business unit
122 Key financials by region123 Accounting principles and
methods applied in preparation of the consolidated financial statements
131 Notes to the consolidated statement of financial position
166 Notes to the consolidated statement of income
171 Other disclosures179 Subsequent events
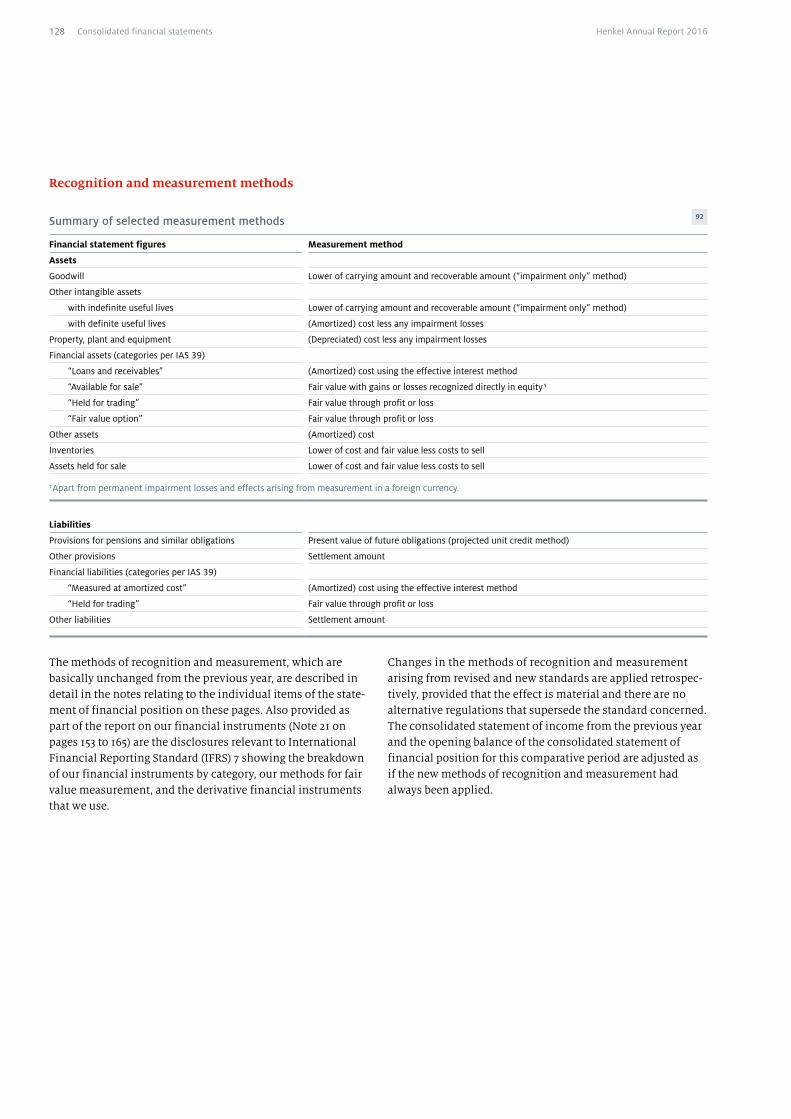
Recognition and measurement methods
Summary of selected measurement methods 92
Financial statement figures Measurement method
Assets
Goodwill Lower of carrying amount and recoverable amount (“impairment only” method)
Other intangible assets
with indefinite useful lives Lower of carrying amount and recoverable amount (“impairment only” method)
with definite useful lives (Amortized) cost less any impairment losses
Property, plant and equipment (Depreciated) cost less any impairment losses
Financial assets (categories per IAS 39)
“Loans and receivables” (Amortized) cost using the effective interest method
“Available for sale” Fair value with gains or losses recognized directly in equity 1
“Held for trading” Fair value through profit or loss
“Fair value option” Fair value through profit or loss
Other assets (Amortized) cost
Inventories Lower of cost and fair value less costs to sell
Assets held for sale Lower of cost and fair value less costs to sell
1 Apart from permanent impairment losses and effects arising from measurement in a foreign currency.
Liabilities
Provisions for pensions and similar obligations Present value of future obligations (projected unit credit method)
Other provisions Settlement amount
Financial liabilities (categories per IAS 39)
“Measured at amortized cost” (Amortized) cost using the effective interest method
“Held for trading” Fair value through profit or loss
Other liabilities Settlement amount
The methods of recognition and measurement, which are basically unchanged from the previous year, are described in detail in the notes relating to the individual items of the state-ment of financial position on these pages. Also provided as part of the report on our financial instruments (Note 21 on pages 153 to 165) are the disclosures relevant to International Financial Reporting Standard (IFRS) 7 showing the breakdown of our financial instruments by category, our methods for fair value measurement, and the derivative financial instruments that we use.
Changes in the methods of recognition and measurement arising from revised and new standards are applied retrospec-tively, provided that the effect is material and there are no alternative regulations that supersede the standard concerned. The consolidated statement of income from the previous year and the opening balance of the consolidated statement of financial position for this comparative period are adjusted as if the new methods of recognition and measurement had always been applied.
128 Henkel Annual Report 2016Consolidated financial statements
Accounting estimates, assumptions and discretionary judgments
Preparation of the consolidated financial statements is based on a number of accounting estimates and assumptions. These have an impact on the reported amounts of assets, liabilities and contingent liabilities at the reporting date and the disclosure of income and expenses for the reporting period. The actual amounts may differ from these estimates.
The accounting estimates and their underlying assumptions are based on past experience and are continually reviewed. Changes in accounting estimates are recognized in the period in which the change takes place where such change exclusively affects that period. A change is recognized in the period in which it occurs and in later periods where such change affects both the reporting period and subsequent periods. The judgments of the Management Board regarding the application of those IFRSs which have a significant impact on the consolidated financial statements are presented in particular in the explanatory notes on taxes on income (Note 30 on pages 168 to 170), intangible assets (Note 1 on pages 131 to 134), provisions for pensions and similar obligations (Note 15 on pages 141 to 149), income tax pro-visions and other provisions (Note 16 on pages 149 and 150), financial instruments (Note 21 on pages 153 to 165) and share-based payment plans (Note 34 on page 172).
Material discretionary judgments are made in respect of the demarcation of the cash-generating units as explained in Note 1 on pages 131 to 134 and the segment reporting as explained in Note 35 on pages 172 to 174. Contingent forward contracts for acquired minority interests are recognized using the anticipated acquisition method.
New international accounting regulations according to International Financial Reporting Standards (IFRSs)
Accounting methods applied for the first time in the year under review 93
Mandatory for fiscal years beginning on
or after
IFRS 11 (Amendment) “Acquisition of an Interest in a Joint Operation” January 1, 2016
IAS 1 (Amendment) “Notes” January 1, 2016
IAS 16 and IAS 38 (Amendment) “Clarification of Acceptable Methods of Depreciation and Amortisation” January 1, 2016
IAS 19 (Amendment) “Defined Benefit Plans: Employee Contributions” February 1, 2015
General standard “Improvements to IFRS 2010 – 2012” February 1, 2015
General standard “Improvements to IFRS 2012 – 2014” January 1, 2016
IFRS 10, IFRS 12 and IAS 28 (Amendment) “Investment Entities: Applying the Consolidation Exception” January 1, 2016
• IFRS 11 governs the procedure for recognizing joint ventures and joint operations in both the statement of financial posi-tion and in profit or loss. Joint ventures must be recognized using the equity method, whereas the treatment of joint operations is comparable to proportionate consolidation, pursuant to IFRS 11. With its amendment of IFRS 11, the International Accounting Standards Board (IASB) has regu-lated the accounting procedure for acquisitions of interests in joint operations in which the activity constitutes a busi-ness, as defined in IFRS 3 “Business Combinations.” In the case of such operations, the acquirer is required to apply the principles of business combinations accounting in IFRS 3. The disclosure requirements specified in IFRS 3 also apply in such instances.
• The amendments relating to IAS 1 affect various reporting issues. The standard now clarifies that disclosures in the notes are only necessary if their content is not immaterial, which is explicitly the case if an IFRS specifies a list of mini-mum disclosures. Explanations on the procedure for aggre-gating and disaggregating items on the statements of finan-cial position and comprehensive income have also been included. The standard further requires contributions to other comprehensive income by companies that are recog-nized using the equity method to be reported in the state-ment of comprehensive income.
• In its amendments of IAS 16 and IAS 38, the IASB has pro-vided further guidance for determining acceptable methods of depreciation and amortization.
• The amendments to IAS 19 clarify the requirements govern-ing the allocation of contributions by employees or third parties to periods of service if the contributions are linked to the period of service. In addition, it permits a practical expe-dient if the amount of the contributions is independent of the number of years of service.
Notes to the consolidated financial statements 129Henkel Annual Report 2016
116 Consolidated statement of financial position
118 Consolidated statement of income
118 Consolidated statement of comprehensive income
119 Consolidated statement of changes in equity
120 Consolidated statement of cash flows
121 Group segment report by business unit
122 Key financials by region123 Accounting principles and
methods applied in preparation of the consolidated financial statements
131 Notes to the consolidated statement of financial position
166 Notes to the consolidated statement of income
171 Other disclosures179 Subsequent events
• As part of the annual improvement project “Improvements to IFRS 2010 – 2012,” amendments were made to seven stan-dards. Adjustments to the wording of individual IFRSs are intended to clarify existing regulations. Amendments affect-ing disclosures in the notes have also been implemented. The following standards are affected: IFRS 2, IFRS 3, IFRS 8, IFRS 13, IAS 16, IAS 24 and IAS 38.
• As part of the annual improvement project “Improvements to IFRS 2012 – 2014,” amendments were made to four stan-dards. Adjustments to the wording of individual IFRSs/IASs are intended to clarify existing regulations. The following standards are affected: IFRS 5, IFRS 7, IAS 19 and IAS 34.
• The amendments to IFRS 10, IFRS 12 and IAS 28 serve to clarify various issues relating to the application of the con-solidation exception under IFRS 10 if the parent company complies with the definition of an “investment entity.”
The first-time application of the amended standards had no material impact on the presentation of our consolidated financial statements.
Accounting regulations not applied in advance of their effective dateThe following standards and amendments to existing stan-dards of possible relevance to Henkel, which have been adopted into EU law (endorsement mechanism) but are not yet mandatory, have not been applied early:
Accounting regulations not applied in advance of their effective date 94
Mandatory for fiscal years beginning on
or after
IFRS 9 “Financial Instruments” January 1, 2018
IFRS 15 “Revenue from Contracts with Customers” January 1, 2018
These standards and amendments to existing standards will be applied by Henkel starting in fiscal 2018. We are currently examining what impact IFRS 15 “Revenue from Contracts with Customers” will have on the consolidated financial statements. Given the current situation, we expect a minor impact on sales and on cost of sales in the year of implementation due to the recognition of rights of return in the financial statements. A conclusive assessment of the effects is not possible at present. We are also currently examining what impact IFRS 9 “Financial Instruments” will have on the consolidated financial state-ments. A conclusive assessment of the effects is not possible.
Accounting regulations not yet adopted into EU lawIn fiscal 2016, the IASB issued the following standards and amendments to existing standards of relevance to Henkel, which still have to be adopted into EU law (endorsement mechanism) before they become applicable:
Accounting regulations not yet adopted into EU law 95
Mandatory for fiscal years beginning on
or after
IFRS 16 “Leases” January 1, 2019
IFRS 2 (Amendment) “Classification and Measurement of Share-Based Payment Transactions” January 1, 2018
IFRS 10 and IAS 28 (Amendment) “Sale or Contribution of Assets between an Investor and its Associate or Joint Venture” outstanding
IFRS 15 (Amendment) “Clarifications to IFRS 15” January 1, 2018
IAS 7 (Amendment) “Disclosure Initiative” January 1, 2017
IAS 12 (Amendment) “Recognition of Deferred Tax Assets for Unrealised Losses” January 1, 2017
IAS 40 (Amendment) “Transfers of Investment Property” January 1, 2018
IFRIC 22 “Foreign Currency Transactions and Advance Consideration” January 1, 2018
Improvements to IFRS 2014 – 2016 “Amendments to IFRS 12” January 1, 2017
Improvements to IFRS 2014 – 2016 “Amendments to IFRS 1 and IAS 28” January 1, 2018
These new standards and amendments to existing standards will be applied by Henkel starting in fiscal 2017 or later. A con-clusive assessment of the effects is not possible.
130 Henkel Annual Report 2016Consolidated financial statements
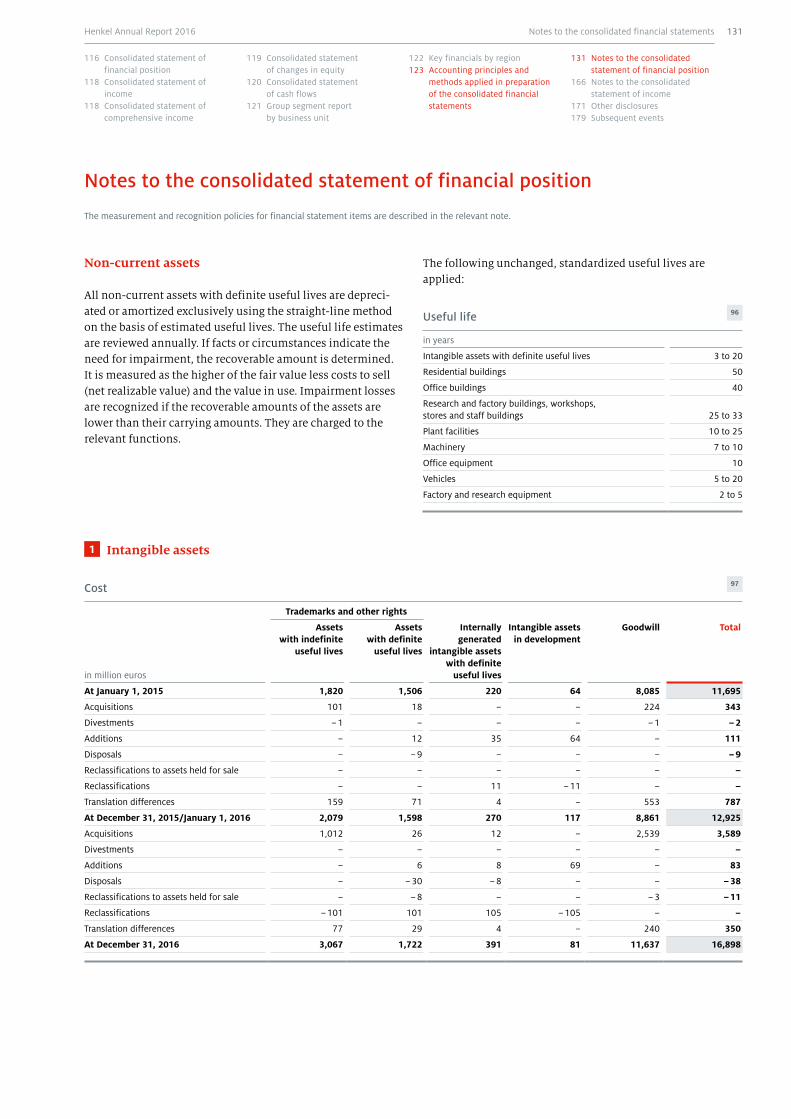
Notes to the consolidated statement of financial position
The measurement and recognition policies for financial statement items are described in the relevant note.
Non-current assets
All non-current assets with definite useful lives are depreci-ated or amortized exclusively using the straight-line method on the basis of estimated useful lives. The useful life estimates are reviewed annually. If facts or circumstances indicate the need for impairment, the recoverable amount is determined. It is measured as the higher of the fair value less costs to sell (net realizable value) and the value in use. Impairment losses are recognized if the recoverable amounts of the assets are lower than their carrying amounts. They are charged to the relevant functions.
The following unchanged, standardized useful lives are applied:
Useful life 96
in years
Intangible assets with definite useful lives 3 to 20
Residential buildings 50
Office buildings 40
Research and factory buildings, workshops, stores and staff buildings 25 to 33
Plant facilities 10 to 25
Machinery 7 to 10
Office equipment 10
Vehicles 5 to 20
Factory and research equipment 2 to 5
1 Intangible assets
Cost 97
in million euros
Trademarks and other rights
Assets with indefinite
useful lives
Assets with definite
useful lives
Internally generated
intangible assets with definite
useful lives
Intangible assets in development
Goodwill Total
At January 1, 2015 1,820 1,506 220 64 8,085 11,695
Acquisitions 101 18 – – 224 343
Divestments – 1 – – – – 1 – 2
Additions – 12 35 64 – 111
Disposals – – 9 – – – – 9
Reclassifications to assets held for sale – – – – – –
Reclassifications – – 11 – 11 – –
Translation differences 159 71 4 – 553 787
At December 31, 2015/January 1, 2016 2,079 1,598 270 117 8,861 12,925
Acquisitions 1,012 26 12 – 2,539 3,589
Divestments – – – – – –
Additions – 6 8 69 – 83
Disposals – – 30 – 8 – – – 38
Reclassifications to assets held for sale – – 8 – – – 3 – 11
Reclassifications – 101 101 105 – 105 – –
Translation differences 77 29 4 – 240 350
At December 31, 2016 3,067 1,722 391 81 11,637 16,898
Notes to the consolidated financial statements 131Henkel Annual Report 2016
116 Consolidated statement of financial position
118 Consolidated statement of income
118 Consolidated statement of comprehensive income
119 Consolidated statement of changes in equity
120 Consolidated statement of cash flows
121 Group segment report by business unit
122 Key financials by region123 Accounting principles and
methods applied in preparation of the consolidated financial statements
131 Notes to the consolidated statement of financial position
166 Notes to the consolidated statement of income
171 Other disclosures179 Subsequent events
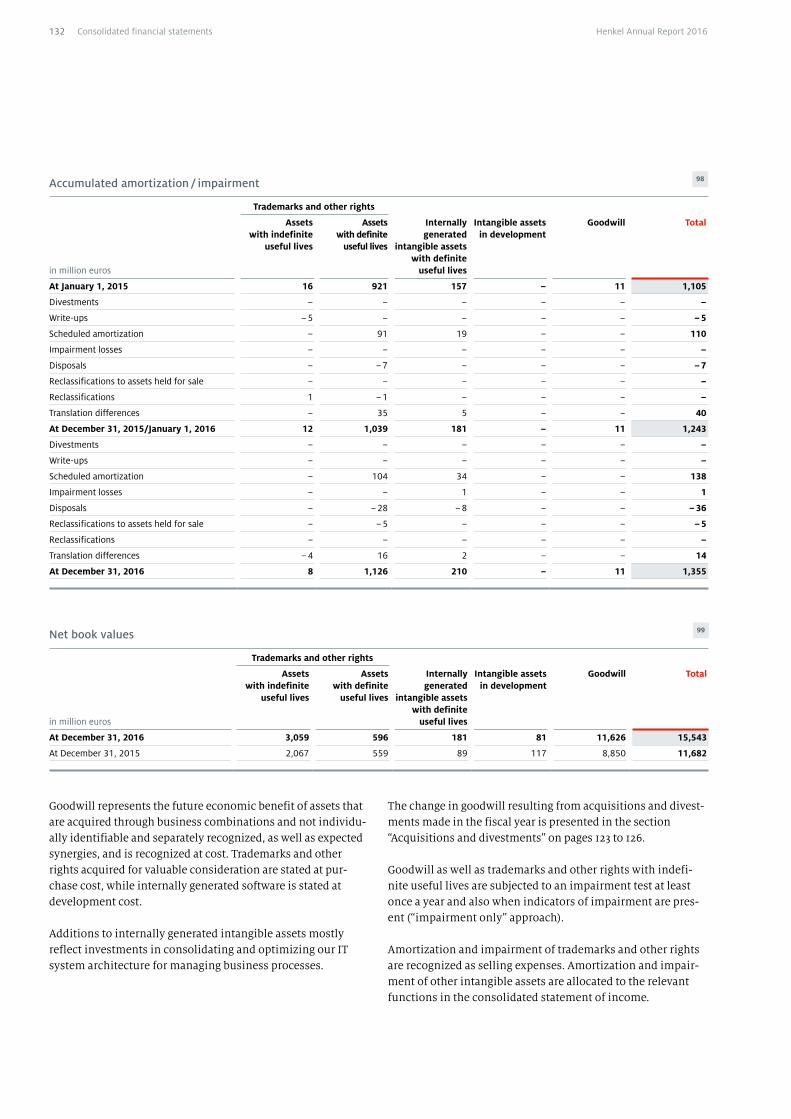
Accumulated amortization / impairment 98
Trademarks and other rights
in million euros
Assets with indefinite
useful lives
Assets with definite
useful lives
Internally generated
intangible assets with definite
useful lives
Intangible assets in development
Goodwill Total
At January 1, 2015 16 921 157 – 11 1,105
Divestments – – – – – –
Write-ups – 5 – – – – – 5
Scheduled amortization – 91 19 – – 110
Impairment losses – – – – – –
Disposals – – 7 – – – – 7
Reclassifications to assets held for sale – – – – – –
Reclassifications 1 – 1 – – – –
Translation differences – 35 5 – – 40
At December 31, 2015/January 1, 2016 12 1,039 181 – 11 1,243
Divestments – – – – – –
Write-ups – – – – – –
Scheduled amortization – 104 34 – – 138
Impairment losses – – 1 – – 1
Disposals – – 28 – 8 – – – 36
Reclassifications to assets held for sale – – 5 – – – – 5
Reclassifications – – – – – –
Translation differences – 4 16 2 – – 14
At December 31, 2016 8 1,126 210 – 11 1,355
Net book values 99
Trademarks and other rights
in million euros
Assets with indefinite
useful lives
Assets with definite
useful lives
Internally generated
intangible assets with definite
useful lives
Intangible assets in development
Goodwill Total
At December 31, 2016 3,059 596 181 81 11,626 15,543
At December 31, 2015 2,067 559 89 117 8,850 11,682
Goodwill represents the future economic benefit of assets that are acquired through business combinations and not individu-ally identifiable and separately recognized, as well as expected synergies, and is recognized at cost. Trademarks and other rights acquired for valuable consideration are stated at pur-chase cost, while internally generated software is stated at development cost.
Additions to internally generated intangible assets mostly reflect investments in consolidating and optimizing our IT system architecture for managing business processes.
The change in goodwill resulting from acquisitions and divest-ments made in the fiscal year is presented in the section “Acquisitions and divestments” on pages 123 to 126.
Goodwill as well as trademarks and other rights with indefi-nite useful lives are subjected to an impairment test at least once a year and also when indicators of impairment are pres-ent (“impairment only” approach).
Amortization and impairment of trademarks and other rights are recognized as selling expenses. Amortization and impair-ment of other intangible assets are allocated to the relevant functions in the consolidated statement of income.
132 Henkel Annual Report 2016Consolidated financial statements
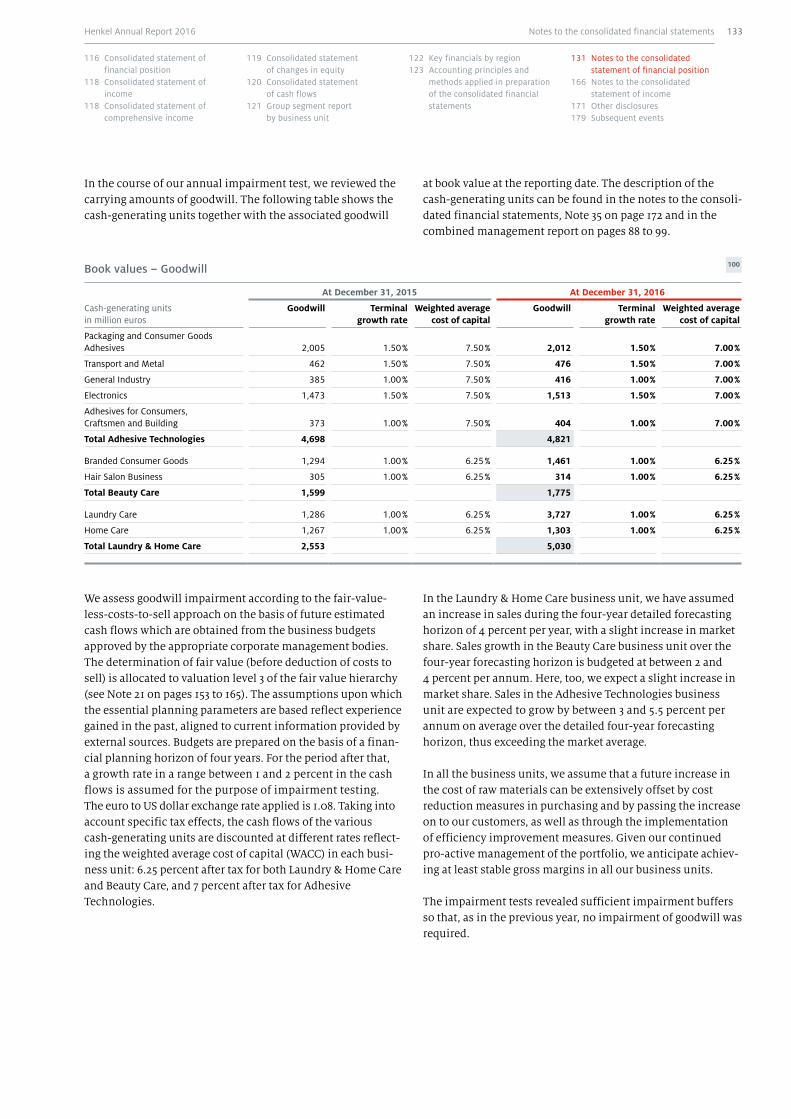
In the course of our annual impairment test, we reviewed the carrying amounts of goodwill. The following table shows the cash-generating units together with the associated goodwill
Book values – Goodwill 100
Cash-generating units in million euros
At December 31, 2015 At December 31, 2016
Goodwill Terminal growth rate
Weighted average cost of capital
Goodwill Terminal growth rate
Weighted average cost of capital
Packaging and Consumer Goods Adhesives 2,005 1.50 % 7.50 % 2,012 1.50 % 7.00 %
Transport and Metal 462 1.50 % 7.50 % 476 1.50 % 7.00 %
General Industry 385 1.00 % 7.50 % 416 1.00 % 7.00 %
Electronics 1,473 1.50 % 7.50 % 1,513 1.50 % 7.00 %
Adhesives for Consumers, Craftsmen and Building 373 1.00 % 7.50 % 404 1.00 % 7.00 %
Total Adhesive Technologies 4,698 4,821
Branded Consumer Goods 1,294 1.00 % 6.25 % 1,461 1.00 % 6.25 %
Hair Salon Business 305 1.00 % 6.25 % 314 1.00 % 6.25 %
Total Beauty Care 1,599 1,775
Laundry Care 1,286 1.00 % 6.25 % 3,727 1.00 % 6.25 %
Home Care 1,267 1.00 % 6.25 % 1,303 1.00 % 6.25 %
Total Laundry & Home Care 2,553 5,030
We assess goodwill impairment according to the fair-value-less-costs-to-sell approach on the basis of future estimated cash flows which are obtained from the business budgets approved by the appropriate corporate management bodies. The determination of fair value (before deduction of costs to sell) is allocated to valuation level 3 of the fair value hierarchy (see Note 21 on pages 153 to 165). The assumptions upon which the essential planning parameters are based reflect experience gained in the past, aligned to current information provided by external sources. Budgets are prepared on the basis of a finan-cial planning horizon of four years. For the period after that, a growth rate in a range between 1 and 2 percent in the cash flows is assumed for the purpose of impairment testing. The euro to US dollar exchange rate applied is 1.08. Taking into account specific tax effects, the cash flows of the various cash-generating units are discounted at different rates reflect-ing the weighted average cost of capital (WACC) in each busi-ness unit: 6.25 percent after tax for both Laundry & Home Care and Beauty Care, and 7 percent after tax for Adhesive Technologies.
In the Laundry & Home Care business unit, we have assumed an increase in sales during the four-year detailed forecasting horizon of 4 percent per year, with a slight increase in market share. Sales growth in the Beauty Care business unit over the four-year forecasting horizon is budgeted at between 2 and 4 percent per annum. Here, too, we expect a slight increase in market share. Sales in the Adhesive Technologies business unit are expected to grow by between 3 and 5.5 percent per annum on average over the detailed four-year forecasting horizon, thus exceeding the market average.
In all the business units, we assume that a future increase in the cost of raw materials can be extensively offset by cost reduction measures in purchasing and by passing the increase on to our customers, as well as through the implementation of efficiency improvement measures. Given our continued pro-active management of the portfolio, we anticipate achiev-ing at least stable gross margins in all our business units.
The impairment tests revealed sufficient impairment buffers so that, as in the previous year, no impairment of goodwill was required.
at book value at the reporting date. The description of the cash-generating units can be found in the notes to the consoli-dated financial statements, Note 35 on page 172 and in the combined management report on pages 88 to 99.
Notes to the consolidated financial statements 133Henkel Annual Report 2016
116 Consolidated statement of financial position
118 Consolidated statement of income
118 Consolidated statement of comprehensive income
119 Consolidated statement of changes in equity
120 Consolidated statement of cash flows
121 Group segment report by business unit
122 Key financials by region123 Accounting principles and
methods applied in preparation of the consolidated financial statements
131 Notes to the consolidated statement of financial position
166 Notes to the consolidated statement of income
171 Other disclosures179 Subsequent events

Trademarks and other rights with indefinite useful lives are presented in the following table.
Book values – Trademarks and other rights 101
Cash-generating units (summarized) in million euros
At December 31, 2015 At December 31, 2016
Trademarks and other rights
with indefinite useful lives
Terminal growth rate
Weighted average cost of capital
Trademarks and other rights
with indefinite useful lives
Terminal growth rate
Weighted average cost of capital
Packaging and Consumer Goods Adhesives 51 1.50 % 7.50 % 51 1.50 % 7.00 %
Transport and Metal 14 1.50 % 7.50 % 18 1.50 % 7.00 %
General Industry 0 1.00 % 7.50 % – 1.00 % 7.00 %
Electronics 90 1.50 % 7.50 % 90 1.50 % 7.00 %
Adhesives for Consumers, Craftsmen and Building 68 1.00 % 7.50 % 67 1.00 % 7.00 %
Total Adhesive Technologies 223 226
Branded Consumer Goods 572 0.20 – 1.80 % 6.25 – 9.50 % 603 0.20 – 1.80 % 6.25 – 9.00 %
Hair Salon Business 121 0.20 – 1.80 % 6.25 – 9.80 % 124 0.20 – 1.80 % 6.25 – 7.80 %
Total Beauty Care 693 727
Laundry Care 779 1.00 – 1.80 % 6.25 – 12.30 % 1,745 1.00 – 2.00 % 6.25 – 14.40 %
Home Care 372 1.00 – 1.80 % 6.25 – 11.50 % 361 1.00 – 2.00 % 6.25 – 14.30 %
Total Laundry & Home Care 1,151 2,106
We assess impairment of trademarks and other rights with indefinite useful lives according to the fair-value-less-costs-to-sell approach at the level of the cash-generating unit, which consists of either global business units (Adhesive Technolo-gies) or regional strategic business units. We base the approach on future estimated cash flows which are obtained from business budgets. The determination of fair value (before deduction of costs to sell) is allocated to valuation level 3 of the fair value hierarchy (see Note 21 on pages 153 to 165). The assumptions upon which the essential planning parameters are based reflect experience gained in the past, aligned to cur-rent information provided by external sources. Budgets are prepared on the basis of a financial planning horizon of four years. For the period after that, a growth rate in a range between 0.2 and 2 percent in the cash flows is assumed for the purpose of impairment testing. The euro to US dollar exchange rate applied is 1.08. Taking into account specific tax effects, the cash flows of the various cash-generating units are dis-counted at different rates, with a range between 6.25 and 14.40 percent applied as the applicable weighted average cost of capital (WACC) to each cash-generating unit. The impair-ment tests revealed sufficient impairment buffers so that – as in the previous year – no impairment of trademarks and other rights with indefinite useful lives was required.
The trademarks and other rights with indefinite useful lives with a net book value of 3,059 million euros (previous year: 2,067 million euros) are established in their markets and will continue to be intensively promoted. Moreover, there are no other statutory, regulatory or competition-related factors that limit our usage of our brand names.
Our annual impairment tests on trademarks and other rights with indefinite useful lives required impairment losses of 0 million euros (previous year: 0 million euros). Following the acquisition of The Sun Products Corporation and the associ-ated integration and restructuring measures, trademark book values with indefinite useful lives were reclassified to trade-marks with finite useful lives in an amount of 101 million euros. The scheduled amortization ends in December 2017. In 2016, amortization of around 14 million euros was recognized.
The company also intends to continue using the brands disclosed as having definite useful lives. No impairment losses were registered with respect to trademarks and other rights with definite useful lives in 2016.
134 Henkel Annual Report 2016Consolidated financial statements
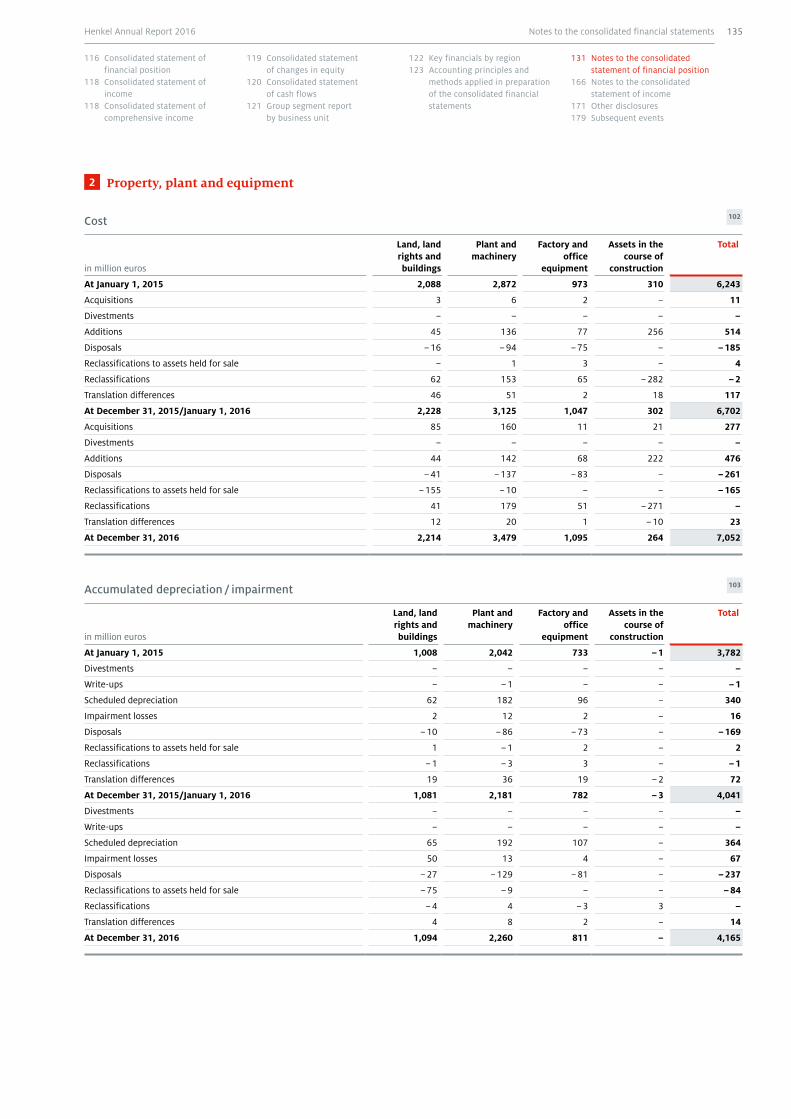
2 Property, plant and equipment
Cost 102
in million euros
Land, land rights and buildings
Plant and machinery
Factory and office
equipment
Assets in the course of
construction
Total
At January 1, 2015 2,088 2,872 973 310 6,243
Acquisitions 3 6 2 – 11
Divestments – – – – –
Additions 45 136 77 256 514
Disposals – 16 – 94 – 75 – – 185
Reclassifications to assets held for sale – 1 3 – 4
Reclassifications 62 153 65 – 282 – 2
Translation differences 46 51 2 18 117
At December 31, 2015/January 1, 2016 2,228 3,125 1,047 302 6,702
Acquisitions 85 160 11 21 277
Divestments – – – – –
Additions 44 142 68 222 476
Disposals – 41 – 137 – 83 – – 261
Reclassifications to assets held for sale – 155 – 10 – – – 165
Reclassifications 41 179 51 – 271 –
Translation differences 12 20 1 – 10 23
At December 31, 2016 2,214 3,479 1,095 264 7,052
Accumulated depreciation / impairment 103
in million euros
Land, land rights and buildings
Plant and machinery
Factory and office
equipment
Assets in the course of
construction
Total
At January 1, 2015 1,008 2,042 733 – 1 3,782
Divestments – – – – –
Write-ups – – 1 – – – 1
Scheduled depreciation 62 182 96 – 340
Impairment losses 2 12 2 – 16
Disposals – 10 – 86 – 73 – – 169
Reclassifications to assets held for sale 1 – 1 2 – 2
Reclassifications – 1 – 3 3 – – 1
Translation differences 19 36 19 – 2 72
At December 31, 2015/January 1, 2016 1,081 2,181 782 – 3 4,041
Divestments – – – – –
Write-ups – – – – –
Scheduled depreciation 65 192 107 – 364
Impairment losses 50 13 4 – 67
Disposals – 27 – 129 – 81 – – 237
Reclassifications to assets held for sale – 75 – 9 – – – 84
Reclassifications – 4 4 – 3 3 –
Translation differences 4 8 2 – 14
At December 31, 2016 1,094 2,260 811 – 4,165
Notes to the consolidated financial statements 135Henkel Annual Report 2016
116 Consolidated statement of financial position
118 Consolidated statement of income
118 Consolidated statement of comprehensive income
119 Consolidated statement of changes in equity
120 Consolidated statement of cash flows
121 Group segment report by business unit
122 Key financials by region123 Accounting principles and
methods applied in preparation of the consolidated financial statements
131 Notes to the consolidated statement of financial position
166 Notes to the consolidated statement of income
171 Other disclosures179 Subsequent events
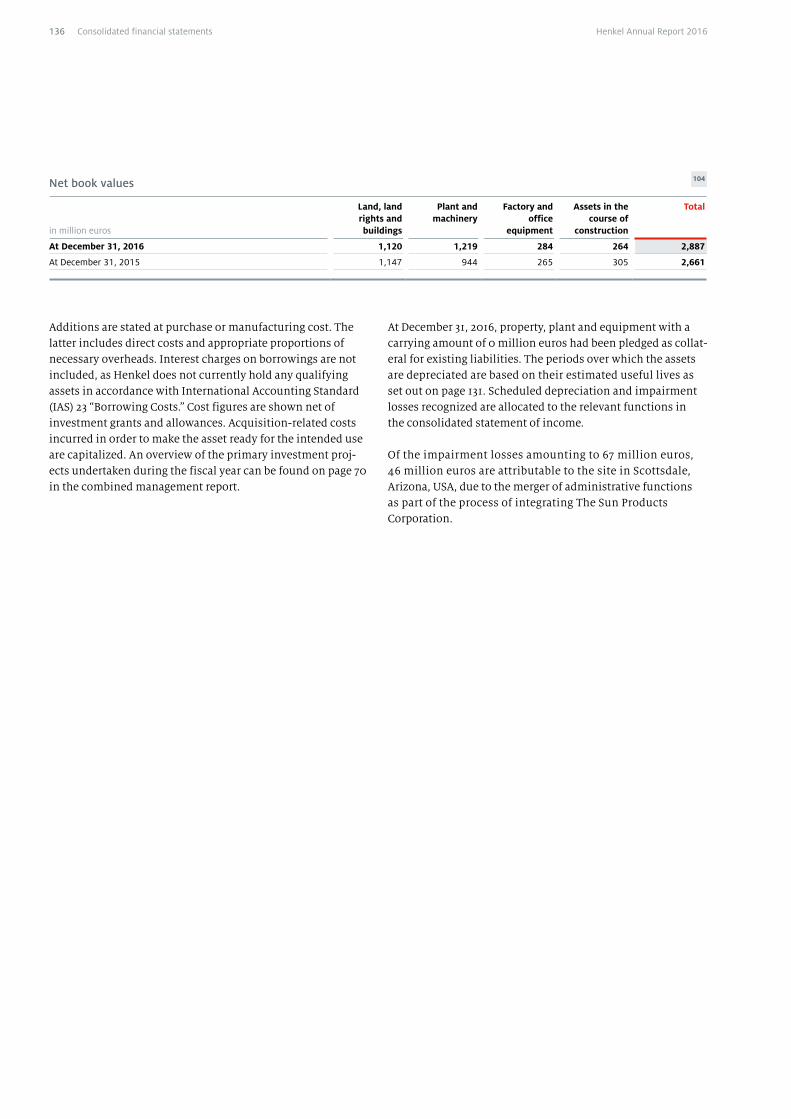
Net book values 104
in million euros
Land, land rights and buildings
Plant and machinery
Factory and office
equipment
Assets in the course of
construction
Total
At December 31, 2016 1,120 1,219 284 264 2,887
At December 31, 2015 1,147 944 265 305 2,661
Additions are stated at purchase or manufacturing cost. The latter includes direct costs and appropriate proportions of necessary overheads. Interest charges on borrowings are not included, as Henkel does not currently hold any qualifying assets in accordance with International Accounting Standard (IAS) 23 “Borrowing Costs.” Cost figures are shown net of investment grants and allowances. Acquisition-related costs incurred in order to make the asset ready for the intended use are capitalized. An overview of the primary investment proj-ects undertaken during the fiscal year can be found on page 70 in the combined management report.
At December 31, 2016, property, plant and equipment with a carrying amount of 0 million euros had been pledged as collat-eral for existing liabilities. The periods over which the assets are depreciated are based on their estimated useful lives as set out on page 131. Scheduled depreciation and impairment losses recognized are allocated to the relevant functions in the consolidated statement of income.
Of the impairment losses amounting to 67 million euros, 46 million euros are attributable to the site in Scottsdale, Arizona, USA, due to the merger of administrative functions as part of the process of integrating The Sun Products Corporation.
136 Henkel Annual Report 2016Consolidated financial statements
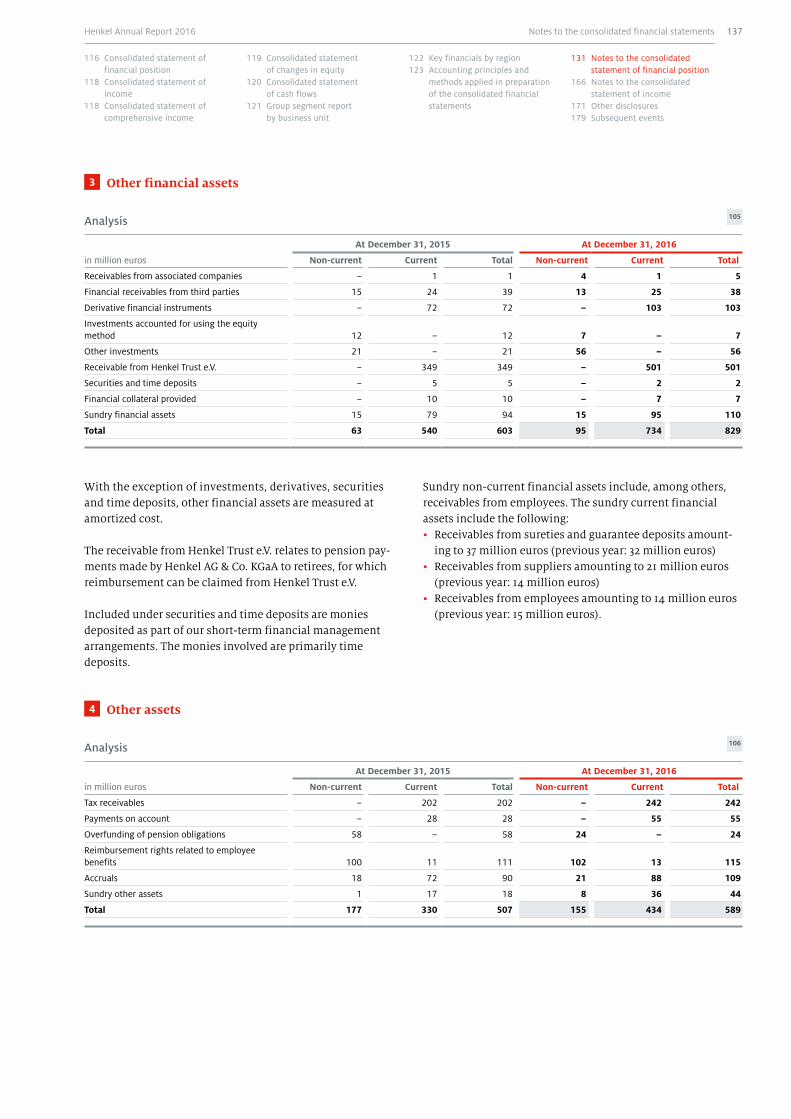
3 Other financial assets
Analysis 105
in million euros
At December 31, 2015 At December 31, 2016
Non-current Current Total Non-current Current Total
Receivables from associated companies – 1 1 4 1 5
Financial receivables from third parties 15 24 39 13 25 38
Derivative financial instruments – 72 72 – 103 103
Investments accounted for using the equity method 12 – 12 7 – 7
Other investments 21 – 21 56 – 56
Receivable from Henkel Trust e.V. – 349 349 – 501 501
Securities and time deposits – 5 5 – 2 2
Financial collateral provided – 10 10 – 7 7
Sundry financial assets 15 79 94 15 95 110
Total 63 540 603 95 734 829
With the exception of investments, derivatives, securities and time deposits, other financial assets are measured at amortized cost.
The receivable from Henkel Trust e.V. relates to pension pay-ments made by Henkel AG & Co. KGaA to retirees, for which reimbursement can be claimed from Henkel Trust e.V.
Included under securities and time deposits are monies deposited as part of our short-term financial management arrangements. The monies involved are primarily time deposits.
Sundry non-current financial assets include, among others, receivables from employees. The sundry current financial assets include the following:• Receivables from sureties and guarantee deposits amount-
ing to 37 million euros (previous year: 32 million euros)• Receivables from suppliers amounting to 21 million euros
(previous year: 14 million euros)• Receivables from employees amounting to 14 million euros
(previous year: 15 million euros).
4 Other assets
Analysis 106
in million euros
At December 31, 2015 At December 31, 2016
Non-current Current Total Non-current Current Total
Tax receivables – 202 202 – 242 242
Payments on account – 28 28 – 55 55
Overfunding of pension obligations 58 – 58 24 – 24
Reimbursement rights related to employee benefits 100 11 111 102 13 115
Accruals 18 72 90 21 88 109
Sundry other assets 1 17 18 8 36 44
Total 177 330 507 155 434 589
Notes to the consolidated financial statements 137Henkel Annual Report 2016
116 Consolidated statement of financial position
118 Consolidated statement of income
118 Consolidated statement of comprehensive income
119 Consolidated statement of changes in equity
120 Consolidated statement of cash flows
121 Group segment report by business unit
122 Key financials by region123 Accounting principles and
methods applied in preparation of the consolidated financial statements
131 Notes to the consolidated statement of financial position
166 Notes to the consolidated statement of income
171 Other disclosures179 Subsequent events
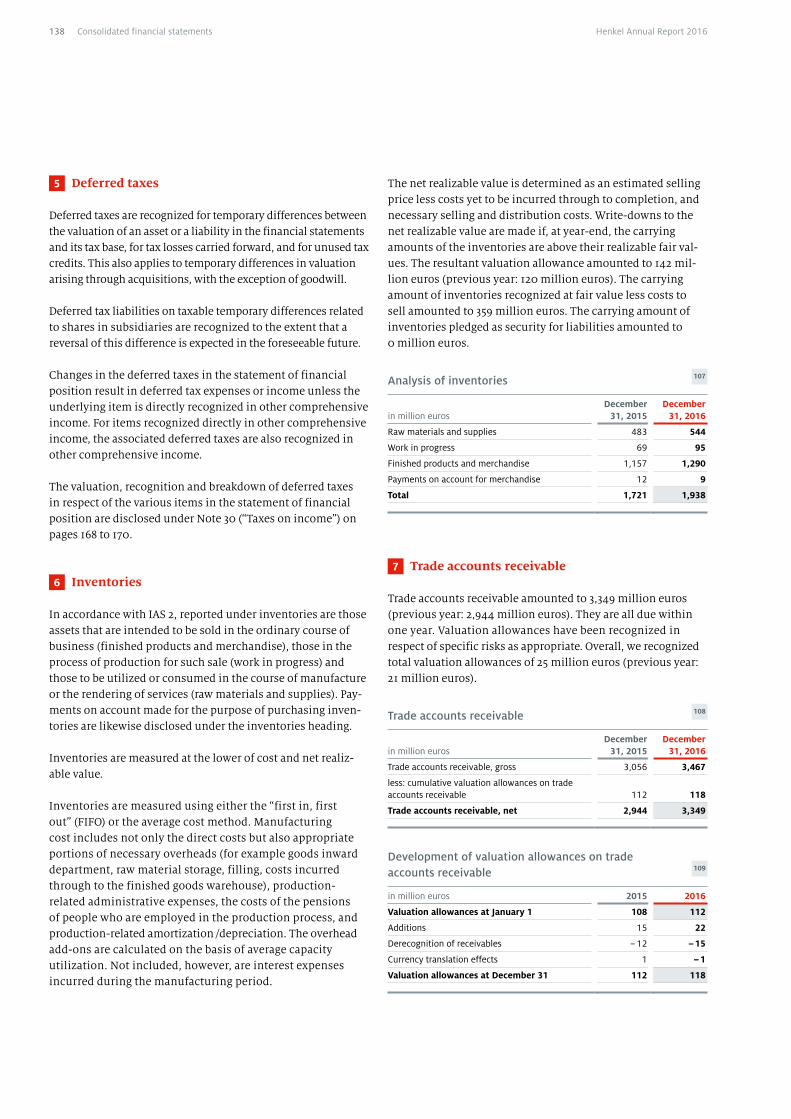
5 Deferred taxes
Deferred taxes are recognized for temporary differences between the valuation of an asset or a liability in the financial statements and its tax base, for tax losses carried forward, and for unused tax credits. This also applies to temporary differences in valuation arising through acquisitions, with the exception of goodwill.
Deferred tax liabilities on taxable temporary differences related to shares in subsidiaries are recognized to the extent that a reversal of this difference is expected in the foreseeable future.
Changes in the deferred taxes in the statement of financial position result in deferred tax expenses or income unless the underlying item is directly recognized in other comprehensive income. For items recognized directly in other comprehensive income, the associated deferred taxes are also recognized in other comprehensive income.
The valuation, recognition and breakdown of deferred taxes in respect of the various items in the statement of financial position are disclosed under Note 30 (“Taxes on income”) on pages 168 to 170.
6 Inventories
In accordance with IAS 2, reported under inventories are those assets that are intended to be sold in the ordinary course of business (finished products and merchandise), those in the process of production for such sale (work in progress) and those to be utilized or consumed in the course of manufacture or the rendering of services (raw materials and supplies). Pay-ments on account made for the purpose of purchasing inven-tories are likewise disclosed under the inventories heading.
Inventories are measured at the lower of cost and net realiz-able value.
Inventories are measured using either the “first in, first out” (FIFO) or the average cost method. Manufacturing cost includes not only the direct costs but also appropriate portions of necessary overheads (for example goods inward department, raw material storage, filling, costs incurred through to the finished goods warehouse), production- related administrative expenses, the costs of the pensions of people who are employed in the production process, and production- related amortization /depreciation. The overhead add-ons are calculated on the basis of average capacity utilization. Not included, however, are interest expenses incurred during the manufacturing period.
The net realizable value is determined as an estimated selling price less costs yet to be incurred through to completion, and necessary selling and distribution costs. Write-downs to the net realizable value are made if, at year-end, the carrying amounts of the inventories are above their realizable fair val-ues. The resultant valuation allowance amounted to 142 mil-lion euros (previous year: 120 million euros). The carrying amount of inventories recognized at fair value less costs to sell amounted to 359 million euros. The carrying amount of inventories pledged as security for liabilities amounted to 0 million euros.
Analysis of inventories 107
in million eurosDecember
31, 2015December
31, 2016
Raw materials and supplies 483 544
Work in progress 69 95
Finished products and merchandise 1,157 1,290
Payments on account for merchandise 12 9
Total 1,721 1,938
7 Trade accounts receivable
Trade accounts receivable amounted to 3,349 million euros (previous year: 2,944 million euros). They are all due within one year. Valuation allowances have been recognized in respect of specific risks as appropriate. Overall, we recognized total valuation allowances of 25 million euros (previous year: 21 million euros).
Trade accounts receivable 108
in million eurosDecember
31, 2015December
31, 2016
Trade accounts receivable, gross 3,056 3,467
less: cumulative valuation allowances on trade accounts receivable 112 118
Trade accounts receivable, net 2,944 3,349
Development of valuation allowances on trade accounts receivable 109
in million euros 2015 2016
Valuation allowances at January 1 108 112
Additions 15 22
Derecognition of receivables – 12 – 15
Currency translation effects 1 – 1
Valuation allowances at December 31 112 118
138 Henkel Annual Report 2016Consolidated financial statements
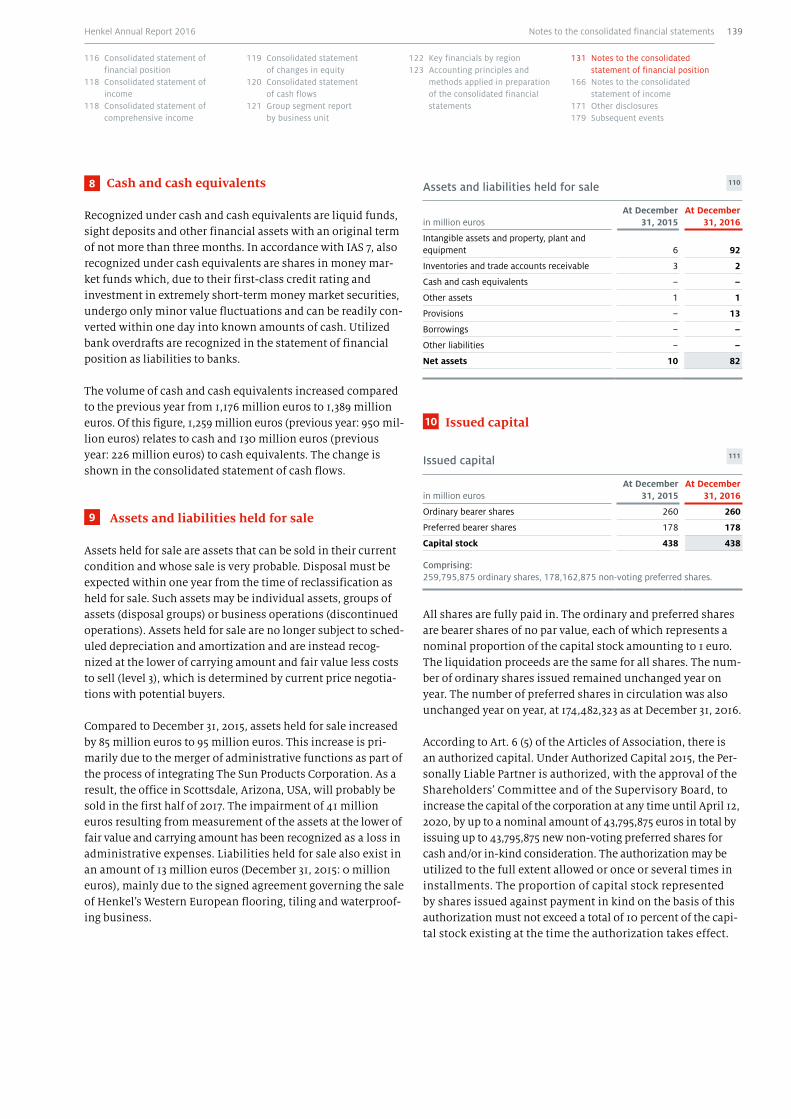
8 Cash and cash equivalents
Recognized under cash and cash equivalents are liquid funds, sight deposits and other financial assets with an original term of not more than three months. In accordance with IAS 7, also recognized under cash equivalents are shares in money mar-ket funds which, due to their first-class credit rating and investment in extremely short-term money market securities, undergo only minor value fluctuations and can be readily con-verted within one day into known amounts of cash. Utilized bank overdrafts are recognized in the statement of financial position as liabilities to banks.
The volume of cash and cash equivalents increased compared to the previous year from 1,176 million euros to 1,389 million euros. Of this figure, 1,259 million euros (previous year: 950 mil-lion euros) relates to cash and 130 million euros (previous year: 226 million euros) to cash equivalents. The change is shown in the consolidated statement of cash flows.
All shares are fully paid in. The ordinary and preferred shares are bearer shares of no par value, each of which represents a nominal proportion of the capital stock amounting to 1 euro. The liquidation proceeds are the same for all shares. The num-ber of ordinary shares issued remained unchanged year on year. The number of preferred shares in circulation was also unchanged year on year, at 174,482,323 as at December 31, 2016.
According to Art. 6 (5) of the Articles of Association, there is an authorized capital. Under Authorized Capital 2015, the Per-sonally Liable Partner is authorized, with the approval of the Shareholders’ Committee and of the Supervisory Board, to increase the capital of the corporation at any time until April 12, 2020, by up to a nominal amount of 43,795,875 euros in total by issuing up to 43,795,875 new non-voting preferred shares for cash and/or in-kind consideration. The authorization may be utilized to the full extent allowed or once or several times in installments. The proportion of capital stock represented by shares issued against payment in kind on the basis of this authorization must not exceed a total of 10 percent of the capi-tal stock existing at the time the authorization takes effect.
9 Assets and liabilities held for sale
Assets held for sale are assets that can be sold in their current condition and whose sale is very probable. Disposal must be expected within one year from the time of reclassification as held for sale. Such assets may be individual assets, groups of assets (disposal groups) or business operations (discontinued operations). Assets held for sale are no longer subject to sched-uled depreciation and amortization and are instead recog-nized at the lower of carrying amount and fair value less costs to sell (level 3), which is determined by current price negotia-tions with potential buyers.
Compared to December 31, 2015, assets held for sale increased by 85 million euros to 95 million euros. This increase is pri-marily due to the merger of administrative functions as part of the process of integrating The Sun Products Corporation. As a result, the office in Scottsdale, Arizona, USA, will probably be sold in the first half of 2017. The impairment of 41 million euros resulting from measurement of the assets at the lower of fair value and carrying amount has been recognized as a loss in administrative expenses. Liabilities held for sale also exist in an amount of 13 million euros (December 31, 2015: 0 million euros), mainly due to the signed agreement governing the sale of Henkel’s Western European flooring, tiling and waterproof-ing business.
Assets and liabilities held for sale 110
in million eurosAt December
31, 2015At December
31, 2016
Intangible assets and property, plant and equipment 6 92
Inventories and trade accounts receivable 3 2
Cash and cash equivalents – –
Other assets 1 1
Provisions – 13
Borrowings – –
Other liabilities – –
Net assets 10 82
10 Issued capital
Issued capital 111
in million eurosAt December
31, 2015At December
31, 2016
Ordinary bearer shares 260 260
Preferred bearer shares 178 178
Capital stock 438 438
Comprising: 259,795,875 ordinary shares, 178,162,875 non-voting preferred shares.
Notes to the consolidated financial statements 139Henkel Annual Report 2016
116 Consolidated statement of financial position
118 Consolidated statement of income
118 Consolidated statement of comprehensive income
119 Consolidated statement of changes in equity
120 Consolidated statement of cash flows
121 Group segment report by business unit
122 Key financials by region123 Accounting principles and
methods applied in preparation of the consolidated financial statements
131 Notes to the consolidated statement of financial position
166 Notes to the consolidated statement of income
171 Other disclosures179 Subsequent events
11 Capital reserve
The capital reserve comprises the amounts received in previ-ous years in excess of the nominal value of preferred shares and convertible warrant bonds issued by Henkel AG & Co. KGaA.
12 Retained earnings
Recognized in retained earnings are the following:• Amounts allocated in the financial statements of Henkel AG
& Co. KGaA in previous years• Amounts allocated from consolidated net income less those
amounts attributable to non-controlling interests• Buy-back of treasury shares by Henkel AG & Co. KGaA at cost
and the proceeds from their disposal• Actuarial gains and losses recognized in equity• The acquisition or disposal of ownership interests in
subsidiaries with no change in control• Valuation effects following application of the anticipated
acquisition method
For details on the acquisition of ownership interests in subsid-iaries with no change in control in fiscal 2016, please see the section “Acquisitions and divestments” on pages 123 to 126.
13 Other components of equity
Reported under this heading are differences reported in equity arising from the currency translation of annual financial state-ments of foreign subsidiaries and also the effects arising from the valuation in total comprehensive income of financial assets in the “Available for sale” category and of derivative financial instruments for which hedge accounting is used. The latter are derivatives used in connection with cash flow hedges or hedges of a net investment in a foreign entity. Due in particular to the appreciation of the US dollar versus the euro, the negative differ-ence attributable to shareholders of Henkel AG & Co. KGaA aris-ing from currency translation decreased compared to the figure at December 31, 2015, by 134 million euros to –7 million euros.
14 Non-controlling interests
Recognized under non-controlling interests are equity shares held by third parties measured on the basis of the proportion of net assets.
The Personally Liable Partner is authorized, with the approval of the Shareholders’ Committee and of the Supervisory Board, to set aside the pre-emptive rights of shareholders in the case of a capital increase against payment in kind, particularly for the purpose of business combinations or the (direct or indi-rect) acquisition of entities, operations, parts of businesses, equity interests or other assets, including claims against the corporation or companies dependent upon it within the mean-ing of Section 17 of the German Stock Corporation Act [AktG].
If capital is increased against payment in cash, all sharehold-ers are essentially assigned pre-emptive rights. However, these may be set aside where necessary, subject to the approval of the Shareholders’ Committee and of the Supervisory Board, in order to dispose of fractional amounts or to grant to holders of bonds with warrants or conversion rights issued by the corpo-ration, or one of the companies dependent upon it, pre-emp-tive rights corresponding to those that would accrue to such bondholders following the exercise of their warrant or conver-sion rights or on fulfillment of their conversion obligations, or if the issue price of the new shares is not significantly below the quoted market price at the time of issue price fixing.
In addition, the Personally Liable Partner is authorized to pur-chase ordinary and/or preferred shares of the corporation at any time until April 12, 2020, up to a maximum nominal pro-portion of the capital stock of 10 percent. This authorization can be exercised for any legal purpose. To the exclusion of the pre-emptive rights of existing shareholders, treasury shares may, in particular, be transferred to third parties for the pur-pose of acquiring entities or participating interests of entities. Treasury shares may also be sold to third parties against pay-ment in cash, provided that the selling price is not signifi-cantly below the quoted market price at the time of share dis-posal. The shares may likewise be used to satisfy warrants or conversion rights granted by the corporation. The Personally Liable Partner has also been authorized, with the approval of the Shareholders’ Committee and of the Supervisory Board, to cancel treasury shares without the need for further resolution by the Annual General Meeting.
Insofar as shares are issued or used to the exclusion of pre- emptive rights, the proportion of capital stock represented by such shares shall not exceed 10 percent.
Treasury shares held by the corporation at December 31, 2016 amounted to 3,680,552 preferred shares (December 31, 2015: 3,680,552). This represents 0.84 percent of the capital stock and a proportional nominal value of 3.7 million euros.
See also the explanatory notes on pages 31 and 32 of the com-bined management report.
140 Henkel Annual Report 2016Consolidated financial statements

15 Provisions for pensions and similar obligations
Description of the pension plansEmployees in companies included in the consolidated finan-cial statements have entitlements under company pension plans which are either defined contribution or defined benefit plans. These take different forms depending on the legal, financial and tax regimes of each country. The level of benefits provided is based, as a rule, on the length of service and on the income of the person entitled. Details of pension benefits for members of the Management Board are provided in the remuneration report on pages 39 to 51.
In defined benefit plans, the liability for pensions and other post-employment benefits is calculated at the present value of the future obligations (projected unit credit method). This actuarial method of calculation takes future trends in wages, salaries and retirement benefits into account.
The majority of the recipients of pension benefits are located in Germany and the USA. The pension obligations are primar-ily financed via various external trust assets that are legally independent of Henkel.
Active employees of Henkel in Germany participate in a defined contribution system, “Altersversorgung 2004 (AV 2004),” which was newly formed in 2004. AV 2004 is an employer- financed pension plan that reflects the personal income devel-opment of employees during their career at Henkel and thus provides a performance-related pension. Henkel guarantees a minimum return on the company’s contributions. The benefit essentially consists of an annuity payable upon attainment of the retirement age plus a lump-sum payment if the annuity threshold is exceeded in the employee’s service period. In addition to age and disability pensions, the plan benefits include surviving spouse and surviving child benefits.
Employees who started at Henkel after April 1, 2011, partici-pate in the pension plan “Altersversorgung 2011 (AV 2011).” AV 2011 is an employer-financed, fund-linked retirement plan funded by contributions based on the income development of the employee. Henkel ensures its employees that a lump-sum amount is available upon retirement which is at least equiva-lent to the level of principal contributions made by Henkel. Henkel makes the pension contribution to an investment fund established for the purpose of the company pension plan. Upon attaining retirement age, the employee can choose between an annuity through transfer of the superannuation lump-sum to a pension fund, or a one-time payment.
To provide protection under civil law of the pension entitle-ments of future and current pensioners of Henkel AG & Co. KGaA against insolvency, we have transferred the proceeds of the bond issued in 2005 and certain other assets to Henkel Trust e.V. The trustee invests the cash with which it has been entrusted in the capital market in accordance with investment policies laid down in the trust agreement. In addition, we also subsidize medical benefits for retired employees resident mainly in the USA. Under these programs, retirees are reim-bursed for a certain percentage of their medical expenses. We build provisions during the employees’ service period and pay the promised benefits when they are claimed.
The defined contribution plans are structured in such a way that the corporation pays contributions to public or private sec-tor institutions on the basis of statutory or contractual terms or on a voluntary basis and has no further obligations regarding the payment of benefits to employees. The contributions for defined contribution plans, excluding multi-employer plans, for the reporting period amounted to 103 million euros (previ-ous year: 82 million euros). In 2016, we paid 47 million euros to public sector institutions (previous year: 46 million euros) and 56 million euros to private sector institutions (previous year: 36 million euros).
No extraordinary events occurred in the reporting period.
Notes to the consolidated financial statements 141Henkel Annual Report 2016
116 Consolidated statement of financial position
118 Consolidated statement of income
118 Consolidated statement of comprehensive income
119 Consolidated statement of changes in equity
120 Consolidated statement of cash flows
121 Group segment report by business unit
122 Key financials by region123 Accounting principles and
methods applied in preparation of the consolidated financial statements
131 Notes to the consolidated statement of financial position
166 Notes to the consolidated statement of income
171 Other disclosures179 Subsequent events

Multi-employer plansHenkel provides defined pension benefits that are financed by more than one employer. The ensuing multi-employer plans are treated as defined contribution plans because, due to the limited share of the contribution volume in the plans, the information available for each of the financing companies is insufficient for defined benefit accounting. In the Henkel Group, benefits from multi-employer plans are provided for employees primarily in the USA and Japan. Withdrawal from our multi- employer plans at the present time would incur a one-time expense of around 29 million euros (previous year: around 30 million euros). Payments into multi-employer plans in fiscal 2016 amounted to 2 million euros (previous year: 2 million euros). We expect contributions of around 2 million euros in fiscal 2017.
AssumptionsGroup-wide, the obligations from our pension plans are valued by an independent external actuary at the end of the fiscal year. The calculations at the end of the fiscal year are based on the actuarial assumptions below. These are given as the weighted average. The mortality rates used are based on published statistics and experience relating to each country. In Germany, the assumptions are based on the “Heubeck 2005G” mortality table. In the USA, the assumptions are based on the modified “RP 2014” mortality table. The valuation of pension obligations in Germany was based essentially on the assump-tion of a 1.9 percent increase in retirement benefits (previous year: 2 percent).
The discount rate is based on yields in the market for high- ranking corporate bonds on the respective date. The currency and term of the underlying bonds are aligned with the cur-rency and expected maturities of the post-employment pen-sion obligation.
Actuarial assumptions 112
in percent
Germany USA Other countries 1
2015 2016 2015 2016 2015 2016
Discount rate 2.20 1.60 4.30 4.10 2.85 2.10
Income trend 3.25 3.25 2.85 3.00 2.50 2.85
Expected increases in costs for medical benefits – – 7.10 6.80 3.80 3.60
in years
Life expectancy at age 65 as of the valuation date for a person currently
65 years old 21.0 21.2 22.0 22.0 24.0 24.0
40 years old 24.2 24.4 23.0 23.0 26.0 26.0
1 Weighted average.
142 Henkel Annual Report 2016Consolidated financial statements

Development of defined benefit obligation at December 31, 2015 113
in million euros Germany USA Other countries Total
At January 1, 2015 3,254 1,174 1,137 5,565
Changes in the Group 5 – – 5
Translation differences – 124 34 158
Actuarial gains (–)/losses (+) – 251 – 68 – 89 – 408
of which: from changes in demographic assumptions – – 36 2 – 34
of which: from changes in financial assumptions – 246 – 27 – 74 – 347
of which: from experience adjustments – 5 – 5 – 17 – 27
Current service cost 46 18 26 90
Employee contributions 11 – 1 12
Gains (–)/losses (+) arising from the termination and curtailment of plans – 1 – 5 – 2 – 8
Interest expense 54 50 28 132
Retirement benefits paid out of plan assets – 144 – 69 – 35 – 248
Employer’s payments for pension obligations – 8 – 26 – 9 – 43
Other changes – – – –
At December 31, 2015 2,966 1,198 1,091 5,255
of which: obligations not covered by plan assets 87 298 94 479
of which: obligations covered by plan assets 2,879 789 997 4,665
of which: obligations covered by reimbursement rights – 111 – 111
Development of plan assets at December 31, 2015 114
in million euros Germany USA Other countries Total
At January 1, 2015 2,646 815 867 4,328
Changes in the Group 3 – – 3
Translation differences – 93 29 122
Employer contributions 25 – 35 60
Employee contributions 11 – 1 12
Retirement benefits paid out of plan assets – 144 – 69 – 35 – 248
Planned income on plan assets 49 34 22 105
Remeasurements in equity – 13 – 39 2 – 50
Other changes – – – –
At December 31, 2015 2,577 834 921 4,332
Development of asset ceiling at December 31, 2015 115
in million euros Germany USA Other countries Total
At January 1, 2015 – – 1 1
Interest cost for asset ceiling – – – –
Remeasurements in equity – – 6 6
At December 31, 2015 – – 7 7
Notes to the consolidated financial statements 143Henkel Annual Report 2016
116 Consolidated statement of financial position
118 Consolidated statement of income
118 Consolidated statement of comprehensive income
119 Consolidated statement of changes in equity
120 Consolidated statement of cash flows
121 Group segment report by business unit
122 Key financials by region123 Accounting principles and
methods applied in preparation of the consolidated financial statements
131 Notes to the consolidated statement of financial position
166 Notes to the consolidated statement of income
171 Other disclosures179 Subsequent events
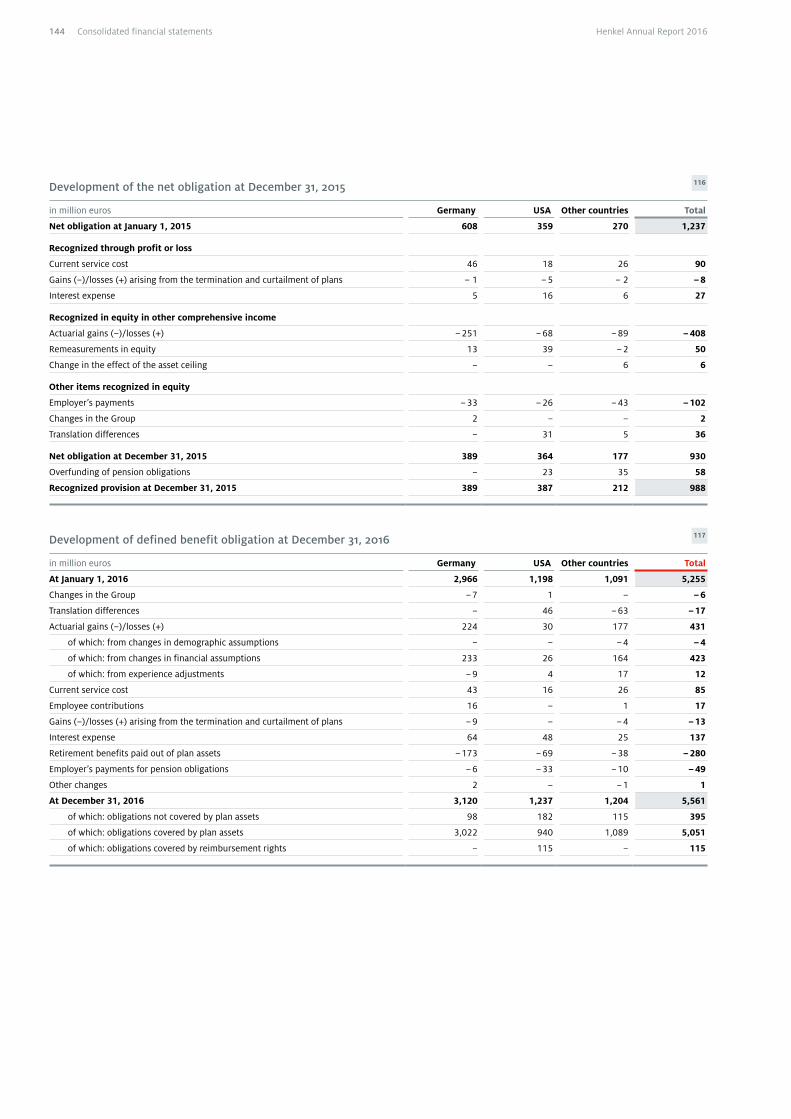
Development of the net obligation at December 31, 2015 116
in million euros Germany USA Other countries Total
Net obligation at January 1, 2015 608 359 270 1,237
Recognized through profit or loss
Current service cost 46 18 26 90
Gains (–)/losses (+) arising from the termination and curtailment of plans – 1 – 5 – 2 – 8
Interest expense 5 16 6 27
Recognized in equity in other comprehensive income
Actuarial gains (–)/losses (+) – 251 – 68 – 89 – 408
Remeasurements in equity 13 39 – 2 50
Change in the effect of the asset ceiling – – 6 6
Other items recognized in equity
Employer’s payments – 33 – 26 – 43 – 102
Changes in the Group 2 – – 2
Translation differences – 31 5 36
Net obligation at December 31, 2015 389 364 177 930
Overfunding of pension obligations – 23 35 58
Recognized provision at December 31, 2015 389 387 212 988
Development of defined benefit obligation at December 31, 2016 117
in million euros Germany USA Other countries Total
At January 1, 2016 2,966 1,198 1,091 5,255
Changes in the Group – 7 1 – – 6
Translation differences – 46 – 63 – 17
Actuarial gains (–)/losses (+) 224 30 177 431
of which: from changes in demographic assumptions – – – 4 – 4
of which: from changes in financial assumptions 233 26 164 423
of which: from experience adjustments – 9 4 17 12
Current service cost 43 16 26 85
Employee contributions 16 – 1 17
Gains (–)/losses (+) arising from the termination and curtailment of plans – 9 – – 4 – 13
Interest expense 64 48 25 137
Retirement benefits paid out of plan assets – 173 – 69 – 38 – 280
Employer’s payments for pension obligations – 6 – 33 – 10 – 49
Other changes 2 – – 1 1
At December 31, 2016 3,120 1,237 1,204 5,561
of which: obligations not covered by plan assets 98 182 115 395
of which: obligations covered by plan assets 3,022 940 1,089 5,051
of which: obligations covered by reimbursement rights – 115 – 115
144 Henkel Annual Report 2016Consolidated financial statements
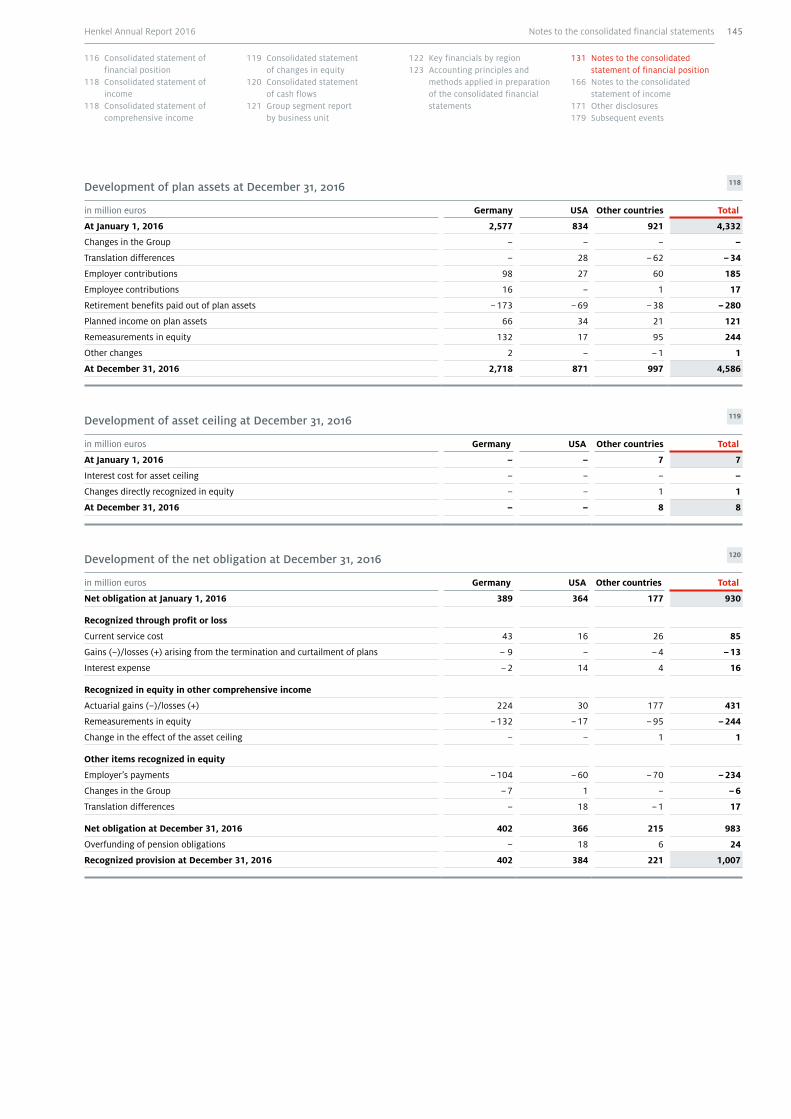
Development of plan assets at December 31, 2016 118
in million euros Germany USA Other countries Total
At January 1, 2016 2,577 834 921 4,332
Changes in the Group – – – –
Translation differences – 28 – 62 – 34
Employer contributions 98 27 60 185
Employee contributions 16 – 1 17
Retirement benefits paid out of plan assets – 173 – 69 – 38 – 280
Planned income on plan assets 66 34 21 121
Remeasurements in equity 132 17 95 244
Other changes 2 – – 1 1
At December 31, 2016 2,718 871 997 4,586
Development of asset ceiling at December 31, 2016 119
in million euros Germany USA Other countries Total
At January 1, 2016 – – 7 7
Interest cost for asset ceiling – – – –
Changes directly recognized in equity – – 1 1
At December 31, 2016 – – 8 8
Development of the net obligation at December 31, 2016 120
in million euros Germany USA Other countries Total
Net obligation at January 1, 2016 389 364 177 930
Recognized through profit or loss
Current service cost 43 16 26 85
Gains (–)/losses (+) arising from the termination and curtailment of plans – 9 – – 4 – 13
Interest expense – 2 14 4 16
Recognized in equity in other comprehensive income
Actuarial gains (–)/losses (+) 224 30 177 431
Remeasurements in equity – 132 – 17 – 95 – 244
Change in the effect of the asset ceiling – – 1 1
Other items recognized in equity
Employer’s payments – 104 – 60 – 70 – 234
Changes in the Group – 7 1 – – 6
Translation differences – 18 – 1 17
Net obligation at December 31, 2016 402 366 215 983
Overfunding of pension obligations – 18 6 24
Recognized provision at December 31, 2016 402 384 221 1,007
Notes to the consolidated financial statements 145Henkel Annual Report 2016
116 Consolidated statement of financial position
118 Consolidated statement of income
118 Consolidated statement of comprehensive income
119 Consolidated statement of changes in equity
120 Consolidated statement of cash flows
121 Group segment report by business unit
122 Key financials by region123 Accounting principles and
methods applied in preparation of the consolidated financial statements
131 Notes to the consolidated statement of financial position
166 Notes to the consolidated statement of income
171 Other disclosures179 Subsequent events
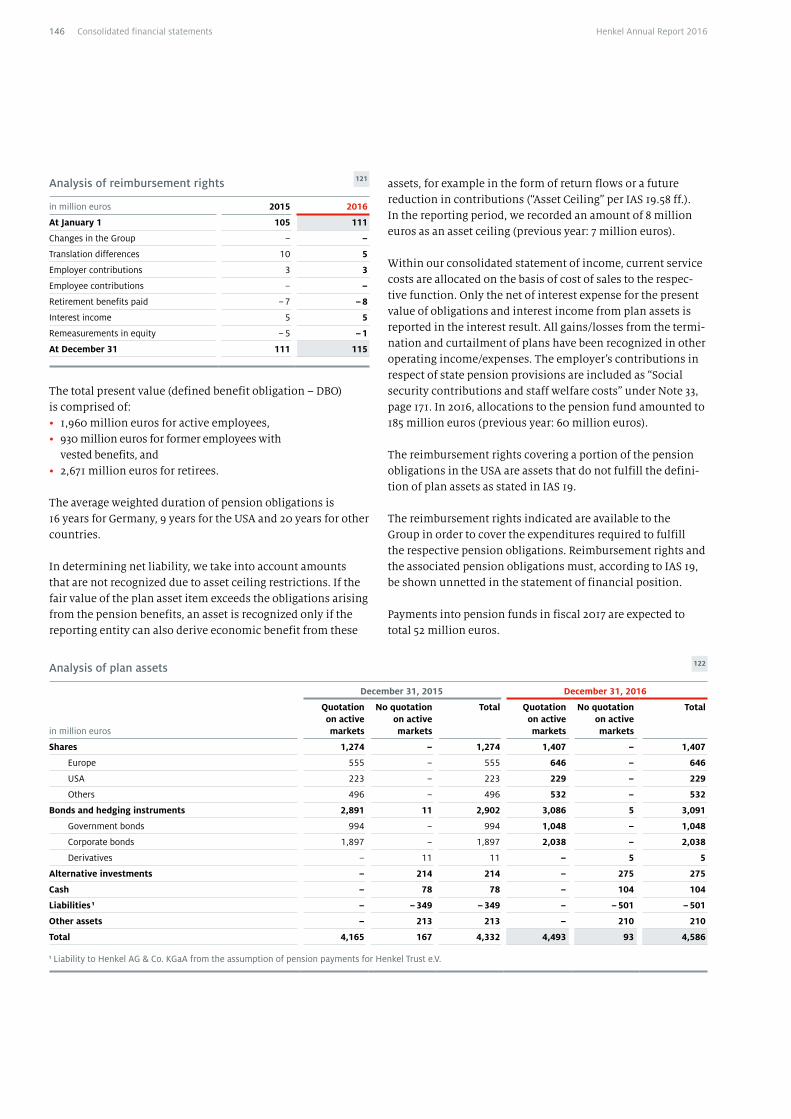
Analysis of plan assets 122
in million euros
December 31, 2015 December 31, 2016
Quotation on active markets
No quotation on active markets
Total Quotation on active markets
No quotation on active markets
Total
Shares 1,274 – 1,274 1,407 – 1,407
Europe 555 – 555 646 – 646
USA 223 – 223 229 – 229
Others 496 – 496 532 – 532
Bonds and hedging instruments 2,891 11 2,902 3,086 5 3,091
Government bonds 994 – 994 1,048 – 1,048
Corporate bonds 1,897 – 1,897 2,038 – 2,038
Derivatives – 11 11 – 5 5
Alternative investments – 214 214 – 275 275
Cash – 78 78 – 104 104
Liabilities 1 – – 349 – 349 – – 501 – 501
Other assets – 213 213 – 210 210
Total 4,165 167 4,332 4,493 93 4,586
1 Liability to Henkel AG & Co. KGaA from the assumption of pension payments for Henkel Trust e.V.
Analysis of reimbursement rights 121
in million euros 2015 2016
At January 1 105 111
Changes in the Group – –
Translation differences 10 5
Employer contributions 3 3
Employee contributions – –
Retirement benefits paid – 7 – 8
Interest income 5 5
Remeasurements in equity – 5 – 1
At December 31 111 115
The total present value (defined benefit obligation – DBO) is comprised of:• 1,960 million euros for active employees, • 930 million euros for former employees with
vested benefits, and • 2,671 million euros for retirees.
The average weighted duration of pension obligations is 16 years for Germany, 9 years for the USA and 20 years for other countries.
In determining net liability, we take into account amounts that are not recognized due to asset ceiling restrictions. If the fair value of the plan asset item exceeds the obligations arising from the pension benefits, an asset is recognized only if the reporting entity can also derive economic benefit from these
assets, for example in the form of return flows or a future reduction in contributions (“Asset Ceiling” per IAS 19.58 ff.). In the reporting period, we recorded an amount of 8 million euros as an asset ceiling (previous year: 7 million euros).
Within our consolidated statement of income, current service costs are allocated on the basis of cost of sales to the respec-tive function. Only the net of interest expense for the present value of obligations and interest income from plan assets is reported in the interest result. All gains/losses from the termi-nation and curtailment of plans have been recognized in other operating income/expenses. The employer’s contributions in respect of state pension provisions are included as “Social security contributions and staff welfare costs” under Note 33, page 171. In 2016, allocations to the pension fund amounted to 185 million euros (previous year: 60 million euros).
The reimbursement rights covering a portion of the pension obligations in the USA are assets that do not fulfill the defini-tion of plan assets as stated in IAS 19.
The reimbursement rights indicated are available to the Group in order to cover the expenditures required to fulfill the respective pension obligations. Reimbursement rights and the associated pension obligations must, according to IAS 19, be shown unnetted in the statement of financial position.
Payments into pension funds in fiscal 2017 are expected to total 52 million euros.
146 Henkel Annual Report 2016Consolidated financial statements
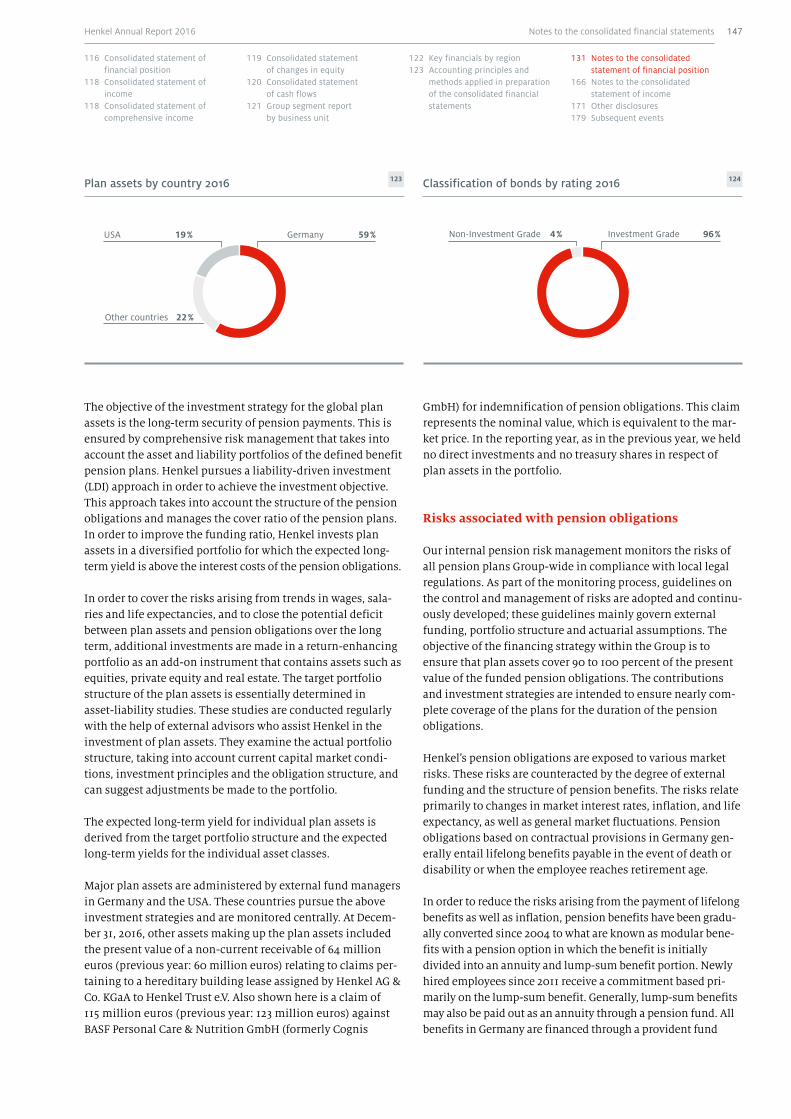
Classification of bonds by rating 2016 124Plan assets by country 2016 123
USA 19 % Germany 59 %
Other countries 22 %
Non-Investment Grade 4 % Investment Grade 96 %
The objective of the investment strategy for the global plan assets is the long-term security of pension payments. This is ensured by comprehensive risk management that takes into account the asset and liability portfolios of the defined benefit pension plans. Henkel pursues a liability-driven investment (LDI) approach in order to achieve the investment objective. This approach takes into account the structure of the pension obligations and manages the cover ratio of the pension plans. In order to improve the funding ratio, Henkel invests plan assets in a diversified portfolio for which the expected long-term yield is above the interest costs of the pension obligations.
In order to cover the risks arising from trends in wages, sala-ries and life expectancies, and to close the potential deficit between plan assets and pension obligations over the long term, additional investments are made in a return-enhancing portfolio as an add-on instrument that contains assets such as equities, private equity and real estate. The target portfolio structure of the plan assets is essentially determined in asset-liability studies. These studies are conducted regularly with the help of external advisors who assist Henkel in the investment of plan assets. They examine the actual portfolio structure, taking into account current capital market condi-tions, investment principles and the obligation structure, and can suggest adjustments be made to the portfolio.
The expected long-term yield for individual plan assets is derived from the target portfolio structure and the expected long-term yields for the individual asset classes.
Major plan assets are administered by external fund managers in Germany and the USA. These countries pursue the above investment strategies and are monitored centrally. At Decem-ber 31, 2016, other assets making up the plan assets included the present value of a non-current receivable of 64 million euros (previous year: 60 million euros) relating to claims per-taining to a hereditary building lease assigned by Henkel AG & Co. KGaA to Henkel Trust e.V. Also shown here is a claim of 115 million euros (previous year: 123 million euros) against BASF Personal Care & Nutrition GmbH (formerly Cognis
GmbH) for indemnification of pension obligations. This claim represents the nominal value, which is equivalent to the mar-ket price. In the reporting year, as in the previous year, we held no direct investments and no treasury shares in respect of plan assets in the portfolio.
Risks associated with pension obligations
Our internal pension risk management monitors the risks of all pension plans Group-wide in compliance with local legal regulations. As part of the monitoring process, guidelines on the control and management of risks are adopted and continu-ously developed; these guidelines mainly govern external funding, portfolio structure and actuarial assumptions. The objective of the financing strategy within the Group is to ensure that plan assets cover 90 to 100 percent of the present value of the funded pension obligations. The contributions and investment strategies are intended to ensure nearly com-plete coverage of the plans for the duration of the pension obligations.
Henkel’s pension obligations are exposed to various market risks. These risks are counteracted by the degree of external funding and the structure of pension benefits. The risks relate primarily to changes in market interest rates, inflation, and life expectancy, as well as general market fluctuations. Pension obligations based on contractual provisions in Germany gen-erally entail lifelong benefits payable in the event of death or disability or when the employee reaches retirement age.
In order to reduce the risks arising from the payment of lifelong benefits as well as inflation, pension benefits have been gradu-ally converted since 2004 to what are known as modular bene-fits with a pension option in which the benefit is initially divided into an annuity and lump-sum benefit portion. Newly hired employees since 2011 receive a commitment based pri-marily on the lump-sum benefit. Generally, lump-sum benefits may also be paid out as an annuity through a pension fund. All benefits in Germany are financed through a provident fund
Notes to the consolidated financial statements 147Henkel Annual Report 2016
116 Consolidated statement of financial position
118 Consolidated statement of income
118 Consolidated statement of comprehensive income
119 Consolidated statement of changes in equity
120 Consolidated statement of cash flows
121 Group segment report by business unit
122 Key financials by region123 Accounting principles and
methods applied in preparation of the consolidated financial statements
131 Notes to the consolidated statement of financial position
166 Notes to the consolidated statement of income
171 Other disclosures179 Subsequent events
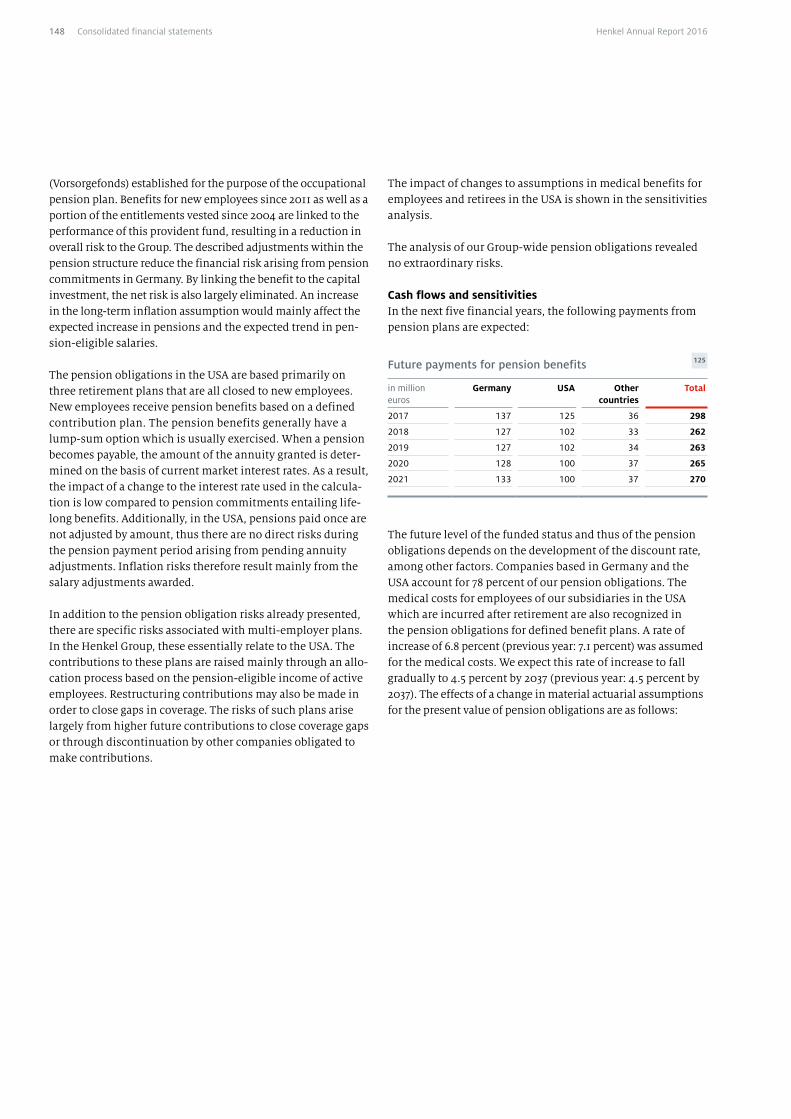
(Vorsorgefonds) established for the purpose of the occupational pension plan. Benefits for new employees since 2011 as well as a portion of the entitlements vested since 2004 are linked to the performance of this provident fund, resulting in a reduction in overall risk to the Group. The described adjustments within the pension structure reduce the financial risk arising from pension commitments in Germany. By linking the benefit to the capital investment, the net risk is also largely eliminated. An increase in the long-term inflation assumption would mainly affect the expected increase in pensions and the expected trend in pen-sion-eligible salaries.
The pension obligations in the USA are based primarily on three retirement plans that are all closed to new employees. New employees receive pension benefits based on a defined contribution plan. The pension benefits generally have a lump-sum option which is usually exercised. When a pension becomes payable, the amount of the annuity granted is deter-mined on the basis of current market interest rates. As a result, the impact of a change to the interest rate used in the calcula-tion is low compared to pension commitments entailing life-long benefits. Additionally, in the USA, pensions paid once are not adjusted by amount, thus there are no direct risks during the pension payment period arising from pending annuity adjustments. Inflation risks therefore result mainly from the salary adjustments awarded.
In addition to the pension obligation risks already presented, there are specific risks associated with multi-employer plans. In the Henkel Group, these essentially relate to the USA. The contributions to these plans are raised mainly through an allo-cation process based on the pension-eligible income of active employees. Restructuring contributions may also be made in order to close gaps in coverage. The risks of such plans arise largely from higher future contributions to close coverage gaps or through discontinuation by other companies obligated to make contributions.
The impact of changes to assumptions in medical benefits for employees and retirees in the USA is shown in the sensitivities analysis.
The analysis of our Group-wide pension obligations revealed no extraordinary risks.
Cash flows and sensitivitiesIn the next five financial years, the following payments from pension plans are expected:
Future payments for pension benefits 125
in million euros
Germany USA Other countries
Total
2017 137 125 36 298
2018 127 102 33 262
2019 127 102 34 263
2020 128 100 37 265
2021 133 100 37 270
The future level of the funded status and thus of the pension obligations depends on the development of the discount rate, among other factors. Companies based in Germany and the USA account for 78 percent of our pension obligations. The medical costs for employees of our subsidiaries in the USA which are incurred after retirement are also recognized in the pension obligations for defined benefit plans. A rate of increase of 6.8 percent (previous year: 7.1 percent) was assumed for the medical costs. We expect this rate of increase to fall gradually to 4.5 percent by 2037 (previous year: 4.5 percent by 2037). The effects of a change in material actuarial assumptions for the present value of pension obligations are as follows:
148 Henkel Annual Report 2016Consolidated financial statements
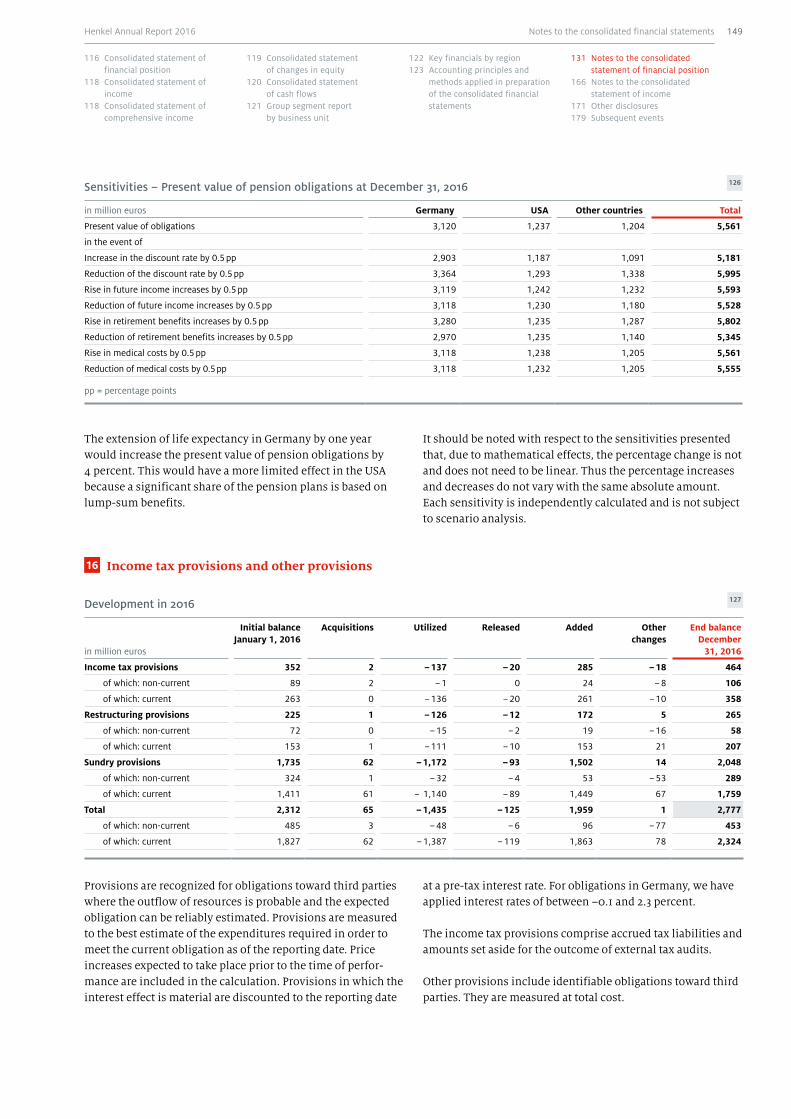
Sensitivities – Present value of pension obligations at December 31, 2016 126
in million euros Germany USA Other countries Total
Present value of obligations 3,120 1,237 1,204 5,561
in the event of
Increase in the discount rate by 0.5 pp 2,903 1,187 1,091 5,181
Reduction of the discount rate by 0.5 pp 3,364 1,293 1,338 5,995
Rise in future income increases by 0.5 pp 3,119 1,242 1,232 5,593
Reduction of future income increases by 0.5 pp 3,118 1,230 1,180 5,528
Rise in retirement benefits increases by 0.5 pp 3,280 1,235 1,287 5,802
Reduction of retirement benefits increases by 0.5 pp 2,970 1,235 1,140 5,345
Rise in medical costs by 0.5 pp 3,118 1,238 1,205 5,561
Reduction of medical costs by 0.5 pp 3,118 1,232 1,205 5,555
pp = percentage points
The extension of life expectancy in Germany by one year would increase the present value of pension obligations by 4 percent. This would have a more limited effect in the USA because a significant share of the pension plans is based on lump-sum benefits.
It should be noted with respect to the sensitivities presented that, due to mathematical effects, the percentage change is not and does not need to be linear. Thus the percentage increases and decreases do not vary with the same absolute amount. Each sensitivity is independently calculated and is not subject to scenario analysis.
at a pre-tax interest rate. For obligations in Germany, we have applied interest rates of between –0.1 and 2.3 percent.
The income tax provisions comprise accrued tax liabilities and amounts set aside for the outcome of external tax audits.
Other provisions include identifiable obligations toward third parties. They are measured at total cost.
16 Income tax provisions and other provisions
Development in 2016 127
in million euros
Initial balance January 1, 2016
Acquisitions Utilized Released Added Other changes
End balance December
31, 2016
Income tax provisions 352 2 – 137 – 20 285 – 18 464
of which: non-current 89 2 – 1 0 24 – 8 106
of which: current 263 0 – 136 – 20 261 – 10 358
Restructuring provisions 225 1 – 126 – 12 172 5 265
of which: non-current 72 0 – 15 – 2 19 – 16 58
of which: current 153 1 – 111 – 10 153 21 207
Sundry provisions 1,735 62 – 1,172 – 93 1,502 14 2,048
of which: non-current 324 1 – 32 – 4 53 – 53 289
of which: current 1,411 61 – 1,140 – 89 1,449 67 1,759
Total 2,312 65 – 1,435 – 125 1,959 1 2,777
of which: non-current 485 3 – 48 – 6 96 – 77 453
of which: current 1,827 62 – 1,387 – 119 1,863 78 2,324
Provisions are recognized for obligations toward third parties where the outflow of resources is probable and the expected obligation can be reliably estimated. Provisions are measured to the best estimate of the expenditures required in order to meet the current obligation as of the reporting date. Price increases expected to take place prior to the time of perfor-mance are included in the calculation. Provisions in which the interest effect is material are discounted to the reporting date
Notes to the consolidated financial statements 149Henkel Annual Report 2016
116 Consolidated statement of financial position
118 Consolidated statement of income
118 Consolidated statement of comprehensive income
119 Consolidated statement of changes in equity
120 Consolidated statement of cash flows
121 Group segment report by business unit
122 Key financials by region123 Accounting principles and
methods applied in preparation of the consolidated financial statements
131 Notes to the consolidated statement of financial position
166 Notes to the consolidated statement of income
171 Other disclosures179 Subsequent events
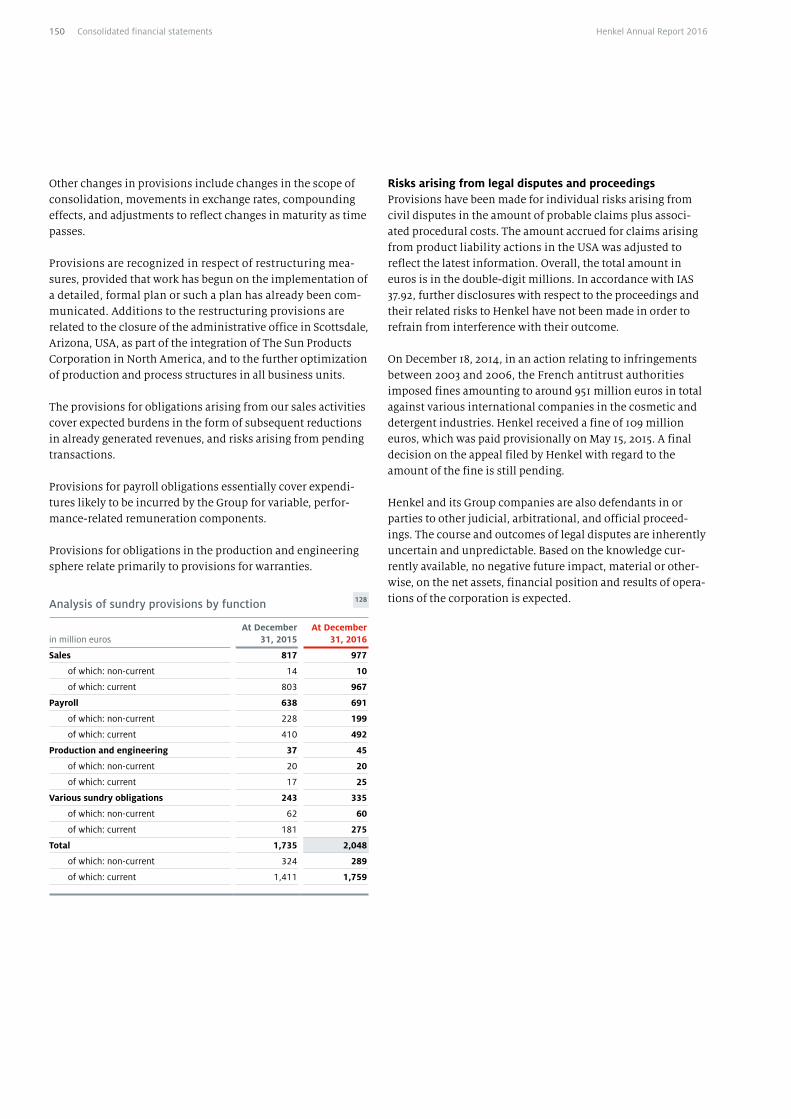
Other changes in provisions include changes in the scope of consolidation, movements in exchange rates, compounding effects, and adjustments to reflect changes in maturity as time passes.
Provisions are recognized in respect of restructuring mea-sures, provided that work has begun on the implementation of a detailed, formal plan or such a plan has already been com-municated. Additions to the restructuring provisions are related to the closure of the administrative office in Scottsdale, Arizona, USA, as part of the integration of The Sun Products Corporation in North America, and to the further optimization of production and process structures in all business units.
The provisions for obligations arising from our sales activities cover expected burdens in the form of subsequent reductions in already generated revenues, and risks arising from pending transactions.
Provisions for payroll obligations essentially cover expendi-tures likely to be incurred by the Group for variable, perfor-mance-related remuneration components.
Provisions for obligations in the production and engineering sphere relate primarily to provisions for warranties.
Analysis of sundry provisions by function 128
in million eurosAt December
31, 2015At December
31, 2016
Sales 817 977
of which: non-current 14 10
of which: current 803 967
Payroll 638 691
of which: non-current 228 199
of which: current 410 492
Production and engineering 37 45
of which: non-current 20 20
of which: current 17 25
Various sundry obligations 243 335
of which: non-current 62 60
of which: current 181 275
Total 1,735 2,048
of which: non-current 324 289
of which: current 1,411 1,759
Risks arising from legal disputes and proceedingsProvisions have been made for individual risks arising from civil disputes in the amount of probable claims plus associ-ated procedural costs. The amount accrued for claims arising from product liability actions in the USA was adjusted to reflect the latest information. Overall, the total amount in euros is in the double-digit millions. In accordance with IAS 37.92, further disclosures with respect to the proceedings and their related risks to Henkel have not been made in order to refrain from interference with their outcome.
On December 18, 2014, in an action relating to infringements between 2003 and 2006, the French antitrust authorities imposed fines amounting to around 951 million euros in total against various international companies in the cosmetic and detergent industries. Henkel received a fine of 109 million euros, which was paid provisionally on May 15, 2015. A final decision on the appeal filed by Henkel with regard to the amount of the fine is still pending.
Henkel and its Group companies are also defendants in or parties to other judicial, arbitrational, and official proceed-ings. The course and outcomes of legal disputes are inherently uncertain and unpredictable. Based on the knowledge cur-rently available, no negative future impact, material or other-wise, on the net assets, financial position and results of opera-tions of the corporation is expected.
150 Henkel Annual Report 2016Consolidated financial statements
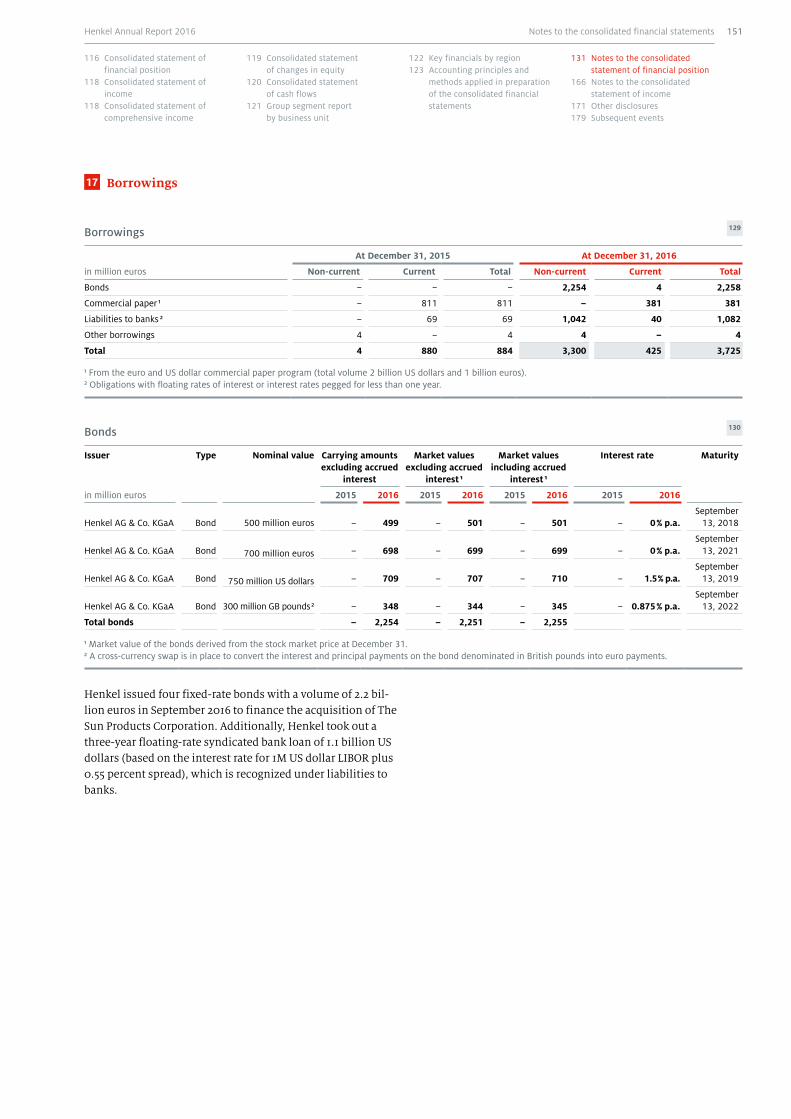
17 Borrowings
Borrowings 129
in million euros
At December 31, 2015 At December 31, 2016
Non-current Current Total Non-current Current Total
Bonds – – – 2,254 4 2,258
Commercial paper 1 – 811 811 – 381 381
Liabilities to banks 2 – 69 69 1,042 40 1,082
Other borrowings 4 – 4 4 – 4
Total 4 880 884 3,300 425 3,725
1 From the euro and US dollar commercial paper program (total volume 2 billion US dollars and 1 billion euros).2 Obligations with floating rates of interest or interest rates pegged for less than one year.
Bonds 130
Issuer Type Nominal value Carrying amounts excluding accrued
interest
Market values excluding accrued
interest 1
Market values including accrued
interest 1
Interest rate Maturity
in million euros 2015 2016 2015 2016 2015 2016 2015 2016
Henkel AG & Co. KGaA Bond 500 million euros – 499 – 501 – 501 – 0 % p.a.September
13, 2018
Henkel AG & Co. KGaA Bond 700 million euros – 698 – 699 – 699 – 0 % p.a.September
13, 2021
Henkel AG & Co. KGaA Bond 750 million US dollars – 709 – 707 – 710 – 1.5 % p.a.September
13, 2019
Henkel AG & Co. KGaA Bond 300 million GB pounds 2 – 348 – 344 – 345 – 0.875 % p.a.September
13, 2022
Total bonds – 2,254 – 2,251 – 2,255
1 Market value of the bonds derived from the stock market price at December 31. 2 A cross-currency swap is in place to convert the interest and principal payments on the bond denominated in British pounds into euro payments.
Henkel issued four fixed-rate bonds with a volume of 2.2 bil-lion euros in September 2016 to finance the acquisition of The Sun Products Corporation. Additionally, Henkel took out a three-year floating-rate syndicated bank loan of 1.1 billion US dollars (based on the interest rate for 1M US dollar LIBOR plus 0.55 percent spread), which is recognized under liabilities to banks.
Notes to the consolidated financial statements 151Henkel Annual Report 2016
116 Consolidated statement of financial position
118 Consolidated statement of income
118 Consolidated statement of comprehensive income
119 Consolidated statement of changes in equity
120 Consolidated statement of cash flows
121 Group segment report by business unit
122 Key financials by region123 Accounting principles and
methods applied in preparation of the consolidated financial statements
131 Notes to the consolidated statement of financial position
166 Notes to the consolidated statement of income
171 Other disclosures179 Subsequent events
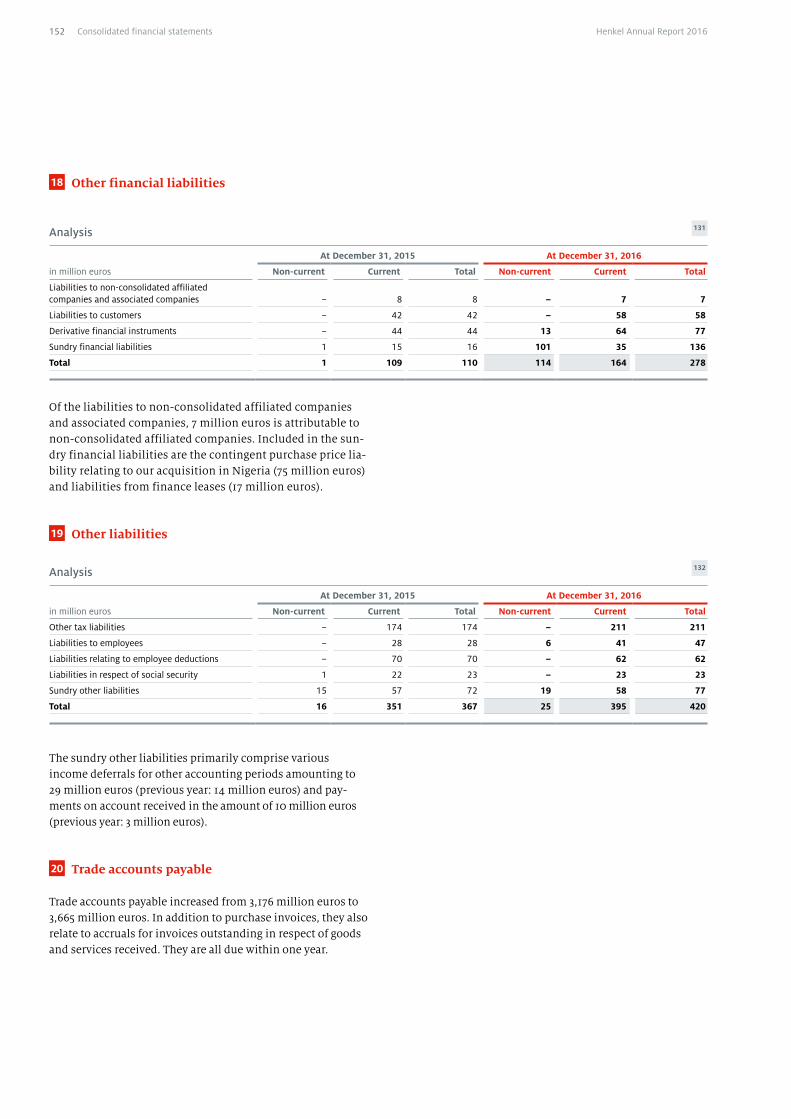
18 Other financial liabilities
Analysis 131
in million euros
At December 31, 2015 At December 31, 2016
Non-current Current Total Non-current Current Total
Liabilities to non-consolidated affiliated companies and associated companies – 8 8 – 7 7
Liabilities to customers – 42 42 – 58 58
Derivative financial instruments – 44 44 13 64 77
Sundry financial liabilities 1 15 16 101 35 136
Total 1 109 110 114 164 278
Of the liabilities to non-consolidated affiliated companies and associated companies, 7 million euros is attributable to non-consolidated affiliated companies. Included in the sun-dry financial liabilities are the contingent purchase price lia-bility relating to our acquisition in Nigeria (75 million euros) and liabilities from finance leases (17 million euros).
19 Other liabilities
Analysis 132
in million euros
At December 31, 2015 At December 31, 2016
Non-current Current Total Non-current Current Total
Other tax liabilities – 174 174 – 211 211
Liabilities to employees – 28 28 6 41 47
Liabilities relating to employee deductions – 70 70 – 62 62
Liabilities in respect of social security 1 22 23 – 23 23
Sundry other liabilities 15 57 72 19 58 77
Total 16 351 367 25 395 420
The sundry other liabilities primarily comprise various income deferrals for other accounting periods amounting to 29 million euros (previous year: 14 million euros) and pay-ments on account received in the amount of 10 million euros (previous year: 3 million euros).
20 Trade accounts payable
Trade accounts payable increased from 3,176 million euros to 3,665 million euros. In addition to purchase invoices, they also relate to accruals for invoices outstanding in respect of goods and services received. They are all due within one year.
152 Henkel Annual Report 2016Consolidated financial statements
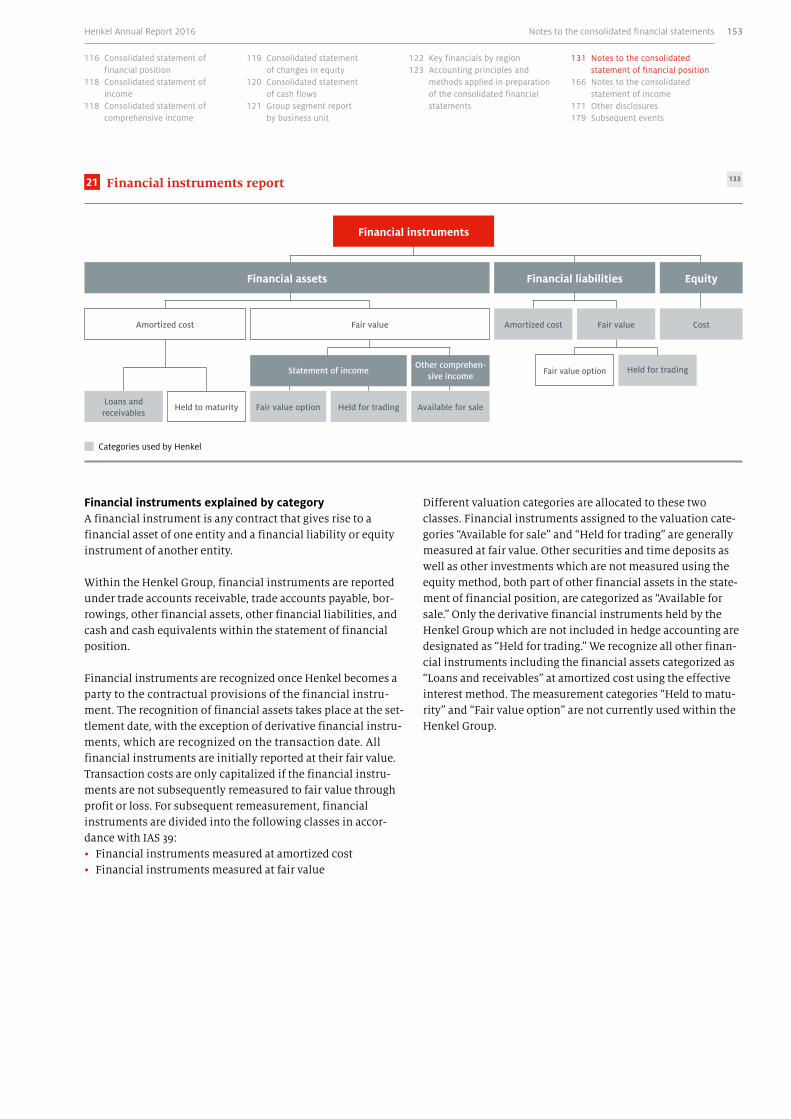
Categories used by Henkel
Financial instruments
Financial assets Financial liabilities Equity
Fair value Amortized cost Fair value Cost
Other comprehen-sive income
Available for sale Loans and receivables
Held to maturity
Amortized cost
Held for tradingFair value option
Statement of income Fair value option Held for trading
Financial instruments explained by categoryA financial instrument is any contract that gives rise to a financial asset of one entity and a financial liability or equity instrument of another entity.
Within the Henkel Group, financial instruments are reported under trade accounts receivable, trade accounts payable, bor-rowings, other financial assets, other financial liabilities, and cash and cash equivalents within the statement of financial position.
Financial instruments are recognized once Henkel becomes a party to the contractual provisions of the financial instru-ment. The recognition of financial assets takes place at the set-tlement date, with the exception of derivative financial instru-ments, which are recognized on the transaction date. All financial instruments are initially reported at their fair value. Transaction costs are only capitalized if the financial instru-ments are not subsequently remeasured to fair value through profit or loss. For subsequent remeasurement, financial instruments are divided into the following classes in accor-dance with IAS 39:• Financial instruments measured at amortized cost• Financial instruments measured at fair value
Different valuation categories are allocated to these two classes. Financial instruments assigned to the valuation cate-gories “Available for sale” and “Held for trading” are generally measured at fair value. Other securities and time deposits as well as other investments which are not measured using the equity method, both part of other financial assets in the state-ment of financial position, are categorized as “Available for sale.” Only the derivative financial instruments held by the Henkel Group which are not included in hedge accounting are designated as “Held for trading.” We recognize all other finan-cial instruments including the financial assets categorized as “Loans and receivables” at amortized cost using the effective interest method. The measurement categories “Held to matu-rity” and “Fair value option” are not currently used within the Henkel Group.
21 Financial instruments report 133
Notes to the consolidated financial statements 153Henkel Annual Report 2016
116 Consolidated statement of financial position
118 Consolidated statement of income
118 Consolidated statement of comprehensive income
119 Consolidated statement of changes in equity
120 Consolidated statement of cash flows
121 Group segment report by business unit
122 Key financials by region123 Accounting principles and
methods applied in preparation of the consolidated financial statements
131 Notes to the consolidated statement of financial position
166 Notes to the consolidated statement of income
171 Other disclosures179 Subsequent events
The financial instruments in the measurement category “Loans and receivables” are non-derivative financial instru-ments. They are characterized by fixed or determinable pay-ments and are not traded in an active market. Within the Henkel Group, this category is mainly comprised of trade accounts receivable, cash and cash equivalents, and other financial assets with the exception of investments, deriva-tives, securities and time deposits. The carrying amounts of the financial instruments categorized as “Loans and receiv-ables” closely approximate their fair value due to their pre-dominantly short-term nature. If there are doubts as to the realizability of these financial instruments, they are recog-nized at amortized cost less appropriate valuation allowances.
Financial instruments in the category “Available for sale” are non-derivative financial assets and are recognized at fair value, provided that this is reliably determinable. If the fair value cannot be reliably determined, they are recognized at cost. Value changes between the reporting dates are essentially recognized in equity through comprehensive income (avail-able-for-sale reserve) without affecting profit or loss, unless the cause lies in permanent impairment. Impairment losses are recognized through profit or loss. When the asset is derecognized, the amounts recognized in the revaluation reserve are released through profit or loss. In the Henkel Group, the securities and time deposits recognized under other financial assets are categorized together with other investments as “Available for sale.” The fair values of the secu-rities and time deposits are based on quoted market prices, or derived from market data. As the fair values of other invest-ments cannot be reliably determined, they are measured at amortized cost. Henkel is currently not planning to sell any of the financial instruments recognized under other investments.
The derivative financial instruments that are not included in a designated hedging relationship are categorized as “Held for trading” and recognized at their fair value. All fair value changes are recognized through profit or loss. Hedge account-ing is applied in individual cases – where possible and eco-nomically sensible – in order to avoid profit and loss varia-tions arising from fair value changes in derivative financial instruments. Fair value and cash flow hedges are designated within the Group depending on the type of underlying and the risk being hedged. Details relating to the hedging contracts transacted within the Group and how the fair values of the derivatives are determined are provided on pages 157 to 159.
All financial liabilities – with the exception of derivative financial instruments and the contingent purchase price lia-bility relating to our acquisition in Nigeria – are essentially recognized at amortized cost using the effective interest method.
Borrowings for which a hedging transaction has been con-cluded that meets the requirements of IAS 39 with respect to a designated hedging relationship are recognized according to hedge accounting rules.
Notes to the consolidated financial statements154 Henkel Annual Report 2016
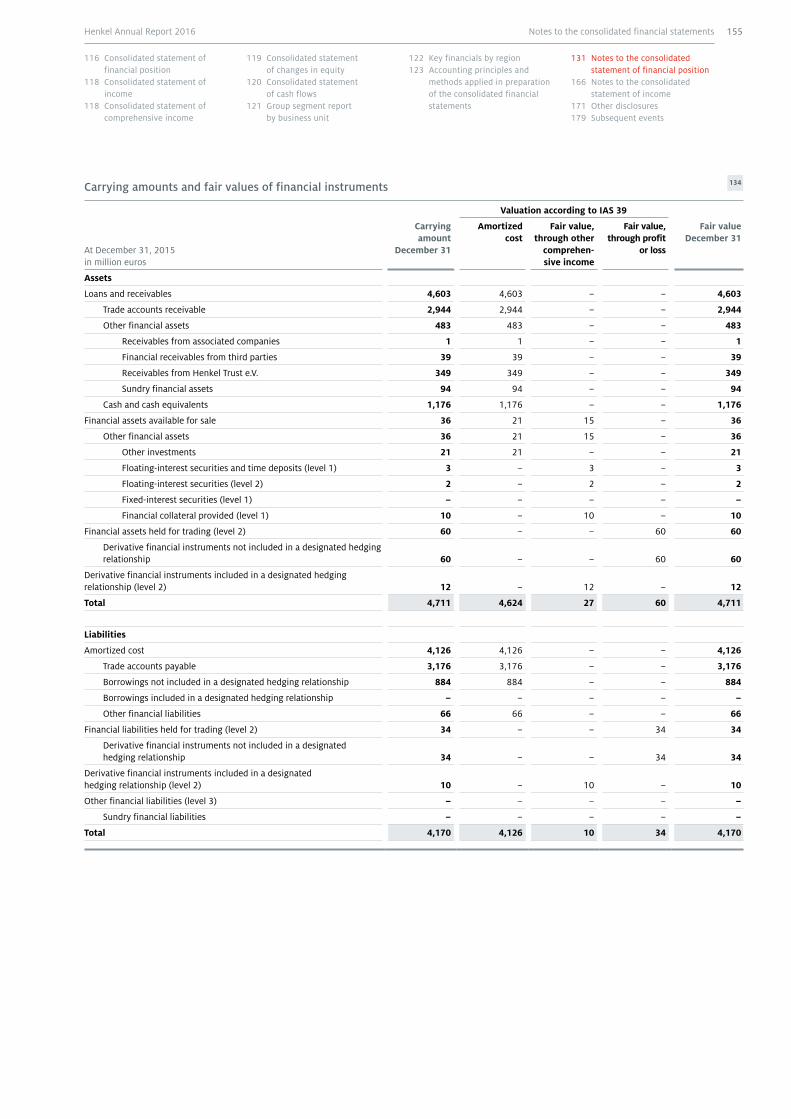
Carrying amounts and fair values of financial instruments 134
At December 31, 2015in million euros
Valuation according to IAS 39
Carrying amount
December 31
Amortized cost
Fair value, through other
comprehen-sive income
Fair value, through profit
or loss
Fair value December 31
Assets
Loans and receivables 4,603 4,603 – – 4,603
Trade accounts receivable 2,944 2,944 – – 2,944
Other financial assets 483 483 – – 483
Receivables from associated companies 1 1 – – 1
Financial receivables from third parties 39 39 – – 39
Receivables from Henkel Trust e.V. 349 349 – – 349
Sundry financial assets 94 94 – – 94
Cash and cash equivalents 1,176 1,176 – – 1,176
Financial assets available for sale 36 21 15 – 36
Other financial assets 36 21 15 – 36
Other investments 21 21 – – 21
Floating-interest securities and time deposits (level 1) 3 – 3 – 3
Floating-interest securities (level 2) 2 – 2 – 2
Fixed-interest securities (level 1) – – – – –
Financial collateral provided (level 1) 10 – 10 – 10
Financial assets held for trading (level 2) 60 – – 60 60
Derivative financial instruments not included in a designated hedging relationship 60 – – 60 60
Derivative financial instruments included in a designated hedging relationship (level 2) 12 – 12 – 12
Total 4,711 4,624 27 60 4,711
Liabilities
Amortized cost 4,126 4,126 – – 4,126
Trade accounts payable 3,176 3,176 – – 3,176
Borrowings not included in a designated hedging relationship 884 884 – – 884
Borrowings included in a designated hedging relationship – – – – –
Other financial liabilities 66 66 – – 66
Financial liabilities held for trading (level 2) 34 – – 34 34
Derivative financial instruments not included in a designated hedging relationship 34 – – 34 34
Derivative financial instruments included in a designated hedging relationship (level 2) 10 – 10 – 10
Other financial liabilities (level 3) – – – – –
Sundry financial liabilities – – – – –
Total 4,170 4,126 10 34 4,170
Notes to the consolidated financial statements 155Henkel Annual Report 2016
116 Consolidated statement of financial position
118 Consolidated statement of income
118 Consolidated statement of comprehensive income
119 Consolidated statement of changes in equity
120 Consolidated statement of cash flows
121 Group segment report by business unit
122 Key financials by region123 Accounting principles and
methods applied in preparation of the consolidated financial statements
131 Notes to the consolidated statement of financial position
166 Notes to the consolidated statement of income
171 Other disclosures179 Subsequent events
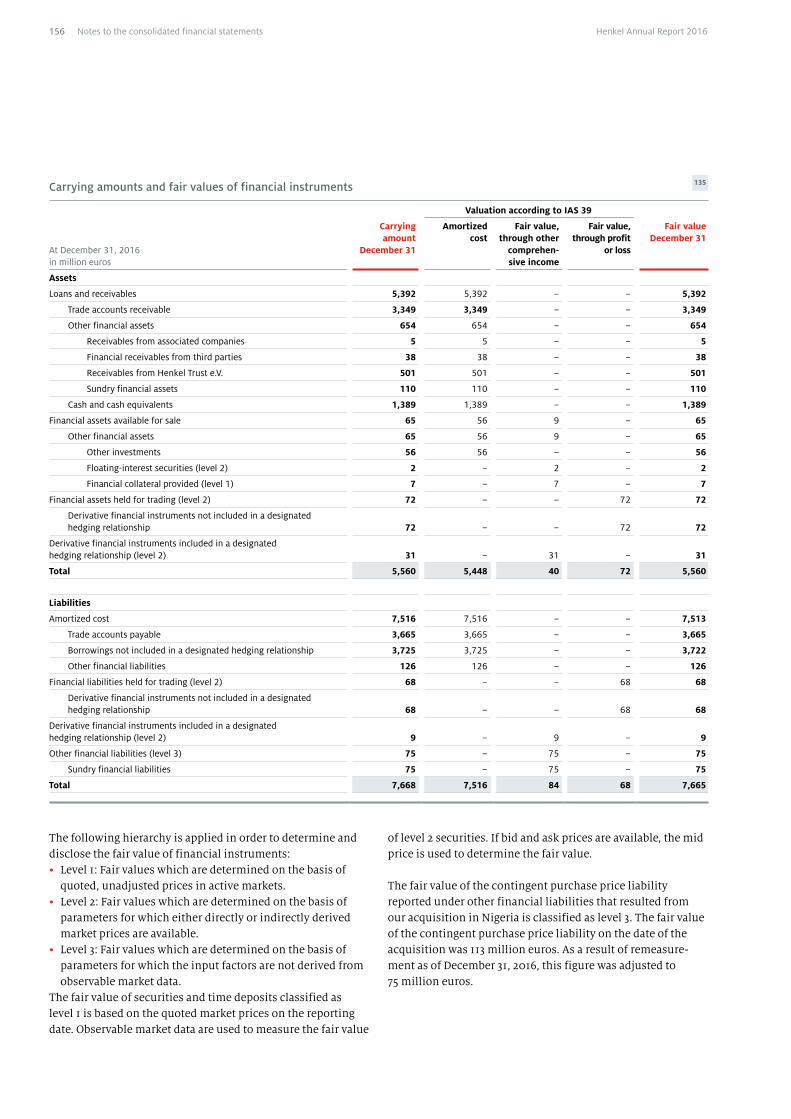
Carrying amounts and fair values of financial instruments 135
At December 31, 2016in million euros
Valuation according to IAS 39
Carrying amount
December 31
Amortized cost
Fair value, through other
comprehen-sive income
Fair value, through profit
or loss
Fair value December 31
Assets
Loans and receivables 5,392 5,392 – – 5,392
Trade accounts receivable 3,349 3,349 – – 3,349
Other financial assets 654 654 – – 654
Receivables from associated companies 5 5 – – 5
Financial receivables from third parties 38 38 – – 38
Receivables from Henkel Trust e.V. 501 501 – – 501
Sundry financial assets 110 110 – – 110
Cash and cash equivalents 1,389 1,389 – – 1,389
Financial assets available for sale 65 56 9 – 65
Other financial assets 65 56 9 – 65
Other investments 56 56 – – 56
Floating-interest securities (level 2) 2 – 2 – 2
Financial collateral provided (level 1) 7 – 7 – 7
Financial assets held for trading (level 2) 72 – – 72 72
Derivative financial instruments not included in a designated hedging relationship 72 – – 72 72
Derivative financial instruments included in a designated hedging relationship (level 2) 31 – 31 – 31
Total 5,560 5,448 40 72 5,560
Liabilities
Amortized cost 7,516 7,516 – – 7,513
Trade accounts payable 3,665 3,665 – – 3,665
Borrowings not included in a designated hedging relationship 3,725 3,725 – – 3,722
Other financial liabilities 126 126 – – 126
Financial liabilities held for trading (level 2) 68 – – 68 68
Derivative financial instruments not included in a designated hedging relationship 68 – – 68 68
Derivative financial instruments included in a designated hedging relationship (level 2) 9 – 9 – 9
Other financial liabilities (level 3) 75 – 75 – 75
Sundry financial liabilities 75 – 75 – 75
Total 7,668 7,516 84 68 7,665
The following hierarchy is applied in order to determine and disclose the fair value of financial instruments:• Level 1: Fair values which are determined on the basis of
quoted, unadjusted prices in active markets.• Level 2: Fair values which are determined on the basis of
parameters for which either directly or indirectly derived market prices are available.
• Level 3: Fair values which are determined on the basis of parameters for which the input factors are not derived from observable market data.
The fair value of securities and time deposits classified as level 1 is based on the quoted market prices on the reporting date. Observable market data are used to measure the fair value
of level 2 securities. If bid and ask prices are available, the mid price is used to determine the fair value.
The fair value of the contingent purchase price liability reported under other financial liabilities that resulted from our acquisition in Nigeria is classified as level 3. The fair value of the contingent purchase price liability on the date of the acquisition was 113 million euros. As a result of remeasure-ment as of December 31, 2016, this figure was adjusted to 75 million euros.
Notes to the consolidated financial statements156 Henkel Annual Report 2016
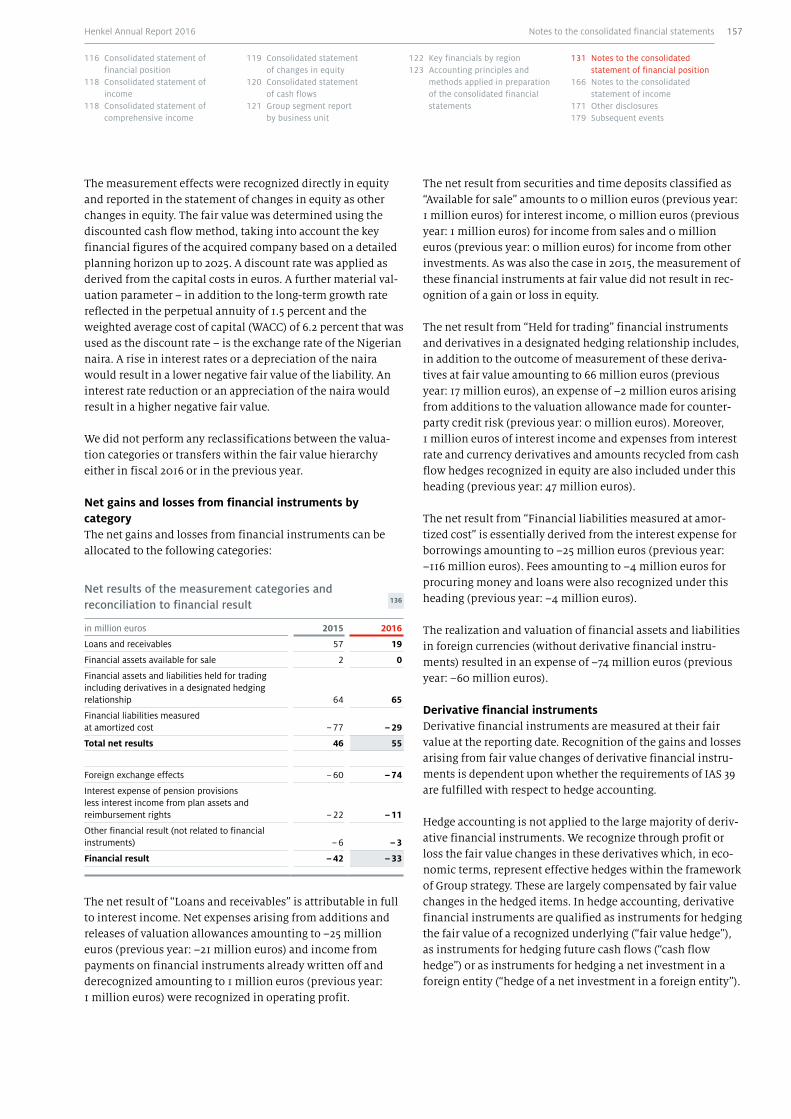
The measurement effects were recognized directly in equity and reported in the statement of changes in equity as other changes in equity. The fair value was determined using the discounted cash flow method, taking into account the key financial figures of the acquired company based on a detailed planning horizon up to 2025. A discount rate was applied as derived from the capital costs in euros. A further material val-uation parameter – in addition to the long-term growth rate reflected in the perpetual annuity of 1.5 percent and the weighted average cost of capital (WACC) of 6.2 percent that was used as the discount rate – is the exchange rate of the Nigerian naira. A rise in interest rates or a depreciation of the naira would result in a lower negative fair value of the liability. An interest rate reduction or an appreciation of the naira would result in a higher negative fair value.
We did not perform any reclassifications between the valua-tion categories or transfers within the fair value hierarchy either in fiscal 2016 or in the previous year.
Net gains and losses from financial instruments by categoryThe net gains and losses from financial instruments can be allocated to the following categories:
Net results of the measurement categories and reconciliation to financial result 136
in million euros 2015 2016
Loans and receivables 57 19
Financial assets available for sale 2 0
Financial assets and liabilities held for trading including derivatives in a designated hedging relationship 64 65
Financial liabilities measured at amortized cost – 77 – 29
Total net results 46 55
Foreign exchange effects – 60 – 74
Interest expense of pension provisions less interest income from plan assets and reimbursement rights – 22 – 11
Other financial result (not related to financial instruments) – 6 – 3
Financial result – 42 – 33
The net result of “Loans and receivables” is attributable in full to interest income. Net expenses arising from additions and releases of valuation allowances amounting to –25 million euros (previous year: –21 million euros) and income from payments on financial instruments already written off and derecognized amounting to 1 million euros (previous year: 1 million euros) were recognized in operating profit.
The net result from securities and time deposits classified as “Available for sale” amounts to 0 million euros (previous year: 1 million euros) for interest income, 0 million euros (previous year: 1 million euros) for income from sales and 0 million euros (previous year: 0 million euros) for income from other investments. As was also the case in 2015, the measurement of these financial instruments at fair value did not result in rec-ognition of a gain or loss in equity.
The net result from “Held for trading” financial instruments and derivatives in a designated hedging relationship includes, in addition to the outcome of measurement of these deriva-tives at fair value amounting to 66 million euros (previous year: 17 million euros), an expense of –2 million euros arising from additions to the valuation allowance made for counter-party credit risk (previous year: 0 million euros). Moreover, 1 million euros of interest income and expenses from interest rate and currency derivatives and amounts recycled from cash flow hedges recognized in equity are also included under this heading (previous year: 47 million euros).
The net result from “Financial liabilities measured at amor-tized cost” is essentially derived from the interest expense for borrowings amounting to –25 million euros (previous year: –116 million euros). Fees amounting to –4 million euros for procuring money and loans were also recognized under this heading (previous year: –4 million euros).
The realization and valuation of financial assets and liabilities in foreign currencies (without derivative financial instru-ments) resulted in an expense of –74 million euros (previous year: –60 million euros).
Derivative financial instrumentsDerivative financial instruments are measured at their fair value at the reporting date. Recognition of the gains and losses arising from fair value changes of derivative financial instru-ments is dependent upon whether the requirements of IAS 39 are fulfilled with respect to hedge accounting.
Hedge accounting is not applied to the large majority of deriv-ative financial instruments. We recognize through profit or loss the fair value changes in these derivatives which, in eco-nomic terms, represent effective hedges within the framework of Group strategy. These are largely compensated by fair value changes in the hedged items. In hedge accounting, derivative financial instruments are qualified as instruments for hedging the fair value of a recognized underlying (“fair value hedge”), as instruments for hedging future cash flows (“cash flow hedge”) or as instruments for hedging a net investment in a foreign entity (“hedge of a net investment in a foreign entity”).
Notes to the consolidated financial statements 157Henkel Annual Report 2016
116 Consolidated statement of financial position
118 Consolidated statement of income
118 Consolidated statement of comprehensive income
119 Consolidated statement of changes in equity
120 Consolidated statement of cash flows
121 Group segment report by business unit
122 Key financials by region123 Accounting principles and
methods applied in preparation of the consolidated financial statements
131 Notes to the consolidated statement of financial position
166 Notes to the consolidated statement of income
171 Other disclosures179 Subsequent events
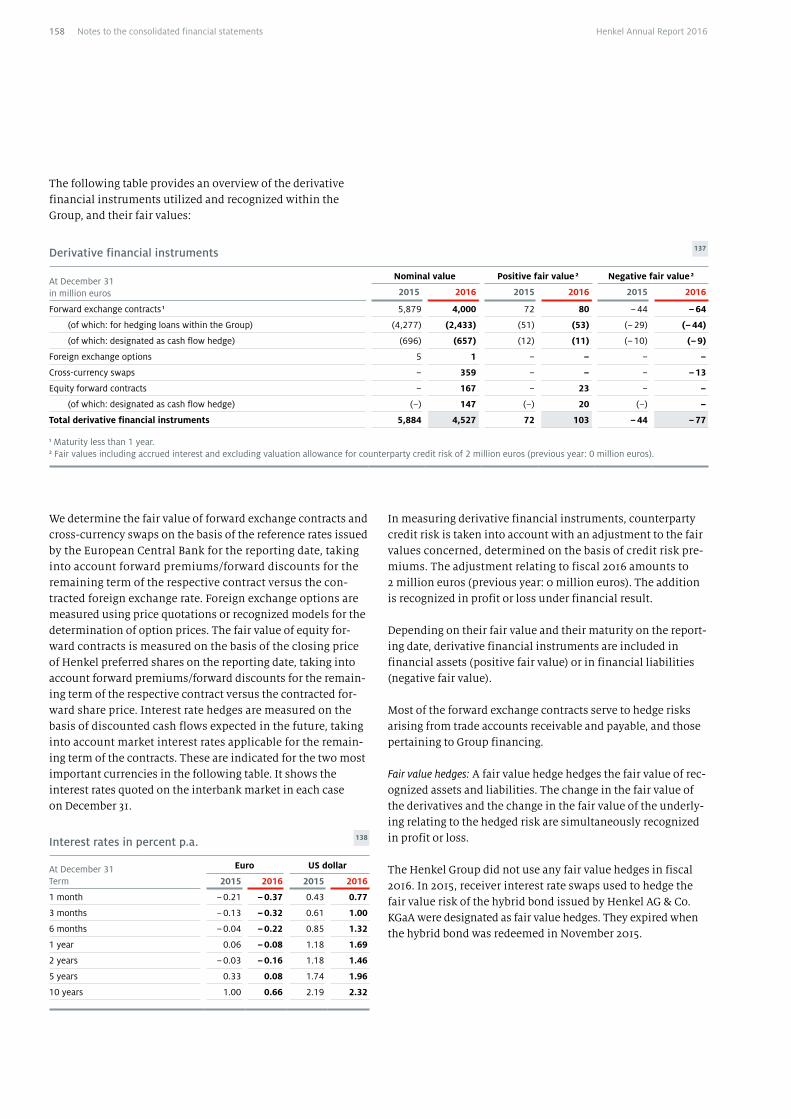
The following table provides an overview of the derivative financial instruments utilized and recognized within the Group, and their fair values:
We determine the fair value of forward exchange contracts and cross-currency swaps on the basis of the reference rates issued by the European Central Bank for the reporting date, taking into account forward premiums/forward discounts for the remaining term of the respective contract versus the con-tracted foreign exchange rate. Foreign exchange options are measured using price quotations or recognized models for the determination of option prices. The fair value of equity for-ward contracts is measured on the basis of the closing price of Henkel preferred shares on the reporting date, taking into account forward premiums/forward discounts for the remain-ing term of the respective contract versus the contracted for-ward share price. Interest rate hedges are measured on the basis of discounted cash flows expected in the future, taking into account market interest rates applicable for the remain-ing term of the contracts. These are indicated for the two most important currencies in the following table. It shows the interest rates quoted on the interbank market in each case on December 31.
Derivative financial instruments 137
At December 31 in million euros
Nominal value Positive fair value 2 Negative fair value 2
2015 2016 2015 2016 2015 2016
Forward exchange contracts 1 5,879 4,000 72 80 – 44 – 64
(of which: for hedging loans within the Group) (4,277) (2,433) (51) (53) (– 29) (– 44)
(of which: designated as cash flow hedge) (696) (657) (12) (11) (– 10) (– 9)
Foreign exchange options 5 1 – – – –
Cross-currency swaps – 359 – – – – 13
Equity forward contracts – 167 – 23 – –
(of which: designated as cash flow hedge) (–) 147 (–) 20 (–) –
Total derivative financial instruments 5,884 4,527 72 103 – 44 – 77
1 Maturity less than 1 year. 2 Fair values including accrued interest and excluding valuation allowance for counterparty credit risk of 2 million euros (previous year: 0 million euros).
Interest rates in percent p.a. 138
At December 31Term
Euro US dollar
2015 2016 2015 2016
1 month – 0.21 – 0.37 0.43 0.77
3 months – 0.13 – 0.32 0.61 1.00
6 months – 0.04 – 0.22 0.85 1.32
1 year 0.06 – 0.08 1.18 1.69
2 years – 0.03 – 0.16 1.18 1.46
5 years 0.33 0.08 1.74 1.96
10 years 1.00 0.66 2.19 2.32
In measuring derivative financial instruments, counterparty credit risk is taken into account with an adjustment to the fair values concerned, determined on the basis of credit risk pre-miums. The adjustment relating to fiscal 2016 amounts to 2 million euros (previous year: 0 million euros). The addition is recognized in profit or loss under financial result.
Depending on their fair value and their maturity on the report-ing date, derivative financial instruments are included in financial assets (positive fair value) or in financial liabilities (negative fair value).
Most of the forward exchange contracts serve to hedge risks arising from trade accounts receivable and payable, and those pertaining to Group financing.
Fair value hedges: A fair value hedge hedges the fair value of rec-ognized assets and liabilities. The change in the fair value of the derivatives and the change in the fair value of the underly-ing relating to the hedged risk are simultaneously recognized in profit or loss.
The Henkel Group did not use any fair value hedges in fiscal 2016. In 2015, receiver interest rate swaps used to hedge the fair value risk of the hybrid bond issued by Henkel AG & Co. KGaA were designated as fair value hedges. They expired when the hybrid bond was redeemed in November 2015.
Notes to the consolidated financial statements158 Henkel Annual Report 2016

The following table provides an overview of the gains and losses arising from fair value hedges (valuation allowance made for the counterparty credit risk not included):
Gains and losses from fair value hedges 139
in million euros 2015 2016
Gains (+)/losses (–) from hedged items 43 –
Gains (+)/losses (–) from hedging instruments – 45 –
Net – 2 –
Cash flow hedges: A cash flow hedge hedges fluctuations in future cash flows from recognized assets and liabilities, and also transactions that are either planned or highly probable, or firmly contracted unrecognized financial commitments, from which an interest-rate, currency, or share price risk arises. The effective portion of a cash flow hedge is recognized in the hedge reserve in equity. The ineffective portion arising from the change in value of the hedging instrument is recognized through profit or loss in the financial result or operating profit, depending on the item hedged. The gains and losses recorded in equity are subsequently recognized through profit or loss in the period in which the results are affected by the hedged transaction.
Cash flow hedges (after tax) 140
in million euros
Initial balance
Addition (recognized
in equity)
Disposal (recognized
through profit or loss)
End balance
2016 – 215 31 – 31 – 215
2015 – 202 1 – 14 – 215
The initial value of the cash flow hedges recognized in equity reflects the fair values of the payer interest swaps that were used in previous years to hedge the cash flow risks of the float-ing-interest US dollar liabilities at Henkel of America, Inc., and of currency hedges for acquisitions.
An addition of 11 million euros after tax relates to currency hedges of planned inventory purchases against fluctuations in spot rates. Of the gains recognized in equity, 11 million euros was reclassified to operating profit in the reporting period. The positive and negative fair values of the derivatives con-tracted as a currency hedge of planned inventory purchases amounted to 11 million and –9 million euros respectively. The cash flows from the currency derivatives and the cash flows from the hedged inventory purchases are expected to occur and affect profit or loss in the next fiscal year.
An addition of 20 million euros resulted from the hedges to protect planned payments relating to our long-term incentive (LTI) scheme – some of which were effected in the course of the fiscal year just ended – against fluctuations in Henkel share prices. All of the gains recognized in equity were reclas-sified to operating profit in the reporting period. The positive fair values of the equity forward contracts totaled 20 million euros. The cash flows relating to these derivatives will occur during the next fiscal year, as will the cash flows from the hedged LTI payments. The ineffective portions recognized in operating profit amounted to 1 million euros.
Hedges of a net investment in a foreign entity: The accounting treatment of hedges of a net investment in a foreign entity against translation risk is similar to that applied to cash flow hedges. The gain or loss arising from the effective portion of the hedging instrument is recognized in equity through other comprehensive income; the gain or loss of the ineffective por-tion is recognized directly through profit or loss. The gains or losses recognized directly in equity remain there until dis-posal or partial disposal of the net investment.
The items recognized in equity relate essentially to translation risks arising from net investments in Swiss francs and US dol-lars for which the associated hedges were entered into and settled in previous years. Henkel did not hedge any net invest-ments in foreign entities in fiscal 2016.
Hedges of a net investment in a foreign entity (after tax) 141
in million euros
Initial balance
Addition (recognized
in equity)
Disposal (recognized
through profit or
loss)
End balance
2016 31 – – 31
2015 35 – 4 – 31
Risks arising from financial instruments, and risk managementAs a globally active corporation, Henkel is exposed in the course of its ordinary business operations to credit risks, liquidity risks and market risks (currency translation, interest rate and commodity price risks). The purpose of financial risk management is to restrict the exposure arising from operating activities through the use of selective derivative and non-de-rivative hedges. Henkel uses derivative financial instruments exclusively for the purposes of risk management. Without these instruments, Henkel would be exposed to higher finan-cial risks. Changes in exchange rates, interest rates or com-modity prices can lead to significant fluctuations in the fair
Notes to the consolidated financial statements 159Henkel Annual Report 2016
116 Consolidated statement of financial position
118 Consolidated statement of income
118 Consolidated statement of comprehensive income
119 Consolidated statement of changes in equity
120 Consolidated statement of cash flows
121 Group segment report by business unit
122 Key financials by region123 Accounting principles and
methods applied in preparation of the consolidated financial statements
131 Notes to the consolidated statement of financial position
166 Notes to the consolidated statement of income
171 Other disclosures179 Subsequent events
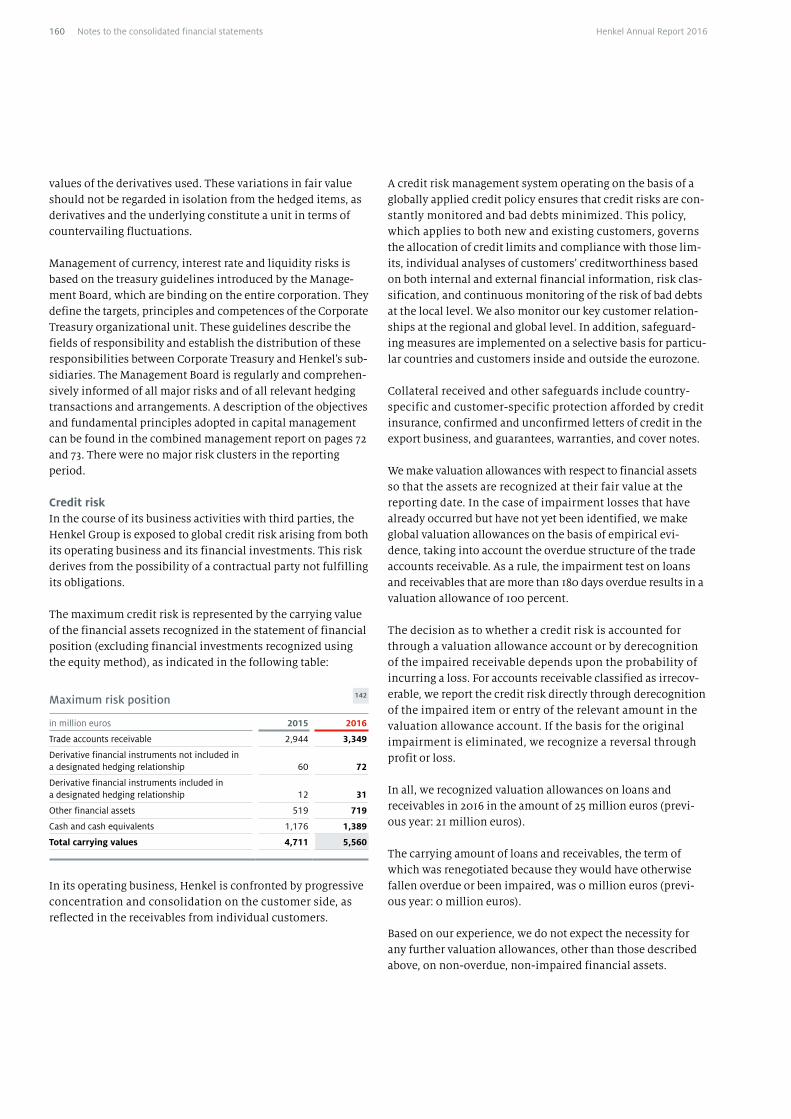
values of the derivatives used. These variations in fair value should not be regarded in isolation from the hedged items, as derivatives and the underlying constitute a unit in terms of countervailing fluctuations.
Management of currency, interest rate and liquidity risks is based on the treasury guidelines introduced by the Manage-ment Board, which are binding on the entire corporation. They define the targets, principles and competences of the Corporate Treasury organizational unit. These guidelines describe the fields of responsibility and establish the distribution of these responsibilities between Corporate Treasury and Henkel’s sub-sidiaries. The Management Board is regularly and comprehen-sively informed of all major risks and of all relevant hedging transactions and arrangements. A description of the objectives and fundamental principles adopted in capital management can be found in the combined management report on pages 72 and 73. There were no major risk clusters in the reporting period.
Credit riskIn the course of its business activities with third parties, the Henkel Group is exposed to global credit risk arising from both its operating business and its financial investments. This risk derives from the possibility of a contractual party not fulfilling its obligations.
The maximum credit risk is represented by the carrying value of the financial assets recognized in the statement of financial position (excluding financial investments recognized using the equity method), as indicated in the following table:
Maximum risk position 142
in million euros 2015 2016
Trade accounts receivable 2,944 3,349
Derivative financial instruments not included in a designated hedging relationship 60 72
Derivative financial instruments included in a designated hedging relationship 12 31
Other financial assets 519 719
Cash and cash equivalents 1,176 1,389
Total carrying values 4,711 5,560
In its operating business, Henkel is confronted by progressive concentration and consolidation on the customer side, as reflected in the receivables from individual customers.
A credit risk management system operating on the basis of a globally applied credit policy ensures that credit risks are con-stantly monitored and bad debts minimized. This policy, which applies to both new and existing customers, governs the allocation of credit limits and compliance with those lim-its, individual analyses of customers’ creditworthiness based on both internal and external financial information, risk clas-sification, and continuous monitoring of the risk of bad debts at the local level. We also monitor our key customer relation-ships at the regional and global level. In addition, safeguard-ing measures are implemented on a selective basis for particu-lar countries and customers inside and outside the eurozone.
Collateral received and other safeguards include country- specific and customer-specific protection afforded by credit insurance, confirmed and unconfirmed letters of credit in the export business, and guarantees, warranties, and cover notes.
We make valuation allowances with respect to financial assets so that the assets are recognized at their fair value at the reporting date. In the case of impairment losses that have already occurred but have not yet been identified, we make global valuation allowances on the basis of empirical evi-dence, taking into account the overdue structure of the trade accounts receivable. As a rule, the impairment test on loans and receivables that are more than 180 days overdue results in a valuation allowance of 100 percent.
The decision as to whether a credit risk is accounted for through a valuation allowance account or by derecognition of the impaired receivable depends upon the probability of incurring a loss. For accounts receivable classified as irrecov-erable, we report the credit risk directly through derecognition of the impaired item or entry of the relevant amount in the valuation allowance account. If the basis for the original impairment is eliminated, we recognize a reversal through profit or loss.
In all, we recognized valuation allowances on loans and receivables in 2016 in the amount of 25 million euros (previ-ous year: 21 million euros).
The carrying amount of loans and receivables, the term of which was renegotiated because they would have otherwise fallen overdue or been impaired, was 0 million euros (previ-ous year: 0 million euros).
Based on our experience, we do not expect the necessity for any further valuation allowances, other than those described above, on non-overdue, non-impaired financial assets.
Notes to the consolidated financial statements160 Henkel Annual Report 2016
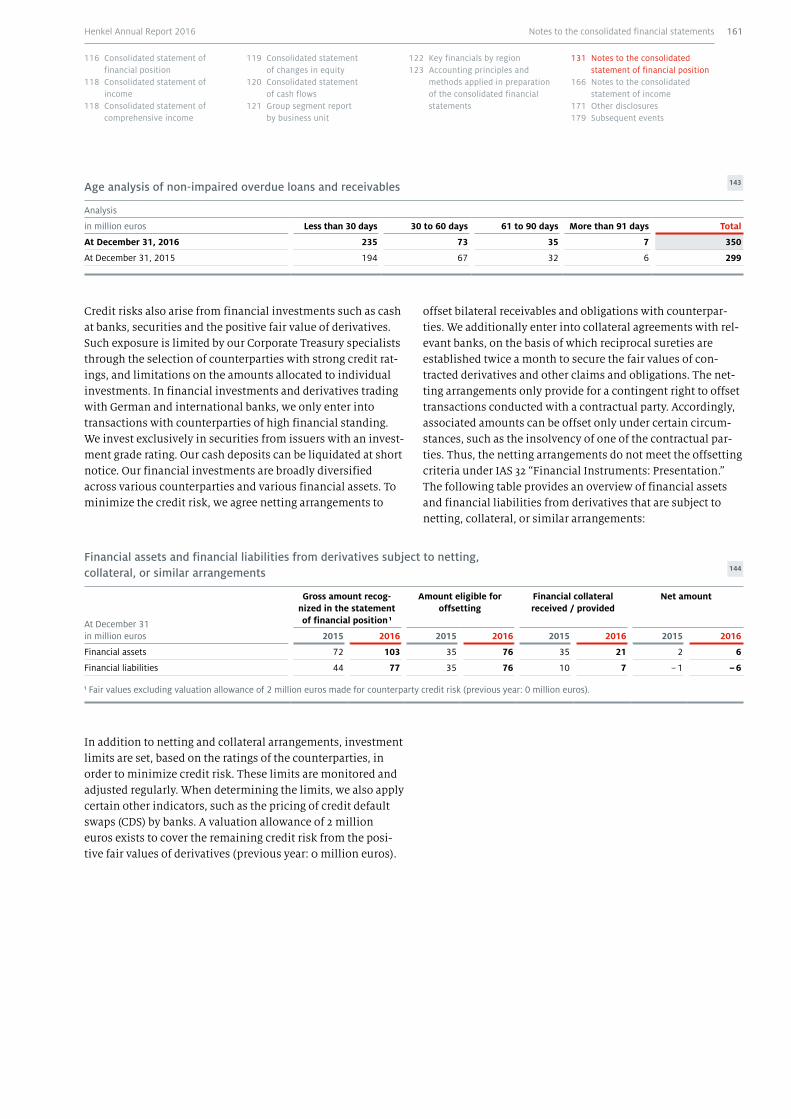
Age analysis of non-impaired overdue loans and receivables 143
Analysis
in million euros Less than 30 days 30 to 60 days 61 to 90 days More than 91 days Total
At December 31, 2016 235 73 35 7 350
At December 31, 2015 194 67 32 6 299
offset bilateral receivables and obligations with counterpar-ties. We additionally enter into collateral agreements with rel-evant banks, on the basis of which reciprocal sureties are established twice a month to secure the fair values of con-tracted derivatives and other claims and obligations. The net-ting arrangements only provide for a contingent right to offset transactions conducted with a contractual party. Accordingly, associated amounts can be offset only under certain circum-stances, such as the insolvency of one of the contractual par-ties. Thus, the netting arrangements do not meet the offsetting criteria under IAS 32 “Financial Instruments: Presentation.” The following table provides an overview of financial assets and financial liabilities from derivatives that are subject to netting, collateral, or similar arrangements:
Financial assets and financial liabilities from derivatives subject to netting, collateral, or similar arrangements 144
At December 31in million euros
Gross amount recog-nized in the statement of financial position 1
Amount eligible for offsetting
Financial collateral received / provided
Net amount
2015 2016 2015 2016 2015 2016 2015 2016
Financial assets 72 103 35 76 35 21 2 6
Financial liabilities 44 77 35 76 10 7 – 1 – 6
1 Fair values excluding valuation allowance of 2 million euros made for counterparty credit risk (previous year: 0 million euros).
In addition to netting and collateral arrangements, investment limits are set, based on the ratings of the counterparties, in order to minimize credit risk. These limits are monitored and adjusted regularly. When determining the limits, we also apply certain other indicators, such as the pricing of credit default swaps (CDS) by banks. A valuation allowance of 2 million euros exists to cover the remaining credit risk from the posi-tive fair values of derivatives (previous year: 0 million euros).
Credit risks also arise from financial investments such as cash at banks, securities and the positive fair value of derivatives. Such exposure is limited by our Corporate Treasury specialists through the selection of counterparties with strong credit rat-ings, and limitations on the amounts allocated to individual investments. In financial investments and derivatives trading with German and international banks, we only enter into transactions with counterparties of high financial standing. We invest exclusively in securities from issuers with an invest-ment grade rating. Our cash deposits can be liquidated at short notice. Our financial investments are broadly diversified across various counterparties and various financial assets. To minimize the credit risk, we agree netting arrangements to
Notes to the consolidated financial statements 161Henkel Annual Report 2016
116 Consolidated statement of financial position
118 Consolidated statement of income
118 Consolidated statement of comprehensive income
119 Consolidated statement of changes in equity
120 Consolidated statement of cash flows
121 Group segment report by business unit
122 Key financials by region123 Accounting principles and
methods applied in preparation of the consolidated financial statements
131 Notes to the consolidated statement of financial position
166 Notes to the consolidated statement of income
171 Other disclosures179 Subsequent events
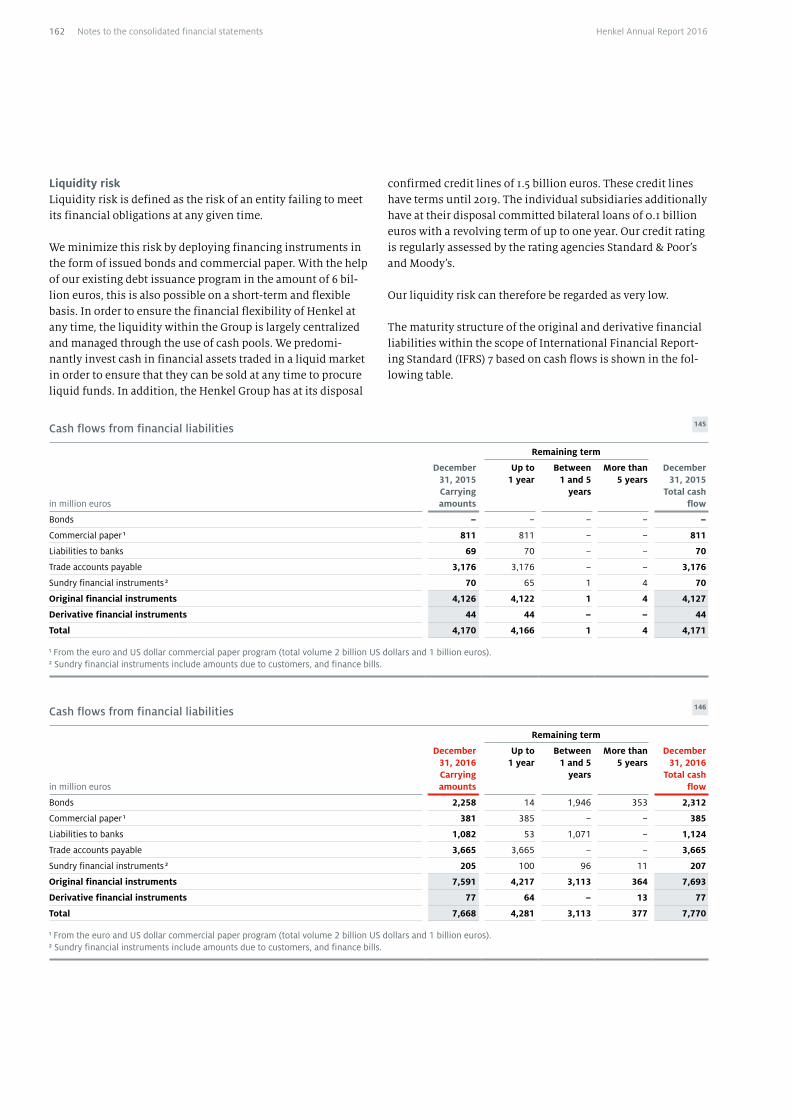
Liquidity riskLiquidity risk is defined as the risk of an entity failing to meet its financial obligations at any given time.
We minimize this risk by deploying financing instruments in the form of issued bonds and commercial paper. With the help of our existing debt issuance program in the amount of 6 bil-lion euros, this is also possible on a short-term and flexible basis. In order to ensure the financial flexibility of Henkel at any time, the liquidity within the Group is largely centralized and managed through the use of cash pools. We predomi-nantly invest cash in financial assets traded in a liquid market in order to ensure that they can be sold at any time to procure liquid funds. In addition, the Henkel Group has at its disposal
Cash flows from financial liabilities 145
Remaining term
in million euros
December 31, 2015 Carrying amounts
Up to 1 year
Between 1 and 5
years
More than 5 years
December 31, 2015
Total cash flow
Bonds – – – – –
Commercial paper 1 811 811 – – 811
Liabilities to banks 69 70 – – 70
Trade accounts payable 3,176 3,176 – – 3,176
Sundry financial instruments 2 70 65 1 4 70
Original financial instruments 4,126 4,122 1 4 4,127
Derivative financial instruments 44 44 – – 44
Total 4,170 4,166 1 4 4,171
1 From the euro and US dollar commercial paper program (total volume 2 billion US dollars and 1 billion euros).2 Sundry financial instruments include amounts due to customers, and finance bills.
Cash flows from financial liabilities 146
Remaining term
in million euros
December 31, 2016 Carrying amounts
Up to 1 year
Between 1 and 5
years
More than 5 years
December 31, 2016
Total cash flow
Bonds 2,258 14 1,946 353 2,312
Commercial paper 1 381 385 – – 385
Liabilities to banks 1,082 53 1,071 – 1,124
Trade accounts payable 3,665 3,665 – – 3,665
Sundry financial instruments 2 205 100 96 11 207
Original financial instruments 7,591 4,217 3,113 364 7,693
Derivative financial instruments 77 64 – 13 77
Total 7,668 4,281 3,113 377 7,770
1 From the euro and US dollar commercial paper program (total volume 2 billion US dollars and 1 billion euros).2 Sundry financial instruments include amounts due to customers, and finance bills.
confirmed credit lines of 1.5 billion euros. These credit lines have terms until 2019. The individual subsidiaries additionally have at their disposal committed bilateral loans of 0.1 billion euros with a revolving term of up to one year. Our credit rating is regularly assessed by the rating agencies Standard & Poor’s and Moody’s.
Our liquidity risk can therefore be regarded as very low.
The maturity structure of the original and derivative financial liabilities within the scope of International Financial Report-ing Standard (IFRS) 7 based on cash flows is shown in the fol-lowing table.
Notes to the consolidated financial statements162 Henkel Annual Report 2016
Market riskMarket risk exists where the fair value or future cash flows of a financial instrument may fluctuate due to changes in market prices. Market risks primarily take the form of currency risk, interest rate risk and various price risks (particularly the com-modity price risk, and the share price risk arising from our long-term incentive [LTI]). Henkel uses equity forward con-tracts to hedge against the share price risk.
The Corporate Treasury department manages currency expo-sure and interest rates centrally for the Group and is therefore responsible for all transactions with financial derivatives and other financial instruments. Trading, Treasury Controlling and Settlement (front, middle and back offices) are separated both physically and in terms of organization. The parties to the con-tracts are German and international banks which Henkel mon-itors regularly, in accordance with Corporate Treasury guide-lines, for creditworthiness and the quality of their quotations. Financial derivatives are used to manage currency exposure and interest rate risks in connection with operating activities and the resultant financing requirements, again in accordance with the Corporate Treasury guidelines. Financial derivatives are entered into solely for hedging purposes.
The currency and interest rate risk management of the Group is supported by an integrated treasury system which is used to identify, measure and analyze the Group’s currency exposure and interest rate risks. In this context, “integrated” means that the entire process from the conclusion of financial transac-tions to their entry in the accounts is covered. Much of the currency trading takes place on internet-based, multibank dealing platforms. These foreign currency transactions are automatically transferred into the treasury system. The cur-rency exposure and interest rate risks reported by all subsid-iaries under standardized reporting procedures are integrated into the treasury system by data transfer. As a result, it is pos-sible to retrieve and measure at any time all currency and interest rate risks across the Group and all derivatives entered into to hedge the exposure to these risks. The treasury system supports the use of various risk concepts.
Market risk is monitored on the basis of sensitivity analyses and value-at-risk computations. Sensitivity analyses enable estimation of potential losses, future gains, fair values or cash flows of instruments susceptible to market risks arising from one or several selected hypothetical changes in foreign exchange rates, interest rates, commodity prices or other relevant market rates or prices over a specific period. We use sensitivity analyses in the Henkel Group because they enable reasonable risk assessments to be made on the basis of direct assumptions (e.g. an increase in interest rates). Value-at-risk computations reveal the maximum potential future loss of a certain portfolio over a given period based on a specified probability level.
Currency riskThe global nature of our business activities results in a huge number of cash flows in different currencies. The resultant currency exposure breaks down into two categories, namely transaction and translation risks.
Transaction risks arise from possible exchange rate fluctua-tions causing changes in the value of future foreign currency cash flows. The hedging of the resultant exchange rate risks forms a major part of our central risk management activity. Transaction risks arising from our operating business are partially avoided by the fact that we largely manufacture our products in those countries in which they are sold. Residual transaction risks on the operating side are proactively man-aged by Corporate Treasury. This includes the ongoing assess-ment of the specific currency risk and the development of appropriate hedging strategies. The objective of our currency hedging is to fix prices based on hedging rates so that we are protected from future adverse fluctuations in exchange rates. Because we limit our potential losses, any negative impact on profits is restricted. The transaction risk arising from major financial payables and receivables is, for the most part, hedged. In order to manage these risks, we primarily utilize forward exchange contracts and currency swaps. The derivatives are designated as cash flow hedges or “Held for trading” and mea-sured accordingly. The currency risk that exists within the Group in the form of transaction risk initially affects equity in the case of cash flow hedges, while all changes in the value of derivatives designated as “Held for trading“ are recognized directly in income.
The value-at-risk pertaining to the transaction risk of the Henkel Group as of December 31, 2016 amounted to 99 million euros after hedging (previous year: 102 million euros). The val-ue-at-risk shows the maximum expected risk of loss in a year as a result of currency fluctuations. Starting in fiscal 2013, our value-at-risk analysis has been extended to one year in our internal risk reports as it provides a more comprehensive rep-resentation of the risk associated with a fiscal year. The risk arises from imports and exports by Henkel AG & Co. KGaA and its foreign subsidiaries. Due to the international nature of its activities, the Henkel Group has a portfolio with more than 50 different currencies. The following table shows the value-at-risk for Henkel’s major currencies.
Notes to the consolidated financial statements 163Henkel Annual Report 2016
116 Consolidated statement of financial position
118 Consolidated statement of income
118 Consolidated statement of comprehensive income
119 Consolidated statement of changes in equity
120 Consolidated statement of cash flows
121 Group segment report by business unit
122 Key financials by region123 Accounting principles and
methods applied in preparation of the consolidated financial statements
131 Notes to the consolidated statement of financial position
166 Notes to the consolidated statement of income
171 Other disclosures179 Subsequent events
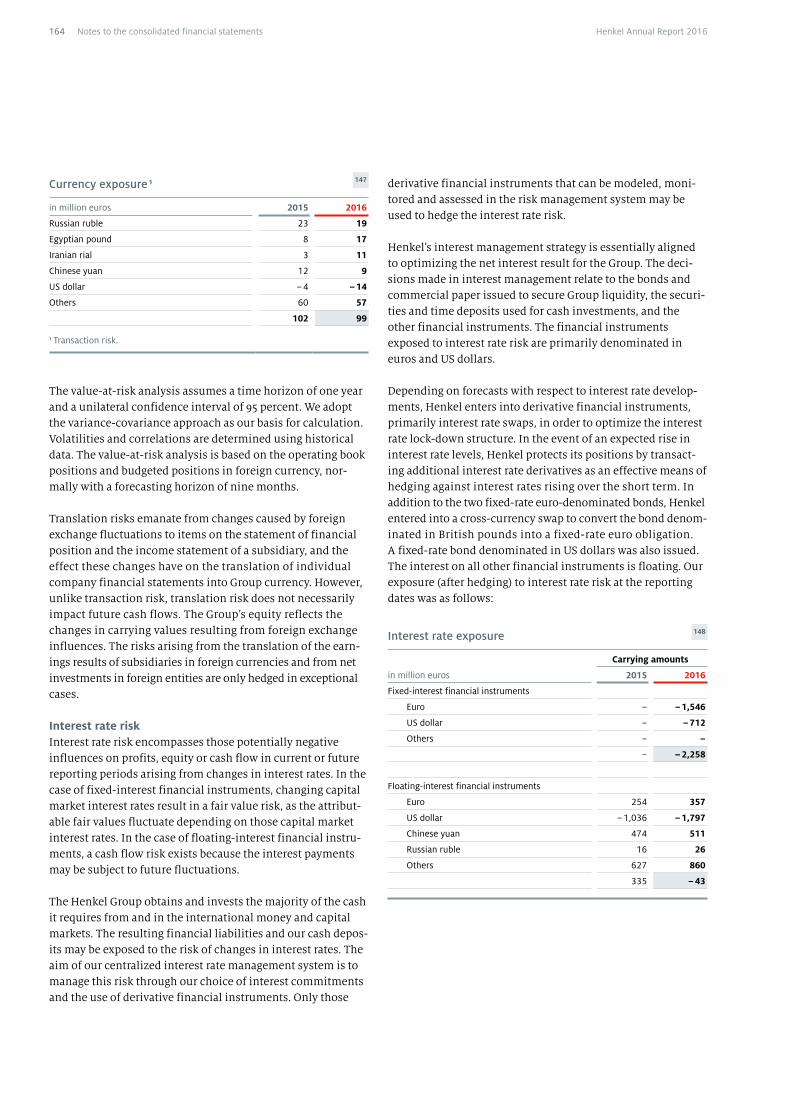
Currency exposure 1 147
in million euros 2015 2016
Russian ruble 23 19
Egyptian pound 8 17
Iranian rial 3 11
Chinese yuan 12 9
US dollar – 4 – 14
Others 60 57
102 99
1 Transaction risk.
The value-at-risk analysis assumes a time horizon of one year and a unilateral confidence interval of 95 percent. We adopt the variance-covariance approach as our basis for calculation. Volatilities and correlations are determined using historical data. The value-at-risk analysis is based on the operating book positions and budgeted positions in foreign currency, nor-mally with a forecasting horizon of nine months.
Translation risks emanate from changes caused by foreign exchange fluctuations to items on the statement of financial position and the income statement of a subsidiary, and the effect these changes have on the translation of individual company financial statements into Group currency. However, unlike transaction risk, translation risk does not necessarily impact future cash flows. The Group’s equity reflects the changes in carrying values resulting from foreign exchange influences. The risks arising from the translation of the earn-ings results of subsidiaries in foreign currencies and from net investments in foreign entities are only hedged in exceptional cases.
Interest rate riskInterest rate risk encompasses those potentially negative influences on profits, equity or cash flow in current or future reporting periods arising from changes in interest rates. In the case of fixed-interest financial instruments, changing capital market interest rates result in a fair value risk, as the attribut-able fair values fluctuate depending on those capital market interest rates. In the case of floating-interest financial instru-ments, a cash flow risk exists because the interest payments may be subject to future fluctuations.
The Henkel Group obtains and invests the majority of the cash it requires from and in the international money and capital markets. The resulting financial liabilities and our cash depos-its may be exposed to the risk of changes in interest rates. The aim of our centralized interest rate management system is to manage this risk through our choice of interest commitments and the use of derivative financial instruments. Only those
derivative financial instruments that can be modeled, moni-tored and assessed in the risk management system may be used to hedge the interest rate risk.
Henkel’s interest management strategy is essentially aligned to optimizing the net interest result for the Group. The deci-sions made in interest management relate to the bonds and commercial paper issued to secure Group liquidity, the securi-ties and time deposits used for cash investments, and the other financial instruments. The financial instruments exposed to interest rate risk are primarily denominated in euros and US dollars.
Depending on forecasts with respect to interest rate develop-ments, Henkel enters into derivative financial instruments, primarily interest rate swaps, in order to optimize the interest rate lock-down structure. In the event of an expected rise in interest rate levels, Henkel protects its positions by transact-ing additional interest rate derivatives as an effective means of hedging against interest rates rising over the short term. In addition to the two fixed-rate euro-denominated bonds, Henkel entered into a cross-currency swap to convert the bond denom-inated in British pounds into a fixed-rate euro obligation. A fixed-rate bond denominated in US dollars was also issued. The interest on all other financial instruments is floating. Our exposure (after hedging) to interest rate risk at the reporting dates was as follows:
Interest rate exposure 148
in million euros
Carrying amounts
2015 2016
Fixed-interest financial instruments
Euro – – 1,546
US dollar – – 712
Others – –
– – 2,258
Floating-interest financial instruments
Euro 254 357
US dollar – 1,036 – 1,797
Chinese yuan 474 511
Russian ruble 16 26
Others 627 860
335 – 43
Notes to the consolidated financial statements164 Henkel Annual Report 2016
The calculation of the interest rate risk is based on sensitivity analyses. The analysis of cash flow risk examines all the main floating-interest financial instruments as of the reporting date. Net financial position is defined as cash and cash equiva-lents plus readily monetizable financial instruments classified as “Available for sale” or according to the “Fair value option,” less borrowings, and plus positive and less negative fair values of hedging transactions. The interest rate risk figures shown in the table are based on this calculation at the relevant reporting date. When analyzing fair value risk, we assume a parallel shift in the interest curve of 100 basis points and calculate the hypothetical loss or gain of the relevant interest rate deriva-tives at the reporting date.
The risk of interest rate fluctuations with respect to the earn-ings of the Henkel Group is shown in the basis point value (BPV) analysis in the following table.
Interest rate risk 149
in million euros 2015 2016
Based on an interest rate change of 100 basis points – 3 –
of which:
Cash flow through profit and loss – 3 –
Fair value recognized in equity through comprehensive income – –
Other price risks (commodity price risk)Uncertainty with respect to commodity price development impacts the Group. Purchase prices for raw materials can affect the net assets, financial position and results of opera-tions of Henkel. The risk management strategy put in place by the Group management for safeguarding against procurement market risk is described in more detail in the risk and opportu-nities report on pages 106 and 107.
As a small part of the risk management strategy, cash-settled commodity futures may be entered into on the basis of fore-casted purchasing requirements in order to hedge future uncertainties with respect to commodity prices. Cash-settled commodity derivatives are only used at Henkel where there is a direct relationship between the hedging derivative and the physical underlying. Henkel does not practice hedge account-ing and can therefore be exposed to temporary price risks when holding commodity derivatives. Such price risks arise due to the fact that the commodity derivatives are measured at fair value whereas the purchasing requirement, as a pending transaction, is not measured or recognized. This can lead to losses being recognized in profit or loss and equity. Develop-ments in fair values and the resultant risks are continuously monitored.
Notes to the consolidated financial statements 165Henkel Annual Report 2016
116 Consolidated statement of financial position
118 Consolidated statement of income
118 Consolidated statement of comprehensive income
119 Consolidated statement of changes in equity
120 Consolidated statement of cash flows
121 Group segment report by business unit
122 Key financials by region123 Accounting principles and
methods applied in preparation of the consolidated financial statements
131 Notes to the consolidated statement of financial position
166 Notes to the consolidated statement of income
171 Other disclosures179 Subsequent events
22 Sales and principles of income recognition
Sales increased year on year to 18,714 million euros. Revenues and their development by business unit and region are sum-marized in the Group segment report and in the key financials by region on pages 121 and 122. A detailed explanation of the development of major income and expense items can be found in the combined management report on pages 64 to 69.
Sales comprise sales of goods and services less direct sales deductions such as customer-related rebates, credits and other benefits paid or granted. Sales are recognized once the goods have been delivered or the service has been performed. In the case of goods, this coincides with the physical delivery and so-called transfer of risks and rewards. Henkel uses different terms of delivery that contractually determine the transfer of risks and rewards. It must also be probable that the economic benefits associated with the transaction will flow to the Group, and the costs incurred with respect to the transaction must be reliably measurable.
Services are generally provided in conjunction with the sale of goods, and recorded once the service has been performed. No sale is recognized if there are significant risks relating to the receipt of the consideration or it is likely that the goods will be returned.
Interest income is recognized on a time-proportion basis that takes into account the effective yield on the asset and the inter-est rate in force. Dividend income from investments is recog-nized when the shareholders’ right to receive payment is legally established.
23 Cost of sales
The cost of sales increased from 9,368 million euros to 9,742 million euros.
Cost of sales comprises the cost of products and services sold and the purchase cost of merchandise sold. It consists of the directly attributable cost of materials and primary production cost, as well as indirect production overheads including the production-related amortization/depreciation and impair-ment of intangible assets and property, plant and equipment.
24 Marketing, selling and distribution expenses
Marketing, selling and distribution expenses amounted to 4,635 million euros (previous year: 4,608 million euros).
In addition to marketing organization and distribution expenses, this item comprises, in particular, advertising, sales promotion and market research expenses. Also included here are the expenses of technical advisory services for customers, valuation allowances on trade accounts receivable and valua-tion allowances and impairment losses on trademarks and other rights.
25 Research and development expenses
Research and development expenses decreased year on year to 463 million euros (previous year: 478 million euros). Expen-ditures directly attributable to research and development activities amounted to 460 million euros (previous year: 464 million euros).
The capitalization of research expenses is not permitted. Development expenditures are recognized as an asset if all the criteria for recognition are met, the research phase can be clearly distinguished from the development phase, and the expenditures can be attributed to distinct project phases. Currently, the criteria set out in International Accounting Standard (IAS) 38 “Intangible Assets” for recognizing develop-ment expenditures are not all met in regard to product and technology developments, due to a high level of interdepen-dence within these developments and the difficulty of assess-ing which products will eventually be marketable.
26 Administrative expenses
Administrative expenses amounted to 1,062 million euros (previous year: 1,012 million euros).
Administrative expenses include personnel and material costs relating to the Group management, Human Resources, Pur-chasing, Accounting and IT functions, as well as the costs of managing and administering the business units.
Notes to the consolidated statement of income
166 Henkel Annual Report 2016Notes to the consolidated financial statements
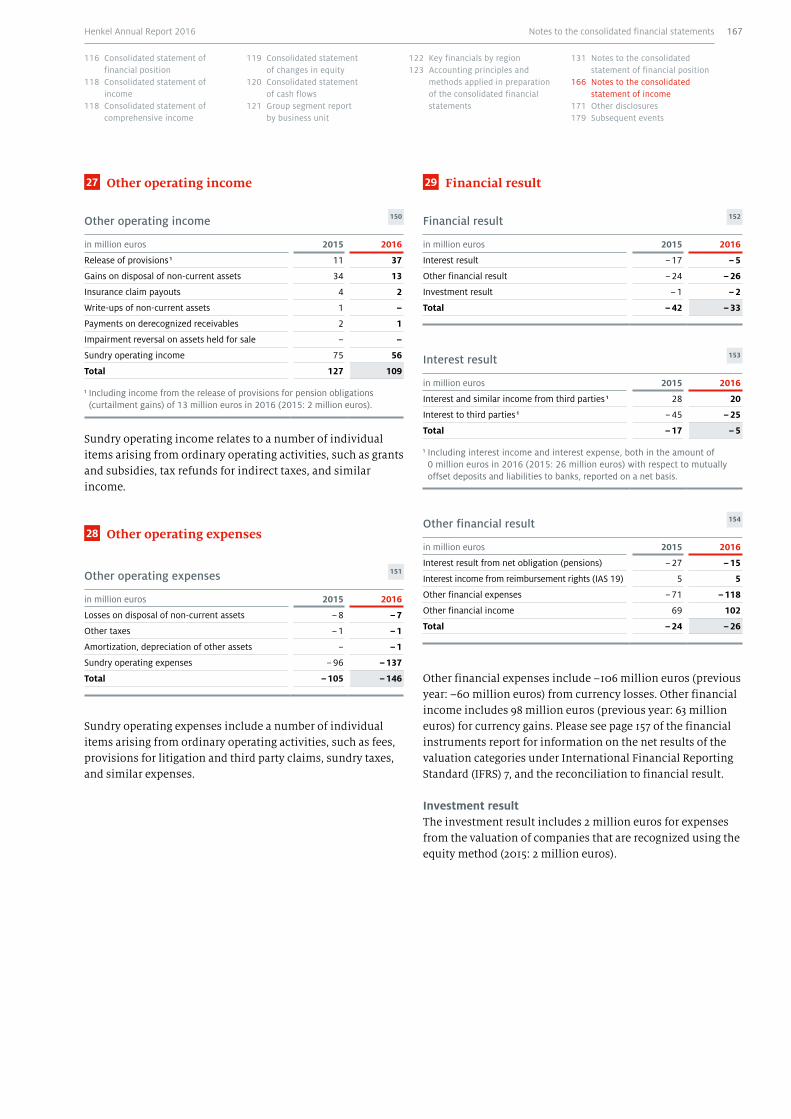
27 Other operating income
Other operating income 150
in million euros 2015 2016
Release of provisions 1 11 37
Gains on disposal of non-current assets 34 13
Insurance claim payouts 4 2
Write-ups of non-current assets 1 –
Payments on derecognized receivables 2 1
Impairment reversal on assets held for sale – –
Sundry operating income 75 56
Total 127 109
1 Including income from the release of provisions for pension obligations (curtailment gains) of 13 million euros in 2016 (2015: 2 million euros).
Sundry operating income relates to a number of individual items arising from ordinary operating activities, such as grants and subsidies, tax refunds for indirect taxes, and similar income.
28 Other operating expenses
Other operating expenses 151
in million euros 2015 2016
Losses on disposal of non-current assets – 8 – 7
Other taxes – 1 – 1
Amortization, depreciation of other assets – – 1
Sundry operating expenses – 96 – 137
Total – 105 – 146
Sundry operating expenses include a number of individual items arising from ordinary operating activities, such as fees, provisions for litigation and third party claims, sundry taxes, and similar expenses.
29 Financial result
Financial result 152
in million euros 2015 2016
Interest result – 17 – 5
Other financial result – 24 – 26
Investment result – 1 – 2
Total – 42 – 33
Interest result 153
in million euros 2015 2016
Interest and similar income from third parties 1 28 20
Interest to third parties 1 – 45 – 25
Total – 17 – 5
1 Including interest income and interest expense, both in the amount of 0 million euros in 2016 (2015: 26 million euros) with respect to mutually offset deposits and liabilities to banks, reported on a net basis.
Other financial result 154
in million euros 2015 2016
Interest result from net obligation (pensions) – 27 – 15
Interest income from reimbursement rights (IAS 19) 5 5
Other financial expenses – 71 – 118
Other financial income 69 102
Total – 24 – 26
Other financial expenses include –106 million euros (previous year: –60 million euros) from currency losses. Other financial income includes 98 million euros (previous year: 63 million euros) for currency gains. Please see page 157 of the financial instruments report for information on the net results of the valuation categories under International Financial Reporting Standard (IFRS) 7, and the reconciliation to financial result.
Investment resultThe investment result includes 2 million euros for expenses from the valuation of companies that are recognized using the equity method (2015: 2 million euros).
Notes to the consolidated financial statements 167Henkel Annual Report 2016
116 Consolidated statement of financial position
118 Consolidated statement of income
118 Consolidated statement of comprehensive income
119 Consolidated statement of changes in equity
120 Consolidated statement of cash flows
121 Group segment report by business unit
122 Key financials by region123 Accounting principles and
methods applied in preparation of the consolidated financial statements
131 Notes to the consolidated statement of financial position
166 Notes to the consolidated statement of income
171 Other disclosures179 Subsequent events
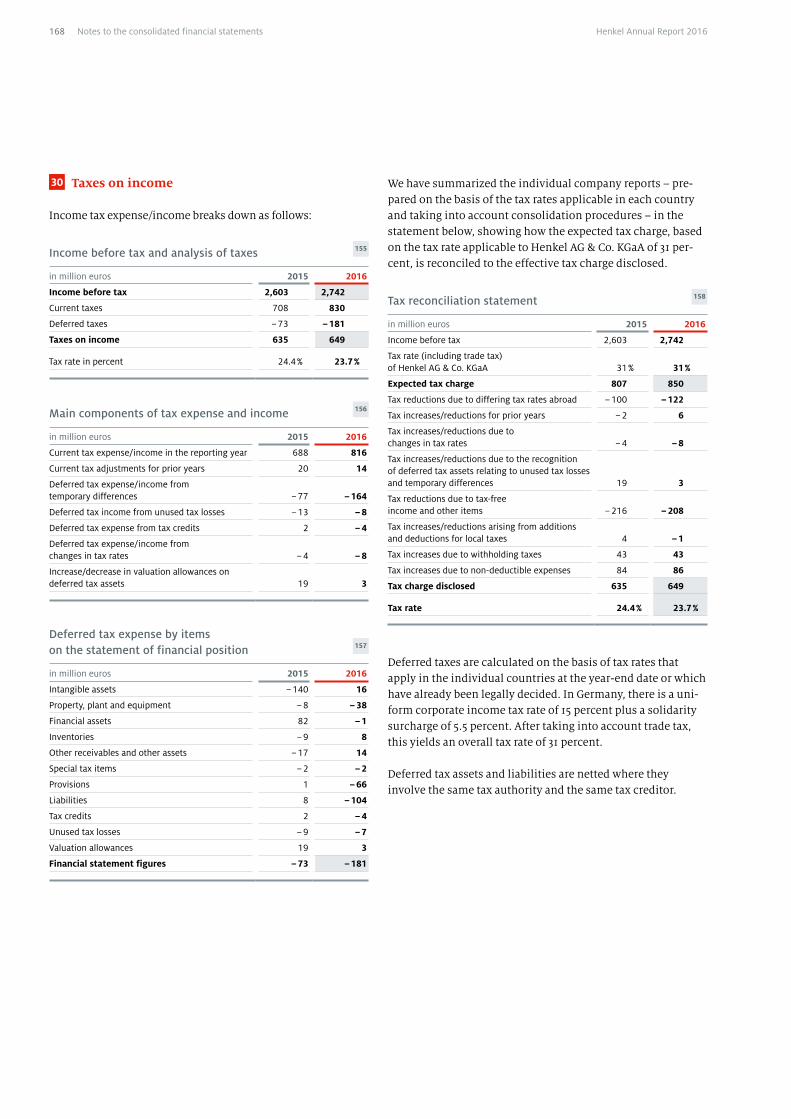
30 Taxes on income
Income tax expense/income breaks down as follows:
Income before tax and analysis of taxes 155
in million euros 2015 2016
Income before tax 2,603 2,742
Current taxes 708 830
Deferred taxes – 73 – 181
Taxes on income 635 649
Tax rate in percent 24.4 % 23.7 %
Main components of tax expense and income 156
in million euros 2015 2016
Current tax expense/income in the reporting year 688 816
Current tax adjustments for prior years 20 14
Deferred tax expense/income from temporary differences – 77 – 164
Deferred tax income from unused tax losses – 13 – 8
Deferred tax expense from tax credits 2 – 4
Deferred tax expense/income from changes in tax rates – 4 – 8
Increase/decrease in valuation allowances on deferred tax assets 19 3
Deferred tax expense by items on the statement of financial position 157
in million euros 2015 2016
Intangible assets – 140 16
Property, plant and equipment – 8 – 38
Financial assets 82 – 1
Inventories – 9 8
Other receivables and other assets – 17 14
Special tax items – 2 – 2
Provisions 1 – 66
Liabilities 8 – 104
Tax credits 2 – 4
Unused tax losses – 9 – 7
Valuation allowances 19 3
Financial statement figures – 73 – 181
We have summarized the individual company reports – pre-pared on the basis of the tax rates applicable in each country and taking into account consolidation procedures – in the statement below, showing how the expected tax charge, based on the tax rate applicable to Henkel AG & Co. KGaA of 31 per-cent, is reconciled to the effective tax charge disclosed.
Tax reconciliation statement 158
in million euros 2015 2016
Income before tax 2,603 2,742
Tax rate (including trade tax) of Henkel AG & Co. KGaA 31 % 31 %
Expected tax charge 807 850
Tax reductions due to differing tax rates abroad – 100 – 122
Tax increases/reductions for prior years – 2 6
Tax increases/reductions due to changes in tax rates – 4 – 8
Tax increases/reductions due to the recognition of deferred tax assets relating to unused tax losses and temporary differences 19 3
Tax reductions due to tax-free income and other items – 216 – 208
Tax increases/reductions arising from additions and deductions for local taxes 4 – 1
Tax increases due to withholding taxes 43 43
Tax increases due to non-deductible expenses 84 86
Tax charge disclosed 635 649
Tax rate 24.4 % 23.7 %
Deferred taxes are calculated on the basis of tax rates that apply in the individual countries at the year-end date or which have already been legally decided. In Germany, there is a uni-form corporate income tax rate of 15 percent plus a solidarity surcharge of 5.5 percent. After taking into account trade tax, this yields an overall tax rate of 31 percent.
Deferred tax assets and liabilities are netted where they involve the same tax authority and the same tax creditor.
168 Henkel Annual Report 2016Notes to the consolidated financial statements
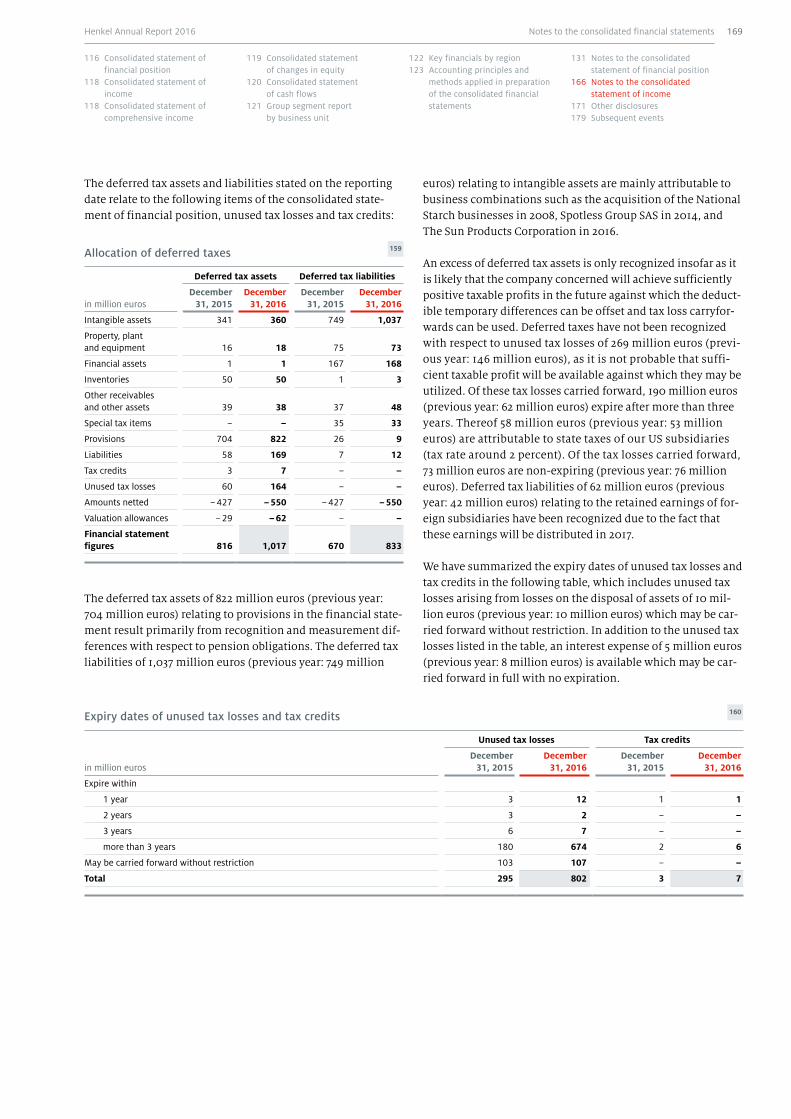
euros) relating to intangible assets are mainly attributable to business combinations such as the acquisition of the National Starch businesses in 2008, Spotless Group SAS in 2014, and The Sun Products Corporation in 2016.
An excess of deferred tax assets is only recognized insofar as it is likely that the company concerned will achieve sufficiently positive taxable profits in the future against which the deduct-ible temporary differences can be offset and tax loss carryfor-wards can be used. Deferred taxes have not been recognized with respect to unused tax losses of 269 million euros (previ-ous year: 146 million euros), as it is not probable that suffi-cient taxable profit will be available against which they may be utilized. Of these tax losses carried forward, 190 million euros (previous year: 62 million euros) expire after more than three years. Thereof 58 million euros (previous year: 53 million euros) are attributable to state taxes of our US subsidiaries (tax rate around 2 percent). Of the tax losses carried forward, 73 million euros are non-expiring (previous year: 76 million euros). Deferred tax liabilities of 62 million euros (previous year: 42 million euros) relating to the retained earnings of for-eign subsidiaries have been recognized due to the fact that these earnings will be distributed in 2017.
We have summarized the expiry dates of unused tax losses and tax credits in the following table, which includes unused tax losses arising from losses on the disposal of assets of 10 mil-lion euros (previous year: 10 million euros) which may be car-ried forward without restriction. In addition to the unused tax losses listed in the table, an interest expense of 5 million euros (previous year: 8 million euros) is available which may be car-ried forward in full with no expiration.
The deferred tax assets and liabilities stated on the reporting date relate to the following items of the consolidated state-ment of financial position, unused tax losses and tax credits:
Allocation of deferred taxes 159
in million euros
Deferred tax assets Deferred tax liabilities
December 31, 2015
December 31, 2016
December 31, 2015
December 31, 2016
Intangible assets 341 360 749 1,037
Property, plant and equipment 16 18 75 73
Financial assets 1 1 167 168
Inventories 50 50 1 3
Other receivables and other assets 39 38 37 48
Special tax items – – 35 33
Provisions 704 822 26 9
Liabilities 58 169 7 12
Tax credits 3 7 – –
Unused tax losses 60 164 – –
Amounts netted – 427 – 550 – 427 – 550
Valuation allowances – 29 – 62 – –
Financial statement figures 816 1,017 670 833
The deferred tax assets of 822 million euros (previous year: 704 million euros) relating to provisions in the financial state-ment result primarily from recognition and measurement dif-ferences with respect to pension obligations. The deferred tax liabilities of 1,037 million euros (previous year: 749 million
Expiry dates of unused tax losses and tax credits 160
Unused tax losses Tax credits
in million eurosDecember
31, 2015December
31, 2016December
31, 2015December
31, 2016
Expire within
1 year 3 12 1 1
2 years 3 2 – –
3 years 6 7 – –
more than 3 years 180 674 2 6
May be carried forward without restriction 103 107 – –
Total 295 802 3 7
Notes to the consolidated financial statements 169Henkel Annual Report 2016
116 Consolidated statement of financial position
118 Consolidated statement of income
118 Consolidated statement of comprehensive income
119 Consolidated statement of changes in equity
120 Consolidated statement of cash flows
121 Group segment report by business unit
122 Key financials by region123 Accounting principles and
methods applied in preparation of the consolidated financial statements
131 Notes to the consolidated statement of financial position
166 Notes to the consolidated statement of income
171 Other disclosures179 Subsequent events
In many countries, different tax rates apply to losses on the disposal of assets than to operating profits, and in some cases losses on the disposal of assets may only be offset against gains on the disposal of assets.
Tax loss carryforwards in the amount of 353 million euros are attributable to our US subsidiaries. Of this amount, 112 million euros relate to federal and state tax loss carryforwards, and 231 million euros (previous year: 101 million euros) relate exclusively to state taxes.
Equity-increasing deferred taxes of 55 million euros were recognized (previous year: equity-decreasing deferred taxes of 82 million euros). Within this figure, income of 55 million euros (previous year: expense of 88 million euros) results from actuarial gains and losses on pension obligations, while income of 0 million euros (previous year: income of 2 million euros) is attributable to hedges of net investments in foreign entities and an expense of 1 million euros (previous year: 0 million euros) is attributable to foreign exchange effects.
31 Non-controlling interests
The amount shown here represents the proportion of net income and losses attributable to other shareholders of con-solidated affiliated companies.
Their share of net income was 41 million euros (previous year: 49 million euros) and that of losses was 1 million euros (previ-ous year: 2 million euros).
The non-controlling interests included in the Henkel Group at the end of fiscal 2016 had no material impact on our net assets, financial position and results of operations. The Group has no joint operations or unconsolidated structured entities.
170 Henkel Annual Report 2016Notes to the consolidated financial statements
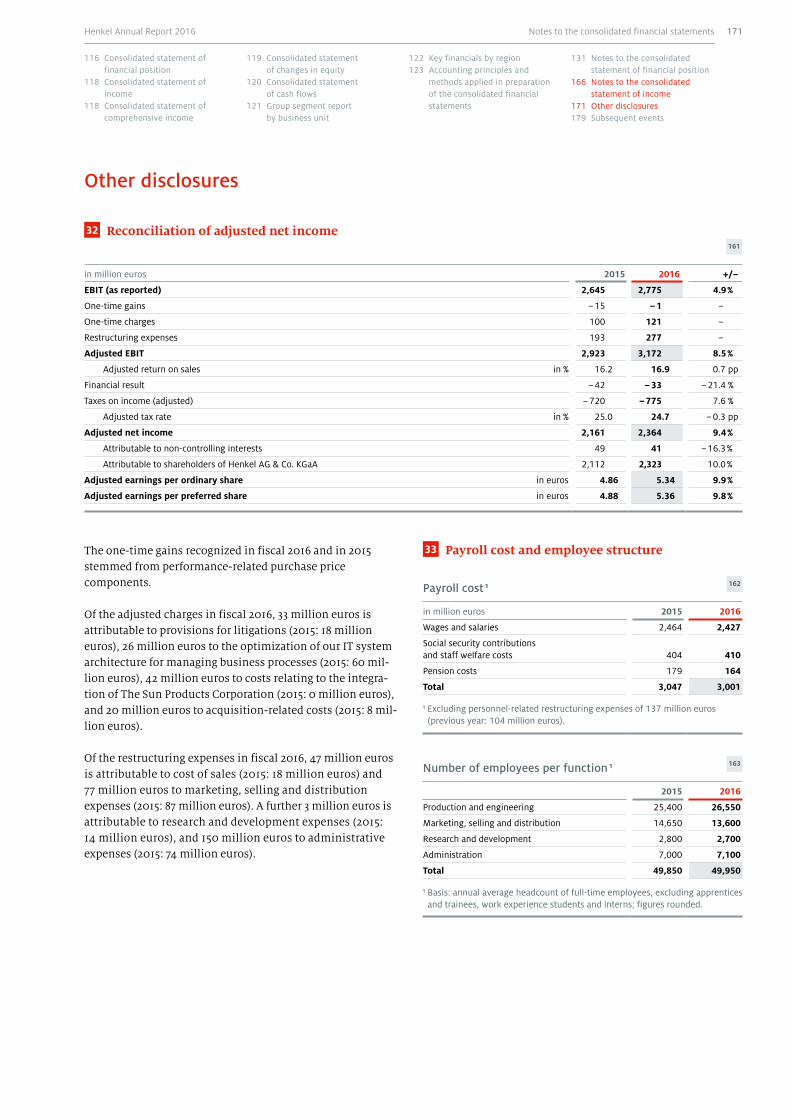
Other disclosures
32 Reconciliation of adjusted net income
161
in million euros 2015 2016 +/–
EBIT (as reported) 2,645 2,775 4.9 %
One-time gains – 15 – 1 –
One-time charges 100 121 –
Restructuring expenses 193 277 –
Adjusted EBIT 2,923 3,172 8.5 %
Adjusted return on sales in % 16.2 16.9 0.7 pp
Financial result – 42 – 33 – 21.4 %
Taxes on income (adjusted) – 720 – 775 7.6 %
Adjusted tax rate in % 25.0 24.7 – 0.3 pp
Adjusted net income 2,161 2,364 9.4 %
Attributable to non-controlling interests 49 41 – 16.3 %
Attributable to shareholders of Henkel AG & Co. KGaA 2,112 2,323 10.0 %
Adjusted earnings per ordinary share in euros 4.86 5.34 9.9 %
Adjusted earnings per preferred share in euros 4.88 5.36 9.8 %
The one-time gains recognized in fiscal 2016 and in 2015 stemmed from performance-related purchase price components.
Of the adjusted charges in fiscal 2016, 33 million euros is attributable to provisions for litigations (2015: 18 million euros), 26 million euros to the optimization of our IT system architecture for managing business processes (2015: 60 mil-lion euros), 42 million euros to costs relating to the integra-tion of The Sun Products Corporation (2015: 0 million euros), and 20 million euros to acquisition-related costs (2015: 8 mil-lion euros).
Of the restructuring expenses in fiscal 2016, 47 million euros is attributable to cost of sales (2015: 18 million euros) and 77 million euros to marketing, selling and distribution expenses (2015: 87 million euros). A further 3 million euros is attributable to research and development expenses (2015: 14 million euros), and 150 million euros to administrative expenses (2015: 74 million euros).
33 Payroll cost and employee structure
Payroll cost 1 162
in million euros 2015 2016
Wages and salaries 2,464 2,427
Social security contributions and staff welfare costs 404 410
Pension costs 179 164
Total 3,047 3,001
1 Excluding personnel-related restructuring expenses of 137 million euros (previous year: 104 million euros).
Number of employees per function 1 163
2015 2016
Production and engineering 25,400 26,550
Marketing, selling and distribution 14,650 13,600
Research and development 2,800 2,700
Administration 7,000 7,100
Total 49,850 49,950
1 Basis: annual average headcount of full-time employees, excluding apprentices and trainees, work experience students and interns; figures rounded.
Notes to the consolidated financial statements 171Henkel Annual Report 2016
116 Consolidated statement of financial position
118 Consolidated statement of income
118 Consolidated statement of comprehensive income
119 Consolidated statement of changes in equity
120 Consolidated statement of cash flows
121 Group segment report by business unit
122 Key financials by region123 Accounting principles and
methods applied in preparation of the consolidated financial statements
131 Notes to the consolidated statement of financial position
166 Notes to the consolidated statement of income
171 Other disclosures179 Subsequent events
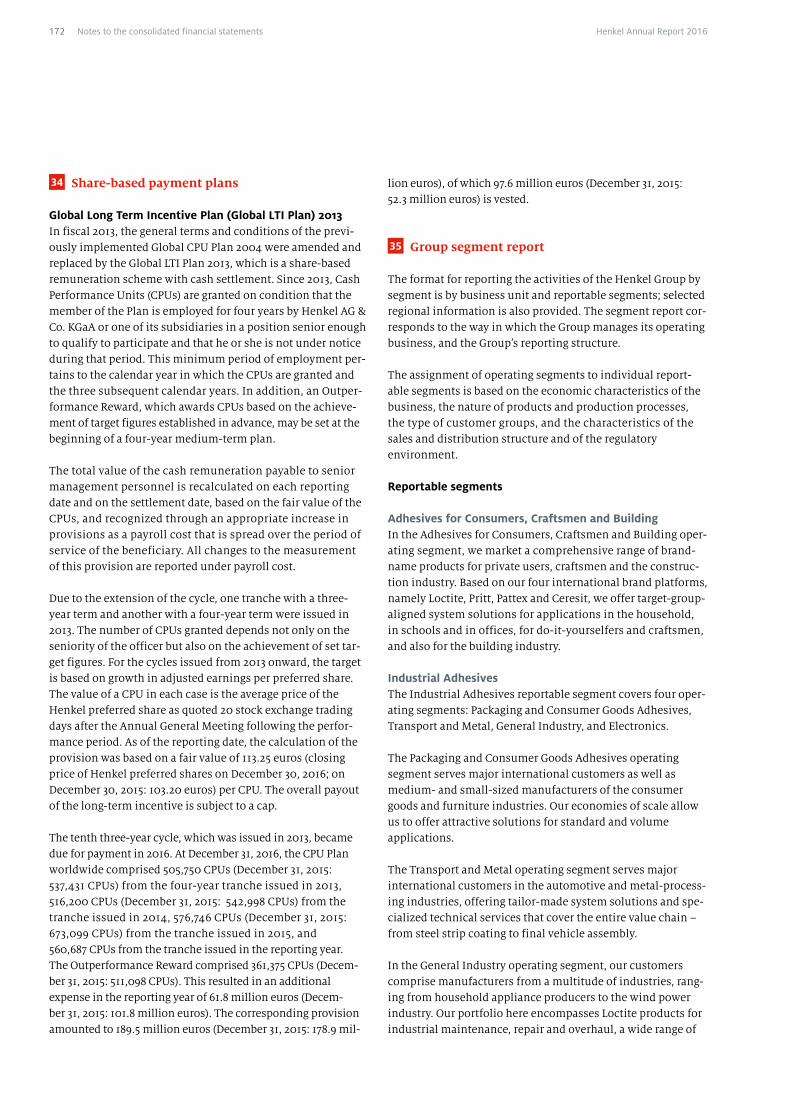
34 Share-based payment plans
Global Long Term Incentive Plan (Global LTI Plan) 2013In fiscal 2013, the general terms and conditions of the previ-ously implemented Global CPU Plan 2004 were amended and replaced by the Global LTI Plan 2013, which is a share-based remuneration scheme with cash settlement. Since 2013, Cash Performance Units (CPUs) are granted on condition that the member of the Plan is employed for four years by Henkel AG & Co. KGaA or one of its subsidiaries in a position senior enough to qualify to participate and that he or she is not under notice during that period. This minimum period of employment per-tains to the calendar year in which the CPUs are granted and the three subsequent calendar years. In addition, an Outper-formance Reward, which awards CPUs based on the achieve-ment of target figures established in advance, may be set at the beginning of a four-year medium-term plan.
The total value of the cash remuneration payable to senior management personnel is recalculated on each reporting date and on the settlement date, based on the fair value of the CPUs, and recognized through an appropriate increase in provisions as a payroll cost that is spread over the period of service of the beneficiary. All changes to the measurement of this provision are reported under payroll cost.
Due to the extension of the cycle, one tranche with a three-year term and another with a four-year term were issued in 2013. The number of CPUs granted depends not only on the seniority of the officer but also on the achievement of set tar-get figures. For the cycles issued from 2013 onward, the target is based on growth in adjusted earnings per preferred share. The value of a CPU in each case is the average price of the Henkel preferred share as quoted 20 stock exchange trading days after the Annual General Meeting following the perfor-mance period. As of the reporting date, the calculation of the provision was based on a fair value of 113.25 euros (closing price of Henkel preferred shares on December 30, 2016; on December 30, 2015: 103.20 euros) per CPU. The overall payout of the long-term incentive is subject to a cap.
The tenth three-year cycle, which was issued in 2013, became due for payment in 2016. At December 31, 2016, the CPU Plan worldwide comprised 505,750 CPUs (December 31, 2015: 537,431 CPUs) from the four-year tranche issued in 2013, 516,200 CPUs (December 31, 2015: 542,998 CPUs) from the tranche issued in 2014, 576,746 CPUs (December 31, 2015: 673,099 CPUs) from the tranche issued in 2015, and 560,687 CPUs from the tranche issued in the reporting year. The Outperformance Reward comprised 361,375 CPUs (Decem-ber 31, 2015: 511,098 CPUs). This resulted in an additional expense in the reporting year of 61.8 million euros (Decem-ber 31, 2015: 101.8 million euros). The corresponding provision amounted to 189.5 million euros (December 31, 2015: 178.9 mil-
lion euros), of which 97.6 million euros (December 31, 2015: 52.3 million euros) is vested.
35 Group segment report
The format for reporting the activities of the Henkel Group by segment is by business unit and reportable segments; selected regional information is also provided. The segment report cor-responds to the way in which the Group manages its operating business, and the Group’s reporting structure.
The assignment of operating segments to individual report-able segments is based on the economic characteristics of the business, the nature of products and production processes, the type of customer groups, and the characteristics of the sales and distribution structure and of the regulatory environment.
Reportable segments
Adhesives for Consumers, Craftsmen and BuildingIn the Adhesives for Consumers, Craftsmen and Building oper-ating segment, we market a comprehensive range of brand-name products for private users, craftsmen and the construc-tion industry. Based on our four international brand platforms, namely Loctite, Pritt, Pattex and Ceresit, we offer target-group-aligned system solutions for applications in the household, in schools and in offices, for do-it-yourselfers and craftsmen, and also for the building industry.
Industrial AdhesivesThe Industrial Adhesives reportable segment covers four oper-ating segments: Packaging and Consumer Goods Adhesives, Transport and Metal, General Industry, and Electronics.
The Packaging and Consumer Goods Adhesives operating segment serves major international customers as well as medium- and small-sized manufacturers of the consumer goods and furniture industries. Our economies of scale allow us to offer attractive solutions for standard and volume applications.
The Transport and Metal operating segment serves major international customers in the automotive and metal-process-ing industries, offering tailor-made system solutions and spe-cialized technical services that cover the entire value chain – from steel strip coating to final vehicle assembly.
In the General Industry operating segment, our customers comprise manufacturers from a multitude of industries, rang-ing from household appliance producers to the wind power industry. Our portfolio here encompasses Loctite products for industrial maintenance, repair and overhaul, a wide range of
172 Henkel Annual Report 2016Notes to the consolidated financial statements
sealants and system solutions for surface treatment applica-tions, and specialty adhesives.
Our Electronics operating segment offers customers from the worldwide electronics industry a broad spectrum of innova-tive high-technology adhesives and soldering materials for the manufacture of microchips and electronic assemblies.
Beauty CareThe Beauty Care reportable segment covers our globally active Branded Consumer Goods operating segment with Hair Care, Hair Colorants, Hair Styling, Body Care, Skin Care and Oral Care, as well as the professional Hair Salon operating segment.
Laundry & Home CareThis reportable segment covers the global activities of Henkel in laundry and home care branded consumer goods. The Laundry Care operating segment includes not only heavy-duty and spe-cialty detergents but also fabric softeners, laundry performance enhancers, and other fabric care products. Our Home Care oper-ating segment encompasses hand and automatic dishwashing products, cleaners for bathroom and WC applications, and household, glass and specialty cleaners. We also offer air fresh-eners and insect control products for household applications in selected regions.
Principles of Group segment reportingIn determining the segment results, assets and liabilities, we apply essentially the same principles of recognition and mea-surement as in the consolidated financial statements. We have valued net operating assets in foreign currencies at average exchange rates.
The Group measures the performance of its segments on the basis of a segment income variable referred to by Internal Con-trol and Reporting as “adjusted EBIT.” For this purpose, operating profit (EBIT) is adjusted for one-time charges and gains and also restructuring expenses.
Of the restructuring expenses, 61 million euros (previous year: 77 million euros) is attributable to Adhesive Technologies, 94 million euros (previous year: 43 million euros) to Beauty Care and 119 million euros (previous year: 66 million euros) to Laundry & Home Care.
For reconciliation with the figures for the Henkel Group, Group overheads are reported under Corporate together with income and expenses that cannot be allocated to the individual business units.
Proceeds transferred between the segments only exist to a negligible extent and are therefore not separately disclosed.
Operating assets, provisions and liabilities are assigned to the segments in accordance with their usage or origin. Where usage or origin is attributable to several segments, allocation is effected on the basis of appropriate ratios and keys.
For regional and geographic analysis purposes, we allocate sales to countries on the basis of the country-of-origin principle, and non-current assets in accordance with the domicile of the inter-national company to which they pertain.
Notes to the consolidated financial statements 173Henkel Annual Report 2016
116 Consolidated statement of financial position
118 Consolidated statement of income
118 Consolidated statement of comprehensive income
119 Consolidated statement of changes in equity
120 Consolidated statement of cash flows
121 Group segment report by business unit
122 Key financials by region123 Accounting principles and
methods applied in preparation of the consolidated financial statements
131 Notes to the consolidated statement of financial position
166 Notes to the consolidated statement of income
171 Other disclosures179 Subsequent events
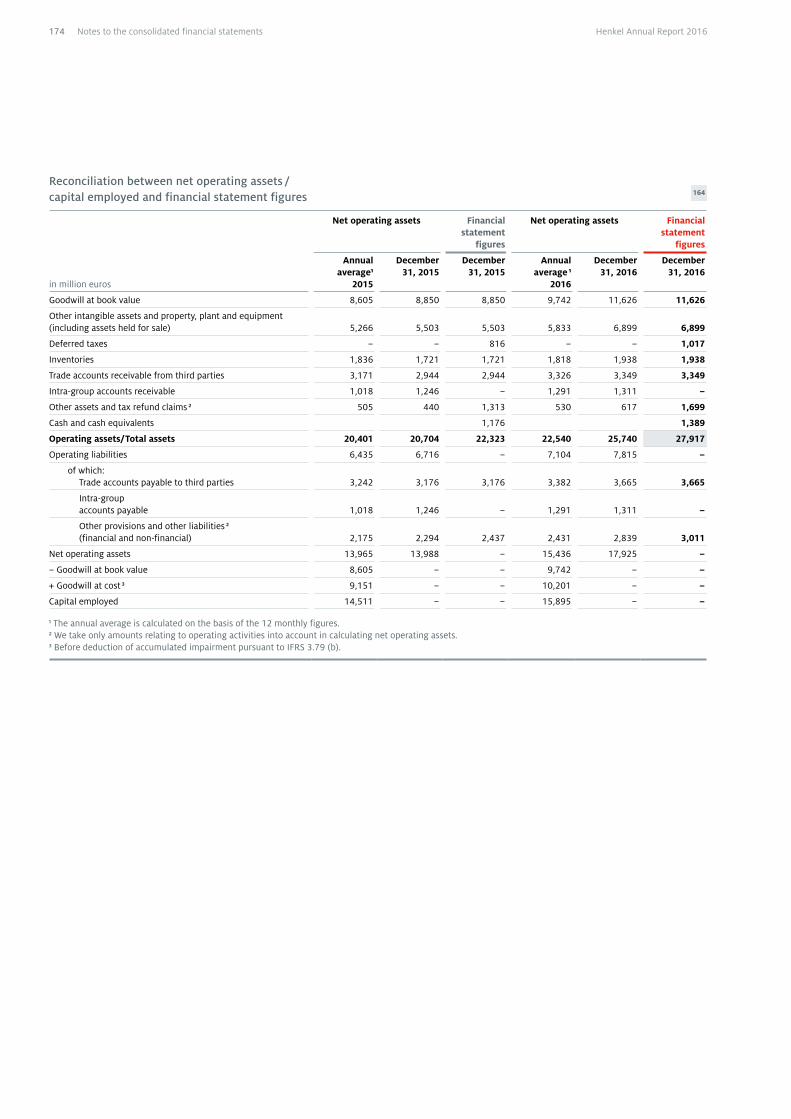
Reconciliation between net operating assets / capital employed and financial statement figures 164
in million euros
Net operating assets Financial statement
figures
Net operating assets Financial statement
figures
Annual average1
2015
December 31, 2015
December 31, 2015
Annual average 1
2016
December 31, 2016
December 31, 2016
Goodwill at book value 8,605 8,850 8,850 9,742 11,626 11,626
Other intangible assets and property, plant and equipment (including assets held for sale) 5,266 5,503 5,503 5,833 6,899 6,899
Deferred taxes – – 816 – – 1,017
Inventories 1,836 1,721 1,721 1,818 1,938 1,938
Trade accounts receivable from third parties 3,171 2,944 2,944 3,326 3,349 3,349
Intra-group accounts receivable 1,018 1,246 – 1,291 1,311 –
Other assets and tax refund claims 2 505 440 1,313 530 617 1,699
Cash and cash equivalents 1,176 1,389
Operating assets/Total assets 20,401 20,704 22,323 22,540 25,740 27,917
Operating liabilities 6,435 6,716 – 7,104 7,815 –
of which: Trade accounts payable to third parties 3,242 3,176 3,176 3,382 3,665 3,665
Intra-group accounts payable 1,018 1,246 – 1,291 1,311 –
Other provisions and other liabilities 2 (financial and non-financial) 2,175 2,294 2,437 2,431 2,839 3,011
Net operating assets 13,965 13,988 – 15,436 17,925 –
– Goodwill at book value 8,605 – – 9,742 – –
+ Goodwill at cost 3 9,151 – – 10,201 – –
Capital employed 14,511 – – 15,895 – –
1 The annual average is calculated on the basis of the 12 monthly figures.2 We take only amounts relating to operating activities into account in calculating net operating assets.3 Before deduction of accumulated impairment pursuant to IFRS 3.79 (b).
174 Henkel Annual Report 2016Notes to the consolidated financial statements

36 Earnings per share
Earnings per share 165
2015 2016
in million euros (rounded) Reported Adjusted Reported Adjusted
Net income attributable to shareholders of Henkel AG & Co. KGaA 1,921 2,112 2,053 2,323
Dividends, ordinary shares 377 377 416 416
Dividends, preferred shares 256 256 283 283
Total dividends 633 633 699 699
Retained earnings, ordinary shares 771 885 810 972
Retained earnings, preferred shares 517 594 544 652
Retained earnings 1,288 1,479 1,354 1,624
Number of ordinary shares 259,795,875 259,795,875 259,795,875 259,795,875
Dividend per ordinary share in euros 1.45 1.45 1.60 3 1.60 3
Of which preliminary dividend per ordinary share in euros 1 0.02 0.02 0.02 0.02
Retained earnings per ordinary share in euros 2.97 3.41 3.12 3.74
EPS per ordinary share in euros 4.42 4.86 4.72 5.34
Number of outstanding preferred shares 2 174,482,312 174,482,312 174,482,323 174,482,323
Dividend per preferred share in euros 1.47 1.47 1.62 3 1.62 3
Of which preferred dividend per preferred share in euros 1 0.04 0.04 0.04 0.04
Retained earnings per preferred share in euros 2.97 3.41 3.12 3.74
EPS per preferred share in euros 4.44 4.88 4.74 5.36
Number of ordinary shares 259,795,875 259,795,875 259,795,875 259,795,875
Dividend per ordinary share in euros 1.45 1.45 1.60 3 1.60 3
Of which preliminary dividend per ordinary share in euros 1 0.02 0.02 0.02 0.02
Retained earnings per ordinary share in euros (after dilution) 2.97 3.41 3.12 3.74
Diluted EPS per ordinary share in euros 4.42 4.86 4.72 5.34
Number of potentially outstanding preferred shares 2 174,482,312 174,482,312 174,482,323 174,482,323
Dividend per preferred share in euros 1.47 1.47 1.62 3 1.62 3
Of which preferred dividend per preferred share in euros 1 0.04 0.04 0.04 0.04
Retained earnings per preferred share in euros (after dilution) 2.97 3.41 3.12 3.74
Diluted EPS per preferred share in euros 4.44 4.88 4.74 5.36
1 See combined management report, Corporate governance, Capital stock denominations/Shareholder rights/Amendments to the Articles of Association on pages 30 and 31.
2 Weighted annual average of preferred shares.3 Proposal to shareholders for the Annual General Meeting on April 6, 2017.
Notes to the consolidated financial statements 175Henkel Annual Report 2016
116 Consolidated statement of financial position
118 Consolidated statement of income
118 Consolidated statement of comprehensive income
119 Consolidated statement of changes in equity
120 Consolidated statement of cash flows
121 Group segment report by business unit
122 Key financials by region123 Accounting principles and
methods applied in preparation of the consolidated financial statements
131 Notes to the consolidated statement of financial position
166 Notes to the consolidated statement of income
171 Other disclosures179 Subsequent events
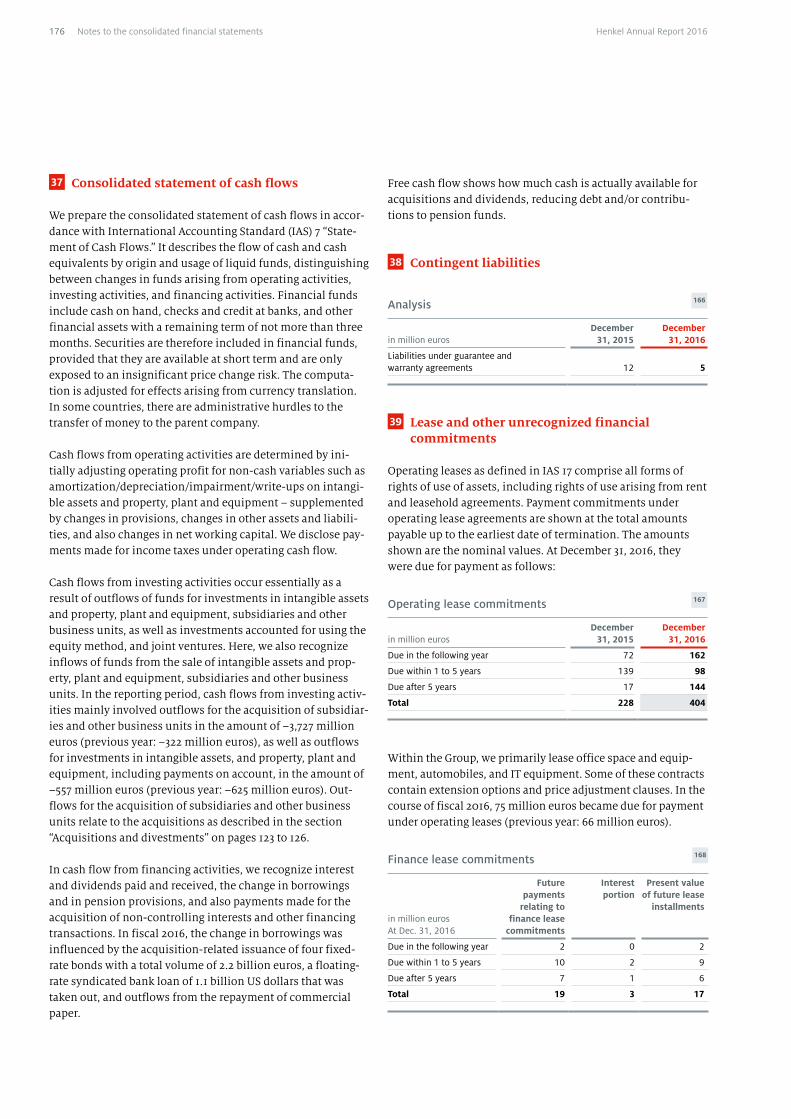
37 Consolidated statement of cash flows
We prepare the consolidated statement of cash flows in accor-dance with International Accounting Standard (IAS) 7 “State-ment of Cash Flows.” It describes the flow of cash and cash equivalents by origin and usage of liquid funds, distinguishing between changes in funds arising from operating activities, investing activities, and financing activities. Financial funds include cash on hand, checks and credit at banks, and other financial assets with a remaining term of not more than three months. Securities are therefore included in financial funds, provided that they are available at short term and are only exposed to an insignificant price change risk. The computa-tion is adjusted for effects arising from currency translation. In some countries, there are administrative hurdles to the transfer of money to the parent company.
Cash flows from operating activities are determined by ini-tially adjusting operating profit for non-cash variables such as amortization/depreciation/impairment/write-ups on intangi-ble assets and property, plant and equipment – supplemented by changes in provisions, changes in other assets and liabili-ties, and also changes in net working capital. We disclose pay-ments made for income taxes under operating cash flow.
Cash flows from investing activities occur essentially as a result of outflows of funds for investments in intangible assets and property, plant and equipment, subsidiaries and other business units, as well as investments accounted for using the equity method, and joint ventures. Here, we also recognize inflows of funds from the sale of intangible assets and prop-erty, plant and equipment, subsidiaries and other business units. In the reporting period, cash flows from investing activ-ities mainly involved outflows for the acquisition of subsidiar-ies and other business units in the amount of –3,727 million euros (previous year: –322 million euros), as well as outflows for investments in intangible assets, and property, plant and equipment, including payments on account, in the amount of –557 million euros (previous year: –625 million euros). Out-flows for the acquisition of subsidiaries and other business units relate to the acquisitions as described in the section “Acquisitions and divestments” on pages 123 to 126.
In cash flow from financing activities, we recognize interest and dividends paid and received, the change in borrowings and in pension provisions, and also payments made for the acquisition of non-controlling interests and other financing transactions. In fiscal 2016, the change in borrowings was influenced by the acquisition-related issuance of four fixed-rate bonds with a total volume of 2.2 billion euros, a floating- rate syndicated bank loan of 1.1 billion US dollars that was taken out, and outflows from the repayment of commercial paper.
Free cash flow shows how much cash is actually available for acquisitions and dividends, reducing debt and/or contribu-tions to pension funds.
38 Contingent liabilities
Analysis 166
in million eurosDecember
31, 2015December
31, 2016
Liabilities under guarantee and warranty agreements
12
5
39 Lease and other unrecognized financial commitments
Operating leases as defined in IAS 17 comprise all forms of rights of use of assets, including rights of use arising from rent and leasehold agreements. Payment commitments under operating lease agreements are shown at the total amounts payable up to the earliest date of termination. The amounts shown are the nominal values. At December 31, 2016, they were due for payment as follows:
Operating lease commitments 167
in million eurosDecember
31, 2015December
31, 2016
Due in the following year 72 162
Due within 1 to 5 years 139 98
Due after 5 years 17 144
Total 228 404
Within the Group, we primarily lease office space and equip-ment, automobiles, and IT equipment. Some of these contracts contain extension options and price adjustment clauses. In the course of fiscal 2016, 75 million euros became due for payment under operating leases (previous year: 66 million euros).
Finance lease commitments 168
in million euros At Dec. 31, 2016
Future payments
relating to finance lease
commitments
Interest portion
Present value of future lease
installments
Due in the following year 2 0 2
Due within 1 to 5 years 10 2 9
Due after 5 years 7 1 6
Total 19 3 17
176 Henkel Annual Report 2016Notes to the consolidated financial statements
At December 31, 2015, the company had no finance lease commitments.
As of the end of 2016, commitments arising from orders for property, plant and equipment amounted to 68 million euros (previous year: 65 million euros).
As of the reporting date, payment commitments under the terms of agreements for capital increases and share pur-chases contracted prior to December 31, 2016 amounted to 4 million euros (previous year: 0 million euros).
40 Voting rights / Related party disclosures
Related parties as defined by IAS 24 “Related Party Disclosures” are legal entities or natural persons who may be able to exert influence on Henkel AG & Co. KGaA and its subsidiaries, or be subject to control or material influence by Henkel AG & Co. KGaA or its subsidiaries. These mainly include all members of the Henkel family share-pooling agreement, the non-consoli-dated affiliated companies in which Henkel holds shares, the associated companies, and the members of the corporate bod-ies of Henkel AG & Co. KGaA, whose remuneration is explained in the remuneration report in the combined management report (pages 39 to 51). Related parties as defined in IAS 24 also include Henkel Trust e.V. and Metzler Trust e.V.
Information required by Section 160 (1) no. 8 of the German Stock Corporation Act [AktG]:
Henkel AG & Co. KGaA, Düsseldorf, has been notified that on December 17, 2015 the proportion of voting rights held by the members of the Henkel family share-pooling agreement repre-sented in total a share of 61.02 percent of the voting rights (158,535,741 votes) in Henkel AG & Co. KGaA (International Secu-rities Identification Number [ISIN]: DE0006048408), held by• 131 members of the families of the descendents of Fritz
Henkel, the company’s founder,• four foundations set up by members of those families,• three trusts set up by members of those families,• two private limited companies (GmbH) set up by members
of those families, 13 limited partnerships with a lim ited company as general partner (GmbH & Co. KG), and one limited partnership (KG),
under the terms of a share-pooling agreement per Section 22 (2) of the German Securities Trading Act [WpHG], whereby the shares held by the two private limited companies, by the 13 limited partnerships with a limited company as general partner, and by the one limited partnership, representing a percentage of 16.97 percent of the voting rights (44,081,965 votes), are attributed (per Section 22 (1) no. 1 WpHG) to the family members who control those companies.
No party to the share-pooling agreement is obliged to notify that it has reached or exceeded 3 percent or more of the total voting rights in Henkel AG & Co. KGaA, even after adding voting rights expressly granted under the terms of usufruct agreements.
Dr. Simone Bagel-Trah, Germany, is the authorized representa-tive of the parties to the Henkel family share-pooling agree-ment. (Latest notification November 5, 2014.)
Financial receivables from and payables to other investments in the form of non-consolidated affiliated entities and associ-ated entities are disclosed in Notes 3 and 18.
Henkel Trust e.V. and Metzler Trust e.V., as parties to relevant contractual trust arrangements (CTA), hold the assets required to cover the pension obligations in Germany. The claim on Henkel Trust e.V. for reimbursement of pension payments made is shown under other financial assets (Note 3 on page 137). The receivable does not bear interest.
41 Exercise of exemption options
As was also the case in 2015, the following German companies included in the consolidated financial statements of Henkel AG & Co. KGaA exercised exemption options in fiscal 2016:• Schwarzkopf Henkel Production Europe GmbH & Co. KG,
Düsseldorf (Section 264b German Commercial Code [HGB])• Henkel Loctite-KID GmbH, Hagen (Section 264 (3) HGB)• Henkel IP Management and IC Services GmbH, Monheim
(Section 264 (3) HGB)• The Bergquist Company GmbH, Halstenbek
(Section 264 (3) HGB)
The Dutch company Henkel Nederland B.V., Nieuwegein, exercised the exemption option afforded in Article 2:403 of the Civil Code of the Netherlands.
Notes to the consolidated financial statements 177Henkel Annual Report 2016
116 Consolidated statement of financial position
118 Consolidated statement of income
118 Consolidated statement of comprehensive income
119 Consolidated statement of changes in equity
120 Consolidated statement of cash flows
121 Group segment report by business unit
122 Key financials by region123 Accounting principles and
methods applied in preparation of the consolidated financial statements
131 Notes to the consolidated statement of financial position
166 Notes to the consolidated statement of income
171 Other disclosures179 Subsequent events
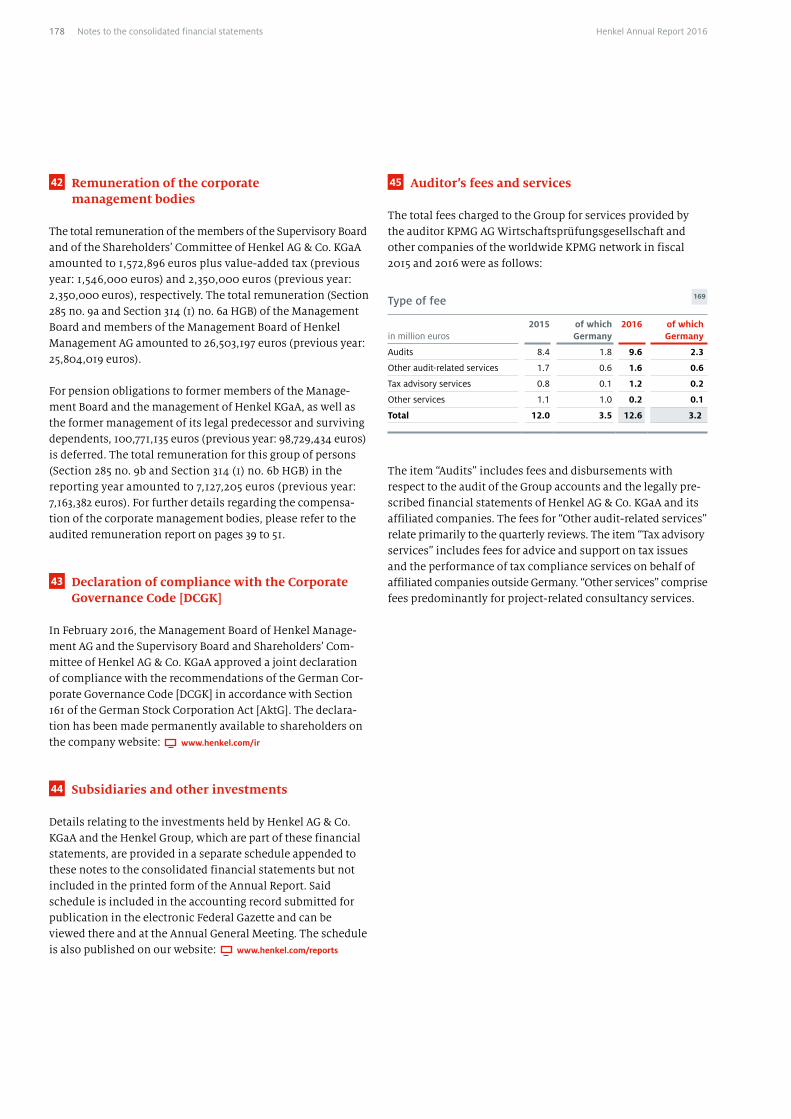
45 Auditor’s fees and services
The total fees charged to the Group for services provided by the auditor KPMG AG Wirtschaftsprüfungsgesellschaft and other companies of the worldwide KPMG network in fiscal 2015 and 2016 were as follows:
Type of fee 169
in million euros2015 of which
Germany2016 of which
Germany
Audits 8.4 1.8 9.6 2.3
Other audit-related services 1.7 0.6 1.6 0.6
Tax advisory services 0.8 0.1 1.2 0.2
Other services 1.1 1.0 0.2 0.1
Total 12.0 3.5 12.6 3.2
The item “Audits” includes fees and disbursements with respect to the audit of the Group accounts and the legally pre-scribed financial statements of Henkel AG & Co. KGaA and its affiliat ed companies. The fees for “Other audit-related services” relate primarily to the quarterly reviews. The item “Tax advisory services” includes fees for advice and support on tax issues and the performance of tax compliance services on behalf of affiliated companies outside Germany. “Other services” comprise fees predominantly for project-related consultancy services.
42 Remuneration of the corporate management bodies
The total remuneration of the members of the Supervisory Board and of the Shareholders’ Committee of Henkel AG & Co. KGaA amounted to 1,572,896 euros plus value-added tax (previous year: 1,546,000 euros) and 2,350,000 euros (previous year: 2,350,000 euros), respectively. The total remuneration (Section 285 no. 9a and Section 314 (1) no. 6a HGB) of the Management Board and members of the Management Board of Henkel Management AG amounted to 26,503,197 euros (previous year: 25,804,019 euros).
For pension obligations to former members of the Manage-ment Board and the management of Henkel KGaA, as well as the former management of its legal predecessor and surviving dependents, 100,771,135 euros (previous year: 98,729,434 euros) is deferred. The total remuneration for this group of persons (Section 285 no. 9b and Section 314 (1) no. 6b HGB) in the reporting year amounted to 7,127,205 euros (previous year: 7,163,382 euros). For further details regarding the compensa-tion of the corporate management bodies, please refer to the audited remuneration report on pages 39 to 51.
43 Declaration of compliance with the Corporate Governance Code [DCGK]
In February 2016, the Management Board of Henkel Manage-ment AG and the Supervisory Board and Shareholders’ Com-mittee of Henkel AG & Co. KGaA approved a joint declaration of compliance with the recommendations of the German Cor-porate Governance Code [DCGK] in accordance with Section 161 of the German Stock Corporation Act [AktG]. The declara-tion has been made permanently available to shareholders on the company website: www.henkel.com/ir
44 Subsidiaries and other investments
Details relating to the investments held by Henkel AG & Co. KGaA and the Henkel Group, which are part of these financial statements, are provided in a separate schedule appended to these notes to the consolidated financial statements but not included in the printed form of the Annual Report. Said schedule is included in the accounting record submitted for publication in the electronic Federal Gazette and can be viewed there and at the Annual General Meeting. The schedule is also published on our website: www.henkel.com/reports
178 Henkel Annual Report 2016Notes to the consolidated financial statements
Subsequent events
After December 31, 2016, there were no reportable events of particular significance for the net assets, financial position and results of operations of the Henkel Group.
Düsseldorf, January 30, 2017
Henkel Management AG, Personally Liable Partner of Henkel AG & Co. KGaA
Management BoardHans Van Bylen, Jan-Dirk Auris, Pascal Houdayer, Carsten Knobel, Kathrin Menges, Bruno Piacenza
Notes to the consolidated financial statements 179Henkel Annual Report 2016
116 Consolidated statement of financial position
118 Consolidated statement of income
118 Consolidated statement of comprehensive income
119 Consolidated statement of changes in equity
120 Consolidated statement of cash flows
121 Group segment report by business unit
122 Key financials by region123 Accounting principles and
methods applied in preparation of the consolidated financial statements
131 Notes to the consolidated statement of financial position
166 Notes to the consolidated statement of income
171 Other disclosures179 Subsequent events
Independent Auditor’s Report
To Henkel AG & Co. KGaA, Düsseldorf
Report on the Consolidated Financial Statements
We have audited the accompanying consolidated financial statements of Henkel AG & Co. KGaA, Düsseldorf, and its subsid-iaries, which comprise the consolidated statement of financial position, the consolidated statement of income, the consoli-dated statement of comprehensive income, the consolidated statement of changes in equity, the consolidated statement of cash flows, and notes to the consolidated financial statements for the business year from January 1 to December 31, 2016.
Responsibility of the Personally Liable Partner of the Company for the Consolidated Financial StatementsThe personally liable partner of Henkel AG & Co. KGaA is responsible for the preparation of these consolidated financial statements. This responsibility includes preparing these con-solidated financial statements in accordance with Interna-tional Financial Reporting Standards as adopted by the EU, and the supplementary requirements of German law pursuant to § [Article] 315a Abs. [paragraph] 1 HGB [Handelsgesetzbuch: German Commercial Code], to give a true and fair view of the net assets, financial position and results of operations of the Group in accordance with these requirements. The personally liable partner of the company is also responsible for the inter-nal controls that management determines are necessary to enable the preparation of consolidated financial statements that are free from material misstatement, whether due to fraud or error.
Auditor’s ResponsibilityOur responsibility is to express an opinion on these consoli-dated financial statements based on our audit. We conducted our audit in accordance with § 317 HGB and German generally accepted standards for the audit of financial statements pro-mulgated by the Institut der Wirtschaftsprüfer [Institute of Public Auditors in Germany] (IDW). Accordingly, we are required to comply with ethical requirements and plan and perform the audit to obtain reasonable assurance about whether the consolidated financial statements are free from material misstatement.
An audit involves performing audit procedures to obtain audit evidence about the amounts and disclosures in the consoli-dated financial statements. The selection of audit procedures depends on the auditor’s professional judgment. This includes
the assessment of the risks of material misstatement of the consolidated financial statements, whether due to fraud or error. In assessing those risks, the auditor considers the inter-nal control system relevant to the entity’s preparation of the consolidated financial statements that give a true and fair view. The aim of this is to plan and perform audit procedures that are appropriate in the given circumstances, but not for the purpose of expressing an opinion on the effectiveness of the Group’s internal control system. An audit also includes evalu-ating the appropriateness of accounting policies used and the reasonableness of accounting estimates made by the compa-ny’s personally liable partner, as well as evaluating the overall presentation of the consolidated financial statements.
We believe that the audit evidence we have obtained is suffi-cient and appropriate to provide a basis for our audit opinion.
Audit OpinionPursuant to § 322 Abs. 3 Satz 1 HGB, we state that our audit of the consolidated financial statements has not led to any reservations.
In our opinion, based on the findings of our audit, the consoli-dated financial statements comply in all material respects with IFRSs as adopted by the EU and the supplementary require-ments of German commercial law pursuant to § 315a Abs. 1 HGB and give a true and fair view of the net assets and financial position of the Henkel Group as at December 31, 2016, as well as the results of operations for the business year then ended, in accordance with these requirements.
Report on the Combined Management Report
We have audited the accompanying Group management report of Henkel AG & Co. KGaA, which is combined with the manage-ment report of the company, for the business year from January 1 to December 31, 2016. The personally liable partner of Henkel AG & Co. KGaA is responsible for the preparation of the combined management report in compliance with the applicable requirements of German commercial law pursuant to § [Article] 315a Abs. [paragraph] 1 HGB [Handelsgesetzbuch: German Commercial Code]. We conducted our audit in accor-dance with § 317 Abs. 2 HGB and German generally accepted standards for the audit of combined management reports pro-mulgated by the Institut der Wirtschaftsprüfer [Institute of Pub-lic Auditors in Germany] (IDW). Accordingly, we are required to plan and perform the audit to obtain reasonable assurance
180 Henkel Annual Report 2016Notes to the consolidated financial statements
about whether the combined management report is consistent with the consolidated financial statements and the audit find-ings, complies with the German statutory requirements, and as a whole provides a suitable view of the Group’s position and suitably presents the opportunities and risks of future development.
Pursuant to § 322 Abs. 3 Satz 1 HGB, we state that our audit of the combined management report has not led to any reservations.
In our opinion, based on the findings of our audit of the con-solidated financial statements and combined management report, the combined management report is consistent with the consolidated financial statements, complies with the German statutory requirements, and as a whole provides a suitable view of the Group’s position and suitably presents the opportunities and risks of future development.
Düsseldorf, January 30, 2017
KPMG AG Wirtschaftsprüfungsgesellschaft
Prof. Dr. Kai C. Andrejewski Simone FischerWirtschaftsprüfer Wirtschaftsprüferin (German Public Auditor) (German Public Auditor)
181Henkel Annual Report 2016
Recommendation for the approval of the annual financial statements and the appropriation of the profit of Henkel AG & Co. KGaA
It is proposed that the annual financial statements of Henkel AG & Co. KGaA be approved as presented and that the unappropriated profit of 1,027,893,701.02 euros for fiscal 2016 be applied as follows:a) Payment of a dividend of 1.60 euros per ordinary share (259,795,875 shares) = 415,673,400.00 euros
b) Payment of a dividend of 1.62 euros per preferred share (178,162,875 shares) = 288,623,857.50 euros
c) Carried forward as retained earnings = 323,596,443.52 euros
1,027,893,701.02 euros
According to Section 71b German Stock Corporation Act [AktG], treasury shares do not qualify for a dividend. The amount in unappropriated profit which relates to the shares held by the corporation (treasury shares) at the date of the Annual General Meeting will be carried forward as retained earnings. As the number of such treasury shares can change up to the time of the Annual General Meeting, a correspondingly adapted proposal for the appropriation of profit will be submitted to it, providing for an unchanged payout of 1.60 euros per ordinary share qualifying for a dividend and 1.62 euros per preferred share qualifying for a dividend, with corresponding adjustment of the payout totals and of retained earnings carried forward to the following year.
Düsseldorf, January 30, 2017
Henkel Management AG, Personally Liable Partner of Henkel AG & Co. KGaA
Management Board
182 Henkel Annual Report 2016Notes to the consolidated financial statements
Responsibility statement by the Personally Liable Partner
To the best of our knowledge, and in accordance with the applicable accounting princi-ples, the consolidated financial statements give a true and fair view of the net assets, financial position and results of operations of the Group, and the management report of the Group, which is combined with the management report of Henkel AG & Co. KGaA, includes a fair review of the development, performance and results of the business and the position of the Group, together with a cogent description of the principal opportu-nities and risks associated with the expected development of the Group.
Düsseldorf, January 30, 2017
Henkel Management AG
Management Board Hans Van Bylen, Jan-Dirk Auris, Pascal Houdayer, Carsten Knobel, Kathrin Menges, Bruno Piacenza
183Henkel Annual Report 2016
Dr. rer. nat. Simone Bagel-Trah Chair, Private Investor, Düsseldorf
Born in 1969 Member since: April 14, 2008
Memberships: Henkel Management AG (Chair) 1 Henkel AG & Co. KGaA (Shareholders’ Committee, Chair) 2 Bayer AG 1 Heraeus Holding GmbH 1
Winfried Zander * Vice Chair, Chairman of the General Works Council of Henkel AG & Co. KGaA and Chairman of the Works Council of Henkel AG & Co. KGaA, Düsseldorf site
Born in 1954 Member since: May 17, 1993
Jutta Bernicke * Member of the Works Council of Henkel AG & Co. KGaA, Düsseldorf site
Born in 1962 Member since: April 14, 2008
Dr. rer. nat. Kaspar von Braun Astrophysicist, Pasadena
Born in 1971 Member since: April 19, 2010
Supervisory Board of Henkel AG & Co. KGaA
Boris Canessa (until April 11, 2016) Private Investor, Düsseldorf
Born in 1963 Member from: April 16, 2012
Johann-Christoph Frey (since April 11, 2016) Private Investor, Klosters
Born in 1955 Member since: April 11, 2016
Ferdinand Groos (until April 11, 2016) Managing Partner, Cryder Capital Partners LLP, London
Born in 1965 Member from: April 16, 2012
Béatrice Guillaume-Grabisch (until March 31, 2016) Chairwoman of the Executive Board, Nestlé Deutschland AG, Frankfurt am Main
Born in 1964 Member from: April 16, 2012
Peter Hausmann * Member of the Executive Board of IG Bergbau, Chemie, Energie and responsible for Wages / Finance, Hannover
Born in 1954 Member since: April 15, 2013
Memberships: Continental AG 1 Covestro Deutschland AG 1 Vivawest Wohnen GmbH (Vice Chair) 1 50 Hertz Transmission AG (Vice Chair) 1
Birgit Helten-Kindlein * Member of the Works Council of Henkel AG & Co. KGaA, Düsseldorf site
Born in 1964 Member since: April 14, 2008
Benedikt-Richard Freiherr von Herman (since April 11, 2016) Private Investor, Wain
Born in 1972 Member since: April 11, 2016
Timotheus Höttges (since April 11, 2016) Chairman of the Executive Board, Deutsche Telekom AG, Bonn
Born in 1962 Member since: April 11, 2016
Memberships: BT Group plc, Great Britain 2 FC Bayern München AG 1 Telekom Group: Telekom Deutschland GmbH (Chair) 1 T-Mobile US, Inc. (Chair), USA 2
Prof. Dr. sc. nat. Michael Kaschke Chairman of the Executive Board, Carl Zeiss AG, Oberkochen
Born in 1957 Member since: April 14, 2008
Memberships: Deutsche Telekom AG 1 Robert Bosch GmbH 1 Carl Zeiss Group: Carl Zeiss Industrielle Messtechnik GmbH (Chair) 1 Carl Zeiss Meditec AG (Chair) 1 Carl Zeiss Microscopy GmbH (Chair) 1 Carl Zeiss SMT GmbH (Chair) 1 Carl Zeiss Australia Pty. Ltd. (Chair), Australia 2 Carl Zeiss Far East Co. Ltd. (Chair), China / Hong Kong 2 Carl Zeiss Inc. (Chair), USA 2 Carl Zeiss India (Bangalore) Private Ltd., India 2 Carl Zeiss Pte. Ltd. (Chair), Singapore 2 Carl Zeiss (Pty.) Ltd., South Africa 2
Corporate management bodies of Henkel AG & Co. KGaA
Boards / memberships as defined by Section 125 (1) sentence 5 of the German Stock Corporation Act [AktG] as at January 2017
Honorary Chairman of the Henkel Group: Dipl.-Ing. Albrecht Woeste
* Employee representatives.1 Membership of statutory supervisory and administrative boards in Germany.2 Membership of comparable oversight bodies.
Notes to the consolidated financial statements184 Henkel Annual Report 2016
Nominations Committee
Functions The Nominations Committee prepares the resolutions of the Supervisory Board on election proposals to be presented to the Annual General Meeting for the election of members of the Supervisory Board (representatives of the share holders).
Members Dr. Simone Bagel-Trah, Chair Dr. Kaspar von Braun Prof. Dr. Theo Siegert
Supervisory Board committees
Angelika Keller*(since January 1, 2017)
Member of the General Works Council of Henkel AG & Co. KGaA and Chairwoman of the Works Council of Henkel AG & Co. KGaA, Munich site
Born in 1965 Member since: January 1, 2017
Barbara Kux Private Investor, Zurich
Born in 1954 Member since: July 3, 2013
Memberships: Engie S.A., France 2 Firmenich S.A., Switzerland 2 Pargesa Holding S.A., Switzerland 2 Total S.A., France 2 Umicore N.V., Belgium 2
Mayc Nienhaus * (until December 31, 2016)
Member of the General Works Council of Henkel AG & Co. KGaA and Chairman of the Works Council of Henkel AG & Co. KGaA, Unna site
Born in 1961 Member from: January 1, 2010
Andrea Pichottka * Managing Director, IG BCE Bonusagentur GmbH, Hannover Managing Director, IG BCE Bonusassekuranz GmbH, Hannover
Born in 1959 Member since: October 26, 2004
Dr. rer. nat. Martina Seiler * Chemist, Duisburg Chairwoman of the General Senior Staff Representative Committee and of the Senior Staff Representative Committee of Henkel AG & Co. KGaA
Born in 1971 Member since: January 1, 2012
Prof. Dr. oec. publ. Theo Siegert Managing Partner of de Haen-Carstanjen & Söhne, Düsseldorf
Born in 1947 Member since: April 20, 2009
Memberships: E.ON SE 1 Merck KGaA 1 DKSH Holding Ltd., Switzerland 2 E. Merck OHG 2
Edgar Topsch * Member of the General Works Council of Henkel AG & Co. KGaA and Vice Chairman of the Works Council of Henkel AG & Co. KGaA, Düsseldorf site
Born in 1960 Member since: August 1, 2010
Audit Committee
Functions The Audit Committee prepares the proceedings and resolutions of the Supervi-sory Board relating to the approval of the annual financial statements and the consolidated financial statements, and relating to ratification of the proposal to be put before the Annual General Meeting regarding appointment of the audi-tor. It also deals with accounting, risk management and compliance issues.
Members Prof. Dr. Theo Siegert, Chair Prof. Dr. Michael Kaschke, Vice Chair Dr. Simone Bagel-Trah Peter Hausmann Birgit Helten-Kindlein Winfried Zander
185Henkel Annual Report 2016

Dr. rer. nat. Simone Bagel-Trah Chair, Private Investor, Düsseldorf
Born in 1969 Member since: April 18, 2005
Memberships: Henkel AG & Co. KGaA (Chair) 1 Henkel Management AG (Chair) 1 Bayer AG 1 Heraeus Holding GmbH 1
Dr. rer. pol. h.c. Christoph Henkel Vice Chair, Founding Partner, Canyon Equity LLC, London
Born in 1958 Member since: May 27, 1991
Prof. Dr. oec. HSG Paul Achleitner Chairman of the Supervisory Board, Deutsche Bank AG, Munich
Born in 1956 Member since: April 30, 2001
Memberships: Bayer AG 1 Daimler AG 1 Deutsche Bank AG (Chair) 1
Boris Canessa (since April 11, 2016) Private Investor, Düsseldorf
Born in 1963 Member since: April 11, 2016
Finance Subcommittee
Functions The Finance Subcommittee deals principally with financial matters, accounting issues including the statutory year-end audit, taxation and accounting policy, internal auditing, and risk management in the company.
Members Dr. Christoph Henkel, Chair Stefan Hamelmann, Vice Chair Prof. Dr. Paul Achleitner Prof. Dr. Ulrich Lehner Dr. Dr. Norbert Reithofer
Shareholders’ Committee of Henkel AG & Co. KGaA
Subcommittees of the Shareholders’ Committee
Johann-Christoph Frey (until April 11, 2016) Private Investor, Klosters
Born in 1955 Member from: April 16, 2012
Stefan Hamelmann Private Investor, Düsseldorf
Born in 1963 Member since: May 3, 1999
Prof. Dr. rer. pol. Ulrich Lehner Former Chairman of the Management Board of Henkel KGaA, Düsseldorf
Born in 1946 Member since: April 14, 2008
Memberships: Deutsche Telekom AG (Chair) 1 E.ON SE 1 Porsche Automobil Holding SE 1 ThyssenKrupp AG (Chair) 1
Dr.-Ing. Dr.-Ing. E.h. Norbert Reithofer Chairman of the Supervisory Board of Bayerische Motoren Werke Aktiengesellschaft, Munich
Born in 1956 Member since: April 11, 2011
Memberships: Bayerische Motoren Werke Aktiengesellschaft (Chair) 1 Siemens AG 1
Konstantin von Unger Managing Director, CKA Capital Limited, London
Born in 1966 Member since: April 14, 2003
Membership: Henkel Management AG 1
Jean-François van Boxmeer Chairman of the Executive Board of Heineken N.V., Amsterdam
Born in 1961 Member since: April 15, 2013
Membership: Mondelez International Inc., USA 2
Werner Wenning Chairman of the Supervisory Board of Bayer AG, Leverkusen
Born in 1946 Member since: April 14, 2008
Memberships: Bayer AG (Chair) 1 Henkel Management AG 1 Siemens AG 1
Human Resources Subcommittee
Functions The Human Resources Subcommittee deals principally with personnel matters relating to members of the Management Board, issues pertaining to human resources strategy, and with remuneration.
Members Dr. Simone Bagel-Trah, Chair Konstantin von Unger, Vice Chair Boris Canessa (since April 11, 2016) Johann-Christoph Frey (until April 11, 2016) Jean-François van Boxmeer Werner Wenning
1 Membership of statutory supervisory and administrative boards in Germany.2 Membership of comparable oversight bodies.
Notes to the consolidated financial statements186 Henkel Annual Report 2016
Hans Van Bylen Chairman of the Management Board (since May 1, 2016)
Born in 1961 Member since: July 1, 2005 3
Kasper Rorsted (until April 30, 2016) Chairman of the Management Board
Born in 1962 Member since: April 1, 2005 3
Memberships: Anheuser-Busch InBev SA, Belgium 2 Bertelsmann Management SE 1 Danfoss A/S, Denmark 2
Jan-Dirk Auris Adhesive Technologies
Born in 1968 Member since: January 1, 2011
Membership: Henkel Corporation (Chair), USA 2
Pascal Houdayer (since March 1, 2016) Beauty Care
Born in 1969 Member since: March 1, 2016
Membership: The Dial Corporation (Chair), USA 2
Carsten Knobel Finance / Purchasing / Integrated Business Solutions
Born in 1969 Member since: July 1, 2012
Memberships: Henkel Central Eastern Europe GmbH (Chair), Austria 2 Henkel (China) Investment Co. Ltd., China 2 Henkel & Cie AG, Switzerland 2 Henkel Consumer Goods Inc. (Chair), USA 2 Henkel Ltd., Great Britain 2 Henkel of America Inc. (Chair), USA 2
Kathrin Menges Human Resources / Infrastructure Services
Born in 1964 Member since: October 1, 2011
Memberships: Adidas AG 1 Henkel Central Eastern Europe GmbH, Austria 2 Henkel Nederland BV, Netherlands 2 Henkel Norden AB, Sweden 2 Henkel Norden Oy, Finland 2
Bruno Piacenza Laundry & Home Care
Born in 1965 Member since: January 1, 2011
Membership: GfK SE, Nuremberg 1
Management Board of Henkel Management AG *
Dr. rer. nat. Simone Bagel-Trah Chair, Private Investor, Düsseldorf
Born in 1969 Member since: February 15, 2008
Memberships: Henkel AG & Co. KGaA (Chair) 1 Henkel AG & Co. KGaA (Shareholders’ Committee, Chair) 2 Bayer AG 1 Heraeus Holding GmbH 1
* Personally Liable Partner of Henkel AG & Co. KGaA.1 Membership of statutory supervisory and administrative boards in Germany.2 Membership of comparable oversight bodies.3 Including membership of the Management Board of Henkel KGaA.
Konstantin von Unger Vice Chair Managing Director, CKA Capital Limited, London
Born in 1966 Member since: April 17, 2012
Membership: Henkel AG & Co. KGaA (Shareholders’ Committee) 2
Werner Wenning Chairman of the Supervisory Board of Bayer AG, Leverkusen
Born in 1946 Member since: September 16, 2013
Memberships: Bayer AG (Chair) 1 Siemens AG 1 Henkel AG & Co. KGaA (Shareholders’ Committee) 2
Supervisory Board of Henkel Management AG *
187Henkel Annual Report 2016
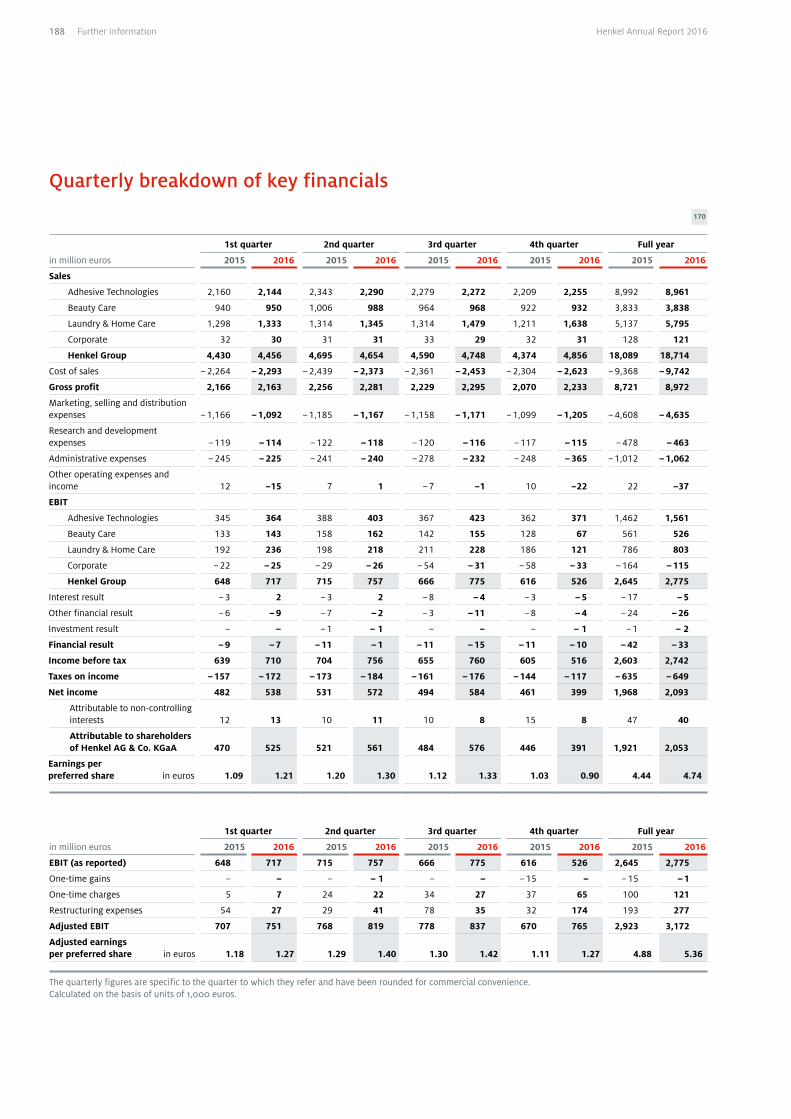
Quarterly breakdown of key financials
170
in million euros
1st quarter 2nd quarter 3rd quarter 4th quarter Full year
2015 2016 2015 2016 2015 2016 2015 2016 2015 2016
Sales
Adhesive Technologies 2,160 2,144 2,343 2,290 2,279 2,272 2,209 2,255 8,992 8,961
Beauty Care 940 950 1,006 988 964 968 922 932 3,833 3,838
Laundry & Home Care 1,298 1,333 1,314 1,345 1,314 1,479 1,211 1,638 5,137 5,795
Corporate 32 30 31 31 33 29 32 31 128 121
Henkel Group 4,430 4,456 4,695 4,654 4,590 4,748 4,374 4,856 18,089 18,714
Cost of sales – 2,264 – 2,293 – 2,439 – 2,373 – 2,361 – 2,453 – 2,304 – 2,623 – 9,368 – 9,742
Gross profit 2,166 2,163 2,256 2,281 2,229 2,295 2,070 2,233 8,721 8,972
Marketing, selling and distribution expenses – 1,166 – 1,092 – 1,185 – 1,167 – 1,158 – 1,171 – 1,099 – 1,205 – 4,608 – 4,635
Research and development expenses – 119 – 114 – 122 – 118 – 120 – 116 – 117 – 115 – 478 – 463
Administrative expenses – 245 – 225 – 241 – 240 – 278 – 232 – 248 – 365 – 1,012 – 1,062
Other operating expenses and income 12 –15 7 1 – 7 –1 10 –22 22 –37
EBIT
Adhesive Technologies 345 364 388 403 367 423 362 371 1,462 1,561
Beauty Care 133 143 158 162 142 155 128 67 561 526
Laundry & Home Care 192 236 198 218 211 228 186 121 786 803
Corporate – 22 – 25 – 29 – 26 – 54 – 31 – 58 – 33 – 164 – 115
Henkel Group 648 717 715 757 666 775 616 526 2,645 2,775
Interest result – 3 2 – 3 2 – 8 – 4 – 3 – 5 – 17 – 5
Other financial result – 6 – 9 – 7 – 2 – 3 – 11 – 8 – 4 – 24 – 26
Investment result – – – 1 – 1 – – – – 1 – 1 – 2
Financial result – 9 – 7 – 11 – 1 – 11 – 15 – 11 – 10 – 42 – 33
Income before tax 639 710 704 756 655 760 605 516 2,603 2,742
Taxes on income – 157 – 172 – 173 – 184 – 161 – 176 – 144 – 117 – 635 – 649
Net income 482 538 531 572 494 584 461 399 1,968 2,093
Attributable to non-controlling interests 12 13 10 11 10 8 15 8 47 40
Attributable to shareholders of Henkel AG & Co. KGaA 470 525 521 561 484 576 446 391 1,921 2,053
Earnings per preferred share in euros 1.09 1.21 1.20 1.30 1.12 1.33 1.03 0.90 4.44 4.74
in million euros
1st quarter 2nd quarter 3rd quarter 4th quarter Full year
2015 2016 2015 2016 2015 2016 2015 2016 2015 2016
EBIT (as reported) 648 717 715 757 666 775 616 526 2,645 2,775
One-time gains – – – – 1 – – – 15 – – 15 – 1
One-time charges 5 7 24 22 34 27 37 65 100 121
Restructuring expenses 54 27 29 41 78 35 32 174 193 277
Adjusted EBIT 707 751 768 819 778 837 670 765 2,923 3,172
Adjusted earnings per preferred share in euros 1.18 1.27 1.29 1.40 1.30 1.42 1.11 1.27 4.88 5.36
The quarterly figures are specific to the quarter to which they refer and have been rounded for commercial convenience. Calculated on the basis of units of 1,000 euros.
188 Further information Henkel Annual Report 2016

Multi-year summary
171
in million euros2010 2011
restated 12012 2013 2014 2015 2016
Results of operations
Sales 15,092 15,605 16,510 16,355 16,428 18,089 18,714
Adhesive Technologies 7,306 7,746 8,256 8,117 8,127 8,992 8,961
Beauty Care 3,269 3,399 3,542 3,510 3,547 3,833 3,838
Laundry & Home Care 4,319 4,304 4,556 4,580 4,626 5,137 5,795
Corporate 199 156 155 148 128 128 121
Gross margin 46.5 45.3 46.8 47.7 47.0 48.2 47.9
Research and development expenses 391 410 408 415 413 478 463
Operating profit (EBIT) 1,723 1,765 2,199 2,285 2,244 2,645 2,775
Adhesive Technologies 878 1,002 1,191 1,271 1,345 1,462 1,561
Beauty Care 411 471 483 474 421 561 526
Laundry & Home Care 542 419 621 682 615 786 803
Corporate – 108 – 127 – 97 – 141 – 137 – 164 – 115
Income before tax 1,552 1,610 2,018 2,172 2,195 2,645 2,742
Tax rate in % 26.4 26.0 24.4 25.2 24.3 24.4 23.7
Net income 1,143 1,191 1,526 1,625 1,662 1,968 2,093
Attributable to shareholders of Henkel AG & Co. KGaA 1,118 1,161 1,480 1,589 1,628 1,921 2,053
Net return on sales 2 in % 7.6 7.6 9.2 9.9 10.1 10.9 11.2
Interest coverage ratio 12.8 14.0 14.3 23.9 48.4 75.7 107.9
Net assets
Total assets 17,525 18,487 19,525 19,344 20,961 22,323 27,917
Non-current assets 11,590 11,848 11,927 11,360 14,150 15,406 19,704
Current assets 5,935 6,639 7,598 7,984 6,811 6,917 8,213
Equity 7,950 8,670 9,511 10,158 11,644 13,811 15,183
Liabilities 9,575 9,817 10,014 9,186 9,317 8,512 12,734
Equity ratio in % 45.4 46.9 48.7 52.5 55.6 61.9 54.4
Return on equity 3 in % 17.5 15.0 17.6 17.1 16.4 16.9 15.2
Operating debt coverage ratio in % 71.4 91.6 >500not relevant 4 274.8 375.2 80.8
Financial position
Cash flow from operating activities 1,851 1,562 2,634 2,116 1,914 2,384 2,850
Capital expenditures 260 443 516 465 2,214 979 4,409
Investment ratio as % of sales 1.7 2.8 3.1 2.8 13.5 5.4 23.6
Shares
Dividend per ordinary share in euros 0.70 0.78 0.93 1.20 1.29 1.45 1.60 5
Dividend per preferred share in euros 0.72 0.80 0.95 1.22 1.31 1.47 1.62 5
Total dividends 310 345 411 529 569 639 704 5
Payout ratio in % 25.5 25.5 25.6 30.0 30.0 30.2 30.3 5
Share price, ordinary shares, at year-end in euros 38.62 37.40 51.93 75.64 80.44 88.62 98.98
Share price, preferred shares, at year-end in euros 46.54 44.59 62.20 84.31 89.42 103.20 113.25
Market capitalization at year-end in bn euros 18.3 17.6 24.6 34.7 36.8 41.4 45.9
Employees
Total 6 (at December 31) 47,850 47,250 46,600 46,850 49,750 49,450 51,350
Germany 8,600 8,300 8,000 8,050 8,200 8,350 8,250
Abroad 39,250 38,950 38,600 38,800 41,550 41,100 43,100
1 Application of IAS 8 “Accounting policies, changes in accounting estimates and errors” (see notes on pages 116 and 117 of the 2012 Annual Report).2 Net income divided by sales.3 Net income divided by equity at the start of the year.4 Figure not relevant due to the positive balance of net financial position and pension obligations.5 Proposed.6 Basis: permanent employees excluding apprentices.
189Further informationHenkel Annual Report 2016
188 Quarterly breakdown of key financials
189 Multi-year summary190 Index of tables and graphs
192 Glossary194 Credits195 Contacts
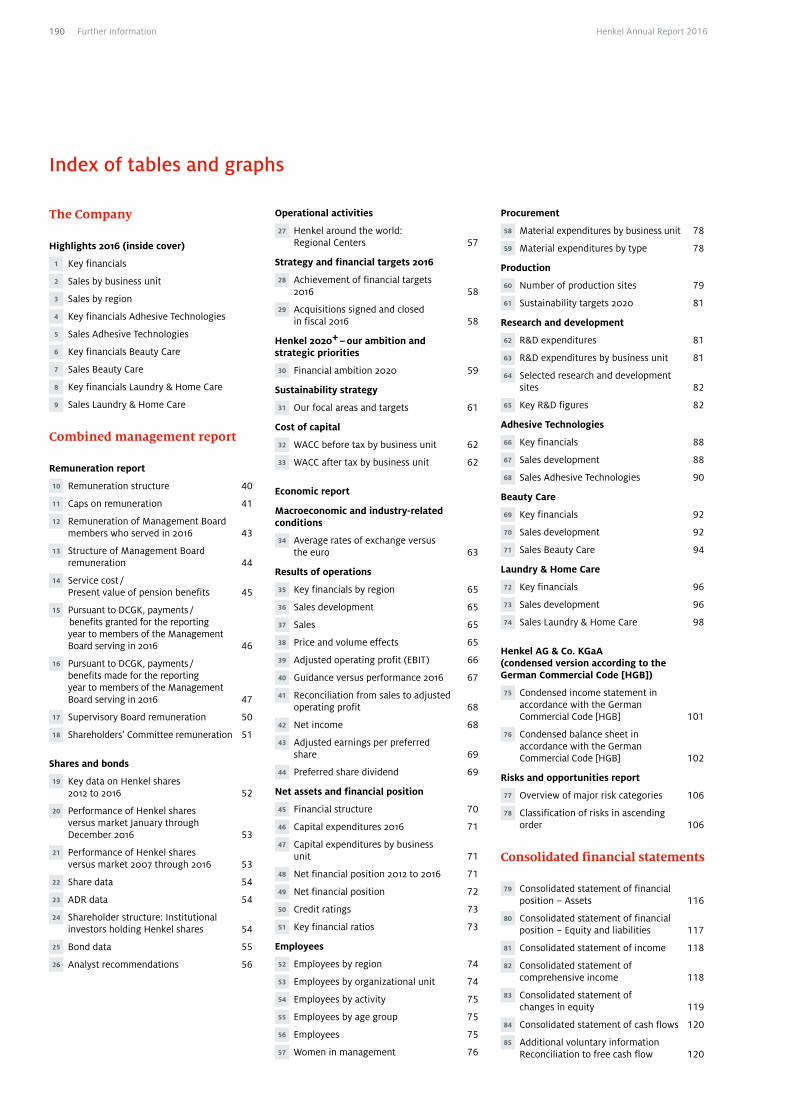
Index of tables and graphs
The Company
Highlights 2016 (inside cover)
1 Key financials
2 Sales by business unit
3 Sales by region
4 Key financials Adhesive Technologies
5 Sales Adhesive Technologies
6 Key financials Beauty Care
7 Sales Beauty Care
8 Key financials Laundry & Home Care
9 Sales Laundry & Home Care
Combined management report
Remuneration report
10 Remuneration structure 40
11 Caps on remuneration 41
12 Remuneration of Management Board members who served in 2016 43
13 Structure of Management Board remuneration 44
14 Service cost / Present value of pension benefits 45
15 Pursuant to DCGK, payments / benefits granted for the reporting year to members of the Management Board serving in 2016 46
16 Pursuant to DCGK, payments / benefits made for the reporting year to members of the Management Board serving in 2016 47
17 Supervisory Board remuneration 50
18 Shareholders’ Committee remuneration 51
Shares and bonds
19 Key data on Henkel shares 2012 to 2016 52
20 Performance of Henkel shares versus market January through December 2016 53
21 Performance of Henkel shares versus market 2007 through 2016 53
22 Share data 54
23 ADR data 54
24 Shareholder structure: Institutional investors holding Henkel shares 54
25 Bond data 55
26 Analyst recommendations 56
Operational activities
27 Henkel around the world: Regional Centers 57
Strategy and financial targets 2016
28 Achievement of financial targets 2016 58
29 Acquisitions signed and closed in fiscal 2016 58
Henkel 2020+ – our ambition and strategic priorities
30 Financial ambition 2020 59
Sustainability strategy
31 Our focal areas and targets 61
Cost of capital
32 WACC before tax by business unit 62
33 WACC after tax by business unit 62
Economic report
Macroeconomic and industry-related conditions
34 Average rates of exchange versus the euro 63
Results of operations
35 Key financials by region 65
36 Sales development 65
37 Sales 65
38 Price and volume effects 65
39 Adjusted operating profit (EBIT) 66
40 Guidance versus performance 2016 67
41 Reconciliation from sales to adjusted operating profit 68
42 Net income 68
43 Adjusted earnings per preferred share 69
44 Preferred share dividend 69
Net assets and financial position
45 Financial structure 70
46 Capital expenditures 2016 71
47 Capital expenditures by business unit 71
48 Net financial position 2012 to 2016 71
49 Net financial position 72
50 Credit ratings 73
51 Key financial ratios 73
Employees
52 Employees by region 74
53 Employees by organizational unit 74
54 Employees by activity 75
55 Employees by age group 75
56 Employees 75
57 Women in management 76
Procurement
58 Material expenditures by business unit 78
59 Material expenditures by type 78
Production
60 Number of production sites 79
61 Sustainability targets 2020 81
Research and development
62 R&D expenditures 81
63 R&D expenditures by business unit 81
64 Selected research and development sites 82
65 Key R&D figures 82
Adhesive Technologies
66 Key financials 88
67 Sales development 88
68 Sales Adhesive Technologies 90
Beauty Care
69 Key financials 92
70 Sales development 92
71 Sales Beauty Care 94
Laundry & Home Care
72 Key financials 96
73 Sales development 96
74 Sales Laundry & Home Care 98
Henkel AG & Co. KGaA (condensed version according to the German Commercial Code [HGB])
75 Condensed income statement in accordance with the German Commercial Code [HGB] 101
76 Condensed balance sheet in accordance with the German Commercial Code [HGB] 102
Risks and opportunities report
77 Overview of major risk categories 106
78 Classification of risks in ascending order 106
Consolidated financial statements
79 Consolidated statement of financial position – Assets 116
80 Consolidated statement of financial position – Equity and liabilities 117
81 Consolidated statement of income 118
82 Consolidated statement of comprehensive income 118
83 Consolidated statement of changes in equity 119
84 Consolidated statement of cash flows 120
85 Additional voluntary information Reconciliation to free cash flow 120
Further information190 Henkel Annual Report 2016
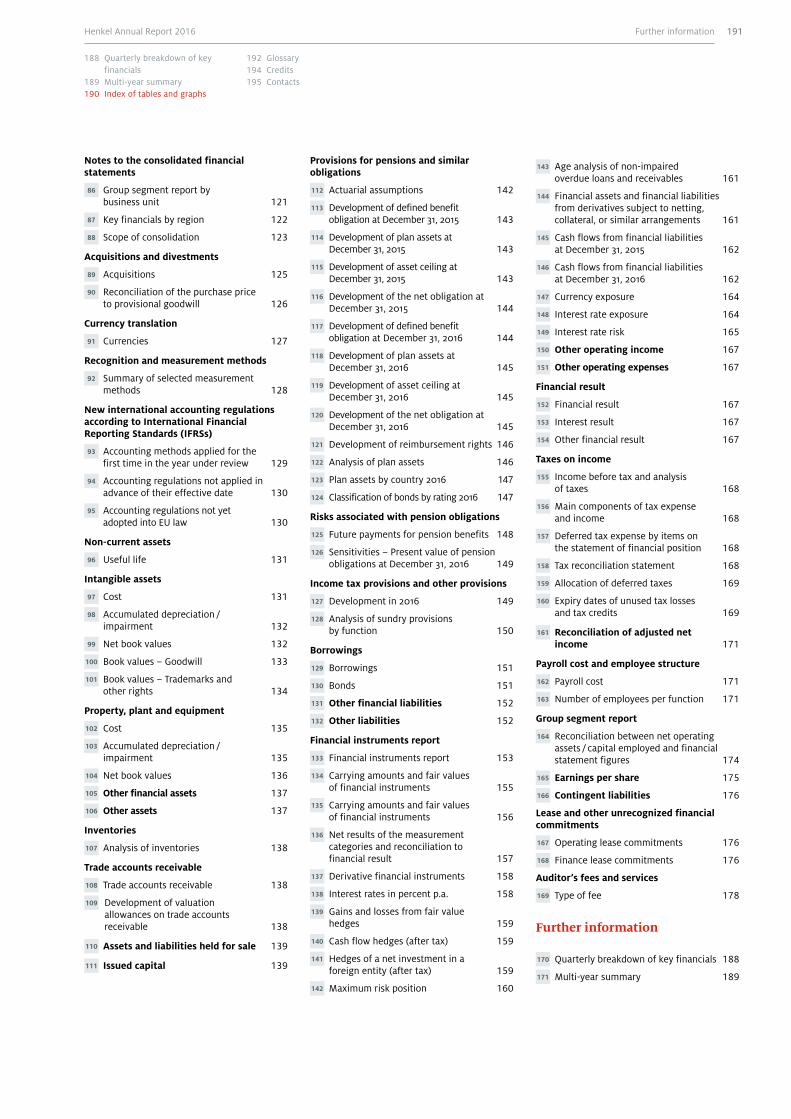
Notes to the consolidated financial statements
86 Group segment report by business unit 121
87 Key financials by region 122
88 Scope of consolidation 123
Acquisitions and divestments
89 Acquisitions 125
90 Reconciliation of the purchase price to provisional goodwill 126
Currency translation
91 Currencies 127
Recognition and measurement methods
92 Summary of selected measurement methods 128
New international accounting regulations according to International Financial Reporting Standards (IFRSs)
93 Accounting methods applied for the first time in the year under review 129
94 Accounting regulations not applied in advance of their effective date 130
95 Accounting regulations not yet adopted into EU law 130
Non-current assets
96 Useful life 131
Intangible assets
97 Cost 131
98 Accumulated depreciation / impairment 132
99 Net book values 132
100 Book values – Goodwill 133
101 Book values – Trademarks and other rights 134
Property, plant and equipment
102 Cost 135
103 Accumulated depreciation / impairment 135
104 Net book values 136
105 Other financial assets 137
106 Other assets 137
Inventories
107 Analysis of inventories 138
Trade accounts receivable
108 Trade accounts receivable 138
109 Development of valuation allowances on trade accounts receivable 138
110 Assets and liabilities held for sale 139
111 Issued capital 139
Provisions for pensions and similar obligations
112 Actuarial assumptions 142
113 Development of defined benefit obligation at December 31, 2015 143
114 Development of plan assets at December 31, 2015 143
115 Development of asset ceiling at December 31, 2015 143
116 Development of the net obligation at December 31, 2015 144
117 Development of defined benefit obligation at December 31, 2016 144
118 Development of plan assets at December 31, 2016 145
119 Development of asset ceiling at December 31, 2016 145
120 Development of the net obligation at December 31, 2016 145
121 Development of reimbursement rights 146
122 Analysis of plan assets 146
123 Plan assets by country 2016 147
124 Classification of bonds by rating 2016 147
Risks associated with pension obligations
125 Future payments for pension benefits 148
126 Sensitivities – Present value of pension obligations at December 31, 2016 149
Income tax provisions and other provisions
127 Development in 2016 149
128 Analysis of sundry provisions by function 150
Borrowings
129 Borrowings 151
130 Bonds 151
131 Other financial liabilities 152
132 Other liabilities 152
Financial instruments report
133 Financial instruments report 153
134 Carrying amounts and fair values of financial instruments 155
135 Carrying amounts and fair values of financial instruments 156
136 Net results of the measurement categories and reconciliation to financial result 157
137 Derivative financial instruments 158
138 Interest rates in percent p.a. 158
139 Gains and losses from fair value hedges 159
140 Cash flow hedges (after tax) 159
141 Hedges of a net investment in a foreign entity (after tax) 159
142 Maximum risk position 160
143 Age analysis of non-impaired overdue loans and receivables 161
144 Financial assets and financial liabilities from derivatives subject to netting, collateral, or similar arrangements 161
145 Cash flows from financial liabilities at December 31, 2015 162
146 Cash flows from financial liabilities at December 31, 2016 162
147 Currency exposure 164
148 Interest rate exposure 164
149 Interest rate risk 165
150 Other operating income 167
151 Other operating expenses 167
Financial result
152 Financial result 167
153 Interest result 167
154 Other financial result 167
Taxes on income
155 Income before tax and analysis of taxes 168
156 Main components of tax expense and income 168
157 Deferred tax expense by items on the statement of financial position 168
158 Tax reconciliation statement 168
159 Allocation of deferred taxes 169
160 Expiry dates of unused tax losses and tax credits 169
161 Reconciliation of adjusted net income 171
Payroll cost and employee structure
162 Payroll cost 171
163 Number of employees per function 171
Group segment report
164 Reconciliation between net operating assets / capital employed and financial statement figures 174
165 Earnings per share 175
166 Contingent liabilities 176
Lease and other unrecognized financial commitments
167 Operating lease commitments 176
168 Finance lease commitments 176
Auditor’s fees and services
169 Type of fee 178
Further information
170 Quarterly breakdown of key financials 188
171 Multi-year summary 189
Further information 191Henkel Annual Report 2016
188 Quarterly breakdown of key financials
189 Multi-year summary190 Index of tables and graphs
192 Glossary194 Credits195 Contacts
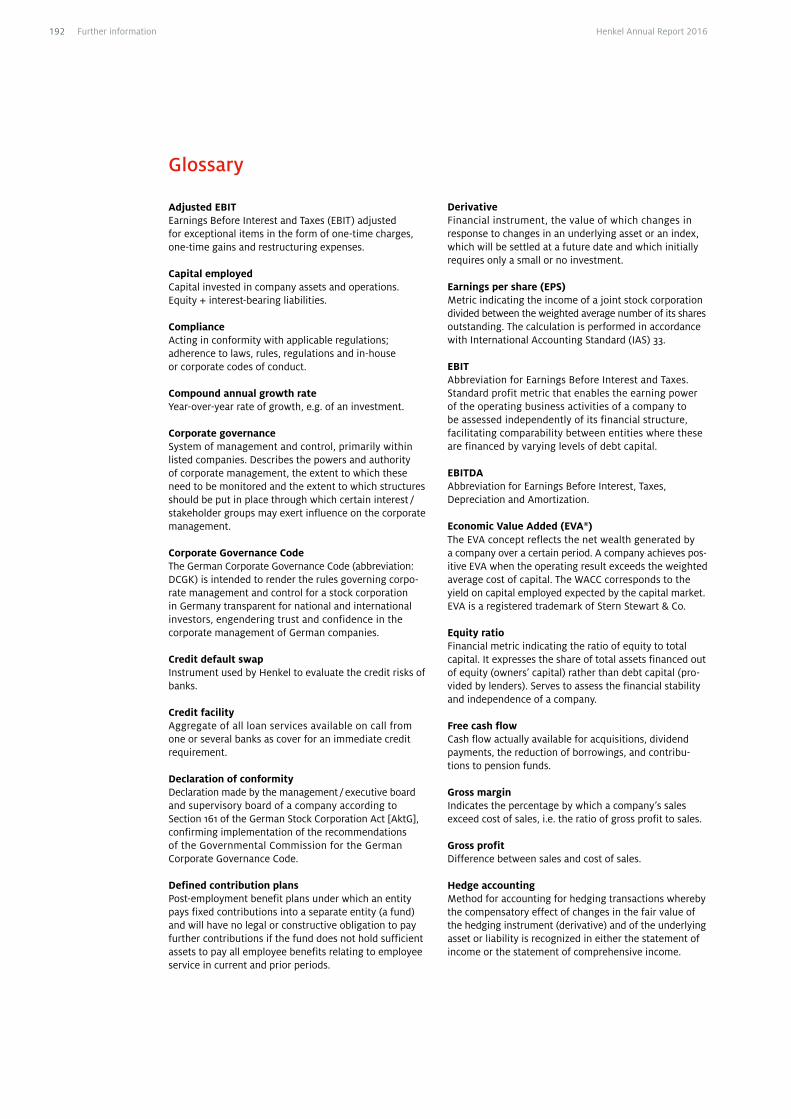
Adjusted EBITEarnings Before Interest and Taxes (EBIT) adjusted for exceptional items in the form of one-time charges, one-time gains and restructuring expenses.
Capital employedCapital invested in company assets and operations. Equity + interest-bearing liabilities.
ComplianceActing in conformity with applicable regulations; ad herence to laws, rules, regulations and in-house or corporate codes of conduct.
Compound annual growth rateYear-over-year rate of growth, e.g. of an investment.
Corporate governanceSystem of management and control, primarily within listed companies. Describes the powers and authority of corporate management, the extent to which these need to be monitored and the extent to which structures should be put in place through which certain interest /stakeholder groups may exert influence on the corporate management.
Corporate Governance Code The German Corporate Governance Code (abbreviation: DCGK) is intended to render the rules governing corpo-rate management and control for a stock corporation in Germany transparent for national and international investors, engendering trust and confidence in the corporate management of German companies.
Credit default swapInstrument used by Henkel to evaluate the credit risks of banks.
Credit facilityAggregate of all loan services available on call from one or several banks as cover for an immediate credit requirement.
Declaration of conformityDeclaration made by the management / executive board and supervisory board of a company according to Section 161 of the German Stock Corporation Act [AktG], confirming implementation of the recommendations of the Governmental Commission for the German Corporate Governance Code.
Defined contribution plansPost-employment benefit plans under which an entity pays fixed contributions into a separate entity (a fund) and will have no legal or constructive obligation to pay further contributions if the fund does not hold sufficient assets to pay all employee benefits relating to employee service in current and prior periods.
DerivativeFinancial instrument, the value of which changes in res ponse to changes in an underlying asset or an index, which will be settled at a future date and which initially requires only a small or no investment.
Earnings per share (EPS)Metric indicating the income of a joint stock corporation divided between the weighted average number of its shares outstanding. The calculation is performed in accordance with International Accounting Standard (IAS) 33.
EBITAbbreviation for Earnings Before Interest and Taxes. Standard profit metric that enables the earning power of the operating business activities of a company to be assessed independently of its financial structure, facilitating comparability between entities where these are financed by varying levels of debt capital.
EBITDAAbbreviation for Earnings Before Interest, Taxes, Depreciation and Amortization.
Economic Value Added (EVA®)The EVA concept reflects the net wealth generated by a company over a certain period. A company achieves pos-itive EVA when the operating result exceeds the weighted average cost of capital. The WACC corresponds to the yield on capital employed expected by the capital market. EVA is a registered trademark of Stern Stewart & Co.
Equity ratioFinancial metric indicating the ratio of equity to total capital. It expresses the share of total assets financed out of equity (owners’ capital) rather than debt capital (pro-vided by lenders). Serves to assess the financial stability and independence of a company.
Free cash flowCash flow actually available for acquisitions, dividend payments, the reduction of borrowings, and contribu-tions to pension funds.
Gross marginIndicates the percentage by which a company’s sales exceed cost of sales, i.e. the ratio of gross profit to sales.
Gross profitDifference between sales and cost of sales.
Hedge accountingMethod for accounting for hedging transactions where by the compensatory effect of changes in the fair value of the hedging instrument (derivative) and of the underlying asset or liability is recognized in either the statement of income or the statement of comprehensive income.
Glossary
Further information192 Henkel Annual Report 2016

KGaAAbbreviation for “Kommanditgesellschaft auf Aktien.” A KGaA is a company with a legal identity (legal entity) in which at least one partner has unlimited liability with respect to the company’s creditors (personally liable partner), while the liability for such debts of the other partners participating in the share-based capital stock is limited to their share capital (limited shareholders).
Long-term incentive (LTI)Bonus aligned to long-term financial performance.
Net financial positionNet financial position is defined as cash and cash equiv-alents plus readily monetizable financial instruments classified as “availa ble for sale” or in the “fair value option,” less borrowings, and plus positive and less neg-ative fair values of hedging transactions.
Net working capitalInventories plus payments on account, receivables from suppliers and trade accounts receivable, less trade accounts payable, liabilities to customers, and current sales provisions.
Non-controlling interests Proportion of equity attributable to third parties in sub-sidiaries included within the scope of consolidation. Previously termed “minority interests.” Valued on a pro-portional net asset basis. A pro-rata portion of the net income of a corporation is due to shareholders owning non-controlling interests.
Operational excellenceA comprehensive program to structure and optimize all Henkel’s business processes based on customer needs, quality and efficiency.
Organic sales growthGrowth in revenues after adjusting for effects arising from acquisitions, divestments and foreign exchange differences – i.e. “top line” growth generated from within.
Payout ratioIndicates what percentage of annual net income (ad-justed for exceptional items) is paid out in dividends to shareholders, including non-controlling interests.
Return-enhancing portfolioContains investments in equities and alternative invest-ments, and serves to improve the overall return of the pension plan assets over the long term in order to raise the coverage ratio of pension funds. In addition, a broader investment horizon increases the level of investment diversification.
Return on capital employed (ROCE)Profitability metric reflecting the ratio of earnings before interest and taxes (EBIT) to capital employed.
Return on sales (EBIT)Operating business metric derived from the ratio of EBIT to revenues. Also known as EBIT margin.
SwapTerm given to the exchange of capital amounts in differ-ing currencies (currency swap) or of different interest obligations (interest swap) between two entities.
Value-at-riskMethod, based on fair value, used to calculate the maxi-mum likely or potential future loss arising from a portfolio.
Weighted average cost of capital (WACC)Average return on capital, expressed as a percentage and calculated on the basis of a weighted average of the cost of debt and equity. WACC represents the minimum return expected of a company by its lenders for financing its assets.
193193Further informationHenkel Annual Report 2016
188 Quarterly breakdown of key financials
189 Multi-year summary190 Index of tables and graphs
192 Glossary194 Credits195 Contacts
Published by Henkel AG & Co. KGaA 40191 Düsseldorf, Germany Phone: +49 (0) 211-797-0
© 2017 Henkel AG & Co. KGaA
Edited by: Corporate Communications, Investor Relations, Corporate Accounting and Subsidiary Controlling
Coordination: Renata Casaro, Dr. Hannes Schollenberger, Wolfgang Zengerling
English translation: Donnelley Language Solutions, London
Pre-print proofing: Paul Knighton, Cambridge; Thomas Krause, Krefeld
Design and typesetting: MPM Corporate Communication Solutions, Mainz
Photographs: Ralph Belfiglio, Tobias Ebert, Owen Gao, Anne Großmann, Claudia Kempf, Nils Hendrik Müller; Henkel
Printed by: Druckpartner, Essen
Date of publication of this Report: February 23, 2017
PR No.: 02 17 3,000 ISSN: 0724-4738 ISBN: 978-3-941517-70-7
Credits
The Annual Report is printed on LuxoArt Silk FSC. The paper is made from pulp bleached without chlorine. It has been certified and verified in accordance with the rules of the Forest Stewardship Council (FSC). The printing inks contain no heavy metals. This publication was cover-finished and bound with these Henkel products: Cellophaning with Aquence GA 6080 HGL laminating adhesive, bound using Technomelt PUR 3400 ME COOL and Technomelt GA 3960 Ultra for the highest occupational health and safety standards.
Except as otherwise noted, all marks used in this publication are trademarks and/or registered trademarks of the Henkel Group in Germany and elsewhere.
This document contains forward-looking statements which are based on the current estimates and assumptions made by the corporate management of Henkel AG & Co. KGaA. Forward-looking statements are characterized by the use of words such as expect, intend, plan, predict, assume, believe, estimate, anticipate, forecast and similar formulations. Such statements are not to be understood as in any way guaranteeing that those expectations will turn out to be accurate. Future performance and the results actually achieved by Henkel AG & Co. KGaA and its affiliated companies depend on a number of risks and uncertainties and may therefore differ materially from forward-looking state-ments. Many of these factors are outside Henkel’s control and cannot be accu-rately estimated in advance, such as the future economic environment and the actions of competitors and others involved in the marketplace. Henkel neither plans nor undertakes to update forward-looking statements. This document has been issued for information purposes only and is not intended to constitute an investment advice or an offer to sell securities, or a solicitation of an offer to buy securities.
Further information194 Henkel Annual Report 2016

Contacts
Corporate Communications Phone: +49 (0) 211-797-3533 Fax: +49 (0) 211-798-2484 E-mail: [email protected]
Investor Relations Phone: +49 (0) 211-797-3937 Fax: +49 (0) 211-798-2863 E-mail: [email protected]
195195Further informationHenkel Annual Report 2016
188 Quarterly breakdown of key financials
189 Multi-year summary190 Index of tables and graphs
192 Glossary194 Credits195 Contacts
Henkel app available for iOS and Android:
Henkel in social media:
www.facebook.com/henkelwww.twitter.com/henkelwww.linkedin.com/company/henkel_2www.instagram.com/henkelglobal/www.youtube.com/henkelwww.henkel.com/annualreport www.henkel.com/sustainabilityreport
Further information196 Henkel Annual Report 2016
Financial calendar
Annual General Meeting Henkel AG & Co. KGaA 2017: Thursday, April 6, 2017
Publication of Report for the First Quarter 2017: Thursday, May 11, 2017
Publication of Report for the Second Quarter / Half Year 2017: Thursday, August 10, 2017
Publication of Report for the Third Quarter / Nine Months 2017: Tuesday, November 14, 2017
Publication of Report for Fiscal 2017: Thursday, February 22, 2018
Annual General Meeting Henkel AG & Co. KGaA 2018: Monday, April 9, 2018
Up-to-date facts and figures on Henkel also available on the internet:
www.henkel.com

Henkel AG & Co. KGaA 40191 Düsseldorf, Germany Phone: +49 (0) 211-797-0 www.henkel.com
Hen
kel A
nnua
l Rep
ort
2016