annual report 2004 · bruno n. slosse • vice president and general manager germany/austria...
TRANSCRIPT

ANNUAL REPORT
2004UNITED STATES
KANSAS CITY, MOCerner CorporationWorld Headquarters2800 Rockcreek ParkwayNorth Kansas City, MO 64117(816) 221 1024
BIRMINGHAM, ALCerner Physician Practice, Inc. 44 Inverness Center ParkwayBirmingham, AL 35242 (205) 981 5520
DENVER, COCerner Multum, Inc.3200 Cherry Creek South DriveSuite 300Denver, CO 80209(303) 733 4447
OVERLAND PARK, KSCerner BeyondNow5750 W. 95th St., Suites 310 & 312Overland Park, KS 66207(913) 385 0212
BEL AIR, MDCerner Project IMPACT, Inc.23 Ellendale StreetBel Air, MD 21014(410) 838 1275
WALTHAM, MACerner DHT, Inc.Two University Office ParkSuite 60051 Sawyer RoadWaltham, MA 02453(781) 642 6200
HOUSTON, TXCerner Radiology Information Systems, Inc.5 Greenway PlazaSuite 1900Houston, TX 77046(832) 325 1500
WORLDWIDE
AUSTRALIACerner Corporation PTY LimitedLevel 10, 52 Alfred StreetMilsons PointNSW 2061Sydney Australia +61 2 9900 4800
CANADACerner Canada Limited Cerner Vision CentrePhase 1, Tower 2, Level 3800 Commissioners Road EastLondon, Ontario N6A4G5Canada(519) 685 8499
FRANCECerner, SAS57 Esplanade Charles De Gaulle92081 Paris La Defense CEDEXGround Floor 25B+33 (0)1 46 96 54 93
GERMANYCerner Deutschland GmbH
andImage Devices GmbHCunoweg 165510 Idstein+49 (0) 6126 957575
INDIACerner Healthcare Solutions Private Ltd. Prestige Obelisk3 Kasturba Rd. Bangalore, India 560 001+91-80-513-47000
LATIN AMERICA / CARIBBEANCerner Latin America Avda. Vitacura 2939 10th FloorLas Condes – SantiagoChile Postal Code 7550011+562 431 5052
MALAYSIACerner Malaysia Sdn BhdLevel 36, Menara Citibank165 Jalan Ampang50450 Kuala LumpurMalaysia+60 3 2169 6218
SINGAPORECerner Singapore Limited391A Orchard Road#12-01 Ngee Ann City Tower ASingapore 238873+65-6786-6933
SPAINCerner Iberia, S.L.World Trade CenterMuelle de BarcelonaEdificio Sur - 2ª PlantaBarcelona 08039+34-93-344-32-21
UNITED KINGDOMCerner Limited6th Floor, North Wing3 Sheldon SquarePaddington CentralLondon WZ 6PW+44 (0) 20 7432 8100
www.cerner.com
Cerner 2004 Annual Report 0174_2005
p r o v e n i n n o v a t i o n | u n i f i e d a r c h i t e c t u r e | s p e e d t o v a l u e
909932 DP_CVR 4/14/2005 10:09 PM Page 1

In the first days of any company’s existence, the instinct to survive over-whelms. Over time, you strive to create mission-critical applications—suchas Cerner’s focus on laboratory information systems—that truly are at thenexus of the field that you are attempting to shape. As Cerner moved fromits humble beginnings in 1979 to a successful growth company, we contin-ued to challenge the status quo and ask hard questions about what the futureof healthcare should look like.
In the early 1990s, a conversation over dinner led to a napkin drawing thatwas grounded in a revolutionary thought: healthcare shouldn’t be organizedaround an encounter; it should revolve around the individual. The discussionled to Cerner’s Community Health Model, the establishment of an internalworking group called Project Ozark with a mandate to action that vision, andultimately the creation of our person-centric Cerner Millennium architec-ture–the only truly unified, enterprise-wide architecture.
1. Automate the Care ProcessCerner offers a longitudinal, person-centric electronic medical record, giving clinicians fingertip access to the right information at the right timeand place.
2. Connect the PersonCerner is dedicated to building a personal health system. Medicalinformation and care regimens accessible from home empower consumers to effectively manage their conditions and adhere to treatmentplans, creating a new medium between physicians and individuals.
3. Structure the KnowledgeCerner is dedicated to building systems that bring the best science to every medical decision by structuring, storing and studying the content surrounding each care episode.
4. Close the LoopToday, the gap between medical discovery and its incorporation into dailypractice can be as long as 10 years. Cerner is dedicated to building systems that implement evidence-based medicine, dramatically reducingthe average time from the discovery of an improved method to the changein the standard of care.
Community Health Model
909932 DP_CVR 4/14/2005 10:09 PM Page 2

ANNUAL REPORT 2004
Cerner Corporation is pleased to issue this enhanced version of our Form 10K as filed with the securities and Exchange Commission.Our simplified approach to our Annual Report yields savings for investment in other areas. For additional information on Cerner, please visit www.cerner.com

909932 DP_N R 4/14/05 9:56 PM Page 1

“We know eliminating film in the Imaging
Division increases safety. With Cerner, we
now have seen a 300 percent decrease in
the number of exams that require more than
24 hours to complete.”
909932 DP_N R 4/14/05 9:56 PM Page 2

“Our doctors know that Cerner
Millennium ® helps deliver better patient
care. Through improved documentation,
we now have decreased managed care
denials by 34 percent.”
909932 DP_N R 4/14/05 9:56 PM Page 3

909932 DP_N R 4/14/05 9:57 PM Page 4

909932 DP_N R 4/14/05 9:57 PM Page 5

“We know technology can help
reduce medication errors. With Cerner
CPOE, we have now cut harmful
adverse drug events by 75 percent.”
909932 DP_N R 4/14/05 9:57 PM Page 6


Table of Contents: Annual Report 2004
Board of Directors 2
Leadership 3
Letter to Our Shareholders 4
Appendix: Cerner’s Business Model and Financial Assessment 8
10K Business and Industry Overview 16
Properties 26
Selected Financial Data 28
Management’s Discussion and Analysis of Financial Condition and Results of Operations 29
Independent Auditor’s Report 46
Financial Statements and Discussion Balance Sheet 48
Income Statement 49
Consolidated Statements of Changes in Equity 50
Statement of Cash Flows 51
Summary of Signifi cant Accounting Policies 52
Business Acquisitions 57
Receivables 58
Property and Equipment 59
Indebtedness 59
Other Income and Expense 60
Stock Options, Warrants and Equity 60
Associate Stock Purchase Plan 62
Foundations Retirement Plan 62
Income Taxes 63
Related Party Transactions 64
Commitments 64
Segment Reporting 65
Quarterly Results 66
Corporate Information 68
Business and Industry Overview 16 Business and Industry Overview 16
Properties 26 Properties 26
Selected Financial Data 28 Selected Financial Data 28
Management’s Discussion and Analysis of Financial Condition and Results of Operations 29 Management’s Discussion and Analysis of Financial Condition and Results of Operations 29
Independent Auditor’s Report 46 Independent Auditor’s Report 46
Balance Sheet 48 Balance Sheet 48 Balance Sheet 48 Balance Sheet 48 Balance Sheet 48 Balance Sheet 48 Balance Sheet 48 Balance Sheet 48 Balance Sheet 48 Balance Sheet 48 Balance Sheet 48 Balance Sheet 48 Balance Sheet 48 Balance Sheet 48 Balance Sheet 48 Balance Sheet 48 Balance Sheet 48 Balance Sheet 48 Balance Sheet 48 Balance Sheet 48 Balance Sheet 48 Balance Sheet 48 Balance Sheet 48 Balance Sheet 48 Balance Sheet 48 Balance Sheet 48 Balance Sheet 48 Balance Sheet 48 Balance Sheet 48 Balance Sheet 48 Balance Sheet 48 Balance Sheet 48 Balance Sheet 48 Balance Sheet 48 Balance Sheet 48 Balance Sheet 48 Balance Sheet 48 Balance Sheet 48 Balance Sheet 48 Balance Sheet 48 Balance Sheet 48 Balance Sheet 48 Balance Sheet 48 Balance Sheet 48 Balance Sheet 48 Balance Sheet 48 Balance Sheet 48 Balance Sheet 48 Balance Sheet 48 Balance Sheet 48 Balance Sheet 48 Balance Sheet 48 Balance Sheet 48 Balance Sheet 48 Balance Sheet 48 Balance Sheet 48 Balance Sheet 48 Balance Sheet 48 Balance Sheet 48 Balance Sheet 48 Balance Sheet 48 Balance Sheet 48 Balance Sheet 48 Balance Sheet 48 Balance Sheet 48 Balance Sheet 48 Balance Sheet 48 Balance Sheet 48 Balance Sheet 48 Balance Sheet 48 Balance Sheet 48 Balance Sheet 48 Balance Sheet 48 Balance Sheet 48 Balance Sheet 48 Balance Sheet 48 Balance Sheet 48 Balance Sheet 48 Balance Sheet 48 Balance Sheet 48 Balance Sheet 48 Balance Sheet 48 Balance Sheet 48 Balance Sheet 48 Balance Sheet 48 Balance Sheet 48 Balance Sheet 48 Balance Sheet 48 Balance Sheet 48 Balance Sheet 48 Balance Sheet 48 Balance Sheet 48 Balance Sheet 48 Balance Sheet 48 Balance Sheet 48 Balance Sheet 48 Balance Sheet 48 Balance Sheet 48 Balance Sheet 48 Balance Sheet 48 Balance Sheet 48 Balance Sheet 48 Balance Sheet 48 Balance Sheet 48 Balance Sheet 48 Balance Sheet 48 Balance Sheet 48 Balance Sheet 48 Balance Sheet 48 Balance Sheet 48 Balance Sheet 48 Balance Sheet 48 Balance Sheet 48 Balance Sheet 48 Balance Sheet 48 Balance Sheet 48 Balance Sheet 48 Balance Sheet 48 Balance Sheet 48 Balance Sheet 48 Balance Sheet 48 Balance Sheet 48 Balance Sheet 48 Balance Sheet 48 Balance Sheet 48 Balance Sheet 48 Balance Sheet 48 Balance Sheet 48 Balance Sheet 48 Balance Sheet 48 Balance Sheet 48
Income Statement 49 Income Statement 49
Consolidated Statements of Changes in Equity 50 Consolidated Statements of Changes in Equity 50
Statement of Cash Flows 51 Statement of Cash Flows 51
Summary of Signifi cant Accounting Policies 52 Summary of Signifi cant Accounting Policies 52
Business Acquisitions 57 Business Acquisitions 57
Receivables 58 Receivables 58 Receivables 58 Receivables 58 Receivables 58 Receivables 58 Receivables 58 Receivables 58 Receivables 58 Receivables 58 Receivables 58 Receivables 58 Receivables 58 Receivables 58 Receivables 58 Receivables 58 Receivables 58 Receivables 58 Receivables 58 Receivables 58 Receivables 58 Receivables 58 Receivables 58 Receivables 58 Receivables 58 Receivables 58 Receivables 58 Receivables 58 Receivables 58 Receivables 58 Receivables 58 Receivables 58 Receivables 58 Receivables 58 Receivables 58 Receivables 58 Receivables 58 Receivables 58 Receivables 58 Receivables 58 Receivables 58 Receivables 58 Receivables 58 Receivables 58 Receivables 58 Receivables 58 Receivables 58 Receivables 58 Receivables 58 Receivables 58 Receivables 58 Receivables 58 Receivables 58 Receivables 58 Receivables 58 Receivables 58 Receivables 58 Receivables 58 Receivables 58 Receivables 58 Receivables 58 Receivables 58 Receivables 58 Receivables 58 Receivables 58 Receivables 58 Receivables 58 Receivables 58 Receivables 58 Receivables 58 Receivables 58 Receivables 58 Receivables 58 Receivables 58 Receivables 58 Receivables 58 Receivables 58 Receivables 58 Receivables 58 Receivables 58 Receivables 58 Receivables 58 Receivables 58 Receivables 58 Receivables 58 Receivables 58 Receivables 58 Receivables 58 Receivables 58 Receivables 58 Receivables 58 Receivables 58 Receivables 58 Receivables 58 Receivables 58 Receivables 58 Receivables 58 Receivables 58 Receivables 58 Receivables 58 Receivables 58 Receivables 58 Receivables 58 Receivables 58 Receivables 58 Receivables 58 Receivables 58 Receivables 58 Receivables 58 Receivables 58 Receivables 58 Receivables 58 Receivables 58 Receivables 58 Receivables 58 Receivables 58 Receivables 58 Receivables 58 Receivables 58 Receivables 58 Receivables 58 Receivables 58 Receivables 58 Receivables 58 Receivables 58 Receivables 58 Receivables 58 Receivables 58 Receivables 58 Receivables 58 Receivables 58 Receivables 58 Receivables 58 Receivables 58 Receivables 58
Property and Equipment 59 Property and Equipment 59
Indebtedness 59 Indebtedness 59
Other Income and Expense 60 Other Income and Expense 60
Stock Options, Warrants and Equity 60 Stock Options, Warrants and Equity 60
Associate Stock Purchase Plan 62 Associate Stock Purchase Plan 62
Foundations Retirement Plan 62 Foundations Retirement Plan 62 Foundations Retirement Plan 62 Foundations Retirement Plan 62 Foundations Retirement Plan 62 Foundations Retirement Plan 62 Foundations Retirement Plan 62 Foundations Retirement Plan 62 Foundations Retirement Plan 62 Foundations Retirement Plan 62 Foundations Retirement Plan 62 Foundations Retirement Plan 62 Foundations Retirement Plan 62 Foundations Retirement Plan 62 Foundations Retirement Plan 62 Foundations Retirement Plan 62 Foundations Retirement Plan 62 Foundations Retirement Plan 62 Foundations Retirement Plan 62 Foundations Retirement Plan 62 Foundations Retirement Plan 62 Foundations Retirement Plan 62 Foundations Retirement Plan 62 Foundations Retirement Plan 62 Foundations Retirement Plan 62 Foundations Retirement Plan 62 Foundations Retirement Plan 62 Foundations Retirement Plan 62 Foundations Retirement Plan 62 Foundations Retirement Plan 62 Foundations Retirement Plan 62 Foundations Retirement Plan 62 Foundations Retirement Plan 62 Foundations Retirement Plan 62 Foundations Retirement Plan 62 Foundations Retirement Plan 62 Foundations Retirement Plan 62 Foundations Retirement Plan 62 Foundations Retirement Plan 62 Foundations Retirement Plan 62 Foundations Retirement Plan 62 Foundations Retirement Plan 62 Foundations Retirement Plan 62 Foundations Retirement Plan 62 Foundations Retirement Plan 62 Foundations Retirement Plan 62 Foundations Retirement Plan 62 Foundations Retirement Plan 62 Foundations Retirement Plan 62 Foundations Retirement Plan 62 Foundations Retirement Plan 62 Foundations Retirement Plan 62 Foundations Retirement Plan 62 Foundations Retirement Plan 62 Foundations Retirement Plan 62 Foundations Retirement Plan 62 Foundations Retirement Plan 62 Foundations Retirement Plan 62 Foundations Retirement Plan 62 Foundations Retirement Plan 62 Foundations Retirement Plan 62 Foundations Retirement Plan 62 Foundations Retirement Plan 62 Foundations Retirement Plan 62 Foundations Retirement Plan 62 Foundations Retirement Plan 62 Foundations Retirement Plan 62 Foundations Retirement Plan 62 Foundations Retirement Plan 62 Foundations Retirement Plan 62 Foundations Retirement Plan 62 Foundations Retirement Plan 62 Foundations Retirement Plan 62 Foundations Retirement Plan 62 Foundations Retirement Plan 62 Foundations Retirement Plan 62 Foundations Retirement Plan 62 Foundations Retirement Plan 62 Foundations Retirement Plan 62 Foundations Retirement Plan 62 Foundations Retirement Plan 62 Foundations Retirement Plan 62 Foundations Retirement Plan 62 Foundations Retirement Plan 62 Foundations Retirement Plan 62 Foundations Retirement Plan 62 Foundations Retirement Plan 62 Foundations Retirement Plan 62 Foundations Retirement Plan 62 Foundations Retirement Plan 62 Foundations Retirement Plan 62 Foundations Retirement Plan 62 Foundations Retirement Plan 62 Foundations Retirement Plan 62 Foundations Retirement Plan 62 Foundations Retirement Plan 62 Foundations Retirement Plan 62 Foundations Retirement Plan 62 Foundations Retirement Plan 62 Foundations Retirement Plan 62 Foundations Retirement Plan 62 Foundations Retirement Plan 62 Foundations Retirement Plan 62 Foundations Retirement Plan 62 Foundations Retirement Plan 62 Foundations Retirement Plan 62 Foundations Retirement Plan 62 Foundations Retirement Plan 62 Foundations Retirement Plan 62 Foundations Retirement Plan 62 Foundations Retirement Plan 62 Foundations Retirement Plan 62 Foundations Retirement Plan 62
Income Taxes 63 Income Taxes 63 Income Taxes 63 Income Taxes 63 Income Taxes 63 Income Taxes 63 Income Taxes 63 Income Taxes 63 Income Taxes 63 Income Taxes 63 Income Taxes 63 Income Taxes 63 Income Taxes 63 Income Taxes 63 Income Taxes 63 Income Taxes 63 Income Taxes 63 Income Taxes 63 Income Taxes 63 Income Taxes 63 Income Taxes 63 Income Taxes 63 Income Taxes 63 Income Taxes 63 Income Taxes 63 Income Taxes 63 Income Taxes 63 Income Taxes 63 Income Taxes 63 Income Taxes 63 Income Taxes 63 Income Taxes 63 Income Taxes 63 Income Taxes 63 Income Taxes 63 Income Taxes 63 Income Taxes 63 Income Taxes 63 Income Taxes 63 Income Taxes 63 Income Taxes 63 Income Taxes 63 Income Taxes 63 Income Taxes 63 Income Taxes 63 Income Taxes 63 Income Taxes 63 Income Taxes 63 Income Taxes 63 Income Taxes 63 Income Taxes 63 Income Taxes 63 Income Taxes 63 Income Taxes 63 Income Taxes 63 Income Taxes 63 Income Taxes 63 Income Taxes 63 Income Taxes 63 Income Taxes 63 Income Taxes 63 Income Taxes 63 Income Taxes 63 Income Taxes 63 Income Taxes 63 Income Taxes 63 Income Taxes 63 Income Taxes 63 Income Taxes 63 Income Taxes 63 Income Taxes 63 Income Taxes 63 Income Taxes 63 Income Taxes 63 Income Taxes 63 Income Taxes 63 Income Taxes 63 Income Taxes 63 Income Taxes 63 Income Taxes 63 Income Taxes 63 Income Taxes 63 Income Taxes 63 Income Taxes 63 Income Taxes 63 Income Taxes 63 Income Taxes 63 Income Taxes 63 Income Taxes 63 Income Taxes 63 Income Taxes 63 Income Taxes 63 Income Taxes 63 Income Taxes 63 Income Taxes 63 Income Taxes 63 Income Taxes 63 Income Taxes 63 Income Taxes 63 Income Taxes 63 Income Taxes 63 Income Taxes 63 Income Taxes 63 Income Taxes 63 Income Taxes 63 Income Taxes 63 Income Taxes 63 Income Taxes 63 Income Taxes 63 Income Taxes 63 Income Taxes 63 Income Taxes 63 Income Taxes 63 Income Taxes 63 Income Taxes 63 Income Taxes 63 Income Taxes 63 Income Taxes 63 Income Taxes 63 Income Taxes 63 Income Taxes 63 Income Taxes 63 Income Taxes 63 Income Taxes 63 Income Taxes 63 Income Taxes 63 Income Taxes 63 Income Taxes 63 Income Taxes 63 Income Taxes 63 Income Taxes 63
Related Party Transactions 64 Related Party Transactions 64
Commitments 64 Commitments 64 Commitments 64 Commitments 64 Commitments 64 Commitments 64 Commitments 64 Commitments 64 Commitments 64 Commitments 64 Commitments 64 Commitments 64 Commitments 64 Commitments 64 Commitments 64 Commitments 64 Commitments 64 Commitments 64 Commitments 64 Commitments 64 Commitments 64 Commitments 64 Commitments 64 Commitments 64 Commitments 64 Commitments 64 Commitments 64 Commitments 64 Commitments 64 Commitments 64 Commitments 64 Commitments 64 Commitments 64 Commitments 64 Commitments 64 Commitments 64 Commitments 64 Commitments 64 Commitments 64 Commitments 64 Commitments 64 Commitments 64 Commitments 64 Commitments 64 Commitments 64 Commitments 64 Commitments 64 Commitments 64 Commitments 64 Commitments 64 Commitments 64 Commitments 64 Commitments 64 Commitments 64 Commitments 64 Commitments 64 Commitments 64 Commitments 64 Commitments 64 Commitments 64 Commitments 64 Commitments 64 Commitments 64 Commitments 64 Commitments 64 Commitments 64 Commitments 64 Commitments 64 Commitments 64 Commitments 64 Commitments 64 Commitments 64 Commitments 64 Commitments 64 Commitments 64 Commitments 64 Commitments 64 Commitments 64 Commitments 64 Commitments 64 Commitments 64 Commitments 64 Commitments 64 Commitments 64 Commitments 64 Commitments 64 Commitments 64 Commitments 64 Commitments 64 Commitments 64 Commitments 64 Commitments 64 Commitments 64 Commitments 64 Commitments 64 Commitments 64 Commitments 64 Commitments 64 Commitments 64 Commitments 64 Commitments 64 Commitments 64 Commitments 64 Commitments 64 Commitments 64 Commitments 64 Commitments 64 Commitments 64 Commitments 64 Commitments 64 Commitments 64 Commitments 64 Commitments 64 Commitments 64 Commitments 64 Commitments 64 Commitments 64 Commitments 64 Commitments 64 Commitments 64 Commitments 64 Commitments 64 Commitments 64 Commitments 64 Commitments 64 Commitments 64 Commitments 64 Commitments 64 Commitments 64 Commitments 64 Commitments 64
Segment Reporting 65 Segment Reporting 65
Quarterly Results 66 Quarterly Results 66
2
Board of DirectorsNeal L. Patterson • Chairman of the Board and Chief Executive Officer, Cerner Corporation
Clifford W. Illig • Vice Chairman, Cerner Corporation
Gerald E. Bisbee Jr., Ph.D. • Chairman, President and Chief Executive Officer, ReGen Biologics, Inc., Franklin Lakes, NJ
The Honorable John C. Danforth • Partner, Bryan Cave LLP, St. Louis, MO • Ambassador to the United Nations, June 2004–January 2005 • U.S. Senator - Missouri, 1976-1995
The Honorable Nancy-Ann DeParle • Senior Advisor to JPMorgan Partners, LLC • Adjunct Professor of Health Care Systems at the Wharton School of the University of Pennsylvania • Administrator, Centers for Medicare and Medicaid Services, 1997-2000
Jeff C. Goldsmith, Ph.D. • President, Health Futures, Inc., Charlottesville, Va.
Michael E. Herman • General Partner, Herman Family Trading Company, Kansas City, Mo. • President, Kansas City Royals Baseball Club, 1992-2000
William B. Neaves, Ph.D. • President and Chief Executive Officer, The Stowers Institute for Medical Research, Kansas City, Mo.

3
Americas Client OrganizationCerner Great LakesJude G. Dieterman • Vice President, Cerner Corporation and President, Cerner Great Lakes
Amy D. Amick • Vice President, Services
Matthew J. Wilson • Vice President, Sales
Cerner Mid AmericaJacob P. Sorg • Vice President, Cerner Corporation and President, Cerner Mid America
Douglas A. Abel • Vice President, Services
Max A. Reinig • Vice President, Services
Michael J. Supple • Vice President, Sales
Cerner North AtlanticRichard J. Flanigan • Senior Vice President, Cerner Corporation and
President, Cerner North Atlantic
Santo A. Cugliotta, Jr. • Vice President, Sales
Ron Jones • Vice President, Services
Cerner SoutheastJohn T. Peterzalek • Vice President, Cerner Corporation and President, Cerner Southeast
Michael L. Fiorito • Vice President, Sales
Paul J. Sinclair • Senior Vice President, Services
Cerner WestZane M. Burke • Vice President, Cerner Corporation and President, Cerner West
Mitchell Clark • Vice President, Sales
Michael C. Neal • Vice President, Services and Accelerated Solutions Center
Cerner CanadaRobert J. Shave • President, Cerner Canada
Cerner Latin AmericaGuillermo E. Moreno • Vice President and General Manager
Europe, Middle East and Asia Pacific Client OrganizationAsia PacificRobert L. Wilhelm • General Manager
France and SpainBruno N. Slosse • Vice President and General Manager
Germany/AustriaSteffen Zander • General Manager
Middle EastAmr Mostafa Gad • General Manager
United KingdomDavid W. Sides • Vice President and General Manager
Marcos Garcia • Vice President, U.K. National Programmes
Intellectual Property OrganizationDouglas S. McNair, M.D. & Ph.D. • Senior Vice President, Knowledge and Discovery
John P. Fingado • Vice President and General Manager, Clinical Centers
J. Bryan Ince • Vice President, Knowledge and Discovery
Gay M. Johannes • Vice President, IP Operations and Chief Quality Officer
David P. McCallie, Jr., M.D. • Vice President, Medical Informatics
Richard D. Neece • Vice President, Classic Operations
Maureen D. Peszko • Vice President, Providing Care
James R. Wilson • Vice President, Revenue Cycle
Grid Services OrganizationJohn F. Dragovits • Vice President, Physician and Metro Grids
Jay E. Linney • Vice President, State and Regional Grids
Daren C. McCormick • Vice President and General Manager, Cerner Physician Practice
Seth T. Rupp • Vice President, Condition and Disease Grids
LeadershipCerner Executive Cabinet
Neal L. Patterson • Chairman of the Board and Chief Executive Officer
Clifford W. Illig • Vice Chairman
Earl H. “Trace” Devanny, III • President
Paul M. Black • Executive Vice President and Chief Operating Officer Jeffrey A. Townsend • Executive Vice President
Paul N. Gorup • Senior Vice President, Knowledge and Discovery
Douglas M. Krebs • Senior Vice President and General Manager,
Cerner Europe, Middle East and Asia Pacific Organization
Marc G. Naughton • Senior Vice President and Chief Financial Officer
Mike Valentine • Senior Vice President and General Manager, U.S. Client Organization
Zane M. Burke • Vice President, Cerner Corporation and President, Cerner West
Michael R. Nill • Vice President, Technical Architecture and Cerner Managed Services
Shellee K. Spring • Vice President, Intellectual Property
Julia M. Wilson • Vice President and Chief People Officer
Jack A. Newman, Jr. • Executive Vice President
William M. Dwyer • Senior Vice President
John B. Landis • Senior Vice President, Sales and Services Operations
Robert J. Campbell • Vice President and Chief Learning Officer
Vicki W. Carlew • Vice President, Marketing Richard H. Miller, Jr. • Vice President and Chief Information Officer
William J. Miller • Vice President, Cerner Technologies
Catherine E. Mueller • Vice President, Client Care
Randy D. Sims • Vice President, Chief Legal Officer and Secretary
Donald D. Trigg • Vice President and Chief Marketing Officer
Charlotte A. Weaver, R.N. & Ph.D. • Vice President and Chief Nursing Officer
Cerner Executive Management
4
To Cerner’s Shareholders, Clients and Associates: Cerner celebrated its 25th anniversary in 2004 with solid operational and fi nancial performances. We grew revenue 10 percent to a record $926 million;
earnings grew 52 percent to a record of $65 million; and earnings per share (EPS) grew 47 percent to another record of $1.73 per share. [Note that
all references to 2004 earnings information in this letter exclude the net impact of ($0.01) per share related to a gain on the sale of Zynx Health and
a vacation accrual adjustment.] More than simply being a year of solid execution, however, 2004 was also a year in which we seeded Cerner’s future
success with a series of signifi cant innovations. We will touch on these innovations later, but fi rst, here are some more of the year’s fi scal and operational
highlights that demonstrate the strength of Cerner’s execution:
Consistent Financial Performance: Cerner has a long history of setting clear external expectations by which we can be measured. In 2004, we met or
exceeded these expectations in all four quarters. In fact, we have met or exceeded external expectations 20 out of 21 quarters since 1999, continuing
to demonstrate Cerner’s ability to execute and the strength of our management team. For the fi rst fi ve years of this decade, 2000 to 2004, Cerner grew
revenue at a compound annual rate of more than 20 percent and EPS more than 50 percent.
Record Operating and Free Cash Flow: We increased operating cash fl ow 25 percent to $168 million in 2004 and generated a strong $53 million of
free cash fl ow (operating cash fl ow less capital expenditures and capitalized software).
Progress Toward 20 Percent Operating Margins: We met key milestones in our published plan to grow operating margins to 20 percent by 2007,
expanding operating margins 310 basis points in 2004 to 12.4 percent, with the fourth quarter of 2004 at 14.8 percent, our highest quarterly level
since 1995.
Improved Cerner’s Business Model: We continued to positively affect our business model with the additions of highly visible revenues such as
Managed Services, which has grown to more than 25 percent of our $1.2 billion contract backlog.
Achieved New Milestones in Delivering Our Solutions: Cerner now turns on major clinical systems by the “thousands” each year, turning on 1,079
Cerner Millennium®Cerner Millennium®Cerner Millennium applications in 2004. This is a 22 percent increase over 2003 and by far the highest number of conversions in the industry. What
is more impressive is the breadth of our offerings, with nearly 60 different solutions built on the Cerner Millennium platform. Cerner Millennium platform. Cerner Millennium
Dominated the Computerized Physician Order Entry (CPOE) Market: With healthcare providers focused on eliminating avoidable medical errors, CPOE
has become the Holy Grail over the past few years. We ended 2004 with CPOE live at 378 locations, which is nearly double our total at the end of 2003. We
signifi cantly increased both the number of acute-care sites and the number of physician offi ce and clinic sites in this important market. Cerner easily
has the largest number of live CPOE sites on a currently marketed platform. A recent survey by KLAS, a leading healthcare information technology
research fi rm, revealed that Cerner was the top choice when respondents were asked who they would consider fi rst if they could “start fresh today”
and select a CPOE supplier.
Launched New Era of Digital Health Systems: The ability to replace the current paper medical record with a digital version is the acid test of
the completeness of an information architecture and the quality of the applications supporting workfl ows. In 1994, Cerner took the Mayo Clinic
in Jacksonville paperless, supporting the complex requirements of this large and growing physician practice. A decade later, the push to improve
effi ciency and safety has extended to the most complex parts of the healthcare delivery system. Today, new hospitals and clinics such as Oklahoma
Heart Hospital in Oklahoma City, University of Utah Orthopaedic Center in Salt Lake City, Banner Estrella Medical Center in Phoenix, and Baptist Medical
Center South in Jacksonville are “going digital”. We have a number of clients that have primarily digitized their medical record but still maintain a
partial paper record. While many of today’s digital hospitals have been designed from the ground up to be paperless, by the end of the decade, we
expect almost all hospitals to be on a path to become digital.
Demonstrated Our Strength Within: The Sarbanes-Oxley Act required public companies in the United States to have the internal controls of their
fi nancial systems independently reviewed in 2004. This process identifi ed material issues for many companies. For Cerner, the process validated the
strength of our controls, and we are pleased to report that no material weaknesses were identifi ed during the independent review of our controls.
Continued Our Commitment to Transparency: Out of respect for our clients and shareholders, Cerner continues to communicate as clearly as we
can about how our business model operates and how external factors and our future plans could impact our business. In this letter, we discuss our
current view on external factors and how our business strategies align with these factors. We have also included a fi nancial appendix to this letter that
contains a detailed discussion of our current business model and our assessment of our 2004 fi nancial results.

5
2004: A Year of Execution “AND” Innovation The Cerner story is interlaced with both the complexities of healthcare delivery and the abstraction of software, but our core story is that of a company driven by a vision of being truly transformational to healthcare. Each year, we use this letter to tell you more about how Cerner works, how we are driven and what the dynamics are at the intersection of healthcare delivery and information technology. This year, we are describing what we call the “AND.”
At Cerner, the AND is a management term that connotes action as well as conjunction. It expresses the idea that our mission often requires us to do our primary jobs capably, while at the same time moving our teams to cross old boundaries in pursuit of something new and valuable. The AND things stretch us. The AND things are almost never urgent today, but they are the reason we are here today. The concept of the AND extends from associates who make individual contributions, to mid-level managers, to the CEO, to our Board of Directors. On the company level, the AND translates into major initiatives that are focused on Cerner’s future. 2004 was a year of execution AND innovation. In addition to performing solidly, we had one of our strongest innovation years in our history. The key to organic growth is constant innovation, and we have grown Cerner organically for 25 years. 2004 was a remarkable year in the volume and breadth of innovations and for the potential magnitude of impact our innovations could have on healthcare and our company. It refl ects our commitment to bringing new levels of value to our clients. What follows are some of the major innovations we believe will propel Cerner’s future growth.
Bedrock™ : Few appreciate the amount of work involved in implementing information systems that automate all major processes in hospitals, physician offi ces, pharmacies and laboratories. We do. We want to change the amount of time and effort required to achieve a high level of automation. The Bedrock innovation is the result of our desire to achieve a major change for the benefi t of our clients. Simply put, we are building a layer of Bedrock innovation is the result of our desire to achieve a major change for the benefi t of our clients. Simply put, we are building a layer of Bedrocktechnology to build and manage our own Cerner Millennium information platform. We anticipate that the Cerner Millennium information platform. We anticipate that the Cerner Millennium Bedrock system will reduce the labor cost of implementing our systems by as much as 50 percent. This substantive change for our clients will change both Cerner and our industry.
Lighthouse™ : Today, almost all clinical information is recorded manually into paper-based records or in printed documents and images that are manually inserted into a binder. Together, these scattered fragments of paper and fi lm comprise the “medical record.” To shine any light on the information in these records in their current state requires signifi cant manual effort to identify, review and abstract data from these records. An accessible and thoughtfully designed electronic medical record database creates complete transparency—provided you have a “lighthouse” to illuminate the critical facts in a sea of records. In our Lighthouse innovation, we are developing a data-driven, clinical optimization process Lighthouse innovation, we are developing a data-driven, clinical optimization process Lighthousereengineering practice that will enable changes in physician and nursing behavior. It will require a new potential business model of gain sharing. The idea has been very well received by chief executive offi cers, chief medical offi cers and chief fi nancial offi cers.
Genomics Data Model: The most exciting scientifi c advancement in medicine is the sequencing of the human genome. It is strongly believed that this sequencing will unlock future discoveries in clinical medicine for the next 100 years and lead to fundamental changes in how clinical medicine is practiced. With the introduction of PathNet®PathNet®PathNet Helix™® Helix™® in 2004, Cerner was the fi rst company in the world to deliver a solution with the ability to store, Helix™ in 2004, Cerner was the fi rst company in the world to deliver a solution with the ability to store, Helix™represent and manipulate the data representation of personal genomic information. We did this by extending our proven Cerner Millennium information architecture that today manages the clinical and phenotypic information of millions of people.
Cerner Grid Services: Health information has great utility to your physician. Many people have multiple physicians, each part of a different practice. In the current state, a person’s information is almost never put together in one place; instead, it exists in a highly fragmented state scattered across hospitals, physician offi ces, clinics, pharmacies, laboratories and the home. There is an increasing awareness of the need to create community lifetime medical records connecting all of the fragmented pieces of a person’s record into a coherent, logical set of data that can be used to coordinate care for an entire lifetime. Cerner is leading these efforts by providing a set of innovative solutions in our newly formed Grid Services organization. Our goal in this set of services is to connect multiple enterprises and persons to a common and secure grid architecture. In 2004, we made meaningful progress toward laying the foundation for this organization.
• Type 1 Diabetes Network / Conditions Grid Service: In October 2004, Cerner announced our pledge to provide every child in the United States with Type I diabetes a Personal Health Record (PHR) and a secure connection to their physicians. Within 100 days of the announcement, the majority of pediatric endocrinologists in the United States were agreeing to be part of the fi rst-ever national PHR network. We will provide this service free of charge to the families and their physicians through 2015 because we sincerely want to make a substantial difference in the lives of each of these children by using technology to better manage their chronic conditions. We believe that this system of care will represent a future model for managing chronic conditions.
• Regional Grid Service: There is a need to coordinate care for entire populations of people across large geographic areas. Dr. David Brailer, who was appointed the fi rst-ever national coordinator for health information technology in 2004, calls the conceptual entities that do this Regional Health Information Organizations (RHIOs). We were already implementing a state-wide version of this concept before the RHIO strategy was announced by signifi cantly leveraging our Cerner Millennium architecture. Working in a progressive public-private partnership with a major commercial payer Cerner Millennium architecture. Working in a progressive public-private partnership with a major commercial payer Cerner Millenniumand a state government, we built and implemented an electronic community health record in fewer than 100 days that could reach approximately one million people. The creation of the electronic community health record is expected to improve the coordination of care and save both the payer and the state a signifi cant amount of money through the elimination of redundant diagnostic procedures, the elimination of medically unnecessary diagnostic procedures and treatments, the prevention of costly medical errors that harm individuals and add costs to the system, the detection of fraud and abuse, and the reduction of emergency department admissions.

6
• Physician Grid Services: The majority of doctors in the United States are in small physician practices with 10 or fewer doctors in the practice. During our fi rst 25 years as a company, we created a lot of value for the large and complex organizations in healthcare—hospitals and large clinics. We believe the time is right to accelerate our impact in smaller physician practices. To this end, we acquired VitalWorks’ Medical Division at the beginning of 2005, and formed Cerner Physician Practice, Inc. Our vision for small physician practices in the United States is to create a highly-scalable, next-generation digital practice and to become a low-cost, high-value service provider to the U.S. physician practice market.
• Transaction Grid Services: Doctors and hospitals fi le claims to be paid. There is a middle layer in healthcare whose core function is the pricing and paying of these claims. Historically, this layer provided an insurance function by pooling members from communities together so that the healthy helped fi nance the cost of the sick. The ultimate payer for healthcare remains the employer/employee and government/citizen. Today, most large employers self-insure their populations, yet they still must absorb signifi cant unnecessary administrative costs due to ineffi ciencies in the payment system. There is a lot of friction, or ineffi ciency, in this middle layer that contributes to administrative costs that consume almost a third of every healthcare dollar spent. Cerner is working to improve the current method of payments and remove some of the friction from the process by entering the Electronic Data Interchange (EDI) business while also working on new innovations in methods of payments.
There is a building sense of excitement about the new thoughts that began to take shape inside Cerner in 2004. In some cases, we are already reaping the benefi ts of these investments in innovation; in other cases, it may take years to realize a return. Our 25-year entrepreneurial history of investing in the future, however, gives us the confi dence that innovation and investment lead to a future full of opportunities.
Healthcare Information Technology Is Becoming Public PolicyDomestically, the news has not changed much. Healthcare is the largest single sector of the United States economy. Right now it represents more than 15 percent of the world’s largest economy—and that percentage is still growing. U.S. healthcare spending alone is the equivalent of the fourth largest economy in the world. Globally, the news is similar. While most other countries do not spend as much on healthcare, either in total or as a percentage of their gross domestic product, the annual percentage of increase each developed country is seeing in healthcare expenditures is about the same. In the United States, many states are now spending more dollars on healthcare (Medicaid) than they are on education. And they must balance their budgets, bringing about hard decisions in each state capital. The hard demographic facts have not changed either—the baby boomers have not yet hit the system with full force, and when they do, the system may not be ready. Clearly, spending will increase. Many experts agree; the current course is not sustainable. Something must change.
Healthcare Information Technology (HIT) has now entered the realm of healthcare policy. On the world stage, governments possessing a centralized form of healthcare increasingly reach for HIT as a tool with massive transformative capabilities. In the last two years, the software procurement felt around the world, the United Kingdom’s National Programme for IT (NPfIT—now rechristened Connecting for Health) was and still is widely followed. Cerner was selected for one of the smaller but strategic contracts in the procurement, a national appointment booking program known as Choose and Book, and we have successfully delivered all that has been asked of us and more for this project. We are excited to be involved with such an ambitious HIT project, and we believe our successful execution to date positions us for more opportunities both in the United Kingdom and around the world.
Despite the largely decentralized form of healthcare afforded in the United States, HIT is now entering the national limelight here as well. The government signaled an unprecedented level of interest in HIT in 2004 with President Bush’s appointment of Dr. David Brailer to the post of national health information technology coordinator. Then, in his 2005 State of the Union speech, President Bush spoke directly to the importance of HIT for the second straight year by calling on Congress to move forward on his comprehensive healthcare agenda that includes improved information technology to prevent medical errors and needless cost. In the United States, where double-digit healthcare spending increases are the norm, federal and state governments are looking for a relief valve, and HIT just might supply it. There is broad, bipartisan support for making fundamental changes to how the healthcare system works that extends from Hillary Clinton to Newt Gingrich. In testimony before the U.S. House Budget Committee, Federal Reserve Chairman Alan Greenspan demonstrated a remarkable insight of the potential of HIT when he stated, “Some important efforts are under way to use the capabilities of information technology to improve the healthcare system. If supported and promoted, these efforts could provide key insights into clinical best practices and substantially reduce administrative costs. And, with time, we should also gain valuable knowledge about the best approaches to restraining the growth of overall healthcare spending.”
Given this broad focus on HIT, there is an increasing likelihood that both Washington and the states will increase incentives for healthcare providers to invest in digitizing hospitals and physician practices. We believe that they will use their role as purchasers of healthcare to create these incentives.
In 2001 and 2002, Cerner formed a coalition with GE, HP, Xerox and Johnson & Johnson. A national advisory board contracted with RAND Corporation to build an econometric model simulation of the impact of widespread IT adoption could have on United States healthcare expenditures. Results should be published in a high-quality, peer-reviewed journal this year, and should have the attention of the policy-makers in Washington.
Not all of the HIT-related studies are positive. While most industry experts believe that broad adoption of healthcare IT is essential to deal with the industry’s disturbing medical errors—errors that kill up to 100,000 people a year in United States hospitals and cause serious harm to many others—a recent study published in a March 2005 Journal of the American Medical Association (JAMA) suggested that Computerized Physician Order Entry (CPOE) systems can facilitate medical errors. The disturbing thing about this study was that it was based on research conducted only at one institution, using

7
NEAL L. PATTERSONFOUNDERChairman & Chief Executive Offi cer
CLIFFORD W. ILLIGFOUNDERVice Chairman
PAUL N. GORUPFOUNDERSenior Vice President, Knowledge & Discovery
only one system—one of our competitors’ CPOE systems that had a separate pharmacy software system connected to it via an interface. The article gave further proof of a point we have been making at Cerner for decades: Healthcare requires a common architecture and intelligent design to automate and improve its core processes. In a case like the one examined at some depth in the JAMA article, disparate systems are interfaced, attempting to create a single workfl ow between departments and likewise attempting to create common shared data from multiple points of origination. Healthcare is simply too complex. The interfaced approach is awkward and unsafe, and doesn’t encourage the most rational principles to rule the design of systems. People can get hurt. Our competitors have claimed that we make this point simply because that’s what we have—a single architecture. Our pharmacy, CPOE, have—a single architecture. Our pharmacy, CPOE, haveand nursing workfl ows emerge from and feed into the common architecture, the same electronic medical record. All of these workfl ows have a single source of truth for allergies and drug nomenclature; nothing gets lost in translation between two different classifi cation systems. The same order details are seen by all clinicians as their workfl ow and process models demand; the orders are not translated between different databases and builds. Because data are not interfaced, changes made by one clinician are seen in real time by all other clinicians—a critical element to ensuring safety. Our competitors do not get it—we have a single architecture because that is what is necessary to safely meet healthcare’s requirements. have a single architecture because that is what is necessary to safely meet healthcare’s requirements. have
Our Business EnvironmentAt Cerner, we stand with one foot in healthcare and the other in information technology. Both currents of change are swift and powerful. Information technology continues its rapid advance, making what was formerly science fi ction into reality. Likewise, the research-based science around healthcare progresses at a rate too fast for any single person to monitor. The place where the two currents combine is producing the expectation of an “any knowledge, any time, any place” working environment for healthcare providers, and the results are capable of producing tremendous benefi t for our society. At Cerner, we strive to do much more than simply outpace obsolescence. We live to be essential to our current and future clients. That is why we innovate rather than replicate. That is why we continue to invest heavily in our Cerner Millennium architecture. We see opportunities in Cerner Millennium architecture. We see opportunities in Cerner Millennium Cerner Millenniumthat don’t exist with any other competitor’s platform. As our industry gets more attention from state and national governments, more companies will look for ways to participate in our sector. The competition is always fi erce. From the biggest “Big Caps” to the acquisition-based “Roll-Ups” to the truly entrepreneurial companies, we have no lack of competitors. However, Cerner will lead and others will follow.
Our Focus in 2005In order to be highly successful as a company over a long period of time, we must serve three stakeholders with sharp focus. Here are some of our 2005 areas of focus relative to our three most important constituents:
For Our Clients: We want our relationship to set the standard for all professional relationships, and our solutions and services to be defi ned by quality. We For Our Clients: We want our relationship to set the standard for all professional relationships, and our solutions and services to be defi ned by quality. We For Our Clients:want to demonstrate how our solutions can deliver tangible value to their organizations and transform their visions for the future into reality.
For Our Shareholders: We plan to act in our shareholders’ best interests by remaining committed to long-term, high-quality and profi table growth achieved by continuing to innovate and organically grow our top line, progressing on our path to 20 percent operating margins, further expanding operating and free cash fl ow, and continuing our focus on increasing the visibility of our revenue streams.
For Our Associates: We will create clarity, alignment and focus for all associates in our work environment; set a new standard of expectations for our For Our Associates: We will create clarity, alignment and focus for all associates in our work environment; set a new standard of expectations for our For Our Associates:managers; and create an environment that fosters exceptional careers.
Refl ections on 25 YearsBack in the summer of 1979, Paul Gorup, Cliff Illig and Neal Patterson were “twentysomethings” dreaming of starting an information technology company. As with many dreamers of this sort, we had a vision of creating an uncommon company that would make an impact on the world as we knew it. In the fall of that year, our unusual journey began. Twenty-fi ve years later, all three of us are still here, a little bit grayer, but still passionate about changing the future. We are now joined by a great management team and thousands of talented, dedicated Cerner associates. The best lies ahead for Cefuture. We are now joined by a great management team and thousands of talented, dedicated Cerner associates. The best lies ahead for Cerner.
EARL H. DEVANNY, IIIPresident
PAUL M. BLACKExecutive Vice President& Chief Operating Offi cer
MARC G. NAUGHTONSenior Vice President& Chief Financial Offi cer
JEFFREY A. TOWNSENDExecutive Vice President
JULIA M. WILSONVice President & Chief People Offi cerVice President & Chief People Offi cer

8
Appendix: Cerner’s Business Model and Financial Assessment INTRODUCTIONLast year we devoted a good portion of our shareholder letter to a discussion about Cerner’s business model. We received a great deal of positive feedback about that portion of the letter, so we are including in this appendix an updated discussion about our business model. In addition, we are including our assessment of our 2004 fi nancial results and an update on our goal to achieve 20 percent operating margins.
THE CERNER BUSINESS MODELIn most respects, our business is relatively straightforward—we create intellectual property (IP) in the form of software and other forms of digital content, and we bundle it with other technologies and services to create complete clinical and business solutions for healthcare providers. In short, we build it, sell it, deliver it and support it for healthcare provider organizations around the world (“it” in this context refers to the solutions Cerner creates for healthcare organizations). In our opinion, we have a healthy business model and, under the right circumstances, we believe it will continue to improve over the next several years. Below is a graphical representation of Cerner’s business model showing a top-to-bottom fl ow of how Cerner converts new business opportunities and our backlog into revenue and earnings:
At the top of our model is our Sales Pipeline of potential future business opportunities we have identifi ed in the marketplace. Our pipeline has increased substantially over the past several years, refl ecting both a strong market for our solutions and our leadership position in the healthcare information technology marketplace.
During each quarter, we sign new contracts to deliver our solutions to clients. These signings are reported as New Contract Bookings and become part of our contract backlog. A typical new contract will impact our revenues in the current quarter and for the next several quarters, or even years, depending on how the licenses, technology resale, subscription, managed services and professional services are delivered.
Almost all of our client contracts will also contain provisions for Support Contracts in which Cerner agrees to provide a broad set of services that support our clients’ use of our solutions in demanding clinical settings. This support includes addressing technical issues related to our software and providing access to future releases of licensed software.
Continuing with our top-down business model fl ow, the value of the new bookings contracts and support contracts rolls into our Contract Backlog and Support Backlog, respectively. Even though almost all of our systems are in service for decades, our reported Support Backlog only includes the expected value for one year of support revenue for all of our client support contracts. We have historically reported the value of these backlogs because we believe they are important to our shareholders’ ability to interpret the overall health of our business. Our total backlog (signed contracts with unrecognized revenues and one year of support) ended 2004 at approximately $1.54 billion and grew at healthy compounded annual rates of 25 percent, 25 percent and 28 percent over the past three, fi ve and 10 years.
At the core of our business model are our various revenue streams and the contribution each stream makes toward the profi tability of Cerner. The contribution is stated as the recognized revenue less the direct cost to produce that revenue. On our business model, we have depicted six revenue categories that roll into the two revenue line items on our income statement. Licensed Software, Technology Resale and Subscriptions make up the System Sales line of our income statement, and Professional Services, Managed Services and Support & Maintenance make up the Services, Maintenance & Support line. Here is a description of each revenue stream:

9
Intellectual Property (IP): Licensed Software. We develop and license IP (our architectures, application software, executable and referential knowledge, data and algorithms) to our clients. Our standard license is perpetual—providing our clients permanent rights to use the software they purchase. This approach contrasts with the approach of most of our competitors who are always trying to sell “upgrades” to their clients. We believe our approach is part of the reason for our leadership position and the reason we have so many long-term client relationships—some longer than 20 years. We recognize revenues from licensed software as we achieve predefi ned client engagement milestones, such as delivery and installation of our software. In 2004, this type of revenue represented 23 percent of our total revenues with a profi t contribution of 88 percent.
Technology Resale. We bundle licensed software with other companies’ IP (e.g., that of HP, IBM, Microsoft, Oracle) in the form of sublicenses in order to create complete technology solutions for our clients. We also resell bundled computer equipment (hardware) from technology companies to create a completely functional system. We recognize revenues from technology resale as the equipment is delivered to our clients. In 2004, these revenues represented approximately 12 percent of our total revenue with a profi t contribution of 20 percent.
Intellectual Property (IP): Subscriptions. Another method by which we provide IP is based on a subscription model that has a periodic usage charge. This is the primary way we package and provide medical knowledge, which changes based on research and can be updated independently from the software in which it is embedded. This revenue is recognized monthly, and in 2004 it represented 3 percent of our total revenues with a profi t contribution of 12 percent. We expect the revenue and profi t contribution percentage from Subscriptions to increase in the upcoming years.
Professional Services. We provide a wide range of professional services to assist our clients in the implementation of our information systems in their organizations. These services are in the form of project management, technical and application expertise, and education and training of our clients’ staffs to assist in the construction and implementation of our systems. We recognize revenues associated with these engagement activities as they are provided to our clients. In 2004, these revenues represented approximately 27 percent of our total revenue with a profi t contribution of 23 percent. We have a number of initiatives in place in order to improve the fundamental profi tability of this element of our business. Our target profi t contribution is 32 percent by 2007.
Managed Services. In addition to offering access to talent and economies of scale, there are some services that, in certain circumstances, we can perform better and more economically than our clients can for themselves. Over the past several years, we have begun to offer a number of such services we call Managed Services. We currently offer a set of technical services that includes Remote Hosting, Application Management Services and Disaster Recovery. Remote Hosting is the largest of these offerings, and it involves Cerner buying (out of cash fl ows) the necessary equipment, installing it in one of our data centers, and operating the entire system on the client’s behalf. The revenues for this service and our charge for the equipment are recognized monthly as we provide the services. Most of our clients choose to own their own software license, so that portion of the revenue is unchanged. Cerner owns the equipment, however, instead of selling it upfront to the client; this impacts the technology resale portion of the revenue. While Managed Services represents a relatively small part of our revenue at $50 million and 5 percent of the total in 2004, it is one of the fastest-growing components of our revenue. The profi tability of this part of our business is currently at 20 percent, but should increase as we grow this business and spread the fi xed costs across a larger revenue stream.
Support & Maintenance. The fi nal portion of our revenue comes from the ongoing support and maintenance services we provide after our systems are in use by our client organizations. Almost all of our clients contract for these services. Clients on support contracts get 24x7 access to our Immediate Response Center, which serves as our “emergency room,” as well as access to a very knowledgeable base of associates in our Immediate Answer Center for less urgent issues. In addition, our clients’ support payments give them ongoing access to the latest releases of our IP. Cerner also provides support for sublicensed software and maintenance for third-party hardware. In 2004, support and maintenance revenues represented approximately 26 percent of total revenue with an impressive profi t contribution of 57 percent.
Note that all of the revenue categories discussed above add up to approximately 96 percent of total revenue. The remaining 4 percent is revenue from reimbursed travel expenses related to Cerner associates traveling to client locations. This revenue has a zero margin as it is simply a pass-through of our client-related travel expenses that are billed to our clients, but which we are required to report as revenue.
The two large indirect expenses in our business model are the costs of our Research and Development (R&D), which was equal to 19 percent of revenue in 2004, and the indirect portion of Selling, General and Administrative (SG&A) activities, which represented 14 percent of revenue in 2004. Cerner has a long history of investing heavily in R&D and using that investment to systematically expand markets to create organic growth, and expect to invest $1 billion in R&D over the next fi ve years, an investment we believe is unmatched in our industry. During recent years, R&D spending has grown at roughly the same rate as revenue. Going forward, we expect the industrial strength of our Cerner Millennium architecture and the enactment of several initiatives Cerner Millennium architecture and the enactment of several initiatives Cerner Millenniumdesigned to leverage our R&D investments to slow the rate of increase in R&D spending, while continuing our strong record of innovation and organic growth. Similarly, we expect to take advantage of a more scalable business infrastructure to reduce the rate of increase in SG&A spending to below our revenue growth rate. We expect this leverage to help improve operating margins without impacting our ability to develop and deliver new solutions to our clients.
Reimbursed Travel4%
Subscriptions3%
Managed Services5%
Maintenance & Support
26%
Professional Services
27%
Technology Resale12%
Licensed Software23%
����������������

10
In 2004, our overall operating margin of $115 million was 12 percent of revenue, positioning us on course for our goal of 20 percent targeted profi tability levels. We will discuss our margin expansion plans later in this appendix.
The remaining expenses in our business model are taxes and interest expense, which totaled $50 million in 2004, leaving $65 million of net earnings, or $1.73 of earnings per share.
ASSESSMENT OF 2004 FINANCIAL RESULTSWe focused on three key fi nancial objectives in 2004: growing the top line, expanding operating margins and generating free cash fl ow.
Growing the Top Line
Cerner has consistently delivered impressive long-term revenue growth. Both our new business bookings and our revenue have grown an average of over 18 percent in the three-, fi ve- and ten-year time horizons. There have been some major dynamics going on inside our business model that slowed revenue growth in 2003 and 2004 to 8 percent and 10 percent, respectively. The primary shift involves our rapidly growing Managed Services business. These contracts are for three to seven years and, in reality, could be renewed for many more years. As a result, these contracts create a much more visible stream of revenue, but the shift to more Managed Services does temporarily slow revenue growth because of the multi-year rollout of revenue and the fact that clients selecting our Managed Services are not purchasing hardware. The success of our Managed Services business and the visibility that it creates are refl ected in our backlog. In fewer than four years, Managed Services has grown to account for more than 25 percent of our $1.2 billion contract backlog.
In 2005, we believe we can continue gaining market share by leveraging our proven solutions and exposing the unproven nature of some of the competitive offerings. We are also focused on cross-selling into our installed base as our clients’ needs grow over time. On average, an existing client has about fi ve solutions installed from among the nearly 60 potential Cerner Millennium solutions that are available.Cerner Millennium solutions that are available.Cerner Millennium
We assume that the competitive environment and levels of penetration in our chosen market will remain reasonable going forward, and we have strategies in place that broaden our market reach beyond the traditional hospital market (i.e. Grid Services, which we discuss in our Shareholder letter). We will also remain focused on leveraging our experience in the global market as we believe there are meaningful opportunities outside of North America, including continental Europe, the Far East and South America.
Expanding Operating Margins
In February of 2004, we mapped out our path from the 2003 level of 9 percent operating margins to our target of 20 percent by 2007. We made very good progress during the fi rst year of this path. Our operating margin expanded 310 basis points in 2004, increasing from 9.3 percent in 2003 to 12.4 percent in 2004 with Q4 of 2004 at 14.8 percent, our highest quarterly level since 1995. A key driver of this margin expansion was improvement in the productivity of our Professional Services organization, which increased its contribution margin from 15 percent in 2003 to 23 percent in 2004. We also achieved productivity gains in our Support and Maintenance business.
In February of 2005, we reiterated our goal of expanding our operating margins to 20 percent by 2007, and we have again laid out the roadmap to achieving this goal. Our roadmap includes the following key elements. In total, these elements are expected to improve operating margins more than 700 basis points by 2007.
Improve Professional Services Margins from 23 percent in 2004 to 32 percent by 2007. We expect this to contribute more than 150 basis points to Cerner’s operating margin. While we made a lot of progress at expanding margins in this organization in 2004, there are still more opportunities to enhance productivity. A key driver will be continuing to leverage our Accelerated Solutions Center, Accelerated Solutions Center, Accelerated Solutions Centerwhich has margins of approximately 40 percent and accounted for more than 20 percent of conversions in 2004. The next level of productivity will be achieved through our Bedrock initiative, which has the potential to signifi cantly reduce Bedrock initiative, which has the potential to signifi cantly reduce Bedrockthe implementation cost for both Cerner and our clients, allowing for margin expansion and a competitive advantage in the marketplace.
Leverage R&D investments, bringing R&D as a percentage of revenue down from 19 percent to 16 percent by 2007. We expect this to contribute nearly 200 basis points to Cerner’s operating margin. The opportunity to generate margin expansion by honing and hardening Cerner Millenniumarchitecture and solutions in order to reap the full benefi t of our signifi cant past IP investments is in focus. Taking advantage of our common platform should allow us to continue our record of innovation while growing R&D spending at a rate that is slower than our top-line growth rate. Obtaining this leverage does not mean we need to reduce our absolute R&D spending, just that we need to grow R&D more slowly than revenue. The key to doing
-
���
���
���
���
���
���
������
������
���� ���� ���� ���� ������
���
���
���
���
���
����������������
������������
����������������
Managed Services/�������������
���������������������
Bas
is P
oint
s
Operating M
argin %
Operating Margin
Drivers of Margin Expansion (Cumulative)
Contribution Margins ����� �����Professional Services 15% ���R&D (% of Total Rev.) ����� �����SG&A (% of Total Rev.) ����� �����Managed Services ��� ���������������� 10% ���Support & Maintenance ��� ���
Key Assumptions to Margin Expansion Target
�������������������������������������������������������
������������������������������������������������������������������������������������������������������������������������������������������������������������
��������
�������������������
��������
�������������������
��������
�������������������
��������������������������������������������������������������������������������������������������������������������������������������������������������������������������������������

11
this will be our ability to extend Cerner Millennium architecture to new revenue opportunities without signifi cant incremental costs. Grid Services and Cerner Millennium architecture to new revenue opportunities without signifi cant incremental costs. Grid Services and Cerner Millenniumthe global marketplace offer good opportunities to achieve this leverage. Our operations in India will also contribute to our ability to control the rate of R&D growth.
Increase profi tability of Support and Maintenance. We expect this to contribute approximately 150 basis points to Cerner’s operating margin. As we have continued to harden the Cerner Millennium platform, our incremental cost to support each additional client has declined. We expect this to Cerner Millennium platform, our incremental cost to support each additional client has declined. We expect this to Cerner Millenniumcontinue, which will allow us to expand the profi tability of this highly visible revenue stream.
Leverage Sales, General, and Administrative expenses. We expect this to contribute approximately 120 basis points to Cerner’s operating margin. We continue to focus on opportunities to amplify gains in other major areas inside our business model. We have built a scalable business infrastructure that should allow us to keep our SG&A spending growth rate lower than our top-line growth rate.
Expand Margins and grow revenue in Managed Services and Subscription business models. We expect these to contribute approximately 100 basis points to Cerner’s operating margin. Both of these business models are relatively immature, but they are experiencing strong growth, and we expect them both to become more profi table as they grow and the fi xed costs associated with supporting them are spread over a higher revenue base.
A key point regarding our margin expansion strategy is that we are executing it while our business model is transitioning to more visible and recurring revenue components. For example, in 2001, approximately 56 percent of Cerner’s revenue came from what we consider visible or recurring sources such as Professional Services, Managed Services, Subscriptions and Support & Maintenance. In 2004, 64 percent of our revenue came from these sources, and by 2007, we estimate that 70 percent of our revenue will be coming from these sources. The result of this shift is that if we have achieved 20 percent margins by 2007, we will not only benefi t from the higher level of profi tability but also from a higher level of visibility and sustainability.
It is important to realize that this plan is based on the assumption that we will continue to grow our top-line revenue by 10 percent.
Earnings Growth
Because of our ability to expand operating margins, we drove very strong earnings growth of 50 percent in 2004, even though revenue growth was 10 percent. While the 2004 earnings growth benefi ted from a lower 2003 comparable, our three-, fi ve- and ten-year earnings growth rates of 23 percent, 56 percent and 13 percent are strong as well. Going forward, our top-line strategies coupled with continued focus on productivity enhancements and margin expansion position us well to grow earnings more than 20 percent annually.
Generating Free Cash Flow
A healthy business generates cash fl ow. Perhaps our most signifi cant improvement over the past two years has been in our cash fl ow performance. In 2003, we generated $134 million of operating cash fl ow, which was nearly double the 2002 level. Because we were still investing heavily in our campus expansion facility, our 2003 free cash fl ow (operating cash fl ow less capital expenditures and capitalized software) was still slightly negative at ($8) million. In 2004, we increased operating cash fl ow 25 percent to $168 million and generated a strong $53 million of free cash fl ow. This cash fl ow performance led to a strong cash balance of $190 million at the end of 2004 and positioned us to fund our strategic VitalWorks Medical Division acquisition at the beginning of 2005 without signifi cantly increasing our debt position.
Stock Price
We manage Cerner, not the stock price. In the short term, the stock price can be infl uenced by many factors beyond our control, but we believe in the long term it will closely refl ect the quality of our decisions. We believe it is important for our shareholders that we focus on delivering strong long-term results, but we also understand the importance of delivering consistently against short-term targets. We have delivered strong short-term and long-term results, and our stock price refl ects this. In 2004, Cerner’s stock price increased 40 percent compared to a 9 percent increase in the NASDAQ Composite Index. And in the Wall Street Journal’s annual scorecard for the top 1,000 public companies, Cerner ranked third out of all software companies based on Wall Street Journal’s annual scorecard for the top 1,000 public companies, Cerner ranked third out of all software companies based on Wall Street Journal’sfi ve-year performance.
$(50)
$-
$50
$100
$150
2000 2001 2002 2003 2004
Operating Cash Flow Free Cash Flow
����
�����
����
���������
0%
10%
20%
30%
40%
50%
60%
70%
80%
90%
100%
2001 2002 2003 2004 2005E 2006E 2007E
�����������������
�����������������
�������������
���������������������
����������������
���������������������
�����������������������������
�����������������


13
ANNUAL REPORT 200410-K


15
SECURITIES AND EXCHANGE COMMISSIONWashington, D.C. 20549
FORM 10-K(Mark One)
( X ) ANNUAL REPORT PURSUANT TO SECTION 13 or 15(d) OF THE SECURITIES EXCHANGE ACT OF 1934 For the fi scal year ended January 1, 2005
OR
( )TRANSITION REPORT PURSUANT TO SECTION 13 OR 15(d) OF THE SECURITIES EXCHANGE ACT OF 1934 [NO FEE REQUIRED]
For the transition period from _____________ to ___________
Commission File Number 0-15386
CERNER CORPORATION(Exact name of Registrant as specifi ed in its charter)
Delaware 43-1196944 (State or other jurisdiction (I.R.S. Employer of incorporation or organization) Identifi cation Number)
2800 Rockcreek ParkwayNorth Kansas City, Missouri 64117
(816) 221-1024(Address of principal executive offi ces, including zip code;
Registrant’s telephone number, including area code)
Securities registered pursuant to Section 12(b) of the Act: NONE
Securities registered pursuant to Section 12(g) of the Act:
Common Stock, par value $.01 per share Preferred Stock Purchase Rights
(Title of Class)
Indicate by check mark whether the Registrant (1) has fi led all reports required to be fi led by Section 13 or 15(d) of the Securities Exchange Act of 1934 during the preceding 12 months (or for such shorter period that the Registrant was required to fi le such reports), and (2) has been subject to such fi ling requirements for the past 90 days. Yes X No _____
Indicate by check mark if disclosure of delinquent fi lers pursuant to Item 405 of Regulation S-K is not contained herein, and will not be contained, to the best of Registrant’s knowledge, in defi nitive proxy or information statements incorporated by reference in Part III of this Form 10-K or any amendment to this Form 10-K. [ ]
Indicate by check mark whether the registrant is an accelerated fi ler (as defi ned in Exchange Act rule 12b-2). Yes X No _____
The aggregate value of the registrant’s voting and non-voting common equity held by non-affi liates of the registrant as of June 25, 2004 was $1,285,888,117.
At February 28, 2005, there were 36,781,069 shares of Common Stock outstanding, of which 7,217,797 shares were owned by affi liates. The aggregate market value of the outstanding Common Stock of the Registrant held by non-affi liates, based on the closing sale price of such stock on February 28, 2005, was $1,540,246,471.
Documents incorporated by reference: portions of the Registrant’s Proxy Statement for the 2005 Annual Meeting of Shareholders to be held on May 27, 2005 are incorporated by reference in Part III hereof.
16
PART 1Item 1. BusinessOverview
Cerner Corporation (“Cerner” or the “Company”) is a Delaware business incorporated in 1980. The Company’s corporate headquarters are located at 2800 Rockcreek Parkway, North Kansas City, Missouri 64117. Its telephone number is (816) 221-1024. The Company’s Web site address is www.cerner.com. The Company makes available free of charge, on or through its Web site, its annual report on Form 10-K, quarterly reports on Form 10-Q, current reports on Form 8-K and all amendments to those reports as soon as reasonably practicable after such material is electronically fi led with or furnished to the Securities and Exchange Commission.
Cerner is taking the paper chart out of healthcare, eliminating error, variance and unnecessary waste in the care process. With more than 1,500 clients worldwide, Cerner is a leading supplier of healthcare information technology. Cerner®Cerner®Cerner solutions give end users secure access to clinical, administrative ® solutions give end users secure access to clinical, administrative ®
and fi nancial data in real time. Consumers retrieve appropriate care information and educational resources via the Internet.
Cerner implements these solutions as stand-alone, combined or enterprise-wide systems. Cerner solutions can be managed by the Company’s clients or Cerner solutions can be managed by the Company’s clients or Cernervia an application outsourcing/hosting model. Cerner provides hosted solutions from its data center in Lee’s Summit, Missouri.
Cerner solutions are designed and developed using the Cerner solutions are designed and developed using the Cerner Cerner Millennium®Cerner Millennium®Cerner Millennium architecture. The Cerner Millennium architecture is a state-of-the-art Cerner Millennium architecture is a state-of-the-art Cerner Millenniumtechnology infrastructure that combines clinical, fi nancial and management information solutions. It provides access to an individual’s electronic medical record at the point of care and organizes information for the specifi c needs of the physician, nurse, laboratory technician, pharmacist or other care provider, as well as for front and back offi ce professionals.
Healthcare organizations utilize data gathered and stored within the Cerner Millennium architecture to improve the safety, effi ciency and productivity Cerner Millennium architecture to improve the safety, effi ciency and productivity Cerner Millenniumof the entire enterprise. The Cerner Millennium architecture is designed to deliver medical knowledge and content to the point of care to help clinicians Cerner Millennium architecture is designed to deliver medical knowledge and content to the point of care to help clinicians Cerner Millenniumpredict outcomes of treatment plans and deliver the most effective care.
The Healthcare Industry
During 2004, stories of medical errors grabbed the nation’s attention, and the cost of healthcare services continued to rise. As a result, several trends accelerated, including measures to increase quality through pay-for-performance initiatives and a movement toward consumer- and employer-driven care.
Healthcare Lags Other Industries in Technology Adoption
The healthcare industry continues to lag other markets in its adoption of technology to streamline processes, increase safety and create cost effi ciencies. For example, the fi nance industry spends 8.6 percent of operating budget on technology while healthcare spends only 3 percent, according to the Information Week 500 study conducted in 2004. The need for increased use of technology in the delivery of healthcare appears to be reaching critical Information Week 500 study conducted in 2004. The need for increased use of technology in the delivery of healthcare appears to be reaching critical Information Weekmass.
In the fi rst half of 2004, healthcare costs rose 7.5 percent, according to the Center for Studying Health System Change (HSC) and the Employee Benefi t Research Institute (EBRI). This number is high when compared to the 5.9 percent increase in per capita gross domestic product. Additionally, the cost of hospital operations increased 8 percent in 2004, representing the largest one-year jump in more than 10 years.
As consumers and healthcare organizations struggle to contain costs, many entities are driving incentives for healthcare organizations to increase care quality. Pay-for-performance efforts, for example, seek to align quality improvement with fi nancial incentives rather than volume. To date, more than 100 plans exist, and many of them are moving toward structured measures, which include the use of healthcare information technology (HIT) and better outcomes, including both clinical and patient satisfaction. For example, the Centers for Medicare and Medicaid Services (CMS) is testing fi nancial incentives to reward hospitals that demonstrate high quality performance with its Premier Hospital Quality Incentive, which rewards organizations in acute care. For ambulatory settings, CMS’ Doctors’ Offi ce Quality (DOQ) project develops and tests a comprehensive, integrated approach to measuring the quality of care for chronic disease and preventive services. These efforts are intended to address rapidly increasing healthcare costs and quality of care issues by promoting a best practices approach and stimulating quality improvement and cost savings.
Consumer- and Employer-Driven Healthcare Become More Prevalent
While healthcare spending in the U.S. has held steady over the past two years, insurance costs continue to increase at a double-digit pace, forcing many employers to either shift the costs to employees or drop coverage altogether. According to the California-based Kaiser Family Foundation, in 2003, the number of employees covered by employer-sponsored health insurance dropped to 45 percent, down from 53 percent in 1999. Additionally, there are now 45 million uninsured Americans, an increase of 3.2 percent since 2002. From 2000 to 2004, the average family health insurance premium increased 59 percent.
Unfortunately, experts predict that insurance costs will continue to rise. In a USA Today article, UBS Analyst William McKeever predicted an insurance premium increase between 9 percent and 10 percent for 2005. As a result, employers and consumers are looking to minimize expenses, and an

17
estimated 50 percent of employers have moved to consumer-driven health plans. These plans give consumers greater control and fi nancial responsibility as they select the most cost effective services and prescriptions. Forrester Research predicts that the consumer-driven health plan membership will triple by 2005, making it the fastest-growing health plan sector.
In addition to consumers, many employers are also taking action to control costs and increase quality. Through employer-driven health plans, companies encourage employees to utilize hospitals that meet specifi c quality criteria. As an example, The Boeing Company established a plan in 2002 to encourage its employees to access hospitals that meet criteria developed by The Leapfrog Group, a coalition of 160 companies working to improve the safety, quality and affordability of healthcare. Hospitals are evaluated on their ability to meet these quality standards, such as the use of computerized physician order entry (CPOE), and certain union groups are encouraged to use the identifi ed organizations over other hospitals. If the participating hospital meets national patient safety standards for specifi c procedures, the hospital stay is eligible for a benefi t incentive payment of 100 percent. Those who select another facility pay 5 percent of their hospital bill, which can often equate to hundreds or thousands of dollars.
These quality initiatives place pressure on hospitals to invest in information technology to remain competitive, and Cerner’s technology is taking part in leading the way with respect to HIT solutions.
Patient Safety Remains in Forefront of National Agenda
The year 2004 marked the fi fth anniversary of a report by the Institute of Medicine (IOM) that cited an unacceptably high rate of medical errors that resulted in an estimated 44,000 to 98,000 deaths per year in the United States. This report became a catalyst for improvement in healthcare as experts cited the numerous fl aws associated with a paper-based system. While the report exposed the high rate of error, the progress made since its publication is unknown. This is due in large part to fragmented efforts to report medical errors.
Only with a cohesive, comprehensive strategy can patient safety goals be achieved. Cerner’s proven CPOE solution, with 65 acute care and 313 ambulatory live sites, can provide organizations with the clinical functionality and executable knowledge to minimize errors and improve compliance with standards at the point of care.
2004 may well be recognized as the year that the electronic medical record (EMR) entered the national political agenda. Starting in January with the State of the Union address, President Bush called for increased use of computerized health records to reduce costs, improve care and lower the risk of error. He also established a goal of having an EMR for most Americans within 10 years.
Momentum continued to build in April when the Health Level Seven (HL7) organization announced the passing of its ballot that created a model and accompanying standards for electronic health records. This initiative will aid the adoption of the technology by creating a common platform for their use.
In May, President Bush confi rmed his commitment to HIT with the appointment of Dr. David Brailer as the fi rst national health infrastructure technology coordinator. In his position, Dr. Brailer is tasked with bringing together the fragmented segments of healthcare to improve quality and reduce costs.
In July, Neal Patterson, Cerner chairman and CEO, participated in the second annual National Health Information Infrastructure (NHII) Summit in Washington, D.C., during which industry leaders discussed plans to transform the delivery of healthcare by building new health information infrastructure, including electronic health records and a nationwide network to link health records. While there, Patterson suggested a similar urgency as President Bush’s 10-year call for EMRs stating, “We are the generation that has to do this work.”
As the year came to a close, Dr. Brailer and Dr. Mark McClellan, administrator of CMS, spoke at Cerner’s Health Care Leadership Forum and Cerner Health Conference, both held in October. They both talked about the growing momentum around HIT and the important role the marketplace can play in hastening its adoption. 2005 promises to bring additional and important developments. Cerner plans to play a role in shaping them.
The Cerner Vision
Cerner’s vision has evolved from a fundamental thought: Healthcare should not be organized around an encounter; it should revolve around the individual. This concept led to Cerner’s Community Health Model and the creation of the person-centric Cerner Millennium architecture – a truly unifi ed, enterprise-Cerner Millennium architecture – a truly unifi ed, enterprise-Cerner Millenniumwide architecture. The Community Health Model encompasses four steps:
Automate the Core Processes
Connect the Person
Structure the Knowledge
Close the Loop
Automate the Core Processes
As long as medical information is isolated in a paper record, the inadequacies of today’s healthcare delivery system will likely remain. Nurses and pharmacists will be forced to interpret potentially illegible and incomplete orders. Physicians will not benefi t from the real-time, contextual reference information available in automated solutions. And clinicians throughout a healthcare organization will continue to search for the single copy of the paper-based record; when it is not readily available, they may be forced to make critical care decisions without adequate information.

18
The elimination of the paper record can improve quality and safety, increase productivity, and generate better documentation from which clinical outcomes, fi nancial performance and resource utilization can be benchmarked and analyzed.
With an EMR, clinicians view demographic information, medical history, lab results, vital signs and treatment plans, along with notes from healthcare team members. Guidelines and pathways relevant to the person’s medical condition help the physician make the best possible decisions in diagnosing and treating the patient. This comprehensive view of the person’s health helps ensure safer and higher-quality care.
Once all the steps of healthcare are captured electronically, the enhanced documentation will create the foundation for data collection that can become the backbone for structuring the knowledge of healthcare.
In addition to automating workfl ow, technology is essential in order to eliminate error, variance, waste, delay and friction – all of which contribute to declines in healthcare quality and increases in medical error. HIT can eliminate these factors, leading to an overall cost reduction in healthcare.
Connect the Person
Cerner is dedicated to helping build a new medium between the person and the physician, which empowers the individual and delivers higher-quality healthcare. A cultural shift toward self-directed care is breeding a new consumerism in healthcare. With a personal health record, individuals can store and access their medical information securely from anywhere they have Internet access. When combined with personalized health content, consumers gain a better sense of the care they are receiving and the options available to them. They communicate better with providers and more proactively manage their healthcare.
Structure the Knowledge
Cerner is dedicated to building information systems that treat every clinical decision as a learning event. Cerner solutions enable the industry to structure, store and study the application and outcomes of medical practice.
Cerner believes medicine must have a structure that allows physicians to record treatment and outcomes in such a way that it can be compared and contrasted with other methods. A common nomenclature that can exactly capture the meaning of input from physicians and clinicians is a necessary fi rst step.
Cerner solutions store healthcare data and provide a framework for comparability. This structured data enables physicians to make sense of and glean value from the information that is gathered through automated processes and connected persons. Cerner believes that without a knowledge framework, data collected will provide no real benefi t. By building this structure, Cerner opens the door for every encounter with a patient and every piece of new knowledge to be catalogued, measured and analyzed. This knowledge framework will allow providers to deliver better care and develop an improved understanding of medicine.
Close the Loop
Cerner is dedicated to building information systems that deliver evidence-based medicine, dramatically reducing the average time from the discovery of an improved method to the change in medical practice.
Advances in technology offer great opportunities in healthcare and must be used to deliver better care faster. The information learned must be applied. Today, patients may wait as long as 10 years before new medical knowledge reaches widespread use. With systems designed to embed evidence-based medicine inside the clinician’s workfl ow—using pathways, guidelines and alerts—physicians know that the best science can be leveraged in every medical decision. This leads to reduced variance and better outcomes.
Evolution of Community Health Model Connects Larger Communities
Over the next 25 years, medicine will become increasingly personalized and technology will become more accessible. Cerner has created four business areas to address this evolutionary progress. These segments, referred to by the Company as grid services, represent the utility-like potential of the services Cerner will offer to large communities of users. The underlying principles of this initiative are to:
Connect all stakeholders in the healthcare system;
Create a secure, transparent and open network for data sharing; and
Remove the clinical, fi nancial and administrative friction.
The fi rst grid is the physician and metro grid, which focuses on leveraging Cerner’s physician practice organization and on delivering a broad range of fi nancial and clinical solutions to physician offi ces. The other grids are the state and regional grid, which drives the Company’s State and Regional Health Information Organization (RHIO) strategy and its next version of e-prescribing; the condition and disease management grid, which securely connects individuals with chronic conditions such as diabetes and asthma, with their healthcare providers; and the transactional services grid, which seeks to eliminate friction in the healthcare system by supporting the processing and management of healthcare transactions.

19
The Cerner Strategy
Key elements of the Company’s business strategy include:
Penetrate the integrated healthcare provider market. Large healthcare systems represent a signifi cant component of the healthcare information technology market. These organizations focus on improving safety and reducing costs through operating effi ciencies. Cerner’s enterprise-wide, person-centric clinical and management solutions provide the technology to manage healthcare across an organization, signifi cantly reducing costs, improving the effi ciency of delivery and enhancing the quality of care.
Increase market share in individual domains and further penetrate the existing client base by cross-selling additional Cerner solutions. Cerner expects continued growth in clinical domain systems for specifi c markets such as nursing, physician offi ce, laboratory, pharmacy, radiology, surgery, emergency medicine and cardiology, as institutions look to restructure and reengineer these high-cost centers.
Focus on independent physician practices. As healthcare becomes increasingly personalized, access to personal patient information is critical for both large integrated networks and independent physician practices. As such, Cerner will concentrate signifi cant efforts to reaching physician practices of all sizes to systematize the healthcare process.
As part of these efforts, in January 2005, Cerner acquired the medical division of VitalWorks, Inc., a leader in the private physician offi ce information technology market. This transaction expands Cerner’s presence in the physician practice market, an area which is expected to increase considerably as the federal government continues its push to bring medical information to the point of care. This acquisition, which adds 3,500 physician practices, builds on Cerner’s already substantial hospital-affi liated physician client base, giving it additional reach across the entire spectrum of the $4 billion ambulatory market.
Create the perfect client experience. As a client-focused company, Cerner recognizes that relationships are as critical to success as breadth and depth of solutions. As a result, its approach to client services is broad, encompassing everything from implementation and adoption to ongoing service and support. Once these elements are in place, healthcare organizations can realize the full benefi ts of HIT and achieve their goals of higher quality care and patient safety.
HIT purchasing decisions are expensive and often present a great risk to both the sponsoring organization and the ultimate decision-maker. Cerner is easing this process by creating a comprehensive approach to implementation and management of these complex systems. The Company is automating processes by creating a specifi c methodology designed to reduce the design/build/maintenance efforts by up to 50 percent. This effort is intended to signifi cantly reduce implementation time and to lower the Company’s clients’ cost of ownership of Cerner solutions. The Cerner strategy also calls for easier system management, which will contribute to Cerner’s ability to achieve its goal of guaranteeing an industry-leading application availability rate.
Remain committed to a common architecture. Because Cerner believes that the constituents in health management need to work together to benefi t defi ned populations in a community, the Company has made a commitment to a single, unifi ed architecture as the platform for its health information and management systems. The Cerner Millennium architecture is scalable on a linear basis, using either Cerner compatible modules for process-oriented Cerner Millennium architecture is scalable on a linear basis, using either Cerner compatible modules for process-oriented Cerner Millenniumapplications or competitive systems interfaced using open system protocols.
Develop innovative solutions and services. Building upon the Cerner Millennium architecture, Cerner intends to continue to lead the industry through new Cerner Millennium architecture, Cerner intends to continue to lead the industry through new Cerner Millenniuminnovations. These solutions and services will complement existing solutions, address clients’ emerging HIT needs and employ technological advances.
In 2004, Cerner introduced PathNet Helix™, a breakthrough genomics solution for the laboratory. This fi rst-of-its-kind solution allows genetic information PathNet Helix™, a breakthrough genomics solution for the laboratory. This fi rst-of-its-kind solution allows genetic information PathNet Helix™to be stored in an electronic medical record, providing immediate access to information from genetic tests and helping clinicians plan the most effective therapy and treatment.
Additionally, the Company launched INet® INet® INet Virtual, a cutting-edge solution for critical care units to achieve real-time data sharing across all domains Virtual, a cutting-edge solution for critical care units to achieve real-time data sharing across all domains Virtualof care, thus eliminating the communication barriers between care providers. The solution went live in November at the Borgess Medical Center in Kalamazoo, Michigan, a member of Ascension Health, the largest nonprofi t health care system in the United States. This implementation, which will form the foundation for the national design for Ascension Health, was the fi rst INet Virtual conversion for Cerner.
Cerner is committed to offering solutions that improve critical care quality, processes, safety and outcomes. Its vision is for a single critical care quality improvement solution that incorporates all standards and evidence. In February 2004, Cerner acquired Project IMPACT TM, a prominent solution in critical care performance benchmarking. This solution provides a unique complement to the Cerner critical care suite of solutions by marrying Project IMPACTwith the decision-support and risk-adjustment capabilities of APACHE®APACHE®APACHE .
Additionally, the PowerInsight®PowerInsight®PowerInsight data-warehouse solution for healthcare business intelligence helps to transform healthcare by providing a foundation for the accurate measurement of a healthcare organization’s current business, delivering specifi c information and services required for continuous performance improvement.
Continue pursuit of excellence in implementations. Since the introduction of the Cerner Millennium architecture, Cerner has steadily decreased Cerner Millennium architecture, Cerner has steadily decreased Cerner Millenniumimplementation timelines while increasing the number of solutions converted within those timelines. In 2004, Cerner turned on 1,079 Cerner Millenniumapplications, a 22 percent increase over 2003. This brings the total number of live applications to 3,767 at nearly 750 facilities.
Cerner’s prescribed practices implementation model, developed from more than 25 years of success in developing and implementing HIT solutions, is contributing to the record number of implementations. Comprised of a dedicated group of information technology consultants who specialize in Cerner

20
Millennium implementations and work closely with clients, the team takes much of the implementation burden of database design and build activities Millennium implementations and work closely with clients, the team takes much of the implementation burden of database design and build activities Millenniumaway from the client. As a result, clients enjoy reduced time, cost and complexity of implementation.
Expand Managed Services. In addition to offering access to talent and economies of scale, there are some services that, in certain circumstances, the Company can perform better and more economically than its clients. Over the past several years, Cerner has added and offered a number of services, called Managed Services. This set of technical services includes remote hosting, application management and disaster recovery.
Build a reputation as a partner characterized by trust and integrity. In an era in which corporate fi nancial scandals seem almost a constant in the headlines, Cerner pledges to promote trust and integrity in every client relationship it establishes. Cerner’s three original founders – still in leadership positions at the Company today – along with its long history of solid fi nancial performance are testaments to the Company’s commitment.
Continue to expand global presence. Cerner has an immense opportunity to revolutionize the practice and delivery of healthcare throughout the world through its leadership in clinical systems and patient safety. To that end, Cerner continues to make signifi cant investments in the infrastructure development to support these efforts.
Cerner signed a contract with St. James’s Hospital in 2004, an organization that has emerged as the largest acute general hospital in the Republic of Ireland. Cerner is providing an integrated RIS/PACS system with Scheduling and Scheduling and Scheduling PowerChart®PowerChart®PowerChart for orders and results.
In 2004, Cerner and its partner Atos Origin (formerly SchlumbergerSema) delivered key milestones in bringing the Choose and Book system live in England. From a technical point of view, the project is the most advanced deployment of the Cerner Millennium architecture to date. The Company Cerner Millennium architecture to date. The Company Cerner Millenniumdemonstrated that the solution could handle large volumes of transactions while meeting extremely high service level requirements. The system handled about 2.8 million service requests per hour, and the database managed 5,000 SQL executions per second. The testing validated the scalability and performance of the Cerner Millennium Web Experience architecture. Cerner Millennium Web Experience architecture. Cerner Millennium
Other countries and regions around the world are taking England’s lead for a countrywide examination of HIT to modernize their healthcare systems. Across Europe, for example, there is an increased understanding of the need for improved access to information to facilitate the frequent movement of citizens across the European Union, according to a recent report by Frost & Sullivan. Cerner is optimistic about the global market and is expanding to new countries and responding to opportunities.
Solutions
Cerner Millennium solutions run on a single healthcare architecture uniquely capable of storing, retrieving and disseminating clinical and fi nancial Cerner Millennium solutions run on a single healthcare architecture uniquely capable of storing, retrieving and disseminating clinical and fi nancial Cerner Millenniuminformation across an entire health system. The Cerner Millennium solutions are dedicated to meeting the automation needs of every segment of the Cerner Millennium solutions are dedicated to meeting the automation needs of every segment of the Cerner Millenniumcare continuum.
Cerner solutions can be acquired individually or as a fully unifi ed health information system. Cerner also markets more than 200 solution options that complement Cerner’s major information systems. In addition, Cerner offers comprehensive consulting services—including learning services, readiness assessments, planning and change management and process redesign—and also sells third-party computers and related hardware to its software licensees.
Financial information regarding the Company’s operating segments is included under the caption “Operations by Segment” under Item 7, “Management’s Discussion and Analysis of Financial Conditions and Results of Operations” and also under the caption “Segment Reporting” as presented in Note 13 of the consolidated fi nancial statements.
Enterprise Repositories
The unique architecture of Cerner Millennium solutions sets Cerner apart from the competition. A key part of the Cerner Millennium architecture is the data repositories—the underlying foundation for Cerner solutions—which allow healthcare organizations to manage and make use of the data collected along the healthcare continuum.
The Open Clinical Foundation® repository manages clinical information with an open, standard medical terminology, providing the foundation for the ® repository manages clinical information with an open, standard medical terminology, providing the foundation for the ®
EMR.
The MultiMedia Foundation™ repository provides the clinical and document imaging foundation for the EMR.
Cerner’s solution categories include:
Enterprise-Wide Systems, which automate processes throughout the health system enterprise, including:
Access Management.
Care Management.
Financial and Operational Management Systems, which automate business operations.
Clinical Systems, which automate critical processes across the healthcare continuum, and Clinical Centers, which provide effi ciencies for ancillary departments such as laboratory and radiology.

21
Decision Support and Knowledge, which enhance clinical and business processes with information and actions.
Consumer, which supports Internet-based healthcare communities that effectively connect individuals, providers and health systems.
Packaged Solutions, which address key processes in healthcare.
Segment Solutions, which address issues unique to specifi c care settings.
Technologies for developing solutions or connecting other technologies and systems to the Cerner Millennium architecture.Cerner Millennium architecture.Cerner Millennium
Enterprise-Wide Solutions
Access Management
The CapStone®CapStone®CapStone Enterprise Access Management System is the industry’s most comprehensive suite of solutions designed to automate, integrate and Enterprise Access Management System is the industry’s most comprehensive suite of solutions designed to automate, integrate and Enterprise Access Management Systemstreamline patient access information between and among all key points in the delivery system. Key components of this solution create the Enterprise Master Person Index (EMPI) and automate the identifi cation, eligibility, registration and scheduling processes across hospitals, clinics, physician practices and other care delivery organizations.
Care Management
PowerChart Enterprise Clinical Data Repository is Cerner’s enterprise-wide electronic medical record system. It includes a robust data repository that is PowerChart Enterprise Clinical Data Repository is Cerner’s enterprise-wide electronic medical record system. It includes a robust data repository that is PowerChartshared across all Cerner Millennium solutions, and a highly interactive clinician’s desktop used for viewing, ordering, documenting and managing care Cerner Millennium solutions, and a highly interactive clinician’s desktop used for viewing, ordering, documenting and managing care Cerner Millenniumdelivery. PowerChart is unifi ed with the PowerChart is unifi ed with the PowerChart PowerOrders®PowerOrders®PowerOrders solution to provide Computerized Physician Order Entry (CPOE).
Financial and Operational
Cerner is leveraging its experience to bridge the gap between clinical settings and the business offi ce, revolutionizing the revenue cycle within healthcare systems.
The ProFit®ProFit®ProFit Enterprise Billing and Enterprise Billing and Enterprise Billing Accounts Receivable System is Cerner’s patient accounting and fi nancial management solution. The Accounts Receivable System is Cerner’s patient accounting and fi nancial management solution. The Accounts Receivable System ProFit system ProFit system ProFitbrings together clinical and fi nancial data to maximize reimbursement, decrease denials and gain dramatic operational effi ciencies.
Cerner ProVision™ Document Image Management System manages document images across the entire healthcare organization, including both clinical Document Image Management System manages document images across the entire healthcare organization, including both clinical Document Image Management Systemand non-clinical departments.
The ProFile® ProFile® ProFile Health Information Management System helps meet the operations management needs of the health information management (medical Health Information Management System helps meet the operations management needs of the health information management (medical Health Information Management Systemrecords) department with functionality that simultaneously manages paper, document images and computerized records within a single application.
The Clinically Driven Workforce Management™ solutions align the appropriate resources based on predicted and actual demand. With this comprehensive Clinically Driven Workforce Management™ solutions align the appropriate resources based on predicted and actual demand. With this comprehensive Clinically Driven Workforce Managementsuite of offerings, organizations are empowered to optimize existing resources while increasing patient throughput and managing employee satisfaction.
The ProCure™ Enterprise Supply Chain Management solutions focus on eliminating variation and clinical staff burden. By connecting materials ProCure™ Enterprise Supply Chain Management solutions focus on eliminating variation and clinical staff burden. By connecting materials ProCure™ Enterprise Supply Chain Managementmanagement processes with key clinical processes, the supply chain is established as a byproduct of care delivery.
Medical Transcription Management Solutions offer unprecedented levels of accuracy and effi ciency of transcribed documents by leveraging clinical data Medical Transcription Management Solutions offer unprecedented levels of accuracy and effi ciency of transcribed documents by leveraging clinical data Medical Transcription Management Solutionsto auto-create report content.
Clinical Systems
Points of Care
The INet® INet® INet Critical Care Management System is designed to automate the entire care process in critical care settings. It supports complete nursing Critical Care Management System is designed to automate the entire care process in critical care settings. It supports complete nursing Critical Care Management Systemdocumentation with automated capture of bedside monitor and device data. Physician workfl ow is automated with both documentation and fl ow sheet embedded Computerized Physician Order Entry (CPOE). Both nursing and physician workfl ows are enhanced with closed loop meds process and remote patient monitoring capabilities. Embedded knowledge augments patient safety with critical care specifi c nursing and physician documentation templates and alerts. Outcome analysis (with premier solutions like APACHE® APACHE® APACHE ) is also embedded in the critical care workfl ow.
The CareNet®CareNet®CareNet Acute Care Management System is designed to automate and streamline the work and care delivery processes for nursing and the entire Acute Care Management System is designed to automate and streamline the work and care delivery processes for nursing and the entire Acute Care Management Systemacute care team. It provides the framework for accessing patient data, directing clinicians to care activities that need to be completed and managing tasks. CareNet provides improved communication and the coordination of care as it connects each member of the care team to a unifi ed plan of care and CareNet provides improved communication and the coordination of care as it connects each member of the care team to a unifi ed plan of care and CareNetcommon system. Everyone involved in the care of a patient can view an up-to-date version of the care plan, allowing physicians and nurses to make the best decisions possible. The CareNet system also promotes patient safety through access to strong clinical decision support, evidence-based nursing and CareNet system also promotes patient safety through access to strong clinical decision support, evidence-based nursing and CareNetknowledge-based best practices, alerts and reminders, thereby reducing errors and variability in the care process.
The CVNet®CVNet®CVNet Cardiology Information System automates the processes within the cardiology department, supporting the scheduling, ordering, documentation Cardiology Information System automates the processes within the cardiology department, supporting the scheduling, ordering, documentation Cardiology Information Systemand data capture required by professionals in the cardiology domain.
22
The PowerChart Oncology Information System automates the clinical decision-making and complex communication needs of the medical oncology care Oncology Information System automates the clinical decision-making and complex communication needs of the medical oncology care Oncology Information Systemteam. This oncology solution provides the ability to share crucial patient information across both ambulatory and acute care for management of complex, multi-encounter chemotherapy protocols, improving communication and the real-time fl ow of patient information across the continuum of care.
The SurgiNet®SurgiNet®SurgiNet Surgery and Anesthesia Management System is designed to automate the needs of the entire perioperative environment, including Surgery and Anesthesia Management System is designed to automate the needs of the entire perioperative environment, including Surgery and Anesthesia Management Systemfunctions of professional staff and material resource scheduling, supply chain management, perioperative documentation, patient tracking, anesthesia documentation, and physiological monitoring at the bedside or in the operating room suite. The solution gives clinicians real-time access to clinical and historical patient data from past surgical events in addition to supporting planning for anesthesia care and surgical case preparation. The SurgiNet system SurgiNet system SurgiNetalso offers fi nancial and operational reporting tools to analyze and support continuous improvement in total perioperative workfl ow.
The Cerner Women’s Health Information System automates the care processes in women’s centers, OB/GYN offi ces, labor and delivery units and in newborn care areas in the hospital. This solution is designed to support the clinical workfl ow, information needs and specifi c challenges faced in women’s healthcare.
The FirstNet®FirstNet®FirstNet Emergency Department Information System provides a comprehensive solution to the challenges emergency departments face to streamline Emergency Department Information System provides a comprehensive solution to the challenges emergency departments face to streamline Emergency Department Information Systemprocess fl ows, comply with Health Insurance Portability and Accountability Act and Emergency Medical Treatment and Active Labor Act regulations, comply with CMS requirements and ensure appropriate reimbursement. The FirstNet system is an emergency department clinician and management tool FirstNet system is an emergency department clinician and management tool FirstNetfor quick and effective patient tracking, ordering, results and medical record review, online clinical documentation, prescription writing, patient education and evidence-based coding.
The PowerChart Offi ce®PowerChart Offi ce®PowerChart Offi ce Management System supports the broad range of clinical and business activities that occur within a physician offi ce, clinic or Management System supports the broad range of clinical and business activities that occur within a physician offi ce, clinic or Management Systemlarge physician organization. This system ties the physician offi ce together with other medical entities and automates key care team activities in both primary and specialty care settings.
Clinical Centers
The PathNet®PathNet®PathNet Laboratory Information System (LIS) addresses the clinical, fi nancial and managerial needs of a comprehensive laboratory setting with unifi ed solutions for: general laboratory, microbiology, blood bank transfusion, blood bank donor, anatomic pathology, human leukocyte antigen (HLA) and total outreach services. Innovative laboratory solutions such as patented Synoptic Reporting for Anatomic Pathology solution, the Synoptic Reporting for Anatomic Pathology solution, the Synoptic Reporting for Anatomic Pathology Gajema®Gajema®Gajema system for outreach client service, courier, fl eet and phlebotomy management, and the PathNet Helix™ solution for molecular diagnostic/genomics are just several PathNet Helix™ solution for molecular diagnostic/genomics are just several PathNet Helixexamples of how PathNet continues to set the bar in the LIS market. The PathNet continues to set the bar in the LIS market. The PathNet PathNet system automates laboratory processes while capturing crucial data for operational success and increased patient safety, ensuring the production of accurate and timely reports and the maintenance of accessible laboratory records.
The RadNet®RadNet®RadNet Radiology Information System addresses the operational and management requirements of radiology departments or services. It allows a Radiology Information System addresses the operational and management requirements of radiology departments or services. It allows a Radiology Information Systemdepartment to replace its manual, paper-based system of record-keeping with an effi cient computer-based system.
Cerner ProVision™ PACS (picture archival and communications system) is fully unifi ed with Cerner’s radiology information system to manage storage, viewing, reporting and distribution of images. Using Cerner’s end-to-end, fully unifi ed radiology information and image management systems, radiologists can improve operational effi ciencies and reduce medical error.
The MultiMedia Foundation™ integrates images, slides, photos, audio, video and waveforms, enabling a comprehensive EMR, enterprise-wide access to images and enhanced clinical decision support.
The PharmNet®PharmNet®PharmNet Pharmacy Information System is a powerful solution for transforming pharmacy and medication administration processes. The Pharmacy Information System is a powerful solution for transforming pharmacy and medication administration processes. The Pharmacy Information System PharmNet system facilitates improved patient safety and operational activities across the continuum of care. The PharmNet system puts patient safety fi rst and PharmNet system puts patient safety fi rst and PharmNetforemost in support of clinical pharmacy practice. It is a complete solution offering clinical decision support, formulary management and operational support, facilitating optimal utilization of pharmacy resources.
Decision Support and Knowledge
The Discern Expert®Discern Expert®Discern Expert solution is an event-driven, rules-based decision support software application that allows users to defi ne clinical and management rules that are applied to event data captured or generated by other applications. It supports both synchronous (real-time, interactive) processing and asynchronous (non-interactive) processing of events.
The Discern Explorer®Discern Explorer®Discern Explorer solution is a decision support software application unifi ed with other Cerner Millennium clinical and management information Cerner Millennium clinical and management information Cerner Millenniumsystems that allows users to execute predetermined or ad hoc queries and reports regarding process-related data that is generated by the other applications.
Executable Knowledge®Executable Knowledge®Executable Knowledge solutions help clinicians assess and treat illnesses and improve outcomes based on the most current medical knowledge. Knowledge is customized to the individual and embedded within the Cerner Millennium architecture via order sets, plans of care, alerts and notifi cations Cerner Millennium architecture via order sets, plans of care, alerts and notifi cations Cerner Millenniumincluding Adverse Drug Event (ADE) prevention alerts and clinical documentation. Reports measure compliance against key clinical standards to help organizations benchmark and enhance care quality.

23
MediSource™ solutions provide caregivers and consumers alike with access to drug information from MediSource™ solutions provide caregivers and consumers alike with access to drug information from MediSource™ Cerner Multum and the ability to perform drug Cerner Multum and the ability to perform drug Cerner Multuminteraction checking to prevent adverse events. Patient safety is enhanced through dose range checking capabilities that determine the appropriate medication dose based on the age, weight and physiology of an individual.
APACHE ®clinical decision support and outcomes management systems manage the clinical and fi nancial outcomes of high-risk patients in critical and acute care.
The PowerInsight ® solution is a comprehensive healthcare intelligence and data warehouse for healthcare. It enables clinical leadership and healthcare executives to collect, measure, analyze and benchmark data, thereby deriving insights to enable positive changes in clinical processes and operational performance.
The Health Facts®Health Facts®Health Facts repository is Cerner’s comparative data warehouse for benchmarking information and services for subscribers to support their own improvement processes.
Cerner Health Insights (CHI) provides clinical insight into pharmaceutical and biotech challenges. Cerner delves deeply into the realities of clinical practice, Cerner Health Insights (CHI) provides clinical insight into pharmaceutical and biotech challenges. Cerner delves deeply into the realities of clinical practice, Cerner Health Insightshelping its clients formulate business responses to outcomes and economic issues.
The HealthSentry™ bio-surveillance network collects critical biological information about potential disease outbreaks and analyzes data for specifi c HealthSentry™ bio-surveillance network collects critical biological information about potential disease outbreaks and analyzes data for specifi c HealthSentrypatterns or trends.
Consumer
Cerner’s IQHealth®IQHealth®IQHealth solution is dedicated to closing the healthcare information loop by delivering the right information to the right person at the right time, and often the right person is the patient. A care delivery organization has not truly closed the loop on healthcare information until they have placed the patient at the center of care. Cerner’s IQHealth solution creates an online dialogue between hospital, physician and patient. Using the Internet, patients IQHealth solution creates an online dialogue between hospital, physician and patient. Using the Internet, patients IQHealthcan maintain their personal health record, gain educational support and receive guidance in managing their health.
Cerner’s IQHealth solution empowers patients to become active members of their care team. By extending the clinical suite to include interaction with IQHealth solution empowers patients to become active members of their care team. By extending the clinical suite to include interaction with IQHealthpatients, healthcare providers can more effi ciently deliver care and enhance the satisfaction of the community. Cerner’s IQHealth solution includes the IQHealth solution includes the IQHealthconsumer Web framework, personal health record, physician and consumer messaging and disease-specifi c modules, as well as a patient medical record view and patient appointments module.
Packaged Solutions
Computerized Physician Order Entry (CPOE)
Cerner offers a total CPOE solution ranging from basic automation to complete medication integration.
CPOE enables automated physician ordering of medications, diagnostic tests and treatment plans. Orders are checked using decision-support tools to determine if they are in line with standards and appropriate for the person’s individual situation. Physicians are alerted to potential problems and prompted to consider alternatives. Actions are documented in the patient’s EMR.
Cerner’s CPOE solution facilitates safe and effi cient care across multiple care venues. It goes beyond automating the ordering process by embedding the latest clinical knowledge to provide effective decision support and guidance. The solution is seamlessly unifi ed with the EMR, pharmacy, medication administration, care documentation and ancillary systems to close the loop in the medication management process. By unifying care in this manner, Cerner CPOE helps clients address potential errors across the entire process.
Cerner’s CPOE solution includes a physician-centric ordering application (PowerOrders), a powerful decision-support engine with rules and alerts PowerOrders), a powerful decision-support engine with rules and alerts PowerOrders(Discern Expert and MediSource), and clinical documentation ( MediSource), and clinical documentation ( MediSource Care Documentation and more), all integrated within a robust clinical data repository Care Documentation and more), all integrated within a robust clinical data repository Care Documentation(PowerChart).PowerChart).PowerChart
PowerPOC
PowerPOC™ is a solution set of supporting, multisystem offerings that automate the documentation of medication administration and documentation of PowerPOC™ is a solution set of supporting, multisystem offerings that automate the documentation of medication administration and documentation of PowerPOCtasks related to specifi c physician/nursing orders at the point of care (POC). This solution set provides notifi cation to the clinician when inconsistencies occur that could represent potential medication administration errors.
This graduated solution set facilitates patient safety through barcode verifi cation of the “Five Rights” of data review and collection, as well as medical devices integration at the patient bedside. Solutions within the PowerPOC family include: PowerPOC family include: PowerPOC CareAdmin™; CareMobile™; and CareGuard™ solutions.CareGuard™ solutions.CareGuard
Homecare
Cerner BeyondNow provides innovative information technology solutions to the homecare industry. The HomeWorks®HomeWorks®HomeWorks solution is a complete offi ce-based homecare information management system targeting business needs in a quickly changing, fast paced environment. The HomeWorks solution manages HomeWorks solution manages HomeWorksdata from the point of the fi rst referral call to the point of the last service payment. The RoadNotes‚ solution enables users to extend complete patient information from point-of-care to the offi ce system. Caregivers have access to complete patient charts, profi les and histories – for the information needed to make informed decisions.
24
Physician Solutions
Cerner Physician Practice solutions offer high-end, leading technology software solutions to a wide variety of offi ce-based and hospital-based medical Cerner Physician Practice solutions offer high-end, leading technology software solutions to a wide variety of offi ce-based and hospital-based medical Cerner Physician Practicespecialties, as well as large physician networks and enterprises. This comprehensive physician practice suite enables general medicine and individual specialty practices to provide effi cient, high quality care while improving reimbursements and streamlining processes.
Rather than offering a one-size-fi ts-all “all-specialty” application, Cerner Physician Practice solutions offer many specialty-specifi c applications and Cerner Physician Practice solutions offer many specialty-specifi c applications and Cerner Physician Practiceservices. Specialty areas include anesthesiology, cardiology, ophthalmology, dermatology and podiatry.
Segment Solutions
Cerner also offers solutions designed for specifi c segments in the healthcare industry.
Cerner solutions for the Integrated Delivery Network allow organizations to serve multiple facilities, with differing needs, across various geographic locations.
Community Hospital Solutions automate clinical and business processes in the community hospital. Community Hospital Solutions automate clinical and business processes in the community hospital. Community Hospital Solutions Community Hospital Solutions suites include Community Hospital Solutions suites include Community Hospital Solutionsadministrative, clinical, patient care, hospital integration and community.
Cerner solutions for the Children’s Hospital setting specifi cally address those issues unique to the pediatric hospital setting. Cerner solutions include content and functionality specifi c to meeting the unique needs of children’s hospitals, including dose range checking, weight-based dose calculation, growth charts and immunization schedules.
Cerner solutions for Academic Medical Centers allow medical centers to focus on delivering high-quality care and carry out high-level teaching and research functions. Cerner’s unifi ed architecture also enhances research efforts by allowing access to information via a centralized database.
The Cerner Academic Education Solution is the only clinical information system adapted to support automated curricula and classroom instruction in Cerner Academic Education Solution is the only clinical information system adapted to support automated curricula and classroom instruction in Cerner Academic Education Solutionnursing, medical and allied health schools, preparing future healthcare professionals for success in an IT-driven environment.
Technologies
The MillenniumObjects®MillenniumObjects®MillenniumObjects toolkit is a collection of reusable programming elements from the revolutionary Cerner Millennium architecture. These segments Cerner Millennium architecture. These segments Cerner Millenniumof code, or objects, allow third-party developers to create front-end applications that draw upon the data model and proven functionality of the Cerner Millennium architecture.Millennium architecture.Millennium
The Open Engine Application Gateway™Open Engine Application Gateway™Open Engine Application Gateway System facilitates the exchange of data and assists in the management of interfaces between foreign systems System facilitates the exchange of data and assists in the management of interfaces between foreign systems Systemin a network environment. It serves as a solution kit to help write interface code.
The Open Port Interface™ System represents Cerner’s standardized technology for providing reliable foreign system, medical device and other System represents Cerner’s standardized technology for providing reliable foreign system, medical device and other Systemstandard interfaces in a timely manner. Message translation and data mapping are done with point-and-click solutions and a scripting environment. Communications protocols are confi gured via table-driven parameters. These sophisticated methodologies result in decreased implementation times and greater client satisfaction.
Software Development
Cerner commits signifi cant resources to developing new health information system solutions. As of January 1, 2005, approximately 1,752 associates were engaged full-time in software solutions development activities. Total expenditures for the development and enhancement of the Company’s software solutions were approximately $188,264,000, $179,999,000 and $149,985,000 during the 2004, 2003 and 2002 fi scal years, respectively. These fi gures include both capitalized and non-capitalized portions and exclude amounts amortized for fi nancial reporting purposes.
The Company expects to continue investment and development efforts for its current and future solution offerings. As new clinical and management information needs emerge, Cerner intends to enhance its current software solutions lines with new versions released to clients on a periodic basis. In addition, Cerner plans to: expand its current software solution lines by developing additional information systems for clinical, fi nancial, operational and/or consumer use; continue to support simultaneous use of Cerner’s solutions across multiple facilities; and continue to expand in the global marketplace.
The Company is committed to maintaining open attributes in its system architecture to achieve operability in a diverse set of technical and application environments. The Company strives to design its systems to co-exist with disparate applications developed and supported by other suppliers. This effort is exemplifi ed by Cerner’s Open Engine Application Gateway, Open Engine Application Gateway, Open Engine Application Gateway Open Port Interface and MillenniumObjects solutions lines. MillenniumObjects solutions lines. MillenniumObjects
Sales and Marketing
The markets for Cerner’s HIT solutions include integrated delivery networks, physician groups and networks and their managed service organizations, managed care organizations, hospitals, medical centers, free-standing reference laboratories, home health agencies, blood banks, imaging centers, pharmacies, pharmaceutical manufacturers, employer coalitions and public health organizations. To date, a substantial portion of system sales has been in clinical solutions in hospital-based provider organizations. The Cerner Millennium architecture is highly scalable, with solutions being used in hospitals Cerner Millennium architecture is highly scalable, with solutions being used in hospitals Cerner Millenniumranging from fewer than 50 beds to more than 2,000 beds and managed care settings with more than 2,000,000 members. All Cerner Millenniumsolutions are designed to operate on HP or IBM platforms, thereby allowing Cerner to be price competitive across the full size and organizational structure

25
range of healthcare providers. The sale of a health information system usually takes approximately nine to 18 months, from the time of initial contact to the signing of a contract.
The Company’s executive marketing management is located in its North Kansas City, Missouri, headquarters, while its client representatives are deployed across the United States and globally. In addition to the United States, the Company, through subsidiaries and joint ventures, has sales staff and/or offi ces in Argentina, Australia, Belgium, Canada, Chile, France, Germany, India, Singapore, Malaysia, Spain, the United Kingdom and the United Arab Emirates. Cerner’s consolidated revenues include foreign sales of $64,333,000, $54,191,000 and $36,634,000 for the 2004, 2003 and 2002 fi scal years, respectively.
The Company supports its sales force with technical personnel who perform demonstrations of Cerner solutions and assist clients in determining the proper hardware and software confi gurations. The Company’s primary direct marketing strategy is to generate sales contacts from its existing client base and through presentations at industry seminars and tradeshows. Cerner attends a number of major tradeshows each year and sponsors executive user conferences, which feature industry experts who address the HIT needs of large healthcare organizations.
Client Services
Signifi cantly all of Cerner’s clients enter into software maintenance agreements with Cerner for support of their Cerner systems. In addition to immediate software support in the event of problems, these agreements allow clients the use of new releases of the Cerner solutions covered by maintenance Cerner solutions covered by maintenance Cerneragreements. Each client has 24-hour access to the client support staff located at Cerner’s world headquarters in North Kansas City, Missouri and the Company’s global support organization in the United Kingdom. Most of Cerner’s clients also enter into hardware maintenance agreements with Cerner. These arrangements normally provide for a fi xed monthly fee for specifi ed services. In the majority of cases, Cerner subcontracts hardware maintenance to the hardware manufacturer. Cerner also offers a set of managed services that include remote hosting, application management services and disaster recovery.
Backlog
At January 1, 2005, Cerner had a contract backlog of approximately $1,191,170,000 as compared to approximately $938,221,000 at January 3, 2004. Such backlog represents system sales from signed contracts, which had not yet been recognized as revenue. The Company recognizes revenue on a percent of completion basis, based on certain milestone conditions, for its software solutions. At January 1, 2005, the Company had approximately $96,909,000 of contracts receivable, which represents revenues recognized under the percentage of completion method but not yet billable under the terms of the contract. At January 1, 2005, Cerner had a software support and maintenance backlog of approximately $347,662,000 as compared to approximately $312,887,000 at January 3, 2004. Such backlog represents contracted software support and hardware maintenance services for a period of twelve months. The Company estimates that approximately 44 percent of the aggregate backlog at January 1, 2005 of $1,538,832,000 will be recognized as revenue during 2005.
Competition
The Company faces a highly competitive environment in the HIT market. The market for HIT solutions and services is intensely competitive, rapidly evolving and subject to rapid technological change. The Company’s principal existing competitors include Eclipsys Corporation, Epic Systems Corporation, GE Medical Systems, IDX Systems Corporation, iSoft Corporation, McKesson Corporation, Medical Information Technology, Inc. (“Meditech”), Misys Healthcare Systems and Siemens Medical Solutions Health Services Corporation, each of which offers a suite of software solutions and services that compete with many of the Company’s software solutions and services. There are other competitors that offer a more limited number of competing software solutions and services. In addition, the Company expects that major software information systems companies, large information technology consulting service providers and system integrators, Internet-based start-up companies and others specializing in the healthcare industry may offer competitive software/solutions or services. The pace of change in the HIT systems market is rapid and there are frequent new software solution introductions, software solution enhancements and evolving industry standards and requirements. The Company believes that the principal competitive factors in this market include the breadth and quality of system and software solution offerings, the stability of the information systems provider, the features and capabilities of the information systems, the ongoing support for the system and the potential for enhancements and future compatible software solutions.
Other Factors Affecting The Company’s Business
Information under the caption “Factors That May Affect Future Results of Operations, Financial Condition of Business” included in “Management’s Discussion and Analysis of Financial Condition and Results of Operations” in Item 7 is incorporated herein by reference. Such information includes a discussion of various factors that could, among other things, affect the Company’s business in the future, including: (a) variations in the Company’s quarterly operating results; (b) volatility of the Company’s stock price; (c) changes in the healthcare industry; (d) signifi cant competition; (e) the Company’s proprietary technology may be subjected to infringement claims or may be infringed upon; (f) government regulation; (g) the possibility of product-related liabilities; (h) possible failures or defects in the performance of the Company’s software; (i) risks associated with the Company’s global operations; (j) recruitment and retention of key personnel; (k) risks related to doing business with third party suppliers; and, (l) the potential inconsistencies in sales forecasts compared to actual sales.
26
Number of Employees (“Associates”)
As of January 1, 2005, the Company employed 5,345 associates worldwide.
Item 2. PropertiesThe Company’s world headquarters offi ces are located in a Company-owned offi ce park in North Kansas City, Missouri, containing approximately 739,000 square feet of useable space (the “Campus”), inclusive of the new buildings described below. As of January 1, 2005, the Company was using approximately 736,000 square feet and substantially all of the remainder was leased to tenants. In 2004, the Company purchased approximately 12 acres of unimproved real estate adjacent to the Cerner World Headquarters for campus expansion. An access road has been built to the property; plans are underway for further development. In November 2004, the Company entered into a lease for approximately 127,000 rentable square feet of property located at 3315 North Oak Traffi cway in Kansas City, Missouri. The offi ce space, known as the Cerner Oaks Campus, will initially house associates from the Cerner Managed Services and Cerner Technologies groups. The lease contains an option to purchase the building at fair value. In the fi rst quarter of 2002, the Company began construction of a new facility situated between the buildings located at 2800 and 2900 Rockcreek Parkway on the Campus. This facility was completed on August 1, 2003 and is approximately 123,000 gross square feet in size. This new facility, referred to as Cerner’s World Headquarters Building, houses offi ces, a cafeteria and meeting space for the Company. In 2002, the Company also began construction of a new offi ce building located on the Campus. This facility, approximately 200,000 gross square feet in size, was completed in December 2003 and houses offi ce and meeting space for the Company.
The Company also owns property located along the north riverbank of the Missouri River, approximately 2 miles from the Company’s Campus. This property consists of an 80,000 square foot building and a 1,300-car parking garage. The building has been renovated for use as a corporate training, meeting and event center for the Company and third parties. The Company has also made use of the parking garage to meet overfl ow-parking demands on the Company’s Campus.
As of March 2005, the Company also leased offi ce space in: Birmingham, Alabama; Beverly Hills, California; Denver, Colorado; Alpharetta, Georgia; Overland Park, Kansas; Waltham, Massachusetts; Bel Air, Maryland; Minneapolis, Minnesota; Rochester, Minnesota; Kansas City, Missouri; Charlotte, North Carolina; Beaverton, Oregon; Houston, Texas; and Vienna, Virginia. The Company operates its primary solutions center (or data center) in leased space in Lee’s Summit, Missouri. Globally, the Company also leases offi ce space in: Sydney, Australia; Brussels, Belgium; Santiago, Chile; London-Ontario, Canada; London, England; Paris, France; Aachen and Idstein, Germany; Bangalore, India; Kuala Lumpur, Malaysia; and Barcelona, Spain. In 2004, the Company’s Detroit, Michigan, and St. Louis, Missouri, offi ces were closed as the Company relocated many associates to its World Headquarters Campus.
Item 3. Legal ProceedingsAs previously disclosed, the Company received notice in April 2003 that three shareholder class action lawsuits were fi led against it and fi ve of its offi cers in the United States District Court for the Western District of Missouri. Subsequently, fi ve additional shareholder class action lawsuits were fi led against the Company. All of these lawsuits were fi led after a decline in the Company’s stock price following the Company’s announcement on April 3, 2003 that the Company would not meet revenue and earnings estimates for the fi rst quarter of 2003.
On August 20, 2003, the Court ordered that all of the lawsuits be consolidated under Case No. 03-CV-00296-DW and appointed Phil Crabtree as Lead Plaintiff. On December 1, 2003, the Lead Plaintiff fi led a Consolidated Class Action Complaint. In general, the consolidated complaint alleges that, during a class period commencing as of July 17, 2002 and ending April 2, 2003, the Company and individually named defendants misrepresented or failed to disclose certain factors, which they allege impacted the Company’s business and anticipated revenue and earnings, all allegedly in violation of Sections 10(b) and 20(a) of the Securities Exchange Act of 1934 and Rule 10b-5 thereunder.
On June 16, 2004, the Court granted the Company’s and the individual defendants’ Motion to Dismiss and ordered the Consolidated Class Action Complaint dismissed with prejudice against re-fi ling. On June 30, 2004, the Lead Plaintiff appealed the District Court’s dismissal of the action to the United States Court of Appeals for the Eighth Circuit. The parties fi led their appellate briefs and the issues were argued before the Eighth Circuit on January 13, 2005. The matter is now submitted to the Eighth Circuit for decision but the Company does not know when the Court of Appeals will rule on the appeal.
The Company believes that the District Court was correct in dismissing the consolidated complaint and that all the claims asserted in that complaint are without merit. In the event that the Court of Appeals reverses the District Court’s dismissal, the Company intends to continue with its vigorous defense of those claims.
Item 4. Submission of Matters to a Vote of Security HoldersNo matters were submitted to a vote of the shareholders of the Company during the fourth quarter of the fi scal year ended January 1, 2005.

27
Item 4A. Executive Offi cers of the CompanyThe following table sets forth the names, ages, positions and certain other information regarding the Company’s executive offi cers as of March 9, 2005. Offi cers are elected annually and serve at the discretion of the Board of Directors.
Name Age Positions
Neal L. Patterson 55 Chairman of the Board of Directors and Chief Executive Offi cer
Clifford W. Illig 54 Vice Chairman of the Board of Directors
Earl H. Devanny, III 53 President
Paul M. Black 46 Executive Vice President and Chief Operating Offi cer
Douglas M. Krebs 47 Senior Vice President Cerner and General Manager of Cerner Europe, Middle East and Asia Pacifi c Organization
Marc G. Naughton 50 Senior Vice President and Chief Financial Offi cer
Jeffrey A. Townsend 41 Senior Vice President
Mike Valentine 36 Senior Vice President and General Manager of U.S. Client Organization
Randy D. Sims 44 Vice President, Chief Legal Offi cer and Secretary
Shellee K. Spring 39 Vice President, Intellectual Property
Julia M. Wilson 42 Vice President and Chief People Offi cer
Neal L. Patterson has been Chairman of the Board of Directors and Chief Executive Offi cer of the Company for more than fi ve years. Mr. Patterson also served as President of the Company from March of 1999 until August of 1999.
Clifford W. Illig has been a Director of the Company for more than fi ve years. He also served as Chief Operating Offi cer of the Company for more than fi ve years until October 1998 and as President of the Company for more than fi ve years until March of 1999. Mr. Illig was appointed Vice Chairman of the Board of Directors in March of 1999.
Earl H. Devanny, III joined the Company in August of 1999 as President. Mr. Devanny also served as interim President of Cerner Southeast from January 2003 through July 2003. Prior to joining the Company, Mr. Devanny served as president of ADAC Healthcare Information Systems, Inc. Prior to joining ADAC, Mr. Devanny served as a Vice President of the Company from 1994 to 1997. Prior to that he spent seventeen years with IBM Corporation.
Paul M. Black joined the Company in March of 1994 as a Regional Vice President. He was promoted in June 1998 to Senior Vice President and Chief Sales Offi cer and to Executive Vice President in September of 2000. In January of 2003 Mr. Black was named Executive Vice President of the U.S. Client Organization. In February of 2005 Mr. Black was named Chief Operating Offi cer. Prior to joining the Company, he spent twelve years with IBM Corporation.
Douglas M. Krebs joined the Company in June 1994 as a Regional Vice President. He was promoted to Senior Vice President and Area Manager in April 1999. In February 2000, Mr. Krebs was appointed as President of Cerner Global. Prior to joining Cerner, he spent fi fteen years with IBM Corporation.
Marc G. Naughton joined the Company in November 1992 as Manager of Taxes. In November 1995 he was named Chief Financial Offi cer and in February 1996 he was promoted to Vice President. He was promoted to Senior Vice President in March 2002.
Jeffrey A. Townsend joined the Company in June 1985. Since that time he has held several positions in the Intellectual Property Organization and was promoted to Vice President in February 1997. He was appointed Chief Engineering Offi cer in March 1998. He was promoted to Senior Vice President in March 2001.
Mike Valentine joined the Company in December 1998 as Director of Technology. He was promoted to Vice President in 2000 and to President of Cerner Mid America in January of 2003. In February 2005, he was named General Manager of the U.S. Client Organization and was promoted to Senior Vice President in March 2005. Prior to joining the Company, Mr. Valentine was with Accenture Consulting.
Randy D. Sims joined the Company in March 1997 as Vice President and Chief Legal Offi cer. Prior to joining the Company, Mr. Sims worked at Farmland Industries, Inc. for three years where he served most recently as Associate General Counsel. Prior to Farmland, Mr. Sims was in-house legal counsel at The Marley Company for seven years, holding the position of Assistant General Counsel when he left to join Farmland.
Shellee K. Spring joined the Company in September 1989 as a systems engineer. Since that time, she has held several positions throughout the Company including positions in the Consulting, Sales and Intellectual Property Organizations. She was promoted to Vice President in March 1999.
Julia M. Wilson joined the Company in November 1995. Since that time, she has held several positions in the Functional Group organization. She was promoted to Vice President and to the position of Chief People Offi cer in August 2003.

28
PART IIItem 5. Market for the Registrant’s Common Stock and Related Security Holder MattersThe Company’s common stock trades on The NASDAQ Stock Market® under the symbol CERN. The following table sets forth the high, low and last sales prices for the fi scal quarters of 2004 and 2003 as reported by The NASDAQ National Market System. These quotations represent prices between dealers and do not include retail mark-up, mark-down or commissions, and do not necessarily represent actual transactions.
2004 2003 HighHigh Low Last HighHigh Low Last First quarter 47.63 37.36 44.81 38.45 30.22 32.81 Second quarter 47.25 39.89 42.74 32.38 16.50 23.25 Third quarter 46.94 41.37 44.61 37.55 20.08 31.42 Fourth quarter 53.59 43.98 53.17 46.12 30.87 38.51
At January 31, 2005, there were approximately 1,600 owners of record. To date, the Company has paid no dividends and it does not intend to pay dividends in the foreseeable future. Management believes it is in the shareholders’ best interest to reinvest funds in the operation of the business.
Item 6. Selected Financial Data
2004 2003 2002 2001 2000 (1)(2) (3)(4)(5) (6)(7) (8)(9) (10)(11)(12) (In thousands, except per share data)
Statements of Earnings Data:
Revenues $ 926,356 839,587 780,262 560,802 414,551
Operating earnings 111,464 78,097 90,820 61,350 21,922
Earnings (loss) before income taxes and cumulative effect
of a change in accounting principle 107,920 71,222 80,625 (63,314) 172,123
Cumulative effect of a change in accounting for goodwill,
net of $486 income tax benefi t - - (786) - -
Net earnings (loss) 64,648 42,791 48,022 (42,366) 105,265
Earnings (loss) per share:
Basic 1.79 1.21 1.36 (1.21) 3.08
Diluted 1.72 1.18 1.30 (1.21) 2.96
Weighted average shares outstanding:
Basic 36,087 35,355 35,458 34,907 34,123
Diluted 37,571 36,356 37,050 34,907 35,603
Balance Sheet Data:
Working capital $ 310,229 246,412 282,135 189,488 186,181
Total assets 982,265 854,252 779,279 712,302 616,411
Long-term debt, net 108,804 124,570 136,636 92,132 102,299
Shareholders’ equity 597,485 494,680 441,244 394,839 343,717

29
(1) Includes a gain on the sale of Zynx Health Incorporated. The impact of this gain is a $1.8 million increase, net of $1.2 million tax expense, in net earnings and increase to diluted earnings per share of $.05 for 2004.
(2) Includes a charge for vacation accrual of $3.3 million included in general and administrative. The impact of this charge is a $2.1 million decrease, net of $1.2 million tax benefi t, in net earnings and a decrease to diluted earnings per share of $.06 for 2004.
(3) Includes a gain on the sale of shares of WebMD common stock. The impact of this gain is a $3.3 million, net of $1.9 million tax expense, increase in net earnings and an increase to diluted earnings per share of $.09 for 2002.
(4) Includes a charge for impairment of investments. The impact of this charge is a $6.3 million, net of $3.6 million tax benefi t, decrease in net earnings and a decrease to diluted earnings per share of $.17 for 2002.
(5) Includes the cumulative effect of a change in accounting for goodwill. The impact of this change is a $.8 million, net of $.5 million tax benefi t, decrease in net earnings and a decrease to diluted earnings per share of $.02 for 2002.
(6) Includes a gain on the settlement of the WebMD performance warrants. The impact of this gain is a $4.8 million, net of $2.7 million tax expense, increase in net earnings and an increase to diluted earnings per share of $.13 for 2001.
(7) Includes a charge on the adjustment of the carrying value of the WebMD shares. The impact of this charge is an $81.4 million, net of $46.1 million tax benefi t, decrease in net earnings and a decrease to diluted earnings per share of $2.21 for 2001.
(8) Includes an investment gain of $120.4 million, net of $68.3 million tax expense, related to the conversion of shares of CareInsite common stock to shares of WebMD common stock. The impact of this investment gain was to increase diluted earnings per share by $3.38 for 2000.
(9) Includes an investment loss of $24.5 million, net of $13.9 million tax benefi t, related to the sale of shares of WebMD common stock. The impact of this investment loss was to decrease diluted earnings per share by $.69 for 2000.
(10) Includes a charge of $6.7 million related to the write-down of intangible assets associated with the acquisition of Health Network Ventures, Inc. The impact of this charge was to decrease diluted earnings per share by $.19 for 2000.
(11) Includes a charge of $3.2 million related to the acquisition of CITATION Computer Systems, Inc. The impact of this charge on diluted earnings per share was ($.09) for 2000.
(12) Includes a charge of $1.0 million, net of $.7 million tax benefi t, related to the acquisition of ADAC Healthcare Information Systems, Inc. The impact of this charge was to decrease diluted earnings per share by $.03 for 2000.
Item 7. Management’s Discussion and Analysis of Financial Condition and Results of OperationsIntroduction
Cerner Corporation (“Cerner” or the “Company”) is headquartered in North Kansas City, Missouri. Cerner derives revenue by selling, implementing and supporting software solutions and hardware that gives healthcare providers secure access to clinical, administrative and fi nancial data in real time, allowing them to improve the quality, safety and effi ciency in the delivery of healthcare. Cerner implements these solutions as stand-alone, combined or enterprise-wide systems. Cerner solutions can be managed by the Company’s clients or in Cerner’s data center via a managed services model.
Results Overview
The Company delivered strong results in 2004. Total new business bookings, which refl ect the value of contracts for software, hardware, services and managed services (hosting of software in the Company’s data center), were $917,367,000 in 2004, an increase of 13% compared to $811,258,000 in 2003.
Total revenues for 2004 were $926,356,000, an increase of 10% compared to 2003. The revenue composition was $351,861,000 in system sales, $241,439,000 in support and maintenance, $300,975,000 in services and $32,081,000 in reimbursed travel. Systems sales revenue, which includes licensed software, sub-licensed software, hardware, and subscriptions, grew 6% in 2004. Services revenue, which includes managed services, grew 13% for the year. Support and maintenance revenue grew 15% for the year.
The Company’s solid bookings drove a 27% year-over-year increase in contract backlog, which refl ects new business bookings that have not yet been recognized as revenue, and ended the year at $1,191,170,000. Backlog grew faster than revenue again in 2004 as the Company continued to experience strong growth in managed services and subscription bookings, which are recognized as revenue over a longer period of time than other types of bookings, such as software and hardware. Collectively, managed services and subscription bookings accounted for about 24% of total bookings margin in 2004 compared to approximately 20% in 2003 and 15% in 2002. This continued shift in mix provides greater visibility of revenue going into 2005 and beyond.
The strong growth in managed services bookings contributed to a decline in hardware bookings and hardware revenue in 2004 as clients electing managed services do not need to make the upfront hardware purchase that they would make in a transaction that does not include managed services. As a result, hardware revenue declined 18% in 2004 compared to 2003. Licensed software revenue grew at a strong rate of 14% in 2004, but this growth was partially offset by the decline in hardware revenue, resulting in lower system sales growth of 6% for 2004. Despite the near-term impact on system sales, the Company views this mix shift favorably because the higher level of managed services bookings improves the visibility of future revenue streams.

30
Net earnings increased from $42,791,000 in 2003 to $64,648,000 in 2004. Included in 2004 results are an adjustment in the third quarter of 2004 related to a prior period vacation pay accrual (see Note 14 to consolidated fi nancial statements) that reduced net earnings by $2,076,000, net of $1,270,000 of tax, and a gain on the sale of Zynx Health Incorporated in the fi rst quarter of 2004 that increased net earnings by $1,826,000, net of $1,197,000 of tax. Excluding these two items, 2004 net earnings would have been $250,000 higher, or $64,898,000.
The increase in net earnings was driven by revenue growth and margin expansion. Operating margins were 12.0% (12.4% prior to the vacation accrual adjustment) for 2004 compared to 9.3% in 2003. Going forward, management believes the Company can continue to increase operating margins by expanding margins on services, leveraging investments in research and development, and controlling sales, general and administrative spending.
The Company’s operational performance was also very strong in 2004. The Company brought a record 1,079 Cerner Millennium solutions live in 2004, bringing the cumulative number of solutions implemented to more than 3,700 at nearly 750 client facilities. These results included signifi cant progress at implementing computerized physician order entry (CPOE), which is the application generating the highest level of industry attention.
The Company’s strong operational performance is also refl ected in its cash fl ow results. In 2004, the Company generated $168,304,000 of cash fl ow from operations, compared to $134,150,000 in 2003. Free cash fl ow, defi ned as operating cash fl ow less capital expenditures and capitalized software, was $52,902,000 in 2004 compared to ($8,169,000) in 2003.
Healthcare Information Technology Market
The Company believes the market for healthcare information technology remains strong. The healthcare information technology industry, and Cerner specifi cally, continues to benefi t from the focus healthcare providers have placed on using technology to drive major patient safety and quality initiatives into their organizations with the ultimate goal of becoming completely digital or paperless. In addition, the Company continues to benefi t from its clients’ increased desire to have a common architecture spanning clinical, management and fi nancial solutions.
In many ways, the Company believes 2004 was a defi ning year for the healthcare information technology industry. President Bush began the year by proclaiming in his State of the Union Address that we can avoid dangerous medical mistakes, reduce costs and improve care by computerizing health records. The President also established a goal for every American to have a personal health record within the next 10 years, and he reaffi rmed that goal in his 2005 State of the Union Address. In the spring of 2004, the President created a sub-cabinet position at the Department of Health and Human Services (HHS) to spearhead this effort. In the summer of 2004, Senator Hillary Clinton and Majority Leader Bill Frist took to the pages of the Washington Post to opine in bipartisan fashion that information technology is central to solving the healthcare crisis. And as the Democratic and Republican parties laid out their agendas in January of 2005 for the 109th Congress, both signaled a strong commitment to healthcare information technology.
Finally, 2004 saw more widespread adoption of pay-for-performance compensation systems for both hospitals and physician offi ces. Employers such as General Motors, Delta Airlines, UPS, Verizon, General Electric, and Boeing led the way both at the company level and through The Leapfrog Group’s standards. And in February of 2005, the Center for Medicare and Medicaid Services (CMS) announced the fi rst ever Medicare pay-for-performance initiative for doctors.
In summary, 2004 was an exciting year of increased focus on healthcare information technology. Although no assurances can be provided, management believes, and recent events suggest, that this momentum could continue.
Results of Operations
Year Ended January 1, 2005, Compared to Year Ended January 3, 2004
The Company’s revenues increased 10% to $926,356,000 in 2004 from $839,587,000 in 2003. The Company had net earnings of $64,648,000 in 2004 compared to $42,791,000 in 2003. Included in 2004 net earnings are an adjustment in the third quarter of 2004 related to a prior period vacation pay accrual that reduced net earnings by $2,076,000, net of $1,270,000 of tax, and a gain on the sale of Zynx Health Incorporated, in the fi rst quarter of 2004 that increased net earnings by $1,826,000, net of $1,197,000 of tax. Excluding these two items, 2004 net earnings would have been $250,000 higher, or $64,898,000.
Revenues - In 2004, revenues increased due to an increase in system sales, support of installed systems and an increase in services. Support, maintenance and service revenues increased 14% to $542,414,000 in 2004 from $476,795,000 in 2003. Support and maintenance revenues were $241,439,000 and $209,876,000 in 2004 and 2003, respectively. Services revenues were $300,975,000 and $266,918,000 in 2004 and 2003, respectively. Included in support, maintenance and service revenues are support and maintenance of software and hardware, managed services and professional services, excluding installation. The increase in support and maintenance revenue was due primarily to the increase in the Company’s installed and converted client base, that was driven by bringing a record number of Cerner Millennium solutions live in 2003 and 2004. The increase in services revenue was driven by increased professional services billable hours and a strong increase in managed services.
System sales increased 6% to $351,861,000 in 2004 from $332,349,000 in 2003. Included in system sales are revenues from the sale of software, hardware and sublicensed software. This increase is due primarily to an increase in license software sales that was partially offset by declines in hardware sales.
At January 1, 2005, the Company had $1,191,170,000 in contract backlog and $347,662,000 in support and maintenance backlog, compared to $938,221,000 in contract backlog and $312,887,000 in support and maintenance backlog at the end of 2003.

31
Cost of Revenues - The cost of revenues includes the cost of reimbursed travel expense, third party consulting services and subscription content, computer hardware and sublicensed software purchased from computer and software manufacturers for delivery to clients. It also includes the cost of hardware maintenance and sublicensed software support subcontracted to the manufacturers. The cost of revenues was 21% of total revenues in 2004, and 23% of total revenues in 2003. Such costs, as a percent of revenues, typically have varied as the mix of revenue (software, hardware, services and support) components carrying different margin rates changes from period to period. The decrease in the cost of revenue as a percent of total revenues resulted principally from a decrease in the percent of revenue from computer hardware and sublicensed software, which carry a higher cost of revenue percentage. The Company believes this trend could continue because of strong demand for its managed service offering, which results in lower hardware sales because the client does not purchase hardware when it chooses this offering.
Sales and Client Service - Sales and client service expenses include salaries of client service personnel, communications expenses and unreimbursed travel expenses. Also included are sales and marketing salaries, travel expenses, tradeshow costs and advertising costs. These expenses as a percent of total revenues were 41% and 42% in 2004 and 2003, respectively. The increase in total sales and client service expenses to $383,628,000 in 2004 from $352,728,000 in 2003 is primarily due to an increase in personnel and personnel related expenses. The decrease in this spending as a percent of total revenue refl ects the Company’s ability to get better utilization of its resources and leverage this spending over a larger revenue stream.
Software Development - Software development expenses include salaries, documentation and other direct expenses incurred in software development and amortization of software development costs. Total expenditures for software development, including both capitalized and noncapitalized portions, for 2004 and 2003 were $188,264,000 and $179,999,000, respectively. These amounts exclude amortization. Capitalized software costs were $58,912,000 and $58,736,000 for 2004 and 2003, respectively. The increase in aggregate expenditures in software development in 2004 is due to continued development of Cerner Millennium solutions.Cerner Millennium solutions.Cerner Millennium
General and Administrative - General and administrative expenses include salaries for corporate, fi nancial and administrative staffs, utilities, communications expenses and professional fees. These expenses as a percent of total revenues were 7% in both 2004 and 2003. Total general and administrative expenses were $63,327,000 and $58,236,000 for 2004 and 2003, respectively. General and administrative expenses for 2004 include a prior period adjustment to increase vacation pay accrual of $3,346,000. Excluding the adjustment to increase vacation pay accrual, general and administrative expenses as a percent of revenues were 6% in 2004.
Interest Expense, Net - Interest income was $3,022,000 in 2004 compared to $1,219,000 in 2003. This increase is due primarily to higher interest rates, and a higher cash balance fed by cash collections. Interest expense was $9,174,000 in 2004 compared to $8,236,000 in 2003.
Other Income, Net - Other income increased from $142,000 in 2003 to $2,608,000 in 2004. This increase is due primarily to a gain on the sale of Zynx Health Incorporated. Also included in other income are revenues from offi ce space leased to third parties.
Operations by Segment
In 2003, the Company organized geographically. The Company’s six geographic business segments are: Great Lakes, Mid-America, North Atlantic, Southeast, West and Global. Revenues are derived primarily from the sale of clinical, fi nancial and administrative information systems and solutions. The cost of revenues includes the cost of third party consulting services, computer hardware and sublicensed software purchased from computer and software manufacturers for delivery to clients. It also includes the cost of hardware maintenance and sublicensed software support subcontracted to the manufacturers. Operating expenses incurred by the geographic business segments consist of sales and client service expenses including salaries of sales and client service personnel, communications expenses and unreimbursed travel expenses. Performance of the segments is assessed at the operating earnings level and, therefore, the segment operations have been presented as such. “Other” includes revenues not generated by the operating segments and expenses such as software development, marketing, general and administrative and depreciation that have not been allocated to the operating segments. The Company does not track assets by geographical business segment.

32
The following table presents a summary of the operating information for 2004 and 2003 (in thousands):
Operating Segments
Great Mid- North South- 2004 Lakes America Atlantic east West Global Other Total
Revenues $ 157,627 $ 201,570 $ 179,520 $ 148,186 $ 150,694 $ 64,333 $ 24,426 $ 926,356
Cost of revenues 29,805 32,588 41,050 35,487 28,577 8,938 19,903 196,348
Operating expenses 27,689 31,618 30,487 33,267 33,827 38,411 423,245 618,544
Total costs and expenses 57,494 64,206 71,537 68,754 62,404 47,349 443,148 814,892
Operating earnings $ 100,133 $ 137,364 $ 107,983 $ 79,432 $ 88,290 $ 16,984 $ (418,722) $ 111,464
Operating Segments
Great Mid- North South- 2003 Lakes America Atlantic east West Global Other Total Revenues $ 153,949 $ 160,633 $ 149,585 $ 145,312 $ 161,840 $ 54,191 $ 14,077 $ 839,587
Cost of revenues 36,910 35,447 37,520 40,784 28,321 13,450 1,858 194,290
Operating expenses 24,897 24,815 26,788 29,454 28,223 35,814 397,209 567,200
Total costs and expenses 61,807 60,262 64,308 70,238 56,544 49,264 399,067 761,490
Operating earnings $ 92,142 $ 100,371 $ 85,277 $ 75,074 $ 105,296 $ 4,927 $ (384,990) $ 78,097
Operating earnings in the Great Lakes segment increased 9% for the year ended January 1, 2005, compared to the year ended January 3, 2004. Total revenues increased 2% in 2004 compared to 2003. The increase in total revenues is due primarily to strong increases in licensed software and support revenues that were largely offset by a decrease in hardware and professional services revenues in 2004 compared to 2003. Costs of revenues were 19% and 24% of total revenues of the Great Lakes segment for 2004 and 2003, respectively. The decrease in the cost of revenues as a percent of revenue is due primarily to lower hardware sales in 2004 as compared to 2003. Costs of revenues, as a percent of revenues, typically have varied as the mix of revenue (software, hardware, maintenance, support, services and reimbursed travel) components carrying different margin rates changes from period to period.
Operating earnings in the Mid-America segment increased 37% for the year ended January 1, 2005, compared to the year ended January 3, 2004. Total revenues increased 25% in 2004 compared to 2003. The increase in total revenues is due primarily to a strong increase in licensed software and professional services revenues in 2004 compared to 2003. Costs of revenues were 16% and 22% of total Mid-America segment revenues for 2004 and 2003, respectively. The decrease in the cost of revenues as a percent of revenue is due primarily to lower hardware sales in 2004 as compared to 2003.
Operating earnings in the North Atlantic segment increased 27% for the year ended January 1, 2005, compared to the year ended January 3, 2004. Total revenues increased 20% in 2004 compared to 2003. The increase in revenues is due primarily to an increase in licensed software and professional services revenues in 2004 compared to 2003. Costs of revenues were 23% and 25% of total North Atlantic segment revenues for 2004 and 2003, respectively.
Operating earnings in the Southeast segment increased 6% for the year ended January 1, 2005, compared to the year ended January 3, 2004. Total revenues increased 2% in 2004 compared to 2003. Costs of revenues were 24% and 28% of total Southeast segment revenues for 2004 and 2003, respectively. The increase in total revenues is due primarily to strong increases in licensed software and support revenues that were largely offset by a decrease in hardware and professional services in 2004 compared to 2003.
Operating earnings in the West decreased 16% for the year ended January 1, 2005, compared to the year ended January 3, 2004. Total revenues decreased 7% in 2004 compared to 2003. The decrease in total revenues is due primarily to a decrease in licensed software in 2004 compared to 2003. Costs of revenues were 19% and 17% of total West segment revenues for 2004 and 2003, respectively. Operating expenses increased 20% in 2004 compared to 2003, due primarily to an increase in personnel related expenses.
Operating earnings in the Global segment increased 245% for the year ended January 1, 2005, compared to the year ended January 3, 2004. Total revenues increased 19% in 2004 compared to 2003. The increase in total revenues is due primarily to an increase in professional services in 2004 compared to 2003. Operating expenses increased 7% in 2004 compared to 2003. These increases are due primarily to an increased presence in the global market.
Operating losses in Other increased 9% for the year ended January 1, 2005, compared to the year ended January 3, 2004. This increase is due to an increase in total costs and expenses of 11% in 2004 compared to 2003. The increase in operating expenses is due to an increase in expenses such as software development, marketing, general and administrative and depreciation in 2004 compared to 2003.
33
Year Ended January 3, 2004, Compared to Year Ended December 28, 2002
The Company’s revenues increased 8% to $839,587,000 in 2003 from $780,262,000 in 2002. The Company had net earnings of $42,791,000 in 2003 compared to $48,022,000 in 2002. Operating results for 2002, as described below, included a gain on the sale of available-for-sale securities and a charge for the impairment of investments, and a change in accounting principle for goodwill. The decrease in net earnings is due primarily to a higher increase in expenses than revenue compared to the prior year. As discussed above, revenue increased less than the Company expected because of the decrease in new contract bookings in the fi rst quarter of 2003 and the shift in bookings mix to more managed services and subscription bookings which are recognized as revenue over longer periods of time. The increase in expenses was driven primarily by continued investments in the Company’s development of software and by sales and client services expenses. Expenses also increased because the Company’s 2003 fi scal year consisted of 53 weeks compared to 52 weeks in 2002.
Revenues - In 2003, revenues increased due to an increase in support of installed systems and an increase in services. Support, maintenance and service revenues increased 14% to $476,795,000 in 2003 from $419,578,000 in 2002. Support and maintenance revenues were $209,877,000 and $171,238,000 in 2003 and 2002, respectively. Services revenues were $266,918,000 and $248,340,000 in 2003 and 2002, respectively. Included in support, maintenance and service revenues are support and maintenance of software and hardware and professional services, excluding installation. This increase in support and maintenance revenue was due primarily to the increase in the Company’s installed and converted client base, that was driven by bringing a record number of Cerner Millennium solutions live in 2002 and 2003. The increase in services revenue was driven primarily by an increase Cerner Millennium solutions live in 2002 and 2003. The increase in services revenue was driven primarily by an increase Cerner Millenniumin revenue from managed services, which increased $20,000,000 to $34,000,000 as the Company continued to experience high levels of demand for hosting solutions in its data center.
System sales were $332,349,000 in 2003 compared to $332,274,000 in 2002. Included in system sales are revenues from the sale of software, hardware and sublicensed software. System sales were fl at because of the aforementioned fi rst quarter bookings shortfall and because of a shift in the mix of bookings during the year.
At January 3, 2004, the Company had $938,221,000 in contract backlog and $312,887,000 in support and maintenance backlog, compared to $732,719,000 in contract backlog and $269,153,000 in support and maintenance backlog at the end of 2002.
Cost of Revenues - The cost of revenues includes the cost of reimbursed travel expense, third party consulting services and subscription content, computer hardware and sublicensed software purchased from computer and software manufacturers for delivery to clients. It also includes the cost of hardware maintenance and sublicensed software support subcontracted to the manufacturers. The cost of revenues was 23% of total revenues in 2003, and 24% of total revenues in 2002. Such costs, as a percent of revenues, typically have varied as the mix of revenue (software, hardware, services and support) components carrying different margin rates changes from period to period. The decrease in the cost of revenue as a percent of total revenues resulted principally from a decrease in the percent of revenue from computer hardware and sublicensed software, which carry a higher cost of revenue percentage.
Sales and Client Service - Sales and client service expenses include salaries of client service personnel, communications expenses and unreimbursed travel expenses. Also included are sales and marketing salaries, travel expenses, tradeshow costs and advertising costs. These expenses as a percent of total revenues were 42% and 41% in 2003 and 2002, respectively. The increase in total sales and client service expenses is attributable to the cost of marketing of solutions. Expenses also increased due to the extra week in the 2003 fi scal year as described above.
Software Development - Software development expenses include salaries, documentation and other direct expenses incurred in software development and amortization of software development costs. Total expenditures for software development, including both capitalized and noncapitalized portions, for 2003 and 2002 were $179,999,000 and $149,985,000, respectively. These amounts exclude amortization. Capitalized software costs were $58,736,000 and $49,984,000 for 2003 and 2002, respectively.
General and Administrative - General and administrative expenses include salaries for corporate, fi nancial and administrative staffs, utilities, communications expenses and professional fees. These expenses as a percent of total revenues were 7% and 6% in 2003 and 2002, respectively.
Interest Expense, Net - Interest income was $1,219,000 in 2003 compared to $1,080,000 in 2002. This increase is due primarily to an increase in invested cash in 2003 compared to 2002. Interest expense was $8,236,000 in 2003 compared to $6,635,000 in 2002. This increase is due primarily to the increase in debt. On December 20, 2002, the Company completed a $60,000,000 private placement of debt pursuant to a Note Agreement dated December 15, 2002.
Other Income, Net - Other income increased to $142,000 in 2003 from $87,000 in 2002. Included in other revenues are revenues from offi ce space leased to third parties.
Gain (Loss) on Sale of Investment - In December 2002, the Company exercised 1,048,783 warrants of WebMD with an exercise price of $3.08 and a cost basis and carrying value of $4,146,000. The warrants were scheduled to expire on January 26, 2003. In December 2002, the Company sold 1,048,783 shares of WebMD for $8,242,000. Accordingly, the Company recorded an investment gain of $527,000, net of $342,000 in tax, as a result of the exercise of the warrants and the sale of the shares. In the second quarter of 2002, the Company sold 14,820,527 shares of WebMD for $90,119,000. Accordingly, the Company recorded an investment gain of $2,736,000, net of $1,572,000 in tax, as a result of the sale.
Impairment of Investment - The Company’s policy is to review declines in fair value of its marketable equity securities for declines that may be other than temporary. Based on events occurring in the fourth quarter of 2002, the Company recorded a charge of $6,281,000, net of tax of $3,623,000, for

34
the impairment of various investments in non-publicly traded securities. The charge is primarily related to a $3,464,000, net of tax, write down of the Company’s investment in Protocare, Inc., a non-publicly traded company.
Income Taxes - The Company’s effective tax rate was 39.9% in 2003 and 39.4% in 2002. As a result of a decrease in net income from 2002 to 2003, the impact of permanent differences increased the Company’s effective tax rate.
Accounting Change - Effective December 30, 2001, the Company adopted the provisions of Statement of Financial Accounting Standards (SFAS) No. 142, “Goodwill and Other Intangible Assets.” As a result, goodwill and intangible assets with indefi nite lives are no longer amortized but are evaluated for impairment annually or whenever there is an impairment indicator. All goodwill is assigned to a reporting unit, where it is subject to an impairment test based on fair value. The Company completed its transitional review of the Company’s goodwill values in the second quarter of 2002. As a result of this review, the Company determined that goodwill arising from the acquisition of Mitch Cooper and Associates was impaired due to declining demand and margins in this business. Mitch Cooper and Associates was a supply chain re-engineering consulting practice. The impairment charge to refl ect this goodwill at fair value was $786,000, net of tax, and is refl ected as a cumulative effect of a change in accounting principle as of the beginning of 2002. The Company used a discounted cash fl ow analysis to determine the fair value of the reporting units.
Liquidity and Capital Resources
The Company’s liquidity is infl uenced by many factors, including the amount and timing of the Company’s revenues, its cash collections from its clients and the amounts the Company invests in software development, acquisitions and capital expenditures.
The Company’s principal source of liquidity is its cash and cash equivalents. The majority of the Company’s cash and cash equivalents consist of U.S. Government Federal Agency Securities, short-term marketable securities and overnight repurchase agreements. At January 1, 2005 the Company had cash and cash equivalents of $189,784,000 and working capital of $310,229,000 compared to cash and cash equivalents of $121,839,000 and working capital of $246,412,000 at January 3, 2004.
The Company generated cash of $168,304,000, $134,150,000 and $36,906,000 from operations in 2004, 2003 and 2002, respectively. Cash fl ow from operations increased in 2004 due primarily to increased collections of receivables, improved payment terms and record level conversions. The Company has periodically provided long-term fi nancing options to creditworthy clients through third party fi nancing institutions and typically has directly provided extended payment terms from contract date. Some of these payment streams have been assigned on a non-recourse basis to third party fi nancing institutions. The Company has provided its usual and customary performance guarantees to the third party fi nancing institutions in connection with its on-going obligations under the client contract. During 2004 and 2003, the Company generated cash fl ow from third party client fi nancing arrangements and non-recourse payment assignments aggregating $53,319,000 and $58,654,000, respectively. Days sales outstanding increased from 103 days at the end of 2003 to 104 days at the end of 2004. Revenues provided under support and maintenance agreements represent recurring cash fl ows. Support and maintenance revenues increased 15% in 2004 and 23% in 2003, and the Company expects these revenues to continue to grow as the base of installed systems grows.
Cash used in investing activities consisted primarily of capitalized software development costs of $58,912,000 and $58,736,000 and purchases of capital equipment, land and buildings of $56,490,000 and $83,583,000 in 2004 and 2003, respectively. The Company completed acquisitions of businesses for $1,957,000 and $6,380,000, net of cash received, in 2004 and 2003, respectively. The Company completed the sale of Zynx Health Incorporated in 2004 for $12,000,000.
The Company’s fi nancing activities for 2004 primarily consisted of repayment of debt of $24,879,000 and the proceeds from the exercise of stock options of $25,717,000. Financing activities for 2003 primarily consisted of the repayment of long term debt of $13,238,000, the purchase of treasury stock of $5,930,000 and the proceeds from the exercise of stock options of $6,703,000.
Prior to May 2002, the Company had a loan agreement with a bank that provided for a current revolving line of credit for working capital purposes. In May 2002, the Company expanded its credit facility by entering into an unsecured revolving credit agreement with a group of banks led by U.S. Bank. The new credit facility increased the amount the Company may borrow from $45,000,000 to $90,000,000. The fee rate on the new facility is approximately the same as the prior facility. The revolving line of credit is unsecured and requires monthly payments of interest only. Interest is payable at the Company’s option at a rate based on prime (5.25% at January 1, 2005) or LIBOR (2.4% at January 1, 2005) plus 2%. The interest rate may be reduced by up to 1.15% if certain net worth ratios are maintained. The agreement contains certain net worth, debt levels and fi xed charge coverage covenants and provides certain restrictions on the Company’s ability to borrow, incur liens, sell assets and pay dividends. A commitment fee of 3/10% to 1/2% is payable quarterly based on the usage of the revolving line of credit. The revolving line of credit matures on May 31, 2007. The Company was in compliance with all covenants at January 1, 2005. At January 1, 2005, the Company had no outstanding borrowings under this agreement and had $90,000,000 available for working capital purposes. On January 10, 2005, the Company drew down $35,000,000 from its revolving line of credit in connection with the acquisition of the medical business division of VitalWorks, Inc. (See Note 2 to the consolidated fi nancial statements.)
In December 2002, the Company completed a $60,000,000 private placement of debt pursuant to a Note Agreement. The Series A Senior Notes, with a $21,000,000 principal amount at 5.57%, are payable in three equal annual installments beginning in December 2006. The Series B Senior notes, with a $39,000,000 principal amount at 6.42%, are payable in four equal annual installments beginning December 2009. The proceeds were used to repay the outstanding amount under the bank loan agreement and for general corporate purposes. The Note Agreement contains certain net worth and fi xed charge coverage covenants and provides certain restrictions on the Company’s ability to borrow, incur liens, sell assets and pay dividends. The Company was in compliance with all covenants at January 1, 2005.

35
In April 1999, the Company completed a $100,000,000 private placement of debt pursuant to a Note Agreement. The Series A Senior Notes, with a $60,000,000 principal amount at 7.14%, are payable in fi ve equal annual installments beginning in April 2002. The Series B Senior Notes, with a $40,000,000 principal amount at 7.66%, are payable in six equal annual installments beginning April 2004. The proceeds were used to retire the Company’s existing $30,000,000 of debt, and the remaining funds were used for capital improvements and to strengthen the Company’s cash position. The Note Agreement contains certain net worth, current, and fi xed charge coverage covenants and provides certain restrictions on the Company’s ability to borrow, incur liens, sell assets and pay dividends. The Company was in compliance with all covenants at January 1, 2005.
The Company believes that its present cash position, together with cash generated from operations and the line of credit, will be suffi cient to meet anticipated cash requirements during 2005.
The following table represents a summary of the Company’s contractual obligations and commercial commitments as of January 1, 2005, except short-term purchase order commitments arising in the ordinary course of business.
Payments due by period
2010 and Contractual Obligations (in thousands) 2005 2006 2007 2008 2009 thereafter Total
Long-Tem Debt Obligations 21,908 28,558 20,207 14,373 16,417 29,249 130,712
Lease Obligations 16,614 12,234 6,428 4,964 3,577 6,634 50,451
Acquisition/Divestiture Related Commitments 250 100 100 25 - - 475
Supplier Software Purchase Commitments 2,872 100 - - - - 2,972
Other 1,800 1,700 - - - - 3,500
Total 43,444 42,692 26,735 19,362 19,994 35,883 188,110
The effects of infl ation on the Company’s business during 2004, 2003 and 2002 were not signifi cant.
Recent Accounting Pronouncements
In December 2004, the FASB issued Statement of Financial Accounting Standards (“SFAS”) No. 123 (revised 2004), Share Based Payments (“SFAS No. 123(R)”) which replaces SFAS 123, Accounting for Stock-Based Compensation, and supersedes APB Opinion No. 25, Accounting for Stock Issued to Employees.” SFAS No. 123(R) addresses the accounting for share-based payments transactions with employees and other third parties, eliminates the ability to account for share-based compensation transactions using APB 25 and requires that the compensation costs relating to such transactions be recognized in the consolidated statement of income. The new standard is effective in the fi rst interim period beginning after June 15, 2005. The Company is currently assessing the impact that the Statement may have on its consolidated fi nancial statements.
Critical Accounting Policies
The Company believes that there are several accounting policies that are critical to understanding the Company’s historical and future performance, as these policies affect the reported amount of revenue and other signifi cant areas involving management’s judgments and estimates. These signifi cant accounting policies relate to revenue recognition, software development, concentrations, allowance for doubtful accounts and potential impairments of goodwill. These policies and the Company’s procedures related to these policies are described in detail below and under specifi c areas within this “Management Discussion and Analysis or Financial Condition and Results of Operations.” In addition, Note 1 to the consolidated fi nancial statements expands upon discussion of the Company’s accounting policies.
Revenue Recognition
The Company recognizes its multiple element arrangements, including software and software-related services, using the residual method under SOP 97-2, “Software Revenue Recognition,” as amended by SOP No. 98-4, SOP 98-9 and clarifi ed by Staff Accounting Bulletin’s (SAB) 101 “Revenue Recognition in Financial Statements” and SAB No. 104 “Revenue Recognition” and Emerging Issues Task Force 00-21 “Accounting for Revenue Arrangements with Multiple Deliverables” (“EITF 00-21”). Key factors in the Company’s revenue recognition model are management’s assessments that installation services are essential to the functionality of the Company’s software whereas implementation services are not. If the Company’s business model were to change such that implementation services became essential to the functionality of the Company’s software, the period of time over which the Company’s licensed software revenue were to be recognized would lengthen. The Company generally recognizes revenue from the sale of its licensed software over two key milestones, delivery and installation, based on percentages that refl ect the underlying effort from planning to installation. Additionally, if the time to achieve the Company’s delivery and installation milestones for its licensed software were to be accelerated or decelerated, its milestones would be adjusted and the timing of revenue recognition for its licensed software could materially change.
36
Software Development Costs
Costs incurred internally in creating computer software solutions are expensed until technological feasibility has been established upon completion of a detailed program design. Thereafter, all software development costs are capitalized and subsequently reported at the lower of amortized cost or net realizable value. Capitalized costs are amortized based on current and expected future revenue for each software solution with minimum annual amortization equal to the straight-line amortization over the estimated economic life of the software solution. The Company is amortizing capitalized costs over fi ve years.
The Company expects that major software information systems companies, large information technology consulting service providers and systems integrators and others specializing in the healthcare industry may offer competitive products or services. The pace of change in the healthcare information systems market is rapid and there are frequent new product introductions, product enhancements and evolving industry standards and requirements. As a result, the capitalized software solutions may become less valuable or obsolete and could be subject to impairment.
Concentrations
Substantially all of the Company’s cash and cash equivalents and short-term investments, are held at three major U.S. fi nancial institutions. The majority of the Company’s cash equivalents consist of U.S. Government Federal Agency Securities, short-term marketable securities and overnight repurchase agreements. Deposits held with banks may exceed the amount of insurance provided on such deposits. Generally these deposits may be redeemed upon demand and, therefore, bear minimal risk.
Substantially all of the Company’s clients are integrated delivery networks, hospitals and other healthcare related organizations. If signifi cant adverse macro-economic factors were to impact these organizations it could materially adversely affect the Company. The Company’s access to certain software and hardware components is dependent upon single and sole source suppliers. The inability of any supplier to fulfi ll supply requirements of the Company could affect future results.
Allowance for Doubtful Accounts
If the creditworthiness of the Company’s clients were to weaken or the Company’s collections results relative to historical experience were to decline, it could have a material adverse impact on operations and cash fl ows.
Goodwill
The Company accounts for its goodwill under the provisions of Statement of Financial Accounting Standards (SFAS) No. 142, “Goodwill and Other Intangible Assets.” As a result, goodwill and intangible assets with indefi nite lives are no longer amortized but are evaluated for impairment annually or whenever there is an impairment indicator. All goodwill is assigned to a reporting unit, where it is subject to an impairment test based on fair value. The Company completed its transitional review of the Company’s goodwill values in the second quarter of 2002. As a result of this review, the Company determined that goodwill arising from the acquisition of Mitch Cooper and Associates was impaired due to declining demand and margins in this business. Mitch Cooper and Associates was a supply chain re-engineering consulting practice. The impairment charge to refl ect this goodwill at fair value was $786,000, net of tax, and is refl ected as a cumulative effect of a change in accounting principle as of the beginning of 2002. The Company again assessed its goodwill for impairment in the second quarters of 2004 and 2003 and concluded that no goodwill was impaired. The Company used a discounted cash fl ow analysis to determine the fair value of the reporting units for all periods. The Company completed fi ve acquisitions and one divestiture subsequent to June 30, 2001, which resulted in approximately $35 million of goodwill that was not amortized in accordance with SFAS 142. Goodwill amounted to $54,600,000 and $51,573,000 at January 1, 2005, and January 3, 2004, respectively. If future, anticipated cash fl ows from the Company’s reporting units, that recognized goodwill, do not materialize as expected the Company’s goodwill could be impaired, which would result in signifi cant write-offs.
Factors that may Affect Future Results of Operations, Financial Condition or Business
Statements made in this report, the Annual Report to Shareholders in which this report is made a part, other reports and proxy statements fi led with the Securities and Exchange Commission, communications to shareholders, press releases and oral statements made by representatives of the Company that are not historical in nature, or that state the Company’s or management’s intentions, hopes, beliefs, expectations or predictions of the future, may constitute “forward-looking statements” within the meaning of Section 21E of the Securities and Exchange Act of 1934, as amended (the “Exchange Act”). Forward-looking statements can often be identifi ed by the use of forward-looking terminology, such as “could,” “should,” “will,” “intended,” “continue,” “believe,” “may,” “expect,” “hope,” “anticipate,” “goal,” “forecast,” “plan,” “guidance” or “estimate” or the negative of these words, variations thereof or similar expressions. Forward-looking statements are not guarantees of future performance or results. They involve risks, uncertainties and assumptions. It is important to note that any such performance and actual results, fi nancial condition or business, could differ materially from those expressed in such forward-looking statements. Factors that could cause or contribute to such differences include, but are not limited to, those discussed below as well as those discussed elsewhere herein or in other reports fi led with the Securities and Exchange Commission. Other unforeseen factors not identifi ed herein could also have such an effect. The Company undertakes no obligation to update or revise forward-looking statements to refl ect changed assumptions, the occurrence of unanticipated events or changes in future operating results, fi nancial condition or business over time.
Quarterly Operating Results May Vary - The Company’s quarterly operating results have varied in the past and may continue to vary in future periods, including, variations from guidance, expectations or historical results or trends. Quarterly operating results may vary for a number of reasons including accounting policy changes mandated by regulating entities, demand for the Company’s software solutions and services, the Company’s long sales cycle,

37
potentially long installation and implementation cycles for these larger, more complex and costlier systems and other factors described in this section and elsewhere in this report. As a result of healthcare industry trends and the market for the Company’s Cerner Millennium solutions, a large percentage of the Company’s revenues are generated by the sale and installation of larger, more complex and costlier systems. The sales process for these systems is lengthy and involves a signifi cant technical evaluation and commitment of capital and other resources by the client. Sales may be subject to delays due to changes in clients’ internal budgets, procedures for approving large capital expenditures, competing needs for other capital expenditures, availability of personnel resources and by actions undertaken by competitors. Delays in the expected sale or installation of these large contracts may have a signifi cant impact on the Company’s anticipated quarterly revenues and consequently its earnings, since a signifi cant percentage of the Company’s expenses are relatively fi xed.
The Company recognizes revenue upon the completion of standard milestone conditions and the amount of revenue recognized in any quarter depends upon the Company’s and the client’s ability to meet these project milestones. Delays in meeting these milestone conditions or modifi cation of the contract relating to one or more of these systems could result in a shift of revenue recognition from one quarter to another and could have a material adverse effect on results of operations for a particular quarter. The Company’s revenues from system sales historically have been lower in the fi rst quarter of the year and greater in the fourth quarter of the year, primarily as a result of the clients’ year-end efforts to make all fi nal capital expenditures for the then current year.
Stock Price May Be Volatile - The trading price of the Company’s common stock may be volatile. The market for the Company’s common stock may experience signifi cant price and volume fl uctuations in response to a number of factors including actual or anticipated quarterly variations in operating results, rumors about the Company’s performance or software solutions, changes in expectations of future fi nancial performance or changes in estimates of securities analysts, governmental regulatory action, healthcare reform measures, client relationship developments, changes occurring in the securities markets in general and other factors, many of which are beyond the Company’s control. As a matter of policy, the Company does not generally comment on rumors.
Furthermore, the stock market in general, and the market for software and healthcare and information technology companies in particular, has experienced extreme volatility that often has been unrelated to the operating performance of particular companies. These broad market and industry fl uctuations may adversely affect the trading price of the Company’s common stock, regardless of actual operating performance.
Changes in the Healthcare Industry - The healthcare industry is highly regulated and is subject to changing political, economic and regulatory infl uences. For example, the Balanced Budget Act of 1997 (Public Law 105-32) contained signifi cant changes to Medicare and Medicaid and had an impact for several years on healthcare providers’ ability to invest in capital intensive systems. In addition, the Health Insurance Portability and Accountability Act of 1996 (HIPAA) is having a direct impact on the healthcare industry by requiring identifi ers and standardized transactions/code sets and necessary security and privacy measures in order to ensure the protection of patient health information. These factors affect the purchasing practices and operation of healthcare organizations. Federal and state legislatures have periodically considered programs to reform or amend the U.S. healthcare system at both the federal and state level and to change healthcare fi nancing and reimbursement systems. These programs may contain proposals to increase governmental involvement in healthcare, lower reimbursement rates or otherwise change the environment in which healthcare industry participants operate. Healthcare industry participants may respond by reducing their investments or postponing investment decisions, including investments in the Company’s software solutions and services.
Many healthcare providers are consolidating to create integrated healthcare delivery systems with greater market power. These providers may try to use their market power to negotiate price reductions for the Company’s software solutions and services. As the healthcare industry consolidates, the Company’s client base could be eroded, competition for clients could become more intense and the importance of acquiring each client becomes greater.
Signifi cant Competition - The market for healthcare information systems is intensely competitive, rapidly evolving and subject to rapid technological change. The Company believes that the principal competitive factors in this market include the breadth and quality of system and software solution offerings, the stability of the information systems provider, the features and capabilities of the information systems, the ongoing support for the system and the potential for enhancements and future compatible software solutions.
Certain of the Company’s competitors have greater fi nancial, technical, product development, marketing and other resources than the Company and some of its competitors offer software solutions that it does not offer. The Company’s principal existing competitors include Eclipsys Corporation, Epic Systems Corporation, GE Medical Systems, IDX Systems Corporation, iSoft Corporation, McKesson Corporation, Medical Information Technology, Inc. (“Meditech”), Misys Healthcare Systems and Siemens Medical Solutions Health Services Corporation, each of which offers a suite of software solutions that compete with many of the Company’s software solutions and services. There are other competitors that offer a more limited number of competing software solutions.
In addition, the Company expects that major software information systems companies, large information technology consulting service providers and system integrators, Internet-based start-up companies and others specializing in the healthcare industry may offer competitive software/solutions or services. The pace of change in the healthcare information systems market is rapid and there are frequent new software solution introductions, software solution enhancements and evolving industry standards and requirements. As a result, the Company’s success will depend upon its ability to keep pace with technological change and to introduce, on a timely and cost-effective basis, new and enhanced software solutions and services that satisfy changing client requirements and achieve market acceptance.
38
Proprietary Technology May Be Subjected to Infringement Claims or May Be Infringed Upon - The Company relies upon a combination of license agreements, confidentiality procedures, employee nondisclosure agreements and technical measures to maintain the confidentiality and trade secrecy of its proprietary information. The Company also relies on trademark and copyright laws to protect its intellectual property. The Company has initiated a patent program but currently has a limited patent portfolio. As a result, the Company may not be able to protect against misappropriation of its intellectual property.
In addition, the Company could be subject to intellectual property infringement claims as the number of competitors grows and the functionality of its software solutions and services expands. These claims, even if not meritorious, could be expensive to defend. If the Company becomes liable to third parties for infringing their intellectual property rights, it could be required to pay a substantial damage award and to develop noninfringing technology, obtain a license or cease selling the software solutions that contain the infringing intellectual property.
Government Regulation - The healthcare industry is highly regulated at the local, state and federal level. Consequently, the Company may be subject to such regulations, which include regulation in the areas of healthcare fraud, medical devices and the security and privacy of patient data, and the risk of changes in the various local, state and federal laws.
Healthcare Fraud - The federal government continues to strengthen its position and scrutiny over practices involving healthcare fraud affecting healthcare providers whose services are reimbursed by Medicare, Medicaid and other government healthcare programs. Healthcare providers who are clients of the Company are subject to laws and regulations on fraud and abuse which, among other things, prohibit the direct or indirect payment or receipt of any remuneration for patient referrals, or arranging for or recommending referrals or other business paid for in whole or in part by these federal or state healthcare programs. Legislative provisions relating to healthcare fraud and abuse give federal enforcement personnel substantial funding, powers and remedies to pursue suspected fraud and abuse. The effect of this government regulation of the Company’s clients is difficult to predict. While the Company believes that it is in substantial compliance with any applicable laws, many of the regulations applicable to the Company’s clients and that may be applicable to the Company, are vague or indefinite and have not been interpreted by the courts. They may be interpreted or applied by a prosecutorial, regulatory or judicial authority in a manner that could require the Company’s clients to make changes in their operations or the way that they deal with the Company. If the such laws and regulations are determined to be applicable to the Company and if the Company fails to comply with any applicable laws and regulations, it could be subject to sanctions or liability, including exclusion from government health programs and could have a material adverse effect on the Company’s business, results of operations or financial condition.
Regulation of Medical Devices - The United States Food and Drug Administration (the “FDA”) has declared that certain of the Company’s software solutions are medical devices that are actively regulated under the Federal Food, Drug and Cosmetic Act (“Act”) and amendments to the Act. As a consequence, the Company is subject to extensive regulation by the FDA with regard to those software solutions that are actively regulated. If other of the Company’s software solutions are deemed to be actively regulated medical devices by the FDA, the Company could be subject to extensive requirements governing pre- and post-marketing requirements including pre-market notification clearance prior to marketing. Complying with these FDA regulations would be time consuming and expensive. It is possible that the FDA may become more active in regulating computer software that is used in healthcare.
There have been six FDA inspections since 1998 at various Cerner sites. Inspections conducted at the Company’s World Headquarters in 1999 and its Houston facility in 2002 each resulted in the issuance of an FDA Form 483 that the Company responded to promptly. The FDA has taken no further action with respect to either of the Form 483s that were issued in 1998 and 2002. The remaining four FDA inspections, including an inspection at the Company’s World Headquarters in 2004, resulted in no issuance of a Form 483. The Company, however, remains subject to periodic FDA inspections and there can be no assurances that the Company will not be required to undertake additional actions to comply with the Act and any other applicable regulatory requirements. Any failure by the Company to comply with the Act and any other applicable regulatory requirements could have a material adverse effect on the Company’s ability to continue to manufacture and distribute its software solutions. The FDA has many enforcement tools including recalls, seizures, injunctions, civil fines and/or criminal prosecutions. Any of the foregoing could have a material adverse effect on the Company’s business, results of operations or financial condition.
Security and Privacy of Patient Information - State and federal laws regulate the confidentiality of patient records and the circumstances under which those records may be released. These regulations govern both the disclosure and use of confidential patient medical record information and require the users of such information to implement specified security measures. Regulations currently in place governing electronic health data transmissions continue to evolve and are often unclear and difficult to apply.
The Health Insurance Portability and Accountability Act of 1996 (“HIPAA”) requires national standards for some types of electronic health information transactions and the data elements used in those transactions, security standards to ensure the integrity and confidentiality of health information and standards to protect the privacy of individually identifiable health information. Covered entities under HIPAA, which include healthcare organizations such as the Company’s clients, were required to comply with the privacy standards by April 2003 and additional transaction regulations by October 2003. Such organizations must also be in compliance with security regulations by April 2005. As a business associate of the covered entities, the Company, in most instances, must also ensure compliance with the HIPAA regulations.
The effect of HIPAA on the Company’s business is difficult to predict, and there can be no assurances that the Company will adequately address the business risks created by HIPAA and its implementation, or that the Company will be able to take advantage of any resulting business opportunities.
39
Furthermore, the Company is unable to predict what changes to HIPAA, or the regulations issued pursuant to HIPAA, might be made in the future or how those changes could affect the Company’s business or the costs of compliance with HIPAA. Evolving HIPAA-related laws or regulations could restrict the ability of the Company’s clients to obtain, use or disseminate patient information. This could adversely affect demand for the Company’s solutions if they are not re-designed in a timely manner in order to meet the requirements of any new regulations that seek to protect the privacy and security of patient data or enable the Company’s clients to execute new or modifi ed healthcare transactions. The Company may need to expend additional capital, research and development and other resources to modify its solutions to address these evolving data security and privacy issues.
Product Related Liabilities - Many of the Company’s software solutions provide data for use by healthcare providers in providing care to patients. Although no such claims have been brought against the Company to date regarding injuries related to the use of its software solutions, such claims may be made in the future. Although the Company maintains product liability insurance coverage in an amount that it believes is suffi cient for its business, there can be no assurance that such coverage will cover a particular claim that may be brought in the future, prove to be adequate or that such coverage will continue to remain available on acceptable terms, if at all. A successful claim brought against the Company, which is uninsured, or under-insured could materially harm its business, results of operations or fi nancial condition.
System Errors and Warranties - The Company’s systems, particularly the Cerner Millennium versions, are very complex. As with complex systems offered by others, the Company’s systems may contain errors, especially when fi rst introduced. Although the Company conducts extensive testing, it has discovered software errors in its software solutions after their introduction. The Company’s systems are intended for use in collecting and displaying clinical information used in the diagnosis and treatment of patients. Therefore, users of the Company software solutions have a greater sensitivity to system errors than the market for software products generally. The Company’s agreements with its clients typically provide warranties against material errors and other matters. Failure of a client’s system to meet these criteria could constitute a material breach under such contracts allowing the client to cancel the contract and obtain a refund and/or damages, or could require the Company to incur additional expense in order to make the system meet these criteria. The Company’s contracts with its clients generally limit the Company’s liability arising from such claims but such limits may not be enforceable in certain jurisdictions or circumstances. A successful claim brought against the Company, which is uninsured, or under-insured could materially harm its business, results of operations or fi nancial condition.
Risks Associated with the Company’s Global Operations – The Company markets, sells and services its software solutions globally. The Company has established offi ces around the world, including in the Americas, Europe, in the Middle East and in the Asia Pacifi c region. The Company will continue to expand its global operations and enter new global markets. This expansion will require signifi cant management attention and fi nancial resources to develop successful direct and indirect global sales and support channels. The business transacted is in the local functional currency and the Company does not currently have any material exposure to foreign currency transaction gains or losses. All other business transactions are in U.S. dollars. To date, the Company has not entered into any derivative fi nancial instruments to manage foreign currency risk. In some countries, the Company’s success will depend in part on its ability to form relationships with local partners. There is a risk that the Company may sometimes choose the wrong partner. For these reasons, the Company may not be able to maintain or increase global market demand for its software solutions.
Global operations are subject to inherent risks, and the Company’s future results could be adversely affected by a variety of uncontrollable and changing factors. These include:
Greater diffi culty in collecting accounts receivable and longer collection periods;
Diffi culties and costs of staffi ng and managing global operations;
The impact of economic conditions outside the United States;
Unexpected changes in regulatory requirements;
Certifi cation or regulatory requirements;
Reduced protection of intellectual property rights in some countries;
Potentially adverse tax consequences;
Different or additional functionality requirements;
Trade protection measures and other regulatory requirements;
Service provider and government spending patterns;
Natural disasters, war or terrorist acts;
Poor selection of a partner in a country; and
Political conditions which may impact sales or threaten the safety of associates or the continued presence of the Company in these countries.
Recruitment and Retention of Key Personnel – To remain competitive in the healthcare information technology industry, the Company must attract, motivate and retain highly skilled managerial, sales, marketing, consulting and technical personnel, including executives, consultants, programmers and systems architects skilled in the healthcare information technology industry and the technical environments in which the Company’s solutions operate. Competition for such personnel in this industry is intense. The Company’s failure to attract additional qualifi ed personnel could have a material adverse effect on the Company’s prospects for long-term growth. The success of the Company is dependent to a signifi cant degree on the continued contributions

40
of key management, sales, marketing, consulting and technical personnel. The Company has succession plans in place; however, the unexpected loss of key personnel could have a material adverse impact to the Company’s business and results of operations, and could potentially inhibit solution development and market share advances.
Third Party Suppliers – The Company licenses or purchases intellectual property and technology (such as software, hardware and content) from third parties, including some competitors, and incorporates it into or sells it in conjunction with the Company’s software solutions and services, some of which intellectual property or technology is critical to the operation of the Company’s solutions. If any of the third party suppliers were to change product offerings, increase prices or terminate the Company’s licenses or supply contracts, the Company might need to seek alternative suppliers and incur additional internal or external development costs to ensure continued performance of the Company’s solutions. Such alternatives may not be available on attractive terms, or may not be as widely accepted or as effective as the intellectual property or technology provided by the Company’s existing suppliers. If the cost of licensing, purchasing or maintaining these third party intellectual property or technology solutions signifi cantly increases, the Company’s gross margin levels could signifi cantly decrease. In addition, interruption in functionality of the Company’s solutions could adversely affect future sales of licenses and services.
Sales Forecasts – The Company’s sales forecasts may vary from actual sales in a particular quarter. The Company uses a “pipeline” system, a common industry practice, to forecast sales and trends in its business. The Company’s sales associates monitor the status of all sales opportunities, such as the date when they estimate that a client will make a purchase decision and the potential dollar amount of the sale. These estimates are aggregated periodically to generate a sales pipeline. The Company compares this pipeline at various points in time to evaluate trends in its business. This analysis provides guidance in business planning and forecasting, but these pipeline estimates are by their nature speculative. The Company’s pipeline estimates are not necessarily reliable predictors of revenues in a particular quarter or over a longer period of time, partially because of changes in the pipeline and in conversion rates of the pipeline into contracts that can be very diffi cult to estimate. A variation in the expected conversion rate or timing of the pipeline into contracts, or in the pipeline itself, could cause the Company’s plan or forecast to be inaccurate and thereby adversely affect business results. For example, a slowdown in information technology spending, or economic conditions or a variety of other reasons can cause purchasing decisions to be delayed, reduced in amount or cancelled, which would reduce the overall pipeline conversion rate in a particular period of time. Because a substantial portion of the Company’s contracts are completed in the latter part of a quarter, the Company may not be able to adjust its cost structure promptly in response to a revenue shortfall resulting from a decrease in its pipeline conversion rate in any given fi scal quarter(s).
Item 7A. Quantitative and Qualitative Disclosures about Market RiskThe Company does not have any signifi cant market risk.
Item 8. Financial Statements and Supplementary DataThe Financial Statements and Notes required by this Item are submitted as a separate part of this report.
Item 9. Changes in and Disagreements with Accountants on Accounting and Financial DisclosureNone.
Item 9.A. Controls and Proceduresa) Evaluation of disclosure controls and procedures. The Company’s Chief Executive Offi cer (CEO) and Chief Financial Offi cer (CFO) have evaluated the effectiveness of the Company’s disclosure controls and procedures (as defi ned in the Exchange Act Rules 13a-15(e) and 15d-15(e)) as of the end of the period covered by the Annual Report (the “Evaluation Date”). They have concluded that, as of the Evaluation Date, these disclosure controls and procedures were effective to ensure that material information relating to the Company and its consolidated subsidiaries would be made known to them by others within those entities and would be disclosed on a timely basis.
b) There were no changes in the Company’s internal controls over fi nancial reporting during the year ended January 1, 2005, that have materially affected, or are reasonably likely to materially affect, its internal controls over fi nancial reporting.
c) The Company’s management, including its Chief Executive Offi cer and Chief Financial Offi cer, cannot provide complete assurance that its disclosure controls and procedures or the Company’s internal controls will prevent all error and all fraud. A control system, no matter how well conceived and operated, can provide only reasonable, not absolute, assurance that the objectives of the control system are met. Further, the design of a control system must refl ect the fact that there are resource constraints, and the benefi ts of controls must be considered relative to their costs. Because of the inherent limitations in all control systems, no evaluation of controls can provide absolute assurance that all control issues and instances of fraud, if any, within Cerner have been detected.
Management’s Report on Internal Control over Financial Reporting
The Company’s management is responsible for establishing and maintaining adequate internal control over fi nancial reporting (as defi ned in Rule 13a-15(f) under the Securities Exchange Act of 1934, as amended). The Company’s management assessed the effectiveness of the Company’s internal control over fi nancial reporting as of January 1, 2005. In making this assessment, the Company’s management used the criteria set forth by the Committee of Sponsoring Organizations of the Treadway Commission (“COSO”) in its Internal Control-Integrated Framework. The Company’s management has

41
concluded that, as of January 1, 2005, the Company’s internal control over fi nancial reporting is effective based on these criteria. The Company’s independent registered public accounting fi rm that audited the consolidated fi nancial statements included in the annual report has issued an audit report on the Company’s assessment of its internal control over fi nancial reporting, which is included herein.
PART IIIItem 10. Directors and Executive Offi cers of the RegistrantThe Registrant’s Proxy Statement to be used in connection with the Annual Meeting of Shareholders to be held on May 27, 2005, will contain under the caption “Election of Directors” certain information required by Item 10 of Form 10-K and such information is incorporated herein by this reference. The information required by Item 10 of Form 10-K as to executive offi cers is set forth in Item 4A of Part I hereof.
The Registrant’s Proxy Statement to be used in connection with the Annual Meeting of Shareholders to be held on May 27, 2005, will contain under the caption “Compliance with Section 16(a) of the Securities Exchange Act of 1934” certain information required by Item 10 of Form 10-K and such information is incorporated herein by this reference.
Audit Committee Financial Expert
The Board of Directors has determined that Gerald E. Bisbee, Jr., Ph.D., a member of the Company’s Audit Committee, is an audit committee fi nancial expert as that term is defi ned under Item 401(h) of Regulation S-K.
Code of Conduct; Corporate Governance Guidelines and Committee Charters
The Board of Directors of the Company has adopted a Code of Conduct that applies to the Company’s principal executive offi cer, principal fi nancial offi cer, controller and all other associates of the Company, including its directors and other offi cers. The Company has posted the text of the Code of Conduct on its website at www.cerner.com under “About Cerner/Investors/Corporate Governance.”
The Board of Directors of the Company has also adopted Corporate Governance Guidelines, which are posted on the Company’s website at www.cerner.com under “About Cerner/Investors/Corporate Governance.”
The charters for the Audit Committee, the Compensation Committee and the Nominating, Governance & Public Policy Committee are also available on the Company’s website at www.cerner.com under “About Cerner/Investors/Corporate Governance.”
A printed copy of the Code of Conduct and the Corporate Governance Guidelines is also available to the public at no charge by writing to Cerner Corporation, Attn. Human Resources, 2800 Rockcreek Parkway, North Kansas City, Missouri, 64117, or calling the Company’s headquarters at (816) 221-1024.
Item 11. Executive CompensationThe Registrant’s Proxy Statement to be used in connection with the Annual Meeting of Shareholders to be held on May 27, 2005, will contain under the caption “Executive Compensation” the information required by Item 11 of Form 10-K and such information is incorporated herein by this reference.
Item 12. Security Ownership of Certain Benefi cial Owners and ManagementThe Registrant’s Proxy Statement to be used in connection with the Annual Meeting of Shareholders to be held on May 27, 2005, will contain under the caption “Voting Securities and Principal Holders Thereof” the information required by Item 12 of Form 10-K and such information is incorporated herein by this reference.
Item 13. Certain Relationships and Related TransactionsThe Registrant’s Proxy Statement to be used in connection with the Annual Meeting of Shareholders to be held on May 27, 2005, will contain under the caption “Certain Transactions” the information required by Item 13 of Form 10-K and such information is incorporated herein by this reference.
Item 14. Principal Accountant Fees and ServicesThe Registrant’s Proxy Statement to be used in connection with the Annual Meeting of Shareholders to be held on May 27, 2005, will contain under the caption “Audit and Non-Audit Fees” the information required by Item 14 of Form 10-K and such information is incorporated herein by this reference.
PART IVItem 15. Exhibits and Financial Statement Schedules (a) Financial Statements and Exhibits.
(1) Consolidated Financial Statements: Reports of Independent Registered Public Accounting Firm
Consolidated Balance Sheets -

42
January 1, 2005 and January 3, 2004
Consolidated Statements of Operations - Years Ended January 1, 2005, January 3, 2004 and December 28, 2002
Consolidated Statements of Changes in Equity Years Ended January 1, 2005, January 3, 2004 and December 28, 2002
Consolidated Statements of Cash Flows Years Ended January 1, 2005, January 3, 2004 and December 28, 2002
Notes to Consolidated Financial Statements
(2) The following fi nancial statement schedule and Report of Independent Registered Public Accounting Firm of the Registrant for the three-year period ended
January 1, 2005 are included herein:
Schedule II - Valuation and Qualifying Accounts,
Report of Independent Registered Public Accounting Firm
All other schedules are omitted, as the required information is inapplicable or the information is presented in the consolidated fi nancial statements or related notes.
(3) The exhibits required to be fi led by this item are set forth below:
Number DescriptionDescription
3(a) Second Restated Certifi cate of Incorporation of the Registrant, dated December 5, 2003 (fi led as exhibit 3(a) to Registrant’s Annual Report on Form 10-K for the year ended January 3, 2004, and incorporated herein by reference).
3(b) Amended and Restated Bylaws, dated March 9, 2001 (fi led as Exhibit 4.2 to Registrant’s Form S-8 fi led on September 26, 2001 and incorporated herein by reference).
4(a) Amended and Restated Rights Agreement, dated as of March 12, 1999, between Cerner Corporation and UMB Bank, n.a., as Rights Agents, which includes the Form of Certifi cate of Designation, Preferences and Rights of Series A Preferred Stock of Cerner Corporation, as Exhibit A, and the Form of Rights Certifi cate, as Exhibit B (fi led as an Exhibit to Registrant’s current report on Form 8-A/A dated March 31, 1999 and incorporated herein by reference).
4(b) Specimen stock certifi cate (fi led as Exhibit 4(a) to Registrant’s Registration Statement on Form S-8 (File No. 33-15156) and hereby incorporated herein by reference).
4(c) Credit Agreement between Cerner Corporation and U.S. Bank National Association as administrative agent and head arranger, and LaSalle Bank National Association, as document agent, dated as of May 31, 2002 (fi led as Exhibit 4(a) to Registrant’s Quarterly Report on Form 10-Q for the quarter ended June 29, 2002, and incorporated herein by reference).
4(d) First Amendment to Credit Agreement between Cerner Corporation and U.S. Bank National Association as administrative agent and head arranger, and LaSalle Bank National Association, as documentation agent, dated as of July 22, 2002 (fi led as Exhibit 4(d) to Registrant’s Annual Report on Form 10-K for the year ended December 28, 2002, and incorporated herein by reference).
4(e) Second Amendment to Credit Agreement between Cerner Corporation and U.S. Bank National Association as administrative agent and head arranger, and LaSalle Bank National Association, as documentation agent, dated as of July 22, 2002 (fi led as Exhibit 4(f) to Registrant’s Quarterly Report on From 10-A for the quarter ended June 28, 2003, and incorporated herein by reference).
4(f) Third Amendment to Credit Agreement between Cerner Corporation and U.S. Bank National Association as administrative agent and head arranger, and LaSalle Bank National Association, as documentation agent, dated as of September 1, 2004 (fi led as Exhibit 99.1 to Registrant’s Form 8-K fi led on September 8, 2004, and incorporated herein by reference).
4(g) Fourth Amendment to Credit Agreement between Cerner Corporation and U.S. Bank National Association as administrative agent and head arranger, and LaSalle Bank National Association, as documentation agent, dated as of December 28, 2004 (fi led as Exhibit 99.1 to Registrant’s Form 8-K fi led on January 4, 2005, and incorporated herein by reference).
4(h) Cerner Corporation Note Agreement dated as of April 1, 1999 among Cerner Corporation, Principal Life Insurance Company, Principal Life Insurance Company, on behalf of one or more separate accounts, Commercial Union Life Insurance Company of America, Nippon Life Insurance Company of America, John Hancock Mutual Life Insurance Company, John Hancock Variable Life Insurance Company, and Investors Partner Life Insurance Company (fi led as Exhibit 4(e) to Registrant’s Form 8-K dated April 23, 1999, and incorporated herein by reference).
10(a) Incentive Stock Option Plan C of Registrant (fi led as Exhibit 10(f) to Registrant’s Annual Report on Form 10-K for the year ended December 31, 1993, and incorporated herein by reference).*
43
10(b) Indemnifi cation Agreements between the Registrant and Neal L. Patterson, Clifford W. Illig and Gerald E. Bisbee, Jr., Ph.D. (fi led as Exhibit 10(i) to Registrant’s Annual report on Form 10-K for the year ended December 31, 1992, and incorporated herein by reference).*
10(c) Indemnifi cation Agreement between Michael E. Herman and Registrant (fi led as Exhibit 10(i)(a) to Registrant’s Quarterly Report on Form 10-Q for the year ended June 29, 1996 and incorporated herein by reference).*
10(d) Indemnifi cation Agreement between John C. Danforth and Registrant (fi led as Exhibit 10(i)(b) to Registrant’s Quarterly Report on Form 10-Q for the year ended June 29, 1996 and incorporated herein by reference).*
10(e) Indemnifi cation Agreement between John C. Danforth and Registrant dated February 3, 2005 (fi led as Exhibit 99.1 to the Registrant’s Form 8-K dated February 3, 2005 and incorporated herein by reference).*
10(f) Indemnifi cation Agreement between Jeff C. Goldsmith, Ph.D. and Registrant (fi led as Exhibit 10(e) to Registrant’s Annual Report on Form 10-K for the year ended January 1, 2000 and incorporated herein by reference).*
10(g) Indemnifi cation Agreement between William B. Neaves, Ph.D. and Nancy-Ann DeParle and Registrant (fi led as Exhibits 10.1 and 10.2 to Registrant’s Form 10-Q for the quarter ended September 29, 2001 and incorporated herein by reference).*
10(h) Amended Stock Option Plan D of Registrant as of December 8, 2000 (fi led as Exhibit 10(f) to Registrant’s Annual Report on Form 10-K for the year ended December 30, 2000, and incorporated herein by reference).*
10(i) Amended Stock Option Plan E of Registrant as of December 8, 2000 (fi led as Exhibit 10(g) to Registrant’s Annual Report on Form 10-K for the year ended December 30, 2000, and incorporated herein by reference).*
10(j) Long-Term Incentive Plan for 1999 (fi led as Exhibit 10(l) to Registrant’s Annual Report on Form 10-K for the year ended January 2, 1999, and incorporated herein by reference).*
10(k) Cerner Corporation Executive Stock Purchase Plan (fi led as Exhibit 4(g) to Registrant’s Registration Statement on Form S-8 (File No. 333-77029) and incorporated herein by reference).*
10(l) Form of Stock Pledge Agreement for Cerner Corporation Executive Stock Purchase Plan (fi led as Exhibit 4(h) to Registrant’s Registration Statement on Form S-8 (File No. 333-77029) and incorporated herein by reference).*
10(m) Form of Promissory Note for Cerner Corporation Executive Stock Purchase Plan (fi led as Exhibit 4(i) to Registrant’s Registration Statement on Form S-8 (File No. 333-77029) and incorporated herein by reference).*
10(n) Employment Agreement of Earl H. Devanny, III (fi led as Exhibit 10(q) to Registrant’s Annual Report on Form 10-K for the year ended January 1, 2000, and incorporated herein by reference).*
10(o) Cerner Corporation 2001 Long-Term Incentive Plan F (fi led as Annex I to Registrant’s 2001 Proxy Statement and incorporated herein by reference).*
10(p) Cerner Corporation 2004 Long-Term Incentive Plan G (fi led as Annex I to Registrant’s 2004 Proxy Statement and incorporated herein by reference).*
10(q) Cerner Corporation 2001 Associate Stock Purchase Plan (fi led as Annex II Registrant’s 2001 Proxy Statement and incorporated herein by reference).*
10(r) Qualifi ed Performance-Based Compensation Plan (fi led as Exhibit 10(v) to Registrant’s Annual Report on Form 10-K for the year ended December 30, 2000, and incorporated herein by reference).*
10(s) Note Purchase Agreement between Cerner Corporation and the purchasers therein, dated December 15, 2002 (fi led as Exhibit 10(x) to Registrant’s Annual Report on Form 10-K for the year ended December 28, 2002, and incorporated herein by reference).
10(t) Cerner Corporation Executive Deferred Compensation Plan (fi led as Exhibit 10(y) to Registrant’s Annual Report on Form 10-K for the year ended December 28, 2002, and incorporated herein by reference).
10(u) Cerner Corporation Enhanced Severance Pay Plan and Summary Plan Description dated October 14, 2003. (fi led as Exhibit 10(a) to Registrant’s Quarterly Report on Form 10-Q for the quarter ended June 28, 2003, and is incorporated herein by reference).
10(v) Cerner Corporation 2001 Long-Term Incentive Plan F Nonqualifi ed Stock Option Agreement. *
10(w) Cerner Corporation 2001 Long-Term Incentive Plan F Nonqualifi ed Stock Option Director Agreement. *
10(x) Cerner Corporation 2001 Long-Term Incentive Plan F Director Restricted Stock Agreement.*
10(y) 2005 Executive Cerner Performance Plan. *
* Management contracts or compensatory plans or arrangements required to be identifi ed by Item15(a)(3)(b)
11 Computation of Registrant’s Earnings Per Share. (Exhibit omitted. Information contained in notes to consolidated fi nancial statements.)
21 Subsidiaries of Registrant.

44
23 Consent of Independent Registered Public Accounting Firm
31.1 Certifi cation of Neal L. Patterson, Chairman of the Board and Chief Executive Offi cer, pursuant to Section 302 of the Sarbanes-Oxley Act of 2002.
31.2 Certifi cation of Marc G. Naughton, Chief Financial Offi cer, pursuant to Section 302 of the Sarbanes-Oxley Act of 2002.
32.1 Certifi cation pursuant to 18 U.S.C. Section. 1350, as adopted pursuant to Section 906 of the Sarbanes-Oxley Act of 2002.
32.2 Certifi cation pursuant to 18 U.S.C. Section. 1350, as adopted pursuant to Section 906 of the Sarbanes-Oxley Act of 2002.
(b) Exhibits. The response to this portion of Item 15 is submitted as a separate section of this report.
(c) Financial Statement Schedules. The response to this portion of Item 15 is submitted as a separate section of this report.

45
SIGNATURESPursuant to the requirements of Section 13 or 15(d) of the Securities Exchange Act of 1934, the registrant has duly caused this report to be signed on its behalf by the undersigned, thereunto duly authorized.
CERNER CORPORATION
Dated: March 17, 2005 By:_/s/ Neal L. Patterson___________
Neal L. Patterson
Chairman of the Board and Chief Executive Offi cer
Pursuant to the requirements of the Securities Exchange Act of 1934, this report has been signed below by the following persons on behalf of the registrant and in the capacities and on the dates indicated:
Signature and Titleignature and Title Date
____/s/Neal L. Patterson______________ March 17, 2005
Neal L. Patterson, Chairman of the Board and
Chief Executive Offi cer (Principal Executive Offi cer)
____/s/Clifford W. Illig_________________ March 17, 2005
Clifford W. Illig, Vice Chairman and Director
____/s/Marc G. Naughton_______________ March 17, 2005
Marc G. Naughton, Senior Vice President and
Chief Financial Offi cer (Principal Financial and Accounting Offi cer)
____/s/Michael E. Herman_______ March 17, 2005
Michael E. Herman, Director
____/s/Gerald E. Bisbee_________________ March 17, 2005
Gerald E. Bisbee, Jr., Ph.D., Director
____/s/John C. Danforth_________________ March 17, 2005
John C. Danforth, Director
____/s/ Jeff C. Goldsmith________________ March 17, 2005
Jeff C. Goldsmith, Ph.D., Director
____/s/ William B. Neaves_______________ March 17, 2005
William B. Neaves, Ph.D., Director
____/s/Nancy-Ann DeParle_______________ March 17, 2005
Nancy-Ann DeParle, Director
46
Report of Independent Registered Public Accounting Firm The Board of Directors and Stockholders
Cerner Corporation:
We have audited management’s assessment, included in the accompanying Management’s Report on Internal Control over Financial Reporting, that Cerner Corporation (the Corporation) maintained effective internal control over fi nancial reporting as of January 1, 2005, based on criteria established in Internal Control—Integrated Framework issued by the Committee of Sponsoring Organizations of the Treadway Commission (COSO). The Corporation’s management is responsible for maintaining effective internal control over fi nancial reporting and for its assessment of the effectiveness of internal control over fi nancial reporting. Our responsibility is to express an opinion on management’s assessment and an opinion on the effectiveness of the Corporation’s internal control over fi nancial reporting based on our audit.
We conducted our audit in accordance with the standards of the Public Company Accounting Oversight Board (United States). Those standards require that we plan and perform the audit to obtain reasonable assurance about whether effective internal control over fi nancial reporting was maintained in all material respects. Our audit included obtaining an understanding of internal control over fi nancial reporting, evaluating management’s assessment, testing and evaluating the design and operating effectiveness of internal control, and performing such other procedures as we considered necessary in the circumstances. We believe that our audit provides a reasonable basis for our opinion.
A company’s internal control over fi nancial reporting is a process designed to provide reasonable assurance regarding the reliability of fi nancial reporting and the preparation of fi nancial statements for external purposes in accordance with generally accepted accounting principles. A company’s internal control over fi nancial reporting includes those policies and procedures that (1) pertain to the maintenance of records that, in reasonable detail, accurately and fairly refl ect the transactions and dispositions of the assets of the company; (2) provide reasonable assurance that transactions are recorded as necessary to permit preparation of fi nancial statements in accordance with generally accepted accounting principles, and that receipts and expenditures of the company are being made only in accordance with authorizations of management and directors of the company; and (3) provide reasonable assurance regarding prevention or timely detection of unauthorized acquisition, use, or disposition of the company’s assets that could have a material effect on the fi nancial statements.
Because of its inherent limitations, internal control over fi nancial reporting may not prevent or detect misstatements. Also, projections of any evaluation of effectiveness to future periods are subject to the risk that controls may become inadequate because of changes in conditions, or that the degree of compliance with the policies or procedures may deteriorate.
In our opinion, management’s assessment that Cerner Corporation maintained effective internal control over fi nancial reporting as of January 1, 2005, is fairly stated, in all material respects, based on criteria established in Internal Control—Integrated Framework issued by the Committee of Sponsoring Organizations of the Treadway Commission (COSO). Also, in our opinion, Cerner Corporation maintained, in all material respects, effective internal control over fi nancial reporting as of January 1, 2005, based on criteria established in Internal Control—Integrated Framework issued by the Committee of Sponsoring Organizations of the Treadway Commission (COSO).
We also have audited, in accordance with the standards of the Public Company Accounting Oversight Board (United States), the consolidated balance sheets of Cerner Corporation and subsidiaries as of January 1, 2005 and January 3, 2004, and the related consolidated statements of operations, changes in equity, and cash fl ows for each of the years in the three-year period ended January 1, 2005, and our report dated March 11, 2005 expressed an unqualifi ed opinion on those consolidated fi nancial statements.
(signed) KPMG LLP
Kansas City, Missouri
March 11, 2005
Report of Independent Registered Public Accounting Firm The Board of Directors and Stockholders
Cerner Corporation:
We have audited the accompanying consolidated balance sheets of Cerner Corporation and subsidiaries (the Corporation) as of January 1, 2005 and January 3, 2004, and the related consolidated statements of operations, changes in equity, and cash fl ows for each of the years in the three-year period ended January 1, 2005. These consolidated fi nancial statements are the responsibility of the Corporation’s management. Our responsibility is to express an opinion on these consolidated fi nancial statements based on our audits.
We conducted our audits in accordance with the standards of the Public Company Accounting Oversight Board (United States). Those standards require that we plan and perform the audit to obtain reasonable assurance about whether the fi nancial statements are free of material misstatement. An audit

47
includes examining, on a test basis, evidence supporting the amounts and disclosures in the fi nancial statements. An audit also includes assessing the accounting principles used and signifi cant estimates made by management, as well as evaluating the overall fi nancial statement presentation. We believe that our audits provide a reasonable basis for our opinion.
In our opinion, the consolidated fi nancial statements referred to above present fairly, in all material respects, the fi nancial position of Cerner Corporation and subsidiaries as of January 1, 2005 and January 3, 2004, and the results of their operations and their cash fl ows for each of the years in the three-year period ended January 1, 2005, in conformity with U.S. generally accepted accounting principles.
We also have audited, in accordance with the standards of the Public Company Accounting Oversight Board (United States), the effectiveness of Cerner Corporation’s internal control over fi nancial reporting as of January 1, 2005, based on criteria established in Internal Control—Integrated Framework issued by the Committee of Sponsoring Organizations of the Treadway Commission (COSO), and our report dated March 11, 2005 expressed an unqualifi ed opinion on management’s assessment of, and the effective operation of, internal control over fi nancial reporting.
(signed) KPMG LLP
Kansas City, Missouri
March 11, 2005
Management’s ReportThe management of Cerner Corporation is responsible for the consolidated fi nancial statements and all other information presented in this report. The fi nancial statements have been prepared in conformity with U.S. generally accepted accounting principles appropriate to the circumstances, and, therefore, included in the fi nancial statements are certain amounts based on management’s informed estimates and judgments. Other fi nancial information in this report is consistent with that in the consolidated fi nancial statements. The consolidated fi nancial statements have been audited by Cerner Corporation’s independent certifi ed public accountants and have been reviewed by the audit committee of the Board of Directors.

48
Consolidated Balance SheetsJanuary 1, 2005 and January 3, 2004
2004 2003 (In thousands except shares and per share data) (In thousands except shares and per share data) (In thousands except shares and per share data) (In thousands except shares and per share data) Assets Assets Current Assets: Current Assets: Cash and cash equivalents $ 189,784 121,839 Cash and cash equivalents $ 189,784 121,839 Receivables, net 282,199 256,574 Receivables, net 282,199 256,574 Inventory 7,373 12,434 Inventory 7,373 12,434 Prepaid expenses and other Prepaid expenses and other 30,117 33,044 Total current assets 509,473 423,891 Total current assets 509,473 423,891 Property and equipment, net 230,440 204,953 Property and equipment, net 230,440 204,953 Software development costs, net 157,765 141,090 Software development costs, net 157,765 141,090 Goodwill, net 54,600 51,573 Goodwill, net 54,600 51,573 Intangible assets, net 22,690 24,036 Intangible assets, net 22,690 24,036 Other assets Other assets 7,297 8,709
Total Assets $ Total Assets $ 982,265 854,252
Liabilities and Stockholders’ Equity Liabilities and Stockholders’ Equity Current Liabilities: Current Liabilities: Accounts payable $ 37,008 20,753 Accounts payable $ 37,008 20,753 Current installments of long-term debt 21,908 21,162 Current installments of long-term debt 21,908 21,162 Deferred revenue 77,445 64,879 Deferred revenue 77,445 64,879 Deferred income taxes 430 15,586 Deferred income taxes 430 15,586 Accrued payroll and tax withholdings 55,819 45,004 Accrued payroll and tax withholdings 55,819 45,004 Other accrued expenses Other accrued expenses 6,634 10,095 Total current liabilities 199,244 177,479 Total current liabilities 199,244 177,479 Long-term debt 108,804 124,570 Long-term debt 108,804 124,570 Deferred income taxes 69,863 54,412 Deferred income taxes 69,863 54,412 Deferred revenue 5,703 1,945 Deferred revenue 5,703 1,945 Minority owners’ equity interest in subsidiary 1,166 1,166 Minority owners’ equity interest in subsidiary 1,166 1,166 Stockholders’ Equity: Stockholders’ Equity: Common stock, $.01 par value,150,000,000 shares authorized, Common stock, $.01 par value,150,000,000 shares authorized, 38,139,881 and 37,057,364 shares issued in 2004 and 38,139,881 and 37,057,364 shares issued in 2004 and 2003, respectively 381 371 2003, respectively 381 371 Additional paid-in capital 271,116 236,969 Additional paid-in capital 271,116 236,969 Retained earnings 344,011 279,363 Retained earnings 344,011 279,363 Treasury stock, at cost (1,502,999 shares in 2004 and 2003) (26,793) (26,793) Treasury stock, at cost (1,502,999 shares in 2004 and 2003) (26,793) (26,793) Accumulated other comprehensive income: Accumulated other comprehensive income: Foreign currency effects on cash and cash equivalents Foreign currency effects on cash and cash equivalents 8,770 4,770 Total stockholders’ equity Total stockholders’ equity 597,485 494,680
Commitments Total liabilities and stockholders’ equity $ Total liabilities and stockholders’ equity $ 982,265 854,252
See notes to consolidated fi nancial statements.
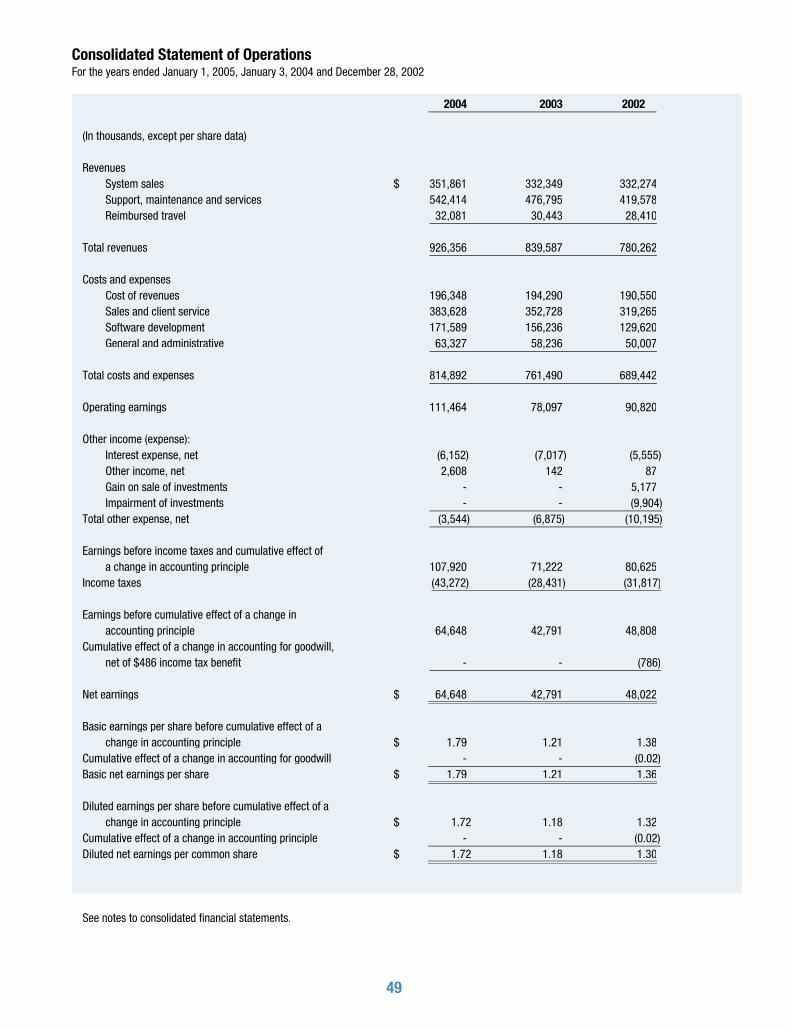
49
2004 2003 2002 (In thousands, except per share data) Revenues System sales $ 351,861 332,349 332,274 Support, maintenance and services 542,414 476,795 419,578 Reimbursed travel 32,081 30,443 28,410 Total revenues 926,356 839,587 780,262 Costs and expenses Cost of revenues 196,348 194,290 190,550 Sales and client service 383,628 352,728 319,265 Software development 171,589 156,236 129,620 General and administrative 63,327 58,236 50,007 Total costs and expenses 814,892 761,490 689,442 Operating earnings 111,464 78,097 90,820 Other income (expense): Interest expense, net (6,152) (7,017) (5,555) Other income, net 2,608 142 87 Gain on sale of investments - - 5,177 Impairment of investments - - (9,904)Total other expense, net (3,544) (6,875) (10,195) Earnings before income taxes and cumulative effect of a change in accounting principle 107,920 71,222 80,625Income taxes (43,272) (28,431) (31,817) Earnings before cumulative effect of a change in accounting principle 64,648 42,791 48,808Cumulative effect of a change in accounting for goodwill, net of $486 income tax benefi t - - (786) Net earnings $ 64,648 42,791 48,022 Basic earnings per share before cumulative effect of a change in accounting principle $ 1.79 1.21 1.38Cumulative effect of a change in accounting for goodwill - - (0.02)Basic net earnings per share $ 1.79 1.21 1.36 Diluted earnings per share before cumulative effect of a change in accounting principle $ 1.72 1.18 1.32Cumulative effect of a change in accounting principle - - (0.02)Diluted net earnings per common share $ 1.72 1.18 1.30
See notes to consolidated fi nancial statements.
Consolidated Statement of OperationsFor the years ended January 1, 2005, January 3, 2004 and December 28, 2002
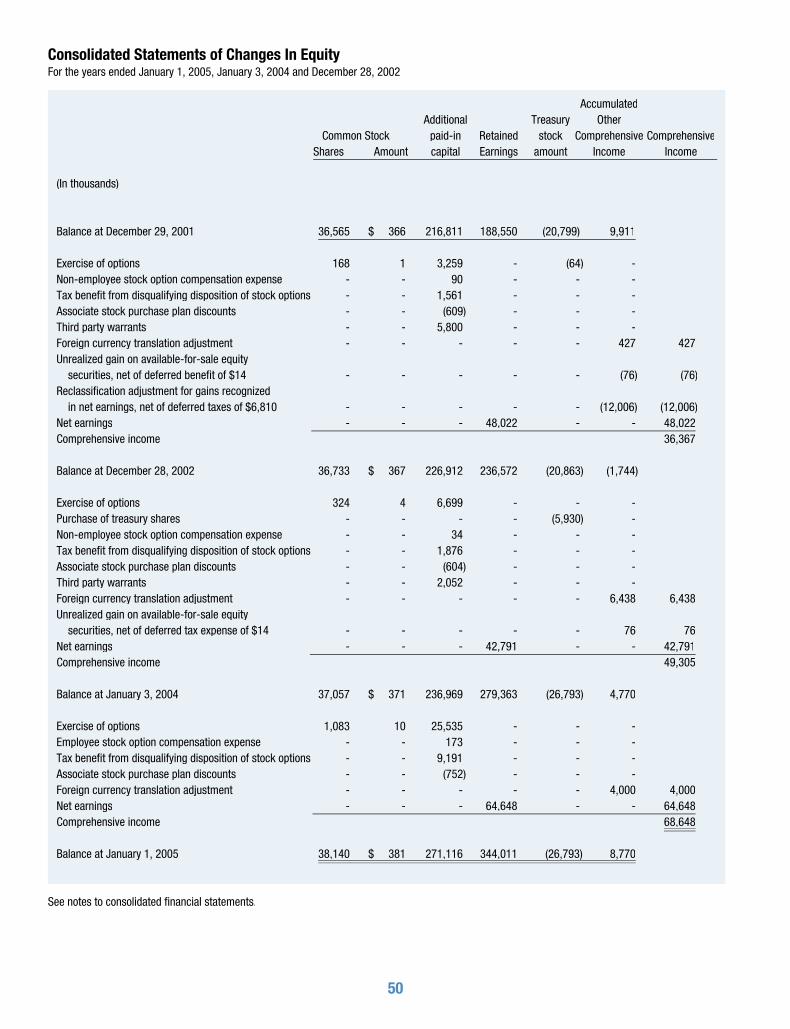
50
Consolidated Statements of Changes In EquityFor the years ended January 1, 2005, January 3, 2004 and December 28, 2002
Accumulated Additional Treasury Other Common Stock paid-in Retained stock Comprehensive Comprehensive
Shares Amount capital Earnings amount Income Income (In thousands) Balance at December 29, 2001 36,565 $ 366 216,811 188,550 (20,799) 9,911 Exercise of options 168 1 3,259 - (64) - Non-employee stock option compensation expense - - 90 - - - Tax benefi t from disqualifying disposition of stock options - - 1,561 - - - Associate stock purchase plan discounts - - (609) - - - Third party warrants - - 5,800 - - - Foreign currency translation adjustment - - - - - 427 427 Unrealized gain on available-for-sale equity securities, net of deferred benefi t of $14 - - - - - (76) (76) Reclassifi cation adjustment for gains recognized in net earnings, net of deferred taxes of $6,810 - - - - - (12,006) (12,006) Net earnings - - - 48,022 - - 48,022 Comprehensive income 36,367 Balance at December 28, 2002 36,733 $ 367 226,912 236,572 (20,863) (1,744) Exercise of options 324 4 6,699 - - - Purchase of treasury shares - - - - (5,930) - Non-employee stock option compensation expense - - 34 - - - Tax benefi t from disqualifying disposition of stock options - - 1,876 - - - Associate stock purchase plan discounts - - (604) - - - Third party warrants - - 2,052 - - - Foreign currency translation adjustment - - - - - 6,438 6,438 Unrealized gain on available-for-sale equity securities, net of deferred tax expense of $14 - - - - - 76 76 Net earnings - - - 42,791 - - 42,791 Comprehensive income 49,305 Balance at January 3, 2004 37,057 $ 371 236,969 279,363 (26,793) 4,770 Exercise of options 1,083 10 25,535 - - - Employee stock option compensation expense - - 173 - - - Tax benefi t from disqualifying disposition of stock options - - 9,191 - - - Associate stock purchase plan discounts - - (752) - - - Foreign currency translation adjustment - - - - - 4,000 4,000 Net earnings - - - 64,648 - - 64,648 Comprehensive income 68,648 Balance at January 1, 2005 38,140 $ 381 271,116 344,011 (26,793) 8,770 See notes to consolidated fi nancial statements.

51
Consolidated Statements of Cash FlowsFor the years ended January 1, 2005, January 3, 2004 and December 28, 2002
2004 2003 2002 (In thousands) CASH FLOWS FROM OPERATING ACTIVITIES Net earnings $ 64,648 42,791 48,022 Adjustments to reconcile net earnings to net cash provided by operating activities: Depreciation and amortization 90,802 69,330 57,346 Gain on sale of business (3,023) - - Impairments of investments - - 9,904 Realized gain on sale of stock - - (5,177) Impairment of goodwill - - 1,272 Non-employee stock option compensation expense - 34 90 Provision for deferred income taxes 295 21,317 8,710 Payment of tax on gain from the sale of WebMD - - (31,200) Tax benefi t from disqualifying dispositions of stock options 9,191 1,876 1,561 Changes in operating assets and liabilities (net of businesses acquired): Receivables, net (24,747) 20,723 (50,364) Inventory 3,924 (3,393) (2,762) Prepaid expenses and other (20,743) (201) (13,302) Accounts payable 9,474 (30,663) 20,648 Accrued income taxes 15,919 (5,187) 1,791 Deferred revenue 16,055 22,561 (12,203) Other current liabilities 6,509 (5,038) 2,570 Total adjustments 103,656 91,359 (11,116) Net cash provided by operating activities 168,304 134,150 36,906 CASH FLOWS FROM INVESTING ACTIVITIES Purchase of capital equipment (44,214) (26,831) (33,235) Purchase of land, buildings, and improvements (12,276) (56,752) (26,464) Acquisition of businesses, net of cash received (1,957) (6,380) (26,016) Proceeds from the sale of business 12,000 - - Proceeds from sale of available for sale securities - - 95,134 Issuance of notes receivable - - (156) Repayment of notes receivable 1,977 651 451 Capitalized software development costs (58,912) (58,736) (49,984) Net cash used in investing activities (103,382) (148,048) (40,270) CASH FLOWS FROM FINANCING ACTIVITIES Proceeds from issuance of long-term debt - 320 70,102 Repayment of long-term debt (24,879) (13,238) (41,032) Proceeds from third party warrants - 2,052 5,800 Purchase of treasury shares - (5,930) - Proceeds from exercise of options 25,717 6,703 3,196 Associate stock purchase plan discounts (752) (604) (609) Net cash provided by (used in) fi nancing activities 86 (10,697) 37,457 Foreign currency translation adjustment 2,937 3,740 914 Increase in cash from the consolidation of a variable interest entity - 151 - Net increase (decrease) in cash and cash equivalents 67,945 (20,704) 35,007 Cash and cash equivalents at beginning of year 121,839 142,543 107,536 Cash and cash equivalents at end of year $ 189,784 121,839 142,543 Supplemental disclosures of cash fl ow information Supplemental disclosures of cash fl ow information Cash paid during the year for: Interest $ 8,614 7,984 6,937 Income taxes, net of refund 21,865 10,426 49,484 Noncash investing and fi nancing activities Issuance of note payable for unused software credits $ 7,500 - - Acquisition of equipment through capital leases 2,075 9,811 - See notes to consolidated fi nancial statements.

52
1 Summary of Signifi cant Accounting Policies(a) Principles of Consolidation - The consolidated fi nancial statements include the accounts of Cerner Corporation and its wholly-owned subsidiaries (the “Company”). All signifi cant intercompany transactions and balances have been eliminated in consolidation.
(b) Nature of Operations - The Company designs, develops, markets, installs, hosts and supports software information technology and content solutions for healthcare organizations and consumers. The Company also implements these solutions as individual, combined or enterprise-wide systems.
(c) Revenue Recognition - Revenues are derived primarily from the sale of clinical, fi nancial and administrative information systems and solutions. The components of the system sales revenues are the licensing of computer software, installation, subscription content and the sale of computer hardware and sublicensed software. The components of support, maintenance and service revenues are software support and hardware maintenance, remote hosting and outsourcing, training, consulting and implementation services.
The Company recognizes revenue in accordance with the provisions of Statement of Position (SOP) 97-2, “Software Revenue Recognition,” as amended by SOP 98-4, SOP 98-9 and clarifi ed by Staff Accounting Bulletin’s (SAB) 101 “Revenue Recognition in Financial Statements” and SAB No. 104 “Revenue Recognition” and Emerging Issues Task Force Issue No. 00-21 “Accounting for Revenue Arrangements with Multiple Deliverables” (“EITF 00-21”). SOP 97-2, as amended, generally requires revenue earned on software arrangements involving multiple-elements to be allocated to each element based on the relative fair values of those elements. Revenue from multiple-element software arrangements is recognized using the residual method. Under the residual method, revenue is recognized in a multiple-element arrangement when Company-specifi c objective evidence of fair value exists for all of the undelivered elements in the arrangement (i.e. professional services, software support, hardware maintenance, hardware and sublicensed software), but does not exist for one or more of the delivered elements in the arrangement (i.e. software solutions). The Company allocates revenue to each element in a multiple-element arrangement based on the element’s respective fair value, with the fair value determined by the price charged when that element is sold separately. Specifi cally, the Company determines the fair value of the software support and maintenance portion of the arrangement based on the renewal price of the software support and maintenance charged to clients; professional services portion of the arrangement, other than installation services, based on hourly rates which the Company charges for these services when sold apart from a software license; and, the hardware and sublicensed software, based on the prices for these elements when they are sold separately from the software. If evidence of the fair value cannot be established for the undelivered elements of a license agreement, the entire amount of revenue under the arrangement is deferred until these elements have been delivered or objective evidence can be established.
Inherent in the revenue recognition process are signifi cant management estimates and judgments, which infl uence the timing and the amount of revenue recognition. The Company provides several models for the procurement of its clinical, fi nancial and administrative information systems. The predominant method is a perpetual software license agreement, project-related installation services, implementation and consulting services, computer hardware and sublicensed software and software support. For those arrangements involving the use of services, the Company uses the percentage of completion method of accounting, following the guidance in the AICPA Statement of Position 81-1 (SOP 81-1), Accounting for Performance of Construction-Type and Certain Production-Type Contracts, as prescribed by 97-2.
The Company provides installation services, which include project-scoping services, conducting pre-installation audits and creating initial environments. Because installation services are deemed to be essential to the functionality of the software, software license and installation services fees are recognized over the software installation period using output measures which refl ect direct labor hours incurred, beginning at software delivery and culminating at completion of installation, typically a three-to-nine month process.
The Company also provides implementation and consulting services, which include consulting activities that fall outside of the scope of the standard installation services. These services vary depending on the scope and complexity requested by the client. Examples of such services may include additional database consulting, system confi guration, project management, testing assistance, network consulting, post conversion review and application management services. Implementation and consulting services generally are not deemed to be essential to the functionality of the software, and thus do not impact the timing of the software license recognition, unless software license fees are tied to implementation milestones. In those instances, the portion of the software license fee tied to implementation milestones is deferred until the related milestone is accomplished and related fees become billable and non-forfeitable. Implementation fees are recognized over the service period, which may extend from nine months to three years for multi-phased projects.
Managed services are marketed under long-term arrangements generally over periods of fi ve to 10 years. These services typically include a perpetual license for software that the client has elected the Company to host in its data center. Vendor-specifi c objective evidence for hosting and outsourcing services are established through renewal rates in the arrangements. The Company accounts for revenues from these arrangements as the services are performed in accordance with EITF Issue No. 00-3, Application of AICPA Statement of Position 97-2 to Arrangements That Include the Right to Use Software Stored on Another Entity’s Hardware.
The Company also offers its solutions on an application service provider (“ASP”) or a term license basis, making available Company software functionality on a remote processing basis from the Company’s data centers. The data centers provide system and administrative support as well as processing services. Revenue on software and services provided on an ASP or term license basis is recognized on a monthly basis over the term of the contract. The Company capitalizes related direct costs consisting of third-party costs and direct software installation and implementation costs. These costs are amortized over the term of the arrangement.

53
Software support fees are marketed under annual and multi-year arrangements and are recognized as revenue ratably over the contracted support term. Hardware maintenance revenues are billed and recognized monthly over the contracted maintenance term.
Subscription and content fees are generally marketed under annual and multi-year agreements and are recognized ratably over the contracted terms.
Hardware and sublicensed software sales are generally recognized when title passes to the client.
Where the Company has contractually agreed to develop new or customized software code for a client as a single element arrangement, the Company utilizes percentage of completion accounting in accordance with SOP 81-1. If a contract includes multiple elements, including one or more undelivered element, or if the agreement includes contingent revenue (as defi ned in EITF 00-21), the Company complies with the provisions of EITF 00-21 and delays revenue recognition until undelivered elements are delivered and revenue contingencies expire. When revenue is deferred all direct and incremental costs associated with the arrangement are capitalized and amortized over the contractual term once revenue recognition commences.
Deferred revenue is comprised of deferrals for license fees, support, maintenance and other services for which payment has been received and for which the service has not yet been performed. Long-term deferred revenue at January 1, 2005, represents amounts received from license fees, maintenance and other services to be earned or provided beginning in periods on or after January 1, 2006.
The Company incurs out-of-pocket expenses in connection with its client service activities, primarily travel, which are reimbursed by its clients. The amounts of ”out-of-pocket” expenses and equal amounts of related reimbursements were $32,081,000, $30,443,000 and $28,410,000 for the years ended January 1, 2005, January 3, 2004 and December 28, 2002, respectively.
The Company’s arrangements with clients typically include a deposit due upon contract signing and date-based licensed software payment terms and payments based upon delivery for services, hardware and sublicensed software. The Company has periodically provided long-term fi nancing options to creditworthy clients through third party fi nancing institutions and has on occasion directly provided extended payment terms from contract date. Certain of these receivables have been assigned on a non-recourse basis to third party fi nancing institutions. The Company accounts for the assignment of these receivables as “true sales” as defi ned in FASB Statement No. 140, Accounting for Transfers and Servicing of Financial Assets and Extinguishments of Liabilities. Provided all other revenue recognition criteria have been met, the Company recognizes revenue for these arrangements under its normal revenue recognition criteria, net of any payment discounts from fi nancing transactions.
The terms of the Company’s software license agreements with its clients generally provide for a limited indemnifi cation of such intellectual property against losses, expenses and liabilities arising from third-party claims based on alleged infringement by the Company’s solutions of an intellectual property right of such third party. The terms of such indemnifi cation often limit the scope of and remedies for such indemnifi cation obligations and generally include a right to replace or modify an infringing solution. To date, the Company has not had to reimburse any of its clients for any losses related to these indemnifi cation provisions pertaining to third-party intellectual property infringement claims. For several reasons, including the lack of prior indemnifi cation claims and the lack of a monetary liability limit for certain infringement cases under the terms of the corresponding agreements with its clients, the Company cannot determine the maximum amount of potential future payments, if any, related to such indemnifi cation provisions.
(d) Fiscal Year - The Company’s fi scal year ends on the Saturday closest to December 31. Fiscal year 2003 consisted of 53 weeks and fi scal years 2004 and 2002 consisted of 52 weeks each. All references to years in these notes to consolidated fi nancial statements represent fi scal years unless otherwise noted.
(e) Software Development Costs - Costs incurred internally in creating computer software products are expensed until technological feasibility has been established upon completion of a detailed program design. Thereafter, all software development costs are capitalized and subsequently reported at the lower of amortized cost or net realizable value. Capitalized costs are amortized based on current and expected future revenue for each product with minimum annual amortization equal to the straight-line amortization over the estimated economic life of the product. The Company is amortizing capitalized costs over fi ve years. During 2004, 2003 and 2002, the Company capitalized $58,912,000, $58,736,000 and $49,984,000, respectively, of total software development costs of $188,264,000, $179,999,000 and $149,985,000, respectively. Amortization expense of capitalized software development costs in 2004, 2003 and 2002, was $42,237,000, $34,973,000 and $29,619,000, respectively, and accumulated amortization was $207,382,000, $165,145,000 and $130,172,000, respectively.
(f) Cash Equivalents - Cash equivalents consist of short-term marketable securities with original maturities less than ninety days.
(g) Inventory - Inventory consists primarily of computer hardware and sub-licensed software held for resale and is recorded at the lower of cost (fi rst-in, fi rst-out) or market.
(h) Property and Equipment - Property, equipment and leasehold improvements are stated at cost. Depreciation of property and equipment is computed using the straight-line method over periods of 3 to 50 years. Amortization of leasehold improvements is computed using a straight-line method over the lease terms, which range from periods of two to fi fteen years.
(i) Earnings per Common Share - Basic earnings per share (EPS) excludes dilution and is computed by dividing income available to common stockholders by the weighted-average number of common shares outstanding for the period. Diluted EPS refl ects the potential dilution that could occur if securities or other contracts to issue stock were exercised or converted into common stock or resulted in the issuance of common stock that then shared in the earnings of the Company. A reconciliation of the numerators and the denominators of the basic and diluted per-share computations is as follows:

54
(In thousands, except per share data) (In thousands, except per share data)
2004 2003 2002
Earnings Shares Per-Share Earnings Shares Per-Share Earnings Shares Per-Share Earnings Shares Per-Share Earnings Shares Per-Share Earnings Shares Per-Share (Numerator) (Denominator) Amount (Numerator) (Denominator) Amount (Numerator) (Denominator) Amount
Earnings per share before cumulative effect of a change in accounting principle Basic earnings per shareBasic earnings per share
Income available to Income available to common stockholders $ 64,648 36,087 common stockholders $ 64,648 36,087 $ 1.79 $ 42,791 35,355 $ 1.21 $ 48,808 35,458 $ 1.38 Effect of dilutive securities Effect of dilutive securities stock options 1,484 1,001 1,592 stock options 1,484 1,001 1,592
Diluted earnings per share
Income available to common Income available to common
stockholders including stockholders including
assumed conversions assumed conversions $ 64,648 37,571 $ 1.72 $ 42,791 36,356 $ 1.18 $ 48,808 37,050 $ 1.32
Net earnings per share Net earnings per share
Basic earnings per share
Income available to Income available to common stockholders $ 64,648 36,087 common stockholders $ 64,648 36,087 $ 1.79 $ 42,791 35,355 $ 1.21 $ 48,022 35,458 $ 1.36 Effect of dilutive securities Effect of dilutive securities stock options 1,484 1,001 1,592 stock options 1,484 1,001 1,592 stock options 1,484 1,001 1,592
Diluted earnings per share
Income available to common Income available to common Income available to common stockholders including stockholders including assumed conversions assumed conversions $ 64,648 37,571 $ 1.72 $ 42,791 36,356 $ 1.18 $ 48,022 37,050 $ 1.30
Options to purchase 1,569,000, 3,054,000 and 2,390,000 shares of common stock at per share prices ranging from $45.00 to $273.72, $32.50 to $574.82 and $43.13 to $574.82, were outstanding at the end of 2004, 2003 and 2002, respectively, but were not included in the computation of diluted earnings per share because the options’ exercise price was greater than the average market price of the common shares for the period.
(j) Foreign Currency - Assets and liabilities of foreign subsidiaries whose functional currency is the local currency are translated into U.S. dollars at exchange rates prevailing at the balance sheet date. Revenues and expenses are translated at average exchange rates for the year. The net exchange differences resulting from these translations are reported in accumulated other comprehensive income. Gains and losses resulting from foreign currency transactions are included in the consolidated statements of operations. The net gain (loss) resulting from foreign currency transactions was ($479,000), $1,376,000 and $1,955,000 in 2004, 2003 and 2002, respectively.
(k) Income Taxes - Deferred tax assets and liabilities are recognized for the future tax consequences attributable to differences between the fi nancial statement carrying amounts of existing assets and liabilities and their respective tax bases. Deferred tax assets and liabilities are measured using enacted tax rates expected to apply to taxable income in the years in which those temporary differences are expected to be recovered or settled.
(l) Goodwill and Other Intangible Assets - The Company accounts for goodwill under the provisions of Statement of Financial Accounting Standards (SFAS) No. 142, “Goodwill and Other Intangible Assets.” As a result, goodwill and intangible assets with indefi nite lives are no longer amortized but are evaluated for impairment annually or whenever there is an impairment indicator. All goodwill is assigned to a reporting unit, where it is subject to an impairment test based on fair value. The Company assesses its goodwill for impairment in the second quarter of its fi scal year. There was no impairment of goodwill in 2004 and 2003. The Company used a discounted cash fl ow analysis to determine the fair value of the reporting units for all periods tested. The Company’s intangible assets, other than goodwill or intangible assets with indefi nite lives, are all subject to amortization and are summarized as follows:
Earnings Shares Per-Share Earnings Shares Per-Share Earnings Shares Per-Share(Numerator) (Denominator) Amount (Numerator) (Denominator) Amount (Numerator) (Denominator) Amount
Income available to $ 42,791 35,355
Effect of dilutive securities stock options 1,484 1,001 1,592
Income available to common
$ 64,648 37,571 $ 1.72 $ 42,791 36,356 $ 1.18 $ 48,808 37,050 $ 1.32
Net earnings per share
Income available to $ 42,791 35,355
Effect of dilutive securities stock options 1,484 1,001 1,592
Income available to common $ 64,648 37,571 $ 1.72 $ 42,791 36,356 $ 1.18 $ 48,022 37,050 $ 1.30
Earnings Shares Per-Share Earnings Shares Per-Share Earnings Shares Per-Share(Numerator) (Denominator) Amount (Numerator) (Denominator) Amount (Numerator) (Denominator) Amount
Income available to $ 48,808 35,458
Effect of dilutive securities stock options 1,484 1,001 1,592
Income available to common
$ 64,648 37,571 $ 1.72 $ 42,791 36,356 $ 1.18 $ 48,808 37,050 $ 1.32
Net earnings per share
Income available to $ 48,022 35,458
Effect of dilutive securities stock options 1,484 1,001 1,592
Income available to common $ 64,648 37,571 $ 1.72 $ 42,791 36,356 $ 1.18 $ 48,022 37,050 $ 1.30

55
(In thousands)
January 1, 2005 January 3, 2004
Weighted Average Gross Gross Amortization Carrying Accumulated Carrying Accumulated Period(Yrs) Amount Amortization Amount Amortization Purchased software 5.0 $ 40,966 20,792 36,236 14,683
Customer lists 7.0 3,700 2,240 3,700 1,711
Patents 14.0 1,080 109 552 86
Non-compete agreements 5.0 125 40 50 22
Total 5.37 $ 45,871 23,181 40,538 16,502
Amortization expense was $6,679,000, $6,592,000 and $4,482,000 for the years ended 2004, 2003 and 2002, respectively.
Estimated aggregate amortization expense for each of the next fi ve years is as follows:
For year ended: 2005 $ 8,244 For year ended: 2005 $ 8,244
2006 6,454 2006 6,454
2007 4,535 2007 4,535
2008 2,414 2008 2,414
2009 689 2009 689
The changes in the carrying amount of goodwill for the 12 months ended January 1, 2005 are as follows:
Balance as of January 3, 2004 $ 51,573
Goodwill acquired 8,822
Goodwill of business divestiture (6,513)
Foreign currency translation adjustment and other 718
Balance as of January 1, 2005 $ 54,600
(m) Use of Estimates - The preparation of fi nancial statements in conformity with accounting principles generally accepted in the United States of America requires management to make estimates and assumptions that affect the reported amounts of assets and liabilities and disclosure of contingent assets and liabilities at the date of the fi nancial statements and the reported amounts of revenues and expenses during the reporting period. Actual results could differ from those estimates.
(n) Concentrations - Substantially all of the Company’s cash and cash equivalents and short-term investments, are held at three major U.S. fi nancial institutions. The majority of the Company’s cash equivalents consist of U.S. Government Federal Agency Securities, short-term marketable securities, and overnight repurchase agreements. Deposits held with banks may exceed the amount of insurance provided on such deposits. Generally these deposits may be redeemed upon demand and, therefore, bear minimal risk.
Substantially all of the Company’s clients are integrated delivery networks, hospitals, and other healthcare related organizations. If signifi cant adverse macro-economic factors were to impact these organizations it could materially adversely affect the Company. The Company’s access to certain software and hardware components is dependent upon single and sole source suppliers. The inability of any supplier to fulfi ll supply requirements of the Company could affect future results.
The Company performs ongoing credit evaluations of its clients and generally does not require collateral from its clients. The Company maintains an allowance for potential losses based on specifi c identifi cation, historical experience and management’s judgments. The Company’s allowance for doubtful accounts as of January 1, 2005 and January 3, 2004 was $17,583,000 and $12,056,000, respectively.
(o) Accounting for Stock Options - The Company applies the intrinsic-value-based method of accounting prescribed by Accounting Principles Board (APB) Opinion No. 25, “Accounting for Stock Issued to Employees,” and related interpretations including FASB Interpretation No. 44, “Accounting for

56
Certain Transactions involving Stock Compensation, an interpretation of APB Opinion No. 25,” issued in March 2000, to account for its fi xed-plan stock options. Under this method for fi xed awards, compensation expense is recorded on the date of grant only if the current market price of the underlying stock exceeded the exercise price. Statement of Financial Accounting Standards No. 123, “Accounting for Stock-Based Compensation,” established accounting and disclosure requirements using a fair-value-based method of accounting for stock-based employee compensation plans. As allowed by SFAS No. 123, the Company has elected to continue to apply the intrinsic-value-based method of accounting described above, and has adopted only the disclosure requirements of SFAS No. 123. The following is a reconciliation of reported net earnings to adjusted net earnings had the Company recorded compensation expense based on the fair value at the grant date for its stock options under SFAS 123 for the years ended 2004, 2003 and 2002.
(In thousands, except per share data)
2004 2003 2002
Reported net earnings $ 64,648 42,791 48,022
Less: stock-based compensation expense determined
under fair-value-based method for all awards, net of tax (7,903) (13,392) (16,640)
Adjusted net earnings 56,745 29,399 31,382
Basic earnings per share:
Reported net earnings $ 1.79 1.21 1.36
Less: stock-based compensation expense determined
under fair-value-based method for all awards, net of tax (.22) (.38) (.47)
Adjusted net earnings 1.57 .83 .89
Diluted earnings per share:
Reported net earnings $ 1.72 1.18 1.30
Less: stock-based compensation expense determined
under fair-value-based method for all awards (.21) (.37) (.45)
Adjusted net earnings 1.51 .81 .85
Pro forma net earnings refl ect only options granted since January 1, 1995. Therefore, the full impact of calculating compensation expense for stock options under FAS 123 is not refl ected in the pro forma net earnings amounts presented above, because compensation cost is refl ected over the options’ vesting period of 10 years for these options. Compensation expense for options granted prior to January 1, 1995 is not considered.
(p) Reclassifi cations – Certain prior year amounts have been reclassifi ed to conform to the current year consolidated fi nancial statement presentation.
(q) Accounting for Variable Interest Entities - On September 27, 2003, the Company adopted Financial Accounting Standards Board Interpretation No. 46 (“FIN 46”) as amended by FIN 46R, “Consolidation of Variable Interest Entities an Interpretation of APB No. 51.” The Interpretation provides guidance on the identifi cation of entities for which control is achieved through means other than through voting rights (“variable interest entities’” or “VIEs”) and how to determine when and which business enterprises should consolidate the VIE (the “primary benefi ciary”).

57
2 Business Acquisitions and DivestitureDuring the three years ended January 1, 2005, the Company completed fi ve acquisitions, which were accounted for under the purchase method of accounting. Pro forma results of operations have not been presented and will not be presented for any of the acquisitions because the effects of these acquisitions were not material to the Company on either an individual or an aggregate basis. The results of operations of each acquisition are included in the Company’s consolidated statement of operations from the date of each acquisition.
On March 15, 2004 the Company sold the referential content portion of Zynx Health Incorporated (Zynx) for $12 million. The Company retained the life sciences portion of the business, which is engaged in selling life sciences data to pharmaceutical companies for use in research, and the Company retained the rights to use the Zynx content in its solutions going forward. The sale of Zynx resulted in a gain of $1,826,000, net of $1,197,000 of tax, and has been included in Other Income, net in the accompanying consolidated statements of operations.
A summary of the Company’s purchase acquisitions for the three years ended January 1, 2005, is included in the following table (in millions, except share amounts):
Entity Name, Description of Business Acquired, Developed Form of Entity Name, Description of Business Acquired, Developed Form of Entity Name, Description of Business Acquired, Developed Form of Entity Name, Description of Business Acquired, Developed Form of Entity Name, Description of Business Acquired, Developed Form of Entity Name, Description of Business Acquired, Developed Form of
and Reason Business Acquired Date Consideration Goodwill Technology Consideration and Reason Business Acquired Date Consideration Goodwill Technology Consideration and Reason Business Acquired Date Consideration Goodwill Technology Consideration and Reason Business Acquired Date Consideration Goodwill Technology Consideration and Reason Business Acquired Date Consideration Goodwill Technology Consideration and Reason Business Acquired Date Consideration Goodwill Technology Consideration
Fiscal 2004 Acquisition
Project IMPACT CCM, Inc. (a) 2/04 $.3 $.7 $.6 $.3 cash Project IMPACT CCM, Inc. (a) 2/04 $.3 $.7 $.6 $.3 cash Project IMPACT CCM, Inc. (a) 2/04 $.3 $.7 $.6 $.3 cash Project IMPACT CCM, Inc. (a) 2/04 $.3 $.7 $.6 $.3 cash Project IMPACT CCM, Inc. (a) 2/04 $.3 $.7 $.6 $.3 cash Project IMPACT CCM, Inc. (a) 2/04 $.3 $.7 $.6 $.3 cash
ICU performance analysis and benchmarking
Integrate technology into Cerner Millennium
Gajema Software (a) 8/04 $1.5 $.6 $.8 $1.5 cash Gajema Software (a) 8/04 $1.5 $.6 $.8 $1.5 cash Gajema Software (a) 8/04 $1.5 $.6 $.8 $1.5 cash Gajema Software (a) 8/04 $1.5 $.6 $.8 $1.5 cash Gajema Software (a) 8/04 $1.5 $.6 $.8 $1.5 cash Gajema Software (a) 8/04 $1.5 $.6 $.8 $1.5 cash
Laboratory information management and logistics
Integrate technology into Cerner Millennium Cerner Millennium Cerner Millennium
Fiscal 2003 Acquisition Fiscal 2003 Acquisition Fiscal 2003 Acquisition Fiscal 2003 Acquisition Fiscal 2003 Acquisition Fiscal 2003 Acquisition
BeyondNow Technologies (a) 9/03
Home care technologies
Integrate technology into Cerner Millennium $7.5 $3.0 $3.2 $7.5 cash $7.5 $3.0 $3.2 $7.5 cash $7.5 $3.0 $3.2 $7.5 cash $7.5 $3.0 $3.2 $7.5 cash $7.5 $3.0 $3.2 $7.5 cash $7.5 $3.0 $3.2 $7.5 cash Cerner Millennium $7.5 $3.0 $3.2 $7.5 cash Cerner Millennium
Fiscal 2002 Acquisitions Fiscal 2002 Acquisitions Fiscal 2002 Acquisitions Fiscal 2002 Acquisitions Fiscal 2002 Acquisitions Fiscal 2002 Acquisitions
Image Devices GmbH (a) 10/02 $15.7 $11.9 $4.4 $14.3 cash Image Devices GmbH (a) 10/02 $15.7 $11.9 $4.4 $14.3 cash Image Devices GmbH (a) 10/02 $15.7 $11.9 $4.4 $14.3 cash Image Devices GmbH (a) 10/02 $15.7 $11.9 $4.4 $14.3 cash Image Devices GmbH (a) 10/02 $15.7 $11.9 $4.4 $14.3 cash Image Devices GmbH (a) 10/02 $15.7 $11.9 $4.4 $14.3 cash
Picture archiving and communication system software $1.4 note payable system software $1.4 note payable system software $1.4 note payable system software $1.4 note payable system software $1.4 note payable system software $1.4 note payable
Supplier of the image archive component for Cerner ProVision TM PACS PACS PACS
Zynx Health Incorporated (a) (b) 4/02 $15.0 $10.4 $3.3 $17.5 cash Zynx Health Incorporated (a) (b) 4/02 $15.0 $10.4 $3.3 $17.5 cash Zynx Health Incorporated (a) (b) 4/02 $15.0 $10.4 $3.3 $17.5 cash Zynx Health Incorporated (a) (b) 4/02 $15.0 $10.4 $3.3 $17.5 cash Zynx Health Incorporated (a) (b) 4/02 $15.0 $10.4 $3.3 $17.5 cash Zynx Health Incorporated (a) (b) 4/02 $15.0 $10.4 $3.3 $17.5 cash
Solutions and services that deliver the latest scientifi c knowledge and best practices $5 note payable scientifi c knowledge and best practices $5 note payable scientifi c knowledge and best practices $5 note payable scientifi c knowledge and best practices $5 note payable scientifi c knowledge and best practices $5 note payable scientifi c knowledge and best practices $5 note payable
Integrate technology into Cerner Millennium
Amounts allocated to intangibles are amortized on a straight-line basis over fi ve to seven years. Amounts allocated to software are amortized based on current and expected future revenues for each product with minimum annual amortization equal to the straight-line amortization over the estimated economic life of the product.

58
(a) The assets and liabilities of the acquired companies at the date of acquisition are as follows:
Project IMPACT Gajema BeyondNow Image Devices Zynx Health CCM, Inc. Software Technologies GmbH Incorporated
Current Assets 644,000 72,000 1,977,000 1,603,000 2,656,000
Total Assets 1,867,000 1,551,000 8,170,000 18,007,000 16,949,000
Current Liabilities 1,050,000 51,000 714,000 4,205,000 1,420,000
Total Liabilities 1,201,000 51,000 714,000 4,205,000 1,669,000
(b) In March 2004 the Company amended the April 2002 purchase agreement with Cedars-Sinai Medical Center (“Cedars”). The amendment requires the Company to pay at least $7.5 million in cash to Cedars related to the original purchase of Zynx, which resulted in $7.5 million of additional goodwill, along with up to $1 million in software discounts if Cedars chooses to license solutions from the Company. At January 1, 2005 the Company had made payments of $2.5 million to Cedars. The balance of the $7.5 million note will be payable on April 30, 2007.
On January 3, 2005, the Company completed the purchase of assets of the medical business division of VitalWorks, Inc. for $100 million, which was funded with existing cash of approximately $65 million and borrowings on the revolving line of credit of approximately $35 million. The medical business consists of delivering and supporting physician practice management, electronic medical record, electronic data interchange and emergency department information solutions and related products and services to physician practices, hospital emergency departments, management service organizations and other related entities. The Company is in the process of determining its allocation of the purchase price to the net assets acquired. A Form 8-K, disclosing the completion of the acquisition of assets was fi led with the Securities and Exchange Commission on January 7, 2005, and an amended 8-K refl ecting pro forma fi nancials will not be fi led as explained above.
3 ReceivablesReceivables consist of accounts receivable and contracts receivable. Accounts receivable represent recorded revenues that have been billed. Contracts receivable represent recorded revenues that are billable by the Company at future dates under the terms of a contract with a client. Billings and other consideration received on contracts in excess of related revenues recognized are recorded as deferred revenue. A summary of receivables is as follows:
(In thousands) 2004 2003
Accounts receivable, net of allowance $ 185,290 162,234
Contracts receivable 96,909 94,340
Total receivables, net $ 282,199 256,574
Substantially all receivables are derived from sales and related support and maintenance of the Company’s clinical, administrative and fi nancial information systems and solutions to healthcare providers located throughout the United States and in certain foreign countries. Included in receivables at the end of 2004 and 2003 are amounts due from healthcare providers located in foreign countries of $33,304,000 and $29,072,000 respectively. Consolidated revenues include foreign sales of $64,333,000, $54,191,000 and $36,634,000 during 2004, 2003 and 2002, respectively. Consolidated long-lived assets at the end of 2004 and 2003 include foreign long-lived assets of $5,176,000 and $4,254,000 respectively. Revenues and long-lived assets from any one foreign country are not material.
The Company provides an allowance for estimated uncollectible accounts based on specifi c identifi cation, historical experience and management’s judgment. At the end of 2004 and 2003 the allowance for estimated uncollectible accounts was $17,583,000 and $12,056,000, respectively.

59
4 Property and EquipmentA summary of property, equipment, and leasehold improvements stated at cost, less accumulated depreciation and amortization, is as follows:
(In thousands) Depreciable lives 2004 2003
Furniture and fi xtures 5 – 12 yrs $ 46,567 43,441
Computer and communications equipment 5 yrs 197,352 150,600
Marketing equipment 5 yrs 2,649 2,649
Shop equipment 5 yrs 2,902 2,902
Leasehold improvements 2 – 15 yrs 61,190 52,378
Capital lease equipment 3 – 5 yrs 14,836 13,087
Land, buildings, and improvements 12 – 50 yrs 95,029 93,006
420,525 358,063
Less accumulated depreciation and amortization 190,085 153,110
Total property and equipment, net $ 230,440 204,953
5 IndebtednessIn December 2002, the Company completed a $60,000,000 private placement of debt pursuant to a Note Agreement. The Series A Senior Notes, with a $21,000,000 principal amount at 5.57%, are payable in three equal installments beginning in December 2006. The Series B Senior notes, with a $39,000,000 principal amount at 6.42%, are payable in 4 equal annual installments beginning December 2009. The proceeds were used to repay the outstanding amount under the Company’s credit facility and for general corporate purposes. The Note Agreement contains certain net worth and fi xed charge coverage covenants and provides certain restrictions on the Company’s ability to borrow, incur liens, sell assets and pay dividends. The Company was in compliance with all covenants at January 1, 2005.
In May 2002, the Company expanded its credit facility by entering into an unsecured credit agreement with a group of banks led by US Bank. This agreement provides for a current revolving line of credit for working capital purposes. The current revolving line of credit is unsecured and requires monthly payments of interest only. Interest is payable at the Company’s option at a rate based on prime (5.25% at January 1, 2005) or LIBOR (2.4% at January 1, 2005) plus 2%. The interest rate may be reduced by up to 1.15% if certain net worth ratios are maintained. The agreement contains certain net worth, current ratio, and fi xed charge coverage covenants and provides certain restrictions on the Company’s ability to borrow, incur liens, sell assets, and pay dividends. A commitment fee of 3/10% to 1/2% is payable quarterly based on the usage of the revolving line of credit. The revolving line of credit matures on May 31, 2007. At January 1, 2005, the Company had no outstanding borrowings under this agreement and had $90,000,000 available for working capital purposes. On January 10, 2005, the Company drew down $35,000,000 from its revolving line of credit in connection with the acquisition of the medical business division of VitalWorks, Inc. (See Note 2 to the consolidated fi nancial statements.)
In April 1999, the Company completed a $100,000,000 private placement of debt pursuant to a Note Agreement. The Series A Senior Notes, with a $60,000,000 principal amount at 7.14%, are payable in fi ve equal annual installments beginning in April 2002. The Series B Senior Notes, with a $40,000,000 principal amount at 7.66%, are payable in six equal annual installments beginning April 2004. The proceeds were used to retire the Company’s existing $30,000,000 of debt, and the remaining funds were used for capital improvements and to strengthen the Company’s cash position. The Note Agreement contains certain net worth, current ratio, and fi xed charge coverage covenants and provides certain restrictions on the Company’s ability to borrow, incur liens, sell assets, and pay dividends. The Company was in compliance with all covenants at January 1, 2005.
In March 2004, the Company issued a $7,500,000 promissory note to Cedars-Sinai Medical Center of which $2,500,000 was repaid in October 2004. The balance of the note will be payable on April 30, 2007.
The Company also has capital lease obligations amounting to $8,378,000, payable over the next four years.

60
The aggregate maturities for the Company’s long-term debt, including capital lease obligations, is as follows (in thousands):
2005 $ 21,908
2006 28,558
2007 20,207
2008 14,373
2009 16,417
2010 and thereafter 29,249
$ 130,712
The Company estimates the fair value of its long-term, fi xed-rate debt using a discounted cash fl ow analysis based on the Company’s current borrowing rates for debt with similar maturities. The fair value of the Company’s long-term debt was approximately $109,746,000 and $147,072,000 at January 1, 2005 and January 3, 2004, respectively.
6 Other Income (Expense)A summary of interest income and expense is as follows:
(In thousands) 2004 2003 2002
Interest income $ 3,022 1,219 1,080
Interest expense (9,174) (8,236) (6,635)
Interest expense, net $ (6,152) (7,017) (5,555)
Included in Other Income (Expense) in 2002 were gains on sale of investments and impairments on Investments as described below.
In the second quarter of 2002, the Company sold its remaining 14,820,527 shares of WebMD for $90,119,000. Accordingly, the Company recorded an investment gain of $2,736,000, net of $1,572,000 in tax, as a result of the sale. Since the shares sold had a lower income tax basis, the sale resulted in the transfer of approximately $29,638,000 of deferred tax liabilities to income taxes payable in the second quarter of 2002. In the third quarter of 2002, the Company made a cash payment of tax in the amount of $31,200,000 related to the investment gain.
In December 2002, the Company exercised 1,048,783 warrants of WebMD with an exercise price of $3.08 and a cost basis and carrying value of $4,146,000. The warrants were scheduled to expire on January 26, 2003. In December 2002, the Company sold 1,048,783 shares of WebMD for $8,242,000. Accordingly, the Company recorded an investment gain of $527,000, net of $342,000 in tax, as a result of the exercise of the warrants and the sale of the shares.
The Company had certain other minority equity investments in non-publicly traded securities. These investments were generally carried at cost as the Company owned less than 20% of the voting equity and did not have the ability to exercise signifi cant infl uence over these companies. Based on events occurring in the fourth quarter of 2002, the Company recorded a charge of $6,281,000, net of tax of $3,623,000, for the impairment of various investments of non-publicly traded securities. The charge is primarily related to a $3,464,000, net of tax, write down of the Company’s investment in Protocare, Inc., a non-publicly traded company.
7 Stock Options, Warrants and EquityAt the end of 2004 and 2003, the Company had 1,000,000 shares of authorized but unissued preferred stock, $.01 par value.
At January 1, 2005, the Company had four fi xed stock option plans. Initially, under Stock Option Plan D, the Company was authorized to grant to associates, directors, consultants or advisors to the Company options to purchase up to 50,000 shares of common stock through January 1, 2005. Additional shares which were approved by the Company’s shareholders on May 17, 1994, May 16, 1995 and May 22, 1998, increasing the total authorized to grant to 4,600,000 shares. The options are exercisable at a price (not less than fair market value on the date of grant) and during a period determined by the Stock Option Committee. Options under this plan currently vest over periods of up to ten years and are exercisable for periods of up to 25 years. The Company, per the terms of the plan, is not permitted to issue any more stock options under Plan D, after January 1, 2005.
Initially, under Stock Option Plan E, the Company was authorized to grant to associates (other than offi cers subject to the provisions of Section 16(a) of the Securities and Exchange Act of 1934), consultants, or advisors to the Company options to purchase up to 2,000,000 shares of common stock through January 1, 2005. Additional shares of 1,100,000 and 1,000,000 were approved by the Company’s Board of Directors on December 8, 2000 and March 9,

61
2001, respectively, increasing the total authorized to grant to 4,100,000 shares. The options are exercisable at a price (not less than fair market value on the date of grant) and during a period determined by the Stock Option Committee. Options under this plan currently vest over periods of up to ten years and are exercisable for periods of up to 25 years. The Company, per the terms of the plan, is not permitted to issue any more stock options under Plan E, after January 1, 2005.
Under the 2001 Long-Term Incentive Plan F, the Company is authorized to grant to associates, directors and consultants 2,000,000 shares of common stock awards. Awards under this plan may consist of stock options, restricted stock and performance shares, as well as other awards such as stock appreciation rights, phantom stock and performance unit awards which may be payable in the form of common stock or cash. However, not more than 500,000 of such shares will be available to granting any types of grants other than options or stock appreciation rights. The company granted 7,500 shares of restricted stock from Plan F to members of the Board of Directors on July 6, 2004. These grants were valued at $42.31 (the fair market value on the date of grant) and vest on May 26, 2005 provided the recipient has continuously served on the Board of Directors through such date. The expense associated with these grants is being recognized over the period from the date of grant to the vest date. The Company recognized expenses related to the restricted stock of $173,000 in 2004.
Long-Term Incentive Plan G was approved by the Company’s shareholders on May 28, 2004. Under the 2004 Long-Term Incentive Plan G, the Company is authorized to grant to associates and directors 2,000,000 shares of common stock awards. Awards under this plan may consist of stock options, restricted stock and performance shares, as well as other awards such as stock appreciation rights, phantom stock and performance unit awards which may be payable in the form of common stock or cash.
The Company has also granted 854,085 other non-qualifi ed stock options under separate agreements to employees and certain third parties. These options are exercisable at a price equal to or greater than the fair market value on the date of grant. These options vest over periods of up to six years and are exercisable for periods of up to ten years. The Company recognized expenses related to the non-qualifi ed stock options of $34,000 and $90,000 for 2003 and 2002, respectively. No expense related to the non-qualifi ed stock options was recognized in 2004.
A combined summary of the status of the Company’s four fi xed stock option plans and other stock options at the end of 2004, 2003 and 2002, and changes during these years ended is presented below:
2004 2003 2002
Weighted Weighted- Weighted Number average Number average Number average of exercise of exercise of exercise Fixed option shares price shares price shares price Outstanding at beginning of year 8,143,614 $ 30.29 8,080,864 $ 31.28 7,244,224 $ 28.79 Granted 893,793 44.64 951,917 26.43 1,501,729 43.50
Exercised (1,082,517) 23.64 (324,622) 20.70 (167,092) 19.40
Forfeited (682,316) 36.05 (564,545) 41.16 (497,997) 36.17
Outstanding at end of year 7,275,574 $ 32.50 8,143,614 $ 30.37 8,080,864 $ 31.28
Options exercisable at year-end 3,493,467 $ 31.44 3,239,586 $ 26.89 2,512,357 $ 24.94
2004 2003 2002
Weighted Weighted- Weighted Number average Number average Number average of exercise of exercise of exercise
Outstanding at beginning of year 8,143,614 $ 30.29 8,080,864 $ 31.28 7,244,224 $ 28.79 Granted 893,793 44.64 951,917 26.43 1,501,729 43.50
Exercised (1,082,517) 23.64 (324,622) 20.70 (167,092) 19.40
Forfeited (682,316) 36.05 (564,545) 41.16 (497,997) 36.17
$ 32.50
Options exercisable at year-end 3,493,467 $ 31.44 3,239,586 $ 26.89 2,512,357 $ 24.94
2004 2003 2002
Weighted Weighted- Weighted Number average Number average Number average of exercise of exercise of exercise
Outstanding at beginning of year 8,143,614 $ 30.29 8,080,864 $ 31.28 7,244,224 $ 28.79 Granted 893,793 44.64 951,917 26.43 1,501,729 43.50
Exercised (1,082,517) 23.64 (324,622) 20.70 (167,092) 19.40
Forfeited (682,316) 36.05 (564,545) 41.16 (497,997) 36.17
Options exercisable at year-end 3,493,467 $ 31.44 3,239,586 $ 26.89 2,512,357 $ 24.94

62
The following table summarizes information about fi xed and other stock options outstanding at January 1, 2005.
Options outstanding Options exercisable
Range of Number Weighted-average Number Exercise outstanding remaining Weighted-average exercisable Weighted-average Prices at 1/1/05 contractual life exercise price at 1/1/05 exercise price $11.06-22.95 2,319,198 11.09 years $18.05 1,112,774 $16.94
22.63-37.36 1,892,833 8.16 28.59 1,033,835 27.59
37.40-46.23 2,281,610 6.70 43.51 1,002,587 43.82
46.60-273.72 781,933 7.42 52.71 344,271 53.73
11.06-273.72 7,275,574 8.55 32.50 3,493,467 31.44
The per share weighted-average fair value of stock options granted during 2004, 2003 and 2002 was $25.75, $15.34 and $25.80, respectively, on the date of grant using the Black Scholes option-pricing model with the following weighted-average assumptions:
2004 2003 2002
Expected years until exercise 6.5 6.5 6.5
Risk-free interest rate 4.0% 3.8% 3.4%
Expected stock volatility 67.3% 71.2% 68.7%
Expected dividend yield 0% 0% 0%
8 Associate Stock Purchase PlanThe Company established an Associate Stock Purchase Plan (ASPP) in 2001, which qualifi es under Section 423 of the Internal Revenue Code. All full-time associates are eligible to participate. Participants may elect to make contributions from 1% to 20% of compensation to the ASPP, subject to annual limitations determined by the Internal Revenue Service. Participants may purchase Company Common Stock at a 15% discount on the last day of the purchase period. Under APB No. 25 the ASPP qualifi es as a non-compensatory plan and no compensation expense has been recognized. The purchase of the Company’s common stock is made through the ASPP on the open market and subsequently reissued to the associates.
9 Foundations Retirement PlanThe Cerner Corporation Foundations Retirement Plan (the Plan) is established under Section 401(k) of the Internal Revenue Code. All full-time associates are eligible to participate. Participants may elect to make pretax contributions from 1% to 80% of compensation to the Plan, subject to annual limitations determined by the Internal Revenue Service. Participants may direct contributions into mutual funds, a money market fund, or a Company stock fund. The Company makes matching contributions to the Plan, on behalf of participants, in an amount equal to 33% of the fi rst 6% of the participant’s contribution. The Company’s expense for the plan amounted to $5,994,000, $5,325,000 and $4,347,000 for 2004, 2003 and 2002, respectively.
The Company added a discretionary match to the Plan in 2000. Contributions are based on attainment of established earnings per share goals for the year. Only participants in the Plan are eligible to receive the discretionary match contribution. For the years ended 2004, 2003 and 2002 the Company expensed $5,186,000, $0 and $5,345,000 for discretionary distributions, respectively.
Range of Number Weighted-average Number Exercise outstanding remaining Weighted-average exercisable Weighted-average
$11.06-22.95 2,319,198 11.09 years $18.05 1,112,774 $16.94
22.63-37.36 1,892,833 8.16 28.59 1,033,835 27.59
37.40-46.23 2,281,610 6.70 43.51 1,002,587 43.82
8.55 32.50

63
10 Income TaxesIncome tax expense for the years ended 2004, 2003 and 2002, consists of the following:
(In thousands) 2004 2003 2002
Current: Current: Federal $ 37,524 9,808 49,384
State 6,756 1,790 5,699
Foreign (1,303) (4,484) (1,262)
Total current 42,977 7,114 53,821
Deferred: Deferred: Federal 1,712 19,040 (21,676)
State 174 2,806 (1,245)
Foreign (1,591) (529) 431
Total deferred 295 21,317 (22,490)
Total income tax expense $ 43,272 28,431 31,331
Temporary differences between the fi nancial statement carrying amounts and tax basis of assets and liabilities that give rise to signifi cant portions of deferred income taxes at the end of 2004 and 2003 relate to the following:
(In thousands) 2004 2003
Deferred Tax Assets
Accrued expenses $ 13,673 9,920
Separate return net operating losses 8,004 10,442
Other 3,754 5,024
Total deferred tax assets 25,431 25,386
Deferred Tax Liabilities
Software development costs (61,146) (55,291)
Contract and service revenues and costs (13,526) (25,096)
Depreciation and amortization (20,825) (14,279)
Other (227) (718)
Total deferred tax liabilities (95,724) (95,384)
Net deferred tax liability $ (70,293) (69,998)
Based upon the level of historical taxable income and projections for future taxable income over the periods which the deferred tax assets are deductible, as well as the scheduled reversal of deferred tax liabilities, management believes it is more likely than not the Company will realize the benefi t of these deductible differences. At January 1, 2005, the Company has net operating loss carryforwards subject to Section 382 of the Internal Revenue Code for Federal income tax purposes of $20.9 million which are available to offset future Federal taxable income, if any, through 2024.

64
The effective income tax rates for 2004, 2003, and 2002 were 40%, 40%, and 39%, respectively. These effective rates differ from the federal statutory rate of 35% as follows:
(In thousands) 2004 2003 2002
Tax expense at statutory rates $ 37,772 24,928 27,774
State income tax, net of federal benefi t 3,507 2,315 2,579
Goodwill 442 793 364
Other, net 1,551 395 614
Total income tax expense $ 43,272 28,431 31,331
Income taxes payable are reduced by the tax benefi t resulting from disqualifying dispositions of stock acquired under the Company’s stock option plans. The 2004, 2003, and 2002 benefi ts of $9,191,000, $1,876,000, and $1,561,000, respectively, are treated as increases to additional paid-in capital.
11 Related Party TransactionsThe Company has made loans to the Company’s senior management under the terms of the Executive Stock Purchase Program (“Program”). The purpose of the Program is to advance the interests of the Company, the Company’s senior management, and the Company’s shareholders by offering the Company’s senior management an incentive to purchase shares of the Company’s stock on the open market. Pursuant to the Program, the Company provided Program loans to executives to help fi nance up to 50% of the total purchase price of the stock purchased. All Program loans have a term of fi ve (5) years, at an interest rate of 5.5%. Principal and interest is not due until the end of the fi ve-year loan term, unless the executive terminates employment. Executives may also elect to pay interest annually. If interest is not paid annually, it will compound annually. All Program loans are full recourse to senior management including the purchased shares and any pledged shares. The balance of these loans, including accrued interest, at January 1, 2005 and January 3, 2004 was $30,000 and $1,710,000, respectively. Loans to the Company’s senior executives are no longer permitted under this program.
The Company leases an airplane from a company owned by Mr. Neal L. Patterson and Mr. Clifford W. Illig. The airplane is leased on a per mile basis with no minimum usage guarantee. The lease rate is believed to approximate fair market value for this type of aircraft. During 2004 and 2003, respectively, the Company paid an aggregate of $574,000 and $839,000 for the rental of the airplane. The airplane is used principally by the Company’s top executives to make client visits.
12 CommitmentsThe Company leases space to unrelated parties in its North Kansas City headquarters complex under noncancelable operating leases. Included in other revenues is rental income of $63,000, $145,000 and $87,000 in 2004, 2003 and 2002, respectively.
The Company is committed under operating leases for offi ce space and computer equipment through May 2013. Rent expense for offi ce and warehouse space for the Company’s regional and global offi ces for 2004, 2003 and 2002 was $6,470,000, $5,345,000 and $5,175,000, respectively. Aggregate minimum future payments (in thousands) under these noncancelable operating leases are as follows:
Aggregate minimum future
Years payments
2005 $ 16,614
2006 12,234
2007 6,428
2008 4,964
2009 3,577
2010 and thereafter 6,634

65
13 Segment ReportingStatement of Financial Accounting Standards No. 131, “Disclosures about Segments of an Enterprise and Related Information” establishes annual and interim reporting standards for operating segments of a company. It also requires entity-wide disclosures about the products and services an entity provides, the material countries in which it holds assets and reports revenues, and its major clients. In 2003, the Company organized geographically. The Company’s six geographic business segments are: Great Lakes, Mid-America, North Atlantic, Southeast, West and Global. The Company has not presented comparable information for 2002 as the necessary information is not available and the cost to develop it would be excessive.
Revenues are derived primarily from the sale of clinical, fi nancial and administrative information systems and solutions. The cost of revenues includes the cost of third party consulting services, computer hardware and sublicensed software purchased from computer and software manufacturers for delivery to clients. It also includes the cost of hardware maintenance and sublicensed software support subcontracted to the manufacturers. Operating expenses incurred by the geographic business segments consist of sales and client service expenses including salaries of sales and client service personnel, communications expenses and unreimbursed travel expenses. Performance of the segments is assessed at the operating earnings level and, therefore, the segment operations have been presented as such. “Other” includes revenues not generated by the operating segments and expenses such as software development, marketing, general and administrative and depreciation that have not been allocated to the operating segments. The Company does not track assets by geographical business segment.
Accounting policies for each of the reportable segments are the same as those used on a consolidated basis. The following table presents a summary of the operating information for the years ended January 1, 2005 and January 3, 2004.
Operating Segments
Great Mid- North South- 2004 Lakes America Atlantic east West Global Other Total
Revenues $ 157,627 $ 201,570 $ 179,520 $ 148,186 $ 150,694 $ 64,333 $ 24,426 $ 926,356
Cost of revenues 29,805 32,588 41,050 35,487 28,577 8,938 19,903 196,348
Operating expenses 27,689 31,618 30,487 33,267 33,827 38,411 423,245 618,544
Total costs and expenses 57,494 64,206 71,537 68,754 62,404 47,349 443,148 814,892
Operating earnings $ 100,133 $ 137,364 $ 107,983 $ 79,432 $ 88,290 $ 16,984 $ (418,722) $ 111,464
Operating Segments
Great Mid- North South- 2003 Lakes America Atlantic east West Global Other Total
Revenues $ 153,949 $ 160,633 $ 149,585 $ 145,312 $ 161,840 $ 54,191 $ 14,077 $ 839,587
Cost of revenues 36,910 35,447 37,520 40,784 28,321 13,450 1,858 194,290
Operating expenses 24,897 24,815 26,788 29,454 28,223 35,814 397,209 567,200
Total costs and expenses 61,807 60,262 64,308 70,238 56,544 49,264 399,067 761,490
Operating earnings $ 92,142 $ 100,371 $ 85,277 $ 75,074 $ 105,296 $ 4,927 $ (384,990) $ 78,097

66
14 Accrued Vacation Pay AdjustmentIn conjunction with a review of the process for calculating the liability for accrued vacation pay at the end of the third quarter of 2004, the Company determined that the liability on the balance sheet relating to periods prior to 2004 was understated by $3,346,000. While the Company was fully accrued for all vested vacation that would be subject to payout upon termination, the Company understated the liability for accumulated vacation that could be used in subsequent periods by associates in excess of the vested amount payable upon termination.
The expense, if properly recorded in 2000 through 2003, would have increased 2003 net earnings by $0.1 million and would have decreased net earnings by $0.4 million in 2002, $0.6 million in 2001, and $1.2 million in 2000. The cumulative impact on net earnings is a decrease of $2.1 million for this four-year period. The impact on 2004 net earnings is a positive $8 thousand. As the impact to prior year’s annual fi nancial statements was not material, Cerner recorded additional expense of $3,346,000, $2,076,000 million after-tax, in the 2004 third quarter to appropriately refl ect the liability as of October 2, 2004. The Company has revised its process for calculating the liability for accumulated vacation to accurately report this information in the future.
15 Quarterly Results (unaudited)Selected quarterly fi nancial data for 2004 and 2003 is set forth below:
Earnings (In thousands, except per share data) before income taxes and cumulative Basic Diluted effect of a change in Net earnings Earnings Revenues accounting principle earnings per share per share 2004 quarterly results: April 3 (1) $ 218,728 23,412 14,129 .40 .38
July 3 228,390 23,940 14,314 .40 .38
October 2 (2) 231,067 24,823 14,779 .41 .39
January 1 248,171 35,745 21,426 .59 .56
Total $ 926,356 107,920 64,648
2003 quarterly results: March 29 $ 198,191 9,418 5,593 .16 .15
June 28 207,695 14,871 8,943 .25 .25
September 27 206,292 20,046 12,047 .34 .33
January 3 227,409 26,887 16,208 .46 .44
Total $ 839,587 71,222 42,791
(1) Includes a gain on the sale of Zynx Health Incorporated. The impact of this gain is a $1.8 million increase, net of $1.2 million tax expense, in net earnings and increase to diluted earnings per share of $.05 for the fi rst quarter and for 2004.
(2) Includes a charge for vacation accrual of $3.3 million included in general and administrative. The impact of this charge is a $2.1 million decrease, net of $1.2 million tax benefi t, in net earnings and a decrease to diluted earnings per share of $.06 for the third quarter and for 2004.


68
Annual Meeting of ShareholdersThe Annual Meeting of shareholders will be held at 10:00 a.m. on May 27, 2005, at The Cerner Round auditorium in the Cerner Vision Center, located on the Cerner campus at 2850 Rockcreek Parkway, North Kansas City, Missouri. A formal notice of the Meeting, with a Proxy Statement and Proxy form, will be mailed to each shareholder in April 2005.
Annual Report/10-K ReportPublications of interest to current and potential Cerner investors are available upon written request or via Cerner’s Web site at www.cerner.com. These include annual and quarterly reports and the Form 10-K fi led with the Securities and Exchange Commission.Written requests should be made to:Cerner CorporationInvestor Relations2800 Rockcreek ParkwayNorth Kansas City, MO 64117-2551Inquires of an administrative nature relating to shareholder accounting records, stock transfer, change of address, and miscellaneous shareholder requests should be directed to the transfer agent and registrar, UMB Bank, at (816) 860 7786.
Transfer Agent and RegistrarSecurities Transfer DivisionUMB BankP.O. Box 410064Kansas City, MO 64141-0064(816) 860 7786
Stock ListingsCerner Corporation’s common stock trades on The NASDAQ Stock Market under the symbol CERN.
Independent AccountantsKPMG LLPKansas City, MO

In the first days of any company’s existence, the instinct to survive over-whelms. Over time, you strive to create mission-critical applications—suchas Cerner’s focus on laboratory information systems—that truly are at thenexus of the field that you are attempting to shape. As Cerner moved fromits humble beginnings in 1979 to a successful growth company, we contin-ued to challenge the status quo and ask hard questions about what the futureof healthcare should look like.
In the early 1990s, a conversation over dinner led to a napkin drawing thatwas grounded in a revolutionary thought: healthcare shouldn’t be organizedaround an encounter; it should revolve around the individual. The discussionled to Cerner’s Community Health Model, the establishment of an internalworking group called Project Ozark with a mandate to action that vision, andultimately the creation of our person-centric Cerner Millennium architec-ture–the only truly unified, enterprise-wide architecture.
1. Automate the Care ProcessCerner offers a longitudinal, person-centric electronic medical record, giving clinicians fingertip access to the right information at the right timeand place.
2. Connect the PersonCerner is dedicated to building a personal health system. Medicalinformation and care regimens accessible from home empower consumers to effectively manage their conditions and adhere to treatmentplans, creating a new medium between physicians and individuals.
3. Structure the KnowledgeCerner is dedicated to building systems that bring the best science to every medical decision by structuring, storing and studying the content surrounding each care episode.
4. Close the LoopToday, the gap between medical discovery and its incorporation into dailypractice can be as long as 10 years. Cerner is dedicated to building systems that implement evidence-based medicine, dramatically reducingthe average time from the discovery of an improved method to the changein the standard of care.
Community Health Model
909932 DP_CVR 4/14/2005 10:09 PM Page 2

ANNUAL REPORT
2004UNITED STATES
KANSAS CITY, MOCerner CorporationWorld Headquarters2800 Rockcreek ParkwayNorth Kansas City, MO 64117(816) 221 1024
BIRMINGHAM, ALCerner Physician Practice, Inc. 44 Inverness Center ParkwayBirmingham, AL 35242 (205) 981 5520
DENVER, COCerner Multum, Inc.3200 Cherry Creek South DriveSuite 300Denver, CO 80209(303) 733 4447
OVERLAND PARK, KSCerner BeyondNow5750 W. 95th St., Suites 310 & 312Overland Park, KS 66207(913) 385 0212
BEL AIR, MDCerner Project IMPACT, Inc.23 Ellendale StreetBel Air, MD 21014(410) 838 1275
WALTHAM, MACerner DHT, Inc.Two University Office ParkSuite 60051 Sawyer RoadWaltham, MA 02453(781) 642 6200
HOUSTON, TXCerner Radiology Information Systems, Inc.5 Greenway PlazaSuite 1900Houston, TX 77046(832) 325 1500
WORLDWIDE
AUSTRALIACerner Corporation PTY LimitedLevel 10, 52 Alfred StreetMilsons PointNSW 2061Sydney Australia +61 2 9900 4800
CANADACerner Canada Limited Cerner Vision CentrePhase 1, Tower 2, Level 3800 Commissioners Road EastLondon, Ontario N6A4G5Canada(519) 685 8499
FRANCECerner, SAS57 Esplanade Charles De Gaulle92081 Paris La Defense CEDEXGround Floor 25B+33 (0)1 46 96 54 93
GERMANYCerner Deutschland GmbH
andImage Devices GmbHCunoweg 165510 Idstein+49 (0) 6126 957575
INDIACerner Healthcare Solutions Private Ltd. Prestige Obelisk3 Kasturba Rd. Bangalore, India 560 001+91-80-513-47000
LATIN AMERICA / CARIBBEANCerner Latin America Avda. Vitacura 2939 10th FloorLas Condes – SantiagoChile Postal Code 7550011+562 431 5052
MALAYSIACerner Malaysia Sdn BhdLevel 36, Menara Citibank165 Jalan Ampang50450 Kuala LumpurMalaysia+60 3 2169 6218
SINGAPORECerner Singapore Limited391A Orchard Road#12-01 Ngee Ann City Tower ASingapore 238873+65-6786-6933
SPAINCerner Iberia, S.L.World Trade CenterMuelle de BarcelonaEdificio Sur - 2ª PlantaBarcelona 08039+34-93-344-32-21
UNITED KINGDOMCerner Limited6th Floor, North Wing3 Sheldon SquarePaddington CentralLondon WZ 6PW+44 (0) 20 7432 8100
www.cerner.com
Cerner 2004 Annual Report 0174_2005
p r o v e n i n n o v a t i o n | u n i f i e d a r c h i t e c t u r e | s p e e d t o v a l u e
909932 DP_CVR 4/14/2005 10:09 PM Page 1