annual report broadcom 2011 - annualreports.com€¦ · broadcom’s innovative products and...
TRANSCRIPT

ANNUAL REPORT
Broadcom 2011

Broadcom’s innovative products and technologiesenable people to connect – locally and globally – athome, at the office and on the move.
About Broadcom
Broadcom Corporation (NASDAQ: BRCM), a FORTUNE 500®
company, is a global leader and innovator in semiconductor
solutions for wired and wireless communications. Broadcom®
products seamlessly deliver voice, video, data and multimedia
connectivity in the home, office and mobile environments. With
the industry's broadest portfolio of state-of-the-art system-on-a-
chip (SoC) and embedded software solutions, Broadcom is
changing the world by Connecting everything®.
Net Revenue Growth Revenue Mix Cash Flow From Operations
8%Y/Y 34%Y/Y
$6.8B
2010 2011 2010 2011
$7.4B
$1.4B
$1.8B
All Other ~3%
Hand
~47%
Home
~28%
Infrastructure
~22%
Connecting everything®

Incredibly, we believe 99.98% of all Internet traffic
today passes through at least one Broadcom chip.
Although our impact on the industry is already
immense, our eyes are locked upon what the next
20 years has in store and how we can continue to
serve as a catalyst for industry innovation.
In 2011, Broadcom's innovative and highly
integrated products, coupled with solid execution,
enabled us to outpace competitors and outgrow
the industry. We did so while meeting our profitability
objectives and delivering an increased dividend to
shareholders. We also nearly doubled the amount
of capital returned to shareholders via share
repurchases and dividends – both indicators of
our financial strength and optimism.
2011 marked a milestone in Broadcom’s history as we celebrated the company’s20th anniversary. The occasion served as a touchstone to celebrate the engineeringinnovation that has transformed the communications industry and reflects onhow far we’ve come as a company, and as an industry.
With all three business units delivering strong
performance, annual product revenue rose almost
9% in 2011 year-over-year. That is in contrast to
our overall industry, which grew only in the low
single digits. Today, we sell roughly 500 million
devices per quarter. With the help of diligent cost
controls, we achieved non-GAAP product operating
margins of nearly 21%1, in the center of our target
range. Both cash flow from operations as well
as total cash and marketable securities balances
set new annual records, at $1.8 billion and $5.2
billion, respectively.
Broadcom’s R&D scale and breadth of complete
system solutions have enabled us to consistently
gain market share, deliver solid profitability,
reinvest in our businesses and return more capital
to shareholders.
BROADCOM CORPORATION 2011 ANNUAL REPORT PAGE 1
To Our Shareholders
Today, we believe 99.98% of all Internet traffic touches Broadcomtechnology.
99.98%Although our impact on theindustry is already immense,our eyes are locked uponwhat the next 20 years has in store and how we can continue to serve as a catalystfor industry innovation.
1 See www.broadcom.com/investors for a reconciliation of GAAP to non-GAAP product operating margin.

BROADCOM CORPORATION 2011 ANNUAL REPORT PAGE 2
Last year, Broadcom spent nearly $2 billion on
R&D and ranked an enviable 17th among American
corporations in total U.S. patent awards. But for us,
being a technology innovator means more than sim-
ply adding new shelves to our patent library (which
incidentally, with the recent acquisition of NetLogic
Microsystems, Inc., is now approaching 16,800
patents and applications). Much more important is
our ability to turn that intellectual property into
commercially successful products. Our engineers
work closely with our manufacturing partners to
design and deliver complete solutions to meet the
unique demands of the communications markets.
Our chips are found in some of the world's best
known devices – including products by Apple,
Cisco, Dell, Huawei and Samsung to name a few.
They count on us to keep them ahead of the
technology curve with complete families of highly
integrated products that deliver compelling price,
performance and power efficiency.
At Broadcom, we like to say we "engineer the
impossible" for our customers. And we do it
every day. The following are 2011 and early 2012
highlights from our three business groups.
Home: Broadband Communications Group
In 2011, Broadcom introduced significant new
product families that contribute to the next
generation of home networks and provide the
basis for continued industry leadership. Our
breakthrough Full Band Capture technology, in
which a single Broadcom chip can digitize the
contents of an entire TV spectrum for either
cable or satellite, was greeted enthusiastically by
customers, investors and the press following its
introduction. By eliminating the need for separate
tuners for every channel, Full Band Capture
significantly decreases the cost of a set-top box. It
also allows video content providers to more closely
integrate their offerings with those delivered via the
Web. There's an additional advantage for consumers
in that Full Band Capture enables channel-switching
to occur virtually instantaneously, rather than with the
multi-second delay that can frustrate TV viewers.
Fiber optics may be the networking technology
of tomorrow, but most of today's home video is
delivered via already-installed copper coaxial cable.
Here again Broadcom continues to innovate,
bringing to market new SoC products that double
At Broadcom, we like to say we “engineer the impossible” for our customers.
Broadcom introduced significant new product familiesthat contribute to the next generation of home networksand provide the basis forcontinued industry leadership.
SUSTAINED RECORD OF INTELLECTUAL PROPERTY INNOVATION
IP Portfolio Strength as Ranked by IEEE:5th in the semiconductor industry#1 among fabless semiconductor companies
Source: 2011 IEEE Spectrum Patent Power Scorecard
U.S. and Foreign Patents: � Patents � Applications
15,900
7,350
8,5506,800
5,3504,500
3,4932,6251,627
82445625573
7,800
7,8007,600
7,400
5,600
5,149
4,0202,769
2,0711,059
14,600
13,150
12,100
10,893
8,225
6,776
4,844
3,2252,326
1,132
2001 2002 2003 2004 2005 2006 2007 2008 2009 2010 2011

BROADCOM CORPORATION 2011 ANNUAL REPORT PAGE 3
the capacity of existing home coax networks. Our
Multimedia over Coax Alliance (MoCA) 2.0 family
of integrated devices lets video operators bring
higher quality video to more rooms in the home
while drawing much less power.
We’re also changing TV in other ways. Our set-top
box chipsets provide advanced graphics and
high-performance processing, enabling the interface
to your TV to be as engaging as the most sophisti-
cated website or video game. In modems, carriers
are designing the devices to do much more than
provide simple broadband connections. New
modems will act more like "gateway" devices, with
built-in connectivity, wireless networking, video
and even telephony. Those features, among others,
will be fully-supported in Broadcom's silicon.
The global market for broadband is extraordinarily
diverse. Different parts of the world are on a myriad
of technology paths; within each county, there are
often six or eight major competitors vying for early
advantage. Only a company of Broadcom's size
and scale can expect to be fully engaged with that
global market. Our suite of DOCSIS® products,
which allow cable TV operators to transmit both
data and video, is making substantial headway in
China, complementing its already strong position
in U.S. and European markets.
Hand:Mobile and Wireless Group
We continue to fortify our position in mobile and
wireless technologies, including cellular SoCs, Wi-Fi,
Bluetooth, mobile application processors and
graphics, Global Positioning Systems (GPS/GNSS)
and Near Field Communication (NFC) products.
Our products can be found in just about
every consumer electronics category including
smartphones, tablets, PCs, TVs, set-top boxes,
games, routers and network gateways.
With accelerating popularity in all parts of the
world, smartphones continue to be a key strategic
opportunity for Broadcom. Our wireless connectivity
combo chips are a common element in a majority
of smartphones. In classic Broadcom tradition,
we are taking advantage of this scale and market
knowledge, along with our vast IP portfolio, to
deliver increasingly integrated products that give
our customers virtually everything needed to bring
advanced smartphones to market.
Our wireless connectivity combo chips are a common element in the majority of smartphones.
Smartphones continue to be a key strategic opportunity for Broadcom.

BROADCOM CORPORATION 2011 ANNUAL REPORT PAGE 4
Infrastructure: Infrastructure & Networking Group
Among our enterprise data center customers,
trends such as cloud computing and "Big Data" are
forcing the migration to a newer, faster generation
of server and storage products. We also work closely
with mobile carriers, who are anxious to upgrade
their networks to keep pace with rising demand.
Our products targeting those markets did well in
2011, and we plan to build upon their success.
Broadcom's ability to offer complete solutions,
for mobile and elsewhere, is greatly enhanced with
our acquisition of NetLogic Microsystems, Inc., a
leader in high performance intelligent semiconductor
solutions. The transaction was valued at $3.7 billion,
making it by far the largest in Broadcom's history.
The NetLogic multi-core embedded processor
solution, market leading knowledge-based proces-
sors, and unique digital front-end technology
for wireless base stations are key enablers for the
next generation infrastructure build-out. With the
acquisition, Broadcom is now better positioned
to meet growing customer demand for integrated,
end-to-end communications and processing
platforms for network infrastructure.
The corporate data center is in the early stages
of a multi-year upgrade cycle involving the
replacement of Gigabit Ethernet connections
Our cellular SoC products integrate – on a single
chip – one or more application processors, graphics,
video, cellular baseband, and other capabilities
that previously required half a dozen or more
separate integrated circuits. When combined with
other key devices like our wireless connectivity
chips, we can provide customers with a complete
smartphone platform. We're proud that Samsung
chose our complete smartphone platform for the
Galaxy Y series, which is attracting attention for styl-
ish design and functionality. Broadcom’s complete
smartphone platforms will change the economics
of the smartphone business by shortening customer
development cycles and reducing costs.
Another technology shift now underway involves
the arrival of fifth generation Wi-Fi products that
Broadcom calls “5G WiFi,” based on the IEEE
specification 802.11ac. Providing speeds up to
three times faster than current Wi-Fi devices, this
new standard will be important across Broadcom's
entire product line, but perhaps nowhere more so
than in smartphones. Faced with exploding demand,
mobile carriers are shifting as much of their cellular
traffic as possible to Wi-Fi frequencies, a trend
that 802.11ac will accelerate. History has taught
us how disruptive a new generation of Wi-Fi can
be, and Broadcom is leading the industry in its
5G WiFi rollout.
Broadcom is leading the industry in its 5G WiFi rollout.
Another crucial technologyshift now underway involvesthe arrival of fifth generationWi-Fi products that Broadcomcalls 5G WiFi.

BROADCOM CORPORATION 2011 ANNUAL REPORT PAGE 5
sophisticated as those in homes. While it may be
a few years before our efforts bear fruit, automobiles
are a perfect opportunity for a company with our
technical depth and organizational scale.
In Conclusion
Our 2011 results were solid and all of us at Broadcom
are proud of our hard work involved in making
them happen. But we're proud of something else
as well: That our company has spent its first
two decades at the center of a world-changing
communications revolution.
Broadcom products are now found everywhere
on the planet, from urban corporate data centers,
where information moves between computers at
speeds that boggle the mind, to villages in some
of the most isolated parts of the world, where
mobile phone users are being exposed to the great
potential of technology for the very first time.
Remarkably, all of those users are alike in
possessing an almost insatiable appetite for data.
Helping them satisfy that demand is our mission
and our passion at Broadcom. As we start our third
decade, that commitment has never been stronger.
Scott A. McGregor
President and Chief Executive Officer
March 23, 2012
with links that are 10 times faster, with analysts
estimating that six million servers will be upgraded
in the coming years. Broadcom spotted this shift
early on, and the numerous 10 Gigabit product
announcements from server companies during
2011 invariably involved our chips. In addition, our
10GBASE-T PHY technology was adopted by most
major vendors in 2011. The device saw a five-fold
increase in sales last year, and we will be working
hard to make it the kind of silicon connectivity
success for which Broadcom is known.
Service providers continue to represent a significant
opportunity for our Infrastructure & Networking
Group. As one example, wireless carriers are
upgrading their networks to 4G to deliver next
generation mobile services. As data traffic continues
to grow and speeds continue to increase, service
providers are upgrading their backhaul links from
legacy Time-Division Multiplexing (TDM) technolo-
gies to Ethernet. With its leading breadth of IP and
optimized product offerings, Broadcom is uniquely
positioned to continue to lead the migration to
Ethernet and enable the next generation of both
fiber and microwave backhaul.
An entirely new market for Broadcom’s infrastructure
solutions is automobiles. Considering the main-
tenance, entertainment, navigation and driver
safety features in a modern car, they are beginning
to require communications networks nearly as
Broadcom is best positioned to providecomplete networking solutions.
Our 10GBASE-T PHYtechnology was adoptedby most major vendors in 2011.

BROADCOM CORPORATION 2011 ANNUAL REPORT PAGE 6
Market Profiles Broadcom’s Business Groups
Home
Hand
Infrastructure
Our Broadband Communications Group products help power the cable and DSL modems through which people receive their household Internetservice. This group also makes the chips for the TV set-top boxes that, even with the growing popularity of notebooks and tablets, continue to be at the heart of today’s TV viewing experience. Last year, we maintained aleadership position in both of these markets, shipping more than 200 millionproducts. Broadband products also extend the capability of widely-installednetworks struggling to keep up with demand. Our Powerline products allow a home network to run over a standard home electrical system, deliveringconnectivity to places wireless and wired networks cannot reach. Broadcomalso provides chips for Femtocell devices, that greatly improve cellular phone reception inside the home.
The Mobile & Wireless Group is engaged in development of cellular SoCs, Wi-Fi, Bluetooth, mobile application processors and graphics, GPS/GNSS and NFC products. This Group’s products can be found in just about every CE (consumer electronics) category including smartphones, tablets, PCs, TVs, TV set-top boxes, games, routers and network gateways. The global communications revolution involving smartphones is a key focus of this group.We are rapidly approaching a time when almost everyone on the planet will have a device that is a powerful computer as well as a fully-enabled mobile voice and video platform. Currently, our connectivity "combo” chips provide features such as Wi-Fi, Bluetooth and FM for over half of the world'ssmartphones. Our smartphone platforms enable handset customers to quicklyadopt our products.
The routers, switches and backhaul products sold by Broadcom’s Infrastructure & Networking Group are sometimes referred to as the networking world's "plumbing." But that name does not do justice to these devices, that are among the company's most complex and highly profitable. They are designed to be end-to-end solutions for complex product offerings; a mobilephone carrier might use Broadcom technology in its handsets, inside the celltowers that comprise the network and in the wired links over which the towerscommunicate. Similarly, in the enterprise, Broadcom products provide thehigh-speed links necessary to shuttle data back and forth between serversand storage devices. The technology progress here is stunning; we are nowengineering enterprise connectivity 50 times faster than what was, only a few years ago, the fastest connection imaginable.

As filed with the Securities and Exchange CommissionFebruary 1, 2012
Broadcom Corporation
Annual Report on Form 10-K
For the Year Ended December 31, 2011
10-K


UNITED STATES SECURITIES AND EXCHANGE COMMISSIONWashington, D.C. 20549
Form 10-K(Mark One)
Í ANNUAL REPORT PURSUANT TO SECTION 13 OR 15(d) OF THE SECURITIESEXCHANGE ACT OF 1934
For the fiscal year ended December 31, 2011or
‘ TRANSITION REPORT PURSUANT TO SECTION 13 OR 15(d) OF THE SECURITIESEXCHANGE ACT OF 1934
For the transition period from toCommission file number 000-23993
Broadcom Corporation(Exact Name of Registrant as Specified in Its Charter)
California 33-0480482(State or Other Jurisdiction
of Incorporation or Organization)(I.R.S. Employer
Identification No.)5300 California Avenue
Irvine, California 92617-3038(Address of Principal Executive Offices) (Zip Code)
Registrant’s telephone number, including area code: (949) 926-5000
Securities registered pursuant to Section 12(b) of the Act:Title of Class Name of Exchange on Which Registered
Class A Common Stock, $0.0001 par value The NASDAQ Stock Market LLC(NASDAQ Global Select Market)
Securities registered pursuant to Section 12(g) of the Act: NoneIndicate by check mark if the registrant is a well-known seasoned issuer, as defined in Rule 405 of the Securities Act. Yes Í No ‘Indicate by check mark if the registrant is not required to file reports pursuant to Section 13 or Section 15(d) of the
Act. Yes ‘ No ÍIndicate by check mark whether the registrant: (1) has filed all reports required to be filed by Section 13 or 15(d) of the Securities Exchange
Act of 1934 during the preceding 12 months (or for such shorter period that the registrant was required to file such reports), and (2) has beensubject to such filing requirements for the past 90 days. Yes Í No ‘
Indicate by check mark whether the registrant has submitted electronically and posted on its corporate Web site, if any, every InteractiveData File required to be submitted and posted pursuant to Rule 405 of Regulation S-T (§ 232.405 of this chapter) during the preceding12 months (or for such shorter period that the registrant was required to submit and post such files). Yes Í No ‘
Indicate by check mark if disclosure of delinquent filers pursuant to Item 405 of Regulation S-K (§ 229.405 of this chapter) is notcontained herein, and will not be contained, to the best of registrant’s knowledge, in definitive proxy or information statements incorporated byreference in Part III of this Form 10-K or any amendment to this Form 10-K. ‘
Indicate by check mark whether the registrant is a large accelerated filer, an accelerated filer, a non-accelerated filer, or a smaller reportingcompany. See the definitions of “large accelerated filer,” “accelerated filer” and “smaller reporting company” in Rule 12b-2 of the Exchange Act.(Check one):Large accelerated filer Í Accelerated filer ‘ Non-accelerated filer ‘ Smaller reporting company ‘
(Do not check if a smaller reporting company)Indicate by check mark whether the registrant is a shell company (as defined in Exchange Act Rule 12b-2). Yes ‘ No ÍThe aggregate market value of the registrant’s common stock, $0.0001 par value per share, held by non-affiliates of the registrant on
June 30, 2011, the last business day of the registrant’s most recently completed second fiscal quarter, was $16.19 billion (based on the closingsales price of the registrant’s common stock on that date). Shares of the registrant’s common stock held by each officer and director and eachperson known to the registrant to own 10% or more of the outstanding voting power of the registrant have been excluded in that such personsmay be deemed to be affiliates. This determination of affiliate status is not a determination for other purposes.
The registrant has two classes of common stock authorized, Class A common stock and Class B common stock. The rights, preferences andprivileges of each class of common stock are substantially identical except for voting rights. Shares of Class B common stock are not publicly traded butare convertible at any time into shares of Class A common stock on a one-for-one basis. As of December 31, 2011 there were 492 million shares ofClass A common stock and 53 million shares of Class B common stock outstanding.
DOCUMENTS INCORPORATED BY REFERENCEPart III incorporates by reference certain information from the registrant’s definitive proxy statement for the 2012 Annual Meeting of
Shareholders to be filed on or before April 27, 2012.

Broadcom®, the pulse logo, VideoCore®, BroadR-Reach® and XGS™ are among the trademarks of Broadcom Corporation and/or its affiliates in the UnitedStates, certain other countries and/or the EU. Any other trademarks or trade names mentioned are the property of their respective owners.
©2012 Broadcom Corporation. All rights reserved. This Annual Report on Form 10-K is printed on recycled paper.

BROADCOM CORPORATION
ANNUAL REPORT ON FORM 10-K
FOR THE FISCAL YEAR ENDED DECEMBER 31, 2011
TABLE OF CONTENTS
Page
PART I
Item 1. Business . . . . . . . . . . . . . . . . . . . . . . . . . . . . . . . . . . . . . . . . . . . . . . . . . . . . . . . . . . . . . . . . . . . 1
Item 1A. Risk Factors . . . . . . . . . . . . . . . . . . . . . . . . . . . . . . . . . . . . . . . . . . . . . . . . . . . . . . . . . . . . . . . . 12
Item 1B. Unresolved Staff Comments . . . . . . . . . . . . . . . . . . . . . . . . . . . . . . . . . . . . . . . . . . . . . . . . . . . . 20
Item 2. Properties . . . . . . . . . . . . . . . . . . . . . . . . . . . . . . . . . . . . . . . . . . . . . . . . . . . . . . . . . . . . . . . . . . 20
Item 3. Legal Proceedings . . . . . . . . . . . . . . . . . . . . . . . . . . . . . . . . . . . . . . . . . . . . . . . . . . . . . . . . . . . . 20
Item 4. (Removed and Reserved) . . . . . . . . . . . . . . . . . . . . . . . . . . . . . . . . . . . . . . . . . . . . . . . . . . . . . . 20
PART II
Item 5. Market for Registrant’s Common Equity, Related Stockholder Matters and Issuer Purchases ofEquity Securities . . . . . . . . . . . . . . . . . . . . . . . . . . . . . . . . . . . . . . . . . . . . . . . . . . . . . . . . . . . . . 21
Item 6. Selected Financial Data . . . . . . . . . . . . . . . . . . . . . . . . . . . . . . . . . . . . . . . . . . . . . . . . . . . . . . . 25
Item 7. Management’s Discussion and Analysis of Financial Condition and Results of Operations . . . . 27
Item 7A. Quantitative and Qualitative Disclosures about Market Risk . . . . . . . . . . . . . . . . . . . . . . . . . . . 55
Item 8. Financial Statements and Supplementary Data . . . . . . . . . . . . . . . . . . . . . . . . . . . . . . . . . . . . . . 56
Item 9. Changes in and Disagreements with Accountants on Accounting and Financial Disclosure . . . . 56
Item 9A. Controls and Procedures . . . . . . . . . . . . . . . . . . . . . . . . . . . . . . . . . . . . . . . . . . . . . . . . . . . . . . 56
Item 9B. Other Information . . . . . . . . . . . . . . . . . . . . . . . . . . . . . . . . . . . . . . . . . . . . . . . . . . . . . . . . . . . 57
PART III
Item 10. Directors, Executive Officers and Corporate Governance . . . . . . . . . . . . . . . . . . . . . . . . . . . . . . 58
Item 11. Executive Compensation . . . . . . . . . . . . . . . . . . . . . . . . . . . . . . . . . . . . . . . . . . . . . . . . . . . . . . 58
Item 12. Security Ownership of Certain Beneficial Owners and Management and Related StockholderMatters . . . . . . . . . . . . . . . . . . . . . . . . . . . . . . . . . . . . . . . . . . . . . . . . . . . . . . . . . . . . . . . . . . . . 58
Item 13. Certain Relationships and Related Transactions, and Director Independence . . . . . . . . . . . . . . 58
Item 14. Principal Accounting Fees and Services . . . . . . . . . . . . . . . . . . . . . . . . . . . . . . . . . . . . . . . . . . . 58
PART IV
Item 15. Exhibits, Financial Statement Schedules . . . . . . . . . . . . . . . . . . . . . . . . . . . . . . . . . . . . . . . . . . . 59

CAUTIONARY STATEMENT
All statements included or incorporated by reference in this Annual Report on Form 10-K, other than statements orcharacterizations of historical fact, are forward-looking statements within the meaning of the federal securities laws,including the Private Securities Litigation Reform Act of 1995. Examples of forward-looking statements include, but arenot limited to, statements concerning projected total net revenue, costs and expenses and product and total gross margin; ouraccounting estimates, assumptions and judgments; the demand for our products; our dependence on a few key customers and/or design wins for a substantial portion of our revenue; our ability to consummate acquisitions and integrate theiroperations successfully, including our pending acquisition of NetLogic Microsystems, Inc.; estimates related to the amountand/or timing of the expensing of unearned stock-based compensation expense and stock-based compensation as a percentageof revenue; manufacturing, assembly and test capacity; the effect that economic conditions, seasonality and volumefluctuations in the demand for our customers’ consumer-oriented products will have on our quarterly operating results; ourability to adjust operations in response to changes in demand for existing products and services or the demand for newproducts requested by our customers; the competitive nature of and anticipated growth in our markets; our ability to migrateto smaller process geometries; our success in pending intellectual property litigation matters; our potential needs foradditional capital; inventory and accounts receivable levels; the impact of the Internal Revenue Service review of certainincome tax returns on our results of operations; the effect of potential changes in U.S. or foreign tax laws and regulations orthe interpretation thereof; the level of accrued rebates, and income we expect to record in connection with the QualcommAgreement or similar arrangements in the future. These forward-looking statements are based on our current expectations,estimates and projections about our industry and business, management’s beliefs, and certain assumptions made by us, all ofwhich are subject to change. Forward-looking statements can often be identified by words such as “anticipates,” “expects,”“intends,” “plans,” “predicts,” “believes,” “seeks,” “estimates,” “may,” “will,” “should,” “would,” “could,” “potential,”“continue,” “ongoing,” similar expressions, and variations or negatives of these words. These statements are not guarantees offuture performance and are subject to risks, uncertainties and assumptions that are difficult to predict. Therefore, our actualresults could differ materially and adversely from those expressed in any forward-looking statements as a result of variousfactors, some of which are listed under the section entitled “Risk Factors” in Part I, Item 1A of this Report. These forward-looking statements speak only as of the date of this Report. We undertake no obligation to revise or update publicly anyforward-looking statement to reflect future events or circumstances.
PART I
Item 1. Business
Overview
Broadcom Corporation (including our subsidiaries, referred to collectively in this Report as “Broadcom,” “we,”“our” and “us”) is a global innovation leader in semiconductor solutions for wired and wireless communications.Broadcom® products seamlessly deliver voice, video, data and multimedia connectivity in the home, the office andthe mobile environment. We provide the industry’s broadest portfolio of state-of-the-art system-on-a-chip, or SoC,and software solutions.
Broadcom was incorporated in California in August 1991. Our Class A common stock trades on the NASDAQGlobal Select Market® under the symbol BRCM. Our principal executive offices are located at 5300 CaliforniaAvenue, Irvine, California 92617-3038, and our telephone number at that location is 949.926.5000. Our Internetaddress is www.broadcom.com. The inclusion of our Internet address in this Report does not include or incorporateby reference into this Report any information on our website. Our annual reports on Form 10-K, quarterly reportson Form 10-Q, current reports on Form 8-K, amendments to those reports and other Securities and ExchangeCommission (SEC) filings are available free of charge through the investor relations section of our website as soon asreasonably practicable after such reports are electronically filed with, or furnished to, the SEC. The SEC alsomaintains a web site, www.sec.gov, that contains reports, proxy and information statements, and other informationregarding issuers that file electronically with the SEC.
Over the past two decades, communications technologies have evolved dramatically in response to ubiquitouswireless and mobile networks, the emergence of new data-intensive computing and multimedia applications, and thecontinuing convergence of personal computing devices and mobile devices. The broadband transmission of digitalinformation over wired and wireless infrastructures requires very sophisticated semiconductor solutions to perform

critical systems functions such as complex signal processing, converting digital data to and from analog signals, andswitching and routing packets of information over IP-based networks.
We currently operate our business to serve three markets: Broadband Communications, Mobile & Wireless andInfrastructure & Networking. Our diverse product portfolio includes:
• Broadband Communications (Solutions for the Home) — Complete solutions for cable, xDSL, fiber, satelliteand IP broadband networks to enable the connected home, including set-top-boxes and media servers,residential modems and gateways, femtocells and wired home networking solutions.
• Mobile & Wireless (Solutions for the Hand) — Low-power, high-performance and highly integrated solutionspowering the mobile and wireless ecosystem, including Wi-Fi and Bluetooth, cellular modems, personalnavigation and global positioning, near field communications (NFC), Voice over IP (VoIP), multimedia andapplication processing, and mobile power management solutions.
• Infrastructure & Networking (Solutions for Infrastructure) — Highly integrated solutions for carriers, serviceproviders, enterprises, small-to-medium businesses and data centers for network infrastructure needs,including switches, physical layer (PHY) and microwave devices for local, metropolitan, wide area and storagenetworking; switch fabric solutions, high-speed ethernet controllers, security and embedded processors.
Net Revenue by Reportable Segment
Our semiconductor solutions are used globally by leading manufacturers and are embedded in an array ofproducts for the home, the hand and network infrastructure. Net revenue for our reportable segments, BroadbandCommunications, Mobile & Wireless and Infrastructure & Networking is presented below. “All Other” includes ourlicensing revenue from Verizon Wireless and related income from the Qualcomm Agreement (see detailed discussionin “Overview” section in Item 7. Management’s Discussion and Analysis of Financial Condition and Results ofOperations).
Percentage of Net Revenue
BroadbandCommunications
~28%
Mobile &Wireless ~47%
Infrastructure &Networking
~22%All Other3%
2011
BroadbandCommunications
~31%
Mobile &Wireless ~43%
Infrastructure &Networking
~23%All Other3%
2010
BroadbandCommunications
~34%
Mobile &Wireless ~38%
Infrastructure &Networking
~24%All Other4%
2009
Net Revenue: $7.39 billion Net Revenue: $6.82 billion Net Revenue: $4.49 billion
2

Broadband Communications Reportable Segment
We offer manufacturers a range of broadband communications and consumer electronics SoC solutions thatenable voice, video, data and multimedia services over wired and wireless networks for the home.
Products Incorporating Our Solutions Broadcom Solutions
Broadband Communications(Solutions for the Home)
Modems (cable, xPON, femtocelland DSL) and Residential Gateways
Cable Modem TerminationSystems (CMTS) and CentralOffice DSLAM Solutions
Digital Cable, Digital TransportAdapter, Direct BroadcastSatellite, Terrestrial and IP Set-TopBoxes
Wired Home Networking Solutions(including Powerline Networking)
Cable modem SoCsFemtocell SoCsMPEG/AVC/VC-1 encoders and
transcodersxDSL, xPON and cable modem
customer premises equipment andcentral office solutions
Powerline Networking SoCsDigital cable, DBS, Terrestrial andIP set-top box SoCs
Digital Cable, Direct Broadcast Satellite, Terrestrial and IP Set-Top Boxes and Digital Transport Adapters
In an effort to increase the number of digital services available to television viewers, features such as highdefinition and 3D programming, digital video recording services, internet applications and connected home medianetworks are being offered by service providers using the same high-speed connections that bring customersbroadband Internet and telephone access. To take advantage of these capabilities, viewers need a set-top box (STB) inthe home to process these functions and distribute them to TVs, other connected STBs and mobile devices withinthe home. According to DisplaySearch, approximately 198 million STB’s were sold in 2011. We offer a completedigital cable-TV silicon platform, comprehensive direct broadcast satellite (DBS) solutions and a family of advancedSoC solutions for the Internet Protocol (IP) STB market.
Modems and Residential Gateways
According to DisplaySearch, there were nearly 562 million total global broadband subscribers in 2011.Competitive pressure among broadband providers to meet increasing consumer demand for internet video content isdriving a race to provide increasing bandwidth to consumers. Broadcom offers ultra-high speed modems andend-to-end broadband solutions to provide data, voice and video services in one multi-function gateway over cabletelevision networks, digital subscriber line (DSL) technologies and gigabit passive optical networks (GPON) to andthroughout the home.
Powerline Networking
Powerline networking increases in-home networking coverage by taking advantage of the availability of existingelectric outlets throughout the home to create an easier plug-and-play connected consumer experience. Broadcom’sPowerline chipset enhances our strong and diverse home network and broadband access portfolio and providescustomers with a cost-effective and efficient method to connect multiple devices and deliver multimedia contentthroughout the home.
Mobile & Wireless Reportable Segment
Broadcom’s mobile and wireless reportable segment offers products that enable end-to-end wireless and cellularconnectivity at home, at work and on-the-go. Products in this area include solutions in wireless local area networking,personal area networking, location and navigation technologies, NFC, cellular baseband SoCs, multimediaprocessors, and radio frequency (RF) and power management. Our portfolio of mobile and wireless products enable abroad range of connected devices including cellular handsets, personal navigation devices, tablets, PCs, wireless homerouters and gateways, portable media players, gaming platforms and other wireless-enabled consumer electronicdevices and peripherals.
3
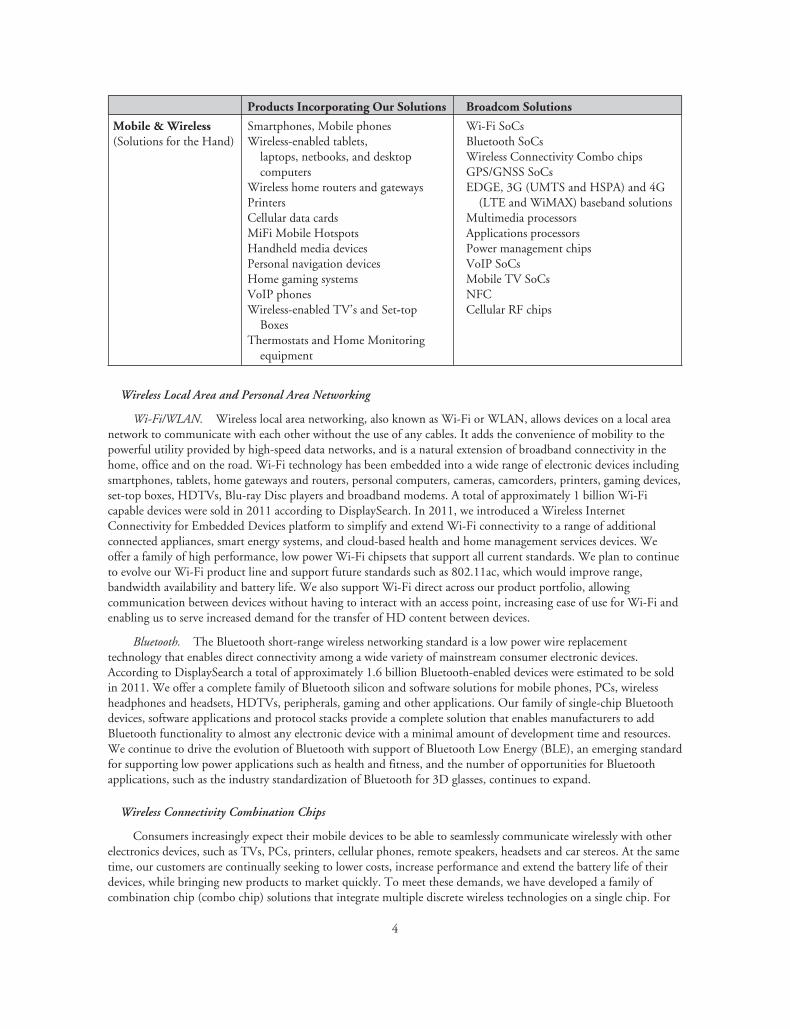
Products Incorporating Our Solutions Broadcom Solutions
Mobile & Wireless(Solutions for the Hand)
Smartphones, Mobile phonesWireless-enabled tablets,
laptops, netbooks, and desktopcomputers
Wireless home routers and gatewaysPrintersCellular data cardsMiFi Mobile HotspotsHandheld media devicesPersonal navigation devicesHome gaming systemsVoIP phonesWireless-enabled TV’s and Set-top
BoxesThermostats and Home Monitoring
equipment
Wi-Fi SoCsBluetooth SoCsWireless Connectivity Combo chipsGPS/GNSS SoCsEDGE, 3G (UMTS and HSPA) and 4G
(LTE and WiMAX) baseband solutionsMultimedia processorsApplications processorsPower management chipsVoIP SoCsMobile TV SoCsNFCCellular RF chips
Wireless Local Area and Personal Area Networking
Wi-Fi/WLAN. Wireless local area networking, also known as Wi-Fi or WLAN, allows devices on a local areanetwork to communicate with each other without the use of any cables. It adds the convenience of mobility to thepowerful utility provided by high-speed data networks, and is a natural extension of broadband connectivity in thehome, office and on the road. Wi-Fi technology has been embedded into a wide range of electronic devices includingsmartphones, tablets, home gateways and routers, personal computers, cameras, camcorders, printers, gaming devices,set-top boxes, HDTVs, Blu-ray Disc players and broadband modems. A total of approximately 1 billion Wi-Ficapable devices were sold in 2011 according to DisplaySearch. In 2011, we introduced a Wireless InternetConnectivity for Embedded Devices platform to simplify and extend Wi-Fi connectivity to a range of additionalconnected appliances, smart energy systems, and cloud-based health and home management services devices. Weoffer a family of high performance, low power Wi-Fi chipsets that support all current standards. We plan to continueto evolve our Wi-Fi product line and support future standards such as 802.11ac, which would improve range,bandwidth availability and battery life. We also support Wi-Fi direct across our product portfolio, allowingcommunication between devices without having to interact with an access point, increasing ease of use for Wi-Fi andenabling us to serve increased demand for the transfer of HD content between devices.
Bluetooth. The Bluetooth short-range wireless networking standard is a low power wire replacementtechnology that enables direct connectivity among a wide variety of mainstream consumer electronic devices.According to DisplaySearch a total of approximately 1.6 billion Bluetooth-enabled devices were estimated to be soldin 2011. We offer a complete family of Bluetooth silicon and software solutions for mobile phones, PCs, wirelessheadphones and headsets, HDTVs, peripherals, gaming and other applications. Our family of single-chip Bluetoothdevices, software applications and protocol stacks provide a complete solution that enables manufacturers to addBluetooth functionality to almost any electronic device with a minimal amount of development time and resources.We continue to drive the evolution of Bluetooth with support of Bluetooth Low Energy (BLE), an emerging standardfor supporting low power applications such as health and fitness, and the number of opportunities for Bluetoothapplications, such as the industry standardization of Bluetooth for 3D glasses, continues to expand.
Wireless Connectivity Combination Chips
Consumers increasingly expect their mobile devices to be able to seamlessly communicate wirelessly with otherelectronics devices, such as TVs, PCs, printers, cellular phones, remote speakers, headsets and car stereos. At the sametime, our customers are continually seeking to lower costs, increase performance and extend the battery life of theirdevices, while bringing new products to market quickly. To meet these demands, we have developed a family ofcombination chip (combo chip) solutions that integrate multiple discrete wireless technologies on a single chip. For
4

example, we offer combo chip solutions that integrate a complete Bluetooth system (with BLE and Bluetooth HighSpeed), a complete Wi-Fi system (including 802.11n Wi-Fi Direct functionality), and a high performance FM stereoradio receiver into a single die.
Global Positioning System
Global Positioning System (GPS) has long been a standard feature in navigation devices and has become acommon feature in smartphones and tablets. In addition to GPS, other satellite-based navigation systems have beendeployed such as GLONASS by Russia. Global Navigation Satellite System (GNSS) technology encompasses aplurality of such satellite-based navigation systems. By making use of additional satellite coverage, significantimprovement in location determination, location accuracy and time-to-first-fix can be obtained over a system thatrelies only on a GPS based solution, particularly in urban areas. Broadcom offers a family of GPS, assisted GPS(A-GPS) and GNSS semiconductor products, software and data services. Broadcom’s Location Based Servicestechnology delivers assistance data to our GNSS devices further enhancing performance and reliability.
Cellular Baseband, Multimedia Processors and Power Management
Handheld devices (such as cellular phones and tablets) and portable computers (such as netbooks and laptops)have become broadband multimedia gateways, enabling end users to wirelessly download email, view web pages,stream audio and video, play games and conduct videoconferences. The evolution of the international Global Systemfor Mobile Communication (GSM) standard to 3G and 4G technologies have enabled “always on” Internetapplications and more efficient data transport. These capabilities enable a range of devices from smart feature-phonesto smartphones and tablets. We develop EDGE, 3G and 4G, LTE and WiMAX chipsets and platform solutions withthe associated software. We use the same technologies to deliver cellular modem cards for use in portable computers,wireless gateway devices and embedded products.
Cellular SoC’s. We provide a family of 2.5G, 3G and 4G SoC chipsets and platform solutions with associatedsoftware. Our cellular SoC’s incorporate a high performance application processing subsystem, a 1080p multimedia/graphics subsystem and a cellular modem on a single chip. Our latest announced cellular SoC offers two integratedCortex A9 application processor cores operating up to 1.3 GHz.
As part of our cellular platform, Broadcom provides cellular RF and a family of power management devices thatintelligently manage power consumption in mobile devices to optimize system operation and improve battery life.
Mobile Multimedia Applications. Multimedia has become a necessary component in handheld devices. Tosupport new multimedia features, Broadcom offers our VideoCore® line of video and multimedia processors basedon a low power, high performance architecture. Our family of mobile multimedia co-processors enables an array ofmultimedia features, including support for high megapixel digital cameras and HD video encoding and decoding.
Voice over Internet Protocol
Driven by the significant build-out of the Internet, voice over an IP packet-based network, or VoIP applicationsare continuing to grow. Our VoIP phone silicon and software solutions integrate packet processing, voice processingand switching technologies to provide the quality of service, high fidelity and reliability necessary for enterprisetelephony applications and home routers/gateways. These products support residential VoIP services that are nowbeing offered by a variety of broadband service providers.
Near Field Communications
Near field communications (NFC) is an ultra short-range wireless standard to enable simple connectivity anddata transfer by the act of bringing two devices in close proximity. NFC has been adopted for contactless paymentsystems and can also be implemented in a variety of consumer devices, including mobile phones, tablets, and digitalTVs, remote controls, wireless mice, 3D glasses and Bluetooth headsets, to pair two devices and enable other forms ofwireless connectivity data transfer between devices. Broadcom has developed a family of NFC solutions with acombination of advanced power, size and functional requirements for original equipment manufacturers toimplement low-cost NFC consumer device applications in their products.
5

Infrastructure & Networking Reportable Segment
Through our Infrastructure & Networking reportable segment, we design and develop complete silicon andsoftware infrastructure solutions for service provider, data center, and enterprise and small-to-medium businessnetworks. Our solutions leverage industry-proven Ethernet technology to promote faster, “greener” and cost-efficienttransport and processing of voice, video, data and multimedia across both wired and wireless networks as networkdata traffic increases. In September 2011 we signed a definitive agreement to acquire NetLogic Microsystems, Inc., orNetLogic, a publicly traded company that is a leader in high-performance intelligent semiconductor solutions fornext generation networks, and upon closing of the acquisition, NetLogic will be incorporated into ourInfrastructure & Networking reportable segment. For more information about the NetLogic acquisition see the“Overview” section in Item 7. Management’s Discussion and Analysis of Financial Condition and Results of Operations.
Products Incorporating Our Solutions Broadcom Solutions
Infrastructure & Networking(Solutions for Infrastructure)
Service provider metro equipment3G/4G wireless infrastructure and wireless
access pointsSwitches, hubs and routers ServersWorkstationsDesktop and notebook computersNetwork interface cardsLAN on motherboard applicationsOptical networks and dense wave division
multiplexing applicationsVirtual private networks and
security appliancesMicrowave links for wireless backhaul
Ethernet copper transceiversEthernet controllersEthernet switchesBackplane and Optical front-end
physical layer devicesSecurity processors and adaptersBroadband processorsMicrowave modems and RF
Ethernet Networking
Ethernet has become a ubiquitous interconnection technology for providing high performance and cost effectivenetworking infrastructure across enterprise, service provider, data center and small and medium business (SMB)market segments. Our highly integrated, low power SoC solutions enable users to access data, voice and video fromtheir offices, homes or over wireless networks.
Ethernet Switches. We offer a broad set of Ethernet switching products ranging from low-cost five port switchchips to complete solutions that can be used to build systems in excess of 10 terabits of switching capacity in a singlechassis.
• Our service provider switch portfolio enables carrier/service provider networks to support a large number ofservices in the wireless backhaul, access, aggregation and core of their networks.
• Our Data Center portfolio provides high capacity, low latency switching silicon that supports advancedprotocols around virtualization and multi-pathing. In addition, our SAND Ethernet switching fabrictechnologies provide the ability to build highly scalable flat networks supporting tens of thousands of servers.
• For enterprise applications, our XGStm product family combines multi-layer switching capabilities with wire-speed Gigabit, 10 and 40 Gigabit Ethernet switching performance for unified wired and wireless enterprisebusiness networks.
• Our family of SMB Ethernet switch products are designed to support lower power modes and comply withindustry standards around energy efficient Ethernet.
Ethernet Copper Transceivers. Our high performance Ethernet transceivers are built upon a proprietary digitalsignal processing (DSP) communication architecture optimized for high-speed network connections and support thelatest standards and advanced features, such as energy efficient Ethernet, data encryption and time synchronization atone or 10 gigabits per second.
Gigabit and 10 Gigabit Ethernet Controllers. Our family of Ethernet controllers offers comprehensive solutionsfor servers, workstations, and desktop and notebook computers, supporting multiple generations of Ethernet
6

technology. Gigabit and 10 Gigabit Ethernet controllers deliver high performance dual-port, single-chip C-NIC at1Gbps or 10-Gbps rates, without requiring external packet memory.
Microwave Modems and RF. Our family of microwave modems and RF chip sets allows our customers to buildthe highest performance wireless backhaul and LAN extension products for the service provider market. They includefeatures such as dual polarization for increased throughput, integrated networking functionality and full pathprotection.
Automotive Ethernet. As consumer demand for in-vehicle connectivity continues to grow, automotivemanufacturers are under pressure to deliver competitive, innovative features while minimizing cost. Broadcom’sBroadR-Reach® automotive solutions allow multiple in-vehicle systems (such as infotainment, on-board diagnosticsand automated driver assistance) to simultaneously access information over unshielded single twisted pair cable. TheBroadcom automotive Ethernet product portfolio consists of five devices (including three highly integrated switcheswith embedded PHYs and two stand-alone PHY solutions) that deliver high-performance bandwidth of 100Mbpsand beyond while dramatically reducing connectivity costs.
Backplane and Optical Front-End Physical Layer Devices
To address increasing volumes of data traffic both in data centers and service provider networks, we offer aportfolio of 10G and 40G Ethernet transceivers, forward error correction solutions, and chips for backplanes andoptical interconnect. These devices are low-power solutions for very high density 10G and 40G switching solutions.We also offer 2.5G and 10G SONET/SDH/OTN transceivers that enable the development of low-cost, high-densityoptical transport equipment, enabling telecommunications and service providers to efficiently deliver data and voicetraffic over existing fiber networks. Our use of the complementary metal oxide semiconductor (CMOS) processallows substantially higher levels of integration and lower power consumption than competitive solutions.
Custom Silicon Products
We offer proprietary silicon devices for the LAN, WAN and PC markets that allow our customers to semi-customize by integrating their own intellectual property. For example, we have developed complex mixed-signaldesigns for customers that leverage our advanced design processes.
Licensing of Intellectual Property
We generate licensing revenue and related income from the licensing of our intellectual property. The vastmajority of our licensing revenue and related income to date has been derived from agreements with two customers,Verizon Wireless and QUALCOMM Incorporated, or Qualcomm. See detailed discussion in the “Overview” sectionin Item 7. Management’s Discussion and Analysis of Financial Condition and Results of Operations. This licensingrevenue and related income represented 3.1%, 3.3% and 4.8% of our total net revenue in 2011, 2010 and 2009,respectively.
Reference Platforms
To assist our customers in developing products, we develop reference platforms designed around our integratedcircuit products that represent prototypical system-level applications. These reference platforms generally include anextensive suite of software drivers, as well as protocol and application layer software. By providing reference platformsthat may ultimately be incorporated into our customers’ end products, we assist our customers in transitioning frominitial prototype designs to final production releases. We believe this enables our customers to achieve easier andfaster transitions from the initial prototype designs through final production releases. We believe these referenceplatform designs also significantly enhance customers’ confidence that our products will meet their marketrequirements and product introduction schedules.
7

Customers and Strategic Relationships
We sell our products to leading wired and wireless communications manufacturers. We have also establishedstrategic relationships with multiservice operators that provide wired and wireless communications services toconsumers and businesses. Customers currently shipping wired and/or wireless communications equipment anddevices incorporating our products include:
• Alcatel • Motorola• Apple • Netgear• Cisco • Nokia• Dell • Pace• EchoStar • Samsung• Hewlett-Packard • Technicolor• Huawei Technologies • ZTE• LG
A small number of customers have historically accounted for a substantial portion of our net revenue. Sales toour five largest customers represented 42.6%, 38.6% and 34.6% of our net revenue in 2011, 2010 and 2009,respectively. In 2011 sales to Apple and Samsung represented 13.1% and 10.0% of our net revenue, respectively. In2010, sales to Apple and Samsung represented 10.9% and 10.0% of our net revenue, respectively. See Note 13 ofNotes to Consolidated Financial Statements, included in Part IV, Item 15 of this Report. We expect that our keycustomers will continue to account for a substantial portion of our net revenue in 2012 and in the foreseeable future.These customers and their respective contributions to our net revenue have varied and will likely continue to varyfrom period to period. We typically sell products pursuant to purchase orders that customers can generally cancel,change or defer on short notice without incurring a significant penalty.
Research and Development
We have assembled a large team of experienced engineers and technologists, many of whom are leaders in theirparticular field or discipline. As of December 31, 2011 we had approximately 7,260 research and developmentemployees, including over 800 employees with Ph.D.s. These key employees are involved in advancing our coretechnologies, as well as product development. Because SoC solutions benefit from the same underlying coretechnologies, we are able to address a wide range of communications markets with a relatively focused investment inresearch and development. Our research and development expense was $1.98 billion, $1.76 billion and $1.54 billionin 2011, 2010 and 2009, respectively. These amounts included stock-based compensation expense for employeesengaged in research and development of $364 million, $341 million and $352 million in 2011, 2010 and 2009,respectively.
We believe that increased IP integration and the timely introduction of new products are essential to ourgrowth. While we endeavor to manage our costs and expenses to attain our long-term business objectives, we plan tomaintain significant research and development staffing levels for the foreseeable future. We have design centersthroughout the United States, including our principal design facilities in Irvine, California and Santa Clara County,California. Internationally, we have design facilities in Asia, Europe, Israel and Canada. We anticipate establishingadditional design centers in the United States and in other countries.
8

Manufacturing
Wafer Fabrication
We depend on multiple foundry subcontractors located in Asia to manufacture a majority of our products. Ourkey silicon foundries are:
• Taiwan Semiconductor Manufacturing Corporation in Taiwan;• GlobalFoundries, Inc. (formerly Chartered Semiconductor Manufacturing) in Singapore;• Semiconductor Manufacturing International Corporation in China; and• United Microelectronics Corporation in Singapore and Taiwan.
By subcontracting manufacturing, we focus resources on design and test applications where we believe we havegreater competitive advantages. This strategy also eliminates the high cost of owning and operating semiconductorwafer fabrication facilities. See “Risk Factors” under Item 1A of this Report for a discussion of the risks associated withour dependence on independent foundry subcontractors.
Most of our products are manufactured using CMOS process technology. Our products are currently fabricatedon a variety of processes ranging from 500 nanometers to 40 nanometers. We generally evaluate the benefits, on aproduct-by-product basis, of migrating to smaller geometry process technologies. Approximately 61.3% of ourproducts are currently manufactured in 65 nanometers. We are designing most new products in 40 nanometers and28 nanometers, and are beginning to evaluate 20 nanometers. See “Risk Factors” under Item 1A of this Report for adiscussion of the risks associated with transitioning to smaller geometry process technologies.
Assembly and Test
Our products are tested either at the wafer level and/or packaged finished products level. Our product testing isconducted by independent foundries, and independent test subcontractors. The die are assembled into finishedproducts by independent assembly and package subcontractors. A majority of our test and assembly is performed bythe following independent subcontractors:
• United Test and Assembly Center in Singapore, China and Thailand (test, assembly and packaging);• Advanced Semiconductor Engineering (ASE) in China and Taiwan (test, assembly and packaging);• Siliconware Precision in Taiwan (test, assembly and packaging);• Amkor in Korea, Philippines, Taiwan and China (assembly and packaging only);• Signetics in Korea (assembly and packaging only);• STATSChipPAC in Singapore, Korea, Malaysia and China (test, assembly and packaging);
See “Risk Factors” under Item 1A of this Report for a discussion of the risks associated with our dependence onthird party assembly and test subcontractors.
Quality Assurance
We focus on product reliability from the initial stage of the design cycle through each specific design process,including layout and production test design. Our operations and quality engineering teams closely manage theinterface between manufacturing and design engineering. We prequalify each assembly and foundry subcontractor.We also participate in quality and reliability monitoring by reviewing electrical and parametric data from our waferfoundry and assembly subcontractors. We closely monitor wafer foundry production to ensure consistent overallquality, reliability and yield levels. All of our principal independent foundries and package assembly facilities arecurrently ISO 9001 certified, a comprehensive International Standards Organization specified quality systemacknowledgement. As part of our total quality program, we received ISO 9001 certification for our Singaporedistribution facility.
Environmental Management
We monitor the environmental impact of our products. Our manufacturing subcontractors have registered ourmanufacturing flow to ISO 14000, the international standard related to environmental management. Lead-freesolutions in electronic components and systems are receiving increasing attention within the semiconductor industry.
9

Our products are compliant with the Restriction of Hazardous Substances Directive, or RoHS, the Europeanlegislation that restricts the use of a number of substances, including lead, and current European REACH(Regulation, Evaluation and Authorization of Chemicals) laws.
Product Distribution
The majority of our products are distributed internationally to customers through our distribution center inSingapore and a smaller portion domestically via an operations and distribution center in Irvine, California. Netproduct revenue derived from actual shipments to international destinations, primarily in Asia represented 98.5%,97.2% and 94.8% of our net revenue in 2011, 2010 and 2009, respectively.
Sales and Marketing
Our sales and marketing strategy is to achieve design wins with technology leaders by providing quality,state-of-the-art products, superior engineering execution, and superior sales, field application and engineeringsupport. We market and sell our products in the United States through a direct sales force, distributors andmanufacturers’ representatives. The majority of our domestic sales occur through our direct sales force, which is basedin offices located in California and throughout the United States.
We market and sell our products internationally through regional offices in Asia, Europe and North America, aswell as through a network of independent and fulfillment distributors and representatives in Asia, Australia, Europeand North America. We or our customers select these independent entities based on their ability to provide effectivefield sales, marketing communications and technical support to our customers. All international sales to date havebeen in U.S. dollars. We present revenue from independent customers by geographic area in Note 13 of Notes toConsolidated Financial Statements, included in Part IV, Item 15 of this Report.
Backlog
Our sales are primarily made through standard purchase orders for delivery of products. Due to industrypractice that allows customers to cancel, change or defer orders with limited advance notice prior to shipment, we donot believe that backlog is a reliable indicator of future revenue levels.
Competition
The semiconductor industry in general, and wired and wireless communications markets in particular, areintensely competitive and are characterized by rapid change, evolving standards, short product life cycles and priceerosion. We believe that the principal factors of competition for integrated circuit providers include:
• product quality and reputation • market presence• product capabilities • standards compliance• level of integration • system cost• engineering execution • intellectual property• reliability • customer interface and support• price • time-to-market
We believe that we compete favorably with respect to each of these factors.
We compete with a number of major domestic and international suppliers of integrated circuits and relatedapplications. We also compete with suppliers of system-level and motherboard-level solutions incorporatingintegrated circuits that are proprietary or sourced from manufacturers other than Broadcom. This competition hasresulted and will continue to result in declining average selling prices for our products in certain markets. We alsomay face competition from newly established competitors, suppliers of products based on new or emergingtechnologies, and customers that choose to develop their own silicon solutions. We expect to encounter continuingconsolidation in the markets in which we compete.
Some of our competitors operate their own fabrication facilities and have longer operating histories and presencein key markets, greater name recognition, larger customer bases and significantly greater financial, sales andmarketing, manufacturing, distribution and other resources than we do. As a result, these competitors may be able to
10

adapt more quickly to new or emerging technologies and changes in customer requirements or devote greaterresources to the promotion and sale of their products. Current and potential competitors have established or mayestablish financial or strategic relationships among themselves or with existing or potential customers, resellers orother third parties, and may refuse to provide us with information necessary to permit the interoperability of ourproducts with theirs. Accordingly, it is possible that new competitors or alliances among competitors could emergeand rapidly acquire significant market share. In addition, competitors may develop technologies that more effectivelyaddress our markets with products that offer enhanced features, lower power requirements or lower costs. Increasedcompetition could result in pricing pressures, decreased gross margins and loss of market share and may materiallyand adversely affect our business, financial condition and results of operations. See “Risk Factors” under Item 1A ofthis Report for further discussion of the risks associated with competition.
Seasonality
An increasing number of our products are being incorporated into consumer electronic products, which aresubject to significant seasonality and fluctuations in demand, and tend to have stronger sales in the middle of thefiscal year as manufacturers prepare for the major holiday selling seasons.
Intellectual Property
Our success and future product revenue growth depend, in part, on our ability to protect our intellectualproperty. We rely primarily on patents, copyrights, trademarks and trade secrets, as well as nondisclosure agreementsand other methods, to protect our proprietary technologies and processes. However, these may not providemeaningful or adequate protection for our intellectual property.
We currently hold more than 6,000 U.S. and more than 2,550 foreign patents (up from more than4,800 U.S. and more than 2,000 foreign patents from the prior year) and have more than 7,350 additional U.S. andforeign pending patent applications. We also generally enter into confidentiality agreements with our employees andstrategic partners, and typically control access to and distribution of product documentation and other proprietaryinformation. Despite these precautions, it is possible that competitors or other unauthorized third parties may obtain,copy, use or disclose our technologies and processes, develop similar technology independently, or design around ourpatents. As such, any rights granted under our patents may not provide us with meaningful protection. In addition,we may not be able to successfully enforce our patents against infringing products in every jurisdiction. See “RiskFactors” under Item 1A of this Report for further discussion of the risks associated with patents and intellectualproperty.
Some or all of our patents have in the past been licensed and likely will in the future be licensed to certain of ourcompetitors through cross-license agreements, such as the Qualcomm Agreement. See the detailed discussion in the“Overview” section in Item 7. Management’s Discussion and Analysis of Financial Condition and Results of Operations.Moreover, because we have participated and continue to participate in developing various industry standards, we maybe required to license some of our patents to others, including competitors, who develop products based on thosestandards.
Companies in and related to the semiconductor industry and the wired and wireless communications marketsoften aggressively protect and pursue their intellectual property rights. We are currently engaged in litigation and mayneed to engage in additional litigation to enforce our intellectual property rights or the rights of our customers, toprotect our trade secrets, or to determine the validity and scope of proprietary rights of others, including ourcustomers. In addition, we are currently engaged in litigation and may engage in future litigation with parties thatclaim that we infringed their patents or misappropriated or misused their trade secrets. Such litigation will result insubstantial costs and diversion of our resources and could materially and adversely affect our business, financialcondition and results of operations. For a detailed description of our outstanding intellectual property litigation, seeNote 12 of Notes to Consolidated Financial Statements, included in Part IV, Item 15 of this Report.
Employees
As of December 31, 2011 we had approximately 9,590 employees, including 7,260 individuals engaged inresearch and development, 910 engaged in sales and marketing, 580 engaged in manufacturing operations, and 840
11

engaged in general and administrative activities. Our employees are not represented by any collective bargainingagreement, and we have never experienced a work stoppage. We believe our employee relations are good.
Item 1A. Risk Factors
Before deciding to purchase, hold or sell our common stock, you should carefully consider the risks described below inaddition to the other information contained in this Report and in our other filings with the SEC, including subsequentreports on Forms 10-Q and 8-K. The risks and uncertainties described below are not the only ones we face. Additional risksand uncertainties not presently known to us or that we currently deem immaterial may also affect our business. If any ofthese known or unknown risks or uncertainties actually occurs with material adverse effects on Broadcom, our business,financial condition, results of operations and/or liquidity could be seriously harmed. In that event, the market price for ourClass A common stock will likely decline, and you may lose all or part of your investment.
Our quarterly operating results may fluctuate significantly.
Our quarterly net revenue and operating results have fluctuated significantly in the past and are likely tocontinue to vary from quarter to quarter. Variability in the nature of our operating results may be attributed to thefactors identified throughout this “Risk Factors” section, many of which may be outside our control, including:
• changes in economic conditions in the markets we address, including the continuing volatility in thetechnology sector and semiconductor industry;
• seasonality in sales of consumer and enterprise products in which our products are incorporated;• our dependence on a few significant customers and/or design wins for a substantial portion of our revenue;• timing, rescheduling or cancellation of significant customer orders and our ability, as well as the ability of our
customers, to manage inventory;• changes in customer product needs and market acceptance of our products;• competitive pressures and other factors such as the qualification, availability and pricing of competing
products and technologies and the resulting effects on sales and pricing of our products;• the impact of a significant natural disaster, such as an earthquake, severe weather, tsunami or other flooding,
or a nuclear crisis, as well as interruptions or shortages in the supply of utilities such as water and electricity,on a key location such as our corporate headquarters or our Northern California facilities, both of which arelocated near major earthquake fault lines; and
• the impact of tax examinations.
We depend on a few significant customers for a substantial portion of our revenue.
We derive a substantial portion of our revenue from sales to a relatively small number of customers. Sales to ourfive largest customers represented 42.6%, 38.6% and 34.6% of our total net revenue for 2011, 2010, and 2009,respectively. We expect that our largest customers will continue to account for a substantial portion of our total netrevenue for the foreseeable future. The loss of any significant customer could materially and adversely affect ourfinancial condition and results of operations.
A significant portion of our revenue in any period may also depend on a single product design win with a largecustomer. As a result, the loss of any such key design win or any significant delay in the ramp of volume productionof the customer’s products into which our product is designed could materially and adversely affect our financialcondition and results of operations. We may not be able to maintain sales to certain of our key customers or continueto secure key design wins for a variety of reasons, including:
• agreements with our customers typically do not require them to purchase a minimum quantity of ourproducts; and
• our customers can stop incorporating our products into their own products with limited notice to us andsuffer little or no penalty.
In addition, the majority of our licensing revenues and related income to date has been derived from agreementswith two customers, Verizon Wireless and Qualcomm. From January 2008 through December 2011, we recorded$753 million in licensing revenue and related income derived from Verizon Wireless and Qualcomm and we expect
12

to record an additional $272 million. The licensing revenue from our agreement with Verizon Wireless has endedand the income from the Qualcomm Agreement is non-recurring and will terminate in 2013. There can be noassurances that we will be able to enter into additional such arrangements in the future, or that we will be able tosuccessfully collect the remaining payments due to us under the Qualcomm Agreement in the event of a default byQualcomm.
The loss of a key customer or design win, a reduction in sales to any key customer, decrease in licensing revenue,significant delay in our customers’ product development plans, or our inability to attract new significant customers orsecure new key design wins could seriously impact our revenue and materially and adversely affect our results ofoperations.
We face intense competition.
The semiconductor industry and the wired and wireless communications markets are intensely competitive. Weexpect competition to continue to increase as new markets develop, as industry standards become well known and asother competitors enter our business. We expect to encounter further consolidation in the markets in which wecompete.
Many of our competitors have longer operating histories and presences in key markets, greater namerecognition, larger customer bases, and significantly greater financial, sales and marketing, manufacturing,distribution, technical and other resources than we do, and in some cases operate their own fabrication facilities.These competitors may be able to adapt more quickly to new or emerging technologies and changes in customerrequirements. They may also be able to devote greater resources to the promotion and sale of their products. We alsoface competition from newly established competitors, suppliers of products, and customers who choose to developtheir own semiconductor solutions.
Existing or new competitors may develop technologies that more effectively address our markets with productsthat offer enhanced features and functionality, lower power requirements, greater levels of integration or lower cost.Increased competition also has resulted in and is likely to continue to result in increased expenditures on research anddevelopment, declining average selling prices, reduced gross margins and loss of market share in certain markets.These factors in turn create increased pressure to consolidate. We cannot assure you that we will be able to continueto compete successfully against current or new competitors. If we do not compete successfully, we may lose marketshare in our existing markets and our revenues may fail to increase or may decline.
We face risks associated with our acquisition strategy.
A key element of our business strategy involves expansion through the acquisitions of businesses, assets, productsor technologies. The expansion of our business through acquisitions allows us to complement our existing productofferings, expand our market coverage, increase our engineering workforce or enhance our technological capabilities.We may not be able to identify or consummate future acquisitions or realize the desired benefit from theseacquisitions.
We face a number of challenges associated with our acquisition strategy that could disrupt our ongoing businessand distract our management team, including:
• delays in the timing and successful integration of an acquired company’s technologies;• the loss of key personnel;• if our actual results, or the plans and estimates used in future impairment analyses, are less favorable than the
original estimates used to assess the recoverability of these assets, we could incur additional impairmentcharges;
• lower gross margins, revenues and operating income than originally anticipated at the time of acquisition andother financial challenges; and
• becoming subject to intellectual property or other litigation.
Acquisitions can result in increased debt or contingent liabilities. While we believe we will have the ability toservice any additional debt we may potentially issue in connection with acquisitions, our ability to make principaland interest payments when due depends upon our future performance, which will be subject to general economic
13

conditions, industry cycles, and business and other factors affecting our operations, including the other risk factorsdescribed in this section, many of which are beyond our control. Acquisitions can also result in adverse taxconsequences, warranty or product liability exposure related to acquired assets, additional stock-based compensationexpense, write up of acquired inventory to fair value, and the recording and later amortization of amounts related tocertain purchased intangible assets. In addition, we may record goodwill and other purchased intangible assets inconnection with an acquisition and incur impairment charges in the future. Each of the above may apply equally toour pending acquisition of NetLogic Microsystems, Inc., which is our largest acquisition to date.
We may fail to adjust our operations in response to changes in demand.
Through internal growth and acquisitions, we significantly modified the scope of our operations and workforcein recent years. Our operations are characterized by a high percentage of costs that are fixed or difficult to reduce inthe short term, such as research and development expenses and our highly skilled workforce. During some periods,our growth has placed a significant strain on our management personnel, systems and resources. To respond toperiods of increased demand, we will be required to expand, train, manage and motivate our workforce. Alternatively,in response to the economic downturn in the markets in the semiconductor industry and communications market,we may be required to implement restructuring actions and a number of other cost saving measures. All of theseendeavors require substantial management effort. If we are unable to effectively manage our expanding operations, wemay be unable to adjust our business quickly enough to meet competitive challenges or exploit potential marketopportunities, or conversely, we may scale our business too quickly and the rate of increase in our expenses mayexceed the rate of increase in our revenue, either of which would materially and adversely affect our current or futurebusiness.
Our operating results may be adversely impacted by worldwide economic uncertainties and specific conditionsin the markets we address.
We operate primarily in the semiconductor industry, which is cyclical and subject to rapid change and evolvingindustry standards. From time to time, the semiconductor industry has experienced significant downturnscharacterized by decreases in product demand, excess customer inventories and accelerated erosion of prices. Thesemiconductor industry also periodically experiences increased demand and production capacity constraints, whichmay affect our ability to ship products. An increasing number of our products are being incorporated into consumerelectronic products, which are subject to significant seasonality and fluctuations in demand. Economic volatility cancause extreme difficulties for our customers and vendors in accurately forecasting and planning future businessactivities. This unpredictability could cause our customers to reduce spending on our products and services, whichwould delay and lengthen sales cycles. Furthermore, during challenging economic times our customers and vendorsmay face challenges in gaining timely access to sufficient credit, which could impact their ability to make timelypayments to us. As a result, we may experience growth patterns that are different than the end demand for products,particularly during periods of high volatility.
We cannot predict the timing, strength or duration of any economic slowdown or recovery or the impact ofsuch events on our customers, our vendors or us. The combination of our lengthy sales cycle coupled withchallenging macroeconomic conditions and supply chain cross-dependencies could have a compound impact on ourbusiness. The impact of market volatility is not limited to revenue but may also affect our product gross margins andother financial metrics. Any downturn in the semiconductor industry may be severe and prolonged, and any failureof the industry or wired and wireless communications markets to fully recover from downturns could seriouslyimpact our revenue and harm our business, financial condition and results of operations.
Our stock price is highly volatile.
The market price of our Class A common stock has fluctuated substantially in the past and is likely to continueto be highly volatile and subject to wide fluctuations. From January 1, 2009 through December 31, 2011 our Class Acommon stock has traded at prices as low as $15.31 and as high as $47.39 per share. Fluctuations have occurred andmay continue to occur in response to various factors, many of which we cannot control.
In addition, the market prices of securities of Internet-related, semiconductor and other technology companieshave been and remain volatile. This volatility has significantly affected the market prices of securities of many
14

technology companies for reasons frequently unrelated to the operating performance of the specific companies. If ouroperating results do not meet the expectations of securities analysts or investors, who may derive their expectations byextrapolating data from recent historical operating results, the market price of our Class A common stock will likelydecline. Accordingly, you may not be able to resell your shares of common stock at or above the price you paid. Inthe past, we, and other companies that have experienced volatility in the market price of their securities, have beenthe subject of securities class action litigation.
Due to the nature of our compensation programs, most of our executive officers sell shares of our common stockeach quarter or otherwise periodically, often pursuant to trading plans established under Rule 10b5-1 promulgatedunder the Securities Exchange Act of 1934, as amended, or the Exchange Act. As a result, sales of shares by ourexecutive officers may not be indicative of their respective opinions of Broadcom’s performance at the time of sale orof our potential future performance. Nonetheless, the market price of our stock may be affected by sales of shares byour executive officers.
We may be required to defend against alleged infringement of intellectual property rights of others and/or maybe unable to adequately protect or enforce our own intellectual property rights.
Companies in the semiconductor industry and the wired and wireless communications markets aggressivelyprotect and pursue their intellectual property rights. From time to time, we receive notices that claim we haveinfringed upon, misappropriated or misused other parties’ proprietary rights. Additionally, we receive notices thatchallenge the validity of our patents. Intellectual property litigation can be expensive, time consuming and distractingto management. An adverse determination in any of these types of disputes could prevent us from manufacturing orselling some of our products or could prevent us from enforcing our intellectual property rights.
We may also be required to indemnify some customers and strategic partners under our agreements if a thirdparty alleges or if a court finds that our products or activities have infringed upon, misappropriated or misusedanother party’s proprietary rights. We have received requests from certain customers and strategic partners to includeincreasingly broad indemnification provisions in our agreements with them. These indemnification provisions may,in some circumstances, extend our liability beyond the products we provide to include liability for combinations ofcomponents or system level designs and for consequential damages and/or lost profits. Even if claims or litigationagainst us are not valid or successfully asserted, these claims could result in significant costs and diversion of theattention of management and other key employees to defend.
Our products may contain technology provided to us by other parties such as contractors, suppliers orcustomers. We may have little or no ability to determine in advance whether such technology infringes theintellectual property rights of a third party. Our contractors, suppliers and licensors may not be required toindemnify us in the event that a claim of infringement is asserted against us, or they may be required to indemnify usonly up to a maximum amount, above which we would be responsible for any further costs or damages. Any of theseclaims or litigation may materially and adversely affect our business, financial condition and results of operations.
Furthermore, our success and future revenue growth will depend, in part, on our ability to protect ourintellectual property. It is possible that competitors or other unauthorized third parties may obtain, copy, use ordisclose our technologies and processes. Any of our existing or future patents may be challenged, invalidated orcircumvented. We engage in litigation to enforce or defend our intellectual property rights, protect our trade secrets,or determine the validity and scope of the proprietary rights of others, including our customers. If our intellectualproperty rights do not adequately protect our technology, our competitors may be able to offer products similar toours.
Our software may be derived from “open source” software, which is generally made available to the public by itsauthors and/or other third parties. Open source software is often made available under licenses, which impose certainobligations in the event we distribute derivative works of the open source software. These obligations may require usto make source code for the derivative works available to the public, and/or license such derivative works on differentterms than those customarily used to protect our intellectual property. With respect to our proprietary software, wegenerally license such software under terms that prohibit combining it with open source software. Despite theserestrictions, parties may combine our proprietary software with open source software without our authorization, inwhich case we might nonetheless be required to release the source code of our proprietary software.
15

We enter into confidentiality agreements with our employees, consultants and strategic partners. We also controlaccess to and distribution of our technologies, documentation and other proprietary information. Despite these efforts,internal or external parties may attempt to copy, disclose, obtain or use our products, services or technology withoutour authorization. Additionally, current, departing or former employees or third parties could attempt to penetrate ourcomputer systems and networks to misappropriate our proprietary information and technology or interrupt ourbusiness. Because the techniques used by computer hackers and others to access or sabotage networks changefrequently and generally are not recognized until launched against a target, we may be unable to anticipate, counter orameliorate these techniques. As a result, our technologies and processes may be misappropriated.
We cannot assure you that our efforts to prevent the misappropriation or infringement of our intellectualproperty or the intellectual property of our customers will succeed. Identifying unauthorized use of our products andtechnologies is difficult and time consuming. The initiation of litigation may adversely affect our relationships andagreements with certain customers that have a stake in the outcome of the litigation proceedings. Litigation is veryexpensive and may divert the attention of management and other key employees from the operation of the business,which could negatively impact our business and results of operations.
We are subject to order and shipment uncertainties.
It is difficult to accurately predict demand for our semiconductor products. We typically sell products pursuant topurchase orders rather than long-term purchase commitments. Customers can generally cancel, change or defer purchaseorders on short notice without incurring a significant penalty. Our ability to accurately forecast customer demand is furtherimpaired by delays inherent in our lengthy sales cycle. We operate in a dynamic industry and use significant resources todevelop new products for existing and new markets. After we have developed a product, there is no guarantee that ourcustomers will integrate our product into their equipment or devices and, ultimately, bring those equipment and devicesincorporating our product to market. In these situations, we may never produce or deliver a significant number of ourproducts, even after incurring substantial development expenses. From the time a customer elects to integrate our solutioninto their product, it is typically six to 24 months before high volume production of that product commences. After volumeproduction begins, we cannot be assured that the equipment or devices incorporating our product will gain marketacceptance.
Our products are incorporated into complex devices and systems, creating supply chain cross-dependencies.Accordingly, supply chain disruptions affecting components of our customers’ devices and/or systems could negativelyimpact the demand for our products, even if the supply of our products is not directly affected.
Our product demand forecasts are based on multiple assumptions, each of which may introduce error into ourestimates. In the event we overestimate customer demand, we may allocate resources to manufacturing products that wemay not be able to sell. As a result, we could hold excess or obsolete inventory, which would reduce our profit margins andadversely affect our financial results. Conversely, if we underestimate customer demand or if insufficient manufacturingcapacity is available, we could forego revenue opportunities and potentially lose market share and damage our customerrelationships. Also, due to our industry’s shift to “just-in-time” inventory management, any disruption in the supply chaincould lead to more immediate shortages in product or component supply. In addition, an increasing percentage of ourinventory is maintained under hubbing arrangements whereby products are delivered to a customer or third partywarehouse based upon the customer’s projected needs. Under these arrangements, we do not recognize product revenueuntil the customer reports that it has removed our product from the warehouse to incorporate into its end products. Ourability to effectively manage inventory levels may be impaired under our hubbing arrangements, which could increaseexpenses associated with excess and obsolete product inventory and negatively impact our cash flow.
We manufacture and sell complex products and may be unable to successfully develop and introduce newproducts.
We expect that a high percentage of our future sales will come from sales of new products. We sell products inmarkets that are characterized by rapid technological change, evolving industry standards, frequent new productintroductions and short product life cycles. The markets for some of these products are new to us and may beimmature and/or unpredictable. These markets may not develop into profitable opportunities and we have investedsubstantial resources in emerging technologies that did not achieve the market acceptance that we had expected. As aresult, it is difficult to anticipate our future revenue streams from, or the sustainability of, our new products.
16

Our industry is dynamic and we are required to devote significant resources to research and development toremain competitive. The development of new silicon devices is highly complex, and due to supply chain cross-dependencies and other issues, we may experience delays in completing the development, production andintroduction of our new products. We may choose to discontinue one or more products or product developmentprograms to dedicate more resources to other products. The discontinuation of an existing or planned product mayadversely affect our relationship with one or more of our customers.
Our ability to successfully develop and deliver new products will depend on various factors, including our abilityto:
• effectively identify and capitalize upon opportunities in new markets;• timely complete and introduce new integrated products;• transition our semiconductor products to increasingly smaller line width geometries;• license any desired third party technology or intellectual property rights;• obtain sufficient foundry capacity and packaging materials; and• qualify and obtain industry interoperability certification of our products.
If we are not able to develop and introduce new products in a cost effective and timely manner, we will beunable to attract new customers or to retain our existing customers which would materially and adversely affect ourresults of operations.
We have experienced hardware and software defects and bugs associated with the introduction of our highlycomplex products. If any of our products contain defects or bugs, or have reliability, quality or compatibilityproblems, our reputation may be damaged and customers may be reluctant to buy our products. These problemscould interrupt or delay sales and shipments of our products to customers. To alleviate these problems, we may haveto divert our resources from other development efforts. In addition, these problems could result in claims against usby our customers or others, including possible claims for consequential damages and/or lost profits.
We are exposed to risks associated with our international operations.
We currently obtain substantially all of our manufacturing, assembly and testing services from suppliers locatedoutside the United States. Products shipped to international destinations, primarily in Asia, represented 98.5%,97.2% and 94.8% of our product revenue in 2011, 2010 and 2009, respectively. In addition, we undertake varioussales and marketing activities through regional offices in a number of countries. We intend to continue expandingour international business activities and to open other design and operational centers abroad.
International operations are subject to many inherent risks, including but not limited to:
• political, social and economic instability;• exposure to different business practices and legal standards, particularly with respect to intellectual property;• continuation of overseas conflicts and the risk of terrorist attacks and resulting heightened security;• the imposition of governmental controls and restrictions and unexpected changes in regulatory requirements;• nationalization of business and blocking of cash flows;• changes in taxation and tariffs; and• difficulties in staffing and managing international operations.
Economic conditions in our primary overseas markets, particularly in Asia, may negatively impact the demandfor our products abroad. Also, all of our international sales to date have been denominated in U.S. dollars.Accordingly, an increase in the value of the U.S. dollar relative to foreign currencies could make our products lesscompetitive in international markets or require us to assume the risk of denominating certain sales in foreigncurrencies. We anticipate that these factors will impact our business to a greater degree as we further expand ourinternational business activities.
We depend on third parties to fabricate, assemble and test our products.
As a fabless semiconductor company, we do not own or operate fabrication, assembly or test facilities. We relyon third parties to manufacture, assemble and test substantially all of our semiconductor devices. Accordingly, wecannot directly control our product delivery schedules and quality assurance. This lack of control could result in
17

product shortages or quality assurance problems. These issues could delay shipments of our products or increase ourassembly or testing costs. In addition, the consolidation of foundry subcontractors, as well as the increasing capitalintensity and complexity associated with fabrication in smaller process geometries may limit our diversity of suppliers,potentially driving increased wafer prices and adversely affecting our results of operations, including our productgross margins.
We do not have long-term agreements with any of our direct or indirect suppliers, including our manufacturing,assembly or test subcontractors. We typically procure services from these suppliers on a per order basis. In the eventour third-party foundry subcontractors experience a disruption or limitation of manufacturing, assembly or testingcapacity, we may not be able to obtain alternative manufacturing, assembly and testing services in a timely manner,or at all. Furthermore, our foundries must have new manufacturing processes qualified if there is a disruption in anexisting process, which could be time-consuming. We could experience significant delays in product shipments if weare required to find alternative manufactures, assemblers or testers for our products. We are continuing to developrelationships with additional third-party subcontractors to assemble and test our products.
Because we rely on outside foundries and other third party suppliers, we face several significant risks in additionto those discussed above, including:
• a lack of guaranteed supply of wafers and other components and potential higher wafer and component pricesdue to supply constraints;
• the limited availability of, or potential delays in obtaining access to, key process technologies; and• the location of foundries and other suppliers in regions that are subject to earthquakes, tsunamis and other
natural disasters.
The manufacture of integrated circuits is a highly complex and technologically demanding process. Ourfoundries have from time to time experienced lower than anticipated manufacturing yields. This often occurs duringthe production of new products or the installation and start-up of new process technologies. In addition, we aredependent on our foundry subcontractors to successfully transition to smaller geometry processes.
There can be no assurance that we will continue to declare cash dividends.
In January 2010, our Board of Directors adopted a dividend policy pursuant to which Broadcom would payquarterly dividends on our common stock. In January 2011, our Board of Directors increased the quarterly dividendpayment. We intend to continue to pay such dividends subject to capital availability and periodic determinations byour Board of Directors that cash dividends are in the best interest of our shareholders and are in compliance with alllaws and agreements of Broadcom applicable to the declaration and payment of cash dividends.
Future dividends may be affected by, among other factors:
• our views on potential future capital requirements for investments in acquisitions and the funding of ourresearch and development;
• use of cash to consummate various acquisition transactions;• stock repurchase programs;• changes in federal and state income tax laws or corporate laws; and• changes to our business model.
Our dividend payments may change from time to time, and we cannot provide assurance that we will continueto increase our dividend payment or declare dividends in any particular amounts or at all. A reduction in ourdividend payments could have a negative effect on our stock price.
We may be unable to attract, retain or motivate key personnel.
Our future success depends on our ability to attract, retain and motivate senior management and qualifiedtechnical personnel. Competition for these employees is intense. If we are unable to attract, retain and motivate suchpersonnel in sufficient numbers and on a timely basis, we will experience difficulty in implementing our currentbusiness and product plans. In that event, we may be unable to successfully meet competitive challenges or to exploitpotential market opportunities, which could adversely affect our business and results of operations.
18

Government regulation may adversely affect our business.
The effects of regulation on our customers or the industries in which they operate may materially and adverselyimpact our business. For example, the Federal Communications Commission, or FCC, has broad jurisdiction in theUnited States over many of the devices into which our products are incorporated. FCC regulatory policies that affectthe ability of cable or satellite operators or telephone companies to offer certain services to their customers or otheraspects of their business may impede sales of our products in the United States. In addition, we may experience delaysif a product incorporating our chips fails to comply with FCC emissions specifications.
We and our customers are subject to various import and export laws and regulations. Government exportregulations apply to the encryption or other features contained in some of our products. If we fail to continue toreceive licenses or otherwise comply with these regulations, we may be unable to manufacture the affected products atforeign foundries or ship these products to certain customers, or we may incur penalties or fines.
Our business may also be subject to regulation by countries other than the United States. Foreign governmentsmay impose tariffs, duties and other import restrictions on components that we obtain from non-domestic suppliersand may impose export restrictions on products that we sell internationally. These tariffs, duties or restrictions couldmaterially and adversely affect our business, financial condition and results of operations.
Our product or manufacturing standards could also be impacted by new or revised environmental rules andregulations or other social initiatives. For instance, the U.S. Securities and Exchange Commission proposed newdisclosure requirements relating to the sourcing of certain minerals from the Democratic Republic of Congo andcertain other adjoining countries. When these new requirements are in effect, they could adversely affect our costs,the availability of minerals used in our products and our relationships with customers and suppliers.
Our business is subject to potential tax liabilities.
We are subject to income taxes in the United States and various foreign jurisdictions. The amount of incometaxes we pay is subject to our interpretation and application of tax laws in jurisdictions in which we file. Changes incurrent or future laws or regulations, or the imposition of new or changed tax laws or regulations or new relatedinterpretations by taxing authorities in the U.S. or foreign jurisdictions, could adversely affect our results ofoperations. We are subject to examinations and tax audits. There can be no assurance that the outcomes from theseaudits will not have an adverse effect on our net operating loss and research and development tax creditcarryforwards, our financial position, or our operating results.
In certain foreign jurisdictions, we operate under tax holidays and favorable tax incentives. For instance, inSingapore we operate under tax holidays, which are effective through March 31, 2014, that reduce taxes onsubstantially all of our operating income in that jurisdiction. Such tax holidays and incentives often require us tomeet specified employment and investment criteria in such jurisdictions. In a period of tight manufacturing capacity,our ability to meet Singaporean content in our products may be more limited, which may have adverse taxconsequences. More generally, if any of our tax holidays or incentives are terminated or if we fail to meet the criteriato continue to enjoy such holidays or incentives, our results of operations may be materially and adversely affected.We have begun discussions with the Singapore Economic Development Board with respect to tax incentives forperiods after March 31, 2014. No assurances can be given that such discussions will be successful. If we are unable toreach an agreement with Singapore (or another jurisdiction that provides similar benefits to those we realize from ourcurrent incentives in Singapore), our results of operations and financial position for periods after March 31, 2014 willbe adversely affected.
Our articles of incorporation and bylaws contain anti-takeover provisions.
Our articles of incorporation and bylaws contain provisions that could make it more difficult for a third party toacquire a majority of our outstanding voting stock. For example, our Board of Directors may also issue shares of ClassB common stock in connection with certain acquisitions, which have superior voting rights entitling the holder to tenvotes for each share held on matters that we submit to a shareholder vote (as compared to one vote per share in thecase of our Class A common stock) as well as the right to vote separately as a class. In addition, our Board of
19
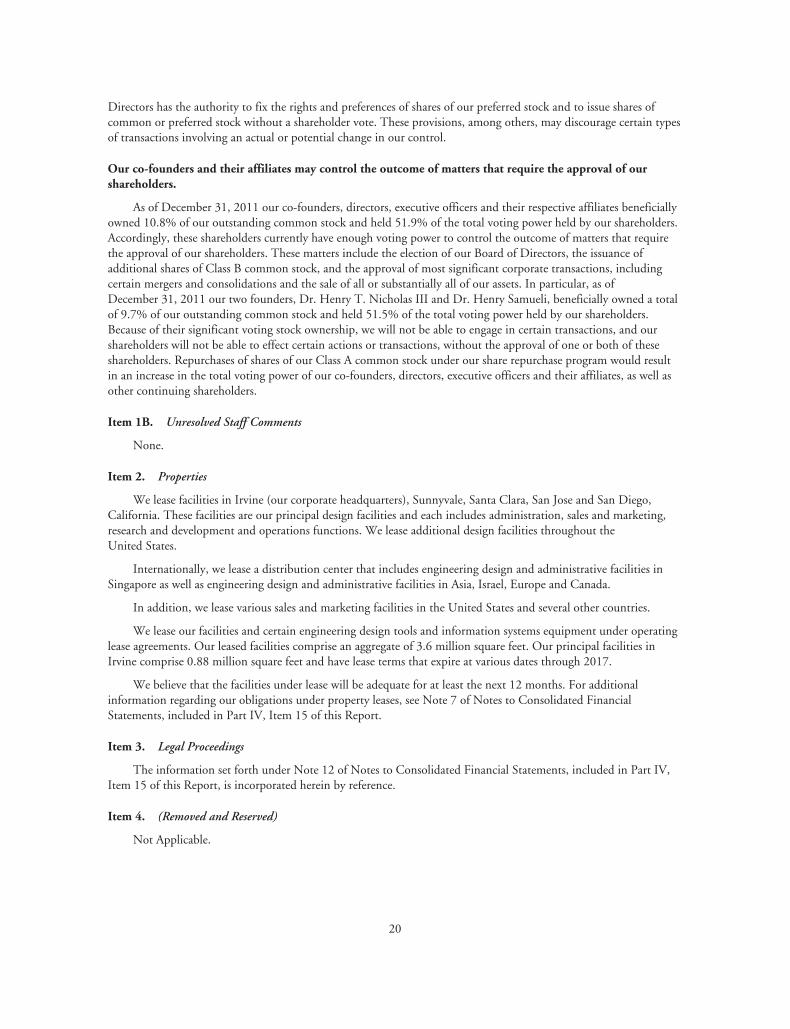
Directors has the authority to fix the rights and preferences of shares of our preferred stock and to issue shares ofcommon or preferred stock without a shareholder vote. These provisions, among others, may discourage certain typesof transactions involving an actual or potential change in our control.
Our co-founders and their affiliates may control the outcome of matters that require the approval of ourshareholders.
As of December 31, 2011 our co-founders, directors, executive officers and their respective affiliates beneficiallyowned 10.8% of our outstanding common stock and held 51.9% of the total voting power held by our shareholders.Accordingly, these shareholders currently have enough voting power to control the outcome of matters that requirethe approval of our shareholders. These matters include the election of our Board of Directors, the issuance ofadditional shares of Class B common stock, and the approval of most significant corporate transactions, includingcertain mergers and consolidations and the sale of all or substantially all of our assets. In particular, as ofDecember 31, 2011 our two founders, Dr. Henry T. Nicholas III and Dr. Henry Samueli, beneficially owned a totalof 9.7% of our outstanding common stock and held 51.5% of the total voting power held by our shareholders.Because of their significant voting stock ownership, we will not be able to engage in certain transactions, and ourshareholders will not be able to effect certain actions or transactions, without the approval of one or both of theseshareholders. Repurchases of shares of our Class A common stock under our share repurchase program would resultin an increase in the total voting power of our co-founders, directors, executive officers and their affiliates, as well asother continuing shareholders.
Item 1B. Unresolved Staff Comments
None.
Item 2. Properties
We lease facilities in Irvine (our corporate headquarters), Sunnyvale, Santa Clara, San Jose and San Diego,California. These facilities are our principal design facilities and each includes administration, sales and marketing,research and development and operations functions. We lease additional design facilities throughout theUnited States.
Internationally, we lease a distribution center that includes engineering design and administrative facilities inSingapore as well as engineering design and administrative facilities in Asia, Israel, Europe and Canada.
In addition, we lease various sales and marketing facilities in the United States and several other countries.
We lease our facilities and certain engineering design tools and information systems equipment under operatinglease agreements. Our leased facilities comprise an aggregate of 3.6 million square feet. Our principal facilities inIrvine comprise 0.88 million square feet and have lease terms that expire at various dates through 2017.
We believe that the facilities under lease will be adequate for at least the next 12 months. For additionalinformation regarding our obligations under property leases, see Note 7 of Notes to Consolidated FinancialStatements, included in Part IV, Item 15 of this Report.
Item 3. Legal Proceedings
The information set forth under Note 12 of Notes to Consolidated Financial Statements, included in Part IV,Item 15 of this Report, is incorporated herein by reference.
Item 4. (Removed and Reserved)
Not Applicable.
20

PART II
Item 5. Market for Registrant’s Common Equity, Related Stockholder Matters and Issuer Purchases of EquitySecurities
Market Information and Holders
Our Class A common stock is traded on the NASDAQ Global Select Market under the symbol BRCM. Thefollowing table sets forth, for the periods indicated, the high and low sale prices for our Class A common stock on theNASDAQ Global Select Market:
2011 2010
High Low High Low
Fourth Quarter . . . . . . . . . . . . . . . . . . . . . . . . . . . . . . . . . . . $38.37 $27.59 $47.00 $34.34
Third Quarter . . . . . . . . . . . . . . . . . . . . . . . . . . . . . . . . . . . . 38.88 30.98 38.47 29.90
Second Quarter . . . . . . . . . . . . . . . . . . . . . . . . . . . . . . . . . . . 41.00 30.71 36.94 29.05
First Quarter . . . . . . . . . . . . . . . . . . . . . . . . . . . . . . . . . . . . . 47.39 38.60 34.30 26.40
As of December 31, 2011 and 2010 there were 1,005 and 1,070 record holders of our Class A common stockand 147 and 154 record holders of our Class B common stock, respectively. On January 31, 2012, the last reportedsale price of our Class A common stock on the NASDAQ Global Select Market was $34.35 per share.
Our Class B common stock is not publicly traded. Each share of Class B common stock is convertible at anytime at the option of the holder into one share of Class A common stock and in most instances automaticallyconverts upon sale or other transfer.
21

Stock Performance Graph
The following graphs compare the cumulative five-year and seven-year total return attained by shareholders onBroadcom Corporation’s common stock relative to the cumulative total returns of the S&P 500 index, thePHLX Semiconductor index, and the NASDAQ Composite index. An investment of $100 (with reinvestment of alldividends) is assumed to have been made in our common stock and in each index on December 31, 2006 (for thefive-year graph) and December 31, 2004 (for the seven-year graph) and its relative performance is tracked throughDecember 31, 2011. Shareholder returns over the indicated periods should not be considered indicative of futurestock prices or shareholder returns.
COMPARISON OF 5 YEAR CUMULATIVE TOTAL RETURNAMONG BROADCOM CORPORATION, THE S&P 500 INDEX,
THE NASDAQ COMPOSITE INDEX AND THE PHLX SEMICONDUCTOR INDEX
Broadcom Corporation S&P 500 Index - Total Returns
Philadelphia Semiconductor IndexNASDAQ Composite - Total Returns
12/1112/1012/0912/0812/0712/060
50
100
150
DOLLARS
22

COMPARISON OF 7 YEAR CUMULATIVE TOTAL RETURNAMONG BROADCOM CORPORATION, THE S&P 500 INDEX,
THE NASDAQ COMPOSITE INDEX AND THE PHLX SEMICONDUCTOR INDEX
12/1112/1012/0912/0812/0712/0612/0512/040
50
100
150
200
250
DOLLARS
Broadcom Corporation S&P 500 Index - Total Returns
Philadelphia Semiconductor IndexNASDAQ Composite - Total Returns
Dividend Policy
In January 2010 our Board of Directors adopted a dividend policy pursuant to which we intend to pay quarterlycash dividends on our common stock. Our Board of Directors declared quarterly cash dividends of $0.08 percommon share payable to holders of our common stock in each quarter of 2010. In January 2011 our Board ofDirectors adopted an amendment to the existing dividend policy pursuant to which we increased the quarterly cashdividend by 12.5% to $0.09 per common share ($0.36 per share on an annual basis) and declared quarterly cashdividends of $0.09 per share payable to holders of our common stock in each quarter of 2011. In 2011 and 2010 wepaid $194 million and $163 million, respectively, in dividends to holders of our Class A and Class B common stock.These dividends were paid from U.S. domestic sources other than our retained earnings and are accounted for asreductions of shareholders’ equity.
The cash dividend policy and the payment of future cash dividends under that policy are subject to the Board’scontinuing determination that the dividend policy and the declaration of dividends thereunder are in the bestinterests of our shareholders and are in compliance with all laws and agreements of Broadcom applicable to thedeclaration and payment of cash dividends.
Recent Sales of Unregistered Securities
In 2011 we issued an aggregate of 1 million shares of Class A common stock upon conversion of a like numberof shares of Class B common stock in connection with their disposition. Each share of Class B common stock isconvertible at any time into one share of Class A common stock at the option of the holder. The offers and sales ofthose securities were effected without registration in reliance on the exemption from registration provided bySection 3(a)(9) of the Securities Act of 1933, as amended, or the Securities Act.
Issuer Purchases of Equity Securities
From time to time our Board of Directors has authorized various programs to repurchase shares of our Class Acommon stock depending on market conditions and other factors. In February 2010 we announced that our Boardof Directors had authorized an evergreen share repurchase program intended to offset dilution of incremental grants
23

of stock awards associated with our stock incentive plans. The maximum number of shares of our Class A commonstock that may be repurchased in any one year (including under an ASR or other arrangement) is equal to the totalnumber of shares issued pursuant to our equity awards in the previous year and the current year. Our February 2010share repurchase program does not have an expiration date and may be suspended at any time at the discretion of theBoard of Directors.
In February 2011 we entered into an accelerated share repurchase, or ASR, agreement to repurchase $300million of our Class A common stock, which was recorded as a reduction to shareholders’ equity. Under the ASRprogram we received and cancelled 7 million shares of our Class A common stock with a weighted average price of$42.64 per share.
In addition to the shares repurchased under the ASR, we repurchased 10 million shares of our Class A commonstock at a weighted average price of $36.84 per share in 2011. We repurchased 9 million and 15 million shares of ourClass A common stock at weighted average prices of $30.86 and $28.12 per share in 2010 and 2009, respectively.
Repurchases under our share repurchase programs were and are intended to be made in open market or privatelynegotiated transactions in compliance with Rule 10b-18 promulgated under the Exchange Act.
24

Item 6. Selected Consolidated Financial DataYear Ended December 31,
2011 2010 2009 2008 2007
(In millions, except per share data)
Consolidated Statements of Income Data
Net revenue:
Product revenue . . . . . . . . . . . . . . . . . . . . . . . . . . . . . . . . . . . . . . $7,160 $6,589 $4,273 $4,485 $3,739
Income from Qualcomm Agreement(1) . . . . . . . . . . . . . . . . . . . . . 207 207 171 — —
Licensing revenue(2) . . . . . . . . . . . . . . . . . . . . . . . . . . . . . . . . . . . 22 22 46 173 37
Total net revenue . . . . . . . . . . . . . . . . . . . . . . . . . . . . . . . . . . . 7,389 6,818 4,490 4,658 3,776
Costs and expenses:
Cost of product revenue(3) . . . . . . . . . . . . . . . . . . . . . . . . . . . . . . 3,626 3,284 2,211 2,213 1,832
Research and development(3) . . . . . . . . . . . . . . . . . . . . . . . . . . . . 1,983 1,762 1,535 1,498 1,349
Selling, general and administrative(3) . . . . . . . . . . . . . . . . . . . . . . 682 590 479 543 492
Amortization of purchased intangible assets . . . . . . . . . . . . . . . . . 30 28 15 3 1
Impairment of long-lived assets . . . . . . . . . . . . . . . . . . . . . . . . . . 92 19 19 172 2
Settlement costs (gains), net . . . . . . . . . . . . . . . . . . . . . . . . . . . . . (18) 53 118 16 —
Restructuring costs (reversals), net . . . . . . . . . . . . . . . . . . . . . . . . 16 — 7 (1) —
In-process research and development . . . . . . . . . . . . . . . . . . . . . . — — — 42 15
Charitable contributions . . . . . . . . . . . . . . . . . . . . . . . . . . . . . . . 25 — 50 — —
Total operating costs and expenses . . . . . . . . . . . . . . . . . . . . . . 6,436 5,736 4,434 4,486 3,691
Income from operations . . . . . . . . . . . . . . . . . . . . . . . . . . . . . . . . . . 953 1,082 56 172 85
Interest income (expense), net . . . . . . . . . . . . . . . . . . . . . . . . . . . . . (5) 9 14 52 131
Other income (expense), net . . . . . . . . . . . . . . . . . . . . . . . . . . . . . . 8 6 2 (2) 3
Income before income taxes . . . . . . . . . . . . . . . . . . . . . . . . . . . . . . . 956 1,097 72 222 219
Provision for income taxes . . . . . . . . . . . . . . . . . . . . . . . . . . . . . . . . 29 15 7 7 6
Net income . . . . . . . . . . . . . . . . . . . . . . . . . . . . . . . . . . . . . . . . . . . $ 927 $1,082 $ 65 $ 215 $ 213
Net income per share (basic)(4) . . . . . . . . . . . . . . . . . . . . . . . . . . . . . $ 1.72 $ 2.13 $ 0.13 $ 0.42 $ 0.39
Net income per share (diluted)(4) . . . . . . . . . . . . . . . . . . . . . . . . . . . $ 1.65 $ 1.99 $ 0.13 $ 0.41 $ 0.37
December 31,
2011 2010 2009 2008 2007
(In millions)
Consolidated Balance Sheet Data
Cash and cash equivalents and short-and long-term marketablesecurities . . . . . . . . . . . . . . . . . . . . . . . . . . . . . . . . . . . . . . . . . . . $5,205 $4,058 $2,368 $1,898 $2,404
Working capital . . . . . . . . . . . . . . . . . . . . . . . . . . . . . . . . . . . . . . . . 4,653 2,913 1,766 2,034 2,323
Goodwill and purchased intangible assets, net . . . . . . . . . . . . . . . . . 2,187 2,043 1,481 1,341 1,424
Total assets . . . . . . . . . . . . . . . . . . . . . . . . . . . . . . . . . . . . . . . . . . . . 9,040 7,944 5,127 4,393 4,838
Total long-term debt . . . . . . . . . . . . . . . . . . . . . . . . . . . . . . . . . . . . 1,196 697 — — —
Total shareholders’ equity . . . . . . . . . . . . . . . . . . . . . . . . . . . . . . . . 6,521 5,826 3,892 3,607 4,036
(1) Includes income relating to the Qualcomm Agreement that was entered into with Qualcomm in April 2009. See “Overview” sectionin Item 7. Management’s Discussion and Analysis of Financial Condition and Results of Operations and Notes 1 and 2 to Notes toConsolidated Financial Statements for a further discussion, included in Part IV, Item 15 of this Report.
25

(2) Includes royalties of $19 million, $149 million and $32 million in 2009, 2008 and 2007, respectively, received pursuant to a patentlicense agreement that was entered into with Verizon Wireless in July 2007, which was completed in March 2009.
(3) Includes stock-based compensation expense resulting from stock options and restricted stock units we issued or assumed inacquisitions. See Note 9 of Notes to Consolidated Financial Statements.
(4) See Notes 1 and 2 of Notes to Consolidated Financial Statements for an explanation of the calculation of net income per share.
The following table presents details of product and total gross margin as a percentage of product and totalrevenue, respectively:
Year Ended December 31,
2011 2010 2009 2008 2007
Supplemental Gross Margin Data
Product gross margin . . . . . . . . . . . . . . . . . . . . . . . . . . . . . . . . . . . . . . 49.4% 50.2% 48.3% 50.7% 51.0%
Total gross margin . . . . . . . . . . . . . . . . . . . . . . . . . . . . . . . . . . . . . . . . 50.9 51.8 50.8 52.5 51.5
The following table presents details of total stock-based compensation expense that is included in each functionalline item in the consolidated statements of income data above:
Year Ended December 31,
2011 2010 2009 2008 2007
(In millions)
Supplemental Data on Stock-Based Compensation Expense
Cost of product revenue . . . . . . . . . . . . . . . . . . . . . . . . . . . . . . . . . . . . $ 24 $ 23 $ 25 $ 25 $ 26
Research and development . . . . . . . . . . . . . . . . . . . . . . . . . . . . . . . . . . 364 341 352 358 354
Selling, general and administrative . . . . . . . . . . . . . . . . . . . . . . . . . . . . 126 119 120 126 140
The tables above set forth our selected consolidated financial data. We prepared this information using theconsolidated financial statements of Broadcom for each of the five years ended December 31, 2011. In addition, theconsolidated financial statements include the results of operations of acquisitions commencing on their respectiveacquisition dates. See Note 3 of Notes to Consolidated Financial Statements.
You should read this selected consolidated financial data together with the Consolidated Financial Statementsand related Notes contained in this Report and in our prior and subsequent reports filed with the SEC, as well as thesection of this Report and our other reports entitled “Management’s Discussion and Analysis of Financial Conditionand Results of Operations.”
26

Item 7. Management’s Discussion and Analysis of Financial Condition and Results of Operations
You should read the following discussion and analysis in conjunction with our Consolidated Financial Statements andrelated Notes thereto included in Part IV, Item 15 of this Report and the “Risk Factors” included in Part I, Item 1A of thisReport, as well as other cautionary statements and risks described elsewhere in this Report, before deciding to purchase, holdor sell our common stock.
Overview
Broadcom Corporation (including our subsidiaries, referred to collectively in this Report as “Broadcom,” “we,”“our” and “us”) is a global innovation leader in semiconductor solutions for wired and wireless communications.Broadcom products seamlessly deliver voice, video, data and multimedia connectivity in the home, the office and themobile environment. We provide the industry’s broadest portfolio of state-of-the-art system-on-a-chip, or SoC, andsoftware solutions.
We sell our products to leading wired and wireless communications manufacturers in each of our reportablesegments: Broadband Communications (Home), Mobile & Wireless (Hand) and Infrastructure & Networking(Infrastructure). Because we leverage our technologies across different markets, certain of our integrated circuits maybe incorporated into products used in multiple markets. We utilize independent foundries and third-partysubcontractors to manufacture, assemble and test all of our semiconductor products.
Our diverse product portfolio includes:
• Broadband Communications (Solutions for the Home) — Complete solutions for cable, xDSL, fiber, satelliteand IP broadband networks to enable the connected home, including set-top-boxes and media servers,residential modems and gateways, femtocells and wired home networking solutions.
• Mobile & Wireless (Solutions for the Hand) — Low-power, high-performance and highly integrated solutionspowering the mobile and wireless ecosystem, including Wi-Fi and Bluetooth, cellular modems, personalnavigation and global positioning, near field communications (NFC), Voice over IP (VoIP), multimedia andapplication processing, and mobile power management solutions.
• Infrastructure & Networking (Solutions for Infrastructure) — Highly integrated solutions for carriers, serviceproviders, enterprises, small-to-medium businesses and data centers for network infrastructure needs,including switches, physical layer (PHY) and microwave devices for local, metropolitan, wide area and storagenetworking; switch fabric solutions, high-speed ethernet controllers, security and embedded processors.
Our product revenue consists principally of sales of semiconductor devices and, to a lesser extent, softwarelicenses and royalties, development, support and maintenance agreements, data services and cancellation fees. Themajority of our product sales occur through the efforts of our direct sales force. The remaining balance of our productsales occurs through distributors. Our licensing revenue and income is generated from the licensing of our intellectualproperty, of which the vast majority to date has been derived from agreements with two customers, Verizon Wirelessand Qualcomm. The licensing revenue from our agreement with Verizon Wireless ended in March 2009 and theincome from the Qualcomm Agreement is non-recurring and will terminate in 2013. There can be no assurances thatwe will be able to enter into similar arrangements in the future. At December 31, 2011 we had deferred income of$13 million related to the Qualcomm Agreement.
The following table details the amount of licensing revenue from our agreement with Verizon Wireless andincome from the Qualcomm Agreement that was recognized or is scheduled to be recognized from 2008 to 2013:
Recognized Scheduled to be Recognized
2008 2009 2010 2011 2012 2013 Thereafter Total
(In millions)
Income from Qualcomm Agreement . . . . . . . . . . $ — $171 $207 $207 $186 $86 $— $ 857Licensing revenue from Verizon Wireless . . . . . . 149 19 — — — — — 168
$149 $190 $207 $207 $186 $86 $— $1,025
Product Cycles. The cycle for test, evaluation and adoption of our products by customers can range from threeto more than nine months, with an additional three to more than twelve months before a customer commences
27
volume production of equipment or devices incorporating our products. Due to this lengthy sales cycle, we mayexperience significant delays from the time we incur expenses for research and development, selling, general andadministrative efforts, and investments in inventory, to the time we generate corresponding revenue, if any. The rateof new orders may vary significantly from month to month and quarter to quarter. If anticipated sales or shipmentsin any quarter do not occur when expected, expenses and inventory levels could be disproportionately high, and ourresults of operations for that quarter, and potentially for future quarters, would be materially and adversely affected.
Acquisition Strategy. An element of our business strategy involves the acquisition of businesses, assets, productsor technologies that allow us to reduce the time or costs required to develop new technologies and products and bringthem to market, incorporate enhanced functionality into and complement our existing product offerings, augmentour engineering workforce, and enhance our technological capabilities. Since our initial public offering, we haveacquired over 50 companies. From 2009 through 2011, we made acquisitions totaling $1.11 billion in purchaseconsideration, of which $155 million, $387 million and $569 million related to our Broadband Communications,Mobile & Wireless and Infrastructure & Networking reportable segments, respectively. We plan to continue toevaluate strategic opportunities as they arise, including acquisitions and other business combination transactions,strategic relationships, capital infusions and the purchase or sale of assets.
In September 2011 we signed a definitive agreement to acquire NetLogic Microsystems, Inc., or NetLogic, apublicly traded company that is a leader in high performance intelligent semiconductor solutions for next generationnetworks. The expected purchase consideration is approximately $3.7 billion, net of cash assumed, based on theshares outstanding on September 11, 2011. The transaction has been approved by the Broadcom and NetLogicboards of directors and is subject to customary closing conditions, including the receipt of clearance by the ChineseMinistry of Commerce under Chinese Antimonopoly Law. There are no financing contingencies related to theacquisition. The transaction is expected to close in the first half of 2012.
The accompanying Consolidated Financial Statements include the results of operations of our acquiredcompanies commencing on their respective acquisition dates. See Note 3 of Notes to Consolidated FinancialStatements for additional information related to these acquisitions.
Operating Results for the Year Ended December 31, 2011
In 2011 our net income was $927 million as compared to net income of $1.08 billion in 2010. The decrease inprofitability was primarily related to lower gross margins and an increase in research and development expenses, aswell as the impairment of certain of our purchased intangible assets, our charitable contribution and our restructuringcharge.
Other highlights during 2011 include the following:
• Our cash and cash equivalents and marketable securities were $5.20 billion at December 31, 2011, comparedwith $4.06 billion at December 31, 2010. We generated cash flow from operations of $1.84 billion during2011 as compared to $1.37 billion in 2010.
• In January 2011 our Board of Directors adopted an amendment to the existing dividend policy pursuant towhich we increased our quarterly cash dividend by 12.5% to $0.09 per share ($0.36 per share on an annualbasis) and declared a dividend of $0.09 per share payable to holders of our common stock in each quarter of2011.
• In February 2011 we entered into an accelerated share repurchase, or ASR, agreement to repurchase $300million dollars of our Class A common stock, which was recorded as a reduction to shareholders’ equity.Under the ASR program we received and cancelled 7 million shares of our Class A common stock with aweighted average price of $42.64 per share. In addition to the shares repurchased under the ASR in February2011, we repurchased 10 million shares at a weighted average price of $36.84 per share.
• In April 2011 we completed our acquisition of Provigent Inc., a privately-held company that provides highlyintegrated, high performance, mixed signal semiconductors for microwave backhaul systems. In connectionwith the acquisition, we paid $314 million, exclusive of cash assumed, to acquire all of the outstanding sharesof capital stock and other equity rights of Provigent.
• In May 2011 we completed our acquisition of SC Square Ltd., a leading security software developer for $40million, exclusive of cash acquired.
28

• In May 2011 the court entered an order granting final approval of a Stipulation and Agreement of Settlement,or Derivative Settlement related to our federal consolidated shareholder derivative action. In connection withthe Derivative Settlement, we recorded a $43 million settlement gain in our consolidated statements ofincome and paid plaintiffs’ counsel $25 million of the settlement proceeds for attorneys’ fees, expenses, andcosts, which was recorded as an operating expense in our consolidated statements of income. In Septemberand December 2011 we also recorded total net settlement costs of $32 million related to patent infringementclaims.
• In June 2011 we contributed $25 million to the Broadcom Foundation to support science, technology,engineering and mathematics programs, as well as a broad range of community services which was recorded asan operating expense in our consolidated statements of income.
• In June 2011 we recorded a purchased intangible impairment charge of $74 million related to our acquisitionof Beceem Communications, Inc. in 2010. The primary factor contributing to this impairment charge was areduction in the forecasted cash flows related to WiMAX products, as wireless service providers haveaccelerated their adoption of Long Term Evolution, or LTE, products. We also recorded other impairmentcharges of $18 million in 2011.
• In June 2011 we completed the Internal Revenue Service (IRS) examination of our income tax returns for2004 to 2006, executed a closing agreement covering the 2001 to 2006 tax years, and agreed to certainadjustments for the 2001 to 2006 tax years, primarily related to intercompany transfer pricing transactions.Such adjustments were offset by net operating losses and credits, and did not result in any income tax expenseor cash tax liability. As a result, our federal and state net operating loss carryforwards were reduced by $620million and $430 million, respectively, which were offset with corresponding reductions in valuationallowance for deferred tax assets.
• As part of our regular product portfolio management review process and in light of our decision tosignificantly reduce our investment in our digital television and Blu-ray Disc product lines within ourBroadband Communications operating segment, in September 2011 we implemented a restructuring plan toreduce our worldwide headcount by approximately 300 employees. We recorded an aggregate of $16 millionin net restructuring costs in 2011.
• In November 2011 we completed a debt offering of $500 million aggregate principal amount of2.700% Senior Notes due 2018. We also amended our credit facility in October 2011 to primarily extend thematurity date by two years to November 19, 2016. To date, we have not drawn on this credit facility.
Business Enterprise Segments
The following tables present details of our reportable segments and the “All Other” category:
Reportable Segments
BroadbandCommunications
Mobile &Wireless
Infrastructure &Networking
AllOther Consolidated
(In millions)
Year ended December 31, 2011
Net revenue . . . . . . . . . . . . . . . . . . . . . . . . . . . . . $2,039 $3,484 $1,658 $ 208 $7,389
Operating income (loss) . . . . . . . . . . . . . . . . . . . . 391 573 545 (556) 953
Year ended December 31, 2010
Net revenue . . . . . . . . . . . . . . . . . . . . . . . . . . . . . $2,134 $2,889 $1,588 $ 207 $6,818
Operating income (loss) . . . . . . . . . . . . . . . . . . . . 447 526 578 (469) 1,082
Year ended December 31, 2009
Net revenue . . . . . . . . . . . . . . . . . . . . . . . . . . . . . $1,525 $1,720 $1,056 $ 189 $4,490
Operating income (loss) . . . . . . . . . . . . . . . . . . . . 180 117 288 (529) 56
29

Included in the “All Other” category:Year Ended December 31,
2011 2010 2009
(In millions)
Net revenue . . . . . . . . . . . . . . . . . . . . . . . . . . . . . . . . . . . . . . . . . . . . . . . . . $ 208 $ 207 $ 189
Stock-based compensation . . . . . . . . . . . . . . . . . . . . . . . . . . . . . . . . . . . . . . $ 514 $ 483 $ 497Amortization of purchased intangible assets . . . . . . . . . . . . . . . . . . . . . . . . . 84 59 31Amortization of acquired inventory valuation step-up . . . . . . . . . . . . . . . . . 24 10 9Impairment of long-lived assets . . . . . . . . . . . . . . . . . . . . . . . . . . . . . . . . . . 92 19 19Settlement costs (gains), net . . . . . . . . . . . . . . . . . . . . . . . . . . . . . . . . . . . . . (18) 53 118Restructuring costs, net . . . . . . . . . . . . . . . . . . . . . . . . . . . . . . . . . . . . . . . . 16 — 7Charitable contributions . . . . . . . . . . . . . . . . . . . . . . . . . . . . . . . . . . . . . . . . 25 — 50Non-recurring legal fees . . . . . . . . . . . . . . . . . . . . . . . . . . . . . . . . . . . . . . . . 25 — 12Change in contingent earnout liability . . . . . . . . . . . . . . . . . . . . . . . . . . . . . (1) — —Employer payroll tax on certain stock option exercises . . . . . . . . . . . . . . . . . 8 13 5Miscellaneous corporate allocation variances . . . . . . . . . . . . . . . . . . . . . . . . . (5) 39 (30)
Total other operating costs and expenses . . . . . . . . . . . . . . . . . . . . . . . . . . . $ 764 $ 676 $ 718
Total operating loss for the “All Other” category . . . . . . . . . . . . . . . . . . . . . $(556) $(469) $(529)
For additional information about our business enterprise segments, see Note 13 of Notes to ConsolidatedFinancial Statements.
Factors That May Impact Net Income
Our net income has been affected in the past, and may continue to be affected in the future, by various factors,including, but not limited to, the following:
• our product mix and volume of product sales and corresponding gross margin (see further discussion belowunder “Factors That May Impact Net Revenue” and “Factors That May Impact Product Gross Margin”);
• required levels of research and development and other operating costs;• stock-based compensation expense;• licensing and income from intellectual property;• impairment of goodwill and other long-lived assets;• deferral of revenue and costs under multiple-element arrangements;• amortization of purchased intangible assets;• cash-based incentive compensation expense;• litigation costs and insurance recoveries;• settlement costs or gains;• changes in tax laws, adjustments to tax reserves and the results of income tax audits;• the loss of interest income resulting from lower average interest rates and investment balance reductions
resulting from expenditures on repurchases of our Class A common stock, dividends and acquisitions ofbusinesses;
• charitable contributions;• other-than-temporary impairment of marketable securities; and• restructuring costs.
Critical Accounting Policies and Estimates
The preparation of financial statements in accordance with U.S. generally accepted accounting principles, orGAAP, requires us to make estimates and assumptions that affect the reported amounts of assets and liabilities at thedate of the financial statements and the reported amounts of net revenue and expenses in the reporting period. Weregularly evaluate our estimates and assumptions related to revenue recognition, rebates, allowances for doubtful
30

accounts, sales returns and allowances, warranty obligations, inventory valuation, stock-based compensation expense,goodwill and purchased intangible asset valuations, strategic investments, deferred income tax asset valuationallowances, uncertain tax positions, tax contingencies, self-insurance, restructuring costs, litigation and other losscontingencies. We base our estimates and assumptions on current facts, historical experience and various other factorsthat we believe to be reasonable under the circumstances, the results of which form the basis for making judgmentsabout the carrying values of assets and liabilities and the recording of revenue, costs and expenses that are not readilyapparent from other sources. The actual results experienced by us may differ materially and adversely from ourestimates. To the extent there are material differences between our estimates and the actual results, our future resultsof operations will be affected.
We believe the following are critical accounting policies that require us to make significant estimates,assumptions or judgments:
• Net Revenue. We recognize product revenue when all of the following criteria are met: (i) persuasiveevidence of an arrangement exists, (ii) delivery has occurred, (iii) our price to the customer is fixed ordeterminable and (iv) collection of the resulting accounts receivable is reasonably assured. These criteria areusually met at the time of product shipment. However, we do not recognize revenue when any futureperformance obligations remain. Customer purchase orders and/or contracts are generally used to determinethe existence of an arrangement. Shipping documents are used to verify product delivery. We assess whether aprice is fixed or determinable based upon the payment terms associated with the transaction and whether thesales price is subject to refund or adjustment. We assess the collectibility of our accounts receivable basedprimarily upon the creditworthiness of the customer as determined by credit checks and analysis, as well as thecustomer’s payment history.
In arrangements that include a combination of semiconductor products and other elements, judgment isrequired to properly identify the accounting units of the multiple deliverable transactions and to determine themanner in which revenue should be allocated among the accounting units. We allocate the arrangementconsideration based on each element’s relative fair value using vendor-specific objective evidence, or VSOE,third-party evidence, or estimated selling prices, as the basis of fair value. Revenue is recognized for theaccounting units when the basic revenue recognition criteria are met.
A portion of our sales is made through distributors under agreements allowing for pricing credits and/or rightsof return. These pricing credits and/or rights of return provisions prevent us from being able to reasonablyestimate the final price of the inventory to be sold and the amount of inventory that could be returnedpursuant to these agreements. As a result, the price to the customer is not fixed or determinable at the time wedeliver products to our distributors. Accordingly, product revenue from sales made through these distributorsis not recognized until the distributors ship the product to their customers. In addition, distributors provide uswith periodic data regarding product, price, quantity, and customers when products are shipped to theircustomers, as well as the quantities of our products that they still have in stock. For specialized shipping termswe may rely on data provided by our freight forwarding providers. For our licensing revenue we rely on dataprovided by the licensee. Any error in the data provided to us by customers, distributors or other third partiescould lead to inaccurate reporting of our total net revenue and net income.
We defer revenue and income when advance payments are received from customers before performanceobligations have been completed and/or services have been performed. Deferred revenue does not includeamounts from products delivered to distributors that the distributors have not yet sold through to their endcustomers.
• Income from the Qualcomm Agreement. On April 26, 2009 we entered into a four-year Settlement and PatentLicense and Non-Assert Agreement, or the Qualcomm Agreement, with QUALCOMM Incorporated, orQualcomm. The Qualcomm Agreement is a multiple element arrangement. We allocated the amount to bereceived under the Qualcomm Agreement amongst several elements. A gain from the settlement of litigationwas immediately recognized and approximated the value of awards determined by the United States DistrictCourt for the Central District of California. The remaining consideration was predominantly associated withthe transfer of current and future intellectual property rights, as well as the settlement of all other outstandinglitigation, and is being recognized over the four year performance period as a single unit of accounting.
31

The value associated with the transfer of intellectual property rights and other elements was treated as a singleunit of accounting and, based on the predominant nature of these elements, recognized them within netrevenue over the contractual performance period of four years, beginning in 2009 and extending through2013. The elements included: (i) an exchange of intellectual property rights, including in certaincircumstances, a series of covenants not to assert claims of patent infringement under future patents issuedwithin one to four years of the execution date of the agreement, (ii) the assignment of certain existing patentsby Broadcom to Qualcomm with Broadcom retaining a royalty-free license under these patents, and (iii) thesettlement of all outstanding litigation and claims between us and Qualcomm.
We consider the Qualcomm Agreement as predominantly related to the transfer of current and futureintellectual property rights. This conclusion was based on (a) the amounts specifically awarded by the courtsfor the patents that were the subject of litigation for which appeals had been substantially exhausted and(b) the extensive nature of the rights transferred to Qualcomm, both for our existing patent portfolio and forthe patents we would develop during the next one to four years. In addition, we obtained a third partyvaluation of the intellectual property rights. The inputs and assumptions we used in this valuation were from amarket participant perspective and included projected revenue, royalty rates, estimated discount rates, usefullives and income tax rates, among others. The development of a number of these inputs and assumptions inour model requires a significant amount of management judgment and is based upon a number of factorsincluding the selection of industry comparables, market growth rates and other relevant factors. Changes inany number of these assumptions would have substantially changed the fair value assigned to the intellectualproperty rights. These inputs and assumptions represent management’s best estimates at the time of thetransaction.
• Sales Returns, Pricing Adjustments and Allowance for Doubtful Accounts. We record reductions of revenue forestimated product returns and pricing adjustments, such as competitive pricing programs and rebates, in thesame period that the related revenue is recorded. The amount of these reductions is based on historical salesreturns, analysis of credit memo data, specific criteria included in rebate agreements, and other factors knownat the time. We accrue 100% of potential rebates at the time of sale and do not apply a breakage factor. Wereverse the accrual of unclaimed rebate amounts as specific rebate programs contractually end and when webelieve unclaimed rebates are no longer subject to payment and will not be paid. Thus the reversal ofunclaimed rebates may have a positive impact on our net revenue and net income in subsequent periods.Additional reductions of revenue would result if actual product returns or pricing adjustments exceed ourestimates. We also maintain an allowance for doubtful accounts for estimated losses resulting from theinability of customers to make required payments. If the financial condition of any customer were todeteriorate, resulting in an impairment of its ability to make payments, additional allowances could berequired.
• Inventory Write-Downs and Warranty Reserves. We write down the carrying value of our inventory to netrealizable value for estimated obsolescence or unmarketable inventory in an amount equal to the differencebetween the cost of inventory and its estimated realizable value based upon assumptions about future demandand market conditions. If actual demand and market conditions are less favorable than those projected bymanagement, additional inventory write-downs could be required. Under the hubbing arrangements that wemaintain with certain customers, we own inventory that is physically located in a customer’s or third party’swarehouse. As a result, our ability to effectively manage inventory levels may be impaired, which would causeour total inventory turns to decrease. In that event, our expenses associated with excess and obsolete inventorycould increase and our cash flow could be negatively impacted. Our products typically carry a one to threeyear warranty. We establish reserves for estimated product warranty costs at the time revenue is recognized.Although we engage in extensive product quality programs and processes, our warranty obligation has beenand may in the future be affected by product failure rates, product recalls, repair or field replacement costsand additional development costs incurred in correcting any product failure, as well as possible claims forconsequential costs. Should actual product failure rates, use of materials or service delivery costs differ fromour estimates, additional warranty reserves could be required. In that event, our product gross margins wouldbe reduced.
32

• Stock-Based Compensation Expense. All share-based payments, including grants of stock options, restrictedstock units and employee stock purchase rights, are recognized in our financial statements based upon theirrespective grant date fair values. The fair value of each employee stock option and employee stock purchaseright is estimated on the date of grant using an option pricing model that meets certain requirements. Wecurrently use the Black-Scholes option pricing model to estimate the fair value of our stock options and stockpurchase rights. Although we utilize the Black-Scholes model, which meets established requirements, the fairvalues generated by the model may not be indicative of the actual fair values of our equity awards as it doesnot consider certain factors important to those awards to employees, such as continued employment andperiodic vesting requirements as well as limited transferability. The determination of the fair value of share-based payment awards utilizing the Black-Scholes model is affected by our stock price and a number ofassumptions, including expected volatility, expected life, risk-free interest rate and expected dividends. We usethe implied volatility for traded options on our stock as the expected volatility assumption required in theBlack-Scholes model. Our selection of the implied volatility approach is based on the availability of dataregarding actively traded options on our stock as we believe that implied volatility is more representative offair value than historical volatility. The expected life of the stock options is based on historical and othereconomic data trended into the future. The risk-free interest rate assumption is based on observed interestrates appropriate for the expected terms of our stock options and stock purchase rights. Prior to 2010, ourdividend yield assumption excluded dividend payouts. In 2010 we began to pay quarterly dividends andincluded that assumption in our fair value calculations. The fair value of our restricted stock units is based onthe closing market price of our Class A common stock on the date of grant less our expected dividend yield.We evaluate the assumptions used to value stock awards on a quarterly basis. If factors change and we employdifferent assumptions, stock-based compensation expense may differ significantly from what we have recordedin the past. If there are any modifications or cancellations of the underlying unvested securities, we may berequired to accelerate, increase or cancel any remaining unearned stock-based compensation expense. To theextent that we grant additional equity securities to employees or we assume unvested securities in connectionwith any acquisitions, our stock-based compensation expense will be increased by the additional unearnedcompensation resulting from those additional grants or acquisitions.
• Goodwill and Purchased Intangible Assets. The value of our goodwill and purchased intangible assets could beimpacted by future adverse changes such as: (i) any future declines in our operating results, (ii) a decline in thevaluation of technology company stocks, including the valuation of our common stock, (iii) a significantslowdown in the worldwide economy or the semiconductor industry, (iv) any failure to meet the performanceprojections included in our forecasts of future operating results or (v) the abandonment of any of our acquiredin-process research and development, or IPR&D, projects.
Goodwill is recorded as the difference, if any, between the aggregate consideration paid for an acquisition andthe fair value of the acquired net tangible and intangible assets. We evaluate goodwill on an annual basis in thefourth quarter or more frequently if we believe indicators of impairment exist. In 2011 we early adopted thenew provisions issued by the Financial Accounting Standards Board, or FASB, that intended to simplifygoodwill impairment testing. The updated guidance permits us to first assess qualitative factors to determinewhether it is more likely than not that the fair value of a reporting unit is less than its carrying amount. If weconclude that it is more likely than not that the fair value of a reporting units is less than its carrying amount,we conduct a two-step goodwill impairment test. The first step of the impairment test involves comparing thefair values of the applicable reporting units with their carrying values. We determine the fair values of ourreporting units using the income valuation approach, as well as other generally accepted valuationmethodologies. If the carrying amount of a reporting unit exceeds the reporting unit’s fair value, we performthe second step of the goodwill impairment test. The second step of the goodwill impairment test involvescomparing the implied fair value of the affected reporting unit’s goodwill with the carrying value of thatgoodwill. The amount, by which the carrying value of the goodwill exceeds its implied fair value, if any, isrecognized as an impairment loss.
During development, IPR&D is not subject to amortization and is tested for impairment annually or morefrequently if events or changes in circumstances indicate that the asset might be impaired. The impairmenttest consists of a comparison of the fair value to its carrying amount. If the carrying value exceeds its fair value,
33

an impairment loss is recognized in an amount equal to that excess. Once an IPR&D project is complete, itbecomes a definite lived intangible asset and is evaluated for impairment in accordance with our policy forlong-lived assets.
We test long lived assets and purchased intangible assets (other than goodwill and IPR&D in development)for impairment if we believe indicators of impairment exist. We determine whether the carrying value of anasset or asset group is recoverable, based on comparisons to undiscounted expected future cash flows the assetare expected to generate. If an asset is not recoverable, we record an impairment loss equal to the amount bywhich the carrying value of the asset exceeds its fair value. We primarily use the income valuation approach todetermine the fair value of our long lived assets and purchased intangible assets.
Significant management judgment is required in the forecasts of future operating results that are used in thediscounted cash flow method of valuation. It is possible, however, that the plans may change and estimatesused may prove to be inaccurate. If our actual results, or the plans and estimates used in future impairmentanalyses, are lower than the original estimates used to assess the recoverability of these assets, we could incuradditional impairment charges.
• Deferred Taxes and Uncertain Tax Positions. We utilize the asset and liability method of accounting forincome taxes. We record a valuation allowance to reduce our deferred tax assets to the amount that we believeis more likely than not to be realized. In assessing the need for a valuation allowance, we consider all positiveand negative evidence, including scheduled reversals of deferred tax liabilities, projected future taxable income,tax planning strategies, and recent financial performance. Forming a conclusion that a valuation allowance isnot required is difficult when there is negative evidence such as cumulative losses in recent years. As a result ofour cumulative losses in the U.S. and certain foreign jurisdictions, our U.S. tax losses after tax deductions forstock-based compensation, and the full utilization of our loss carryback opportunities, we have concluded thata full valuation allowance against our net deferred tax assets is appropriate in the U.S. and certain foreignjurisdictions. In certain other foreign jurisdictions where we do not have cumulative losses, we recordvaluation allowances to reduce our net deferred tax assets to the amount we believe is more likely than not tobe realized. In the future, if we realize a deferred tax asset that currently carries a valuation allowance, we mayrecord a reduction of income tax expense in the period of such realization. Income tax positions must meet amore-likely-than-not recognition threshold to be recognized. Income tax positions that previously failed tomeet the more-likely-than-not threshold are recognized in the first subsequent financial reporting period inwhich that threshold is met. Previously recognized tax positions that no longer meet the more-likely-than-notthreshold are derecognized in the first subsequent financial reporting period in which that threshold is nolonger met. As a multinational corporation, we are subject to taxation in many jurisdictions, and thecalculation of our tax liabilities involves dealing with uncertainties in the application of complex tax laws andregulations in various taxing jurisdictions. If we ultimately determine that the payment of these liabilities willbe unnecessary, we reverse the liability and recognize a tax benefit during the period in which we determinethe liability no longer applies. Conversely, we record additional tax charges in a period in which we determinethat a recorded tax liability is less than we expect the ultimate assessment to be. The application of tax lawsand regulations is subject to legal and factual interpretation, judgment and uncertainty. Tax laws andregulations themselves are subject to change as a result of changes in fiscal policy, changes in legislation, theevolution of regulations and court rulings. Therefore, the actual liability for U.S. or foreign taxes may bematerially different from our estimates, which could result in the need to record additional tax liabilities orpotentially reverse previously recorded tax liabilities.
• Litigation and Settlement Costs. We are involved in disputes, litigation and other legal proceedings. Weprosecute and defend these matters aggressively. However, there are many uncertainties associated with anylitigation, and we cannot assure you that these actions or other third party claims against us will be resolvedwithout costly litigation and/or substantial settlement costs. In addition, the resolution of intellectual propertylitigation may require us to pay damages for past alleged infringement or to obtain a license under the otherparty’s intellectual property rights that could require one-time license fees or running royalties, which couldadversely impact product gross margins in future periods, or could prevent us from manufacturing or sellingsome of our products or limit or restrict the type of work that employees involved in such litigation may
34
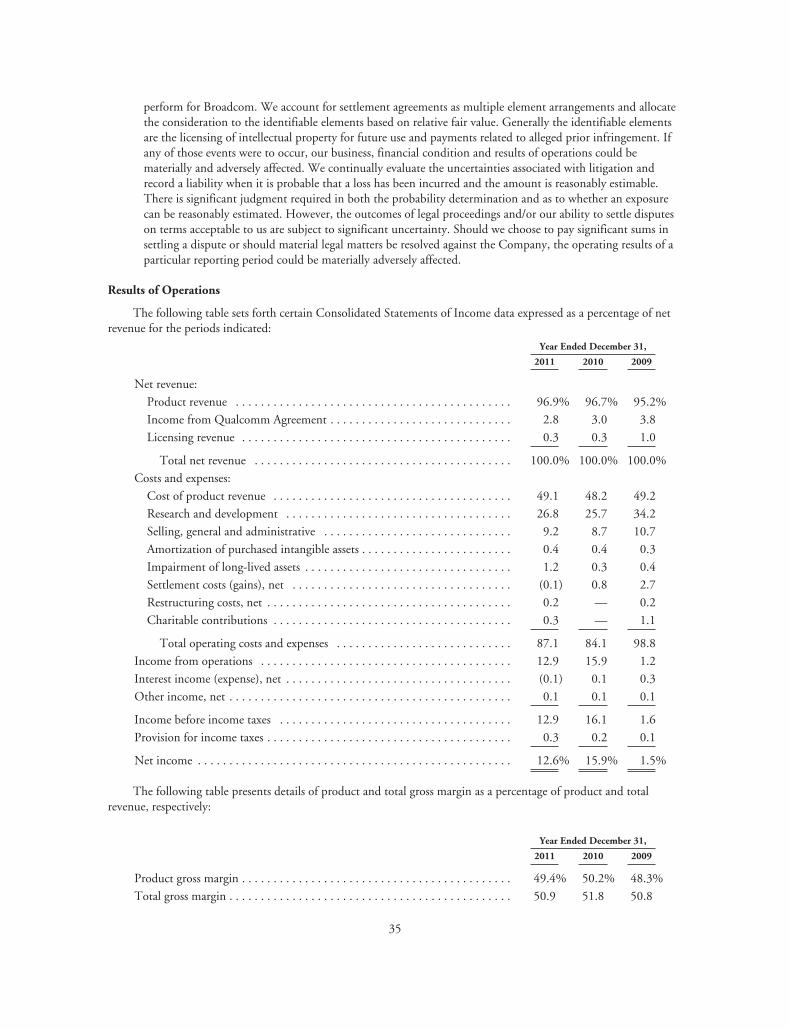
perform for Broadcom. We account for settlement agreements as multiple element arrangements and allocatethe consideration to the identifiable elements based on relative fair value. Generally the identifiable elementsare the licensing of intellectual property for future use and payments related to alleged prior infringement. Ifany of those events were to occur, our business, financial condition and results of operations could bematerially and adversely affected. We continually evaluate the uncertainties associated with litigation andrecord a liability when it is probable that a loss has been incurred and the amount is reasonably estimable.There is significant judgment required in both the probability determination and as to whether an exposurecan be reasonably estimated. However, the outcomes of legal proceedings and/or our ability to settle disputeson terms acceptable to us are subject to significant uncertainty. Should we choose to pay significant sums insettling a dispute or should material legal matters be resolved against the Company, the operating results of aparticular reporting period could be materially adversely affected.
Results of Operations
The following table sets forth certain Consolidated Statements of Income data expressed as a percentage of netrevenue for the periods indicated:
Year Ended December 31,
2011 2010 2009
Net revenue:
Product revenue . . . . . . . . . . . . . . . . . . . . . . . . . . . . . . . . . . . . . . . . . . . . 96.9% 96.7% 95.2%
Income from Qualcomm Agreement . . . . . . . . . . . . . . . . . . . . . . . . . . . . . 2.8 3.0 3.8
Licensing revenue . . . . . . . . . . . . . . . . . . . . . . . . . . . . . . . . . . . . . . . . . . . 0.3 0.3 1.0
Total net revenue . . . . . . . . . . . . . . . . . . . . . . . . . . . . . . . . . . . . . . . . . 100.0% 100.0% 100.0%
Costs and expenses:
Cost of product revenue . . . . . . . . . . . . . . . . . . . . . . . . . . . . . . . . . . . . . . 49.1 48.2 49.2
Research and development . . . . . . . . . . . . . . . . . . . . . . . . . . . . . . . . . . . . 26.8 25.7 34.2
Selling, general and administrative . . . . . . . . . . . . . . . . . . . . . . . . . . . . . . 9.2 8.7 10.7
Amortization of purchased intangible assets . . . . . . . . . . . . . . . . . . . . . . . . 0.4 0.4 0.3
Impairment of long-lived assets . . . . . . . . . . . . . . . . . . . . . . . . . . . . . . . . . 1.2 0.3 0.4
Settlement costs (gains), net . . . . . . . . . . . . . . . . . . . . . . . . . . . . . . . . . . . (0.1) 0.8 2.7
Restructuring costs, net . . . . . . . . . . . . . . . . . . . . . . . . . . . . . . . . . . . . . . . 0.2 — 0.2
Charitable contributions . . . . . . . . . . . . . . . . . . . . . . . . . . . . . . . . . . . . . . 0.3 — 1.1
Total operating costs and expenses . . . . . . . . . . . . . . . . . . . . . . . . . . . . 87.1 84.1 98.8
Income from operations . . . . . . . . . . . . . . . . . . . . . . . . . . . . . . . . . . . . . . . . 12.9 15.9 1.2
Interest income (expense), net . . . . . . . . . . . . . . . . . . . . . . . . . . . . . . . . . . . . (0.1) 0.1 0.3
Other income, net . . . . . . . . . . . . . . . . . . . . . . . . . . . . . . . . . . . . . . . . . . . . . 0.1 0.1 0.1
Income before income taxes . . . . . . . . . . . . . . . . . . . . . . . . . . . . . . . . . . . . . 12.9 16.1 1.6
Provision for income taxes . . . . . . . . . . . . . . . . . . . . . . . . . . . . . . . . . . . . . . . 0.3 0.2 0.1
Net income . . . . . . . . . . . . . . . . . . . . . . . . . . . . . . . . . . . . . . . . . . . . . . . . . . 12.6% 15.9% 1.5%
The following table presents details of product and total gross margin as a percentage of product and totalrevenue, respectively:
Year Ended December 31,
2011 2010 2009
Product gross margin . . . . . . . . . . . . . . . . . . . . . . . . . . . . . . . . . . . . . . . . . . . 49.4% 50.2% 48.3%
Total gross margin . . . . . . . . . . . . . . . . . . . . . . . . . . . . . . . . . . . . . . . . . . . . . 50.9 51.8 50.8
35

The following table presents details of total stock-based compensation expense as a percentage of net revenueincluded in each functional line item in the consolidated statements of income data above:
Year Ended December 31,
2011 2010 2009
Cost of product revenue . . . . . . . . . . . . . . . . . . . . . . . . . . . . . . . . . . . . . . . 0.3% 0.3% 0.5%
Research and development . . . . . . . . . . . . . . . . . . . . . . . . . . . . . . . . . . . . . 4.9 5.0 7.8
Selling, general and administrative . . . . . . . . . . . . . . . . . . . . . . . . . . . . . . . 1.7 1.7 2.7
Years Ended December 31, 2011 and 2010
Net Revenue, Cost of Product Revenue, Product Gross Margin, and Total Gross Margin
The following tables present net revenue, cost of product revenue, product gross margin and total gross margin:
Year Ended December 31,
2011 2010
Amount% of NetRevenue Amount
% of NetRevenue Increase
%Change
(In millions, except percentages)
Product revenue . . . . . . . . . . . . . . . . . . $7,160 96.9% $6,589 96.7% $571 8.7%
Income from QualcommAgreement . . . . . . . . . . . . . . . . . . . . 207 2.8 207 3.0 — —
Licensing revenue . . . . . . . . . . . . . . . . 22 0.3 22 0.3 — —
Total net revenue . . . . . . . . . . . . . . . $7,389 100.0% $6,818 100.0% $571 8.4
Cost of product revenue . . . . . . . . . . . $3,626 49.1% $3,284 48.2% $342 10.4
Product gross margin . . . . . . . . . . . . . . 49.4% 50.2% (0.8)%
Total gross margin . . . . . . . . . . . . . . . . 50.9% 51.8% (0.9)%
Three Months Ended
December 31, 2011 September 30, 2011
Amount% of NetRevenue Amount
% of NetRevenue
Increase(Decrease)
%Change
(In millions, except percentages)
Product revenue . . . . . . . . . . . . . . . . $1,764 96.9% $1,902 97.2% $(138) (7.3)%
Income from QualcommAgreement . . . . . . . . . . . . . . . . . . 52 2.9 52 2.7 — —
Licensing revenue . . . . . . . . . . . . . . . 4 0.2 3 0.1 1 33.3
Total net revenue . . . . . . . . . . . . . $1,820 100.0% $1,957 100.0% $(137) (7.0)
Cost of product revenue . . . . . . . . . . $ 894 $ 960 49.1% $ (66) (6.9)
Product gross margin . . . . . . . . . . . . 49.3% 49.5% (0.2)%
Total gross margin . . . . . . . . . . . . . . 50.9% 50.9% 0.0%
36

Net Revenue.
The following table presents net revenue from each of our reportable segments and its respective contribution tonet revenue:
Year Ended December 31,
2011 2010
Amount% of NetRevenue Amount
% of NetRevenue
Increase(Decrease)
%Change
(In millions, except percentages)
Broadband Communications . . . . . . $2,039 27.6% $2,134 31.3% $ (95) (4.5)%
Mobile & Wireless . . . . . . . . . . . . . . 3,484 47.2 2,889 42.4 595 20.6
Infrastructure & Networking . . . . . . 1,658 22.4 1,588 23.3 70 4.4
All other(1) . . . . . . . . . . . . . . . . . . . . 208 2.8 207 3.0 1 0.5
Total net revenue . . . . . . . . . . . . . $7,389 100.0% $6,818 100.0% $571 8.4
(1) Includes (i) income relating to the Qualcomm Agreement that was entered into in April 2009 and (ii) other revenue from certainpatent agreements. See discussion above in the “Overview” section and Notes 1 and 2 of Notes to Consolidated Financial Statements.
The decrease in net revenue from our Broadband Communications reportable segment resulted primarily from adecrease in demand for our digital television and Blu-ray Disc product lines and set top boxes, offset in part by anincrease in demand for our broadband modems. As a result, we decided to reduce our investment in our digitaltelevision and Blu-ray Disc product lines and reallocate funding to higher return opportunities. The increase in netrevenue from our Mobile & Wireless reportable segment resulted primarily from an increase in demand for ourwireless connectivity and cellular solutions. The increase in net revenue from our Infrastructure & Networkingreportable segment resulted primarily from an increase in demand for our Ethernet switching and wirelessinfrastructure products, offset in part by a reduction in demand for our Ethernet controller products.
The following table presents net revenue from each of the reportable segments and its respective contribution tonet revenue:
Three Months Ended
Decrease%
Change
December 31,2011
September 30,2011
Amount% of NetRevenue Amount
% of NetRevenue
(In millions, except percentages)
Broadband Communications . . . . . . . $ 510 28.0% $ 526 26.9% $ (16) (3.0)%
Mobile & Wireless . . . . . . . . . . . . . . . 876 48.1 942 48.1 (66) (7.0)
Infrastructure & Networking . . . . . . . 382 21.0 437 22.3 (55) (12.6)
All other(1) . . . . . . . . . . . . . . . . . . . . . 52 2.9 52 2.7 — —
Total net revenue . . . . . . . . . . . . . . $ 1,820 100.0% $1,957 100.0% $(137) (7.0)
(1) Includes (i) income relating to the Qualcomm Agreement that was entered into in April 2009 and (ii) other revenue from certainpatent agreements. See discussion above in the “Overview” section and Notes 1 and 2 of Notes to Consolidated Financial Statements.
The decrease in net revenue from our Broadband Communications reportable segment resulted primarily from adecrease in demand for our digital television and Blu-ray Disc product lines. The decrease in net revenue from ourMobile & Wireless reportable segment resulted from a decrease in demand for our wireless connectivity solutions.The decrease in net revenue from our Infrastructure & Networking reportable segment resulted primarily from adecrease in demand for most product lines.
We recorded rebates to certain customers of $643 million, or 8.7% of net revenue and $526 million, or 7.7% ofnet revenue in 2011 and 2010, respectively. The increase in rebates in 2011 was attributable to a change in the mixof sales to customers that participate in our rebate programs, primarily an increase in the Mobile & Wireless area. We
37

anticipate that accrued rebates will vary in future periods based upon the level of overall sales to customers thatparticipate in our rebate programs. We reverse the accrual of unclaimed rebate amounts as specific rebate programscontractually end or when we believe unclaimed rebates are no longer subject to payment and will not be paid. Wereversed accrued rebates of $13 million and $4 million in 2011 and 2010, respectively.
From time to time, our key customers place large orders causing our quarterly net revenue to fluctuatesignificantly. We expect that these fluctuations will continue and that they may be exaggerated by the seasonalvariations in consumer products and changes in the overall economic environment. Additionally, since we owninventory that is physically located in a third party’s warehouse, our ability to effectively manage inventory levels maybe impaired, causing our total inventory turns to decrease, which could increase expenses associated with excess andobsolete products and negatively impact our cash flow.
For these and other reasons, our total net revenue and results of operations for the year ended December 31,2011 and prior periods may not necessarily be indicative of future net revenue and results of operations.
Concentration of Net Revenue
The following table presents details of our product net revenue:Year Ended December 31,
2011 2010 2009
Product sales through direct sales force . . . . . . . . . . . . . . . . . . . . . . . . . . . . . 76.8% 77.6% 78.8%Product sales maintained under fulfillment distributor arrangements . . . . . . 7.5 7.9 8.1Product sales through distributors . . . . . . . . . . . . . . . . . . . . . . . . . . . . . . . . . 15.7 14.5 13.1
100.0% 100.0% 100.0%
Sales to our significant customers, including sales to their manufacturing subcontractors, as a percentage of netrevenue were as follows:
Year EndedDecember 31,
2011 2010 2009
Apple . . . . . . . . . . . . . . . . . . . . . . . . . . . . . . . . . . . . . . . . . . . . . . . . . . . . . . . . . 13.1% 10.9% *Samsung . . . . . . . . . . . . . . . . . . . . . . . . . . . . . . . . . . . . . . . . . . . . . . . . . . . . . . . 10.0 10.0 10.3%Five largest customers as a group . . . . . . . . . . . . . . . . . . . . . . . . . . . . . . . . . . . . . 42.6 38.6 34.6
* Less than 10% of net revenue.
We expect that our largest customers will continue to account for a substantial portion of our total net revenuefor the foreseeable future. The identities of our largest customers and their respective contributions to our total netrevenue have varied and will likely continue to vary from period to period.
Product revenue derived from shipments to international destinations, as a percentage of product revenue was asfollows:
Year EndedDecember 31,
2011 2010 2009
China (exclusive of Hong Kong) . . . . . . . . . . . . . . . . . . . . . . . . . . . . . . . . . . . . . 33.4% 30.4% 28.3%Hong Kong . . . . . . . . . . . . . . . . . . . . . . . . . . . . . . . . . . . . . . . . . . . . . . . . . . . . . 26.4 26.0 24.8Singapore, Taiwan and Japan . . . . . . . . . . . . . . . . . . . . . . . . . . . . . . . . . . . . . . . 22.9 25.3 26.3Europe . . . . . . . . . . . . . . . . . . . . . . . . . . . . . . . . . . . . . . . . . . . . . . . . . . . . . . . . 1.8 2.4 2.7Other . . . . . . . . . . . . . . . . . . . . . . . . . . . . . . . . . . . . . . . . . . . . . . . . . . . . . . . . . 14.0 13.1 12.7
98.5% 97.2% 94.8%
All of our revenue to date has been denominated in U.S. dollars.
38

Factors That May Impact Net Revenue
The demand for our products and the subsequent recognition of net revenue has been affected in the past, andmay continue to be affected in the future, by various factors, including, but not limited to, the following:
• general economic and specific conditions in the markets we address, including the continuing volatility in thetechnology sector and semiconductor industry, trends in the wired and wireless communications markets invarious geographic regions, including seasonality in sales of consumer products into which our products areincorporated;
• the timing, rescheduling or cancellation of significant customer orders and our ability, as well as the ability ofour customers and distributors, to manage inventory;
• the timing of our distributors’ shipments to their customers or when products are taken by our customersunder hubbing arrangements;
• our ability to specify, develop or acquire, complete, introduce, market and transition to volume productionnew products and technologies in a cost effective and timely manner;
• the rate at which our present and future customers and end-users adopt/ramp our products and technologies;• the qualification, availability and pricing of competing products and technologies and the resulting effects on
sales and pricing of our products; and• the availability of credit and financing, which may lead certain of our customers to reduce their level of
purchases or to seek credit or other accommodations from us.
Cost of Product Revenue and Product Gross Margin. Cost of product revenue comprises the cost of oursemiconductor devices, which consists of the cost of purchasing finished silicon wafers manufactured by independentfoundries, costs associated with our purchase of assembly, test and quality assurance services and packaging materialsfor semiconductor products, as well as royalties paid to vendors for use of their technology. Also included in cost ofproduct revenue is the amortization of purchased technology and inventory valuation step-up, and manufacturingoverhead, including costs of personnel and equipment associated with manufacturing support, product warrantycosts, provisions for excess and obsolete inventories, and stock-based compensation expense for personnel engaged inmanufacturing support. Product gross margin is product revenue less cost of product revenue divided by productrevenue and does not include income from the Qualcomm Agreement and revenue from the licensing of intellectualproperty. Total gross margin is total net revenue less cost of product revenue divided by total net revenue.
Product gross margin decreased to 49.4% in 2011 as compared to 50.2% in 2010 primarily as a result of (i) anincrease in amortization of purchased intangibles and inventory valuation step-up of $37 million primarily due to ouracquisitions completed over the last twelve months, and (ii) a shift in the mix of our product revenues with morerevenues attributable to Mobile & Wireless products.
Product gross margin decreased to 49.3% in the three months ended December 31, 2011 from 49.5% in thethree months ended September 30, 2011 primarily as a result of a shift in the mix of our product revenues, offset inpart by a decrease in amortization of inventory valuation step-up of $4 million.
Factors That May Impact Product and Total Gross Margin
Our product gross margin has been affected in the past, and may continue to be affected in the future, byvarious factors, including, but not limited to, the following:
• our product mix and volume of product sales (including sales to high volume customers);• the positions of our products in their respective life cycles;• introduction of products with lower margins;• the effects of competition;• the effects of competitive pricing programs and rebates;• provisions for excess and obsolete inventories and their relationship to demand volatility;• manufacturing cost efficiencies and inefficiencies;• fluctuations in direct product costs such as silicon wafer costs and assembly, packaging and testing costs, and
other fixed costs;• our ability to create cost advantages through successful integration and convergence;
39

• our ability to advance to the next technology node faster than our competitors;• the consolidation of foundry subcontractors that could potentially drive increased wafer prices;• licensing royalties payable by us;• product warranty costs;• fair value and related amortization of acquired tangible and intangible assets; and• amortization of acquired inventory valuation step-up.
Our product and total gross margin may also be impacted by additional stock-based compensation expense andchanges therein, as discussed below, and the amortization of purchased intangible assets related to future acquisitions.
Research and Development Expense
Research and development expense consists primarily of salaries and related costs of employees engaged inresearch, design and development activities, including stock-based compensation expense. Development and designcosts consist primarily of costs related to engineering design tools, mask and prototyping costs, testing andsubcontracting costs. In addition, we incur costs related to facilities and equipment expense, among other items.
The following table presents details of research and development expense:
Year Ended December 31,
Increase%
Change
2011 2010
Amount% of NetRevenue Amount
% of NetRevenue
(In millions, except percentages)
Salaries and benefits . . . . . . . . . . . . . . . $1,097 14.8% $ 929 13.6% $168 18.1%
Stock-based compensation . . . . . . . . . . 364 4.9 341 5.0 23 6.7
Development and design costs . . . . . . . 278 3.8 274 4.0 4 1.5
Other . . . . . . . . . . . . . . . . . . . . . . . . . 244 3.3 218 3.1 26 11.9
Research and development . . . . . . . . . $1,983 26.8% $1,762 25.7% $221 12.5
The increase in salaries and benefits and stock-based compensation were primarily attributable to an increase inheadcount of approximately 460 personnel, bringing headcount to approximately 7,260 at December 31, 2011,which represents a 6.8% increase from our December 31, 2010 levels. Development and design costs vary fromperiod to period depending on the timing development and tape-out of various products. The increase in the Otherline item in the above table is primarily attributable to an increase in depreciation, travel and facilities expenses.
We expect research and development costs to increase as a result of growth in, and the diversification of, themarkets we serve, new product opportunities, the number of design wins that go into production, changes in ourcompensation policies, and any expansion into new markets and technologies.
We remain committed to significant research and development efforts to extend our technology leadership inthe wired and wireless communications markets in which we operate. Approximately 61.3% of our products arecurrently manufactured in 65 nanometers. We are designing most new products in 40 nanometers and 28nanometers, and are beginning to evaluate 20 nanometers. We currently hold more than 6,000 U.S. and more than2,550 foreign patents and more than 7,350 additional U.S. and foreign pending patent applications. We maintain anactive program of filing for and acquiring additional U.S. and foreign patents in wired and wireless communicationsand other fields.
Selling, General and Administrative Expense
Selling, general and administrative expense consists primarily of personnel-related expenses, including stock-based compensation expense, legal and other professional fees, facilities expenses and communications expenses.
40
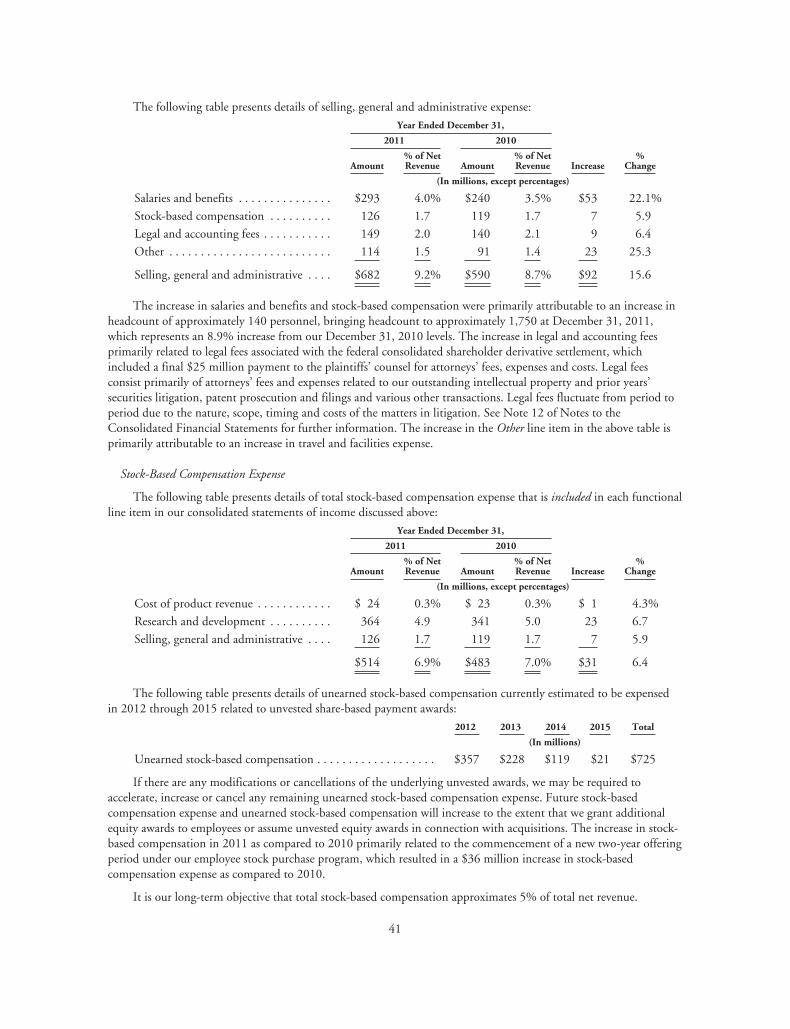
The following table presents details of selling, general and administrative expense:Year Ended December 31,
Increase%
Change
2011 2010
Amount% of NetRevenue Amount
% of NetRevenue
(In millions, except percentages)
Salaries and benefits . . . . . . . . . . . . . . . $293 4.0% $240 3.5% $53 22.1%
Stock-based compensation . . . . . . . . . . 126 1.7 119 1.7 7 5.9
Legal and accounting fees . . . . . . . . . . . 149 2.0 140 2.1 9 6.4
Other . . . . . . . . . . . . . . . . . . . . . . . . . . 114 1.5 91 1.4 23 25.3
Selling, general and administrative . . . . $682 9.2% $590 8.7% $92 15.6
The increase in salaries and benefits and stock-based compensation were primarily attributable to an increase inheadcount of approximately 140 personnel, bringing headcount to approximately 1,750 at December 31, 2011,which represents an 8.9% increase from our December 31, 2010 levels. The increase in legal and accounting feesprimarily related to legal fees associated with the federal consolidated shareholder derivative settlement, whichincluded a final $25 million payment to the plaintiffs’ counsel for attorneys’ fees, expenses and costs. Legal feesconsist primarily of attorneys’ fees and expenses related to our outstanding intellectual property and prior years’securities litigation, patent prosecution and filings and various other transactions. Legal fees fluctuate from period toperiod due to the nature, scope, timing and costs of the matters in litigation. See Note 12 of Notes to theConsolidated Financial Statements for further information. The increase in the Other line item in the above table isprimarily attributable to an increase in travel and facilities expense.
Stock-Based Compensation Expense
The following table presents details of total stock-based compensation expense that is included in each functionalline item in our consolidated statements of income discussed above:
Year Ended December 31,
Increase%
Change
2011 2010
Amount% of NetRevenue Amount
% of NetRevenue
(In millions, except percentages)
Cost of product revenue . . . . . . . . . . . . $ 24 0.3% $ 23 0.3% $ 1 4.3%
Research and development . . . . . . . . . . 364 4.9 341 5.0 23 6.7
Selling, general and administrative . . . . 126 1.7 119 1.7 7 5.9
$514 6.9% $483 7.0% $31 6.4
The following table presents details of unearned stock-based compensation currently estimated to be expensedin 2012 through 2015 related to unvested share-based payment awards:
2012 2013 2014 2015 Total
(In millions)
Unearned stock-based compensation . . . . . . . . . . . . . . . . . . . $357 $228 $119 $21 $725
If there are any modifications or cancellations of the underlying unvested awards, we may be required toaccelerate, increase or cancel any remaining unearned stock-based compensation expense. Future stock-basedcompensation expense and unearned stock-based compensation will increase to the extent that we grant additionalequity awards to employees or assume unvested equity awards in connection with acquisitions. The increase in stock-based compensation in 2011 as compared to 2010 primarily related to the commencement of a new two-year offeringperiod under our employee stock purchase program, which resulted in a $36 million increase in stock-basedcompensation expense as compared to 2010.
It is our long-term objective that total stock-based compensation approximates 5% of total net revenue.
41

See Note 9 of Notes to Consolidated Financial Statements for a discussion of share-based awards.
Amortization of Purchased Intangible Assets
The following table presents details of the amortization of purchased intangible assets included in the cost ofproduct revenue and other operating expense categories:
Year Ended December 31,
Increase%
Change
2011 2010
Amount% of NetRevenue Amount
% of NetRevenue
(In millions, except percentages)
Cost of product revenue . . . . . . . . . . . . $54 0.7% $31 0.5% $23 74.2%
Other operating expenses . . . . . . . . . . . 30 0.4 28 0.4 2 7.1
$84 1.1% $59 0.9% $25 42.4
The increase in amortization of purchased intangible assets in 2011 as compared to 2010 was primarily relatedto our acquisitions of Beceem Communications, Inc. in late 2010 and Provigent in 2011.
The following table presents details of the amortization of existing purchased intangible assets, includingIPR&D, which is currently estimated to be expensed in 2012 and thereafter.
Purchased Intangible Assets Amortization by Year
2012 2013 2014 2015 2016 Thereafter Total
(In millions)
Cost of product revenue . . . . . . . . . . . . . . . . . . . . . . . . . . . . . $ 77 $72 $60 $46 $33 $56 $344
Other operating expenses . . . . . . . . . . . . . . . . . . . . . . . . . . . . 27 10 4 4 4 7 56
$104 $82 $64 $50 $37 $63 $400
If we acquire additional purchased intangible assets in the future, including purchased intangible assets relatedto our pending acquisition of NetLogic, our cost of product revenue or operating expenses will be increased by theamortization of those assets.
Impairment of Goodwill and Other Long-Lived Assets
We performed annual impairment assessments of the carrying value of goodwill in October 2011 and 2010.Upon completion of these assessments, we determined no impairment was indicated as the estimated fair value ofeach of the reporting units exceeded its respective carrying value. We also believe that we have no at-risk goodwill.We recorded a purchased intangible impairment charge of $74 million related to our acquisition of Beceem and otherimpairment charges of $18 million in 2011. The primary factor contributing to the Beceem impairment charge was areduction in the forecasted cash flows related to WiMAX products, as wireless service providers have accelerated theiradoption of LTE products. In 2010 we recorded an impairment charge of $19 million, primarily related to atechnology license that was acquired in 2008 from Sunext Design, Inc. For the carrying balances of our goodwill byreporting segment and a description of our valuation techniques and significant assumptions as well as details of ourother long-lived assets impairment charges taken, see the discussions in Notes 2 and 10 of Notes to the ConsolidatedFinancial Statements.
Restructuring Costs
As discussed above in “Operating Results for the Year Ended December 31, 2011,” we recorded an aggregate of$16 million in net restructuring costs in 2011, of which $12 million was related to severance and other chargesassociated with our reduction in workforce across multiple locations and functions, and $4 million was related to theclosure of three of our facilities. We do not expect any cost savings as we plan to reallocate funding to higher returnopportunities. We currently expect to complete this plan and record additional costs of approximately $1 million inthe three months ended March 31, 2012.
42

Settlement Costs (Gains), Net
In 2011 we recorded settlement gains of $55 million primarily related to the settlement of our shareholderderivative action, partially offset by net settlement costs of $37 million related to patent infringement claims,resulting in net settlement gains of $18 million. In 2010 we recorded settlement costs of $53 million primarilyrelated to licensing and settlement agreements and certain employment tax items.
For a further discussion of our settlement costs and litigation matters, see Notes 11 and 12 of Notes to theConsolidated Financial Statements.
In-Process Research and Development
In 2011 and 2010 we capitalized IPR&D of $45 million and $55 million, respectively. For a description of ourvaluation techniques and significant assumptions underlying the valuation of the ongoing development projects thatwere in process at the date of acquisition and were capitalized as IPR&D in 2011 and 2010, see the discussion inNote 3 of Notes to the Consolidated Financial Statements. In addition, in 2011 and 2010 we reclassified $3 millionand $51 million, respectively, of IPR&D costs to developed technology, primarily related to our acquisition of DuneNetworks, Inc., which will now be amortized to cost of product revenue.
Charitable Contributions
In April 2009 we established the Broadcom Foundation, or the Foundation, to support science, technology,engineering and mathematics programs, as well as a broad range of community services. In June 2011 we contributedan additional $25 million to the Foundation. Approximately $2 million of the $25 million contribution came fromDr. Henry Samueli, our Chief Technical Officer and member of the Board of Directors, who made such payment toBroadcom in connection with the settlement of the shareholder derivative litigation as further described in Note 12of Notes to the Consolidated Financial Statements. This payment was recorded as an operating expense inconsolidated statement of income in 2011.
Interest and Other Income, Net
The following table presents interest and other income, net:Year Ended December 31,
Increase(Decrease)
%Change
2011 2010
Amount% of NetRevenue Amount
% of NetRevenue
(In millions, except percentages)
Interest income (expense), net . . . . . . $(5) (0.1%) $9 0.1% $(14) (155.6)%Other income, net . . . . . . . . . . . . . . 8 0.1 6 0.1 2 33.3
Interest income (expense), net, reflects interest income earned on cash, cash equivalents and marketablesecurities balances offset by interest expense on our Senior Notes totaling $1.20 billion. Other income, net, primarilyincludes gains on foreign currency transactions.
The decrease in interest income (expense), net, for 2011 as compared to 2010 was driven primarily by interestexpense related to our newly issued long-term debt. See Note 6 of Notes to the Consolidated Financial Statements.
Provision for Income TaxesYear Ended December 31,
Increase%
Change
2011 2010
Amount% of NetRevenue Amount
% of NetRevenue
(In millions, except percentages)
Income tax provision . . . . . . . . . . . . . . $29 0.3% $15 0.2% $14 93.3%
The federal statutory rate was 35% for 2011 and 2010. Our effective tax rates were 3.0% and 1.4% for 2011and 2010, respectively. The differences between our effective tax rates and the federal statutory tax rate primarily
43

relate to foreign earnings taxed at substantially lower rates than the federal statutory rate for 2011 and 2010 dueprincipally to our tax holiday in Singapore, and for 2011 and 2010 domestic tax losses recorded without tax benefits.We recorded a tax provision of $13 million in 2011 resulting from legislation enacted in Israel on December 5, 2011which increased tax rates for 2012 and later years applicable to our Israel net deferred tax liabilities, principally relatedto purchased intangible assets. We realized tax benefits resulting from the reversal of certain prior period tax accrualsof $9 million and $12 million in 2011 and 2010, respectively. These reversals resulted primarily from the expirationof the statutes of limitation for the assessment of taxes related to certain foreign subsidiaries. Additionally, as a resultof the March 22, 2010 decision in the U.S. Court of Appeals for the Ninth Circuit case concerning Xilinx, werecorded a tax benefit of approximately $3 million in 2010 to reverse the approximately $3 million of relatedexposure previously recorded in 2009. See Note 5 of Notes to Consolidated Financial Statements for detaileddiscussions of our income taxes.
We operate under tax holidays in Singapore, which are effective through March 2014. The tax holidays areconditional upon our meeting certain employment and investment thresholds. The impact of the Singapore taxholidays decreased Singapore taxes by $368 million and $330 million for 2011 and 2010, respectively. The benefit ofthe tax holidays on net income per share (diluted) was $0.65 and $0.61 for 2011 and 2010, respectively. We havebegun discussions with the Singapore Economic Development Board with respect to tax incentives for periods afterMarch 31, 2014.
Years Ended December 31, 2010 and 2009
Net Revenue, Cost of Product Revenue, Product Gross Margin, and Total Gross Margin
The following tables present net revenue, cost of product revenue, product gross margin and total gross margin:Year Ended December 31,
Increase(Decrease)
%Change
2010 2009
Amount% of NetRevenue Amount
% of NetRevenue
(In millions, except percentages)
Product revenue . . . . . . . . . . . . . . . . . $6,589 96.7% $4,273 95.2% $2,316 54.2%Income from Qualcomm
Agreement . . . . . . . . . . . . . . . . . . . 207 3.0 171 3.8 36 21.1Licensing revenue . . . . . . . . . . . . . . . . 22 0.3 46 1.0 (24) (52.2)
Total net revenue . . . . . . . . . . . . . . $6,818 100.0% $4,490 100.0% $2,328 51.8
Cost of product revenue . . . . . . . . . . . $3,284 48.2% $2,211 49.2% $1,073 48.5
Product gross margin . . . . . . . . . . . . . 50.2% 48.3% 1.9%
Total gross margin . . . . . . . . . . . . . . . 51.8% 50.8% 1.0%
The following table presents net revenue from each of our reportable segments and its respective contribution tonet revenue:
Year Ended December 31,
Increase%
Change
2010 2009
Amount% of NetRevenue Amount
% of NetRevenue
(In millions, except percentages)
Broadband Communications . . . . . . . $2,134 31.3% $1,525 34.0% $ 609 39.9%Mobile & Wireless . . . . . . . . . . . . . . . 2,889 42.4 1,720 38.3 1,169 68.0Infrastructure & Networking . . . . . . . 1,588 23.3 1,056 23.5 532 50.4All other(1) . . . . . . . . . . . . . . . . . . . . . . 207 3.0 189 4.2 18 9.5
Total net revenue . . . . . . . . . . . . . . $6,818 100.0% $4,490 100.0% $2,328 51.8
44

(1) Includes (i) income relating to the Qualcomm Agreement that was entered into in April 2009, (ii) royalties received pursuant to apatent license agreement that was entered into with Verizon Wireless in July 2007 which was completed in March 2009 and (iii) otherrevenue from certain patent agreements, each previously reported in our Mobile & Wireless reportable segment. See Notes 1 and 2 ofNotes to Consolidated Financial Statements.
The increase in net revenue from our Broadband Communications reportable segment resulted primarily froman increase in demand for digital set-top boxes and broadband modems. The increase in net revenue from ourMobile & Wireless reportable segment resulted primarily from the increase in demand for our wireless connectivitycombo solutions, as well as the ramp of our cellular products. The increase in net revenue from our Infrastructure &Networking reportable segment resulted primarily from an increase in demand for our Ethernet switching products.The increase in our “All Other” category was the result of a $36 million increase in income received from theQualcomm Agreement, offset in part by a $19 million decrease in licensing revenue from our agreement withVerizon Wireless, which was completed in March 2009.
We recorded rebates to certain customers of $526 million, or 7.7% of net revenue and $312 million, or 6.9% ofnet revenue in 2010 and 2009, respectively. The increase in rebates in 2010 was attributable to the increase in netrevenue along with a change to the mix in sales to customers that participate in our rebate programs, primarily anincrease in the Mobile & Wireless reportable segment. We reversed accrued rebates of $4 million and $11 million in2010 and 2009, respectively.
Cost of Product Revenue, Product Gross Margin and Total Gross Margin.
Product gross margin increased from 48.3% in 2009 to 50.2% in 2010 primarily as a result of cost reductions ineach of our reportable segments as we continued our transition to 40 nanometer process technology. Other factorsthat contributed to the increase in product gross margin were: (i) fixed costs being spread over a higher revenue base(ii) higher margins in our infrastructure and networking products offset by (iii) a net increase in excess and obsoleteinventory provisions of $7 million due to an increase in the provision for digital TV products.
Research and Development Expense
The following table presents details of research and development expense:
Year Ended December 31,
Increase(Decrease)
%Change
2010 2009
Amount% of NetRevenue Amount
% of NetRevenue
(In millions, except percentages)
Salaries and benefits . . . . . . . . . . . . . $ 929 13.6% $ 770 17.2% $159 20.6%
Stock-based compensation . . . . . . . . 341 5.0 352 7.8 (11) (3.1)
Development and design costs . . . . . 274 4.0 211 4.7 63 29.9
Other . . . . . . . . . . . . . . . . . . . . . . . . 218 3.1 202 4.5 16 7.9
Research and development . . . . . . . . $1,762 25.7% $1,535 34.2% $227 14.8
The increase in salaries and benefits was primarily attributable to an increase in headcount of approximately1,300 personnel; bringing total headcount to approximately 6,800 personnel. This represents a 23.6% increase fromour December 31, 2009 levels, and was predominantly in each of our reportable segments as a result of both organicgrowth and our 2010 acquisitions. Salary increases were also attributable to increased incentive compensation.Development and design costs increased due to increases in mask, prototyping, testing and engineering design toolcosts stemming from our continued transition of products to 40 nanometer process technologies. Development anddesign costs vary from period to period depending on the timing, development and tape-out of various products.
45

Selling, General and Administrative Expense
The following table presents details of selling, general and administrative expense:Year Ended December 31,
Increase(Decrease)
%Change
2010 2009
Amount% of NetRevenue Amount
% of NetRevenue
(In millions, except percentages)
Salaries and benefits . . . . . . . . . . . . . $240 3.5% $194 4.3% $ 46 23.7%Stock-based compensation . . . . . . . . 119 1.7 120 2.7 (1) (0.8)Legal and accounting fees . . . . . . . . . 140 2.1 110 2.5 30 27.3Other . . . . . . . . . . . . . . . . . . . . . . . . 91 1.4 55 1.2 36 65.5
Selling, general and administrative . . $590 8.7% $479 10.7% $111 23.2
The increase in salaries and benefits was primarily attributable to an increase in headcount of approximately300 personnel, which represents a 23.1% increase from our December 31, 2009 levels, as well as higher incentivecompensation. The increase in legal and accounting fees in 2010 was primarily related to a 2009 recovery of legal feesof $91 million under our directors’ and officers’ insurance policies, which reduced our 2009 legal fees. Legal feesconsist primarily of attorneys’ fees and expenses related to our outstanding intellectual property and prior years’ stockoption backdating securities litigation, patent prosecution and filings and various other transactions. Legal feesfluctuate from period to period due to the nature, scope, timing and costs of the matters in litigation. See Note 12 ofNotes to Consolidated Financial Statements for further information. The increase in the Other line item in the abovetable is primarily attributable to an increase in facilities and travel expenses.
Stock-Based Compensation Expense
The following table presents details of total stock-based compensation expense that is included in each functionalline item in our consolidated statements of income discussed above:
Year Ended December 31,
Decrease%
Change
2010 2009
Amount% of NetRevenue Amount
% of NetRevenue
(In millions, except percentages)
Cost of product revenue . . . . . . . . . . . $ 23 0.3% $ 25 0.5% $ (2) (8.0)%Research and development . . . . . . . . . 341 5.0 352 7.8 (11) (3.1)Selling, general and administrative . . . 119 1.7 120 2.7 (1) (0.8)
$483 7.0% $497 11.0% $(14) (2.8)
See Note 9 of Notes to Consolidated Financial Statements for a discussion of share-based awards.
Amortization of Purchased Intangible Assets
The following table presents details of the amortization of purchased intangible assets included in the cost ofproduct revenue and other operating expense categories:
Year Ended December 31,
Increase%
Change
2010 2009
Amount% of NetRevenue Amount
% of NetRevenue
(In millions, except percentages)
Cost of product revenue . . . . . . . . . . . . $31 0.5% $16 0.4% $15 93.8%Other operating expenses . . . . . . . . . . . 28 0.4 15 0.3 13 86.7
$59 0.9% $31 0.7% $28 90.3
46
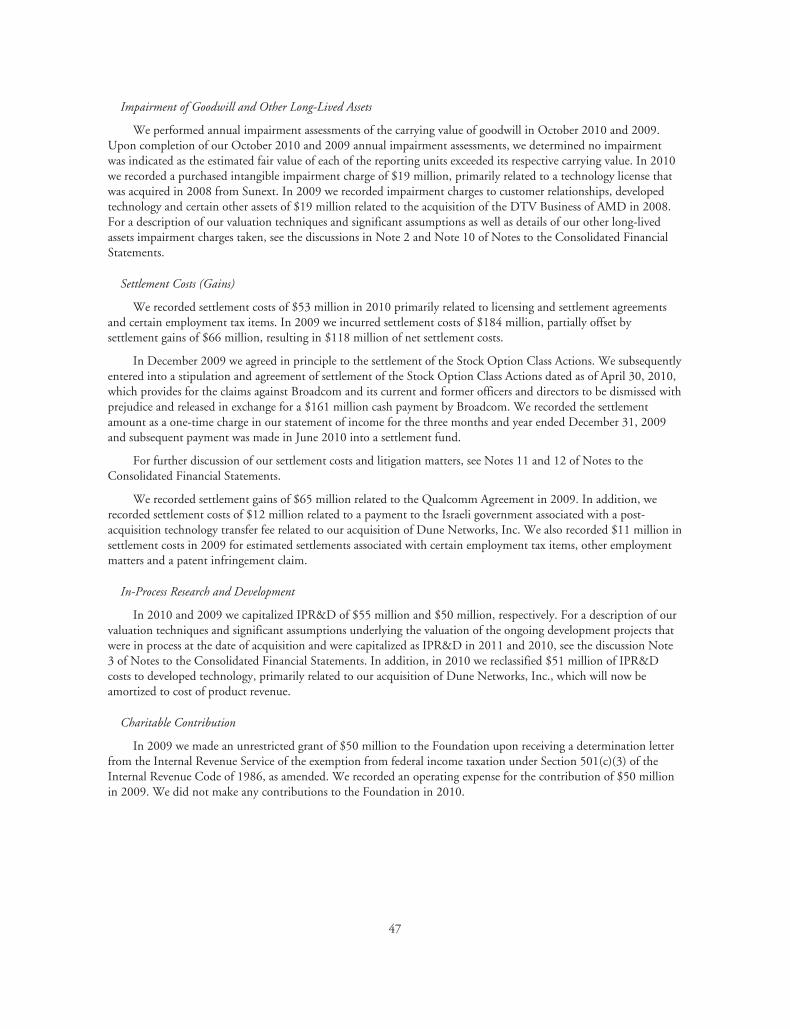
Impairment of Goodwill and Other Long-Lived Assets
We performed annual impairment assessments of the carrying value of goodwill in October 2010 and 2009.Upon completion of our October 2010 and 2009 annual impairment assessments, we determined no impairmentwas indicated as the estimated fair value of each of the reporting units exceeded its respective carrying value. In 2010we recorded a purchased intangible impairment charge of $19 million, primarily related to a technology license thatwas acquired in 2008 from Sunext. In 2009 we recorded impairment charges to customer relationships, developedtechnology and certain other assets of $19 million related to the acquisition of the DTV Business of AMD in 2008.For a description of our valuation techniques and significant assumptions as well as details of our other long-livedassets impairment charges taken, see the discussions in Note 2 and Note 10 of Notes to the Consolidated FinancialStatements.
Settlement Costs (Gains)
We recorded settlement costs of $53 million in 2010 primarily related to licensing and settlement agreementsand certain employment tax items. In 2009 we incurred settlement costs of $184 million, partially offset bysettlement gains of $66 million, resulting in $118 million of net settlement costs.
In December 2009 we agreed in principle to the settlement of the Stock Option Class Actions. We subsequentlyentered into a stipulation and agreement of settlement of the Stock Option Class Actions dated as of April 30, 2010,which provides for the claims against Broadcom and its current and former officers and directors to be dismissed withprejudice and released in exchange for a $161 million cash payment by Broadcom. We recorded the settlementamount as a one-time charge in our statement of income for the three months and year ended December 31, 2009and subsequent payment was made in June 2010 into a settlement fund.
For further discussion of our settlement costs and litigation matters, see Notes 11 and 12 of Notes to theConsolidated Financial Statements.
We recorded settlement gains of $65 million related to the Qualcomm Agreement in 2009. In addition, werecorded settlement costs of $12 million related to a payment to the Israeli government associated with a post-acquisition technology transfer fee related to our acquisition of Dune Networks, Inc. We also recorded $11 million insettlement costs in 2009 for estimated settlements associated with certain employment tax items, other employmentmatters and a patent infringement claim.
In-Process Research and Development
In 2010 and 2009 we capitalized IPR&D of $55 million and $50 million, respectively. For a description of ourvaluation techniques and significant assumptions underlying the valuation of the ongoing development projects thatwere in process at the date of acquisition and were capitalized as IPR&D in 2011 and 2010, see the discussion Note3 of Notes to the Consolidated Financial Statements. In addition, in 2010 we reclassified $51 million of IPR&Dcosts to developed technology, primarily related to our acquisition of Dune Networks, Inc., which will now beamortized to cost of product revenue.
Charitable Contribution
In 2009 we made an unrestricted grant of $50 million to the Foundation upon receiving a determination letterfrom the Internal Revenue Service of the exemption from federal income taxation under Section 501(c)(3) of theInternal Revenue Code of 1986, as amended. We recorded an operating expense for the contribution of $50 millionin 2009. We did not make any contributions to the Foundation in 2010.
47

Interest and Other Income (Expense), Net
The following table presents interest and other income (expense), net:
Year Ended December 31,
Increase(Decrease)
%Change
2010 2009
Amount% of NetRevenue Amount
% of NetRevenue
(In millions, except percentages)
Interest income, net . . . . . . . . . . . . . . $9 0.1% $14 0.3% $(5) (35.7)%
Other income, net . . . . . . . . . . . . . . . 6 0.1 2 0.1 4 200.0
The decrease in interest income, net, was the result of interest expense related to long-term debt and the overalldecrease in market interest rates. Our cash and marketable securities balances increased from $2.37 billion atDecember 31, 2009 to $4.06 billion at December 31, 2010, primarily due to net cash provided by operatingactivities, proceeds from exercise of stock options and stock purchase rights and proceeds from the issuance of ourlong-term debt. The average interest rates earned in 2010 and 2009 were 0.43% and 0.63%, respectively. Thedecrease in the average interest rate is a reflection of reinvestment in the current low interest rate environment.
The increase in other income, net was primarily the result of a gain on strategic investments.
Provision for Income Taxes
Year Ended December 31,
Increase%
Change
2010 2009
Amount% of NetRevenue Amount
% of NetRevenue
(In millions, except percentages)
Income tax provision . . . . . . . . . . . . . . $15 0.2% $7 0.1% $8 114.3%
The federal statutory rate was 35% for 2010 and 2009. Our effective tax rates were 1.4% and 9.6% for 2010and 2009, respectively. The differences between our effective tax rates and the federal statutory tax rate primarilyrelate to foreign earnings taxed at substantially lower rates than the federal statutory rate for 2010 and 2009 dueprincipally to our tax holiday in Singapore, and for 2010 and 2009 domestic tax losses recorded without tax benefits.We recognized federal tax benefits of approximately $3 million in 2009, which resulted from the utilization of aportion of our federal credits for increasing research activities (research and development tax credits) pursuant to aprovision contained in the American Recovery and Reinvestment Tax Act of 2009, which was enacted in February,2009. In addition, we realized tax benefits resulting from the reversal of certain prior period tax accruals of$12 million and $8 million in 2010 and 2009, respectively. These reversals resulted primarily from the expiration ofthe statutes of limitation for the assessment of taxes related to certain foreign subsidiaries. Additionally, as a result ofthe May 27, 2009 and March 22, 2010 decisions in the U.S. Court of Appeals for the Ninth Circuit case concerningXilinx, we recorded a tax benefit of approximately $3 million in 2010 to reverse the approximately $3 million ofrelated exposure previously recorded in 2009. See Note 5 of Notes to Consolidated Financial Statements for detaileddiscussions of our income taxes.
We operate under tax holidays in Singapore, which are effective through March 2014. The tax holidays areconditional upon our meeting certain employment and investment thresholds. The impact of the Singapore taxholidays decreased Singapore taxes by $330 million and $225 million for 2010 and 2009, respectively. The benefit ofthe tax holidays on net income per share (diluted) was $0.61 and $0.44 for 2010 and 2009, respectively.
At December 31, 2010 we had unrecognized tax benefits in the amount of $188 million which included$23 million of tax benefits that, if recognized, would reduce our annual effective tax rate. Approximately $12 millionof the tax benefit, if recognized would be credited to shareholder’s equity. The remaining $153 million, if recognized,would not result in a tax benefit since it would be fully offset with a valuation allowance. We also accrued potentialpenalties and interest of $2 million and $1 million, respectively, related to these unrecognized tax benefits during2010, and in total, as of December 31, 2010, we had recorded liabilities for potential penalties and interest of$14 million and $2 million, respectively. We recognize potential accrued interest and penalties related to
48

unrecognized tax benefits within the consolidated statements of income as income tax expense. In 2010 we had adecrease in unrecognized tax benefits of approximately $273 million relating to increases to our federal and state netoperating loss carryforwards, capitalized research and development costs, and tax credit carryforwards for previousyears primarily resulting from the U.S. Court of Appeals for the Ninth Circuit March 22, 2010 ruling in the casebetween Xilinx, Inc. and the Commissioner of Internal Revenue. In addition, we had an increase in unrecognized taxbenefits of approximately $39 million primarily relating to transactions with certain foreign subsidiaries. In 2009 ourjudgment changed with respect to prior period uncertain tax positions, which resulted in additional unrecognized taxbenefits in the amount of approximately $380 million as of December 31, 2009. In 2010 we reversed approximately$273 million of this amount due to the March 22, 2010 decision in the Xilinx case as discussed above, and recorded$23 million of unrecognized tax benefits resulting from a 2010 change in judgment regarding certain tax accruals.
Quarterly Financial Data
The following table presents our quarterly financial data. In our opinion, this information has been prepared ona basis consistent with that of our audited consolidated financial statements and all necessary material adjustments,consisting of normal recurring accruals and adjustments, have been included to present fairly the quarterly financialdata. Our quarterly results of operations for these periods are not necessarily indicative of future results of operations.
Total NetRevenue
GrossProfit
NetIncome
Diluted NetIncome
PerShare
(In millions, except per share data)
Year Ended December 31, 2011Fourth Quarter . . . . . . . . . . . . . . . . . . . . . . . . . . . . . . . . . . $1,820 $926 $254 $0.45Third Quarter . . . . . . . . . . . . . . . . . . . . . . . . . . . . . . . . . . . 1,957 997 270(1) 0.48Second Quarter . . . . . . . . . . . . . . . . . . . . . . . . . . . . . . . . . . 1,796 919 175(2) 0.31First Quarter . . . . . . . . . . . . . . . . . . . . . . . . . . . . . . . . . . . . 1,816 921 228 0.40Year Ended December 31, 2010Fourth Quarter . . . . . . . . . . . . . . . . . . . . . . . . . . . . . . . . . . $1,945 $990 $266(3) $0.47Third Quarter . . . . . . . . . . . . . . . . . . . . . . . . . . . . . . . . . . . 1,806 934 328 0.60Second Quarter . . . . . . . . . . . . . . . . . . . . . . . . . . . . . . . . . . 1,605 843 278 0.52First Quarter . . . . . . . . . . . . . . . . . . . . . . . . . . . . . . . . . . . . 1,462 767 210 0.40
(1) Includes settlement costs of $27 million and a restructuring charge of $17 million.
(2) Includes settlement gains of $45 million, an impairment of long-lived assets charge of $74 million, a charitable contribution of $25million and non-recurring legal expenses of $25 million.
(3) Includes settlement costs of $49 million and an impairment of long-lived assets charge of $17 million.
Subsequent Events
In January 2012 our Board of Directors adopted an amendment to the existing dividend policy pursuant towhich we intend to increase the quarterly cash dividend by 11.1% to $0.10 per share ($0.40 per share on an annualbasis) and declared a quarterly cash dividend of $0.10 per share payable to holders of our common stock.
Recent Accounting Pronouncements
In May 2011 the FASB issued additional guidance on fair value measurements that clarifies the application ofexisting guidance and disclosure requirements, changes certain fair value measurement principles and requiresadditional disclosures about fair value measurements. The updated guidance is effective on a prospective basis forfinancial statements issued for fiscal years, and interim periods within those fiscal years, beginning after December 15,2011. The adoption of this guidance will not have a material impact on our financial statements.
In June 2011 the FASB issued guidance regarding the presentation of comprehensive income. The new standardrequires the presentation of comprehensive income, the components of net income and the components of othercomprehensive income either in a single continuous statement of comprehensive income or in two separate but
49

consecutive statements. The updated guidance is effective on a retrospective basis for financial statements issued forfiscal years, and interim periods within those fiscal years, beginning after December 15, 2011. The adoption of thisguidance will not have a material impact on our financial statements.
Liquidity and Capital Resources
Working Capital and Cash and Marketable Securities. The following table presents working capital, and cashand cash equivalents and marketable securities:
December 31, Increase(Decrease)2011 2010
(In millions)
Working capital . . . . . . . . . . . . . . . . . . . . . . . . . . . . . . . . . . . . . . . . . . $4,653 $2,913 $1,740
Cash and cash equivalents . . . . . . . . . . . . . . . . . . . . . . . . . . . . . . . . . . . $4,146 $1,622 $2,524
Short-term marketable securities . . . . . . . . . . . . . . . . . . . . . . . . . . . . . . 383 1,035 (652)
Long-term marketable securities . . . . . . . . . . . . . . . . . . . . . . . . . . . . . . 676 1,401 (725)
$5,205 $4,058 $1,147
See the summary of cash, cash equivalents, short and long-term marketable securities by major security type anddiscussion of market risk that follows in Item 7A. Quantitative and Qualitative Disclosures about Market Risk.
Cash Provided and Used in 2011 and 2010
Cash and cash equivalents increased to $4.15 billion at December 31, 2011 from $1.62 billion at December 31,2010 as a result of cash provided by operating activities, proceeds from marketable securities, proceeds from theissuance of our long-term debt, and the issuance of our Class A common stock, offset in part by repurchases of ourClass A common stock, net cash paid for acquired companies, our quarterly dividend payments and net purchases ofproperty and equipment.
Year Ended December 31,
2011 2010 2009
(In millions)
Net cash provided by operating activities . . . . . . . . . . . . . . . . . . . . . . . . $1,838 $ 1,371 $ 987
Net cash provided by (used in) investing activities . . . . . . . . . . . . . . . . . 863 (2,179) (502)
Net cash provided by (used in) financing activities . . . . . . . . . . . . . . . . . (177) 1,033 (279)
Increase in cash and cash equivalents . . . . . . . . . . . . . . . . . . . . . . . . . . . 2,524 225 206
Cash and cash equivalents at beginning of year . . . . . . . . . . . . . . . . . . . 1,622 1,397 1,191
Cash and cash equivalents at end of year . . . . . . . . . . . . . . . . . . . . . . . . $4,146 $ 1,622 $1,397
Operating Activities
In 2011 our operating activities provided $1.84 billion in cash. This was primarily the result of net income of$927 million, net non-cash operating expenses of $784 million and net cash provided by changes in operating assetsand liabilities of $127 million. In 2010 our operating activities provided $1.37 billion in cash. This was primarily theresult of net income of $1.08 billion and net non-cash operating expenses of $638 million, offset in part by net cashused by changes in operating assets and liabilities of $349 million, which includes our $161 million payment ofpreviously accrued securities litigation settlement costs.
Our days sales outstanding decreased to 34 days for the three months ended December 31, 2011 as compared to38 days for the three months ended December 31, 2010 due to our revenue linearity. We typically bill customers onan open account basis subject to our standard net thirty day payment terms. If, in the longer term, our revenueincreases, it is likely that our accounts receivable balance will also increase. Our accounts receivable could also
50

increase if customers delay their payments or if we grant extended payment terms to customers, both of which aremore likely to occur during challenging economic times when our customers may have difficulty gaining access tosufficient credit on a timely basis.
Our inventory days on hand decreased from 57 days at December 31, 2010 to 43 days at December 31, 2011,primarily attributable to inventory management. In the future, our inventory levels will continue to be determined bythe level of purchase orders we receive and the stage at which our products are in their respective product life cycles,our ability, and the ability of our customers, to manage inventory under hubbing arrangements, and competitivesituations in the marketplace. Such considerations are balanced against the risk of obsolescence or potentially excessinventory levels.
Investing Activities
Investing activities provided $863 million in cash in 2011. This was primarily the result of $1.38 billion in netproceeds from sales and maturities of marketable securities in anticipation of our acquisition of NetLogic in the firsthalf of 2012, offset in part by $347 million in net cash paid for our acquisitions of Provigent and SC Square and$163 million of capital equipment purchases to support our research and development efforts. Investing activitiesused $2.18 billion in cash in 2010, which was primarily the result of $1.47 billion in net purchases of marketablesecurities, $599 million in net cash paid primarily for the acquisitions of Teknovus, Innovision, Percello, Beceem andGigle, and $109 million of capital equipment purchases, mostly to support our research and development efforts.
Financing Activities
Our financing activities used $177 million in cash in 2011. This was primarily the result of $670 million inrepurchases of shares of our Class A common stock, dividends paid of $194 million, and $155 million in minimumtax withholding paid on behalf of employees for shares issued pursuant to restricted stock units, offset in part by $494million in proceeds from the issuance of our long-term debt and $348 million in proceeds received from issuances ofcommon stock upon the exercise of stock options and pursuant to our employee stock purchase plan. Our financingactivities provided $1.03 billion in cash in 2010, which was primarily the result of $936 million in proceeds receivedfrom issuances of common stock upon exercise of stock options and pursuant to our employee stock purchase planand $691 million in proceeds from the issuance of our long-term debt, offset in part by $280 million in repurchasesof shares of our Class A common stock, dividends paid of $163 million, repayment of debt assumed in our Teknovusacquisition of $15 million, and $136 million in minimum tax withholding paid on behalf of employees for sharesissued pursuant to restricted stock units.
The timing and number of stock option exercises and employee stock purchases and the amount of cashproceeds we receive through those exercises and purchases are not within our control, and in the future we may notgenerate as much cash from the exercise of stock options as we have in the past. Moreover, it is now our generalpractice to issue a combination of time-based and performance-based RSUs only to certain employees and, in mostcases to issue solely time-based RSUs. While we may issue stock options in the future, we currently plan to do so onlyin connection with acquisitions. Unlike the exercise of stock options, the issuance of shares upon vesting of restrictedstock units does not result in any cash proceeds to Broadcom and requires the use of cash, as we currently allowemployees to elect to have a portion of the shares issued upon vesting of restricted stock units withheld to satisfyminimum statutory withholding taxes, which we then pay in cash to the appropriate tax authorities on eachparticipating employee’s behalf.
Short and Long-Term Financing Arrangements
At December 31, 2011, we had the following resources available to obtain short-term or long-term financings ifwe need additional liquidity:
Registration Statements
We have a Form S-3 universal shelf registration statement and a Form S-4 acquisition shelf registrationstatement on file with the SEC. The universal shelf registration statement on Form S-3 permits Broadcom to sell, inone or more public offerings, shares of our Class A common stock, shares of preferred stock or debt securities, or any
51

combination of such securities, for proceeds in an aggregate amount of up to $1.50 billion. The 2018 Notes with anaggregate principal amount of $500 million that we issued in November 2011 (more fully described in Note 6 ofNotes to Consolidated Financial Statements) were issued pursuant to the Form S-3. The Form S-3 will expire inaccordance with applicable SEC rules on February 27, 2012. The acquisition shelf registration statement onForm S-4 enables us to issue up to 30 million shares of our Class A common stock in one or more acquisitiontransactions. These transactions may include the acquisition of assets, businesses or securities by any form of businesscombination. To date no securities have been issued pursuant to the S-4 registration statement, which does not havean expiration date mandated by SEC rules.
Credit Facility
In November 2010 we entered into a credit facility with certain institutional lenders that provides for unsecuredrevolving facility loans, swing line loans and letters of credit in an aggregate amount of up to $500 million. Weamended this credit facility in October 2011 primarily to extend the maturity date by two years to November 19,2016, at which time all outstanding revolving facility loans (if any) and accrued and unpaid interest must be repaid.The amendment to the credit facility also decreased the interest rate margins applicable to loans made under thecredit facility and the commitment fee paid on the amount of the unused commitments. We did not draw on ourcredit facility in 2011 or 2010.
The credit facility contains customary representations, warranties and covenants. Financial covenants require usto maintain a consolidated leverage ratio of no more than 3.25 to 1.00 and a consolidated interest coverage ratio ofno less than 3.00 to 1.00.
We were in compliance with all debt covenants as of December 31, 2011.
Senior Notes
The following table summarizes the principal amount of our senior unsecured notes:December 31,
Increase2011 2010
(In millions)
1.500% fixed-rate notes, due 2013 . . . . . . . . . . . . . . . . . . . . . . . . . . . . . . . $ 300 $300 $ —
2.375% fixed-rate notes, due 2015 . . . . . . . . . . . . . . . . . . . . . . . . . . . . . . . 400 400 —
2.700% fixed-rate notes, due 2018 . . . . . . . . . . . . . . . . . . . . . . . . . . . . . . . 500 — 500
Total . . . . . . . . . . . . . . . . . . . . . . . . . . . . . . . . . . . . . . . . . . . . . . . . . . . . . . $1,200 $700 $500
In November 2010 we issued senior unsecured notes in an aggregate principal amount of $700 million. Thesenotes consist of $300 million aggregate principal amount which mature in November 2013, or the 2013 Notes, andbear interest at a fixed rate of 1.500% per annum, and $400 million aggregate principal amount which mature inNovember 2015, or the 2015 Notes, and bear interest at a fixed rate of 2.375% per annum. Proceeds from theissuance of the 2013 Notes and the 2015 Notes were utilized for general corporate purposes.
In November 2011 we issued senior unsecured notes in aggregate principal amount of $500 million whichmature in November 2018 and bear interest at a fixed rate of 2.700% per annum, or the 2018 Notes. Proceeds fromthe 2018 Notes are expected to fund a portion of the acquisition consideration for NetLogic.
The 2018 Notes are subject to a mandatory redemption in the event Broadcom’s proposed acquisition ofNetLogic is not consummated on or prior to August 31, 2012, or if prior to August 31, 2012, the Agreement andPlan of Merger is terminated. In such an event, the 2018 Notes will be redeemed for cash at a price equal to 101% ofthe aggregate principle amount plus accrued and unpaid interest.
The Notes contain a number of restrictive covenants, including, but not limited to, restrictions on our ability togrant liens on assets; enter into sale and lease-back transactions; or merge, consolidate or sell assets. Failure to complywith these covenants, or any other event of default, could result in acceleration of the principal amount and accruedand unpaid interest on the Notes.
52

We were in compliance with all debt covenants as of December 31, 2011.
See Note 6 of Notes to Consolidated Financial Statements for additional discussion on our financingarrangements.
Other Notes and Borrowings
We had no other significant notes or borrowings as of December 31, 2011.
Obligations and Commitments
The following table summarizes our contractual obligations and commitments as of December 31, 2011:Payment Obligations by Year
2012 2013 2014 2015 2016 Thereafter Total
(In millions)
Operating leases . . . . . . . . . . . . . . . . . . . . . . . . . . . . . . . $121 $120 $ 90 $ 76 $ 69 $123 $ 599Inventory and related purchase obligations . . . . . . . . . . . 468 — — — — — 468Other obligations . . . . . . . . . . . . . . . . . . . . . . . . . . . . . . 147 35 31 30 23 3 269Long-term debt and related interest . . . . . . . . . . . . . . . . 27 328 23 423 13 527 1,341
$763 $483 $144 $529 $105 $653 $2,677
We lease our facilities and certain engineering design tools and information systems equipment under operatinglease agreements. Our leased facilities comprise an aggregate of 3.6 million square feet. Our principal facilities inIrvine have lease terms that expire at various dates through 2017 with an aggregate rent of $130 million (included inthe table above).
Inventory and related purchase obligations represent purchase commitments for silicon wafers and assembly andtest services. We depend upon third party subcontractors to manufacture our silicon wafers and provide assembly andtest services. Due to lengthy subcontractor lead times, we must order these materials and services from subcontractorswell in advance. We expect to receive and pay for these materials and services within the ensuing six months. Oursubcontractor relationships typically allow for the cancellation of outstanding purchase orders, but require payment ofall expenses incurred through the date of cancellation. To date we have not incurred significant cancellation charges.
Other obligations represent purchase commitments for lab test equipment, computer hardware, informationsystems infrastructure, mask and prototyping costs, intellectual property licensing arrangements and othercommitments made in the ordinary course of business.
For purposes of the table above, obligations for the purchase of goods or services are defined as agreements thatare enforceable and legally binding and that specify all significant terms, including: fixed or minimum quantities tobe purchased; fixed, minimum or variable price provisions; and the approximate timing of the transaction. Ourpurchase orders are based on our current manufacturing needs and are typically fulfilled by our vendors within arelatively short time horizon. We have additional purchase orders (not included in the table above) that representauthorizations to purchase rather than binding agreements. We do not have significant agreements for the purchaseof inventories or other goods specifying minimum quantities or set prices that exceed our expected requirements.
Unrecognized tax benefits were $212 million, of which $25 million would result in potential cash payment oftaxes and $187 million would result in a reduction in net operating loss and tax credit carryforwards. We are notincluding any amount related to uncertain tax positions in the table presented above because of the difficulty inmaking reasonably reliable estimates of the timing of settlements with the respective taxing authorities. In addition tothe unrecognized tax benefits, we have also recorded a liability for potential tax penalties and interest of $11 millionand $3 million, respectively, at December 31, 2011.
Prospective Capital Needs
We believe that our existing cash, cash equivalents and marketable securities, together with cash generated fromoperations and from the issuance of common stock through our employee stock option and purchase plans, will be
53

sufficient to cover our working capital needs, capital expenditures, investment requirements, commitments,repurchases of our Class A common stock and quarterly dividends for at least the next 12 months. However, it ispossible that we may choose to raise additional funds or draw on our existing credit facility to finance our activitiesbeyond the next 12 months or to consummate acquisitions of other businesses, assets, products or technologies,including our pending acquisition of NetLogic. If needed, we may be able to raise such funds by selling equity ordebt securities to the public or to selected investors, or by borrowing money from financial institutions. We couldalso reduce certain expenditures, such as repurchases of our Class A common stock.
We expect our acquisition of NetLogic for $50 per share, or approximately $3.7 billion, net of cash assumed, toclose in the first half of 2012. We currently expect to fund the acquisition with our available cash and cashequivalents and marketable securities.
We earn a significant amount of our operating income outside the U.S., which is deemed to be permanentlyreinvested in foreign jurisdictions. For at least the next 12 months, we have sufficient cash in the U.S. and expectdomestic cash flow to sustain our operating activities and cash commitments for investing and financing activities,such as acquisitions, quarterly dividends, share buy-backs and repayment of debt. In addition, we expect existingforeign cash, cash equivalents, short-term investments, and cash flows from operations to continue to be sufficient tofund our foreign operating activities and cash commitments for investing activities, such as material capitalexpenditures, for at least the next 12 months.
If we require more capital in the U.S. than is generated by our domestic operations, any taxable income thatcould result from the repatriation of our foreign earnings would be offset by our net operating loss and research anddevelopment tax credit carryforwards, which are currently subject to a full valuation allowance on our deferred taxassets, and would not be expected to have a material effect on our tax liabilities.
In addition, even though we may not need additional funds, we may still elect to sell additional equity or debtsecurities or utilize or increase our existing credit facilities for other reasons. However, we may not be able to obtainadditional funds on a timely basis at acceptable terms, if at all. If we raise additional funds by issuing additionalequity or convertible debt securities, the ownership percentages of existing shareholders would be reduced. Inaddition, the equity or debt securities that we issue may have rights, preferences or privileges senior to those of ourClass A common stock.
As of December 31, 2011 we have approximately $1.93 billion of cash, cash equivalents, and marketablesecurities held by our foreign subsidiaries. As a result of the June 30, 2011 closing of our IRS audit and agreedadjustments to income for the 2001 through 2006 tax years, $802 million was paid from our foreign subsidiaries toBroadcom Corporation during the three months ended September 30, 2011. This amount was not subject toadditional income tax. The income resulting from the IRS adjustments was offset by net operating loss carryforwards.Any potential additional income, which could result if we were to repatriate the remaining $1.93 billion of foreigncash, cash equivalents and marketable securities would be offset by existing net operating loss and research anddevelopment tax credit carryforwards and should not have a material effect on our tax liabilities. Our net operatingloss and research and development tax credit carryforwards are currently subject to a full valuation allowance.
Although we believe that we have sufficient capital to fund our activities for at least the next 12 months, ourfuture capital requirements may vary materially from those now planned. We anticipate that the amount of capital wewill need in the future will depend on many factors, including:
• general economic and specific conditions in the markets we address, including the continuing volatility in thetechnology sector and semiconductor industry, trends in the wired and wireless communications markets invarious geographic regions, including seasonality in sales of consumer products into which our products areincorporated;
• acquisitions of businesses, assets, products or technologies;• the unavailability of credit and financing, which may lead certain of our customers to reduce their levels of
purchases or to seek credit or other accommodations from us;• litigation expenses, settlements and judgments;• the overall levels of sales of our semiconductor products, licensing revenue, income from the Qualcomm
Agreement and product gross margins;
54

• our business, product, capital expenditure and research and development plans, and product and technologyroadmaps;
• the market acceptance of our products;• payment of cash dividends;• required levels of research and development and other operating costs;• repurchases of our Class A common stock;• volume price discounts and customer rebates;• intellectual property disputes, customer indemnification claims and other types of litigation risks;• the levels of inventory and accounts receivable that we maintain;• licensing royalties payable by us;• changes in our compensation policies;• the issuance of restricted stock units and the related cash payments we make for withholding taxes due from
employees;• capital improvements for new and existing facilities;• technological advances;• our competitors’ responses to our products and our anticipation of and responses to their products;• our relationships with suppliers and customers;• the availability and cost of sufficient foundry, assembly and test capacity and packaging materials; and• the level of exercises of stock options and stock purchases under our employee stock purchase plan.
In addition, we may require additional capital to accommodate planned future long-term growth, hiring,infrastructure and facility needs.
Off-Balance Sheet Arrangements
At December 31, 2011 we had no material off-balance sheet arrangements not fully recorded on ourconsolidated balance sheets or fully disclosed in the notes to our consolidated financial statements.
Item 7A. Quantitative and Qualitative Disclosures about Market Risk
Interest Rate Risk
We manage our total portfolio to encompass a diversified pool of investment-grade securities to preserve principaland maintain liquidity. The average credit rating of our marketable securities portfolio by major credit rating agencieswas Aa2/AA. Investments in both fixed rate and floating rate instruments carry a degree of interest rate risk. Fixed ratesecurities may have their market value adversely impacted due to an increase in interest rates, while floating ratesecurities may produce less income than expected if interest rates fall. Due in part to these factors, our futureinvestment income, net, may fall short of expectations due to changes in interest rates or if the decline in fair value ofour publicly traded fixed income investments is judged to be other-than-temporary. We may suffer losses in principal ifwe are forced to sell securities that have declined in market value due to changes in interest rates. However, because anyfixed income securities we hold are classified as available-for-sale, no gains or losses are realized in the income statementdue to changes in interest rates unless such securities are sold prior to maturity or unless declines in value aredetermined to be other-than-temporary. These securities are reported at fair value with the related unrealized gains andlosses included in accumulated other comprehensive income (loss), a component of shareholders’ equity, net of tax.
In the current interest rate environment, as short-term investments mature, reinvestment occurs at less favorablemarket rates. Given the short-term nature of certain investments, the current interest rate environment may continueto negatively impact our investment income.
To assess the interest rate risk associated with our investment portfolio, we performed a sensitivity analysis todetermine the impact a change in interest rates would have on the value of the investment portfolio assuming a 100basis point parallel shift in the yield curve. Based on investment positions as of December 31, 2011, a 100 basis pointincrease in interest rates across all maturities would result in a $9 million incremental decline in the fair market valueof the portfolio. As of December 31, 2010, a similar 100 basis point increase in interest rates across all maturitieswould result in a $23 million incremental decline in the fair market value of the portfolio. Such losses would only berealized if we sold the investments prior to maturity.
55

Actual future gains and losses associated with our investments may differ from the sensitivity analyses performedas of December 31, 2011 due to the inherent limitations associated with predicting the changes in the timing andlevel of interest rates and our actual exposures and positions.
A hypothetical increase of 100 basis points in short-term interest rates would not have a material impact on ourrevolving credit facility, which bears a floating interest rate. This sensitivity analysis assumes all other variables willremain constant in future periods.
Our Senior Notes bear fixed interest rates, and therefore, would not be subject to interest rate risk.
Exchange Rate Risk
We consider our direct exposure to foreign exchange rate fluctuations to be minimal. Currently, sales tocustomers and arrangements with third-party manufacturers provide for pricing and payment in United Statesdollars, and, therefore, are not subject to exchange rate fluctuations. Increases in the value of the United States’ dollarrelative to other currencies could make our products more expensive, which could negatively impact our ability tocompete. Conversely, decreases in the value of the United States dollar relative to other currencies could result in oursuppliers raising their prices to continue doing business with us. Fluctuations in currency exchange rates could affectour business in the future.
Other Risks
We believe we do not have material direct or indirect exposure to European sovereign or non-sovereign debt.
Item 8. Financial Statements and Supplementary Data
The financial statements and supplementary data required by this item are included in Part IV, Item 15 of thisReport.
Item 9. Changes in and Disagreements with Accountants on Accounting and Financial Disclosure
None.
Item 9A. Controls and Procedures
We are committed to maintaining disclosure controls and procedures designed to ensure that informationrequired to be disclosed in our periodic reports filed under the Securities Exchange Act of 1934, as amended, or theExchange Act, is recorded, processed, summarized and reported within the time periods specified in the SEC’s rulesand forms, and that such information is accumulated and communicated to our management, including our ChiefExecutive Officer and Chief Financial Officer, as appropriate, to allow for timely decisions regarding requireddisclosure. In designing and evaluating our disclosure controls and procedures, management recognizes that anycontrols and procedures, no matter how well designed and operated, can provide only reasonable assurance ofachieving the desired control objectives, and management necessarily is required to apply its judgment in evaluatingthe cost-benefit relationship of possible controls and procedures and implementing controls and procedures based onthe application of management’s judgment.
Under the supervision and with the participation of our management, including our Chief Executive Officerand Chief Financial Officer, we conducted an evaluation of our disclosure controls and procedures, as such term isdefined under Rules 13a-15(e) and 15d-15(e) promulgated under the Exchange Act. Based on this evaluation, ourChief Executive Officer and our Chief Financial Officer concluded that our disclosure controls and procedures wereeffective at a reasonable assurance level as of December 31, 2011, the end of the period covered by this Report.
There has been no change in our internal control over financial reporting (as defined in Rules 13a-15(f) and15d-15(f) of the Exchange Act) during the three months ended December 31, 2011 that has materially affected, or isreasonably likely to materially affect, our internal control over financial reporting.
56

Inherent Limitations on Internal Control
A control system, no matter how well conceived and operated, can provide only reasonable, not absolute,assurance that the objectives of the control system are met. Further, the benefits of controls must be consideredrelative to their costs. Because of the inherent limitations in all control systems, no evaluation of controls can provideabsolute assurance that all control issues and instances of management override or improper acts, if any, have beendetected. These inherent limitations include the realities that judgments in decision making can be faulty, and thatbreakdowns can occur because of simple errors or mistakes. Additionally, controls can be circumvented by theindividual acts of some persons, by collusion of two or more people, or by management override of the control. Thedesign of any system of controls is also based in part upon certain assumptions about the likelihood of future events,and there can be no assurance that any design will succeed in achieving its stated goals under all potential futureconditions. Because of the inherent limitations in a cost-effective control system, misstatements due to managementoverride, error or improper acts may occur and not be detected. Any resulting misstatement or loss may have anadverse and material effect on our business, financial condition and results of operations.
Management’s Report on Internal Control over Financial Reporting
Our management is responsible for establishing and maintaining adequate internal control over financialreporting, as such term is defined in Exchange Act Rule 13a-15(f). Under the supervision and with the participationof our management, including our principal executive officer and principal financial officer, we conducted anevaluation of the effectiveness of our internal control over financial reporting based on the framework set forth inInternal Control — Integrated Framework issued by the Committee of Sponsoring Organizations of the TreadwayCommission. Based on our evaluation under the framework set forth in Internal Control — Integrated Framework,our management concluded that our internal control over financial reporting was effective as of December 31, 2011.The effectiveness of our internal control over financial reporting as of December 31, 2011 has been audited byKPMG LLP, an independent registered public accounting firm, as stated in their report which is included in Part IV.
Item 9B. Other Information
None.
57

PART III
Item 10. Directors, Executive Officers and Corporate Governance
(a) Identification and Business Experience of Directors; Involvement in Certain Legal Proceedings. Theinformation under the caption “Election of Directors,” appearing in our Definitive Proxy Statement to be filed withthe Securities and Exchange Commission in connection with the 2012 Annual Meeting of Shareholders, referred toas the 2012 Proxy Statement, is hereby incorporated by reference.
(b) Identification and Business Experience of Executive Officers and Certain Significant Employees. Theinformation under the caption “Executive Compensation and Other Information — Executive Officers and KeyEmployees,” appearing in the 2012 Proxy Statement, is hereby incorporated by reference.
(c) Compliance with Section 16(a) of the Exchange Act. The information under the caption “Ownership ofSecurities — Section 16(a) Beneficial Ownership Reporting Compliance,” appearing in the 2012 Proxy Statement, ishereby incorporated by reference.
(d) Code of Ethics. The information under the caption “Corporate Governance and Board Matters,” appearingin the 2012 Proxy Statement, is hereby incorporated by reference.
(e) Audit Committee. The information under the caption “Corporate Governance and Board Matters — AuditCommittee,” appearing in the 2012 Proxy Statement, is hereby incorporated by reference.
Item 11. Executive Compensation
The information under the caption “Executive Compensation and Other Information” and “CorporateGovernance and Board Matters — Compensation of Non-Employee Directors,” appearing in the 2012 ProxyStatement, is hereby incorporated by reference.
Item 12. Security Ownership of Certain Beneficial Owners and Management and Related Stockholder Matters
The information under the captions “Equity Compensation Plan Information” and “Ownership of Securities,”appearing in the 2012 Proxy Statement, is hereby incorporated by reference.
Item 13. Certain Relationships and Related Transactions, and Director Independence
The information under the captions “Certain Relationships and Related Transactions” and “CorporateGovernance and Board Matter — Director Independence” appearing in the 2012 Proxy Statement, is herebyincorporated by reference.
Item 14. Principal Accounting Fees and Services
The information under the caption “Audit Information — Fees Paid to Independent Registered PublicAccounting Firm,” appearing in the 2012 Proxy Statement, is hereby incorporated by reference.
58

PART IV
Item 15. Exhibits, Financial Statement Schedules
(a) 1. Financial Statements.
The following Broadcom consolidated financial statements, and related notes thereto, and the related Reports ofour Independent Registered Public Accounting Firm are filed as part of this Form 10-K:
Page
Reports of Independent Registered Public Accounting Firm . . . . . . . . . . . . . . . . . . . . . . . . . . . . . . . . . . . . . . . F-1
Consolidated Balance Sheets as of December 31, 2011 and 2010 . . . . . . . . . . . . . . . . . . . . . . . . . . . . . . . . . . . F-3
Consolidated Statements of Income for the years ended December 31, 2011, 2010 and 2009 . . . . . . . . . . . . . . F-4
Consolidated Statements of Shareholders’ Equity and Comprehensive Income for the years endedDecember 31, 2011, 2010 and 2009 . . . . . . . . . . . . . . . . . . . . . . . . . . . . . . . . . . . . . . . . . . . . . . . . . . . . . . . F-5
Consolidated Statements of Cash Flows for the years ended December 31, 2011, 2010 and 2009 . . . . . . . . . . . F-6
Notes to Consolidated Financial Statements . . . . . . . . . . . . . . . . . . . . . . . . . . . . . . . . . . . . . . . . . . . . . . . . . . . F-7
2. Financial Statement Schedules.
The following financial statement schedule of Broadcom is filed as part of this Form 10-K:
Page
Schedule II — Consolidated Valuation and Qualifying Accounts . . . . . . . . . . . . . . . . . . . . . . . . . . . . . . . . . . . S-1
All other schedules have been omitted because they are not applicable or not required, or the information isincluded in the Consolidated Financial Statements or Notes thereto.
3. Exhibits.
The exhibits listed on the accompanying index to exhibits immediately following the financial statements arefiled as part of, or hereby incorporated by reference into, this Report.
59

[THIS PAGE INTENTIONALLY LEFT BLANK]

Report of Independent Registered Public Accounting Firm
The Board of Directors and ShareholdersBroadcom Corporation:
We have audited the accompanying consolidated balance sheets of Broadcom Corporation and subsidiaries as ofDecember 31, 2011 and 2010, and the related consolidated statements of income, shareholders’ equity andcomprehensive income, and cash flows for each of the years in the three-year period ended December 31, 2011. Inconnection with our audits of the consolidated financial statements, we also have audited the consolidated financialstatement schedule of valuation and qualifying accounts. These consolidated financial statements and financialstatement schedule are the responsibility of the Company’s management. Our responsibility is to express an opinionon these consolidated financial statements and financial statement schedule based on our audits.
We conducted our audits in accordance with the standards of the Public Company Accounting Oversight Board(United States). Those standards require that we plan and perform the audit to obtain reasonable assurance aboutwhether the financial statements are free of material misstatement. An audit includes examining, on a test basis,evidence supporting the amounts and disclosures in the financial statements. An audit also includes assessing theaccounting principles used and significant estimates made by management, as well as evaluating the overall financialstatement presentation. We believe that our audits provide a reasonable basis for our opinion.
In our opinion, the consolidated financial statements referred to above present fairly, in all material respects, thefinancial position of Broadcom Corporation and subsidiaries as of December 31, 2011 and 2010, and the results oftheir operations and their cash flows for each of the years in the three-year period ended December 31, 2011, inconformity with U.S. generally accepted accounting principles. Also, in our opinion, the related consolidatedfinancial statement schedule, when considered in relation to the basic consolidated financial statements taken as awhole, presents fairly, in all material respects, the information set forth therein.
As discussed in Note 1 to the consolidated financial statements, in 2011 the Company adopted the provisions ofFASB Accounting Standards Codification (ASC) Topic 350, Testing Goodwill for Impairment, and in 2010 theCompany adopted the provisions of FASB ASC Topic 605, Multiple-Deliverable Revenue Arrangements, and FASBASC Topic 985, Certain Revenue Arrangements That Include Software Elements.
We also have audited, in accordance with the standards of the Public Company Accounting Oversight Board (UnitedStates), Broadcom Corporation’s internal control over financial reporting as of December 31, 2011, based on criteriaestablished in Internal Control — Integrated Framework issued by the Committee of Sponsoring Organizations of theTreadway Commission (COSO), and our report dated February 1, 2012, expressed an unqualified opinion on theeffectiveness of the Company’s internal control over financial reporting.
/s/ KPMG LLP
Irvine, CaliforniaFebruary 1, 2012
F-1

Report of Independent Registered Public Accounting Firm
The Board of Directors and ShareholdersBroadcom Corporation:
We have audited Broadcom Corporation’s internal control over financial reporting as of December 31, 2011, basedon criteria established in Internal Control — Integrated Framework issued by the Committee of SponsoringOrganizations of the Treadway Commission (COSO). Broadcom Corporation’s management is responsible formaintaining effective internal control over financial reporting and for its assessment of the effectiveness of internalcontrol over financial reporting, included in the accompanying Management’s Report on Internal Control overFinancial Reporting appearing under Item 9A. Our responsibility is to express an opinion on the Company’s internalcontrol over financial reporting based on our audit.
We conducted our audit in accordance with the standards of the Public Company Accounting Oversight Board(United States). Those standards require that we plan and perform the audit to obtain reasonable assurance aboutwhether effective internal control over financial reporting was maintained in all material respects. Our audit includedobtaining an understanding of internal control over financial reporting, assessing the risk that a material weaknessexists, and testing and evaluating the design and operating effectiveness of internal control based on the assessed risk.Our audit also included performing such other procedures as we considered necessary in the circumstances. Webelieve that our audit provides a reasonable basis for our opinion.
A company’s internal control over financial reporting is a process designed to provide reasonable assurance regardingthe reliability of financial reporting and the preparation of financial statements for external purposes in accordancewith generally accepted accounting principles. A company’s internal control over financial reporting includes thosepolicies and procedures that (1) pertain to the maintenance of records that, in reasonable detail, accurately and fairlyreflect the transactions and dispositions of the assets of the company; (2) provide reasonable assurance thattransactions are recorded as necessary to permit preparation of financial statements in accordance with generallyaccepted accounting principles, and that receipts and expenditures of the company are being made only in accordancewith authorizations of management and directors of the company; and (3) provide reasonable assurance regardingprevention or timely detection of unauthorized acquisition, use, or disposition of the company’s assets that couldhave a material effect on the financial statements.
Because of its inherent limitations, internal control over financial reporting may not prevent or detect misstatements.Also, projections of any evaluation of effectiveness to future periods are subject to the risk that controls may becomeinadequate because of changes in conditions, or that the degree of compliance with the policies or procedures maydeteriorate.
In our opinion, Broadcom Corporation maintained, in all material respects, effective internal control over financialreporting as of December 31, 2011, based on criteria established in Internal Control — Integrated Framework issuedby the Committee of Sponsoring Organizations of the Treadway Commission (COSO).
We also have audited, in accordance with the standards of the Public Company Accounting Oversight Board (UnitedStates), the consolidated balance sheets of Broadcom Corporation and subsidiaries as of December 31, 2011 and2010, and the related consolidated statements of income, shareholders’ equity and comprehensive income, and cashflows for each of the years in the three-year period ended December 31, 2011, and our report dated February 1,2012, expressed an unqualified opinion on those consolidated financial statements.
/s/ KPMG LLP
Irvine, CaliforniaFebruary 1, 2012
F-2

CONSOLIDATED BALANCE SHEETS(In millions, except par value)
December 31,
2011 2010
AssetsCurrent assets:Cash and cash equivalents . . . . . . . . . . . . . . . . . . . . . . . . . . . . . . . . . . . . . . . . . . . . . . . . . . . . $ 4,146 $ 1,622Short-term marketable securities . . . . . . . . . . . . . . . . . . . . . . . . . . . . . . . . . . . . . . . . . . . . . . . 383 1,035Accounts receivable (net of allowance for doubtful accounts of $9 in 2011 and $9 in
2010) . . . . . . . . . . . . . . . . . . . . . . . . . . . . . . . . . . . . . . . . . . . . . . . . . . . . . . . . . . . . . . . . . . 678 820Inventory . . . . . . . . . . . . . . . . . . . . . . . . . . . . . . . . . . . . . . . . . . . . . . . . . . . . . . . . . . . . . . . . . 421 598Prepaid expenses and other current assets . . . . . . . . . . . . . . . . . . . . . . . . . . . . . . . . . . . . . . . . 124 109
Total current assets . . . . . . . . . . . . . . . . . . . . . . . . . . . . . . . . . . . . . . . . . . . . . . . . . . . . . . . 5,752 4,184Property and equipment, net . . . . . . . . . . . . . . . . . . . . . . . . . . . . . . . . . . . . . . . . . . . . . . . . . . 368 266Long-term marketable securities . . . . . . . . . . . . . . . . . . . . . . . . . . . . . . . . . . . . . . . . . . . . . . . 676 1,401Goodwill . . . . . . . . . . . . . . . . . . . . . . . . . . . . . . . . . . . . . . . . . . . . . . . . . . . . . . . . . . . . . . . . . 1,787 1,677Purchased intangible assets, net . . . . . . . . . . . . . . . . . . . . . . . . . . . . . . . . . . . . . . . . . . . . . . . . 400 366Other assets . . . . . . . . . . . . . . . . . . . . . . . . . . . . . . . . . . . . . . . . . . . . . . . . . . . . . . . . . . . . . . . 57 50
Total assets . . . . . . . . . . . . . . . . . . . . . . . . . . . . . . . . . . . . . . . . . . . . . . . . . . . . . . . . . . . . . $ 9,040 $ 7,944
Liabilities and Shareholders’ EquityCurrent liabilities:Accounts payable . . . . . . . . . . . . . . . . . . . . . . . . . . . . . . . . . . . . . . . . . . . . . . . . . . . . . . . . . . . $ 442 $ 604Wages and related benefits . . . . . . . . . . . . . . . . . . . . . . . . . . . . . . . . . . . . . . . . . . . . . . . . . . . . 175 208Deferred revenue and income . . . . . . . . . . . . . . . . . . . . . . . . . . . . . . . . . . . . . . . . . . . . . . . . . 21 55Accrued liabilities . . . . . . . . . . . . . . . . . . . . . . . . . . . . . . . . . . . . . . . . . . . . . . . . . . . . . . . . . . 461 404
Total current liabilities . . . . . . . . . . . . . . . . . . . . . . . . . . . . . . . . . . . . . . . . . . . . . . . . . . . . 1,099 1,271Long-term debt . . . . . . . . . . . . . . . . . . . . . . . . . . . . . . . . . . . . . . . . . . . . . . . . . . . . . . . . . . . . 1,196 697Other long-term liabilities . . . . . . . . . . . . . . . . . . . . . . . . . . . . . . . . . . . . . . . . . . . . . . . . . . . . 224 150Commitments and contingenciesShareholders’ equity:
Convertible preferred stock, $.0001 par value:Authorized shares — 6 — none issued and outstanding . . . . . . . . . . . . . . . . . . . . . . . . . . . — —Class A common stock, $.0001 par value:Authorized shares — 2,500Issued and outstanding shares — 492 in 2011 and 485 in 2010 . . . . . . . . . . . . . . . . . . . . . — —Class B common stock, $.0001 par value:Authorized shares — 400Issued and outstanding shares — 53 in 2011 and 54 in 2010 . . . . . . . . . . . . . . . . . . . . . . . — —
Additional paid-in capital . . . . . . . . . . . . . . . . . . . . . . . . . . . . . . . . . . . . . . . . . . . . . . . . . . . . 11,821 11,994Accumulated deficit . . . . . . . . . . . . . . . . . . . . . . . . . . . . . . . . . . . . . . . . . . . . . . . . . . . . . . . . . (5,250) (6,177)Accumulated other comprehensive income (loss) . . . . . . . . . . . . . . . . . . . . . . . . . . . . . . . . . . . (50) 9
Total shareholders’ equity . . . . . . . . . . . . . . . . . . . . . . . . . . . . . . . . . . . . . . . . . . . . . . . . . . 6,521 5,826
Total liabilities and shareholders’ equity . . . . . . . . . . . . . . . . . . . . . . . . . . . . . . . . . . . . . . . $ 9,040 $ 7,944
See accompanying notes.
F-3

CONSOLIDATED STATEMENTS OF INCOME(In millions, except per share data)
Year Ended December 31,
2011 2010 2009
Net revenue:
Product revenue . . . . . . . . . . . . . . . . . . . . . . . . . . . . . . . . . . . . . . . . . . . . . . . . . . . $7,160 $6,589 $4,273
Income from Qualcomm Agreement (see Note 2) . . . . . . . . . . . . . . . . . . . . . . . . . 207 207 171
Licensing revenue . . . . . . . . . . . . . . . . . . . . . . . . . . . . . . . . . . . . . . . . . . . . . . . . . . 22 22 46
Total net revenue . . . . . . . . . . . . . . . . . . . . . . . . . . . . . . . . . . . . . . . . . . . . . . . . 7,389 6,818 4,490
Costs and expenses:
Cost of product revenue . . . . . . . . . . . . . . . . . . . . . . . . . . . . . . . . . . . . . . . . . . . . . 3,626 3,284 2,211
Research and development . . . . . . . . . . . . . . . . . . . . . . . . . . . . . . . . . . . . . . . . . . . 1,983 1,762 1,535
Selling, general and administrative . . . . . . . . . . . . . . . . . . . . . . . . . . . . . . . . . . . . . 682 590 479
Amortization of purchased intangible assets . . . . . . . . . . . . . . . . . . . . . . . . . . . . . . 30 28 15
Impairment of long-lived assets . . . . . . . . . . . . . . . . . . . . . . . . . . . . . . . . . . . . . . . 92 19 19
Settlement costs (gains), net . . . . . . . . . . . . . . . . . . . . . . . . . . . . . . . . . . . . . . . . . . (18) 53 118
Restructuring costs, net . . . . . . . . . . . . . . . . . . . . . . . . . . . . . . . . . . . . . . . . . . . . . 16 — 7
Charitable contributions . . . . . . . . . . . . . . . . . . . . . . . . . . . . . . . . . . . . . . . . . . . . 25 — 50
Total operating costs and expenses . . . . . . . . . . . . . . . . . . . . . . . . . . . . . . . . . . . 6,436 5,736 4,434
Income from operations . . . . . . . . . . . . . . . . . . . . . . . . . . . . . . . . . . . . . . . . . . . . . . . 953 1,082 56
Interest income (expense), net . . . . . . . . . . . . . . . . . . . . . . . . . . . . . . . . . . . . . . . . . . (5) 9 14
Other income, net . . . . . . . . . . . . . . . . . . . . . . . . . . . . . . . . . . . . . . . . . . . . . . . . . . . 8 6 2
Income before income taxes . . . . . . . . . . . . . . . . . . . . . . . . . . . . . . . . . . . . . . . . . . . . 956 1,097 72
Provision for income taxes . . . . . . . . . . . . . . . . . . . . . . . . . . . . . . . . . . . . . . . . . . . . . 29 15 7
Net income . . . . . . . . . . . . . . . . . . . . . . . . . . . . . . . . . . . . . . . . . . . . . . . . . . . . . . . . $ 927 $1,082 $ 65
Net income per share (basic) . . . . . . . . . . . . . . . . . . . . . . . . . . . . . . . . . . . . . . . . . . . $ 1.72 $ 2.13 $ 0.13
Net income per share (diluted) . . . . . . . . . . . . . . . . . . . . . . . . . . . . . . . . . . . . . . . . . . $ 1.65 $ 1.99 $ 0.13
Weighted average shares (basic) . . . . . . . . . . . . . . . . . . . . . . . . . . . . . . . . . . . . . . . . . 539 508 494
Weighted average shares (diluted) . . . . . . . . . . . . . . . . . . . . . . . . . . . . . . . . . . . . . . . 563 545 513
Dividends per share . . . . . . . . . . . . . . . . . . . . . . . . . . . . . . . . . . . . . . . . . . . . . . . . . . $ 0.36 $ 0.32 $ —
The following table presents details of total stock-based compensation expense included in each functional lineitem in the consolidated statements of income above (see Note 9):
Years Ended December 31,
2011 2010 2009
(In millions)
Cost of product revenue . . . . . . . . . . . . . . . . . . . . . . . . . . . . . . . . . . . . . . . . . . . . . . . $ 24 $ 23 $ 25
Research and development . . . . . . . . . . . . . . . . . . . . . . . . . . . . . . . . . . . . . . . . . . . . . 364 341 352
Selling, general and administrative . . . . . . . . . . . . . . . . . . . . . . . . . . . . . . . . . . . . . . . 126 119 120
See accompanying notes.
F-4

CONSOLIDATED STATEMENTS OF SHAREHOLDERS’ EQUITY AND COMPREHENSIVE INCOME(In millions)
Common Stock AdditionalPaid-InCapital
AccumulatedDeficit
AccumulatedOther
ComprehensiveIncome(Loss)
TotalShareholders’
EquityShares Amount
Balance at December 31, 2008 . . . . . . . . . . . . . . . . 489 $— $10,930 $(7,324) $ 1 $3,607
Shares issued pursuant to stock awards, net . . . . . . . 16 — 59 — — 59
Employee stock purchase plan . . . . . . . . . . . . . . . . . 6 — 86 — — 86
Repurchases of Class A common stock . . . . . . . . . . . (15) — (422) — — (422)
Stock-based compensation expense . . . . . . . . . . . . . — — 500 — — 500
Components of comprehensive income:
Unrealized loss on marketable securities, net . . . . — — — — (4) (4)
Translation adjustments . . . . . . . . . . . . . . . . . . . . — — — — 1 1
Net income . . . . . . . . . . . . . . . . . . . . . . . . . . . . . — — — 65 — 65
Comprehensive income . . . . . . . . . . . . . . . . . . . . . . — — — — — 62
Balance at December 31, 2009 . . . . . . . . . . . . . . . . 496 — 11,153 (7,259) (2) 3,892
Shares issued pursuant to stock awards, net . . . . . . . 46 — 710 — — 710
Employee stock purchase plan . . . . . . . . . . . . . . . . . 6 — 93 — — 93
Repurchases of Class A common stock . . . . . . . . . . . (9) — (282) — — (282)
Dividends paid . . . . . . . . . . . . . . . . . . . . . . . . . . . . . — — (163) — — (163)
Stock-based compensation expense . . . . . . . . . . . . . — — 483 — — 483
Components of comprehensive income:
Unrealized loss on marketable securities, net . . . . — — — — (4) (4)
Translation adjustments . . . . . . . . . . . . . . . . . . . . — — — — 15 15
Net income . . . . . . . . . . . . . . . . . . . . . . . . . . . . . — — — 1,082 — 1,082
Comprehensive income . . . . . . . . . . . . . . . . . . . . . . — — — — — 1,093
Balance at December 31, 2010 . . . . . . . . . . . . . . . . 539 — 11,994 (6,177) 9 5,826
Shares issued pursuant to stock awards, net . . . . . . . 19 — 65 — — 65
Employee stock purchase plan . . . . . . . . . . . . . . . . . 4 — 111 — — 111
Repurchases of Class A common stock . . . . . . . . . . . (17) — (669) — — (669)
Dividends paid . . . . . . . . . . . . . . . . . . . . . . . . . . . . . (194) (194)
Stock-based compensation expense . . . . . . . . . . . . . — — 514 — — 514
Components of comprehensive income:
Unrealized loss on marketable securities, net . . . . — — — — 2 2
Translation adjustments, net of $9 tax benefit . . . — — — — (61) (61)
Net income . . . . . . . . . . . . . . . . . . . . . . . . . . . . . — — — 927 — 927
Comprehensive income . . . . . . . . . . . . . . . . . . . . . . — — — — — 868
Balance at December 31, 2011 . . . . . . . . . . . . . . . . 545 $— $11,821 $(5,250) $(50) $6,521
See accompanying notes.
F-5

CONSOLIDATED STATEMENTS OF CASH FLOWS(In millions)
Year Ended December 31,
2011 2010 2009
Operating activitiesNet income . . . . . . . . . . . . . . . . . . . . . . . . . . . . . . . . . . . . . . . . . . . . . . . . . . . . . . . . . $ 927 $ 1,082 $ 65Adjustments to reconcile net income to net cash provided by operating activities:Depreciation and amortization . . . . . . . . . . . . . . . . . . . . . . . . . . . . . . . . . . . . . . . . . . 108 79 74Stock-based compensation expense:
Stock options and other awards . . . . . . . . . . . . . . . . . . . . . . . . . . . . . . . . . . . . . . . 119 121 160Restricted stock units . . . . . . . . . . . . . . . . . . . . . . . . . . . . . . . . . . . . . . . . . . . . . . . 395 362 337
Acquisition-related items:Amortization of purchased intangible assets . . . . . . . . . . . . . . . . . . . . . . . . . . . . . . 84 59 31Impairment of goodwill and long-lived assets . . . . . . . . . . . . . . . . . . . . . . . . . . . . . 92 19 19
Gain on strategic investments, net . . . . . . . . . . . . . . . . . . . . . . . . . . . . . . . . . . . . . . . — (2) —Non-cash restructuring reversals, net . . . . . . . . . . . . . . . . . . . . . . . . . . . . . . . . . . . . . — — (2)Gain on sale of marketable securities . . . . . . . . . . . . . . . . . . . . . . . . . . . . . . . . . . . . . — — (1)Non-cash settlement gain . . . . . . . . . . . . . . . . . . . . . . . . . . . . . . . . . . . . . . . . . . . . . . (14) — —Changes in operating assets and liabilities:
Accounts receivable . . . . . . . . . . . . . . . . . . . . . . . . . . . . . . . . . . . . . . . . . . . . . . . . . 154 (287) (132)Inventory . . . . . . . . . . . . . . . . . . . . . . . . . . . . . . . . . . . . . . . . . . . . . . . . . . . . . . . . 207 (208) 12Prepaid expenses and other assets . . . . . . . . . . . . . . . . . . . . . . . . . . . . . . . . . . . . . . (28) 27 9Accounts payable . . . . . . . . . . . . . . . . . . . . . . . . . . . . . . . . . . . . . . . . . . . . . . . . . . (201) 146 123Deferred revenue and income . . . . . . . . . . . . . . . . . . . . . . . . . . . . . . . . . . . . . . . . . (33) (32) 72Accrued settlement costs . . . . . . . . . . . . . . . . . . . . . . . . . . . . . . . . . . . . . . . . . . . . . 21 (122) 171Other accrued and long-term liabilities . . . . . . . . . . . . . . . . . . . . . . . . . . . . . . . . . . 7 127 49
Net cash provided by operating activities . . . . . . . . . . . . . . . . . . . . . . . . . . . . . . . . 1,838 1,371 987
Investing activitiesNet purchases of property and equipment . . . . . . . . . . . . . . . . . . . . . . . . . . . . . . . . . (163) (109) (67)Net cash paid for acquired companies . . . . . . . . . . . . . . . . . . . . . . . . . . . . . . . . . . . . . (347) (599) (165)Purchases of strategic investments . . . . . . . . . . . . . . . . . . . . . . . . . . . . . . . . . . . . . . . . (2) (4) (2)Purchases of marketable securities . . . . . . . . . . . . . . . . . . . . . . . . . . . . . . . . . . . . . . . . (2,768) (2,934) (1,139)Proceeds from sales and maturities of marketable securities . . . . . . . . . . . . . . . . . . . . . 4,143 1,467 871
Net cash provided by (used in) investing activities . . . . . . . . . . . . . . . . . . . . . . . . . 863 (2,179) (502)
Financing activitiesIssuance of long-term debt, net . . . . . . . . . . . . . . . . . . . . . . . . . . . . . . . . . . . . . . . . . . 494 691 —Repurchases of Class A common stock . . . . . . . . . . . . . . . . . . . . . . . . . . . . . . . . . . . . (670) (280) (422)Dividends paid . . . . . . . . . . . . . . . . . . . . . . . . . . . . . . . . . . . . . . . . . . . . . . . . . . . . . . (194) (163) —Payment of assumed debt . . . . . . . . . . . . . . . . . . . . . . . . . . . . . . . . . . . . . . . . . . . . . . — (15) —Proceeds from issuance of common stock . . . . . . . . . . . . . . . . . . . . . . . . . . . . . . . . . . 348 936 227Minimum tax withholding paid on behalf of employees for restricted stock units . . . . (155) (136) (84)
Net cash provided by (used in) financing activities . . . . . . . . . . . . . . . . . . . . . . . . . (177) 1,033 (279)
Increase in cash and cash equivalents . . . . . . . . . . . . . . . . . . . . . . . . . . . . . . . . . . . . . 2,524 225 206Cash and cash equivalents at beginning of year . . . . . . . . . . . . . . . . . . . . . . . . . . . . . . 1,622 1,397 1,191
Cash and cash equivalents at end of year . . . . . . . . . . . . . . . . . . . . . . . . . . . . . . . . . . . $ 4,146 $ 1,622 $ 1,397
Supplemental disclosure of cash flow informationIncome taxes paid . . . . . . . . . . . . . . . . . . . . . . . . . . . . . . . . . . . . . . . . . . . . . . . . . . . . $ 23 $ 15 $ 17
Interest paid . . . . . . . . . . . . . . . . . . . . . . . . . . . . . . . . . . . . . . . . . . . . . . . . . . . . . . . . $ 14 $ — $ —
See accompanying notes.
F-6

NOTES TO CONSOLIDATED FINANCIAL STATEMENTSDecember 31, 2011
1. Summary of Significant Accounting Policies
Our Company
Broadcom Corporation (including our subsidiaries, referred to collectively in this Report as “Broadcom,” “we,”“our” and “us”) is a global innovation leader in semiconductor solutions for wired and wireless communications.Broadcom products seamlessly deliver voice, video, data and multimedia connectivity in the home, the office and themobile environment. We provide the industry’s broadest portfolio of state-of-the-art system-on-a-chip, or SoC, andsoftware solutions.
Basis of Presentation
Our consolidated financial statements include the accounts of Broadcom and our subsidiaries. All significantintercompany accounts and transactions have been eliminated in consolidation.
In 2011 we early adopted the provisions of Financial Accounting Standards Board, or FASB, AccountingStandards Codification (ASC) Topic 350, Testing Goodwill for Impairment. In 2010 we adopted the provisions ofFASB ASC Topic 605, Multiple-Deliverable Revenue Arrangement, and FASB ASC Topic 985, Certain RevenueArrangements That Include Software Elements. The adoption of these accounting standards did not have a materialimpact on our consolidated financial statements.
Foreign Currency
The functional currency for most of our international operations is the U.S. dollar. Assets and liabilitiesdenominated in foreign currencies are translated using the exchange rates on the balance sheet dates. Revenues andexpenses are translated using the average exchange rates prevailing during the year. Any translation adjustmentsresulting from this process are shown separately as a component of accumulated other comprehensive income (loss)within shareholders’ equity in the consolidated balance sheets. Foreign currency transaction gains and losses arereported in other income, net in the consolidated statements of income.
Use of Estimates
The preparation of financial statements in accordance with United States generally accepted accountingprinciples, or GAAP, requires management to make estimates and assumptions that affect the reported amounts ofassets and liabilities at the dates of the financial statements and the reported amounts of total net revenue andexpenses in the reporting periods. We regularly evaluate estimates and assumptions related to revenue recognition,rebates, allowances for doubtful accounts, sales returns and allowances, warranty obligations, inventory valuation,stock-based compensation expense, goodwill and purchased intangible asset valuations, strategic investments, deferredincome tax asset valuation allowances, uncertain tax positions, tax contingencies, self-insurance, restructuring costs orreversals, litigation and other loss contingencies. These estimates and assumptions are based on current facts,historical experience and various other factors that we believe to be reasonable under the circumstances, the results ofwhich form the basis for making judgments about the carrying values of assets and liabilities and the recording ofrevenue, costs and expenses that are not readily apparent from other sources. The actual results we experience maydiffer materially and adversely from our estimates. To the extent there are material differences between the estimatesand actual results, our future results of operations will be affected.
Revenue Recognition
We derive revenue principally from sales of integrated circuit products, royalties and license fees for ourintellectual property and software and related services. The timing of revenue recognition and the amount of revenueactually recognized for each arrangement depends upon a variety of factors, including the specific terms of eacharrangement and the nature of our deliverables and obligations. Determination of the appropriate amount of revenuerecognized involves judgments and estimates that we believe are reasonable, but actual results may differ from ourestimates. We recognize product revenue when all of the following criteria are met: (i) persuasive evidence of anarrangement exists, (ii) delivery has occurred, (iii) the price to the customer is fixed or determinable, and
F-7

(iv) collection of the resulting receivable is reasonably assured. These criteria are usually met at the time of productshipment. However, we do not recognize revenue when any future performance obligations remain. We recordreductions of revenue for estimated product returns and pricing adjustments, such as competitive pricing programsand rebates, in the same period that the related revenue is recorded. The amount of these reductions is based onhistorical sales returns, analysis of credit memo data, specific criteria included in rebate agreements, and other factorsknown at the time. We accrue 100% of potential rebates at the time of sale and do not apply a breakage factor. Wereverse the accrual for unclaimed rebate amounts as specific rebate programs contractually end and when we believeunclaimed rebates are no longer subject to payment and will not be paid. See Note 2 for a summary of our rebateactivity.
Multiple Element Arrangements Excluding Software
We occasionally enter into revenue arrangements that contain multiple deliverables. Judgment is required toproperly identify the accounting units of the multiple deliverable transactions and to determine the manner in whichrevenue should be allocated among the accounting units. Moreover, judgment is used in interpreting the commercialterms and determining when all criteria of revenue recognition have been met for each deliverable in order forrevenue recognition to occur in the appropriate accounting period. While changes in the allocation of thearrangement consideration between the units of accounting will not affect the amount of total revenue recognized fora particular sales arrangement, any material changes in these allocations could impact the timing of revenuerecognition, which could affect our results of operations. When we enter into an arrangement that includes multipleelements, the allocation of value to each element is derived based on management’s best estimate of selling price whenvendor specific evidence or third party evidence is unavailable.
Distributor Revenue
A portion of our product sales is made through distributors under agreements allowing for pricing credits and/orrights of return. These pricing credits and/or right of return provisions prevent us from being able to reasonablyestimate the final price of the inventory to be sold and the amount of inventory that could be returned pursuant tothese agreements. As a result, the fixed and determinable revenue recognition criterion has not been met at the timewe deliver products to our distributors. Accordingly, product revenue from sales made through these distributors isnot recognized until the distributors ship the product to their customers.
Software, Royalties and Cancellation Fee Revenue
Revenue from software licenses is recognized when all of the software revenue recognition criteria are met and, ifapplicable, when vendor specific objective evidence, or VSOE, exists to allocate the total license fee to each elementof multiple-element software arrangements, including post-contract customer support. Post-contract support isrecognized ratably over the support period. When a contract contains multiple elements wherein the only undeliveredelement is post-contract customer support and VSOE of the fair value of post-contract customer support does notexist, revenue from the entire arrangement is recognized ratably over the support period. Software royalty revenue isrecognized in arrears on a quarterly basis, based upon reports received from licensees during the period, unlesscollectability is not reasonably assured, in which case revenue is recognized when payment is received from thelicensee. Revenue from cancellation fees is recognized when cash is received from the customer.
Licensing Revenue
We license or otherwise provide rights to use portions of our intellectual property, which includes certain patentrights essential to and/or utilized in the manufacture and sale of certain wireless products. Licensees typically pay alicense fee in one or more installments and ongoing royalties based on their sales of products incorporating or using ourlicensed intellectual property. License fees are recognized over the estimated period of benefit to the licensee, typicallyfive to ten years. We recognize licensing revenue on the sale of patents when all of the following criteria are met:(i) persuasive evidence of an arrangement exist, (ii) delivery has occurred, (iii) the price to be paid by the purchaser isfixed or determinable and (iv) collection of the resulting accounts receivable is reasonably assured. These criteria areusually met at the time of patent transfer. We recognize royalty revenues based on royalties reported by licensees andwhen other revenue recognition criteria are met, which is generally a quarter in arrears from the period earned.
F-8

Income from the Qualcomm Agreement
On April 26, 2009 we entered into a four-year Settlement and Patent License and Non-Assert Agreement, orthe Qualcomm Agreement, with Qualcomm Incorporated, or Qualcomm. The Qualcomm Agreement is a multipleelement arrangement which includes: (i) an exchange of intellectual property rights, including in certaincircumstances, by a series of covenants not to assert claims of patent infringement under future patents issued withinone to four years of the execution date of the agreement, (ii) the assignment of certain existing patents by Broadcomto Qualcomm with Broadcom retaining a royalty-free license under these patents, and (iii) the settlement of alloutstanding litigation and claims between us and Qualcomm. The proceeds of the Qualcomm Agreement wereallocated amongst the principal elements of the transaction. A gain of $65 million from the settlement of litigationwas immediately recognized as a reduction in settlement costs that approximates the value of awards determined bythe United States District Court for the Central District of California. The remaining consideration waspredominantly associated with the transfer of current and future intellectual property rights and is being recognizedwithin net revenue over the performance period of four years as a single unit of accounting. However this income willbe limited to the lesser of the cumulative straight-line amortization over the four year performance period or thecumulative cash proceeds received.
Deferred Revenue and Income
We defer revenue and income when advance payments are received from customers before performanceobligations have been completed and/or services have been performed. Deferred revenue does not include amountsfrom products delivered to distributors that the distributors have not yet sold through to their end customers.
Cost of Product Revenue
Cost of product revenue comprises the cost of our semiconductor devices, which consists of the cost ofpurchasing finished silicon wafers manufactured by independent foundries, costs associated with our purchase ofassembly, test and quality assurance services and packaging materials for semiconductor products, as well as royaltiespaid to vendors for use of their technology. Also included in cost of product revenue is the amortization of purchasedtechnology, and manufacturing overhead, including costs of personnel and equipment associated with manufacturingsupport, product warranty costs, provisions for excess and obsolete inventories, and stock-based compensationexpense for personnel engaged in manufacturing support.
Concentration of Credit Risk
We sell the majority of our products throughout North America, Asia and Europe. Sales to our recurringcustomers are generally made on open account while sales to occasional customers are typically made on a prepaid orletter of credit basis. We perform periodic credit evaluations of our recurring customers and generally do not requirecollateral. An allowance for doubtful accounts is maintained for potential credit losses, which losses historically havenot been significant.
We invest our cash in U.S. Treasury instruments, in deposits and money market funds with major financialinstitutions and in commercial paper, asset-backed securities and corporate and agency bonds. We place our cashinvestments in instruments that meet high credit quality standards, as specified in our investment policy guidelines.These guidelines also limit the amount of credit exposure to any one issue, issuer or type of instrument. It is generallyour policy to invest in instruments that have a final maturity of no longer than three years, with a portfolio weightedaverage maturity of no longer than 18 months.
Fair Value of Financial Instruments
Our financial instruments consist principally of cash and cash equivalents, short- and long-term marketablesecurities, accounts receivable, accounts payable and long-term debt. The fair value of a financial instrument is theamount that would be received in an asset sale or paid to transfer a liability in an orderly transaction betweenunaffiliated market participants. The fair value of our long-term debt is determined by using estimated market prices.Assets and liabilities measured at fair value are categorized based on whether or not the inputs are observable in the
F-9

market and the degree that the inputs are observable. The categorization of financial instruments within the valuationhierarchy is based upon the lowest level of input that is significant to the fair value measurement. The hierarchy isprioritized into three levels (with Level 3 being the lowest) defined as follows:
Level 1: Inputs are based on quoted market prices for identical assets or liabilities in active markets at themeasurement date.
Level 2: Inputs include quoted prices for similar assets or liabilities in active markets and/or quoted pricesfor identical or similar assets or liabilities in markets that are not active near the measurement date.
Level 3: Inputs include management’s best estimate of what market participants would use in pricing theasset or liability at the measurement date. The inputs are unobservable in the market and significant to theinstrument’s valuation.
The fair value of the majority of our cash equivalents and marketable securities was determined based on “Level1” inputs. The fair value of certain marketable securities and our long-term debt were determined based on “Level 2”inputs. The valuation techniques used to measure the fair value of our “Level 2” instruments were valued based onquoted market prices or model driven valuations using significant inputs derived from or corroborated by observablemarket data. We do not have any marketable securities in the “Level 3” category. We believe that the recorded valuesof all our other financial instruments approximate their current fair values because of their nature and respectiverelatively short maturity dates or durations.
Cash, Cash Equivalents and Marketable Securities
We consider all highly liquid investments that are readily convertible into cash and have a maturity of threemonths or less at the time of purchase to be cash equivalents. The cost of these investments approximates their fairvalue. We maintain an investment portfolio of various security holdings, types and maturities. We define marketablesecurities as income yielding securities that can be readily converted into cash. Marketable securities’ short-term andlong-term classifications are based on remaining maturities at each reporting period. Examples of marketablesecurities include U.S. Treasury and agency obligations, commercial paper, asset-back securities and corporate bonds.We place our cash investments in instruments that meet various parameters, including credit quality standards asspecified in our investment policy. We do not use derivative financial instruments.
We account for our investments in debt and equity instruments as available-for-sale. Management determinesthe appropriate classification of such securities at the time of purchase and re-evaluates such classification as of eachbalance sheet date. Cash equivalents and marketable securities are reported at fair value with the related unrealizedgains and losses included in accumulated other comprehensive income (loss), a component of shareholders’ equity,net of tax. We assess whether our investments with unrealized loss positions are other than temporarily impaired.Unrealized gains and losses and declines in value judged to be other than temporary are determined based on thespecific identification method and are reported in other income, net in the consolidated statements of income.
Allowance for Doubtful Accounts
We evaluate the collectibility of accounts receivable based on a combination of factors. In cases where we areaware of circumstances that may impair a specific customer’s ability to meet its financial obligations subsequent to theoriginal sale, we will record an allowance against amounts due, and thereby reduce the net recognized receivable tothe amount we reasonably believe will be collected. For all other customers, we recognize allowances for doubtfulaccounts based on the length of time the receivables are past due, industry and geographic concentrations, the currentbusiness environment and our historical experience.
Inventory
Inventory consists of work in process and finished goods and is stated at the lower of cost (first-in, first-out) ormarket. We write down the carrying value of our inventory to net realizable value for estimated obsolescence orunmarketable inventory in an amount equal to the difference between the cost of inventory and its estimatedrealizable value based upon assumptions about future demand and market conditions, among other factors. Shippingand handling costs are classified as a component of cost of product revenue in the consolidated statements of income.Inventory acquired through business combinations is recorded at its acquisition date fair value which is the netrealizable value less a normal profit margin depending on the stage of inventory completion.
F-10

Property and Equipment
Property and equipment are carried at cost. Depreciation and amortization are provided using the straight-linemethod over the assets’ estimated remaining useful lives, ranging from one to ten years. Depreciation andamortization of leasehold improvements are computed using the shorter of the remaining lease term or ten years.
Goodwill and Other Long-Lived Assets
Goodwill is recorded as the difference, if any, between the aggregate consideration paid for an acquisition andthe fair value of the acquired net tangible and intangible assets. Other long-lived assets primarily represent purchasedintangible assets including developed technology, customer relationships and in-process research and development, orIPR&D. We currently amortize our intangible assets with definitive lives over periods ranging from one to fifteenyears using a method that reflects the pattern in which the economic benefits of the intangible asset are consumed orotherwise used or, if that pattern cannot be reliably determined, using a straight-line amortization method. Wecapitalize IPR&D projects acquired as part of a business combination. On completion of each project, IPR&D assetsare reclassified to developed technology and amortized over their estimated useful lives.
Impairment of Goodwill and Other Long-Lived Assets
We evaluate goodwill on an annual basis in the fourth quarter or more frequently if we believe indicators ofimpairment exist. In 2011 we early adopted the new provisions issued by the FASB that intended to simplifygoodwill impairment testing. The updated guidance permits us to first assess qualitative factors to determine whetherit is more likely than not that the fair value of a reporting unit is less than its carrying amount. If we conclude that itis more likely than not that the fair value of a reporting units is less than its carrying amount, we conduct a two-stepgoodwill impairment test. The first step of the impairment test involves comparing the fair values of the applicablereporting units with their carrying values. We determine the fair values of our reporting units using the incomevaluation approach, as well as other generally accepted valuation methodologies. If the carrying amount of a reportingunit exceeds the reporting unit’s fair value, we perform the second step of the goodwill impairment test. The secondstep of the goodwill impairment test involves comparing the implied fair value of the affected reporting unit’sgoodwill with the carrying value of that goodwill. The amount, by which the carrying value of the goodwill exceedsits implied fair value, if any, is recognized as an impairment loss.
During development, IPR&D is not subject to amortization and is tested for impairment annually or morefrequently if events or changes in circumstances indicate that the asset might be impaired. The impairment testconsists of a comparison of the fair value to its carrying amount. If the carrying value exceeds its fair value, animpairment loss is recognized in an amount equal to that excess. Once an IPR&D project is complete, it becomes adefinite lived intangible asset and is evaluated for impairment in accordance with our policy for long-lived assets.
We test long-lived assets and purchased intangible assets (other than goodwill and IPR&D in development) forimpairment if we believe indicators of impairment exist. We determine whether the carrying value of an asset or assetgroup is recoverable, based on comparisons to undiscounted expected future cash flows the asset are expected togenerate. If an asset is not recoverable, we record an impairment loss equal to the amount by which the carrying valueof the asset exceeds its fair value. We primarily use the income valuation approach to determine the fair value of ourlong lived assets and purchased intangible assets.
Warranty
Our products typically carry a one to three year warranty. We establish reserves for estimated product warrantycosts at the time revenue is recognized based upon our historical warranty experience, and additionally for any knownproduct warranty issues. If actual costs differ from our initial estimates, we record the difference in the period they areidentified. Actual claims are charged against the warranty reserve. See Note 2 for a summary of our warranty activity.
Guarantees and Indemnifications
In some agreements to which we are a party, we have agreed to indemnify the other party for certain matters,including, but not limited to product liability. We include intellectual property indemnification provisions in ourstandard terms and conditions of sale for our products and have also included such provisions in certain agreementswith third parties. We have and will continue to evaluate and provide reasonable assistance for these other parties.
F-11

This may include certain levels of financial support to minimize the impact of the litigation in which they areinvolved. To date, there have been no known events or circumstances that have resulted in any material costs relatedto these indemnification provisions and no liabilities therefor have been recorded in the accompanying consolidatedfinancial statements. However, the maximum potential amount of the future payments we could be required to makeunder these indemnification obligations could be significant.
We have obligations to indemnify certain of our present and former directors, officers and employees to themaximum extent not prohibited by law. Under these obligations, Broadcom is required (subject to certainexceptions) to indemnify each such director, officer and employee against expenses, including attorneys’ fees,judgments, fines and settlements, paid by such individual. The potential amount of the future payments we could berequired to make under these indemnification obligations could be significant. We maintain directors’ and officers’insurance policies that may generally limit our exposure and enable us to recover a portion of the amounts paid withrespect to such obligations.
Income Taxes
We utilize the asset and liability method of accounting for income taxes, under which deferred taxes aredetermined based on the temporary differences between the financial statement and tax basis of assets and liabilitiesusing tax rates expected to be in effect during the years in which the basis differences reverse. A valuation allowance isrecorded when it is more likely than not that some of the deferred tax assets will not be realized.
Income tax positions must meet a more-likely-than-not recognition threshold to be recognized. Income taxpositions that previously failed to meet the more-likely-than-not threshold are recognized in the first subsequentfinancial reporting period in which that threshold is met. Previously recognized tax positions that no longer meet themore-likely-than-not threshold are derecognized in the first subsequent financial reporting period in which thatthreshold is no longer met. We recognize potential accrued interest and penalties related to unrecognized tax benefitswithin the consolidated statements of income as income tax expense.
Research and Development Expense
Research and development expenditures are expensed in the period incurred.
Stock-Based Compensation
Broadcom has in effect stock incentive plans under which incentive stock options have been granted toemployees and restricted stock units and non-qualified stock options have been granted to employees andnon-employee members of the Board of Directors. We also have an employee stock purchase plan for all eligibleemployees. We are required to estimate the fair value of share-based awards on the date of grant. The value of theaward is principally recognized as an expense ratably over the requisite service periods. The fair value of our restrictedstock units is based on the closing market price of our Class A common stock on the date of grant less our expecteddividend yield. We have estimated the fair value of stock options and stock purchase rights as of the date of grant orassumption using the Black-Scholes option pricing model, which was developed for use in estimating the value oftraded options that have no vesting restrictions and that are freely transferable. The Black-Scholes model considers,among other factors, the expected life of the award, the expected volatility of our stock price and the expecteddividend yield. We evaluate the assumptions used to value stock options and stock purchase rights on a quarterlybasis. The fair values generated by the Black-Scholes model may not be indicative of the actual fair values of ourequity awards, as it does not consider other factors important to those awards to employees, such as continuedemployment, periodic vesting requirements and limited transferability.
Litigation and Settlement Costs
Legal costs are expensed as incurred. We are involved in disputes, litigation and other legal actions in theordinary course of business. We continually evaluate uncertainties associated with litigation and record a charge equalto at least the minimum estimated liability for a loss contingency when both of the following conditions are met:(i) information available prior to issuance of the financial statements indicates that it is probable that an asset hadbeen impaired or a liability had been incurred at the date of the financial statements and (ii) the loss or range of losscan be reasonably estimated. This generally occurs when an agreement in principle has been reached by both partiesthat include substantive terms, conditions and amounts. We account for settlement agreements as multiple
F-12

element arrangements and allocate the consideration to the identifiable elements based on relative fair value.Generally the identifiable elements are the licensing of intellectual property for future use and payments related toalleged prior infringement.
Self-Insurance
We are self-insured for certain healthcare benefits provided to our U.S. employees. The liability for the self-insured benefits is limited by the purchase of stop-loss insurance. The stop-loss coverage provides payment foraggregate claims exceeding $0.3 million per covered person for any given year.
Accruals for losses are made based on our claim experience and actuarial estimates based on historical data.Actual losses may differ from accrued amounts. Should actual losses exceed the amounts expected and if the recordedliabilities are insufficient, an additional expense will be recorded.
Accumulated Comprehensive Income (Loss)
Accumulated other comprehensive income (loss) includes foreign currency translation adjustments andunrealized gains or losses on investments. This information is provided in our statements of shareholders’ equity.Accumulated other comprehensive income (loss) on the consolidated balance sheets at December 31, 2011 and 2010represents accumulated translation adjustments and unrecognized gains and losses on investments classified asavailable for sale.
Net Income Per Share
Net income per share (basic) is calculated by dividing net income by the weighted average number of commonshares outstanding during the year. Net income per share (diluted) is calculated by adjusting outstanding shares,assuming any dilutive effects of options and restricted stock units calculated using the treasury stock method. Underthe treasury stock method, an increase in the fair market value of our Class A common stock results in a greaterdilutive effect from outstanding options, stock purchase rights and restricted stock units. Additionally, the exercise ofemployee stock options and stock purchase rights and the vesting of restricted stock units results in a further dilutiveeffect on net income per share.
2. Supplemental Financial Information
Net Revenue
The following table presents details of our product revenue:Year Ended December 31,
2011 2010 2009
Product sales through direct sales force . . . . . . . . . . . . . . . . . . . . . . . 76.8% 77.6% 78.8%Product sales maintained under fulfillment distributor
arrangements . . . . . . . . . . . . . . . . . . . . . . . . . . . . . . . . . . . . . . . . . 7.5 7.9 8.1Product sales through distributors . . . . . . . . . . . . . . . . . . . . . . . . . . . 15.7 14.5 13.1
100.0% 100.0% 100.0%
Inventory
The following table presents details of our inventory:December 31,
2011 2010
(In millions)
Work in process . . . . . . . . . . . . . . . . . . . . . . . . . . . . . . . . . . . . . . . . . . . . . . . . . . $135 $279Finished goods . . . . . . . . . . . . . . . . . . . . . . . . . . . . . . . . . . . . . . . . . . . . . . . . . . . 286 319
$421 $598
F-13

Property and Equipment
The following table presents details of our property and equipment:
Useful Life
December 31,
2011 2010
(In years) (In millions)
Leasehold improvements . . . . . . . . . . . . . . . . . . . . . . . . . . . . . . . . . 1 to 10 $ 212 $ 173
Office furniture and equipment . . . . . . . . . . . . . . . . . . . . . . . . . . . . 3 to 7 38 29
Machinery and equipment . . . . . . . . . . . . . . . . . . . . . . . . . . . . . . . . 5 396 313
Computer software and equipment . . . . . . . . . . . . . . . . . . . . . . . . . 2 to 5 128 142
Construction in progress . . . . . . . . . . . . . . . . . . . . . . . . . . . . . . . . . N/A 26 14
800 671
Less accumulated depreciation and amortization . . . . . . . . . . . . . . . (432) (405)
$ 368 $ 266
Goodwill
The following table summarizes the activity related to the carrying value of our goodwill:
Reportable Segments
ForeignCurrency Consolidated
BroadbandCommunications
Mobile &Wireless
Infrastructure &Networking
(In millions)
Goodwill . . . . . . . . . . . . . . . . . . . . . . . . . $483 $ 802 $ 1,874 $ — $ 3,159
Accumulated impairment losses . . . . . . . . — (543) (1,286) — (1,829)
Goodwill at December 31, 2009 . . . . . . . . $483 $ 259 $ 588 $ — $ 1,330
Goodwill recorded in connection withacquisitions . . . . . . . . . . . . . . . . . . . . . . 111 188 36 — 335
Contingent consideration . . . . . . . . . . . . . 1 — — — 1
Effects of foreign currency translation . . . . — — — 11 11
Goodwill at December 31, 2010 . . . . . . . . $595 $ 447 $ 624 $ 11 $ 1,677
Goodwill recorded in connection withacquisitions . . . . . . . . . . . . . . . . . . . . . . — 23 111 — 134
Escrow related and other . . . . . . . . . . . . . . 2 — — — 2
Effects of foreign currency translation . . . . — — — (26) (26)
Goodwill at December 31, 2011 . . . . . . . . $597 $ 470 $ 735 $(15) $ 1,787
For a detailed discussion of our annual impairment assessment of goodwill, see Note 10.
F-14

Purchased Intangible Assets
The following table presents details of our purchased intangible assets:
December 31,2011
December 31,2010
Gross
AccumulatedAmortization &
Impairments Net Gross
AccumulatedAmortization &
Impairments Net
(In millions)
Developed technology . . . . . . . . $587 $(282) $305 $481 $(236) $245
In-process research anddevelopment . . . . . . . . . . . . . . 59 — 59 56 — 56
Customer relationships . . . . . . . . 173 (117) 56 154 (102) 52
Customer backlog . . . . . . . . . . . 10 (10) — 10 (8) 2
Other . . . . . . . . . . . . . . . . . . . . . 13 (10) 3 11 (9) 2
$842 $(419) $423 $712 $(355) $357
Effects of foreign currencytranslation . . . . . . . . . . . . . . . (23) 9
$400 $366
For a detailed discussion of our various impairments of purchased intangible assets, see Note 10.
The following table presents details of the amortization of purchased intangible assets included in the cost ofproduct revenue and other operating expense categories:
Year Ended December 31,
2011 2010 2009
(In millions)
Cost of product revenue . . . . . . . . . . . . . . . . . . . . . . . . . . . . . . . . . . $54 $31 $16
Other operating expenses . . . . . . . . . . . . . . . . . . . . . . . . . . . . . . . . . . 30 28 15
$84 $59 $31
The following table presents details of the estimated future amortization of existing purchased intangible assets,including IPR&D. If we acquire additional purchased intangible assets in the future, our cost of product revenue oroperating expenses will be increased by the amortization of those assets.
Purchased Intangible Assets Amortization by Year
2012 2013 2014 2015 2016 Thereafter Total
(In millions)
Cost of product revenue . . . . $ 77 $72 $60 $46 $33 $56 $344
Other operating expenses . . . 27 10 4 4 4 7 56
$104 $82 $64 $50 $37 $63 $400
F-15

Accrued Liabilities
The following table presents details of our accrued liabilities:
December 31,
2011 2010
(In millions)
Accrued rebates . . . . . . . . . . . . . . . . . . . . . . . . . . . . . . . . . . . . . . . . . . . . . . . . . . . $317 $270
Accrued royalties . . . . . . . . . . . . . . . . . . . . . . . . . . . . . . . . . . . . . . . . . . . . . . . . . . 18 19
Accrued settlement charges . . . . . . . . . . . . . . . . . . . . . . . . . . . . . . . . . . . . . . . . . . 28 17
Accrued legal costs . . . . . . . . . . . . . . . . . . . . . . . . . . . . . . . . . . . . . . . . . . . . . . . . 16 28
Accrued taxes . . . . . . . . . . . . . . . . . . . . . . . . . . . . . . . . . . . . . . . . . . . . . . . . . . . . 16 14
Warranty reserve . . . . . . . . . . . . . . . . . . . . . . . . . . . . . . . . . . . . . . . . . . . . . . . . . . 14 13
Restructuring liabilities . . . . . . . . . . . . . . . . . . . . . . . . . . . . . . . . . . . . . . . . . . . . . 6 —
Other . . . . . . . . . . . . . . . . . . . . . . . . . . . . . . . . . . . . . . . . . . . . . . . . . . . . . . . . . . 46 43
$461 $404
Other Long-Term Liabilities
The following table presents details of our other long-term liabilities, which excludes long-term debt:
December 31,
2011 2010
(In millions)
Deferred rent . . . . . . . . . . . . . . . . . . . . . . . . . . . . . . . . . . . . . . . . . . . . . . . . . . . . $ 48 $ 39
Accrued taxes . . . . . . . . . . . . . . . . . . . . . . . . . . . . . . . . . . . . . . . . . . . . . . . . . . . . 24 29
Deferred tax liabilities . . . . . . . . . . . . . . . . . . . . . . . . . . . . . . . . . . . . . . . . . . . . . . 80 35
Restructuring liabilities . . . . . . . . . . . . . . . . . . . . . . . . . . . . . . . . . . . . . . . . . . . . . 2 —
Accrued settlement charges . . . . . . . . . . . . . . . . . . . . . . . . . . . . . . . . . . . . . . . . . . 48 38
Other long-term liabilities . . . . . . . . . . . . . . . . . . . . . . . . . . . . . . . . . . . . . . . . . . . 22 9
$224 $150
Accrued Rebate Activity
The following table summarizes the activity related to accrued rebates:
Year Ended December 31,
2011 2010
(In millions)
Beginning balance . . . . . . . . . . . . . . . . . . . . . . . . . . . . . . . . . . . . . . . . . . . . . . . . $ 270 $ 162
Charged as a reduction to revenue . . . . . . . . . . . . . . . . . . . . . . . . . . . . . . . . . . . . 643 526
Reversal of unclaimed rebates . . . . . . . . . . . . . . . . . . . . . . . . . . . . . . . . . . . . . . . (13) (4)
Payments . . . . . . . . . . . . . . . . . . . . . . . . . . . . . . . . . . . . . . . . . . . . . . . . . . . . . . . (583) (414)
Ending balance . . . . . . . . . . . . . . . . . . . . . . . . . . . . . . . . . . . . . . . . . . . . . . . . . . $ 317 $ 270
F-16

Warranty Reserve Activity
The following table summarizes the activity related to warranty reserve:
Year Ended December 31,
2011 2010
(In millions)
Beginning balance . . . . . . . . . . . . . . . . . . . . . . . . . . . . . . . . . . . . . . . . . . . . . $ 13 $10
Charged to costs and expenses . . . . . . . . . . . . . . . . . . . . . . . . . . . . . . . . . . . . 11 8
Payments . . . . . . . . . . . . . . . . . . . . . . . . . . . . . . . . . . . . . . . . . . . . . . . . . . . . (10) (5)
Ending balance . . . . . . . . . . . . . . . . . . . . . . . . . . . . . . . . . . . . . . . . . . . . . . . . $ 14 $13
Restructuring Activity
As part of our regular portfolio management review process and in light of our decision to significantly reduceour investment in our digital television and Blu-ray Disc lines of business within our Broadband Communicationsoperating segment, in September 2011 we implemented a restructuring plan to reduce our worldwide headcount byapproximately 300 employees. We recorded $16 million in net restructuring costs in 2011, of which $12 million wasrelated to severance and other charges associated with our reduction in workforce across multiple locations andfunctions, and $4 million was related to the closure of three of our facilities. We currently expect to complete thisplan and record additional costs of approximately $1 million in the three months ended March 31, 2012.
The following table summarizes activity related to our current and long-term restructuring liabilities during the2011 (in millions):
Total
Restructuring liabilities at December 31, 2010 . . . . . . . . . . . . . . . . . . . . . . . . . . . . . . . . . . . . $—
Charged to expense . . . . . . . . . . . . . . . . . . . . . . . . . . . . . . . . . . . . . . . . . . . . . . . . . . . . . . . . . 16
Cash payments . . . . . . . . . . . . . . . . . . . . . . . . . . . . . . . . . . . . . . . . . . . . . . . . . . . . . . . . . . . . (8)
Restructuring liabilities at December 31, 2011 . . . . . . . . . . . . . . . . . . . . . . . . . . . . . . . . . . . . $ 8
Computation of Net Income Per Share
The following table presents the computation of net income per share:
Year Ended December 31,
2011 2010 2009
(In millions, except per share data)
Numerator: Net income . . . . . . . . . . . . . . . . . . . . . . . . . . . . . . . . . . $ 927 $1,082 $ 65
Denominator for net income per share (basic) . . . . . . . . . . . . . . . . . . 539 508 494
Effect of dilutive securities:
Stock awards . . . . . . . . . . . . . . . . . . . . . . . . . . . . . . . . . . . . . . . . . 24 37 19
Denominator for net income per share (diluted) . . . . . . . . . . . . . . . . 563 545 513
Net income per share (basic) . . . . . . . . . . . . . . . . . . . . . . . . . . . . . . . $1.72 $ 2.13 $0.13
Net income per share (diluted) . . . . . . . . . . . . . . . . . . . . . . . . . . . . . $1.65 $ 1.99 $0.13
Net income per share (diluted) does not include the effect of anti-dilutive common share equivalents resultingfrom outstanding equity awards. There were 18 million, 20 million and 73 million anti-dilutive common shareequivalents in 2011, 2010 and 2009, respectively.
F-17

Income from the Qualcomm Agreement
As part of the Qualcomm Agreement, each party granted certain rights under its patent portfolio to the otherparty including, in certain circumstances, under future patents issued within one to four years after April 26, 2009.The term of the Qualcomm Agreement commenced April 26, 2009 and will continue until the expiration of the lastto expire of the covered patents. In addition, certain existing patents were assigned by Broadcom to Qualcomm withBroadcom retaining a royalty-free license under these patents. The Qualcomm Agreement also resulted in the partiesdismissing with prejudice all outstanding litigation between them, and in Broadcom withdrawing its complaints withforeign competition authorities. Under the terms of the agreement, Qualcomm is expected to make payments toBroadcom totaling $891 million, of which $632 million has been paid through December 31, 2011. The remainingbalance of $259 million is expected to be paid in six equal and successive quarterly payments of $43 million each,continuing in the three months ending March 31, 2012 and concluding in the three months ending June 30, 2013.
We allocated the payment due us under the Qualcomm Agreement amongst several elements. In 2009 werecorded a gain from the settlement of litigation related to intellectual property of $65 million, which was recorded asa reduction in settlement costs and approximated the value of the settlements determined by the United StatesDistrict Court for the Central District of California.
The fair value associated with the transfer of intellectual property rights, as well as the settlement of otheroutstanding litigation, of $826 million, has been accounted for as a single unit of accounting and recognized withinnet revenue over the Qualcomm Agreement’s performance period of four years; recognition is limited to the lesser ofthe cumulative straight-line amortization over the four year performance period or the cumulative cash proceedsreceived. As a result, income from the Qualcomm Agreement will never be recorded ahead of cash payments received.We also recognized income from the Qualcomm Agreement of $31 million in 2009 related to previous paymentsmade to us by Qualcomm for shipments from May 2007 through December 31, 2008, related to a court-orderedpermanent injunction. We had deferred the recognition of these amounts, which were received during 2008, due tocontinuing litigation appeals. These appeals were resolved through the Qualcomm Agreement.
Income from the Qualcomm Agreement is expected to be recognized as follows:2012 2013 Thereafter Total
(In millions)
Income from Qualcomm Agreement . . . . . . . . . . . . $186 $86 $— $272
At December 31, 2011 we had deferred income of $13 million related to the Qualcomm Agreement related tothe initial payment by Qualcomm of $200 million in April 2009.
Charitable Contributions
In April 2009 we established the Broadcom Foundation, or the Foundation, to support science, technology,engineering and mathematics programs, as well as a broad range of community services. In June 2009 we made anunrestricted grant of $50 million to the Foundation upon receiving a determination letter from the Internal RevenueService of the exemption from federal income taxation under Section 501(c)(3) of the Internal Revenue Code of1986, as amended. In June 2011 we contributed an additional $25 million to the Foundation. Approximately $2million of the $25 million contribution came from Dr. Henry Samueli, our Chief Technical Officer and member ofthe Board of Directors, who made such payment to Broadcom Corporation in connection with the settlement of theshareholder derivative litigation as further described in Note 12. These payments were recorded as operating expensesin consolidated statements of income in 2009 and 2011.
Supplemental Cash Flow Information
In 2011 we paid $1 million related to share repurchases that had not settled by December 31, 2010. In 2011 wereceived $4 million related to stock option exercises that had not settled by December 31, 2010. In 2010 we received$1 million related to stock option exercises that had not settled by December 31, 2009.
At December 31, 2011, 2010 and 2009 we had billings of $43 million, $12 million and $8 million,respectively, for capital equipment that were accrued. The amounts accrued for capital equipment purchases havebeen excluded from the consolidated statements of cash flows and were paid in the subsequent period.
F-18

3. Business Combinations
From January 1, 2009 through December 31, 2011 we completed a number of acquisitions. The consolidated financialstatements include the results of operations of these acquired companies commencing as of their respective acquisition dates.
Company AcquiredDate
Acquired Business
CashConsideration
PaidCash
Assumed
EquityConsideration
PaidAssumed
Debt
ContingentConsideration
Maximum
ContingentConsideration
Fair Value
(In millions)
2011 Acquisitions
SC Square Ltd. . . . . . . . . . . . . . . . . . . . . . . May 2011 Security software $ 40 $— $— $— $— $—
Provigent, Inc. . . . . . . . . . . . . . . . . . . . . . . Apr. 2011 Microwavebackhaul systems 314 10 4 — — —
Other . . . . . . . . . . . . . . . . . . . . . . . . . . . . . Various 3 — — — — —
$ 357 $10 $ 4 $— $— $—
2010 Acquisitions
Gigle Networks, Inc. . . . . . . . . . . . . . . . . . . Dec. 2010 SoC solutions forhome networkingover power lines $ 73 $ 1 $ 2 $— $ 8 $ 1
Percello Ltd. . . . . . . . . . . . . . . . . . . . . . . . . Nov. 2010 SoC solutions forfemtocells 85 2 3 — 12 —
Beceem Communications, Inc. . . . . . . . . . . Nov. 2010 SoC solutions forLTE andWiMAX 4Gconnectivity 301 12 23 — — —
Innovision Research & Technology PLC . . Jul. 2010 Near-fieldcommunication(NFC) 50 2 — — — —
Teknovus, Inc. . . . . . . . . . . . . . . . . . . . . . . Mar. 2010 Ethernet passiveoptical network(EPON) chipsets& software 109 9 — 15 — —
Other . . . . . . . . . . . . . . . . . . . . . . . . . . . . . Various 7 — — — — —
$ 625 $26 $28 $15 $20 $ 1
2009 Acquisitions
Dune Networks, Inc. . . . . . . . . . . . . . . . . . Dec. 2009 Switch fabricsolutionsfor data centernetworkingequipment $ 185 $28 $14 $— $— $—
Other . . . . . . . . . . . . . . . . . . . . . . . . . . . . . Various 8 — — — 2 1
$ 193 $28 $14 $— $ 2 $ 1
Total Acquisitions . . . . . . . . . . . . . . . . . . . $1,175 $64 $46 $15 $22 $ 2
Substantially all of the equity consideration paid will be recognized as stock-based compensation expense over three to fouryears. Certain of the cash consideration in the above acquisitions is currently held in escrow pursuant to the terms of theacquisition agreements and is reflected in goodwill as we believe the likelihood of the escrow fund being utilized by us is remote.
Our primary reasons for the above acquisitions were to enter into or expand our market share in the relevant wired andwireless communications markets, reduce the time required to develop new technologies and products and bring them to market,incorporate enhanced functionality into and complement our existing product offerings, augment our engineering workforce, andenhance our technological capabilities. The principal factor that resulted in recognition of goodwill was that the purchase price foreach acquisition was based on cash flow projections assuming the integration of any acquired technology and products with ourproducts, which is of considerably greater value than utilizing each acquired company’s technology or product on a standalonebasis.
F-19

We allocated the purchase price of these acquisitions to tangible assets, liabilities and identifiable intangibleassets acquired based on their estimated fair values. The excess of the purchase price over the aggregate fair values wasrecorded as goodwill. The fair value assigned to identifiable intangible assets acquired was based on estimates andassumptions made by management at the time of acquisition. Based upon those calculations, the purchase prices forthe acquisitions were allocated as follows:
2011Acquisitions
2010Acquisitions
2009Acquisitions
(In millions)
Fair Market ValuesCash and cash equivalents . . . . . . . . . . . . . . . . . . . . . . . . . . . . $ 11 $ 26 $ 28Accounts receivable, net . . . . . . . . . . . . . . . . . . . . . . . . . . . . . . 12 24 5Inventory . . . . . . . . . . . . . . . . . . . . . . . . . . . . . . . . . . . . . . . . . 30 27 8Prepaid and other current assets . . . . . . . . . . . . . . . . . . . . . . . . 4 5 1Property and equipment, net . . . . . . . . . . . . . . . . . . . . . . . . . . 3 6 1Other assets . . . . . . . . . . . . . . . . . . . . . . . . . . . . . . . . . . . . . . . — 5 —Goodwill . . . . . . . . . . . . . . . . . . . . . . . . . . . . . . . . . . . . . . . . . 134 336 53Purchased intangible assets . . . . . . . . . . . . . . . . . . . . . . . . . . . . 233 266 136
Total assets acquired . . . . . . . . . . . . . . . . . . . . . . . . . . . . . . . . . 427 695 232Accounts payable . . . . . . . . . . . . . . . . . . . . . . . . . . . . . . . . . . . (7) (14) (2)Wages and related benefits . . . . . . . . . . . . . . . . . . . . . . . . . . . . (4) (8) (3)Debt . . . . . . . . . . . . . . . . . . . . . . . . . . . . . . . . . . . . . . . . . . . . . — (15) —Accrued liabilities . . . . . . . . . . . . . . . . . . . . . . . . . . . . . . . . . . . (2) (15) (29)Long-term liabilities . . . . . . . . . . . . . . . . . . . . . . . . . . . . . . . . . (57) (13) —
Total liabilities assumed . . . . . . . . . . . . . . . . . . . . . . . . . . . . . . (70) (65) (34)
Purchase price allocation . . . . . . . . . . . . . . . . . . . . . . . . . . . $357 $630 $198
UsefulLife
2011Acquisitions
2010Acquisitions
2009Acquisitions
(In years) (In millions)
Purchased Intangible Assets:Developed technology . . . . . . . . . . . . . . . . . . . . 1 - 13 $148 $156 $ 58In-process research and development . . . . . . . . . 2 - 10 45 55 51Customer relationships . . . . . . . . . . . . . . . . . . . 1 - 8 37 47 27Other . . . . . . . . . . . . . . . . . . . . . . . . . . . . . . . . 1 - 10 3 8 —
$233 $266 $136
Purchased Intangible Assets
Developed technology represents patented technology and completed technology. Patented technology is thefundamental technology that survives multiple product iterations, while completed technology is specific to certainproducts acquired: both of these technologies have passed technological feasibility. We generally use a relief-from-royalty method to value patented technology, based on market royalties for similar fundamental technologies. Therelief-from-royalty method estimates the cost savings that accrue to the owner of an intangible asset that wouldotherwise be payable as royalties or license fees on revenues earned through the use of the asset. The royalty rate usedis based on an analysis of empirical, market-derived royalty rates for guideline intangible assets. Typically, revenue isprojected over the expected remaining useful life of the patented technology. The market-derived royalty rate is thenapplied to estimate the royalty savings. To value completed technology, we generally use a multi-period excessearnings approach which calculates the value based on the risk-adjusted present value of the cash flows specific to theproducts, allowing for a reasonable return.
F-20

Customer relationships represent the fair value of future projected revenue that will be derived from the sale ofproducts to existing customers of the acquired companies.
In-Process Research and Development
The fair value of the IPR&D for our acquisitions was determined using the income approach. Under theincome approach, the expected future cash flows from each project under development are estimated and discountedto their net present values at an appropriate risk-adjusted rate of return. Significant factors considered in thecalculation of the rate of return are the weighted average cost of capital, the return on assets, as well as the risksinherent in the development process, including the likelihood of achieving technological success and marketacceptance. Each project was analyzed to determine the unique technological innovations, the existence and relianceon patented technology, the existence of any alternative future use or current technological feasibility, and thecomplexity, cost and time to complete the remaining development. Future cash flows for each project were estimatedbased on forecasted revenue and costs, taking into account the expected product life cycles, market penetration andgrowth rates. We believe the amounts recorded as IPR&D, as well as developed technology, represented the fairvalues and approximate the amounts a market participant would pay for these projects as of the respective acquisitiondates.
The following table summarizes the significant assumptions underlying the valuations of the ongoingdevelopment projects that were in process at the date of acquisition and were capitalized as IPR&D in 2011, 2010and 2009:
Company Acquired Development Projects
WeightedAverage
EstimatedPercent
Complete
AverageEstimatedTime to
Complete
EstimatedCost to
Complete
RiskAdjustedDiscount
Rate IPR&D
(In years) (In millions) (In millions)
2011 AcquisitionsProvigent, Inc. . . . . . . . . . . . . . Microwave 41% 2.1 $74 21% $452010 AcquisitionsGigle Networks . . . . . . . . . . . . Powerline Communication
Solutions 12% 1.4 10 18% 5Percello . . . . . . . . . . . . . . . . . . . LTE/Femtocell solutions 10% 3.2 10 17% 10Beceem Communications . . . . . LTE/WiMAX 51% 1.1 32 22% 29Teknovus . . . . . . . . . . . . . . . . . Ethernet Passive Optical
Network (EPON) chipsets andsoftware 11% 0.9 19 26% 11
2009 AcquisitionsDune Networks . . . . . . . . . . . . High-density switching line
card solutions 85% 1.0 2 21% 50
At December 31, 2011 all development projects from our Provigent, Teknovus, Percello and Gigle acquisitionswere still in process. In 2011 and 2010 we reclassified $3 million and $51 million, respectively, of IPR&D costs todeveloped technology, primarily related to our acquisition of Dune Networks, Inc., and such costs will be now beamortized to cost of product revenue. Research and development costs to bring the products of the acquiredcompanies to technological feasibility are not expected to have a material impact on our results of operations orfinancial condition. Actual results to date have been consistent, in all material respects, with our assumptions at thetime of the acquisitions.
Contingent Earn-out Consideration
In connection with certain of our acquisitions, additional cash consideration of up to $20 million may be paidto former shareholders upon satisfaction of certain future performance goals. In connection with this contingentearn-out consideration, we originally recorded an estimated $1 million liability. In 2011 we recorded a change incontingent earn-out consideration of $1 million and reversed the associated liability. This benefit is reflected inselling, general and administrative expenses. As of December 31, 2011 we do not have any liabilities recorded inconnection with any remaining contingent earn-out consideration.
F-21

Supplemental Pro Forma Data (Unaudited)
The unaudited pro forma statements of income data below gives effect to the 2011 and 2010 acquisitions,described above, as if they had occurred at the beginning of the year prior to their respective acquisition dates. Thefollowing data includes the amortization of purchased intangible assets, the amortization of inventory valuationstep-up and stock-based compensation expense. This pro forma data is presented for informational purposes only anddoes not purport to be indicative of the results of future operations or of the results that would have occurred had theacquisitions taken place in the periods noted above.
Year EndedDecember 31,
2011 2010
(In millions, except per share data)
Pro forma net revenue . . . . . . . . . . . . . . . . . . . . . . . . . . . . . . . . . . . . . . . $7,412 $6,971
Pro forma net income . . . . . . . . . . . . . . . . . . . . . . . . . . . . . . . . . . . . . . . $ 911 $ 988
Pro forma net income per share (basic) . . . . . . . . . . . . . . . . . . . . . . . . . . $ 1.69 $ 1.94
Pro forma net income per share (diluted) . . . . . . . . . . . . . . . . . . . . . . . . . $ 1.62 $ 1.81
Pending Acquisition
In September 2011 we signed a definitive agreement to acquire NetLogic Microsystems, Inc., or NetLogic, apublicly traded company that is a leader in high performance intelligent semiconductor solutions for next generationnetworks. The expected purchase consideration is approximately $3.7 billion, net of cash assumed, based on theshares outstanding on September 11, 2011.
Under the agreement, each issued and outstanding share of NetLogic common stock (other than (i) shares heldby Broadcom, NetLogic or any of their respective wholly owned subsidiaries and (ii) shares held by NetLogicstockholders who perfect their appraisal rights) will be converted into the right to receive $50 in cash. The agreementfurther provides for, subject to certain limited exceptions, (i) the assumption of all in-the-money options to acquireNetLogic common stock outstanding immediately prior to the effective time of the Merger held by employees,(ii) the cash-out of all in-the-money stock options held by non-employees, (iii) the conversion of all unvestedrestricted stock units held by NetLogic employees into Broadcom restricted stock units and (iv) the cash-out of allunvested restricted stock units held by persons other than NetLogic employees.
The transaction has been approved by the Broadcom and NetLogic boards of directors and is subject tocustomary closing conditions, including the receipt of clearance by the Chinese Ministry of Commerce under theChinese Antimonopoly Law. There are no financing contingencies related to the acquisition. The transaction isexpected to close in the first half of 2012.
F-22

4. Cash, Cash Equivalents and Marketable Securities
The following tables present our cash and marketable securities’ costs, gross unrealized gains, gross unrealizedlosses and fair value by major security type recorded as cash and cash equivalents or short-term or long-termmarketable securities:
December 31, 2011
Cost
GrossUnrealized
Gains
GrossUnrealized
Losses Fair ValueCash and
Cash Equivalents
Short-TermMarketableSecurities
Long-TermMarketableSecurities
Cash . . . . . . . . . . . . . . . . . . . $ 154 $— $— $ 154 $ 154 $ — $ —
Level 1:
Bank deposits . . . . . . . . . . 2,717 — — 2,717 2,716 — 1
Money market funds . . . . . 914 — — 914 914 — —
U.S. treasury and andagency obligations . . . . . 469 — — 469 — 90 379
Corporate bonds . . . . . . . . 7 — — 7 — 7 —
Subtotal . . . . . . . . . . . . . 4,107 — — 4,107 3,630 97 380
Level 2:
Commercial paper . . . . . . . 381 — — 381 311 70 —
Corporate bonds . . . . . . . . 543 1 (2) 542 51 211 280
Asset-backed securities andother . . . . . . . . . . . . . . . 21 — — 21 — 5 16
Subtotal . . . . . . . . . . . . . 945 1 (2) 944 362 286 296
Level 3:
None . . . . . . . . . . . . . . . . . — — — — — — —
Total . . . . . . . . . . . . . . . $5,206 $ 1 $ (2) $5,205 $4,146 $383 $676
December 31, 2010
Cost
GrossUnrealized
Gains
GrossUnrealized
Losses Fair ValueCash and
Cash Equivalents
Short-TermMarketableSecurities
Long-TermMarketableSecurities
Cash . . . . . . . . . . . . . . . . . . . $ 103 $— $— $ 103 $ 103 $ — $ —
Level 1:
Bank deposits . . . . . . . . . . 455 — — 455 455 — —
Money market funds . . . . . 641 — — 641 641 — —
U.S. treasury and andagency obligations . . . . . 1,953 2 (5) 1,950 4 586 1,360
Corporate bonds . . . . . . . . 20 — — 20 — 13 7
Subtotal . . . . . . . . . . . . . 3,069 2 (5) 3,066 1,100 599 1,367
Level 2:
Commercial paper . . . . . . . 782 — — 782 419 363 —
Corporate bonds . . . . . . . . 107 — — 107 — 73 34
Subtotal . . . . . . . . . . . . . 889 — — 889 419 436 34
Level 3:
None . . . . . . . . . . . . . . . . . — — — — — — —
Total . . . . . . . . . . . . . . . $4,061 $ 2 $ (5) $4,058 $1,622 $1,035 $1,401
F-23

There were no transfers between Level 1, Level 2 or Level 3 securities in 2011 or 2010. All of our long-termmarketable securities had maturities of between one and three years in duration at December 31, 2011. Our cash,cash equivalent and marketable securities at December 31, 2011 consisted of $3.28 billion held domestically, withthe remaining balance of $1.93 billion held by foreign subsidiaries.
At December 31, 2011 we had 140 investments that were in an unrealized loss position for less than 12 months.Our gross unrealized losses of $2 million at December 31, 2011 were due to changes in interest rates. We havedetermined that the gross unrealized losses on these investments at December 31, 2011 are temporary in nature. Weevaluate securities for other-than-temporary impairment on a quarterly basis. Impairment is evaluated consideringnumerous factors, and their relative significance varies depending on the situation. Factors considered include thelength of time and extent to which fair value has been less than the cost basis, the financial condition and near-termprospects of the issuer, and our intent and ability to hold the investment in order to allow for an anticipated recoveryin fair value.
5. Income Taxes
For financial reporting purposes, income (loss) before income taxes includes the following components:
Year Ended December 31,
2011 2010 2009
(In millions)
United States . . . . . . . . . . . . . . . . . . . . . . . . . . . . . . . . . . . . . . . . . . . $ (132) $ 229 $(366)
Foreign . . . . . . . . . . . . . . . . . . . . . . . . . . . . . . . . . . . . . . . . . . . . . . . 1,088 868 438
$ 956 $1,097 $ 72
A reconciliation of the provision for income taxes at the federal statutory rate compared to our provision forincome taxes follows:
Year Ended December 31,
2011 2010 2009
(In millions)
Statutory federal provision for income taxes . . . . . . . . . . . . . . . . . . . . $ 335 $ 384 $ 25
Increase (decrease) in taxes resulting from:
Tax credits . . . . . . . . . . . . . . . . . . . . . . . . . . . . . . . . . . . . . . . . . . . . . (140) (90) (39)
Valuation allowance changes . . . . . . . . . . . . . . . . . . . . . . . . . . . . . . . 154 52 120
Tax rate differential on foreign earnings . . . . . . . . . . . . . . . . . . . . . . . (353) (270) (139)
Stock-based compensation expense (benefit) . . . . . . . . . . . . . . . . . . . (1) (81) 40
Other . . . . . . . . . . . . . . . . . . . . . . . . . . . . . . . . . . . . . . . . . . . . . . . . . 34 20 —
Provision for income taxes . . . . . . . . . . . . . . . . . . . . . . . . . . . . . . . $ 29 $ 15 $ 7
F-24

The income tax provision consists of the following components:
Year Ended December 31,
2011 2010 2009
(In millions)
Current:
Federal . . . . . . . . . . . . . . . . . . . . . . . . . . . . . . . . . . . . . . . . . . . . . . . . $— $ (4) $ (2)
State . . . . . . . . . . . . . . . . . . . . . . . . . . . . . . . . . . . . . . . . . . . . . . . . . (1) (3) —
Foreign . . . . . . . . . . . . . . . . . . . . . . . . . . . . . . . . . . . . . . . . . . . . . . . 23 21 14
22 14 12
Deferred:
Federal . . . . . . . . . . . . . . . . . . . . . . . . . . . . . . . . . . . . . . . . . . . . . . . . — — —
State . . . . . . . . . . . . . . . . . . . . . . . . . . . . . . . . . . . . . . . . . . . . . . . . . — — —
Foreign . . . . . . . . . . . . . . . . . . . . . . . . . . . . . . . . . . . . . . . . . . . . . . . 7 1 (5)
7 1 (5)
$29 $15 $ 7
Deferred income taxes reflect the net tax effects of temporary differences between the carrying amounts of assetsand liabilities for financial reporting purposes and the amounts used for income tax purposes. Significant componentsof our deferred taxes were as follows:
December 31,
2011 2010
(In millions)
Deferred tax assets:
Research and development tax credit carryforwards . . . . . . . . . . . . . . . . . . . . . . . $ 966 $ 761
Foreign tax credit carryforwards . . . . . . . . . . . . . . . . . . . . . . . . . . . . . . . . . . . . . . 56 44
Capitalized research and development costs . . . . . . . . . . . . . . . . . . . . . . . . . . . . . 135 133
Net operating loss carryforwards . . . . . . . . . . . . . . . . . . . . . . . . . . . . . . . . . . . . . . 259 496
Reserves and accruals not currently deductible for tax purposes . . . . . . . . . . . . . . 66 61
Stock-based compensation . . . . . . . . . . . . . . . . . . . . . . . . . . . . . . . . . . . . . . . . . . 108 123
Other . . . . . . . . . . . . . . . . . . . . . . . . . . . . . . . . . . . . . . . . . . . . . . . . . . . . . . . . . . 83 98
Gross deferred tax assets . . . . . . . . . . . . . . . . . . . . . . . . . . . . . . . . . . . . . . . . . . . . 1,673 1,716
Valuation allowance . . . . . . . . . . . . . . . . . . . . . . . . . . . . . . . . . . . . . . . . . . . . . . . (1,631) (1,621)
Deferred tax assets, net . . . . . . . . . . . . . . . . . . . . . . . . . . . . . . . . . . . . . . . . . . . . . 42 95
Deferred tax liabilities:
Purchased intangible assets . . . . . . . . . . . . . . . . . . . . . . . . . . . . . . . . . . . . . . . . . . (104) (112)
Net deferred tax liabilities . . . . . . . . . . . . . . . . . . . . . . . . . . . . . . . . . . . . . . . . . . . $ (62) $ (17)
F-25

At December 31, 2011 and 2010, we had valuation allowances of approximately $1.57 billion and $1.58 billionagainst certain U.S. deferred tax assets, and valuation allowances of approximately $60 million and $40 millionagainst deferred tax assets of certain foreign subsidiaries, respectively, to reflect the deferred tax asset at the netamount that is more likely than not to be realized.
We operate under tax holidays in Singapore, which are effective through March 2014. The tax holidays areconditional upon our meeting certain employment and investment thresholds. The impact of the Singapore taxholidays decreased Singapore taxes by $368 million, $330 million and $225 million for 2011, 2010 and 2009respectively.
We utilize the asset and liability method of accounting for income taxes. We record net deferred tax assets to theextent we believe these assets will more likely than not be realized. In making such determination, we consider allavailable positive and negative evidence, including scheduled reversals of deferred tax liabilities, projected futuretaxable income, tax planning strategies and recent financial performance. Forming a conclusion that a valuationallowance is not required is difficult when there is negative evidence such as cumulative losses in recent years. As aresult of our recent cumulative tax losses in the U.S. and certain foreign jurisdictions, and the full utilization of ourloss carryback opportunities, we have concluded that a full valuation allowance should be recorded in suchjurisdictions. In certain other foreign jurisdictions where we do not have cumulative losses, we had net deferred taxliabilities of $62 million and $17 million at December 31, 2011 and December 31, 2010, respectively.
Our deferred tax assets at December 31, 2011 and 2010 do not include $677 million and $632 million,respectively, of excess tax benefits from employee stock option exercises that are a component of our net operatingloss carryovers, research and development credits, and capitalized research and development expenses. Shareholders’equity will be increased by $677 million if and when such excess tax benefits are ultimately realized.
If and when recognized, the tax benefits relating to any reversal of the valuation allowance on deferred tax assetsat December 31, 2011 will be accounted for as follows: approximately $1.62 billion will be recognized as a reductionof income tax expense and $11 million will be recorded as an increase in shareholder’s equity. In 2011 we recorded a$45 million increase in foreign net deferred tax liabilities relating to acquisitions.
At December 31, 2011 for our income tax filings we had federal, state, United Kingdom, Israel and Spain netoperating loss carryforwards of approximately $2.19 billion, $2.05 billion, $126 million, $29 million and$12 million, respectively. A valuation allowance has been provided on substantially all of these loss carryforwards. Ifunutilized, the federal net operating loss carryforwards will expire between 2019 and 2031, the state net operatingloss carryforwards will expire between 2012 and 2031, and the Spain net operating loss carryforwards will expirebetween 2021 and 2025. The United Kingdom and Israel net operating losses have no expiration date. AtDecember 31, 2011 we had Canada scientific research and experimental development expenditures of $30 millionavailable for tax deduction in future tax years. These future tax deductions can be carried forward indefinitely. AtDecember 31, 2011, we also had $8 million of Israel research and development expenditures which are deductibleover the next two tax years. Also, for federal purposes, we had approximately $50 million and $2 million of charitableand capital loss carryovers, respectively. Charitable contributions are limited to 10% of taxable income and will expirein 2014 if not utilized. Capital losses may only be utilized to offset capital gains and will expire in 2012 if notutilized.
At December 31, 2011 for our income tax filings we had foreign tax credit carryforwards of approximately $56million, and federal, state, Canada and Spain research and development credit carryforwards of approximately$691 million, $634 million, $31 million and $7 million, respectively. A valuation allowance has been provided onsubstantially all of these credit carryforwards. These foreign tax credit carryforwards expire between 2016 and 2021,and these research and development credit carryforwards expire between 2019 and 2031, if not previously utilized.Certain state research and development credit carryforwards have no expiration date.
In 2010, we acquired companies with significant net operating loss and research and development creditcarryforwards. These attributes are offset with a full valuation allowance against the related deferred tax assets atDecember 31, 2010. Internal Revenue Code Sections 382 and 383 can limit the amount of net operating losses andcredits that can be utilized if certain changes to a company’s ownership occur. We determined that there were nomaterial limitations resulting from Internal Revenue Code Sections 382 and 383 with respect to these acquired taxattributes.
F-26

At December 31, 2011, deferred taxes have not been provided on the excess of book basis over tax basis in theamount of approximately $2.11 billion in the shares of certain foreign subsidiaries because their bases differences arenot expected to reverse in the foreseeable future and are considered permanent in duration. These bases differencesarose primarily through the undistributed book earnings of these foreign subsidiaries that we intend to reinvestindefinitely. The bases differences could reverse through a sale of the subsidiaries, the receipt of dividends from thesubsidiaries, or various other events. We believe that U.S. income taxes and foreign withholding taxes would besubstantially offset upon reversal of this excess book basis due to the existence of domestic net operating loss andcredit carryforwards.
The following table summarizes the activity related to our unrecognized tax benefits:Year Ended December 31,
2011 2010 2009
(In millions)
Beginning balance . . . . . . . . . . . . . . . . . . . . . . . . . . . . . . . . . . . . . . . $187 $ 401 $ 21Increases in current year . . . . . . . . . . . . . . . . . . . . . . . . . . . . . . . . . . . 59 38 7Expiration of the statutes of limitation for the assessment of taxes . . . (3) (3) (4)Increases (decreases) related to prior year tax positions . . . . . . . . . . . . (31) (249) 377
Ending balance . . . . . . . . . . . . . . . . . . . . . . . . . . . . . . . . . . . . . . . . . $212 $ 187 $401
The unrecognized tax benefits of $212 million at December 31, 2011 included $36 million of tax benefits that,if recognized, would reduce our annual effective tax rate. Approximately $2 million of the tax benefit, if recognized,would be credited to shareholder’s equity. The remaining $174 million, if recognized, would not result in a taxbenefit since it would be fully offset with a valuation allowance. We reversed penalties and interest related tounrecognized tax benefits of $4 million and $1 million, respectively, during 2011, resulting from the expiration ofstatutes of limitation. We also accrued potential penalties and interest of $2 million and $1 million, respectively,related to these unrecognized tax benefits during 2011, and in total, as of December 31, 2011, we recorded a liabilityfor potential penalties and interest of $11 million and $3 million, respectively. We recognize potential accruedinterest and penalties related to unrecognized tax benefits within the consolidated statements of income as income taxexpense.
In 2011 we had an increase in unrecognized tax benefits of approximately $59 million, primarily relating totransactions with certain foreign subsidiaries. In 2010 we had a decrease in unrecognized tax benefits ofapproximately $273 million relating to increases to our federal and state net operating loss carryforwards, capitalizedresearch and development costs, and tax credit carryforwards for previous years primarily resulting from theU.S. Court of Appeals for the Ninth Circuit March 22, 2010 ruling in the case between Xilinx, Inc. and theCommissioner of Internal Revenue and recorded $23 million of unrecognized tax benefits resulting from a 2010change in judgment regarding certain tax accruals. In addition, we had an increase in unrecognized tax benefits ofapproximately $38 million in 2010 primarily relating to transactions with certain foreign subsidiaries. We do notexpect our unrecognized tax benefits to change significantly over the next twelve months.
On May 27, 2009, the U.S. Court of Appeals for the Ninth Circuit in the case between Xilinx, Inc. and theCommissioner of Internal Revenue overturned a 2005 U.S. Tax Court ruling regarding treatment of certaincompensation expenses under a Company’s research and development cost-sharing arrangements with affiliates. TheCourt of Appeals originally held that related parties to such an arrangement must share stock-based compensationexpenses, notwithstanding the fact that unrelated parties in such an arrangement would not share such costs. As aresult of this May 27, 2009 decision, we reduced our gross deferred tax assets for federal and state net operating losscarryforwards and capitalized research and development costs, increased our deferred tax assets for certain tax credits,and increased our tax provision in 2009 by approximately $3 million. However, on January 13, 2010, the U.S. Courtof Appeals for the Ninth Circuit withdrew its May 27, 2009 ruling in the Xilinx case and subsequently issued a newdecision in favor of Xilinx on March 22, 2010, thereby affirming the August 30, 2005 decision of the U.S. TaxCourt. Consequently, during the quarter ended March 31, 2010, we reversed the amounts we had previouslyrecorded in 2009 related to the court’s May 27, 2009 decision. As a result, in the quarter ended March 31, 2010, wereduced our tax provision by approximately $3 million and adjusted certain of our gross deferred tax assets. Includedin these adjustments was an increase in our federal and state net operating loss carryforwards of approximately
F-27

$665 million and $455 million, respectively, an increase of federal and state capitalized research and developmentcosts of approximately $10 million each, an increase in our deferred tax assets relating to stock-based compensation ofapproximately $65 million, and a decrease in certain tax credits of approximately $10 million. These changes in ourgross deferred tax assets were fully offset by a valuation allowance adjustment, and therefore did not result in anychange in our net deferred tax assets or our income tax expense for the three months ended March 31, 2010. Inaddition to the adjustments related to the March 22, 2010 Xilinx decision, in the three months ended March 31,2010, we reduced our federal and state net operating losses by approximately $60 million for adjustments to ourintercompany charges to foreign affiliates for the years ended 2001 to 2009. This reduction to our net operatinglosses was fully offset by a corresponding adjustment to the valuation allowance for deferred tax assets resulting in nonet change to net deferred tax assets in our consolidated balance sheet and no adjustment to our income tax expense.
We file federal, state, and foreign income tax returns in jurisdictions with varying statutes of limitation. The2007 through 2011 tax years generally remain open subject to assessment of tax by federal and most state taxauthorities. In significant foreign jurisdictions, the 2002 through 2011 tax years generally remain subject toexamination by their respective tax authorities. Our income tax returns for the 2007, 2008 and 2009 tax years arecurrently under examination by the Internal Revenue Service, or (“IRS”), beginning in the quarter endedDecember 31, 2011. We do not expect that the results of these examinations will have a material effect on ourfinancial condition or results of operations. On June 30, 2011 we concluded the IRS examination of our income taxreturns for 2004 through 2006, executed a closing agreement covering the 2001 through 2006 tax years, and agreedto certain adjustments for the 2001 through 2006 tax years, primarily related to intercompany transfer pricingtransactions. Those audit adjustments were offset by federal net operating losses and credits, and did not result in anyincome tax expense or cash tax liability for the Company. As a result of the IRS examination, taking into accounteffects on post-audit periods, we reduced our federal and state net operating losses by approximately $620 millionand $430 million, respectively, and we reduced amounts relating to federal and state uncertain tax benefits byapproximately $180 million and $100 million, respectively, as of June 30, 2011. This reduction in federal and statenet operating loss carryforwards was fully offset with a reduction in our valuation allowance for deferred tax assets,and had no impact on our operating results or financial position.
In December, 2011 legislation was enacted in Israel which increased tax rates for 2012 and later years. As aresult of this legislation, we recorded a $13 million tax provision in 2011 for the effect of this tax rate increase on ourIsrael net deferred tax liabilities, which were principally related to purchased intangible assets. In December, 2010 theTax Relief, Unemployment Insurance Reauthorization and Job Creation Act of 2010 was enacted. A provision in thislegislation provided for the extension of the research and development tax credit for qualifying expenditures paid orincurred from January 1, 2010 through December 31, 2011. As a result of this new legislation, we generated federalresearch and development tax credits of $118 million and $145 million for the years ended December 31, 2011 and2010, respectively. These tax credits, if unutilized, will carry forward to future periods. No tax benefit was recordedfor these carryovers since we have a full valuation allowance on our U.S. deferred tax assets.
6. Long-Term Debt
Senior Notes
The following table presents details of our long-term debt liabilities:
December 31,
2011 2010
(In millions)
1.500% fixed-rate notes, due 2013 . . . . . . . . . . . . . . . . . . . . . . . . . . . . . . . . . $ 300 $300
2.375% fixed-rate notes, due 2015 . . . . . . . . . . . . . . . . . . . . . . . . . . . . . . . . . 400 400
2.700% fixed-rate notes, due 2018 . . . . . . . . . . . . . . . . . . . . . . . . . . . . . . . . . 500 —
1,200 $700
Unaccreted discount . . . . . . . . . . . . . . . . . . . . . . . . . . . . . . . . . . . . . . . . . . . . (4) (3)
$1,196 $697
F-28

In November 2010 we issued senior unsecured notes in an aggregate principal amount of $700 million. Thesenotes consist of $300 million aggregate principal amount which mature in November 2013, or the 2013 Notes, andbear interest at a fixed rate of 1.500% per annum, and $400 million aggregate principal amount which mature inNovember 2015, or the 2015 Notes, and bear interest at a fixed rate of 2.375% per annum. Interest is payable incash semi-annually in arrears on May 1 and November 1 of each year, beginning on May 1, 2011. The 2013 Noteswere issued at an effective yield of 1.605% and an original issue discount at 99.694% and the 2015 Notes were issuedat an effective yield of 2.494% and an original issue discount at 99.444%.
In September 2011 we entered into and completed an exchange offer registration statement to issue registerednotes with substantially identical terms as the original 2013 and 2015 Notes. Nearly all of the original notes wereexchanged. The exchange offer was made in order to satisfy certain obligations of Broadcom contained in aRegistration Rights Agreement, dated as of November 1, 2010.
In November 2011 we issued senior unsecured notes in aggregate principal amount of $500 million whichmature in November 2018 and bear interest at a fixed rate of 2.700% per annum, or the 2018 Notes. Interest ispayable in cash semi-annually in arrears on May 1 and November 1 of each year, beginning on May 1, 2012. The2018 Notes were issued at an effective yield of 2.762% and an original issue discount at 99.609%.
The 2018 Notes are subject to a mandatory redemption in the event Broadcom’s proposed acquisition ofNetLogic is not consummated on or prior to August 31, 2012, or if prior to August 31 2012, the Agreement andPlan of Merger is terminated. In such an event, the 2018 Notes will be redeemed for cash at a price equal to 101% ofthe aggregate principle amount plus accrued and unpaid interest.
We may redeem the 2013 Notes, the 2015 Notes or 2018 Notes, or the Notes at any time, subject to a specifiedmake-whole premium as defined in the indenture governing the respective Notes. In the event of a change of controltriggering event, each holder of the Notes will have the right to require us to purchase for cash all or a portion of theirNotes at a redemption price of 101% of the aggregate principal amount of such Notes plus accrued and unpaidinterest. Default can be triggered by any missed interest or principal payment, breach of covenant, or in certain eventsof bankruptcy, insolvency or reorganization.
The Notes contain a number of restrictive covenants, including, but not limited to, restrictions on our ability togrant liens on assets; enter into sale and lease-back transactions; or merge, consolidate or sell assets. Failure to complywith these covenants, or any other event of default, could result in acceleration of the principal amount and accruedbut unpaid interest on the Notes.
These Notes are recorded as long-term debt, net of original issue discount. The discount and debt issuance costsassociated with the issuance of the Notes are amortized to interest expense over their respective terms. The effectiverates for the fixed-rate debt include the interest on the notes and the accretion of the original issue discount. Based onthe market prices, the fair value of our Notes was $1.22 billion and $687 million as of December 31, 2011 andDecember 31, 2010, respectively.
Relative to our overall indebtedness, the Notes rank in right of payment (i) equal with all of our other existingand future senior unsecured indebtedness (ii) senior to all of our existing and future subordinated indebtedness, and(iii) effectively subordinated to all of our subsidiaries’ existing and future indebtedness and other obligations(including secured and unsecured obligations) and subordinated to our existing and future secured indebtedness andother obligations, to the extent of the assets securing such indebtedness and other obligations.
Credit Facility
In November 2010 we entered into a credit facility with certain institutional lenders that provides for unsecuredrevolving facility loans, swing line loans and letters of credit in an aggregate amount of up to $500 million. Weamended this credit facility in October 2011 primarily to extend the maturity date by two years to November 19,2016, at which time all outstanding revolving facility loans (if any) and accrued and unpaid interest must be repaid.
F-29

The amendment to the credit facility also decreased the interest rate margins applicable to loans made under thecredit facility and the commitment fee paid on the amount of the unused commitments. We did not draw on ourcredit facility in 2011 or 2010.
Any advances under a Eurodollar Rate Committed Loan will accrue interest at the British Bankers AssociationLIBOR, or BBA LIBOR, plus the Applicable Rate. Any advances under a US Dollar Base Rate Committed Loan willaccrue interest at rates that are equal to the Applicable Rate plus the higher of (a) the Federal Funds Rate plus 0.5%,(b) Bank of America’s “prime rate” as announced from time to time, or (c) BBA LIBOR plus 1.0%. The ApplicableRate is based on our senior debt credit ratings as published by Standard & Poor’s Rating Services and Moody’sInvestors Service, Inc. and can range between 0.625% and 1.500% for Eurodollar Rate Committed Loans and0.000% to 0.500% for US Dollar Base Rate Committed Loans. We are also required to pay a commitment fee onthe actual daily unused amount of commitments. We may also, upon the agreement of the existing lenders, increasethe commitments under the credit facility by up to an additional $100 million. Borrowings of swing line loans bearinterest at a rate equivalent to the US Dollar Base Rate Committed Loans noted above.
The credit facility contains customary representations, warranties and covenants. Financial covenants require usto maintain a consolidated leverage ratio of no more than 3.25 to 1.00 and a consolidated interest coverage ratio ofno less than 3.00 to 1.00.
7. Commitments and Other Contractual Obligations
The following table summarizes our commitments and other contractual obligations as of December 31, 2011:
Payment Obligations by Year
2012 2013 2014 2015 2016 Thereafter Total
(In millions)
Operating leases . . . . . . . . . . . . . . . . . . . . . . . . . . . . . . . $121 $120 $ 90 $ 76 $ 69 $123 $ 599
Inventory and related purchase obligations . . . . . . . . . . . 468 — — — — — 468
Other obligations . . . . . . . . . . . . . . . . . . . . . . . . . . . . . . 147 35 31 30 23 3 269
Long-term debt and related interest . . . . . . . . . . . . . . . . 27 328 23 423 13 527 1,341
$763 $483 $144 $529 $105 $653 $2,677
Facilities rent expense in 2011, 2010 and 2009 was $84 million, $71 million and $70 million, respectively.
Inventory and related purchase obligations represent purchase commitments for silicon wafers and assembly andtest services. We depend upon third party subcontractors to manufacture our silicon wafers and provide assembly andtest services. Due to lengthy subcontractor lead times, we must order these materials and services from subcontractorswell in advance. We expect to receive and pay for these materials and services within the ensuing six months. Oursubcontractor relationships typically allow for the cancellation of outstanding purchase orders, but require payment ofall expenses incurred through the date of cancellation.
Other obligations represent purchase commitments for lab test equipment, computer hardware, informationsystems infrastructure, mask and prototyping costs, intellectual property licensing arrangements and othercommitments made in the ordinary course of business.
For purposes of the table above, obligations for the purchase of goods or services are defined as agreements thatare enforceable and legally binding and that specify all significant terms, including: fixed or minimum quantities tobe purchased; fixed, minimum or variable price provisions; and the approximate timing of the transaction. Ourpurchase orders are based on current manufacturing needs and are typically fulfilled by our vendors within a relativelyshort time horizon. We have additional purchase orders (not included in the table above) that representauthorizations to purchase rather than binding agreements. We do not have significant agreements for the purchaseof inventories or other goods specifying minimum quantities or set prices that exceed our expected requirements.
F-30

8. Shareholders’ Equity
Common Stock
At December 31, 2011 we had 2.5 billion authorized shares of Class A common stock and 400 millionauthorized shares of Class B common stock. The shares of Class A common stock and Class B common stock aresubstantially identical, except that holders of Class A common stock are entitled to one vote for each share held, andholders of Class B common stock are entitled to ten votes for each share held, on all matters submitted to a vote ofthe shareholders. In addition, holders of Class B common stock are entitled to vote separately on the proposedissuance of additional shares of Class B common stock in certain circumstances. The shares of Class B common stockare not publicly traded. Each share of Class B common stock is convertible at any time at the option of the holderinto one share of Class A common stock and in most instances automatically converts upon sale or other transfer.The Class A common stock and Class B common stock are sometimes collectively referred to herein as “commonstock.” In 2011, 2010 and 2009, 1 million, 3 million and 6 million shares, respectively, of Class B common stockwere automatically converted into a like number of shares of Class A common stock upon sale or other transferpursuant to the terms of our Articles of Incorporation.
Share Repurchase Programs
From time to time our Board of Directors has authorized various programs to repurchase shares of our Class Acommon stock depending on market conditions and other factors. In February 2010 we announced that our Boardof Directors had authorized an evergreen share repurchase program intended to offset dilution of incremental grantsof stock awards associated with our stock incentive plans. The maximum number of shares of our Class A commonstock that may be repurchased in any one year (including under an ASR or other arrangement) is equal to the totalnumber of shares issued pursuant to our equity awards in the previous year and the current year. Our February 2010share repurchase program does not have an expiration date and may be suspended at any time at the discretion of theBoard of Directors.
In February 2011 we entered into an accelerated share repurchase, or ASR, agreement to repurchase $300million of our Class A common stock, which was recorded as a reduction to shareholders’ equity. Under the ASRprogram we received and cancelled 7 million shares of our Class A common stock with a weighted average price of$42.64 per share.
In addition to the shares repurchased under the ASR in February 2011, we repurchased 10 million shares of ourClass A common stock at a weighted average price of $36.84 per share in 2011. We repurchased 9 million and15 million shares of our Class A common stock at a weighted average prices of $30.86 and $28.12 per share in 2010and 2009, respectively.
Repurchases under our share repurchase programs were and are intended to be made in open market or privatelynegotiated transactions in compliance with Rule 10b-18 promulgated under the Securities Exchange Act of 1934, asamended, or the Exchange Act.
Quarterly Dividend
In January 2010 our Board of Directors adopted a dividend policy pursuant to which we intend to pay quarterlycash dividends on our common stock. Our Board of Directors declared quarterly cash dividends of $0.08 percommon share payable to holders of our common stock in each quarter of 2010. In January 2011 our Board ofDirectors adopted an amendment to the existing dividend policy pursuant to which we increased the quarterly cashdividends by 12.5% to $0.09 per common share ($0.36 per share on an annual basis) and declared quarterly cashdividend of $0.09 per share payable to holders of our common stock in each quarter of 2011. In 2011 and 2010 wepaid $194 million and $163 million, respectively, in dividends to holders of our Class A and Class B common stock.These dividends were paid from U.S. domestic sources other than our retained earnings and are accounted for asreductions of shareholders’ equity.
F-31

Registration Statements
We have a Form S-3 universal shelf registration statement and a Form S-4 acquisition shelf registrationstatement on file with the SEC. The universal shelf registration statement on Form S-3 permits Broadcom to sell, inone or more public offerings, shares of our Class A common stock, shares of preferred stock or debt securities, or anycombination of such securities, for proceeds in an aggregate amount of up to $1.5 billion. The 2018 Notes with anaggregate principal amount of $500 million that we issued in November 2011 (more fully described in Note 6) wereissued pursuant to the Form S-3. The Form S-3 will expire in accordance with applicable SEC rules on February 27,2012. The acquisition shelf registration statement on Form S-4 enables us to issue up to 30 million shares of ourClass A common stock in one or more acquisition transactions. These transactions may include the acquisition ofassets, businesses or securities by any form of business combination. To date no securities have been issued pursuantto the S-4 registration statement, which does not have an expiration date mandated by SEC rules.
9. Employee Benefit Plans
Employee Stock Purchase Plan
We have an employee stock purchase plan, or ESPP, for all eligible employees. Under the ESPP, employees maypurchase shares of our Class A common stock at six-month intervals at 85% of fair market value (calculated in themanner provided in the plan). Employees purchase such stock using payroll deductions, which may not exceed 15%of their total cash compensation. Shares of Class A common stock are offered under the ESPP through a series ofsuccessive offering periods, generally with a maximum duration of 24 months, subject to an additional 3-monthextension under certain circumstances. The plan imposes certain limitations upon an employee’s right to acquireClass A common stock, including the following: (i) no employee may purchase more than 9,000 shares of Class Acommon stock on any one purchase date, (ii) no employee may be granted rights to purchase more than $25,000worth of Class A common stock for each calendar year that such rights are at any time outstanding, and (iii) themaximum number of shares of Class A common stock purchasable in total by all participants in the ESPP on anypurchase date is limited to 4 million shares. The number of shares of Class A common stock reserved for issuanceunder the plan automatically increases in January each year. The increase is equal to a percentage of the total numberof shares of common stock outstanding on the last trading day of the immediately preceding year, subject to anannual share limit.
In 2011, 2010 and 2009, 4 million, 6 million and 6 million shares, respectively, were issued under this plan ataverage per share prices of $29.93, $15.21 and $14.59, respectively. At December 31, 2011, 14 million shares wereavailable for future issuance under this plan.
Stock Incentive Plans
We have in effect stock incentive plans under which incentive stock options have been granted to employees andrestricted stock units and non-qualified stock options have been granted to employees and non-employee members ofthe Board of Directors. Our 1998 Stock Incentive Plan, as amended and restated, or 1998 Plan, is the successorequity incentive program to our 1994 Stock Option Plan, or 1994 Plan and our 1998 Special Stock Option Plan,together, the Predecessor Plans. The number of shares of Class A common stock reserved for issuance under the 1998Plan automatically increases in January each year. The increase is equal to 4.5% of the total number of shares ofcommon stock outstanding on the last trading day of the immediately preceding year, subject to an annual sharelimit.
The Board of Directors or the Plan Administrator determines eligibility, vesting schedules and exercise prices foroptions granted under the plans. Options granted generally have a term of 10 years, and in the case of new hiresgenerally vest and become exercisable at the rate of 25% after one year and ratably on a monthly basis over a periodof 36 months thereafter; subsequent option grants to existing employees generally vest and become exercisable ratablyon a monthly basis over a period of 48 months measured from the date of grant. However, certain options that havebeen granted under our 1998 Plan or that were assumed by us in connection with certain of our acquisitions providethat the vesting of the options granted thereunder will accelerate in whole or in part upon the occurrence of certainspecified events.
F-32

In addition, we grant restricted stock units to certain employees as part of our regular annual employee equitycompensation review program as well as to selected new hires and to non-employee members of the Board ofDirectors. Restricted stock units are share awards that entitle the holder to receive freely tradable shares of our Class Acommon stock upon vesting. Generally, restricted stock units vest ratably on a quarterly basis over 16 quarters fromthe date of grant. On a limited basis, we grant certain restricted stock units that vest in their entirety after three years.
In January 2011 the Compensation Committee adopted a Performance Restricted Stock Units Incentive AwardProgram, or the PRSU Program. In 2011 we granted 0.2 million PRSUs that were based on 2010 performancetargets under the PRSU Program. Under the terms of the PRSU Program, the award recipients were also awardedgrants of the same number of PRSUs to be made in the subsequent two calendar years on the basis of having met the2010 performance targets.
In connection with certain acquisitions, we have assumed stock options granted under stock option plans oragreements established by the acquired company. As of December 31, 2011, 1 million shares of Class Acommon stock were reserved for issuance upon exercise of outstanding options assumed under these stock optionplans.
Combined Incentive Plan Activity
Activity under all stock option incentive plans is set forth below:
Options Outstanding
Number ofShares
ExercisePrice Rangeper Share
WeightedAverageExercise
Priceper Share
WeightedAverage
Grant-DateFair Valueper Share
(In millions)
Balance at December 31, 2008 . . . . . . . . . . . . . . . . . . . . . . . . 122 $ .01 - 81.50 $25.42 $15.66
Options granted under the 1998 Plan . . . . . . . . . . . . . . . . . . . 3 17.83 - 29.07 23.26 10.91
Options cancelled . . . . . . . . . . . . . . . . . . . . . . . . . . . . . . . . . . (4) .01 - 48.63 31.12 15.71
Options exercised . . . . . . . . . . . . . . . . . . . . . . . . . . . . . . . . . . . (8) .01 - 31.08 17.93 13.23
Balance at December 31, 2009 . . . . . . . . . . . . . . . . . . . . . . . . 113 .01 - 81.50 25.71 15.71
Options granted under the 1998 Plan . . . . . . . . . . . . . . . . . . . 3 29.39 - 42.34 29.64 9.43
Options issued in connection with acquisitions . . . . . . . . . . . . 1 0.55 - 41.57 14.26 25.76
Options cancelled . . . . . . . . . . . . . . . . . . . . . . . . . . . . . . . . . . (1) .01 - 81.50 36.47 15.24
Options exercised . . . . . . . . . . . . . . . . . . . . . . . . . . . . . . . . . . . (38) .01 - 44.99 22.56 16.88
Balance at December 31, 2010 . . . . . . . . . . . . . . . . . . . . . . . . 78 .01 - 48.63 27.05 15.05
Options granted under the 1998 Plan . . . . . . . . . . . . . . . . . . . — 45.82 45.82 11.72
Options cancelled . . . . . . . . . . . . . . . . . . . . . . . . . . . . . . . . . . (2) 0.55 - 48.63 30.08 11.87
Options exercised . . . . . . . . . . . . . . . . . . . . . . . . . . . . . . . . . . . (10) .01 - 45.05 23.48 15.86
Balance at December 31, 2011 . . . . . . . . . . . . . . . . . . . . . . . . 66 $ .01 - 48.63 $27.47 $15.10
At December 31, 2011 outstanding options to purchase 63 million shares were exercisable with an average pershare exercise price of $27.57. The weighted average remaining contractual lives of options outstanding and ofoptions exercisable as of December 31, 2011 were 3.7 years and 3.6 years, respectively.
The total pretax intrinsic value of options exercised in 2011 was $163 million. This intrinsic value represents thedifference between the fair market value of our Class A common stock on the date of exercise and the exercise price ofeach option. Based on the closing price of our Class A common stock of $29.36 on December 31, 2011, the totalpretax intrinsic value of all outstanding options was $300 million. The total pretax intrinsic value of exercisableoptions at December 31, 2011 was $286 million.
F-33

Restricted stock unit activity is set forth below:Restricted Stock Units
Outstanding
Number ofShares
WeightedAverage
Grant-DateFair Valueper Share
(In millions)
Balance at December 31, 2008 . . . . . . . . . . . . . . . . . . . . . . . . . . . . . 28 $27.61
Restricted stock units granted . . . . . . . . . . . . . . . . . . . . . . . . . . . . . . 14 24.06
Restricted stock units cancelled . . . . . . . . . . . . . . . . . . . . . . . . . . . . . (2) 24.51
Restricted stock units vested . . . . . . . . . . . . . . . . . . . . . . . . . . . . . . . (11) 28.84
Balance at December 31, 2009 . . . . . . . . . . . . . . . . . . . . . . . . . . . . . 29 25.58
Restricted stock units granted . . . . . . . . . . . . . . . . . . . . . . . . . . . . . . 13 30.91
Restricted stock units cancelled . . . . . . . . . . . . . . . . . . . . . . . . . . . . . (1) 26.04
Restricted stock units vested . . . . . . . . . . . . . . . . . . . . . . . . . . . . . . . (13) 27.44
Balance at December 31, 2010 . . . . . . . . . . . . . . . . . . . . . . . . . . . . . 28 27.17
Restricted stock units granted . . . . . . . . . . . . . . . . . . . . . . . . . . . . . . 10 42.45
Restricted stock units cancelled . . . . . . . . . . . . . . . . . . . . . . . . . . . . . (2) 31.63
Restricted stock units vested . . . . . . . . . . . . . . . . . . . . . . . . . . . . . . . (14) 28.84
Balance at December 31, 2011 . . . . . . . . . . . . . . . . . . . . . . . . . . . . . 22 $32.88
The total pretax intrinsic value of restricted stock units that vested in 2011 was $397 million. Based on theclosing price of our Class A common stock of $29.36 on December 31, 2011, the total pretax intrinsic value of alloutstanding restricted stock units was $659 million.
The per share fair values of stock options granted in connection with stock incentive plans and rights granted inconnection with the employee stock purchase plan have been estimated with the following weighted averageassumptions:
Employee Stock Options Employee Stock Purchase Rights
2011 2010 2009 2011 2010 2009
Expected life (in years) . . . . . . . 3.60 4.08 4.98 1.70 1.23 0.92
Implied volatility . . . . . . . . . . . 0.34 0.39 0.53 0.37 0.39 0.53
Risk-free interest rate . . . . . . . . 1.56% 1.61% 1.83% 0.50% 0.25% 0.46%
Expected dividend yield . . . . . . 0.80% 1.00% 0.00% 0.99% 0.76% 0.00%
Weighted average fair value . . . $11.72 $13.47 $10.91 $11.01 $11.83 $7.39
Stock-Based Compensation Expense
The following table presents details of total stock-based compensation expense that is included in each functionalline item on our consolidated statements of income:
Year Ended December 31,
2011 2010 2009
(In millions)
Cost of product revenue . . . . . . . . . . . . . . . . . . . . . . . . . . . . . . . . . . $ 24 $ 23 $ 25
Research and development . . . . . . . . . . . . . . . . . . . . . . . . . . . . . . . . . 364 341 352
Selling, general and administrative . . . . . . . . . . . . . . . . . . . . . . . . . . . 126 119 120
$514 $483 $497
F-34

The following table presents details of unearned stock-based compensation currently estimated to be expensedin 2012 through 2015 related to unvested share-based payment awards at December 31, 2011:
2012 2013 2014 2015 Total
(In millions)
Unearned stock-based compensation . . . . . . . . . . . . . . . . . . . $357 $228 $119 $21 $725
The weighted-average period over which the unearned stock-based compensation is expected to be recognized is1.3 years.
If there are any modifications or cancellations of the underlying unvested awards, we may be required toaccelerate, increase or cancel any remaining unearned stock-based compensation expense. Future stock-basedcompensation expense and unearned stock-based compensation will increase to the extent that we grant additionalequity awards or assume unvested equity awards in connection with acquisitions.
Shares Reserved For Future Issuance
We had the following shares of common stock reserved for future issuance upon the exercise or issuance ofequity instruments:
Number of Shares
(In millions)
Stock options outstanding . . . . . . . . . . . . . . . . . . . . . . . . . . . . . . . . . . . . . . . . . . . . . . . 66
Authorized for future grants under stock incentive plans . . . . . . . . . . . . . . . . . . . . . . . . 112
Authorized for future issuance under stock purchase plan . . . . . . . . . . . . . . . . . . . . . . . 14
Restricted stock units outstanding . . . . . . . . . . . . . . . . . . . . . . . . . . . . . . . . . . . . . . . . . 22
Balance at December 31, 2011 . . . . . . . . . . . . . . . . . . . . . . . . . . . . . . . . . . . . . . . . . . . 214
401(k) Savings and Investment Plan
We sponsor a defined contribution 401(k) savings and investment plan, established in 1996, coveringsubstantially all of our U.S. employees, subject to certain eligibility requirements. At our discretion, we may makecontributions to this plan. We have a limited matching contribution policy under which we made $14 million,$11 million and $7 million in contributions to participants in this plan in 2011, 2010 and 2009, respectively.
10. Goodwill and Long-Lived Assets
In 2011 we made a qualitative assessment of whether goodwill impairment exists. Since we did not determinethat it was more likely than not that the fair value of a reporting unit is less than its carrying amount, we were notrequired to perform the current two-step goodwill impairment test. At December 31, 2011 the book value of theCompany was $6.52 billion while the market capitalization was $15.99 billion. We performed annual impairmentassessments of the carrying value of goodwill in October 2010 and 2009. We compared the carrying value of each ofour reporting units that existed at those times to its estimated fair value.
We estimated the fair values of our reporting units primarily using the income approach valuation methodologythat includes the discounted cash flow method, taking into consideration the market approach and certain marketmultiples as a validation of the values derived using the discounted cash flow methodology. The discounted cashflows for each reporting unit were based on discrete financial forecasts developed by management for planningpurposes. Cash flows beyond the discrete forecasts were estimated using a terminal value calculation, whichincorporated historical and forecasted financial trends for each identified reporting unit and considered perpetualearnings growth rates for publicly traded peer companies. Future cash flows were discounted to present value byincorporating appropriate present value techniques.
F-35

Specifically, the income approach valuations included the following assumptions for 2010 and 2009:2010 2009
Discount Rate . . . . . . . . . . . . . . . . . . . . . . . . . . . . . . . . . . . . . . . . . . . . 12.0% - 17.7% 12.0% - 17.5%
Perpetual Growth Rate . . . . . . . . . . . . . . . . . . . . . . . . . . . . . . . . . . . . . 4.0% 4.0%
Tax . . . . . . . . . . . . . . . . . . . . . . . . . . . . . . . . . . . . . . . . . . . . . . . . . . . . 17.0% 17.0%
Risk Free Rate . . . . . . . . . . . . . . . . . . . . . . . . . . . . . . . . . . . . . . . . . . . . 3.4% 4.0%
Peer Company Beta . . . . . . . . . . . . . . . . . . . . . . . . . . . . . . . . . . . . . . . . 1.26 - 1.52 1.24 - 1.69
Upon completion of the October 2011, 2010 and 2009 annual impairment assessments, we determined noimpairment was indicated as the estimated fair value of each of the reporting units exceeded its respective carryingvalue.
In 2011 we recorded a purchased intangible impairments charge of $74 million related to our acquisition ofBeceem. The primary factor contributing to this impairment charge was a reduction in the forecasted cash flowsrelated to WiMAX products, as wireless service providers have accelerated their adoption of competing Long TermEvolution, or LTE, products. In addition we recorded other impairment charges of $18 million in 2011.
In 2010 we recorded an impairment charge of $19 million, primarily related to a technology license that wasacquired in 2008 from Sunext Design, Inc. In 2009 we recorded impairment charges to customer relationships,developed technology and certain other assets of $19 million related to the acquisition of the DTV Business of AMDin 2008. The primary factor contributing to these impairment charges was the continued reduction in our revenueoutlook for these businesses, and the related decrease to the estimated cash flows identified with the impaired assets.
In determining the amount of these impairment charges we calculated fair values as of the impairment date foracquired developed technology, IPR&D and customer relationships. The fair value for the first two assets wasdetermined using the multiple period excess earnings method, which method is described above in Note 3. The fairvalue of acquired customer relationships was based on the benefit derived from the incremental revenue and relatedcash flow as a direct result of the customer relationship. The fair values were determined using significantunobservable inputs categorized as Level 3 inputs.
11. Settlement Costs (Gains), Net
In 2011 we recorded settlement gains of $55 million primarily related to the settlement of the federalconsolidated shareholder derivative action, or the Derivative Settlement, partially offset by net settlement costs of $37million related to patent infringement claims, resulting in net settlement gains of $18 million. In 2010 we recordedsettlement costs of $53 million primarily related to licensing and settlement agreements and certain employment taxitems. In 2009 we incurred settlement costs of $184 million, partially offset by settlement gains of $66 million,resulting in $118 million of net settlement costs.
On March 18, 2011 Broadcom announced that the remaining defendants in the federal consolidatedshareholder derivative action relating to the company’s historical stock option accounting practices entered into asettlement. On May 23, 2011, the District Court entered an order granting final approval of the DerivativeSettlement. Pursuant to the Derivative Settlement:
- Broadcom received a payment from Henry T. Nicholas, III, our former President and Chief Executive Officerand former Co-Chairman of the Board, of approximately $27 million;
- Broadcom cancelled unexercised Broadcom stock options held by Dr. Henry Samueli, our Chief TechnicalOfficer and member of our Board of Directors, valued at approximately $14 million, using a Black-Scholesanalysis based on the closing price of Broadcom’s Class A common stock on the date the settlement wasdeemed final (such stock options were originally valued at $24 million for purposes of the settlement (usingthe same methodology used to value equity granted to employees in the February annual focal compensationreview)); and
- Dr. Samueli contributed approximately $2 million in cash to the Broadcom Foundation (through BroadcomCorporation).
F-36

We entered into a stipulation and agreement of settlement of the Stock Option Class Actions dated as ofApril 30, 2010, which provides for the claims against Broadcom and its current and former officers and directors tobe dismissed with prejudice and released in exchange for a $161 million cash payment by Broadcom. We recordedthe settlement amount as a one-time charge in our statement of income for the three months and year endedDecember 31, 2009 and subsequent payment was made in June 2010 into a settlement fund.
We recorded settlement gains of $65 million related to the Qualcomm Agreement in 2009. For a furtherdiscussion of this agreement, see Note 2. In addition, we recorded settlement costs of $12 million related to apayment to the Israeli government associated with a post-acquisition technology transfer fee related to our acquisitionof Dune Networks. We also recorded $11 million in settlement costs in 2009 for estimated settlements associatedwith certain employment tax items, other employment matters and a patent infringement claim.
For further discussion of litigation matters, see Note 12.
12. Litigation
We and certain of our subsidiaries are currently parties to various legal proceedings, including those noted inthis section. Unless otherwise noted below, during the period presented we have not: recorded any accrual for losscontingencies associated with such legal proceedings; determined that an unfavorable outcome is probable orreasonably possible; or determined that the amount or range of any possible loss is reasonably estimable. We areengaged in numerous other legal actions not described below arising in the ordinary course of our business and, whilethere can be no assurance, we believe that the ultimate outcome of these actions will not have a material adverse effecton our operating results, liquidity or financial position.
From time to time we may conclude it is in the best interests of our shareholders, employees, and customers tosettle one or more litigation matters, and any such settlement could include substantial payments; however, otherthan as noted below, we have not reached this conclusion with respect to any particular matter at this time. There area variety of factors that influence our decisions to settle and the amount we may choose to pay, including the strengthof our case, developments in the litigation, the behavior of other interested parties, the demand on management timeand the possible distraction of our employees associated with the case and/or the possibility that we may be subject toan injunction or other equitable remedy. It is difficult to predict whether a settlement is possible, the amount of anappropriate settlement or when is the opportune time to settle a matter in light of the numerous factors that go intothe settlement decision.
Intellectual Property Proceedings
In September 2009 we filed a complaint in the United States District Court for the Central District ofCalifornia against Emulex Corporation, or Emulex, alleging infringement of ten patents generally relating tonetworking technologies. In subsequent filings, we added two additional patents and withdrew six patents, bringingthe total to six asserted patents. In its answers, Emulex denied liability and asserted counterclaims seeking adeclaratory judgment that the asserted patents are invalid and not infringed. A trial occurred in September andOctober 2011, and the Court heard post-trial motions in December 2011.
The Court has found that all six asserted Broadcom patents are not invalid. The Court further found Emulexinfringed U.S. Patent No. 7,058,150 and 7,471,691. On January 6, 2012, we filed a motion for injunctive relief onthe ‘150 and ‘691 patents, which motion is scheduled to be heard in March 2012. On the remaining four patents,the jury found one patent not infringed and failed to reach a verdict on the other three, resulting in a mistrial onthose three patents. The Court has not yet scheduled a new trial on the three patents.
In November 2009 we filed a complaint in the United States District Court for the Eastern District of Texasagainst the Commonwealth Scientific and Industrial Research Organisation, or CSIRO, seeking a declaratoryjudgment that a certain U.S. patent number is invalid, unenforceable and not infringed. CSIRO has answered thecomplaint and counterclaimed for infringement against Broadcom wireless LAN products and seeking damages,attorney’s fees, and an injunction. In connection with an ex parte reexamination, the Patent Office has issued aReexamination Certificate allowing the original claims of CSIRO’s patent and adding some amended claims.However, the Patent Office subsequently initiated a reexamination and rejected all effective claims of thepatent-in-suit, including the amended claims. Trial has been set for April 2012.
F-37

In August 2010, Broadcom filed a motion to intervene (i.e., to be added as a party) in U.S. Ethernet Innovations,LLC v. Acer, Inc., Case No. 10-cv-03724-JW (N.D. Cal.). In this case, U.S. Ethernet Innovations, LLC, or USEI,filed a patent infringement complaint alleging that numerous companies, including certain Broadcom customers,infringe four patents relating generally to Ethernet technology. USEI seeks monetary damages, attorney’s fees, and aninjunction. Defendants have filed answers denying the allegations in USEI’s complaint and asserting counterclaimsfor declaratory judgment that USEI’s patents are invalid, unenforceable, and not infringed. Broadcom contends thatit has a license related to USEI’s patents and is seeking to assert this license as a defense. In December 2010, theCourt granted Broadcom’s motion to intervene. A claims construction hearing was held on October 21, 2011, andno trial date has been set.
Since December 2006 Broadcom and its subsidiary, Global Locate, Inc., were engaged in various litigationmatters with SiRF Technology, Inc., which company was later acquired by CSR plc. On January 10, 2011,Broadcom and CSR announced that the parties had settled all outstanding litigation between themselves and theirsubsidiaries. The consideration received and to be received under the agreement was allocated on a relative fair valuebasis between a settlement gain and patent licensing royalty revenue. Revenue derived from the patent license will berecognized as licensing revenue.
Since December 2010, Broadcom was engaged in litigation with Rambus, Inc. in the United States DistrictCourt for the Northern District of California and the United States International Trade Commission. In the districtcourt, Rambus alleged that certain Broadcom products infringe nineteen patents relating generally to memorycontroller and high speed interface technologies. In the International Trade Commission Rambus asserted thatBroadcom engaged in unfair trade practices by importing certain memory controllers and devices having certainaccused interface technologies that allegedly infringe six patents. On December 22, 2011 the parties settled alloutstanding litigation, and signed a five year patent license, whereby we were required to pay certain amounts foralleged prior infringement and the licensing of intellectual property. On December 29, 2011, the United StatesDistrict Court entered a dismissal of the litigation between Rambus and Broadcom. Also on December 29, 2011,Rambus and Broadcom filed a joint motion to terminate the International Trade Commission investigation as toBroadcom, which was granted by the Administrative Law Judge on January 17, 2012, and is currently pending withthe Commission. The settlement was treated as a multiple element arrangement and the consideration was allocatedto alleged prior infringement and licensing of intellectual property for future use. The consideration allocated toalleged prior infringement was recognized as a settlement cost in our consolidated statement of income in 2011.
We and our subsidiaries are also involved in other intellectual property proceedings, claims and litigation. Wewill disclose the nature of any such matter if we believe it to be material. Particularly in the early stages of suchproceedings, an assessment of materiality may be complicated by limited information, including, without limitation,limited information about the patents-in-suit and Broadcom products against which the patents are being asserted.Accordingly, our assessment of materiality may change in the future based upon availability of discovery and furtherdevelopments in the proceedings at issue. Some of these intellectual property proceedings may involve, for example,“non-practicing entities” asserting claims addressing certain of our products. The resolution of intellectual propertylitigation can include, among other things, payment of damages, royalties, or other amounts, which could adversely,impact our product gross margins in future periods, or could prevent us from manufacturing or selling some of ourproducts or limit or restrict the type of work that employees may perform for us. In addition, from time to time weare approached by holders of intellectual property, including non-practicing entities, to engage in discussions aboutour obtaining licenses to their intellectual property. We will disclose the nature of any such discussion if wedetermine that (i) it is probable an intellectual property holder will assert a claim of infringement, (ii) there is areasonable possibility the outcome (assuming assertion) will be unfavorable, and (iii) the resulting liability would bematerial to our financial condition.
Other Litigation
In November 2009 Emulex filed a complaint in the Central District of California against Broadcom allegingviolation of the antitrust laws, defamation, and unfair competition. The complaint seeks injunctive relief andmonetary damages, including treble damages and attorneys’ fees. In January 2010, Emulex filed an amendedcomplaint in which Emulex removed, among other things, the claim of unfair competition. In February 2010, we
F-38

filed motions to dismiss the case and a motion to strike. In June 2010, the District Court granted in part and deniedin part our motion to dismiss and denied our motion to strike. In July 2010, we filed a notice of appeal of theDistrict Court’s denial of our motion to strike. In November 2010, the parties agreed to a voluntary stay of theappeal. Trial has been scheduled for January 2013.
In April 2011 Motorola Mobility, Inc., or MMI, filed a third-party complaint against Broadcom in the U.S.District Court for the District of Colorado, alleging that we breached a duty to defend, indemnify, and hold MMIharmless for certain patent infringement claims that MMI is defending. In the same action, MMI is defending itselfagainst claims for patent infringement brought by Biax Corporation involving certain U.S. patents. In December2011 we entered into a settlement agreement with MMI, pursuant to which MMI filed a motion to dismiss its claimsagainst Broadcom without prejudice. On January 6, 2012 the Court granted MMI’s motion to dismiss.
As previously reported in our Annual Report on Form 10-K for the year ended December 31, 2010, in 2006 anumber of purported Broadcom shareholders filed putative shareholder derivative actions in state and federal courtagainst Broadcom, each of the then members of our Board of Directors and certain current or former officers,alleging, among other things, that the defendants improperly dated certain Broadcom employee stock option grants.In August 2009 Broadcom plaintiffs and certain defendants executed a Stipulation and Agreement of PartialSettlement in the federal derivative action, which resolved all claims except those against three individuals:Dr. Henry T. Nicholas, III, our former President and Chief Executive Officer and former Co-Chairman of theBoard, William J. Ruehle, our former Chief Financial Officer, and Dr. Henry Samueli, our Chief Technical Officerand member of our Board of Directors.
In March 2011, Broadcom, plaintiffs and the three remaining defendants executed a Stipulation and Agreementof Settlement, or Derivative Settlement, in the federal derivative action. On May 23, 2011, the District Courtentered an order granting final approval of the Derivative Settlement. Pursuant to the Derivative Settlement, amongother things: (i) Broadcom received a payment from Dr. Nicholas of approximately $27 million, which was recordedas a settlement gain in our consolidated statements of income; (ii) Broadcom cancelled unexercised Broadcom stockoptions held by Dr. Samueli valued at approximately $14 million, using a Black-Scholes analysis based on the closingprice of Broadcom’s Class A common stock on the date the settlement was deemed final, which amount was recordedas a settlement gain in our consolidated statements of income; (iii) Dr. Samueli contributed approximately $2 millionin cash to the Broadcom Foundation (through Broadcom Corporation), which was recorded as a settlement gain inour consolidated statements of income; (iv) Mr. Ruehle executed and filed a Notice of Dismissal with Prejudice of anaction filed by him against Broadcom, which sought damages in excess of $26 million; and (v) Dr. Nicholas,Mr. Ruehle and Dr. Samueli were dismissed with prejudice from the federal consolidated shareholder derivativelitigation.
Upon Court approval of the Derivative Settlement, Broadcom paid plaintiffs’ counsel $25 million of thesettlement proceeds for attorneys’ fees, expenses, and costs, which was recorded as an operating expense in theconsolidated statements of income. In addition, Broadcom contributed approximately $25 million to the BroadcomFoundation (which included the $2 million payment from Dr. Samueli discussed above). Such amount was recordedas a charitable contribution in the consolidated statements of income. On July 1, 2011, the plaintiffs in the statederivative action filed a request for dismissal with prejudice of that action. The Court entered an order dismissing thestate derivative action on July 8, 2011.
In April 2008 we delivered a Notice of Arbitration and Arbitration Claim to our former independent registeredpublic accounting firm Ernst & Young LLP, or E&Y, and certain related parties. The arbitration relates to the issuesthat led to the restatement of Broadcom’s financial statements for the periods from 1998 through March 31, 2006 asdisclosed in an amended Annual Report on Form 10-K/A for the year ended December 31, 2005 and an amendedQuarterly Report on Form 10-Q/A for the three months ended March 31, 2006, each filed with the SEC January 23,2007. In May 2008 E&Y delivered a Notice of Defense and Counterclaim. The arbitration hearing has beenscheduled for October 2012.
In September 2011, two lawsuits were filed by stockholders of NetLogic Microsystems Inc. purporting to assertclaims arising from Broadcom’s entry into a definitive merger agreement with NetLogic under which a subsidiary ofBroadcom, I&N Acquisition Corp., will be merged with and into NetLogic. On November 11, 2011, all parties to
F-39

these actions, captioned New Jersey Carpenters’ Pension Fund v. Broyles et al., (Cal. Super. Ct. County of SantaClara, Case No. 1-11-CV-209381) (referred to as the California Action), and Danielo v. NetLogic Microsystems, etal., (Del. Ct. of Chancery, Case No. 6881-VCG) (referred to as the Delaware Action), executed a Memorandum ofUnderstanding, or MOU, respecting a proposed settlement of the claims in each of those actions. The terms of theproposed settlement required NetLogic to make certain supplemental disclosures regarding the Merger in a Form8-K filed with the Securities and Exchange Commission by NetLogic on November 14, 2011, and contemplate thepayment by NetLogic of attorneys fees’ and costs to counsel representing the plaintiffs in the amount of $795,000, orsuch lower amount as the Court may order. The terms of the MOU also provide for a general stay of proceedings inboth actions, excluding proceedings related to finalizing and seeking court approval of the proposed settlement andany necessary confirmatory discovery. The parties in the California Action are currently negotiating the terms of aStipulation of Settlement to present to the Court for preliminary approval. Under the terms of the MOU and thestipulation, the Delaware Action will be voluntarily dismissed with prejudice upon the Court’s final approval of thestipulation in the California Action.
General
We and our subsidiaries are also involved in other legal proceedings, claims and litigation arising in the ordinarycourse of business. We will disclose the nature of any such matter if we believe it to be material.
The pending proceedings described above involve complex questions of fact and law and may require theexpenditure of significant funds and the diversion of other resources to prosecute and defend. The results of legalproceedings are inherently uncertain, and material adverse outcomes are possible. From time to time we may enterinto confidential discussions regarding the potential settlement of pending intellectual property or other litigation orother proceedings; however, there can be no assurance that any such discussions will occur or will result in asettlement. In the course of such settlement discussions, if we conclude that a settlement is probable and thesettlement amount is estimable we may record settlement costs, notwithstanding not having reached a finalsettlement agreement. In the three months ended September 30, 2011 and December 31, 2011 we recorded netsettlement costs of $27 million and $5 million, respectively, related to the actual and potential settlements of patentinfringement claims referenced above. Upon the occurrence of certain events, we may be required to recordadditional settlement costs of up to $20 million. The settlement of any pending litigation or other proceeding couldrequire us to incur substantial settlement payments and costs. Furthermore, the settlement of any intellectualproperty proceeding may require us to grant a license to certain of our intellectual property rights to the other partyunder a cross-license agreement. If any of those events were to occur, our business, financial condition and results ofoperations could be materially and adversely affected. See Note 11 for an additional breakout of our settlement costs(gains).
13. Business Enterprise Segments, Significant Customer, Supplier and Geographical Information
Business Enterprise Segments
Broadcom has three reportable segments consistent with our target markets. Our three reportable segments are:Broadband Communications (Home), Mobile & Wireless (Hand) and Infrastructure & Networking (Infrastructure).Our Chief Executive Officer, who is our chief operating decision maker, or CODM, reviews financial information atthe reporting segment level. In January 2011, our Mobile Platforms and Wireless Connectivity businesses werecombined for internal reporting purposes, which aligns with our externally reported Mobile & Wireless segment.
We also report an “All Other” category that primarily includes licensing revenue from our agreement withVerizon Wireless and income from the Qualcomm Agreement since they are principally the result of corporateefforts. “All Other” also includes operating expenses that we do not allocate to our other operating segments as theseexpenses are not included in the segment operating performance measures evaluated by our CODM. Operating costsand expenses that are not allocated include stock-based compensation, amortization of purchased intangible assets,impairment of goodwill and other long-lived assets, net settlement costs, net restructuring costs, charitablecontributions, employer payroll tax on certain stock option exercises, and other miscellaneous expenses related tocorporate allocations that were either over or under the original projections at the beginning of the year. We includestock-based compensation and acquisition-related items in the “All Other” category as decisions regarding equity
F-40

compensation are made at the corporate level and our CODM reviews reportable segment performance exclusive ofthese charges. In 2010, we reclassified the amortization of acquired inventory valuation step-up from its respectivereportable segment into the “All Other” category, as these charges are the result of acquisition accounting and webelieve these amounts should not be included when measuring our reportable segments’ operating performance. Priorperiod amounts have been reclassified to conform to the current period presentation. Our CODM does not reviewinformation regarding total assets, interest income or income taxes on an operating segment basis. The accountingpolicies for segment reporting are the same as for Broadcom as a whole.
The following tables present details of our reportable segments and the “All Other” category:
Reportable Segments
BroadbandCommunications
Mobile &Wireless
Infrastructure &Networking
AllOther Consolidated
(In millions)
Year ended December 31, 2011
Net revenue . . . . . . . . . . . . . . . . . . . . . . . . $2,039 $3,484 $1,658 $ 208 $7,389
Operating income (loss) . . . . . . . . . . . . . . . 391 573 545 (556) 953
Year ended December 31, 2010
Net revenue . . . . . . . . . . . . . . . . . . . . . . . . $2,134 $2,889 $1,588 $ 207 $6,818
Operating income (loss) . . . . . . . . . . . . . . . 447 526 578 (469) 1,082
Year ended December 31, 2009
Net revenue . . . . . . . . . . . . . . . . . . . . . . . . $1,525 $1,720 $1,056 $ 189 $4,490
Operating income (loss) . . . . . . . . . . . . . . . 180 117 288 (529) 56
Included in the “All Other” category: Year Ended December 31,
2011 2010 2009
(In millions)
Net revenue . . . . . . . . . . . . . . . . . . . . . . . . . . . . . . . . . . . . . . . . . . . . $ 208 $ 207 $ 189
Stock-based compensation . . . . . . . . . . . . . . . . . . . . . . . . . . . . . . . . . $ 514 $ 483 $ 497
Amortization of purchased intangible assets . . . . . . . . . . . . . . . . . . . . 84 59 31
Amortization of acquired inventory valuation step-up . . . . . . . . . . . . 24 10 9
Impairment of long-lived assets . . . . . . . . . . . . . . . . . . . . . . . . . . . . . 92 19 19
Settlement costs (gains), net . . . . . . . . . . . . . . . . . . . . . . . . . . . . . . . . (18) 53 118
Restructuring costs, net . . . . . . . . . . . . . . . . . . . . . . . . . . . . . . . . . . . 16 — 7
Charitable contributions . . . . . . . . . . . . . . . . . . . . . . . . . . . . . . . . . . 25 — 50
Non-recurring legal fees . . . . . . . . . . . . . . . . . . . . . . . . . . . . . . . . . . . 25 — 12
Change in contingent earnout liability . . . . . . . . . . . . . . . . . . . . . . . . (1) — —
Employer payroll tax on certain stock option exercises . . . . . . . . . . . . 8 13 5
Miscellaneous corporate allocation variances . . . . . . . . . . . . . . . . . . . (5) 39 (30)
Total other operating costs and expenses . . . . . . . . . . . . . . . . . . . . . . $ 764 $ 676 $ 718
Total operating loss for the “All Other” category . . . . . . . . . . . . . . . . $(556) $(469) $(529)
F-41

Significant Customer, Supplier and Geographical Information
Sales to our significant customers, including sales to their manufacturing subcontractors, as a percentage of netrevenue were as follows:
Year EndedDecember 31,
2011 2010 2009
Apple . . . . . . . . . . . . . . . . . . . . . . . . . . . . . . . . . . . . . . . . . . . . . . . . . . . . . . . . . 13.1% 10.9% *
Samsung . . . . . . . . . . . . . . . . . . . . . . . . . . . . . . . . . . . . . . . . . . . . . . . . . . . . . . . 10.0 10.0 10.3%
Five largest customers as a group . . . . . . . . . . . . . . . . . . . . . . . . . . . . . . . . . . . . . 42.6 38.6 34.6
* Less than 10% of net revenue.
No other customer represented more than 10% of our annual net revenue in these years.
Product revenue derived from shipments to international destinations, as a percentage of product revenue was asfollows:
Year EndedDecember 31,
2011 2010 2009
China (exclusive of Hong Kong) . . . . . . . . . . . . . . . . . . . . . . . . . . . . . . . . . . . . . 33.4% 30.4% 28.3%
Hong Kong . . . . . . . . . . . . . . . . . . . . . . . . . . . . . . . . . . . . . . . . . . . . . . . . . . . . . 26.4 26.0 24.8
Singapore, Taiwan and Japan . . . . . . . . . . . . . . . . . . . . . . . . . . . . . . . . . . . . . . . 22.9 25.3 26.3
Europe . . . . . . . . . . . . . . . . . . . . . . . . . . . . . . . . . . . . . . . . . . . . . . . . . . . . . . . . 1.8 2.4 2.7
Other . . . . . . . . . . . . . . . . . . . . . . . . . . . . . . . . . . . . . . . . . . . . . . . . . . . . . . . . . 14.0 13.1 12.7
98.5% 97.2% 94.8%
We do not own or operate a fabrication facility. Four independent third-party foundries located in Asiamanufacture a majority of our semiconductor devices in current production. Any sudden demand for an increasedamount of semiconductor devices or sudden reduction or elimination of any existing source or sources ofsemiconductor devices could result in a material delay in the shipment of our products. In addition, substantially allof our products are assembled and tested by one of six independent third-party subcontractors in Asia. We do nothave long-term agreements with any of these suppliers. Any problems associated with the fabrication facilities or thedelivery, quality or cost of our products could have a material adverse effect on our business, results of operations andfinancial condition.
We have an international distribution center that includes engineering design and administrative facilities inSingapore as well as engineering design facilities in Belgium, Canada, China, Denmark, France, Greece, India, Israel,Japan, Korea, the Netherlands, Taiwan and the United Kingdom. At December 31, 2011, $105 million, orapproximately 25.8%, of our tangible long-lived assets were located outside the United States.
F-42

14. Quarterly Financial Data (Unaudited)
The following table presents our unaudited quarterly financial data. In our opinion, this information has beenprepared on a basis consistent with that of our audited consolidated financial statements and all necessary materialadjustments, consisting of normal recurring accruals and adjustments, have been included to present fairly theunaudited quarterly financial data. Our quarterly results of operations for these periods are not necessarily indicativeof future results of operations.
Total NetRevenue
GrossProfit
NetIncome
Diluted NetIncome
Per Share
(In millions, except per share data)
Year Ended December 31, 2011
Fourth Quarter . . . . . . . . . . . . . . . . . . . . . . . . . . . . . . . . . . . . . . . . . . . . . . . $1,820 $926 $254 $0.45
Third Quarter . . . . . . . . . . . . . . . . . . . . . . . . . . . . . . . . . . . . . . . . . . . . . . . . 1,957 997 270(1) 0.48
Second Quarter . . . . . . . . . . . . . . . . . . . . . . . . . . . . . . . . . . . . . . . . . . . . . . . 1,796 919 175(2) 0.31
First Quarter . . . . . . . . . . . . . . . . . . . . . . . . . . . . . . . . . . . . . . . . . . . . . . . . . 1,816 921 228 0.40
Year Ended December 31, 2010
Fourth Quarter . . . . . . . . . . . . . . . . . . . . . . . . . . . . . . . . . . . . . . . . . . . . . . . $1,945 $990 $266(3) $0.47
Third Quarter . . . . . . . . . . . . . . . . . . . . . . . . . . . . . . . . . . . . . . . . . . . . . . . . 1,806 934 328 0.60
Second Quarter . . . . . . . . . . . . . . . . . . . . . . . . . . . . . . . . . . . . . . . . . . . . . . . 1,605 843 278 0.52
First Quarter . . . . . . . . . . . . . . . . . . . . . . . . . . . . . . . . . . . . . . . . . . . . . . . . . 1,462 767 210 0.40
(1) Includes settlement costs of $27 million and a restructuring charge of $17 million.
(2) Includes settlement gains of $45 million, an impairment of long-lived assets charge of $74 million, a charitable contribution of $25million and non-recurring legal expenses of $25 million.
(3) Includes settlement costs of $49 million and an impairment of long-lived assets charge of $17 million.
15. Subsequent Events
In January 2012 our Board of Directors adopted an amendment to the existing dividend policy pursuant towhich we intend to increase the quarterly cash dividend by 11.1% to $0.10 per share ($0.40 per share on an annualbasis) and declared a quarterly cash dividend of $0.10 per share payable to holders of our common stock.
F-43

[THIS PAGE INTENTIONALLY LEFT BLANK]

Exhibits and Financial Statement Schedules
Exhibit Index
Where Located
ExhibitNumber Description Form File No.
ExhibitNo. Filing Date
FiledHerewith
2.1 Agreement and plan of Merger, dated as ofSeptember 11, 2011, by and among Broadcom,NetLogic Microsystems and I&N AcquisitionCorp.
8-K 000-23993
2.1 09/12/2011
3.1 Second Amended and Restated Articles ofIncorporation filed with the California Secretaryof State on June 8, 2006
8-K 000-23993
3.1 08/10/2006
3.4 Bylaws as amended through December 21, 2007 8-K 000-23993
3.1 12/21/2007
4.1 Indenture, dated November 1, 2010, between theregistrant and Wilmington Trust FSB
8-K 000-23993
4.1 11/01/2010
4.2 Supplemental Indenture, dated November 1,2010, between the registrant and WilmingtonTrust FSB, including the forms of Broadcom’s1.500% Senior Notes due 2013 and2.375% Senior Notes due 2015.
8-K 000-23993
4.2 11/01/2010
4.3 Second Supplemental Indenture, datedNovember 9, 2011, between the registrant andWilmington Trust, National Association,including the form of Broadcom’s 2.700% SeniorNotes due 2018.
8-K 000-23993
4.1 11/09/2011
10.1* Performance Bonus Plan (as amended andrestated March 5, 2010)
8-K 000-23993
99.1 03/09/2010
10.2* Letter Agreement between the registrant and ScottA. McGregor dated October 25, 2004
10-K/A 000-23993
10.4 01/23/2007
10.3* Fourth Amendment dated August 9, 2010 toLetter Agreement between the registrant and ScottA. McGregor
10-Q 000-23993
10.1 10/26/2010
10.4* Letter Agreement between the registrant and EricK. Brandt dated March 11, 2007
10-Q 000-23993
10.1 05/01/2007
10.5* Third Amendment dated August 9, 2010 toLetter Agreement between the registrant and EricK. Brandt
10-Q 000-23993
10.2 10/26/2010
10.6* Form of Revised Letter Agreement for Change inControl Severance Benefit Program datedAugust 9, 2010 between the registrant and each ofthe following executive officers: Neil Kim,Thomas F. Lagatta, Daniel A. Marotta, andRobert A. Rango
10-Q 000-23993
10.5 10/26/2010
10.7* Revised Letter Agreement for Change in ControlSeverance Benefit Program dated August 9, 2010between the registrant and Robert L. Tirva
10-Q 000-23993
10.6 10/26/2010
10.8* Letter Agreement between the registrant andArthur Chong dated October 27, 2008
10-K 000-23993
10.11 02/04/2009

Where Located
ExhibitNumber Description Form File No.
ExhibitNo. Filing Date
FiledHerewith
10.9* Amendment dated August 9, 2010 to LetterAgreement between the registrant andArthur Chong
10-Q 000-23993
10.3 10/26/2010
10.10* Letter Agreement between the registrant and RajivRamaswami dated January 8, 2010
10-Q 000-23993
10.1 04/27/2010
10.11* Amendment dated August 9, 2010 to LetterAgreement between the registrant andRajiv Ramaswami
10-Q 000-23993
10.4 10/26/2010
10.12* Severance Benefit Plan for Vice Presidents andAbove and Summary Plan Description effectiveJune 1, 2010
8-K 000-23993
10.1 05/07/2010
10.13* Stock Option Amendment Agreement betweenthe registrant and Thomas F. Lagatta datedDecember 29, 2006
10-K 000-23993
10.10 02/20/2007
10.14* 1998 Stock Incentive Plan, as amended andrestated November 11, 2010
10-K 000-23993
10.14 02/02/2011
10.15* 1998 Stock Incentive Plan form of Notice ofGrant of Stock Option for executive officers
10-K 000-23993
10.17 02/04/2009
10.16* 1998 Stock Incentive Plan form of Stock OptionAgreement for executive officers
10-K 000-23993
10.21 02/04/2009
10.17* 1998 Stock Incentive Plan form of AutomaticStock Option Agreement for Non-EmployeeDirectors (under prior Director Automatic GrantProgram)
10-Q 000-23993
10.2 11/09/2004
10.18* 1998 Stock Incentive Plan form of RestrictedStock Unit Issuance Agreement forScott A. McGregor
10-K 000-23993
10.18 02/02/2011
10.19* 1998 Stock Incentive Plan form of RestrictedStock Unit Issuance Agreement for executiveofficers other than Scott A. McGregor
10-K 000-23993
10.19 02/02/2011
10.20* 1998 Stock Incentive Plan form of RestrictedStock Unit Issuance Agreement for executiveofficers (for RSUs governed by the Special RSUProgram)
10-K 000-23993
10.20 02/02/2011
10.21* 1998 Stock Incentive Plan form of RestrictedStock Unit Issuance Agreement for Non-Employee Directors (Annual Award)
10-K 000-23993
10.29 02/04/2009
10.22* 1998 Stock Incentive Plan form of RestrictedStock Unit Issuance Agreement for Non-Employee Directors (Pro-rated Awards)
10-K 000-23993
10.30 02/04/2009
10.23* 1998 Stock Incentive Plan form of RestrictedStock Unit Award Agreement for Non-EmployeeDirectors (Initial Awards under prior DirectorAutomatic Grant Program)
10-Q 000-23993
10.3 05/04/2005
10.24 1999 Special Stock Option Plan (as amended andrestated July 18, 2003)
10-Q 000-23993
10.2 08/11/2003
10.25 1999 Special Stock Option Plan form of Noticeof Grant of Stock Option
S-8 333-93457
99.2 12/22/1999

Where Located
ExhibitNumber Description Form File No.
ExhibitNo. Filing Date
FiledHerewith
10.26 1999 Special Stock Option Plan form of StockOption Agreement
10-Q 000-23993
10.2.1 08/11/2003
10.27* Restricted Stock Units Incentive Award Program 8-K 000-23993
10.1 01/20/2011
10.28* Restricted Stock Unit Incentive AwardProgram — Form of Award Letter
8-K 000-23993
10.2 01/20/2011
10.29* Form of Indemnification Agreement forDirectors, Elected Officers and certainemployees or agents of the registrant
8-K 000-23993
10.1 06/24/2008
10.30†† Settlement and Patent License and Non-AssertAgreement by and between QualcommIncorporated and the registrant
8-K/A 000-23993
10.1 07/23/2009
10.31 Credit Agreement, dated as of November 19,2010, among the registrant, Bank of America,N.A. and the other lenders party thereto.
8-K 000-23993
10.1 11/22/2010
10.32 First Amendment to Credit Agreement with Bankof America, N.A., as administrative agent, swingline lender and L/C issuer, and the lenders partythereto
8-K 000-2393
10.1 11/01/2011
10.33 Letter agreement dated February 1, 2011 by andbetween Morgan Stanley & Co. Incorporated andthe Registrant Regarding a Fixed CollaredAccelerated Share Repurchase Transaction.
X
10.34 Lease Agreement dated February 1, 2000 betweenConejo Valley Development Corporation and theregistrant
10-K 000-23993
10.17 03/19/2002
10.35 First Amendment dated July 1, 2009 to LeaseAgreement dated February 1, 2000 betweenConejo Valley Development Corporation and theregistrant.
10-K 000-23993
10.30 02/03/2010
10.36 Lease Agreement dated May 18, 2000 betweenM-D Downtown Sunnyvale, LLC and theregistrant
10-K 000-23993
10.21 03/31/2003
10.37 Amendment dated September 30, 2005 to LeaseAgreement dated May 18, 2000 between M-DDowntown Sunnyvale, LLC and the registrant
10-K 000-23993
10.43 02/04/2009
10.38 Second Amendment dated October 15, 2010 toLease Agreement dated May 18, 2000 betweenM-D Downtown Sunnyvale, LLC and theregistrant
10-K 000-23993
10.36 02/02/2011
10.39†† Lease Agreement dated December 17, 2004between Irvine Commercial Property Companyand the registrant
10-K 000-23993
10.38 03/01/2005
10.40 First Amendment, Second Amendment, andThird Amendment dated June 7, 2005, April 9,2007 and April 9, 2007, respectively, to Leasedated December 17, 2004 between IrvineCommercial Property Company LLC and theregistrant
10-Q 000-23993
10.2 10/24/2007

Where Located
ExhibitNumber Description Form File No.
ExhibitNo. Filing Date
FiledHerewith
10.41 Fourth Amendment dated November 19, 2007to Lease dated December 17, 2004 betweenIrvine Commercial Property Company LLC andthe registrant
10-K 000-23993
10.43 01/28/2008
10.42 Lease Agreement dated October 31, 2007between Irvine Commercial Property CompanyLLC and the registrant
10-K 000-23993
10.44 01/28/2008
10.43 First Amendment dated November 12, 2008 toLease Agreement dated October 31, 2007between Irvine Commercial Property CompanyLLC and the registrant
10-K 000-23993
10.49 02/04/2009
10.44 Second Amendment, Third Amendment, andFourth Amendment dated July 30, 2010,September 14, 2010 and November 15, 2010,respectively, to Lease Agreement datedOctober 31, 2007 between Irvine CommercialProperty Company LLC and the registrant
10-K 000-23993
10.42 02/02/2011
10.45 Fifth and Sixth Amendment dated April 24,2011 and August 2, 2011, respectively to LeaseAgreement dated October 31, 2007 betweenIrvine Commercial Property Company LLC andthe registrant
X
21.1 Subsidiaries of the Company X
23.1 Consent of KPMG LLP X
31.1 Certification of the Chief Executive Officer, asrequired pursuant to Section 302 of theSarbanes-Oxley Act of 2002
X
31.2 Certification of the Chief Financial Officer, asrequired pursuant to Section 302 of theSarbanes-Oxley Act of 2002
X
32.1 Certifications of the Chief Executive Officer andChief Financial Officer, as required pursuant toSection 906 of the Sarbanes-Oxley Act of 2002
X
101.INS XBRL Instance Document X
101.SCH XBRL Taxonomy Extension Schema Document X
101.CAL XBRL Taxonomy Extension CalculationLinkbase Document X
101.LAB XBRL Taxonomy Extension Label LinkbaseDocument X
101.PRE XBRL Taxonomy Extension PresentationLinkbase Document X
101.DEF XBRL Taxonomy Extension DefinitionLinkbase Document X
* A contract, compensatory plan or arrangement in which directors or executive officers are eligible to participate.
†† Confidential treatment has previously been granted by the SEC for certain portions of the referenced exhibit pursuant to Rule 406under the Securities Act.

SIGNATURES
Pursuant to the requirements of Section 13 or 15(d) of the Securities Exchange Act of 1934, the Registrant hasduly caused this Report to be signed on its behalf by the undersigned, thereunto duly authorized.
BROADCOM CORPORATION
By: /s/ SCOTT A. MCGREGOR
Scott A. McGregorPresident and Chief Executive Officer
Date: February 1, 2012
Pursuant to the requirements of the Securities Exchange Act of 1934, this Report has been signed below by thefollowing persons on behalf of the Registrant and in the capacities and on the dates indicated:
Signature Title Date
/s/ SCOTT A. MCGREGOR
Scott A. McGregorPresident and Chief Executive Officer andDirector (Principal Executive Officer)
February 1, 2012
/s/ HENRY SAMUELI
Henry Samueli, Ph.D.
Chief Technical Officer and Director February 1, 2012
/s/ ERIC K. BRANDT
Eric K. BrandtExecutive Vice President, Chief FinancialOfficer (Principal Financial Officer)
February 1, 2012
/s/ ROBERT L. TIRVA
Robert L. TirvaSenior Vice President, Corporate Controller(Principal Accounting Officer)
February 1, 2012
/s/ ROBERT J. FINOCCHIO, JR.
Robert J. Finocchio, Jr.
Director February 1, 2012
/s/ NANCY H. HANDEL
Nancy H. Handel
Director February 1, 2012
/s/ EDDY W. HARTENSTEIN
Eddy W. Hartenstein
Director February 1, 2012
/s/ MARIA M. KLAWE
Maria M. Klawe, Ph.D.
Director February 1, 2012
/s/ JOHN E. MAJOR
John E. Major
Chairman of the Board February 1, 2012
/s/ WILLIAM T. MORROW
William T. Morrow
Director February 1, 2012
/s/ JOHN A.C. SWAINSON
John A.C. Swainson
Director February 1, 2012
/s/ ROBERT E. SWITZ
Robert E. Switz
Director February 1, 2012

[THIS PAGE INTENTIONALLY LEFT BLANK]
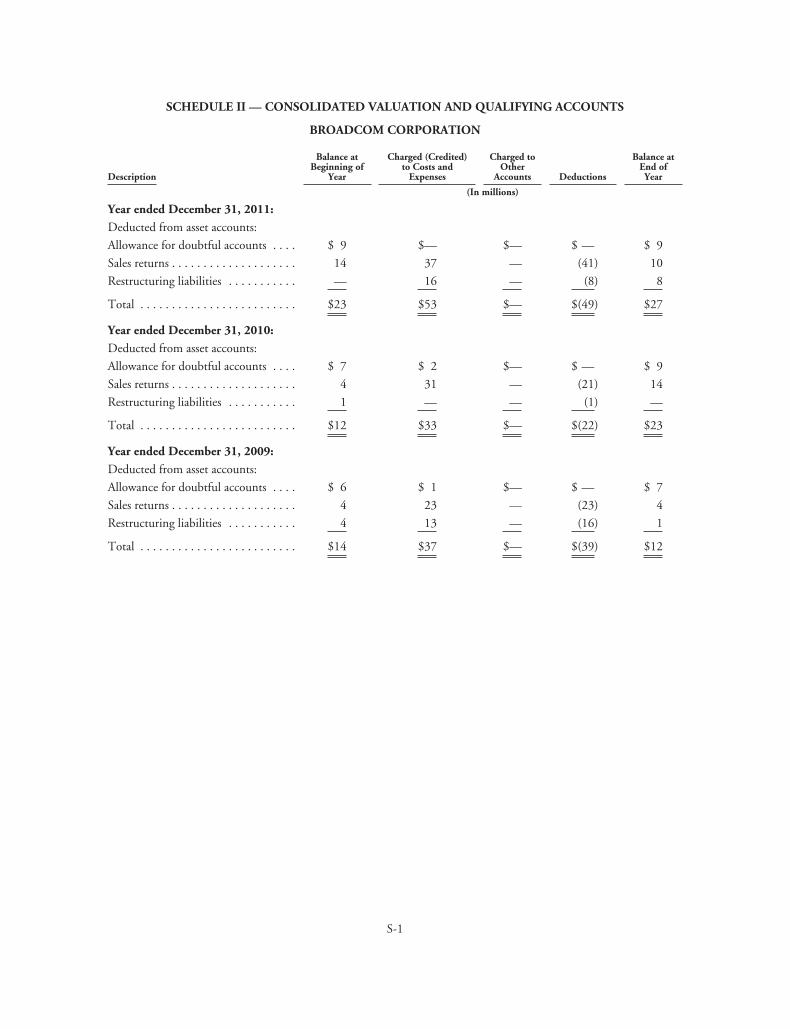
SCHEDULE II — CONSOLIDATED VALUATION AND QUALIFYING ACCOUNTS
BROADCOM CORPORATION
Description
Balance atBeginning of
Year
Charged (Credited)to Costs and
Expenses
Charged toOther
Accounts Deductions
Balance atEnd ofYear
(In millions)
Year ended December 31, 2011:
Deducted from asset accounts:
Allowance for doubtful accounts . . . . $ 9 $— $— $ — $ 9
Sales returns . . . . . . . . . . . . . . . . . . . . 14 37 — (41) 10
Restructuring liabilities . . . . . . . . . . . — 16 — (8) 8
Total . . . . . . . . . . . . . . . . . . . . . . . . . $23 $53 $— $(49) $27
Year ended December 31, 2010:
Deducted from asset accounts:
Allowance for doubtful accounts . . . . $ 7 $ 2 $— $ — $ 9
Sales returns . . . . . . . . . . . . . . . . . . . . 4 31 — (21) 14
Restructuring liabilities . . . . . . . . . . . 1 — — (1) —
Total . . . . . . . . . . . . . . . . . . . . . . . . . $12 $33 $— $(22) $23
Year ended December 31, 2009:
Deducted from asset accounts:
Allowance for doubtful accounts . . . . $ 6 $ 1 $— $ — $ 7
Sales returns . . . . . . . . . . . . . . . . . . . . 4 23 — (23) 4
Restructuring liabilities . . . . . . . . . . . 4 13 — (16) 1
Total . . . . . . . . . . . . . . . . . . . . . . . . . $14 $37 $— $(39) $12
S-1

[THIS PAGE INTENTIONALLY LEFT BLANK]


Broadcom’s Annual Report on Form 10-K for the year ended December 31, 2011 ends on the preceding page. The following information is part of the 2011 Annual Report to Shareholders.
CAUTIONS REGARDING FORWARD-LOOKING STATEMENTS:
All statements included or incorporated by reference in this 2011 Annual Report to Shareholders, other than statements or characterizations of historical fact, are forward-looking statements within the meaning of the federal securities laws, including the Private Securities Litigation Reform Act of 1995. These forward-looking statements are based on our current expectations, estimates and projections about our industry and business, management’s beliefs, and certain assumptions made by us, all of which are subject to change. Forward-looking statements can often be identified by words such as “anticipates,” “expects,” “intends,” “plans,” “predicts,” “believes,” “seeks,” “estimates,” “may,” “will,” “should,” “would,” “could,” “potential,” “continue,” “ongoing,” similar expressions, and variations or negatives of these words. These forward-looking statements are not guarantees of future results and are subject to risks, uncertainties and assumptions that are difficult to predict. Therefore, our actual results could differ materially and adversely from those expressed in any forward-looking statement as a result of various factors.
Our Annual Report on Form 10-K, and other filings with the Securities and Exchange Commission discuss some of the important risk factors that could contribute to such differences or otherwise affect our business, results of operations and financial condition. These forward-looking statements speak only as of the date of this Annual Report. We undertake no obligation to revise or update publicly any forward-looking statement for any reason to reflect future events or circumstances.
10-K
Board of Directors
Scott A. McGregor President and Chief Executive Officer Broadcom Corporation
Henry Samueli, Ph.D.Chief Technical Officer Broadcom Corporation
John E. Major (1)
Chairman of the Board Broadcom Corporation
Robert J. Finocchio, Jr.(2)
Chairman and CEO Informix Corporation (retired)Chair of the Board of TrusteesSanta Clara University
Nancy H. Handel(3)
Senior Vice President and Chief Financial OfficerApplied Materials, Inc. (retired)
Eddy W. Hartenstein(4)
Publisher and Chief Executive Officer Los Angeles TimesPresident and Chief Executive OfficerTribune Company
Maria M. Klawe, Ph.D.(5)
PresidentHarvey Mudd College
William T. Morrow (4)
Former Chief Executive OfficerClearwire Corporation
John A.C. SwainsonPresident, Software Dell Inc.
Robert E. Switz (6)
President and Chief Executive OfficerADC Telecommunications, Inc. (retired)
(1) Chair of the Compensation Committee,Member of the Nominating & CorporateGovernance Committee; (2) Member of theAudit Committee; (3) Chair of the AuditCommittee; (4) Member of the CompensationCommittee; (5) Member of the Nominating& Corporate Governance Committee;(6) Chair of the Nominating & CorporateGovernance Committee, Member of theAudit Committee
Corporate Information
Elected Officers
Scott A. McGregorPresident and Chief Executive OfficerMember of the Board of Directors
Henry Samueli, Ph.D.Chief Technical OfficerMember of the Board of Directors
Eric K. BrandtExecutive Vice President and Chief Financial Officer
Arthur ChongExecutive Vice President, General Counsel and Secretary
Neil Y. KimExecutive Vice President, Operations and Central Engineering
Thomas F. LagattaExecutive Vice President, Worldwide Sales
Daniel A. MarottaExecutive Vice President & General Manager,Broadband Communications Group
Rajiv RamaswamiExecutive Vice President & General Manager,Infrastructure & Networking Group
Robert A. RangoExecutive Vice President & General Manager,Mobile & Wireless Group
Terri L. TimbermanExecutive Vice President, Human Resources
Robert L. TirvaSenior Vice President and Corporate Controller
Corporate HeadquartersBroadcom Corporation5300 California AvenueIrvine, California 92617-3038Tel: 949.926.5000Fax: 949.949.5203
Annual Meeting of ShareholdersMay 15, 2012Broadcom Corporate Headquarters Irvine, California
Transfer Agent and RegistrarComputershare Trust Company N.A.250 Royall StreetCanton, Massachusetts 02021Tel: 800.962.4284Fax: 303.262.0700
Independent Registered Public Accounting FirmKPMG LLPIrvine, California
Investor RelationsFor further information on Broadcom,additional copies of this Report, ourSEC filings or other financial informa-tion (available free of charge), pleasecontact:
Investor RelationsBroadcom CorporationP.O. Box 57013Irvine, California 92619-7013Tel: 949.926.5663Fax: 949.926.9254
You may also contact us by email at [email protected] or by visiting our website atwww.broadcom.com.
Broadcom®, the pulse logo, Connectingeverything®, the Connecting everythinglogo and the 5G WiFi logo are among the trademarks of Broadcom Corporationand/or its affiliates in the United States,certain other countries and/or the EU. Any other trademarks or trade names mentioned are the property of their respective owners.
© 2
012
Bro
adco
m C
orp
orat
ion.
All
right
s re
serv
ed. C
orp
orat
e in
form
atio
n cu
rren
t as
of M
arch
23,
201
2.
A
ll p
aper
s us
ed in
this
ann
ual r
epor
t are
recy
clab
le.

BROADCOM CORPORATION5300 California AvenueIrvine, California 92617-3038949.926.5000www.broadcom.com