annual report 2011 · book value per share 18.72 18.83 17.95 18.85 20.66 financial ... smart...
TRANSCRIPT

Annual Report 2011

Bel is a leading producer of electronic products that help make global
connectivity a reality. The Company designs, manufactures, and markets a
broad array of magnetics, modules, circuit protection devices, and interconnect
products. While these components are deployed primarily in the computer,
networking, telecommunication, and aerospace industries, Bel’s ever-expanding
portfolio of parts also finds application in the transportation, medical, and
consumer electronics markets. These components are designed to protect, regulate,
connect, isolate, or manage a variety of electronic circuits. With over 60 years in
the electronics industry, Bel has reliably demonstrated the ability to succeed in a
variety of product areas across multiple industries. Founded in 1949, the Company
has a strong track record of technical
innovation working with the
engineering communities of market
leaders. Bel has consistently proven
itself a valuable supplier to the
foremost companies in its chosen
industries by developing cost-effective
solutions for the challenges of new
product development. By combining
our strength in component design
with our own specially-designed
manufacturing facilities, Bel has
established itself as a formidable
competitor on a global basis.
C o m p a n y P r o f i l e

NET EARNINGS (LOSS) (dollars in millions)
SALES(dollars in millions)
26.3
(14.9)
’07
’08 ’09
INCOME (LOSS)FROM OPERATIONS(dollars in millions)
STOCKHOLDERS’ EQUITY(dollars in millions)
-15.000000
-10.411110
-5.822220
-1.233330
3.355560
7.944450
12.533340
17.122231
21.711121
(8.3)
13.6
’11 ’11’10
0
50
100
150
200
250
300
350
-20
-15
-10
-5
0
5
10
15
20
25
30
0
50
100
150
200
250
7.4
25.5
(10.7)
’07
’08 ’09
(17.4)
15.2
’10
259.1 258.4
’07 ’08 ’09 ’10
182.8
302.5295.1
’11
244.5
217.8208.9
’07 ’08 ’09 ’10
208.9
221.1220.3
’11
3.8
Year Ended December 31, 2011 2010 2009 2008 2007
(In thousands of dollars, except per share data)
Select Statements of Operations Data:
Net sales $295,121 $302,539 $182,753 $258,350 $259,137
Selling, general and administrative expenses 39,284 40,443 30,055 36,093 36,117
Net earnings (loss) 3,764 13,649 (8,310) (14,929) 26,336
Earnings (loss) per common share—diluted
Class A 0.28 1.10 (0.71) (1.25) 2.11
Class B 0.33 1.18 (0.72) (1.28) 2.24
As of December 31, 2011 2010 2009 2008 2007
(In thousands of dollars, except per share data)
Selected Balance Sheet Data:
Working capital $165,264 $157,296 $167,833 $163,985 $173,171
Total assets 276,911 277,172 245,946 261,784 293,860
Stockholders’ equity 221,080 220,333 208,932 217,773 244,527
Book value per share 18.72 18.83 17.95 18.85 20.66
F i n a n c i a l H i g h l i g h t s
1

To Our Shareholders:
This year’s cover design highlights products that we currently supply to the aerospace and transportation industries through Cinch Connectors, which was acquired by Bel in early 2010. Due to this success, we are focusing our acquisition efforts on products that will allow us to build upon the Cinch footprint. We will also be looking at companies that can support our fastest growing product line, Module Products. These products have a custom-driven design which will allow Bel an excellent opportunity for long-term growth and profitability.
2011Driven by solid shipments of Modules and Interconnect Products, the sales momentum we enjoyed in 2010 continued into the first half of 2011 with the highest first and second quarter revenue in Bel’s 61-year history. By mid-year, we had successfully manufactured and shipped the remainder of our excess backlog. Sales in our Modular Group ramped up and interconnect sales remained strong throughout the year, but this growth was not enough to offset a sharp 32% decrease in magnetics sales, where competition had a substantial impact on our MagJack® integrated connector modules, especially in the second half of 2011. As a result, for 2011 as a whole, net sales decreased 2.5% to $295 million compared to $303 million for 2010.
Pricing pressure from customers and a decrease in gross margin caused by the shift in our sales mix had a significant impact on our profitability. And while we succeeded in keeping our SG&A expenses for 2011 in line with 2010, we recorded $3.1 million in litigation charges related to our lawsuits with Halo and SynQor. These factors resulted in a decrease in our net earnings for 2011 to $3.8 million, or $0.28 per diluted Class A share and $0.33 per diluted Class B share. Although there will be ongoing royalty expenses as a result of the lawsuits, we believe the litigation charges are now behind us. The
Halo litigation was completed in 2011. We are appealing the SynQor verdict, but any future exposure related to this matter should be limited by an indemnification agreement with one of our major customers.
During the fourth quarter of 2011, Bel incurred $0.3 million of restructuring costs related to the realignment of our Cinch UK operations. This realignment is expected to generate annualized savings of approximately $0.5 million. In addition, during the first three quarters of 2012, we plan to implement additional streamlining steps to enable Bel to take advantage of a variety of operational efficiencies. We currently anticipate approximately $5.4 million in pretax costs associated with these steps, which are expected to result in annual savings of approximately $4.4 million once the plan is fully implemented.
MagneticsAt Bel, we are streamlining our MagJack® integrated connector product line for the highly-refined data center market which demands higher performance and more reliable products. Our focus remains on customers in the Networking and Server spaces, along with the storage and high-speed computing areas that support Cloud Computing. The Bel product concentration is on 10Gigabit Ethernet and PoE (Power over Ethernet) applications, while maintaining our market position with interests in production automation and cost sensitive manufacturing methodologies. Our end goal is to keep our market leadership role, while helping our customers in the development of their new products and technologies in an ever-changing world.
The Signal Transformer group continued to expand its well-established product mix during 2011, including the deployment of several new magnetics variations. Many of these Signal Transformer products
Daniel J. BernsteinPresident andChief Executive Officer
2
Driven by solid
shipments of Modules
and Interconnect
Products, the sales
momentum we enjoyed
in 2010 continued into
the first half of 2011
with the highest first and
second quarter revenue
in Bel’s 61-year history.

Sales in our Modular Group, consisting
of power products and integrated
modules, increased 48% in 2011.
are featured on the Company’s newly enhanced website, which now offers expanded parametric search capabilities and a user-friendly e-commerce feature to facilitate online purchases. Signal continues to expand its product offerings to a broader range of markets, including energy management, smart metering, medical equipment, LED lighting, test and measurement, power supply, industrial process control, factory automation, security/fire safety systems, HVAC, elevators, entertainment and gaming.
Modules Sales in our Modular Group, consisting of power products and integrated modules, increased 48% in 2011. As expected, a major contributor to the growth was driven by our partnership with Ambient Corporation, a leading corporation in the Smart Grid field. Production output tripled in 2011 and with several new Smart Grid products on the horizon, we are very excited about our future business with them. Also in support of Bel’s Smart Grid initiatives, the Modular Group has started developing a range of energy measurement modules designed to measure energy usage and efficiency in applications such as a cellular base station. Solutions for both new and field retrofit applications are in the advanced stages of development.
In the Home Networking space, our Powerline communications product development continued at a rapid pace in support of the ever-growing requirements for high-speed data transmission around the home. We are also seeing this technology now being adopted in many industrial applications as the benefits of using existing wiring for high-speed communications are recognized.
In 2011, the Bel Power Group extended its offering of regulated bus converters, taking advantage of the flexibility inherent with the use of a digital control architecture. Bel’s innovations with the use of this architecture have reduced our time to market for these product development efforts, allowing us to service the time-to-market requirements of our large customers in an ever-more competitive environment. During the year, the Power Group also introduced new products in the DC front end space and put in place the test and manufacturing capability to cost effectively develop and produce these devices. New products in the area of battery management were introduced, expanding our capabilities into the development and manufacture of board mount battery pack solutions.
Several new and significant module opportunities presented themselves during the year outside of Bel’s traditional markets, which we expect to lead into new and exciting diversification for the module group in the coming years.
Circuit ProtectionTechnical sales and marketing efforts for our PTC resettable fuse product line and high ampere rated surface mount design fuse series during 2011 resulted in continued increases in design wins throughout our target customer base. Although the general economic downturn limited our sales volumes in 2011, we expect that increased customer approvals of our products will lead to higher sales revenue as the economy recovers.
Product cost reductions were realized for several mature fuse series, with similar savings scheduled to be achieved for additional types during 2012.
Safety agency approvals for lower-cost versions of high-volume fuse types were completed in 2011, and new automated production equipment will be placed into production during 2012.
The popular RST fuse series, long used in lighting industry products, was adapted for use in high-volume Solar Power conversion products, with excellent growth prospects in our North America and Europe segments.
Integration of Bel’s Circuit Protection products into our other product lines continues to expand beyond the long-standing fused MagJack® designs. PTC and SMD fuse types are now incorporated in various Power Conversion and Integrated Module designs, providing Bel the opportunity to be more cost competitive.
InterconnectOur Interconnect Group, which includes Stewart Connector, continued to promote and expand its offering of premise wiring connectors supporting 10GBase-T Ethernet data transmission. This includes a new CAT6a unshielded modular plug to accompany its already strong product offering of CAT6a shielded plugs, CAT6a shielded and unshielded jacks, as well as punch down blocks. All of these products are used to build the connectivity components which comprise a building or data center’s structured cabling system.
Expanding on its product offering of high-density Ethernet connectivity options, Stewart Connector released RJ point five™ connectors. RJ point five™ connectors are high-density Gigabit Ethernet connectors which are about half the size of a traditional RJ45 connector. They give our customers the capability
3

TM MRJ21 and RJ point five are trademarks owned by TE Connectivity used here under license
of providing switch density of 96 ports, where only 48 ports were possible using
traditional RJ45 connectors. This new product offering compliments the MRJ21™ interconnect system currently supported.
The Interconnect Group continues as an active member of many key standards committees, such as TIA and IEC, which define electrical and mechanical performance parameters for RJ45 connectors. The group also participates in IEEE standards development for 10Gigabit and 40Gigabit technologies as they evolve.
Cinch Connectors Sales at Cinch Connectors, which became part of Bel’s interconnect group upon its acquisition in January 2010, increased by 12% in 2011, resulting in total sales of $65.9 million. In 2011, we made substantial investments in the infrastructure surrounding Cinch’s commercial aerospace business to support the increase in demand for Cinch’s circular Omega connectors and custom cables for fuel management applications. There has also been heavy emphasis on after-market aspects of the commercial aerospace business, as we are now supplying our circular connectors and custom cables to the aftermarket, both directly and through newly-formed distribution agreements.
At Cinch UK, we have focused our business development efforts on high-reliablity applications that utilize our compression interconnect products under Cinch’s trade name CIN::APSE, and our Duracon microminiature connectors.
Overall, 2011 represented a year of bringing the recently acquired Cinch further into the fold and realigning the existing Cinch infrastructure to be better positioned for the business needs of 2012 and beyond.
2012 outlookDespite the challenges we faced in 2011, our cash position increased by $8.4 million during the year to $94 million at December 31, 2011.
We are financially well-positioned to take our next steps. We continue to actively pursue acquisition candidates and believe strongly that acquiring the right companies will further strengthen Bel for the future. We are focusing our acquisition as well as our internal product development efforts on non-commodity components. Our major effort will be in the Modular Group in both power and integrated modules and Mil-AeroSpace products found in our Interconnect Group. We believe these areas provide the greatest opportunity for Bel’s long-term growth and profitability.
In September 2011, Bel was awarded Cisco’s prestigious “Excellence in Service and Responsiveness” award and was nominated for Cisco’s “Excellence in Technology Alignment” and prestigious “Supplier of the Year” award. Bel was the only Cisco supplier to be nominated in three separate categories, and we are honored to be singled out for this recognition among Cisco’s hundreds of vendors, including many Fortune 500 companies.
Our award for “Excellence in Service and Responsiveness” is a tribute to the hard work and dedication of all Bel associates throughout the world. We respect and appreciate the efforts of all of our associates. Each one makes a difference, as only a successful collective effort enables us to bring quality products and outstanding service to our customers, year after year.
We are excited by the opportunities that lie ahead and prepared to meet the challenges we see on the horizon as we work to achieve the growth and profitability Bel is striving for.
Sincerely,
Daniel J. BernsteinPresident and Chief Executive Officer
4
We continue to actively pursue acquisition candidates
and believe strongly that acquiring the right companies
will further strengthen Bel for the future.
Ambient x-3100
Communication Node
is one of the many
products that are built
by our Module Product
Group. This smart grid
device contains over 1,200
components, including Bel’s
own custom magnetic,
interconnect and circuit
protection devices.

UNITED STATES SECURITIES AND EXCHANGE COMMISSION
Washington, D.C. 20549 _____________________
FORM 10-K (MARK ONE) [X] ANNUAL REPORT PURSUANT TO SECTION 13 OR 15(d) OF THE SECURITIES EXCHANGE ACT OF 1934 For the Fiscal Year Ended December 31, 2011
or
[ ] TRANSITION REPORT PURSUANT TO SECTION 13 OR 15(d) OF THE SECURITIES EXCHANGE ACT OF 1934
For the transition period from ___________ to ____________
Commission File No. 0-11676 _____________________
BEL FUSE INC. 206 Van Vorst Street
Jersey City, NJ 07302 (201) 432-0463
(Address of principal executive offices and zip code) (Registrant’s telephone number, including area code)
NEW JERSEY 22-1463699
(State of incorporation) (I.R.S. Employer Identification No.)
Securities registered pursuant to Section 12(b) of the Act:
Title of Each Class
Name of Each Exchange on which Registered
Class A Common Stock ($0.10 par value) NASDAQ Class B Common Stock ($0.10 par value) NASDAQ
Securities registered pursuant to Section 12(g) of the Act: None
Indicate by checkmark if the registrant is a well-known seasoned issuer, as defined in Rule 405 of the Securities Act. Yes [ ] No [X]
Indicate by checkmark if the registrant is not required to file reports to Section 13 or 15(d) of the Act. Yes [ ] No [X]
Indicate by check mark whether the registrant (1) has filed all reports required to be filed by Section 13 or 15(d) of the Securities Exchange Act of 1934 during the preceding 12 months (or for such shorter period that the registrant was required to file such reports), and (2) has been subject to such filing requirements for the past 90 days. Yes [X] No [ ]
Indicate by check mark whether the registrant has submitted electronically and posted on its corporate Web site, if any, every Interactive Data File required to be submitted and posted pursuant to Rule 405 of Regulation S-T during the preceding 12 months (or for such shorter period that the registrant was required to submit and post such files). Yes [X] No [ ]
Indicate by check mark if disclosure of delinquent filers pursuant to Item 405 of Regulation S-K (229.405 of this chapter) is not contained herein, and will not be contained, to the best of registrant's knowledge, in definitive proxy or information statements incorporated by reference in Part III of this Form 10-K or any amendment to this Form 10-K. [ ]

Indicate by checkmark whether the registrant is a large accelerated filer, an accelerated filer, a non-accelerated filer or a smaller reporting company. See the definitions of large accelerated filer, accelerated filer and smaller reporting company in Rule 12b-2 of the Exchange Act.
Large accelerated filer [ ] Accelerated filer [X] Non-accelerated filer [ ] (Do not check if a smaller reporting company)
Smaller reporting company [ ]
Indicate by check mark whether the registrant is a shell company (as defined in Rule 12b-2 of the Act). Yes [ ] No [X]
The aggregate market value of the voting and non-voting common equity of the registrant held by non-affiliates (for this purpose, persons and entities other than executive officers and directors) of the registrant, as of the last business day of the registrant's most recently completed second fiscal quarter (June 30, 2011) was $239 million.
Title of Each Class
Number of Shares of Common Stock Outstanding as of March 1, 2012
Class A Common Stock 2,174,912 Class B Common Stock 9,633,643
Documents incorporated by reference: Bel Fuse Inc.'s Definitive Proxy Statement for the 2012 Annual Meeting of Stockholders is incorporated by reference into Part III.

Page
Forward Looking Information 1
Part I
Item 1. Business 1
Item 1A. Risk Factors 6
Item 1B. Unresolved Staff Comments 10
Item 2. Properties 11
Item 3. Legal Proceedings 11
Item 4. Mine Safety Disclosures 11
Part II
Item 5. Market for Registrant's Common Equity, Related Stockholder Matters and IssuerPurchases of Equity Securities 12
Item 6. Selected Financial Data 13
Item 7. Management's Discussion and Analysis of Financial Condition and Resultsof Operations 15
Item 7A. Quantitative and Qualitative Disclosures About Market Risk 27
Item 8. Financial Statements and Supplementary Data* 27
Item 9. Changes in and Disagreements with Accountants on Accounting and Financial Disclosure 29
Item 9A. Controls and Procedures 29
Item 9B. Other Information 29
Part III
Item 10. Directors, Executive Officers and Corporate Governance 30
Item 11. Executive Compensation 30
Item 12. Security Ownership of Certain Beneficial Owners and Management and RelatedStockholder Matters 30
Item 13. Certain Relationships and Related Transactions, and Director Independence 30
Item 14. Principal Accountant Fees and Services 30
Part IV
Item 15. Exhibits, Financial Statement Schedule 31
Signatures 34
* Page F-1 follows page 28
BEL FUSE INC.
INDEX
-1-
FORWARD LOOKING INFORMATION
The terms “Company” and “Bel” as used in this Annual Report on Form 10-K refer to Bel Fuse Inc. and its consolidated subsidiaries unless otherwise specified. The Company’s quarterly and annual operating results are affected by a wide variety of factors that could materially and adversely affect revenues and profitability, including the risk factors described in Item 1A of the Company's Annual Report on Form 10-K. As a result of these and other factors, the Company may experience material fluctuations in future operating results on a quarterly or annual basis, which could materially and adversely affect its business, financial condition, operating results, and stock prices. Furthermore, this document and other documents filed by the Company with the Securities and Exchange Commission (the “SEC”) contain certain forward-looking statements under the Private Securities Litigation Reform Act of 1995 (“Forward-Looking Statements”) with respect to the business of the Company. These Forward-Looking Statements are subject to certain risks and uncertainties, including those mentioned above, and those detailed in Item 1A of this Annual Report on Form 10-K, which could cause actual results to differ materially from these Forward-Looking Statements. The Company undertakes no obligation to publicly release the results of any revisions to these Forward-Looking Statements which may be necessary to reflect events or circumstances after the date hereof or to reflect the occurrence of unanticipated events. An investment in the Company involves various risks, including those mentioned above and those which are detailed from time to time in the Company’s SEC filings.
PART I Item 1. Business General Bel Fuse Inc. is a leading producer of electronic products that help make global connectivity a reality. The Company designs, manufactures and markets a broad array of magnetics, modules, circuit protection devices and interconnect products, as further described below. These products are designed to protect, regulate, connect, isolate or manage a variety of electronic circuits. Bel’s products are primarily used in the networking, telecommunications, computing, military, aerospace and transportation industries. Bel’s portfolio of products also finds application in the automotive, medical and consumer electronics markets. On January 29, 2010, the Company completed its acquisition of 100% of the issued and outstanding capital stock of Cinch Connectors, Inc. (“Cinch U.S.”), Cinch Connectors de Mexico, S.A. de C.V. (“Cinch Mexico”) and Cinch Connectors Ltd. (“Cinch Europe”) (collectively, “Cinch”) from Safran S.A.
With over 60 years in the electronics industry, Bel has reliably demonstrated the ability to succeed in a variety of product areas across multiple industries. The Company has a strong track record of technical innovation working with the engineering teams of market leaders. Bel has consistently proven itself a valuable supplier to the foremost companies in its chosen industries by developing cost-effective solutions for the challenges of new product development. By combining our strength in product design with our own specially-designed manufacturing facilities, Bel has established itself as a formidable competitor on a global basis. The Company, which is organized under New Jersey law, operates in one industry with three reportable operating segments, which are geographic in nature. Bel’s principal executive offices are located at 206 Van Vorst Street, Jersey City, New Jersey 07302; (201) 432-0463. The Company operates other facilities in North America, Europe and Asia and trades on the NASDAQ Global Select Market (BELFA and BELFB). For information regarding Bel's three geographic operating segments, see Note 11 of the notes to consolidated financial statements.
Product Groups The Company has set forth below a description of its product groups as of December 31, 2011. Magnetics
MagJack® integrated connector modules Power transformers Discrete components
The Company produces MagJack® integrated connector modules. These devices integrate RJ45 and/or USB connectors with discrete magnetic components to provide a more robust part that allows customers to substantially reduce board space and inventory requirements. MagJack® provides the signal conditioning, electromagnetic interference suppression and signal isolation for

-2-
networking, telecommunications, and broadband applications. These connectors are designed for network speeds from 10/100Base-T to 10GBase-T and include options for Power over Ethernet (PoE) capability. Power transformer products include standard and custom designs produced by the Company’s Signal Transformer subsidiary. Manufactured for use in alarm, security, motion control, elevator, medical products and many other industries, Signal’s designs are available in PC mount, chassis mount, surface mount and toroidal construction. These devices are designed to comply with international safety standards governing transformers including UL, CSA, IEC, TUV, and VDE.
Discrete magnetic components comprise Bel’s legacy product group, which includes transformers and chokes for use in networking, telecommunications and broadband applications. These magnetic devices condition, filter and isolate the signal as it travels through network equipment, helping to ensure accurate data/voice/video transmission. Modules
Power conversion modules Integrated modules
Bel’s Power conversion products include standard and custom isolated and non-isolated DC-DC converters designed specifically to power low voltage silicon devices. The need for converting one DC voltage to another is growing rapidly as developers of integrated circuits commonly adjust the supply voltage as a means of optimizing device performance. The DC-DC converters are used in data networking equipment, distributed power architecture, and telecommunication devices, as well as computers and peripherals. The Company has expanded its line of modules designed to support data transmission over existing power lines including next generation HomePlug® AV powerline applications. Typically deployed in home-based communication/entertainment devices such as Set Top Boxes (STBs), DSL modems, home theaters, HDTVs motherboards, and IPTV equipment, Bel’s modules incorporate the silicon required to enable powerline functionality, supporting a lower cost of ownership within a reduced footprint. Bel’s powerline modules are also being integrated in smart meters and appliances to support emerging Smart Grid technology developments. The Company continues to pursue market opportunities where it can supply customized, value-added modules that capitalize on the Company’s manufacturing capabilities in surface mount assembly, automatic winding, hybrid fabrication, and component encapsulation. Circuit Protection
Miniature, subminiature and micro fuses – cartridge, surface mount and through hole designs PTC devices – surface mount and radial through hole designs
Bel circuit protection products include board level fuses (miniature, micro and surface mount), and Polymeric PTC (Positive Temperature Coefficient) devices, designed for the global electronic and telecommunication markets. Fuses and PTC devices prevent currents in an electrical circuit from exceeding certain predetermined levels, acting as a safety valve to protect expensive components from damage by cutting off high currents before they can generate enough heat to cause smoke or fire. Additionally, PTC devices are resettable and do not have to be replaced before normal operation of the end product can resume. While the Company continues to manufacture traditional fuse types, its surface mount chip fuses are used in space-critical applications such as mobile phones and computers. Like all of Bel's fuse products, the chip fuses comply with RoHS6 standards for the elimination of lead and other hazardous materials. The Company's circuit protection devices are used extensively in products such as televisions, consumer electronics, power supplies, computers, telephones, and networking equipment. Interconnect Stewart Interconnect Products:
Passive jacks Plugs Cable assemblies
Bel has a comprehensive line of modular connectors including RJ45 and RJ11 passive jacks, plugs, and cable assemblies. Passive jacks serve primarily as the connectivity device in networking equipment such as routers, hubs, switches, and patch panels. Modular plugs and cable assemblies are utilized within the structured cabling system, often referred to as premise wiring. The Company’s connector products are designed to meet all major performance standards for Category 5e, 6, 6a, and Category 7a compliant devices used within Gigabit Ethernet and 10Gigabit Ethernet networks.
-3-
Cinch Interconnect Products (acquired in January 2010) I/O Interconnect – Circular Connectors, Micro D Connectors Compression Board to Board, Device to Board Interconnect High speed cables Enclosures Custom cable assemblies
Cinch is a supplier of reliable, high quality standard products for use in a variety of industries. Cinch also possesses various enabling technologies and expertise with which to provide custom solutions and products for strategic accounts within its focus markets. Those focus markets are the transportation market for which a number of leading edge products have been, and continue to be, developed, and the telecommunications market to which Cinch supplies various standard products as well as a number of new, higher speed devices consistent with the rapidly changing needs in this industry.
Cinch is also a major supplier of products to the military/aerospace market with significant presence in the commercial aircraft industry, as well as in the munitions, missile, and satellite communications sectors.
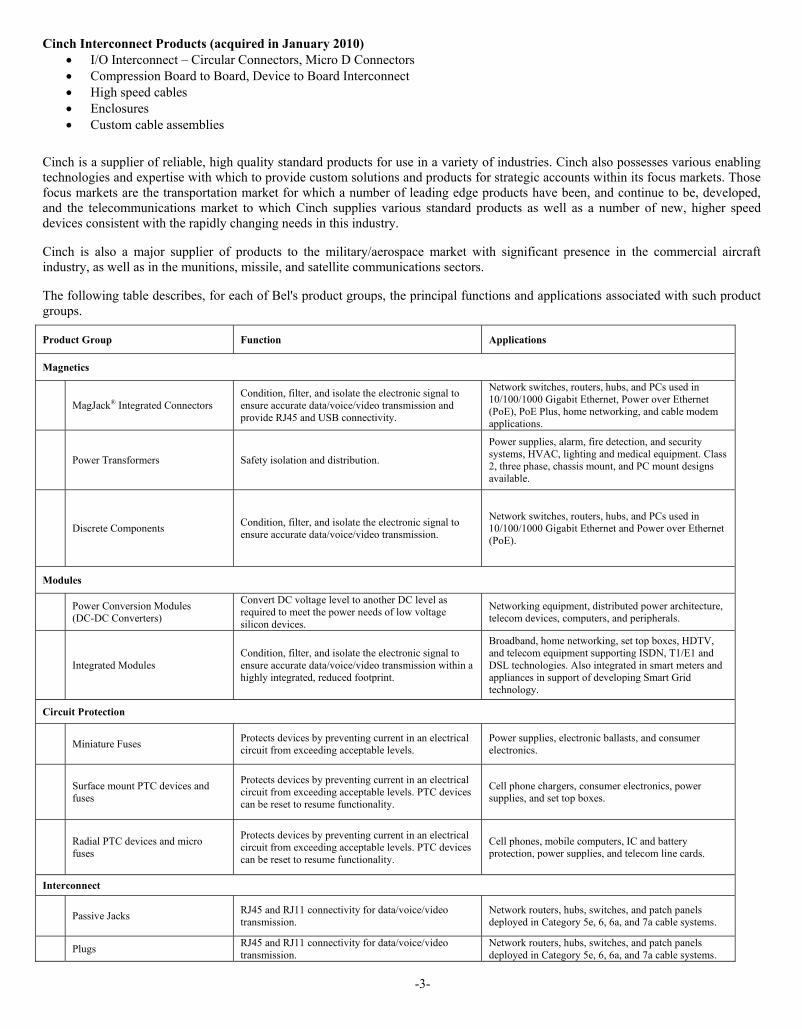
The following table describes, for each of Bel's product groups, the principal functions and applications associated with such product groups.
Product Group Function Applications
Magnetics
MagJack® Integrated Connectors Condition, filter, and isolate the electronic signal to ensure accurate data/voice/video transmission and provide RJ45 and USB connectivity.
Network switches, routers, hubs, and PCs used in 10/100/1000 Gigabit Ethernet, Power over Ethernet (PoE), PoE Plus, home networking, and cable modem applications.
Power Transformers Safety isolation and distribution.
Power supplies, alarm, fire detection, and security systems, HVAC, lighting and medical equipment. Class 2, three phase, chassis mount, and PC mount designs available.
Discrete Components Condition, filter, and isolate the electronic signal to ensure accurate data/voice/video transmission.
Network switches, routers, hubs, and PCs used in 10/100/1000 Gigabit Ethernet and Power over Ethernet (PoE).
Modules
Power Conversion Modules (DC-DC Converters)
Convert DC voltage level to another DC level as required to meet the power needs of low voltage silicon devices.
Networking equipment, distributed power architecture, telecom devices, computers, and peripherals.
Integrated Modules Condition, filter, and isolate the electronic signal to ensure accurate data/voice/video transmission within a highly integrated, reduced footprint.
Broadband, home networking, set top boxes, HDTV, and telecom equipment supporting ISDN, T1/E1 and DSL technologies. Also integrated in smart meters and appliances in support of developing Smart Grid technology.
Circuit Protection
Miniature Fuses Protects devices by preventing current in an electrical circuit from exceeding acceptable levels.
Power supplies, electronic ballasts, and consumer electronics.
Surface mount PTC devices and fuses
Protects devices by preventing current in an electrical circuit from exceeding acceptable levels. PTC devices can be reset to resume functionality.
Cell phone chargers, consumer electronics, power supplies, and set top boxes.
Radial PTC devices and micro fuses
Protects devices by preventing current in an electrical circuit from exceeding acceptable levels. PTC devices can be reset to resume functionality.
Cell phones, mobile computers, IC and battery protection, power supplies, and telecom line cards.
Interconnect
Passive Jacks RJ45 and RJ11 connectivity for data/voice/video transmission.
Network routers, hubs, switches, and patch panels deployed in Category 5e, 6, 6a, and 7a cable systems.
Plugs RJ45 and RJ11 connectivity for data/voice/video transmission.
Network routers, hubs, switches, and patch panels deployed in Category 5e, 6, 6a, and 7a cable systems.

-4-
Cable Assemblies RJ45 and RJ11 connectivity for data/voice/video transmission.
Structured Category 5e, 6, 6a, and 7a cable systems (premise wiring).
Compression Interface CIN::APSE , iQ and AMC Connectors
High density parallel interfacing. Supporting Board-to-Board, Device-to-Board and Flex-To-Board applications – in ATE and high speed computer applications
High Speed Cables QSFP, QSFP+ , CX4 and 12X
High speed data rate transfers – supported by industry standards like Infiniband – targeting networking applications
Connectors Omega series, circular connectors, Dura-Con MIL-DTL-83513, Barrier Blocks, Harness Connectors
MIL/Aero applications, Specifically FQIS – Fuel quantity indicator system applications. Highest reliability interconnect applications
Enclosures and Harnesses ModICE™ and SHS Headers/Connectors Engine control units, transportation applications
Acquisitions Acquisitions have played a critical role in the growth of Bel and the expansion of both its product portfolio and its customer base. Furthermore, acquisitions continue to be a key element in the Company’s growth strategy. As part of the Company’s acquisition strategy, it may, from time to time, purchase equity positions in companies that are potential merger candidates. The Company frequently evaluates possible merger candidates that would provide an expanded product and technology base that will allow the Company to further penetrate its strategic customers and/or an opportunity to reduce overall operating expense as a percentage of revenue. Bel also looks at whether the merger candidates are positioned to take advantage of the Company's lower cost offshore manufacturing facilities; and whether a cultural fit will allow the acquired company to be integrated smoothly and efficiently.
On January 29, 2010 (the “Acquisition Date”), the Company completed its acquisition of 100% of the issued and outstanding capital stock of Cinch from Safran S.A. Bel paid $39.7 million in cash and assumed an additional $0.8 million of expenses in exchange for the net assets acquired. The transaction was funded with cash on hand. Cinch is headquartered in Lombard, Illinois and has manufacturing facilities in Vinita, Oklahoma; Reynosa, Mexico; and Worksop, England.
Cinch manufactures a broad range of interconnect products for customers in the military and aerospace, high-performance computing, telecom/datacom, and transportation markets. The addition of Cinch’s well-established lines of connector and cable products and extensive clientele has enabled Bel to broaden its customer base to include aerospace and military markets. The acquisition of Cinch has also created the opportunity for expense reduction and the elimination of redundancies. The combination of these factors has given rise to goodwill in the amount of $2.3 million related to this acquisition. See Note 2 to the consolidated financial statements for further details on this acquisition.
On July 1, 2009, the Company acquired all of the outstanding shares of Winsonko (Guangxi Pingguo) Electron Co., Ltd. for $0.5 million in cash, including an immaterial amount of transaction costs. Sales and Marketing The Company sells its products to customers throughout North America, Europe and Asia. Sales are made through one of three channels: direct strategic account managers, regional sales managers working with independent sales representative organizations or authorized distributors. Bel's strategic account managers are assigned to handle major accounts requiring global coordination. Independent sales representatives and authorized distributors are overseen by the Company's sales management personnel located throughout the world. As of December 31, 2011, the Company had a sales and support staff of 88 persons that supported a network of 98 sales representative organizations and non-exclusive distributors. The Company has written agreements with all of its sales representative organizations and major distributors. These written agreements, terminable on short notice by either party, are standard in the industry. Sales support functions have also been established and located in Bel international facilities to provide timely, efficient support for customers. This supplemental level of service, in addition to first-line sales support, enables the Company to be more responsive to customers’ needs on a global level. The Company’s marketing capabilities include product management which drives new product development, application engineering for technical support and marketing communications. Product marketing managers facilitate technical partnerships for engineering development of IC-compatible components and modules.
-5-
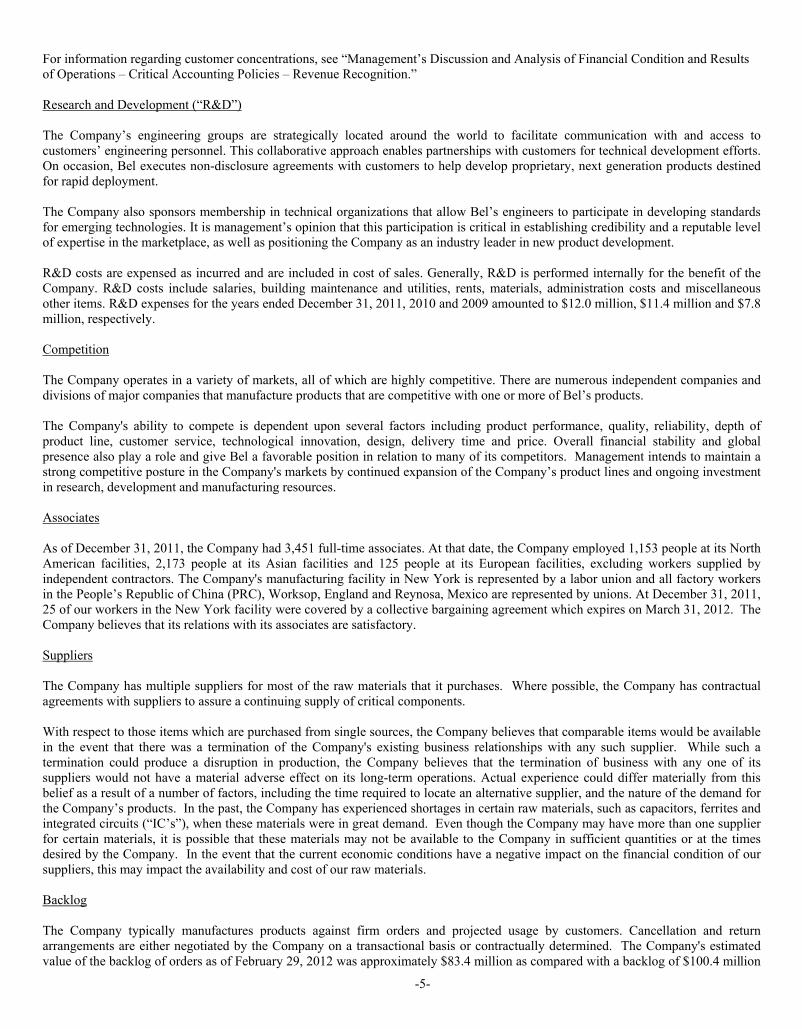
For information regarding customer concentrations, see “Management’s Discussion and Analysis of Financial Condition and Results of Operations – Critical Accounting Policies – Revenue Recognition.” Research and Development (“R&D”) The Company’s engineering groups are strategically located around the world to facilitate communication with and access to customers’ engineering personnel. This collaborative approach enables partnerships with customers for technical development efforts. On occasion, Bel executes non-disclosure agreements with customers to help develop proprietary, next generation products destined for rapid deployment. The Company also sponsors membership in technical organizations that allow Bel’s engineers to participate in developing standards for emerging technologies. It is management’s opinion that this participation is critical in establishing credibility and a reputable level of expertise in the marketplace, as well as positioning the Company as an industry leader in new product development. R&D costs are expensed as incurred and are included in cost of sales. Generally, R&D is performed internally for the benefit of the Company. R&D costs include salaries, building maintenance and utilities, rents, materials, administration costs and miscellaneous other items. R&D expenses for the years ended December 31, 2011, 2010 and 2009 amounted to $12.0 million, $11.4 million and $7.8 million, respectively. Competition The Company operates in a variety of markets, all of which are highly competitive. There are numerous independent companies and divisions of major companies that manufacture products that are competitive with one or more of Bel’s products.
The Company's ability to compete is dependent upon several factors including product performance, quality, reliability, depth of product line, customer service, technological innovation, design, delivery time and price. Overall financial stability and global presence also play a role and give Bel a favorable position in relation to many of its competitors. Management intends to maintain a strong competitive posture in the Company's markets by continued expansion of the Company’s product lines and ongoing investment in research, development and manufacturing resources. Associates
As of December 31, 2011, the Company had 3,451 full-time associates. At that date, the Company employed 1,153 people at its North American facilities, 2,173 people at its Asian facilities and 125 people at its European facilities, excluding workers supplied by independent contractors. The Company's manufacturing facility in New York is represented by a labor union and all factory workers in the People’s Republic of China (PRC), Worksop, England and Reynosa, Mexico are represented by unions. At December 31, 2011, 25 of our workers in the New York facility were covered by a collective bargaining agreement which expires on March 31, 2012. The Company believes that its relations with its associates are satisfactory. Suppliers The Company has multiple suppliers for most of the raw materials that it purchases. Where possible, the Company has contractual agreements with suppliers to assure a continuing supply of critical components. With respect to those items which are purchased from single sources, the Company believes that comparable items would be available in the event that there was a termination of the Company's existing business relationships with any such supplier. While such a termination could produce a disruption in production, the Company believes that the termination of business with any one of its suppliers would not have a material adverse effect on its long-term operations. Actual experience could differ materially from this belief as a result of a number of factors, including the time required to locate an alternative supplier, and the nature of the demand for the Company’s products. In the past, the Company has experienced shortages in certain raw materials, such as capacitors, ferrites and integrated circuits (“IC’s”), when these materials were in great demand. Even though the Company may have more than one supplier for certain materials, it is possible that these materials may not be available to the Company in sufficient quantities or at the times desired by the Company. In the event that the current economic conditions have a negative impact on the financial condition of our suppliers, this may impact the availability and cost of our raw materials. Backlog The Company typically manufactures products against firm orders and projected usage by customers. Cancellation and return arrangements are either negotiated by the Company on a transactional basis or contractually determined. The Company's estimated value of the backlog of orders as of February 29, 2012 was approximately $83.4 million as compared with a backlog of $100.4 million

-6-
as of February 28, 2011. Management expects that virtually all of the Company's backlog as of February 29, 2012 will be shipped by December 31, 2012. Such expectation constitutes a Forward-Looking Statement. Factors that could cause the Company to fail to ship all such orders by year-end include unanticipated supply difficulties, changes in customer demand and new customer designs. Due to these factors, backlog may not be a reliable indicator of the timing of future sales. See Item 1A of this Annual Report- "Risk Factors - Our backlog figures may not be reliable indicators." Intellectual Property The Company has been granted a number of patents in the U.S., Europe and Asia and has additional patent applications pending relating to its products. While the Company believes that the issued patents are defendable and that the pending patent applications relate to patentable inventions, there can be no assurance that a patent will be obtained from the applications or that its existing patents can be successfully defended. It is management's opinion that the successful continuation and operation of the Company's business does not depend upon the ownership of patents or the granting of pending patent applications, but upon the innovative skills, technical competence and marketing and managerial abilities of its personnel. The patents have a life of seventeen years from the date of issue or twenty years from filing of patent applications. The Company's existing patents expire on various dates from May 20, 2012 to August 7, 2029. The Company utilizes registered trademarks in the U.S., Europe and Asia to identify various products that it manufactures. The trademarks survive as long as they are in use and the registrations of these trademarks are renewed. Available Information
The Company maintains a website at www.belfuse.com where it makes available the proxy statements, press releases and reports on Form 4, 8-K, 10-K and 10-Q that it and its insiders file with the SEC. These forms are made available as soon as reasonably practicable after such material is electronically filed with or furnished to the SEC. Press releases are also issued via electronic transmission to provide access to the Company’s financial and product news. The Company also provides notification of and access to voice and Internet broadcasts of its quarterly and annual results. The Company’s website also includes investor presentations and corporate governance materials. Item 1A. Risk Factors An investment in our common stock involves a high degree of risk. Investors should carefully consider the risks described below, together with all other information contained in this Annual Report before making investment decisions with respect to our common stock. Additional risks and uncertainties not presently known to us or that we currently believe to be immaterial may also materially adversely affect our business in the future. We do business in a highly competitive industry. Our business is largely in a highly competitive worldwide industry, with relatively low barriers to competitive entry. We compete principally on the basis of product performance, quality, reliability, depth of product line, customer service, technological innovation, design, delivery time and price. The electronic components industry has become increasingly concentrated and globalized in recent years and our major competitors, some of which are larger than Bel, have significant financial resources and technological capabilities. Our backlog figures may not be reliable indicators.
Many of the orders that comprise our backlog may be delayed, accelerated or canceled by customers without penalty. Customers may on occasion double order from multiple sources to ensure timely delivery when leadtimes are particularly long. Customers often cancel orders when business is weak and inventories are excessive. Therefore, we cannot be certain that the amount of our backlog equals or exceeds the level of orders that will ultimately be delivered. Our results of operations could be adversely impacted if customers cancel a material portion of orders in our backlog. There are several factors which can cause us to lower our prices. a) The average selling prices for our products tend to decrease rapidly over their life cycle, and customers are increasingly putting pressure on suppliers to lower prices even when production costs are increasing. Our profits suffer if we are not able to reduce our costs of production, induce technological innovations as sales prices decline, or pass through cost increases to customers. b) Any drop in demand or increase in supply of our products could cause a dramatic drop in our average sales prices which in turn could result in a decrease in our gross margins. A shift in product mix could also have a favorable or unfavorable impact on our gross margins, depending upon the underlying raw material content and labor requirements of the associated products.

-7-
c) Increased competition from low cost suppliers around the world has put further pressures on pricing. We continually strive to lower our costs, negotiate better pricing for components and raw materials and improve our operating efficiencies. Profit margins will be materially and adversely impacted if we are not able to reduce our costs of production or introduce technological innovations when sales prices decline. In China, we are challenged to match availability of workers and maintain leadtimes in line with customer demand for certain of our products, which has been highly volatile in recent years. This volatility can materially adversely affect Bel’s results. In the PRC, the availability of labor is cyclical and is significantly affected by the migration of workers in relation to the annual Lunar New Year holiday as well as economic conditions in the PRC. In addition, we have little visibility into the ordering habits of our customers and can be subjected to large and unpredictable variations in demand for our products. Accordingly, we must continually recruit and train new workers to replace those lost to attrition each year and to address peaks in demand that may occur from time to time. These recruiting and training efforts and related inefficiencies, and overtime required in order to meet demand can add volatility to the costs incurred by the Company for labor in the PRC. In 2011, we experienced a softening in customer demand for certain of our products, which resulted in underutilized capacity and lower gross margins, as our fixed costs had a lower absorption rate. Conversely, any future significant increase in customer demand would result in the hiring and training of new workers and related inefficiencies. We are dependent on our ability to develop new products. Our future operating results are dependent, in part, on our ability to develop, produce and market new and more technologically advanced products. There are numerous risks inherent in this process, including the risks that we will be unable to anticipate the direction of technological change or that we will be unable to timely develop and bring to market new products and applications to meet customers’ changing needs. Our acquisitions may not produce the anticipated results. A significant portion of our growth is from acquisitions. We cannot assure you that we will identify or successfully complete transactions with suitable acquisition candidates in the future. If an acquired business fails to operate as anticipated or cannot be successfully integrated with our other businesses, our results of operations, enterprise value, market value and prospects could all be materially and adversely affected. Integration of new acquisitions into our consolidated operations may result in lower average operating results for the group as a whole, and may divert management’s focus from the ongoing operations of the Company during the integration period. Our strategy also focuses on the reduction of selling, general and administrative expenses through the integration or elimination of redundant sales facilities and administrative functions at acquired companies. On January 29, 2010, the Company acquired Cinch as previously described in the Acquisitions section of this Form 10-K. If we are unable to achieve our expectations with respect to the Cinch acquisition or future acquisitions, such inability could have a material and adverse effect on our results of operations. In connection with the acquisition of Cinch, we recorded $2.3 million of goodwill and $11.4 million of other intangible assets. If our acquisitions fail to perform up to our expectations, or if the value of goodwill or other intangible assets decreases as a result of weakened economic conditions, we could be required to record a loss from the impairment of assets. If we were to undertake a substantial acquisition for cash, the acquisition would either be funded with cash on hand or financed in part through bank borrowings or the issuance of public or private debt or equity. The acquisition of Cinch was funded with cash on hand. If we borrow money to finance future acquisitions, this would likely decrease our ratio of earnings to fixed charges and adversely affect other leverage criteria and could result in the imposition of material restrictive covenants. Under our existing credit facility, we are required to obtain our lenders’ consent for certain additional debt financing and to comply with other covenants, including the application of specific financial ratios, and we may be restricted from paying cash dividends on our capital stock. We cannot assure you that the necessary acquisition financing would be available to us on acceptable terms, or at all, when required. If we issue a substantial amount of stock either as consideration in an acquisition or to finance an acquisition, such issuance may dilute existing stockholders and may take the form of capital stock having preferences over our existing common stock. We are exposed to weaknesses in international markets and other risks inherent in foreign trade. We have operations in six countries around the world outside the United States, and approximately 61% of our revenues during 2011 were derived from sales to customers outside the United States. Some of the countries in which we operate have in the past experienced and may continue to experience political, economic, and military instability or unrest, medical epidemic and natural disasters. These conditions could have a material and adverse impact on our ability to operate in these regions and, depending on the extent and severity of these conditions, could materially and adversely affect our overall financial condition and operating results.

-8-
Although our operations have traditionally been largely transacted in U.S. dollars or U.S. dollar linked currencies, recent world financial instability may cause additional foreign currency risks in the countries in which we operate. The decoupling of the Chinese Renminbi from the U.S. dollar has increased, and will continue to increase financial risk. With the acquisition of Cinch, the Company has additional exposure to foreign currency risks associated with the British Pound and Mexican Peso as the Company now has a larger labor force in Great Britain and Mexico. Other risks inherent in doing business internationally include: expropriation and nationalization, trade restrictions, transportation delays, and changes in United States laws that may inhibit or restrict our ability to manufacture in or sell to any particular country. For information regarding risks associated with our presence in Asia, see "Item 2 - Properties" of this Annual Report on Form 10-K. While we have benefited from favorable tax treatment in many of the countries where we operate, this situation could change if laws or rules in the United States or those foreign jurisdictions change, incentives are changed or revoked, or we are unable to renew current incentives. The loss of certain substantial customers could materially and adversely affect us. During the year ended December 31, 2011, we had two customers with sales in excess of 10% of our consolidated revenue. One such customer, located in Asia, represented 11.4% of our revenue and the other, located in North America, represented 10.9% of our revenue. We believe that the loss of either of these customers would have a material adverse effect on the Company’s results of operations, financial position and cash flows. We have experienced significant concentrations in prior years. See Note 11 of the notes to the Company’s consolidated financial statements. We may experience labor unrest. As we implement transfers of certain of our operations, we may experience strikes or other types of labor unrest as a result of lay-offs or termination of employees in higher labor cost countries. Our manufacturing facilities in New York, the United Kingdom and Mexico are represented by labor unions and all factory workers in the PRC are represented by government-sponsored unions. We may experience labor shortages. Government economic, social and labor policies in the PRC may cause shortages of factory labor in areas where we have our products manufactured. If we are required to manufacture more products outside of the PRC as a result of such shortages, our margins will likely be materially adversely affected. Our results of operations may be materially and adversely impacted by environmental and other regulations. Our manufacturing operations, products and/or product packaging are subject to environmental laws and regulations governing air emissions; wastewater discharges; the handling, disposal and remediation of hazardous substances, wastes and certain chemicals used or generated in our manufacturing processes; employee health and safety labeling or other notifications with respect to the content or other aspects of our processes, products or packaging; restrictions on the use of certain materials in or on design aspects of our products or product packaging; and, responsibility for disposal of products or product packaging. More stringent environmental regulations may be enacted in the future, and we cannot presently determine the modifications, if any, in our operations that any such future regulations might require, or the cost of compliance with these regulations. We may face risks relating to climate change that could have an adverse impact on our business. Greenhouse gas (“GHG”) emissions have increasingly become the subject of substantial international, national, regional, state and local attention. GHG emission regulations have been promulgated in certain of the jurisdictions in which we operate, and additional GHG requirements are in various stages of development. Such measures could require us to modify existing or obtain new permits, implement additional pollution control technology, curtail operations or increase our operating costs. Any additional regulation of GHG emissions, including a cap-and-trade system, technology mandate, emissions tax, reporting requirement or other program, could adversely affect our business. Customer requirements and new regulations may increase our expenses and impact the availability of certain raw materials, which could adversely affect our revenue and operating profits. The products we manufacture utilize materials that are impacted by the Dodd-Frank Wall Street Reform and Consumer Protection Act (the “Dodd-Frank Act”) requirement for disclosure of the use of “conflict minerals” mined in the Democratic Republic of the Congo and adjoining countries.
-9-
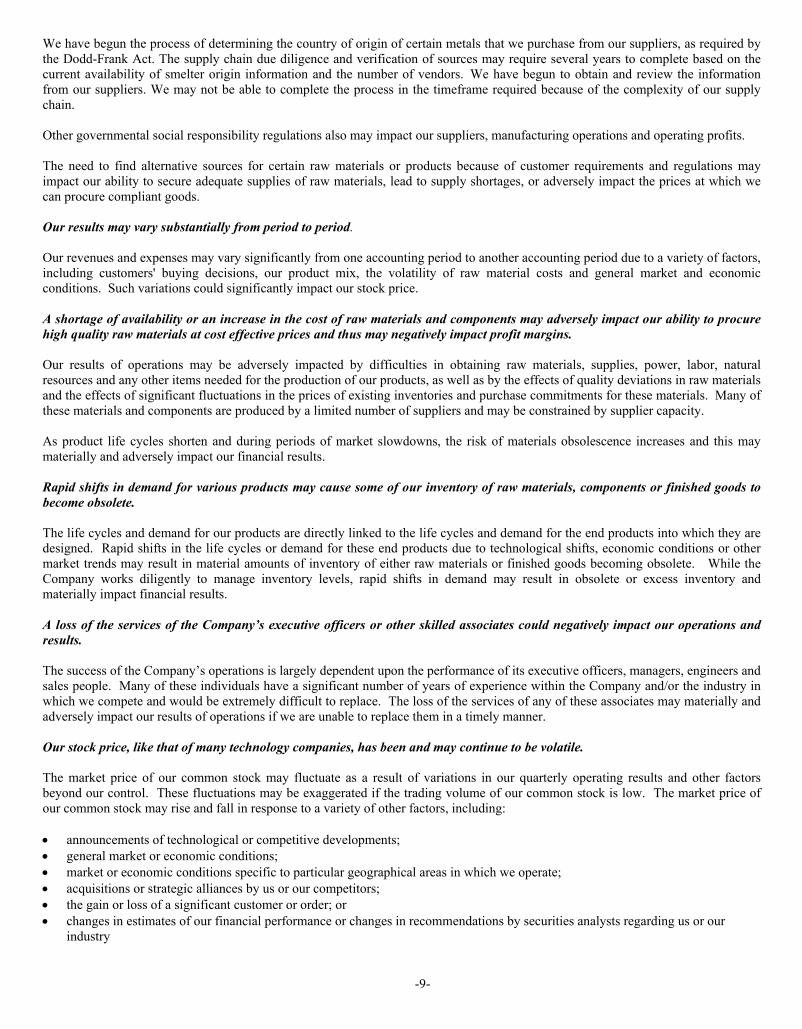
We have begun the process of determining the country of origin of certain metals that we purchase from our suppliers, as required by the Dodd-Frank Act. The supply chain due diligence and verification of sources may require several years to complete based on the current availability of smelter origin information and the number of vendors. We have begun to obtain and review the information from our suppliers. We may not be able to complete the process in the timeframe required because of the complexity of our supply chain. Other governmental social responsibility regulations also may impact our suppliers, manufacturing operations and operating profits. The need to find alternative sources for certain raw materials or products because of customer requirements and regulations may impact our ability to secure adequate supplies of raw materials, lead to supply shortages, or adversely impact the prices at which we can procure compliant goods. Our results may vary substantially from period to period. Our revenues and expenses may vary significantly from one accounting period to another accounting period due to a variety of factors, including customers' buying decisions, our product mix, the volatility of raw material costs and general market and economic conditions. Such variations could significantly impact our stock price. A shortage of availability or an increase in the cost of raw materials and components may adversely impact our ability to procure high quality raw materials at cost effective prices and thus may negatively impact profit margins. Our results of operations may be adversely impacted by difficulties in obtaining raw materials, supplies, power, labor, natural resources and any other items needed for the production of our products, as well as by the effects of quality deviations in raw materials and the effects of significant fluctuations in the prices of existing inventories and purchase commitments for these materials. Many of these materials and components are produced by a limited number of suppliers and may be constrained by supplier capacity.
As product life cycles shorten and during periods of market slowdowns, the risk of materials obsolescence increases and this may materially and adversely impact our financial results. Rapid shifts in demand for various products may cause some of our inventory of raw materials, components or finished goods to become obsolete. The life cycles and demand for our products are directly linked to the life cycles and demand for the end products into which they are designed. Rapid shifts in the life cycles or demand for these end products due to technological shifts, economic conditions or other market trends may result in material amounts of inventory of either raw materials or finished goods becoming obsolete. While the Company works diligently to manage inventory levels, rapid shifts in demand may result in obsolete or excess inventory and materially impact financial results. A loss of the services of the Company’s executive officers or other skilled associates could negatively impact our operations and results. The success of the Company’s operations is largely dependent upon the performance of its executive officers, managers, engineers and sales people. Many of these individuals have a significant number of years of experience within the Company and/or the industry in which we compete and would be extremely difficult to replace. The loss of the services of any of these associates may materially and adversely impact our results of operations if we are unable to replace them in a timely manner. Our stock price, like that of many technology companies, has been and may continue to be volatile. The market price of our common stock may fluctuate as a result of variations in our quarterly operating results and other factors beyond our control. These fluctuations may be exaggerated if the trading volume of our common stock is low. The market price of our common stock may rise and fall in response to a variety of other factors, including: announcements of technological or competitive developments; general market or economic conditions; market or economic conditions specific to particular geographical areas in which we operate; acquisitions or strategic alliances by us or our competitors; the gain or loss of a significant customer or order; or changes in estimates of our financial performance or changes in recommendations by securities analysts regarding us or our
industry

-10-
In addition, equity securities of many technology companies have experienced significant price and volume fluctuations even in periods when the capital markets generally are not distressed. These price and volume fluctuations often have been unrelated to the operating performance of the affected companies. Our intellectual property rights may not be adequately protected under the current state of the law. We cannot assure you we will be successful in protecting our intellectual property through patent or other laws. As a result, other companies may be able to develop and market similar products which could materially and adversely affect our business. We may be sued by third parties for alleged infringement of their proprietary rights and we may incur defense costs and possibly royalty obligations or lose the right to use technology important to our business. From time to time, we receive claims by third parties asserting that our products violate their intellectual property rights. Any intellectual property claims, with or without merit, could be time consuming and expensive to litigate or settle and could divert management attention from administering our business. A third party asserting infringement claims against us or our customers with respect to our current or future products may materially and adversely affect us by, for example, causing us to enter into costly royalty arrangements or forcing us to incur settlement or litigation costs. In connection with patent infringement lawsuits discussed in Item 3. Legal Proceedings, the Company incurred expenses of $3.5 million and $8.1 million related to lawsuit settlements in 2011 and 2010, respectively. In 2009, the Company paid a lump sum licensing fee of $2.1 million in exchange for a licensing agreement covering past and future sales of the Company’s MagJack® integrated connector modules (ICMs). Our investments in marketable securities could have a negative impact on our profitability. As part of our acquisition strategies, we may from time to time acquire equity positions in companies that could be attractive acquisition candidates or could otherwise be potential co-venturers in potential business transactions with us. Market declines occurring subsequent to any such investment could have a negative impact on our profitability. As a result of protective provisions in the Company’s certificate of incorporation, the voting power of certain officers, directors and principal shareholders may be increased at future meetings of the Company’s shareholders. The Company's certificate of incorporation provides that if a shareholder, other than shareholders subject to specific exceptions, acquires (after the date of the Company’s 1998 recapitalization) 10% or more of the outstanding Class A common stock and does not own an equal or greater percentage of all then outstanding shares of both Class A and Class B common stock (all of which common stock must have been acquired after the date of the 1998 recapitalization), such shareholder must, within 90 days of the trigger date, purchase Class B common shares, in an amount and at a price determined in accordance with a formula described in the Company's certificate of incorporation, or forfeit its right to vote its Class A common shares. As of February 29, 2012, to the Company’s knowledge, there were two shareholders of the Company's common stock with ownership in excess of 10% of Class A outstanding shares with no ownership of the Company's Class B common stock and with no basis for exception from the operation of the above-mentioned provisions. In order to vote their respective shares at Bel's next shareholders' meeting, these shareholders must either purchase the required number of Class B common shares or sell or otherwise transfer Class A common shares until their Class A holdings are under 10%. As of February 29, 2012, to the Company's knowledge, these shareholders owned 31.6% and 14.5%, respectively, of the Company's Class A common stock and had not taken steps to either purchase the required number of Class B common shares or sell or otherwise transfer Class A common shares until their Class A holdings fall below 10%. Unless and until this situation is satisfied in a manner permitted by the Company’s Restated Certificate of Incorporation, the subject shareholders will not be permitted to vote their shares of Common Stock. To the extent that the voting rights of particular holders of Class A common stock are suspended as of times when the Company's shareholders vote due to the above-mentioned provisions, such suspension will have the effect of increasing the voting power of those holders of Class A common shares whose voting rights are not suspended. As of February 29, 2012, Daniel Bernstein, the Company's chief executive officer, beneficially owned 161,902 Class A common shares (or 13.8%) of the outstanding Class A common shares whose voting rights were not suspended, the Estate of Elliot Bernstein beneficially owned 251,132 Class A common shares (or 21.4%) of the outstanding Class A common shares whose voting rights were not suspended and all directors and executive officers as a group (which includes Daniel Bernstein, but does not include the Estate of Elliot Bernstein) beneficially owned 309,790 Class A common shares (or 26.3%) of the outstanding Class A common shares whose voting rights were not suspended. Item 1B. Unresolved Staff Comments Not applicable.

-11-
Item 2. Properties The Company is headquartered in Jersey City, New Jersey, where it currently owns 19,000 square feet of office and warehouse space. In addition to its facilities in Jersey City, New Jersey, the Company leases 94,000 square feet in 12 facilities and owns properties of 45,000 square feet which are used primarily for management, financial accounting, engineering, sales and administrative support. The Company also operated 12 manufacturing facilities in 6 countries as of December 31, 2011. Approximately 36% of the 1.3 million square feet the Company occupies is owned while the remainder is leased. See Note 15 of the notes to consolidated financial statements for additional information pertaining to leases. The following is a list of the locations of the Company's principal manufacturing facilities at December 31, 2011.
LocationApproximateSquare Feet
Owned/Leased
PercentageUsed for
Manufacturing
Zhongshan, People's Republic of China 385,000 Leased 70%Zhongshan, People's Republic of China 118,000 Owned 100%Zhongshan, People's Republic of China 78,000 Owned 100%Pingguo, People's Republic of China 149,000 Leased 66%Louny, Czech Republic 11,000 Owned 75%Dominican Republic 41,000 Leased 85%Cananea, Mexico 39,000 Leased 60%Reynosa, Mexico 77,000 Leased 56%Worksop, England (a) 52,000 Leased 28%Inwood, New York 39,000 Owned 40%Glen Rock, Pennsylvania 74,000 Owned 60%Vinita, Oklahoma 87,000 Owned 53%
1,150,000
(a) Approximately 58% of the Worksop faci lity is designated for manufacturing use, but 30% is current ly idle
Of the space described above, 201,000 square feet is used for engineering, warehousing, sales and administrative support functions at various locations and 154,000 square feet is used for dormitories, canteen and other employee related facilities in the PRC. The Territory of Hong Kong became a Special Administrative Region (“SAR”) of the PRC during 1997. The territory of Macao became a SAR of the PRC at the end of 1999. Management cannot presently predict what future impact, if any, this will have on the Company or how the political climate in the PRC will affect its contractual arrangements in the PRC. A significant portion of the Company's manufacturing operations and approximately 41% of its identifiable assets are located in Asia. Item 3. Legal Proceedings The information called for by this Item is incorporated herein by reference to the caption “Legal Proceedings” in Note 15. “Commitments and Contingencies” included in Part II, Item 8. “Financial Statements and Supplementary Data.” Item 4. Mine Safety Disclosures Not applicable.

-12-
PART II
Item 5. Market for Registrant's Common Equity and Related Stockholder Matters and Issuer Purchases of Equity Securities (a) Market Information The Company’s voting Class A Common Stock, par value $0.10 per share, and non-voting Class B Common Stock, par value $0.10 per share ("Class A" and "Class B," respectively), are traded on the NASDAQ Global Select Market under the symbols BELFA and BELFB. The following table sets forth the high and low sales price range (as reported by The Nasdaq Stock Market Inc.) for the Common Stock on NASDAQ for each quarter during the past two years.
Class A Class A Class B Class B High Low High Low Year Ended December 31, 2011
First Quarter $28.35 $22.16 $26.77 $18.83 Second Quarter 24.54 20.51 22.45 18.33 Third Quarter 24.04 15.37 22.18 13.76 Fourth Quarter 22.36 15.48 19.97 13.40
Year Ended December 31, 2010
First Quarter $21.80 $14.64 $24.04 $17.37 Second Quarter 22.25 15.50 25.15 16.35 Third Quarter 23.36 16.45 24.03 16.27 Fourth Quarter 27.88 20.46 25.52 20.11
(b) Holders As of February 29, 2012, there were 67 registered shareholders of the Company's Class A Common Stock and 172 registered shareholders of the Company’s Class B Common Stock. As of February 29, 2012, the Company estimates that there were 671 beneficial shareholders of the Company’s Class A Common Stock and 1,884 beneficial shareholders of the Company’s Class B Common Stock. At February 29, 2012, to the Company’s knowledge, there were two shareholders of the Company’s Class A common stock whose voting rights were suspended. These two shareholders owned an aggregate of 46% of the Company’s outstanding shares of Class A common stock. See Item 1A – Risk Factors for additional discussion. (c) Dividends Throughout 2009, 2010 and 2011, the Company declared dividends on a quarterly basis at a rate of $0.06 per Class A share of common stock and $0.07 per Class B share of common stock. During the years ended December 31, 2011, 2010 and 2009, the Company declared dividends totaling $3.2 million, $3.2 million and $3.1 million, respectively. There are no contractual restrictions on the Company's ability to pay dividends provided the Company is not in default under its credit agreements immediately before such payment and after giving effect to such payment. On February 1, 2012, the Company paid a dividend to all shareholders of record at January 15, 2012 of Class A and Class B Common Stock in the total amount of $0.1 million ($0.06 per share) and $0.7 million ($0.07 per share), respectively. The Company currently anticipates paying dividends quarterly in the future. (d) Issuer Purchases of Equity Securities From 2000 through December 31, 2011, the Company has purchased and retired 527,817 Class A common shares at a cost of approximately $16.8 million and has purchased and retired 23,600 Class B common shares at a cost of approximately $0.8 million. No shares of Class A or Class B common stock were repurchased during the year ended December 31, 2011.

-13-
Item 6. Selected Financial Data
The following tables set forth selected consolidated financial data as of the dates and for the periods presented. The selected consolidated balance sheet data as of December 31, 2011 and 2010 and the selected consolidated statement of operations data for the years ended December 31, 2011, 2010 and 2009 have been derived from our audited consolidated financial statements and related notes that we have included elsewhere in this Annual Report. The selected consolidated balance sheet data as of December 31, 2009, 2008 and 2007 and the selected consolidated statement of operations data for the years ended December 31, 2008 and 2007 have been derived from audited consolidated financial statements that are not presented in this Annual Report.
The selected historical consolidated financial data as of any date and for any period are not necessarily indicative of the results that may be achieved as of any future date or for any future period. You should read the following selected historical consolidated financial data in conjunction with the more detailed information contained in “Management’s Discussion and Analysis of Financial Condition and Results of Operations” and our consolidated financial statements and the related notes that we have presented elsewhere in this Annual Report. For information regarding the Company’s acquisitions of Cinch in 2010 and Bel Pingguo in 2009, see “Business – Acquisitions.”
2011 2010 2009 2008 2007
Selected Statements of Operations Data:
Net sales 295,121$ 302,539$ 182,753$ 258,350$ 259,137$ Cost of sales (e) 244,749 239,185 161,454 217,079 203,007 Selling, general and administrative expenses (f) 39,284 40,443 30,055 36,093 36,117 Impairment of assets (a) (c) - - 12,875 14,805 - Litigation charges (g) 3,471 8,103 - - - Restructuring charges (b) 314 - 413 1,122 - Gain on sale of property, plant and equipment (h) (93) (352) (4,693) - (5,499) Gain (loss/impairment charge) on investments (d) 119 - 7,129 (10,358) 2,146 Interest income and other, net 357 420 527 2,454 4,046 Earnings (loss) before provision (benefit) for income taxes 7,872 15,580 (9,695) (18,653) 31,704 Income tax provision (benefit) 4,108 1,931 (1,385) (3,724) 5,368 Net earnings (loss) 3,764 13,649 (8,310) (14,929) 26,336
Earnings (loss) per share:Class A common share - basic and diluted 0.28 1.10 (0.71) (1.25) 2.11 Class B common share - basic 0.33 1.18 (0.72) (1.28) 2.25 Class B common share - diluted 0.33 1.18 (0.72) (1.28) 2.24
Cash dividends declared per share:Class A common share 0.24 0.24 0.24 0.24 0.20 Class B common share 0.28 0.28 0.28 0.28 0.24
2011 2010 2009 2008 2007
Selected Balance Sheet Data and Ratios:
Working capital 165,264$ 157,296$ 167,833$ 163,985$ 173,171$ Total assets 276,911 277,172 245,946 261,784 293,860 Stockholders' equity 221,080 220,333 208,932 217,773 244,527 Return on average total assets (i) 1.35% 5.22% -3.32% -5.17% 9.34%Return on average stockholders' equity (i) 1.69% 6.37% -3.88% -6.23% 11.30%
Years Ended December 31,
(In thousands of dollars, except per share data)
As of December 31,
(In thousands of dollars, except percentages)
-14-
(a) During the third quarter of 2009, the Company conducted an interim valuation test related to the Company’s goodwill by
operating segment. As a result of the reduction in fair value of the Asia operating segment, the Company recorded charges of $12.9 million related to the impairment of goodwill of its Asia operating segment during 2009. During the fourth quarter of 2008, the Company conducted its annual valuation test related to the Company's goodwill by operating segment. As a result of the reduction in the fair value of the North America operating segment, the Company recorded charges of $14.1 million related to the impairment of goodwill of its North America operating segment during 2008.
(b) During 2011, the Company recorded $0.3 million of restructuring costs associated with the realignment of its Cinch UK
operations. In 2009, the Company incurred $0.4 million of restructuring costs related primarily to the Westborough, Massachusetts facility lease obligation, as the Company ceased its manufacturing operations at that facility in 2008. Also in connection with this closure, the Company incurred severance costs of $0.6 million and lease termination costs of $0.5 million during 2008.
(c) During 2008, the Company incurred fixed asset impairments of $0.7 million related to assets located at the Westborough,
Massachusetts facility which ceased operations as of December 31, 2008. This charge is included in Impairment of Assets in the Company’s consolidated statement of operations for the year ended December 31, 2008.
(d) During 2009, the Company realized a net gain for financial reporting purposes of $7.1 million related to the sale of its
investments in Toko, Inc. and Power-One, Inc and the final redemptions of its investment in the Columbia Strategic Cash Portfolio. During 2008, the Company recorded other-than-temporary impairment charges and realized losses of $10.4 million related to its investments in Toko, Inc., Power-One, Inc. and the Columbia Strategic Cash Portfolio. During 2007, the Company realized a gain from the sale of Toko, Inc. common stock in the amount of $2.5 million, offset by an other-than-temporary impairment charge of $0.3 million related to its investment in the Columbia Strategic Cash Portfolio.
(e) During 2009, the Company incurred a $2.0 million licensing fee in connection with the settlement of the Murata lawsuit.
(f) During 2009, the Company incurred $0.6 million in acquisition costs related to the acquisitions of Bel Pingguo and Cinch Connectors. During 2010, the Company incurred an additional $0.3 million of acquisition costs related to Cinch.
(g) During 2011, the Company recorded litigation charges totaling $3.5 million related to the SynQor and Halo lawsuits. During 2010, the Company recorded a litigation charge in the amount of $8.1 million in connection with the SynQor lawsuit. Both of these lawsuits are further described in Note 15 to the accompanying consolidated financial statements.
(h) During 2009, the Company realized a $4.6 million gain from the sale of property in Jersey City, New Jersey. During 2007, the Company realized gains from the sale of property, plant and equipment in Hong Kong and Macao in the amount of $5.5 million.
(i) Returns on average total assets and stockholders’ equity are computed for each year by dividing net earnings (loss) for such
year by the average balances of total assets or stockholders’ equity, as applicable, on the last day of each quarter during such year and on the last day of the immediately preceding year.

-15-
Item 7. Management’s Discussion and Analysis of Financial Condition and Results of Operations The following discussion and analysis should be read in conjunction with the Company’s consolidated financial statements and the notes related thereto. The discussion of results, causes and trends should not be construed to imply any conclusion that such results, causes or trends will necessarily continue in the future. Overview Our Company Bel is a leading producer of electronic products that help make global connectivity a reality. The Company designs, manufactures and markets a broad array of magnetics, modules, circuit protection devices and interconnect products. These products are designed to protect, regulate, connect, isolate or manage a variety of electronic circuits. Bel’s products are primarily used in the networking, telecommunications, computing, military, aerospace and transportation industries. Bel’s portfolio of products also finds application in the automotive, medical and consumer electronics markets. Bel’s business is operated through three geographic segments: North America, Asia and Europe. During 2011, 46% of the Company’s revenues were derived from North America, 43% from Asia and 11% from its Europe operating segment. The Company’s revenues are primarily driven by working closely with customers’ engineering staffs and aligning new and existing product offerings with industry standards committees. Sales of the Company’s interconnect products represented approximately 36% of our total net sales for 2011. The remaining 2011 revenues related to sales of the Company’s modules products (31%), magnetic products (30%) and circuit protection products (3%).
The Company’s expenses are driven principally by the cost of the materials that it uses, the cost of labor where Bel’s factories are located, and its ability to efficiently manage overhead costs. As material and labor costs vary by product line, any significant shift in product mix has an associated impact on the Company’s costs of sales. Bel generally enters into processing arrangements with several independent suppliers of wire wound components in Asia. Costs are recorded as incurred for all products manufactured, whether at third-party facilities or at the Company's own manufacturing facilities. Such amounts are determined based upon the estimated stage of production and include labor cost and fringes and related allocations of factory overhead. The Company manufactures products at its manufacturing facilities in the People’s Republic of China (PRC); Glen Rock, Pennsylvania; Inwood, New York; Haina, Dominican Republic; Reynosa and Cananea, Mexico; Louny, Czech Republic; Vinita, Oklahoma; and Worksop, England. In the PRC, where the Company generally enters into processing arrangements with several independent third-party contractors and also has its own manufacturing facilities, the availability of labor is cyclical and is significantly affected by the migration of workers in relation to the annual Lunar New Year holiday as well as economic conditions in the PRC. In addition, the Company has little visibility into the ordering habits of its customers and can be subjected to large and unpredictable variations in demand for its products. Accordingly, the Company must continually recruit and train new workers to replace those lost to attrition each year and to address peaks in demand that may occur from time to time. These recruiting and training efforts and related inefficiencies, and overtime required in order to meet demand, can add volatility to the costs incurred by the Company for labor in the PRC. Trends Affecting our Business The Company believes the key factors affecting Bel’s 2011 and/or future results include the following:
Product Mix – Sales of the Company’s module products increased from 20% of total sales during 2010 to 31% of total sales during 2011. Module products have a higher material and lower added-value content than the Bel’s other product lines. As a result, these products will not have as high a margin as Bel’s other products. The Company also experienced a significant reduction in sales of its MagJack product during 2011, which is a higher-margin product. Bel has begun to focus its product development efforts on non-commodity products. This major effort will be in the modular product line in both power and integrated modules and Mil-AeroSpace products included in our interconnect product line.
Pricing and Availability of Materials – The Company has seen component pricing and availability stabilize for most of its product lines. Although there has recently been some moderation in commodity prices, higher costs for commodities including gold, copper, and petroleum-based plastics continue to keep manufacturing costs high in comparison to the prior year. Fluctuations in component prices and other commodity prices associated with Bel’s raw materials will have a corresponding impact on Bel’s profit margins.
Labor Costs – The costs of labor, particularly in the PRC where a significant percentage of Bel’s products are manufactured,
have been higher in recent years as a result of government mandates for new higher minimum wage and overtime requirements. The PRC government increased minimum wage levels by 21% in the areas where Bel’s products are
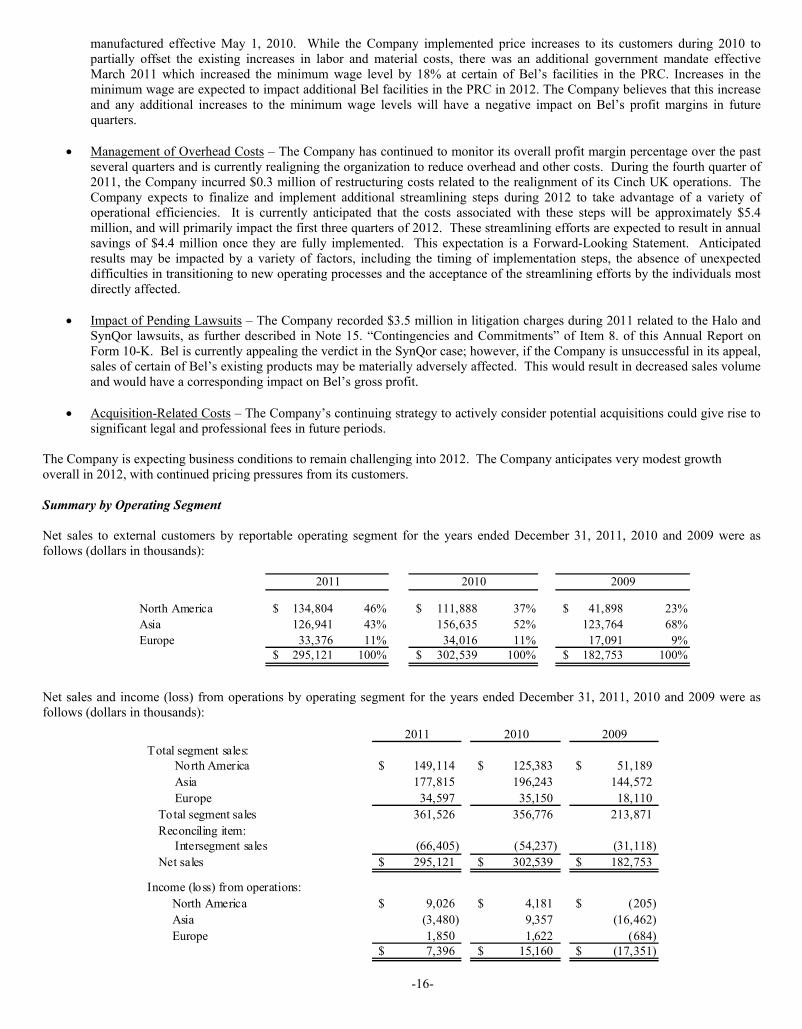
-16-
manufactured effective May 1, 2010. While the Company implemented price increases to its customers during 2010 to partially offset the existing increases in labor and material costs, there was an additional government mandate effective March 2011 which increased the minimum wage level by 18% at certain of Bel’s facilities in the PRC. Increases in the minimum wage are expected to impact additional Bel facilities in the PRC in 2012. The Company believes that this increase and any additional increases to the minimum wage levels will have a negative impact on Bel’s profit margins in future quarters.
Management of Overhead Costs – The Company has continued to monitor its overall profit margin percentage over the past several quarters and is currently realigning the organization to reduce overhead and other costs. During the fourth quarter of 2011, the Company incurred $0.3 million of restructuring costs related to the realignment of its Cinch UK operations. The Company expects to finalize and implement additional streamlining steps during 2012 to take advantage of a variety of operational efficiencies. It is currently anticipated that the costs associated with these steps will be approximately $5.4 million, and will primarily impact the first three quarters of 2012. These streamlining efforts are expected to result in annual savings of $4.4 million once they are fully implemented. This expectation is a Forward-Looking Statement. Anticipated results may be impacted by a variety of factors, including the timing of implementation steps, the absence of unexpected difficulties in transitioning to new operating processes and the acceptance of the streamlining efforts by the individuals most directly affected.
Impact of Pending Lawsuits – The Company recorded $3.5 million in litigation charges during 2011 related to the Halo and SynQor lawsuits, as further described in Note 15. “Contingencies and Commitments” of Item 8. of this Annual Report on Form 10-K. Bel is currently appealing the verdict in the SynQor case; however, if the Company is unsuccessful in its appeal, sales of certain of Bel’s existing products may be materially adversely affected. This would result in decreased sales volume and would have a corresponding impact on Bel’s gross profit.
Acquisition-Related Costs – The Company’s continuing strategy to actively consider potential acquisitions could give rise to significant legal and professional fees in future periods.
The Company is expecting business conditions to remain challenging into 2012. The Company anticipates very modest growth overall in 2012, with continued pricing pressures from its customers. Summary by Operating Segment Net sales to external customers by reportable operating segment for the years ended December 31, 2011, 2010 and 2009 were as follows (dollars in thousands):
North America 134,804$ 46% 111,888$ 37% 41,898$ 23% Asia 126,941 43% 156,635 52% 123,764 68% Europe 33,376 11% 34,016 11% 17,091 9%
295,121$ 100% 302,539$ 100% 182,753$ 100%
2011 2010 2009
Net sales and income (loss) from operations by operating segment for the years ended December 31, 2011, 2010 and 2009 were as follows (dollars in thousands):
2011 2010 2009Total segment sales:
North America 149,114$ 125,383$ 51,189$ Asia 177,815 196,243 144,572 Europe 34,597 35,150 18,110 Total segment sales 361,526 356,776 213,871 Reconciling item: Intersegment sales (66,405) (54,237) (31,118) Net sales 295,121$ 302,539$ 182,753$
Income (loss) from operations: North America 9,026$ 4,181$ (205)$ Asia (3,480) 9,357 (16,462) Europe 1,850 1,622 (684)
7,396$ 15,160$ (17,351)$
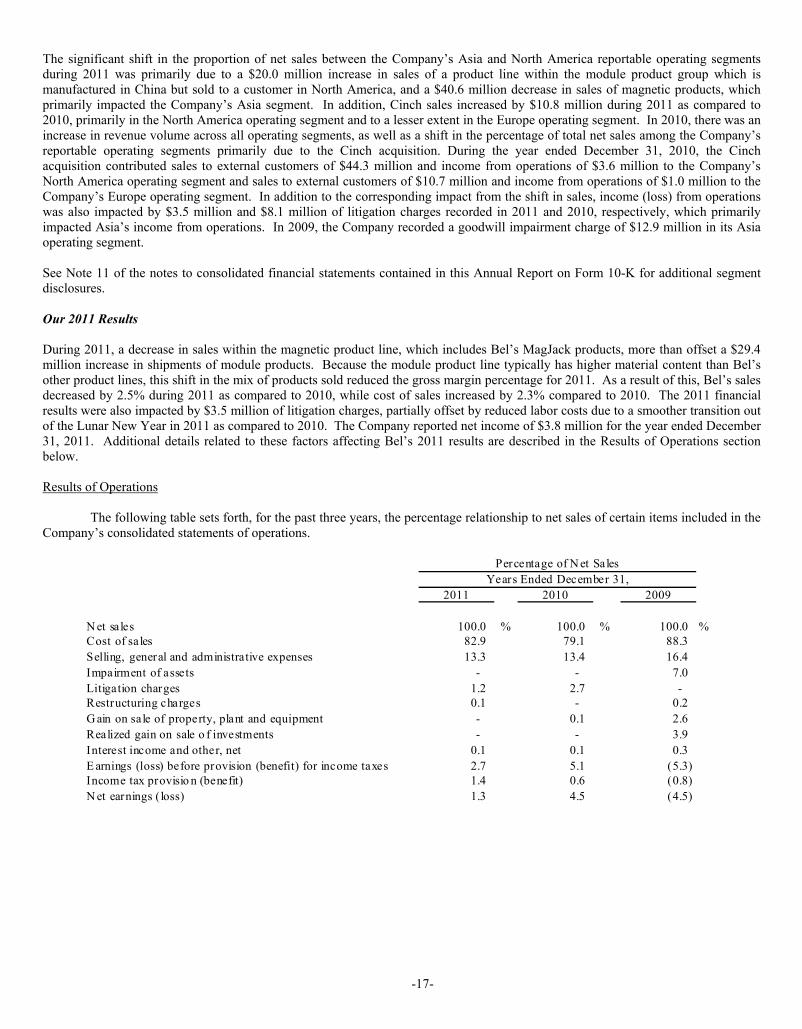
-17-
The significant shift in the proportion of net sales between the Company’s Asia and North America reportable operating segments during 2011 was primarily due to a $20.0 million increase in sales of a product line within the module product group which is manufactured in China but sold to a customer in North America, and a $40.6 million decrease in sales of magnetic products, which primarily impacted the Company’s Asia segment. In addition, Cinch sales increased by $10.8 million during 2011 as compared to 2010, primarily in the North America operating segment and to a lesser extent in the Europe operating segment. In 2010, there was an increase in revenue volume across all operating segments, as well as a shift in the percentage of total net sales among the Company’s reportable operating segments primarily due to the Cinch acquisition. During the year ended December 31, 2010, the Cinch acquisition contributed sales to external customers of $44.3 million and income from operations of $3.6 million to the Company’s North America operating segment and sales to external customers of $10.7 million and income from operations of $1.0 million to the Company’s Europe operating segment. In addition to the corresponding impact from the shift in sales, income (loss) from operations was also impacted by $3.5 million and $8.1 million of litigation charges recorded in 2011 and 2010, respectively, which primarily impacted Asia’s income from operations. In 2009, the Company recorded a goodwill impairment charge of $12.9 million in its Asia operating segment. See Note 11 of the notes to consolidated financial statements contained in this Annual Report on Form 10-K for additional segment disclosures. Our 2011 Results During 2011, a decrease in sales within the magnetic product line, which includes Bel’s MagJack products, more than offset a $29.4 million increase in shipments of module products. Because the module product line typically has higher material content than Bel’s other product lines, this shift in the mix of products sold reduced the gross margin percentage for 2011. As a result of this, Bel’s sales decreased by 2.5% during 2011 as compared to 2010, while cost of sales increased by 2.3% compared to 2010. The 2011 financial results were also impacted by $3.5 million of litigation charges, partially offset by reduced labor costs due to a smoother transition out of the Lunar New Year in 2011 as compared to 2010. The Company reported net income of $3.8 million for the year ended December 31, 2011. Additional details related to these factors affecting Bel’s 2011 results are described in the Results of Operations section below. Results of Operations The following table sets forth, for the past three years, the percentage relationship to net sales of certain items included in the Company’s consolidated statements of operations.
2011 2010 2009
N et sales 100.0 % 100.0 % 100.0 %Cost of sales 82.9 79.1 88.3 Selling, general and administrative expenses 13.3 13.4 16.4 Impairment of assets - - 7.0 Litigation charges 1.2 2.7 - Restructuring charges 0.1 - 0.2 G ain on sale of property, plant and equipment - 0.1 2.6 Realized gain on sale o f investments - - 3.9 Interest income and other, net 0.1 0.1 0.3 E arnings (loss) before provision (benefit) for income taxes 2.7 5.1 (5.3) Income tax provisio n (benefit) 1.4 0.6 (0.8) N et earnings ( loss) 1.3 4.5 (4.5)
Percentage of N et SalesYears Ended December 31,

-18-
The following table sets forth the year over year percentage increases or decreases of certain items included in the Company's consolidated statements of operations.
Net sales (2.5) % 65.5 %Cost of sales 2.3 48.1 Selling, general and administrative expenses (2.9) 34.6 Net earnings/loss (72.4) 264.2
with 2010 with 2009
Increase (Decrease) fromPrior Period
2011 compared 2010 compared
Sales The Company experienced significant offsetting fluctuations in sales among its product groups in 2011, which resulted in a 2.5% decrease in net sales as compared to 2010. Net sales increased by 65.5% during 2010 as compared to 2009. The increase in sales during 2010 related primarily to improved market conditions, which resulted in an increase in legacy-Bel revenue of $64.7 million. The remaining increase for 2010 related to the addition of Cinch revenue of $55.1 million. The Company’s net sales by major product line as a percentage of consolidated net sales for the years ended December 31, 2011, 2010 and 2009 were as follows:
Interconnect 107,346$ 36% 101,059$ 33% 32,447$ 18%Modules 90,475 31% 61,092 20% 54,323 30%Magnetics 87,104 30% 127,664 43% 86,326 47%Circuit protection 10,196 3% 12,724 4% 9,657 5%
295,121$ 100% 302,539$ 100% 182,753$ 100%
2011 2010 2009
Year EndedDecember 31,
Sales related to the Cinch acquisition, which are included in the interconnect product group above, have shown steady growth in 2011. The most significant shift in product mix relates to a $40.6 million decrease in sales of the Company’s magnetic products partially offset by $29.4 million increase in sales of modules products. The Company anticipates future growth to be primarily within Bel’s modular and interconnect product lines. The Company continues to have limited visibility as to future customer requirements and as such, the Company cannot predict with any degree of certainty sales revenues for 2012. The Company cannot quantify the extent of sales growth arising from unit sales mix and/or price changes. Product demand and sales volume will affect how we price our products. Through the Company's engineering and research effort, the Company has been successful in adding additional value to existing product lines, which tends to increase sales prices initially until that generation of products becomes mature and sales prices experience price degradation. In general, as products become mature, average selling prices decrease. Cost of Sales The Company’s cost of sales as a percentage of consolidated net sales for the years ended December 31, 2011, 2010 and 2009 were comprised of the following:
2011 2010 2009
Material 50.4% 44.7% 55.3%Labor 10.9% 13.9% 11.5%Research and development 4.1% 3.8% 4.3%Other expenses 17.5% 16.7% 17.2% Total cost of sales 82.9% 79.1% 88.3%
Year EndedDecember 31,
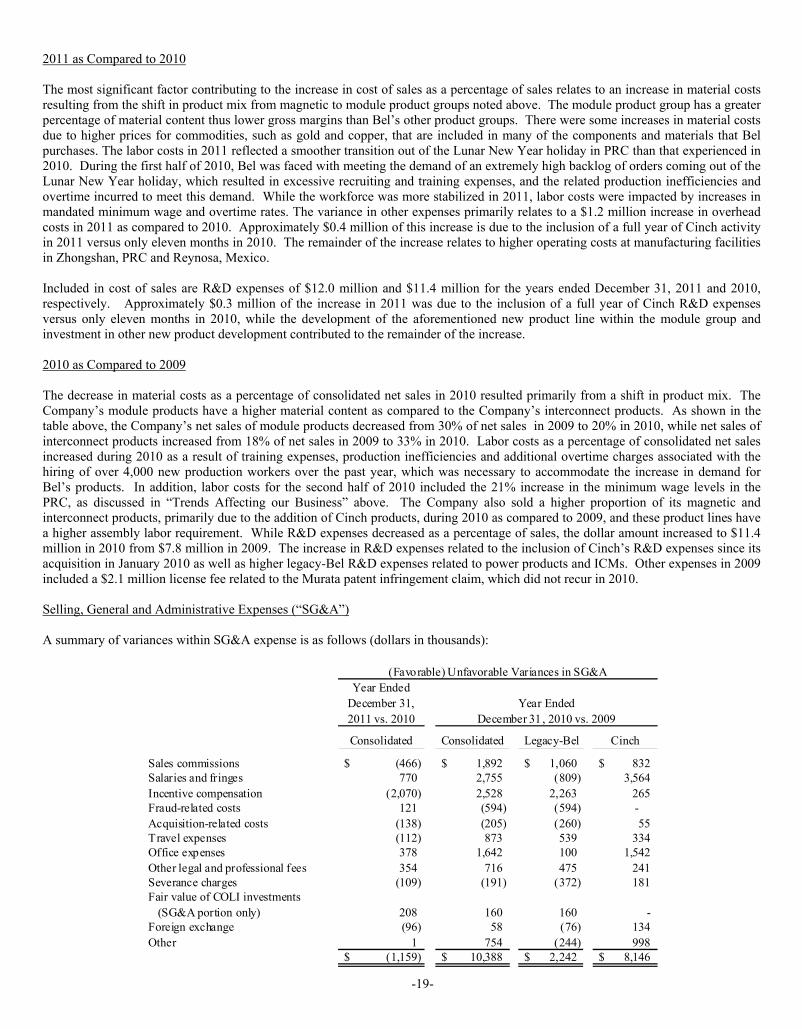
-19-
2011 as Compared to 2010 The most significant factor contributing to the increase in cost of sales as a percentage of sales relates to an increase in material costs resulting from the shift in product mix from magnetic to module product groups noted above. The module product group has a greater percentage of material content thus lower gross margins than Bel’s other product groups. There were some increases in material costs due to higher prices for commodities, such as gold and copper, that are included in many of the components and materials that Bel purchases. The labor costs in 2011 reflected a smoother transition out of the Lunar New Year holiday in PRC than that experienced in 2010. During the first half of 2010, Bel was faced with meeting the demand of an extremely high backlog of orders coming out of the Lunar New Year holiday, which resulted in excessive recruiting and training expenses, and the related production inefficiencies and overtime incurred to meet this demand. While the workforce was more stabilized in 2011, labor costs were impacted by increases in mandated minimum wage and overtime rates. The variance in other expenses primarily relates to a $1.2 million increase in overhead costs in 2011 as compared to 2010. Approximately $0.4 million of this increase is due to the inclusion of a full year of Cinch activity in 2011 versus only eleven months in 2010. The remainder of the increase relates to higher operating costs at manufacturing facilities in Zhongshan, PRC and Reynosa, Mexico. Included in cost of sales are R&D expenses of $12.0 million and $11.4 million for the years ended December 31, 2011 and 2010, respectively. Approximately $0.3 million of the increase in 2011 was due to the inclusion of a full year of Cinch R&D expenses versus only eleven months in 2010, while the development of the aforementioned new product line within the module group and investment in other new product development contributed to the remainder of the increase. 2010 as Compared to 2009 The decrease in material costs as a percentage of consolidated net sales in 2010 resulted primarily from a shift in product mix. The Company’s module products have a higher material content as compared to the Company’s interconnect products. As shown in the table above, the Company’s net sales of module products decreased from 30% of net sales in 2009 to 20% in 2010, while net sales of interconnect products increased from 18% of net sales in 2009 to 33% in 2010. Labor costs as a percentage of consolidated net sales increased during 2010 as a result of training expenses, production inefficiencies and additional overtime charges associated with the hiring of over 4,000 new production workers over the past year, which was necessary to accommodate the increase in demand for Bel’s products. In addition, labor costs for the second half of 2010 included the 21% increase in the minimum wage levels in the PRC, as discussed in “Trends Affecting our Business” above. The Company also sold a higher proportion of its magnetic and interconnect products, primarily due to the addition of Cinch products, during 2010 as compared to 2009, and these product lines have a higher assembly labor requirement. While R&D expenses decreased as a percentage of sales, the dollar amount increased to $11.4 million in 2010 from $7.8 million in 2009. The increase in R&D expenses related to the inclusion of Cinch’s R&D expenses since its acquisition in January 2010 as well as higher legacy-Bel R&D expenses related to power products and ICMs. Other expenses in 2009 included a $2.1 million license fee related to the Murata patent infringement claim, which did not recur in 2010. Selling, General and Administrative Expenses (“SG&A”) A summary of variances within SG&A expense is as follows (dollars in thousands):
Year EndedDecember 31,2011 vs. 2010
Consolidated Consolidated Legacy-Bel Cinch
Sales commissions (466)$ 1,892$ 1,060$ 832$ Salaries and fringes 770 2,755 (809) 3,564 Incentive compensation (2,070) 2,528 2,263 265 Fraud-related costs 121 (594) (594) - Acquisition-related costs (138) (205) (260) 55 Travel expenses (112) 873 539 334 Office expenses 378 1,642 100 1,542 Other legal and professional fees 354 716 475 241 Severance charges (109) (191) (372) 181 Fair value of COLI investments (SG&A portion only) 208 160 160 - Foreign exchange (96) 58 (76) 134 Other 1 754 (244) 998
(1,159)$ 10,388$ 2,242$ 8,146$
December 31, 2010 vs. 2009Year Ended
(Favorable) Unfavorable Variances in SG&A
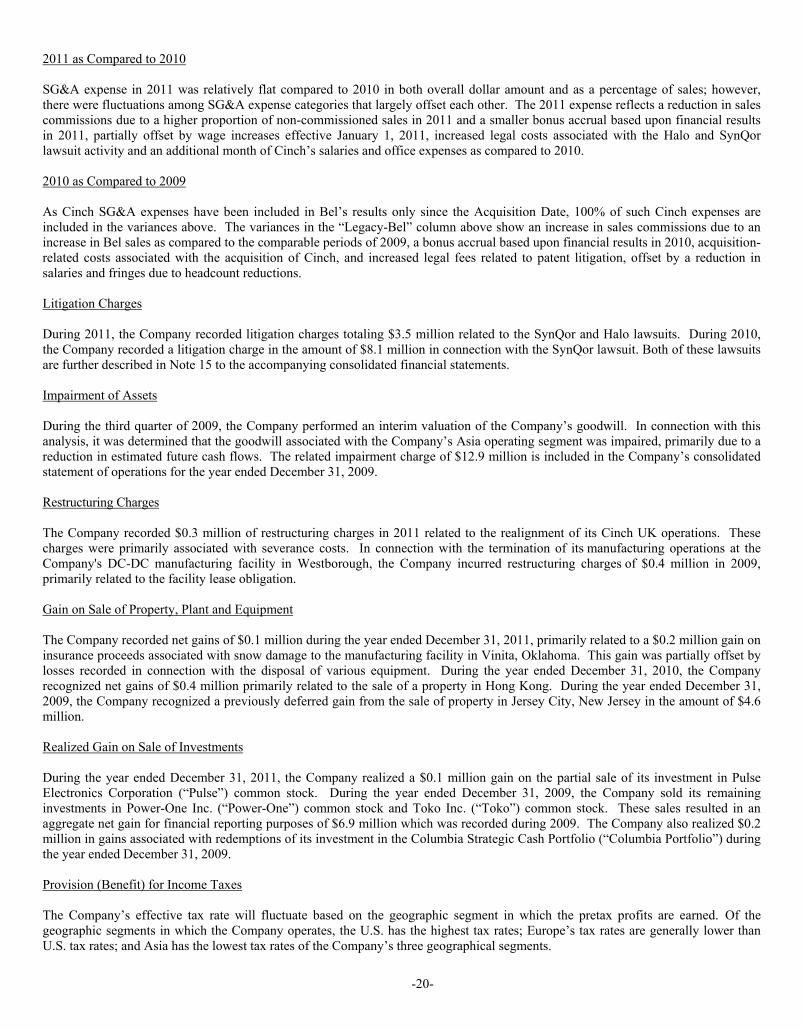
-20-
2011 as Compared to 2010 SG&A expense in 2011 was relatively flat compared to 2010 in both overall dollar amount and as a percentage of sales; however, there were fluctuations among SG&A expense categories that largely offset each other. The 2011 expense reflects a reduction in sales commissions due to a higher proportion of non-commissioned sales in 2011 and a smaller bonus accrual based upon financial results in 2011, partially offset by wage increases effective January 1, 2011, increased legal costs associated with the Halo and SynQor lawsuit activity and an additional month of Cinch’s salaries and office expenses as compared to 2010. 2010 as Compared to 2009 As Cinch SG&A expenses have been included in Bel’s results only since the Acquisition Date, 100% of such Cinch expenses are included in the variances above. The variances in the “Legacy-Bel” column above show an increase in sales commissions due to an increase in Bel sales as compared to the comparable periods of 2009, a bonus accrual based upon financial results in 2010, acquisition-related costs associated with the acquisition of Cinch, and increased legal fees related to patent litigation, offset by a reduction in salaries and fringes due to headcount reductions. Litigation Charges During 2011, the Company recorded litigation charges totaling $3.5 million related to the SynQor and Halo lawsuits. During 2010, the Company recorded a litigation charge in the amount of $8.1 million in connection with the SynQor lawsuit. Both of these lawsuits are further described in Note 15 to the accompanying consolidated financial statements. Impairment of Assets During the third quarter of 2009, the Company performed an interim valuation of the Company’s goodwill. In connection with this analysis, it was determined that the goodwill associated with the Company’s Asia operating segment was impaired, primarily due to a reduction in estimated future cash flows. The related impairment charge of $12.9 million is included in the Company’s consolidated statement of operations for the year ended December 31, 2009. Restructuring Charges The Company recorded $0.3 million of restructuring charges in 2011 related to the realignment of its Cinch UK operations. These charges were primarily associated with severance costs. In connection with the termination of its manufacturing operations at the Company's DC-DC manufacturing facility in Westborough, the Company incurred restructuring charges of $0.4 million in 2009, primarily related to the facility lease obligation. Gain on Sale of Property, Plant and Equipment The Company recorded net gains of $0.1 million during the year ended December 31, 2011, primarily related to a $0.2 million gain on insurance proceeds associated with snow damage to the manufacturing facility in Vinita, Oklahoma. This gain was partially offset by losses recorded in connection with the disposal of various equipment. During the year ended December 31, 2010, the Company recognized net gains of $0.4 million primarily related to the sale of a property in Hong Kong. During the year ended December 31, 2009, the Company recognized a previously deferred gain from the sale of property in Jersey City, New Jersey in the amount of $4.6 million. Realized Gain on Sale of Investments During the year ended December 31, 2011, the Company realized a $0.1 million gain on the partial sale of its investment in Pulse Electronics Corporation (“Pulse”) common stock. During the year ended December 31, 2009, the Company sold its remaining investments in Power-One Inc. (“Power-One”) common stock and Toko Inc. (“Toko”) common stock. These sales resulted in an aggregate net gain for financial reporting purposes of $6.9 million which was recorded during 2009. The Company also realized $0.2 million in gains associated with redemptions of its investment in the Columbia Strategic Cash Portfolio (“Columbia Portfolio”) during the year ended December 31, 2009. Provision (Benefit) for Income Taxes The Company’s effective tax rate will fluctuate based on the geographic segment in which the pretax profits are earned. Of the geographic segments in which the Company operates, the U.S. has the highest tax rates; Europe’s tax rates are generally lower than U.S. tax rates; and Asia has the lowest tax rates of the Company’s three geographical segments.
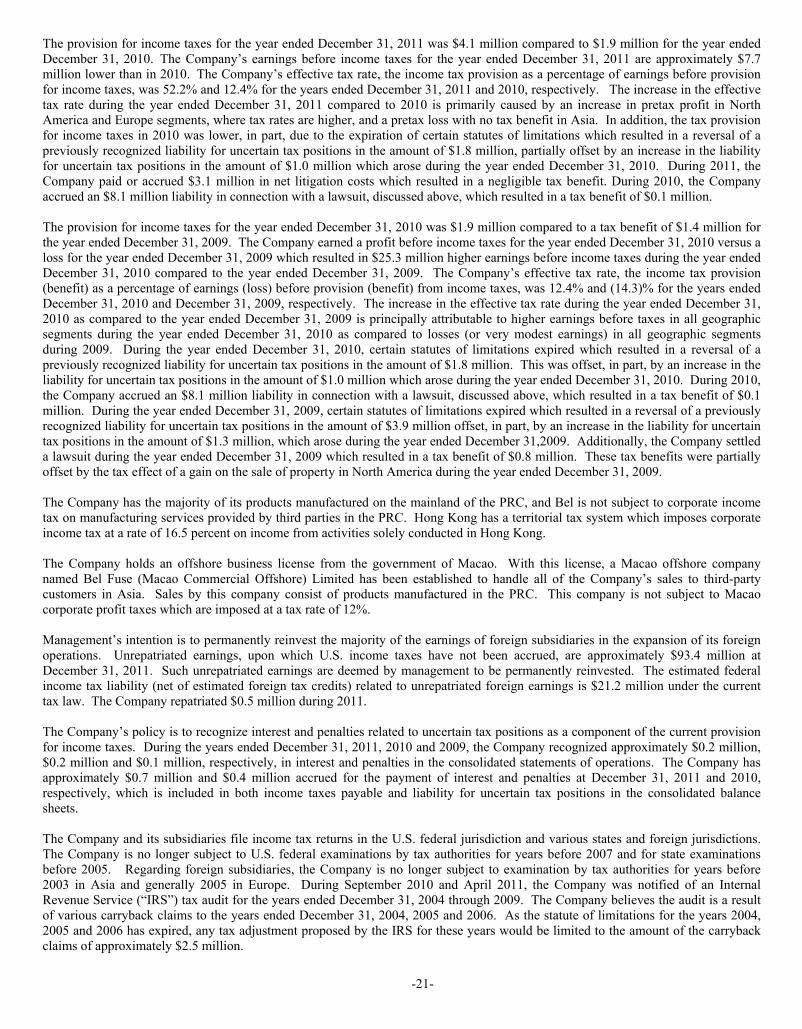
-21-
The provision for income taxes for the year ended December 31, 2011 was $4.1 million compared to $1.9 million for the year ended December 31, 2010. The Company’s earnings before income taxes for the year ended December 31, 2011 are approximately $7.7 million lower than in 2010. The Company’s effective tax rate, the income tax provision as a percentage of earnings before provision for income taxes, was 52.2% and 12.4% for the years ended December 31, 2011 and 2010, respectively. The increase in the effective tax rate during the year ended December 31, 2011 compared to 2010 is primarily caused by an increase in pretax profit in North America and Europe segments, where tax rates are higher, and a pretax loss with no tax benefit in Asia. In addition, the tax provision for income taxes in 2010 was lower, in part, due to the expiration of certain statutes of limitations which resulted in a reversal of a previously recognized liability for uncertain tax positions in the amount of $1.8 million, partially offset by an increase in the liability for uncertain tax positions in the amount of $1.0 million which arose during the year ended December 31, 2010. During 2011, the Company paid or accrued $3.1 million in net litigation costs which resulted in a negligible tax benefit. During 2010, the Company accrued an $8.1 million liability in connection with a lawsuit, discussed above, which resulted in a tax benefit of $0.1 million. The provision for income taxes for the year ended December 31, 2010 was $1.9 million compared to a tax benefit of $1.4 million for the year ended December 31, 2009. The Company earned a profit before income taxes for the year ended December 31, 2010 versus a loss for the year ended December 31, 2009 which resulted in $25.3 million higher earnings before income taxes during the year ended December 31, 2010 compared to the year ended December 31, 2009. The Company’s effective tax rate, the income tax provision (benefit) as a percentage of earnings (loss) before provision (benefit) from income taxes, was 12.4% and (14.3)% for the years ended December 31, 2010 and December 31, 2009, respectively. The increase in the effective tax rate during the year ended December 31, 2010 as compared to the year ended December 31, 2009 is principally attributable to higher earnings before taxes in all geographic segments during the year ended December 31, 2010 as compared to losses (or very modest earnings) in all geographic segments during 2009. During the year ended December 31, 2010, certain statutes of limitations expired which resulted in a reversal of a previously recognized liability for uncertain tax positions in the amount of $1.8 million. This was offset, in part, by an increase in the liability for uncertain tax positions in the amount of $1.0 million which arose during the year ended December 31, 2010. During 2010, the Company accrued an $8.1 million liability in connection with a lawsuit, discussed above, which resulted in a tax benefit of $0.1 million. During the year ended December 31, 2009, certain statutes of limitations expired which resulted in a reversal of a previously recognized liability for uncertain tax positions in the amount of $3.9 million offset, in part, by an increase in the liability for uncertain tax positions in the amount of $1.3 million, which arose during the year ended December 31,2009. Additionally, the Company settled a lawsuit during the year ended December 31, 2009 which resulted in a tax benefit of $0.8 million. These tax benefits were partially offset by the tax effect of a gain on the sale of property in North America during the year ended December 31, 2009. The Company has the majority of its products manufactured on the mainland of the PRC, and Bel is not subject to corporate income tax on manufacturing services provided by third parties in the PRC. Hong Kong has a territorial tax system which imposes corporate income tax at a rate of 16.5 percent on income from activities solely conducted in Hong Kong. The Company holds an offshore business license from the government of Macao. With this license, a Macao offshore company named Bel Fuse (Macao Commercial Offshore) Limited has been established to handle all of the Company’s sales to third-party customers in Asia. Sales by this company consist of products manufactured in the PRC. This company is not subject to Macao corporate profit taxes which are imposed at a tax rate of 12%. Management’s intention is to permanently reinvest the majority of the earnings of foreign subsidiaries in the expansion of its foreign operations. Unrepatriated earnings, upon which U.S. income taxes have not been accrued, are approximately $93.4 million at December 31, 2011. Such unrepatriated earnings are deemed by management to be permanently reinvested. The estimated federal income tax liability (net of estimated foreign tax credits) related to unrepatriated foreign earnings is $21.2 million under the current tax law. The Company repatriated $0.5 million during 2011. The Company’s policy is to recognize interest and penalties related to uncertain tax positions as a component of the current provision for income taxes. During the years ended December 31, 2011, 2010 and 2009, the Company recognized approximately $0.2 million, $0.2 million and $0.1 million, respectively, in interest and penalties in the consolidated statements of operations. The Company has approximately $0.7 million and $0.4 million accrued for the payment of interest and penalties at December 31, 2011 and 2010, respectively, which is included in both income taxes payable and liability for uncertain tax positions in the consolidated balance sheets. The Company and its subsidiaries file income tax returns in the U.S. federal jurisdiction and various states and foreign jurisdictions. The Company is no longer subject to U.S. federal examinations by tax authorities for years before 2007 and for state examinations before 2005. Regarding foreign subsidiaries, the Company is no longer subject to examination by tax authorities for years before 2003 in Asia and generally 2005 in Europe. During September 2010 and April 2011, the Company was notified of an Internal Revenue Service (“IRS”) tax audit for the years ended December 31, 2004 through 2009. The Company believes the audit is a result of various carryback claims to the years ended December 31, 2004, 2005 and 2006. As the statute of limitations for the years 2004, 2005 and 2006 has expired, any tax adjustment proposed by the IRS for these years would be limited to the amount of the carryback claims of approximately $2.5 million.
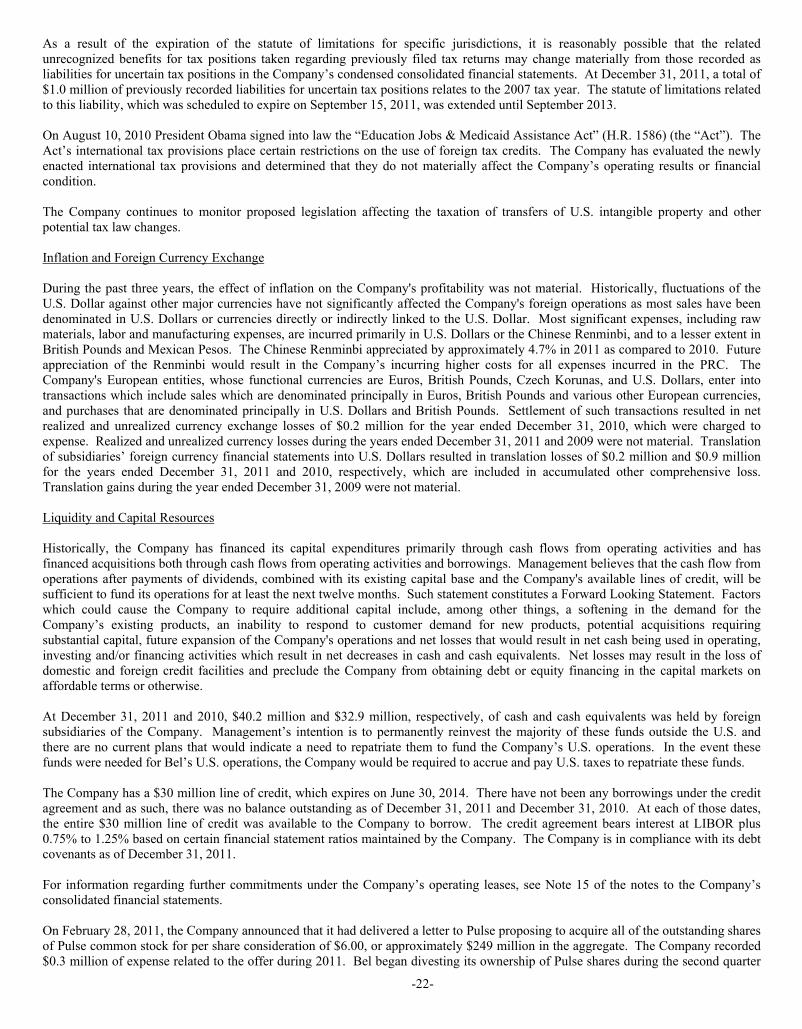
-22-
As a result of the expiration of the statute of limitations for specific jurisdictions, it is reasonably possible that the related unrecognized benefits for tax positions taken regarding previously filed tax returns may change materially from those recorded as liabilities for uncertain tax positions in the Company’s condensed consolidated financial statements. At December 31, 2011, a total of $1.0 million of previously recorded liabilities for uncertain tax positions relates to the 2007 tax year. The statute of limitations related to this liability, which was scheduled to expire on September 15, 2011, was extended until September 2013. On August 10, 2010 President Obama signed into law the “Education Jobs & Medicaid Assistance Act” (H.R. 1586) (the “Act”). The Act’s international tax provisions place certain restrictions on the use of foreign tax credits. The Company has evaluated the newly enacted international tax provisions and determined that they do not materially affect the Company’s operating results or financial condition. The Company continues to monitor proposed legislation affecting the taxation of transfers of U.S. intangible property and other potential tax law changes. Inflation and Foreign Currency Exchange During the past three years, the effect of inflation on the Company's profitability was not material. Historically, fluctuations of the U.S. Dollar against other major currencies have not significantly affected the Company's foreign operations as most sales have been denominated in U.S. Dollars or currencies directly or indirectly linked to the U.S. Dollar. Most significant expenses, including raw materials, labor and manufacturing expenses, are incurred primarily in U.S. Dollars or the Chinese Renminbi, and to a lesser extent in British Pounds and Mexican Pesos. The Chinese Renminbi appreciated by approximately 4.7% in 2011 as compared to 2010. Future appreciation of the Renminbi would result in the Company’s incurring higher costs for all expenses incurred in the PRC. The Company's European entities, whose functional currencies are Euros, British Pounds, Czech Korunas, and U.S. Dollars, enter into transactions which include sales which are denominated principally in Euros, British Pounds and various other European currencies, and purchases that are denominated principally in U.S. Dollars and British Pounds. Settlement of such transactions resulted in net realized and unrealized currency exchange losses of $0.2 million for the year ended December 31, 2010, which were charged to expense. Realized and unrealized currency losses during the years ended December 31, 2011 and 2009 were not material. Translation of subsidiaries’ foreign currency financial statements into U.S. Dollars resulted in translation losses of $0.2 million and $0.9 million for the years ended December 31, 2011 and 2010, respectively, which are included in accumulated other comprehensive loss. Translation gains during the year ended December 31, 2009 were not material. Liquidity and Capital Resources Historically, the Company has financed its capital expenditures primarily through cash flows from operating activities and has financed acquisitions both through cash flows from operating activities and borrowings. Management believes that the cash flow from operations after payments of dividends, combined with its existing capital base and the Company's available lines of credit, will be sufficient to fund its operations for at least the next twelve months. Such statement constitutes a Forward Looking Statement. Factors which could cause the Company to require additional capital include, among other things, a softening in the demand for the Company’s existing products, an inability to respond to customer demand for new products, potential acquisitions requiring substantial capital, future expansion of the Company's operations and net losses that would result in net cash being used in operating, investing and/or financing activities which result in net decreases in cash and cash equivalents. Net losses may result in the loss of domestic and foreign credit facilities and preclude the Company from obtaining debt or equity financing in the capital markets on affordable terms or otherwise. At December 31, 2011 and 2010, $40.2 million and $32.9 million, respectively, of cash and cash equivalents was held by foreign subsidiaries of the Company. Management’s intention is to permanently reinvest the majority of these funds outside the U.S. and there are no current plans that would indicate a need to repatriate them to fund the Company’s U.S. operations. In the event these funds were needed for Bel’s U.S. operations, the Company would be required to accrue and pay U.S. taxes to repatriate these funds. The Company has a $30 million line of credit, which expires on June 30, 2014. There have not been any borrowings under the credit agreement and as such, there was no balance outstanding as of December 31, 2011 and December 31, 2010. At each of those dates, the entire $30 million line of credit was available to the Company to borrow. The credit agreement bears interest at LIBOR plus 0.75% to 1.25% based on certain financial statement ratios maintained by the Company. The Company is in compliance with its debt covenants as of December 31, 2011. For information regarding further commitments under the Company’s operating leases, see Note 15 of the notes to the Company’s consolidated financial statements. On February 28, 2011, the Company announced that it had delivered a letter to Pulse proposing to acquire all of the outstanding shares of Pulse common stock for per share consideration of $6.00, or approximately $249 million in the aggregate. The Company recorded $0.3 million of expense related to the offer during 2011. Bel began divesting its ownership of Pulse shares during the second quarter

-23-
of 2011 and recorded a related gain of $0.1 million. As of December 31, 2011, the Company still owns 258,928 shares of Pulse common stock. On March 9, 2012, the Company completed its acquisition of 100% of the issued and outstanding capital stock of GigaCom Interconnect AB (“GigaCom Interconnect”) with a cash payment of £1.7 million (approximately $2.7 million). GigaCom Interconnect, located in Gothenburg, Sweden, is a supplier of expanded beam fiber optic technology and a participant in the development of next-generation commercial aircraft components. GigaCom Interconnect will become part of Bel’s Cinch Connector business. Management believes that GigaCom’s offering of expanded beam fiber optic products, which are replacing traditional copper-based components due to their superior performance, reliability and lighter weight, will enhance Cinch’s position within the growing aerospace and military markets. Cash Flows During the year ended December 31, 2011, the Company's cash and cash equivalents increased by $4.4 million. This resulted primarily from $30.3 million provided by operating activities, $0.4 million of proceeds from the sale of marketable securities and $0.4 million of proceeds from the disposal of property, plant and equipment, offset by $12.8 million transferred to restricted cash related to the SynQor lawsuit, $5.1 million used to purchase marketable securities, $2.9 million paid for the purchase of property, plant and equipment and $3.2 million for payments of dividends. During the year ended December 31, 2011, cash provided by operating activities was $30.3 million as compared to $7.6 million for the year ended December 31, 2010. Accounts receivable decreased by $14.2 million in 2011 due to a $15.1 million reduction in sales during the fourth quarter of 2011 as compared to the fourth quarter of 2010. In addition, the Company experienced a $17.6 million increase in inventory levels during 2010 related to heightened demand for products, which did not recur in 2011. During the year ended December 31, 2010, the Company's cash and cash equivalents decreased by $40.4 million. This resulted primarily from $40.4 million paid in connection with the acquisition of Cinch, $2.4 million for the purchase of property, plant and equipment, $6.2 million for the purchase of marketable securities and $3.2 million for payments of dividends, offset by $7.6 million provided by operating activities, $3.4 million in net proceeds from the surrender of company-owned life insurance policies, and $0.6 million of proceeds from the sale of property, plant and equipment. During the year ended December 31, 2010, cash provided by operating activities was $7.6 million as compared to $29.2 million for year ended December 31, 2009. This $21.6 million reduction in operating cash flow related primarily to the significant fluctuations in accounts receivable and inventory levels in both 2009 and 2010, commensurate with fluctuating customer demand and the related manufacturing and sales volumes. In early 2009, customer demand for Bel’s products was down, which resulted in decreased accounts receivable and inventory levels during 2009 followed by a reversal of this trend during the latter part of 2009 and into 2010. During the year ended December 31, 2009, the Company's cash and cash equivalents increased by $49.3 million from $75.0 million at December 31, 2008 to $124.2 million at December 31, 2009, reflecting approximately $29.2 million provided by operating activities. This resulted primarily from a reduction in 2009 sales volume and the associated decrease in purchases of raw materials and overall reduction in manufacturing of finished products which led to a $11.3 million decrease in accounts receivable and a $14.8 million decrease in inventory on hand as compared to those balances at December 31, 2008. Other factors contributing to the overall increase in cash and cash equivalents at December 31, 2009 included $20.6 million of proceeds from the sale of marketable securities, $5.3 million from the final redemptions of the Columbia Portfolio, $1.5 million of proceeds from the surrender of company-owned life insurance policies and $2.6 million of proceeds from the sale of property, plant and equipment, primarily from the $2.3 million release of final escrow related to the sale of the Jersey City property, offset, in part, by $2.4 million for the purchase of property, plant and equipment, $0.1 million for the repurchase of the Company’s common stock, $3.5 million for the purchase of marketable securities, $0.4 million in payment for an acquisition, $0.1 million for the purchase of a license agreement and $3.1 million for payments of dividends. The remaining reduction in cash and cash equivalent relates to $0.3 million which was reclassified to restricted cash as of December 31, 2009. Cash and cash equivalents, marketable securities, short-term investments and accounts receivable comprised approximately 48.0% and 50.1% of the Company's total assets at December 31, 2011 and December 31, 2010, respectively. The Company's current ratio (i.e., the ratio of current assets to current liabilities) was 4.9 to 1 and 4.4 to 1 at December 31, 2011 and December 31, 2010, respectively. Accounts receivable, net of allowances, were $39.1 million at December 31, 2011, as compared with $53.3 million at December 31, 2010. The decrease in accounts receivable is primarily due to an 18.0% decrease in fourth quarter sales for 2011 as compared to the fourth quarter of 2010 in addition to a decrease in the Company’s days sales outstanding (DSO) from 57 days at December 31, 2010 to 51 days at December 31, 2011. Marketable securities increased by $4.0 million as a result of the purchase of new marketable securities during 2011. Inventories were $53.4 million at December 31, 2011, as compared with $57.0 million at December 31, 2010.

-24-
Contractual Obligations The following table sets forth at December 31, 2011 the amounts of payments due under specific types of contractual obligations, aggregated by category of contractual obligation, for the time periods described below. This table excludes $4.1 million of unrecognized tax benefits as of December 31, 2011, as the Company is unable to make reasonably reliable estimates of the period of cash settlements, if any, with the respective taxing authorities.
Contractual Obligations Total Less than 1 year1-3
years3-5
yearsMore than
5 years
Capital expenditure obligations 1,679$ 1,679$ -$ -$ -$ Operating leases 8,293 2,847 2,765 1,524 1,157 Raw material purchase obligations 25,187 24,970 217 - -
Total 35,159$ 29,496$ 2,982$ 1,524$ 1,157$
Payments due by period (dollars in thousands)
The Company is required to pay SERP obligations at the occurrence of certain events. As of December 31, 2011, $9.3 million is included in long-term liabilities as an unfunded pension obligation on the Company’s consolidated balance sheet. Included in other assets at December 31, 2011 is the cash surrender value of company-owned life insurance and marketable securities held in a rabbi trust with an aggregate value of $10.5 million, which has been designated by the Company to be utilized to fund the Company’s SERP obligations. Critical Accounting Policies and Other Matters The Company’s consolidated financial statements include certain amounts that are based on management’s best estimates and judgments. Estimates are used when accounting for amounts recorded in connection with mergers and acquisitions, including determination of the fair value of assets and liabilities. Additionally, estimates are used in determining such items as current fair values of goodwill and other intangible assets, as well as provisions related to product returns, bad debts, inventories, intangible assets, investments, SERP expense, income taxes and contingencies and litigation. The Company bases its estimates on historical experience and on various other assumptions, including in some cases future projections, that are believed to be reasonable under the circumstances, the results of which form the basis for making judgments about the carrying values of assets and liabilities that are not readily apparent from other sources. Actual results may differ from these estimates under different assumptions or conditions. The following accounting policies require accounting estimates that have the potential for significantly impacting Bel’s financial statements.
Inventory The Company makes purchasing and manufacturing decisions principally based upon firm sales orders from customers, projected customer requirements and the availability and pricing of raw materials. Future events that could adversely affect these decisions and result in significant charges to the Company’s operations include miscalculating customer requirements, technology changes which render certain raw materials and finished goods obsolete, loss of customers and/or cancellation of sales orders, stock rotation with distributors and termination of distribution agreements. The Company writes down its inventory for estimated obsolescence or unmarketable inventory equal to the difference between the cost of inventory and the estimated market value based on the aforementioned assumptions. As of December 31, 2011 and 2010, the Company had reserves for excess or obsolete inventory of $4.8 million and $4.6 million, respectively. If actual market conditions are less favorable than those projected by management, additional inventory write-downs may be required. When the value of inventory is written down, it is never written back up. When inventory that has been written down is subsequently used in the manufacturing process, the lower adjusted cost of the material is charged to cost of sales. Should any of this inventory be used in the manufacturing process for customer orders, the improved gross profit will be recognized at the time the completed product is shipped and the sale is recorded. Goodwill and Indefinite-Lived Intangible Assets The assets and liabilities of acquired businesses are recorded under the purchase method of accounting at their estimated fair values at the dates of acquisition. Goodwill represents the amount of consideration transferred in excess of fair values assigned to the underlying net assets of acquired businesses.

-25-
Goodwill and intangible assets deemed to have indefinite lives are not amortized, but are subject to annual impairment testing. Management reviews the carrying value of goodwill and other indefinite-lived intangible assets on an annual basis or whenever events or changes in circumstances indicate that the carrying amount of an asset may not be recoverable. The Company tests goodwill for impairment, and has established December 31 as the annual impairment test date, using a fair value approach at the reporting unit level. A reporting unit is an operating segment or one level below an operating segment for which discrete financial information is available and reviewed regularly by management. Assets and liabilities of the Company have been assigned to the reporting units to the extent they are employed in or are considered a liability related to the operations of the reporting unit and are considered in determining the fair value of the reporting unit. Reporting units with similar economic characteristics are aggregated for the goodwill impairment test. The goodwill impairment test is a two-step process. If the fair value of a reporting unit exceeds its carrying amount, goodwill of the reporting unit is considered not impaired and the second step of the impairment test is unnecessary. If the carrying amount of a reporting unit exceeds its fair value, the second step of the goodwill impairment test is performed to measure the amount of impairment loss, if any. The second step of the goodwill impairment test, used to measure the amount of impairment loss, compares the implied fair value of goodwill associated with each reporting unit with the carrying amount of that goodwill. If the carrying amount of goodwill associated with a reporting unit exceeds the implied fair value of that goodwill, an impairment loss shall be recognized in an amount equal to that excess.
At December 31, 2011, the Company’s goodwill consisted of $1.2 million related to its North America reporting unit and $2.9 million related to its Europe reporting unit. Management has concluded that the fair value of the North America and Europe reporting units exceeds the associated carrying values at December 31, 2011 and that no impairment exists as of that date. While both reporting units passed the first step of the goodwill impairment test as of December 31, 2011, the fair value of the Company’s Europe reporting unit was determined to be only $0.9 million in excess of its carrying value of $15.1 million. There can be no assurances that goodwill impairments will not occur in the future. The valuation model utilizes assumptions which represent management’s best estimate of future events, but would be sensitive to positive or negative changes in each of the underlying assumptions as well as to an alternative weighting of valuation methods which would result in a potentially higher or lower goodwill impairment expense. The Company tests indefinite-lived intangible assets for impairment using a fair value approach, the relief-from-royalty method (a form of the income approach). At December 31, 2011, the Company’s indefinite-lived intangible assets related solely to the trademarks acquired in the Cinch acquisition in January 2010. Management has concluded that the combined fair value of the Cinch trademarks exceeds the related carrying value at December 31, 2011 and that no impairment existed as of that date. Long-Lived Assets and Other Intangible Assets Property, plant and equipment represents an important component of the Company’s total assets. The Company depreciates its property, plant and equipment on a straight-line basis over the estimated useful lives of the assets. Intangible assets with a finite useful life are amortized on a straight-line basis over the estimated useful lives of the assets. Management reviews long-lived assets and other intangible assets for potential impairment whenever significant events or changes in circumstances indicate that the carrying amount of an asset may not be recoverable. An impairment exists when the estimated undiscounted cash flows expected to result from the use of an asset and its eventual disposition are less than its carrying amount. If an impairment exists, the resulting write-down would be the difference between the fair market value of the long-lived asset and the related net book value. No impairments related to long-lived assets or amortized intangible assets were recorded during the years ended December 31, 2011, 2010 or 2009. Income Taxes Deferred tax assets and liabilities are recognized for the future tax consequences attributable to differences between the financial statement carrying amounts of existing assets and liabilities and their respective tax bases, as measured by enacted tax rates that are expected to be in effect in the periods when the deferred tax assets and liabilities are expected to be settled or realized. Significant judgment is required in determining the worldwide provisions for income taxes. Valuation allowances are provided for deferred tax assets where it is considered more likely than not that the Company will not realize the benefit of such asset. In the ordinary course of a global business, the ultimate tax outcome is uncertain for many transactions. It is the Company’s policy not to recognize tax benefits arising from uncertain tax positions that may not be realized in future years as a result of an examination by tax authorities. The Company establishes the provisions based upon management’s assessment of exposure associated with permanent tax differences and tax credits applied to temporary difference adjustments. The tax provisions are analyzed periodically (at least quarterly) and adjustments are made as events occur that warrant adjustments to those provisions. The accounting literature requires significant judgment in determining what constitutes an individual tax position as well as assessing the outcome of each tax position. Changes in judgment as to recognition or measurement of tax positions can materially affect the estimate of the effective tax rate and, consequently, affect our operating results. As of December 31, 2011, the Company had gross foreign income tax net operating and capital losses (“NOL”) of $2.3 million. The Company has established a valuation allowance of $0.4 million against the deferred tax asset related to this amount. In addition, the

-26-
Company has gross state income tax NOL’s, capital loss carryforwards, and credit carryforwards totaling $3.5 million. The Company has established a valuation allowance of $0.8 million against the deferred tax asset related to this amount. The foreign NOL's can be carried forward indefinitely and the state NOL's expire at various times during 2013 - 2029. If our assumptions change and we determine we will be able to realize these amounts, the tax benefits relating to any reversal of the valuation allowance on deferred tax assets at December 31, 2011 will be recognized as a reduction of income tax expense. Revenue Recognition Revenue is recognized when the product has been delivered and title and risk of loss have passed to the customer, collection of the resulting receivable is deemed reasonably assured by management, persuasive evidence of an arrangement exists and the sale price is fixed and determinable. Historically the Company has been successful in mitigating the risks associated with its revenue. Some issues relate to product warranty, creditworthiness of customers and concentration of sales among a few major customers. The Company is not contractually obligated to accept returns from non-distributor customers except for defective products or in instances where the product does not meet the Company’s quality specifications. If these conditions exist, the Company would be obligated to repair or replace the defective product or make a cash settlement with the customer. Distributors generally have the right to return up to 5% of their purchases over the previous three to six months and are obligated to purchase an amount at least equal to the return. If the Company terminates a relationship with a distributor, the Company is obligated to accept as a return all of the distributor’s inventory from the Company. The Company accrues an estimate for anticipated returns based on historical experience at the time revenue is recognized and adjusts such estimate as specific anticipated returns are identified. If a distributor terminates its relationship with the Company, the Company is not obligated to accept any inventory returns. The Company has a significant amount of sales with certain customers. During the year ended December 31, 2011, the Company had two customers with sales in excess of 10% of Bel’s consolidated revenue. Management believes that the individual loss of either of these customers would have a material adverse effect on the Company’s results of operations, financial position and cash flows. During the year ended December 31, 2011, the Company had sales of $33.6 million and $32.0 million, representing 11.4% and 10.9% of Bel’s consolidated revenue, to Hon Hai Precision Industry Company Ltd. in the Asia operating segment and Ambient Corporation in the North America operating segment, respectively. Other Matters The Company believes that it has sufficient cash reserves to fund its foreseeable working capital needs. It may, however, seek to expand such resources through bank borrowings, at favorable lending rates, from time to time. If the Company were to undertake a substantial acquisition for cash, the acquisition would either be funded with cash on hand or would be financed in part through cash on hand and in part through bank borrowings or the issuance of public or private debt or equity. If the Company borrows money to finance acquisitions, this would likely decrease the Company’s ratio of earnings to fixed charges, could impact other leverage criteria and could result in the imposition of material restrictive covenants, depending on the size of the borrowing and the nature of the target company. Under its existing credit facility, the Company is required to obtain its lender’s consent for certain additional debt financing and to comply with other covenants, including the application of specific financial ratios, and may be restricted from paying cash dividends on its common stock. Depending on the nature of the transaction, the Company cannot assure investors that the necessary acquisition financing would be available to it on acceptable terms, or at all, when required. If the Company issues a substantial amount of stock either as consideration in an acquisition or to finance an acquisition, such issuance may dilute existing stockholders and may take the form of capital stock having preferences over its existing common stock. New Financial Accounting Standards The discussion of new financial accounting standards applicable to the Company is incorporated herein by reference to Note 1. “Description of Business and Summary of Significant Accounting Policies” included in Part II, Item 8. “Financial Statements and Supplementary Data.”
-27-
Item 7A. Quantitative and Qualitative Disclosures About Market Risk Fair Value of Financial Instruments — The estimated fair values of financial instruments have been determined by the Company using available market information and appropriate valuation methodologies. See Note 1 to the Company’s consolidated financial statements. The Company has not entered into, and does not expect to enter into, financial instruments for trading or hedging purposes. The Company does not currently anticipate entering into interest rate swaps and/or similar instruments.
The Company's carrying values of cash, marketable securities, accounts receivable, accounts payable and accrued expenses are a reasonable approximation of their fair value. The Company enters into transactions denominated in U.S. Dollars, Hong Kong Dollars, the Chinese Renminbi, Euros, British Pounds, Mexican Pesos, the Czech Koruna and other European currencies. Fluctuations in the U.S. dollar exchange rate against these currencies could significantly impact the Company's consolidated results of operations. The Company believes that a change in interest rates of 1% or 2% would not have a material effect on the Company's consolidated statement of operations or balance sheet. Item 8. Financial Statements and Supplementary Data
See the consolidated financial statements listed in the accompanying Index to Consolidated Financial Statements for the information required by this item.
-28-
Financial Statements Page
Report of Independent Registered Public Accounting Firm F-1
Consolidated Balance Sheets as of December 31, 2011 and 2010 F-2
Consolidated Statements of Operations for Each of the Three Years in the Period Ended December 31, 2011 F-3
Consolidated Statements of Stockholders' Equity for Each of the Three Years in the Period Ended December 31, 2011 F-4
Consolidated Statements of Cash Flows for Each of the Three Years in the Period Ended December 31, 2011 F-5
Notes to Consolidated Financial Statements F-7
BEL FUSE INC.INDEX
F-1
REPORT OF INDEPENDENT REGISTERED PUBLIC ACCOUNTING FIRM
To the Board of Directors and Stockholders of Bel Fuse Inc. Jersey City, New Jersey
We have audited the accompanying consolidated balance sheets of Bel Fuse Inc. and subsidiaries (the “Company”) as of December 31, 2011 and 2010, and the related consolidated statements of operations, stockholders’ equity, and cash flows for each of the three years in the period ended December 31, 2011. Our audits also included the financial statement schedule listed in the Index at Item 15. We also have audited the Company’s internal control over financial reporting as of December 31, 2011, based on criteria established in Internal Control—Integrated Framework issued by the Committee of Sponsoring Organizations of the Treadway Commission. The Company’s management is responsible for these financial statements and financial statement schedule, for maintaining effective internal control over financial reporting, and for its assessment of the effectiveness of internal control over financial reporting, included in the accompanying management’s report on internal control over financial reporting. Our responsibility is to express an opinion on these financial statements and financial statement schedule and an opinion on the Company’s internal control over financial reporting based on our audits.
We conducted our audits in accordance with the standards of the Public Company Accounting Oversight Board (United States). Those standards require that we plan and perform the audit to obtain reasonable assurance about whether the financial statements are free of material misstatement and whether effective internal control over financial reporting was maintained in all material respects. Our audits of the financial statements included examining, on a test basis, evidence supporting the amounts and disclosures in the financial statements, assessing the accounting principles used and significant estimates made by management, and evaluating the overall financial statement presentation. Our audit of internal control over financial reporting included obtaining an understanding of internal control over financial reporting, assessing the risk that a material weakness exists, testing and evaluating the design and operating effectiveness of internal control based on the assessed risk. Our audits also included performing such other procedures as we considered necessary in the circumstances. We believe that our audits provide a reasonable basis for our opinions.
A company’s internal control over financial reporting is a process designed by, or under the supervision of, the company’s principal executive and principal financial officers, or persons performing similar functions, and effected by the company’s board of directors, management, and other personnel to provide reasonable assurance regarding the reliability of financial reporting and the preparation of financial statements for external purposes in accordance with generally accepted accounting principles. A company’s internal control over financial reporting includes those policies and procedures that (1) pertain to the maintenance of records that, in reasonable detail, accurately and fairly reflect the transactions and dispositions of the assets of the company; (2) provide reasonable assurance that transactions are recorded as necessary to permit preparation of financial statements in accordance with generally accepted accounting principles and that receipts and expenditures of the company are being made only in accordance with authorizations of management and directors of the company; and (3) provide reasonable assurance regarding prevention or timely detection of unauthorized acquisition, use, or disposition of the company’s assets that could have a material effect on the financial statements.
Because of the inherent limitations of internal control over financial reporting, including the possibility of collusion or improper management override of controls, material misstatements due to error or fraud may not be prevented or detected on a timely basis. Also, projections of any evaluation of the effectiveness of the internal control over financial reporting to future periods are subject to the risk that the controls may become inadequate because of changes in conditions, or that the degree of compliance with the policies or procedures may deteriorate.
In our opinion, the consolidated financial statements referred to above present fairly, in all material respects, the financial position of Bel Fuse Inc. and subsidiaries as of December 31, 2011 and 2010, and the results of their operations and their cash flows for each of the three years in the period ended December 31, 2011, in conformity with accounting principles generally accepted in the United States of America. Also, in our opinion, such financial statement schedule of Bel Fuse Inc. and subsidiaries, when considered in relation to the basic consolidated financial statements taken as a whole, presents fairly, in all material respects, the information set forth therein. Also, in our opinion, the Company maintained, in all material respects, effective internal control over financial reporting as of December 31, 2011, based on the criteria established in Internal Control—Integrated Framework issued by the Committee of Sponsoring Organizations of the Treadway Commission.
/s/ DELOITTE & TOUCHE LLP
New York, New York March 12, 2012

F-2
(dollars in thousands, except share and per share data)
December 31, December 31,2011 2010
Current Assets:Cash and cash equivalents 88,241$ 83,829$ Marketable securities 5,731 1,706 Accounts receivable - less allowance for doubtful accounts of $771 and $653 at December 31, 2011 and 2010, respectively 39,107 53,312 Inventories 53,361 56,970 Restricted cash, current 12,991 - Prepaid expenses and other current assets 4,092 2,354 Refundable income taxes 2,871 4,370 Deferred income taxes 1,295 1,023
Total Current Assets 207,689 203,564
Property, plant and equipment - net 39,414 44,793 Restricted cash, noncurrent - 155 Deferred income taxes 2,814 3,201 Intangible assets - net 10,877 11,291 Goodwill 4,163 4,264 Other assets 11,954 9,904
TOTAL ASSETS 276,911$ 277,172$
Current Liabilities:Accounts payable 18,459$ 21,180$ Accrued expenses 22,936 22,545 Accrued restructuring costs - 160 Income taxes payable 224 1,584 Dividends payable 806 799
Total Current Liabilities 42,425 46,268
Long-term Liabilities:Accrued restructuring costs - 347 Liability for uncertain tax positions 4,132 2,874 Minimum pension obligation and unfunded pension liability 9,274 7,350
Total Long-term Liabilities 13,406 10,571
Total Liabilities 55,831 56,839
Commitments and Contingencies
Stockholders' Equity:Preferred stock, no par value, 1,000,000 shares authorized; none issued - - Class A common stock, par value $.10 per share, 10,000,000 shares authorized; 2,174,912 shares outstanding at each date (net of 1,072,769 treasury shares) 217 217 Class B common stock, par value $.10 per share, 30,000,000 shares authorized; 9,635,643 and 9,527,343 shares outstanding, respectively (net of 3,218,307 treasury shares) 964 953 Additional paid-in capital 25,420 23,725 Retained earnings 196,029 195,477 Accumulated other comprehensive loss (1,550) (39)
Total Stockholders' Equity 221,080 220,333
TOTAL LIABILITIES AND STOCKHOLDERS' EQUITY 276,911$ 277,172$
See notes to consolidated financial statements.
BEL FUSE INC. AND SUBSIDIARIESCONSOLIDATED BALANCE SHEETS
ASSETS
LIABILITIES AND STOCKHOLDERS' EQUITY

F-3
(dollars in thousands, except per share data)
Years Ended December 31,2011 2010 2009
Net Sales 295,121$ 302,539$ 182,753$
Costs and expenses:Cost of sales 244,749 239,185 161,454 Selling, general and administrative 39,284 40,443 30,055 Litigation charges 3,471 8,103 - Restructuring charges 314 - 413 Impairment of assets - - 12,875 Gain on disposal/sale of property, plant and equipment (93) (352) (4,693)
287,725 287,379 200,104
Income (loss) from operations 7,396 15,160 (17,351) Gain on sale of investments 119 - 7,129 Interest income and other, net 357 420 527
Earnings (loss) before provision (benefit) for income taxes 7,872 15,580 (9,695) Income tax provision (benefit) 4,108 1,931 (1,385)
Net earnings (loss) 3,764$ 13,649$ (8,310)$
Earnings (loss) per share:
Class A common share - basic and diluted 0.28$ 1.10$ (0.71)$
Class B common share - basic and diluted 0.33$ 1.18$ (0.72)$
Weighted-average shares outstanding:
Class A common share - basic and diluted 2,174,912 2,174,912 2,175,322
Class B common share - basic and diluted 9,597,661 9,504,261 9,363,199
Dividends paid per share:
Class A common share 0.24$ 0.24$ 0.24$
Class B common share 0.28$ 0.28$ 0.28$
See notes to consolidated financial statements.
BEL FUSE INC. AND SUBSIDIARIESCONSOLIDATED STATEMENTS OF OPERATIONS
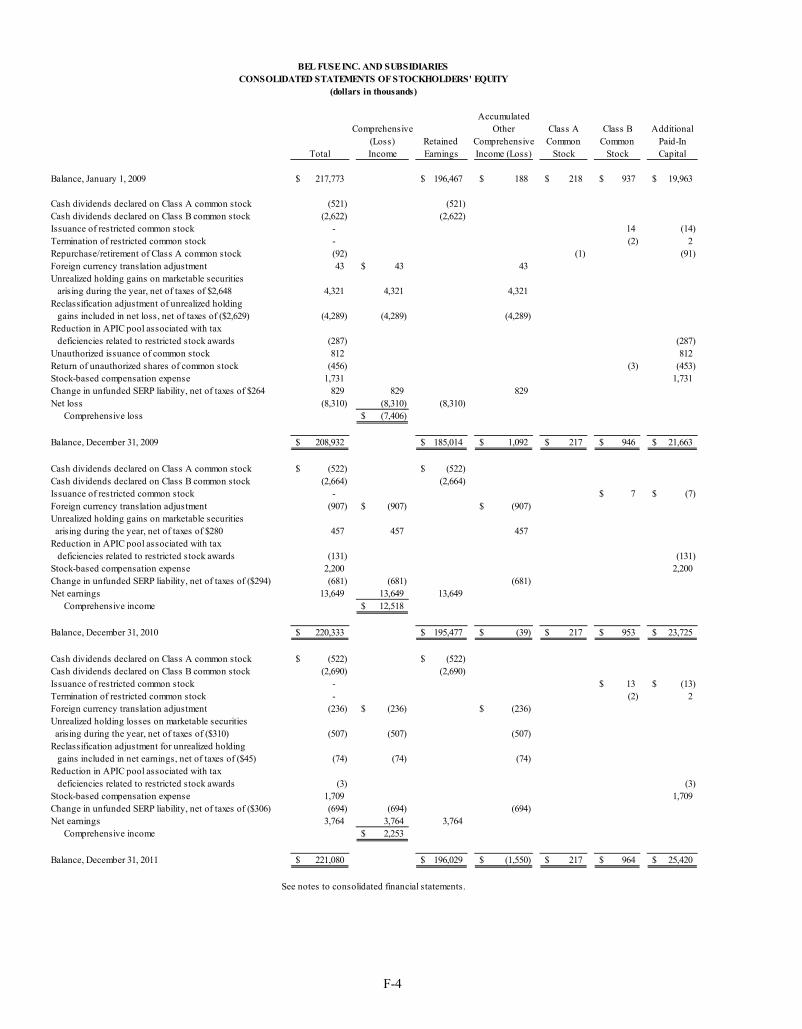
F-4
BEL FUSE INC. AND SUBSIDIARIESCONSOLIDATED STATEMENTS OF STOCKHOLDERS' EQUITY
(dollars in thousands)
AccumulatedComprehensive Other Class A Class B Additional
(Loss) Retained Comprehensive Common Common Paid-InTotal Income Earnings Income (Loss) Stock Stock Capital
Balance, January 1, 2009 217,773$ 196,467$ 188$ 218$ 937$ 19,963$
Cash dividends declared on Class A common stock (521) (521)Cash dividends declared on Class B common stock (2,622) (2,622)Issuance of restricted common stock - 14 (14)Termination of restricted common stock - (2) 2Repurchase/retirement of Class A common stock (92) (1) (91)Foreign currency translation adjustment 43 43$ 43Unrealized holding gains on marketable securities arising during the year, net of taxes of $2,648 4,321 4,321 4,321Reclassification adjustment of unrealized holding gains included in net loss, net of taxes of ($2,629) (4,289) (4,289) (4,289)Reduction in APIC pool associated with tax deficiencies related to restricted stock awards (287) (287)Unauthorized issuance of common stock 812 812Return of unauthorized shares of common stock (456) (3) (453)Stock-based compensation expense 1,731 1,731Change in unfunded SERP liability, net of taxes of $264 829 829 829Net loss (8,310) (8,310) (8,310) Comprehensive loss (7,406)$
Balance, December 31, 2009 208,932$ 185,014$ 1,092$ 217$ 946$ 21,663$
Cash dividends declared on Class A common stock (522)$ (522)$ Cash dividends declared on Class B common stock (2,664) (2,664)Issuance of restricted common stock - 7$ (7)$ Foreign currency translation adjustment (907) (907)$ (907)$ Unrealized holding gains on marketable securities arising during the year, net of taxes of $280 457 457 457Reduction in APIC pool associated with tax deficiencies related to restricted stock awards (131) (131)Stock-based compensation expense 2,200 2,200Change in unfunded SERP liability, net of taxes of ($294) (681) (681) (681)Net earnings 13,649 13,649 13,649 Comprehensive income 12,518$
Balance, December 31, 2010 220,333$ 195,477$ (39)$ 217$ 953$ 23,725$
Cash dividends declared on Class A common stock (522)$ (522)$ Cash dividends declared on Class B common stock (2,690) (2,690)Issuance of restricted common stock - 13$ (13)$ Termination of restricted common stock - (2) 2Foreign currency translation adjustment (236) (236)$ (236)$ Unrealized holding losses on marketable securities arising during the year, net of taxes of ($310) (507) (507) (507)Reclassification adjustment for unrealized holding gains included in net earnings, net of taxes of ($45) (74) (74) (74)Reduction in APIC pool associated with tax deficiencies related to restricted stock awards (3) (3)Stock-based compensation expense 1,709 1,709Change in unfunded SERP liability, net of taxes of ($306) (694) (694) (694)Net earnings 3,764 3,764 3,764 Comprehensive income 2,253$
Balance, December 31, 2011 221,080$ 196,029$ (1,550)$ 217$ 964$ 25,420$
See notes to consolidated financial statements.

F-5
BEL FUSE INC. AND SUBSIDIARIESCONSOLIDATED STATEMENTS OF CASH FLOWS
(dollars in thousands)
Year Ended December 31,2011 2010 2009
Cash flows from operating activities:Net earnings (loss) 3,764$ 13,649$ (8,310)$
Adjustments to reconcile net earnings (loss) to net cash provided by operating activities:
Depreciation and amortization 8,667 8,836 6,778 Stock-based compensation 1,709 2,200 1,731 Gain on disposal/sale of property, plant and equipment (93) (352) (4,693) Realized gain on sale of investments (119) - (7,129) Impairment of assets - - 12,875 Other, net 1,114 715 807 Deferred income taxes 683 725 4,004 Changes in operating assets and liabilities (see below) 14,542 (18,136) 23,095
Net Cash Provided by Operating Activities 30,267 7,637 29,158
Cash flows from investing activities:Purchase of property, plant and equipment (2,928) (2,427) (2,357) Purchase of marketable securities (5,135) (6,190) (3,545) (Purchase of) proceeds from surrender of company-owned life insurance, net (2,406) 3,428 1,518 Cash transferred (to) from restricted cash (12,830) 250 (250) Payment for acquisition, net of cash acquired - (40,424) (454) Purchase of intangible asset - - (99) Proceeds from sale of marketable securities 433 - 20,592 Proceeds from disposal/sale of property, plant and equipment 386 606 2,639 Redemption of investment - - 5,286
Net Cash (Used In) Provided by Investing Activities (22,480) (44,757) 23,330
Cash flows from financing activities:Dividends paid to common shareholders (3,205) (3,181) (3,137)
Purchase and retirement of Class A common stock - - (92)
Net Cash Used In Financing Activities (3,205) (3,181) (3,229)
Effect of exchange rate changes on cash (170) (101) 17
Net Increase (Decrease) in Cash and Cash Equivalents 4,412 (40,402) 49,276
Cash and Cash Equivalents - beginning of year 83,829 124,231 74,955
Cash and Cash Equivalents - end of year 88,241$ 83,829$ 124,231$
See notes to consolidated financial statements.
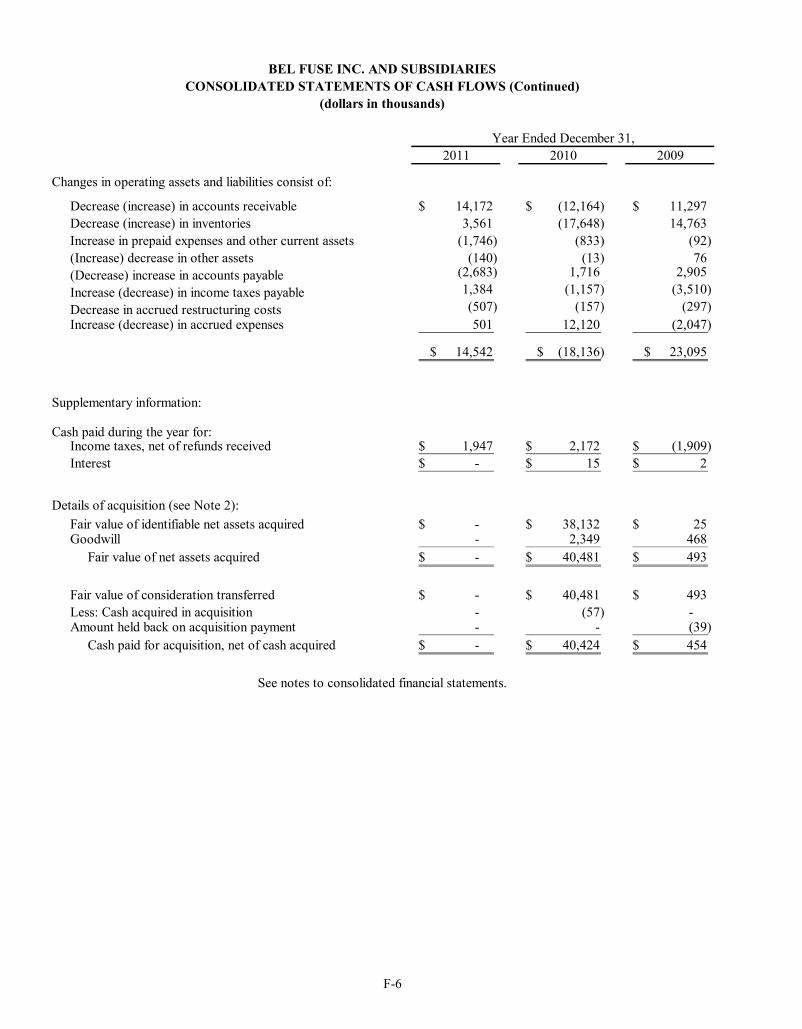
F-6
BEL FUSE INC. AND SUBSIDIARIESCONSOLIDATED STATEMENTS OF CASH FLOWS (Continued)
(dollars in thousands)
Year Ended December 31,2011 2010 2009
Changes in operating assets and liabilities consist of:
Decrease (increase) in accounts receivable 14,172$ (12,164)$ 11,297$ Decrease (increase) in inventories 3,561 (17,648) 14,763 Increase in prepaid expenses and other current assets (1,746) (833) (92) (Increase) decrease in other assets (140) (13) 76 (Decrease) increase in accounts payable (2,683) 1,716 2,905
Increase (decrease) in income taxes payable 1,384 (1,157) (3,510)
Decrease in accrued restructuring costs (507) (157) (297) Increase (decrease) in accrued expenses 501 12,120 (2,047)
14,542$ (18,136)$ 23,095$
Supplementary information:
Cash paid during the year for:Income taxes, net of refunds received 1,947$ 2,172$ (1,909)$ Interest -$ 15$ 2$
Details of acquisition (see Note 2):
Fair value of identifiable net assets acquired -$ 38,132$ 25$ Goodwill - 2,349 468 Fair value of net assets acquired -$ 40,481$ 493$
Fair value of consideration transferred -$ 40,481$ 493$ Less: Cash acquired in acquisition - (57) - Amount held back on acquisition payment - - (39) Cash paid for acquisition, net of cash acquired -$ 40,424$ 454$
See notes to consolidated financial statements.

F-7
BEL FUSE INC. AND SUBSIDIARIES NOTES TO CONSOLIDATED FINANCIAL STATEMENTS
AS OF AND FOR THE YEARS ENDED DECEMBER 31, 2011, 2010 AND 2009
1. DESCRIPTION OF BUSINESS AND SUMMARY OF SIGNIFICANT ACCOUNTING POLICIES
Bel Fuse Inc. and subsidiaries (“Bel” or the “Company”) design, manufacture and sell electronic components and modules used in the networking, telecommunication, high-speed data transmission, commercial aerospace, military, transportation and consumer electronic industries around the world. The Company manages its operations geographically through its three reportable operating segments: North America, Asia and Europe. On January 29, 2010, the Company completed its acquisition of Cinch Connectors, Inc. (“Cinch U.S.”), Cinch Connectors de Mexico, S.A. de C.V. (“Cinch Mexico”) and Cinch Connectors Ltd. (“Cinch Europe”) (collectively, “Cinch”) from Safran S.A. The results of Cinch’s business have been included in the Company’s financial statements only for periods subsequent to the completion of the acquisition. Therefore, the Company’s financial results for 2010 do not reflect a full year of Cinch operations. PRINCIPLES OF CONSOLIDATION - The consolidated financial statements include the accounts of the Company and its wholly owned subsidiaries, including businesses acquired since their respective dates of acquisition. All intercompany transactions and balances have been eliminated. USE OF ESTIMATES - The preparation of the consolidated financial statements in conformity with accounting principles generally accepted in the United States of America requires the Company to make estimates and judgments that affect the reported amounts of assets, liabilities, revenues and expenses, and related disclosure of contingent assets and liabilities. On an on-going basis, the Company evaluates its estimates, including but not limited to those related to product returns, bad debts, inventories, goodwill, intangible assets, investments, Supplemental Executive Retirement Plan (“SERP”) expense, income taxes, contingencies and litigation. The Company bases its estimates on historical experience and on various other assumptions that are believed to be reasonable under the circumstances, the results of which form the basis for making judgments about the carrying values of assets and liabilities that are not readily apparent from other sources. Actual results may differ from these estimates under different assumptions or conditions. CASH EQUIVALENTS - Cash equivalents include short-term investments in money market funds and certificates of deposit with an original maturity of three months or less when purchased. ALLOWANCE FOR DOUBTFUL ACCOUNTS - The Company maintains allowances for doubtful accounts for estimated losses from the inability of its customers to make required payments. The Company determines its allowances by both specific identification of customer accounts where appropriate and the application of historical loss experience to non-specific accounts. As of December 31, 2011 and 2010, the Company had an allowance for doubtful accounts of $0.8 million and $0.7 million, respectively. MARKETABLE SECURITIES - The Company generally classifies its equity securities as "available for sale" and, accordingly, reflects unrealized gains and losses, net of deferred income taxes, as a component of accumulated other comprehensive loss. The Company periodically reviews its marketable securities and determines whether the investments are other-than-temporarily impaired. If the investments are deemed to be other-than-temporarily impaired, the investments are written down to their then current fair market value. The fair values of marketable securities are based on quoted market prices. Realized gains or losses from the sale of marketable securities are based on the specific identification method. During the years ended December 31, 2011 and 2009, the Company recorded net realized gains on sales of investments in the amount of $0.1 million and $7.1 million, respectively. BUSINESS COMBINATIONS – The Company accounts for business combinations by recognizing the assets acquired, the liabilities assumed, and any noncontrolling interest in the acquiree at the acquisition date, measured at their fair values as of that date, with limited exceptions specified in the accounting literature. Acquisition-related costs, including restructuring costs, are recognized separately from the acquisition and will generally be expensed as incurred. EFFECTS OF FOREIGN CURRENCY - The Company's European entities, whose functional currencies are Euros, British Pounds, Czech Korunas, and U.S. Dollars, enter into transactions which include sales denominated principally in Euros, British Pounds and various other European currencies, and purchases that are denominated principally in U.S. Dollars and British Pounds. Settlement of such transactions resulted in net realized and unrealized currency exchange losses of $0.2 million for the year ended December 31, 2010, which were charged to expense. Realized and unrealized currency losses during the years ended December 31, 2011 and 2009 were not material. The functional currency for some foreign operations is the local currency.
F-8
Assets and liabilities of foreign operations are translated at exchange rates as of the balance sheet date, and income, expense and cash flow items are translated at the average exchange rate for the applicable period. Translation adjustments are recorded in other comprehensive income. The U.S. Dollar is used as the functional currency for certain foreign operations that conduct their business in U.S. Dollars. Translation of subsidiaries’ foreign currency financial statements into U.S. dollars resulted in translation losses of $0.2 million and $0.9 million for the years ended December 31, 2011 and 2010, respectively, which are included in accumulated other comprehensive loss. Translation gains during the year ended December 31, 2009 were not material. CONCENTRATION OF CREDIT RISK - Financial instruments which potentially subject the Company to concentrations of credit risk consist principally of accounts receivable and temporary cash investments. The Company grants credit to customers that are primarily original equipment manufacturers and to subcontractors of original equipment manufacturers based on an evaluation of the customer's financial condition, without requiring collateral. Exposure to losses on receivables is principally dependent on each customer's financial condition. The Company controls its exposure to credit risk through credit approvals, credit limits and monitoring procedures and establishes allowances for anticipated losses. See Note 11 of notes to the Company’s consolidated financial statements for disclosures regarding significant customers. The Company places its temporary cash investments with quality financial institutions and commercial issuers of short-term paper and, by policy, limits the amount of credit exposure in any one financial instrument. INVENTORIES - Inventories are stated at the lower of weighted-average cost or market. REVENUE RECOGNITION – Revenue is recognized when the product has been delivered and title and risk of loss has passed to the customer, collection of the resulting receivable is deemed reasonably assured by management, persuasive evidence of an arrangement exists and the sales price is fixed and determinable. Substantially all of the Company's shipments are FCA (free carrier), which provides for title to pass upon delivery to the customer's freight carrier. Some product is shipped DDP/DDU with title passing when the product arrives at the customer's dock. DDP is defined as Delivered Duty Paid by the Company and DDU is Delivered Duty Unpaid by the Company. For certain customers, the Company provides consigned inventory, either at the customer’s facility or at a third-party warehouse. Sales of consigned inventory are recorded when the customer withdraws inventory from consignment. The Company typically has a twelve-month warranty policy for workmanship defects. As the Company has not historically had significant warranty claims, no general reserves for warranties have been established. The Company is not contractually obligated to accept returns except for defective product or in instances where the product does not meet the customer's quality specifications. However, the Company may permit its customers to return product for other reasons. In these instances, the Company would generally require a significant cancellation penalty payment by the customer. The Company estimates such returns, where applicable, based upon management's evaluation of historical experience, market acceptance of products produced and known negotiations with customers. Such estimates are deducted from sales and provided for at the time revenue is recognized. INTANGIBLE ASSETS – Intangible assets with finite lives are stated at cost less accumulated amortization. Amortization is calculated using the straight-line method over the estimated useful life of the asset. Intangible assets with indefinite lives, such as trademarks, are tested for impairment on an annual basis or whenever events or changes in circumstances indicate that the carrying amount of the intangible asset may not be recoverable. The Company tests indefinite-lived intangible assets for impairment using the relief-from-royalty method (a form of the income approach). See Note 3 of the consolidated financial statements. GOODWILL – Goodwill is tested for impairment on an annual basis or whenever events or changes in circumstances indicate that the carrying amount of goodwill may not be recoverable. The Company tests goodwill for impairment, and has established December 31 as the annual impairment test date, using a fair value approach at the reporting unit level. A reporting unit is an operating segment or one level below an operating segment for which discrete financial information is available and reviewed regularly by management. Assets and liabilities of the Company have been assigned to the reporting units to the extent they are employed in or are considered a liability related to the operations of the reporting unit and are considered in determining the fair value of the reporting unit. Reporting units with similar economic characteristics are aggregated for the goodwill impairment test. The goodwill impairment test is a two-step process. If the fair value of a reporting unit exceeds its carrying amount, goodwill of the reporting unit is considered not impaired and the second step of the impairment test is unnecessary. If the carrying amount of a reporting unit exceeds its fair value, the second step of the goodwill impairment test is performed to measure the amount of
F-9
impairment loss, if any. The second step of the goodwill impairment test, used to measure the amount of impairment loss, compares the implied fair value of goodwill associated with each reporting unit with the carrying amount of that goodwill. If the carrying amount of goodwill associated with a reporting unit exceeds the implied fair value of that goodwill, an impairment loss shall be recognized in an amount equal to that excess. See Note 3 of the consolidated financial statements. DEPRECIATION - Property, plant and equipment are stated at cost less accumulated depreciation and amortization. Depreciation and amortization are calculated primarily using the straight-line method over the estimated useful life of the asset. The estimated useful lives primarily range from 3 to 39 years for buildings and leasehold improvements, and from 3 to 13 years for machinery and equipment. INCOME TAXES - The Company accounts for income taxes under the asset and liability method, which requires the recognition of deferred tax assets and liabilities for the expected future tax consequences of events that have been included in the consolidated financial statements. Under this method, deferred tax assets and liabilities are determined based on the differences between the financial statement and tax basis of assets and liabilities using enacted tax rates in effect for the year in which the differences are expected to reverse. The effect of a change in tax rates on deferred tax assets and liabilities is recognized in income in the period that includes the enactment date. The Company records net deferred tax assets to the extent it believes these assets will more-likely-than-not be realized. In making such determination, the Company considers all available positive and negative evidence, including future reversals of existing taxable temporary differences, projected future taxable income, tax planning strategies and recent financial operations. The Company has established a valuation allowance for deferred tax assets that are not likely to be realized. In the event the Company were to determine that it would be able to realize its deferred income tax assets in the future in excess of its net recorded amount, the Company would make an adjustment to the valuation allowance which would reduce the provision for income taxes. The Company establishes reserves for tax contingencies when, despite the belief that the Company’s tax return positions are fully supported, it is probable that certain positions may be challenged and may not be fully sustained. The tax contingency reserves are analyzed on a quarterly basis and adjusted based upon changes in facts and circumstances, such as the conclusion of federal and state audits, expiration of the statute of limitations for the assessment of tax, case law and emerging legislation. The Company’s effective tax rate includes the effect of tax contingency reserves and changes to the reserves as considered appropriate by management. EARNINGS (LOSS) PER SHARE – The Company utilizes the two-class method to report its earnings (loss) per share. The two-class method is an earnings (loss) allocation formula that determines earnings (loss) per share for each class of common stock according to dividends declared and participation rights in undistributed earnings (loss). The Company’s Certificate of Incorporation, as amended, states that Class B common shares are entitled to dividends at least 5% greater than dividends paid to Class A common shares, resulting in the two-class method of computing earnings (loss) per share. In computing earnings (loss) per share, the Company has allocated dividends declared to Class A and Class B based on amounts actually declared for each class of stock and 5% more of the undistributed earnings (loss) have been allocated to Class B shares than to the Class A shares on a per share basis. Basic earnings (loss) per common share are computed by dividing net earnings (loss) by the weighted average number of common shares outstanding during the period. Diluted earnings per common share, for each class of common stock, are computed by dividing net earnings (loss) by the weighted average number of common shares and potential common shares outstanding during the period.
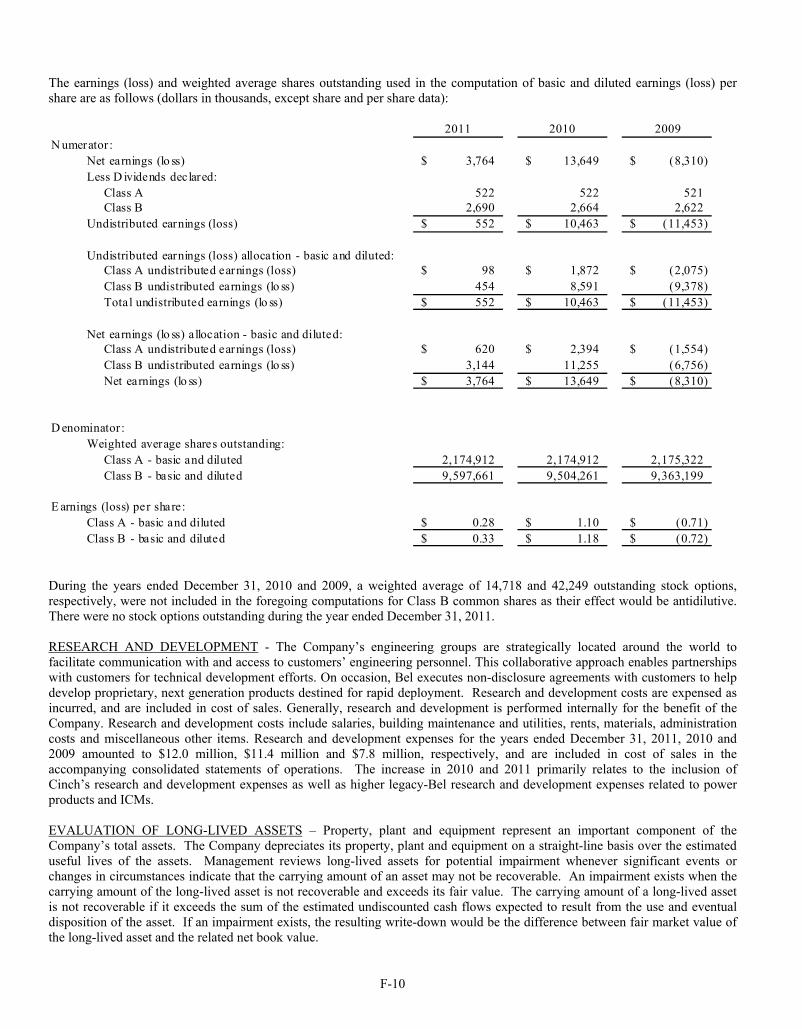
F-10
The earnings (loss) and weighted average shares outstanding used in the computation of basic and diluted earnings (loss) per share are as follows (dollars in thousands, except share and per share data):
2011 2010 2009N umerator :
Net earnings (lo ss) 3,764$ 13,649$ (8,310)$ Less D ividends declared: Class A 522 522 521 Class B 2,690 2,664 2,622 Undistributed earnings (loss) 552$ 10,463$ (11,453)$
Undistributed earnings (loss) allocation - basic and diluted: Class A undistributed earnings (loss) 98$ 1,872$ (2,075)$ Class B undistributed earnings (lo ss) 454 8,591 (9,378) Total undistributed earnings (lo ss) 552$ 10,463$ (11,453)$
Net earnings (lo ss) allocation - basic and diluted: Class A undistributed earnings (loss) 620$ 2,394$ (1,554)$ Class B undistributed earnings (lo ss) 3,144 11,255 (6,756) Net earnings (lo ss) 3,764$ 13,649$ (8,310)$
D enominator :Weighted average shares outstanding: Class A - basic and diluted 2,174,912 2,174,912 2,175,322 Class B - basic and diluted 9,597,661 9,504,261 9,363,199
E arnings (loss) per share:Class A - basic and diluted 0.28$ 1.10$ (0.71)$ Class B - basic and diluted 0.33$ 1.18$ (0.72)$
During the years ended December 31, 2010 and 2009, a weighted average of 14,718 and 42,249 outstanding stock options, respectively, were not included in the foregoing computations for Class B common shares as their effect would be antidilutive. There were no stock options outstanding during the year ended December 31, 2011. RESEARCH AND DEVELOPMENT - The Company’s engineering groups are strategically located around the world to facilitate communication with and access to customers’ engineering personnel. This collaborative approach enables partnerships with customers for technical development efforts. On occasion, Bel executes non-disclosure agreements with customers to help develop proprietary, next generation products destined for rapid deployment. Research and development costs are expensed as incurred, and are included in cost of sales. Generally, research and development is performed internally for the benefit of the Company. Research and development costs include salaries, building maintenance and utilities, rents, materials, administration costs and miscellaneous other items. Research and development expenses for the years ended December 31, 2011, 2010 and 2009 amounted to $12.0 million, $11.4 million and $7.8 million, respectively, and are included in cost of sales in the accompanying consolidated statements of operations. The increase in 2010 and 2011 primarily relates to the inclusion of Cinch’s research and development expenses as well as higher legacy-Bel research and development expenses related to power products and ICMs. EVALUATION OF LONG-LIVED ASSETS – Property, plant and equipment represent an important component of the Company’s total assets. The Company depreciates its property, plant and equipment on a straight-line basis over the estimated useful lives of the assets. Management reviews long-lived assets for potential impairment whenever significant events or changes in circumstances indicate that the carrying amount of an asset may not be recoverable. An impairment exists when the carrying amount of the long-lived asset is not recoverable and exceeds its fair value. The carrying amount of a long-lived asset is not recoverable if it exceeds the sum of the estimated undiscounted cash flows expected to result from the use and eventual disposition of the asset. If an impairment exists, the resulting write-down would be the difference between fair market value of the long-lived asset and the related net book value.
F-11
FAIR VALUE MEASUREMENTS - The Company utilizes the accounting guidance for fair value measurements and disclosures for all financial assets and liabilities and nonfinancial assets and liabilities that are recognized or disclosed at fair value in the consolidated financial statements on a recurring basis or on a nonrecurring basis during the reporting period. The fair value is an exit price, representing the price that would be received to sell an asset or paid to transfer a liability in an orderly transaction between market participants based upon the best use of the asset or liability at the measurement date. The Company utilizes market data or assumptions that market participants would use in pricing the asset or liability. The accounting guidance establishes a three-tier fair value hierarchy, which prioritizes the inputs used in measuring fair value. These tiers are defined as follows:
Level 1 - Observable inputs such as quoted market prices in active markets Level 2 - Inputs other than quoted prices in active markets that are either directly or indirectly observable Level 3 - Unobservable inputs about which little or no market data exists, therefore requiring an entity to develop its
own assumptions For financial instruments such as cash and cash equivalents, accounts receivable, accounts payable and accrued expenses, the carrying amount approximates fair value because of the short maturities of such instruments. See Note 4 for additional disclosures related to fair value measurements. NEW FINANCIAL ACCOUNTING STANDARDS Accounting Standards Update No. 2011-04 – Fair Value Measurement (Topic 820): Amendments to Achieve Common Fair Value Measurement and Disclosure Requirements in U.S. GAAP and IFRS (“ASU No. 2011-04”) ASU No. 2011-04 clarifies some existing concepts, eliminates wording differences between U.S. GAAP and International Financial Reporting Standards (“IFRS”), and in some limited cases, changes some principles to achieve convergence between U.S. GAAP and IFRS. ASU No. 2011-04 results in a consistent definition of fair value and common requirements for measurement of and disclosure about fair value between U.S. GAAP and IFRS. This ASU also expands the disclosures for fair value measurements that are estimated using significant unobservable (Level 3) inputs. The Company will implement the provisions of ASU No. 2011-04 effective January 1, 2012. The Company does not expect the adoption of the provisions of this ASU to have a material effect on its consolidated financial position, results of operations or cash flows nor is it expected to materially modify or expand the Company’s financial statement footnote disclosures. Accounting Standards Update No. 2011-05 – Comprehensive Income (Topic 220): Presentation of Comprehensive Income (“ASU No. 2011-05”)
ASU No. 2011-05 amends existing guidance by allowing only two options for presenting the components of net income and other comprehensive income: (1) in a single continuous statement of comprehensive income or (2) in two separate but consecutive financial statements, consisting of an income statement followed by a separate statement of other comprehensive income. This ASU eliminates the option to present the components of other comprehensive income as part of the statement of changes in stockholders’ equity. The amendments in this ASU do not change the items that must be reported in other comprehensive income or when an item of other comprehensive income must be reclassified to net income. This ASU requires retrospective application, and it is effective for fiscal years, and interim periods within those years, beginning after December 15, 2011, with early adoption permitted. The Company will implement the provisions of ASU 2011-05 by presenting the components of net income and other comprehensive income in two separate but consecutive financial statements beginning in the first quarter of 2012. Accounting Standards Update No. 2011-08 – Testing Goodwill for Impairment (Topic 350): Intangibles—Goodwill and Other (“ASU No. 2011-08”) ASU No. 2011-08 updates existing guidance regarding testing of goodwill for impairment. This ASU gives entities the option to perform a qualitative assessment to first assess whether the fair value of a reporting unit is less than its carrying amount. If an entity determines it is not more likely than not that the fair value of the reporting unit is less than its carrying amount, then performing the two-step impairment test is unnecessary. This ASU is effective during the first quarter of 2012, with early adoption permitted. The adoption of this standard during the first quarter of 2012 is not expected to have a material impact on the Company’s results of operations or financial condition.
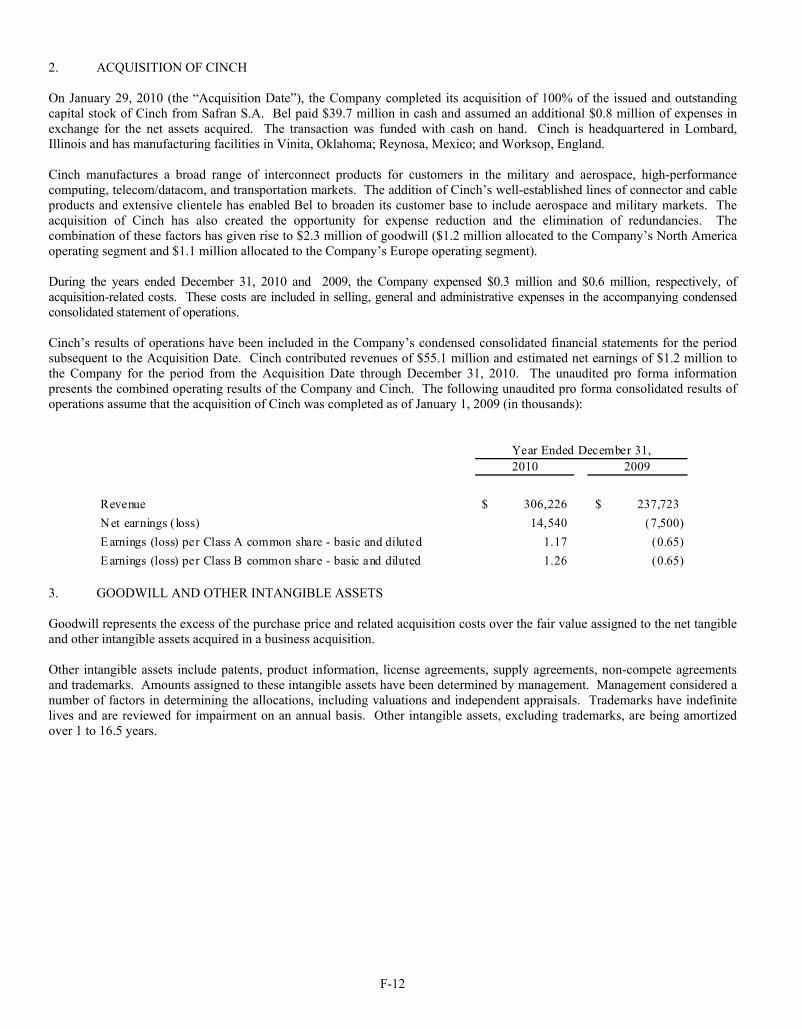
F-12
2. ACQUISITION OF CINCH On January 29, 2010 (the “Acquisition Date”), the Company completed its acquisition of 100% of the issued and outstanding capital stock of Cinch from Safran S.A. Bel paid $39.7 million in cash and assumed an additional $0.8 million of expenses in exchange for the net assets acquired. The transaction was funded with cash on hand. Cinch is headquartered in Lombard, Illinois and has manufacturing facilities in Vinita, Oklahoma; Reynosa, Mexico; and Worksop, England.
Cinch manufactures a broad range of interconnect products for customers in the military and aerospace, high-performance computing, telecom/datacom, and transportation markets. The addition of Cinch’s well-established lines of connector and cable products and extensive clientele has enabled Bel to broaden its customer base to include aerospace and military markets. The acquisition of Cinch has also created the opportunity for expense reduction and the elimination of redundancies. The combination of these factors has given rise to $2.3 million of goodwill ($1.2 million allocated to the Company’s North America operating segment and $1.1 million allocated to the Company’s Europe operating segment).
During the years ended December 31, 2010 and 2009, the Company expensed $0.3 million and $0.6 million, respectively, of acquisition-related costs. These costs are included in selling, general and administrative expenses in the accompanying condensed consolidated statement of operations. Cinch’s results of operations have been included in the Company’s condensed consolidated financial statements for the period subsequent to the Acquisition Date. Cinch contributed revenues of $55.1 million and estimated net earnings of $1.2 million to the Company for the period from the Acquisition Date through December 31, 2010. The unaudited pro forma information presents the combined operating results of the Company and Cinch. The following unaudited pro forma consolidated results of operations assume that the acquisition of Cinch was completed as of January 1, 2009 (in thousands):
2010 2009
Revenue 306,226$ 237,723$
Net earnings (loss) 14,540 (7,500)
E arnings (loss) per Class A common share - basic and diluted 1.17 (0.65)
E arnings (loss) per Class B common share - basic and diluted 1.26 (0.65)
Year Ended December 31,
3. GOODWILL AND OTHER INTANGIBLE ASSETS Goodwill represents the excess of the purchase price and related acquisition costs over the fair value assigned to the net tangible and other intangible assets acquired in a business acquisition.
Other intangible assets include patents, product information, license agreements, supply agreements, non-compete agreements and trademarks. Amounts assigned to these intangible assets have been determined by management. Management considered a number of factors in determining the allocations, including valuations and independent appraisals. Trademarks have indefinite lives and are reviewed for impairment on an annual basis. Other intangible assets, excluding trademarks, are being amortized over 1 to 16.5 years.

F-13
The changes in the carrying value of goodwill classified by reportable operating segment for the years ended December 31, 2011 and 2010 are as follows (dollars in thousands):
Total Asia North America Europe
Balance at January 1, 2010: Goodwill, gross 28,898$ 12,875$ 14,066$ 1,957$ Accumulated impairment charges (26,941) (12,875) (14,066) - Goodwill, net 1,957 - - 1,957
Goodwill allocation related to acquisition 2,349 - 1,227 1,122 Foreign currency translation (42) - - (42)
Balance at December 31, 2010: Goodwill, gross 31,205 12,875 15,293 3,037 Accumulated impairment charges (26,941) (12,875) (14,066) - Goodwill, net 4,264 - 1,227 3,037
Foreign currency translation (101) - - (101)
Balance at December 31, 2011: Goodwill, gross 31,104 12,875 15,293 2,936 Accumulated impairment charges (26,941) (12,875) (14,066) - Goodwill, net 4,163$ -$ 1,227$ 2,936$
During the third quarter of 2009, the Company conducted an interim impairment test related to its goodwill by reporting unit as a result of continued market declines. For the interim goodwill impairment assessment performed as of August 31, 2009, the Company’s fair value analysis was supported by a weighting of two generally accepted valuation approaches, the income approach and the market approach, as further described in Note 2 of the Company’s 2009 Annual Report on Form 10-K. These approaches include numerous assumptions with respect to future circumstances, such as industry and/or local market conditions that might directly impact each of the reporting unit’s operations in the future, and are therefore uncertain. These approaches were utilized to develop a range of fair values and a weighted average of these approaches was utilized to determine the best fair value estimate within that range. The interim impairment test related to the Company's goodwill was performed by reporting unit. The valuation test, which heavily weights future cash flow projections, indicated that the goodwill associated with the Company’s Asia reporting unit was fully impaired and, as a result, the Company recorded an impairment charge of $12.9 million during the third quarter of 2009. During the year ended December 31, 2010, the Company recorded $2.3 million of additional goodwill in connection with the acquisition of Cinch. The goodwill was allocated by segment as noted in the table above. Management determined that the fair value of the goodwill at December 31, 2011 exceeded its carrying value and that no impairment existed as of that date. The Company tests indefinite-lived intangible assets for impairment using a fair value approach, the relief-from-royalty method (a form of the income approach) . At December 31, 2011, the Company’s indefinite-lived intangible assets related solely to the trademarks acquired in the Cinch acquisition in January 2010. Management has concluded that the combined fair value of the Cinch trademarks exceeds the related carrying value at December 31, 2011 and that no impairment existed as of that date. The components of intangible assets other than goodwill are as follows (dollars in thousands):
Gross Carrying Accumulated Net Carrying Gross Carrying Accumulated Net Carrying Amount Amortization Amount Amount Amortization Amount
Patents and product information 2,719$ 1,029$ 1,690$ 2,724$ 795$ 1,929$ Customer relationships 2,541 301 2,240 4,370 1,974 2,396 Non-compete agreements 40 38 2 40 18 22 Trademarks 6,945 - 6,945 6,944 - 6,944
12,245$ 1,368$ 10,877$ 14,078$ 2,787$ 11,291$
December 31, 2011 December 31, 2010
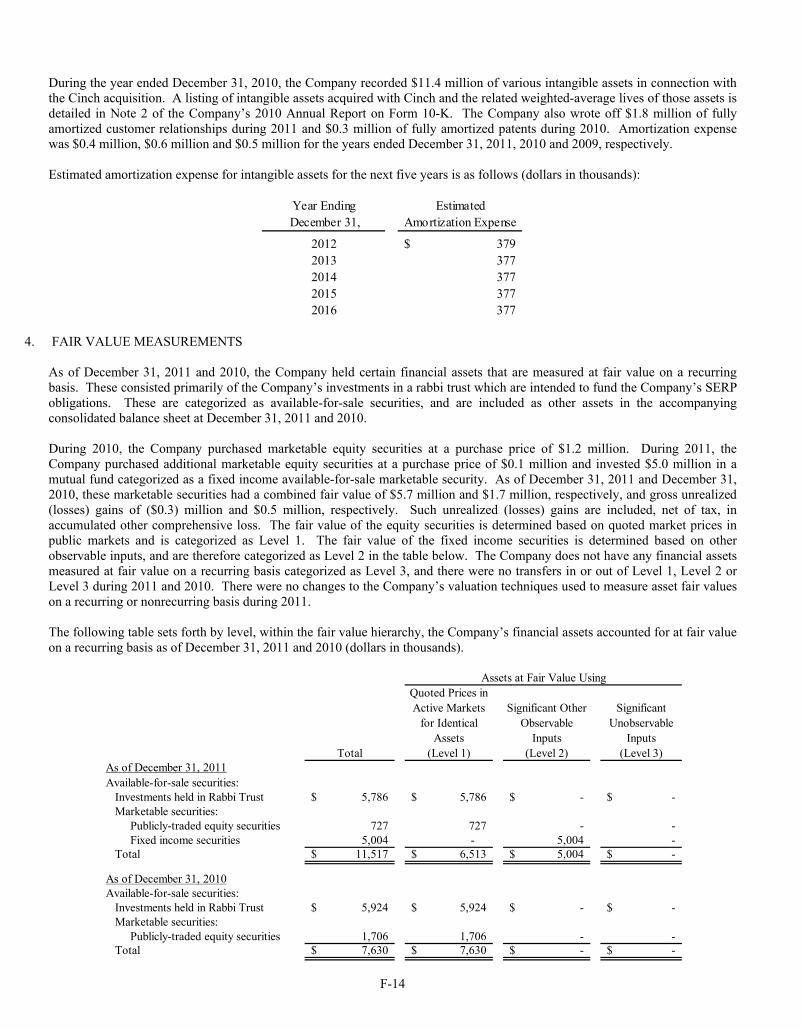
F-14
During the year ended December 31, 2010, the Company recorded $11.4 million of various intangible assets in connection with the Cinch acquisition. A listing of intangible assets acquired with Cinch and the related weighted-average lives of those assets is detailed in Note 2 of the Company’s 2010 Annual Report on Form 10-K. The Company also wrote off $1.8 million of fully amortized customer relationships during 2011 and $0.3 million of fully amortized patents during 2010. Amortization expense was $0.4 million, $0.6 million and $0.5 million for the years ended December 31, 2011, 2010 and 2009, respectively. Estimated amortization expense for intangible assets for the next five years is as follows (dollars in thousands):
Year Ending EstimatedDecember 31, Amortization Expense
2012 379$ 2013 377 2014 377 2015 377 2016 377
4. FAIR VALUE MEASUREMENTS
As of December 31, 2011 and 2010, the Company held certain financial assets that are measured at fair value on a recurring basis. These consisted primarily of the Company’s investments in a rabbi trust which are intended to fund the Company’s SERP obligations. These are categorized as available-for-sale securities, and are included as other assets in the accompanying consolidated balance sheet at December 31, 2011 and 2010. During 2010, the Company purchased marketable equity securities at a purchase price of $1.2 million. During 2011, the Company purchased additional marketable equity securities at a purchase price of $0.1 million and invested $5.0 million in a mutual fund categorized as a fixed income available-for-sale marketable security. As of December 31, 2011 and December 31, 2010, these marketable securities had a combined fair value of $5.7 million and $1.7 million, respectively, and gross unrealized (losses) gains of ($0.3) million and $0.5 million, respectively. Such unrealized (losses) gains are included, net of tax, in accumulated other comprehensive loss. The fair value of the equity securities is determined based on quoted market prices in public markets and is categorized as Level 1. The fair value of the fixed income securities is determined based on other observable inputs, and are therefore categorized as Level 2 in the table below. The Company does not have any financial assets measured at fair value on a recurring basis categorized as Level 3, and there were no transfers in or out of Level 1, Level 2 or Level 3 during 2011 and 2010. There were no changes to the Company’s valuation techniques used to measure asset fair values on a recurring or nonrecurring basis during 2011. The following table sets forth by level, within the fair value hierarchy, the Company’s financial assets accounted for at fair value on a recurring basis as of December 31, 2011 and 2010 (dollars in thousands).
Total
Quoted Prices in Active Markets
for Identical Assets
(Level 1)
Significant Other Observable
Inputs (Level 2)
Significant Unobservable
Inputs (Level 3)
As of December 31, 2011Available-for-sale securities: Investments held in Rabbi Trust 5,786$ 5,786$ -$ -$ Marketable securities: Publicly-traded equity securities 727 727 - - Fixed income securities 5,004 - 5,004 - Total 11,517$ 6,513$ 5,004$ -$
As of December 31, 2010Available-for-sale securities: Investments held in Rabbi Trust 5,924$ 5,924$ -$ -$ Marketable securities: Publicly-traded equity securities 1,706 1,706 - - Total 7,630$ 7,630$ -$ -$
Assets at Fair Value Using
F-15
The Level 2 fixed income securities noted in the table above represent the Company’s investment in a fund that consists of debt securities (bonds), primarily U.S. government securities, corporate bonds, asset-backed securities and mortgage-backed securities. The value of the fund is determined based on quoted market prices for similar instruments or nonbinding market prices that are corroborated by observable market data. There were no financial assets accounted for at fair value on a nonrecurring basis as of December 31, 2011 or 2010. The Company has other financial instruments, such as cash equivalents, accounts receivable, accounts payable and accrued expenses, which are not measured at fair value on a recurring basis but are recorded at amounts that approximate fair value due to their liquid or short-term nature. The Company did not have any other financial liabilities within the scope of the fair value disclosure requirements as of December 31, 2011. Nonfinancial assets and liabilities, such as goodwill, indefinite-lived intangible assets and long-lived assets, are accounted for at fair value on a nonrecurring basis. These items are tested for impairment upon the occurrence of a triggering event or in the case of goodwill, on at least an annual basis. At December 31, 2011, the Company determined that the fair value of its aggregated reporting units exceeded the respective carrying values, and concluded that no impairment of goodwill existed as of that date. In addition, the Company determined that the fair value of its indefinite-lived intangible assets exceeded the book value at December 31, 2011 and concluded that no impairment existed as of that date. 5. OTHER ASSETS At December 31, 2011, the Company has obligations of $9.3 million associated with its supplemental executive retirement plan (“SERP”). As a means of informally funding these obligations, the Company has invested in life insurance policies related to certain employees and marketable securities held in a rabbi trust. At December 31, 2011, these assets had a combined fair value of $10.5 million. Company-Owned Life Insurance Investments in company-owned life insurance policies (“COLI”) were made with the intention of utilizing them as a long-term funding source for the Company’s SERP obligations. However, the cash surrender value of the COLI does not represent a committed funding source for these obligations. Any proceeds from these policies are subject to claims from creditors. During 2011, the Company purchased $2.4 million of additional COLI policies. The fair market value of the COLI of $4.7 million and $2.4 million at December 31, 2011 and 2010, respectively, is included in other assets in the accompanying consolidated balance sheets. The volatility in global equity markets in recent years has had a significant effect on the cash surrender value of the COLI policies. As a result, the Company recorded (expense) income to account for the (decrease) increase in cash surrender value in the amount of $(0.1) million and $0.2 million during the years ended December 31, 2011 and 2010, respectively. These fluctuations in the cash surrender value were allocated between cost of sales and selling, general and administrative expenses on the consolidated statements of operations for the years ended December 31, 2011 and 2010. The allocation is consistent with the costs associated with the long-term employee benefit obligations that the COLI is intended to fund. Other Investments At December 31, 2011 and 2010, the Company held, in the aforementioned rabbi trust, available-for-sale investments at a cost of $5.6 million. Together with the COLI described above, these investments are intended to fund the Company’s SERP obligations and are classified as other assets in the accompanying consolidated balance sheets. The Company monitors these investments for impairment on an ongoing basis. At December 31, 2011 and 2010, the fair market value of these investments was $5.8 million and $5.9 million, respectively. The gross unrealized gain of $0.2 million and $0.3 million at December 31, 2011 and 2010, respectively, has been included, net of tax, in accumulated other comprehensive loss.

F-16
6. INVENTORIES The components of inventories are as follows (dollars in thousands):
2011 2010Raw materials 27,975$ 35,157$ Work in progress 7,025 5,930 Finished goods 18,361 15,883
53,361$ 56,970$
December 31,
7. PROPERTY, PLANT AND EQUIPMENT Property, plant and equipment consist of the following (dollars in thousands):
2011 2010
Land 3,396$ 3,400$ Buildings and improvements 24,844 24,803 Machinery and equipment 67,823 67,961
Construction in progress 1,487 1,332 97,550 97,496
Accumulated depreciation (58,136) (52,703) 39,414$ 44,793$
December 31,
Depreciation expense for the years ended December 31, 2011, 2010 and 2009 was $8.0 million, $8.3 million and $6.3 million, respectively. During the year ended December 31, 2009, upon the resolution of various environmental matters with the State of New Jersey, the Company recognized a previously-deferred $4.6 million gain related to the 2007 sale of land in Jersey City, New Jersey. 8. INCOME TAXES At December 31, 2011 and 2010, the Company has approximately $4.1 million and $3.8 million, respectively, of liabilities for uncertain tax positions ($0 and $0.9 million, respectively, included in income taxes payable and $4.1 million and $2.9 million, respectively, included in liability for uncertain tax positions) all of which, if recognized, would reduce the Company’s effective tax rate.
The Company and its subsidiaries file income tax returns in the U.S. federal jurisdiction and various state and foreign jurisdictions. The Company is no longer subject to U.S. federal examinations by tax authorities for years before 2007 and for state examinations before 2005. Regarding foreign subsidiaries, the Company is no longer subject to examination by tax authorities for years before 2003 in Asia and generally 2005 in Europe. During September 2010 and April 2011, the Company was notified of an Internal Revenue Service (“IRS”) tax audit for the years ended December 31, 2004 through 2009. The Company believes the audit is a result of various carryback claims to the years ended December 31, 2004, 2005 and 2006. As the statute of limitations for the years 2004, 2005 and 2006 has expired, any tax adjustment proposed by the IRS for these years would be limited to the amount of the carryback claims of approximately $2.5 million. As a result of the expiration of the statute of limitations for specific jurisdictions, it is reasonably possible that the related unrecognized benefits for tax positions taken regarding previously filed tax returns may change materially from those recorded as liabilities for uncertain tax positions in the Company’s condensed consolidated financial statements. At December 31, 2011, a total of $1.0 million of previously recorded liabilities for uncertain tax positions relates to the 2007 tax year. The statute of limitations related to this liability, which was scheduled to expire on September 15, 2011, was extended until September 2013.
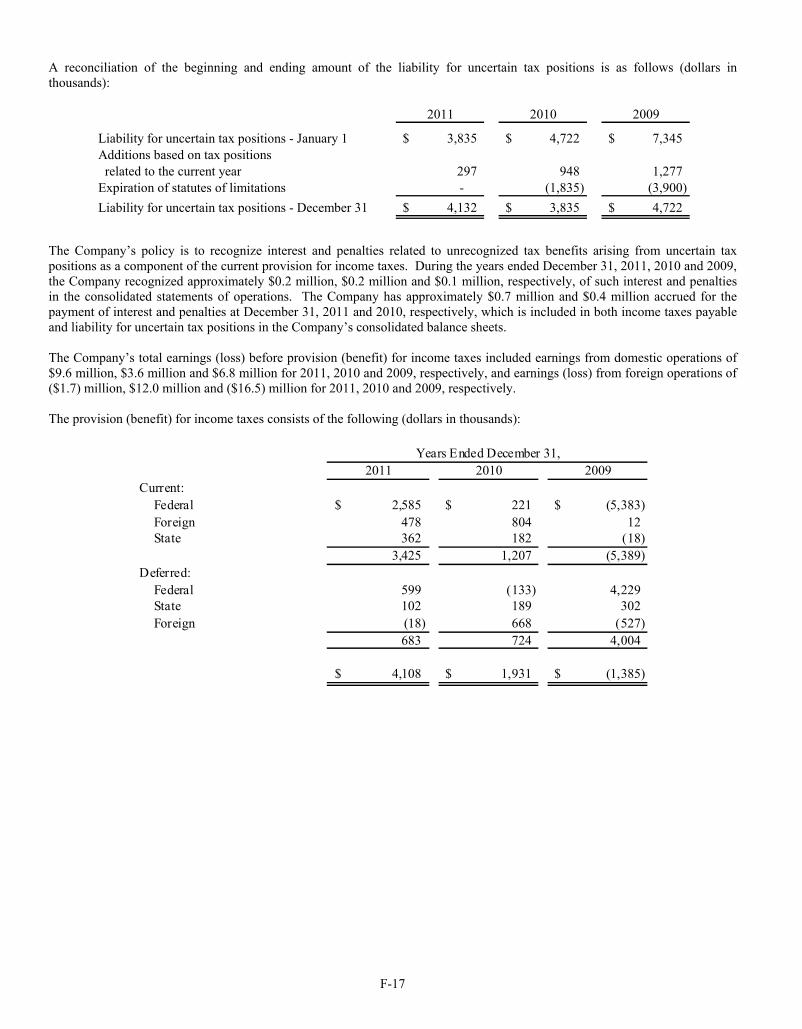
F-17
A reconciliation of the beginning and ending amount of the liability for uncertain tax positions is as follows (dollars in thousands):
2011 2010 2009
Liability for uncertain tax positions - January 1 3,835$ 4,722$ 7,345$ Additions based on tax positions related to the current year 297 948 1,277 Expiration of statutes of limitations - (1,835) (3,900)
Liability for uncertain tax positions - December 31 4,132$ 3,835$ 4,722$
The Company’s policy is to recognize interest and penalties related to unrecognized tax benefits arising from uncertain tax positions as a component of the current provision for income taxes. During the years ended December 31, 2011, 2010 and 2009, the Company recognized approximately $0.2 million, $0.2 million and $0.1 million, respectively, of such interest and penalties in the consolidated statements of operations. The Company has approximately $0.7 million and $0.4 million accrued for the payment of interest and penalties at December 31, 2011 and 2010, respectively, which is included in both income taxes payable and liability for uncertain tax positions in the Company’s consolidated balance sheets. The Company’s total earnings (loss) before provision (benefit) for income taxes included earnings from domestic operations of $9.6 million, $3.6 million and $6.8 million for 2011, 2010 and 2009, respectively, and earnings (loss) from foreign operations of ($1.7) million, $12.0 million and ($16.5) million for 2011, 2010 and 2009, respectively. The provision (benefit) for income taxes consists of the following (dollars in thousands):
2011 2010 2009Current: Federal 2,585$ 221$ (5,383)$ Foreign 478 804 12 State 362 182 (18)
3,425 1,207 (5,389) Deferred: Federal 599 (133) 4,229 State 102 189 302 Foreign (18) 668 (527)
683 724 4,004
4,108$ 1,931$ (1,385)$
Years Ended December 31,

F-18
A reconciliation of taxes on income computed at the federal statutory rate to amounts provided is as follows (dollars in thousands):
$ % $ % $ %Tax provision (benefit) computed at the
federal statutory rate 2,676$ 34% 5,297$ 34% (3,296)$ 34%Increase (decrease) in taxes resulting from:
Different tax rates and permanent differencesapplicable to foreign operations 1,526 20% (2,377) -15% 720 -8%
Increase in (reversal of) liability for uncertaintax positions - net 297 4% (887) -6% (2,623) 27%
Permanent tax differences related to goodwillimpairment with no tax benefit - 0% - 0% 4,378 -45%
Utilization of research and development and foreigntax credits (762) -10% (549) -4% (674) 7%
State taxes, net of federal benefit 341 4% 309 2% 290 -3%
Other, including qualified production activity credits,SERP/COLI income, fair value of vested stock awards,overaccruals and amortization of purchaseaccounting intangibles 30 0% 138 1% (180) 2%
Tax provision (benefit) computed at the Company'seffective tax rate 4,108$ 52% 1,931$ 12% (1,385)$ 14%
200920102011Years Ended December 31,
As of December 31, 2011, the Company has gross foreign income tax net operating losses (“NOL”) and capital loss carryforwards of $2.3 million The Company has established a valuation allowance of $0.4 million against the deferred tax asset related to this amount. In addition, the Company has gross state income tax NOLs, capital loss carryforwards and credit carryforwards of $3.5 million. The Company has established a valuation allowance of $0.8 million against the deferred tax asset related to this amount. The foreign NOL's can be carried forward indefinitely and the state NOL's expire at various times during 2013 - 2029. In connection with the Cinch acquisition, the Company acquired certain tax assets and liabilities. Cinch Europe had net operating loss and capital loss carryforwards in the amounts of $0.6 million and $0.2 million, respectively, as of the acquisition date. The related tax benefits were $0.2 million and $0.1 million, respectively. The capital loss carryforward was acquired with a valuation allowance, which the Company maintained at December 31, 2011. During the year ended December 31, 2010, the entire $0.6 million net operating loss was utilized. Additionally, Cinch Europe had a deferred tax liability in the amount of $0.1 million for various timing differences and $0.1 million in refundable income taxes. At the time of the acquisition, Cinch U.S. had a deferred tax asset in the amount of $0.1 million relating to vacation accruals. Cinch Mexico was acquired with a refundable income tax in the amount of $0.1 million, which was applied to current year income tax for 2010. The Company has received a fair market value report of property, plant and equipment, and intangibles related to Cinch Europe and Cinch Mexico which resulted in the establishment of deferred tax liabilities at the date of acquisition in the amounts of $0.4 million and an immaterial amount, respectively. At December 31, 2011, a deferred tax liability of $0.3 million remains on the consolidated balance sheet. None of the reversals of the deferred tax asset or deferred tax liabilities or use of NOL carryforwards acquired from the Cinch acquisition will impact the consolidated statement of operations. The Company has made an election under IRC Section 338(h)(10) to step-up the tax basis of the Cinch U.S. assets and IRC Section 338(g) to step-up the tax basis of assets for the Cinch Mexico and Cinch U.K. entities acquired to fair value. The elections made under Section 338(h)(10) and Section 338(g) only affect U.S. income taxes (not those of the foreign countries where non-U.S. Cinch entities are incorporated).

F-19
Management’s intention is to permanently reinvest the majority of the earnings of foreign subsidiaries in the expansion of its foreign operations. Unrepatriated earnings, upon which U.S. income taxes have not been accrued, are approximately $93.4 million at December 31, 2011. Such unrepatriated earnings are deemed by management to be permanently reinvested. The estimated federal income tax liability (net of estimated foreign tax credits) related to unrepatriated foreign earnings is $21.2 million under the current tax law. The Company repatriated $0.5 million during 2011. On August 10, 2010, President Obama signed into law the “Education Jobs & Medicaid Assistance Act” (H.R. 1586) (the “Act”). The Act’s international tax provisions place certain restrictions on the use of foreign tax credits. The Company has evaluated the newly-enacted international tax provisions and determined that they do not materially affect the Company’s operating results or financial condition. The Company continues to monitor proposed legislation affecting the taxation of transfers of U.S. intangible property and other potential tax law changes. Components of deferred income tax assets are as follows (dollars in thousands).
2011 2010Tax Effect Tax Effect
Deferred Tax Assets - current: State tax credits 766$ 519$ Reserves and accruals 1,195 923 Valuation allowance (666) (419)
1,295$ 1,023$
Deferred Tax Assets - noncurrent: Unfunded pension liability 941$ 635$ Depreciation (369) 161 Amortization 243 526
Federal, state and foreign net operating loss
and credit carryforwards 566 1,060 Restructuring expenses - 193 Other accruals 1,999 1,670 Valuation allowances (566) (1,044)
2,814$ 3,201$
December 31,
The Company holds an offshore business license from the government of Macao. With this license, a Macao offshore company named Bel Fuse (Macao Commercial Offshore) Limited has been established to handle all of the Company’s sales to third-party customers in Asia. Sales by this company consist of products manufactured in the People’s Republic of China (“PRC”). This company is not subject to Macao corporate profit taxes which are imposed at a tax rate of 12%. 9. DEBT At December 31, 2011 and 2010, a $30 million line of credit, which expires on June 30, 2014, was available to the Company to borrow. During early 2011, an amendment to the prior credit agreement was finalized whereby the amount available to borrow was increased from $20 million to $30 million. Amounts outstanding under this line of credit are collateralized with a first priority security interest in 100% of the issued and outstanding shares of the capital stock of the Company's material domestic subsidiaries and 65% of all the issued and outstanding shares of the capital stock of certain of the foreign subsidiaries of the Company. There have not been any borrowings under the credit agreement during 2011 or 2010 and, as a result, there was no balance outstanding as of December 31, 2011 or 2010. At those dates, the entire $30 million line of credit was available to the Company to borrow. The credit agreement bears interest at LIBOR plus 0.75% to 1.25% based on certain financial statement ratios maintained by the Company. Under the terms of the credit agreement, the Company is required to maintain certain financial ratios and comply with other financial conditions. At December 31, 2011, the Company was in compliance with its debt covenants.
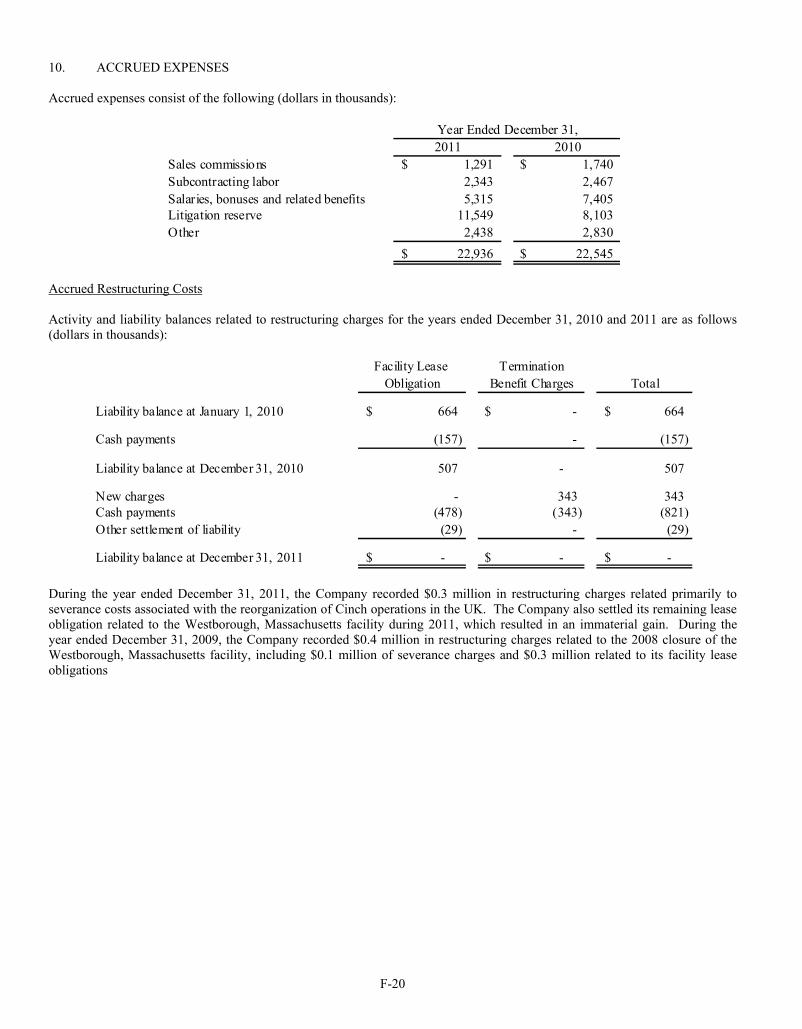
F-20
10. ACCRUED EXPENSES Accrued expenses consist of the following (dollars in thousands):
2011 2010Sales commissions 1,291$ 1,740$ Subcontracting labor 2,343 2,467 Salaries, bonuses and related benefits 5,315 7,405 Litigation reserve 11,549 8,103 Other 2,438 2,830
22,936$ 22,545$
Year Ended December 31,
Accrued Restructuring Costs
Activity and liability balances related to restructuring charges for the years ended December 31, 2010 and 2011 are as follows (dollars in thousands):
Facility Lease TerminationObligation Benefit Charges Total
Liability balance at January 1, 2010 664$ -$ 664$
Cash payments (157) - (157)
Liability balance at December 31, 2010 507 - 507
New charges - 343 343 Cash payments (478) (343) (821) Other settlement of liability (29) - (29)
Liability balance at December 31, 2011 -$ -$ -$
During the year ended December 31, 2011, the Company recorded $0.3 million in restructuring charges related primarily to severance costs associated with the reorganization of Cinch operations in the UK. The Company also settled its remaining lease obligation related to the Westborough, Massachusetts facility during 2011, which resulted in an immaterial gain. During the year ended December 31, 2009, the Company recorded $0.4 million in restructuring charges related to the 2008 closure of the Westborough, Massachusetts facility, including $0.1 million of severance charges and $0.3 million related to its facility lease obligations

F-21
11. BUSINESS SEGMENT INFORMATION The Company operates in one industry with three reportable operating segments, which are geographic in nature. The segments consist of North America, Asia and Europe. The primary criteria by which financial performance is evaluated and resources are allocated are revenues and operating income. The following is a summary of key financial data (dollars in thousands):
2011 2010 2009
Net Sales to External Customers: North America 134,804$ 111,888$ 41,898$ Asia 126,941 156,635 123,764 Europe 33,376 34,016 17,091
295,121$ 302,539$ 182,753$
Net Sales: North America 149,114$ 125,383$ 51,189$ Asia 177,815 196,243 144,572 Europe 34,597 35,150 18,110 Less intergeographic revenues (66,405) (54,237) (31,118)
295,121$ 302,539$ 182,753$
Income (Loss) from Operations: North America 9,026$ 4,181$ (205)$ Asia (3,480) 9,357 (16,462) Europe 1,850 1,622 (684)
7,396$ 15,160$ (17,351)$
Total Assets: North America 115,552$ 110,984$ Asia 148,950 155,414 Europe 12,409 10,774
276,911$ 277,172$
Capital Expenditures: North America 1,121$ 870$ 353$ Asia 1,733 1,371 1,979 Europe 74 186 25
2,928$ 2,427$ 2,357$
Depreciation and Amortization Expense: North America 4,046$ 3,862$ 1,535$ Asia 4,137 4,513 5,087 Europe 484 461 156
8,667$ 8,836$ 6,778$
Net sales from external customers are attributed to individual operating segments based on the geographic source of the billing for such customer sales. Transfers between geographic areas include finished products manufactured in foreign countries which are then transferred to the United States and Europe for sale; finished goods manufactured in the United States which are transferred to Europe and Asia for sale; and semi-finished components manufactured in the United States which are sold to Asia for further processing. Income (loss) from operations represents gross profit less operating expenses. The following items are included in the income (loss) from operations presented above: Litigation Charges – During the year ended December 31, 2011, the Company recorded $3.5 million of litigation charges related to the SynQor and Halo lawsuits. During the year ended December 31, 2010, the Company recorded $8.1 million of litigation charges related to the SynQor lawsuit. These charges impacted income from operations primarily within the Company’s Asia reportable
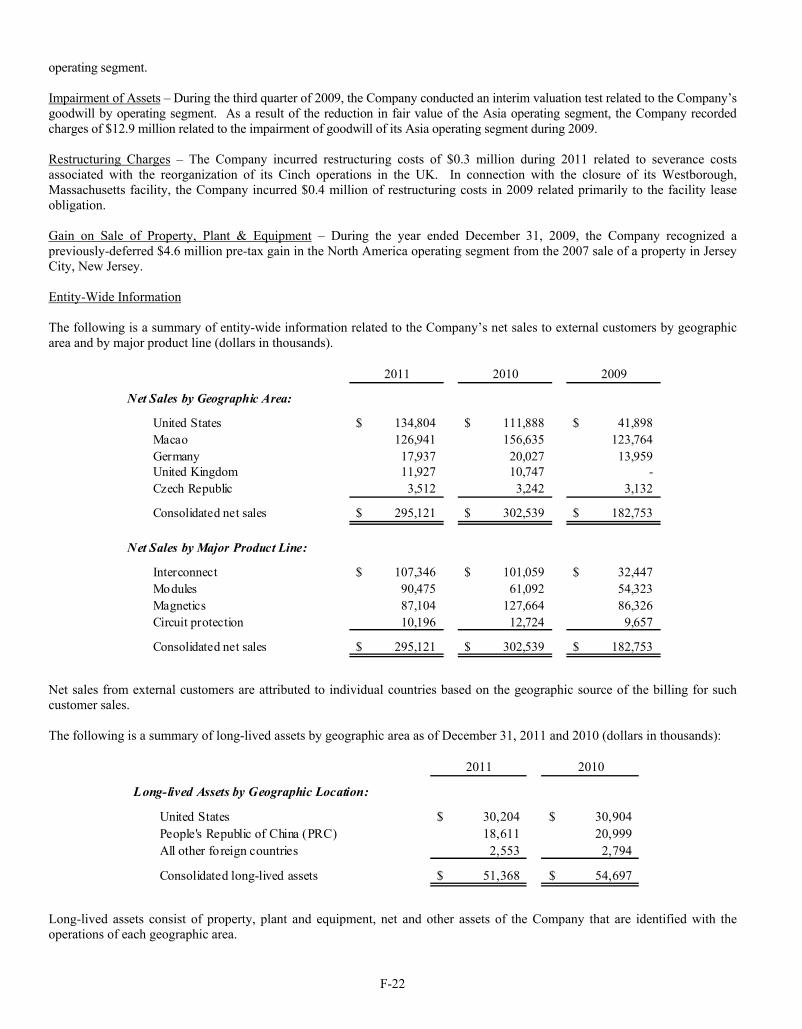
F-22
operating segment. Impairment of Assets – During the third quarter of 2009, the Company conducted an interim valuation test related to the Company’s goodwill by operating segment. As a result of the reduction in fair value of the Asia operating segment, the Company recorded charges of $12.9 million related to the impairment of goodwill of its Asia operating segment during 2009. Restructuring Charges – The Company incurred restructuring costs of $0.3 million during 2011 related to severance costs associated with the reorganization of its Cinch operations in the UK. In connection with the closure of its Westborough, Massachusetts facility, the Company incurred $0.4 million of restructuring costs in 2009 related primarily to the facility lease obligation. Gain on Sale of Property, Plant & Equipment – During the year ended December 31, 2009, the Company recognized a previously-deferred $4.6 million pre-tax gain in the North America operating segment from the 2007 sale of a property in Jersey City, New Jersey. Entity-Wide Information The following is a summary of entity-wide information related to the Company’s net sales to external customers by geographic area and by major product line (dollars in thousands).
2011 2010 2009
Net Sales by Geographic Area:
United States 134,804$ 111,888$ 41,898$ Macao 126,941 156,635 123,764 Germany 17,937 20,027 13,959 United Kingdom 11,927 10,747 - Czech Republic 3,512 3,242 3,132
Consolidated net sales 295,121$ 302,539$ 182,753$
Net Sales by Major Product Line:
Interconnect 107,346$ 101,059$ 32,447$ Modules 90,475 61,092 54,323 Magnetics 87,104 127,664 86,326 Circuit protection 10,196 12,724 9,657
Consolidated net sales 295,121$ 302,539$ 182,753$
Net sales from external customers are attributed to individual countries based on the geographic source of the billing for such customer sales. The following is a summary of long-lived assets by geographic area as of December 31, 2011 and 2010 (dollars in thousands):
2011 2010
Long-lived Assets by Geographic Location:
United States 30,204$ 30,904$ People's Republic of China (PRC) 18,611 20,999 All other foreign countries 2,553 2,794
Consolidated long-lived assets 51,368$ 54,697$
Long-lived assets consist of property, plant and equipment, net and other assets of the Company that are identified with the operations of each geographic area.

F-23
The territory of Hong Kong became a Special Administrative Region (“SAR”) of the PRC in the middle of 1997. The territory of Macao became a SAR of the PRC at the end of 1999. Management cannot presently predict what future impact this will have on the Company, if any, or how the political climate in the PRC will affect the Company's contractual arrangements in the PRC. A significant portion of the Company's manufacturing operations and approximately 41% of its identifiable assets are located in Asia. Net Sales to Major Customers In 2011, there were two customers with sales in excess of ten percent of consolidated net sales. The combined revenue from these two customers was $65.7 million during the year ended December 31, 2011, representing 22.3% of total sales. In 2010, the Company had sales to two customers in excess of ten percent of consolidated net sales. The combined revenue from these two customers was $74.6 million during the year ended December 31, 2010, representing 24.7% of total sales. The Company had sales to three customers in excess of ten percent of consolidated net sales in 2009. The combined revenue from these three customers was $71.9 million during the year ended December 31, 2009, representing 39.4% of total sales. Sales related to these significant customers were primarily reflected in the North America and Asia operating segments during 2011 and 2010, and in the Asia operating segment in 2009. 12. RETIREMENT FUND AND PROFIT SHARING PLAN The Company maintains a domestic profit sharing plan and a contributory stock ownership and savings 401(k) plan, which combines stock ownership and individual voluntary savings provisions to provide retirement benefits for plan participants. The plan provides for participants to voluntarily contribute a portion of their compensation, subject to certain legal maximums. The Company will match, based on a sliding scale, up to $350 for the first $600 contributed by each participant. Matching contributions plus additional discretionary contributions are made with Company stock purchased in the open market. The expense for the years ended December 31, 2011, 2010 and 2009 amounted to approximately $0.9 million, $0.7 million and $0.4 million, respectively. As of December 31, 2011, the plans owned 15,920 and 243,547 shares of Bel Fuse Inc. Class A and Class B common stock, respectively. The Company amended its 401(k) plan effective January 1, 2012. Under the new plan design, the Company will match 100% of the first 1% of employee deferrals and 50% of the next 5% of employee deferrals. Matching contributions will be made in cash beginning in 2012. The Company's subsidiaries in Asia have a retirement fund covering substantially all of their Hong Kong based full-time employees. Eligible employees contribute up to 5% of salary to the fund. In addition, the Company must contribute a minimum of 5% of eligible salary, as determined by Hong Kong government regulations. The Company currently contributes 7% of eligible salary in cash or Company stock. The expense for the years ended December 31, 2011, 2010 and 2009 amounted to approximately $0.3 million in each year. As of December 31, 2011, the plan owned 3,323 and 17,342 shares of Bel Fuse Inc. Class A and Class B common stock, respectively. The Supplemental Executive Retirement Plan (the "SERP" or the “Plan”) is designed to provide a limited group of key management and highly compensated employees of the Company with supplemental retirement and death benefits. Participants in the SERP are selected by the Compensation Committee of the Board of Directors. The SERP initially became effective in 2002 and was amended and restated in April 2007 to conform with applicable requirements of Section 409A of the Internal Revenue Code and to modify the provisions regarding benefits payable in connection with a change in control of the Company. The Plan is unfunded. Benefits under the SERP are payable from the general assets of the Company, but the Company has established a rabbi trust which includes certain life insurance policies in effect on participants as well as other investments to partially cover the Company’s obligations under the Plan. The benefits available under the Plan vary according to when and how the participant terminates employment with the Company. If a participant retires (with the prior written consent of the Company) on his normal retirement date (65 years old, 20 years of service, and 5 years of Plan participation), his normal retirement benefit under the Plan would be annual payments equal to 40% of his average base compensation (calculated using compensation from the highest 5 consecutive calendar years of Plan participation), payable in monthly installments for the remainder of his life. If a participant retires early from the Company (55 years old, 20 years of service, and 5 years of Plan participation), his early retirement benefit under the Plan would be an amount (i) calculated as if his early retirement date were in fact his normal retirement date, (ii) multiplied by a fraction, with the numerator being the actual years of service the participant has with the Company and the denominator being the years of service the participant would have had if he had retired at age 65, and (iii) actuarially reduced to reflect the early retirement date. If a participant dies prior to receiving 120 monthly payments under the Plan, his beneficiary would be entitled to continue receiving benefits for the shorter of (i) the time necessary to complete 120 monthly payments or (ii) 60 months. If a participant dies while employed by the Company, his beneficiary would receive, as a survivor benefit, an annual amount equal to (i) 100% of the participant’s annual base salary at date of death for one year, and (ii) 50% of the participant’s annual base salary at date of

F-24
death for each of the following 4 years, each payable in monthly installments. The Plan also provides for disability benefits, and a forfeiture of benefits if a participant terminates employment for reasons other than those contemplated under the Plan. The expense related to the Plan for the years ended December 31, 2011, 2010 and 2009 amounted to approximately $0.9 million, $0.8 million and $0.9 million, respectively. Net Periodic Benefit Cost The net periodic benefit cost related to the SERP consisted of the following components during the years ended December 31, 2011, 2010 and 2009 (dollars in thousands):
2011 2010 2009
Service Cost 371$ 340$ 383$ Interest Cost 404 336 352 Net amortization 149 133 147 Net periodic benefit cost 924$ 809$ 882$
Obligations and Funded Status Summarized information about the changes in plan assets and benefit obligation, the funded status and the amounts recorded at December 31, 2011 and 2010 are as follows (dollars in thousands):
2011 2010
Fair value of plan assets, January 1 -$ -$ Company contributions - 56 Benefits paid - (56) Fair value of plan assets, December 31 -$ -$
Benefit obligation, January 1 7,350 5,622 Service cost 371 340 Interest cost 404 336 Benefits paid - (56) Actuarial losses 1,149 1,108
Benefit obligation, December 31 9,274$ 7,350$ Funded status, December 31 (9,274)$ (7,350)$
The Company has recorded the related liability of $9.3 million and $7.4 million as a long-term liability in its consolidated balance sheets at December 31, 2011 and 2010, respectively. The accumulated benefit obligation for the SERP was $7.5 million and $5.8 million as of December 31, 2011 and 2010, respectively. The aforementioned company-owned life insurance policies and marketable securities held in a rabbi trust had a combined fair value of $10.5 million and $8.4 million at December 31, 2011 and 2010, respectively. See Note 5 for additional information on these investments. The estimated net loss and prior service cost for the defined benefit pension plan that will be amortized from accumulated other comprehensive income into net periodic benefit cost over the next fiscal year is $0.1 million and $0.1 million, respectively. The Company does not expect to make any contributions to the SERP in 2012. The Company had no net transition assets or obligations recognized as an adjustment to other comprehensive income and does not anticipate any plan assets being returned to the Company during 2012, as the plan has no assets.
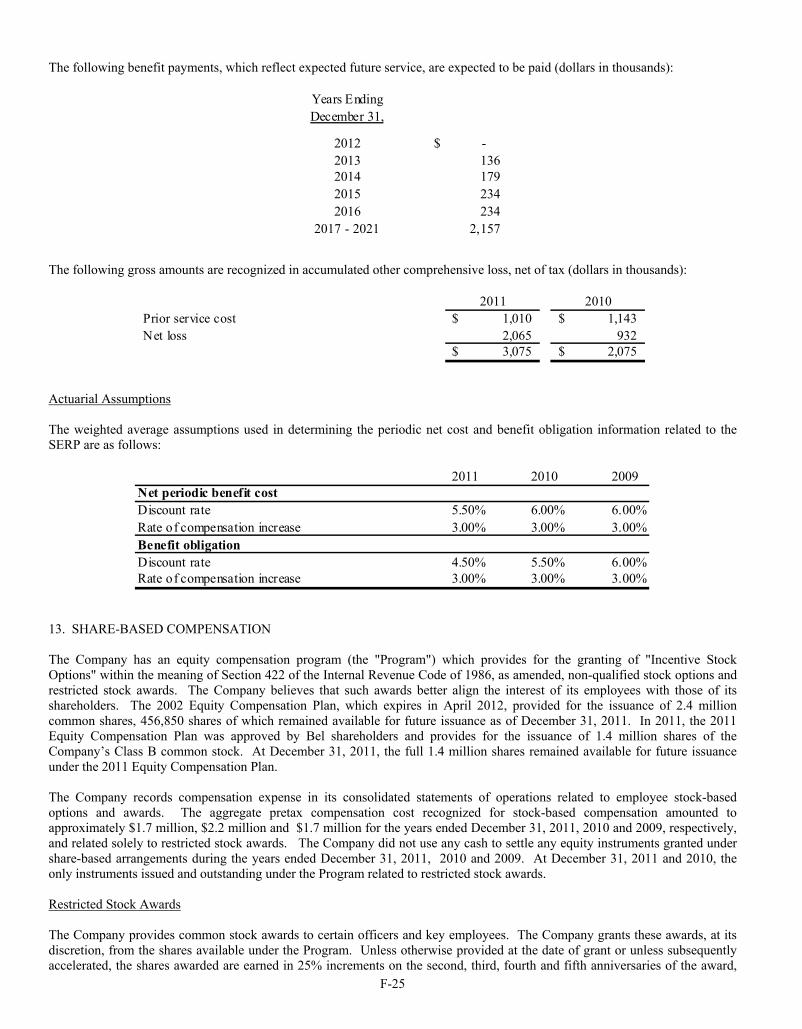
F-25
The following benefit payments, which reflect expected future service, are expected to be paid (dollars in thousands):
Years EndingDecember 31,
2012 -$ 2013 136 2014 179 2015 234 2016 234
2017 - 2021 2,157
The following gross amounts are recognized in accumulated other comprehensive loss, net of tax (dollars in thousands):
2011 2010Prior service cost 1,010$ 1,143$ Net loss 2,065 932
3,075$ 2,075$
Actuarial Assumptions The weighted average assumptions used in determining the periodic net cost and benefit obligation information related to the SERP are as follows:
2011 2010 2009Net periodic benefit costDiscount rate 5.50% 6.00% 6.00%Rate of compensation increase 3.00% 3.00% 3.00%Benefit obligationDiscount rate 4.50% 5.50% 6.00%Rate of compensation increase 3.00% 3.00% 3.00%
13. SHARE-BASED COMPENSATION The Company has an equity compensation program (the "Program") which provides for the granting of "Incentive Stock Options" within the meaning of Section 422 of the Internal Revenue Code of 1986, as amended, non-qualified stock options and restricted stock awards. The Company believes that such awards better align the interest of its employees with those of its shareholders. The 2002 Equity Compensation Plan, which expires in April 2012, provided for the issuance of 2.4 million common shares, 456,850 shares of which remained available for future issuance as of December 31, 2011. In 2011, the 2011 Equity Compensation Plan was approved by Bel shareholders and provides for the issuance of 1.4 million shares of the Company’s Class B common stock. At December 31, 2011, the full 1.4 million shares remained available for future issuance under the 2011 Equity Compensation Plan. The Company records compensation expense in its consolidated statements of operations related to employee stock-based options and awards. The aggregate pretax compensation cost recognized for stock-based compensation amounted to approximately $1.7 million, $2.2 million and $1.7 million for the years ended December 31, 2011, 2010 and 2009, respectively, and related solely to restricted stock awards. The Company did not use any cash to settle any equity instruments granted under share-based arrangements during the years ended December 31, 2011, 2010 and 2009. At December 31, 2011 and 2010, the only instruments issued and outstanding under the Program related to restricted stock awards. Restricted Stock Awards The Company provides common stock awards to certain officers and key employees. The Company grants these awards, at its discretion, from the shares available under the Program. Unless otherwise provided at the date of grant or unless subsequently accelerated, the shares awarded are earned in 25% increments on the second, third, fourth and fifth anniversaries of the award,
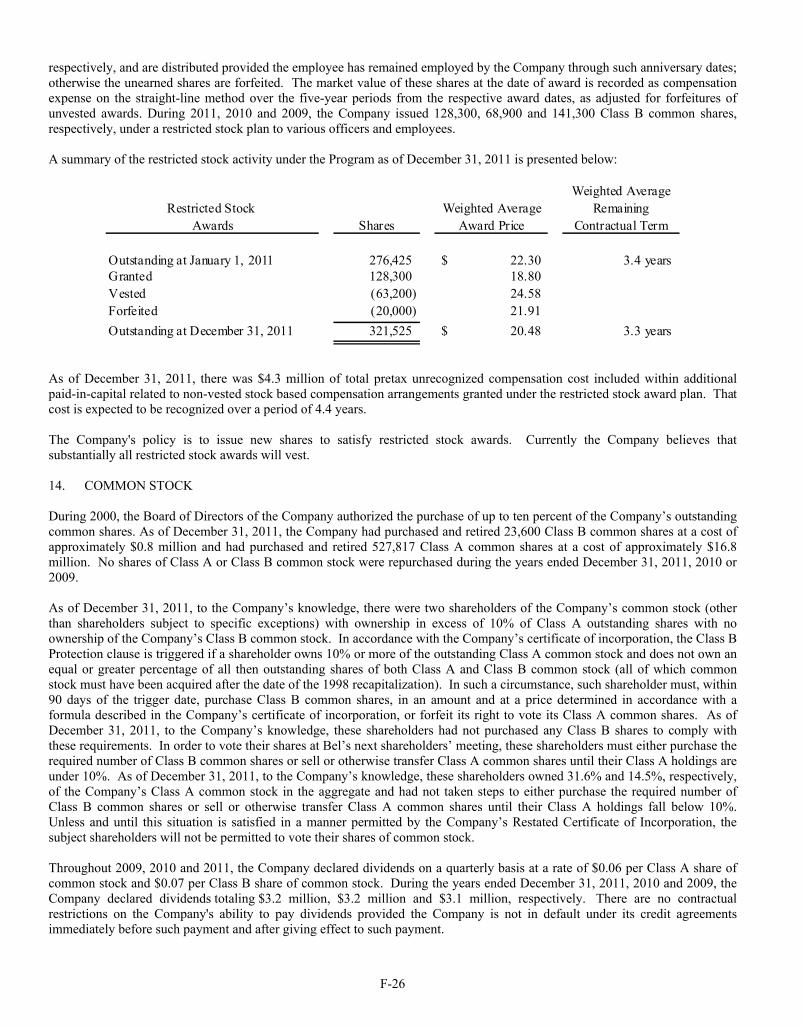
F-26
respectively, and are distributed provided the employee has remained employed by the Company through such anniversary dates; otherwise the unearned shares are forfeited. The market value of these shares at the date of award is recorded as compensation expense on the straight-line method over the five-year periods from the respective award dates, as adjusted for forfeitures of unvested awards. During 2011, 2010 and 2009, the Company issued 128,300, 68,900 and 141,300 Class B common shares, respectively, under a restricted stock plan to various officers and employees. A summary of the restricted stock activity under the Program as of December 31, 2011 is presented below:
Weighted AverageRestricted Stock Weighted Average Remaining
Awards Shares Award Price Contractual Term
Outstanding at January 1, 2011 276,425 22.30$ 3.4 yearsGranted 128,300 18.80 Vested (63,200) 24.58 Forfeited (20,000) 21.91
Outstanding at December 31, 2011 321,525 20.48$ 3.3 years
As of December 31, 2011, there was $4.3 million of total pretax unrecognized compensation cost included within additional paid-in-capital related to non-vested stock based compensation arrangements granted under the restricted stock award plan. That cost is expected to be recognized over a period of 4.4 years. The Company's policy is to issue new shares to satisfy restricted stock awards. Currently the Company believes that substantially all restricted stock awards will vest. 14. COMMON STOCK During 2000, the Board of Directors of the Company authorized the purchase of up to ten percent of the Company’s outstanding common shares. As of December 31, 2011, the Company had purchased and retired 23,600 Class B common shares at a cost of approximately $0.8 million and had purchased and retired 527,817 Class A common shares at a cost of approximately $16.8 million. No shares of Class A or Class B common stock were repurchased during the years ended December 31, 2011, 2010 or 2009. As of December 31, 2011, to the Company’s knowledge, there were two shareholders of the Company’s common stock (other than shareholders subject to specific exceptions) with ownership in excess of 10% of Class A outstanding shares with no ownership of the Company’s Class B common stock. In accordance with the Company’s certificate of incorporation, the Class B Protection clause is triggered if a shareholder owns 10% or more of the outstanding Class A common stock and does not own an equal or greater percentage of all then outstanding shares of both Class A and Class B common stock (all of which common stock must have been acquired after the date of the 1998 recapitalization). In such a circumstance, such shareholder must, within 90 days of the trigger date, purchase Class B common shares, in an amount and at a price determined in accordance with a formula described in the Company’s certificate of incorporation, or forfeit its right to vote its Class A common shares. As of December 31, 2011, to the Company’s knowledge, these shareholders had not purchased any Class B shares to comply with these requirements. In order to vote their shares at Bel’s next shareholders’ meeting, these shareholders must either purchase the required number of Class B common shares or sell or otherwise transfer Class A common shares until their Class A holdings are under 10%. As of December 31, 2011, to the Company’s knowledge, these shareholders owned 31.6% and 14.5%, respectively, of the Company’s Class A common stock in the aggregate and had not taken steps to either purchase the required number of Class B common shares or sell or otherwise transfer Class A common shares until their Class A holdings fall below 10%. Unless and until this situation is satisfied in a manner permitted by the Company’s Restated Certificate of Incorporation, the subject shareholders will not be permitted to vote their shares of common stock. Throughout 2009, 2010 and 2011, the Company declared dividends on a quarterly basis at a rate of $0.06 per Class A share of common stock and $0.07 per Class B share of common stock. During the years ended December 31, 2011, 2010 and 2009, the Company declared dividends totaling $3.2 million, $3.2 million and $3.1 million, respectively. There are no contractual restrictions on the Company's ability to pay dividends provided the Company is not in default under its credit agreements immediately before such payment and after giving effect to such payment.
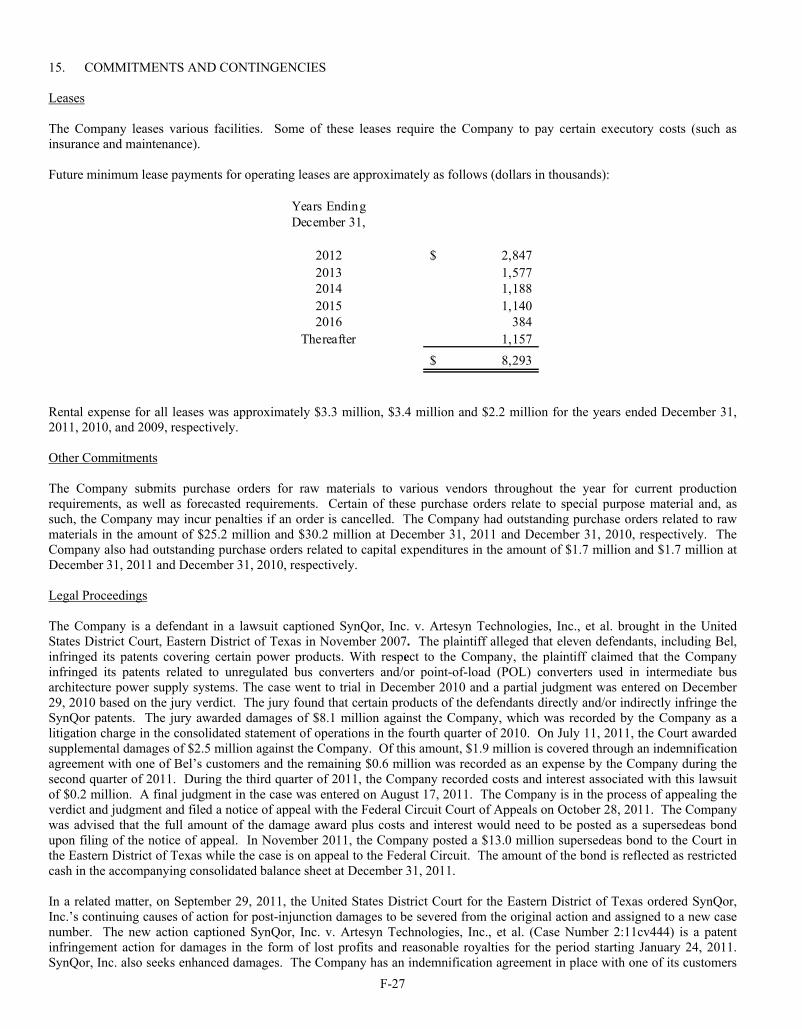
F-27
15. COMMITMENTS AND CONTINGENCIES
Leases The Company leases various facilities. Some of these leases require the Company to pay certain executory costs (such as insurance and maintenance). Future minimum lease payments for operating leases are approximately as follows (dollars in thousands):
Years EndingDecember 31,
2012 2,847$ 2013 1,577 2014 1,188 2015 1,140 2016 384
Thereafter 1,157
8,293$
Rental expense for all leases was approximately $3.3 million, $3.4 million and $2.2 million for the years ended December 31, 2011, 2010, and 2009, respectively. Other Commitments The Company submits purchase orders for raw materials to various vendors throughout the year for current production requirements, as well as forecasted requirements. Certain of these purchase orders relate to special purpose material and, as such, the Company may incur penalties if an order is cancelled. The Company had outstanding purchase orders related to raw materials in the amount of $25.2 million and $30.2 million at December 31, 2011 and December 31, 2010, respectively. The Company also had outstanding purchase orders related to capital expenditures in the amount of $1.7 million and $1.7 million at December 31, 2011 and December 31, 2010, respectively.
Legal Proceedings The Company is a defendant in a lawsuit captioned SynQor, Inc. v. Artesyn Technologies, Inc., et al. brought in the United States District Court, Eastern District of Texas in November 2007. The plaintiff alleged that eleven defendants, including Bel, infringed its patents covering certain power products. With respect to the Company, the plaintiff claimed that the Company infringed its patents related to unregulated bus converters and/or point-of-load (POL) converters used in intermediate bus architecture power supply systems. The case went to trial in December 2010 and a partial judgment was entered on December 29, 2010 based on the jury verdict. The jury found that certain products of the defendants directly and/or indirectly infringe the SynQor patents. The jury awarded damages of $8.1 million against the Company, which was recorded by the Company as a litigation charge in the consolidated statement of operations in the fourth quarter of 2010. On July 11, 2011, the Court awarded supplemental damages of $2.5 million against the Company. Of this amount, $1.9 million is covered through an indemnification agreement with one of Bel’s customers and the remaining $0.6 million was recorded as an expense by the Company during the second quarter of 2011. During the third quarter of 2011, the Company recorded costs and interest associated with this lawsuit of $0.2 million. A final judgment in the case was entered on August 17, 2011. The Company is in the process of appealing the verdict and judgment and filed a notice of appeal with the Federal Circuit Court of Appeals on October 28, 2011. The Company was advised that the full amount of the damage award plus costs and interest would need to be posted as a supersedeas bond upon filing of the notice of appeal. In November 2011, the Company posted a $13.0 million supersedeas bond to the Court in the Eastern District of Texas while the case is on appeal to the Federal Circuit. The amount of the bond is reflected as restricted cash in the accompanying consolidated balance sheet at December 31, 2011. In a related matter, on September 29, 2011, the United States District Court for the Eastern District of Texas ordered SynQor, Inc.’s continuing causes of action for post-injunction damages to be severed from the original action and assigned to a new case number. The new action captioned SynQor, Inc. v. Artesyn Technologies, Inc., et al. (Case Number 2:11cv444) is a patent infringement action for damages in the form of lost profits and reasonable royalties for the period starting January 24, 2011. SynQor, Inc. also seeks enhanced damages. The Company has an indemnification agreement in place with one of its customers

F-28
specifically covering post-injunction damages related to this case. As a result, the Company does not anticipate that its consolidated statement of operations will be materially impacted by any potential post-injunction damages. The Company was a defendant in a lawsuit captioned Halo Electronics, Inc. (“Halo”) v. Bel Fuse Inc., Pulse Engineering, Inc. and Technitrol, Inc. brought in Nevada Federal District Court. The plaintiff claimed that the Company had infringed its patents covering certain surface mount discrete magnetic products made by the Company. Halo sought unspecified damages, which it claimed should be trebled. In December 2007, this case was dismissed by the Nevada Federal District Court for lack of personal jurisdiction. Halo then re-filed this suit, with similar claims against the Company, in the Northern California Federal District Court, captioned Halo Electronics, Inc. v. Bel Fuse Inc., Elec & Eltek (USA) Corporation, Wurth Electronics Midcom, Inc., and Xfmrs, Inc. In June 2011, a memorandum of understanding was signed by the Company and Halo with regard to this lawsuit, whereby the Company has agreed to pay Halo a royalty on past sales. The Company recorded a $2.6 million liability related to past sales during the second quarter of 2011. This is included as a litigation charge in the accompanying consolidated statement of operations for the year ended December 31, 2011. Bel also agreed to take a license with respect to the Halo patents at issue in the lawsuit and pay an 8% royalty on all net worldwide sales of the above-mentioned products from June 7, 2011 through August 10, 2015. The Company was a plaintiff in a lawsuit captioned Bel Fuse Inc. v. Halo Electronics, Inc. brought in the United States District Court of New Jersey during June 2007. The Company claimed that Halo infringed a patent covering certain integrated connector modules made by Halo. The Company was seeking an unspecified amount of damages plus interest, costs and attorney fees. In August 2011, a settlement agreement was signed by the Company and Halo with regard to this lawsuit, whereby Halo agreed to pay the Company a 10% royalty related to its net worldwide sales of its integrated connector modules in exchange for a fully paid-up license of the Bel patent. This royalty income has been included in net sales in the accompanying consolidated statement of operations for the year ended December 31, 2011. The Company is not a party to any other legal proceeding, the adverse outcome of which is likely to have a material adverse effect on the Company's consolidated financial condition or results of operations. 16. ACCUMULATED OTHER COMPREHENSIVE LOSS The components of accumulated other comprehensive loss as of December 31, 2011 and 2010 are summarized below (dollars in thousands)
2011 2010
Foreign currency translation adjustment 646$ 882$ Unrealized holding (loss) gain on available-for-sale securities, net of taxes of ($33) and $322 as of December 31, 2011 and 2010 (62) 519 Unfunded SERP liability, net of taxes of $(941) and $(635) as of December 31, 2011 and 2010 (2,134) (1,440)
Accumulated other comprehensive loss (1,550)$ (39)$
17. RELATED PARTY TRANSACTIONS As of December 31, 2011, the Company has $2.0 million invested in a money market fund with GAMCO Investors, Inc. (“GAMCO”). GAMCO is a current shareholder of the Company, with holdings of its Class A stock of approximately 31.6%. However, as discussed in Note 14, GAMCO’s voting rights are currently suspended. 18. UNAUTHORIZED TRANSACTIONS In April 2009, as part of the March 31, 2009 quarter-end review, the Company's internal accounting personnel identified a questionable entry in the Company's stock option exercise records. After questioning by management, a Company employee (the "Employee") responsible for certain aspects of the Company's benefit plan administration admitted fabricating certain Company records for his own benefit in order to enable him to exercise stock options that had not been granted to him by the Company's Compensation Committee. The investigation related to this matter was completed during 2009.

F-29
During the year ended December 31, 2009, the Company recorded an unauthorized issuance of common stock charge of $0.9 million related to this theft. This charge was offset by $0.5 million related to the fair market value of shares returned by the Employee during 2009. The Company incurred $0.2 million in legal and professional fees related to this activity which were included within selling, general and administrative expenses in the accompanying consolidated statement of operations for the year ended December 31, 2009. During the year ended December 31, 2010, the Company received insurance proceeds related to this theft in the amount of $0.1 million. This amount was recorded as a reduction to the corresponding expense items within selling, general and administrative expenses in the accompanying consolidated statement of operations for the year ended December 31, 2010. 19. SUBSEQUENT EVENT On March 9, 2012, the Company completed its acquisition of 100% of the issued and outstanding capital stock of GigaCom Interconnect AB (“GigaCom Interconnect”) with a cash payment of £1.7 million (approximately $2.7 million). GigaCom Interconnect, located in Gothenburg, Sweden, is a supplier of expanded beam fiber optic technology and a participant in the development of next-generation commercial aircraft components. GigaCom Interconnect will become part of Bel’s Cinch Connector business. Management believes that GigaCom’s offering of expanded beam fiber optic products, which are replacing traditional copper-based components due to their superior performance, reliability and lighter weight, will enhance Cinch’s position within the growing aerospace and military markets. All other disclosure requirements related to this acquisition are impracticable as of the filing date of this Form 10-K, given its proximity to the closing date. 20. SELECTED QUARTERLY FINANCIAL DATA (UNAUDITED)
Quarterly results (unaudited) for the years ended December 31, 2011 and 2010 are summarized as follows (in thousands, except per share data):
Total YearEnded
March 31, June 30, September 30, December 31, December 31,2011 2011 (b) 2011 2011 2011 (a)
Net sales 71,403$ 79,173$ 75,903$ 68,642$ 295,121$
Cost of sales 57,132 65,368 63,865 58,384 244,749
Net earnings (loss) 3,244 (574) 1,012 82 3,764
Earnings (loss) per share:Class A common share - basic and diluted 0.26$ (0.05)$ 0.08$ 0.00$ 0.28$ Class B common share - basic and diluted 0.28$ (0.05)$ 0.09$ 0.01$ 0.33$
Total YearEnded
March 31, June 30, September 30, December 31, December 31,2010 (c) 2010 (c) 2010 (c) 2010 (b) 2010 (a)
Net sales 56,069$ 77,732$ 85,041$ 83,697$ 302,539$
Cost of sales 47,157 61,570 64,797 65,661 239,185
Net earnings (loss) (120) 4,790 10,001 (1,022) 13,649
Earnings (loss) per share:Class A common share - basic and diluted (0.02)$ 0.39$ 0.82$ (0.09)$ 1.10$ Class B common share - basic and diluted (0.01)$ 0.42$ 0.86$ (0.09)$ 1.18$
Quarter Ended
Quarter Ended
(a) Quarterly amounts of earnings per share may not agree to the total for the year due to rounding. (b) The net loss for the quarter ended June 30, 2011 includes $2.8 million of net litigation charges related to the SynQor and
Halo lawsuits ($2.6 million after tax). The net loss for the quarter ended December 31, 2010 includes a litigation charge of $8.1 million related to the SynQor lawsuit ($8.0 million after tax).
(c) Amounts have been restated to reflect adjustments previously reported during the measurement period related to the Cinch
acquisition as if all such adjustments had been recognized on the date of acquisition.

Column A Column B Column D Column E
Balance at (1) (2) Balancebeginning Charged to costs Charged to other Deductions at end
Description of period and expenses accounts (b) (a) of period Year ended December 31, 2011:
Allowance for doubtful accounts 653$ 125$ 12$ (19)$ 771$
Allowance for excess and obsolete inventory 4,607$ 1,042$ (3)$ (870)$ 4,776$
Deferred tax assets - valuation allowances 1,463$ 146$ -$ (377)$ 1,232$
Year ended December 31, 2010:
Allowance for doubtful accounts 596$ 35$ 29$ (7)$ 653$
Allowance for excess and obsolete inventory 2,767$ 2,560$ (14)$ (706)$ 4,607$
Deferred tax assets - valuation allowances 878$ 614$ -$ (29)$ 1,463$
Year ended December 31, 2009:
Allowance for doubtful accounts 660$ 36$ 6$ (106)$ 596$
Allowance for excess and obsolete inventory 4,051$ (849)$ (26)$ (409)$ 2,767$
Deferred tax assets - valuation allowances 971$ 231$ -$ (324)$ 878$
(a) Write offs
(b) Includes foreign currency translation adjustments
BEL FUSE INC. AND SUBSIDIARIESSCHEDULE II - VALUATION AND QUALIFYING ACCOUNTS
(Amounts in thousands)
Column C
Additions
S-1

-29-
Item 9. Changes in and Disagreements with Accountants on Accounting and Financial Disclosures. Not applicable
Item 9A. Controls and Procedures Evaluation of Disclosure Controls and Procedures During the fourth quarter of 2011, the Company’s management, including the principal executive officer and principal financial officer, evaluated the Company’s disclosure controls and procedures (as defined in Rules 13a-15(e) and 15d-15(e) under the Securities Exchange Act of 1934) related to the recording, processing, summarization, and reporting of information in the Company’s periodic reports that the Company files with the SEC. These disclosure controls and procedures have been designed to ensure that material information relating to the Company, including its subsidiaries, is made known to the Company’s management, including these officers, by other of the Company’s employees, and that this information is recorded, processed, summarized, evaluated, and reported, as applicable, within the time periods specified in the SEC’s rules and forms. The Company’s controls and procedures can only provide reasonable, not absolute, assurance that the above objectives have been met. Notwithstanding these limitations, the Company believes that its disclosure controls and procedures are designed to provide reasonable assurances of achieving their objectives.
Based on their evaluation as of December 31, 2011, the Company’s principal executive officer and principal financial officer have concluded that the Company’s disclosure controls and procedures (as defined in Rules 13a-15(e) and 15d-15(e) under the Securities Exchange Act of 1934) are effective to ensure that the information required to be disclosed by the Company in the reports that the Company files or submits under the Securities Exchange Act of 1934 is recorded, processed, summarized and reported within the time periods specified in SEC rules and forms.
Management’s Report on Internal Control Over Financial Reporting
The Company’s management is responsible for establishing and maintaining adequate internal control over financial reporting, as such term is defined in Exchange Act Rules 13a-15(f). Under the supervision and with the participation of the Company’s management, including the Company’s principal executive officer and principal financial officer, the Company conducted an evaluation of the effectiveness of the Company’s internal control over financial reporting based on the framework in Internal Control – Integrated Framework issued by the Committee of Sponsoring Organizations of the Treadway Commission. Based on the Company’s evaluation under the framework in Internal Control – Integrated Framework, the Company’s management concluded that the Company’s internal control over financial reporting was effective as of December 31, 2011.
The Company’s independent registered public accounting firm, Deloitte & Touche LLP, has audited the effectiveness of the Company’s internal control over financial reporting as of December 31, 2011 and has expressed an unqualified opinion in their report which is included in Item 8 herein.
Changes in Internal Controls Over Financial Reporting
There were no significant changes in the Company’s internal control over financial reporting that occurred during the last fiscal quarter of the year to which this Annual Report on Form 10-K relates that have materially affected, or are reasonably likely to materially affect, the Company’s internal control over financial reporting. Item 9B. Other Information Not applicable.

-30-
Item 10. Directors, Executive Officers and Corporate Governance The Registrant incorporates by reference herein information to be set forth in its definitive proxy statement for its 2012 annual meeting of shareholders that is responsive to the information required with respect to this item. The Registrant has adopted a code of ethics for its directors, executive officers and all other senior financial personnel. The code of ethics, as amended from time to time, is available on the Registrant’s website under Corporate Governance. The Registrant will also make copies of its code of ethics available to investors upon request. Any such request should be sent by mail to Bel Fuse Inc., 206 Van Vorst Street, Jersey City, NJ 07302 Attn: Colin Dunn or should be made by telephone by calling Colin Dunn at 201-432-0463. Item 11. Executive Compensation The Registrant incorporates by reference herein information to be set forth in its definitive proxy statement for its 2012 annual meeting of shareholders that is responsive to the information required with respect to this Item. Item 12. Security Ownership of Certain Beneficial Owners and Management and Related Stockholder Matters The Registrant incorporates by reference herein information to be set forth in its definitive proxy statement for its 2012 annual meeting of shareholders that is responsive to the remaining information required with respect to this Item. The table below depicts the securities authorized for issuance under the Company’s equity compensation plans.
Equity Compensation Plan Information
Plan CategoryEquity compensation plans approved by security holders 2002 Equity Compensation Plan (expires April 4, 2012) - -$ 456,850 2011 Equity Compensation Plan - - 1,400,000
- - 1,856,850
Equity compensation plans not approved by security holders - - -
Totals - -$ 1,856,850
Number of Securities to be Issued Upon
Exercise of Outstanding Options, Warrants and Rights
(a)
Weighted Average Exercise Price of
Outstanding Options, Warrants
and Rights(b)
Number of Securities Remaining Available for Future Issuance Under Equity Compensation
Plans (Excluding Securities Reflected in
Column (a))(c)
Item 13. Certain Relationships and Related Transactions, and Director Independence The Registrant incorporates by reference herein information to be set forth in its definitive proxy statement for its 2012 annual meeting of shareholders that is responsive to the information required with respect to this Item. Item 14. Principal Accountant Fees and Services The Registrant incorporates by reference herein information to be set forth in its definitive proxy statement for its 2012 annual meeting of shareholders that is responsive to the information required with respect to this Item.

-31-
PART IV Item 15. Exhibits, Financial Statement Schedules Page (a) Financial Statements 1. Financial Statements filed as part of this Annual Report on Form 10-K: Report of Independent Registered Public Accounting Firm F-1 Consolidated Balance Sheets as of December 31, 2011 and 2010 F-2 Consolidated Statements of Operations for Each of the Three Years in the Period Ended December 31, 2011 F-3 Consolidated Statements of Stockholders' Equity for Each of the Three Years in the Period Ended December 31, 2011 F-4 Consolidated Statements of Cash Flows for Each of the Three Years in the Period Ended December 31, 2011 F-5 Notes to Consolidated Financial Statements F-7 2. Financial statement schedules filed as part of this report: Schedule II: Valuation and Qualifying Accounts S-1 All other schedules are omitted because they are inapplicable, not required or the information is included in the consolidated financial statements or notes thereto. (b) Exhibits Exhibit No.:
3.1 Certificate of Incorporation, as amended, is incorporated by reference to Exhibit 3.1 of the Company’s Annual Report on Form 10-K for the year ended December 31, 1999.
3.2 By-laws, as amended, are incorporated by reference to Exhibit 4.2 of the Company's
Registration Statement on Form S-2 (Registration No. 33-16703) filed with the Securities and Exchange Commission on August 25, 1987.
10.1† 2002 Equity Compensation Program. Incorporated by reference to the Registrant’s proxy
statement for its 2002 annual meeting of shareholders.
10.2 Credit and Guaranty Agreement, dated as of February 12, 2007, by and among Bel Fuse Inc., as Borrower, the Subsidiary Guarantors party thereto and the Bank of America, N.A., as Lender. Filed as Exhibit 10.1 to the Company’s Current Report on Form 8-K filed on February 16, 2007 and incorporated herein by reference.
10.3† Amended and Restated Bel Fuse Supplemental Executive Retirement Plan, dated as of April
17, 2007. Filed as Exhibit 10.1 to the Company’s Current Report on Form 8-K filed on April 23, 2007 and incorporated herein by reference.
10.4 Contract for Purchase and Sale of Real Estate dated July 15, 2004 between Bel Fuse Inc. and Fields Development Group Co. Incorporated by reference to Exhibit 10.9 of the Company’s Form 10-K for the year ended December 31, 2004.
10.5 First Amendment to Credit and Guaranty Agreement dated as of April 30, 2008, by and
among Bel Fuse Inc., as Borrower, the Subsidiary Guarantors party thereto and the Bank of

-32-
America, N.A., as Lender. Filed as Exhibit 10.6 to the Company’s Annual Report on Form 10-K for the year ended December 31, 2009 and incorporated herein by reference.
10.6 Second Amendment to Credit and Guaranty Agreement dated as of June 30, 2009, by and
among Bel Fuse Inc., as Borrower, the Subsidiary Guarantors party thereto and the Bank of America, N.A., as Lender. Filed as Exhibit 10.7 to the Company’s Annual Report on Form 10-K for the year ended December 31, 2009 and incorporated herein by reference.
10.7 Stock purchase agreement by and among Safran USA, Inc., Safran UK Limited and Bel Fuse
Inc., dated as of December 28, 2009. Filed as Exhibit 10.8 to the Company’s Annual Report on Form 10-K for the year ended December 31, 2009 and incorporated herein by reference.
10.8 Third Amendment to Credit and Guaranty Agreement dated as of January 29, 2010, by and
among Bel Fuse Inc., as Borrower, the Subsidiary Guarantors party thereto and the Bank of America, N.A., as Lender. Filed as Exhibit 10.9 to the Company’s Annual Report on Form 10-K for the year ended December 31, 2009 and incorporated herein by reference.
10.9* Fourth Amendment to Credit and Guaranty Agreement dated as of September 27, 2010, by
and among Bel Fuse Inc., as Borrower, the Subsidiary Guarantors party thereto and the Bank of America, N.A., as Lender.
10.10* Fifth Amendment to Credit and Guaranty Agreement dated as of February 16, 2011, by and
among Bel Fuse Inc., as Borrower, the Subsidiary Guarantors party thereto and the Bank of America, N.A., as Lender.
10.11† 2011 Equity Compensation Program. Incorporated by reference to the Registrant’s proxy
statement for its 2011 annual meeting of shareholders.
11.1 A statement regarding the computation of earnings per share is omitted because such computation can be clearly determined from the material contained in this Annual Report on Form 10-K.
21.1* Subsidiaries of the Registrant.
23.1* Consent of Independent Registered Public Accounting Firm.
24.1* Power of attorney (included on the signature page)
31.1* Certification of the Chief Executive Officer pursuant to Section 302 of the Sarbanes-Oxley
Act of 2002
31.2* Certification of the Vice President of Finance pursuant to Section 302 of the Sarbanes-Oxley Act of 2002.
32.1** Certification of the Chief Executive Officer pursuant to Section 906 of the Sarbanes - Oxley
Act of 2002.
32.2** Certification of the Vice-President of Finance pursuant to Section 906 of the Sarbanes-Oxley Act of 2002.
101.INS*** XBRL Instance Document
101.SCH*** XBRL Taxonomy Extension Schema Document
101.CAL*** XBRL Taxonomy Extension Calculation Linkbase Document
101.DEF*** XBRL Taxonomy Extension Definition Linkbase Document
101.LAB*** XBRL Taxonomy Extension Label Linkbase Document

-33-
101.PRE*** XBRL Taxonomy Extension Presentation Linkbase Document
* Filed herewith. ** Submitted herewith. *** XBRL (Extensible Business Reporting Language) information is furnished and not filed herewith, is not a part of a registration statement or Prospectus for purposes of Sections 11 or 12 of the Securities Act of 1933, is deemed not filed for purposes of Section 18 of the Securities Exchange Act of 1934, and otherwise is not subject to liability under these sections. † Management contract or compensatory plan or arrangement.

-34-
SIGNATURES
Pursuant to the requirements of Section 13 or 15(d) of the Securities Exchange Act of 1934, the registrant has duly caused this report to be signed on its behalf by the undersigned, thereunto duly authorized. BEL FUSE INC.
By: /s/ Daniel Bernstein Daniel Bernstein President and Chief Executive Officer Dated: March 12, 2012 KNOW ALL MEN BY THESE PRESENTS, that each person whose signature appears below constitutes and appoints Daniel Bernstein and Colin Dunn as his/her attorney-in-fact and agent, with full power of substitution and resubstitution, for him/her and in his/her name, place, and stead, in any and all capacities, to sign and file any and all amendments to this Annual Report on Form 10-K, with all exhibits thereto and hereto, and other documents with the Securities and Exchange Commission, granting unto said attorney-in-fact and agent, and each of them, full power and authority to do and perform each and every act and thing requisite or necessary to be done in and about the premises, as fully to all intents and purposes as he/she might or could do in person, hereby ratifying and confirming all that said attorneys-in-fact and agents, or any of them, or their or his substitutes, may lawfully do or cause to be done by virtue hereof. Pursuant to the requirements of the Securities Exchange Act of 1934, this report has been signed below by the following persons on behalf of the registrant and in the capacities and on the dates indicated.
Signature Title Date /s/ Daniel Bernstein President, Chief Executive Officer March 12, 2012 Daniel Bernstein and Director /s/ Howard Bernstein Director March 12, 2012 Howard B. Bernstein /s/ Robert H. Simandl Director March 12, 2012 Robert H. Simandl /s/ Peter Gilbert Director March 12, 2012 Peter Gilbert /s/ John Tweedy Director March 12, 2012 John Tweedy /s/ John Johnson Director March 12, 2012 John Johnson /s/ Avi Eden Director March 12, 2012 Avi Eden /s/ Mark Segall Director March 12, 2012 Mark Segall /s/ Colin Dunn Vice President of Finance and Secretary March 12, 2012 Colin Dunn
Ex - 21.1Subsidiaries of the Registrant
Jurisdiction ofName Incorporation
Bel Components Ltd. Hong Kong
Bel Connector Inc. Delaware
Bel Fuse Delaware Inc. Delaware
Bel Fuse Europe Ltd. United Kingdom
Bel Fuse Limited Hong Kong
Bel Fuse (Macao Commerical Offshore) Limited Macao
Winsonko (Guangxi Pingguo) Electron Co., Ltd. PRC
Bel Power (Hangzhou) Co. Ltd. PRC
Bel Power Inc. Massachusetts
Bel Sales (Hong Kong) Ltd. Hong Kong
Bel Stewart GmbH Germany
Bel Stewart s.r.o. Czech Republic
Bel Transformer Inc. Delaware
Bel Ventures Inc. Delaware
Cinch Connectors, Inc. Delaware
Cinch Connectors Limited England and Wales
Cinch Connectors de Mexico, S.A. de C.V. Mexico
Signal Dominicana, S.R.L. Dominican Republic
Stewart Connector Systems de Mexico, S.A. de C.V. Mexico

Exhibit 23.1
CONSENT OF INDEPENDENT REGISTERED PUBLIC ACCOUNTING FIRM
We consent to the incorporation by reference in Bel Fuse Inc.’s Registration Statement No. 333-89376 and No. 333-65627 on Form S-8 of our report dated March 12, 2012, relating to the consolidated financial statements and financial statement schedule of Bel Fuse Inc. and subsidiaries (the “Company”) and the effectiveness of the Company’s internal control over financial reporting, which expresses an unqualified opinion appearing in this Annual Report on Form 10-K of the Company for the year ended December 31, 2011. /s/ DELOITTE & TOUCHE LLP New York, New York March 12, 2012

Exhibit 31.1
CERTIFICATION
I, Daniel Bernstein, certify that:
1. I have reviewed this annual report on Form 10-K of Bel Fuse Inc.;
2. Based on my knowledge, this report does not contain any untrue statement of a material fact or omit to state a material fact necessary to make the statements made, in light of the circumstances under which such statements were made, not misleading with respect to the period covered by this report;
3. Based on my knowledge, the financial statements, and other financial information included in this report, fairly present in all material respects the financial condition, results of operations and cash flows of the registrant as of, and for, the periods presented in this report;
4. The registrant’s other certifying officer and I are responsible for establishing and maintaining disclosure controls and procedures (as defined in Exchange Act Rules 13a-15(e) and 15d-15(e)) and internal controls over financial reporting (as defined in Exchange Act Rules 13a-15(f) and 15d-15(f)) for the registrant and have:
(a) designed such disclosure controls and procedures, or caused such disclosure controls and procedures to be designed under our supervision, to ensure that material information relating to the registrant, including its consolidated subsidiaries, is made known to us by others within those entities, particularly during the period in which this report is being prepared;
(b) designed such internal control over financial reporting, or caused such internal control over financial reporting to be designed under our supervision, to provide reasonable assurance regarding the reliability of financial reporting and the preparation of financial statements for external purposes in accordance with generally accepted accounting principles;
(c) evaluated the effectiveness of the registrant’s disclosure controls and procedures and presented in this report
our conclusions about the effectiveness of the disclosure controls and procedures, as of the end of the period covered by this report based on such evaluation; and
(d) disclosed in this report any change in the registrant’s internal control over financial reporting that occurred during the registrant’s most recent fiscal quarter (the registrant’s fourth fiscal quarter in the case of an annual report) that has materially affected, or is reasonably likely to materially affect, the registrant’s internal control over financial reporting; and
5. The registrant’s other certifying officer and I have disclosed, based on our most recent evaluation of internal control over financial reporting, to the registrant’s auditors and the audit committee of the registrant’s board of directors (or persons performing the equivalent functions):
(a) all significant deficiencies and material weaknesses in the design or operation of internal control over financial reporting which are reasonably likely to adversely affect the registrant’s ability to record, process, summarize and report financial information; and
(b) any fraud, whether or not material, that involves management or other employees who have a significant role in the registrant’s internal control over financial reporting.
Date: March 12, 2012 /s/ Daniel Bernstein Daniel Bernstein President and Chief Executive Officer

Exhibit 31.2
CERTIFICATION
I, Colin Dunn, certify that:
1. I have reviewed this annual report on Form 10-K of Bel Fuse Inc.;
2. Based on my knowledge, this report does not contain any untrue statement of a material fact or omit to state a material fact necessary to make the statements made, in light of the circumstances under which such statements were made, not misleading with respect to the period covered by this report;
3. Based on my knowledge, the financial statements, and other financial information included in this report, fairly present in all material respects the financial condition, results of operations and cash flows of the registrant as of, and for, the periods presented in this report;
4. The registrant’s other certifying officer and I are responsible for establishing and maintaining disclosure controls and procedures (as defined in Exchange Act Rules 13a-15(e) and 15d-15(e)) and internal controls over financial reporting (as defined in Exchange Act Rules 13a-15(f) and 15d-15(f)) for the registrant and have:
(a) designed such disclosure controls and procedures, or caused such disclosure controls and procedures to be designed under our supervision, to ensure that material information relating to the registrant, including its consolidated subsidiaries, is made known to us by others within those entities, particularly during the period in which this report is being prepared;
(b) designed such internal control over financial reporting, or caused such internal control over financial reporting to be designed under our supervision, to provide reasonable assurance regarding the reliability of financial reporting and the preparation of financial statements for external purposes in accordance with generally accepted accounting principles;
(c) evaluated the effectiveness of the registrant’s disclosure controls and procedures and presented in this report
our conclusions about the effectiveness of the disclosure controls and procedures, as of the end of the period covered by this report based on such evaluation; and
(d) disclosed in this report any change in the registrant’s internal control over financial reporting that occurred during the registrant’s most recent fiscal quarter (the registrant’s fourth fiscal quarter in the case of an annual report) that has materially affected, or is reasonably likely to materially affect, the registrant’s internal control over financial reporting; and
5. The registrant’s other certifying officer and I have disclosed, based on our most recent evaluation of internal control over financial reporting, to the registrant’s auditors and the audit committee of the registrant’s board of directors (or persons performing the equivalent functions):
(a) all significant deficiencies and material weaknesses in the design or operation of internal control over financial reporting which are reasonably likely to adversely affect the registrant’s ability to record, process, summarize and report financial information; and
(b) any fraud, whether or not material, that involves management or other employees who have a significant role in the registrant’s internal control over financial reporting.
Date: March 12, 2012 /s/ Colin Dunn Colin Dunn Vice President of Finance and Secretary

Exhibit 32.1 CERTIFICATION PURSUANT TO
18 U.S.C. SECTION 1350, AS ADOPTED PURSUANT TO
SECTION 906 OF THE SARBANES-OXLEY ACT OF 2002 In connection with the annual report of Bel Fuse Inc. (the "Company") on Form 10-K for the year ended December 31, 2011 filed with the Securities and Exchange Commission (the "Report"), I, Daniel Bernstein, President and Chief Executive Officer of the Company, certify, pursuant to 18 U.S.C. Section 1350, as adopted pursuant to Section 906 of the Sarbanes-Oxley Act of 2002, that to my knowledge: (1) The Report fully complies with the requirements of Section 13(a) of the Securities Exchange Act of 1934; and (2) The information contained in the Report fairly presents, in all material respects, the consolidated financial condition of the
Company as of the dates presented and consolidated results of operations of the Company for the periods presented. Date: March 12, 2012 /s/ Daniel Bernstein Daniel Bernstein President and Chief Executive Officer

Exhibit 32.2 CERTIFICATION PURSUANT TO
18 U.S.C. SECTION 1350, AS ADOPTED PURSUANT TO
SECTION 906 OF THE SARBANES-OXLEY ACT OF 2002 In connection with the annual report of Bel Fuse Inc. (the "Company") on Form 10-K for the year ended December 31, 2011 filed with the Securities and Exchange Commission (the "Report"), I, Colin Dunn, Vice President of Finance and Secretary of the Company, certify, pursuant to 18 U.S.C. Section 1350, as adopted pursuant to Section 906 of the Sarbanes-Oxley Act of 2002, that to my knowledge: (1) The Report fully complies with the requirements of Section 13(a) of the Securities Exchange Act of 1934; and (2) The information contained in the Report fairly presents, in all material respects, the consolidated financial condition of the
Company as of the dates presented and consolidated results of operations of the Company for the periods presented. Date: March 12, 2012 /s/ Colin Dunn Colin Dunn Vice President of Finance and Secretary
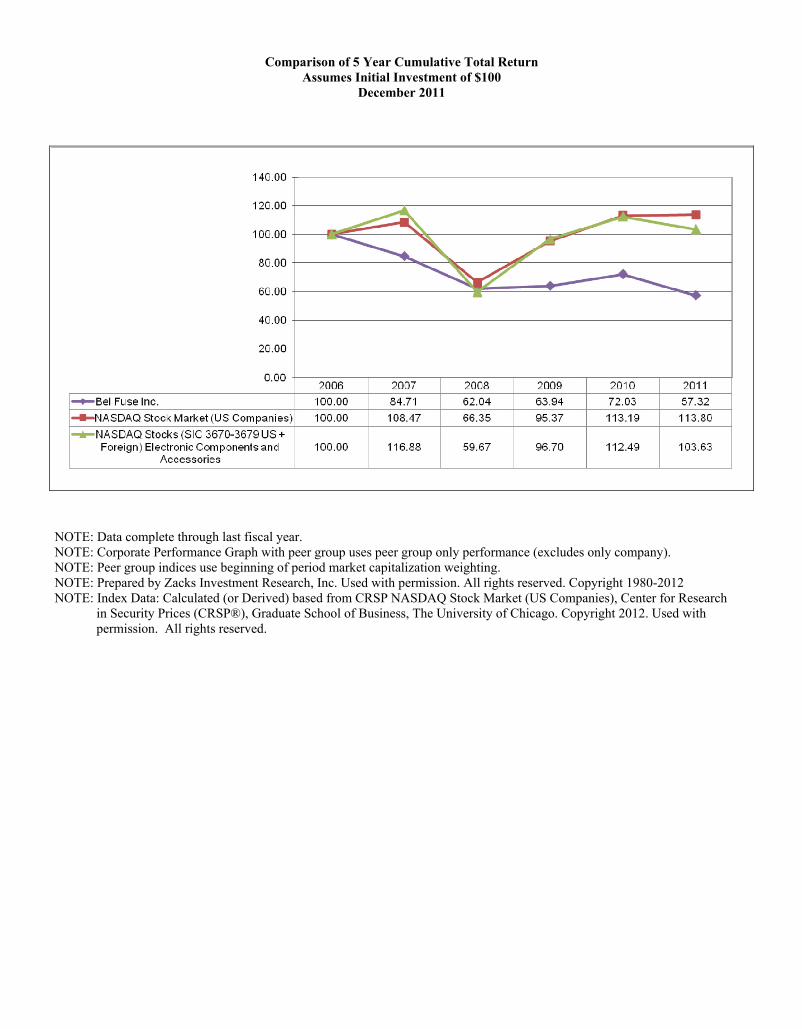
Comparison of 5 Year Cumulative Total Return Assumes Initial Investment of $100
December 2011
NOTE: Data complete through last fiscal year. NOTE: Corporate Performance Graph with peer group uses peer group only performance (excludes only company). NOTE: Peer group indices use beginning of period market capitalization weighting. NOTE: Prepared by Zacks Investment Research, Inc. Used with permission. All rights reserved. Copyright 1980-2012 NOTE: Index Data: Calculated (or Derived) based from CRSP NASDAQ Stock Market (US Companies), Center for Research
in Security Prices (CRSP®), Graduate School of Business, The University of Chicago. Copyright 2012. Used with permission. All rights reserved.

DIreCTorS
Daniel BernsteinPresident and Chief Executive Officer
Howard BernsteinRetired Businessman
Avi edenConsultant Retired Vice Chairman and EVPVishay Intertechnology, Inc.
Peter Gilbert Former President and CEO Gilbert Manufacturing Co. Inc.
John JohnsonRetired Corporate ControllerAVX Corporation
Mark SegallSenior Managing DirectorKidron Corporate Advisors LLC
robert SimandlPracticing Attorney
John TweedyFormer Vice President Engineering Standard Microsystems Corporation
oFFICerS
Daniel Bernstein President and Chief Executive Officer
Colin Dunn Vice President–Finance and Secretary
Dennis Ackerman Vice President–Operations
raymond Cheung Vice President–Asia Operations
TrANSFer AGeNT
Continental Stock Transferand Trust Company17 Battery PlaceNew York, NY 10004Tel: 212-509-4000
AUDITorS
Deloitte & Touche LLPNew York, NY
INTerNeT
www.belfuse.com
Bel Fuse Inc. is traded on theNASDAQ Global Select MarketSystem under the symbolsBELFA and BELFB.
Bel Fuse Inc. 206 Van Vorst Street Jersey City, NJ 07302 Tel: 201-432-0463 Fax: 201-432-9542
5627 Stoneridge Drive #312 Pleasanton, CA 94588 Tel: 925-227-0102
17180 Bernardo Center Drive San Diego, CA 92128 Tel: 858-676-9650
Stewart Connector 11118 Susquehanna Trail South Glen Rock, PA 17327 Tel: 717-235-7512
Signal Transformer 500 Bayview Avenue Inwood, NY 11096 Tel: 516-239-5777 Fax: 516-239-7208
Cinch Connectors, Inc. 1700 Finley Road Lombard, IL 60148 Tel: 630-705-6000
Bel Power Inc. 2400 Computer Drive Westborough, MA 01581 Tel: 508-870-9775 Fax: 508-870-9796
Bel Stewart GmbH Industriestrasse 20, D-61381 Friedrichsdorf, Germany Tel: 49-6172-9552-0 Fax: 49-6172-9552-40
Bel Fuse Ltd. 8F/8 Luk Hop Street San Po Kong Kowloon, Hong Kong Tel: 852-2328-5515 Fax: 852-2352-3706
Bel Power (Hangzhou) Co., Ltd. 2nd Floor, Building E Eastcom City, 66 Dongxin Avenue Hangzhou, Zhejiang 310053 People’s Republic of China Tel: 86-571-8669-6947 Fax: 86-571-8669-6949
Cinch Connectors Ltd. Shireoaks Road Worksop S80 3HA Nottinghamshire, U.K. Tel: 44-1909-474131
Bel Fuse europe Ltd. Suite F15 Preston Technology Management Centre Marsh Lane, Preston PR1 8UQ Lancashire U.K. Tel: 44-1772-556601 Fax: 44-1772-888366
28 Turkey Court, Turkey Mill Ashford Road, Maidstone Kent ME14 5PP U.K. Tel: 44-1622-757395 Fax: 44-1622-663252
Bel Fuse (Macao Commercial offshore) Limited Rua de Xangai No.175 Edificio Da Associacao Commercial De Macau Macao Tel: 853-2870-6137 Fax: 853-2870-7483
Bel Stewart, s.r.o. Na Bojišti 2 120 00 Praha 2 Czech Republic Tel: 420-296-180-000 Fax: 420-296-180-003
C o r p o r a t e I n f o r m a t i o n
Bel Fuse Inc. 206 Van Vorst Street Jersey City, NJ 07302 USATel: 201-432-0463 Fax: 201-432-9542