annual report - axiom
TRANSCRIPT

French collective
investment fund (FCP)
AXIOM CONTINGENT
CAPITAL
ANNUAL REPORT
as of 29 December 2017
Management Company: Axiom Alternative Investments
Depositary: Caceis Bank
Statutory Auditor: PriceWaterhouseCoopers Audit
Axiom Alternative Investments – 39, Avenue Pierre 1er de Serbie, 75008 Paris, France

2
1. Description of the Fund 3
2. Changes affecting the Fund 11
3. Management report 12
4. Regulatory information 24
5. Auditor’s opinion on the financial statements 28
6. Financial statements for the year 33
TABLE OF CONTENTS

3
• LEGAL FORM
French collective investment fund (Fonds Commun de Placement, FCP).
• CLASSIFICATION
International bonds and other debt securities (Obligations et autres titres de créances internationaux).
• PROCEDURES FOR DETERMINING AND ALLOCATING PROFITS
Class C, R, E, CHF and Z shares: the amounts available for distribution are fully reinvested except those amounts that, by law,
are subject to mandatory distribution.
• INVESTMENT OBJECTIVE
The Fund is a French collective investment fund (Fonds commun de placement, FCP) which seeks to obtain returns (net of
management fees) similar to or greater than those of its benchmark index (BofA Contingent Capital Index), over an
investment horizon of at least 3 years.
• BENCHMARK INDEX
This Fund is not an index tracker but it is managed relative to a benchmark index. The Fund’s performance may be compared
retrospectively with that of the BofA Contingent Capital Index over an investment horizon of more than 3 years.
The BofA Contingent Capital Index tracks the performance of investment grade or high yield bonds issued by financial
institutions as securities to be included in their Additionnal Tier 1 and Tier 2 ratios.
• INVESTMENT STRATEGY
Management policy
The asset management company’s investment process aims to take advantage of major opportunities in the international bond
market. The Fund's investment policy is to select bonds or debt securities issued by financial institutions. The use of
subordinated bonds, especially "Additional Tier 1" bonds will be at the core of the investment process, as these securities offer
high yields that compensate for high risks, including:
- risk of coupon suspension: coupon payments are fully discretionary.
- risk of a trigger event: if a certain capital level is reached, these bonds are either converted into shares or partially or totally
written down.
- risk of non-redemption: these are perpetual bonds that can only be repaid at the issuer's discretion on predefined call dates.
The offering circular for a subordinated bond sets out the requirements and risks which apply to it as an instrument eligible as
capital for financial institutions.
In order to optimise the portfolio’s return, the investment process is divided into several steps:
Step 1: Assessment of the quality of the securities issued
• The management team defines the criteria and stress situations that are likely to affect the credit risk of each issuer based on
the information supplied by the companies themselves (reports, press releases, company meetings), independent research and
analysis by the research teams from leading investment banks.
• Only securities issued by companies with a proven track record, strong market positions and known and measurable
competitive advantages are taken into consideration.
• Detailed scenarios and stress tests are prepared with different interest rates and credit spreads, for each credit rating category
for the main bond maturities.
• Securities are selected by the asset managers based on an in-depth analysis of offering circulars.
• The acquisition or disposal of bonds or debt securities is also based on an in-house analysis of each issuer’s credit risk. The
Fund may be fully invested in debt securities of any quality, including a High Yield rating (securities considered highly
speculative) from the main rating agencies–or a rating considered equivalent by the Management Company.
Step 2: Portfolio construction
• The portfolio is then constructed based on the choices made on risk allocation and security selection as outlined above.
1. DESCRIPTION OF THE FUND

4
• Portfolio construction ensures effective diversification, made possible by an allocation by type of issuer.
• However, exposure to each type of underlying assets may be as high as 100%.
• The asset managers may hedge currency and interest rate risk. Since part of the assets may be denominated in currencies
other than the reference currency, the Fund will be systematically hedged against this risk. However, a residual risk remains.
Step 3: Portfolio monitoring
• The performance of underlying assets is regularly monitored via the publication of statistical data on the securities.
• Systematic monitoring of the trends in each sub-sector (issuer concentration, regulatory watch).
• Circumstances that are likely to affect the payment of coupons or the repayment of the principal are specifically monitored.
The Fund is constantly exposed to the interest rate markets of OECD countries, especially those of eurozone countries, the
U.K., Switzerland and the U.S. Exposure to each of these markets may be as high as 100%.
For other OECD countries (excluding those referred to in the paragraph above), the Fund’s exposure to each of these
markets may not exceed 5% of the NAV.
Exposure to non-OECD markets is incidental (below 10%).
Bonds issued by both public and private sector issuers may be selected.
The acquisition or disposal of bonds or debt securities is based on an in-house analysis of each issuer’s credit risk; the
acquisition or disposal of a security is not based exclusively on ratings assigned by rating agencies.
The Fund is managed within a 0 to 10 sensitivity scale (see risk profile – interest rate risk).
Range of sensitivity to interest rates within which the
Fund is managed
0 to 10
Currency of denomination of the securities in which the
Fund is invested
International
Currency risk borne by the Fund Minor because it only relates to the risk associated
with an imperfect hedge
Geographic area of security issuers to which the Fund is
exposed
OECD countries (all areas)
Main asset classes (excluding embedded derivatives)
Equities:
The Fund is not intended to hold stocks. However, since the UCITS may invest in bonds of any seniority or contingent
convertible bonds, there is a chance that such instruments may be converted into shares at the initiative of the regulator or,
for instance, in the event that a solvency ratio falls below a contractually agreed minimum level. If the bonds held in the
portfolio are converted into shares, the UCITS may temporarily hold shares for up to 10% of its net assets and shall sell them
as soon as possible in the holders' best interests.
Bonds and debt securities:
The Fund shall be invested in bonds issued by sovereign states, industrial, commercial and financial companies, as well as
convertible bonds, shares or debt securities. All financial instruments may be fixed-, variable- and/or adjustable-rate securities.
These securities issued by international issuers, may be secured, unsecured or subordinated.
Money market instruments:
During times when the investment strategy leads the management team to trim the Fund’s exposure to bonds and/or other
debt securities in order to attain the investment objective, the Fund may be exposed up to 100% to commercial paper,
certificates of deposit and euro commercial paper. These financial instruments may also be used on an incidental basis as cash
investments.
Shares or units from other UCITS and/or AIFs:
Exposure to funds classified as “bond and/or money market”, which may not exceed 10%, will be aimed at helping to achieve
the Fund’s objective. On an ancillary basis, the Fund may also invest its cash in money market funds.
In order to deliver the target investment return, up to 10% of the Fund’s assets may be invested in French securitisation funds
(FCTs) or their equivalent.

5
The Fund may be invested in European UCITS and AIFs open to non-professional investors. The Fund may be invested in
other collective investment undertakings managed by AXIOM ALTERNATIVE INVESTMENTS.
Securitisation:
On an ancillary basis, the Fund may also be invested in securitised products via the UCITS or AIFs in which it invests.
Derivative instruments
For hedging or exposure purposes, the Fund may trade in any forwards/futures or options, provided that their underlying
assets have a direct financial relationship or correlation with an asset held in the portfolio.
Types of markets in which the Fund may be invested:
• regulated: yes;
• organised: yes;
• OTC: yes.
Risks to which the fund manager intends to seek exposure:
• equity: yes (for hedging purposes);
• interest rate: yes;
• currency: yes;
• credit: yes;
• index: yes (interest rates);
• dividends: yes.
Purpose of the investments:
• hedging: yes;
• exposure: yes;
• arbitrage: no.
Types of instruments used:
• futures: yes;
• options: yes;
• swaps: yes;
• currency forwards: yes;
• credit derivatives: yes, CDS.
GBP-denominated Class E shares and CHF-denominated Class CHF shares will be systematically hedged against the risk of
fluctuation in the exchange rate between their respective currencies of denomination and the Euro. The asset manager will use
financial forwards in an effort to seek systematic and comprehensive hedging. This hedge will be ensured through financial
instruments minimising the impact of hedging transactions on other share classes, most of these instruments being currency
forwards.
Derivative contracts may be entered into with counterparties selected by the Management Company in accordance with its
Best Execution/Best Selection policy and with the procedure for authorising new counterparties. The latter may be large
French or foreign counterparties such as credit institutions or banks. They are subject to exchanges of collateral. It should be
noted that they do not have any discretion in the composition or management of the Fund's portfolio, and/or in the underlying
assets of the financial derivatives.
Such instruments are subject to various types of risks, including, for instance, market, liquidity, credit, counterparty, legal or
operational risk.

6
Securities with embedded derivatives
The Fund may be invested in securities with embedded derivatives.
Risks to which the fund manager intends to seek exposure:
• equity: yes;
• interest rate: yes;
• currency: yes;
• credit: yes;
• index: yes.
Purpose of the investments:
• hedging: yes;
• exposure: yes;
• arbitrage: no.
The types of instruments used will include:
• Convertible bonds or any other fixed-income investment vehicle carrying a conversion or subscription right;
• Warrants;
• EMTNs;
• CLNs;
• Subscription rights;
• Preferred shares: American Depositary Receipts (ADRs) and Global Depositary Receipts (GDRs) (certificate allowing
investors to buy stocks in foreign markets).
Deposits
The Fund may make deposits up to 20% of its NAV (per entity) and for a maximum duration of 12 months, with one or more
European credit institutions.
Cash borrowings
Under normal operating conditions, the Fund may also have a temporary debit balance and may, in this case, use cash
borrowings up to 10% of its NAV.
Securities financing transactions
Types of securities financing transactions:
• repurchase agreements and reverse repurchase agreements pursuant to the French Monetary Code: Yes;
• securities lending and borrowing transactions pursuant to the French Monetary Code: Yes.
Purpose and impact of these transactions, which may only be intended to achieve the investment objective:
• cash management: Yes;
• optimisation of the UCITS' income: Yes;
• potential contribution to the UCITS' leverage: No;
• other.
The target percentage of assets under management which may be used in such transactions or contracts will be "below 10%".
However, the Fund may enter into securities financing transactions up to 100% of its assets under certain market conditions.
The Fund’s exposure to derivatives, embedded derivatives and repurchase agreements and reverse repurchase agreements
may not exceed 100% of its assets.
The Fund’s total commitments on and exposure to physical securities may not exceed 200% of its assets.
• RISK PROFILE
The Fund will be mainly invested in financial instruments selected by the Management Company. These instruments will be
subject to the ups and downs of financial markets.
The Fund is a UCITS classified as "International bonds and other debt securities" (obligations et autres titres de créance
internationaux).
Risk factors include, but are not limited to, those outlined below. It is the investor’s responsibility to analyse the inherent risk
of this investment and to ensure that it is appropriate to their financial situation.

7
When investing in this Fund, the investor may be exposed to the following risks:
Risk related to subordinated bonds
The use of subordinated bonds, especially "Additional Tier 1" bonds exposes the Fund to the following risks:
- trigger event: if a certain capital level is reached, these bonds are either converted into shares or partially or totally written
down.
- coupon cancellation: coupon payments on such instruments are entirely discretionary and may be cancelled by the issuer at
any time, for any reason, and for any length of time.
- capital structure inversion risk: contrary to usual capital hierarchy, investors in such instruments may suffer a capital loss, as a
subordinated creditor will be repaid after ordinary creditors but before shareholders.
- call extension risk: Such instruments are issued as perpetual instruments, callable at pre-determined levels only with the
approval of the competent authority.
- Yield/Valuation risk: The attractive yields of such instruments may be viewed as a complexity premium.
The materialisation of any of these risks may lead to a fall in the UCITS’ net asset value.
Risk of capital loss
The Fund offers no capital guarantee or protection. Therefore, investors may not recover their initial investment in full.
Interest rate risk
When interest rates rise, the value of the Fund’s investments in fixed-rate (and potentially variable-rate) bonds and in certain
fixed-income UCITS or AIFs is reduced. As such, the Fund’s NAV is increased or reduced by interest rate fluctuations.
This risk is measured by the Fund’s interest rate sensitivity or “modified duration”, which ranges between 0 and 10.
The occurrence of these risks may lead to a fall in the UCITS’ net asset value.
Credit risk
This risk arises from the possibility that a bond or debt security issuer might not be able to meet its payment obligations,
namely coupon payments and/or capital repayment at maturity. Such a default may result in a decrease in the Fund’s NAV.
Credit risk also includes the risk of a downgrade in the issuer’s credit rating.
This risk is especially high as the Fund may invest in securities rated below B- by Standard and Poor’s, B3 by Moody’s, B- by
Fitch Ratings or B Low by DBRS (the highest rating will be applied), or having no rating, or having a rating considered
equivalent by the Management Company.
On an ancillary basis, the Fund may be exposed to non-OECD countries.
The occurrence of these risks may lead to a fall in the UCITS’ net asset value.
Counterparty risk
The Fund may enter into securities financing transactions and/or OTC derivative contracts. Therefore, it is exposed to the risk
of default of the counterparties to such transactions, which may result in a decrease in its net asset value.
Risk related to securitised products
The Fund may also be exposed to these instruments via the UCITS or AIFs in which it may be invested.
For such instruments, credit risk lies mainly in the quality of the underlying assets, which may vary in nature (bank loans, debt
securities, etc.).
These instruments are the result of complex structures which may carry legal and specific risks related to the characteristics
of the underlying assets.
Liquidity risk
Risk arising from the potential difficulty or impossibility of selling securities held in the portfolio when necessary and at the
portfolio valuation price, due to the limited size of the market or insufficient trading volumes in the market where these
securities are usually traded.
The occurrence of these risks may lead to a fall in the UCITS’ net asset value.
Currency risk (ancillary)

8
Since part of the assets may be denominated in currencies other than the base currency, the Fund may be affected by changes
in foreign exchange controls or in exchange rates between the base currency and these other currencies. As a result, the Fund
will be systematically hedged against this risk. However, a residual risk remains. Such fluctuations in exchange rates may lead to
a fall in the Fund’s net asset value.
For Class E and Class CHF shares, the fund manager shall systematically and totally hedge the portfolio against the EUR/GBP
and the EUR/CHF exchange-rate risk. However, a residual risk remains.
Risk related to discretionary management
This risk arises from the selection of securities and financial instruments carried out by the fund manager. Therefore, the Fund
may not always be exposed to the best-performing financial instruments.
The occurrence of these risks may lead to a fall in the UCITS’ net asset value.
Risk related to non-OECD countries
The prices of securities from non-OECD issuers may be subject to substantial volatility. The operational conditions and
conditions of control by the authorities for these securities may differ from those prevailing in major international markets.
The occurrence of this risk may lower the net asset value of the UCITS.
Legal risk
The use, among others, of securities financing transactions and total return swaps gives rise to complex financial structures
that may carry legal risks, which may be due in particular to the contracts with the counterparties being poorly drafted. The
occurrence of these risks may lead to a fall in the net asset value of the Fund.
Operational risk
Risk of losses resulting from the inadequacy or inefficiency of internal processes, persons, systems or from external events.
The occurrence of these risks may lead to a fall in the net asset value of the Fund.
• ELIGIBLE INVESTORS AND TYPICAL INVESTOR PROFILE
The Fund is intended for all investors seeking a return net management fees similar to or greater than the BofA Contingent
Capital Index.
The recommended minimum investment horizon for the Fund is 3 years.
The reasonable amount to invest in the Fund depends on each investor’s individual situation. To calculate this amount
investors must take into account their personal assets and financial plans as well as their level of risk aversion. Investors are
strongly advised to diversify their investments sufficiently so that they are not solely exposed to the risks associated with this
Fund.

9
31 January 2017:
1 - Performance, ongoing charges and performance fees for the year 2016 have been updated on the KIID
2 - Addition related to the entry into force of UCITS 5: paragraph on the depositary and remuneration policy
- Change in the wording of references to investments in other collective investment undertakings (in the section “Main
asset classes used”): the collective investment undertakings in which the funds may invest are no longer referred to as
belonging to the “money-market” or “bond” fund categories.
- Change in the legal name of Caceis Bank
2. CHANGES AFFECTING THE FUND

10
The rally initiated at the end of 2016 continues in January.
The trend towards regulatory forbearance is confirmed. The new Trump administration is in discord with the rules of the
Dodd-Frank Act and the Basel Committee has not been able to maintain a consensus on the so-called “output floors”. These
successive postponements are viewed positively by the market. They show a regulatory return to simple rules, adapted to
each country, in the context of economic recovery.
The outlook on fundamentals is also improving. Increasing interest rates are pulling revenues up and the Q4 market volatility is
supporting investment banking activities. Unicredit is launching an outstanding €13Bn capital increase and BCP in Portugal
announced one of its own for €1.3Bn.
Valuations have been supported by a consolidating bank sector. In Italy, UBI has repurchased three regional banks and there
are rumors surrounding a joint approach between Intesa an Allianz concerning Generali’s activities.
The primary market has been active. Several banks have taken advantage of the market’s good performance in order to issue
new AT1s - Intesa in euros at 7.75% and Standard Chartered in USD at 7.75%. Rabobank issued €1.5Bn of listed certificates to
bring the total issue size to €7.5Bn with a generous price of 108 (it initially traded at 114 before this announcement).
The month ended slightly more reinforced after comments from the ECB on a possible tapering of its QE policy.
We remain confident about the AT1s’ potential to keep performing in this favorable financial and regulatory environment.
Spreads are still 100 bps higher than those at the beginning of 2015 and their floating rate structure is attractive considering
the possible tapering of QE policy and a rise in interest rates.
Axiom Contingent Capital ends the month with a performance of + 1.44%.
The bond market in February was marked by a spread widening on sovereign bonds, particularly those of Italy, Spain and
France against those of Germany. The uncertainties surrounding the French President Election are of great concern to the
market. Despite this volatility, the price of financial subordinated debts has risen and the Itraxx Sub Financials indexes have
remained stable, at around 210 pts.
AT1s increased strongly at the end of the month in light of low net issuance (Barclays issued one AT1 in £ at 7.25% coupon in
which we participated). Only the AT1s of French banks dropped in the middle of the month, allowing us to buy some rather
opportunistically (BNP, Société Générale and Crédit Agricole). For example, BNP 6 1/8 has fallen by more than 3% in a bull
market!
We have sold our entire position on Deutsche Bank's AT1 after its very strong growth. This position, which consisted of
71.5% to 84.5% of the purchase price, was fully sold at 91.56% mid-February.
The fundamentals of the banking sector continue to improve. The annual earning period revealed a better quality of
outstanding loans (lower provisions, lower non-performing loans ratios), costs under control (after adjusting exceptional
items) and sustained income despite the ultra-low interest rate environment in 2016. The excellent results of ABN Amro,
Coventry Building Society and Erste Bank are noteworthy. Disappointment came from two of the biggest institutions, BNP
Paribas and HSBC (they respectively showed a decline in retail banking income in France and a weakness in non-USD
currencies). Only HSBC AT1s reacted negatively to these results, offering an attractive entry point to reinforce our exposure
within the portfolio.
The financial debt market continued to increase in March. Interest rates remained stable over the month, particularly after
Donald Trump encountered difficulties in reforming the Obamacare program.
The market still remains unaffected by certain geopolitical risks such as the French presidential elections and with the Brexit
process underway as demonstrated by the tightening by 30bp of the Subfin, Tier 2 index of European financial issuers (+24 bps
contribution in the fund). This paradox led us to reduce the fund's exposure to this index by 5%.
The fundamentals of the sector remain strong. A year or so after considerable media attention, Deutsche Bank has succeeded
in its capital increase of 8 billion euros. Deutsche Bank’s AT1 performed strongly following this news, and we took the
3. MANAGEMENT REPORT
11
opportunity to remove the residual position in the fund.
Spreads tightening is still conducive to an active primary market: Macquarie bank issued its first AT1 at 6.125% in $ (we
participated in the issue to diversify the geographic exposure of the fund), SEB AB at 5.625% in $ (we did not participate
because we think that the risk related to Bale IV is not taken into account), Santander UK at 6.75 in £ (we participated),
Danske Bank in DKK (we participated because its currency and its variable coupon will reduce the volatility of the bond),
Caixa Geral at 10.75% in € (we participated to take advantage of improving fundamentals in Portugal), and finally RSA at
550bps spread with the first "Restricted Tier 1" issued by an insurer (we also participated to improve the diversification of the
fund and take advantage of the solid profile of this insurer).
The fund ended the month up 0.93% and has risen by 4.18% over the year.
Macron's victory in the first round sparked a relief rally. Uncertainty with regards to opinion polls maintained the Subfin index
above 200bp, it narrowed by more than 30 bp over the last week. Bank stocks jumped 6% and AT1s, especially French names,
surpassed their historical highs. Despite rapid adjustment processes, financial indices tend to always fall behind corporate ones.
By way of comparison, the EUR HY Corporate index (BEUH) has a return of 2.7% while the EUR HY Financial index (BEUHFI)
remains at 3.7%
The surprise announcement of legislative elections in the UK to strengthen the government of Theresa May has provoked a
feeling of collective solidarity from the other 27 EU members. The negotiations promise to be tense, each member state acting
from a position of strength. However, liquidity, which remained behind, continues to be deployed and valuations stabilize at
levels where fundamentals are again dominating.
The first-quarter earnings season showed profits in Swedish banks and solid revenues at Santander, BBVA and Lloyds, while
Credit Suisse confirms its capital increase for CHF 4bn. Deutsche Bank has completed its own capital increase for Eur 8Mds
and is now focusing on its restructuring. It is now Banco Popular that is likely to launch a new capital increase. The Spanish
bank had to correct its 2016 accounts for provisions on non-performing loans and replaced the management which had
already carried out a capital increase in June 2016. The bank is now exploring several scenarios to retain its financial flexibility
with asset disposals and a possible merger.
The primary activity was limited to two new AT1s issued by Erste Bank and Santander in which we participated.
The fund ended the month up 2.52% carried by all the bonds in the portfolio that performed well.
May started with Emmanuel Macron's victory in the second round of the French elections, confirming the trend initiated in
the first round and favoring the AT1 market.
Four banks took the opportunity to issue new AT1s. Sabadell issued its first instrument with a coupon of 6.5%. HSBC, BBVA
and Unicredit completed their program with respective coupons of 6% (USD), 5.875 and 6.625. We have participated in all
these issues except BBVA because the bond was too expensive from our point of view.
At the end of the month, three developments put a lid on this strong rally: firstly, a possible agreement on the future electoral
law in Italy could give rise to early elections, especially if the Democratic Party wins the local elections in June.
Secondly, the EBA released an opinion, although purely consultative, on the redrafting of the CRD/CRR package which
recommends not changing the distribution hierarchy under a breach of the Combined Buffer. Finally, the woes of Banco
Popular in Spain grew larger as, according to the local press, all potential buyers but Santander pulled out from the process.
The poor handling of the process, a mix of M&A, asset sales and capital raise without any coordination or any clear strategy,
weighed heavily on the valuations of AT1s and legacy T1s but no contagion to the rest of the market.
Lastly, more and more news articles are evoking the possibility that Bale 4 might finally be adopted when the Basel Committee
meets on June 15th. This would be an important catalyst for the financial sector, with a new wave of equity capital.
The fund ended the month up 0.60%.
June was a lively month for the banking sector. It started with the announcement of Banco Santander’s purchase of Banco
Popular, and ended on bullish rate movements following the ECB's annual forum and several speeches from central bankers
concerning the exit of the QE.

12
The resolution of Banco Popular was undoubtedly the highlight of the month. This very severe resolution was particularly
unexpected by banking sector specialists. Furthermore, the completely indistinguishable treatment between AT1, T1 and T2
(which were all reduced to zero) came as a surprise. 1.17% of Axiom Contingent Capital was exposed to the Spanish bank.
We wrote a research note on this subject which is available on request.
Considering how this first banking resolution was carried out by the SRB (Single Resolution Board), we have decided to
strengthen the credit quality of the fund. From now on, the fund will invest exclusively in securities issued by issuers with an
investment grade rating on their senior debt (which already represented 97.4% of the portfolio before Banco Popular).
Italy also experienced three bank restructurings. Uncertainties removed, investors can once again focus on the improving
fundamentals of leading European banks, with an outperformance of peripheral banks (+11 bps for CaixaBank for example).
The series of upgrades continue this month with RBS, Sabadell, Bank of Ireland and AIB seeing their credit rating improving
and with a move into investment grade territory in unsecured senior debt.
As a result, the Itraxx sub index tightened sharply from 158bps to 133bps, driven also by the announcement of the
replacement of Opco entities by Holdcos (+5bps contribution in the fund). We took advantage of this move to sell the
entirety our exposure on Itraxx (winning position within the portfolio).
The AT1 market also benefited from this positive context. Caixabank and RBI issued their first AT1 at 6.75% and 6.125%
respectively in which we participated. HSBC took advantage of low rates to issue 4.75% on a 12-year non-call format. We also
participated in this.
July saw another leg of appreciation in a context of low volatility supported by dovish comments from the Central banks. The
VIX index (implicit index for options on the S&P 500) reached its lowest level since its inception at 9.20.
This appreciation is part of a global normalization trend of the financial sector; it is therefore normal that spreads are
converging towards corporate credit. A combination of factors drove investor appetite: the resolution of the Venetian banks
and the approval of the Monte Paschi recapitalization (we took advantage of the prices' rise to sell all our position). Only
Banca Carige, Novo Banco and Co-operative Bank remain on the list of distressed European banks (we don’t have any of these
names in the portfolio). We will also note the announcement by RBS of its settlement with FHFA on US claims RMBS for
$4.75 bn and the closing of Unicredit's sale of NPLs for €16.2 bn.
The earnings season started. After three consecutive positive quarters, the trend is now a significant decrease in market
revenues due to falling volatility but still an important increase of capital ratios.
Instruments with the highest beta benefited most from this positive context, in particular AT1s (+2.06% over the month for
the Bofa Coco Index). Despite the tightening of spreads, only Bankia came on the market to issue its first Basel 3 bond: a non-
call 5 year with a 6% coupon (we participated in the issue).
We took advantage of this context to reduce the fund's exposure, especially on peripheral banks that have a significant
sensitivity to the market (Unicredit 6.75%, +3.50% over the month).
We also reduce our exposure on bonds wiht short calls (<2 years). There is a strong appetite for these instruments (KBC
5.625, call 19/03/2019 with 2.50% yield) because the market anticipates that the call will be exercised given the issue spread
(+475bps for KBC).
Axiom Contingent Capital is up 1,84% over the month and 8,59% YTD.
As opposed to previous years, the month of August was relatively calm for markets. After a valuation peak in the banking
sector (its highest since the beginning of the year), the market eventually landed near its end of July level. Investors’ concerns
about ECB tapering, a downturn in US inflation and geopolitical frictions in the Far East then took over to leave the Itraxx Sub
fin index slightly wider by 6bp at the end of the month.
In early August, Barclays took advantage of the low spreads to issue a new AT1 of £1.25bn with a 5.875% coupon. We did not
participate in this issuance.
More generally speaking, considering that the risk of a Brexit setback does not seem to be included in the valuations, we took
advantage of the high point to reduce our exposition to the UK, notably by taking profits on Coventry and Nationwide.

13
The main contributors this month were the bonds issued by RBS after the release of some historically strong earnings, while
bonds with a strong beta, especially from Italian and Spanish banks, decreased.
Economic prospects in Europe are clearly improving, heralding a relatively calm end of the year.
The fund is flat -0.01% this month and up 8.58% YTD.
Subordinated financials continued their upward trend during September in a context of historically low volatility, with a
tightening of 20bps for the SubFin iTraxx index.
On the market, Liberbank announced a capital increase of €500m aimed at strengthening its asset coverage, while Co-
Operative Bank successfully completed its recapitalization.
A conference about NPLs gathering every market player took place in Italy. Disposal of bad loan portfolios is gaining
momentum under the pressure of the regulator. Banco BPM is about to sell a €5bn bad loan portfolio, while Banca Carige has
announced a €1.4bn reduction plan of its portfolio. Unicredit is preparing for a second NPL deal for a gross book value
between €1-1.5bn.
M&A theme is back on the front of the stage: after Abanca, Unicaja and CaixaBank are interested in bidding for Liberbank,
Unicredit is rumoured to have approached the German State about Commerzbank, Banque Internationale à Luxembourg has
been sold by its Qatari owners to a Chinese conglomerate.
In September, the AT1 pocket performed well thanks to a very active primary market. We participated in the new issuances
of: Julius Baer (4.75% USD, call in 7 years), Jyske Bank (4.75% EUR, call in 10 years), Santander (5.25% EUR, call in 6 years) and
NIBC Bank (6% EUR, call in 7 years). However, we left out some issuances that we deemed had less potential such as ABN
AMRO (4.75% EUR, call in 10 years) due to the risk of Basel 4 output floors and Investec (6.75% GBP, call in 5 years) because
of its high exposition in South Africa.
We did not do any arbitration this month as the low volatility of the asset class didn't favor relative value strategies.
Major positive contributors this month were the Austrian banks Erste Bank and Raiffeisen Bank (+8bps) while Spanish banks
suffered from the approaching Catalan referendum (-3bps).
The fund ended the month up 0.38% and up 8.99% since the beginning of the year.
October :
Subordinated financials continued to grow at the same pace as in September, as the tail risk of Catalonia’s independence
receded and the ECB adopted a more dovish stance talking about QE recalibration as anticipated by the markets.
On the regulatory front, the Basel Committee has yet to reach an agreement on RWA minima and French banks are defending
their interests by pushing for the implementation of the review of trading books. The ECB announced a consultation on NPL
measures but national interest again prevailed with the Bank of Italy voicing strong opposition.
The earnings season revealed substantial capital increase from a number of banks in the UK (RBS and Lloyds), Spain and Italy
(Unicredit), while others achieved significant progress on reducing their NPLs (Caixabank, Liberbank). Consequently, the trend
towards rating upgrades continued. Only Barclays and Deutsche Bank’s investment banks published disappointing results. It is
interesting to note as well that Liberbank has successfully raised €500m and Carige is currently finalizing its capital increase.
The sector’s consolidation continued as Novo Banco completed its sale to Lone Star, HSH is gathering bids and Commerzbank
has nominated two advisors for possible M&A scenarios.
Liberbank is also about to launch its rights issue and Carige is in the process of realizing its own capital increase. FirstRand has
made a takeover bid on Aldermore for £1.1 bn.
AT1s had the strongest uptrend this month. The Santander 5.25 issued at the end of September and in which we participated
ends at 106% (6bps of contribution for the fund). Few banks issued new securities before the publishing of earnings results.
Only ASR, a Dutch insurer, issued the first RT1 (Restricted Tier 1, AT1 for insurers) in euros in which we participated. The
coupon of 4.625% over 10 years seems attractive in respect to the quality of the insurer.
S&P’s Italian upgrade from BBB- to BBB on October 27th was followed by an upgrade on the long and short-term ratings of 11

14
Italian financial institutions leading to a market rally between Italian issuers. Our overweight position in Intesa and Unicredit
(positions above 10%) enabled the fund to benefit from this positive rating movement (+60bps of contribution)
The fund’s performance has risen by +2.81% this month, bringing the year-to-date performance to +12.06%.
November :
The Q3 results in the financial sector highlighted once again the positive trends there: higher capital ratios (Unicredit, Intesa,
Commerzbank), improving asset quality (ABN Amro, Credit Agricole), guidance towards annual profits for 2017
(Commerzbank, NDB) and new targets announced during investor days for Credit Suisse, Societe Generale and BPCE.
The EBA Transparency Exercise also disclosed a clear improvement in the banks' exposure to non-performing loans;
particularly in peripheral countries such as Spain and Portugal (we published a note on this which is available on our website).
In the UK, the regulator published the results of its stress tests, confirming the resilience of the sector in the context of
Brexit. Lastly, the rating agencies further confirmed the trend: the British banking sector now has a positive outlook at S&P,
while Italian banks and Raiffeisen Banking Group in Austria were upgraded by S&P and Moody’s respectively.
On the regulatory front, the ECB had to delay its initiative of provisioning NPLs under the pressure of the European
Commission. On the other hand, the timing is imminent for Basel 4: international regulators should announce an agreement
shortly, with a minimum of RWAs at 72.5%.
Meanwhile the sector continues its transformation: Credit Agricole has acquired Banca Leonardo, the Italian insurance
company Cattolica and Banco BPM have entered into a 15 years strategic partnership, BBVA is targeting acquisitions in the
United States and Belfius and Deutsche AM are preparing their IPOs.
The primary market has been active with AT1s issued by BNP ($ 750m), BBVA ($ 1bn), Sabadell (€ 400m) and Nordea (€
750m), T2s (Sainsbury Bank, Vivat and BCP) as well as Restricted Tier 1 (AT1 format for insurers) issued by QBE ($ 400m)
and Direct Line (£ 350m). On the legacy instruments front, corporate actions continued with a tender from Credit Logement
on its Legacy Tier 1 floater.
During the month of November, the fund participated in the new issue of Nordea for its Investment Grade rating and first
appearance in Euro. The main negative contributor of the month was HSBC whose bonds fell by 3 points. The market
downturn led us to make some shifts in the portfolio. More particularly, we sold bonds from Lloyds, ING, Crédit Agricole and
BNP and bought bonds from Sabadell now that the situation in Catalonia has settled down.
The fund ended the month down slightly (-0.04%) while the Bofa Coco index was down 0.27%. The fund is however up +
12.01% since the beginning of the year.
December :
The sector ended the year on a positive note and thus has achieved an overall good performance in 2017.
The year was essentially marked by a sharp reduction in the stocks of non-performing loans from European banks, reducing
the main risk in the sector. However, the peripheral banks will have to continue their efforts in 2018, especially since they are
facing the pressure of the regulator who wants to put in place the European Deposit Guarantee Scheme (EDIS) in a
completely consolidated environment.
The credit enhancement cycle continues with the rating agencies: Portugal and Ireland were upgraded by Fitch. We should
continue to see upward revisions in 2018 as the quality of European bank assets normalizes.
Mergers and acquisitions should be a major theme in 2018 encouraged by the regulator who is putting constant pressure on
high NPE banks.
2017 marks the end of regulatory uncertainties after the Basle 3 agreement, which has been under discussion for several years,
was finally finalized on 8 December. The political context also offers some relief with the Brexit negotiations which resulted in
an agreement for phase 1 and a mixed but constructive outcome in the elections in Catalonia.
During the month of December, the AT1 market was particularly sluggish, with 1-month volatility slipping to a record low of
0.93%. In this context, few arbitrages were made in the portfolio.
In the primary market, we participated in the new issue of a Restricted Tier 1 by Direct Line (anEnglish insurer) because we
found the spread attractive. This new issuance increases exposure to insurers (10% of the fund).

15
In presenting its quarterly results, Unicredit also announced a new AT1 issuance. We did not participate because we found
that the return was not attractive enough compared to existing issuances with higher call spreads.
The fund ended the month up 0.29% and has achieved an overall performance of + 12.33% in 2017.
Exposure
Axiom Contingent Capital has entered into currency forward contracts with its counterparty Caceis for the purpose of hedging
its portfolio against currency risk associated with foreign currency investments. As of 29 December 2017, the fund was 99.40%
hedged.
The fund was also invested in CDS (credit default swaps) hedges with the following counterparties: BARCLAYS. As of 29
December, the fund was 8.93% exposed through derivatives (especially CDS) and 88.07% exposed through embedded
derivatives (especially AT1).
Performances
Axiom Contingent Capital 2017
Part C 12,33%
Part R 11,78%
Part Z 13,18%
Past performance is no guarantee of future results.
Main portfolio changes during the financial year
Securities Changes (“Accounting currency”)
Acquisitions Disposals
UNION + SI.3 DEC 7,078,651.59 10,654,916.72
BPCE 6.117% PERP EMTN 2,055,000.00 2,000,000.00
AXA SA TF/TV PERP. 2,037,050.00 2,000,000.00
BANK OF NOVA SCOTIA TORONTO 4.65% PERP 1,700,463.38 1,706,578.69
HSBC HOLDINGS PLC 5.25% PERP 1,991,200.00 1,343,327.50
INTESA SANPAOLO 7.75% PERP 2,000,000.00 1,287,500.00
STANDARD CHARTERED PLC 7.75% PERP 2,197,067.39 1,036,952.17
NATIXIS 6.307% PERP 1,530,000.00 1,500,000.00
RAIFFEISEN BANK INTERNATIONAL AG 6.125% PERP 2,000,000.00 1,005,200.00
UNICREDIT SPA 6.625% PERP 1,650,000.00 1,057,827.50

16
• EFFICIENT PORTFOLIO MANAGEMENT TECHNIQUES AND DERIVATIVE INSTRUMENTS
a) Exposure obtained through efficient portfolio management techniques and derivative instruments
• Exposure obtained through efficient portfolio management techniques:
o Securities lending:
o Securities borrowing:
o Reverse repurchase agreements: o Repurchase agreements:
• Underlying exposure obtained through derivative instruments: 18,362,586.03
o Currency derivatives: 15,323,750.76
o Futures: 2,904,835.27
o Options: 134,000.00
o Swaps:
b) Identity of the counterparty(ies) to the efficient portfolio management techniques and derivative
instruments
Efficient portfolio management techniques Derivative instruments (*)
CACEIS BANK (FRANCE)
(*) Except listed derivatives.
ESMA
17
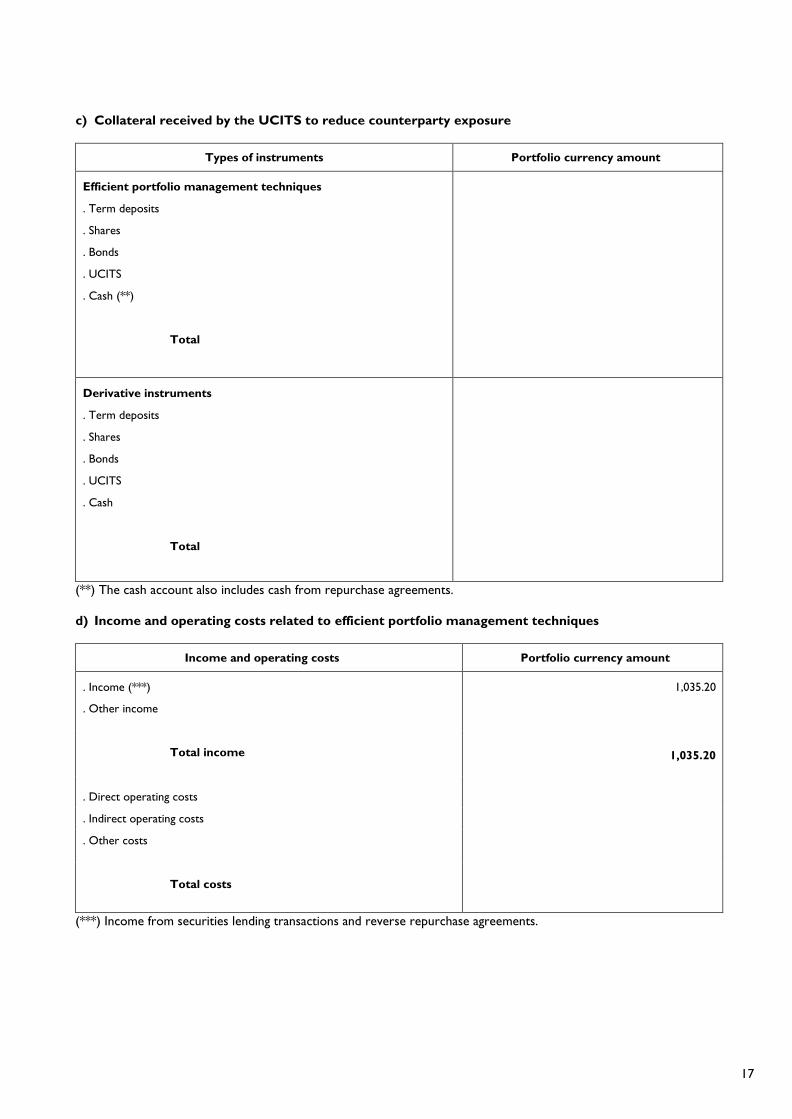
c) Collateral received by the UCITS to reduce counterparty exposure
Types of instruments Portfolio currency amount
Efficient portfolio management techniques
. Term deposits
. Shares
. Bonds
. UCITS
. Cash (**)
Total
Derivative instruments
. Term deposits
. Shares
. Bonds
. UCITS
. Cash
Total
(**) The cash account also includes cash from repurchase agreements.
d) Income and operating costs related to efficient portfolio management techniques
Income and operating costs Portfolio currency amount
. Income (***) 1,035.20
. Other income
Total income
1,035.20
. Direct operating costs
. Indirect operating costs
. Other costs
Total costs
(***) Income from securities lending transactions and reverse repurchase agreements.

18
• TRANSPARENCY OF SECURITIES FINANCING TRANSACTIONS AND OF REUSE (SFTR
REGULATION), in the accounting currency of the Fund (EUR)
Securities
lending Securities
borrowing Repurchase
agreements Reverse
repurchase
agreements
TRS
a) Securities and commodities on loan
Amount
% of net assets*
*% excluding cash and cash equivalents
b) Assets engaged in each type of SFT and TRS expressed as an absolute amount
Amount
% of net assets
c) Top 10 issuers of collateral received (excluding cash) for all types of financing transactions
d) Top 10 counterparties in terms of absolute value of assets and liabilities without netting
e) Type and quality of collateral
Type
- Shares
- Bonds
- Collective investment undertakings
- Transferable debt securities
- Cash
Rating
f) Settlement and clearing of contracts
Tri-party
Central counterparty
Bilateral X X
g) Maturity tenor of the collateral broken down in the following maturity buckets
Less than 1 day
1 day to 1 week
1 week to 1 month
1 to 3 months
3 months to 1 year
Above 1 year
Open maturity

19
Securities
lending Securities
borrowing Repurchase
agreements Reverse
repurchase
agreements
TRS
h) Maturity tenor of SFTs and TRS broken down in the following maturity buckets
Less than 1 day
1 day to 1 week
1 week to 1 month
1 to 3 months
3 months to 1 year
Above 1 year
Open maturity
i) Data on reuse of collateral
Maximum amount (%)
Used amount (%)
Income received by the Fund
from reinvestment of euro-
denominated cash collateral
j) Data on safekeeping of collateral received by the Fund
Caceis Bank
Securities
Cash
k) Data on safekeeping of collateral granted by the Fund
Securities
Cash
l) Breakdown of data on income and costs
Income
- Fund 1,035.20
- Fund manager
- Third parties
Costs
- Fund
- Fund manager
- Third parties
e) Data on type and quality of collateral
Axiom Alternative Investments endeavours to only accept securities with a high credit quality and to enhance the
value of its collateral by applying valuation discounts to the securities received.
This system is regularly reviewed and updated.
1. i) Data on reuse of collateral
Cash collateral received is reinvested in the following five vehicles:
o Short-term money market UCITS (as defined by ESMA in its Guidelines on ETFs and other UCITS issues)
o Deposits

20
o High-quality long-term government bonds
o High-quality short-term government bonds
o Reverse repurchase agreements
The maximum reuse amount is 0% for securities and 100% of the amount received for cash. The amount used is 0% for
securities and 100% for cash received.
k) Data on safekeeping of collateral granted by the Fund
Axiom Alternative Investments endeavours to work with a small number of custodians, selected to ensure proper
safekeeping of the securities and cash received.
l) Breakdown of data on income and costs
Any income from securities financing transactions, net of operating costs, shall be returned to the Fund.
Repurchase agreements and securities lending transactions are entered into with market counterparties, with Axiom
Alternative Investments acting as intermediary.

21
• PROCEDURE FOR SELECTING AND ASSESSING INTERMEDIARIES AND COUNTERPARTIES
The Management Company selects brokers and counterparties according to a specific process in compliance with
applicable regulations, including the provisions of Article 322-50 of the General Regulation of the French Financial
Markets Authority (Autorité des marchés financiers, AMF). As part of this selection process, the Management Company
complies at all times with its ‘best execution’ obligation. The objective selection criteria used by the Management
Company are, among others, the quality of order execution, the fees charged and the financial solidity of each broker
or counterparty.
• VOTING POLICY
The voting rights attached to securities held by the Fund are exercised by the Management Company, which has exclusive
authority to make decisions, in accordance with applicable regulations.
The voting policy of the Management Company is available at its registered office, in accordance with Article 322-75 of
the AMF General Regulation.
• ENVIRONMENTAL, SOCIAL AND CORPORATE GOVERNANCE CRITERIA (ESG CRITERIA)
Since 1 July 2012, the information relating to the implementation of Environmental, social and corporate governance
criteria (ESG criteria) has been available on the website www.axiom-ai.com and included in the annual report.
The investment selection process does not systematically or simultaneously take into account all ESG criteria.
• CALCULATION METHOD FOR GLOBAL EXPOSURE
The Management Company uses the commitment approach to calculate the Fund’s global exposure to financial contracts.
• REMUNERATION POLICY
1. Introduction
The remuneration policy implemented by Axiom AI is consistent with the risks to which it may be exposed.
The principles adopted are not conducive to risk-taking at the expense of clients’ interests. Remuneration is individual
and negotiated on signing of the contract by Axiom’s management.
Depending on the position and the level of responsibility, the total remuneration package is composed of a fixed element
and a variable element:
- the fixed element remunerates the candidate’s expertise, experience, qualifications and involvement in the tasks
assigned
- the variable element remunerates quantitative and/or qualitative performance measured based on observed results
and individual assessments, against the objectives set. It is determined according to the market (local and/or
industry-level), results achieved by the business and performance against objectives. It does not constitute a right
and is fixed each year in accordance with the remuneration policy for the year in question and the governance
principles in force. Objectives are set individually and/or collectively, based on qualitative and quantitative criteria.
They are discussed and validated with the employee concerned and with the management
Employee remuneration is reviewed every year by the senior management based on annual evaluations conducted by
line managers.
This policy is documented and is an integral part of the company’s set of internal policies. It is updated annually to take
into account any regulatory changes.
The 16 “general” principles appearing in Annex II of the AIFM Directive will be complied with by Axiom AI.
2. Governance and creation of a Remuneration Committee
The management company declares that it complies with I, 3) of Article 314-85-2 of the AMF’s General Regulation
relating to governance of remuneration.
4. REGULATED INFORMATION

22
Since the company applies the principle of proportionality, it does not need to create the Remuneration Committee
referred to in I, 3) of Article 314-85-2 of the AMF’s General Regulation. As in the example given in the ESMA guidelines,
the asset management company can do so because it manages portfolios of UCITS whose value does not exceed
€1.25 billion and does not have more than 50 employees, including those dedicated to the management of AIFs and the
provision of services mentioned in Article 6(3) a) and b) of the UCITS Directive (discretionary management and non-
core services).
3. Persons identified as affected
Identified persons comprise all members of the Management Board, most of whom occupy operational positions, which
also fall within the category of “identified persons”.
Also falling within the category of “identified persons” are the Head of Compliance and Internal Control-Secretary
General (Chief Compliance Officer), the Risk Controller and the portfolio managers.
No employee receives variable remuneration that is flat-rate and discretionary and that is included in their employment
contract. For new hires, any such variable remuneration would only be provided for in the employment contract with
respect to the first year following recruitment.
i) Identified persons responsible for risk management and compliance functions
The variable remuneration (excluding the company savings scheme) paid to persons responsible for risk management
and compliance functions is determined independently of the performance of the UCITS. It reflects the individual
performance of the person, i.e. their ability to achieve the objectives set in advance by their line manager, which
necessarily include the effectiveness of risk management with special regard to continuous monitoring and the
assessment of the company’s overall remuneration policy. It is also determined by taking into consideration the overall
financial position of the company.
ii) Identified persons who are not responsible for risk management and compliance functions
The variable remuneration (excluding the company savings scheme) paid to identified persons who are not
responsible for risk management and compliance functions is determined as a result of a multifactorial assessment.
The following are thus taken into account:
• individual performance and behaviour
• the performance of the UCITS managed or the operational unit in question
• the company’s financial profitability
In addition, this category of staff may be granted a guaranteed variable remuneration only at the time of hiring and for
a maximum of one year.
4. Methods of payment of variable remuneration
The variable component of the remuneration allocated to the identified person reflects sustained risk-adjusted
performance.
If the gross variable remuneration granted to an employee identified as a risk-taker is greater than €100,000 and
represents more than 30% of their annual fixed remuneration, Axiom will apply the rules outlined below to the full
amount of the corresponding variable remuneration.
Variable remuneration is paid to risk-takers based on two principles provided for by the regulations:
- A deferral principle for the payment, which is structured as follows:
• 60% of variable remuneration paid at the end of the accrual period (before the end of the 4th month
following the end of the financial year),
• 40% deferred over 3 years (1/3 per year, after a retention period of one year). In the case of a variable
component of a particularly high amount, at least 60% of the amount is deferred.
- Payment of 50% of the variable component in cash and the remaining 50% consisting of:
• Fund shares (the fund(s) to which variable remuneration relates),
• Or cash linked to one or two funds that are representative of the potential beneficiary’s individual activities.
Based on the combination of these two principles, variable remuneration will be paid as follows:
- 60% payable immediately in cash
- 40% deferred over 3 years
• Fund shares (the fund(s) to which variable remuneration relates),

23
• Or cash linked to one or two funds that are representative of the potential beneficiary’s individual activities.
5. Risk alignment
Axiom has not established a discretionary pensions policy (including on departure).
Axiom has not established a system allowing the granting of golden parachutes, and does not intend to pay this type of
compensation.
The deferred cash component of the variable remuneration may be adjusted downwards by up to 100% of its amount
if, on the theoretical payment date, any of the conditions below are met:
• The operating profit posted by Axiom with respect to the previous financial year is negative;
• The average assets under management have dropped by more than 50% with respect to the previous financial year;
• The average annual return on UCITS units as posted with respect to the financial year preceding the acquisition
is less than -30%.
As of this date, the management company has not established any policy on discretionary pensions payable in cash or
in financial instruments and prohibits any type of hedging of the variations in remuneration resulting from payment
instruments.
6. Reporting
Axiom declares that it complies with and has implemented all measures necessary for compliance with reporting
requirements, as provided for in Articles 411-107, 411-113 and 411-121 of the AMF’s General Regulation and Article 33
as well as annexes XIII and XIV of the AMF’s Instruction No. 2011-19.
7. Declaration of compliance
The asset management company declares that it complies with points 1 to 12 and 16 to 18 of I of Article 314-85-2 of
the AMF’s General Regulation.
8. Control of compliance of the policy and updating procedure
This policy is documented and is an integral part of the company’s set of internal policies. It is updated annually to take
into account any regulatory changes.
The remuneration policy follows the recommendations of the AMF (French Financial Markets Authority) and industry
associations and integrates the new standards introduced by the AIFM Directive, subject to the application of the
principle of proportionality.
The balance between fixed and variable remuneration is compliant. The criteria for variable remuneration are based on
both collective and individual performance. The policy does not encourage risk taking by the persons concerned and
avoids any attempt to circumvent regulations.
Its compliance is controlled annually by the senior management and the Head of Compliance and Internal Control, especially
- compliance with due diligence procedures;
- decisions taken relating to remuneration, by the Remuneration Committee;
- checking that the remuneration policy is updated on an annual basis.
9. Quantitative data on the remuneration policy required by AMF Instruction 2011-20
Quantitative data on the remuneration policy required by AMF Instruction 2011-20.
The total amount of remuneration (excluding corporate officers) paid by the company Axiom Alternative
Investments to its staff for the financial year 2017 was €1,153,000, including €676,000 of fixed remuneration and
€477,000 of variable remuneration and there were 12 beneficiaries. The total amount of remuneration of management
(including corporate officers) and staff members of Axiom AI whose actions had a significant impact on the risk
profile of the Company during the period amounted to €2,104,202.
10. Regulatory References
Directive 2009/65/EC (consolidated),
Article L.533-22-2 of the French Monetary and Financial Code,
Article 314-85-2 of the AMF’s General Regulation,
UCITS Guidelines V for asset management companies,
ESMA Guidelines on remuneration.

24
• OTHER INFORMATION
Investors may obtain copies of the Fund’s prospectus, latest annual and interim reports within one week by written
request to:
Axiom Alternative Investments
39, Avenue Pierre 1er de Serbie,
75008 Paris, France

25
5. AUDITOR’S OPINION ON THE FINANCIAL STATEMENTS

PricewaterhouseCoopers Audit, 63, rue de Villiers, 92208 Neuilly-sur-Seine Cedex, France Tel: +33 (0) 1 56 57 58 59, F: +33 (0) 1 56 57 58 60, www.pwc.fr A firm of chartered accountants registered with the Registered Accountants Association of Paris, Île-de-France region. An audit firm affiliated to the regional entity of
Versailles. A French simplified joint-stock company (SAS) with a share capital of €2,510,460. Registered office: 63, rue de Villiers, 92200 Neuilly-sur-Seine, France.
Registered in the Nanterre Trade and Companies Register (RCS) under No. 672 006 483. Intra-community VAT No. FR 76 672 006 483. SIRET code: 672 006 483 00362.
APE code: 6920 Z. Offices: Bordeaux, Grenoble, Lille, Lyon, Marseille, Metz, Nantes, Nice, Paris, Poitiers, Rennes, Rouen, Strasbourg, Toulouse.
STATUTORY AUDITOR’S REPORT ON THE ANNUAL FINANCIAL STATEMENTS Financial year ended 29 December 2017
AXIOM CONTINGENT CAPITAL UCITS ORGANISED AS A FRENCH COLLECTIVE INVESTMENT FUND (FONDS COMMUN DE PLACEMENT, FCP) Governed by the French Monetary and Financial Code
Management Company AXIOM ALTERNATIVE INVESTMENTS 39, Avenue Pierre 1er de Serbie, 75008 Paris, France
Opinion
In compliance with the assignment entrusted to us by the management company, we have audited the annual financial statements of AXIOM CONTINGENT CAPITAL, a UCITS organised as a French FCP, for the financial year ended 29 December 2017, as appended to this report.
We certify that, in accordance with French accounting rules and principles, these annual financial statements are in due form and sincere, and provide a true and fair view of the transactions of this UCITS organised as a French FCP for the financial year ended and of its financial position and assets and liabilities at the end of the financial year.
Basis for opinion
Auditing standards
We conducted our audit in accordance with the professional standards applicable in France. We believe that the audit evidence we have obtained is sufficient and appropriate to provide a basis for our opinion. Our responsibilities under those standards are further described in the “Auditor’s responsibilities for the audit of the annual financial statements” section of this report.
Independence
We conducted our audit in compliance with the independence rules applicable to us, for the period from 30/12/2016 to the date of our report and, in particular, we did not provide any prohibited services referred to in the French Code of ethics for statutory auditors.

PricewaterhouseCoopers Audit, 63, rue de Villiers, 92208 Neuilly-sur-Seine Cedex, France Tel: +33 (0) 1 56 57 58 59, F: +33 (0) 1 56 57 58 60, www.pwc.fr A firm of chartered accountants registered with the Registered Accountants Association of Paris, Île-de-France region. An audit firm affiliated to the regional entity of
Versailles. A French simplified joint-stock company (SAS) with a share capital of €2,510,460. Registered office: 63, rue de Villiers, 92200 Neuilly-sur-Seine, France.
Registered in the Nanterre Trade and Companies Register (RCS) under No. 672 006 483. Intra-community VAT No. FR 76 672 006 483. SIRET code: 672 006 483 00362.
APE code: 6920 Z. Offices: Bordeaux, Grenoble, Lille, Lyon, Marseille, Metz, Nantes, Nice, Paris, Poitiers, Rennes, Rouen, Strasbourg, Toulouse.
AXIOM CONTINGENT CAPITAL
Key audit matters
In accordance with Articles L.823-9 and R.823-7 of the French Commercial Code relating to the justification of our assessments, we inform you that the key audit matters that, in our professional judgement, were of most significance, related to the appropriateness of the accounting principles applied, the reasonableness of significant estimates and the overall adequacy of the presentation of information in the financial statements.
These matters were addressed in the context of our audit of the annual financial statements as a whole, and in forming our opinion thereon, and we do not provide a separate opinion on these matters relating to the annual financial statements.
Audit of the management report and other documents provided to the shareholders
In accordance with the professional auditing standards applicable in France, we have also performed the specific checks provided for by law.
We have no matters to report as to the fair presentation, and consistency with the annual financial statements, of the information provided in the management report and in the documents sent to the shareholders regarding the Company’s financial position and annual financial statements.

PricewaterhouseCoopers Audit, 63, rue de Villiers, 92208 Neuilly-sur-Seine Cedex, France Tel: +33 (0) 1 56 57 58 59, F: +33 (0) 1 56 57 58 60, www.pwc.fr A firm of chartered accountants registered with the Registered Accountants Association of Paris, Île-de-France region. An audit firm affiliated to the regional entity of
Versailles. A French simplified joint-stock company (SAS) with a share capital of €2,510,460. Registered office: 63, rue de Villiers, 92200 Neuilly-sur-Seine, France.
Registered in the Nanterre Trade and Companies Register (RCS) under No. 672 006 483. Intra-community VAT No. FR 76 672 006 483. SIRET code: 672 006 483 00362.
APE code: 6920 Z. Offices: Bordeaux, Grenoble, Lille, Lyon, Marseille, Metz, Nantes, Nice, Paris, Poitiers, Rennes, Rouen, Strasbourg, Toulouse.
AXIOM CONTINGENT CAPITAL
Responsibilities of management and those charged with governance for the annual financial statements
The management company is responsible for the preparation and fair presentation of these annual financial statements in accordance with French accounting rules and principles and for such internal control as the management company determines is necessary to enable the preparation of annual financial statements that are free from material misstatement, whether due to fraud or error.
In preparing the annual financial statements, the management company is responsible for assessing the Fund’s ability to continue as a going concern, disclosing in those financial statements, as applicable, matters related to going concern and using the going concern basis of accounting unless the management company either intends to liquidate the Fund or to cease operations.
It is the responsibility of the management company to monitor the preparation of financial information and the effectiveness of internal control and risk management systems, and of internal audit, in respect of the procedures on the preparation and processing of accounting and financial information.
The annual financial statements were prepared by the management company.
Auditor’s responsibilities for the audit of the annual financial statements
Audit objective and approach
Our role is to issue a report on the annual financial statements. Our objective is to obtain reasonable assurance about whether the annual financial statements as a whole are free from material misstatement. Reasonable assurance is a high level of assurance, but is not a guarantee that an audit conducted in accordance with professional standards applicable in France will always detect a material misstatement when it exists. Misstatements can arise from fraud or error and are considered material if, individually or in the aggregate, they could reasonably be expected to influence the economic decisions of users taken on the basis of these financial statements.
As specified in Article L. 823-10-1 of the French Commercial Code, our statutory audit does not include assurance on the viability or the quality of management of your Fund.
As part of an audit in accordance with professional standards applicable in France, the auditor exercises professional judgement throughout the audit. The auditor’s responsibilities are also:
• to identify and assess the risks of material misstatement of the annual financial statements, whether due to fraud or error, design and perform audit procedures responsive to those risks, and obtain audit evidence that is sufficient and appropriate to provide a basis for the auditor’s opinion. The risk of not detecting a material misstatement resulting from fraud is higher than for one resulting from error, as fraud may involve collusion, forgery, intentional omissions, misrepresentations, or the override of internal control;

AXIOM CONTINGENT CAPITAL
• to obtain an understanding of internal control relevant to the audit in order to design audit procedures that are appropriate in the circumstances, but not for the purpose of expressing an opinion on the effectiveness of the entity’s internal control;
• to evaluate the appropriateness of accounting policies used and the reasonableness of accounting estimates and related disclosures made by the management company in the annual financial statements.
• to conclude on the appropriateness of the management company’s use of the going concern basis of accounting and, based on the audit evidence obtained, whether a material uncertainty exists related to events or conditions that may cast significant doubt on the Fund’s ability to continue as a going concern. These conclusions are based on the audit evidence obtained up to the date of the auditor’s report. However, future events or conditions may cause the Fund to cease to continue as a going concern. If the auditor concludes that a material uncertainty exists, they are required to draw attention in the auditor’s report to the related disclosures in the annual financial statements or, if such disclosures are not provided or are inadequate, to express a qualified opinion or to disclaim an opinion;
• to evaluate the overall presentation of the annual financial statements and whether the annual financial statements represent the underlying transactions and events in a manner that achieves fair presentation.
Given the time required to obtain certain additional information that we needed to complete our assignment, this report is issued as of its date of electronic signature.
Neuilly-sur-Seine, date of electronic signature
Document authenticated by electronic signature Auditor
PricewaterhouseCoopers Audit Frédéric SELLAM

33
• BALANCE SHEET in EUR
ASSETS
29/12/2017 30/12/2016
Net fixed assets
Deposits
Financial instruments
Equities and similar securities
Traded on a regulated or similar market
Not traded on a regulated or similar market
Bonds and similar securities
Traded on a regulated or similar market
Not traded on a regulated or similar market
Debt securities
Traded on a regulated or similar market
Transferable debt securities
Other debt securities
Not traded on a regulated or similar market
Collective investment undertakings
General-purpose UCITS and AIFs intended for retail investors, and
foreign equivalents
Other funds intended for retail investors, and equivalents from other
EU member states
Listed general-purpose funds intended for professional investors and
equivalents from other EU member states and securitisation vehicles
Unlisted general-purpose funds intended for professional investors and
equivalents from other EU member states and securitisation vehicles
Other non-EU vehicles
Securities financing transactions
Receivables on securities received under a reverse repurchase agreement
Receivables on lent securities
Borrowed securities
Securities transferred under a repurchase agreement
Other securities financing transactions
Financial derivatives
Transactions on a regulated or similar market
Other transactions
Other financial instruments
Receivables
Currency derivatives
Others
Financial assets
Cash
38,610,912.06
36,603,604.08
36,603,604.08
1,986,867.84
1,986,867.84
20,440.14
20,271.14
169.00
17,411,019.74
15,323,750.76
2,087,268.98
1,763,830.85
1,763,830.85
46,344,518.02
41,438,070.16
41,438,070.16
4,784,910.75
4,784,910.75
121,537.11
119,130.00
2,407.11
30,347,784.85
29,606,415.56
741,369.29
4,010,984.91
4,010,984.91
Total assets 57,785,762.65 80,703,287.78
6. ANNUAL FINANCIAL STATEMENTS

34
LIABILITIES
29/12/2017 30/12/2016
Equity
Share capital
Non-distributed net capital gains and losses from prior years (a)
Retained earnings brought forward (a)
Net capital gains and losses for the year (a, b)
Profit for the year (a, b)
Total equity (= amount corresponding to net assets)
Financial instruments
Sales of financial instruments
Securities financing transactions
Payables on securities transferred under a repurchase agreement
Payables on borrowed securities
Other securities financing transactions
Financial derivatives
Transactions on a regulated or similar market
Other transactions
Payables
Currency derivatives
Others
Financial liabilities
Short-term bank loans
Borrowings
38,142,589.85
1,575,114.43
1,845,476.06
41,563,180.34
24,999.45
24,999.45
24,999.45
15,189,282.79
15,161,302.69
27,980.10
1,008,300.07
1,008,300.07
45,848,012.43
1,594,490.93
2,505,023.43
49,947,526.79
749,718.09
749,718.09
121,050.00
628,668.09
30,006,042.90
29,975,432.20
30,610.70
Total liabilities 57,785,762.65 80,703,287.78
(a) Including accruals
(b) Minus any interim distributions for the financial year

35
• OFF-BALANCE SHEET in EUR
29/12/2017 30/12/2016
Hedging transactions
Exposure on a regulated or similar market
Futures contracts
BANCO SANTANDER
EUR GR SG DI 10 1218
EUR GR UNICRD10 1217
GR BCO SA1000 1218
GR BNP 1000 1217
SM BBVA 1000 1217
TY CBOT YST 1 0318
XEUR FGBL BUN 0317
XEUR FGBL BUN 0318
XEUR I3ES INT 1219
Exposure on an OTC market
Options
SNRFIN CDSI S28 5Y C 12/2022 PUT 65
Other exposure
Other transactions
Exposure on a regulated or similar market
Exposure on an OTC market
Credit default swaps
CDS BNP. S11_201221
ITRAXX EUR SUB FINAN
Other exposure
110,000.00
55,000.00
1,033,035.27
1,616,800.00
90,000.00
134,000.00
18,250.00
5,000.00
267,900.00
70,200.00
3,283,000.00
2,000,000.00
11,000,000.00

36
• PROFIT & LOSS ACCOUNT in EUR
29/12/2017 30/12/2016
Income from financial transactions
Income from deposits and financial assets
Income from equities and similar securities
Income from bonds and similar securities
Income from debt securities
Income from (reverse) repurchase agreements
Income from financial derivatives
Other finance income
Total (1)
Expenses on financial transactions
Expenses on (reverse) repurchase agreements
Expenses on financial derivatives
Expenses on financial liabilities
Other finance costs
Total (2)
Profit/(loss) from financial transactions (1 - 2)
Other income (3)
Management fees and provision for depreciation (4)
Net profit/(loss) for the financial year (L. 214-17-1) (1 - 2 + 3 - 4)
Accruals for the financial year (5)
Interim distributions of profits made for the financial year (6)
Profit/(loss) (1 - 2 + 3 - 4 + 5 - 6)
3,029,320.13
1,035.20
3,030,355.33
10,343.38
10,343.38
3,020,011.95
424,916.68
2,595,095.27
-749,619.21
1,845,476.06
64.16
2,576,607.66
2,576,671.82
13,792.12
13,792.12
2,562,879.70
325,162.63
2,237,717.07
267,306.36
2,505,023.43

37
ACCOUNTING RULES AND METHODS
The annual financial statements are presented in the form set out by the French Accounting Standards Authority’s
(ANC) Regulation 2014-01 repealing the French Accounting Regulatory Committee’s (CRC) Regulation 2003-02 as
amended.
General accounting principles apply:
- true and fair view, comparability, going concern,
- accuracy, reliability,
- prudence,
- consistency of accounting methods from one year to another.
The accounting method selected to record income from fixed-income securities is based on accrued interest.
Purchases and sales of securities are recorded exclusive of costs.
The base currency of the portfolio for accounting purposes is the euro.
The financial year lasted 12 months.
Asset valuation rules
Financial instruments are recorded in the accounts using the historical cost method and entered on the balance sheet at
their current value as determined by the last-known market value or, where a market does not exist, by any external
means or by using financial models.
The differences between the current values used for calculating the net asset value and the historical costs of the
securities at the time they are added to the portfolio are recorded in the “valuation differences” account.
Securities that are not denominated in the same currency as the portfolio are valued based on the principle described
below, and then converted into the portfolio currency using the exchange rate on the valuation day.
Deposits:
Deposits with a residual maturity of less than or equal to three months may be valued using the straight-line method.
Equities, bonds and other securities traded on a regulated or similar market:
To calculate the net asset value, equities and other securities traded on a regulated or similar market are valued on the
basis of the last market price of the day.
Bonds and similar securities are valued at the closing price supplied by financial service providers. Interest accrued on
bonds and similar securities is calculated up to the net asset value date.
Equities, bonds and other securities not traded on a regulated or similar market:
Securities not traded on a regulated market are valued under the responsibility of the Management Company using
methods based on the net asset value and yield, taking into consideration the prices used in recent major transactions.
Transferable debt securities:
Transferable debt securities and similar securities that are not traded in significant volumes are valued on the basis of an
actuarial method with the reference rate defined below plus, where applicable, a differential reflecting the issuer’s specific
characteristics:
Transferable debt securities with a maturity of less than or equal to 1 year: Euro interbank offered rate (Euribor);
Transferable debt securities with a maturity exceeding 1 year: Rates of “BTAN” fixed-rate treasury notes with interest
paid annually and “OAT” fungible treasury bonds, with similar maturity dates for longer maturities.
NOTES TO THE FINANCIAL STATEMENTS

38
Transferable debt securities with a residual maturity of less than or equal to 3 months may be valued using the straight-
line method.
Treasury bills are valued on the basis of the market rate published daily by Banque de France.
Shares in collective investment undertakings (CIUs) held:
CIU shares or units will be valued at the last known net asset value.
Securities financing transactions:
Securities received under a reverse repurchase agreement are recorded under the heading “Receivables on securities
received under a reverse repurchase agreement” for the sum provided for in the agreement, plus accrued interest to
be received.
Securities transferred under a repurchase agreement are recorded as securities purchased at their current value.
Payables on securities transferred under repurchase agreements are recorded as securities sold at the value indicated
in the agreement, plus any accrued interest payable.
Lent securities are valued at their current value and are recorded on the asset side of the balance sheet under the
heading “Receivables on lent securities” at the current value, plus accrued interest to be received.
Borrowed securities are recorded on the asset side of the balance sheet under the heading “Borrowed securities” for
the sum indicated in the agreement, and on the liabilities side under the heading “Payables on borrowed securities” for
the sum indicated in the agreement, plus any accrued interest payable.
Financial derivatives:
Financial derivatives traded on a regulated or similar market:
Financial derivatives traded on regulated markets are valued at the settlement price of the day.
Financial derivatives not traded on a regulated or similar market:
Swaps:
Interest rate and/or currency swaps are valued at their market value using the price calculated by discounting future
interest flows at market interest rates and/or exchange rates. This price is adjusted for credit risk.
Index swaps are valued on the basis of an actuarial method with the reference rate provided by the counterparty.
Other swaps are valued at their market value or a value estimated according to the procedures laid down by the
Management Company.
CDSs/CDS options
CDSs are valued based on mathematical models using the credit spread curves provided by Markit.
CDS options are valued based on models approved by the Management Company using market data from specialist
financial information providers. The prices calculated are compared with those supplied by counterparties
Off-balance-sheet commitments:
Futures/forwards are recorded at their market value as off-balance sheet exposure at the price used in the portfolio.
Options are recorded at the equivalent value of underlying assets.

39
Swap exposure is presented at its nominal value, or in the absence of a nominal value, at an equivalent amount.
Management fees
Management fees are calculated upon each valuation based on the net
asset value.
These fees are charged to the Fund’s profit & loss account.
All management fees are paid to the Management Company, which is in turn responsible for paying all the operating
costs of the Funds.
Management fees do not include transaction costs.
The maximum rates applied to the NAV are:
- 0.80% incl. taxes for Share Class C;
- 1.30% incl. taxes for Share Class R;
- 0.05% incl. taxes for Share Class Z.
Operating costs and management fees
These fees cover all expenses charged directly to the Fund with the exception of transaction costs. Transaction costs
include intermediary fees (brokerage, stamp duty, etc.) and transaction fees, if any, which may be charged by the
depositary and the Management Company.
The following fees may be charged in addition to operating costs and management fees:
o transaction fees charged to the Fund, o performance fees. These fees are intended to reward the Management Company if the Fund exceeds its objectives. They are therefore charged to the Fund.
Fees charged to the Fund Calculation base Standard rate
Management fees Net assets Share Class C: maximum 0.80% incl. taxes
Share Class R: maximum 1.30% incl. taxes
Share Class Z: maximum 0.05% incl. taxes
*: Since the Fund invests less than 10% of its assets in other collective investment undertakings, the Management Company is not
required by law to indicate an applicable rate for indirect costs. However, such costs may be charged.
Securities financing transactions: the Management Company does not receive any fees on such transactions.
Appropriation of distributable amounts
Definition of distributable amounts:
Distributable amounts are made up of:
Profit:
The net profit for the year shall be equal to total interest income, arrears, premiums and prizes, dividends, attendance
fees and any income from the securities making up the Fund’s portfolio plus any income from temporary cash holdings,
minus management fees and borrowing costs.
Retained earnings are added, and the balance of accrued income and expenses is added or subtracted from net profit.
Capital gains and losses:
Realised capital gains net of costs, minus capital losses net of costs, recorded during the financial year, plus net capital
gains of the same type recorded during prior financial years which have not been distributed or accumulated, plus or
minus the balance of the capital gains accrual account.

40
Procedures for allocating distributable amounts:
Distributable amounts Share Classes C, R and Z
Appropriation of net profit Accumulation
Appropriation of net realised capital gains or losses Accumulation

41
• CHANGES IN NET ASSETS in EUR
29/12/2017 30/12/2016
Net assets at the beginning of the financial year
49,947,526.79 23,568,798.05
Subscriptions (including subscription fees charged by the Fund)
9,831,195.58 34,471,769.75
Redemptions (after deduction of redemption fees charged by the Fund)
-24,724,511.58 -11,797,312.42
Capital gains realised on deposits and financial instruments
3,662,654.45 675,082.21
Capital losses realised on deposits and financial instruments
-1,477,254.05 -454,522.90
Capital gains realised on financial derivatives
2,713,801.81 4,738,581.79
Capital losses realised on financial derivatives
-1,843,992.92 -4,169,370.63
Transaction costs
-7,287.25 -7,780.15
Foreign exchange differences
-1,436,934.59 126,566.72
Changes in the valuation difference of deposits and financial instruments
1,586,369.31 1,217,480.20
Valuation difference for financial year N
2,704,597.63 1,118,228.32
Valuation difference for financial year N-1
-1,118,228.32 99,251.88
Changes in the valuation difference of financial derivatives
716,517.52 -659,482.90
Valuation difference for financial year N
-9,793.46 -726,310.98
Valuation difference for financial year N-1
726,310.98 66,828.08
Distribution of net capital gains and losses for the previous financial year
Distribution of profits for the previous financial year
Net profit/loss for the financial year before accruals
2,595,095.27 2,237,717.07
Interim distribution(s) of net capital gains and losses made during the financial year
Interim distribution(s) of profits made during the financial year
Other items
Net assets at the end of the financial year
41,563,180.34 49,947,526.79

42
• BREAKDOWN OF FINANCIAL INSTRUMENTS BY LEGAL OR ECONOMIC CLASSIFICATION
Amount %
Assets
Bonds and similar securities
Other bonds (index-linked, titres participatifs [participation certificates])
Fixed-rate bonds traded on a regulated or similar market
Variable- and adjustable-rate bonds traded on a regulated or similar market
Convertible bonds traded on a regulated or similar market
Bonds and similar securities
TOTAL Bonds and similar securities
Debt securities
Debt securities
TOTAL Debt securities
Liabilities
Sales of financial instruments
Equities and similar securities
TOTAL Sales of financial instruments
Off-balance sheet
Hedging transactions
Equity
Others
Interest rate
TOTAL Hedging transactions
Other transactions
Equity
TOTAL Other transactions
888,594.77
33,580,651.42
1,077,059.42
1,057,298.47
36,603,604.08
389,000.00
2,649,835.27
3,038,835.27
2.14
80.79
2.59
2.54
88.07
0.94
6.38
7.31
• BREAKDOWN OF ASSETS, LIABILITIES AND OFF-BALANCE SHEET ITEMS BY TYPE OF RATE
Fixed rate % Variable rate % Adjustable rate
% Others %
Assets
35,526,544.66
85.48
1,077,059.42
2.59
1,763,830.85
4.24
Deposits
Bonds and similar
securities
Debt securities
Securities financing transactions
Financial assets
Liabilities Securities financing transactions
Financial liabilities 1,008,300.07 2.43
Off-balance sheet
Hedging transactions 2,649,835.27 6.38
Other transactions

43
• BREAKDOWN OF ASSETS, LIABILITIES AND OFF-BALANCE SHEET ITEMS BY RESIDUAL
MATURITY
< 3 months %
]3 months - 1 year] % ]1 - 3 years] % ]3 - 5 years] % > 5 years %
Assets
1,763,830.85
4.24
36,603,604.08
88.07
Deposits
Bonds and similar securities
Debt securities
Securities financing transactions
Financial assets
Liabilities
Securities financing transactions
Financial liabilities 1,008,300.07 2.43
Off-balance sheet
Hedging transactions 2,649,835.27 6.38
Other transactions
Positions in interest-rate derivatives are classified based on the maturity of the underlying.
• BREAKDOWN OF ASSETS, LIABILITIES AND OFF-BALANCE SHEET ITEMS BY TRADING
OR VALUATION CURRENCY
USD
Amount %
GBP
Amount %
SEK
Amount %
Other currencies
Amount %
Assets
Deposits
Equities and similar securities
Bonds and similar securities
Debt securities
Collective investment undertakings
Securities financing transactions Receivables
Financial assets
5,913,080.59 14.23 4,909,977.09 11.81 1,077,059.42 2.59
2,737,244.63 6.59 72,428.47 0.17 12,374.63 0.03 20.78
Liabilities
Sales of financial instruments
Securities financing transactions
Payables
Financial liabilities
7,611,592.27
1,008,300.07
18.31
2.43
4,956,908.69 11.93 1,086,812.80 2.61
Off-balance sheet
Hedging transactions
Other transactions
1,033,035.27 2.49

44
• RECEIVABLES AND PAYABLES: BREAKDOWN BY TYPE
Type of payable/receivable 29/12/2017
Receivables
Forward purchases of currency
1,499,000.67
Amounts to be received from a forward sale of currency 13,824,750.09
Deferred payment sales 2,015,528.62
Cash collateral 65,483.69
Cash coupons and dividends 4,996.67
Collateral 1,260.00 Total receivables 17,411,019.74
Payables Forward sales of currency 13,655,313.76
Amounts to be paid for forward purchases of currency 1,505,988.93
Management fees 27,980.10 Total payables 15,189,282.79

45
• NUMBER OF SHARES ISSUED OR REDEEMED
Number of shares Amount
Share Class C 7,199.5688
7,834,556.95 Shares subscribed during the financial year
Shares redeemed during the financial year -19,427.2499 -22,905,811.24 Net balance of subscriptions and redemptions -12,227.6811 -15,071,254.29
Share Class Z 1,760.0000
1,993,640.00 Shares subscribed during the financial year
Shares redeemed during the financial year -1,592.3500 -1,815,666.57 Net balance of subscriptions and redemptions 167.6500 177,973.43
Share Class R 2.5767
2,998.63 Shares subscribed during the financial year
Shares redeemed during the financial year -2.5767 -3,033.77 Net balance of subscriptions and redemptions -35.14
• SUBSCRIPTION AND/OR REDEMPTION FEES
Amount
Share Class Z
Redemption fees charged by the Fund
Subscription fees charged by the Fund
Total fees charged by the Fund
Share Class C
Redemption fees charged by the Fund
Subscription fees charged by the Fund
Total fees charged by the Fund
Share Class R
Redemption fees charged by the Fund
Subscription fees charged by the Fund
Total fees charged by the Fund
• MANAGEMENT FEES
29/12/2017
Share Class C
419,615.19
Guarantee fees Fixed management fees Percentage of fixed management fees 0.80 Variable management fees Retrocessions of management fees Share Class Z
1,410.46
Guarantee fees Fixed management fees Percentage of fixed management fees 0.05 Variable management fees Retrocessions of management fees Share Class R
3,891.03
Guarantee fees Fixed management fees Percentage of fixed management fees 1.30 Variable management fees Retrocessions of management fees

46
• MANAGEMENT FEES
29/12/2017
Share Class E
Guarantee fees
Fixed management fees
Percentage of fixed management fees
Variable management fees
Retrocessions of management fees
• COMMITMENTS RECEIVED AND MADE
Collateral received by the Fund:
None.
Other commitments received and/or made:
None.

47
• CURRENT VALUE OF FINANCIAL INSTRUMENTS UNDER SECURITIES FINANCING
TRANSACTIONS
29/12/2017
Securities received under a reverse repurchase agreement
Borrowed securities
• CURRENT VALUE OF FINANCIAL INSTRUMENTS USED AS COLLATERAL
29/12/2017
Financial instruments given as collateral and kept in their original account
Financial instruments received as collateral and not recorded on the balance
sheet
• GROUP FINANCIAL INSTRUMENTS HELD IN THE PORTFOLIO
ISIN Code Names 29/12/2017
Shares
Bonds
Transferable debt securities
Collective investment undertakings
Financial derivatives
FR0013250412
AXIOM OBLIGATAIRE G
259,005.00
259,005.00

48
• APPROPRIATION OF DISTRIBUTABLE AMOUNTS RELATED TO PROFITS
29/12/2017 30/12/2016
Amounts to be appropriated
Retained earnings
Profit/(loss)
Total
1,845,476.06
1,845,476.06
2,505,023.43
2,505,023.43
29/12/2017 30/12/2016
Share Class Z
136,149.26
124,048.41
Appropriation
Distribution
Retained earnings for the year
Accumulation
Total 136,149.26 124,048.41
29/12/2017 30/12/2016
Share Class C
1,696,954.24
2,368,244.94
Appropriation
Distribution
Retained earnings for the year
Accumulation
Total 1,696,954.24 2,368,244.94
29/12/2017 30/12/2016
Share Class R
12,372.56
12,739.23
Appropriation
Distribution
Retained earnings for the year
Accumulation
Total 12,372.56 12,739.23
29/12/2017 30/12/2016
Share Class E
-9.15
Appropriation
Distribution
Retained earnings for the year
Accumulation
Total -9.15
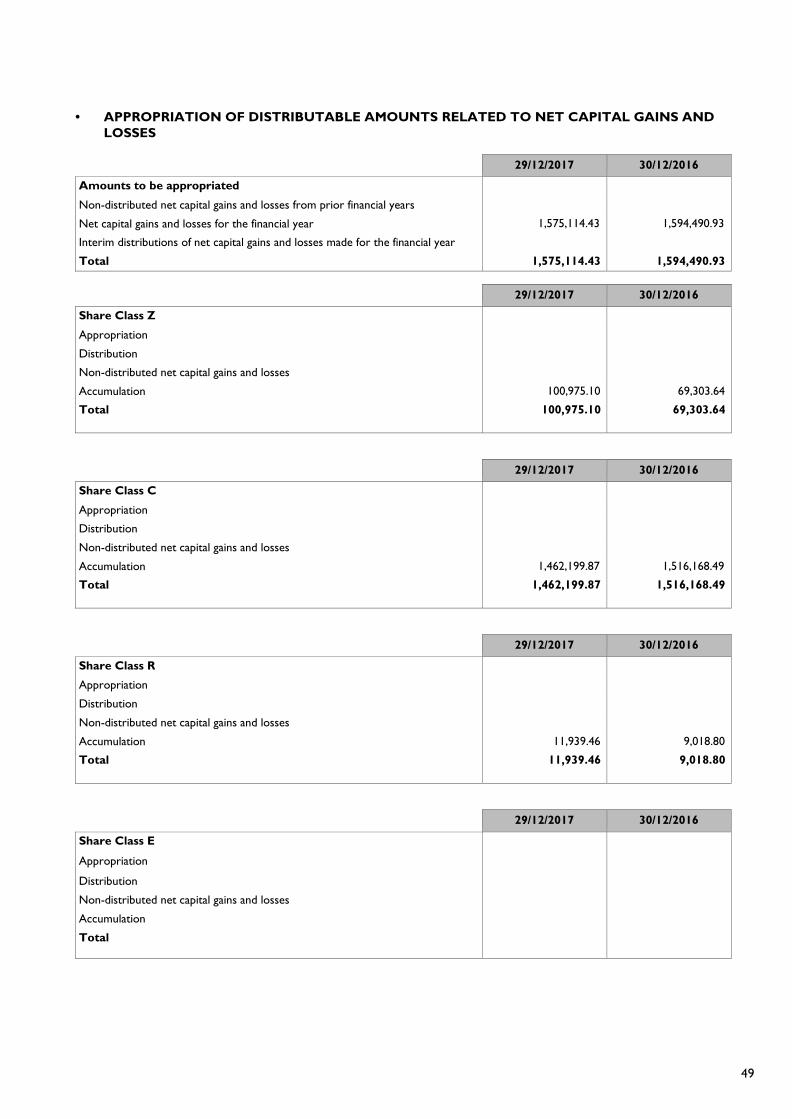
49
• APPROPRIATION OF DISTRIBUTABLE AMOUNTS RELATED TO NET CAPITAL GAINS AND
LOSSES
29/12/2017 30/12/2016
Amounts to be appropriated
1,575,114.43
1,594,490.93
Non-distributed net capital gains and losses from prior financial years
Net capital gains and losses for the financial year
Interim distributions of net capital gains and losses made for the financial year Total 1,575,114.43 1,594,490.93
29/12/2017 30/12/2016
Share Class Z
100,975.10
69,303.64
Appropriation
Distribution
Non-distributed net capital gains and losses
Accumulation
Total 100,975.10 69,303.64
29/12/2017 30/12/2016
Share Class C
1,462,199.87
1,516,168.49
Appropriation
Distribution
Non-distributed net capital gains and losses
Accumulation
Total 1,462,199.87 1,516,168.49
29/12/2017 30/12/2016
Share Class R
11,939.46
9,018.80
Appropriation
Distribution
Non-distributed net capital gains and losses
Accumulation
Total 11,939.46 9,018.80
29/12/2017 30/12/2016
Share Class E
Appropriation
Distribution
Non-distributed net capital gains and losses
Accumulation
Total

50
• OVERVIEW OF RESULTS AND OTHER SIGNIFICANT ITEMS FOR THE ENTITY OVER THE
PAST 5 FINANCIAL YEARS
31/12/2015 30/12/2016 29/12/2017
Total net asset value in EUR 23,568,798.05 49,947,526.79 41,563,180.34
Axiom Contingent Capital C
Net asset value in EUR 22,909,295.06 47,481,072.84 38,576,183.08
Number of shares 22,206.6407 44,182.5154 31,954.8343
Net asset value per share in EUR 1,031.64 1,074.65 1,207.20
Accumulation of net capital gains
and losses per share in EUR -2.13 34.31 45.75
Accumulation of profit per share
in EUR 36.64 53.60 53.10
Axiom Contingent Capital Z
Net asset value in EUR 50,058.01 2,185,262.04 2,672,685.10
Number of shares 50.0000 2,079.3500 2,247.0000
Net asset value per share in EUR 1,001.16 1,050.93 1,189.44
Accumulation of net capital gains
and losses per share in EUR 0.43 33.32 44.93
Accumulation of profit per share
in EUR 2.06 59.65 60.59
Axiom Contingent Capital R
Net asset value in EUR 103,291.05 281,191.91 314,312.16
Number of shares 100.0000 262.6292 262.6292
Net asset value per share in EUR 1,032.91 1,070.68 1,196.79
Accumulation of net capital gains
and losses per share in EUR -4.30 34.34 45.46
Accumulation of profit per share
in EUR 32.08 48.50 47.11
Axiom Contingent Capital E
Net asset value in GBP 373,060.75
Number of shares 360.0000
Net asset value per share in GBP 1,036.27
Accumulation of net capital gains
and losses per share in EUR 31.40
Accumulation of profit per share
in EUR 50.83

51
• INVENTORY in EUR
Name of the security Currency Qty, number or
nominal value Current value
% of net
assets
Bonds and similar securities
Bonds and similar securities traded on a regulated or similar
market
AUSTRALIA
QBE INSURANCE GROUP LTD 5.25% PERP USD 500,000 427,300.20 1.03 TOTAL AUSTRALIA 427,300.20 1.03
AUSTRIA
ERSTE GROUP BANK AG 6.5% PERP EUR 600,000 705,933.43 1.70 RAIFFEISEN BANK INTERNATIONAL AG 6.125% PERP EUR 1,000,000 1,087,467.12 2.61
TOTAL AUSTRIA 1,793,400.55 4.31
DENMARK
DANSKE BANK AS 6.125% HYB FIX/VAR PERP USD 900,000 812,685.61 1.95 JYSKE BANK DNK 4.75% PERP EUR 700,000 729,537.49 1.76
TOTAL DENMARK 1,542,223.10 3.71
SPAIN
BANCO BILBAO VIZCAYA ARGENTARIA SA 5.875% PERP
EUR
400,000
437,026.35
1.05 BANCO DE SABADELL SA 6.125% PERP EUR 400,000 412,629.62 0.99 BANCO DE SABADELL SA 6.5% PERP EUR 400,000 423,262.00 1.02 BANCO SANTANDER SA 5.25% PERP EUR 1,400,000 1,480,218.83 3.57 BANKIA SA 6.0% PERP EUR 1,000,000 1,062,564.35 2.56 BBVA 7% PERP EUR 400,000 425,139.91 1.02 CAIXABANK SA 6.75% PERP EUR 600,000 670,180.50 1.61
TOTAL SPAIN 4,911,021.56 11.82
UNITED STATES OF AMERICA
DEUTSCHE BANK CAP 8% 15/05/2018
EUR
1,000,000
1,078,598.49
2.60 TOTAL UNITED STATES OF AMERICA 1,078,598.49 2.60
FRANCE
BNP PARIBAS FIX PERP
EUR
700,000
812,021.40
1.95 CASA 6.50% PERP EUR 500,000 568,038.06 1.37 SG 6.75% 31/12/2099 EUR 1,000,000 1,139,528.68 2.74
TOTAL FRANCE 2,519,588.14 6.06
ITALY
INTESA SAN 7.0% PERP EMTN
EUR
1,400,000
1,596,821.13
3.84 INTESA SANPAOLO 7.75% PERP EUR 800,000 1,004,900.17 2.42 UNICREDIT SPA FIX PERP EUR 200,000 244,283.55 0.59 UNICREDIT SPA 6.625% PERP EUR 600,000 656,266.03 1.58 UNICREDIT SPA 6.75% PERP EUR 1,200,000 1,323,184.04 3.18
TOTAL ITALY 4,825,454.92 11.61
NETHERLANDS
ASR NEDERLAND NV 10.0% PERP
EUR
1,000,000
1,199,764.11
2.89 ASR NEDERLAND NV 4.625% PERP EUR 800,000 857,173.27 2.06 ING GROEP NV 6.0% PERP USD 500,000 437,667.95 1.05 NIBC BANK NV 6.0% PERP EUR 750,000 791,025.62 1.90 RABO NEDE 5.5% PERP EUR 1,000,000 1,086,835.49 2.61 STICH AK RABOBK 6,5%13-PERP. EUR 1,300,000 1,614,381.89 3.89
TOTAL NETHERLANDS 5,986,848.33 14.40

52
Name of the security Currency Qty, number or
nominal value Current value
% of net
assets
UNITED KINGDOM
BARCLAYS PLC 5.875% PERP GBP 400,000 457,337.11 1.10 BARCLAYS PLC 6.5% 31-12-99 EUR 600,000 644,544.00 1.55 BARCLAYS PLC 7.125% PERP GBP 500,000 618,751.14 1.49 BARCLAYS 7.875% PERP GBP 600,000 756,674.08 1.82 COVE BUIL SOC 6.375% 31-12-99 GBP 1,000,000 1,187,691.78 2.86 DIRECT LINE INSURANCE PLC 4.75% PERP GBP 550,000 627,267.89 1.51 HSBC HOLDINGS PLC 4.75% PERP EUR 500,000 543,265.46 1.31 HSBC HOLDINGS PLC 5.25% PERP EUR 750,000 842,751.01 2.03 HSBC HOLDINGS PLC 6.0% PERP CV USD 1,200,000 1,057,298.47 2.54 LBG CAPITAL 6,375%09-120520 EUR 600,000 660,713.75 1.59 NATIONWIDE BUILDING SOCIETY 10.25% 31-12-99 GBP 5,000 888,594.77 2.14 ROYAL AND SUN ALLIANCE INSURANCE GROUP P
STIB3R+5.25% PERP SEK 10,000,000 1,077,059.42 2.59
SANTANDER UK PLC 7.375% PERP GBP 300,000 373,660.32 0.90 STAN CHAR PLC 6.5% PERP USD 1,000,000 867,005.80 2.09 STANDARD CHARTERED PLC 7.75% PERP USD 1,200,000 1,115,126.86 2.68
TOTAL UNITED KINGDOM 11,717,741.86 28.20
SWEDEN
NORDEA BANK AB PUBL 3.5% PERP EUR 600,000 605,431.23 1.45 SKANDINAVISKA ENSKILDA BANKEN AB 5.625% PERP USD 400,000 348,078.78 0.84
TOTAL SWEDEN 953,510.01 2.29
SWITZERLAND
CREDIT SUISSE GROUP AG 7.125% PERP USD 400,000 374,240.23 0.90 UBS GROUP AG 6.875% PERP USD 500,000 473,676.69 1.14
TOTAL SWITZERLAND 847,916.92 2.04
TOTAL Bonds and similar securities traded on a
regulated or similar market 36,603,604.08 88.07
TOTAL Bonds and similar securities 36,603,604.08 88.07
Collective investment undertakings
General-purpose UCITS and AIFs intended for
retail investors, and foreign equivalents
FRANCE
AXIOM OBLIGATAIRE G EUR 250 259,005.00 0.62 Premium Multi Stratégies D EUR 435 523,822.65 1.26 UNION + SI.3 DEC EUR 6.3 1,204,040.19 2.90
TOTAL FRANCE 1,986,867.84 4.78
TOTAL General-purpose UCITS and AIFs intended for
retail investors, and foreign equivalents
1,986,867.84
4.78
TOTAL Collective investment undertakings 1,986,867.84 4.78
Financial derivatives
Exposure to futures/forwards
Exposure to futures (regulated or similar market)
EUR GR SG DI 10 1218 EUR -50 -2,500.00 -0.01 GR BCO SA1000 1218 EUR -250 -5,083.60 -0.01 TY CBOT YST 1 0318 USD -10 6,571.14 0.02 XEUR FGBL BUN 0318 EUR -10 13,700.00 0.03

53
Name of the security Currency Qty, number or
nominal value Current value
% of net
assets
XEUR FGBL BUN 0317 EUR -500 -1,250.00
TOTAL Exposure to futures (regulated or similar
market) 11,437.54 0.03
TOTAL Exposure to futures/forwards 11,437.54 0.03
Exposure to options
Exposure to OTC options
SNRFIN CDSI S28 5Y C 12/2022 PUT 65 EUR 10,000,000 169.00 TOTAL Exposure to OTC options 169.00
TOTAL Exposure to options 169.00
TOTAL Financial derivatives 11,606.54 0.03
Margin calls
C.A.Indo margin calls in USD USD -7,890.55 -6,571.08 -0.02
C.A.Indo margin calls in EUR EUR -9,594.77 -9,594.77 -0.02
TOTAL Margin calls -16,165.85 -0.04
Receivables 17,411,019.74 41.89
Payables -15,189,282.79 -36.55
Financial assets/liabilities 755,530.78 1.82
Net assets 41,563,180.34 100.00
Axiom Contingent Capital Z EUR 2,247.0000 1,189.44
Axiom Contingent Capital C EUR 31,954.8343 1,207.20
Axiom Contingent Capital R EUR 262.6292 1,196.79
Axiom Contingent Capital E GBP