annual report - avation · annual report 2016 2 aircraft type in operation ordered options atr...
TRANSCRIPT
ANNUAL REPORT
2016

Annual Report 2016
2
Aircraft Type In Operation Ordered Options
ATR 72-500 6 - -
ATR 72-600 18 9 27
Airbus A320-200 3 - -
Airbus A321-200 6 3 -
Fokker 100 5 - -
Total 38 12 27
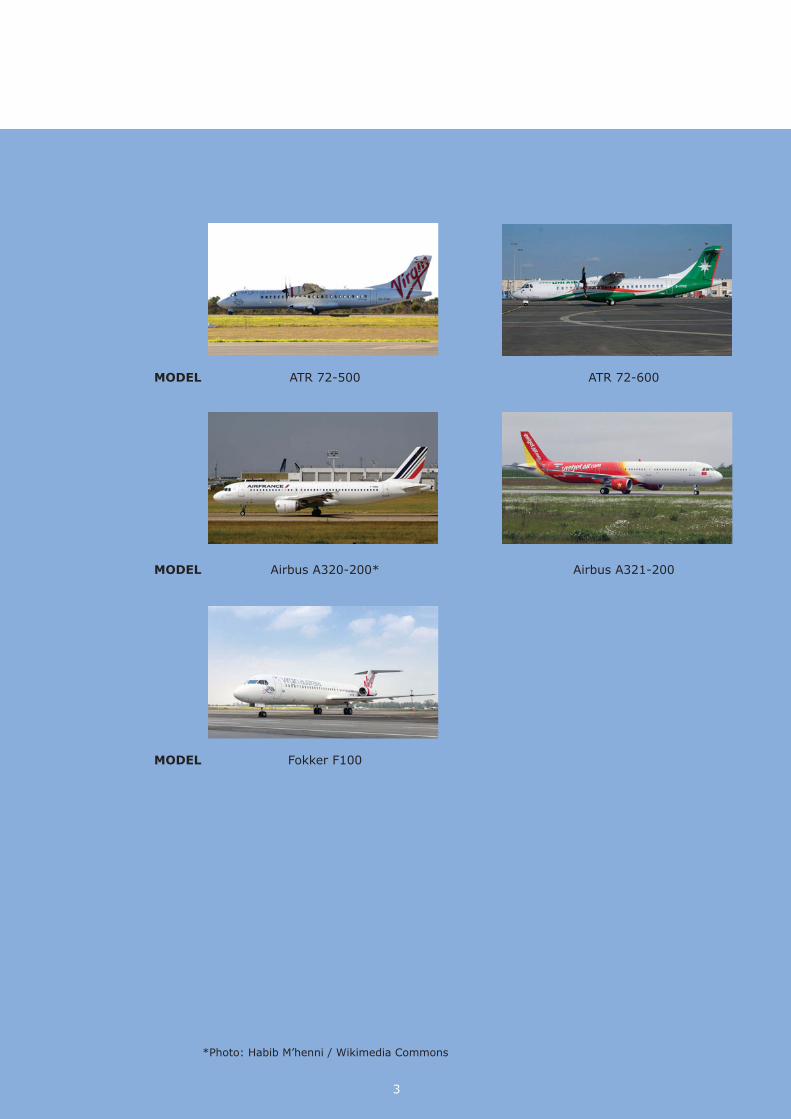
OUR FLEET
3
*Photo: Habib M’henni / Wikimedia Commons
MODEL ATR 72-500 ATR 72-600
MODEL Airbus A320-200* Airbus A321-200
MODEL Fokker F100

Annual Report 2016
4
COMPANY INFORMATION
DIRECTORS: Robert Jeffries Chatfi eld
Roderick Douglas Mahoney
Stephen John Fisher
COMPANY SECRETARIES: Duncan Gerard Stephen Scott
Jason Francis Gollogly
REGISTERED OFFICE: 5 Fleet Place
London EC4M 7RD
United Kingdom
PRINCIPAL PLACE OF BUSINESS: 65 Kampong Bahru Road
Singapore 169370
AUDITORS: Kingston Smith LLP
Devonshire House
60 Goswell Road
London EC1M 7AD
United Kingdom
SOLICITORS: Charles Russell Speechlys LLP
5 Fleet Place
London EC4M 7RD
United Kingdom
REGISTRARS: Computershare Investor Services LLC
The Pavilions
Bridgewater Road
Bristol BS99 6ZZ
United Kingdom
5
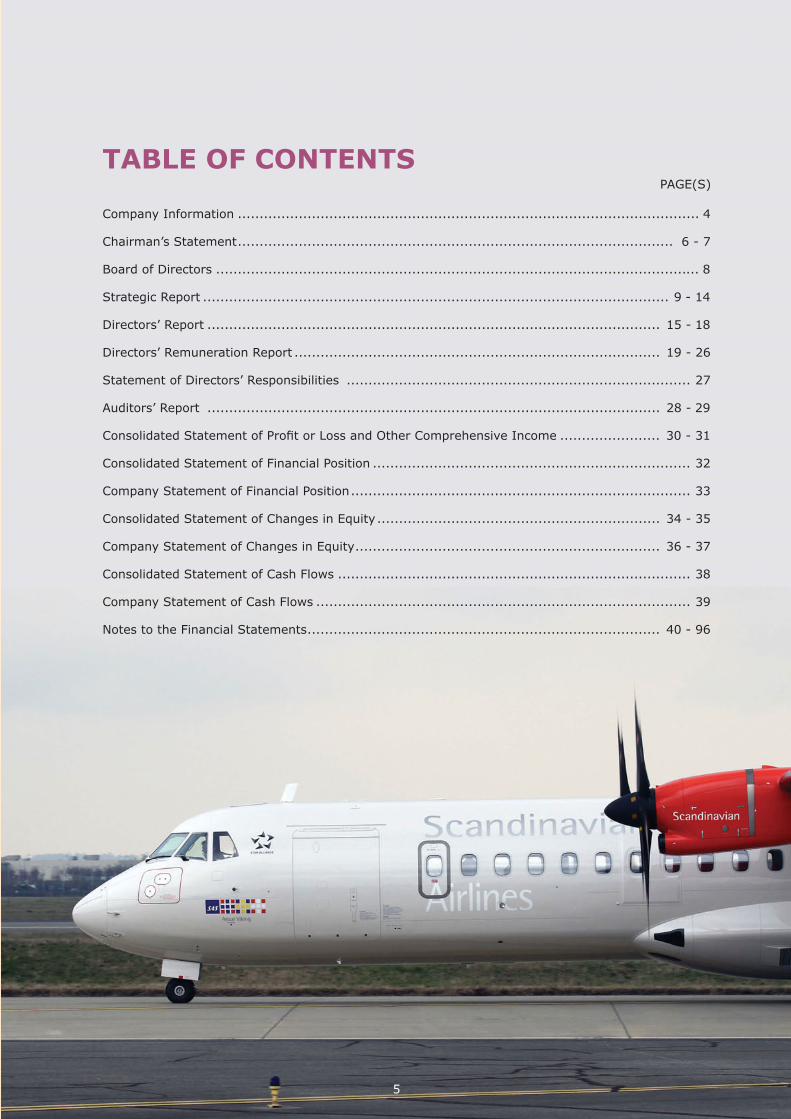
TABLE OF CONTENTS PAGE(S)
Company Information .......................................................................................................... 4
Chairman’s Statement .................................................................................................... 6 - 7
Board of Directors ............................................................................................................... 8
Strategic Report ........................................................................................................... 9 - 14
Directors’ Report ........................................................................................................ 15 - 18
Directors’ Remuneration Report .................................................................................... 19 - 26
Statement of Directors’ Responsibilities ............................................................................... 27
Auditors’ Report ........................................................................................................ 28 - 29
Consolidated Statement of Profi t or Loss and Other Comprehensive Income ....................... 30 - 31
Consolidated Statement of Financial Position ......................................................................... 32
Company Statement of Financial Position .............................................................................. 33
Consolidated Statement of Changes in Equity ................................................................. 34 - 35
Company Statement of Changes in Equity ...................................................................... 36 - 37
Consolidated Statement of Cash Flows ................................................................................. 38
Company Statement of Cash Flows ...................................................................................... 39
Notes to the Financial Statements ................................................................................. 40 - 96
Annual Report 2016
6
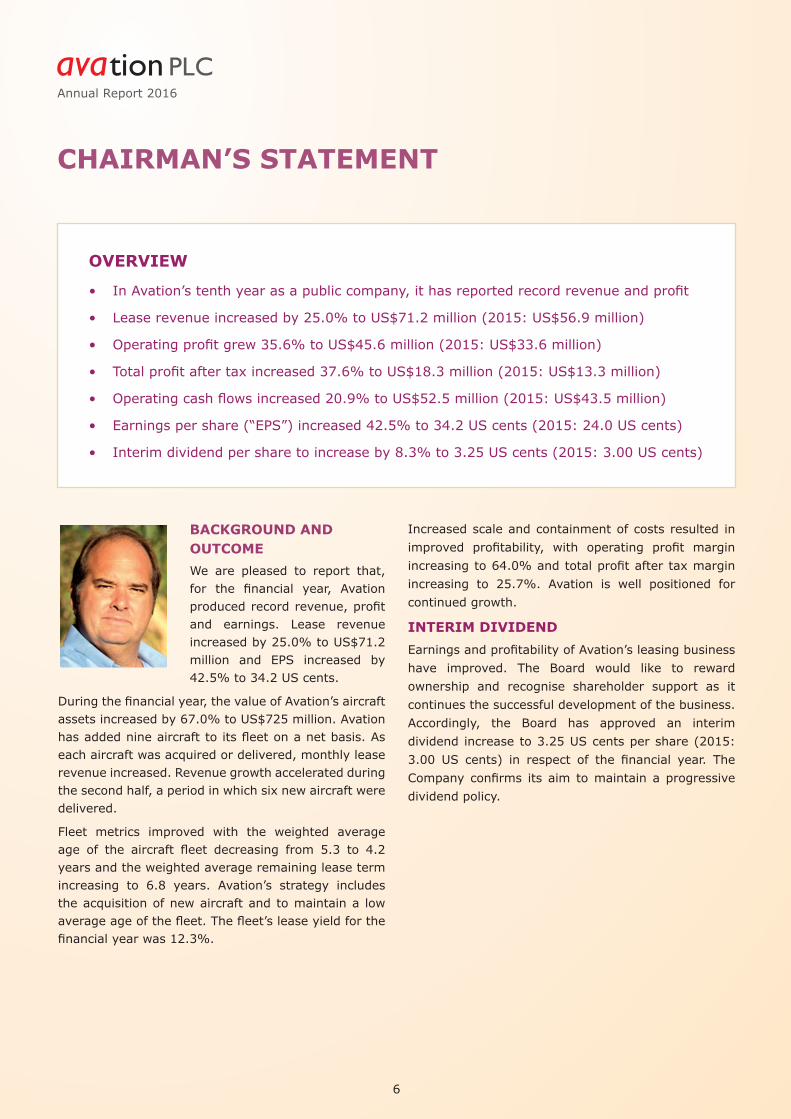
CHAIRMAN’S STATEMENT
BACKGROUND AND OUTCOMEWe are pleased to report that, for the fi nancial year, Avation produced record revenue, profi t and earnings. Lease revenue increased by 25.0% to US$71.2 million and EPS increased by 42.5% to 34.2 US cents.
During the fi nancial year, the value of Avation’s aircraft assets increased by 67.0% to US$725 million. Avation has added nine aircraft to its fl eet on a net basis. As each aircraft was acquired or delivered, monthly lease revenue increased. Revenue growth accelerated during the second half, a period in which six new aircraft were delivered.
Fleet metrics improved with the weighted average age of the aircraft fl eet decreasing from 5.3 to 4.2 years and the weighted average remaining lease term increasing to 6.8 years. Avation’s strategy includes the acquisition of new aircraft and to maintain a low average age of the fl eet. The fl eet’s lease yield for the fi nancial year was 12.3%.
Increased scale and containment of costs resulted in improved profi tability, with operating profi t margin increasing to 64.0% and total profi t after tax margin increasing to 25.7%. Avation is well positioned for continued growth.
INTERIM DIVIDENDEarnings and profi tability of Avation’s leasing business have improved. The Board would like to reward ownership and recognise shareholder support as it continues the successful development of the business. Accordingly, the Board has approved an interim dividend increase to 3.25 US cents per share (2015: 3.00 US cents) in respect of the fi nancial year. The Company confi rms its aim to maintain a progressive dividend policy.
OVERVIEW
• In Avation’s tenth year as a public company, it has reported record revenue and profi t
• Lease revenue increased by 25.0% to US$71.2 million (2015: US$56.9 million)
• Operating profi t grew 35.6% to US$45.6 million (2015: US$33.6 million)
• Total profi t after tax increased 37.6% to US$18.3 million (2015: US$13.3 million)
• Operating cash fl ows increased 20.9% to US$52.5 million (2015: US$43.5 million)
• Earnings per share (“EPS”) increased 42.5% to 34.2 US cents (2015: 24.0 US cents)
• Interim dividend per share to increase by 8.3% to 3.25 US cents (2015: 3.00 US cents)
7
CHAIRMAN’S STATEMENT
OUTLOOKFleet size and lease revenue run rate increased signifi cantly during the fi nancial year. Additional aircraft have been acquired since the commencement of the 2017 fi nancial period and lease revenue has subsequently continued to increase. Further aircraft deliveries are scheduled in the near term. As at the date of this report, contracted lease revenue for the 2017 fi nancial period is over US$95 million. At 30 June 2016, total contracted future lease revenue from the existing fl eet and committed deliveries was US$745.8 million (2015: US$565.4 million).
Avation’s strategy continues to include the acquisition of new aircraft, maintenance of low average fl eet age, increased scale and customer diversifi cation. The Company will seek to trade mid-life and older aircraft when conditions permit in order to mitigate certain risks. Avation’s average aircraft age has decreased as it has acquired new aircraft. Avation expects its lease yield to reduce correspondingly as older, higher yielding aircraft are sold off. The Company believes that this is suitable risk mitigation by trading yield against longer term unexpired revenue and lowering risk by owning new aircraft.
Management believes that it can attract airline customers and periodically obtain the required funding for growth. In addition to operational cash fl ows, funding is traditionally sourced from capital markets, asset backed bank lending and disposal of selected aircraft. Access to acceptably priced funding remains a risk, which is common to all capital-intensive businesses. Specifi c risks which are inherent in the aircraft leasing industry include, but are not limited to, the creditworthiness of client airlines, over-production of new aircraft and market saturation, technology change in engines and aircraft, residual value risks, competition from other lessors and the general risk of impairment of aircraft assets.
In its tenth year as a public company Avation’s Board of Directors is pleased to deliver record revenue, profi t and earnings per share from the aircraft leasing business while executing a strategy of fl eet growth. Avation remains committed to delivering diversifi cation and further scale to the business in the future.
Robert Jeffries Chatfi eld,
Executive Chairman
Singapore
30 September 2016

Annual Report 2016
8
BOARD OF DIRECTORS
Jeff Chatfi eldChairmanMr Chatfi eld is the executive chairman of Avation PLC and has been instrumental in establishing and growing the Company. Mr Chatfi eld has a track record of leadership in a variety of profi table
and successful businesses. He is a qualifi ed public company director and business executive experienced in the fi elds of commercial airlines, aviation, aircraft leasing and fi nance, electronic commerce, investment management, radio and TV broadcasting. Mr Chatfi eld holds both Bachelor’s and Master’s Degrees in engineering from the University of Western Australia where he graduated top of the class. He has been involved in a number of successful businesses both private and public, the majority of which have been strongly cash fl ow generative. In the recent past Mr Chatfi eld was chairman of Skywest Airlines Ltd, a LSE-ASX dual-listed public company recently sold to Virgin Australia Ltd. He is a member of the Australian Institute of Company Directors and a fellow of the Singapore Institute of Directors. Mr Chatfi eld was born in Perth, Australia and is a Permanent Resident of Singapore.
Rod MahoneyExecutive DirectorMr Mahoney is the Chief Operating Offi cer and an Executive Director of the Company. Before this executive appointment, he was a fl eet planning and aircraft procurement consultant to the
Company. He has previously been a project advisor to a variety of Asia-Pacifi c airlines, suppliers and other aviation businesses, including Virgin Blue and V Australia and also held various senior executive positions at Airbus for 23 years, largely within the sales divisions covering Europe and Africa, China and the Pacifi c. He holds a Bachelor of Science Degree in Aeronautical Engineering (BSc. Hons), a Masters in Air Transport (MSc.) and a Masters of Applied Finance (MAppFin). Mr Mahoney holds dual citizenship of the United Kingdom and Australia and resides in Singapore. Mr Mahoney is a graduate member of the Australian Institute of Company Directors and a member of the Singapore Institute of Directors.
Stephen Fisher PhD Non-Executive DirectorIn addition to his role at Avation PLC, Stephen is Chairman, Principal and Chief Investment Offi cer of First Degree Global Asset Management Pte. Ltd., a privately owned asset management company in
Singapore founded in 2011. First Degree Global Asset Management operates a number of strategies for its clients including a Fixed Income focused hedge fund.
Stephen has had twenty-two years experience as an investment professional with leading investment management groups in the United States, Asia and Australia. From 2000 to 2011 he was Managing Director and Head of Global Fixed Income Product – Asia Pacifi c at JPMorgan Asset Management. Stephen held the positions of Australian Head of Capital Markets Research from 1992- 1996, and Asia Pacifi c Regional Head of Capital Markets Research at J.P. Morgan Investment Management, Inc. from 1996-1998.
Stephen’s particular areas of expertise are in quantitative analysis of fi xed income, equities, asset allocation and derivatives. He has advised Central Banks and Sovereign Wealth Funds on their reserves management practice, and his research on investment management issues has been widely published in academic and industry journals.
Stephen has a Master of Science (Finance) and a PhD (Finance) from the WE Simon Graduate School of Business Administration, University of Rochester, New York and a Bachelor of Economics (First Class Honours) from the University of Sydney.
9
STRATEGIC REPORT
The Directors present their strategic report for the year ended 30 June 2016.
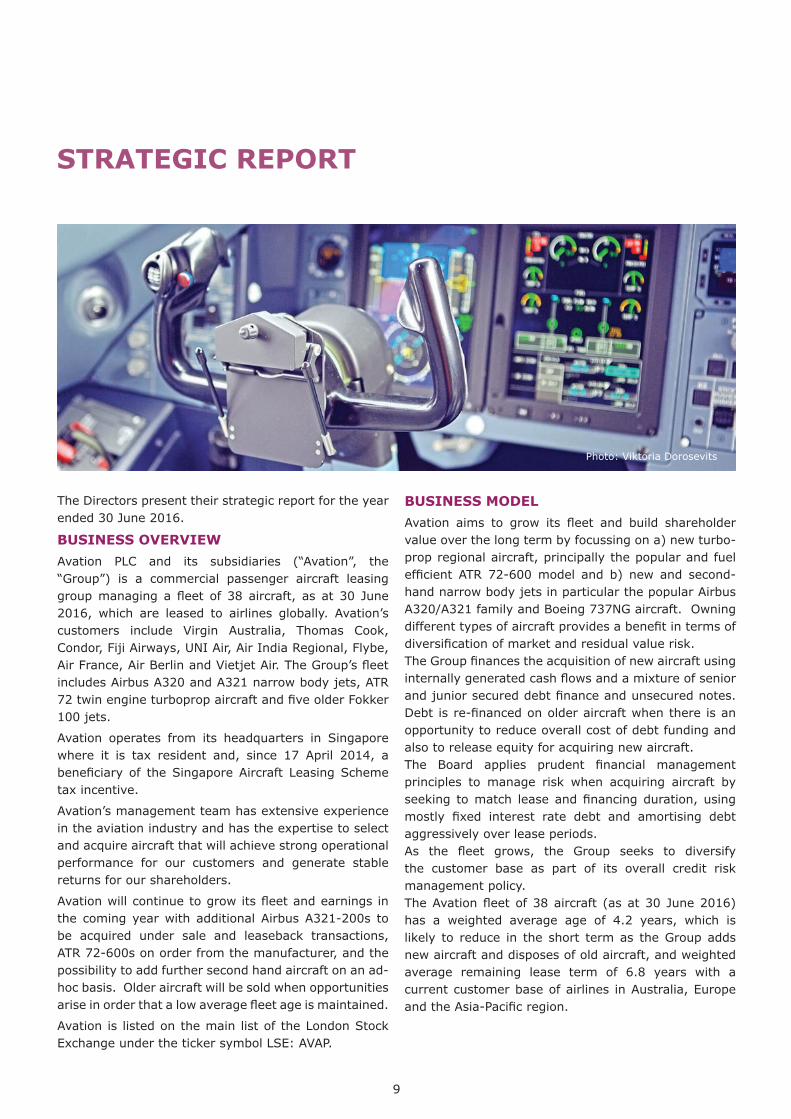
BUSINESS OVERVIEWAvation PLC and its subsidiaries (“Avation”, the “Group”) is a commercial passenger aircraft leasing group managing a fl eet of 38 aircraft, as at 30 June 2016, which are leased to airlines globally. Avation’s customers include Virgin Australia, Thomas Cook, Condor, Fiji Airways, UNI Air, Air India Regional, Flybe, Air France, Air Berlin and Vietjet Air. The Group’s fl eet includes Airbus A320 and A321 narrow body jets, ATR 72 twin engine turboprop aircraft and fi ve older Fokker 100 jets.
Avation operates from its headquarters in Singapore where it is tax resident and, since 17 April 2014, a benefi ciary of the Singapore Aircraft Leasing Scheme tax incentive.
Avation’s management team has extensive experience in the aviation industry and has the expertise to select and acquire aircraft that will achieve strong operational performance for our customers and generate stable returns for our shareholders.
Avation will continue to grow its fl eet and earnings in the coming year with additional Airbus A321-200s to be acquired under sale and leaseback transactions, ATR 72-600s on order from the manufacturer, and the possibility to add further second hand aircraft on an ad-hoc basis. Older aircraft will be sold when opportunities arise in order that a low average fl eet age is maintained.
Avation is listed on the main list of the London Stock Exchange under the ticker symbol LSE: AVAP.
BUSINESS MODELAvation aims to grow its fl eet and build shareholder value over the long term by focussing on a) new turbo-prop regional aircraft, principally the popular and fuel effi cient ATR 72-600 model and b) new and second-hand narrow body jets in particular the popular Airbus A320/A321 family and Boeing 737NG aircraft. Owning different types of aircraft provides a benefi t in terms of diversifi cation of market and residual value risk.The Group fi nances the acquisition of new aircraft using internally generated cash fl ows and a mixture of senior and junior secured debt fi nance and unsecured notes. Debt is re-fi nanced on older aircraft when there is an opportunity to reduce overall cost of debt funding and also to release equity for acquiring new aircraft.The Board applies prudent fi nancial management principles to manage risk when acquiring aircraft by seeking to match lease and fi nancing duration, using mostly fi xed interest rate debt and amortising debt aggressively over lease periods.As the fl eet grows, the Group seeks to diversify the customer base as part of its overall credit risk management policy. The Avation fl eet of 38 aircraft (as at 30 June 2016) has a weighted average age of 4.2 years, which is likely to reduce in the short term as the Group adds new aircraft and disposes of old aircraft, and weighted average remaining lease term of 6.8 years with a current customer base of airlines in Australia, Europe and the Asia-Pacifi c region.
Photo: Viktoria Dorosevits
Annual Report 2016
10
STRATEGIC REPORT
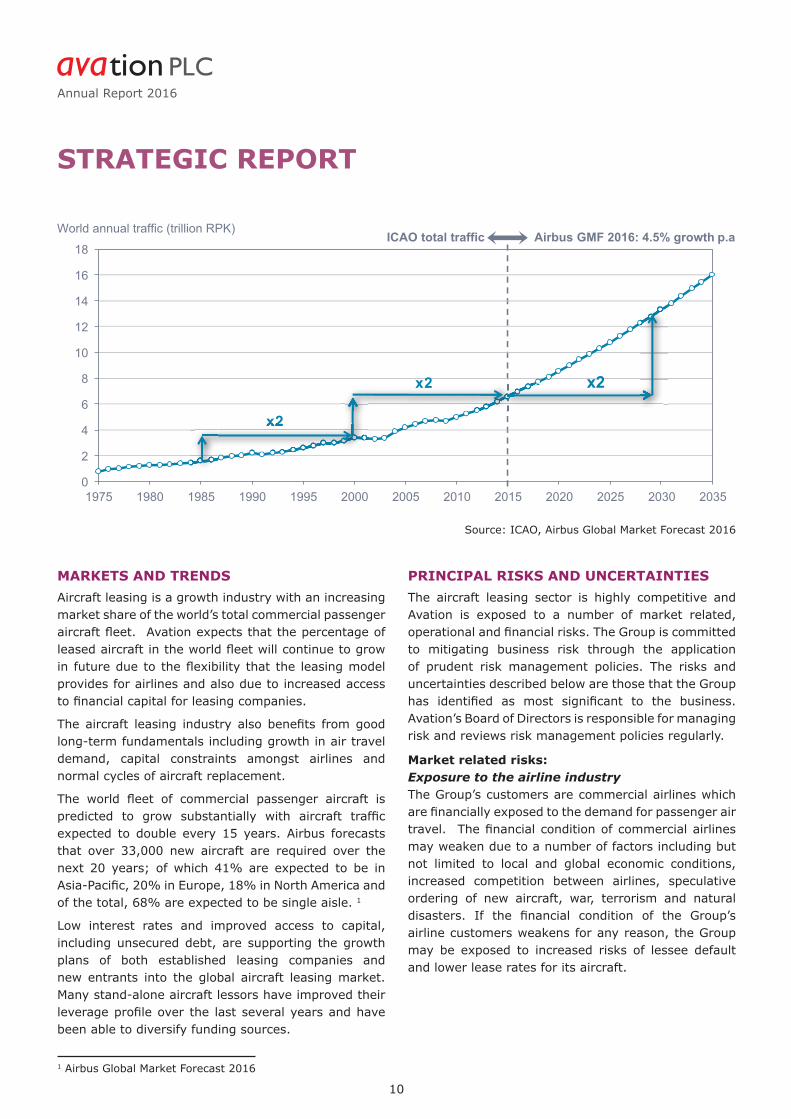
MARKETS AND TRENDSAircraft leasing is a growth industry with an increasing market share of the world’s total commercial passenger aircraft fl eet. Avation expects that the percentage of leased aircraft in the world fl eet will continue to grow in future due to the fl exibility that the leasing model provides for airlines and also due to increased access to fi nancial capital for leasing companies.
The aircraft leasing industry also benefi ts from good long-term fundamentals including growth in air travel demand, capital constraints amongst airlines and normal cycles of aircraft replacement.
The world fl eet of commercial passenger aircraft is predicted to grow substantially with aircraft traffi c expected to double every 15 years. Airbus forecasts that over 33,000 new aircraft are required over the next 20 years; of which 41% are expected to be in Asia-Pacifi c, 20% in Europe, 18% in North America and of the total, 68% are expected to be single aisle. 1
Low interest rates and improved access to capital, including unsecured debt, are supporting the growth plans of both established leasing companies and new entrants into the global aircraft leasing market. Many stand-alone aircraft lessors have improved their leverage profi le over the last several years and have been able to diversify funding sources.
PRINCIPAL RISKS AND UNCERTAINTIESThe aircraft leasing sector is highly competitive and Avation is exposed to a number of market related, operational and fi nancial risks. The Group is committed to mitigating business risk through the application of prudent risk management policies. The risks and uncertainties described below are those that the Group has identifi ed as most signifi cant to the business. Avation’s Board of Directors is responsible for managing risk and reviews risk management policies regularly.
Market related risks:Exposure to the airline industryThe Group’s customers are commercial airlines which are fi nancially exposed to the demand for passenger air travel. The fi nancial condition of commercial airlines may weaken due to a number of factors including but not limited to local and global economic conditions, increased competition between airlines, speculative ordering of new aircraft, war, terrorism and natural disasters. If the fi nancial condition of the Group’s airline customers weakens for any reason, the Group may be exposed to increased risks of lessee default and lower lease rates for its aircraft.
Source: ICAO, Airbus Global Market Forecast 2016
1 Airbus Global Market Forecast 2016

11
STRATEGIC REPORT
Asset value riskFluctuations in the supply and demand for aircraft and aircraft travel may impact values of and lease rates for the Group’s aircraft. Market forces and prevailing economic conditions may change over the economic lives of the Group’s aircraft and could have a positive or negative impact on aircraft valuations.
Advances in aircraft technology may create obsolescence in the fl eet before the end of aircrafts’ current estimated useful lives. The Group regularly obtains independent third party valuations for its fl eet and may dispose of aircraft in order to reduce its exposure to certain aircraft types. Avation has a policy of investing in popular narrowbody aircraft types on the basis that asset values and lease rates will be supported by continuing high demand for these aircraft.
Operational risks:Economic, legal and political risksAvation leases aircraft to lessees in different jurisdictions. As such the Group is exposed to economic, legal and political risk in those jurisdictions. Avation’s aircraft are subject to operational risks specifi c to the aviation sector resulting from war, acts of terrorism or the threat of terrorism, and natural disasters. The Group mitigates against these risks by requiring airline lessees to maintain adequate insurance over the aircraft.
Regulatory risksAvation’s fl eet operates in many jurisdictions and complies with tax and other regulatory requirements in those jurisdictions. There is a risk that changing tax and regulatory regimes may have an impact on the business and fi nancial results.
Lessee risksAvation’s airline lessees are responsible for all maintenance and safety checks. The requirement for each airline lessee to service and maintain the aircraft are set out in the lease agreements. There is a risk that airlines may not properly maintain aircraft which may lead to an impairment of the aircraft’s value. In order to mitigate against this risk the Group closely monitors each airline’s usage of aircraft and their compliance with agreed maintenance schedules. Avation can require lessees to pay maintenance reserve payments in order to ensure that there is adequate funding at all times for proper maintenance of the aircraft.
Financial risksAvation’s fi nancial risk management objectives and policies are set out in note 7 to the fi nancial statements and are as follows:
• Airline industry risks• Credit risk• Interest rate risk• Foreign currency risk• Liquidity risk• Capital risk

Annual Report 2016
12
STRATEGIC REPORT
FINANCIAL REVIEW
2016 2015US$’000s US$’000s
Lease revenue 71,190 56,932
Operating profi t 45,573 33,608
Total profi t 18,280 13,285
Net cash from operating activities 52,547 43,451
Total assets 831,785 586,182
Total equity 173,608 128,204
Basic earnings per share 34.35 cents 24.12 cents
Dividend per share 3.25 cents 3.00 cents
Lease revenue increased by 25.0% to US$71.2 million (2015: US$56.9 million) as a result of the increase in the size of the aircraft fl eet.
Operating profi t increased 35.6% to US$45.6 million (2015: US$33.6 million).
Depreciation increased as a consequence of overall fl eet growth by 30.5% to US$23.2 million (2015: US$17.8 million).
Gains on sales of aircraft during the period were US$3.7 million (2015: loss of US$0.7 million). One aircraft in the fl eet was impaired during the Financial Year with an impairment of US$0.9 million.
Administrative expenses increased 4.9% to US$7.5 million (2015: US$7.2 million). As a percentage of lease revenue administrative expenses decreased to 10.6% (2015: 12.6%). Other expenses were US$0.7 million (2015: US$0.8 million).
With the addition of aircraft assets, fi nance expenses increased by 52.0% to US$28.7 million (2015: US$18.9 million). Total interest expense within fi nance expenses increased to US$26.8 million (2015: US$17.3 million). The increase in total interest expense was primarily attributable to interest on the unsecured notes issued under the Company’s Global Medium Term Note Programme (“GMTN”), which was US$8.3 million (2015: US$0.8 million). Finance income was US$1.2 million (2015: US$0.8 million).
13
STRATEGIC REPORT
The majority of the Group’s operations are based in Singapore and are included in Singapore’s Aircraft Leasing Scheme, benefi tting from a concessionary tax rate. Taxation for the year was a credit of US$0.2 million primarily due to the reversal of an over-provision for deferred taxation (2015: US$1.0 million expense).
Operating cash fl ows increased by 20.9% to US$52.5 million (2015: US$43.5 million). EBITDA defi ned as the sum of pre-tax profi t from continuing operations, fi nance expenses and depreciation increased by 34.0% to US$70.0 million (2015: US$52.2 million).
Total profi t after tax for the Financial Year increased 37.6% to US$18.3 million (2015: US$13.3 million).
Total diluted earnings per share increased by 42.5% to 34.2 US cents (2015: 24.0 US cents).
The Company confi rms that there have been no changes to its accounting policies.
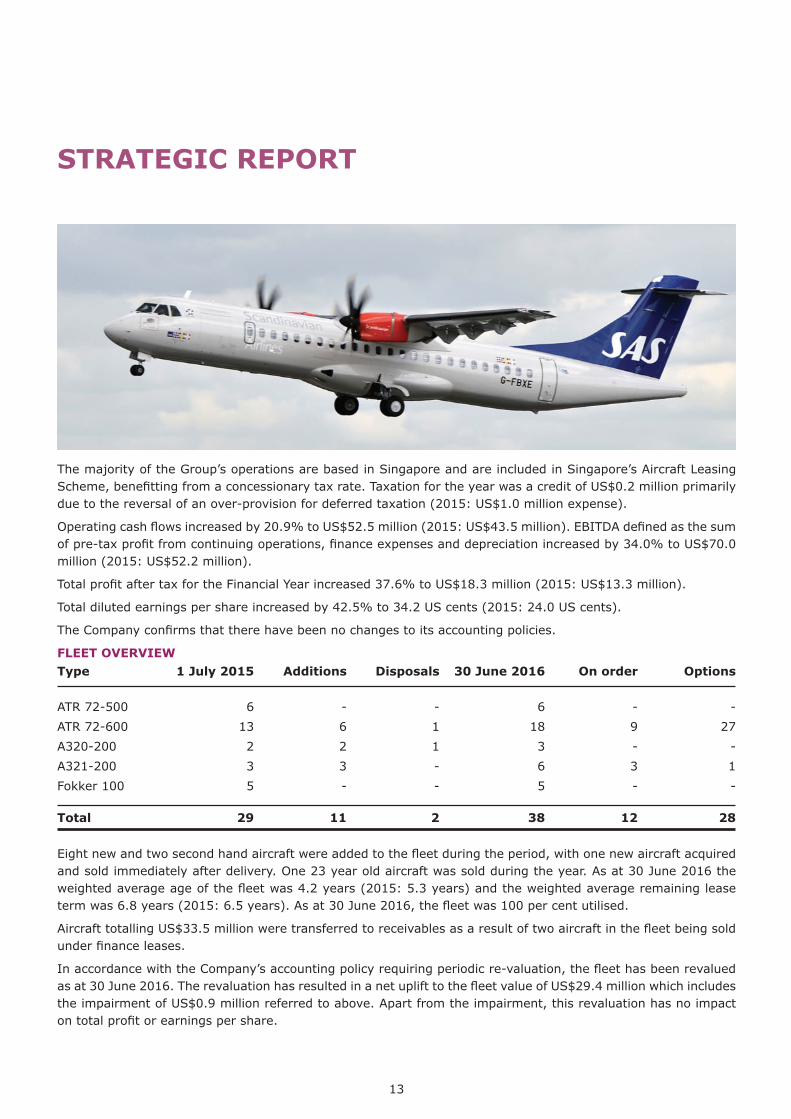
FLEET OVERVIEWType 1 July 2015 Additions Disposals 30 June 2016 On order Options
ATR 72-500 6 - - 6 - -
ATR 72-600 13 6 1 18 9 27
A320-200 2 2 1 3 - -
A321-200 3 3 - 6 3 1
Fokker 100 5 - - 5 - -
Total 29 11 2 38 12 28
Eight new and two second hand aircraft were added to the fl eet during the period, with one new aircraft acquired and sold immediately after delivery. One 23 year old aircraft was sold during the year. As at 30 June 2016 the weighted average age of the fl eet was 4.2 years (2015: 5.3 years) and the weighted average remaining lease term was 6.8 years (2015: 6.5 years). As at 30 June 2016, the fl eet was 100 per cent utilised.
Aircraft totalling US$33.5 million were transferred to receivables as a result of two aircraft in the fl eet being sold under fi nance leases.
In accordance with the Company’s accounting policy requiring periodic re-valuation, the fl eet has been revalued as at 30 June 2016. The revaluation has resulted in a net uplift to the fl eet value of US$29.4 million which includes the impairment of US$0.9 million referred to above. Apart from the impairment, this revaluation has no impact on total profi t or earnings per share.
Annual Report 2016
14
STRATEGIC REPORT
DEBT SUMMARY2016 2015
US$’000s US$’000s
Loans and borrowings 615,724 428,095
Cash and cash equivalents 48,267 108,647
Net indebtedness 567,457 319,448
Loan to value ratio 74.0% 73.0%
Weighted average cost of secured debt 4.3% 4.4%
Weighted average cost of total debt 4.8% 5.1%
Loans and borrowings and net indebtedness increased due to additional secured debt issued to fund fl eet acquisitions.
The weighted average cost of total debt continued to decline to 4.8% as at 30 June 2016 (2015: 5.1%). The weighted average cost of the group’s secured debt facilities was lower at 4.3% as at 30 June 2016 (2015: 4.4%). The overall decrease in the Group’s cost of debt resulted from paying down debt with higher interest rates, increasing the proportion of secured debt as a percentage of total debt and improved interest rates on new secured loans drawn down in the year.
The issue of the notes under the GMTN in 2015 provided funding to support growth during 2016. These funds were combined with proceeds from aircraft sales, ordinary earnings and additional secured debt and deployed to fund aircraft acquisitions. The Board is pleased to report achieving both signifi cant fl eet growth and a reduction in the weighted average cost of debt.
At the end of the Financial Year, Avation’s overall loan to value ratio was 74.0% (2015: 73.0%). At 30 June 2016, 91.6% of total debt was at fi xed interest rates (2015: 88.8%). At 30 June 2016, there was no related party debt other than pursuant to participation in notes issued under the GMTN (2015: US$2.0 million).
EnvironmentAvation is committed to environmental responsibility as part of its business strategy. This is achieved by investing in technologically advanced designs of commercial aircraft that offer improved fuel effi ciency and lower emissions. The majority of our fl eet are modern regional turbo-prop aircraft which provide signifi cant environmental benefi ts over comparable jet aircraft due to their more economical use of fuel and consequently lower carbon dioxide emissions.
EmployeesA breakdown by gender of the number of persons who were Directors of the Company, senior managers and other employees as at 30 June 2016 is set out below:
Male Female
Directors of the Company 3 -
Senior managers 3 -
Other employees 5 7
On behalf of the board
Robert Jeffries Chatfi eldDirector
30 September 2016
The directors present their report and fi nancial statements for the fi nancial year ended 30 June 2016.
Principal activities and business reviewThe principal activity of the Group is leasing aircraft. Details of activities carried out by subsidiary companies are set out in Note 24 to these fi nancial statements.
The principal risks and uncertainties affecting the Group’s turnover are described in the Strategic Report.
The full business review including KPI’s can be found in the Strategic Report and in Note 7 to these fi nancial statements. The Group has reviewed the environmental matters in the Strategic Report.
Results and dividendsThe consolidated statement of profi t or loss and other comprehensive income for the year is set out on page 30. The directors have resolved to pay a 3.25 US cents interim dividend.
Directors and their interestsThe directors who served the Company during the year together with their interests and deemed interests in the shares of the Company at the beginning (or subsequent date of appointment) and end of the year, were as follows:
Direct interest Deemed interest30 June
20161 July2015
30 June 2016
1 July2015
Ordinary shares of £0.01 each:
Robert Jeffries Chatfi eld 1 1 10,405,000 10,215,365
Roderick Douglas Mahoney 300,000 240,000 - -
Stephen John Fisher 5,000 5,000 - -
Signifi cant shareholdings
Ordinary shares Percentage
Ordinary shares of £0.01 each:
Goldman Sachs Securities (Nominees) Limited 14,427,188 25.86%
Chase Nominees Limited 7,691,140 13.79%
Fitel Nominees Limited 5,624,006 10.08%
Lynchwood Nominees Limited 5,275,746 9.46%
State Street Nominees Limited 4,269,769 7.65%
HSBC Global Custody Nominee (UK) Limited 3,792,405 6.80%
15
DIRECTORS’ REPORT
Photo: Viktoria Dorosevits
Annual Report 2016
Equal Opportunities Policy
It is the Group’s policy to employ individuals with the necessary qualifi cations without regard to sex, marital status, race, creed, colour, nationality or religion. Full and fair consideration is given to applications for employment made by disabled persons having regard to their particular aptitudes and abilities.
The Group recognises the great importance of the contribution made by all employees and aims to keep them informed of matters affecting them as employees and developments within the Group. Communication and consultation is achieved by a variety of means both within individual companies or branches and on a group-wide basis.
Directors’ Insurance
The Group maintains insurance policies on behalf of all the directors against liability arising from negligence, breach of duty and breach of trust in relation to the Group.
Future Developments
In accordance with s414C(11) of the Companies Act 2006, the directors have chosen to include information about future developments in the Chairman’s Statement and Strategic Report.
Financial Instruments
See Note 7 to these fi nancial statements.
Going Concern
After making appropriate enquiries and taking into account the matters set out in the principal risks and uncertainties in the Strategic Report, the directors have a reasonable expectation that the Company and the Group have adequate resources to continue in operational existence for the foreseeable future. For this reason, they continue to adopt the going concern basis in preparing the fi nancial statements.
Greenhouse Gas Emissions Statement
It is not practical for the Company to calculate its greenhouse gas emissions. Usage of the Company’s aircraft is under the control of lessees who are not required to provide emissions data to the Company.
Capital Structure
Details of the Company’s issued share capital, together with details of the movements therein during the fi nancial year are shown in Note 32. The Company has one class of ordinary shares which carry no right to fi xed income. Each share carries the right to one vote at general meetings of the Company.
By a resolution passed at the AGM held on 16 November 2015 the Company’s Directors are authorised to buy back shares not exceeding 15 per cent of the total number of shares in issue on that date. Share buy backs may be at market prices but not under £0.50 and not above £3.00 per share, including commissions and other related expenses.
16
DIRECTORS’ REPORT
Photo: Viktoria Dorosevits
There are no specifi c restrictions on the size of a holding nor on the transfer of shares, which are both governed by the general provisions of the Articles of Association and prevailing legislation. The directors are not aware of any agreements between holders of the Company’s shares that may result in restrictions on the transfers of securities or on voting rights.
Details of employees share option schemes are set out in Note 33.
No person has any special rights of control over the Company’s share capital and all issued shares are fully paid.
With regards to the appointment and replacement of directors, the Company is governed by its Articles of Association, the Companies Act and related legislation. The Articles themselves may be amended by special resolution of the shareholders.
Corporate Governance Statement
The Board is accountable to the shareholders for the good corporate governance of the Group. The principles of corporate governance and a code of best practice are set out in the UK Corporate Governance Code issued in September 2014. The Company is not required to comply in full with the Code nor state any areas with which it does not comply. The Board has adopted policies that it considers to be appropriate for the Company’s size and nature.
The Board acts as the administrative, management and supervisory body overseeing the operation of the Group. The Board consist of two executive directors (Robert Jeffries Chatfi eld and Roderick Douglas Mahoney) and one non-executive director (Stephen John Fisher). The Board meets at least six times a year; matters for discussion at formal meetings are clearly laid down and decisions recorded. The Board is responsible for overall corporate strategy; the reviewing and approval of acquisition and divestment opportunities; the approval of signifi cant capital expenditures; the review of budgets, trading performance, and all signifi cant fi nancial and operational issues.
The Company operates the following committees whose members are detailed below:
• Audit Committee - Robert Jeffries Chatfi eld, Roderick Douglas Mahoney, Stephen John Fisher and Iain Cawte (non-Board member); and
• Risk Committee - Robert Jeffries Chatfi eld, Roderick Douglas Mahoney, Stephen John Fisher, Iain Cawte (non-Board member), Duncan Scott (non-Board member), Richard Wolanski (non-Board member), Sumit Vasudeva (non-Board member) and Ashley Nicholas (non-Board member).
• Remuneration Committee - Robert Jeffries Chatfi eld, Roderick Douglas Mahoney, Stephen John Fisher
The Board is responsible for identifying and evaluating the major business risks faced by the Company and for determining and monitoring the appropriate course of action to manage these risks. The key risks the Company faces are described in the risk assessment section of this annual report and accounts.
17
DIRECTORS’ REPORT
Photo: Viktoria Dorosevits
Annual Report 2016
The Board conducts a review of the effectiveness of the Company’s systems of internal control and risk management on an annual basis. Following this review it has concluded that the Company’s fi nancial, operational and compliance controls and risk management procedures are appropriate and suitable to enable the Board to safeguard shareholders’ investments and the Company’s assets.
The process and systems of internal control are designed to manage, rather than eliminate, the risk of failure to achieve the Company’s objectives, and can therefore only provide reasonable and not absolute assurance against material misstatement or loss.
Statement as to disclosure of information to auditors
• So far as the directors are aware, there is no relevant audit information of which the Company’s auditors are unaware, and
• They have taken all the steps that they ought to have taken as directors in order to make themselves aware of any relevant audit information and to establish that the Company’s auditors are aware of that information.
Auditors
Kingston Smith LLP have indicated their willingness to continue in offi ce and in accordance with s489 of the Companies Act 2006. A resolution proposing that they be reappointed as auditors of the Company will be put to the Annual General Meeting.
Purchase of own shares
During the fi nancial year, the Company purchased 3,750,600 shares for US$7.94 million. These were held as treasury shares and presented within shareholders equity. The Company subsequently sold 4,200,000 treasury shares.
Subsequent events
See Note 41 to these fi nancial statements.
Information to be included in annual report
In accordance with the UK Financial Conduct Authority’s Listing Rules (LR 9.8.4C), the following table provides references to where the information to be included in the annual report and accounts, where applicable, under LR 9.8.4, is set out.
Listing Rule requirement Reference
Details of any long-term incentive schemes as required by LR 9.4.3 R.
Details of any contract of signifi cance subsisting during the period under review to which the listed company, or one of its subsidiary undertakings, is a party and in which a director of the listed company is or was materially interested.
Directors’ Remuneration report and Notes to the Financial Statements – Note 33, Share Based Payments
Notes to the Financial Statements – Note 8, Related Party Transactions
On behalf of the board
Robert Jeffries Chatfi eld
Director
18
DIRECTORS’ REPORT
Introduction
This report has been prepared in accordance with Schedule 8 of the Large and Medium Companies and Groups (Accounts and Reports) Regulations 2008 as amended in August 2013. As required a resolution to approve the Directors’ remuneration will be proposed at the forthcoming Annual General Meeting of the Company at which the fi nancial statements will be approved. The vote will have advisory status, will be in respect of the remuneration policy and overall remuneration packages and will not be specifi c to the individual levels of remuneration.
The information in the Directors’ Remuneration Report is not audited, unless specifi cally stated that the section is subject to audit.
Statement by the Chair of the remuneration committee
The Company’s remuneration policy remains substantiality unchanged for 2016. Key aspects of the policy are to attract and retain executives; be consistent with best practices and to ensure alignment between performance and compensation. The Company’s performance in the current year was in line with expectations with revenue increasing 25% and earnings per share increasing 40% and remuneration was commensurate with this performance.
Remuneration (audited)
The components of remuneration are:
• basic salary and benefi ts determined by the Remuneration Committee which are included in employment agreements and reviewed annually;
• bonuses based upon performance of the Company and the individual concerned; and• share warrants.
19
DIRECTORS’ REMUNERATION REPORT

20
Annual Report 2016
DIRECTORS’ REMUNERATION REPORT
Component Purpose Operation & framework used to assess performance
Salary and benefi ts
To provide the core reward for the role at a suffi cient level to recruit and retain individuals of the necessary competence to execute the company’s business strategy.
Operation: Salaries are typically set after considering salary levels in companies of a similar size and complexity, the responsibilities of each individual role, progression within the role, individual performance and an individual’s experience. Our overall policy, having had due regard to the factors noted, is normally to target salaries at the market median level.Salaries may be adjusted in line with the market and adjustments out of line with the market may be awarded in certain circumstances such as where there is a change in responsibility, progression in the role, experience or a signifi cant increase in the scale of the role and/or size, value and/or complexity of the Group. Salary levels for current incumbents are set out elsewhere in this report.Framework used to assess performance:The remuneration committee considers individual salaries at the appropriate committee meeting each year after having due regard to the factors noted in operating the salary policy. No recovery provisions apply to salary.
Bonuses To incentivise and recognise execution of the business strategy on a semi-annual basis.
Operation: Bonuses are paid in cash twice yearly to Directors based on a target percentage of the employee’s basic salary. All bonus payments are at the discretion of the Committee, as shown following this table.Framework used to assess performance:The remuneration committee will assess company and individual performance compared to prior year and expectations for the current year. Individual performance will also be assessed against key performance metrics established for each executive. Metrics considered in awarding bonuses include share price appreciation; increase in the Company’s earnings per share; reliable and high quality fi nancial reporting; growth in asset value and profi ts; and dividend growth.
Share Warrants
To incentivise and recognise execution of the business strategy over the long-term.
Operation: Each year share warrants and/or performance shares awards may be granted subject to the achievement of performance targets. Awards normally vest over a three-year period.Framework used to assess performance:Same as for bonus.
21
DIRECTORS’ REMUNERATION REPORT
Individual Director’s remuneration from the group was as follows:
Salariesand fees
Bonuses Taxable benefi ts
Total2016
Total2015
US$’000s US$’000s US$’000s US$’000s US$’000s
Executive Directors:Robert Jeffries Chatfi eld 528 70 101 699 711
Roderick Douglas Mahoney 230 198 - 428 308
Non-executive Directors:Stephen John Fisher 30 - - 30 30
788 268 101 1,157 1,049
Bonuses are subject to the discretion of the remuneration committee and are awarded after assessing company and individual performance compared to prior years and expectations for the current year. Individual performance is also assessed against key performance metrics established for each executive.
Taxable benefi ts mainly relate to housing expenses.
The information in this part of the Directors’ Remuneration Report is subject to audit.
Service contracts
The employment contracts of the executive Directors with the Company are terminable by either party with no less than four weeks’ notice in writing to the other.
The Directors’ service contracts are as follows:
Date of contractUnexpired
termNotice period
Compensation payable on early
termination
Robert Jeffries Chatfi eld 29 April 2013 Indefi nite 4 months -
Roderick Douglas Mahoney 16 December 2011 Indefi nite 4 weeks -
Stephen John Fisher 29 April 2014 Indefi nite 1 month -
Share options and warrants (audited)
The Group has an ownership-based compensation scheme for Directors and senior management of the Group.
Warrants are granted to Directors and senior management of the Group to promote:
• improvement in share price;• improvement in profi t; and• improvement in returns to shareholders.
Each share warrant converts into one ordinary share of Avation PLC on exercise. No amounts are paid or are payable by the recipient on receipt of the warrant. The warrants carry neither rights to dividends nor voting rights. There are no performance conditions that need to be met before warrants can be exercised.
Warrants granted to Directors on 20 November 2013 have a 3 year vesting schedule with details as follows:

Annual Report 2016
22
DIRECTORS’ REMUNERATION REPORT
Vesting periodProportion of total share options that are
exercisable
Before 20 November 2014 0 per cent
On 20 November 2014 and before 20 November 2015 Up to 33 per cent of the grant
On 20 November 2015 and before 20 November 2016 Up to 33 per cent of the grant or up to 66 per cent of the grant if warrants were not exercised after the fi rst vesting year
On 20 November 2016 Balance or 100 per cent of the grant if warrants were not exercised after the fi rst and second vesting years
Warrants granted to directors on 8 December 2014 have a 3 year vesting schedule with details as follows:
Vesting period Proportion of total share options that are exercisable
Before 8 December 2015 0 per cent
On 8 December 2015 and before 8 December 2016 Up to 33 per cent of the grant
On 8 December 2016 and before 8 December 2017 Up to 33 per cent of the grant or up to 66 per cent of the grant if warrants were not exercised after the fi rst vesting year
On 8 December 2017 Balance or 100 per cent of the grant if warrants were not exercised after the fi rst and second vesting years
Warrants granted to directors on 8 December 2015 have a 3 year vesting schedule with details as follows:
Vesting period Proportion of total share options that are exercisable
Before 16 November 2016 0 per cent
On 16 November 2016 and before 16 November 2017 Up to 33 per cent of the grant
On 16 November 2017 and before 16 November 2018 Up to 33 per cent of the grant or up to 66 per cent of the grant if warrants were not exercised after the fi rst vesting year
On 16 November 2018 Balance or 100 per cent of the grant if warrants were not exercised after the fi rst and second vesting years
23
Avation PLC
FTSE100
DIRECTORS’ REMUNERATION REPORT
The following share warrants issued to Directors were outstanding at the year-end:
DirectorDate
grantedWarrant
price
Balance at beginning
of year
Granted during the
year
Exercised during the
year
Balance atend of year
Robert Jeffries Chatfi eld * 20 Nov 2013 110.0p 335,000 - (35,000) 300,000
Robert Jeffries Chatfi eld * 8 Dec 2014 153.0p 450,000 - - 450,000
Robert Jeffries Chatfi eld * 16 Nov 2015 130.0p - 450,000 - 450,000
Roderick Douglas Mahoney**
20 Nov 2013 110.0p 300,000 - - 300,000
Roderick Douglas Mahoney 8 Dec 2014 153.0p 400,000 - - 400,000
Roderick Douglas Mahoney 16 Nov 2015 130.0p - 400,000 - 400,000
* Robert Jeffries Chatfi eld was granted the share warrants via Epsom Assets Limited. For warrants exercised during the year the market price was 147.0p at the date of exercise.** Roderick Douglas Mahoney was granted the share warrants via Douglas Aviation Pte Ltd.
The closing market price of the shares subject to warrants at the year-end was £1.41. The highest and lowest closing market prices during the year were £1.50 and £1.19.
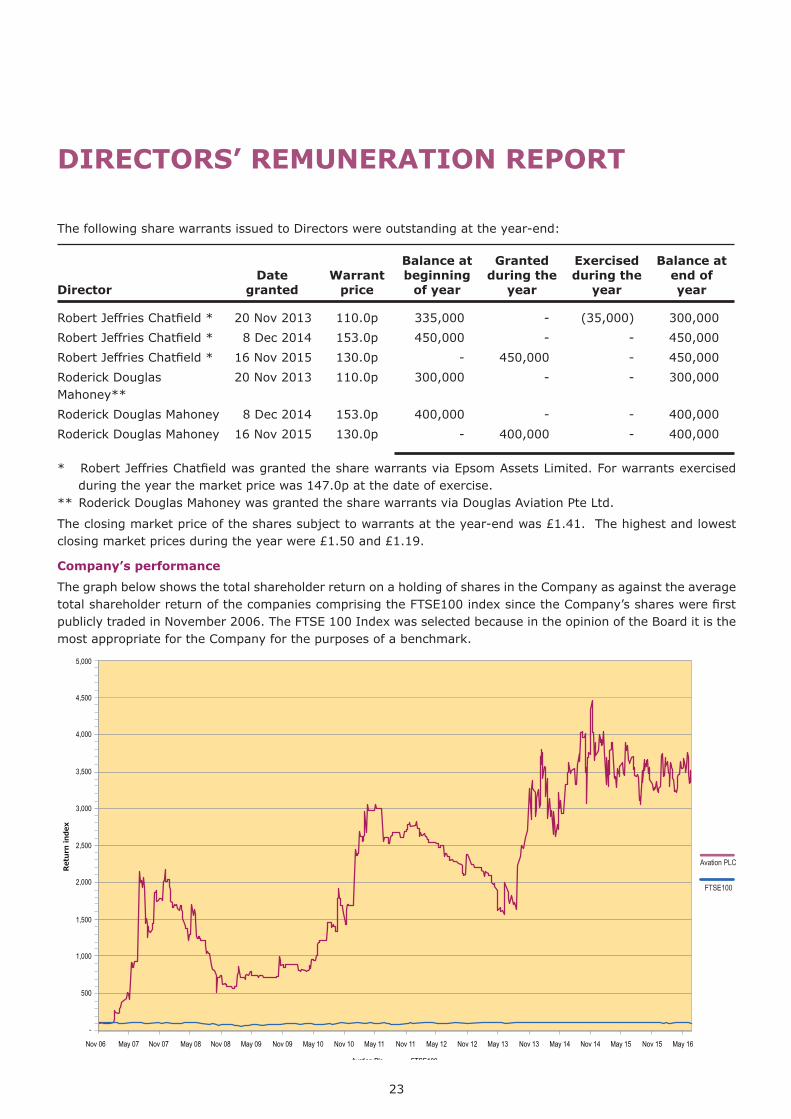
Company’s performance
The graph below shows the total shareholder return on a holding of shares in the Company as against the average total shareholder return of the companies comprising the FTSE100 index since the Company’s shares were fi rst publicly traded in November 2006. The FTSE 100 Index was selected because in the opinion of the Board it is the most appropriate for the Company for the purposes of a benchmark.
Annual Report 2016
24
DIRECTORS’ REMUNERATION REPORT
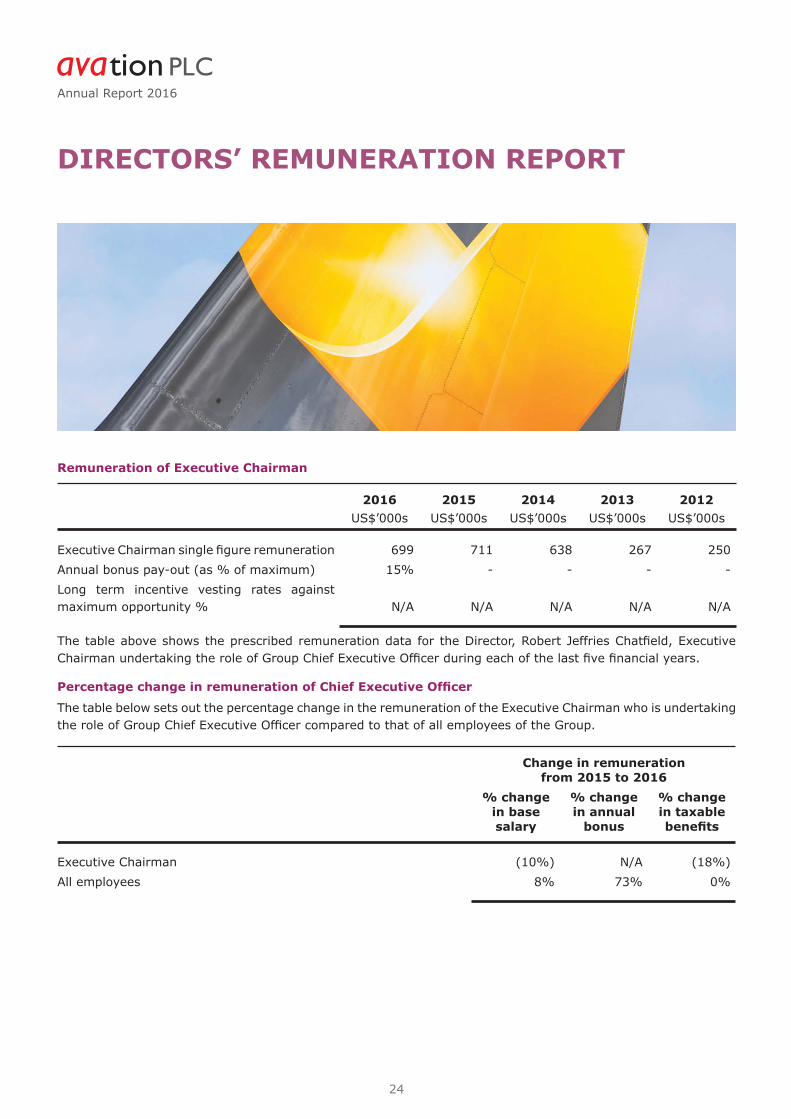
Remuneration of Executive Chairman
2016 2015 2014 2013 2012US$’000s US$’000s US$’000s US$’000s US$’000s
Executive Chairman single fi gure remuneration 699 711 638 267 250
Annual bonus pay-out (as % of maximum) 15% - - - -
Long term incentive vesting rates against maximum opportunity % N/A N/A N/A N/A N/A
The table above shows the prescribed remuneration data for the Director, Robert Jeffries Chatfi eld, Executive Chairman undertaking the role of Group Chief Executive Offi cer during each of the last fi ve fi nancial years.
Percentage change in remuneration of Chief Executive Offi cer
The table below sets out the percentage change in the remuneration of the Executive Chairman who is undertaking the role of Group Chief Executive Offi cer compared to that of all employees of the Group.
Change in remunerationfrom 2015 to 2016
% change in base salary
% change in annual
bonus
% change in taxable benefi ts
Executive Chairman (10%) N/A (18%)
All employees 8% 73% 0%
25
DIRECTORS’ REMUNERATION REPORT
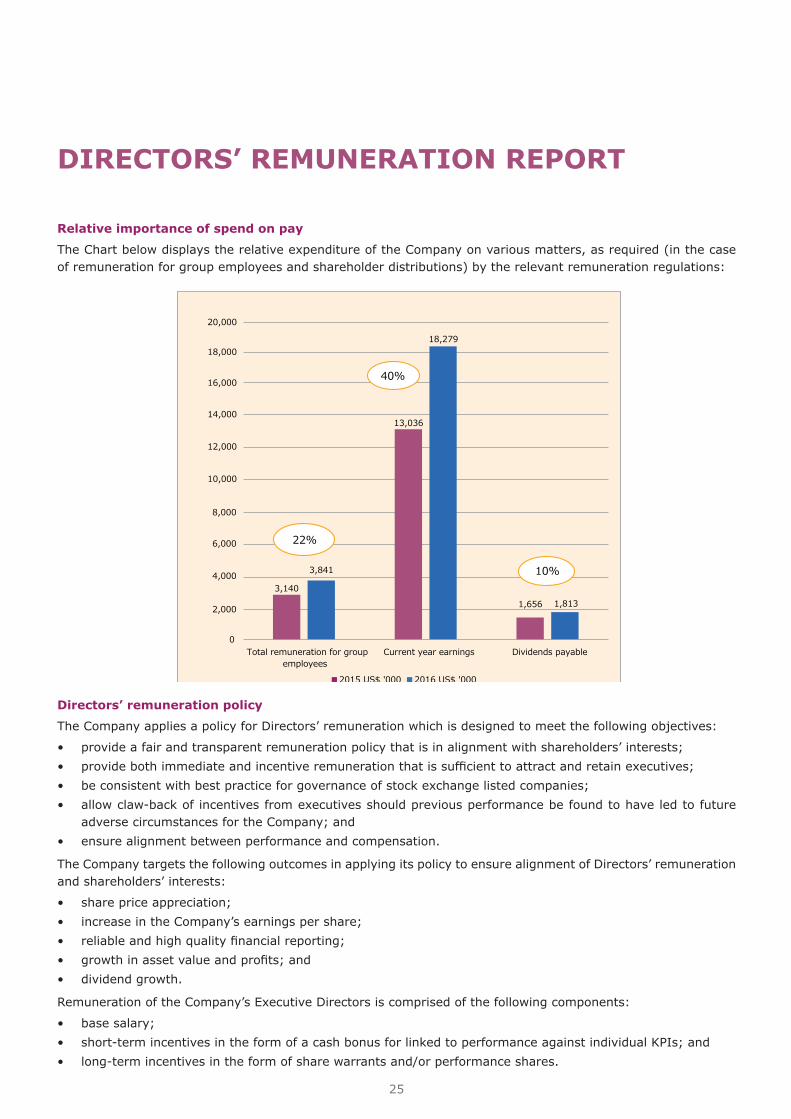
Relative importance of spend on pay
The Chart below displays the relative expenditure of the Company on various matters, as required (in the case of remuneration for group employees and shareholder distributions) by the relevant remuneration regulations:
Directors’ remuneration policy
The Company applies a policy for Directors’ remuneration which is designed to meet the following objectives:
• provide a fair and transparent remuneration policy that is in alignment with shareholders’ interests;• provide both immediate and incentive remuneration that is suffi cient to attract and retain executives;• be consistent with best practice for governance of stock exchange listed companies;• allow claw-back of incentives from executives should previous performance be found to have led to future
adverse circumstances for the Company; and• ensure alignment between performance and compensation.
The Company targets the following outcomes in applying its policy to ensure alignment of Directors’ remuneration and shareholders’ interests:
• share price appreciation;• increase in the Company’s earnings per share;• reliable and high quality fi nancial reporting;• growth in asset value and profi ts; and• dividend growth.
Remuneration of the Company’s Executive Directors is comprised of the following components:
• base salary;• short-term incentives in the form of a cash bonus for linked to performance against individual KPIs; and• long-term incentives in the form of share warrants and/or performance shares.

Annual Report 2016
26
DIRECTORS’ REMUNERATION REPORT
Remuneration of the Company’s Non-Executive Directors is comprised of fi xed Directors’ Fees.
Payments for loss of offi ce
No provisions are made under the Directors’ service contracts for any payments beyond the applicable notice period.
Remuneration for the appointment of a new Executive Director
Base salary levels are set in accordance with the Company’s remuneration policy, taking into account the experience and calibre of the individual. Benefi ts are provided in line with those offered to other employees, with relocation expenses/arrangements provided if necessary. The Company may offer a cash amount on recruitment, payment of which may be deferred, as compensation for the value of benefi ts a new employee would have received from a former employer.
Statement of consideration of employment conditions elsewhere in the company
Pay and employment conditions of other employees in the company were taken into account when setting the policy for Directors’ remuneration. Similar remuneration polices are in place for Directors and employees of an equivalent level.
Shareholders’ vote on remuneration
Share Count % of Total
Votes cast in favour 24,725,407 84.00%
Votes cast against 4,710,000 16.00%
Total votes cast in favour or against 29,435,407 100.00%
Votes withheld 2,375,000
The Board as a whole considers the remuneration of the Directors and has not engaged external advisers. The remuneration report for the year ended 30 June 2015 was approved at the Annual General Meeting held on 16 November 2015.
On behalf of the Board
Robert Jeffries Chatfi eld
Director
27
DIRECTORS’ RESPONSIBILITIES
Statement of Directors’ responsibilities
The Directors are responsible for preparing the Directors’ Report and the fi nancial statements in accordance with applicable law and regulations.
Company law requires the Directors to prepare fi nancial statements for each fi nancial year. Under that law the Directors are required to prepare the Group fi nancial statements in accordance with International Financial Reporting Standards (“IFRSs”) as adopted by the European Union (“EU”) and Article 4 of the IAS Regulation and have also chosen to prepare the Parent Company fi nancial statements under IFRSs as adopted by the EU.
Under company law the Directors must not approve the fi nancial statements unless they are satisfi ed that they give a true and fair view of the state of affairs of the Company and of the Group and the fi nancial performance and cash fl ows of the Group for that year. In preparing these fi nancial statements, the Directors are required to:
• select suitable accounting policies and then apply them consistently;
• make judgements and accounting estimates that are reasonable and prudent;
• prepare the accounts on the going concern basis unless it is inappropriate to presume that the Company will continue in business;
• present information, including accounting policies, in a manner that provides relevant reliable, comparable and understandable information;
• provide additional disclosures when compliance with specifi c IFRSs are insuffi cient to enable the users to understand the impact of particular transactions, other events and conditions on the entity’s fi nancial position and fi nancial performance;
• properly select and apply accounting policies.
The Directors are responsible for keeping adequate accounting records that are suffi cient to show and explain the Company’s and the Group’s transactions and disclose with reasonable accuracy at any time the fi nancial position of the Company and the Group and enable them to ensure that the fi nancial statements comply with the Companies Act 2006. They are also responsible for safeguarding the assets of the Company and the Group and hence for taking reasonable steps for the prevention and detection of fraud and other irregularities.
The Directors are responsible for the maintenance and integrity of the corporate and fi nancial information included on the Company’s website. Legislation in the United Kingdom governing the preparation and dissemination of the fi nancial statements may differ from legislation in other jurisdictions.
We confi rm that to the best of our knowledge:
• the fi nancial statements, prepared in accordance with IFRSs as adopted by the EU, give a true and fair view of the assets, liabilities, fi nancial position and profi t or loss of the Company and of the Group;
• the strategic report includes a fair review of the development and performance of the business and the position of the Company and of the Group, together with a description of the principal risks and uncertainties that they face; and
• the annual report and fi nancial statements, taken as a whole, are fair, balanced and understandable and provide the information necessary for the shareholders to assess the Group’s position, performance, business model and strategy.
By order of the BoardRobert Jeffries Chatfi eldDirector

28
AVATION PLC AUDITORS’ REPORT FOR THE FINANCIAL YEAR ENDED 30 JUNE 2016 INDEPENDENT AUDITORS’ REPORT TO THE MEMBERS OF AVATION PLC We have audited the financial statements of Avation PLC for the year ended 30 June 2016 which comprise the Consolidated Statement of Profit or Loss and other Comprehensive Income, the Consolidated Balance Sheet, the Company Balance Sheet, the Consolidated Statement of Changes in Equity, the Company Statement of Changes in Equity, the Consolidated Statement of Cash Flows, the Company Statement of Cash Flows and the related notes. The financial reporting framework that has been applied in their preparation is applicable law and International Financial Reporting Standards (“IFRSs”) as adopted by the European Union and as regards the Parent Company financial statements, as applied in accordance with the provisions of the Companies Act 2006. This report is made solely to the Company’s members, as a body, in accordance with Chapter 3 of Part 16 of the Companies Act 2006. Our audit work has been undertaken for no purpose other than to draw to the attention of the Company’s members those matters which we are required to include in an auditors’ report addressed to them. To the fullest extent permitted by law, we do not accept or assume responsibility to any party other than the Company and Company’s members as a body, for our work, for this report, or for the opinions we have formed. Respective responsibilities of directors and auditors As explained more fully in the Directors’ Responsibilities Statement set out on page 27 the directors are responsible for the preparation of the financial statements and for being satisfied that they give a true and fair view. Our responsibility is to audit and express an opinion on the financial statements in accordance with applicable law and International Standards on Auditing (UK and Ireland). Those standards require us to comply with the Auditing Practices Board’s (APB’s) Ethical Standards for Auditors. Scope of the audit of the financial statements An audit involves obtaining evidence about the amounts and disclosures in the financial statements sufficient to give reasonable assurance that the financial statements are free from material misstatement, whether caused by fraud or error. This includes an assessment of: whether the accounting policies are appropriate to the Group’s and the Parent Company’s circumstances and have been consistently applied and adequately disclosed; the reasonableness of significant accounting estimates made by the directors; and the overall presentation of the financial statements. In addition, we read all the financial and non-financial information in the Annual Report to identify material inconsistencies with the audited financial statements and to identify any information that is apparently materially incorrect based on, or materially inconsistent with, the knowledge acquired by us in the course of performing the audit. If we became aware of any apparent material misstatements or inconsistencies we consider the implications in our report. Opinion on the financial statements In our opinion:
• the financial statements give a true and fair view of the state of the Group’s and of the Parent Company’s affairs as at 30 June 2016 and of the Group’s profit for the year then ended;
• the Group’s financial statements have been properly prepared in accordance with IFRSs as adopted by the European Union;
• the parent company financial statements have been prepared properly in accordance with IFRS as adopted by the European Union and as applied in accordance with the provisions of the Companies Act 2006, and
• the financial statements have been prepared in accordance with the requirements of the Companies Act 2006 and, as regards the Group financial statements, Article 4 of the IAS Regulation.

29
AVATION PLC AUDITORS’ REPORT FOR THE FINANCIAL YEAR ENDED 30 JUNE 2016 Opinion on other matters prescribed by the Companies Act 2006 In our opinion:
• the part of the Directors Remuneration Report to be audited has been properly prepared in accordance with the Companies Act 2006;
• the information given in the Corporate Governance Statement included in the Directors’ report with respect to internal control and risk management systems in relation to financial reporting processes and about share capital structures is consistent with the financial statements; and
• the information given in the Directors’ Report for the financial year for which the financial statements are prepared is consistent with the financial statements.
Matters on which we are required to report by exception We have nothing to report in respect of the following matters where the Companies Act 2006 requires us to report to you if, in our opinion:
• adequate accounting records have not been kept by the Parent Company, or returns adequate for our audit have not been received from branches not visited by us; or
• the Parent Company financial statements are not in agreement with the accounting records and returns; or
• certain disclosures of directors’ remuneration specified by law are not made; or • we have not received all the information and explanations we require for our audit; and • a Corporate Governance Statement has not been prepared by the Company.
30 September 2016
Mark Twum-Ampofo (Senior Statutory Auditor) For and on behalf of Kingston Smith LLP, Statutory Auditor Devonshire House
60 Goswell Road London EC1M 7AD

AVATION PLC CONSOLIDATED STATEMENT OF PROFIT OR LOSS AND OTHER COMPREHENSIVE INCOME FOR THE FINANCIAL YEAR ENDED 30 JUNE 2016
Note 2016 2015 US$’000s US$’000s Continuing operations Lease revenue 71,190 56,932 Other income 9 3,045 3,202 74,235 60,134 Depreciation 25 (23,201) (17,775) Gain/(loss) on disposal of aircraft 3,660 (729) Impairment loss on aircraft (902) - Administrative expenses 10 (7,550) (7,199) Other expenses 11 (669) (823) Operating profit 45,573 33,608 Finance income 12 1,202 807 Finance expenses 13 (28,706) (18,895)
Profit before taxation 15 18,069 15,520 Taxation 16 202 (1,039)
Profit from continuing operations 18,271 14,481 Discontinued operations Profit/(Loss) from discontinued operations 17 9 (1,196)
Total profit 18,280 13,285
Other comprehensive income: Items that may be reclassified subsequently to profit or loss: Currency translation differences arising on consolidation (6) (23) Fair value loss on derivative financial instruments (2,158) (229)
(2,164) (252) Items that may not be reclassified subsequently to profit or loss: Revaluation gain on property, plant and equipment, net of tax 30,987 - Other comprehensive income, net of tax 28,823 (252) Total comprehensive income for the year 47,103 13,033
Profit attributable to: Equity holders of the Company 18,279 13,036 Non-controlling interests 1 249
18,280 13,285 Total comprehensive income attributable to: Equity holders of the Company 47,098 12,786 Non-controlling interests 5 247
47,103 13,033
30
AVATION PLC CONSOLIDATED STATEMENT OF PROFIT OR LOSS AND OTHER COMPREHENSIVE INCOME FOR THE FINANCIAL YEAR ENDED 30 JUNE 2016
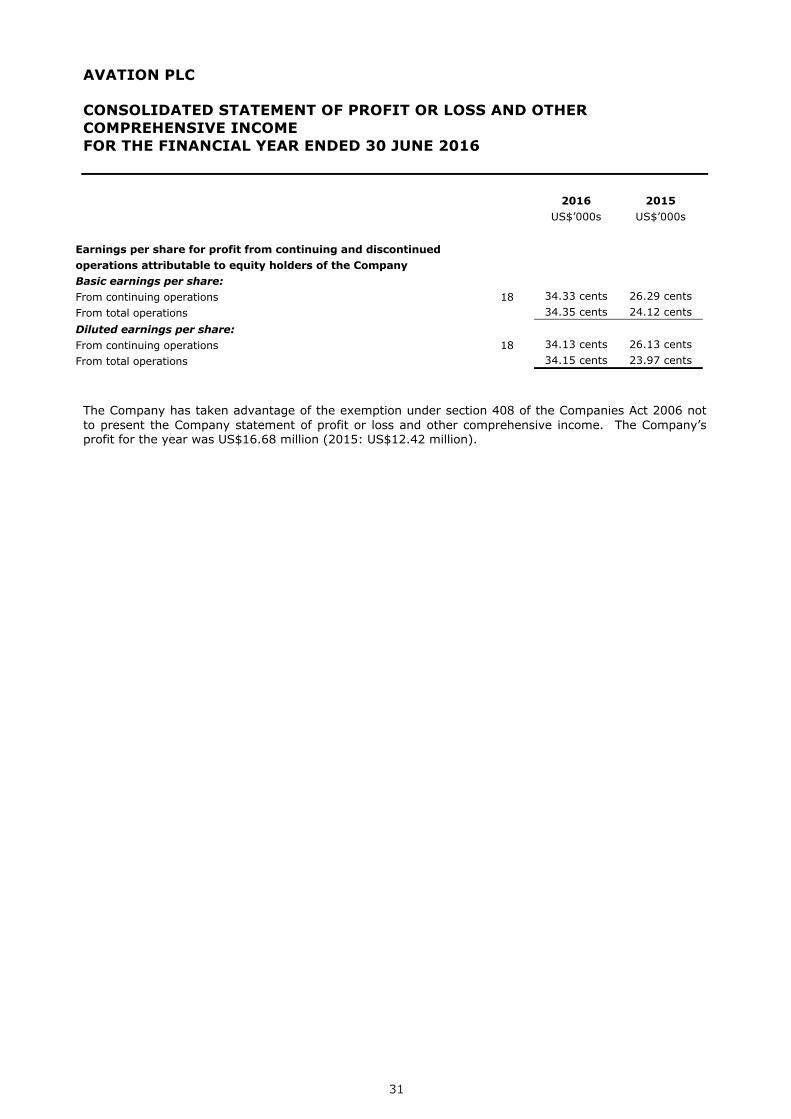
2016 2015 US$’000s US$’000s Earnings per share for profit from continuing and discontinued operations attributable to equity holders of the Company Basic earnings per share: From continuing operations 18 34.33 cents 26.29 cents From total operations 34.35 cents 24.12 cents
Diluted earnings per share: From continuing operations 18 34.13 cents 26.13 cents From total operations 34.15 cents 23.97 cents
The Company has taken advantage of the exemption under section 408 of the Companies Act 2006 not to present the Company statement of profit or loss and other comprehensive income. The Company’s profit for the year was US$16.68 million (2015: US$12.42 million).
31

AVATION PLC CONSOLIDATED STATEMENT OF FINANCIAL POSITION FOR THE FINANCIAL YEAR ENDED 30 JUNE 2016
Note 2016 2015 US$’000s US$’000s ASSETS: Current assets: Cash and cash equivalents 19 48,267 108,647 Trade and other receivables 20 5,631 4,362 Loan receivable 21 - 19,600 Finance lease receivables 22 3,032 - Options held for trading 23 3,040 - Assets held for sale - 30 Total current assets 59,970 132,639 Non-current assets: Trade and other receivables 20 11,304 17,080 Finance lease receivables 22 33,627 - Property, plant and equipment 25 724,982 434,079 Goodwill 26 1,902 2,384 Total non-current assets 771,815 453,543
Total assets 831,785 586,182
LIABILITIES AND EQUITY: Current liabilities: Trade and other payables 27 10,065 10,280 Provision for taxation 1,029 431 Loans and borrowings 28 72,423 51,584 Maintenance reserves 29 7,440 825 Total current liabilities 90,957 63,120 Non-current liabilities: Trade and other payables 27 13,471 11,271 Loans and borrowings 28 543,301 376,511 Derivative financial instruments 30 2,387 229 Deferred tax liabilities 31 4,738 6,847 Maintenance reserves 29 3,323 - Total non-current liabilities 567,220 394,858 Equity attributable to shareholders: Share capital 32 993 991 Treasury shares 32 (1) (682) Share premium 38,925 38,692 Merger reserve 6,715 6,715 Asset revaluation reserve 41,142 10,159 Capital reserve 8,876 8,459 Other reserves 34 (1,814) 50 Retained earnings 78,679 62,363 173,515 126,747 Non-controlling interest 93 1,457 Total equity 173,608 128,204 Total liabilities and equity 831,785 586,182 Approved by the board and authorised for issue on 30 September 2016 Robert Jeffries Chatfield Director
32
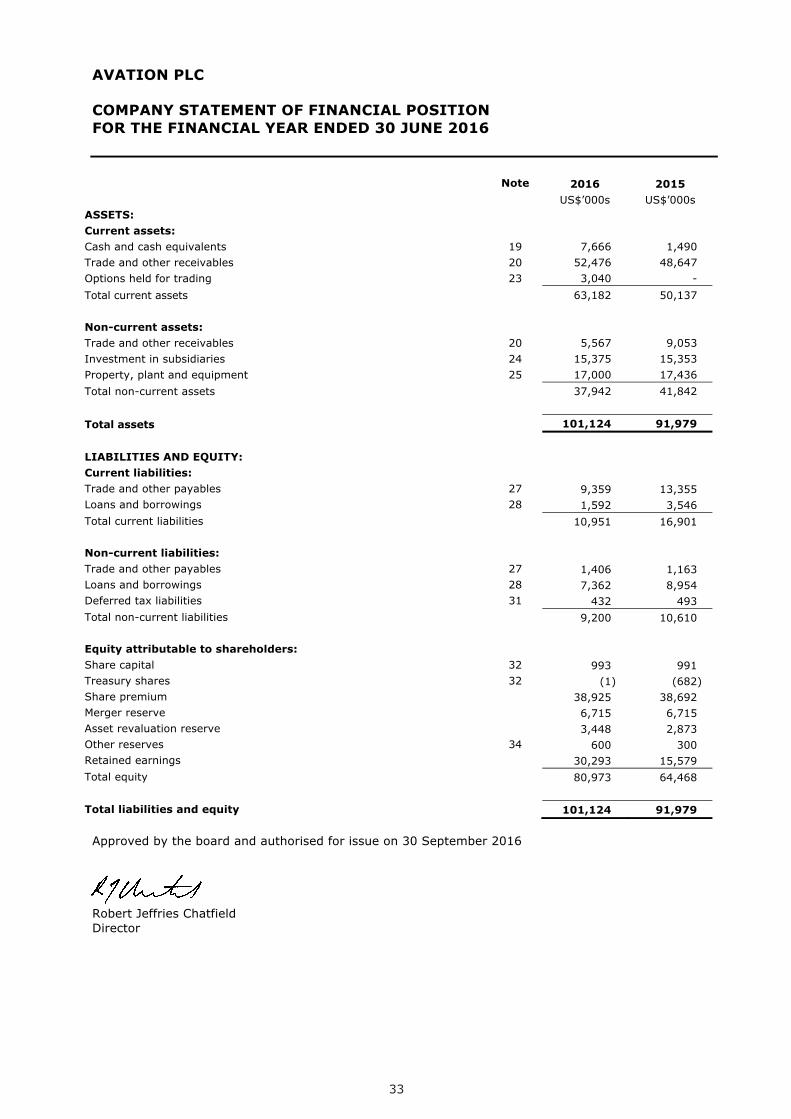
AVATION PLC COMPANY STATEMENT OF FINANCIAL POSITION FOR THE FINANCIAL YEAR ENDED 30 JUNE 2016
Note 2016 2015 US$’000s US$’000s ASSETS: Current assets: Cash and cash equivalents 19 7,666 1,490 Trade and other receivables 20 52,476 48,647 Options held for trading 23 3,040 - Total current assets 63,182 50,137 Non-current assets: Trade and other receivables 20 5,567 9,053 Investment in subsidiaries 24 15,375 15,353 Property, plant and equipment 25 17,000 17,436 Total non-current assets 37,942 41,842
Total assets 101,124 91,979
LIABILITIES AND EQUITY: Current liabilities: Trade and other payables 27 9,359 13,355 Loans and borrowings 28 1,592 3,546 Total current liabilities 10,951 16,901 Non-current liabilities: Trade and other payables 27 1,406 1,163 Loans and borrowings 28 7,362 8,954 Deferred tax liabilities 31 432 493 Total non-current liabilities 9,200 10,610 Equity attributable to shareholders: Share capital 32 993 991 Treasury shares 32 (1) (682) Share premium 38,925 38,692 Merger reserve 6,715 6,715 Asset revaluation reserve 3,448 2,873 Other reserves 34 600 300 Retained earnings 30,293 15,579 Total equity 80,973 64,468 Total liabilities and equity 101,124 91,979 Approved by the board and authorised for issue on 30 September 2016 Robert Jeffries Chatfield Director
33

AV
AT
ION
PLC
C
ON
SO
LID
AT
ED
ST
AT
EM
EN
T O
F C
HA
NG
ES
IN
EQ
UIT
Y
FOR
TH
E F
INA
NC
IAL
YE
AR
EN
DE
D 3
0 J
UN
E 2
01
6
A
ttri
bu
tab
le t
o sh
areh
old
ers
of t
he
par
ent
N
ote
Sh
are
cap
ital
Trea
sury
shar
es
Sh
are
pre
miu
m
Mer
ger
rese
rve
Ass
et
reva
luat
ion
rese
rve
Cap
ital
rese
rve
Oth
er
rese
rves
Ret
ain
ed
earn
ing
s
Tota
l N
on-
con
trol
ling
inte
rest
Tota
l
equ
ity
US$’
000s
U
S$’
000s
U
S$’
000s
U
S$’
000s
U
S$’
000s
U
S$’
000s
U
S$’
000s
U
S$’
000s
U
S$’
000s
U
S$’
000s
U
S$’
000s
Bal
ance
at
1 Ju
ly 2
015
99
1 (6
82)
38,6
92
6,71
5 10
,159
8,
459
50
62,3
63
126,
747
1,45
7 12
8,20
4
Prof
it f
or t
he y
ear
- -
- -
- -
- 18
,279
18
,279
1
18,2
80
Oth
er c
ompr
ehen
sive
inco
me
-
- -
- 30
,983
-
(2,1
64)
- 28
,819
4
28,8
23
Tota
l com
preh
ensi
ve in
com
e
-
- -
- 30
,983
-
(2,1
64)
18,2
79
47,0
98
5 47
,103
Div
iden
d pa
id
39
- -
- -
- -
- (1
,656
) (1
,656
) -
(1,6
56)
Purc
hase
of tr
easu
ry s
hare
s 32
-
(7,9
36)
- -
- -
- -
(7,9
36)
- (7
,936
)
Re-
issu
e of
tre
asur
y sh
ares
32
-
8,61
7 -
- -
- -
(307
) 8,
310
- 8,
310
Trea
sury
sha
res
of a
sub
sidi
ary
- -
- -
- 88
2 -
- 88
2 2
884
Incr
ease
in is
sued
sha
re c
apital
32
2
- 23
3 -
- -
(39)
-
196
- 19
6
War
rant
s ex
pens
e
- -
- -
- -
339
- 33
9 -
339
Cha
nge
in o
wne
rshi
p in
tere
st in
a su
bsid
iary
-
- -
- -
(465
) -
- (4
65)
(1,3
71)
(1,8
36)
Bal
ance
at
30
Ju
ne
20
16
99
3
(1)
38
,92
5
6,7
15
4
1,1
42
8
,87
6
(1,8
14
) 7
8,6
79
1
73
,51
5
93
1
73
,60
8
D
urin
g th
e ye
ar t
he C
ompa
ny p
aid
a di
vide
nd o
f 3.
00 U
S c
ents
(20
15:
2.01
US c
ents
) pe
r sh
are.
O
ther
res
erve
s co
nsis
ts o
f ca
pita
l red
empt
ion
rese
rve,
war
rant
res
erve
, fa
ir v
alue
res
erve
and
for
eign
cur
renc
y tr
ansl
atio
n re
serv
e.
The
mer
ger
rese
rve
aros
e on
acq
uisi
tion
of
addi
tion
al s
hare
s of
the
Com
pany
’s s
ubsi
diar
y C
apital
Lea
se A
viat
ion
PLC
thr
ough
the
allo
tmen
t of
ord
inar
y sh
ares
in
the
yea
r en
ded
30 J
une
2015
. T
he m
erge
r re
serv
e re
pres
ents
the
diff
eren
ce b
etw
een
the
fair
val
ue a
nd t
he n
omin
al v
alue
of
the
shar
es i
ssue
d by
the
C
ompa
ny.
34

AV
AT
ION
PLC
C
ON
SO
LID
AT
ED
ST
AT
EM
EN
T O
F C
HA
NG
ES
IN
EQ
UIT
Y
FOR
TH
E F
INA
NC
IAL
YE
AR
EN
DE
D 3
0 J
UN
E 2
01
5
A
ttri
bu
tab
le t
o sh
areh
old
ers
of t
he
par
ent
N
ote
Sh
are
cap
ital
Trea
sury
shar
es
Sh
are
pre
miu
m
Mer
ger
rese
rve
Ass
et
reva
luat
ion
rese
rve
Cap
ital
rese
rve
Oth
er
rese
rves
Ret
ain
ed
earn
ing
s
Tota
l N
on-
con
trol
ling
inte
rest
Tota
l
equ
ity
US$’
000s
U
S$’
000s
U
S$’
000s
U
S$’
000s
U
S$’
000s
U
S$’
000s
U
S$’
000s
U
S$’
000s
U
S$’
000s
U
S$’
000s
U
S$’
000s
Bal
ance
at
1 Ju
ly 2
014
89
1 (6
82)
31,4
24
- 10
,159
3,
856
12
50,4
46
96,1
06
14,6
61
110,
767
Prof
it f
or t
he y
ear
- -
- -
- -
- 13
,036
13
,036
24
9 13
,285
Oth
er c
ompr
ehen
sive
inco
me
-
- -
- -
- (2
50)
- (2
50)
(2)
(252
)
Tota
l com
preh
ensi
ve in
com
e
-
- -
- -
- (2
50)
13,0
36
12,7
86
247
13,0
33
Div
iden
d pa
id
39
- -
- -
- -
- (1
,119
) (1
,119
) -
(1,1
19)
Trea
sury
sha
res
of a
sub
sidi
ary
- -
- -
- 39
5 -
- 39
5 18
41
3
Incr
ease
in is
sued
sha
re c
apital
32
10
0 -
7,87
1 6,
715
- -
- -
14,6
86
- 14
,686
Sha
re is
sue
expe
nses
32
-
- (6
03)
- -
- -
- (6
03)
- (6
03)
War
rant
s ex
pens
e
- -
- -
- -
288
- 28
8 -
288
Cha
nge
in o
wne
rshi
p in
tere
st in
a su
bsid
iary
-
- -
- -
4,20
8 -
- 4,
208
(13,
469)
(9
,261
)
Bal
ance
at
30
Ju
ne
20
15
99
1
(68
2)
38
,69
2
6,7
15
1
0,1
59
8
,45
9
50
6
2,3
63
1
26
,74
7
1,4
57
1
28
,20
4
35

AV
AT
ION
PLC
C
OM
PA
NY
ST
AT
EM
EN
T O
F C
HA
NG
ES
IN
EQ
UIT
Y
FOR
TH
E F
INA
NC
IAL
YE
AR
EN
DE
D 3
0 J
UN
E 2
01
6
Not
e S
har
e
cap
ital
Tr
easu
ry
shar
es
Sh
are
pre
miu
m
Mer
ger
re
serv
e A
sset
re
valu
atio
n
rese
rve
Oth
er
rese
rves
R
etai
ned
ea
rnin
gs
Tota
l
US$’
000s
U
S$’
000s
U
S$’
000s
U
S$’
000s
U
S$’
000s
U
S$’
000s
U
S$’
000s
U
S$’
000s
Bal
ance
at
1 Ju
ly 2
015
99
1 (6
82)
38,6
92
6,71
5 2,
873
300
15,5
79
64,4
68
Prof
it f
or t
he y
ear
- -
- -
- -
16,6
77
16,6
77
Oth
er c
ompr
ehen
sive
inco
me
-
- -
- 57
5 -
- 57
5 To
tal c
ompr
ehen
sive
inco
me
- -
- -
575
- 16
,677
17
,252
D
ivid
end
paid
39
-
- -
- -
- (1
,656
) (1
,656
) Pu
rcha
se o
f tr
easu
ry s
hare
s
32
- (7
,936
) -
- -
- -
(7,9
36)
Re-
issu
e of
tre
asur
y sh
ares
32
-
8,61
7 -
- -
- (3
07)
8,31
0 In
crea
se in
issu
ed s
hare
cap
ital
32
2
- 23
3 -
- (3
9)
- 19
6 W
arra
nts
expe
nse
-
- -
- -
339
- 33
9
B
alan
ce a
t 3
0 J
un
e 2
01
6
9
93
(1
) 3
8,9
25
6
,71
5
3,4
48
6
00
3
0,2
93
8
0,9
73
D
urin
g th
e ye
ar t
he C
ompa
ny p
aid
a di
vide
nd o
f 3.
00 U
S c
ents
(20
15:
2.01
US c
ents
) pe
r sh
are.
36
AV
AT
ION
PLC
C
OM
PA
NY
ST
AT
EM
EN
T O
F C
HA
NG
ES
IN
EQ
UIT
Y
FOR
TH
E F
INA
NC
IAL
YE
AR
EN
DE
D 3
0 J
UN
E 2
01
5
Not
e S
har
e
cap
ital
Tr
easu
ry
shar
es
Sh
are
pre
miu
m
Mer
ger
re
serv
e A
sset
re
valu
atio
n
rese
rve
Oth
er
rese
rves
R
etai
ned
ea
rnin
gs
Tota
l
US$’
000s
U
S$’
000s
U
S$’
000s
U
S$’
000s
U
S$’
000s
U
S$’
000s
U
S$’
000s
U
S$’
000s
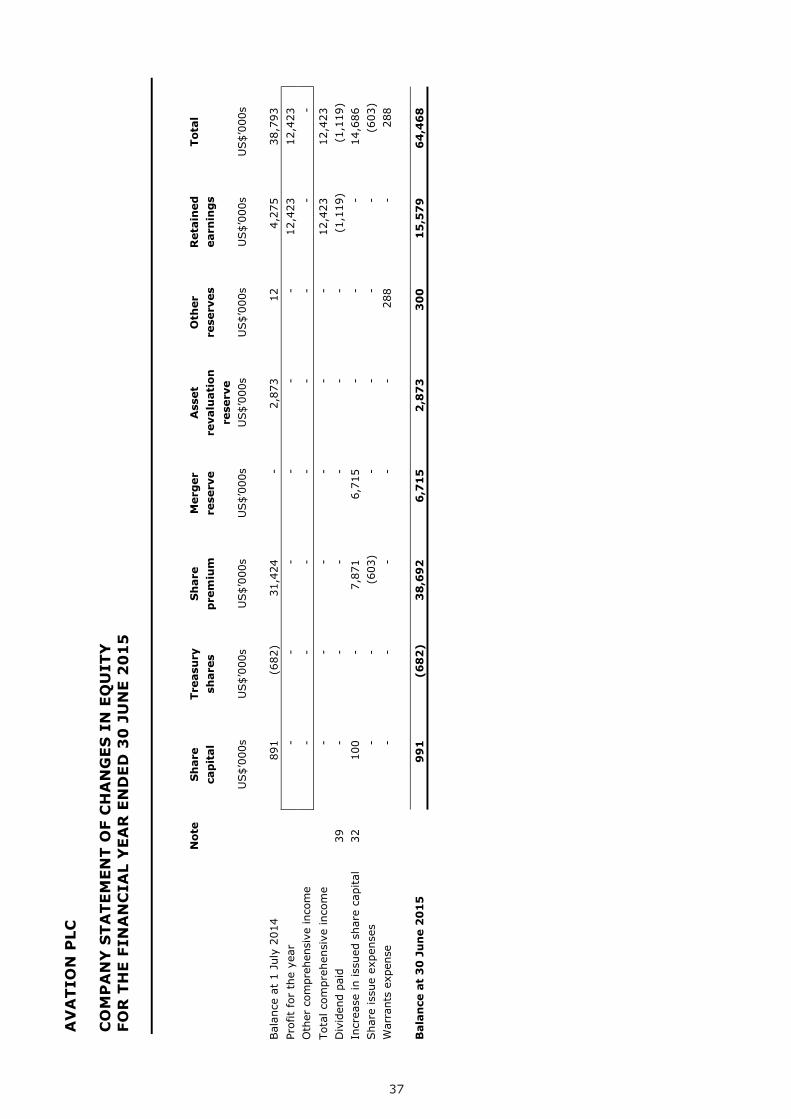
Bal
ance
at
1 Ju
ly 2
014
89
1 (6
82)
31,4
24
- 2,
873
12
4,27
5 38
,793
Pr
ofit f
or t
he y
ear
- -
- -
- -
12,4
23
12,4
23
Oth
er c
ompr
ehen
sive
inco
me
-
- -
- -
- -
- To
tal c
ompr
ehen
sive
inco
me
- -
- -
- -
12,4
23
12,4
23
Div
iden
d pa
id
39
- -
- -
- -
(1,1
19)
(1,1
19)
Incr
ease
in is
sued
sha
re c
apital
32
10
0 -
7,87
1 6,
715
- -
- 14
,686
Sha
re is
sue
expe
nses
- -
(603
) -
- -
- (6
03)
War
rant
s ex
pens
e
- -
- -
- 28
8 -
288
Bal
ance
at
30
Ju
ne
20
15
99
1
(68
2)
38
,69
2
6,7
15
2
,87
3
30
0
15
,57
9
64
,46
8
37

AVATION PLC CONSOLIDATED STATEMENT OF CASH FLOWS FOR THE FINANCIAL YEAR ENDED 30 JUNE 2016
Note 2016 2015 US$’000s US$’000s Cash flows from operating activities: Profit before taxation from continuing operations 18,069 15,520 Profit /(Loss) before taxation from discontinued operations 9 (1,625) Profit before income tax 18,078 13,895 Adjustments for: Depreciation expense 23,201 17,925 Warrants expense 14 339 288 Discount on early settlement of loans 9 - (1,160) Impairment loss on aircraft 902 3,850 Impairment loss on trade receivables 11 7 145 Impairment loss on goodwill 11 482 - Amortisation of loan insurance premium 13 1,078 1,078 Amortisation of interest expense on non-current deposits 13 376 317 (Gain)/Loss on disposal of aircraft (3,660) 729 (Gain)/Loss on disposal of assets held for sale (25) 1,600 Fair value gain on options held for trading 9 (2,940) - Finance income from discounting non-current deposits to fair value 12 (393) (309) Interest income 12 (809) (498) Interest expense 13 26,811 17,295 Operating cash flows before working capital changes 63,447 55,155 Movement in working capital: Trade and other receivables and finance lease receivables 3,798 (141) Trade and other payables 1,226 4,194 Maintenance reserves 9,938 825 Cash from operations 78,409 60,033 Interest received 809 498 Interest paid (26,034) (16,228) Income tax paid (637) (852) Net cash from operating activities 52,547 43,451 Cash flows from investing activities: Purchase of property, plant and equipment (323,222) (110,173) Purchase of options held for trading (100) - Proceeds from disposal of aircraft 24,755 18,074 Proceeds from disposal of assets held for sale 55 1,210 Investment in loans receivable - (19,600) Purchase of additional shares in a subsidiary from non-controlling interest (22) (843) Repurchase of a subsidiary’s treasury shares (884) (413)
Net cash used in investing activities (299,418) (111,745) Cash flows from financing activities: Net proceeds from issuance of ordinary shares 196 6,591 Dividends paid to shareholders (1,656) (1,119) Repurchase of treasury shares (7,936) - Proceeds from sale of treasury shares 8,310 - Dividend paid to non-controlling interest of a subsidiary (46) - Proceeds from loans and borrowings, net of transactions costs 233,869 212,410 Repayment of loans and borrowings (46,240) (64,313)
Net cash from financing activities 186,497 153,569 Effects of exchange rates on cash and cash equivalents (6) (23)
Net (decrease)/increase in cash and cash equivalents (60,380) 85,252 Cash and cash equivalents at beginning of financial year 108,647 23,395
Cash and cash equivalents at end of financial year 48,267 108,647
38
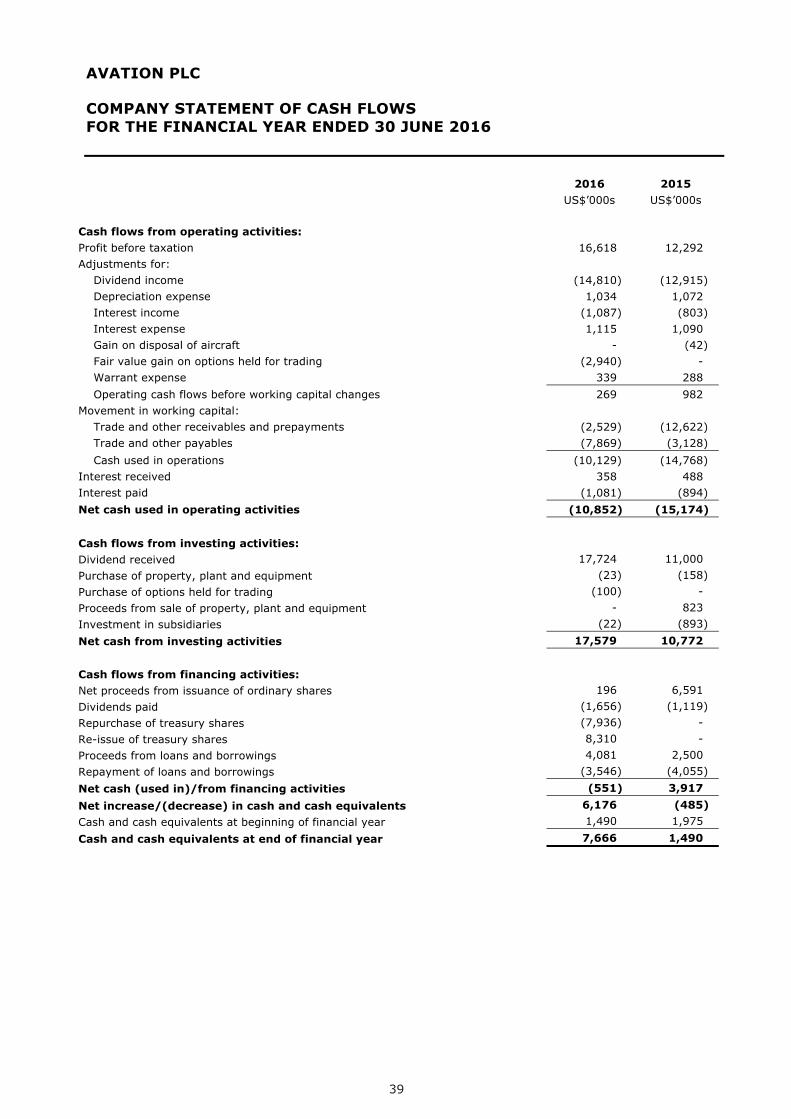
AVATION PLC COMPANY STATEMENT OF CASH FLOWS FOR THE FINANCIAL YEAR ENDED 30 JUNE 2016
2016 2015 US$’000s US$’000s Cash flows from operating activities: Profit before taxation 16,618 12,292 Adjustments for: Dividend income (14,810) (12,915) Depreciation expense 1,034 1,072 Interest income (1,087) (803) Interest expense 1,115 1,090 Gain on disposal of aircraft - (42) Fair value gain on options held for trading (2,940) - Warrant expense 339 288 Operating cash flows before working capital changes 269 982 Movement in working capital: Trade and other receivables and prepayments (2,529) (12,622) Trade and other payables (7,869) (3,128) Cash used in operations (10,129) (14,768) Interest received 358 488 Interest paid (1,081) (894) Net cash used in operating activities (10,852) (15,174) Cash flows from investing activities: Dividend received 17,724 11,000 Purchase of property, plant and equipment (23) (158) Purchase of options held for trading (100) - Proceeds from sale of property, plant and equipment - 823 Investment in subsidiaries (22) (893)
Net cash from investing activities 17,579 10,772 Cash flows from financing activities: Net proceeds from issuance of ordinary shares 196 6,591 Dividends paid (1,656) (1,119) Repurchase of treasury shares (7,936) - Re-issue of treasury shares 8,310 - Proceeds from loans and borrowings 4,081 2,500 Repayment of loans and borrowings (3,546) (4,055)
Net cash (used in)/from financing activities (551) 3,917 Net increase/(decrease) in cash and cash equivalents 6,176 (485) Cash and cash equivalents at beginning of financial year 1,490 1,975
Cash and cash equivalents at end of financial year 7,666 1,490
39

AVATION PLC NOTES TO THE FINANCIAL STATEMENTS FOR THE FINANCIAL YEAR ENDED 30 JUNE 2016 1 GENERAL
Avation PLC is a public limited company incorporated in England and Wales under the Companies Act 2006 (Registration Number 05872328) and is listed as a Standard Listing on the London Stock Exchange. The address of the registered office is given on page 4.
As disclosed in the Directors’ Report, the Group’s principal activity is aircraft leasing. Details of the activities of subsidiary companies are set out in Note 24 to these financial statements.
2 STATEMENT OF COMPLIANCE
These financial statements have been prepared in accordance with International Financial Reporting Standards, International Accounting Standards and their interpretations issued or adopted by the International Accounting Standards Board as adopted by the European Union (“IFRS”).
3 SUMMARY OF SIGNIFICANT ACCOUNTING POLICIES
(a) BASIS OF PREPARATION – The financial statements have been prepared in accordance with IFRS including standards and interpretations issued by the International Accounting Standards Board (“IASB”). The financial statements have been prepared on a going concern basis and have been prepared in accordance with the historical cost convention, as modified by the revaluation of certain assets and liabilities. The financial statements are presented in United States Dollars and all values are rounded to the nearest thousand (US$’000s). The year-end exchange rate for Pounds Sterling to United States Dollars is 1.339. The preparation of financial statements in conformity with IFRS requires the use of estimates and assumptions that affect the reported amounts of assets and liabilities and disclosure of contingent assets and liabilities at the date of the financial statements and the reported amounts of revenues and expenses during the financial period. Although these estimates are based on management’s best knowledge of current events and actions, actual results may ultimately differ from those estimates. The accounting policies set out below have been applied consistently throughout the financial period presented in these financial statements and have been applied consistently by the Company and its subsidiaries, unless otherwise disclosed.
40

AVATION PLC NOTES TO THE FINANCIAL STATEMENTS FOR THE FINANCIAL YEAR ENDED 30 JUNE 2016 3 SUMMARY OF SIGNIFICANT ACCOUNTING POLICIES (continued)
(b) BASIS OF CONSOLIDATION - The consolidated financial statements comprise the financial statements of the Company and its subsidiaries as at 30 June 2016. Subsidiaries are all entities over which the Group has control. Control is achieved when the Group is exposed, or has rights, to variable returns from its involvement with the investee and has the ability to affect those returns through its power over the investee.
Specifically, the Group controls an investee if and only if the Group has:
• Power over the investee (i.e. existing rights that give it the current ability to direct
the relevant activities of the investee) • Exposure, or rights, to variable returns from its involvement with the investee, and • The ability to use its power over the investee to affect its returns
When the Group has less than a majority of the voting or similar rights of an investee, the Group considers all relevant facts and circumstances in assessing whether it has power over an investee, including:
• The contractual arrangement with the other vote holders of the investee • Rights arising from other contractual arrangements • The Group’s voting rights and potential voting rights
Whether or not the Group controls an investee is re-assessed if facts and circumstances indicate that there are changes to one or more of the three elements of control. Consolidation of a subsidiary begins when the Group obtains control over the subsidiary and ceases when the Group loses control of the subsidiary. Assets, liabilities, income and expenses of a subsidiary acquired or disposed of during the year are included in the statement of comprehensive income from the date the Group gains control until the date the Group ceases to control the subsidiary. Profit or loss and each component of other comprehensive income (“OCI”) are attributed to the equity holders of the parent of the Group and to the non-controlling interests, even if this results in the non-controlling interests having a deficit balance. When necessary, adjustments are made to the financial statements of subsidiaries to bring their accounting policies into line with the Group’s accounting policies. All intra-group assets and liabilities, equity, income, expenses and cash flows relating to transactions between members of the Group are eliminated in full on consolidation. A change in the ownership interest of a subsidiary, without a loss of control, is accounted for as an equity transaction. If the Group loses control over a subsidiary, it:
• Derecognises the assets (including goodwill) and liabilities of the subsidiary • Derecognises the carrying amount of any non-controlling interests • Derecognises the cumulative translation differences recorded in equity • Recognises the fair value of the consideration received • Recognises the fair value of any investment retained • Recognises any surplus or deficit in profit or loss • Reclassifies the parent’s share of components previously recognised in OCI to profit
or loss or retained earnings, as appropriate, as would be required if the Group had directly disposed of the related assets or liabilities.
Investments in subsidiaries are stated at cost less impairment in the Company’s separate financial statements. For all non-controlling interests voting rights not controlled by the Group are equivalent to ownership interests.
41
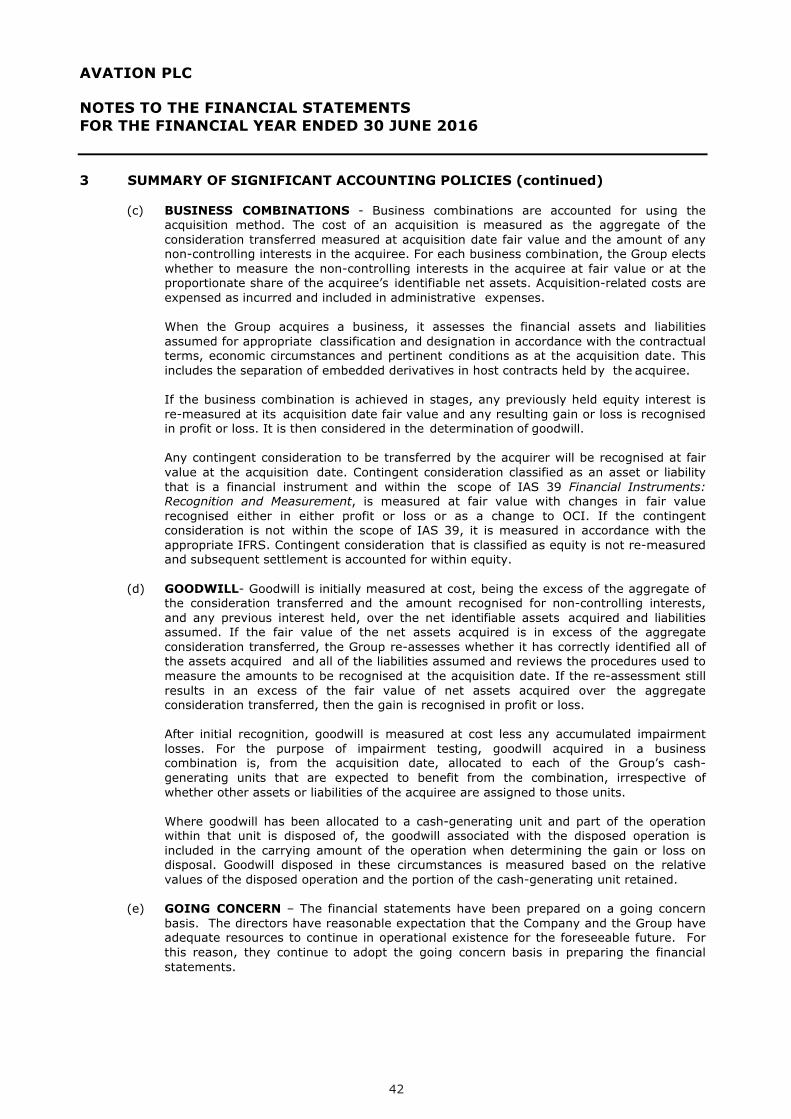
AVATION PLC NOTES TO THE FINANCIAL STATEMENTS FOR THE FINANCIAL YEAR ENDED 30 JUNE 2016 3 SUMMARY OF SIGNIFICANT ACCOUNTING POLICIES (continued)
(c) BUSINESS COMBINATIONS - Business combinations are accounted for using the acquisition method. The cost of an acquisition is measured as the aggregate of the consideration transferred measured at acquisition date fair value and the amount of any non-controlling interests in the acquiree. For each business combination, the Group elects whether to measure the non-controlling interests in the acquiree at fair value or at the proportionate share of the acquiree’s identifiable net assets. Acquisition-related costs are expensed as incurred and included in administrative expenses. When the Group acquires a business, it assesses the financial assets and liabilities assumed for appropriate classification and designation in accordance with the contractual terms, economic circumstances and pertinent conditions as at the acquisition date. This includes the separation of embedded derivatives in host contracts held by the acquiree. If the business combination is achieved in stages, any previously held equity interest is re-measured at its acquisition date fair value and any resulting gain or loss is recognised in profit or loss. It is then considered in the determination of goodwill. Any contingent consideration to be transferred by the acquirer will be recognised at fair value at the acquisition date. Contingent consideration classified as an asset or liability that is a financial instrument and within the scope of IAS 39 Financial Instruments: Recognition and Measurement, is measured at fair value with changes in fair value recognised either in either profit or loss or as a change to OCI. If the contingent consideration is not within the scope of IAS 39, it is measured in accordance with the appropriate IFRS. Contingent consideration that is classified as equity is not re-measured and subsequent settlement is accounted for within equity.
(d) GOODWILL- Goodwill is initially measured at cost, being the excess of the aggregate of
the consideration transferred and the amount recognised for non-controlling interests, and any previous interest held, over the net identifiable assets acquired and liabilities assumed. If the fair value of the net assets acquired is in excess of the aggregate consideration transferred, the Group re-assesses whether it has correctly identified all of the assets acquired and all of the liabilities assumed and reviews the procedures used to measure the amounts to be recognised at the acquisition date. If the re-assessment still results in an excess of the fair value of net assets acquired over the aggregate consideration transferred, then the gain is recognised in profit or loss. After initial recognition, goodwill is measured at cost less any accumulated impairment losses. For the purpose of impairment testing, goodwill acquired in a business combination is, from the acquisition date, allocated to each of the Group’s cash-generating units that are expected to benefit from the combination, irrespective of whether other assets or liabilities of the acquiree are assigned to those units. Where goodwill has been allocated to a cash-generating unit and part of the operation within that unit is disposed of, the goodwill associated with the disposed operation is included in the carrying amount of the operation when determining the gain or loss on disposal. Goodwill disposed in these circumstances is measured based on the relative values of the disposed operation and the portion of the cash-generating unit retained.
(e) GOING CONCERN – The financial statements have been prepared on a going concern basis. The directors have reasonable expectation that the Company and the Group have adequate resources to continue in operational existence for the foreseeable future. For this reason, they continue to adopt the going concern basis in preparing the financial statements.
42
AVATION PLC NOTES TO THE FINANCIAL STATEMENTS FOR THE FINANCIAL YEAR ENDED 30 JUNE 2016 3 SUMMARY OF SIGNIFICANT ACCOUNTING POLICIES (continued)
(f) FAIR VALUE MEASUREMENT – The Group measures financial instruments, such as derivatives, and non-financial assets such as aircraft, at fair values at each reporting date. The fair values of debt instruments are not considered to be materially different from their amortised cost.
Fair value is the price that would be received to sell an asset or paid to transfer a liability in an orderly transaction between market participants at the measurement date. Fair value measurement is based on the presumption that the transaction to sell the asset or transfer the liability takes place either:
• In the principal market for the asset or liability, or • In the absence of a principal market, in the most advantageous market for the
asset or liability The principal or the most advantageous market must be accessible by the Group. The fair value of an asset or a liability is measured using the assumptions that market participants would use when pricing the asset or liability, assuming that market participants act in their economic best interest. A fair value measurement of a non-financial asset takes into account a market participant's ability to generate economic benefits by using the asset in its highest and best use or by selling it to another market participant that would use the asset in its highest and best use. The Group uses valuation techniques that are appropriate in the circumstances and for which sufficient data are available to measure fair value, maximising the use of relevant observable inputs and minimising the use of unobservable inputs. In the case of aircraft, unless otherwise disclosed, the assets are valued using lease encumbered value (“LEV”). Under such a valuation, which reflects highest and best use given the fact that the aircraft are held for use in a leasing business, the income streams associated with the lease and the expected future market value of the aircraft at the end of the lease are discounted to current values. The valuers prepare their valuation report based on the market for second hand aircraft, which is active, known and measurable. All assets and liabilities for which fair value is measured or disclosed in the financial statements are categorised within the fair value hierarchy, described as follows, based on the lowest level input that is significant to the fair value measurement as a whole:
• Level 1 – Quoted (unadjusted) market prices in active markets for identical assets
or liabilities • Level 2 – Valuation techniques for which the lowest level input that is significant to
the fair value measurement is directly or indirectly observable • Level 3 – Valuation techniques for which the lowest level input that is significant to
the fair value measurement is unobservable For assets and liabilities that are recognised in the financial statements on a recurring basis, the Group determines whether transfers have occurred between Levels in the hierarchy by re-assessing categorisation (based on the lowest level input that is significant to the fair value measurement as a whole) at the end of each reporting period.
43

AVATION PLC NOTES TO THE FINANCIAL STATEMENTS FOR THE FINANCIAL YEAR ENDED 30 JUNE 2016 3 SUMMARY OF SIGNIFICANT ACCOUNTING POLICIES (continued)
(f) FAIR VALUE MEASUREMENT (continued)
The Group’s management determines the policies and procedures for both recurring fair value measurement, such as aircraft and unquoted available for sale (“AFS”) financial assets, and for non-recurring measurement, such as assets held for distribution in discontinued operations. External valuers are involved for valuation of significant assets, such as aircraft and AFS financial assets, and significant liabilities, such as contingent consideration. At each reporting date, management analyses the movements in the values of assets and liabilities which are required to be re-measured or re-assessed as per the Group’s accounting policies. For this analysis, the management verifies the major inputs applied in the latest valuation by agreeing the information in the valuation computation to contracts and other relevant documents so far as possible. Management, in conjunction with the Group’s external valuers, also compares the changes in the fair value of each asset and liability with relevant external sources to determine whether the change is reasonable. For the purpose of fair value disclosures, the Group has determined classes of assets and liabilities on the basis of the nature, characteristics and risks of the asset or liability and the level of the fair value hierarchy as explained above.
(g) PROPERTY, PLANT AND EQUIPMENT – All items of property, plant and equipment are
initially recorded at cost. Such cost include the cost of replacing part of the property. The cost of an item of property, plant and equipment is recognised as an asset if, it is probable that future economic benefits associated with the item will flow to the Group and the cost of the item can be measured reliably. Subsequent to recognition, aircraft are stated in the statement of financial position at their fair value. All items of property plant and equipment other than aircraft are measured at cost less any accumulated depreciation and accumulated impairment losses. Revaluations are performed with sufficient regularity such that the carrying amount does not differ materially from that which would be determined using fair values at the reporting date. However, these aircraft have been reviewed for impairment. Any revaluation increase arising on the revaluation of such aircraft is credited to the assets revaluation reserve, except to the extent that it reverses a revaluation decrease for the same asset previously recognised in profit or loss, in which case the increase is credited to profit or loss to the extent of the decrease previously charged. A decrease in carrying amount arising on the revaluation of such aircraft is charged to profit or loss to the extent that it exceeds the balance, if any, held in the assets revaluation reserve relating to a previous revaluation of that asset. Depreciation on revalued aircraft is charged to profit or loss. On the subsequent sale or retirement of a revalued aircraft, the attributable revaluation surplus remaining in the asset revaluation reserve is transferred directly to retained earnings. Depreciation is charged so as to write off the cost or valuation of assets less residual values, over their estimated useful lives, using the straight-line method, on the following bases:
Jets 25 years from date of manufacture Turbo props 25 years from date of manufacture Furniture and equipment 3 years
44

AVATION PLC NOTES TO THE FINANCIAL STATEMENTS FOR THE FINANCIAL YEAR ENDED 30 JUNE 2016 3 SUMMARY OF SIGNIFICANT ACCOUNTING POLICIES (continued)
(g) PROPERTY, PLANT AND EQUIPMENT (continued)
Residual values, useful lives and depreciation methods are revised and adjusted if appropriate, at each reporting date. Residual values of aircraft are based on their estimated scrap value.
Fully depreciated assets still in use are retained in the financial statements.
The gain or loss arising on the disposal or retirement of an item of property, plant and equipment is determined as the difference between the sales proceeds and the carrying amount of the asset and is recognised in profit or loss.
(h) NON-CURRENT ASSETS HELD FOR SALE – Non-current assets (and disposal groups)
classified as held for sale are measured at the lower of carrying amount and fair value less costs to sell. Non-current assets and disposal groups are classified as held for sale if their carrying amount will be recovered through a sale transaction rather than through continuing use. This condition is regarded as met only when the sale is highly probable and the asset (or disposal) group is available for immediate sale in its present condition. Management must be committed to the sale which should be expected to qualify for recognition as a completed sale within one year from the date of classification.
(i) IMPAIRMENT OF NON-FINANCIAL ASSETS - At each reporting date the Group assesses whether there is an indication that an asset may be impaired. If any indication exists, or when an annual impairment testing for an asset is required, the Group makes an estimate of the asset's recoverable amount.
An asset's recoverable amount is the higher of an asset's or cash-generating unit's fair value less costs of disposal and its value-in-use and is determined for an individual asset, unless the asset does not generate cash inflows that are largely independent of those from other assets or group of assets. Where the carrying amount of an asset or cash-generating unit exceeds its recoverable amount, the asset is considered impaired and is written down to its recoverable amount. In assessing value-in-use, the estimated future cash flows expected to be generated by the asset are discounted to their present value using a pre-tax discount rate that reflects current market assessments of the time value of money and the risks specific to the asset. In determining fair value less costs of disposal, recent market transactions are taken into account, if available. If no such costs can be identified, an appropriate valuation model is used.
45
AVATION PLC NOTES TO THE FINANCIAL STATEMENTS FOR THE FINANCIAL YEAR ENDED 30 JUNE 2016 3 SUMMARY OF SIGNIFICANT ACCOUNTING POLICIES (continued)
(i) IMPAIRMENT OF NON-FINANCIAL ASSETS (continued)
Impairment losses are recognised in profit or loss. An assessment is made at each reporting date as to whether there is any indication that previously recognised impairment losses may no longer exist or may have decreased. If such indication exists, the Group estimates the asset's or cash-generating unit's recoverable amount. A previously recognised impairment loss is reversed only if there has been a change in the estimates used to determine the asset's recoverable amount since the last impairment loss was recognised. If that is the case, the carrying amount of the asset is increased to its recoverable amount. That increase cannot exceed the carrying amount that would have been determined, net of depreciation, had no impairment loss been recognised previously. Such reversal is recognised in profit or loss. Impairment losses are recognised as an immediate expense. However, the impairment loss shall be recognised in other comprehensive income to the extent of any credit balance existing in the revaluation surplus in respect of that asset. The decrease recognised in other comprehensive income reduces the amount accumulated in equity under the heading of revaluation surplus.
(j) JOINTLY CONTROLLED ASSETS – A jointly controlled asset involves joint control and
ownership by the Group and other venturers of assets contributed to or acquired. The Group accounts for its share of the jointly controlled assets, any liabilities it has incurred, its share of any liabilities jointly incurred with other ventures, income from the sale or used of its share of the joint venture’s output, together with its share of the expense incurred by the joint venture, and any expenses it incurs in relation to its interest in the joint venture.
(k) PROVISIONS - Provisions are recognised when the Group has a present obligation as a
result of a past event, and it is probable that the Group will be required to settle that obligation. Provisions are measured at the directors’ best estimate of the expenditure required to settle the obligation at the reporting date, and are discounted to present value where the effect is material.
(l) MAINTENANCE RESERVES - Normal maintenance and repairs, airframe and engine
overhauls, and compliance with return conditions of the aircraft placed on operating leases are provided by and paid for by the lessees. Certain lease agreements require the lessees to make maintenance reserve contributions to the Group which subsequently can be drawn on to pay for certain maintenance events carried out. These maintenance reserve balances are accounted for as liabilities. Upon termination of the lease, any unutilised maintenance reserve balance will be released to profit and loss or continued to be retained as reserves for drawdown by the follow-on operator. Upon sale of the aircraft, any unutilised maintenance reserve balance held in respect of historic operation of the aircraft that are required to maintain the aircraft to the required standards by a follow-on operator are provided as a charge to profit and loss.
46
AVATION PLC NOTES TO THE FINANCIAL STATEMENTS FOR THE FINANCIAL YEAR ENDED 30 JUNE 2016 3 SUMMARY OF SIGNIFICANT ACCOUNTING POLICIES (continued)
(m) SHARE-BASED PAYMENTS – The cost of share based payment arrangements whereby
employees receive remuneration in the form of warrants, is recognised as an employee benefit expense in profit or loss. The total expense to be apportioned over the vesting period of the benefit is determined by reference to the fair value at date of grant. The assumption underlying the number of warrants expected to vest are subsequently adjusted for the effects of non-market based vesting conditions prevailing at the reporting date. Fair value is measured by the use of the Black-Scholes method and is based on a reasonable expectation of the extent to which performance criteria will be met.
(n) LEASES – The Group leases aircraft to airlines under operating leases. Leases of aircraft
where the Group retains substantially all risks and rewards incidental to ownership are classified as operating leases. Rental income from operating leases (net of any incentives given to the lessees) is recognised in the profit or loss on a straight-line basis over the lease term.
The Group leases aircraft for use in the business. Where the Group bears substantially all the risk and rewards of ownership of the item, the lease is classified as a finance lease and the item is capitalised within the appropriate class of property, plant and equipment at the lower of the fair value of the leased item and the minimum lease payments. Each lease payment is allocated between the liability and finance charges so as to obtain a constant rate on the finance balance outstanding. The outstanding capital element of the lease payments are included within current and long-term payables as appropriate; the interest element of the lease payments is charged to profit or loss over the period of the lease so as to produce a constant periodic rate of interest on the remaining balance of the liability for each period.
(o) BORROWING COSTS - Borrowing costs are capitalised as part of the cost of a
qualifying asset if they are directly attributable to the acquisition, construction or production of that asset. Capitalisation of borrowing costs commences when the activities to prepare the asset for its intended use or sale are in progress and the expenditures and borrowing costs are incurred. Borrowing costs are capitalised until the assets are substantially completed for their intended use or sale. All other borrowing costs are expensed in the period they occur. Borrowing costs consist of interest and other costs that an entity incurs in connection with the borrowing of funds.
47

AVATION PLC NOTES TO THE FINANCIAL STATEMENTS FOR THE FINANCIAL YEAR ENDED 30 JUNE 2016 3 SUMMARY OF SIGNIFICANT ACCOUNTING POLICIES (continued)
(p) REVENUE RECOGNITION – Revenue is measured at the fair value of the consideration received or receivable and represents amounts receivable for goods and services provided in the normal course of business, net of discounts and sales related taxes.
(i) Aircraft lease revenue is recognised in the profit or loss on a straight line basis
over the terms of the lease. Lease incentives granted are recognised as an integral part of the total rental income.
(ii) Interest income is accrued on a time basis, by reference to the principal
outstanding and at the effective interest rate applicable, which is the rate that exactly discounts estimated future cash receipts through the expected life of the financial asset to that asset’s net carrying amount.
(iii) Sales of goods are recognised when goods are delivered and title has passed.
(iv) Dividend income from investments is recognised when the shareholders’ right to receive payment have been established.
(v) Licence fees received are recognised over the life of the licence agreement.
Ongoing royalties and commissions pursuant to the licence agreement are recognised as earned.
(q) CONTINGENCIES – A contingent liability is:
(i) a possible obligation that arises from past events and whose existence will be
confirmed only by the occurrence or non-occurrence of one or more uncertain future events not wholly within the control of the Group; or
(ii) a present obligation that arises from past events but is not recognised because:
i. It is not probable that an outflow of resources embodying economic benefits
will be required to settle the obligation; or ii. The amount of the obligation cannot be measured with sufficient reliability.
A contingent asset is a possible asset that arises from past events and whose existence will be confirmed only by the occurrence or non-occurrence of one or more uncertain future events not wholly within the control of the Group.
48

AVATION PLC NOTES TO THE FINANCIAL STATEMENTS FOR THE FINANCIAL YEAR ENDED 30 JUNE 2016 3 SUMMARY OF SIGNIFICANT ACCOUNTING POLICIES (continued)
(r) TAXATION - Taxation expense represents the sum of current tax and deferred tax. Current tax is based on taxable profit for the financial period. Taxable profit differs from profit as reported in profit or loss because it excludes items of income or expense that are taxable or deductible in other years and it further excludes items that are never taxable or deductible. The Group’s liability for current tax is calculated using tax rates that have been enacted or substantively enacted by the reporting date. Deferred tax is recognised on differences between the carrying amounts of assets and liabilities in the financial statements and the corresponding tax bases used in the computation of taxable profit. Deferred tax liabilities are generally recognised for all taxable temporary differences and deferred tax assets are recognised to the extent that it is probable that taxable profits will be available against which deductible temporary differences can be utilised. Such assets and liabilities are not recognised if the temporary difference arises from goodwill or from the initial recognition (other than in a business combination) of other assets and liabilities in a transaction that affects neither the taxable profit nor the accounting profit. Deferred tax liabilities are recognised for taxable temporary differences arising on investments in subsidiaries, except where the Group is able to control the reversal of the temporary difference and it is probable that the temporary difference will not reverse in the foreseeable future. The carrying amount of deferred tax assets is reviewed at each reporting date and reduced to the extent that it is no longer probable that sufficient taxable profits will be available to allow all or part of the asset to be recovered. Deferred tax is calculated at the tax rates that are expected to apply in the period when the liability is settled or the asset realised. Deferred tax is charged or credited to profit or loss, except when it relates to items charged or credited directly to equity, in which case the deferred tax is also dealt with in equity. Deferred tax assets and liabilities are offset when there is a legally enforceable right to set off current tax assets against current tax liabilities and when they relate to income taxes levied by the same taxation authority and the Group intends to settle its current tax assets and liabilities on a net basis. The Company is Singapore resident for tax purposes.
49

AVATION PLC NOTES TO THE FINANCIAL STATEMENTS FOR THE FINANCIAL YEAR ENDED 30 JUNE 2016 3 SUMMARY OF SIGNIFICANT ACCOUNTING POLICIES (continued)
(s) FOREIGN CURRENCIES - The Group’s consolidated financial statements and Company financial statements are presented in United States dollars. The individual financial statements of each Group entity are presented in the currency of the primary economic environment in which the entity operates (its functional currency) and United States Dollars is the functional currency of most Group entities, including the parent company. In preparing the financial statements of the individual entities, transactions in currencies other than the entity’s functional currency (foreign currencies) are recorded at rates of exchange prevailing on the dates of the transactions. At each reporting date, monetary items denominated in foreign currencies are retranslated at rates prevailing on the reporting date. Non-monetary items carried at fair value that are denominated in foreign currencies are retranslated at rates prevailing on the date when the fair value was determined. Non-monetary items that are measured in terms of historical cost in a foreign currency are not retranslated.
Exchange differences arising on the settlement of monetary items, and on the retranslation of monetary items, are included in profit or loss for the period. Exchange differences arising on the retranslation of non-monetary items carried at fair value are included in profit or loss for the period except for differences arising on the retranslation of non-monetary items in respect of which gains and losses are recognised directly in equity. For such non-monetary items, any exchange component of that gain or loss is also recognised directly in equity.
For the purpose of presenting consolidated financial statements, the assets and liabilities of the Group’s foreign operations are expressed in United States dollars using exchange rates prevailing on the reporting date. Income and expense items are translated at the average exchange rates for the period, unless exchange rates fluctuated significantly during that period, in which case the exchange rates at the dates of the transactions are used. Exchange differences arising, if any, are classified as equity and transferred to the Group’s translation reserve. Such translation differences are recognised in profit or loss in the period in which the foreign operation is disposed of.
Goodwill and fair value adjustments arising on the acquisition of a foreign operation are treated as assets and liabilities of the foreign operation and translated at the closing rate.
(t) FINANCIAL INSTRUMENTS - Financial assets and financial liabilities are recognised in
the Group’s statement of financial position when the Group becomes a party to the contractual provisions of the instrument.
(i) Trade and other receivables – Trade and other receivables are measured at fair
value upon initial recognition, and are subsequently measured at amortised cost using the effective interest rate method. Appropriate allowances for estimated irrecoverable amounts are recognised in profit or loss when there is objective evidence that the asset is impaired. The allowance recognised is measured as the difference between the asset’s carrying amount and the present value of estimated future cash flows discounted at the effective interest rate computed at initial recognition.
50
AVATION PLC NOTES TO THE FINANCIAL STATEMENTS FOR THE FINANCIAL YEAR ENDED 30 JUNE 2016 3 SUMMARY OF SIGNIFICANT ACCOUNTING POLICIES (continued)
(t) FINANCIAL INSTRUMENTS (continued)
(ii) Cash and cash equivalents - Cash and cash equivalents comprise cash at bank and on hand and call deposits which are subject to an insignificant risk of changes in value.
(iii) Financial liabilities and equity - Financial liabilities and equity instruments
issued by the Group are classified according to the substance of the contractual arrangements entered into and the definitions of a financial liability and an equity instrument. An equity instrument is any contract that evidences a residual interest in the assets of the Group after deducting all of its liabilities. The accounting policies adopted for specific financial liabilities and equity instruments are set out below.
(iv) Borrowings - Interest-bearing loans from banks and financial institutions are
initially measured at fair value, and are subsequently measured at amortised cost, using the effective interest rate method. Any difference between the proceeds (net of transaction costs) and the settlement or redemption of borrowings is recognised over the term of the borrowings in accordance with the Group’s accounting policy for borrowing costs (see above). Insurance premiums paid to export credit agencies independent of the lending bank or financial institution are not considered to constitute transaction costs and are accounted for separately.
(v) Trade and other payables - Trade payables are stated at their original invoiced
value, as the interest that would be recognised from discounting future cash payments over the short payment period is not considered to be material.
(vi) Equity instruments - Equity instruments issued by the Company are recorded at
the proceeds received, net of direct issue costs.
(u) DERIVATIVE FINANCIAL INSTRUMENTS AND HEDGING – The Group uses derivative financial instruments such as interest rate swap contracts to hedge its risks associated with interest rate fluctuations. Such derivative financial instruments are initially recognised at fair value on the date on which a derivative contract is entered into, and are subsequently re-measured at fair value.
Any gains or losses arising from changes in fair value on derivatives that do not qualify for hedge accounting are taken directly into profit or loss. At the inception of a hedge relationship, the Group formally designates and documents the hedge relationship to which the Group wishes to apply hedge accounting and the risk management objective and strategy for undertaking the hedge. The documentation includes identification of the hedged item or transaction, the hedging instrument, the nature of the risk being hedged and how the Group will assess the hedging instrument’s effectiveness in offsetting the exposure to changes in the hedged item’s (or transaction’s) cash flows attributable to the hedge risk. Such hedges are expected to be highly effective in achieving offsetting changes in cash flows, and are assessed on an ongoing basis to determine that they have been highly effective throughout the financial reporting periods for which they are designated.
51
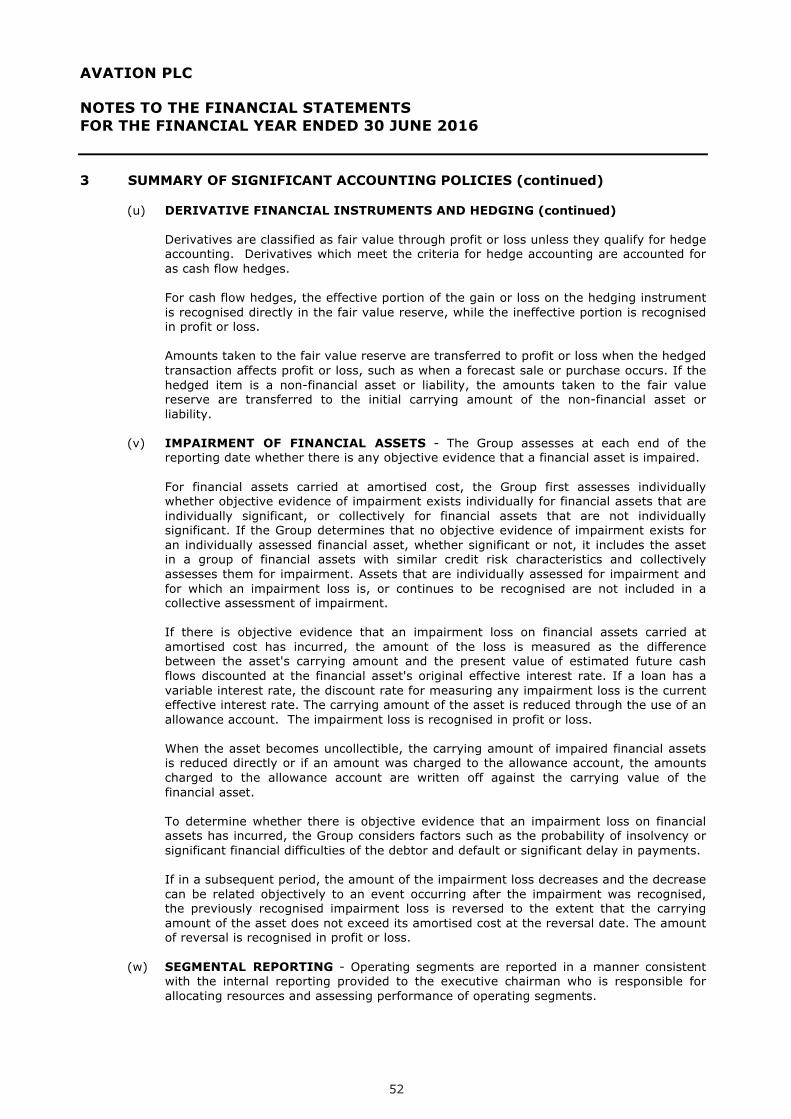
AVATION PLC NOTES TO THE FINANCIAL STATEMENTS FOR THE FINANCIAL YEAR ENDED 30 JUNE 2016 3 SUMMARY OF SIGNIFICANT ACCOUNTING POLICIES (continued)
(u) DERIVATIVE FINANCIAL INSTRUMENTS AND HEDGING (continued)
Derivatives are classified as fair value through profit or loss unless they qualify for hedge accounting. Derivatives which meet the criteria for hedge accounting are accounted for as cash flow hedges. For cash flow hedges, the effective portion of the gain or loss on the hedging instrument is recognised directly in the fair value reserve, while the ineffective portion is recognised in profit or loss. Amounts taken to the fair value reserve are transferred to profit or loss when the hedged transaction affects profit or loss, such as when a forecast sale or purchase occurs. If the hedged item is a non-financial asset or liability, the amounts taken to the fair value reserve are transferred to the initial carrying amount of the non-financial asset or liability.
(v) IMPAIRMENT OF FINANCIAL ASSETS - The Group assesses at each end of the
reporting date whether there is any objective evidence that a financial asset is impaired. For financial assets carried at amortised cost, the Group first assesses individually whether objective evidence of impairment exists individually for financial assets that are individually significant, or collectively for financial assets that are not individually significant. If the Group determines that no objective evidence of impairment exists for an individually assessed financial asset, whether significant or not, it includes the asset in a group of financial assets with similar credit risk characteristics and collectively assesses them for impairment. Assets that are individually assessed for impairment and for which an impairment loss is, or continues to be recognised are not included in a collective assessment of impairment. If there is objective evidence that an impairment loss on financial assets carried at amortised cost has incurred, the amount of the loss is measured as the difference between the asset's carrying amount and the present value of estimated future cash flows discounted at the financial asset's original effective interest rate. If a loan has a variable interest rate, the discount rate for measuring any impairment loss is the current effective interest rate. The carrying amount of the asset is reduced through the use of an allowance account. The impairment loss is recognised in profit or loss. When the asset becomes uncollectible, the carrying amount of impaired financial assets is reduced directly or if an amount was charged to the allowance account, the amounts charged to the allowance account are written off against the carrying value of the financial asset. To determine whether there is objective evidence that an impairment loss on financial assets has incurred, the Group considers factors such as the probability of insolvency or significant financial difficulties of the debtor and default or significant delay in payments. If in a subsequent period, the amount of the impairment loss decreases and the decrease can be related objectively to an event occurring after the impairment was recognised, the previously recognised impairment loss is reversed to the extent that the carrying amount of the asset does not exceed its amortised cost at the reversal date. The amount of reversal is recognised in profit or loss.
(w) SEGMENTAL REPORTING - Operating segments are reported in a manner consistent
with the internal reporting provided to the executive chairman who is responsible for allocating resources and assessing performance of operating segments.
52

AVATION PLC NOTES TO THE FINANCIAL STATEMENTS FOR THE FINANCIAL YEAR ENDED 30 JUNE 2016 4 CRITICAL ACCOUNTING ESTIMATES AND JUDGEMENTS
Estimates and assumptions concerning the future are made in the preparation of financial statements. They affect the application of the Group’s accounting policies, reported amounts of assets, liabilities, income and expenses and disclosures made. They are assessed on an ongoing basis and are based on experience and relevant factors, including expectations of future events that are believed to be reasonable under the circumstances.
The key assumptions concerning the future at the reporting date, that have a significant risk of causing a material adjustment to the carrying amounts of assets and liabilities within the next financial year are discussed below.
(a) Impairment of property, plant and equipment – aircraft
The Group periodically evaluates its aircraft for impairment. Factors that would indicate potential impairment would include, but not be limited to, significant decreases in the market value of aircraft or, a significant change in an aircraft’s physical condition or cash-flow associated with the use of the aircraft.
(b) Revaluation of property, plant and equipment – aircraft
The Group periodically revalues its aircraft using lease encumbered value (“LEV”). Under such a valuation, which reflects highest and best use given the fact that the aircraft are held for use in a leasing business, the income streams associated with the lease and the expected future market value of the aircraft at the end of the lease are discounted to current values. Critical assumptions made in determining LEV are the discount rate applied to cashflows associated with the lease and the expected future value of aircraft at the end of the lease.
(c) Impairment of loans and receivables
At the end of each reporting period the Group assesses whether there is any objective evidence that a financial asset is impaired. The Company considers factors such as the probability of insolvency or significant financial difficulties of the debtor and default or significant delay in payments to determine whether there is objective evidence of impairment.
Where there is objective evidence of impairment, the amount and timing of future cash flows are estimated based on historical loss experience for assets with similar risk characteristics.
(d) Fair value estimation on options held for trading The Group holds options to acquire aircraft. Management periodically assesses the Group’s future fleet requirements and will identify options in excess of requirements as held for trading. The Group values options held for trading as the expected market value of the relevant aircraft based on its estimated delivery date less the Group’s estimated contract price to acquire the aircraft, discounted to present value. Critical assumptions made in determining the fair value of these options include the discount rate of 8.1%, an inflation rate of 1.5% per annum used to estimate the future contract price for the aircraft and the expected open market future value of the aircraft at delivery.
53
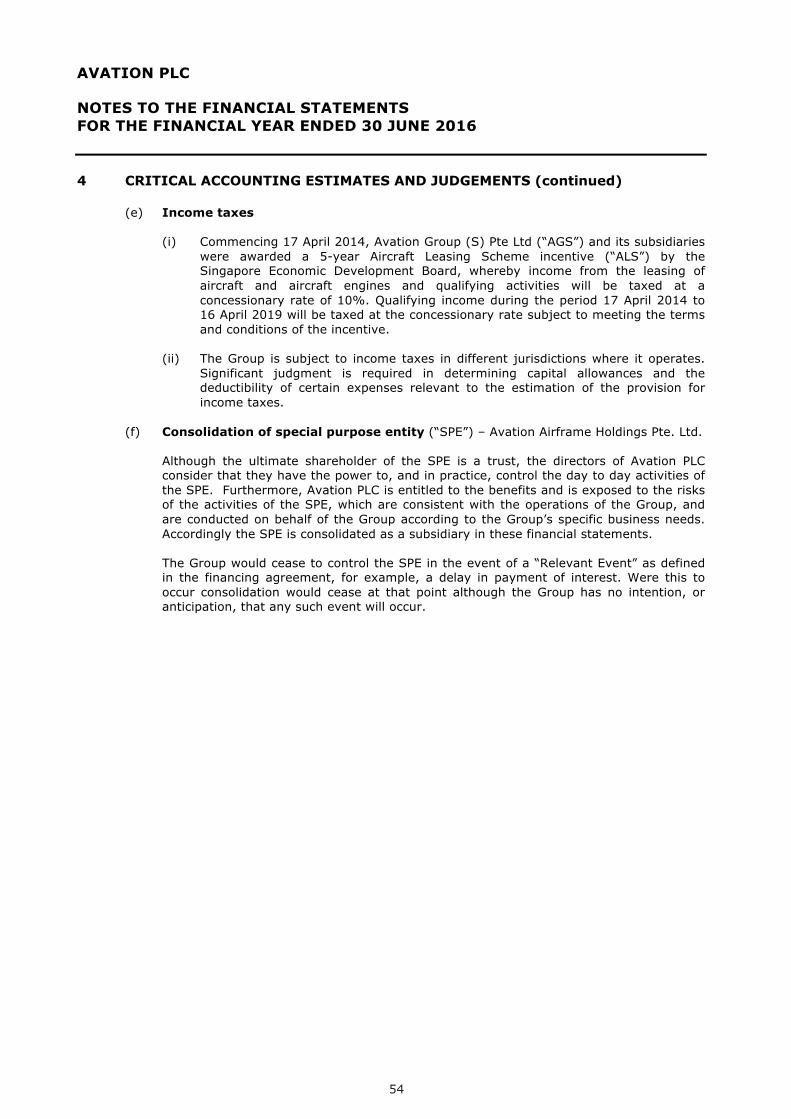
AVATION PLC NOTES TO THE FINANCIAL STATEMENTS FOR THE FINANCIAL YEAR ENDED 30 JUNE 2016 4 CRITICAL ACCOUNTING ESTIMATES AND JUDGEMENTS (continued)
(e) Income taxes
(i) Commencing 17 April 2014, Avation Group (S) Pte Ltd (“AGS”) and its subsidiaries
were awarded a 5-year Aircraft Leasing Scheme incentive (“ALS”) by the Singapore Economic Development Board, whereby income from the leasing of aircraft and aircraft engines and qualifying activities will be taxed at a concessionary rate of 10%. Qualifying income during the period 17 April 2014 to 16 April 2019 will be taxed at the concessionary rate subject to meeting the terms and conditions of the incentive.
(ii) The Group is subject to income taxes in different jurisdictions where it operates.
Significant judgment is required in determining capital allowances and the deductibility of certain expenses relevant to the estimation of the provision for income taxes.
(f) Consolidation of special purpose entity (“SPE”) – Avation Airframe Holdings Pte. Ltd.
Although the ultimate shareholder of the SPE is a trust, the directors of Avation PLC consider that they have the power to, and in practice, control the day to day activities of the SPE. Furthermore, Avation PLC is entitled to the benefits and is exposed to the risks of the activities of the SPE, which are consistent with the operations of the Group, and are conducted on behalf of the Group according to the Group’s specific business needs. Accordingly the SPE is consolidated as a subsidiary in these financial statements. The Group would cease to control the SPE in the event of a “Relevant Event” as defined in the financing agreement, for example, a delay in payment of interest. Were this to occur consolidation would cease at that point although the Group has no intention, or anticipation, that any such event will occur.
54
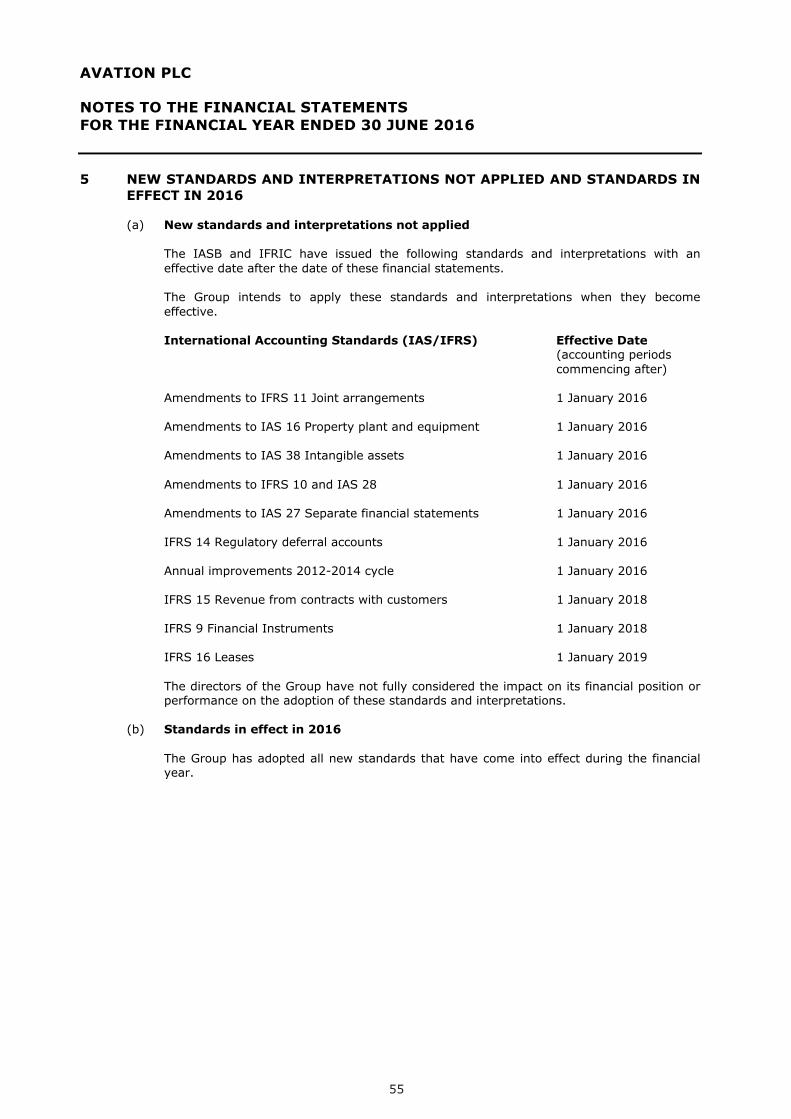
AVATION PLC NOTES TO THE FINANCIAL STATEMENTS FOR THE FINANCIAL YEAR ENDED 30 JUNE 2016 5 NEW STANDARDS AND INTERPRETATIONS NOT APPLIED AND STANDARDS IN
EFFECT IN 2016
(a) New standards and interpretations not applied
The IASB and IFRIC have issued the following standards and interpretations with an effective date after the date of these financial statements. The Group intends to apply these standards and interpretations when they become effective.
International Accounting Standards (IAS/IFRS) Effective Date
(accounting periods commencing after)
Amendments to IFRS 11 Joint arrangements 1 January 2016 Amendments to IAS 16 Property plant and equipment 1 January 2016 Amendments to IAS 38 Intangible assets 1 January 2016 Amendments to IFRS 10 and IAS 28 1 January 2016 Amendments to IAS 27 Separate financial statements 1 January 2016 IFRS 14 Regulatory deferral accounts 1 January 2016 Annual improvements 2012-2014 cycle 1 January 2016 IFRS 15 Revenue from contracts with customers 1 January 2018 IFRS 9 Financial Instruments 1 January 2018 IFRS 16 Leases 1 January 2019 The directors of the Group have not fully considered the impact on its financial position or performance on the adoption of these standards and interpretations.
(b) Standards in effect in 2016
The Group has adopted all new standards that have come into effect during the financial year.
55

AVATION PLC NOTES TO THE FINANCIAL STATEMENTS FOR THE FINANCIAL YEAR ENDED 30 JUNE 2016 6 FAIR VALUE MEASUREMENT
The fair value of a financial instrument is the amount at which the instrument could be exchanged or settled between knowledgeable and willing parties in an arm’s length transaction, other than a forced or liquidation sale. The carrying amounts of cash and cash equivalents, trade and other receivables, trade and other payables and loans and borrowings are a reasonable approximation of fair value either due to their short-term nature or because the interest rate charged closely approximates market interest rates or that the financial instruments have been discounted to their fair value at a current pre-tax interest rate. Non-financial assets measured at fair value: Group Company 2016 2015 2016 2015 US$’000s US$’000s US$’000s US$’000s
Fair value measurement using significant unobservable inputs: Aircraft 724,800 433,810 16,904 17,305
Aircraft were valued at 30 June 2016 and 30 June 2015. Refer to Note 25 for the details on the valuation technique and significant inputs used in the valuation. Classification of financial instruments: A comparison by category of carrying amounts of all the Group and Company's financial instruments that are carried in the financial statements which are considered to equate to fair value is set out below. Group Company 2016 2015 2016 2015 US$’000s US$’000s US$’000s US$’000s
Loans and receivables: Cash and cash equivalents 48,267 108,647 7,666 1,490 Trade and other receivables 9,647 13,133 57,907 57,594 Loan receivables - 19,600 - - Finance lease receivables 36,659 - - - 94,573 141,380 65,573 59,084 Financial liabilities measured at amortised cost: Trade and other payables 15,219 15,282 10,666 14,419 Loans and borrowings 615,724 428,095 8,954 12,500 Maintenance reserves 10,763 825 - - 641,706 444,202 19,620 26,919 Fair value through profit or loss: Options held for trading 3,040 - 3,040 - Derivative financial instruments 2,387 229 - -
56

AVATION PLC NOTES TO THE FINANCIAL STATEMENTS FOR THE FINANCIAL YEAR ENDED 30 JUNE 2016 7 FINANCIAL INSTRUMENTS RISK MANAGEMENT OBJECTIVES AND POLICIES
The Group’s activities expose it to a number of market related, operational and financial risks. Risk is mitigated through the application of prudent risk management policies. The risks described below are those that the Group has identified as the most significant risks to the business. The directors are responsible for managing risk and review risk management policies regularly. The Group utilises derivative financial instruments as part of its overall risk management strategy.
(a) Airline Industry Risks
The Group faces risks specific to the aviation sector including war, terrorism and equipment failure. These exposures are managed through the requirement for the airlines that lease the Group’s assets to maintain insurance, adequate maintenance policies and/or contribute to a maintenance reserve for the major maintenance on each aircraft.
(b) Credit risk Credit risk refers to the risk that debtors will default on their obligations to repay amounts owing to the Group. The Group has adopted a prudent credit policy towards extending credit terms to customers and in monitoring those credit terms. This includes assessing customers’ credit standing and periodic reviews of their financial status to determine appropriate credit limits. The Group generally requires its customers to pay rentals in advance and provide collateral in the form of cash or letters of credit as security deposits for leases. The maximum exposure to credit risk in the event that counterparties fail to perform their obligations in relation to each class of financial assets is the carrying amount of those assets as stated in the statement of financial position. The maximum exposure to credit risk for trade receivables at the reporting date by geographical area is: Group 2016 2015 US$’000s US$’000s Asia Pacific 2,355 2,576 Europe 1,304 311 3,659 2,887 The Group’s concentration of customers is disclosed in Note 37.
57

AVATION PLC NOTES TO THE FINANCIAL STATEMENTS FOR THE FINANCIAL YEAR ENDED 30 JUNE 2016 7 FINANCIAL INSTRUMENTS RISK MANAGEMENT OBJECTIVES AND POLICIES
(continued)
(b) Credit risk (continued)
(i) Financial assets that are neither past due nor impaired Financial assets that are neither past due nor impaired are comprised of bank deposits and trade receivables. Bank deposits that are neither past due or impaired are mainly deposits with banks with strong credit–ratings from international credit-rating agencies. Trade receivables that are neither past due nor impaired amounting to US$2.76 million (2015: US$1.75 million) are substantially due from companies with a good payment track record.
(ii) Financial assets that are past due and/or impaired
There is no class of financial assets that are past due and/or impaired except for trade receivables.
The age analysis of trade receivables past due but not impaired is as follows: Group 2016 2015 US$’000s US$’000s
Past due less than 3 months 828 927 Past due 3 to 6 months - - Past due over 6 months 69 59 897 986
(c) Interest rate risk
The Group is exposed to interest rate risk through the impact of interest rate changes on floating rate interest bearing liabilities and assets. The Group seeks to reduce its exposure to interest rate risk by fixing interest rates on the majority of its loans and borrowings. As at 30 June 2016 92% (2015: 89%) of the Group’s loans and borrowings are at fixed rates. The interest rates and repayment terms for financial assets and financial liabilities are disclosed in the respective notes to the financial statements.
(d) Foreign currency risk Foreign currency risk arises from transactions and cash balances that are not denominated in the Group’s functional currency. The Group’s foreign currency exposures arose mainly from movements in the exchange rate for British Pounds against the United States Dollar. The Group aims to mitigate foreign currency risk by holding the majority of its cash balances in United States Dollars. From time to time the Group utilises forward foreign currency contracts to hedge its exposure to specific currency risks.
58

AVATION PLC NOTES TO THE FINANCIAL STATEMENTS FOR THE FINANCIAL YEAR ENDED 30 JUNE 2016 7 FINANCIAL INSTRUMENTS RISK MANAGEMENT OBJECTIVES AND POLICIES
(continued)
(d) Foreign currency risk (continued) The Group’s foreign currency exposure is as follows:
Group
Cash and cash
equivalents
Trade and other
receivables
Other financial liabilities
Net currency exposure
US$’000s US$’000s US$’000s US$’000s
2016: Pound sterling 245 2 (86) 161 Australian dollar 16 91 (101) 6 Euro 23 23 (91) (45) Swiss Franc - 6 (16) (10) Singapore dollar 335 1 (432) (96) 619 123 (726) 16 2015: Pound sterling 160 - (130) 30 Australian dollar 12 - (13) (1) Euro 20 2 (14) 8 Singapore dollar 307 3 (504) (194)
499 5 (661) (157)
Company
Cash and cash
equivalents
Trade and other
receivables
Other financial liabilities
Net currency exposure
US$’000s US$’000s US$’000s US$’000s
2016: Pound sterling 183 1 (60) 124 Australian dollar - - (10) (10) Euro - - - - Singapore dollar 55 - (19) 36 238 1 (89) 150 2015: Pound sterling 13 - (102) (89) Australian dollar - - (13) (13) Euro - - - - Singapore dollar 152 - (136) 16
165 - (251) (86)
59

AVATION PLC NOTES TO THE FINANCIAL STATEMENTS FOR THE FINANCIAL YEAR ENDED 30 JUNE 2016 7 FINANCIAL INSTRUMENTS RISK MANAGEMENT OBJECTIVES AND POLICIES
(continued)
(d) Foreign currency risk (continued) The table below illustrates the effect on total profit and total equity that would result from a strengthening of foreign currencies against the United States Dollar by 10% (2015: 10%) with all other variables including tax rate being held constant:
Group Company 2016 2015 2016 2015 US$’000s US$’000s US$’000s US$’000s
Foreign currency: Pound sterling 16 3 12 (9) Australian dollar - - (1) (1) Euro (5) - - - Swiss Franc (1) - - Singapore dollar (10) (20) 4 2
A weakening of the respective currencies by 10% against the United States Dollar would have an equal and opposite effect.
(e) Liquidity risk
Liquidity risk is the risk that the Group will encounter difficulty in meeting financial obligations due to shortage of funds. The Group’s exposure to liquidity risk arises primarily from mismatches of the maturities of financial assets and liabilities. The Group monitors and maintains a level of cash and cash equivalents that management deems adequate to finance the Group’s operations and mitigate the effects of fluctuations in cash flows. Short-term funding is obtained from loan facilities.
Analysis of financial instruments by remaining contractual maturities The table below summarises the maturity profile of the Group’s financial assets and non-derivative liabilities at the end of the reporting period based on contractual undiscounted repayment obligations:
60

AVATION PLC NOTES TO THE FINANCIAL STATEMENTS FOR THE FINANCIAL YEAR ENDED 30 JUNE 2016 7 FINANCIAL INSTRUMENTS RISK MANAGEMENT OBJECTIVES AND POLICIES
(continued)
(e) Liquidity risk (continued)
Group One year or
less One to five
years Over five
years Total
US$’000s US$’000s US$’000s US$’000s
2016: Financial assets: Cash and cash equivalents 48,267 - - 48,267 Trade and other receivables 4,080 5,567 - 9,647 Finance lease receivable 3,032 33,627 - 36,659 Total undiscounted financial assets 55,379 39,194 - 94,573
Financial liabilities: Trade and other payables 3,497 2,831 11,061 17,389 Loans and borrowings 98,203 405,312 182,402 685,917 Maintenance reserves 7,440 3,323 - 10,763 Total undiscounted financial liabilities
109,140
411,466
193,463
714,069
Total net undiscounted financial liabilities (53,761) (372,272) (193,463) (619,496)
2015: Financial assets: Cash and cash equivalents 108,647 - - 108,647 Trade and other receivables 2,955 10,178 - 13,133 Loan receivable 19,600 - - 19,600 Total undiscounted financial assets 131,202 10,178 - 141,380
Financial liabilities: Trade and other payables 5,507 2,833 8,804 17,144 Loans and borrowings 68,556 328,249 116,322 513,127 Maintenance reserves 825 - - 825 Total undiscounted financial liabilities
74,888
331,082
125,126
531,096
Total net undiscounted financial liabilities 56,314 (320,904) (125,126) (389,716)
61
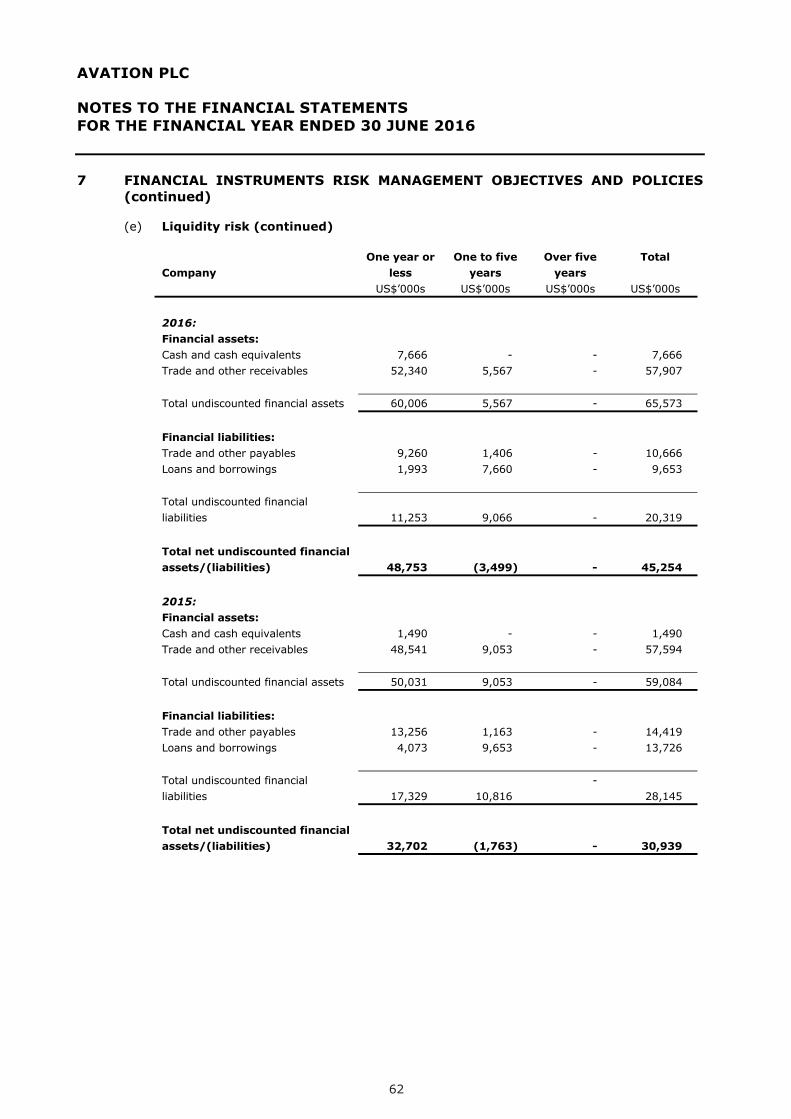
AVATION PLC NOTES TO THE FINANCIAL STATEMENTS FOR THE FINANCIAL YEAR ENDED 30 JUNE 2016 7 FINANCIAL INSTRUMENTS RISK MANAGEMENT OBJECTIVES AND POLICIES
(continued)
(e) Liquidity risk (continued)
Company One year or
less One to five
years Over five
years Total
US$’000s US$’000s US$’000s US$’000s
2016: Financial assets: Cash and cash equivalents 7,666 - - 7,666 Trade and other receivables 52,340 5,567 - 57,907 Total undiscounted financial assets 60,006 5,567 - 65,573
Financial liabilities: Trade and other payables 9,260 1,406 - 10,666 Loans and borrowings 1,993 7,660 - 9,653 Total undiscounted financial liabilities
11,253
9,066
-
20,319
Total net undiscounted financial assets/(liabilities) 48,753 (3,499) - 45,254
2015: Financial assets: Cash and cash equivalents 1,490 - - 1,490 Trade and other receivables 48,541 9,053 - 57,594 Total undiscounted financial assets 50,031 9,053 - 59,084
Financial liabilities: Trade and other payables 13,256 1,163 - 14,419 Loans and borrowings 4,073 9,653 - 13,726 Total undiscounted financial liabilities
17,329
10,816
- 28,145
Total net undiscounted financial assets/(liabilities) 32,702 (1,763) - 30,939
62

AVATION PLC NOTES TO THE FINANCIAL STATEMENTS FOR THE FINANCIAL YEAR ENDED 30 JUNE 2016 7 FINANCIAL INSTRUMENTS RISK MANAGEMENT OBJECTIVES AND POLICIES
(continued)
(f) Capital risk
The Group’s objectives when managing capital are to safeguard the Group’s ability to continue as a going concern and to maintain a suitable capital structure so as to fund growth and maximise shareholder value. In order to maintain or achieve an optimal capital structure, the Group may adjust the amount of dividend payments, return capital to shareholders, issue new shares, buy back issued shares, incur new borrowings or sell assets to reduce borrowings.
Management monitors capital based on a gearing ratio. The gearing ratio is calculated as net debt divided by total capital. Net debt is calculated as borrowings less cash and cash equivalents. Group Company 2016 2015 2016 2015 US$’000s US$’000s US$’000s US$’000s
Current: Net debt 567,457 319,448 1,288 11,010 Total equity 173,608 128,204 80,973 64,458 Total capital 741,065 447,652 82,261 75,478 Gearing ratio: 77% 71% 2% 15%
The Group is in compliance with all externally imposed capital requirements for the financial years ended 30 June 2016 and 30 June 2015.
(g) Fair value of financial assets and financial liabilities
The fair values of financial assets and financial liabilities reported in the statement of financial position approximate the carrying amounts of those assets and liabilities.
63
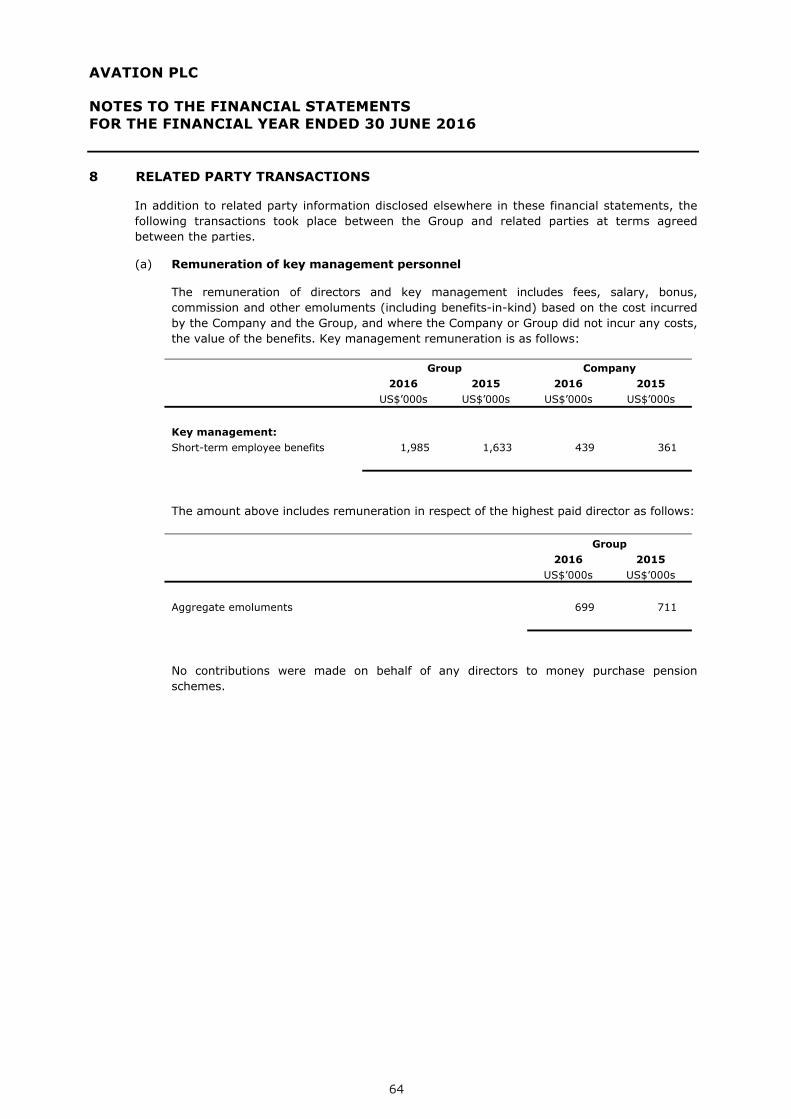
AVATION PLC NOTES TO THE FINANCIAL STATEMENTS FOR THE FINANCIAL YEAR ENDED 30 JUNE 2016
8 RELATED PARTY TRANSACTIONS In addition to related party information disclosed elsewhere in these financial statements, the
following transactions took place between the Group and related parties at terms agreed between the parties.
(a) Remuneration of key management personnel
The remuneration of directors and key management includes fees, salary, bonus, commission and other emoluments (including benefits-in-kind) based on the cost incurred by the Company and the Group, and where the Company or Group did not incur any costs, the value of the benefits. Key management remuneration is as follows:
Group Company 2016 2015 2016 2015 US$’000s US$’000s US$’000s US$’000s
Key management: Short-term employee benefits 1,985 1,633 439 361
The amount above includes remuneration in respect of the highest paid director as follows:
Group 2016 2015 US$’000s US$’000s
Aggregate emoluments 699 711
No contributions were made on behalf of any directors to money purchase pension schemes.
64

AVATION PLC NOTES TO THE FINANCIAL STATEMENTS FOR THE FINANCIAL YEAR ENDED 30 JUNE 2016 8 RELATED PARTY TRANSACTIONS (continued)
(b) Significant related party transactions:
Group Company 2016 2015 2016 2015 US$’000s US$’000s US$’000s US$’000s
Entities controlled by key management personnel (including directors): Interest income - 3 - 3 Rental expenses paid (217) (111) (119) (55) Consulting fee paid (107) (202) (107) (202) Service fee paid (15) (10) (15) (10) Interest expense (506) (615) (74) (399)
Directors Interest expense (9) - - -
(c) Significant transactions between the Company and its subsidiaries:
Company 2016 2015 US$’000s US$’000s
Commission income 105 589 Dividend income 14,428 12,915 Interest income 1,087 638 Management and service fee income 759 199 Rental income 2,088 2,088 Interest expense (596) (216)
65
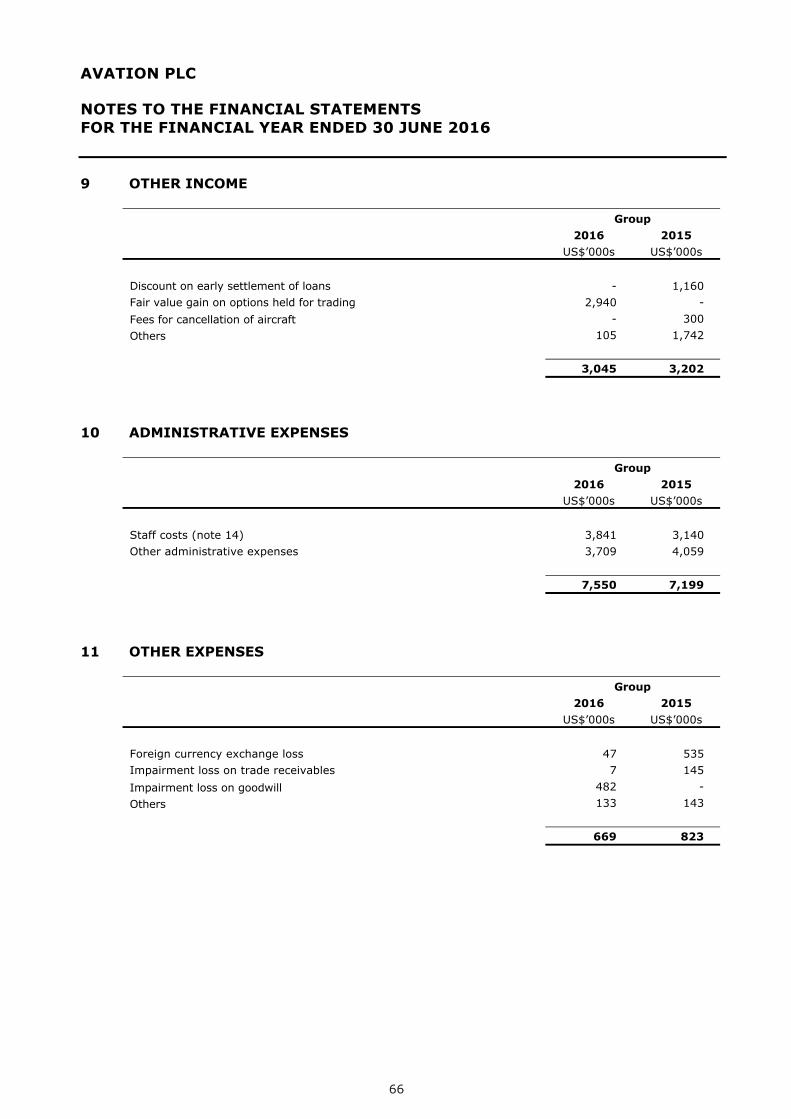
AVATION PLC NOTES TO THE FINANCIAL STATEMENTS FOR THE FINANCIAL YEAR ENDED 30 JUNE 2016 9 OTHER INCOME
Group 2016 2015 US$’000s US$’000s
Discount on early settlement of loans - 1,160 Fair value gain on options held for trading 2,940 - Fees for cancellation of aircraft - 300 Others 105 1,742 3,045 3,202
10 ADMINISTRATIVE EXPENSES
Group 2016 2015 US$’000s US$’000s
Staff costs (note 14) 3,841 3,140 Other administrative expenses 3,709 4,059 7,550 7,199
11 OTHER EXPENSES
Group 2016 2015 US$’000s US$’000s
Foreign currency exchange loss 47 535 Impairment loss on trade receivables 7 145 Impairment loss on goodwill 482 - Others 133 143 669 823
66
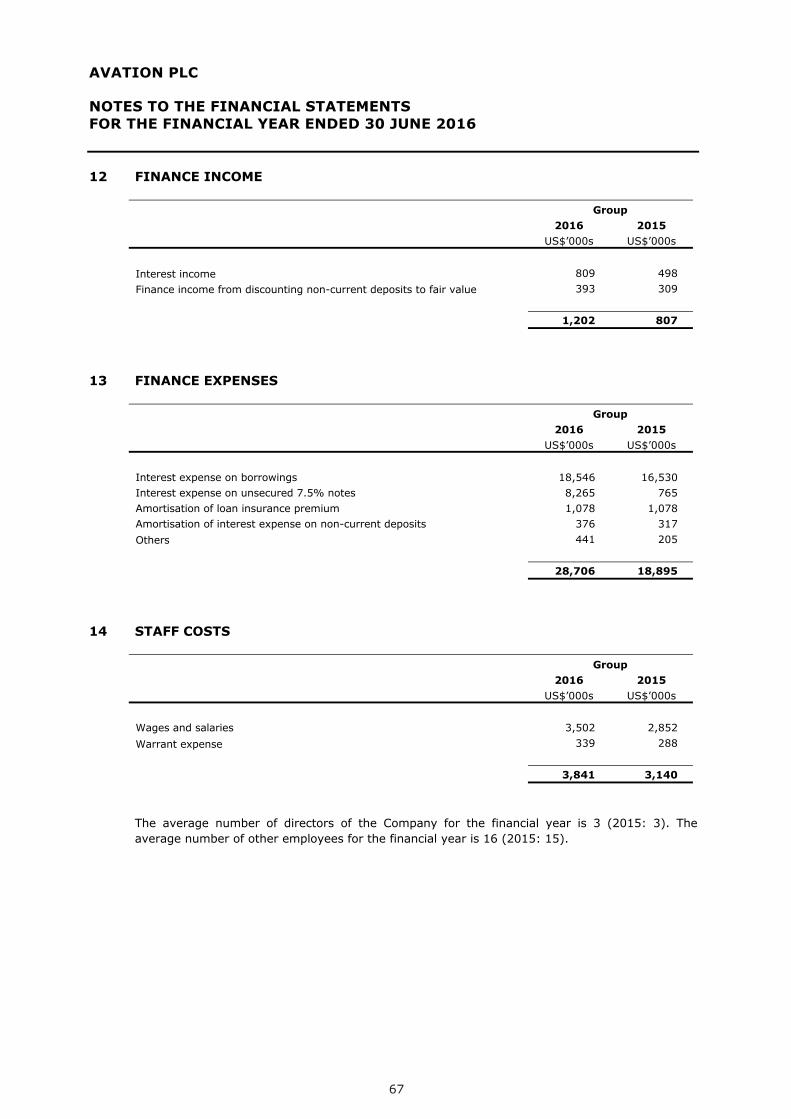
AVATION PLC NOTES TO THE FINANCIAL STATEMENTS FOR THE FINANCIAL YEAR ENDED 30 JUNE 2016
12 FINANCE INCOME
Group 2016 2015 US$’000s US$’000s
Interest income 809 498 Finance income from discounting non-current deposits to fair value 393 309 1,202 807
13 FINANCE EXPENSES
Group 2016 2015 US$’000s US$’000s
Interest expense on borrowings 18,546 16,530 Interest expense on unsecured 7.5% notes 8,265 765 Amortisation of loan insurance premium 1,078 1,078 Amortisation of interest expense on non-current deposits 376 317 Others 441 205 28,706 18,895
14 STAFF COSTS
Group 2016 2015 US$’000s US$’000s Wages and salaries 3,502 2,852 Warrant expense 339 288 3,841 3,140
The average number of directors of the Company for the financial year is 3 (2015: 3). The average number of other employees for the financial year is 16 (2015: 15).
67

AVATION PLC NOTES TO THE FINANCIAL STATEMENTS FOR THE FINANCIAL YEAR ENDED 30 JUNE 2016 15 PROFIT BEFORE TAXATION
Profit before taxation for the year is stated after charging / (crediting) the following: Group 2016 2015 US$’000s US$’000s Depreciation of property, plant and equipment 23,201 17,775 Foreign currency exchange loss 47 535 Audit fees: Fees payable to the Company’s auditor and their associates for the audit of the Company’s annual accounts 65 37 Fees payable to the Company’s auditor and their associates for audits of the Company’s subsidiaries’ annual accounts 34 51 Total audit fees 99 88
Auditors’ remuneration for non-audit services: - Tax compliance services 5 7 - Tax advisory services - - - Other services - 41 Total audit fees 5 48
16 TAXATION
Group 2016 2015 US$’000s US$’000s
From continuing operations Current tax expense: - Singapore 1,018 313 - Overseas 188 35 (Over)/Under provision in prior years current tax expense: - Singapore (31) (32) - Overseas 56 (144) Deferred tax expense: - Singapore (349) 737 - Overseas (466) 117 Over provision in prior years deferred tax expense: - Singapore (622) - Withholding tax - Singapore 4 13 (202) 1,039 From discontinued operations Deferred tax expense: - Overseas - (429) (202) 610 Tax expense attributable to: - continuing operations (202) 1,039 - discontinued operations (Note 17) - (429) (202) 610
68
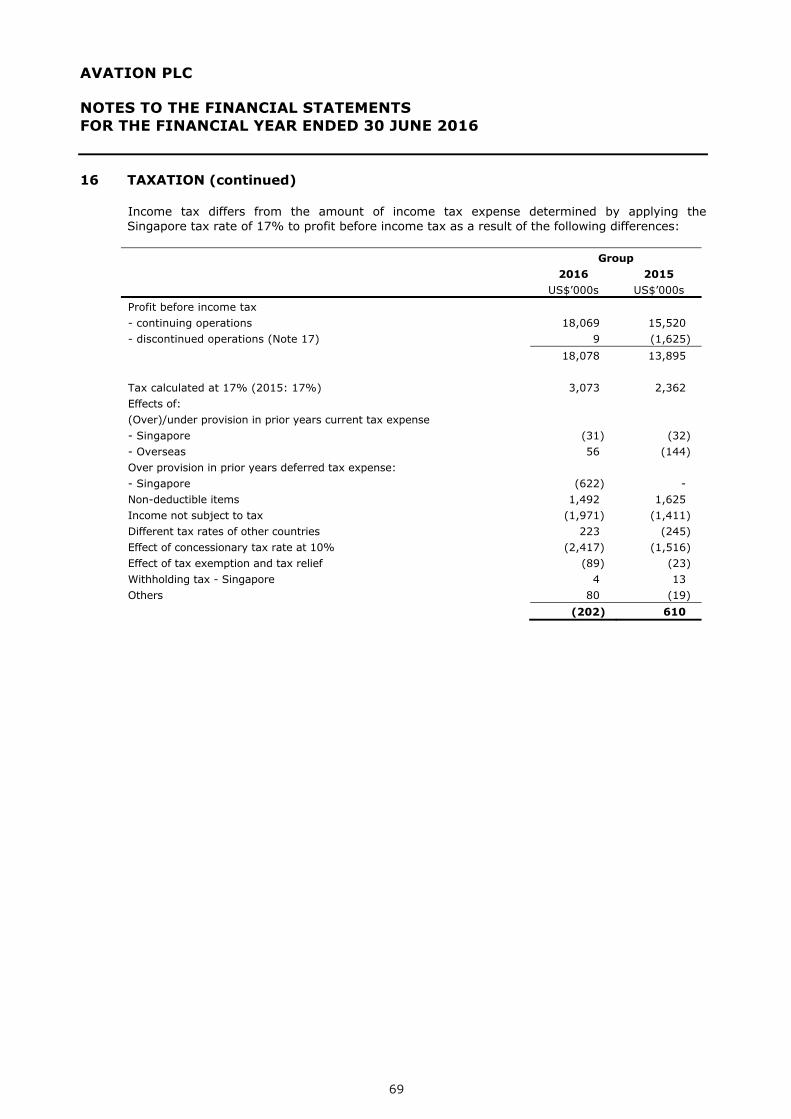
AVATION PLC NOTES TO THE FINANCIAL STATEMENTS FOR THE FINANCIAL YEAR ENDED 30 JUNE 2016 16 TAXATION (continued)
Income tax differs from the amount of income tax expense determined by applying the Singapore tax rate of 17% to profit before income tax as a result of the following differences: Group 2016 2015 US$’000s US$’000s Profit before income tax - continuing operations 18,069 15,520 - discontinued operations (Note 17) 9 (1,625) 18,078 13,895 Tax calculated at 17% (2015: 17%) 3,073 2,362 Effects of: (Over)/under provision in prior years current tax expense - Singapore (31) (32) - Overseas 56 (144) Over provision in prior years deferred tax expense: - Singapore (622) - Non-deductible items 1,492 1,625 Income not subject to tax (1,971) (1,411) Different tax rates of other countries 223 (245) Effect of concessionary tax rate at 10% (2,417) (1,516) Effect of tax exemption and tax relief (89) (23) Withholding tax - Singapore 4 13 Others 80 (19) (202) 610
69

AVATION PLC NOTES TO THE FINANCIAL STATEMENTS FOR THE FINANCIAL YEAR ENDED 30 JUNE 2016 17 DISCONTINUED OPERATIONS
In the prior financial year, the Company’s subsidiary Capital Lease Aviation PLC reported a US$1.2 million loss, net of a tax write-back, on the part-out disposal of a 25 year old aircraft. This loss was classified within discontinued operations as it represented the Group’s only aircraft operating in North America.
(a) Results of discontinued operations
Group 2016 2015 US$’000s US$’000s Revenue 25 3,997 Expenses (16) (5,622) Profit/(Loss) before tax from discontinued operations 9 (1,625) Taxation - 429 Profit/(Loss) after tax from discontinued operations 9 (1,196)
(b) Cash flows from discontinued operations
Group 2016 2015 US$’000s US$’000s
Operating cash/(outflow) inflows (16) 3,975 Investing cash inflows 55 1,210 Total cash inflows 39 5,185
(c) Earnings per share from discontinued operations
Group 2016 2015 Profit/(Loss) per share from discontinued operation attributable to equity owners of the Company (cents per share) Basic 0.02 cents (2.17) cents Diluted 0.02 cents (2.16) cents
70

AVATION PLC NOTES TO THE FINANCIAL STATEMENTS FOR THE FINANCIAL YEAR ENDED 30 JUNE 2016 18 EARNINGS PER SHARE
(a) Basic earnings per share (“EPS”)
EPS is calculated by dividing total profit attributable to members of the Company by the weighted average number of ordinary shares in issue during the financial year.
Company 2016 2015 US$’000s US$’000s
Total profit attributable to equity holders of the company - Continuing operations 18,270 14,210 - Discontinued operations 9 (1,174) 18,279 13,036
Weighted average number of ordinary shares (‘000s) 53,208 54,050
Basic earnings per share: - Continuing operations 34.33 cents 26.29 cents - Discontinued operations 0.02 cents (2.17) cents 34.35 cents 24.12 cents
(b) Diluted earnings per share
For the purpose of calculating diluted earnings per share, total profit attributable to equity holders of the Company and the weighted average number of ordinary shares outstanding are adjusted for the effects of all dilutive potential ordinary shares. The Company has one category of dilutive potential ordinary shares; warrants.
For warrants, the weighted average number of shares on issue has been adjusted as if all dilutive share options were exercised. The number of shares that could have been issued upon the exercise of all dilutive share option less the number of shares that could have been issued at fair value (determined as the Company’s average share price for the financial year) for the same total proceeds is added to the denominator as the number of shares issued for no consideration.
71
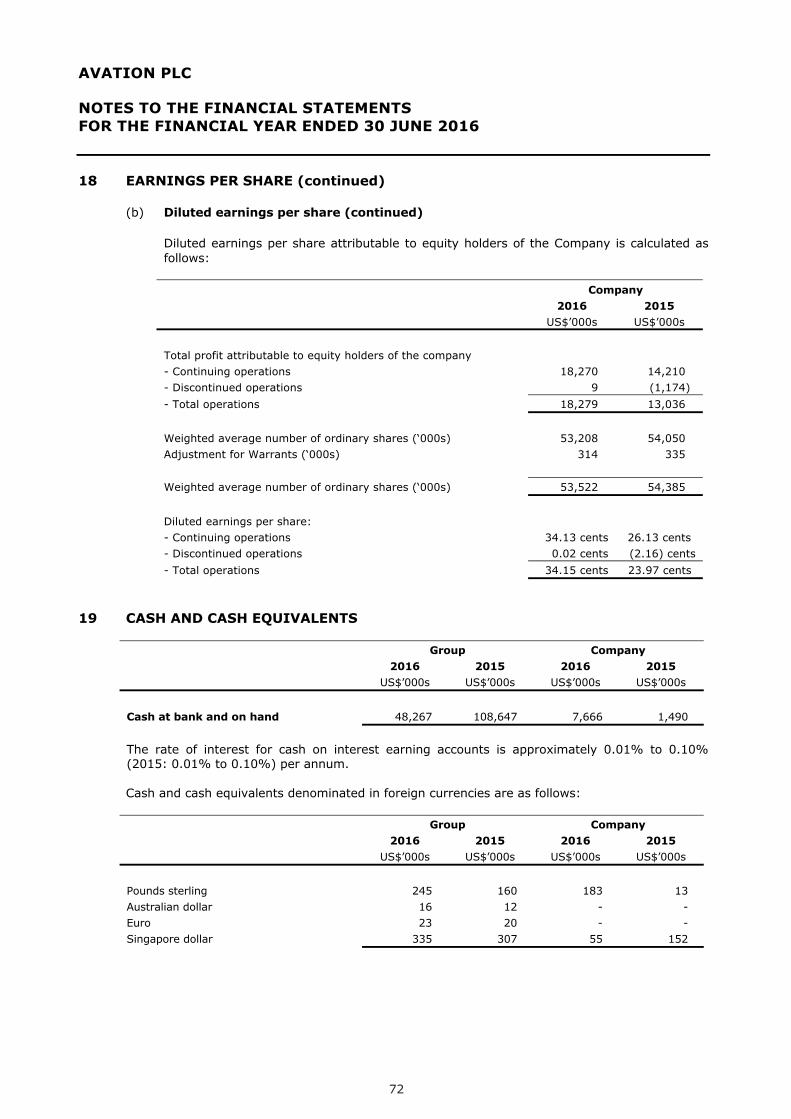
AVATION PLC NOTES TO THE FINANCIAL STATEMENTS FOR THE FINANCIAL YEAR ENDED 30 JUNE 2016 18 EARNINGS PER SHARE (continued)
(b) Diluted earnings per share (continued)
Diluted earnings per share attributable to equity holders of the Company is calculated as follows:
Company 2016 2015 US$’000s US$’000s
Total profit attributable to equity holders of the company - Continuing operations 18,270 14,210 - Discontinued operations 9 (1,174) - Total operations 18,279 13,036
Weighted average number of ordinary shares (‘000s) 53,208 54,050 Adjustment for Warrants (‘000s) 314 335 Weighted average number of ordinary shares (‘000s) 53,522 54,385
Diluted earnings per share: - Continuing operations 34.13 cents 26.13 cents - Discontinued operations 0.02 cents (2.16) cents - Total operations 34.15 cents 23.97 cents
19 CASH AND CASH EQUIVALENTS
Group Company 2016 2015 2016 2015 US$’000s US$’000s US$’000s US$’000s
Cash at bank and on hand 48,267 108,647 7,666 1,490
The rate of interest for cash on interest earning accounts is approximately 0.01% to 0.10% (2015: 0.01% to 0.10%) per annum. Cash and cash equivalents denominated in foreign currencies are as follows: Group Company 2016 2015 2016 2015 US$’000s US$’000s US$’000s US$’000s
Pounds sterling 245 160 183 13 Australian dollar 16 12 - - Euro 23 20 - - Singapore dollar 335 307 55 152
72

AVATION PLC NOTES TO THE FINANCIAL STATEMENTS FOR THE FINANCIAL YEAR ENDED 30 JUNE 2016 20 TRADE AND OTHER RECEIVABLES
Group Company 2016 2015 2016 2015 US$’000s US$’000s US$’000s US$’000s
Current: Trade receivables 3,659 2,742 15 6 Other receivables: – subsidiaries - - 51,019 45,229 – third parties 391 155 255 46 Accrued interest - - 1,051 322 Deposits 30 58 - 24 Prepaid expenses 469 329 136 106 Prepaid loan premiums 1,082 1,078 - - Dividend receivable - - - 2,914 5,631 4,362 52,476 48,647
Non-current: Deposits for aircraft 5,567 10,178 5,567 9,053 Prepaid expenses 529 616 - - Prepaid loan premiums 5,208 6,286 - - 11,304 17,080 5,567 9,053
Other receivables from subsidiaries includes interest bearing receivables of US$24.96 million (2015: US$6.89 million). The receivables are unsecured and repayable upon demand. Interest is charged at 5.5% to 6.0% (2015: 5.5% to 6.0%) per annum.
The average credit period generally granted to customers is 30 to 60 days. Rent for leased aircraft is due in advance in accordance with the leases. Trade and other receivables denominated in foreign currencies are as follows:
Group Company 2016 2015 2016 2015 US$’000s US$’000s US$’000s US$’000s
Pound sterling 2 - 1 - Australian dollar 91 - - - Euro 23 2 - - Swiss Franc 6 - - - Singapore dollar 1 3 - -
73

AVATION PLC NOTES TO THE FINANCIAL STATEMENTS FOR THE FINANCIAL YEAR ENDED 30 JUNE 2016 21 LOAN RECEIVABLE
Group 2016 2015 US$’000s US$’000s Loan receivable - 19,600
The Group granted a loan facility of up to US$24 million to a third party for the purpose of financing the acquisition of two new aircraft. The loan facility bore interest at LIBOR + 3.95% per annum. During the financial year, the Group purchased the two aircraft from the third party and the US$24 million loan receivable was offset against the purchase price for the aircraft. The Group currently leases these aircraft to the same third party under operating leases.
22 FINANCE LEASE RECEIVABLES
During the financial year, a third party who leases two aircraft from the Group agreed to acquire the aircraft at the end of their lease terms. As a result the leases for these aircraft have been reclassified as finance leases. The leases have a remaining term of approximately 1.5 years. Future minimum lease payments receivable under these finance are as follows:
2016 2015
Group
Minimum lease
payments
Present value of
payments
Minimum lease
payments
Present value of
payments US$’000s US$’000s US$’000s US$’000s
Within one year 3,600 3,032 - - Later than one year but not more than five years 33,600 33,627 - - Total minimum lease payments 37,200 36,659 - - Less: amounts representing interest income (541) - - - Present value of minimum lease payments 36,659 36,659 - -
74
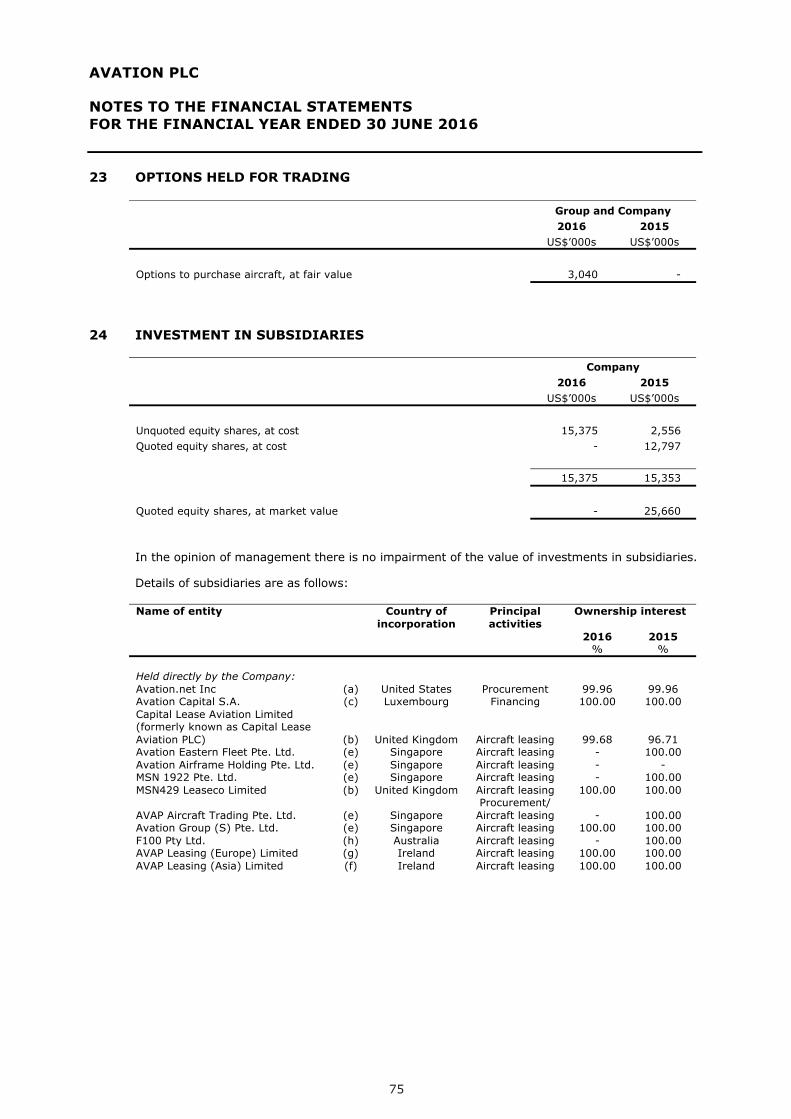
AVATION PLC NOTES TO THE FINANCIAL STATEMENTS FOR THE FINANCIAL YEAR ENDED 30 JUNE 2016
23 OPTIONS HELD FOR TRADING
Group and Company 2016 2015 US$’000s US$’000s
Options to purchase aircraft, at fair value 3,040 -
24 INVESTMENT IN SUBSIDIARIES
Company 2016 2015 US$’000s US$’000s
Unquoted equity shares, at cost 15,375 2,556 Quoted equity shares, at cost - 12,797 15,375 15,353
Quoted equity shares, at market value - 25,660
In the opinion of management there is no impairment of the value of investments in subsidiaries.
Details of subsidiaries are as follows:
Name of entity Country of incorporation
Principal activities
Ownership interest
2016 2015 % % Held directly by the Company: Avation.net Inc (a) United States Procurement 99.96 99.96 Avation Capital S.A. (c) Luxembourg Financing 100.00 100.00 Capital Lease Aviation Limited (formerly known as Capital Lease Aviation PLC)
(b)
United Kingdom
Aircraft leasing
99.68
96.71 Avation Eastern Fleet Pte. Ltd. (e) Singapore Aircraft leasing - 100.00 Avation Airframe Holding Pte. Ltd. (e) Singapore Aircraft leasing - - MSN 1922 Pte. Ltd. (e) Singapore Aircraft leasing - 100.00 MSN429 Leaseco Limited (b) United Kingdom Aircraft leasing 100.00 100.00 AVAP Aircraft Trading Pte. Ltd.
(e)
Singapore
Procurement/ Aircraft leasing
-
100.00
Avation Group (S) Pte. Ltd. (e) Singapore Aircraft leasing 100.00 100.00 F100 Pty Ltd. (h) Australia Aircraft leasing - 100.00 AVAP Leasing (Europe) Limited (g) Ireland Aircraft leasing 100.00 100.00 AVAP Leasing (Asia) Limited (f) Ireland Aircraft leasing 100.00 100.00
75

AVATION PLC NOTES TO THE FINANCIAL STATEMENTS FOR THE FINANCIAL YEAR ENDED 30 JUNE 2016
24 INVESTMENT IN SUBSIDIARIES (continued)
Name of entity Country of incorporation
Principal activities
Ownership interest
2016 2015 % % AVAP Leasing (Asia) II Limited (g) Ireland Aircraft leasing 100.00 - AVAP Leasing (Asia) III Limited (g) Ireland Aircraft leasing 100.00 - AVAP Leasing (Asia) IV Limited (g) Ireland Aircraft leasing 100.00 - Held by Capital Lease Aviation Limited: Capital Lease Malta Ltd. (d) Malta Aircraft leasing 99.68 96.71 Capital Lease Aviation (S) Pte. Ltd. (a) Singapore Aircraft leasing 99.68 96.71 MSN 1607 Pte. Ltd. (e) Singapore Aircraft leasing - 96.71 Capital MSN 4033 Limited (f) Ireland Aircraft leasing 99.68 - Held by Avation Eastern Fleet Pte. Ltd.: Airframe Leasing (S) Pte. Ltd. (e) Singapore Aircraft leasing 100.00 100.00 Held by Avation Eastern Fleet II Pte. Ltd.: Airframe Leasing (S) II Pte. Ltd. (a) Singapore Aircraft leasing 100.00 100.00 Held by Avation Eastern Fleet III Pte. Ltd.: Airframe Leasing (S) III Pte. Ltd. (e) Singapore Aircraft leasing 100.00 100.00 Held by Avation Eastern Fleet IV Pte. Ltd.: Airframe Leasing (S) IV Pte. Ltd. (e) Singapore Aircraft leasing 100.00 100.00 Held by MSN 429 Leaseco Limited: MSN 429 Limited (b) United Kingdom Aircraft leasing 100.00 100.00 Held by F100 Fleet Pte. Ltd.: F100 Leasing Pte. Ltd. (e) Singapore Aircraft leasing 100.00 100.00 Held by Avation Group (S) Pte. Ltd.: Avation Eastern Fleet Pte. Ltd. (e) Singapore Aircraft leasing 100.00 - Avation Eastern Fleet II Pte. Ltd. (e) Singapore Aircraft leasing 100.00 100.00 Avation Eastern Fleet III Pte. Ltd. (e) Singapore Aircraft leasing 100.00 100.00 Avation Eastern Fleet IV Pte. Ltd. (e) Singapore Aircraft leasing 100.00 100.00 Avation Pacific Leasing Pte. Ltd. (e) Singapore Aircraft leasing 100.00 100.00 Avation Taiwan Leasing Pte. Ltd. (e) Singapore Aircraft leasing 100.00 100.00 AVAP Leasing (Europe) II Pte. Ltd. (e) Singapore Aircraft leasing 100.00 100.00 AVAP Leasing (Europe) III Pte. Ltd. (e) Singapore Aircraft leasing 100.00 100.00 MSN 429 (S) Pte. Ltd. (e) Singapore Aircraft leasing 100.00 100.00 F100 Fleet Pte. Ltd. (e) Singapore Aircraft leasing 100.00 100.00 MSN 1607 Pte. Ltd. (e) Singapore Aircraft leasing 100.00 - AVAP Aircraft Trading Pte. Ltd. (e) Singapore Aircraft leasing 100.00 - AVAP Leasing (Europe) IV Pte. Ltd. (e) Singapore Aircraft leasing 100.00 - Avation Leasing (China) Pte. Ltd. (e) Singapore Aircraft leasing 100.00 - AVAP Leasing Holding Pte. Ltd. (e) Singapore Aircraft leasing 100.00 - Avation Asia Fleet Pte. Ltd. (g) Singapore Aircraft leasing 100.00 - MSN 1922 Pte. Ltd. (e) Singapore Aircraft leasing 100.00 -
(a) Audited by Jasmine Chua and Associates, Singapore (b) Audited by Kingston Smith LLP, London, United Kingdom (c) Audited by Artemis Audit and Advisory, Luxembourg (d) Audited by Nexia BT, Malta (e) Audited by Ernst & Young LLP, Singapore (f) Audited by KSi Faulkner Orr, Dublin, Ireland (g) Audited by Kingston Smith LLP, London, United Kingdom for consolidation purposes. (h) Dissolved during the financial year.
For all non-controlling interests, voting rights not controlled by group are equivalent to ownership interests.
76

AVATION PLC NOTES TO THE FINANCIAL STATEMENTS FOR THE FINANCIAL YEAR ENDED 30 JUNE 2016 25 PROPERTY, PLANT AND EQUIPMENT
Group
Furniture and
equipment Jets Turbo-props Total
US$’000s US$’000s US$’000s US$’000s
2016: Cost or valuation: At beginning of year 357 163,040 344,492 507,889 Additions 31 226,914 115,877 342,822 Disposals/written-off - (7,999) (19,258) (27,257) Reclassified as held under finance leases - - (35,601) (35,601) Movement in revaluation reserve - 610 29,705 30,315 At end of the year 388 382,565 435,215 818,168 Representing: At cost 388 - - 388 At valuation - 382,565 435,215 817,780 388 382,565 435,215 818,168 Accumulated depreciation and impairment: At beginning of year 88 47,875 25,847 73,810 Depreciation expense – continuing operations 118 9,704 13,379 23,201 Disposals/written-off - (2,636) - (2,636) Reclassified as held under finance leases - - (2,091) (2,091) Impairment loss - 902 - 902 At end of the year 206 55,845 37,135 93,186 Net book value: At beginning of the year 269 115,165 318,645 434,079 At end of the year 182 326,720 398,080 724,982
77

AVATION PLC NOTES TO THE FINANCIAL STATEMENTS FOR THE FINANCIAL YEAR ENDED 30 JUNE 2016 25 PROPERTY, PLANT AND EQUIPMENT (continued)
Group
Furniture and
equipment Jets Turbo-props Total
US$’000s US$’000s US$’000s US$’000s
2015: Cost or valuation: At beginning of year 133 177,596 253,000 430,729 Additions 311 - 109,862 110,173 Disposals/written-off (87) (1,078) (18,370) (19,535) Reclassified as assets held for sale - (13,478) - (13,478) At end of the year 357 163,040 344,492 507,889 Representing: At cost 357 - - 357 At valuation - 163,040 344,492 507,532 357 163,040 344,492 507,889 Accumulated depreciation and impairment: At beginning of year 73 48,129 15,202 63,404 Depreciation expense - Continuing operations 90 6,680 11,005 17,775 - Discontinued operations - 150 - 150 90 6,830 11,005 17,925 Impairment loss – discontinued operations - 3,850 - 3,850 Disposals/written-off (75) (296) (360) (731) Reclassified as assets held for sale - (10,638) - (10,638) At end of the year 88 47,875 25,847 73,810 Net book value: At beginning of the year 60 129,467 237,798 367,325 At end of the year 269 115,165 318,645 434,079
78

AVATION PLC NOTES TO THE FINANCIAL STATEMENTS FOR THE FINANCIAL YEAR ENDED 30 JUNE 2016 25 PROPERTY, PLANT AND EQUIPMENT (continued)
Company
Furniture and
equipment Jets Total US$’000s US$’000s US$’000s
2016: Cost or valuation: At beginning of year 166 19,374 19,540 Additions 23 - 23 Movement in revaluation reserve - 575 575 At end of the year 189 19,949 20,138 Representing: At cost 189 - 189 At valuation - 19,949 19,949 189 19,949 20,138 Accumulated depreciation and impairment: At beginning of year 35 2,069 2,104 Depreciation expense 58 976 1,034 At end of the year 93 3,045 3,138 Net book value: At beginning of the year 131 17,305 17,436 At end of the year 96 16,904 17,000
79

AVATION PLC NOTES TO THE FINANCIAL STATEMENTS FOR THE FINANCIAL YEAR ENDED 30 JUNE 2016 25 PROPERTY, PLANT AND EQUIPMENT (continued)
Company
Furniture and
equipment Jets Total US$’000s US$’000s US$’000s
2015: Cost or valuation: At beginning of year 8 20,452 20,460 Additions 158 - 158 Disposals - (1,078) (1,078) At end of the year 166 19,374 19,540 Representing: At cost 166 - 166 At valuation - 19,374 19,374 166 19,374 19,540 Accumulated depreciation and impairment: At beginning of year 4 1,325 1,329 Depreciation expense 31 1,041 1,072 Disposals - (297) (297) At end of the year 35 2,069 2,104 Net book value: At beginning of the year 4 19,127 19,131 At end of the year 131 17,305 17,436
80

AVATION PLC NOTES TO THE FINANCIAL STATEMENTS FOR THE FINANCIAL YEAR ENDED 30 JUNE 2016 25 PROPERTY, PLANT AND EQUIPMENT (continued)
Assets pledged as security The Group’s aircraft with carrying values of US$724.80 million (2015: US$433.81 million) are mortgaged to secure the Group’s borrowings (Note 28).
Valuation The Group’s aircraft were valued in June 2016 by independent valuers on lease-encumbered basis (“LEV’). LEV takes into account the current lease arrangements for the aircraft and estimated residual values at the end of the lease. These amounts have been discounted to present value using discount rates of 6.5% and 8.1% per annum. Different discount rates are considered appropriate for different aircraft based on their respective risk profiles. Management estimates that a change of 1% in the discount rate used would increase/decrease the total LEV of the fleet by US$15.70 million. An impairment loss of US$0.9 million was recognised during the year to write down the book value of a 24 year old aircraft to LEV. An impairment loss of US$3.85 million was recognised during the previous financial year to write down an aircraft to its fair value less costs to sell prior to the aircraft being reclassified as an asset held for sale. This was a non-recurring impairment loss which was measured using observable inputs, being the prices for recent sales of similar aircraft parts, and is therefore within Level 2 of the fair value hierarchy.
If the aircraft were measured using the cost model, the carrying amounts would be as follows:
2016 2015
Group Jets Turbo-props Jets
Turbo-props
US$’000s US$’000s US$’000s US$’000s
Cost 363,011 405,510 144,058 344,366 Accumulated depreciation and impairment (44,031) (37,135) (38,878) (25,846) Net book value 318,980 368,375 105,180 318,520
2016 2015
Company Jets Turbo-props Jets
Turbo-props
US$’000s US$’000s US$’000s US$’000s
Cost 16,561 - 16,561 - Accumulated depreciation and impairment (2,479) - (1,905) - Net book value 14,082 - 14,656 -
81
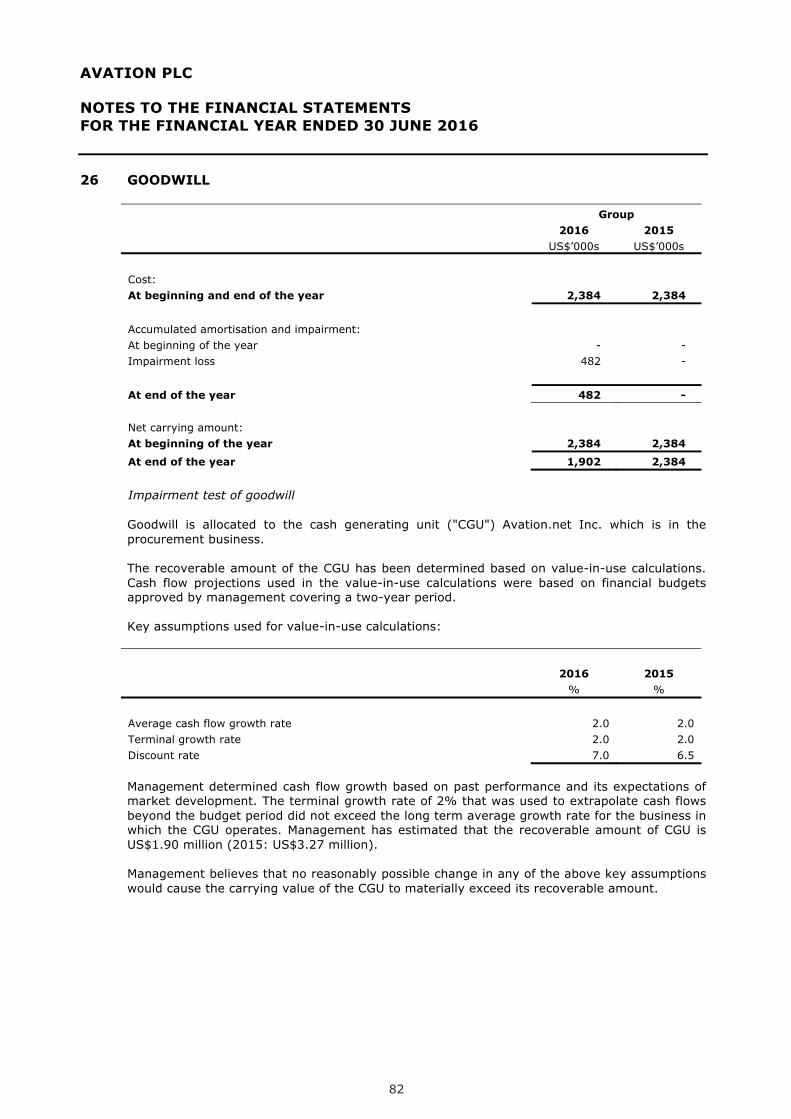
AVATION PLC NOTES TO THE FINANCIAL STATEMENTS FOR THE FINANCIAL YEAR ENDED 30 JUNE 2016 26 GOODWILL
Group 2016 2015 US$’000s US$’000s
Cost: At beginning and end of the year 2,384 2,384 Accumulated amortisation and impairment: At beginning of the year - - Impairment loss 482 -
At end of the year 482 -
Net carrying amount: At beginning of the year 2,384 2,384
At end of the year 1,902 2,384
Impairment test of goodwill
Goodwill is allocated to the cash generating unit ("CGU") Avation.net Inc. which is in the procurement business. The recoverable amount of the CGU has been determined based on value-in-use calculations. Cash flow projections used in the value-in-use calculations were based on financial budgets approved by management covering a two-year period. Key assumptions used for value-in-use calculations:
2016 2015 % %
Average cash flow growth rate 2.0 2.0 Terminal growth rate 2.0 2.0 Discount rate 7.0 6.5
Management determined cash flow growth based on past performance and its expectations of market development. The terminal growth rate of 2% that was used to extrapolate cash flows beyond the budget period did not exceed the long term average growth rate for the business in which the CGU operates. Management has estimated that the recoverable amount of CGU is US$1.90 million (2015: US$3.27 million).
Management believes that no reasonably possible change in any of the above key assumptions would cause the carrying value of the CGU to materially exceed its recoverable amount.
82
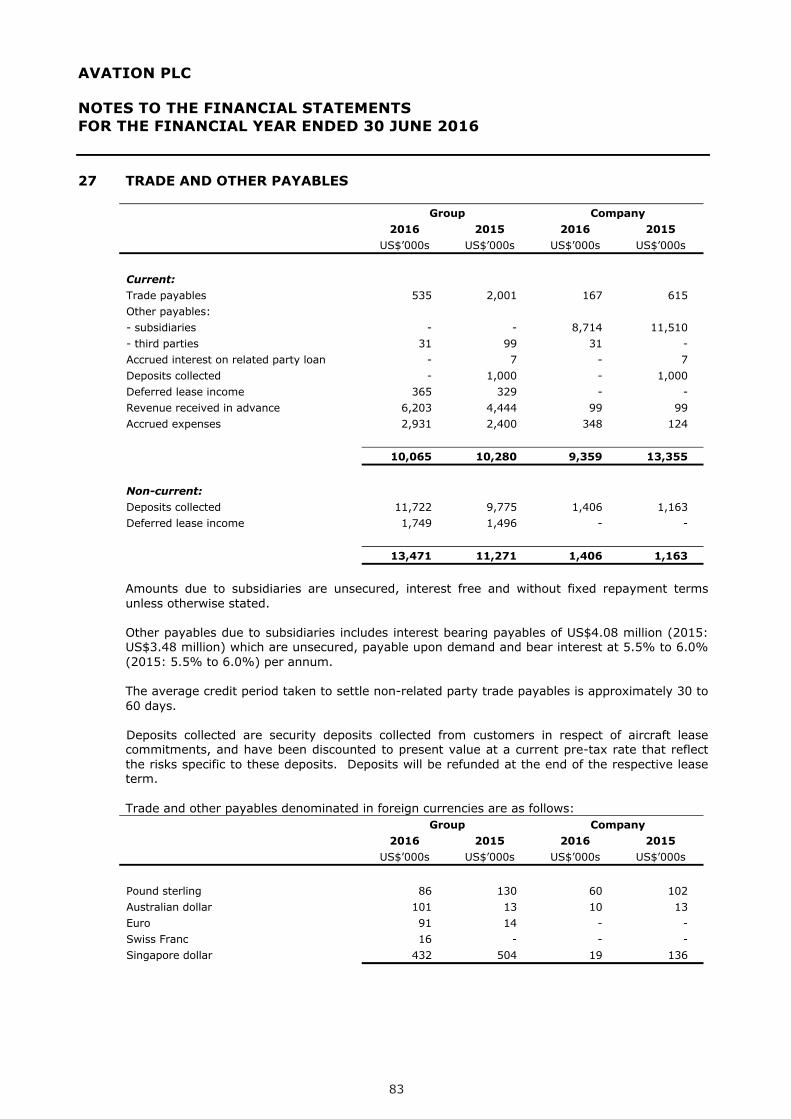
AVATION PLC NOTES TO THE FINANCIAL STATEMENTS FOR THE FINANCIAL YEAR ENDED 30 JUNE 2016 27 TRADE AND OTHER PAYABLES
Group Company 2016 2015 2016 2015 US$’000s US$’000s US$’000s US$’000s
Current: Trade payables 535 2,001 167 615 Other payables: - subsidiaries - - 8,714 11,510 - third parties 31 99 31 - Accrued interest on related party loan - 7 - 7 Deposits collected - 1,000 - 1,000 Deferred lease income 365 329 - - Revenue received in advance 6,203 4,444 99 99 Accrued expenses 2,931 2,400 348 124 10,065 10,280 9,359 13,355
Non-current: Deposits collected 11,722 9,775 1,406 1,163 Deferred lease income 1,749 1,496 - - 13,471 11,271 1,406 1,163 Amounts due to subsidiaries are unsecured, interest free and without fixed repayment terms unless otherwise stated. Other payables due to subsidiaries includes interest bearing payables of US$4.08 million (2015: US$3.48 million) which are unsecured, payable upon demand and bear interest at 5.5% to 6.0% (2015: 5.5% to 6.0%) per annum. The average credit period taken to settle non-related party trade payables is approximately 30 to 60 days. Deposits collected are security deposits collected from customers in respect of aircraft lease commitments, and have been discounted to present value at a current pre-tax rate that reflect the risks specific to these deposits. Deposits will be refunded at the end of the respective lease term.
Trade and other payables denominated in foreign currencies are as follows: Group Company 2016 2015 2016 2015 US$’000s US$’000s US$’000s US$’000s
Pound sterling 86 130 60 102 Australian dollar 101 13 10 13 Euro 91 14 - - Swiss Franc 16 - - - Singapore dollar 432 504 19 136
83

AVATION PLC NOTES TO THE FINANCIAL STATEMENTS FOR THE FINANCIAL YEAR ENDED 30 JUNE 2016
28 LOANS AND BORROWINGS
Group Company 2016 2015 2016 2015 US$’000s US$’000s US$’000s US$’000s
Secured borrowings 510,640 319,451 8,954 10,500 Junior secured borrowings 8,017 10,148 - - Related party borrowings (a) - 2,000 - 2,000 Unsecured 7.5% notes due 2020 (b) 97,067 96,496 - - 615,724 428,095 8,954 12,500 Less: current portion of borrowings (72,423) (51,584) (1,592) (3,546) 543,301 376,511 7,362 8,954
Maturity
Weighted average interest rate per annum
2016 2015 2016 2015 US$’000s US$’000s % %
Secured borrowings 2015-2028 2015-2027 4.3% 4.3% Junior secured borrowings 2020-2024 2020-2024 6.3% 6.3% Related party borrowings (a) - 2015 8.0% 8.0% Unsecured 7.5% notes due 2020 (b) 2020 2020 7.5% 7.5% Secured borrowings are secured by first ranking mortgages over the aircraft financed by the related borrowings, security assignments of the Group’s rights under leases and other contractual agreements relating to the aircraft, charges over bank accounts in which lease payments relating to the aircraft are received and charges over the issued share capital of certain subsidiaries. Junior secured borrowings are secured by second ranking aircraft mortgages, security assignments and charges over bank accounts. (a) Interest bearing unsecured loan due to an entity over which a director has significant
influence amount to US$2.0 million as at 30 June 2015. The loan was repaid during the financial year. Interest was charged at 8.0% (2015: 8.0%) per annum.
84

AVATION PLC NOTES TO THE FINANCIAL STATEMENTS FOR THE FINANCIAL YEAR ENDED 30 JUNE 2016 28 LOANS AND BORROWINGS (continued)
(b) In May 2015, the Company through its wholly-owned subsidiaries, Avation Capital S.A. and Avation Group (S) Pte Ltd (together, "the Issuers") established a US$500 million global medium term note programme (the "Programme") guaranteed by the Company. Under the Programme, the Issuers may from time to time issue Notes (the “Notes") denominated in any currency as agreed. In May 2015, the Issuers issued US$100 million unsecured Notes with a fixed coupon rate of 7.5% per annum and a tenor of 5 years repayable in May 2020 under the Programme. The Notes are listed on the Singapore Exchange (SGX). Entities over which a director has significant influence hold US$5.45 million (2015: US$5.00 million) of the May 2015 series of the unsecured Notes as at 30 June 2016. A director of the Company holds US$0.4 million (2015: US$Nil) of the May 2015 series of the unsecured Notes as at 30 June 2016.
The carrying amounts of borrowings approximate fair value.
29 MAINTENANCE RESERVES
Group 2016 2015 US$’000s US$’000s
Current 7,440 825 Non-current 3,323 - Total maintenance reserves 10,763 825
Group 2016 2015 US$’000s US$’000s
At beginning of year 825 - Transfer from sellers 8,552 - Contributions 1,386 825 At end of the year 10,763 825
The Group also holds letters of credit for US$14.10 million (2015: US$7.30 million) as security for lessees’ obligations under operating leases for the maintenance of aircraft.
85

AVATION PLC NOTES TO THE FINANCIAL STATEMENTS FOR THE FINANCIAL YEAR ENDED 30 JUNE 2016 30 DERIVATIVE FINANCIAL INSTRUMENTS
Contract/ notional amount
Fair value
Group 2016 2015 2016 2015 US$’000s US$’000s US$’000s US$’000s
Interest rate swap 54,010 15,031 2,387 229
The Group pays fixed rates of interest of 1.78% to 2.3% per annum and receives floating rate interest equal to 3-month LIBOR under the interest rate swap contracts. The swap contracts mature between 30 May 2026 and 26 May 2028.
31 DEFERRED TAX LIABILITIES Recognised deferred tax liabilities are attributable to the following:
Group Company 2016 2015 2016 2015 US$’000s US$’000s US$’000s US$’000s
Property, plant and equipment 5,700 6,847 432 493 Tax losses carried forward (962) - - - Other items - - - - 4,738 6,847 432 493
Movements in temporary differences are as follows:
Group
Property, plant and
equipment
Tax losses carried forward /other items Total
US$’000s US$’000s US$’000s 2016 At beginning of the year 6,847 - 6,847 Recognised in profit or loss - Continuing operations (475) (962) (1,437) Recognised in equity (672) - (672)
At end of the year 5,700 (962) 4,738 2015 At beginning of the year 6,464 (42) 6,422 Recognised in profit or loss - Continuing operations 812 42 854 - Discontinued operations (429) - (429) At end of the year 6,847 - 6,847
86

AVATION PLC NOTES TO THE FINANCIAL STATEMENTS FOR THE FINANCIAL YEAR ENDED 30 JUNE 2016 31 DEFERRED TAX LIABILITIES (continued)
Company
Property, plant and
equipment Other items Total US$’000s US$’000s US$’000s 2016 At beginning of the year 493 - 493 - Recognised in profit or loss (61) - (61) At end of the year 432 - 432 2015 At beginning of the year 624 - 624 - Recognised in profit or loss (131) - (131) At end of the year 493 - 493
32 SHARE CAPITAL AND TREASURY SHARES
(a) Share capital
2016 2015 No of shares US$’000s No of shares US$’000s
Allotted, called up and fully paid Ordinary shares of 1 penny each: At beginning of the year 55,663,727 991 49,604,639 891 Issue of shares 121,500 2 6,059,088 100 At end of the year 55,785,227 993 55,663,727 991
During the financial year, the Company issued 121,500 ordinary shares of 1 penny each at a price of 110p following the exercise of warrants by warrant holders raising gross proceeds of US$196,000.
The holders of ordinary shares (except for treasury shares) are entitled to receive dividends as and when declared by the Company. All ordinary shares carry one vote per share without restrictions.
87
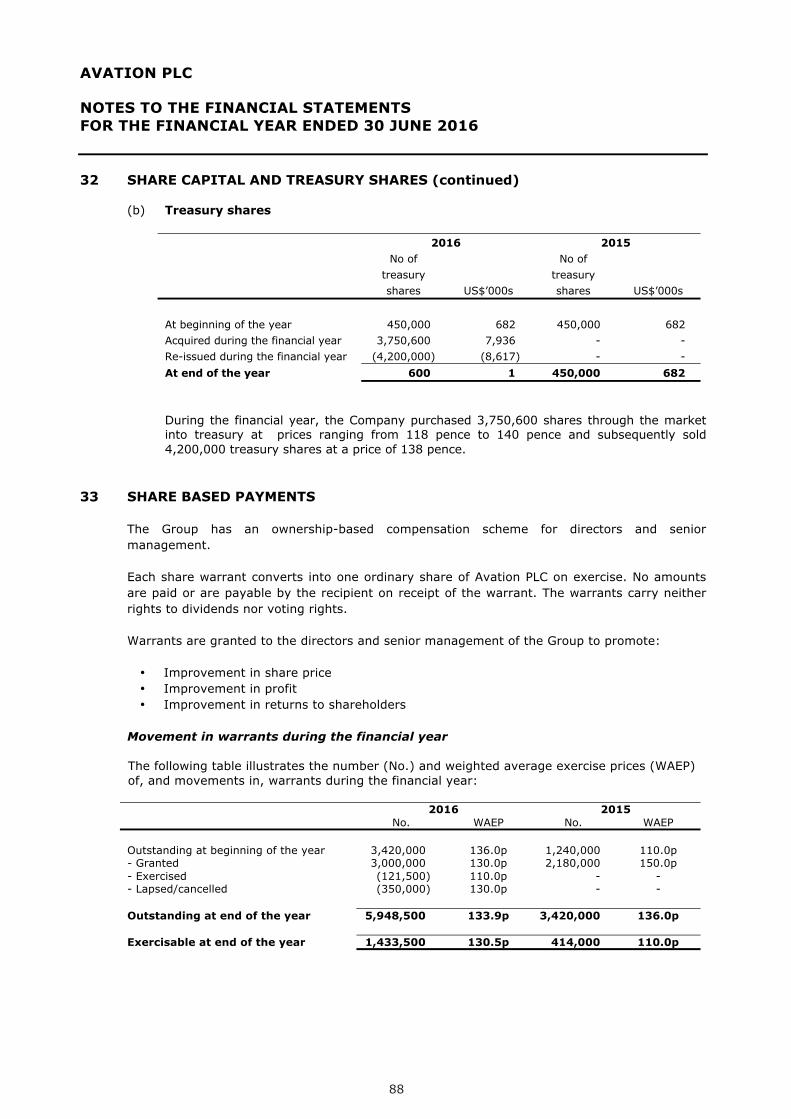
AVATION PLC NOTES TO THE FINANCIAL STATEMENTS FOR THE FINANCIAL YEAR ENDED 30 JUNE 2016 32 SHARE CAPITAL AND TREASURY SHARES (continued)
(b) Treasury shares
2016 2015 No of
treasury shares US$’000s
No of treasury shares US$’000s
At beginning of the year 450,000 682 450,000 682 Acquired during the financial year 3,750,600 7,936 - - Re-issued during the financial year (4,200,000) (8,617) - - At end of the year 600 1 450,000 682
During the financial year, the Company purchased 3,750,600 shares through the market into treasury at prices ranging from 118 pence to 140 pence and subsequently sold 4,200,000 treasury shares at a price of 138 pence.
33 SHARE BASED PAYMENTS
The Group has an ownership-based compensation scheme for directors and senior management. Each share warrant converts into one ordinary share of Avation PLC on exercise. No amounts are paid or are payable by the recipient on receipt of the warrant. The warrants carry neither rights to dividends nor voting rights.
Warrants are granted to the directors and senior management of the Group to promote: • Improvement in share price • Improvement in profit • Improvement in returns to shareholders
Movement in warrants during the financial year
The following table illustrates the number (No.) and weighted average exercise prices (WAEP) of, and movements in, warrants during the financial year: 2016 2015 No. WAEP No. WAEP Outstanding at beginning of the year 3,420,000 136.0p 1,240,000 110.0p - Granted 3,000,000 130.0p 2,180,000 150.0p - Exercised (121,500) 110.0p - - - Lapsed/cancelled (350,000) 130.0p - - Outstanding at end of the year 5,948,500 133.9p 3,420,000 136.0p Exercisable at end of the year 1,433,500 130.5p 414,000 110.0p
88
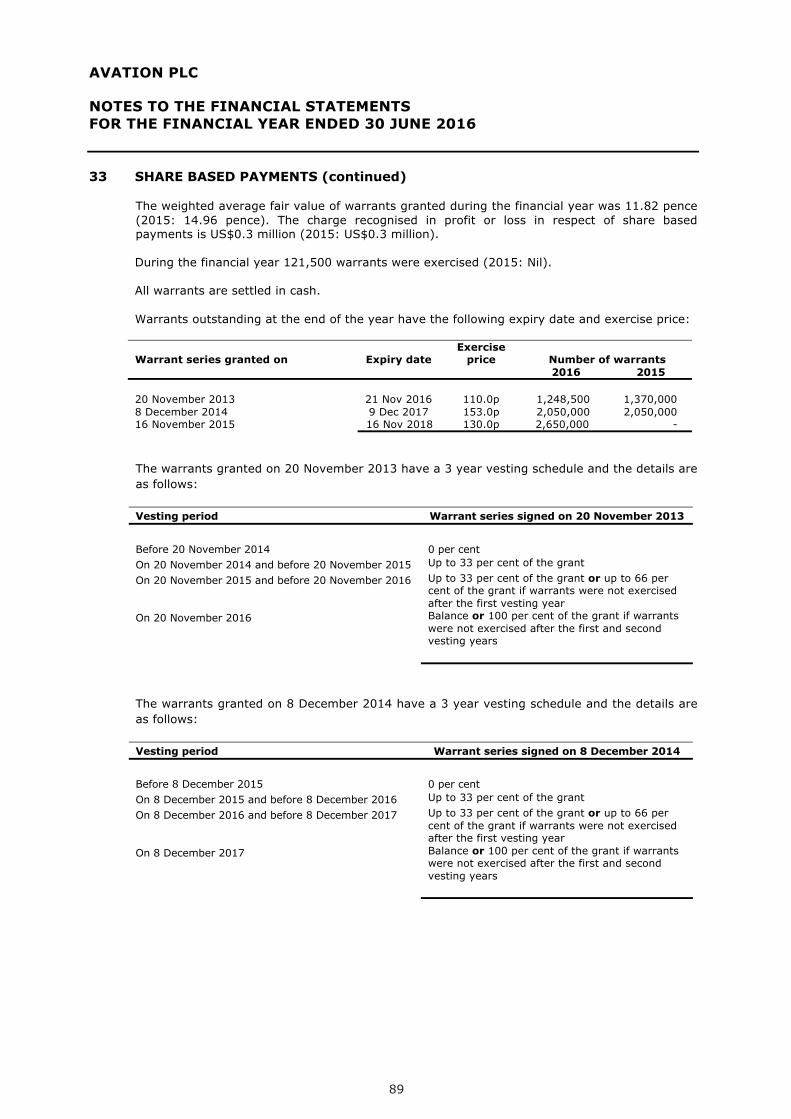
AVATION PLC NOTES TO THE FINANCIAL STATEMENTS FOR THE FINANCIAL YEAR ENDED 30 JUNE 2016
33 SHARE BASED PAYMENTS (continued)
The weighted average fair value of warrants granted during the financial year was 11.82 pence (2015: 14.96 pence). The charge recognised in profit or loss in respect of share based payments is US$0.3 million (2015: US$0.3 million). During the financial year 121,500 warrants were exercised (2015: Nil). All warrants are settled in cash. Warrants outstanding at the end of the year have the following expiry date and exercise price:
Warrant series granted on Expiry date Exercise
price Number of warrants 2016 2015 20 November 2013 21 Nov 2016 110.0p 1,248,500 1,370,000 8 December 2014 9 Dec 2017 153.0p 2,050,000 2,050,000 16 November 2015 16 Nov 2018 130.0p 2,650,000 -
The warrants granted on 20 November 2013 have a 3 year vesting schedule and the details are as follows: Vesting period Warrant series signed on 20 November 2013
Before 20 November 2014 0 per cent On 20 November 2014 and before 20 November 2015 Up to 33 per cent of the grant
On 20 November 2015 and before 20 November 2016 Up to 33 per cent of the grant or up to 66 per cent of the grant if warrants were not exercised after the first vesting year
On 20 November 2016 Balance or 100 per cent of the grant if warrants were not exercised after the first and second vesting years
The warrants granted on 8 December 2014 have a 3 year vesting schedule and the details are as follows: Vesting period Warrant series signed on 8 December 2014 Before 8 December 2015 0 per cent On 8 December 2015 and before 8 December 2016 Up to 33 per cent of the grant
On 8 December 2016 and before 8 December 2017 Up to 33 per cent of the grant or up to 66 per cent of the grant if warrants were not exercised after the first vesting year
On 8 December 2017 Balance or 100 per cent of the grant if warrants were not exercised after the first and second vesting years
89
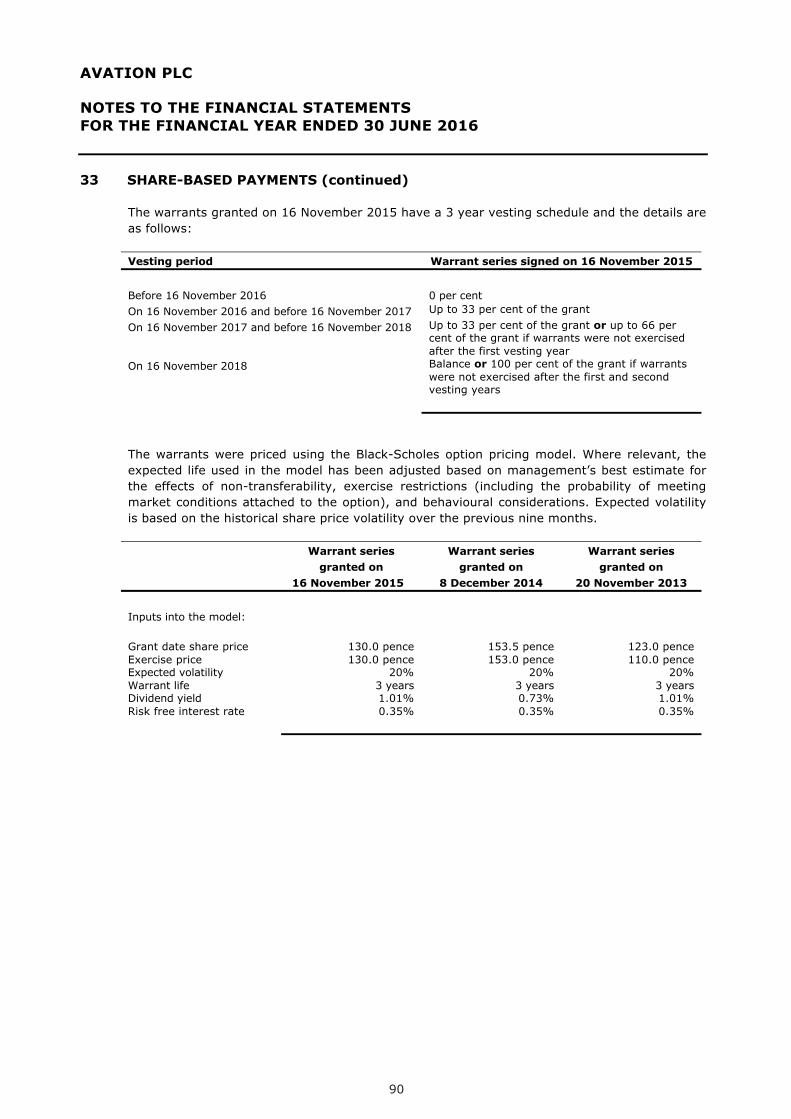
AVATION PLC NOTES TO THE FINANCIAL STATEMENTS FOR THE FINANCIAL YEAR ENDED 30 JUNE 2016 33 SHARE-BASED PAYMENTS (continued)
The warrants granted on 16 November 2015 have a 3 year vesting schedule and the details are as follows:
Vesting period Warrant series signed on 16 November 2015
Before 16 November 2016 0 per cent On 16 November 2016 and before 16 November 2017 Up to 33 per cent of the grant
On 16 November 2017 and before 16 November 2018 Up to 33 per cent of the grant or up to 66 per cent of the grant if warrants were not exercised after the first vesting year
On 16 November 2018 Balance or 100 per cent of the grant if warrants were not exercised after the first and second vesting years
The warrants were priced using the Black-Scholes option pricing model. Where relevant, the expected life used in the model has been adjusted based on management’s best estimate for the effects of non-transferability, exercise restrictions (including the probability of meeting market conditions attached to the option), and behavioural considerations. Expected volatility is based on the historical share price volatility over the previous nine months.
Warrant series
granted on 16 November 2015
Warrant series granted on
8 December 2014
Warrant series granted on
20 November 2013 Inputs into the model: Grant date share price 130.0 pence 153.5 pence 123.0 pence Exercise price 130.0 pence 153.0 pence 110.0 pence Expected volatility 20% 20% 20% Warrant life 3 years 3 years 3 years Dividend yield 1.01% 0.73% 1.01% Risk free interest rate 0.35% 0.35% 0.35%
90
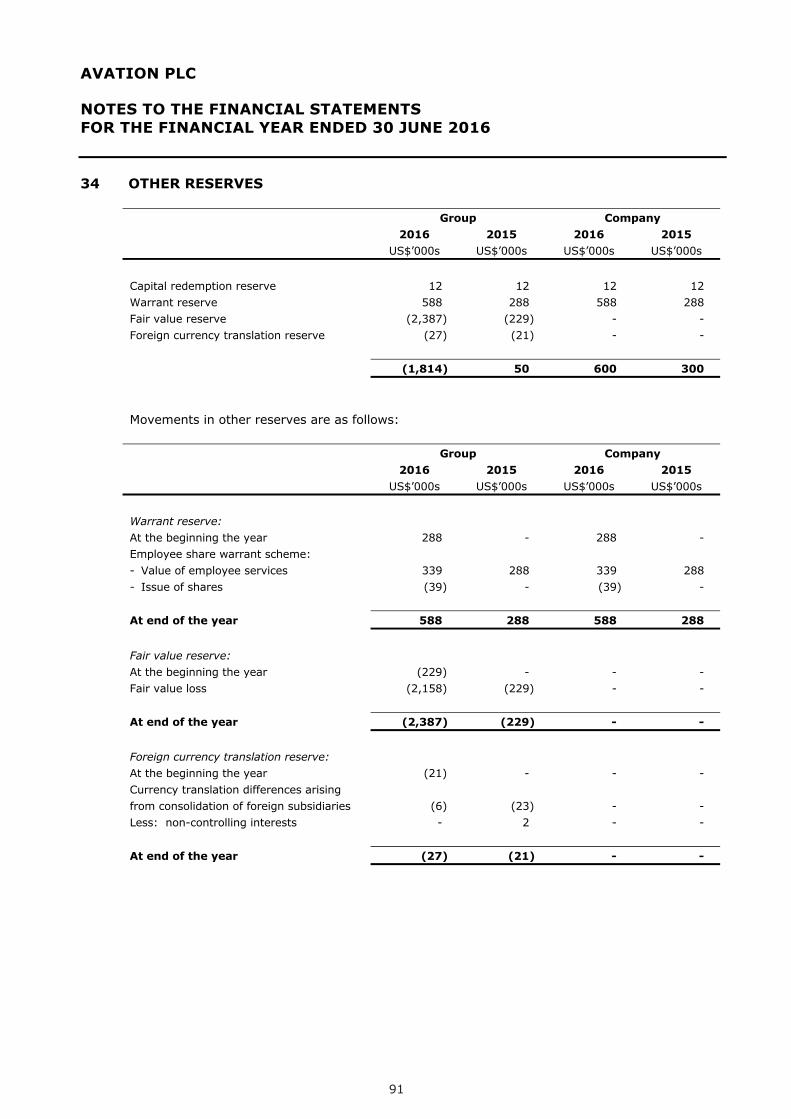
AVATION PLC NOTES TO THE FINANCIAL STATEMENTS FOR THE FINANCIAL YEAR ENDED 30 JUNE 2016 34 OTHER RESERVES
Group Company 2016 2015 2016 2015 US$’000s US$’000s US$’000s US$’000s
Capital redemption reserve 12 12 12 12 Warrant reserve 588 288 588 288 Fair value reserve (2,387) (229) - - Foreign currency translation reserve (27) (21) - - (1,814) 50 600 300
Movements in other reserves are as follows:
Group Company 2016 2015 2016 2015 US$’000s US$’000s US$’000s US$’000s
Warrant reserve: At the beginning the year 288 - 288 - Employee share warrant scheme: - Value of employee services 339 288 339 288 - Issue of shares (39) - (39) - At end of the year 588 288 588 288
Fair value reserve: At the beginning the year (229) - - - Fair value loss (2,158) (229) - - At end of the year (2,387) (229) - - Foreign currency translation reserve: At the beginning the year (21) - - - Currency translation differences arising from consolidation of foreign subsidiaries (6) (23) - - Less: non-controlling interests - 2 - - At end of the year (27) (21) - -
91

AVATION PLC NOTES TO THE FINANCIAL STATEMENTS FOR THE FINANCIAL YEAR ENDED 30 JUNE 2016 35 CAPITAL COMMITMENTS Capital expenditure contracted for at the reporting date but not recognised in the financial
statements are as follows:
Group 2016 2015 US$’000s US$’000s
Property, plant and equipment 327,955 292,232
The above capital commitments represent amounts due under contracts entered into by the group to purchase aircraft. The company has paid deposits towards the cost of these aircraft which are included in trade and other receivables. Included in the above are commitments to purchase nine ATR 72-600 aircraft from the manufacturer with expected delivery dates over a three-year period ending in June 2019. Two of these aircraft are due to be delivered before the end of the calendar year 2016. As at the date of this report the Group has not placed these aircraft on leases. Management intends to arrange leases for or agree sales of these aircraft prior to delivery.
36 OPERATING LEASE COMMITMENTS
The Group leases out aircraft under operating leases. The future minimum lease payments receivable under non-cancellable leases are as follows: Group 2016 2015 US$’000s US$’000s
Within one year 84,182 58,154 In the second to fifth years inclusive 313,268 193,946 More than five years 240,947 115,926
The Group holds cash deposits of US$12.80 million (2015: $10.40 million) and letters of credit for US$4.70 million (2015: US$2.30 million) as security for lessees’ obligations under operating leases.
92
AVATION PLC NOTES TO THE FINANCIAL STATEMENTS FOR THE FINANCIAL YEAR ENDED 30 JUNE 2016 37 SEGMENT INFORMATION
Management has determined the operating segments based on reports reviewed by the Executive Chairman (“Chief Operating Decision Maker” or “CODM”) that are used to make strategic decisions. The CODM considers the business from a business segment perspective. Management manages and monitors the business in 2 primary business areas: aircraft leasing and business procurement. (a) Segment reporting policy
A segment is a distinguishable component of the Group within a particular economic environment (geographical segment) and to a particular industry (business segment) which is subject to risks and rewards that are different from those of other segments. Business segments are based on the Group’s management and internal reporting structure. In presenting information on the basis of business segments, segment revenue and segment assets are based on the nature of the products or services provided by the Group while information for geographical segments is based on the geographical areas where customers are located. Inter-segment pricing is determined on an arm’s length basis. Segment results, assets and liabilities include items directly attributable to a segment as well as those that can be allocated on a reasonable basis. Unallocated items are mostly comprised of corporate assets and liabilities or profit or losses items that are not directly attributable to a segment or those that cannot be allocated on a reasonable basis. Common expenses were allocated based on revenue. Segment capital expenditure is the total cost incurred during the period to acquire segment assets that are expected to be used for more than one year.
(b) Business segments
During the year ended 30 June 2016, the Group was organised into two main business segments which are aircraft leasing and business procurement. Other Group operations mainly comprise investment holding which does not constitute a separate reportable segment. There are no inter-segment transactions recorded during the financial period. The business procurement segment does not meet the quantitative thresholds and is not separately disclosed.
93

AVATION PLC NOTES TO THE FINANCIAL STATEMENTS FOR THE FINANCIAL YEAR ENDED 30 JUNE 2016 37 SEGMENT INFORMATION (continued)
(c) Geographical analysis
2016 Europe Asia
Pacific Total US$’000s US$’000s US$’000s Lease income from continuing activities 22,030 49,160 71,190 Capital expenditure and valuation movements 293,912 79,225 373,137 Net book value - aircraft 341,765 383,035 724,800 Total assets 370,708 461,077 831,785
2015 Europe Asia
Pacific Total US$’000s US$’000s US$’000s Lease income from continuing activities 11,682 45,250 56,932 Capital expenditure and valuation movements 18,371 91,802 110,173 Net book value - aircraft 74,764 359,046 433,810 Total assets 127,040 459,142 586,182
During the year, certain customers accounted for more than 10% of the Group’s total revenues. There is one customer based in the Asia Pacific geographical area that accounts for US$37.7 million (2015: US$38.3 million), 53% (2015: 67%) of the Group’s total revenues from continuing operations.
94

AVATION PLC NOTES TO THE FINANCIAL STATEMENTS FOR THE FINANCIAL YEAR ENDED 30 JUNE 2016 38 CONTINGENT LIABILITIES
(a) Lease-end/re-delivery adjustment compensation
The Company’s subsidiary MSN 1607 Pte Ltd owns an aircraft where there is a contingent liability to pay amounts to the lessee dependent upon the return condition of the aircraft at the end of the lease term. A liability would only become payable in the event that the aircraft is returned at the end of the lease in April 2018 in a condition which exceeds certain criteria agreed at the inception of the lease. Given that the lease continues until April 2018, the directors are of the opinion that it is impossible to accurately estimate the return condition of the aircraft given the number of variables such as aircraft usage and timing of future maintenance events. The directors have assessed several different outcomes and consider that the likely outcome would result in a cash inflow from the lessee. On this basis, the directors have not recognised a contingent asset or liability in this set of financial statements.
(b) Guarantees
Group 2016 2015 US$’000s US$’000s
Guarantees 615,724 426,095
The maximum estimated amount that the Group could become liable for under guarantees is as shown above.
39 DIVIDEND
2016 2015 US$’000s US$’000s
Declared/paid during the financial year: Dividends on ordinary shares - Final exempt (one-tier) dividend for 2015: Nil US cents (2014: 2.01 US cents) per share - 1,119 - Interim exempt (one-tier) dividend for 2016: 3.00 US cents per share 1,656 -
Dividends to the Company’s shareholders are recognised when the dividends are approved for payment.
95

AVATION PLC NOTES TO THE FINANCIAL STATEMENTS FOR THE FINANCIAL YEAR ENDED 30 JUNE 2016 40 ULTIMATE HOLDING COMPANY
No party controls the Company. 41 SUBSEQUENT EVENTS
On 29 July 2016 the Group announced the successful purchase and delivery of a new Airbus A321-200 aircraft which is leased to Vietjet, a leading domestic and international Vietnamese airline. On 22 August 2016, the Group announced the successful purchase and delivery of a second new Airbus A321-200 aircraft leased to Vietjet.
On 2 September 2016, the Group entered into two agreements to purchase and lease two additional new Aircraft A321-200 aircraft to Vietjet. On 8 September 2016, the directors of the Company declared a 3.25 US cents interim dividend for the financial year ending 30 June 2017.
On 8 September 2016, the Group announced the sale of the first of two 2003 built Airbus A321 aircraft which are leased to Thomas Cook Airlines. On 13 September 2016, the Group announced the sale of the second of two 2003 built Airbus A321 which are leased to Thomas Cook Airlines.
42 APPROVAL OF FINANCIAL STATEMENTS The financial statements of the Company and the consolidated financial statements of the Group
for the financial year ended 30 June 2016 were authorised for issue by the Board of Directors on 30 September 2016.
96


Annual Report 2016

ATR 72-600 aircraft at production facility

ANNUAL REPORT 2016
65 Kampong Bahru Road
Singapore 169370
www.avation.net
S T A N D A R DSHARES
L I S T E D
Reuters/BBG AVAP.LNIndex: LSE AVAPFTSE Sector: Industrial TransportationFTSE Sub Sector: Transportation Services