annual report annual report 2008 - marsa maroc · marsa maroc was established in december 2006...
TRANSCRIPT

Annual Report 2008
An
nu
al Rep
ort

Company name : Société d’exploitation des ports - Marsa MarocDate of establishment : December 1st, 2006Legal status : Public Limited Company with Executive and Supervisory BoardsShare Capital : 733.956.000 MADRegistered Offi ce : 175 Bd Zerktouni – 20 100 Casablanca – MoroccoPresident of the Executive Board : Mr Mohammed ABDELJALILBusiness area : Terminals and ports operating within the framework of concessions Turnover : 2.980 Million MADStaff : 2.204Global traffi c : 41.3 Million tonsOperated ports : Nador, Tangier, Mohammedia, Casablanca, Jorf Lasfar, Safi , Agadir, Laâyoune and Dakhla

Table of contents
A n n u a lR e p o r t2 0 0 8
Table of contents President’s word
Presentation of Marsa Maroc
Management Method
Activity and Services
Main terminals
Highlights
Ports’ Business
Marsa Maroc’s Activity
Strategy & Development
Strategic Plan CAP 15
Development Projects
Structuring Projects
2008 Results
Consolidated Traffic, Financial and Budgetary Accounts
Variation by Location
Financial Statements
Appendices
Contacts
4
7
9
10
12
15
16
17
21
22
24
25
27
28
35
45
53
57
6
President’s word Presid
ent’s wo
rd
President’s word Presid
ent’s wo
rd
President’s word Presid
ent’s wo
rd
5
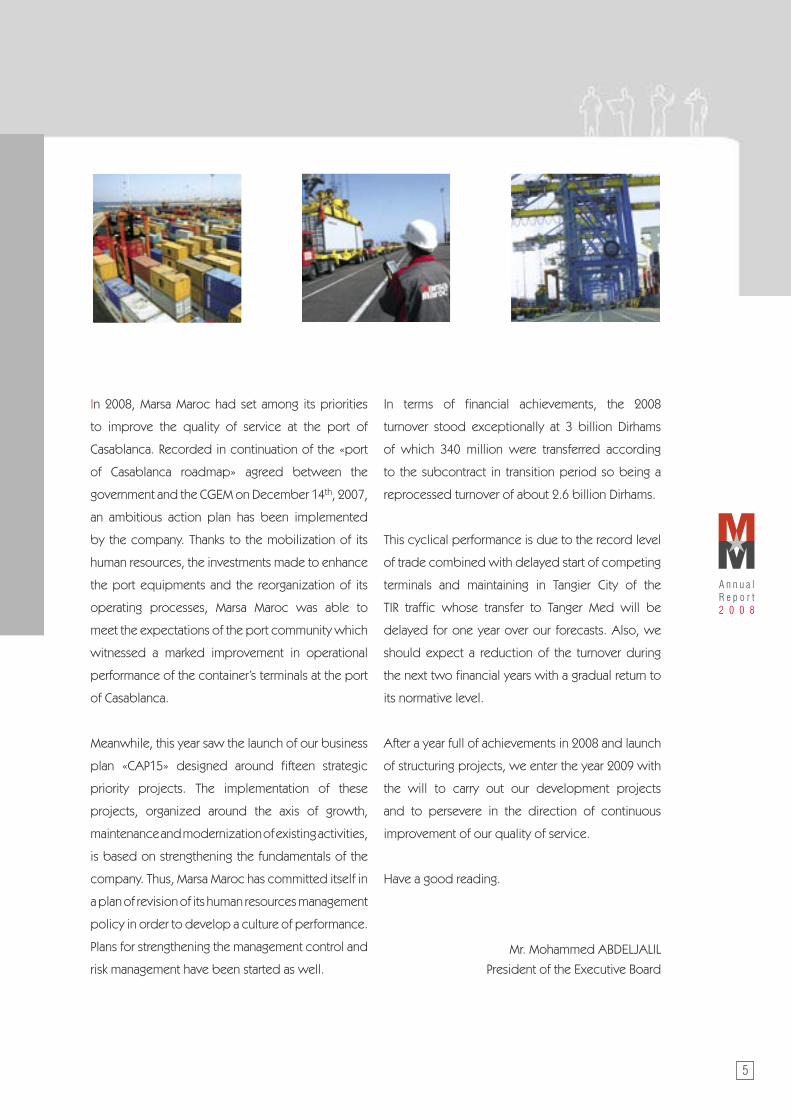
In 2008, Marsa Maroc had set among its priorities
to improve the quality of service at the port of
Casablanca. Recorded in continuation of the «port
of Casablanca roadmap» agreed between the
government and the CGEM on December 14th, 2007,
an ambitious action plan has been implemented
by the company. Thanks to the mobilization of its
human resources, the investments made to enhance
the port equipments and the reorganization of its
operating processes, Marsa Maroc was able to
meet the expectations of the port community which
witnessed a marked improvement in operational
performance of the container’s terminals at the port
of Casablanca.
Meanwhile, this year saw the launch of our business
plan «CAP15» designed around fifteen strategic
priority projects. The implementation of these
projects, organized around the axis of growth,
maintenance and modernization of existing activities,
is based on strengthening the fundamentals of the
company. Thus, Marsa Maroc has committed itself in
a plan of revision of its human resources management
policy in order to develop a culture of performance.
Plans for strengthening the management control and
risk management have been started as well.
In terms of financial achievements, the 2008
turnover stood exceptionally at 3 billion Dirhams
of which 340 million were transferred according
to the subcontract in transition period so being a
reprocessed turnover of about 2.6 billion Dirhams.
This cyclical performance is due to the record level
of trade combined with delayed start of competing
terminals and maintaining in Tangier City of the
TIR traffic whose transfer to Tanger Med will be
delayed for one year over our forecasts. Also, we
should expect a reduction of the turnover during
the next two financial years with a gradual return to
its normative level.
After a year full of achievements in 2008 and launch
of structuring projects, we enter the year 2009 with
the will to carry out our development projects
and to persevere in the direction of continuous
improvement of our quality of service.
Have a good reading.
Mr. Mohammed ABDELJALIL
President of the Executive Board


Presentation of Marsa Maroc
Presentation of Marsa M
aroc
Management Method
Activity and Services
Main terminals

Marsa M
aroc
Ports’ Business Reform
Marsa Maroc was established in December 2006 further to the dissolution of the former “Office d’Exploitation des Ports” in the framework of the ports’ business reform. Thus, the law 15-02 on ports’ reform which came into force in December 2006 has deeply changed the functioning of the national ports sector with three main objectives:
• Clarification of roles and split of functions of authority and business operations; • Introduction of competition between port operators; • Unification of handling operations therefore ending breach of responsibility in the handling chain.
In this new configuration, and in competition with other operators, Marsa Maroc takes in charge operating terminals and wharfs within the framework of concession contracts with the “Agence Nationale des Ports” which is entrusted with missions of authority, regulation and development of ports capacities.
8
Presentation of Marsa Maroc

9
Management Method
Marsa Maroc was set up in December 2006, as a limited company with Executive and Supervisory
Boards.
The Supervisory Board, chaired by
Mr Karim GHELLAB, Minister of Equipment
and Transport, carries out continuous
monitoring of the Company’s management
by the Executive Board and approves the
major strategic orientations of the company.
Executive Board, chaired by Mr Mohammed ABELJALIL, is the company’s management body.
It is vested with abilities to make commercial, technical, financial and social decisions.
President of the Executive BoardMohammed ABDELJALIL
Technical Director and Interim Development Director
El Mahjoub BAYRIFinance Director
Mustapha SAHABI
Operations Director in the Port of Casablanca
Rachid HADIHuman Resources
and General Affairs Director
Youssef BENNANI
chaired by Mr Karim GHELLAB
The Supervisory Board

10
Presentation of Marsa Maroc
Integrated Port Logistics
Mission
Marsa Maroc is assigned to the mission of creating value for its customers at each step of the port’s
logistics chain.
Services
Marsa Maroc offers to its customers, importers, exporters, shipowners, shipping agents,
and freight-forwarders, a range of diversified services:
Port operations:
Main services: on board and dockside handling, warehousing, checking, weighing, loading
and unloading containers and trailers.
Other Services: stevedoring, loading and unloading trucks and other port logistical support
services. .
Maritime services:
Piloting, towing, mooring as well as supplying water and electricity.
e-services:
The e-service « Marsa Conteneur » enables the customers an access to real-time information
about the different stages of their containers’ transit.
Marsa M
aroc

11
Nador Ores, billets and Passengers
Al HoceimaPassengers
Tangier CityPassengers
MohammediaLiquid bulks : hydrocarbons
CasablancaContainers, Ro-Ro, conventional
shipments and dry bulks
Jorf LasfarDry bulks and hydrocarbons
ROYAUME DU MAROC
DakhlaRefrigerated
containers and fish
products
LaayouneSand, containers,
hydrocarbons and ores
Agadir Containers, citrus and early fruits
Safi Ores
A multi-location Implementation
Marsa Maroc is present in the 10 major ports of the Kingdom. This diversity has vested it with the nature of a multi-services port operator taking in charge various kinds of traffic.
Main terminals
12
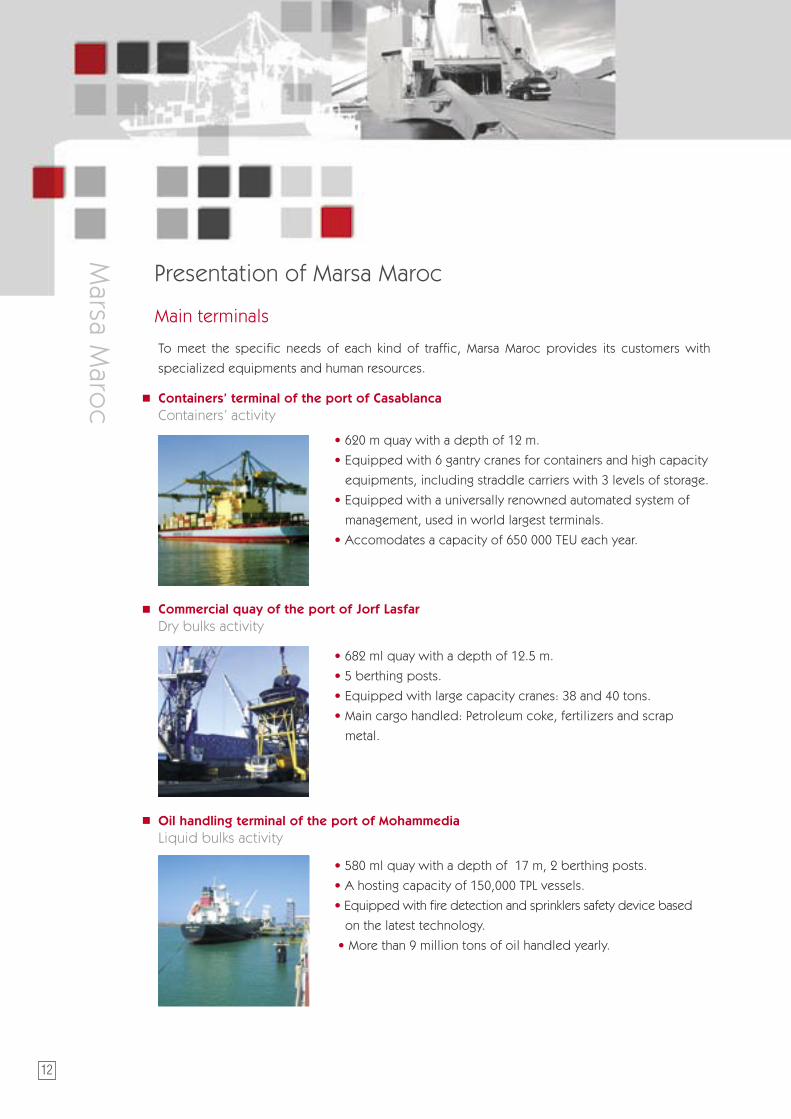
Containers’ terminal of the port of Casablanca Containers’ activity
• 620 m quay with a depth of 12 m.
• Equipped with 6 gantry cranes for containers and high capacity
equipments, including straddle carriers with 3 levels of storage.
• Equipped with a universally renowned automated system of
management, used in world largest terminals.
• Accomodates a capacity of 650 000 TEU each year.
Commercial quay of the port of Jorf LasfarDry bulks activity
• 682 ml quay with a depth of 12.5 m.
• 5 berthing posts.
• Equipped with large capacity cranes: 38 and 40 tons.
• Main cargo handled: Petroleum coke, fertilizers and scrap
metal.
Oil handling terminal of the port of MohammediaLiquid bulks activity
• 580 ml quay with a depth of 17 m, 2 berthing posts.
• A hosting capacity of 150,000 TPL vessels.
• Equipped with fire detection and sprinklers safety device based
on the latest technology.
• More than 9 million tons of oil handled yearly.
Presentation of Marsa Maroc
Marsa M
aroc
To meet the specific needs of each kind of traffic, Marsa Maroc provides its customers with
specialized equipments and human resources.
13
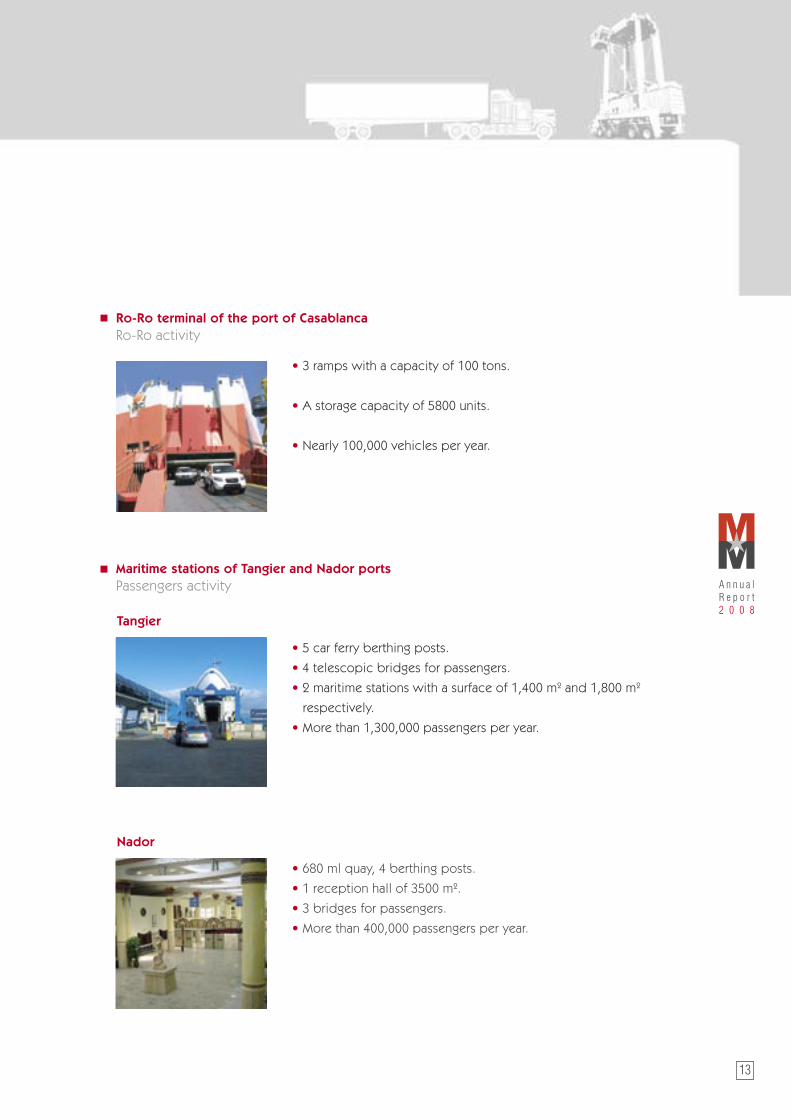
Ro-Ro terminal of the port of CasablancaRo-Ro activity
• 3 ramps with a capacity of 100 tons.
• A storage capacity of 5800 units.
• Nearly 100,000 vehicles per year.
Maritime stations of Tangier and Nador portsPassengers activity
• 5 car ferry berthing posts.
• 4 telescopic bridges for passengers.
• 2 maritime stations with a surface of 1,400 m2 and 1,800 m2
respectively.
• More than 1,300,000 passengers per year.
• 680 ml quay, 4 berthing posts.
• 1 reception hall of 3500 m2.
• 3 bridges for passengers.
• More than 400,000 passengers per year.
Nador
Tangier


2 0 0 8 H i g h l i g h t s
2008 Highlights Ports’ business
Marsa Maroc’s activity

2008 Highlights
16
Ports’ business
Launching of construction work of a new container’s terminal at the port
of Casablanca.
In November 2008, His Majesty King Mohammed VI launched the construction of
the Containers’ Terminal 3 (TC3).
With a capacity of 600,000 TEU, the new terminal has a quay length of 600 m with
a depth between 12m and 14 m.
Start of new activities at the port of Tanger Med.
• In March 2008, containers import/export traffic activity started at Containers’
Terminal 1, operated by APM Terminals Tangiers;
• In November 2008, the TIR activity was launched at the RO-RO terminal
of Tanger Med.
Implementation of Containers’ Terminal 2 at the port of Tanger Med
Conceded to the Consortium formed by the operator Eurogate-Contship and
the shipping companies MSC and CMA-CGM, the Containers’ Terminal 2 started
operating in July 2008.
2008 Highlights

17
Marsa Maroc’s Activities
Projects and achievements
Implementation of Marsa Maroc’s strategic plan «CAP 15» by the launching of
the first strategic projects:
• obtaining new concessions ;
• integrating Freight Forwarding (Port to Door) ;
• improving the quality of service and industrial performance ;
• developping partnerships with industrials.
Launching of the project of a vertical storage space construction in the port of
Casablanca. This car park will provide a capacity of 6.000 vehicles as well as
value-added services.
18
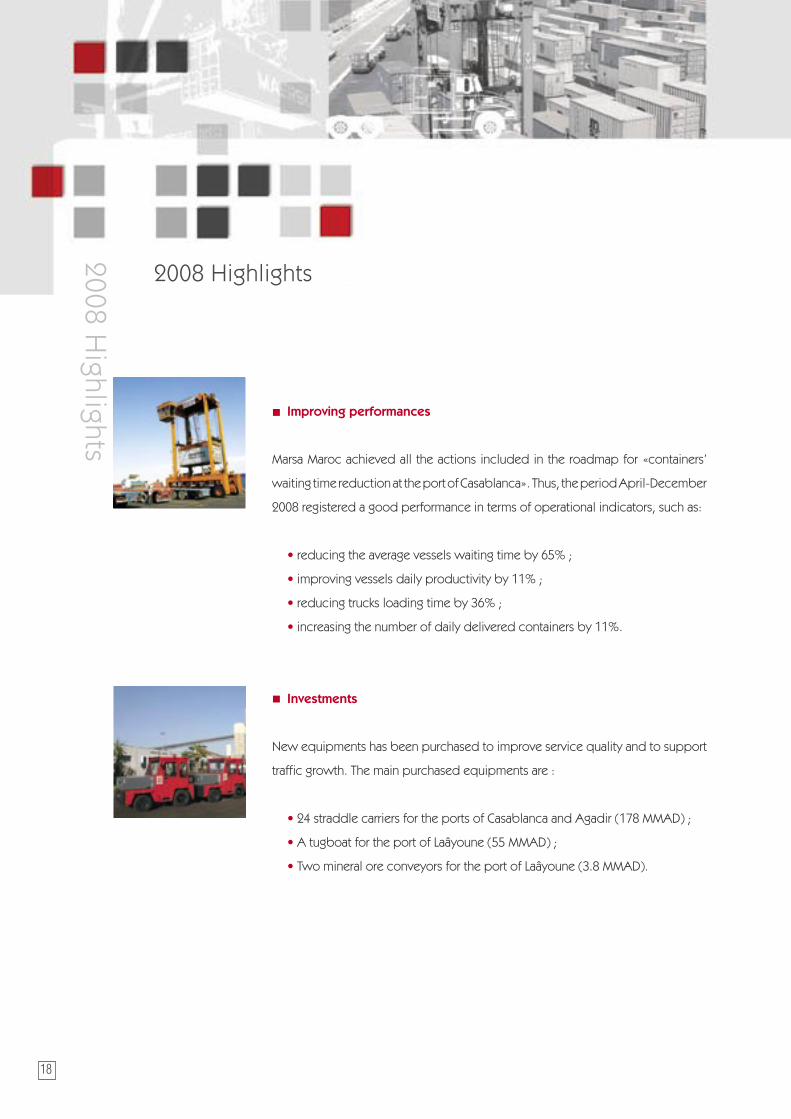
Improving performances
Marsa Maroc achieved all the actions included in the roadmap for «containers’
waiting time reduction at the port of Casablanca». Thus, the period April-December
2008 registered a good performance in terms of operational indicators, such as:
• reducing the average vessels waiting time by 65% ;
• improving vessels daily productivity by 11% ;
• reducing trucks loading time by 36% ;
• increasing the number of daily delivered containers by 11%.
Investments
New equipments has been purchased to improve service quality and to support
traffic growth. The main purchased equipments are :
• 24 straddle carriers for the ports of Casablanca and Agadir (178 MMAD) ;
• A tugboat for the port of Laâyoune (55 MMAD) ;
• Two mineral ore conveyors for the port of Laâyoune (3.8 MMAD).
2008 Highlights
2008 Highlights

19
• 27 forklifts including 2 for the port of Dakhla, the others for the port of
Casablanca (31.5 MMAD);
• 5 loaders for the ports of Nador (2), Jorf Lasfar (1), Laâyoune (2) for an
amount of (10 MMAD);
• 8 industrial tractors for the port of Casablanca (10.5 MMAD).
• 5 rail mounted cranes, 2 for the port of Casablanca, 2 for the port of Nador,
1 for the port of Jorf Lasfar (186 MMAD);
• 41 industrial tractors including 38 for the port of Casablanca and 3 for the
port of Jorf Lasfar (65 MMAD);
• 15 forklifts including 10 for the port of Casablanca, 3 for Nador, 1 for Jorf
Lasfar, 1 for Laâyoune (58.6 MMAD);
• 1 towboat for the port of Mohammedia (3.2 MMAD).
The renovation and implementation of two oil delivery systems and the pipeline 24
connecting SAMIR to the port of Mohammedia, have reduced by half the average
stay at berth of ships importing refined products (Oil Handling Terminal).
20
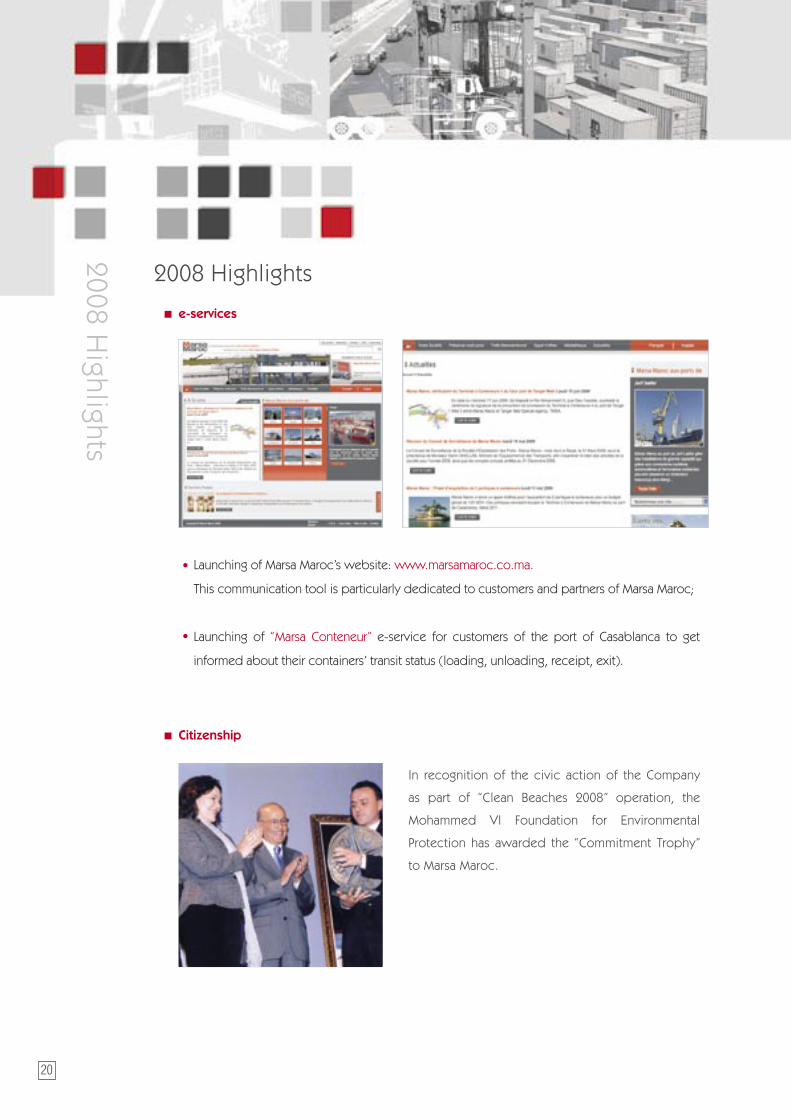
e-services
Launching of Marsa Maroc’s website: www.marsamaroc.co.ma.
This communication tool is particularly dedicated to customers and partners of Marsa Maroc;
Launching of “Marsa Conteneur” e-service for customers of the port of Casablanca to get
informed about their containers’ transit status (loading, unloading, receipt, exit).
Citizenship
In recognition of the civic action of the Company
as part of “Clean Beaches 2008” operation, the
Mohammed VI Foundation for Environmental
Protection has awarded the “Commitment Trophy”
to Marsa Maroc.
2008 Highlights
2008 Highlights

S t r a t e g y & D e v e l o p m e n t
Strate
gy &
De
velo
pm
en
t
Strategic Plan CAP 15
Development projects
Structuring projects
Given the major changes experienced by the port business sector including the reform and liberalization
of the sector as well as the start of activity of the port of Tanger Med, the strategy adopted by Marsa
Maroc aims to maintain its market positions in order to preserve the financial equilibrium of the Company,
while focusing on the priorities of growth.
So, the strategic plan of Marsa Maroc «CAP 15» revolves around themes of growth and improvement of
the present situation as well as a transverse axis of consolidating fundamentals of the company.
Growth axis 1
Development of the container’s strategic business
Obtaining new concessions in Tangier and Casablanca areas.
Diversification in surface logistics by the development of dry ports/logistics platforms.
Improving the quality of service and operational performance.
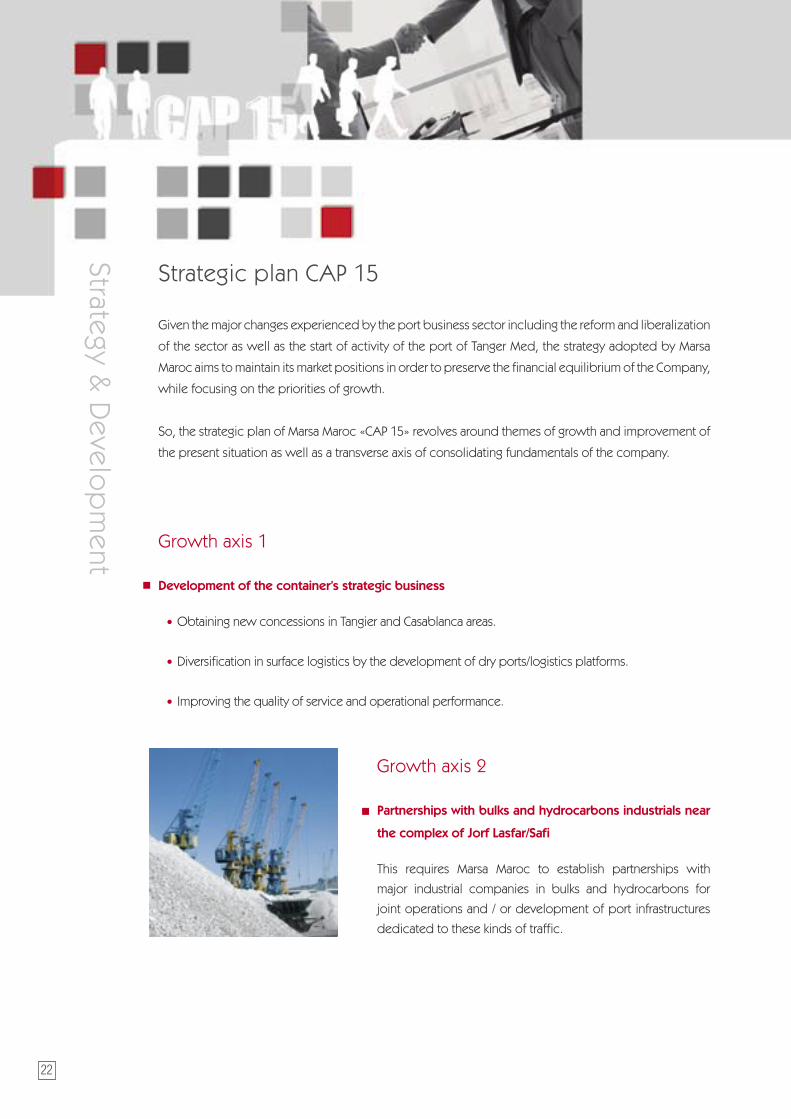
Growth axis 2
Partnerships with bulks and hydrocarbons industrials near
the complex of Jorf Lasfar/Safi
This requires Marsa Maroc to establish partnerships with
major industrial companies in bulks and hydrocarbons for
joint operations and / or development of port infrastructures
dedicated to these kinds of traffic.
22
Strategic plan CAP 15
Strategy & D
evelop
ment
23
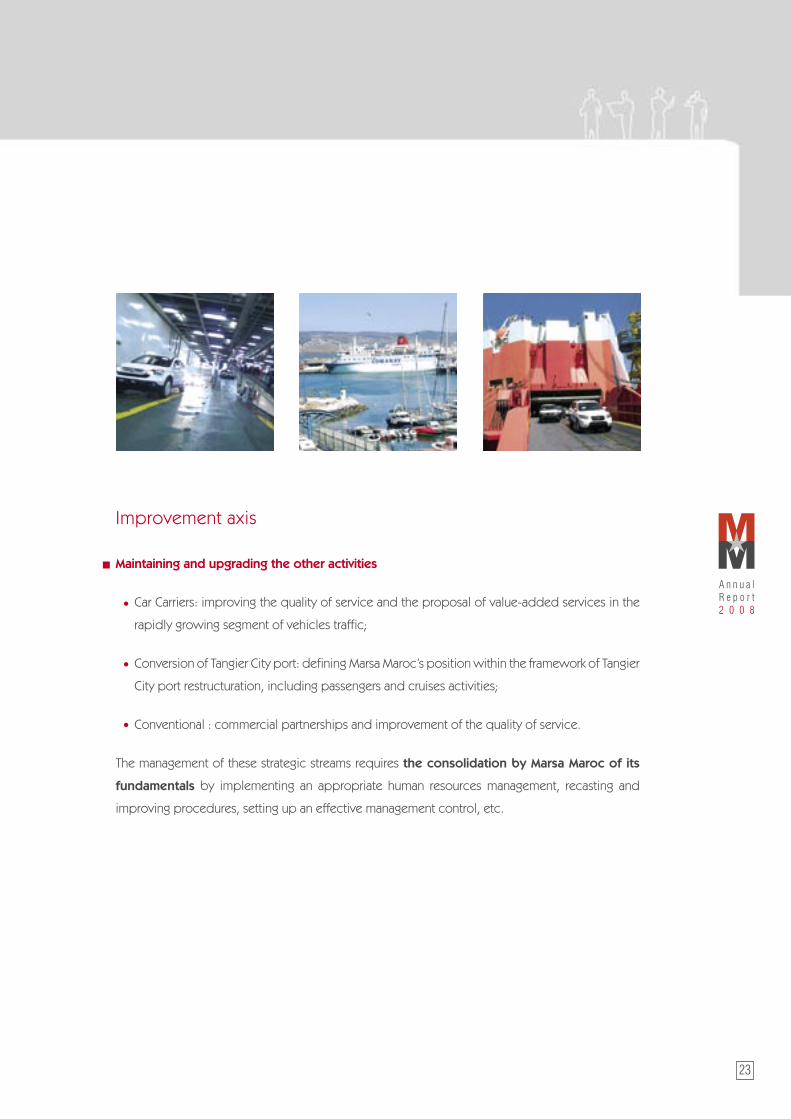
Improvement axis
Maintaining and upgrading the other activities
Car Carriers: improving the quality of service and the proposal of value-added services in the
rapidly growing segment of vehicles traffic;
Conversion of Tangier City port: defining Marsa Maroc’s position within the framework of Tangier
City port restructuration, including passengers and cruises activities;
Conventional : commercial partnerships and improvement of the quality of service.
The management of these strategic streams requires the consolidation by Marsa Maroc of its
fundamentals by implementing an appropriate human resources management, recasting and
improving procedures, setting up an effective management control, etc.

Development projects
Development of the container strategic business: Obtaining new concessions
Marsa Maroc aims to operate new container terminals by obtaining concessions in national ports like
Casablanca and Tanger Med or other regional ports (West of Africa).
Modernization of car carriers activity: Construction of a multi-storey car park
To support the growth of the automotive business, Marsa Maroc plans to build a vertical storage space
at the vehicles terminal of the port of Casablanca.
Designed in accordance with the best international standards, the terminal will require an investment of
130 million MAD and a completion period of almost 18 months.
This building will have a three-storey car park, areas dedicated to value added services as well as
delivery and reception areas.
With a ground surface of 18,000 m2, the building will have a storage area of 90,000 m2 with a capacity
of 5,000 to 6,000 cars. Its start up is scheduled for the end of 2011.
Development of bulks activities: Capacities Expansion in the port of Jorf Lasfar
Implementation of a new multipurpose terminal
To meet the needs of an hinterland with an increasing number of industrial
units, Marsa Maroc will operate the new multipurpose terminal by the end
of 2009. This terminal will offer to the local industries large facilities such as
a 320 meters long quay with a depth of 12.5m and an area of 9.5 ha.
Implementation of a new oil handling terminal
Marsa Maroc will implement, by the end of 2009, an oil handling terminal, «berth 8». With a depth of
15.6 m, this platform will be able to receive ships of large capacity. The quay’s facilities meet the needs
of the port’s hinterland for hydrocarbons as well as serving other regions through cabotage.
24
Strategy & D
evelop
ment
25
Human resources: towards a culture of performance
Since its establishment, Marsa Maroc has committed itself to develop and deploy a new human resources
policy according to its strategic plans.
Thanks to its scope, the structural redesign of our human resources policy will upgrade the human resources
management. It will become more dynamic, fair and appreciative of the participation, initiative and
performance individually as well as collectively.
It aims to help employees to prepare their career plans, enhance their motivation and have them joining the
dynamic of the company.
The study, which was started late November 2007, focused on the main levers of modern human resources
management, such as the Management by Objectives, Workforce Planning, Wage and Staff Policies.
Management control: for a better guidance
In 2008, Marsa Maroc initiated a project for the development of management control with the following
objectives:
• Guiding activities and measuring company’s performance based on relevant dashboards.
• Readjustment and improvement of the current budgeting method to make it evolve from a control
spending device to a budget guiding system.
• Structuring the «management control» within the company and encompassing both its human
and organizational aspects.
Risk Management: towards quality insurance
In order to provide the structure with an operational tool to manage and prepare the quality insurance
certification, a project is currently under way, in order to rebuild the procedural repository.
Achieving this project is fundamental to the Company’s strategy. It covers both operational and functional
procedures.
In this context, a study of operational risks related to the container’s activity at the port of Casablanca was
performed. This study provided a map of the process and then enabled to identify, analyze and prioritize
the risks linked to the container traffic process. According to their level of mitigation and potential severity,
the risks are prioritized in order to identify a list of major hazards with adequate action plans.
This pilot project will be reapplied to the other activities of the Company across all operational locations.
Structuring projects

2008 Resu l t s
2008 Results
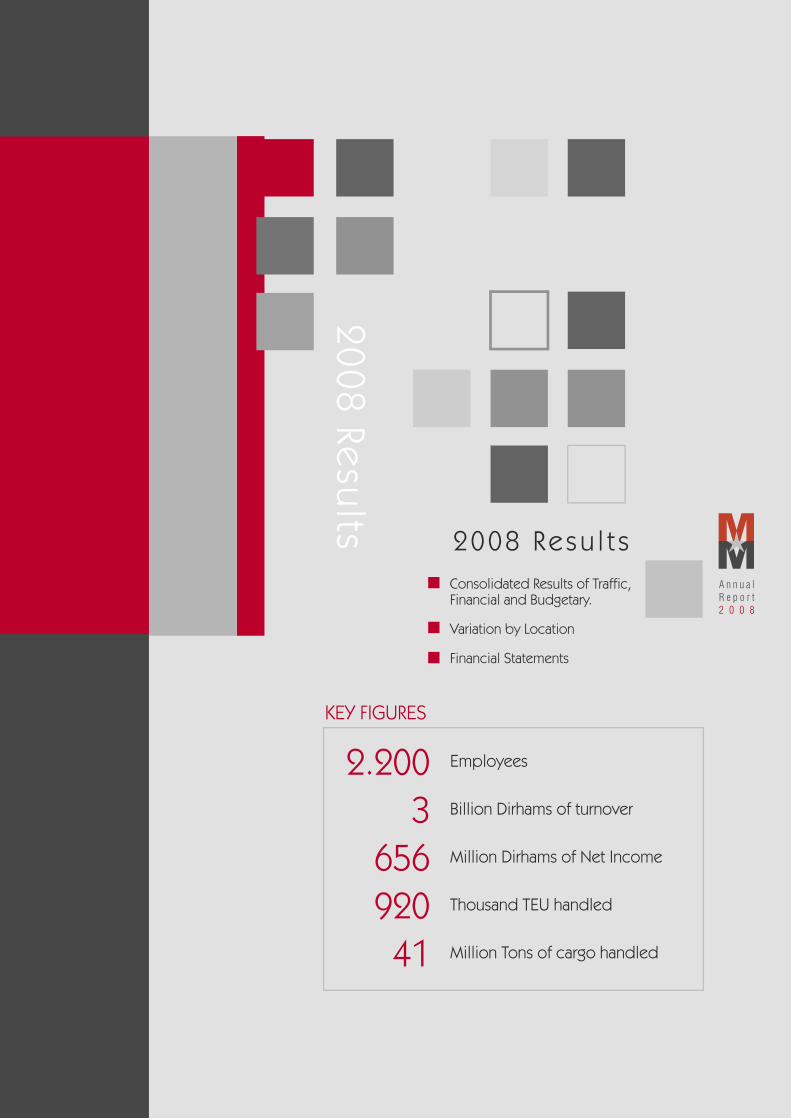
Consolidated Results of Traffi c, Financial and Budgetary.
Variation by Location
Financial Statements
KEY FIGURES
2.200 Employees
3 Billion Dirhams of turnover 656 Million Dirhams of Net Income
920 Thousand TEU handled
41 Million Tons of cargo handled

In 2008 Marsa Maroc has carried out across its 10 ports a global traffi c of 41.3 million tons compared to 41.81 million tons in 2007. Its market share in the national ports traffi c reaches 62%.
Overall traffi c
10
30
40
20
50
0Total Import Total Export
+0,5%
Global trafi c
-6,5%
-1,2%Million of tons
20082007
Traffic Achievem
ents
28
Traffic Achievements
2008 was characterized by the following major
trends:
Continued growth of containerized traffi c with an
increase of 13% compared to 2007. At the port
of Agadir, this traffi c increased by 43% which is
explained by the switch of citrus and early fruits
traffi c from the TIR and conventional methods to
the container method and the reinforcement of
the container carriers shipping lines.
With 793 257 TEU*, Marsa Maroc’s facilities at
the port of Casablanca contributed with 86%
to the global container traffi c handled by Marsa
Maroc.
The port of Tangier’s traffi c fell by 50% because
of the transfer of the container’s traffi c from
Tangier City port to Tangier Med port.
* TEU: Twenty-foot Equivalent Unit.
41Million tons of cargo handled
Container
400 000
800 000
900 000
600 000
1 000 000
0Total Import Total Export
+11,3%
Global trafi c
+13,9%
+12,6%TEU
20082007
100 000
300 000
500 000
200 000
700 000
400 000
800 000
900 000
600 000
1 000 000
0Casablanca
+12,4%
TEU
20082007
100 000
300 000
500 000
200 000
700 000
Tangier Agadir Total
-49,5%+43%
+12,6%

29
Sustained growth of vehicles traffi c approaching
the level of 100,000 units with 99,896 vehicles
handled in 2008 and an increase of 21%.
The export-bound vehicles fl ow effectively
started in 2008 with 6,124 units against 352 units
in 2007.
Slight increase of the TIR traffi c (0.8%) thanks to
the import of goods, equipments and industrial
products.
The traffi c of hydrocarbons slightly decreased
by 2.1%, this trend is mostly due to the decline
of imports of crude oil (-12%) and fuel versus
an increased traffi c of refi ned products and
liquefi ed gas.
About 11% decrease of grain traffi c because of
the decline of grains’ import through the port of
Casablanca.
Véhicules neufs
2007 2008
40 000
80 000
90 000
60 000
100 000
0
+21%
Units
10 000
30 000
50 000
20 000
70 000
80 000
160 000
180 000
120 000
200 000
0Total infl ow total outfl ow
+1,8%
Global traffi c
-0,4%
+0,8%Units
20082007
20 000
60 000
100 000
40 000
140 000
TIR Traffi c
4
8 9
6
10
0
-11,2%
Million tons
20082007
1
3
5
2
7
Grains Coal& Pet Coke
Hydrocarbons
111213
+0,7%
-2,1%
Main bulks traffi c
New vehicles traffi c

Traffic Achievem
ents
30
Marsa Maroc’s traffic by port (in tons)
Nador
Tangier
Mohammedia
Casablanca
Jorf Lasfar
Dakhla
Laâyoune
Agadir
Safi
Traffic Achievements
14 592 266
9 449 144
4 272 462
3 541 127
2 822 713
2 693 950
2 359 231
1 475 383
112 482

Operating charges are 2 billion MAD which
340 million MAD due to the subcontracting of
operations on ships’ board at the port of Casablanca.
Excluding these subcontracts expenses, operating
charges are 1.7 billion MAD versus 1.3 billion MAD
in 2007.
They will be reduced to a level of 1.6 billion MAD
in 2009.
31
Marsa Maroc achieved a turnover of nearly 3 billion MAD
of which 340 million MAD correspond to operations
on ships’ board processed and transferred to the
private operator under a subcontract covering the
transition period for the reform implementation
in the port of Casablanca agreed with the Agence
Nationale des Ports.
Excluding these outsourced items, the turnover
achieved by the own means of the company is
2.6 billion MAD in increase of 18% compared to
2.2 billion MAD in 2007.
Despite the effects of the global fi nancial crisis and its impact on the national economy causing a
decline in port’s activity, the projected turnover for 2009 is approximately 2.4 billion DH of which
200 million MAD correspond to «on board» operations.
With the start up of new private operators at the port of Casablanca, after the end of the transition
period in September 2009 and the transfer of the roll on-roll off activity and the majority of the
passengers activity from the port of Tangier City towards the port of Tanger Med expected during
2010, the turnover will be brought back to a normative level of about 1.8 billion DH.
Turnover in MMAD
Operating charges
Réalisations financièresFinancial Results
2 000 000
4 000 000
3 000 000
02007
Subcontracts turnover
Turnover excluding subcontracts
1 000 000
2008 P2009 P2010
2 000 000
3 000 000
02007
Charges excluding subcontracts
Subcontracts charges
1 000 000
2008 P2009 P2010
KMAD
KMAD
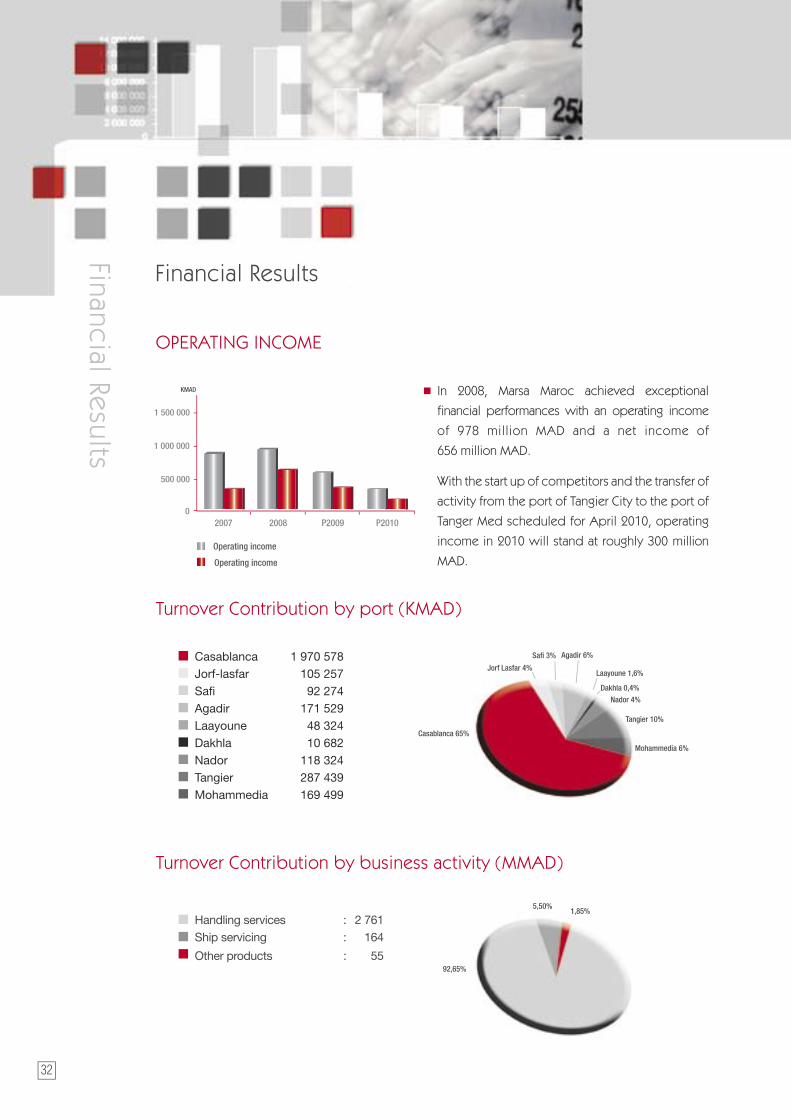
Turnover Contribution by port (KMAD)
Turnover Contribution by business activity (MMAD)
Casablanca 65%
Jorf Lasfar 4%
Safi 3% Agadir 6%
Laayoune 1,6%
Dakhla 0,4%
Nador 4%
Tangier 10%
Mohammedia 6%
Ports 2 008Casablanca 1 970 578Jorf-lasfar 105 257Safi 92 274Agadir 171 529Laayoune 48 324Dakhla 10 682Nador 118 324 Tangier 287 439 Mohammedia 169 499
Handling services : 2 761 Ship servicing : 164
Other products : 55 92,65%
5,50%1,85%
32
Financial Results
Financial Results
In 2008, Marsa Maroc achieved exceptional
fi nancial performances with an operating income
of 978 million MAD and a net income of
656 million MAD.
With the start up of competitors and the transfer of
activity from the port of Tangier City to the port of
Tanger Med scheduled for April 2010, operating
income in 2010 will stand at roughly 300 million
MAD.
OPERATING INCOME
1 000 000
1 500 000
02007
Operating income
Operating income
500 000
2008 P2009 P2010
KMAD

33
Capital2 119 250
Current liabilities1 064 405
Fixed Assets1 307 970
Current Assets1 818 259
Treasury57 426
2007
Capital2 649 715
Current liabilities1 077 753
Fixed Assets1 491 843
Current Assets2 162 036
Treasury73 589
2008
Balance Sheet
In thousands of MAD

34
Cap
ital bud
get
The 2007-2009 capital budget, approved by the Supervisory Board of Marsa Maroc on January
29th, 2008 meeting covered a total of 2,276 million MAD divided as follows:
Facilities : 1.366 MMAD including 647 MMAD for 2008
Infrastructures : 758 MMAD including 492 MMAD for 2008
Studies : 70 MMAD including 38 MMAD for 2008
Other : 82 MMAD including 82 MMAD for 2008
Commitments for 2008
The main projects undertaken for equipments are :
• Supply and maintenance of straddle carriers at the ports of Casablanca and Agadir: 112 MMAD;
• Supply and maintenance of 2 rail mounted cranes and their accessories at the port of Jorf Lasfar:
70 MMAD;
• Supply and maintenance of straddle tractors and trailers at the ports of Casablanca and Agadir:
59 MMAD;
• Supply and maintenance of containers forklift at the port of Casablanca: 42 MMAD;
• Supply and maintenance of forklifts for empty containers: 16 MMAD;
• Supply of high capacity forklifts to the ports of Casablanca and Agadir: 13 MMAD.
Capital budget
35
Réalisations par port
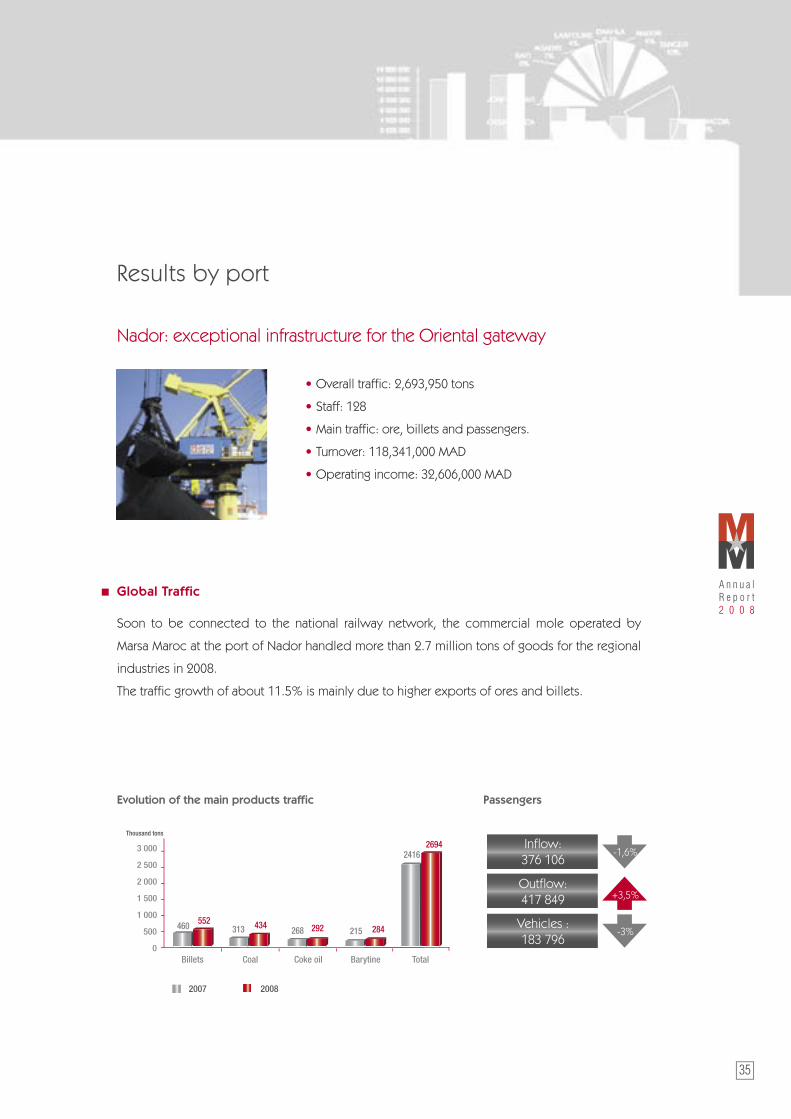
Nador: exceptional infrastructure for the Oriental gateway
• Overall traffi c : 2,693,950 tons
• Staff : 128
• Main traffi c : ore, billets and passengers.
• Turnover : 118,341,000 MAD
• Operating income : 32,606,000 MAD
Global Traffic
Soon to be connected to the national railway network, the commercial mole operated by
Marsa Maroc at the port of Nador handled more than 2.7 million tons of goods for the regional
industries in 2008.
The traffi c growth of about 11.5% is mainly due to higher exports of ores and billets.
Evolution of the main products traffi c
500
1 500
2 000
1 000
2 500
3 000
0Billets Coal Coke oil Barytine
460
Thousand tons
20082007
552313 434
268 292 215 284
Total
24162694
Passengers
Infl ow:376 106
Outfl ow:417 849
Vehicles :183 796
-1,6%
+3,5%
-3%
Results by port

3 6874 310
36
Results by port
Results by p
ort
Tangier: a non stop service for a high frequency traffic
• Overall traffi c: 4,272,462 tons
• Staff: 162
• Main traffi cs: Passengers, Ro-Ro
• Turnover: 287,439,000 MAD
• Operating income: 154,780,000 MAD
Global Traffi c
In 2008, the traffi c handled by Marsa Maroc at the port of Tangier has experienced a slight
decline of 0.9%.
The year 2008 was characterized by the start of the TIR and container traffi cs at the port of
Tanger Med.
1 000
3 000
4 000
2 000
5 000
0Grains Container TIR Total
Thousand tons
20082007
188 326
3 811 4 272
Infl ow:1 434 101
Outfl ow:1 371 520
Vehicles:73 837
-4%
-1%
+5%219 189
Evolution of the Main products traffi c Passengers

37
Mohammedia: leader for hydrocarbons
• Overall traffi c : 9, 449,144 tons
• Staff: 128
• Main Activity: Liquid bulks
• Turnover : 169, 499,000 MAD
• Operating income : 73, 740,000 MAD
Global Traffic
In 2008, the traffi c handled by Marsa Maroc at the port of Mohammedia reached nearly 9.5
million tons, which is a decrease of 1.2% compared to 2007.
This decline is mostly due to a decrease of fuel exportations and an increased traffi c of
refi ned products and liquefi ed gas, including diesel and LPG 350.
Evolution of the main products traffi c
2 000
6 000
8 000
4 000
10 000
12 000
0Crude oil Liquid gases Refi ned
productsTotal
6256
Thousand tons
20082007
5535
1035 10312579 2786
9986 9449

3938
Casablanca: an organization that measures up to the country’s fi rst port
• Overall traffi c: 14,592,266 tons
• Staff: 1069
• Major traffi c: containers, dry bulks, Ro-Ro
• Turnover: 1,970,758,000 MAD
• Operating income: 722,408,000 MAD
Global Traffic
The traffi c handled by Marsa Maroc at the port of Casablanca stood at nearly 14.6 million tons,
a slight decrease of 2.3% compared to 2007.
However, 2008 was characterized by the sustained growth of several activities, namely that of
containers, TIR and new vehicles.
20082007
Evolution of the main products traffi c
500
1 500
2 000
1 000
2 500
3 000
0
Grains at dockside
Steel Products
Wood and by-products
Sugar
3 170
Thousand tons
2 590
1 460 1 464
686 737 720 739
3 500
Global traffi c evolution
2 000
6 000
8 000
4 000
10 000
12 000
0
Import Export Total
11 783
Thousand tons
12 199
2 477 2 393
14 257 14 592
14 000
16 000
Container’s traffi c evolution
680 000
720 000
740 000
700 000
760 000
780 000
660 000
2007 2008
705 505
TEU793 257800 000
Roll-on/Roll-off traffi c evolution
115 000
125 000
130 000
120 000
135 000
140 000
110 000
2007 2008
119 392
Units
136 042
Results by port
Results by p
ort

Jorf Lasfar: a prospective challenger
• Overall traffi c: 3,541,127 tons
• Staff : 64
• Main traffi cs: Dry bulks and liquid bulks
• Turnover: 105,257,000 MAD
• Operating income: 53,521,000 MAD
Global Traffic
Marsa Maroc facilities at the port of Jorf Lasfar handled nearly 3.6 million tons of oil, scrap metal,
petroleum coke and other dry bulks.
In 2008, and in order to attract new customers at the port of Jorf Lasfar, Marsa Maroc initiated
new services, such as stevedoring.
Evolution of the main products traffi c
500
1 500
2 000
1 000
2 500
3 000
0
Grains Coke oil Fertilizers Diesel
408
Thousand tons
20082007
500 392 424263 410
976 1154
Total
3 1983 541
3 500
3938

4140
Safi: large capacities for the ore region
• Overall traffi c: 2,359,231 tons
• Staff : 106
• Principal Activity: Dry bulks
• Turnover: 92,274,000 MAD
• Operating income: 14,574,000 MAD
Global Traffic
At the port of Safi , Marsa Maroc’s facilities handled nearly 2.4 million tons of cargo, registering a
decrease of 7%.
2008 was characterized by a decrease of ore exports from the port of Safi because of the little
content of zinc, copper and lead deposits
Evolution of the main products traffi c
500
1 500
2 000
1 000
2 500
3 000
0Sulphur Barytine Gypsum Total
1493
Thousand tons
20082007
1208
227 223 222 176
2543 2359
Results by port
Results by p
ort
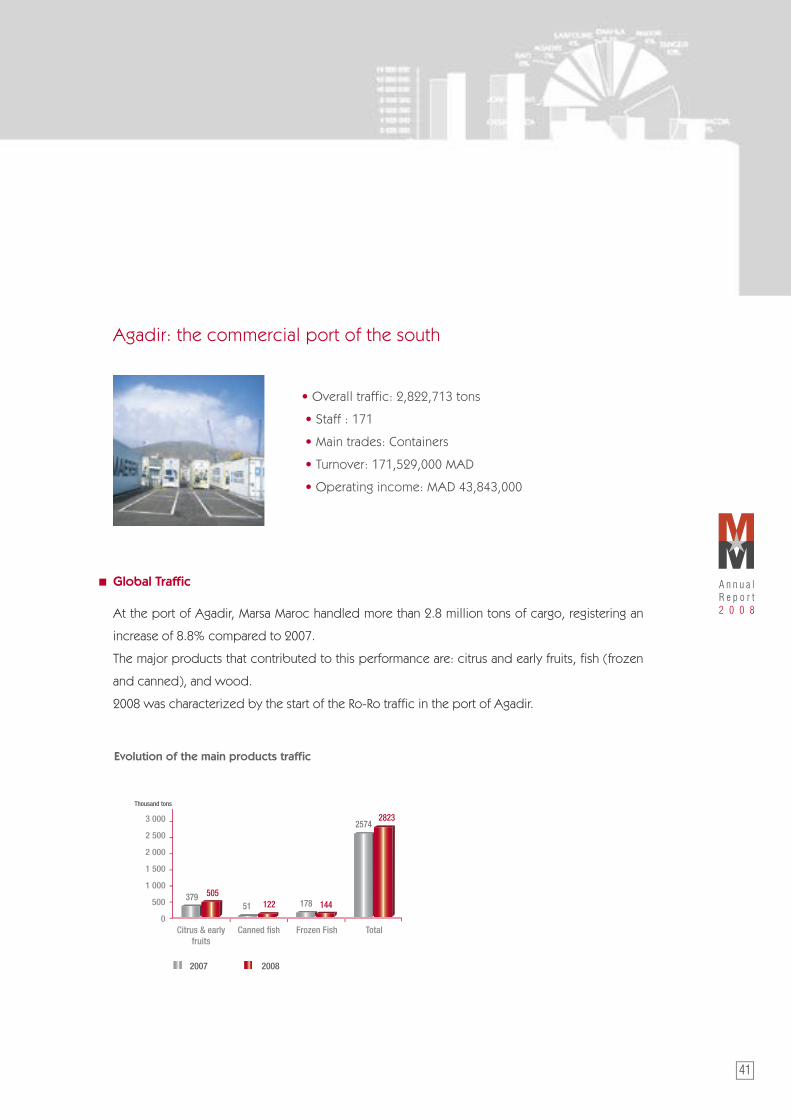
Agadir: the commercial port of the south
• Overall traffic: 2,822,713 tons
• Staff : 171
• Main trades: Containers
• Turnover: 171,529,000 MAD
• Operating income: MAD 43,843,000
Global Traffi c
At the port of Agadir, Marsa Maroc handled more than 2.8 million tons of cargo, registering an
increase of 8.8% compared to 2007.
The major products that contributed to this performance are: citrus and early fruits, fi sh (frozen
and canned), and wood.
2008 was characterized by the start of the Ro-Ro traffi c in the port of Agadir.
Evolution of the main products traffi c
500
1 500
2 000
1 000
2 500
3 000
0Citrus & early
fruitsCanned fi sh Frozen Fish Total
379
Thousand tons
50551 122 178 144
25742823
20082007
4140
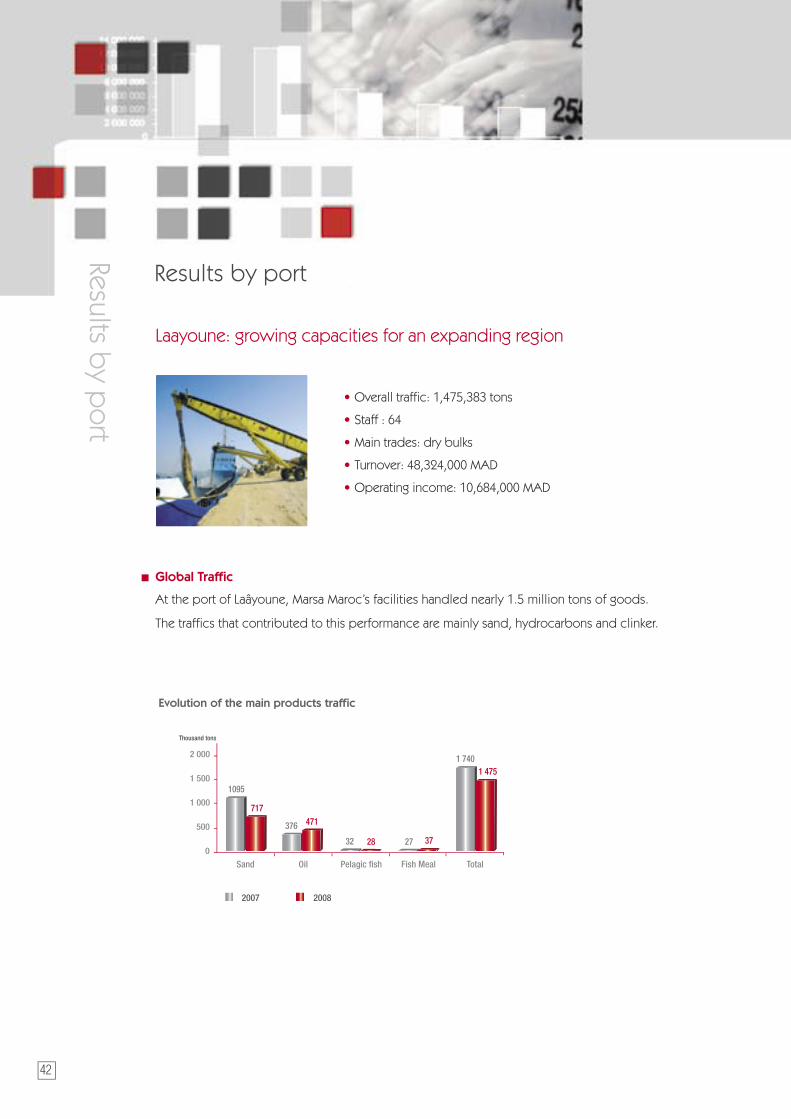
Laayoune: growing capacities for an expanding region
• Overall traffi c: 1,475,383 tons
• Staff : 64
• Main trades: dry bulks
• Turnover: 48,324,000 MAD
• Operating income: 10,684,000 MAD
Global Traffi c
At the port of Laâyoune, Marsa Maroc’s facilities handled nearly 1.5 million tons of goods.
The traffi cs that contributed to this performance are mainly sand, hydrocarbons and clinker.
Evolution of the main products traffi c
500
1 500
2 000
1 000
0
Sand Oil Pelagic fi sh Fish Meal
1095
Thousand tons
20082007
717
376 471
32 28 27 37
1 7401 475
Total
4342
Results by port
Results by p
ort

Dakhla: a modern port
• Overall traffi c: 112,482 tons
• Staff : 21
• Main trades: fi shery products, liquid bulks
• Turnover: 10,682,000 MAD
Trafic Global
2008 knew a decline in traffi c for Marsa Maroc at the port of Dakhla.
Thus the handled traffi c declined by 14% to reach a total of 112,482 tons.
Evolution of the main products traffi c
50
0
Frozen Fish Hydrocarbons
39
Thousand tons
20082007
21
87 86
131112
Total
100
150
4342

F inanc i a l S t a tement s
2008 Résultts
Assets
Liabilities
Profi t and Loss Account
Business Operations
Financing Statement

ASSETS FINANCIAL YEAR 01/01/2008 TO 31/12/2008
FINANCIAL STATEMENTS
ASSETS GROSS AMOUNT DEPRECIATION& PROVISIONS
NET 2008 AMOUNT
PREVIOUS YEAR
NET 2007NONCASH ASSETS (A)
INTANGIBLE FIXED ASSETS (B) 52 358 368,47 13 778 685,03 38 579 683,44 37 085 476,57
• Other intangible assets 52 358 368,47 13 778 685,03 38 579 683,44 37 085 476,57
TANGIBLE FIXED ASSETS (C) 1 792 529 355,91 525 181 823,94 1 267 347 531,97 1 073 444 607,05
• Lands 80 535 975,60 16 655 279,82 63 880 695,78 61 524 631,46
• Construction 230 221 268,51 50 581 499,64 179 639 768,87 126 704 109,56
• Plant, machinery and equipment 1 295 635 171,69 427 858 262,29 867 776 909,40 757 123 973,91
• Transportation Equipment 19 970 537,48 8 282 749,13 11 687 788,35 9 348 243,11
• Furniture & offi ce equipment 50 952 540,83 21 280 877,22 29 671 663,61 26 176 856,95
• Other tangible assets 1 398 140,21 523 155,84 874 984,37 685 658,05
• Current tangible assets 113 815 721,59 113 815 721,59 91 881 134,01
FINANCIAL FIXED ASSETS (D) 186 308 858,48 2 831 949,55 183 476 908,93 192 950 487,02
• Long term Loans 178 725 215,33 2 791 949,55 175 933 265,78 185 444 168,87
• Other receivable accounts 1 468 743,15 40 000,00 1 428 743,15 1 391 418,15
• Equities stake 6 114 900,00 6 114 900,00 6 114 900,00
ASSETS ADJUSTMENTS (E) 2 439 161,03 2 439 161,03 4 489 720,06
• Increase of fi nancing debt 2 439 161,03 2 439 161,03 4 489 720,06
TOTAL I (A+B+C+D+E) 2 033 635 743,89 541 792 458,52 1 491 843 285,37 1 307 970 290,70
INVENTORIES (F) 128 938 976,43 5 973 991,37 122 964 985,06 105 840 338,23
• Materials and supplies 109 134 715,93 5 973 991,37 103 160 724,56 85 927 735,30
• Work in progress 19 804 260,50 19 804 260,50 19 912 602,93
ACCOUNTS RECEIVABLE (G) 568 180 718,98 39 430 233,08 528 750 485,90 469 393 951,29
• Supplier receivable, advances and deposits 436 480,00 436 480,00 436 480,00
• Customer and related accounts 353 015 019,03 29 787 863,72 323 227 155,31 295 709 827,95
• Staff 1 118 254,36 1 118 254,36 1 239 177,98
• State 115 201 610,61 115 201 610,61 90 963 635,01
• Shareholder accounts
• Other receivables 88 613 443,61 9 642 369,36 78 971 074,25 63 515 688,56
• Accrued assets 9 795 911,37 9 795 911,37 17 529 141,79
EQUITIES AND SECURITIES (H) 1 510 320 148,73 1 510 320 148,73 1 243 024 655,91
TOTAL II (F+G+H+I) 2 207 439 844,14 45 404 224,45 2 162 035 619,69 1 818 258 945,43
CASH - ASSETS 397 208 248,07 26 101,10 397 182 146,97 516 764 849,00
• Check and drafts to be cashed 1 387 976,65 26 101,10 1 361 875,55 1 881 568,12
• Bank and giro accounts 395 188 087,65 0,00 395 188 087,65 514 304 033,14
• Cash, credits and advance deposits 632 183,77 0,00 632 183,77 579 247,74
TOTAL III 397 208 248,07 26 101,10 397 182 146,97 516 764 849,00
TOTAL I + II + III 4 638 283 836,10 587 222 784,07 4 051 061 052,03 3 642 994 085,13
FI
XE
D
AS
SE
TS
CU
RR
EN
T
AS
SE
TS
CASH
• (HT): non-cash.

LIABILITIES FINANCIAL YEAR 01/01/2008 TO 31/12/2008
LIABILITIES YEAR 2008 PREVIOUS YEAR 2007
EQUITY 1 662 948 544,07 1 105 924 639,07
• Share capital or personal (1) 733 956 000,00 733 956 000,00
• Less: shareholders, unpaid-up capital
• Discount, merger, contribution premium
• Revaluation
• Regulatory reserve 17 260 151,25 30 000,00
• Other reserves (2)
• Carried forward 255 624 427,82 27 335 613,89
• Net profi t pending assignment (2)
• Net profi t for the year (2) 656 107 965,00 344 603 025,18
TOTAL EQUITY (A) 1 662 948 544,07 1 105 924 639,07
RELATED EQUITY (B) 270 740 406,32 233 298 200,90
• Regulated Provisions 270 740 406,32 233 298 200,90
DEBT FINANCING (C) 358 338 284,48 531 172 998,18
• Mandatory Borrowings 146 000 000,00 292 000 000,00
• Other fi nancial debts 212 338 284,48 239 172 998,18
LONG TERM PROVISIONS FOR LIABILITIES AND CHARGES (D) 357 688 246,92 248 854 784,88
• Contingency and loss provisions 150 169 828,30 120 121 164,70
• Provisions for charges 207 518 418,62 128 733 620,18
TOTAL I (A+B+C+D) 2 649 715 481,79 2 119 250 623,03
DETTES DU PASSIF CIRCULANT (F) 1 077 754 141,94 1 064 404 772,05
• Payable Trade accounts payable 471 095 336,30 448 016 026,40
• Customers accounts, advances and deposits 24 203 099,34 22 975 452,32
• Staff 83 442 387,58 48 032 457,30
• Social security 45 915 460,95 42 962 230,28
• State 223 486 482,33 316 708 050,63
• Shareholders accounts 48,60 0,00
• Other creditors 223 817 706,75 174 979 397,04
• Accrued liabilities 5 793 620,09 10 731 158,08
TOTAL II (F + G + H) 1 077 754 141,94 1 064 404 772,05
CASH - LIABILITIES 323 591 428,30 459 338 690,05
• Banks (credit balance) 323 591 428,30 459 338 690,05
TOTAL III 323 591 428,30 459 338 690,05
TOTAL I + II + III 4 051 061 052,03 3 642 994 085,13
PE
RM
AN
EN
T
FI
NA
NC
IN
GC
UR
RE
NT
LIA
BIL
ITIE
S (
3)
CASH
(1) Staff receivable equity - (2) Increase (+) Decrease (-) - (3) • (HT): Non-cash.

PROFIT AND LOSS STATEMENT FINANCIAL YEAR 01/01/2008 to 31/12/2008
FINANCIAL STATEMENTSO
PE
RA
TIN
GF
INA
NC
ING
NO
N C
UR
RE
NT
PROFIT AND LOSS ACCOUNTS
OPERATIONS TOTAL TOTAL
FINANCIAL YEAR 2008 PREVIOUS YEARS 2008 2007
A B C = A + B D
I. OPERATING REVENUES 3 018 779 336,72 1 037 369,87 3 019 816 706,59 2 573 820 528,41
* Sales of produced goods and services turnovers 2 979 200 853,80 1 037 369,87 2 980 238 223,67 2 556 192 669,85
* Operating Adjustments: transfer of charges 39 578 482,92 39 578 482,92 17 627 858,56
TOTAL I 3 018 779 336,72 1 037 369,87 3 019 816 706,59 2 573 820 528,41
II. OPERATING EXPENSES 2 032 192 506,57 9 613 641,94 2 041 806 148,51 1 648 532 472,42
* Purchase (2) of materials and supplies 515 028 339,68 376 280,92 515 404 620,60 477 815 662,53
* Other external expenses 520 320 257,64 8 156 736,46 528 476 994,10 373 143 947,22
* Taxes and duties 48 957 721,88 953 835,80 49 911 557,68 42 868 049,17
* Staff expenses 506 552 254,88 126 305,46 506 678 560,34 436 563 886,00
* Other operating expenses
* Operating Depreciation 441 333 932,49 483,30 441 334 415,79 318 140 927,50
TOTAL II 2 032 192 506,57 9 613 641,94 2 041 806 148,51 1 648 532 472,42
III. OPERATING PROFIT (I - II) 986 586 830,15 -8 576 272,07 978 010 558,08 925 288 055,99
IV. FINANCIAL INCOME 64 607 611,15 0,00 64 607 611,15 35 219 519,79
* Income from securities and other fi xed assets 750 000,00 750 000,00
* Foreign exchange gain 208 238,68 208 238,68 23 449,07
* Interest and other fi nancial income 60 578 891,53 60 578 891,53 35 196 070,72
* Financial adjustements: transfer of charges 3 070 480,94 3 070 480,94
TOTAL IV 64 607 611,15 0,00 64 607 611,15 35 219 519,79
V. FINANCIAL EXPENSES 23 747 248,74 3 382,38 23 750 631,12 38 233 161,81
* Interest charges 22 993 346,41 3 382,38 22 996 728,79 31 451 032,12
* Foreign exchange loss 723 797,47 723 797,47 186 716,79
* Other fi nancial charges 30 104,86 30 104,86
* Financial provision 6 595 412,90
TOTAL V 23 747 248,74 3 382,38 23 750 631,12 38 233 161,81
VI. FINANCIAL RESULTS (IV - V) 40 860 362,41 -3 382,38 40 856 980,03 -3 013 642,02
VII. CURRENT RESULTS (III - VI) 1 027 447 192,56 -8 579 654,45 1 018 867 538,11 922 274 413,97
VIII. NON-CURRENT REVENUES 33 273 927,18 72 918,91 33 346 846,09 25 128 304,12
* Income from disposal of fi xed assets 5 796 789,00 5 796 789,00 3 054 024,01
* Other non-current assets 8 555 678,77 72 918,91 8 628 597,68 22 074 280,11
* Non-current adjustments: transfer of charges 18 921 459,41 18 921 459,41
TOTAL VIII 33 273 927,18 72 918,91 33 346 846,09 25 128 304,12
IX. NON-CURRENT EXPENSES 70 711 068,19 1 324 093,94 72 035 162,13 329 049 993,99
* Net depreciation value of disposed fi xed assets 368 530,95 368 530,95 59 745,42
* Other non-current expenses 22 103 872,41 1 324 093,94 23 427 966,35 25 708 196,47
* Non-current allowances for depreciation and provisions 48 238 664,83 48 238 664,83 303 282 052,10
TOTAL IX 70 711 068,19 1 324 093,94 72 035 162,13 329 049 993,99
X. Non-operating PROFIT (VIIIX) -37 437 141,01 -1 251 175,03 -38 688 316,04 -303 921 689,87
XI. PROFIT BEFORE INCOME TAX (VII+X) 990 010 051,55 -9 830 829,48 980 179 222,07 618 352 724,10
XII. INCOME TAX (*) 324 071 257,07 0,00 324 071 257,07 273 749 698,92
XIII. NET PROFIT (XI - XII) 665 938 794,48 -9 830 829,48 656 107 965,00 344 603 025,18
XIV. TOTAL REVENUES (I + IV + VIII) 3 116 660 875,05 1 110 288,78 3 117 771 163,83 2 634 168 352,32
XV. TOTAL EXPENSES (II + V + IX + XII) 2 450 722 080,57 10 941 118,26 2 461 663 198,83 2 289 565 327,14
XVI - NET PROFIT (total revenues - total charges) 665 938 794,48 -9 830 829,48 656 107 965,00 344 603 025,18

BUSINESS OPERATING STATEMENT PERIOD OF 01/01/2008 to 31/12/2008
2008FINANCIAL YEAR
2007PREVIOUS YEAR
I. RESULTS FORMATION TABLE
I + TOTAL ANNUAL PRODUCTION: (1+2+3) 2 980 238 223,67 2 556 192 669,85
1 Sales of goods and services 2 980 238 223,67 2 556 192 669,85
2 Variation of stocks
3 Fixed assets produced for use by the company
II - TOTAL ANNUAL EXPENSES: (4+5) 1 043 881 614,70 850 959 609,75
4 Purchases of materials and supplies 515 404 620,60 477 815 662,53
5 Other external expenses 528 476 994,10 373 143 947,22
III = VALUE ADDED (I -II ) 1 936 356 608,97 1 705 233 060,10
6 + Operating subsidies
7 - Tax & fees 49 911 557,68 42 868 049,17
8 - Staff expenses 506 678 560,34 436 563 886,00
IV = GROSS OPERATING PROFIT 1 379 766 490,95 1 225 801 124,93
9 + Other operating income
10 - Other operating expenses
11 + Operating write-back : transfer of charges 39 578 482,92 17 627 858,56
12 - Operating provision 441 334 415,79 318 140 927,50
V = OPERATING PROFIT (+ or -) 978 010 558,08 925 288 055,99
VI + - FINANCIAL RESULTS 40 856 980,03 -3 013 642,02
VII = CURRENT PROFIT (+ or -) 1 018 867 538,11 922 274 413,97
VIII + - NON-CURRENT PROFIT -38 688 316,04 -303 921 689,87
13 - Income tax 324 071 257,07 273 749 698,92
IX = NET PROFIT FOR THE YEAR (+ or -) 656 107 965,00 344 603 025,18
II. CASHFLOW
1 Net profi t 656 107 965,00 344 603 025,18
2 + Operating provisions (1) 417 927 533,37 310 196 103,27
3 + Finance provisions (1) 6 595 412,90
4 + Non-current provisions (1) 48 238 664,83 303 282 052,10
5 - Operating write-back (2) 34 397 965,89 14 818 245,05
6 - Finance write-back (2) 3 070 480,94
7 - Non-current write-back (2) (3) 18 921 459,41
8 - Income from disposals of fi xed assets 5 796 789,00 3 054 024,01
9 + Depreciation net value of disposed fi xed assets 368 530,95 59 745,42
I CASHFLOW 1 060 455 998,91 946 864 069,81
10 Dividends distributed 99 084 060,00 0,00
II NET CASHFLOW 961 371 938,91 946 864 069,81
(1) Except provisions for current assets and liabilities to cash (2) Except write-backs on assets and liabilities (3) Including write-backs on investment subsidies
NOTA : The CAF calculation can also be made from the E.B.E

FINANCING STATEMENT FOR THE YEAR INVESTMENT FUNDS INTEGRATED THE CURRENT ASSETS YEAR END 31/12/2008
FINANCIAL STATEMENTS
CATEGORYFINANCIAL YEAR 2008
(a)
EPREVIOUS YEAR 2007
(b)
VARIATION (a - b)
EXPENSES ( c) RESOURCES (d)
Permanent Financing 2 649 715 481,79 2 119 250 623,03 530 464 858,76
Minus fi xed asset 1 491 843 285,37 1 307 970 290,70 183 872 994,67
= WORKING CAPITAL (A) CURRENT (1-2) 1 157 872 196,42 811 280 332,33 346 591 864,09
Current Assets 2 162 035 619,69 1 818 258 945,43 343 776 674,26
Minus Current Liabilities 1 077 753 141,94 1 064 404 772,05 13 348 369,89
= CAPITAL REQUIREMENTS (B) GLOBAL (4-5) 1 084 282 477,75 753 854 173,38 330 428 304,37
NET CASH ACCOUNT (ASSETS – LIABILITIES) = A - B 73 589 718,67 57 426 158,95 16 163 559,72
CATEGORYFINANCIAL YEAR 2008 PREVIOUS YEAR 2007
EXPENSES (a) RESOURCES (b) EXPENSES (a) RESOURCES (b)
I. INVESTMENT CAPITAL FOR THE YEAR (FLOW) 1 004 209 686,39 1 718 977 058,48
• CASHFLOW (A) 961 371 938,91 946 864 069,81
- Investment Cash fl ow 1 060 455 998,91 946 864 069,81
- Dividends distributed 99 084 060,00
• DISPOSALS AND WITHDRAWALS OF FIXED ASSETS (B) 42 837 747,48 38 456 988,67
- Disposal of intangible fi xed assets
- Disposal of tangible fi xed assets 5 796 789,00 3 054 024,01
- Disposal of fi nancial fi xed assets
- Recovery from long term debts 37 040 958,48 35 402 964,66
- Withdrawal of tangible fi xed assets
• INCREASE IN EQUITY AND RELATED INVESTMENTS (C’) 733 656 000,00
- Stock issue 733 656 000,00
- Investment subsidy
• OTHER FINANCING CAPITAL
• INCREASE OF FINANCING DEBT (D) (net of redemption premiums)
TOTAL 1: INVESTMENT CAPITAL 1 004 209 686,39 1 718 977 058,48
II. INVESTMENT ACTIVITIES FOR THE YEAR (FLOW) 657 617 822,30 390 763 410,76
• ACQUISITION AND INVESTMENT INCREASE (E’) 486 833 667,63 220 938 988,61
• Acquisitions of intangible assets 8 855 765,08 5 220 385,13
• Acquisition of tangible fi xed assets 451 430 444,17 201 323 185,87
• Acquisition of fi nancial assets
• Increase in long term receivables 26 547 458,38 14 395 417,61
• REPAYMENT OF SHAREHOLDERS EQUITY (F)
• REPAYMENT OF FINANCING DEBT (G) 170 784 154,67 169 824 422,15
• NONCASH INVESTMENT (H)
TOTAL II - INVESTMENT ACTIVITIES (E + F + G + H) 657 617 822,30 390 763 410,76
III. CHANGE IN GLOBAL BUDGET FINANCING 330 428 304,37 1 274 329 493,12
IV. NET CHANGE OF THE CASH ACCOUNT 16 163 559,72 53 884 154,60
TOTAL 1 004 209 686,39 1 004 209 686,39 1 718 977 058,48 1 718 977 058,48


Append ices
Ap
pend
ices

Overall traffic
10
30
40
20
50
0Total Imports Total Exports
+0,5%
Overall Traffi c
-6,5%
-1,2%
Million of tons
20082007
20082007
12%11%
30%
30%
17%
Traffi c breakdown by packaging mode by the end of Dec 2008
Structure of the Handled Traffic
Containers (6 950 807) Dry Bulks (12 213 569)RO-RO (4 765 656) Liquid Bulks (12 970 156)Conventional shipments (4 418 570)
2008 vs 2007 Total Trend by packaging mode
2
68
4
10
121416
0Dry bulks Liquid Bulks Containers RO-RO Conventional
shipments
-9% -2%
+9%+6% +4%
Million of tons
(in Tons)
Ap
pend
ices
54
Appendices

55
20082007
Casablanca 35%
Traffi c Breakdown by port at December-end 2008
Traffic by location
Traffi c breakdown by port
Nador
+11,5%
Tangier Mohamedia Casablanca JorfLasfar
Safi Agadir Laayoune Dakhla
-2,3%
+10%-15,2%
Jorf Lasfar 9%
Safi 6%
Agadir 7%Laayoune 4%
Dakhla 0,3%Nador 6%
Tangier 10%
Mohammedia 23%
Million of tons
2
68
4
10
121416
0
Main traffic
• CONTAINER
400 000
800 000
900 000
600 000
1 000 000
0Total Import Total Export
+11,3%
Global traffi c
+13,9%
+12,6%TEU
20082007
100 000
300 000
500 000
200 000
700 000
400 000
800 000
900 000
600 000
1 000 000
0Casablanca
+12,4%
TEU
20082007
100 000
300 000
500 000
200 000
700 000
Tangier Agadir Total
-49,5%+43%
+12,6%
Evolution of container traffi c Evolution of container traffi c by port

• PASSENGERS
0
+1,4%
Passengers
20082007
Nador Tangier Casablanca Agadir Total
-2,68%
+19,4% +19,07%
-2%
• BULKS
4
8 9
6
10
0
-11,2%
Millions of tons
20082007
1
3
5
2
7
Grains Coal& Pet Coke
Hydrocarbons
111213
+0,7%
-2,1%
Evolution of passengers by port Major bulks cargo trend
1 000 000
2 000 000
3 000 000
4 000 000
500 000
1 500 000
2 500 000
3 500 000
Main traffic
56
Main traffic
• RO-RO
80 000
160 000
180 000
120 000
200 000
0Total Infl ow Total Outfl ow
+1,8%
Global Traffi c
-0,4%
+0,8%Units
20082007
20 000
60 000
100 000
40 000
140 000
TIR Traffi c
40 000
80 000
90 000
60 000
100 000
02007 2008
+21%
Units
10 000
30 000
50 000
20 000
70 000
New vehicles Traffi c

17
Contac t s
Co
ntacts
Marsa M
aroc co
ntacts
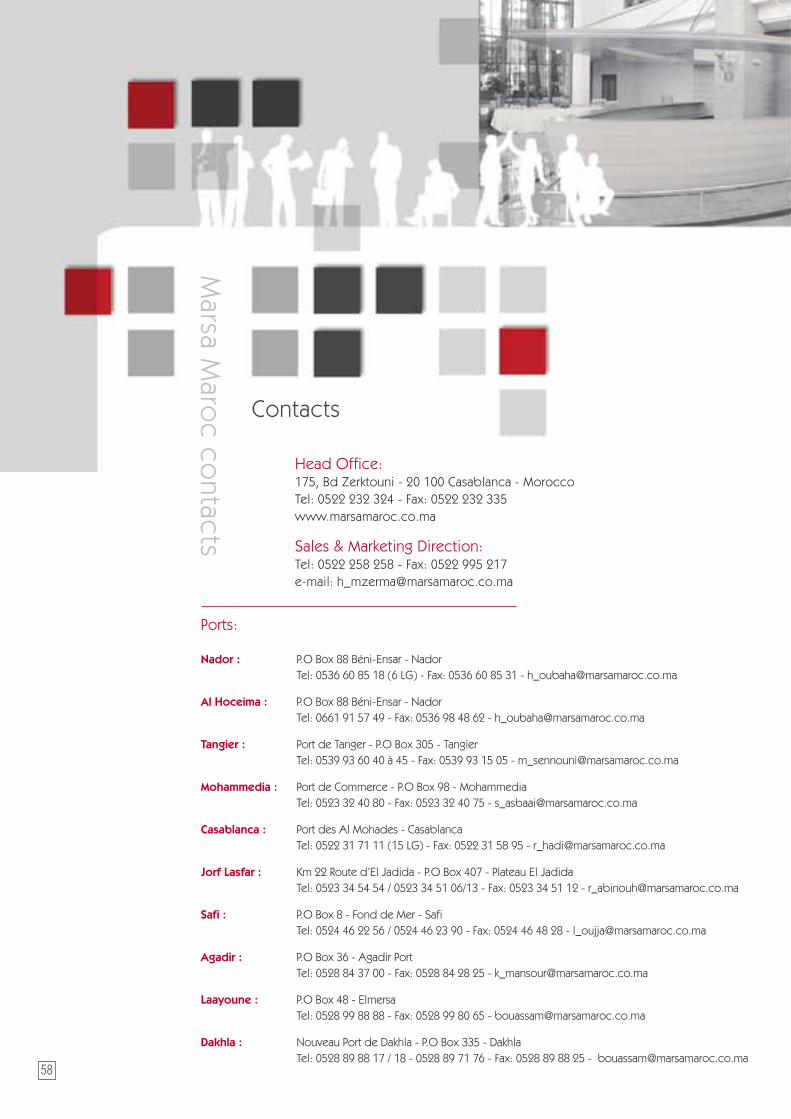
Head Office:175, Bd Zerktouni - 20 100 Casablanca - MoroccoTel: 0522 232 324 - Fax: 0522 232 335www.marsamaroc.co.ma
Sales & Marketing Direction:Tel: 0522 258 258 - Fax: 0522 995 217e-mail: [email protected]
Ports:
Nador : P.O Box 88 Béni-Ensar - Nador Tel: 0536 60 85 18 (6 LG) - Fax: 0536 60 85 31 - [email protected]
Al Hoceima : P.O Box 88 Béni-Ensar - Nador Tel: 0661 91 57 49 - Fax: 0536 98 48 62 - [email protected]
Tangier : Port de Tanger - P.O Box 305 - Tangier Tel: 0539 93 60 40 à 45 - Fax: 0539 93 15 05 - [email protected]
Mohammedia : Port de Commerce - P.O Box 98 - Mohammedia Tel: 0523 32 40 80 - Fax: 0523 32 40 75 - [email protected]
Casablanca : Port des Al Mohades - Casablanca Tel: 0522 31 71 11 (15 LG) - Fax: 0522 31 58 95 - [email protected]
Jorf Lasfar : Km 22 Route d’El Jadida - P.O Box 407 - Plateau El Jadida Tel: 0523 34 54 54 / 0523 34 51 06/13 - Fax: 0523 34 51 12 - [email protected]
Safi : P.O Box 8 - Fond de Mer - Safi Tel: 0524 46 22 56 / 0524 46 23 90 - Fax: 0524 46 48 28 - [email protected]
Agadir : P.O Box 36 - Agadir Port Tel: 0528 84 37 00 - Fax: 0528 84 28 25 - [email protected]
Laayoune : P.O Box 48 - Elmersa Tel: 0528 99 88 88 - Fax: 0528 99 80 65 - [email protected]
Dakhla : Nouveau Port de Dakhla - P.O Box 335 - Dakhla Tel: 0528 89 88 17 / 18 - 0528 89 71 76 - Fax: 0528 89 88 25 - [email protected]
58
Contacts


175, Bd Zerktouni - 20 100 Casablanca - MoroccoTel: 0522 232 324 - Fax: 0522 232 335 - www.marsamaroc.co.ma