annual report and sustainability update 2017-2018
TRANSCRIPT

Annual Report and Sustainability Update2017-2018

Teachers Mutual Bank Limited

1
Contents
Annual Report and Sustainability Update 2017-2018
Key financial performance 02
Chairperson and Chief Executive Officer’s report 04
Members 06
Employees 08
Community 12
Environment 16
Sustainability KPIs and targets 15
Directors’ report 22
Auditor’s independence declaration 26
Financial statements and notes 27
Statement of comprehensive income 28
Statement of changes in member equity 29
Statement of financial position 30
Statement of cash flows 31
Notes to the financial statements 32
Independent auditor’s report 78
Directors’ declaration 80
Our VisionTo be the largest, most successfuland respected Australian mutual bank primarily focused on serving the Australian education sector and other niche markets in the professional and essential services sector.

2 Teachers Mutual Bank Limited
Financial Performance
Key Financial Performance
Our focus is to maintain sustainable growth to ensure we provide competitive products and services to enable our members to secure their financial future.
15.72% 15.74% 15.85% 15.09% 15.65%
2014 2015 2016 2017 2018
16
1,8
98
16
6,0
46
177
,357
19
1,4
15
19
8,4
40
2014 2015 2016 2017 2018
$3,
68
5,37
1,4
74
$4
,077
,415
,96
0
$4
,59
5,0
64
,69
4
$5,
476
,770
,66
0
$5,
99
2,6
90
,337
2014 2015 2016 2017 2018
$25
,80
5,6
83
$29
,78
1,8
77
$30
,212
,04
7
$27
,877
,58
4
$31
,79
8,3
62
2014 2015 2016 2017 2018
Capital adequacy ratioCapital adequacy is a ratio which protects depositors and investors by indicating the strength of an institution. We are well above APRA’s minimum requirement of 8%.
MembershipMembership refers to all shareholders that are eligible to join under the common bond.
Profit after income taxProfit after income tax1 is the amount of money we generate from operating our products and services minus the cost of providing those products and services, including all taxes.
Loan balancesLoan balances is the total of money owed to us by our members from personal loans, secured (home) loans, credit cards and overdrafts.
1 Parent (Bank) – not consolidated group.

3Annual Report and Sustainability Update 2017-2018
We achieved a healthy netprofit of $31.8 million aftertax, and maintained a high capital adequacy ratio at 15.65%, comfortably above prudential requirements.
$4
,39
4,4
72,0
40
$4
,86
2,32
0,3
34
$5,
542,
509
,26
6
$6
,68
2,0
13,2
96
$7,
06
8,7
64
,86
6
2014 2015 2016 2017 2018
0.61% 0.64% 0.58%
0.46% 0.46%
2014 2015 2016 2017 2018
$3,
579
,079
,48
4
$3,
975
,178
,055
$4
,550
,80
4,6
08
$5,
294
,128
,44
6
$5,
636
,451
,84
9
2014 2015 2016 2017 2018
$36
4,9
87,
639
$39
6,1
37,9
19
$4
37,0
98
,930
$4
92,
226
,30
2
$52
5,38
5,0
46
2014 2015 2016 2017 2018
Return on assetsReturn on assets measures how profitable a company is relative to its total average assets and shows how efficiently a company uses its assets.
ReservesReserves are accumulated profits held by us to ensure our ability to safely grow.
AssetsAssets are the total of all Teachers Mutual Bank Limited assets.
Member depositsMember deposits are made up of savings, investments and shares, excluding interest accrued.

4 Teachers Mutual Bank Limited
Leadership
Chairperson and CEO’s Report
In our 52nd year of operation, we have continued to build our brand as one of Australia’s largest and most successful mutual banks.
This year we reached a milestone of $7 billion in assets held on behalf of over 198,000 members. Teachers Mutual Bank Limited now supports three brands under its umbrella: our Teachers Mutual Bank, Firefighters Mutual Bank, and UniBank.
Our Teachers Mutual Bank, UniBank, and Firefighters Mutual Bank strategies have seen all brands,
particularly across our home loans portfolio, grow very successfully and all brands continue to demonstrate strong value for our members and our overall business strategy.
This year we have brought a greater focus to ensuring members have quick, convenient payments and digital services across all brands. We worked with Cuscal, our service provider to build new digital mobile apps for UniBank and Firefighters, and in late 2017 launched a brand new mobile app for Teachers Mutual Bank.
We’ve also focussed on providing cutting-edge technology to
our members. In line with this commitment this year we rolled out the New Payments Platform to all our members. This platform allows for real-time payments to be made between different participating financial institutions. As one of the first Australian banks to offer this service, we were proud to once again lead the way with this innovation. Of course, we continue to supply the increasingly popular Apple Pay, Google Pay, and Samsung Pay payments platforms to all members.
At an organisational level Teachers Mutual Bank Limited has posted

Annual Report and Sustainability Update 2017-2018
another strong net profit this year, of $31.8 million. This result has been achieved despite the continuation of the low-interest rate and competitive environment and ongoing economic and political uncertainty nationally and internationally.
This year the banking sector has faced significant challenges too. The Royal Commission into conduct in the Banking, Superannuation and Financial Services Industry has revealed unacceptable practices across some major parts of the Australian financial services sector. Although the mutual banking industry has shown it puts members first consistently, we do anticipate this will see the financial services sector face further regulatory burdens over the coming months. We have supported the Customer-owned Banking Association’s campaign to ensure this regulation does not disproportionately impact our sector.
Our Board of Directors and management continue to ensure we balance our business to maintain great member value, whilst ensuring our business position is strong. Not only has our asset base grown by 5.8% to $7 billion, we have maintained our high capital adequacy ratio at 15.65%, further highlighting the consistency and integrity of our operational standards.
Beyond our function as a financial institution, we also believe we have a function as a socially responsible institution. To this end, we have continued to invest heavily in our community. This year we invested 6.9% of net profits after tax back into community initiatives, according to the international London Benchmarking Group measures. This is 23 times the London Benchmarking Group Australia and New Zealand Financial sector average of 0.3%. Our visible action on community investment and ethical practice is a key reason we’ve been cited as one of the Ethisphere Institute’s World’s Most Ethical Companies for a fifth consecutive year.
These results show what we care about most. Giving our members access to great products and services, investing in new technology, building a financially strong bank, and placing an emphasis on community investment and ethical practice across our business.
Thanks to our skilled and experienced Board of Directors and Management Team for the excellent control of expenses during a year of strong growth and expansion. Our thanks go to our staff for their commitment and professionalism in embracing our strategic objective to grow our brands for the benefit of you, our members.
For 52 years we have been dedicated to one purpose – assisting you, our members to build wealth and enjoy financial well-being throughout your lifetime. You, our members are the reason we exist and we are honoured to serve you.
Thank you for choosing Teachers Mutual Bank, UniBank and Firefighters Mutual Bank as your financial services provider.
John Kouimanos Steve James Chairperson Chief Executive Officer
This year we invested 6.9% of net profitsafter tax backinto communityinitiatives, whichequates to 23 times the Australian financial sector average.
5

6 Teachers Mutual Bank Limited
Members
Putting our members’ needs first
We help our members to build strong financial futures by providing award-winning competitive products, a wide range of digital and mobile service options, and exceptional customer-focused service.
We focus on customer careOur dedication to high-quality customer service continues to put us in the forefront of the market. Research from GALKAL highlights that we continue to provide excellent customer service across all brands, with Firefighters Mutual Bank (92%), Teachers Mutual Bank (93%), UniBank (92%), all registering high rates of customer satisfaction. In addition, according to independent Roy Morgan Research nearly three-quarters of Teachers Mutual Bank members said that they would be ‘highly likely’ to recommend us to friends or colleagues, making us a clear market leader for advocacy. Our customer service, efficiency, and friendly, helpful staff are the main reasons why our members continue to rank us so highly.
We’re making payments instantThis year’s launch of our New Payments Platform (NPP) enabled more than 193,000 of our members to access instant payments through their mobile and internet banking platforms. The platform represents a new level of convenience, enabling members to safely and securely transfer money in seconds – whether they are shopping, paying bills, or splitting a restaurant bill between friends. We were one of the first financial institutions in Australia to rollout the New Payments Platform to all of our members at its launch. This is just one example of how we strive to serve members across all of our brands. We know our members are already busy enough working, studying and serving the community without having to worry about slow transaction times to pay bills or receive money.
We’re providing award-winning productsWe pride ourselves in our ongoing commitment to member value and service, and as a result our members are accustomed to having access to some of the most competitive financial products that the market has to offer. Once again this year, we were recognised by both Money Magazine and Mozo for the great options we provide to depositors and borrowers. In Money Magazine’s Best of the Best 2018 Product Awards we were awarded ‘Best Term Deposit – Long-Term’ while our Visa Credit Card was awarded a 2017 Mozo Experts Choice Award for Low Rate Credit Card and No Annual Fee Credit Card, as well as a 2018 Award for Low Rate Travel Credit Card.
We’re helping you bank on-the-goOur members continue to enjoy a wide range of great options that increase their financial flexibility and help them take control of their financial journeys. Access to mobile payment platforms Google Pay, Apple Pay, and Samsung Pay helps streamline payments for members. Members have access to a variety of payment methods, whether through mobile or online platforms. Many transactions can now be done with a simple of wave of a smartphone, saving members valuable time in their busy lives.
We’re expanding our branch networkServing our members means being available where and when they need us. The August 2017 opening of a new office in West End, Brisbane was the latest in our continuing efforts to deliver quality services to members of all brands in Queensland. In Western Australia, our new premises in West Perth provides convenient access and personal service for members of all our brands.
On the road!Our business relationship staff travel to regional centres to ensure that members outside larger metropolitan areas have access to the professional service and personalised experience they expect from the bank.

7Annual Report and Sustainability Update 2017-2018
Putting our members’ needs first
This year’s launch of our New PaymentsPlatform (NPP) enabled more than 193,000 of our members to access instant payments through theirmobile and internet banking platforms.
We’re bringing the bank to our membersWe know our members are busy, whether at school and university, or serving and protecting their communities, so – we bring the bank to them. This year our teams once again ensured we got out to our members and prospective members: Teachers Mutual Bank hosted nearly 250 member engagement events, made 1223 visits to schools, held 49 university events, supported more than 170 conferences and got involved with more than 50 Orientation Week Events. Firefighters Mutual Bank conducted over 225 Fire and Rescue Station visits across NSW, WA and ACT regions, and UniBank held more than 200
events nationally reaching graduates, students, and professionals in the university sector.
Our business relationship staff travel to regional centres to ensure that members outside larger metropolitan areas have access to the professional service and personalised experience they expect from the bank.
In the past year we have also run a number of kiosks in high-profile shopping centres such as Westfield Hurstville in Sydney, Westfield Kotara in Newcastle and Broadway shopping centre in central Sydney, providing members and prospective members with greater access at convenient locations and with extended operating hours.

8 Teachers Mutual Bank Limited
Enhancing our employees’ experience
Employees
This year, 84 staff memberswere enrolled in courses ranging from certificate level to postgraduate study.
Delivering outstanding service for our members starts with recognising and supporting the quality work and ongoing commitment of our employees.
We understand that our success relies on the people who work with us. To provide our members with the excellent service they have come to expect, it is vital that we attract excellent staff and support their ongoing development.
We achieve these goals by investing in our employees to reach their full
potential, by committing to gender equality in the workplace, and by celebrating the diversity of cultures in a way that makes people proud to be part of our team.
We support high-performanceOur talentSmart+ high-potential employee program develops team members recognised for their achievements, capability and outstanding performance. It offers them opportunities to raise their profiles within the company and for personal growth and professional
development. The program also aims to achieve greater diversity in senior roles by ensuring equal gender representation of participants.
Tangible benefits of attending the program are already apparent for this year’s cohort, with eight of eleven participants having gone on to new roles in the business. In addition, a core element of the program gives participants the chance to undertake group challenges in areas of business interest and apply knowledge across different departments. In 2017 the talentSmart+ group focused on

9Annual Report and Sustainability Update 2017-2018
internal Corporate Social Responsibility (CSR) initiatives, which resulted in record levels of contributions to employee charity days.
We have award-winning career developmentThis year we were awarded Best Career Development Programme at the 2018 Australian Retail Banking Awards, an award that recognises excellence in career development across the banking sector. Our programs encourage employees to develop their skills and knowledge by providing assistance for approved studies such as certificates, diplomas, undergraduate and postgraduate courses, as well as professional accreditations. Support for programs of study includes both study leave and financial assistance. This year, 84 staff members were enrolled in courses ranging from certificate level to postgraduate study.
We’re an Employer of Choice for everyoneFor the third consecutive year, we were awarded the Employer of Choice for Gender Equality citation by the Workplace Gender Equality Agency, making us one of just 120 Australian companies to receive this citation in 2018. This achievement once again highlights our status as one of Australia’s leading organisations for championing gender equality.
We also met a significant milestone in our ongoing commitment to gender equality, as we achieved our target of over 40% female representation in management, in line with in our Gender Diversity Strategy. We remain dedicated to providing access to flexible working arrangements and career development opportunities to all employees regardless of gender.
We’re creating opportunities for Indigenous studentsIn 2017 our Learning and Development team worked with the New South Wales Department of Education to develop a work placement program for Indigenous students from Sydney’s Western Suburbs.
Coordinated through our Western Sydney office, the program allows for real world business experience for interested Indigenous students. Program placements were offered to two Year 10 Chifley College students for a 10-week period. The program, now in its second consecutive year, will continue to offer further placements to aspiring Indigenous students.
Our Learning and Development team worked with the New South Wales Department of Education to develop a work placement program for Indigenous students from Sydney’s Western Suburbs.

10 Teachers Mutual Bank Limited
Sustainability
Acting on our values
Community investmentWe sustained our global leadership in community investment for the sixth year running, with an investment of 6.9% of pre-tax profits as measured by London Benchmarking Group (LBG).
We base our business practices on our ethical values. We practise responsible lending and ensure our business activities have a positive impact for our members and the broader community.
Sustainability is a core value that we integrate into our operations, ethos and business relationships. Once again this year we are proud to have been recognised as a global leader in ethical and socially responsible behaviour, as we’re always looking for ways to improve our policies and the sustainability of our business.
As one of the World’s Most Ethical Companies, we’re committed to ethical leadership in the Australian financial services sector and to the highest standards of ethical business practices.
We benchmark ourselves against industry leaders around the world using a number of highly regarded independent measurements, including those of the Ethisphere Institute, the London Benchmarking Group (LBG) and the Responsible Investment Association Australasia (RIAA). We are proud that over the past year we have once again strengthened our position as a leader in ethical business while simultaneously achieving strong financial growth.
We’re advocating for housing affordabilityThis year we commissioned the Key Worker Housing Affordability in Sydney report, the first of its kind in Australia. Undertaken by the University of Sydney’s Urban Housing Lab, this wide-ranging study provided in-depth analysis of declining levels of housing affordability across greater and metropolitan Sydney for ‘key workers’ (including teachers, firefighters, nurses, police, ambulance drivers and paramedics).
The report concluded that emergency and essential services are being put at risk as key workers are priced out of Sydney metropolitan areas. The report identifies five key priorities for policy makers and private sector stakeholders to consider and is a major step toward addressing this important issue.
We’re investing in communitiesWe sustained our global leadership in community investment with an investment of 6.9% of pre-tax profits as measured by LBG. Once again, we far outperformed other domestic and foreign companies with an investment rate that was more than five times the international average, 11 times the Australia and New Zealand average, and 23 times the Australia and New Zealand finance services sector average.
We’re still one of the World’s Most Ethical CompaniesWe upheld our position for the fifth year in a row on the Ethisphere Institute’s list of the World’s Most Ethical Companies. This designation was granted to just 135 companies worldwide for 2018; we’re the only Australian company and one of only four banks globally to be named on the list. This recognises superior achievements in transparency, integrity, ethics, and compliance and demonstrates that we are committed to prioritising ethical business practices.
We’re increasing opportunities for ethical investmentOur ethical bond issuance increased by $200m to $420 million, with proceeds used to fund the balance sheet for residential mortgages for the three bank brands. This is the first wholesale cash product in Australia to be designated as a Certified Ethical Investment by the RIAA. The issuance took meaningful steps to ensure our reputation as a responsible and ethical financial institution, and a pioneer in ethical bond issuance.
We’re supporting financial literacy around the worldWe continue to invest in the Cufa Children’s Financial Literacy (CFL) program in Cambodia which gives children aged 6-12 who are living in poverty the opportunity to create

11Annual Report and Sustainability Update 2017-2018
a brighter future for themselves and their families. Now in our third year supporting the program, we are proud to have helped deliver tangible results, including 26,454 children educated, 17,410 children actively saving, 220 teachers trained, and 1,029 financial literacy lessons held. Over the course of the Bank’s three-year $177,000 investment in the CFL program, children reached by the project
have managed to save over $430,000 – an incredible achievement for some of the most economically disadvantaged areas in Cambodia. Cufa’s social return on investment (SROI) evaluation showed that for every dollar invested in the Children’s Financial Literacy program, $2.60 of social value is generated, meaning that the impact of the Bank’s investment is almost tripled.
We upheld our position for the fifth year in a row on the Ethisphere Institute’s list of the World’s Most Ethical Companies – the only Australian company and one of only four banks globally to be named on the list.

12 Teachers Mutual Bank Limited
Community
Investing in our community
Since our foundation, we have proudly supported our members through community investment in projects and initiatives that reflect our shared goals and social values. These are just a small sample of the ways we provide support for our community.
We’re supporting rural and remote teachersWe believe in supporting teachers’ access to development opportunities. That’s why, this year, we have been very proud to continue our partnership with Bell Shakespeare by funding the 2017 Regional Teacher Mentorship. The program recognises outstanding teachers in our regional communities, giving 30 teachers from regional, rural and remote Australian schools a fully-funded one-year mentorship with the company.
This mentorship helps to develop these teachers’ careers, while enriching the learning experience of their students. In addition to four days of accredited professional learning at Bell Shakespeare headquarters in Sydney, recipients receive specialist training in practical and innovative strategies for teaching Shakespeare – as well as the opportunity to collaborate and network with other regional teachers from around Australia. On returning to their schools, teachers receive ongoing support from Bell Shakespeare artists and staff and ongoing access to in-school and in-theatre programs.
We’re backing leading educatorsIn 2017 Teachers Mutual Bank, in association with the Public
Education Foundation, provided vital scholarship support to leading educators to further their professional development. This year, four scholarships were awarded, each of which included program tuition for participants to travel to America and undertake a professional education program tailor-made for school principals at Harvard Graduate School of Education. These scholarships were established in 2013 to offer school principals the opportunity to ‘reflect, focus and recharge’ through professional leadership programs. The scholarship program reflects our commitment to supporting excellence in public education across Australia and we remain dedicated to our ongoing partnership with the Public Education Foundation.
In 2017 we provided vital scholarship support to leading educators to further their professional development.

Annual Report and Sustainability Update 2017-2018
Investing in our community
We’re championing our student athletesUniBank was the official Bank Partner of the 2017 UniGames. Held on the Gold Coast, UniGames brought together over 9,000 students from 42 universities all over Australia to participate in over 30 different sports – making it the single largest student sporting event in Australia. Besides UniBank’s financial support, over the five days of the UniGames, UniBank staff ran leisure activities for the competitors and engaged with the students and spectators in attendance.
We’re encouraging great minds to speakUniBank was the Platinum Sponsor for the 2017 Three Minute Thesis (3MT) competition, where PhD students were challenged with presenting an 80,000-word thesis in three minutes. The University of Queensland founded 3MT, which has become the longest-running competition of its kind in the world. The winner of 3MT receives $5,000 from UniBank to assist them in their academic journey as an emerging new researcher.
We’re promoting emergency servicesCollaborating and exchanging information is essential to promote continued success in emergency management and Firefighters Mutual Bank was proud to sponsor the dinner of the 2017 Annual Conference of the Australasian Fire and Emergency Service Authorities Council (AFAC), at which more than 1,100 attendees had opportunities to share insights and experience among members who serve in this vital sector.
The AFAC17 event in Sydney brought together more than 3,200 people to discuss the latest in research and practice in emergency services and natural hazards management. Under the conference theme ‘Collaborating for Success – Improving performance in emergency management’ the program boasted more than 100 speakers.
We’re standing by our firefighting communityWe supported the Firefighters Climb for Motor Neurone Disease for a second consecutive year. This year saw 600 firefighters from ten different agencies across Australia take on the challenge of climbing up the 1,504 steps in the Centrepoint Tower in Sydney. Employees from Firefighters Mutual Bank stood by the firefighters, ensuring they were hydrated and giving encouragement as they undertook the gruelling climb.
13
We supported the Firefighters Climb for Motor Neurone Disease for a second consecutive year, which saw 600 firefighters climbingup all 1,504 steps of the Centrepoint Tower in Sydney.


15Annual Report and Sustainability Update 2017-2018
CSR targets and KPIs
Sustainability KPIs and targets
We report on our environmental, social and governance performanceannually, and in 2018 we reviewed and strengthened our 85 targets and KPIs for Teachers Mutual Bank Limited. This helps to show we put sustainability at the forefront of our business, and integrate it throughout our operations, systems and relationships.
Members 2015-2016 2016-2017 2017-2018
Member satisfaction rating1 93% 93% 93%
Member engagement events hosted 237 207 246
Formal complaints received by external bodies2 n/a n/a 0
Members assisted through the Credit Assistance program 130 159 115
Community 2015-2016 2016-2017 2017-2018
Total community investment (as measured by LBG) (FY2017 data3) $1,977,000 $2,412,000 $2,712,661
% of net profits before tax (NPBT) 4.7% 5.4% 6.9%
School visits 1,169 1,150 1223
Conferences supported 161 134 209
Employee fundraising $24,336 $17,984 $23,564
Employees 2015-2016 2016-2017 2017-2018
Percentage of females in management 38% 37.5% 41%
Employee satisfaction4 83% 78% n/a*
Employee engagement rating 82% 81% n/a*
Employee turnover rate 8% 10.3% 9%
Employees currently studying 17% 15% 15.5%
Study leave days granted 209 154 129
Worker compensation claims5 4 6 4
Staff satisfaction with workplace health & safety (WH&S) 93% 89% n/a*
Average lost time incident rate (in days) 17 28 16
Environment 2015-2016 2016-2017 2017-2018
Paper recycled (tonnes) 38.5 36.5 39
Paper use per employee (kg/FTE ) 134 102 118
Waste generated per employee (kg/FTE) 132 81 67
Electricity generated by solar panels (KWh) 0 220,596 254,119
Emissions intensity (tCO2-e per million $ of assets) 0.24 0.17 0.16
1 As measured by the Member Satisfaction Survey conducted by GALKAL. 2 The previous measure was called ‘Disputes lodged with external bodies’ for which there were 11 complaints in 2015-16 and 10 complaints in 2016-17. 3 See footnote 1 on page 25. 4 Data from Teachers Mutual Bank Limited internal staff survey. 5 In 2016-2017, this consisted of two lost time occurrences and four medical expense claims. * No data available due to Annual Staff survey being undertaken after FY2018.
GDS milestoneWe achieved our target of over 40% female representation in management, in line with in our Gender Diversity Strategy.

16 Teachers Mutual Bank Limited
Results on our targets
Sustainable business practiceStrive for international leadership in sustainable business practices1
International leadership is measured and recognised by the Ethisphere Institute, a global leader in defining and advancing the standards of ethical business practices, in their World’s Most Ethical Companies 2018 list. In 2018 we are 1 of 135 companies worldwide and 1 of only 4 banks named. The recognition honours superior achievements in transparency, integrity, ethics and compliance, and underscores an honouree’s commitment to leading with integrity and prioritising ethical business practices. Scores are generated in five key categories: ethics and compliance program (35%), corporate citizenship and responsibility (20%), culture of ethics (20%), governance (15%) and leadership, innovation and reputation (10%). We are a member of the Global Alliance for Banking on Values (GABV), a network of banking leaders from around the world committed to advancing positive change in the banking sector. We adhere to and support the GABV Principles of values-based banking, and are a signatory of the GABV Kathmandu Pledge.
Benchmark and report on our community investment using the London Benchmarking Group (LBG) global standard2
FY2017 is the sixth year that we benchmarked our community investment in the LBG. The Bank is a global leader in community investment for the sixth year running, based on the results of the 12th LBG Annual Review of Community Investment 2017. In FY2017, Teachers Mutual Bank’s $2.7 million community investment is 6.9% of pre-tax profits (NPBT), equal to 9.8% of profits after tax (NPAT). The LBG also measures the focus area of community investment – the Bank directs 98% of its community investment into ‘Education and Young People’ compared to 18% for the Au & NZ average.
Board meetings have Corporate Social Responsibility (CSR) as a standing agenda item
12 Board meetings were held, with CSR as a standing agenda item. The Board also has an annual CSR Strategy presentation and discussion.
CSR Policy and CSR Committee Charter is reviewed and updated annually by the Board
The CSR Policy 2220 and the CSR Committee Charter were updated and approved by the Board in April 2018. Corporate Social Responsibility Policy (CSR) 2220 establishes our approach to ethical business and social responsibility practices and how we deliver on our responsibilities and commitments across 200+ actions.
Environmental, Social and Governance (ESG) issues embedded in our lending and investment practices
ESG issues are embedded in our lending and investment practices . The Business objective of Lending Risk Policy 2236 is ‘The Bank strives to provide quality services to members via ethical and prudent lending practices that are financially, socially and environmentally sustainable.’ In 2018 we formalised ESG exclusion criteria in this Policy. ‘Various lending opportunities are disqualified from the Bank’s lending origination business. Such exclusions are where the primary purpose of the entity or business is alcohol, armaments, correctional facilities, cryptocurrency, deforestation or gross environmental degradation, gambling, military activities, political activities, pornography, slavery, tobacco or uranium.’
Maintain RIAA certification as an Ethical Bank3
The Bank’s wholesale market ethical bond issuance reached A$420 million, with the single largest issuance of $200m. The TMBL $500m Debt Issuance Programme (DIP) for wholesale investors is a Certified Ethical Investment by the RIAA. The Bank is an issuer of Certified Ethical Investment product. Certification4 started in June 2015 for the first two-year period and was extended for a further two years, from June 2017 to June 2019. We are the first bank in Australia to have a Certified Ethical Investment wholesale cash product, and it is the first that is based on fossil fuel lending and investing exclusion. Proceeds are used to fund the balance sheet, largely residential mortgages for Teachers Mutual Bank, UniBank and Firefighters Mutual Bank members.
Public disclosure of our investment policy on climate change and fossil fuels
Our position is published on our website. The Bank has zero direct investment in any large-scale greenhouse polluting activity or company. The Bank does not use members’ funds to finance large-scale greenhouse-gas pollution. The Bank does not use members’ deposits to directly lend to, buy equity or debt in, any large-scale greenhouse polluting activities from fossil fuel exploration, extraction, production and use.
Implement a national Stakeholder Strategy utilising our Stakeholder Engagement Standard
We broadened our national strategy for Stakeholder Engagement to include Teachers Mutual Bank, Firefighters Mutual Bank and UniBank as well as all areas of our business. A uniform approach resulted in a 32% increase in stakeholders focused on increasing advocacy, supported by the ACT data framework more commonly used throughout the Bank.
Mandate and embed sustainability in our supply chain Vendor Management Framework (VFM)
All material, strategic and major suppliers are required to complete a comprehensive CSR Survey that is included as part of their contract. CSR is one of the six standard vendor governance health checks, which operates as a traffic light system. The vendor governance process focuses on the top 100 vendors that represent 90% of our total vendor spend.

17Annual Report and Sustainability Update 2017-2018
Increase the purchase of more sustainable products and services
17% of Winx office supplies is sourced from the Earth Saver range, down 1%. We source a range of napkins and other paper products from recycled material. All our tea is Rainforest Alliance certified.
Roll out mandatory sustainability training for all employees
A CSR training module is rolled out to all staff every 24 months.
All staff at Grade 6 and above have sustainability KPIs
These form part of all Manager and Grade 6 Performance review documents. Each person has four CSR KPIs to report on.
Promote a zero tolerance culture for corruption and fraud
Our Fraud Policy defines the Bank’s fraud control principles, mandatory requirements and accountabilities. It clearly expresses that our Bank does not tolerate fraud and corruption and is committed to promoting and maintaining a sound ethical culture. No incidents of corruption or internal fraud were identified. All employees, temporary staff, contractors and service providers must ensure they are aware of their responsibilities and obligations with respect to the prevention, detection and reporting of fraud. The Bank continues to educate its staff and members in fraud prevention, partnering with government departments in cyber security and privacy awareness campaigns, having dedicated Security pages on all our websites.
1 The Ethisphere Institute is the global leader in defining and advancing the standards of ethical business practice. The World’s Most Ethical Company assessment is based upon the Ethisphere Institute’s Ethics Quotient (EQ) framework and honours superior achievements in transparency, integrity, ethics and compliance – more information at: http://ethisphere.com. 2 The LBG is the global standard for measuring and benchmarking corporate community investment. The LBG model provides a comprehensive and consistent set of measures to determine an organisation’s contribution to the community, including cash, time, in kind donations, and management costs. www.lbg-australia.com. Data is FY2017 as LBG is measured after a full FY dataset is completed. 3 TMBL’s $500m Debt Issuance Programme has been certified by RIAA according to the strict operational and disclosure practices required under the Responsible Investment Certification Program. See www.responsibleinvestment.org for details. 4 Issued on July 2.
The Bank’s $2.7 millioncommunity investment is equal to 9.8% of profits after tax.

18 Teachers Mutual Bank Limited
Results on our targets
Members
Achieve member satisfaction ratings at or above 90%1
Member satisfaction rates are 93% for Teachers Mutual Bank, 92% for Unibank and 93% for Firefighters Mutual Bank.
Member retention rates are at 95% or higher
The member retention rate is at 97.95% across the bank.
Adverse findings by external parties not to exceed 20% of disputes
This relates to the number of disputes with the Financial Ombudsman Service (FOS) There were no adverse findings.
Reduce the number of disputes lodged with external bodies each year
The number of disputes lodged with the Financial Ombudsman Service (FOS) went up from 10 to 22.
All complaints responded to within one business day
We responded to 99.9% (6,775) of complaints (6,777) within one business day.
Achieve best practice for all complaints resolved within 14 days
We resolved 96.5% (6,538) of complaints within 14 days or less, with 97.8% (6,628) of complaints completed within 21 days or less.
No external loss of data that results in a major breach of policy
There was no external loss of data that resulted in a major breach of policy.
Host member engagement events We hosted 246 events for members, including university seminars, lunch box presentations, mobile offices, and dinners.
Visit members' workplaces We visited 1,223 schools over the year.
More than 90% of members to feel that they have adequate access to banking services
The figure is 96% for Teachers Mutual Bank, 95% for Unibank and 93% for Firefighters Mutual Bank.
More than 90% of members felt that they have adequate access to information and assistance
The figure is 92% for Teachers Mutual Bank, 88% for Unibank and 90% for Firefighters Mutual Bank.
100% of marketing campaigns complying with responsible marketing guidelines
100% of marketing campaigns complied with responsible marketing guidelines.
No breaches of responsible marketing guidelines that adversely affect members and customers resulted in adverse media or sanctions
There were no breaches of responsible marketing guidelines that adversely affected members and customers and resulted in adverse media or sanctions.
Assist members in financial difficulty through the Credit Assistance Programme
115 members were assisted through the Credit Assistance Programme.
1As measured by the 2017 Member Satisfaction Survey conducted by GALKAL.
Aa

19Annual Report and Sustainability Update 2017-2018
Community
Invest a minimum of 3% of net profits after tax (NPAT) in the community1
The LBG’s measurement framework is the global standard for measuring and benchmarking corporate community investment. The LBG model provides a comprehensive and consistent set of measures to determine an organisation’s contribution to the community, including cash, time and in kind donations, as well as management costs. In FY2017, the Bank’s $2.7 million community investment is 6.86% of pre-tax profits (NPBT), equal to 9.8% of profits after tax (NPAT). This is 11 times the LBG Au & NZ average of 0.61%; 23 times the LBG Au & NZ Financial Services sector average of 0.3%; and five times the LBG Global average of 1.35%.
Provide financial support across the education sector via scholarships, sponsorships, grants, event support and professional development
The Bank’s financial support for the education sector has grown in the last 12 months with investment into key sponsorships and conferences in the university sector, as well as, the schools system. In addition to Bell Shakespeare’s Regionals Teacher Mentorship, the Future Teachers Scholarships and Executive Scholarships we have also invested in UQ 3MT, Unigames, Tertiary Education Management Conference and the Universities Australia Conference.
Manage partnerships with State Education Departments
As part of our commitment to education we expanded our support to be more nationally focused through our sponsorship and partnership programs in states and territories across Australia aimed at delivering increased financial assistance to both student and teacher learning and development programs including a number of teacher excellence awards programs, higher learning programs as well as sport and arts programs aimed at developing students. The Bank works closely with the Departments of Education in the states in which we have a presence to sponsor key initiatives including: Schools Spectacular, the Premier’s Teacher Scholarships, Festival of Instrumental Music and School Sport; Australian Capital Territory Education Awards; Secondary School Leader, Primary Principal of the Year and the Excellence Awards; School of the Year Award and Principals Conference in Queensland.
Broaden collaboration and develop new partnerships in the Non-Government education sector
This year we deepened our relationships with Catholic Education through new and existing partnerships as well as our partnership with the Independent Education Union in NSW and ACT through our support for Ann D Clarke Lecture, Executive Reading Challenge, Environment Grant Program and the Annual Diocesan Teacher Accreditation Recognition Program, all aimed at delivering much needed support in key areas in Catholic and Independent Education systems.
Support the professional development of teachers, office and support staff at conferences, events and leadership development courses
We sponsored 209 conferences and events across Australia.
Develop and implement a national sponsorship strategy and review current sponsorship guidelines
The national sponsorship strategy continues to align the Bank’s business objectives with community support to the education and emergency services sector. The national approach means that the Bank continues to increase our impact and value to our members and provide greater community impact into the sectors where they are employed.
Support NSW school children in need through Platinum Sponsorship of Stewart House
Stewart House remains a key investment in the NSW education community as they assist over 1,800 children per year for a 12 day respite. The Bank’s staff fundraise and conduct volunteer days at Stewart House.
Assist poverty alleviation in Asia Pacific through Platinum Sponsorship of CUFA
For three years we have supported the Cufa Children’s Financial Literacy (CFL) program, which provides the opportunity for children living in poverty to create a brighter future for themselves and their families. Impacts of our three-year partnership with international aid agency Cufa were published in June 2018. This includes; 26,454 children educated; 17,410 children actively saving; 220 teachers trained; 1,029 financial literacy lessons held. Each dollar invested generates $2.60 of social value. Over the course of the Bank’s three-year investment, children reached by the project have managed to save over $430,000, which is an incredible achievement for some of the most economically disadvantaged areas in Cambodia.
Support Queensland teachers and students through the sponsorship of the Queensland Life Education programme for drug and health education
The Bank continued its support to assist in the delivery of school-based health and drug education programs throughout Queensland schools.
Introduce an Indigenous scholarship The Premier’s Teachers Mutual Bank Indigenous Education Scholarship, worth $15,000 aims to embed Indigenous education into the NSW curriculum and develop the skills of educators teaching in Indigenous education.
1 The LBG is the global standard for measuring and benchmarking corporate community investment. The LBG model provides a comprehensive and consistent set of measures to determine an organi-sation’s contribution to the community, including cash, time, in kind donations, and management costs. www.lbg-australia.com. Data is FY2017 as LBG is measured after a full FY dataset is completed.

20 Teachers Mutual Bank Limited
Results on our targets
Environment
Measure and report energy emissions and solar panel performance annually
Solar PV on our roofs generated 18% of total electricity consumption and saved 208 tonnes of CO2. Solar PV as a % of total power consumption per site is Homebush (10%), Parramatta (17%), UniBank WA (110%), and Rooty Hill (19%) and Queensland (91%). We generated 254,119 Kwh of solar power, an increase of 15% over 2017.
Achieve net zero emissions for all owned buildings
All of our five owned buildings are net zero, based on solar PV generated, LED lights, energy savings, and carbon offsets.
Mandatory installation of solar PV and LEDs for all new owned buildings
We bought one new building in Perth in January 2018, and we plan to install LED lighting in 2019-20. We are unable to install PV because we own only one level out of eight, and the strata management rules are not supportive.
All new building leases to have minimum 3.5 star on the National Australian Built Environment Rating System (NABERS)
We have not leased any new buildings in 2018.
Review our Green Vehicle Policy We reduced the car fleet to 57 from 100, and we reduced support for staff to own cars. The fleet is to be reviewed at the end of 2019, for a new five-year commitment. We plan to replace the current Hybrid vehicle with a fully electric car.
Engage and train employees on recycling Staff at the three new offices in Perth, Sydney and Brisbane have been trained and brought into the single recycling system, and we continue to reduce the number of bins on site.
Reduce paper use per member 116,000 (59%) people had opted out of paper statements and registered to receive online statement notifications, an increase of 15%. Paper use per member increased to 118kg/FTE from 102kg.
100% of paper purchased to be from a certified sustainable source
100% of the paper we purchased is certified; 49% is FSC certified and 51% is PEFC certified, and 79% of paper purchased is carbon neutral.
Implement new water-saving initiatives We continued to install water-saving taps across the portfolio, and lifted the level of inspections and maintenance. We identified and fixed a number of leaks through the year, reducing our total consumption by 22%, with a 30% reduction at the Homebush HQ. Water use per FTE dropped to 7,938 litres/FTE from 10,497.
Maintain carbon neutral status so that all member accounts are with a carbon neutral bank
This is the sixth year we have been a carbon neutral bank, and so all members’ accounts are with a carbon neutral bank. Our emissions from electricity and fuel use (Scope 1 and 2), are offset to zero.

21Annual Report and Sustainability Update 2017-2018
Employees
100% of frontline employees enrolled in/completed online complaints handling
100% of frontline employees (336) enrolled in and completed online complaints handling.
Maintain employee satisfaction rating at or above 85%
No data available due to Annual Staff survey being undertaken after FY2018.
Maintain employee engagement at or above 80%
No data available due to Annual Staff survey being undertaken after FY2018.
Achieve employee engagement rating above the national Finance Sector industry standard1
No data available due to Annual Staff survey being undertaken after FY2018.
Minimum 85% of employees recommending TMB as a good place to work
No data available due to Annual Staff survey being undertaken after FY2018.
Minimum 15% of staff engaged in studying 15.5% of staff are engaged in studying.
All employees to complete annual performance reviews
All employees completed annual performance reviews.
All employees to complete annual development plans
All employees completed annual development plans.
Continue to develop and implement policies and procedures that reflect best practice in employee relations
We continue to build on existing policies as part of our commitment to best practice in employee relations. Policies include workplace health and safety, volunteering, domestic violence, parental leave and pay equity.
Zero tolerance to discrimination, harassment and bullying
We continue to maintain a culture that is free from harassment and workplace bullying through a comprehensive education program and zero tolerance policy.
Exceed the ASX average of the percentage of females in Board, executive and management positions
We exceed the ASX average of the % of females in Board (44% vs. 26% ASX), Executive (14 vs. 10% ASX), and Management positions (41% vs. 38% ASX).
Be recognised as an Employer of Choice under the Workplace Gender Equality Agency (WGEA)2
The Bank was awarded the Employer of Choice for Gender Equality (EOCGE) citation for 2018 by the Workplace Gender Equality Agency (WGEA). The bank is one of 120 organisations named as a leader in workplace gender equality, and has achieved the citation for the third year in a row. The citation recognises employer commitment and best practice in promoting gender equality in Australian workplaces.
Continue to support employee volunteer days, sponsorship and donation requests associated with charitable initiatives
54 staff volunteered 354 hours for the community this year, and staff donations totalled $23, 564. This include $14,995 raised over three charity days in support of Cufa, the Starlight Children’s Foundation, The Children’s Burns Unit at Westmead Hospital, and the Perth Children’s Hospital Foundation Fundraising by staff in support of Craig McMahon’s CEO Sleepout for Vinnie’s, totalled $3,350. Firefighters Mutual Bank staff volunteered their time to assist FRNSW firefighters in fundraising for motor neurone disease research at Macquarie University. The bank provides $3,992 to charities nominated by staff. On average each FTE employee donated $46 to charity.
Continue to develop and implement diversity, discrimination and flexible working guidelines for recruitment, training and promotion
We continued to work towards the recommendations and targets set out in our Gender Diversity Strategy. KPIs relating to flexible working practices are included in each Manager’s performance assessment.
Reduce the lost time incident rate (LTIR) (in days)
Our LTIR reduced from 29 days in FY2017 to 16 days in FY2018
Maintain staff satisfaction with WH&S at or above 85%
No data available due to Annual Staff survey being undertaken after FY2018
Make health, safety and wellbeing an integral part of each employee’s role
WHS responsibilities are contained within each individual’s job description.
1 Small to medium sized companies. 2 The WGEA Employer of Choice for Gender Equality (EOCGE) citation is designed to encourage, recognise and promote active commitment to achieving gender equality in Australian workplaces – www.wgea.gov.au.

22 Teachers Mutual Bank Limited
Directors
Directors’ Report
The Board of Directors has responsibility for the overall management and strategic direction of Teachers Mutual Bank Limited. All Board members are independent, non-executive directors and the majority are elected by members (our shareholders) on rotation every three years.
John Kouimanos (Chairperson)BA, Dip Ed
John Kouimanos commenced teaching in 1967 and retired as Head Teacher Social Sciences at Greystanes High School in February 2004. He was appointed to the Supervisory Committee in 1973 and served until appointed as director in 1974. He was appointed as first Chair of the Audit Committee. Mr Kouimanos was appointed Chair of Teachers Credit Union in 2008 and the inaugural Chair of Teachers Mutual Bank in 2012. Mr Kouimanos is Chair of the Board Remuneration Committee and a member of the Large Exposures Committee.
Linda Green (Deputy Chairperson)Dip Teach, B Ed (Primary Education), GAICD
Linda Green commenced teaching in 1979 and is currently Principal of Robert Townson Public School. She served as a member of the Supervisory Committee for two years and was elected to the Board in 1997, and as Deputy Chairperson in 2009. Mrs Green is Chairperson of the Marketing and Member Relations Strategy Committee, a member of the Development and Education Committee, and Board Remuneration Committee.
Tyrone Carlin (Director)B Com, LLB (Hons), M Com (Hons), LLM, PhD, Grad Dip Fin SIA, CA, FCPA, F Fin, MAICD, MFP
Tyrone Carlin is Professor of Financial Regulation and Reporting at the University of Sydney. He has held a variety of prior senior academic appointments including Deputy Vice-Chancellor (Registrar) at the University of Sydney, Co-Dean of the University of Sydney Business School, Dean of Law at Macquarie University and Director of Academic Programs at Macquarie Graduate School of Management. Professor Carlin teaches in the areas of financial reporting and management, corporate acquisitions and reconstructions and corporate and commercial law, and has published more than 100 scholarly articles in his areas of expertise. He has been engaged as a consultant by a substantial number of leading corporations, professional services and Government organisations. He is a director of University Admissions Centre NSW & ACT, and the Urological Society of Australia and New Zealand. Professor Carlin is a member of the Audit Committee and Risk and Compliance Committee, Marketing and Member Relations Strategy, and Large Exposures Committees.
The Directors are committed to ongoing training to maintainknowledge of emerging issuesand to satisfy all governancerequirements.

23Annual Report and Sustainability Update 2017-2018
Michelene Collopy (Director)B Ec, CA (FPS), FAICD
Michelene Collopy has over 20 years’ experience in financial markets and has held senior roles in compliance, funds management, treasury and financial reporting. Michelene is currently Chairperson of Perpetual Superannuation Limited and sits on the council of the University of Technology Sydney. Ms Collopy is a qualified chartered accountant and financial planning specialist, a registered company auditor, licensed operator on the Australian Stock Exchange, and Justice of the Peace. She is Chairperson of the Audit Committee and the Risk and Compliance Committee and a member of the Board Remuneration Committee and the Board Reporting Committee.
Emeritus Professor William Ford (Director)BA LLB (Hons), DipEd W Aust, DipLib (NSW)
Professor Ford was a director of Unicredit since 1990 and Chair from 2004 up until Unicredit’s merger with Teachers Mutual Bank in 2015. Professor Ford’s experience includes Barrister and Solicitor of Supreme Court of WA; Emeritus Professor of Law (UWA); Dean of the Law School, University of WA (2001-2011); Former Chair, Council of Australian Law Deans (2007-2011); Former Committee Member (UWA Branch) NTEU & Secretary UWA Academic Staff Association; and Former National Vice-President (Academic) NTEU. He is a member of the Board Remuneration Committee.
Michael O’Neill (Director)B Ec, BEd, Grad Dip Acct, FFTA, GAICD
Michael O’Neill is an experienced senior executive and director with over 25 years’ experience in financial services. Michael has a strong background in finance, risk and governance, having held roles as Chief Financial Officer and Chief Risk Officer for NAB’s Personal Banking Division in Australia and Treasurer for the NAB Group. He also has a background in risk management consulting and audit with KPMG. Michael holds a number of non-executive positions including Chairman of Gymnastics Victoria. He is the Chair of the Large Exposures Committee, a member of the Risk and Compliance Committee and the Nominations Committee and the Board Reporting Committee.
Maree O’Halloran AM (Director)AM, Ba/Dip Ed, BLegS, GDLP, LLM, GAICD
Maree O’Halloran is currently a Senior Associate at NEW Law Pty Ltd where her clients include teachers and nurses. Prior to her appointment with NEW Law in April 2015, Ms O’Halloran was the Director (ie, CEO) of the Welfare Rights Centre for seven years where she also practised as a solicitor. The Welfare Rights Centre provides free legal services to some of the most disadvantaged people in the community. Ms O’Halloran has also worked as a teacher in public schools and TAFE. She has served as President of the NSW Teachers Federation, a Director of Teachers Federation Health and SAS Trustee Corporation, and as a member of the NSW Public Service Commission. She is currently a member of the NSW Rhodes Scholarship Selection Committee. Ms O’Halloran is a member of the Audit Committee, the Marketing and Member Relations Strategy Committee and the Risk & Compliance Committee. Ms O’Halloran was awarded the Member of the Order of Australia (AM) in the 2011 Australia Day Honours List, in recognition of her service to industrial relations and education sector.
Jennifer Leete (Director)BA, Dip Ed, GAICD
Jennifer Leete commenced teaching in 1977. Her last teaching position was as Head Teacher Social Sciences at Narrabeen High School. She is a Life Member of both the NSW Teachers Federation and the Australian Education Union. Ms Leete was elected as a Director in October 2005. She is Chairperson of the Development and Education Committee, and is a member of the Marketing and Member Relations Strategy Committee and the Nominations committee.
Graeme Lockwood (Director)Dip Teach, Grad Dip C.Ed, GAICD
Graeme Lockwood commenced teaching in 1974 and retired as Head Teacher (Administration) at Normanhurst Boys High School in 2012. He served on the Supervisory Committee and Members Committee for many years and was elected to the Board in 2004. He is a member of the Audit Committee, the Development and Education Committee and the Large Exposures Committee. Mr Lockwood is Chairman of Q.T. Travel Pty. Ltd. (trading as Diploma Travel) and Tertiary Travel Service Pty Ltd.
We have three Board-appointed Directors. The Directors must satisfy the Fit and Proper criteria set down by APRA, and they must abide by our Code of Conduct which outlines their legal and ethical obligations. The Directors are committed to ongoing training to maintain knowledge of emerging issues and to satisfy all governance requirements. The Board conducts an annual review of its performance, along with reviews of individual directors, committees and the executive.

24 Teachers Mutual Bank Limited
Management
Company secretaries
Company SecretariesThe Company Secretaries in office at the end of the financial year are:
Steve James (Chief Executive Officer)MBA, Dip AICD, Adv Acc Cert, GAICD
Steve James is the Chief Executive Officer of Teachers Mutual Bank. Having worked in a diverse range of management roles at Teachers Mutual Bank over the last thirty years, Steve has played a significant role in its growth and success. He became Chief Executive Officer in 2005. Steve has been an active participant in both the national and global mutual banking movement, including participating on many national credit union committees, developing his understanding and appreciation of the environment of mutual banking organisations. He is committed to ensuring that Teachers Mutual Bank maintains its high level of member service, employee satisfaction, and financial performance.
Brad Hedgman (Deputy Chief Executive)MBus, GradCert BusTech, Dip AICD, F FINSIA, MAICD
Brad Hedgman joined Teachers Mutual Bank in 1982 and has worked in a diverse range of management positions since that time. While working primarily in the areas of finance, information technology, administration and risk, he has played an integral part in Teachers Mutual Bank’s strength and success. In his current role he remains committed to the unique environment of mutual banks and the provision of responsible financial services to our members.
Committees of Directors’ meetingsThe number of meetings held for the committees of Directors during the year and the number of meetings attended by each Director was as follows:
Audit Board Remuneration
Board Reporting
Development and Education
Large Exposures
Marketing* Nominations Risk and Compliance
A B A B A B A B A B A B A B A B
John Kouimanos 1 1 2 2
Linda Green 1 1 2 2 4 4 1 1
Tyrone Carlin 4 4 2 2 3 4 4 4
Michelene Collopy 4 4 1 1 1 1 4 4
William Ford 1 1
Jennifer Leete 2 2 2 4
Graeme Lockwood 4 4 2 2 2 2 1 1
Maree O’Halloran 4 4 4 4 4 4
Michael O’Neill 1 1 2 2 4 4
Total meetings 4 1 1 2 2 4 1 4
A Number of meetings attended. B Number of meetings entitled to attend. *Marketing includes Member Relations Strategy. Note: A leave of absence was granted where a Director was unable to attend any of the above meetings

25Annual Report and Sustainability Update 2017-2018
Directors’ board meetingsThe number of meetings of Directors held during the year and the number of meetings attended by each Director was as follows:
Attended by: A B
John Kouimanos 14 14
Linda Green 12 14
Tyrone Carlin 14 14
Michelene Collopy 13 14
William Ford 14 14
Jennifer Leete 11 14
Graeme Lockwood 14 14
Maree O'Halloran 14 14
Michael O’Neill 12 14
Total meetings 14
A Number of meetings attended. B Number of meetings entitled to attend. Note: A leave of absence was granted where Directors were unable to attend a Board of Directors meeting.
Directors’ benefitsNo Director received, or became entitled to receive, during or since the financial year, a benefit because of a contract made by the Parent, controlled entity, or a related body corporate with a Director, a firm of which a Director is a member or an entity in which a Director has a substantial financial interest, other than that disclosed in Note 32 of the financial report.
Indemnifying officers or auditorsInsurance premiums have been paid to insure each of the Directors and officers of the Group, against costs and expenses incurred by them in defending any legal proceeding arising out of their conduct while acting in their capacity as an officer of the Group. In accordance with normal commercial practice, disclosure of the premium amount and the nature of the insured liabilities is prohibited by a confidentiality clause in the contract.
No insurance cover has been provided for the benefit of the auditors of the Group.
Financial performance disclosuresPrincipal activitiesThe principal activities of the Group during the year were the provision of retail financial services in the form of taking deposits and the giving of financial accommodation as prescribed by the Group’s Constitution.
No significant changes in the nature of these activities occurred during the year.
Operating resultsThe net profit of the consolidated Group for the year after providing for income tax was $31.7 million (2017: $27.6 million).
DividendsNo dividends have been paid or declared since the end of the financial year and no dividends have been recommended or provided for by the Directors of the Group.
Review of operationsThe results provided include the results of the Parent’s operations from its activities of providing financial services, which did not change significantly from those of the previous year and the results of the subsidiary’s operations from its activities of providing travel services.
Significant changes in state of affairsThere were no significant changes in the state of affairs of the Group during the year.
Events occurring after balance dateOn 2 July 2018, the Bank issued $200 million of senior unsecured notes to 42 investors as part of the Bank’s funding strategy. As the note issuance occurred on 2 July 2018, the financial effect of this has not been recognised in the financial statements for 30 June 2018. No other matters or circumstances have arisen since the end of the financial year, which significantly affected or may significantly affect the operations, or state of affairs of the Group in subsequent financial years.
Likely developments and resultsNo matter, circumstance or likely development in operations has arisen since the end of the financial year that has significantly affected or may significantly affect:
i. the operations of the Group;
ii. the results of those operations; or
iii. the state of affairs of the Group
in the financial years subsequent to this financial year.
Auditors’ independenceThe auditors have provided the declaration of independence to the Board of Directors as prescribed by the Corporations Act 2001 (cth) as set out below.
RoundingThe amounts contained in the financial statements have been rounded to the nearest one thousand dollars in accordance with ASIC Class Order 98/100 (as amended by 06/51). The Group is permitted to round to the nearest one thousand ($’000) for all amounts except prescribed disclosures, which are shown in whole dollars.
This report is made in accordance with a resolution of the Board of Directors.
Signed on behalf of the Board of Directors by:
John Kouimanos Chairperson
Michelene CollopyChairperson of the Audit Committee
Signed and dated this 27 August 2018

26 Teachers Mutual Bank Limited
Auditor’s Declaration of Independence
Declaration of independence
In accordance with the requirements of section 307C of the Corporations Act 2001, as lead auditor for the audit of Teachers Mutual Bank Limited for the year ended 30 June 2018, I declare that, to the best of my knowledge and belief, there have been:
(i) no contraventions of the auditor independence requirements of the Corporations Act 2001 in relation to the audit; and
(ii) no contraventions of any applicable code of professional conduct in relation to the audit.
GRANT THORNTON AUDIT PTY LTD Chartered Accountants
M. Mattera Partner – Audit & Assurance
Dated 24 August 2018

27Annual Report and Sustainability Update 2017-2018
Financial StatementsNotes to the Financial Statements
Statement of comprehensive income 28
Statement of changes in member equity 29
Statement of financial position 30
Statement of cash flows 31
Notes to the financial statements 32
1. Statement of accounting policies 32
2. Income statement 36
3. Income tax expense 39
4. Receivables from financial institutions 39
5. Derivative financial instruments 40
6. Receivables 40
7. Loans and advances 41
8. Provision on impaired loans 43
9. Available for sale investments 45
10. Investment in controlled entities 45
11. Property, plant and equipment 46
12. Taxation assets 47
13. Intangible assets 48
14. Wholesale sector funding 48
15. Retail deposits 48
16. Creditors, accruals and settlement accounts 49
17. Taxation liabilities 50
18. Provisions 50
19. Subordinated debt 51
20. Capital reserve 51
21. General reserve for credit losses 51
22. Cash flow hedge reserve 51
23. Financial risk management objectives and policies 52
24. Categories of financial instruments 61
25. Maturity profile of financial assets and liabilities 62
26. Current and non-current maturity profile of financial assets and liabilities 65
27. Interest rate change profile of financial assets and liabilities 67
28. Fair value of financial assets and liabilities 70
29. Financial commitments 72
30. Standby borrowing facilities 73
31. Contingent liabilities 73
32. Disclosures by Directors, other key management personnel and related parties 74
33. Segmental reporting 76
34. Superannuation liabilities 76
35. Transfers of financial assets 76
36. Notes to statement of cash flows 77
37. Events occurring after balance date 77
38. Corporate information 77
Independent Auditor’s Report 78
Directors’ declaration 80

28 Teachers Mutual Bank Limited
Financial Statements
Statement of comprehensive incomeFor the year ended 30 June 2018
Note(s) 2018 $’000 2017 $’000
Consolidated Parent Consolidated Parent
Interest revenue 2a 272,567 272,568 247,841 247,841
Interest expense 2c (126,177) (126,182) (115,243) (115,270)
Net interest income 146,390 146,386 132,598 132,571
Fee, commission and other income 2b 34,497 22,677 35,411 22,762
Total revenue 180,887 169,063 168,009 155,333
Less: Non-interest expenses
- Impairment losses on loans and advances 2d (2,697) (2,697) (2,498) (2,498)
General administration 2e
- Employees compensation and benefits (65,684) (64,625) (62,168) (60,960)
- Depreciation and amortisation (7,286) (7,284) (6,321) (6,318)
- Auditors Remuneration (190) (177) (197) (182)
- Transaction expenses (13,056) (13,056) (12,643) (12,643)
- Information technology (12,486) (12,454) (11,795) (11,763)
- Office occupancy (3,914) (3,914) (3,375) (3,375)
- Research, marketing, sponsorship and events (6,593) (6,595) (5,977) (5,982)
- Professional fees (1,537) (1,537) (1,701) (1,701)
- Travel cost of sales (10,770) - (11,619) -
- Other administration (11,544) (11,513) (10,138) (9,968)
Total general administration (133,060) (121,155) (125,934) (112,892)
Total non-interest expenses (135,757) (123,852) (128,432) (115,390)
Profit before income tax 45,130 45,211 39,577 39,943
Income tax expense 3 (13,388) (13,412) (11,955) (12,065)
Profit after income tax 31,742 31,799 27,622 27,878
Other comprehensive income
Net movement on cash flow hedge (will be reclassified subsequently to profit or loss if specific conditions are met) 22 1,360 1,360 8,543 8,543
Non-operating income received on transfer of engagement (2017: FBECU) - - 18,706 18,706
Total comprehensive income 33,102 33,159 54,871 55,127

29Annual Report and Sustainability Update 2017-2018
Statement of changes in member equityFor the year ended 30 June 2018
Capital reserve
General reserve for credit losses
Cash flow hedge reserve
Retained earnings Total
$’000 $’000 $’000 $’000 $’000
CONSOLIDATED
Balance as at 1 July 2016 626 9,894 (9,605) 437,176 438,091
Total comprehensive income for the year – as reported - - 8,543 27,622 36,165
Subtotal 626 9,894 (1,062) 464,798 474,256
Receipts from transfer of business 35 441 - 18,230 18,706
Transfers to (from) reserves 37 2,672 - (2,709) -
Total at 30 June 2017 698 13,007 (1,062) 480,319 492,962
CONSOLIDATED
Balance as at 1 July 2017 698 13,007 (1,062) 480,319 492,962
Total comprehensive income for the year – as reported - - 1,360 31,742 33,102
Subtotal 698 13,007 298 512,061 526,064
Transfers to (from) reserves 48 761 - (809) -
Total at 30 June 2018 746 13,768 298 511,252 526,064
Capital reserve
General reserve for credit losses
Cash flow hedge reserve
Retained earnings Total
$’000 $’000 $’000 $’000 $’000
PARENT
Balance as at 1 July 2016 626 9,894 (9,605) 436,184 437,099
Total comprehensive income for the year – as reported - - 8,543 27,878 36,421
Subtotal 626 9,894 (1,062) 464,062 473,520
Receipts from transfer of business 35 441 - 18,230 18,706
Transfers to (from) reserves 37 2,672 - (2,709) -
Total at 30 June 2017 698 13,007 (1,062) 479,583 492,226
PARENT
Balance as at 1 July 2017 698 13,007 (1,062) 479,583 492,226
Total comprehensive income for the year – as reported - - 1,360 31,799 33,159
Subtotal 698 13,007 298 511,382 525,385
Transfers to (from) reserves 48 761 - (809) -
Total at 30 June 2018 746 13,768 298 510,573 525,358

Financial Statements
30 Teachers Mutual Bank Limited
Statement offinancial positionFor the year ended 30 June 2018
Note(s) 2018 $’000 2017 $’000
Consolidated Parent Consolidated Parent
ASSETS
Cash on hand and deposits at call 70,884 70,884 146,758 146,758
Receivables from financial institutions 4 933,510 933,510 984,279 984,279
Derivative assets held for hedging purposes 5 818 818 1,338 1,338
Receivables 6 5,450 5,080 12,085 11,579
Prepayments 4,018 4,018 4,317 4,315
Loans and advances to members 7 & 8 5,997,831 5,997,831 5,480,497 5,480,497
Available for sale investments 9 5,145 5,145 5,145 5,145
Investments in controlled entities 10 - 147 - 147
Property, plant and equipment 11 36,869 36,868 34,157 34,154
Taxation assets 12 9,140 9,013 8,723 8,557
Intangible assets 13 5,451 5,451 5,244 5,244
Total assets 7,069,116 7,068,765 6,682,543 6,682,013
LIABILITIES
Borrowings - - - -
Wholesale sector funding 14 670,879 670,879 680,261 680,261
Retail deposits 15 5,812,848 5,813,647 5,479,060 5,479,874
Derivative liabilities 5 519 519 2,645 2,645
Creditors accruals and settlement accounts 16 19,839 19,480 9,794 9,349
Taxation liabilities 17 1,434 1,434 996 996
Provisions 18 17,469 17,357 16,825 16,662
Subordinated debt 19 20,064 20,064 - -
Total liabilities 6,543,052 6,543,380 6,189,581 6,189,787
Net assets 526,064 525,385 492,962 492,226
MEMBERS’ EQUITY
Capital reserve account 20 746 746 698 698
General reserve for credit losses 21 13,768 13,768 13,007 13,007
Cash flow hedge reserve 22 298 298 (1,062) (1,062)
Retained earnings 511,252 510,573 480,319 479,583
Total members’ equity 526,064 525,385 492,962 492,226

31Annual Report and Sustainability Update 2017-2018
Statement of cash flowsFor the year ended 30 June 2018
Note(s) 2018 $’000 2017 $’000
Consolidated Parent Consolidated Parent
CASH FLOWS FROM OPERATING ACTIVITIES
Interest received 273,080 273,047 248,173 248,173
Fees and commissions 18,923 18,923 32,672 18,834
Dividends received 429 429 695 695
Other non-interest income received 13,484 1,629 248 1,437
Interest paid on deposits (124,030) (124,035) (111,438) (111,465)
Borrowing costs (51) (15) (31) (31)
Capital Raising – subordinated Debt (622) (622) - -
Expenses paid to suppliers and staff (124,904) (112,920) (119,475) (106,434)
Income tax paid (13,310) (13,372) (12,965) (12,996)
Net increase in loans and advances to members (518,955) (518,955) (772,056) (772,056)
Net increase in retail deposits 349,206 349,142 633,176 632,842
Net cash flows from operating activities 36b (126,750) (126,749) (101,001) (101,001)
CASH FLOWS FROM INVESTING ACTIVITIES
Acquisition of property, plant and equipment (7,682) (7,682) (7,044) (7,044)
Acquisition of intangible assets (2,357) (2,357) (1,691) (1,691)
Sale of property, plant and equipment 714 714 159 159
Sale of other investments - - 92 92
Increase (decrease) in deposits with other financial institutions 50,770 50,769 (206,639) (206,639)
Net cash received on transfer of engagement - - 30,615 30,615
Net cash flows used in investing activities 41,445 41,444 (184,508) (184,508)
CASH FLOWS FROM FINANCING ACTIVITIES
Increase (decrease) in wholesale sector funding (10,505) (10,505) 258,830 258,830
Proceeds of issue of subordinated debt 19,936 19,936 - -
Net cash flows from (used in) financing activities 9,431 9,431 258,830 258,830
CASH HELD
Net increase (decrease) in cash held (75,874) (75,874) (26,679) (26,679)
Add opening cash brought forward 146,758 146,758 173,437 173,437
Closing cash carried forward 36a 70,884 70,884 146,758 146,758

32 Teachers Mutual Bank Limited
Financial Statements
Notes to the financial statements1. Statement of accounting policiesThis financial report is prepared for Teachers Mutual Bank Limited (the Parent) and its controlled entities Q.T. Travel Pty. Ltd, Tertiary Travel Service Pty Ltd and Edsec Funding Trust No. 1 for the year ended the 30 June 2018. The report was authorised for issue on the 27 August 2018, in accordance with a resolution of the Board of Directors.
The financial report is presented in Australian dollars. The financial report is a general purpose financial report which has been prepared in accordance with Australian equivalents to International Financial Reporting Standards (AIFRS), Interpretations of the Australian Accounting Standards Board, and the Corporations Act 2001. Compliance with AIFRS ensures the financial statements and notes comply with the International Financial Reporting Standards (IFRS). The Parent is a for-profit entity for the purpose of preparing the financial statements.
a. Basis of consolidationThe Group financial statements consolidate those of the Parent Company and all of its subsidiaries as of 30 June 2018. The parent controls a subsidiary if it is exposed, or has rights, to variable returns from its involvement with the subsidiary and has the ability to affect those returns through its power over the subsidiary. All subsidiaries have a reporting date of 30 June.
All transactions and balances between Group companies are eliminated on consolidation, including unrealised gains and losses on transactions between Group companies. Where unrealised losses on intra-group asset sales are reversed on consolidation, the underlying asset is also tested for impairment from a group perspective. Amounts reported in the financial statements of subsidiaries have been adjusted where necessary to ensure consistency with the accounting policies adopted by the Group.
Profit or loss and other comprehensive income of subsidiaries acquired or disposed of during the year are recognised from the effective date of acquisition, or up to the effective date of disposal, as applicable.
Non-controlling interests, presented as part of equity, represent the portion of a subsidiary’s profit or loss and net assets that is not held by the Group. The Group attributes total comprehensive income or loss of subsidiaries between the owners of the parent and the non-controlling interests based on their respective ownership interests.
b. Basis of measurementThe financial statements are prepared on an accruals basis and are based on historical costs, which do not take into account changing money values, current values or non-current assets, except for the treatment of derivative financial instruments stated in Note 1j, employee entitlements stated in Note 1q and leasehold make good costs stated in Note 1r. Accounting policies are consistent with the prior financial year unless otherwise stated.
c. Loans to membersBasis of recognitionLoans are initially recognised at fair value, net of transaction costs incurred and inclusive of loan origination fees. Loans are subsequently measured at amortised cost. Any difference between the proceeds (net of transaction costs) and the redemption amount is recognised in the statement of comprehensive income over the expected life of the loan using the effective interest method.
Loans to members are reported at their recoverable amount, representing the aggregate amount of principal and unpaid interest owing to the Group at balance date less any allowance or provision against debts considered doubtful.
Loan impairment is recognised when there is doubt as to the collection of repayments in accordance with the loan agreement. Impairment charges are determined on a portfolio basis using credit grading processes, and through specific assessment of loans exhibiting possible impairment characteristics.
Bad debts are written off when identified and are recognised as expenses in the statement of comprehensive income.
All loans and advances are reviewed and graded according to the assessed level of credit risk. The classification adopted is described below.
Non-accrual loans are loans and advances, including savings accounts drawn past their approved credit limit, where the recovery of all interest and principal is considered to be reasonably doubtful. Interest charged and not received on this class of loan is not recognised as revenue.
Restructured loans arise when the borrower is granted a concession due to continuing difficulties in meeting the original terms and the revised terms are not comparable to new facilities of comparable risk. Loans where interest has been stopped or is less than the Group’s average cost of funds are included in non-accrual loans.
Assets acquired through the enforcement of security are assets acquired in full or partial settlement of a loan or similar facility through the enforcement of security arrangements.
Past due loans are loans where payments of principal or interest are at least 30 days in arrears and are not non-accrual loans or restructured loans. Full recovery of both principal and interest is expected.
Interest earnedVariable and fixed rate loan interest is calculated on the daily balance outstanding and is charged in arrears on the last day of each month. All home loans are secured by registered mortgages. Other loans are assessed on an individual basis.
Fixed interest loan interest is calculated at a fixed rate on the daily balance and is charged in arrears on the last day of each month.
Overdraft interest is calculated on the daily balance outstanding and is charged in arrears on the last day of each month.
Overdrawn savings interest is calculated on the daily balance outstanding and is charged in arrears on the last day of each month.
Credit card interest is calculated on the outstanding balance, after any interest free period applicable, that has not been paid for by the due date. Interest is charged in arrears on the last day of the statement period.

33Annual Report and Sustainability Update 2017-2018
Balance offset loans interest is calculated on the same basis as variable rate loans but with the daily balance outstanding reduced by the balance held in the offset savings account for that day.
Loan origination feesLoan establishment fees are initially deferred as part of the loan balance. The fees are brought to account as income over the expected life of the loan, as part of interest revenue.
Transaction costsTransaction costs are expenses directly related to the establishment of the loan. These costs are initially deferred as part of the loan balance and are recognised as a reduction to interest revenue over the expected life of the loan.
Broker commissionsUpfront commissions paid to brokers are initially deferred as part of prepaid expenses and are recognised as a reduction to interest revenue over the expected life of the loan.
Trailing commissions paid to brokers after loan origination are recognised as an administration expense.
Fees on loansFees charged on loans after origination are recognised as income when the service is provided or costs are incurred.
The REPO securitisation trust consolidationThe Parent maintains a securitisation trust that issues notes to meet the Reserve Bank of Australia’s criteria for borrowing funds via Repurchase Agreements for emergency liquidity requirements only. The Parent holds all notes issued by the trust, manages the loans, and retains all residual benefits and costs of the portfolio.
Accordingly:
(a) The trust meets the definition of a controlled entity; and
(b) As the Parent has not transferred all risks and rewards to the trust, the assigned loans are not derecognised in the financial statements of the Parent.
The Group presents a set of financial statements representing:
1. The consolidated financial performance and financial position of the Parent consisting of the bank and the securitisation trust; and
2. The consolidated financial performance and financial position of the Group consisting of the Parent, the securitisation trust and any subsidiaries.
d. Loan impairmentSpecific provisionA provision for losses on impaired loans is recognised when there is objective evidence of impairment. Impairment charges are calculated on a portfolio basis for loans of similar characteristics, or on an individual basis. Amounts provided are determined by management and the Board of Directors to recognise the probability of loan collections not occurring in accordance with the terms of loan agreements. The critical assumptions used in the calculation are as set out in Note 8.
Australian Prudential Standards specify a minimum provision that is based on percentages of loan balances within specific arrears aging periods, loan type, insurance and security. This method is applied in determining the collective provisions for impairment.
Individual and groups of loans are continually reviewed for indicators of impairment. When impairment indicators exist further assessment is undertaken and loan impairment charges are recognised. Evidence of impairment may include indications that the borrower has defaulted, is experiencing significant financial
difficulty, or where the debt has been restructured to reduce the burden to the borrower.
General reserve for credit lossesThe General reserve for credit losses is a reserve in respect of credit losses prudently estimated but are not certain to arise over the life of individual loan facilities provided by the Group.
A historical probability of default and loss given default (LGD) are calculated and projected over the expected life of the loan portfolio to identify expected losses on loan facilities. This result is compared to expected losses that would arise should the minimum (LGD) levels specified by the Australian Prudential Regulation Authority (APRA) under an internal ratings based approach be applied. The Reserve is set at the greater of the two calculations. The Board considers whether there are any significant environmental factors that warrant adjustment to the Reserve and makes increasing adjustments should it judge it appropriate.
e. Bad debts written offLoan balances are written off when it is reasonable to expect that the recovery of the debt is unlikely. Bad debts are recognised as expenses in the statement of comprehensive income.
f. Property, plant and equipmentLand and buildings are measured at cost net of accumulated depreciation and impairment charges.
Property, plant and equipment are depreciated on a straight-line basis over their expected useful life. Useful lives are adjusted at each reporting date where appropriate. Estimated useful lives as at the balance date are:
• Buildings – 40 years;
• Leasehold improvements – up to 5 years or the term of the lease; and
• Plant and equipment – 2.5 to 12 years.
g. Intangible assetsItems of computer software, which are not integral to computer hardware owned by the Group are classified as intangible assets and amortised over an expected useful life of 2.5 to 4 years.
h. Cash and cash equivalentsCash comprises cash on hand, demand deposits and restricted access accounts.
Cash equivalents are readily convertible to known amounts of cash and are subject to insignificant risk of changes in value. Restricted access accounts represent the Group’s security deposit obligations with Cuscal Limited (Cuscal).
i. Receivables from financial institutionsTerm deposits, negotiable certificates of deposit (NCDs) and floating rate notes (FRNs) are unsecured and are recorded at their purchase price. Interest on term deposits and NCDs are calculated on the daily balance and paid at maturity. Interest on FRNs is calculated on the daily balance and paid at each repricing date. All deposits are in Australian currency. Accrued interest is calculated on a proportional basis of the expired period of the term of the investment and included in receivables in the statement of financial position. All receivables from financial institutions are intended to be held to maturity.

34 Teachers Mutual Bank Limited
Financial Statements
j. Derivative financial instrumentsInterest rate swapsThe Group transacts interest rate swaps to manage interest rate risk. These are recognised at fair value at the date of the contract and are reported at fair value at subsequent reporting dates. Resulting gains or loss are recognised in profit or loss immediately unless the swap is determined to be an effective hedging instrument. Where the hedge is effective, fair value losses and gains are recognised in Other Comprehensive Income. Interest rate swaps are designated as hedges of highly probable forecast transactions (cash flow hedges).
Hedge accountingThe Group determines that any proposed hedging instrument to be used in a hedging relationship is highly effective in offsetting changes in cash flows of the hedged item before entering the hedge. The relationship between the hedging instrument and the hedged item, its risk management objectives, and its strategy is documented at the inception of the hedge. Existing hedges are tested on a retrospective basis to ensure that gains and losses on any ineffective portion of hedges are reported through profit and loss.
Fair values of derivative instruments used for hedging purposes are provided at Note 28. Movements in the hedging reserve are provided at Note 22.
Cash flow hedgesThe effective portion of changes in the fair value of derivatives designated and qualifying as cash flow hedges are deferred in equity. The gain or loss relating to the ineffective portion is recognised immediately in profit or loss as part of other expenses or other income.
Amounts deferred in equity are recycled in profit or loss in the periods when the hedged item is recognised in profit or loss in the same line of the statement of comprehensive income as the recognised hedged item. Hedge accounting is discontinued when the hedging relationship is revoked, the hedging instrument expires or is sold, terminated, or exercised, or no longer qualifies for hedge accounting. Any cumulative gain or loss deferred in equity at that time remains in equity and is recognised when the forecast transaction is ultimately recognised in profit or loss. When a forecast transaction is no longer expected to occur, the cumulative gain or loss that was deferred in equity is recognised immediately in profit or loss.
k. Equity investments and other securitiesInvestments in shares are classified as available for sale financial assets where they do not qualify for classification as loans and receivables or investments held for trading.
Investments in shares, which do not have a ready market and are not capable of being reliably valued are recorded at the lower of cost or recoverable amount. Investments in shares where no market value is readily available are carried at cost less any provision for amortisation. All investments are in Australian currency.
l. Investment in controlled entitiesInvestments in controlled entities are carried at cost, net of amortisation and impairment and eliminated on consolidation.
m. Retail depositsBasis for determinationRetail savings and term deposits are stated at the aggregate amount of money owing to depositors.
Interest payableSavingsSavings account interest is calculated on daily balances and credited monthly, unless the account is designated as a balance offset account, in which case interest is calculated as described in balance offset loans in Note 1c.
Fixed term depositsInterest on fixed term deposits is calculated on a daily basis at the agreed rate and is paid in accordance with the terms of the deposit. Interest payable is included in the balance of retail deposits in the statement of financial position.
n. Wholesale sector fundingBasis for determinationWholesale term deposits, FRNs and NCDs are stated at the aggregate amount owed.
Interest payableInterest on fixed term deposit accounts is calculated on a daily basis at the agreed rate and is paid in accordance with the terms of the deposit. Interest payable is included in the balance of wholesale sector funding in the statement of financial position.
o. BorrowingsAll borrowings are initially recognised at fair value net of transaction costs. Borrowings are subsequently measured at amortised cost. Differences between net proceeds and redemption amounts are recognised in the statement of comprehensive income over the term of the borrowings using the effective interest method.
p. Subordinated debtSubordinated debt is initially recognised at fair value net of transaction costs, and subsequently measured at amortised cost using the effective interest rate method.
q. Provision for employee benefitsEmployee benefits expected to be settled within 12 months of the end of the reporting period have been measured at their nominal amount. Employee benefits not expected to be settled within 12 months of the end of the reporting period are stated at present value, using expected settlement timings and discount rates equivalent to government guaranteed securities of similar term. Employee benefits consist of sick leave, annual leave and long-service leave. Sick leave is short-term, non-vesting and accumulating.
r. Leasehold on premisesLeases where the lessor retains substantially all the risks and rewards of ownership of the asset are classified as operating leases. Payments made under operating leases (net of incentives received from the lessor) are charged to the statement of comprehensive income on a straight-line basis over the period of the lease.
Provision for make good costs on operating leases is based on the net present value of future expenditure at the conclusion of the lease term discounted at interest rates attaching to government guaranteed securities for terms to maturity approximating the terms of the related liability. Increases in the provision in future years are recognised as part of the interest expense.

35Annual Report and Sustainability Update 2017-2018
s. Income taxIncome tax expense presented in the statement of comprehensive income is based on profit before income tax adjusted for non-tax deductible or non-assessable items. Deferred tax assets and liabilities are recognised using the statement of financial position liability method in respect of temporary differences arising between the tax bases of assets or liabilities and their carrying amounts in the financial statements. Current and deferred tax balances relating to amounts recognised directly in equity, are also recognised directly in equity.
Deferred tax assets and liabilities are recognised for all temporary differences between carrying amounts of assets and liabilities for financial reporting purposes and their respective tax bases at the rate of income tax applicable to the period in which the benefit will be received or the liability will become payable. These differences are presently assessed at 30%.
Deferred tax assets are brought to account if it is probable that future taxable amounts will be available to utilise those temporary differences. The recognition of these benefits is based on the assumption that no adverse change will occur in income tax legislation, that the Group will derive sufficient future assessable income, and will comply with deductibility conditions imposed by law.
t. Goods and services tax (GST)The Group is input taxed on all income except commissions and some fees. As some income is subject to GST, the Group determines recoverable GST through analysis of activities and costs pertaining to income. In addition, certain prescribed purchases are subject to reduced input tax credits (RITC), with 75% of GST paid being recoverable.
Revenue, expenses and assets are recognised net of GST, unless the GST incurred is not recoverable from the Australian Tax Office (ATO). In these circumstances, GST is recognised as part of the cost of acquisition of the asset or as part of an item’s expense.
Receivables and payables are stated inclusive of GST where applicable. The net amount of GST receivable or payable is recorded as a current asset or current liability in the statement of financial position. Cash flows are included in the statement of cash flows on an inclusive basis of unrecoverable GST. The GST components of cash flows arising from investing and financing activities are classified as operating cash flows.
u. Business combinationsThe purchase method of accounting is used to account for all business combinations. Cost is measured as the fair value of the assets given, shares issued or liabilities incurred or assumed at the date of exchange plus costs directly attributable to the acquisition. Where equity instruments are issued, the value of the equity instruments is their market value as at the date of exchange unless it can be demonstrated that the published price at the date of exchange is an unreliable indicator of fair value and that other evidence and valuation methods provide a more reliable measure of fair value.
Transaction costs arising on the issue of equity instruments are recognised directly in equity.
Transaction costs of business acquisitions other than for the issue of equity instruments are expensed as incurred as operating expenses.
Identifiable assets acquired and liabilities and contingent liabilities assumed in business combinations are initially measured at their fair values at acquisition date. The excess of the cost of acquisition over the fair value of the identifiable net assets acquired is recorded as goodwill. If the cost of acquisition is less than the fair value of the net assets acquired, the difference is recognised in comprehensive income.
v. Impairment of assetsThe Group assesses whether there are any impairment indicators for individual assets at each reporting date. If impairment indicators exist, the recoverable amount is compared to the carrying value and any shortfalls are recognised in the statement of comprehensive income. The recoverable amount is the higher of an asset’s fair value less costs to sell and value in use.
To assess value in use, estimated cash flows are discounted to present value using a pre-tax discount rate reflecting current market rates and the risks specific to the asset. Where it is not possible to estimate a recoverable amount for an individual asset, a recoverable amount is determined for the cash-generating unit to which the asset belongs.
w. Accounting estimates and judgementsManagement has made judgements when applying the Group’s accounting policies with respect to the classification of assets as available for sale.
The detail of the critical accounting estimates and assumptions are set out in Note 8 for the impairment provisions for loans.
x. Assets measured at fair valueAssets measured at fair value have been classified according to the following hierarchy;
• Level 1 – quoted prices (unadjusted) in active markets for identical assets or liabilities;
• Level 2 – inputs other than quoted prices included within Level 1 that are observable for the asset or liability, either directly (i.e. as prices) or indirectly (i.e. derived from prices); and
• Level 3 – inputs for the asset or liability that are not based on observable market data (unobservable inputs).

36 Teachers Mutual Bank Limited
Financial Statements
y. New or emerging standards not yet mandatoryCertain new accounting standards and interpretations have been published that are not mandatory for the reporting period ending 30th June 2018. The Group’s assessment of the impact of these new standards and interpretations is set out below.
Emerging standardsAASB reference
Nature of change Application date
Impact on initial application
AASB 9 Financial Instruments (December 2014)
The new standard replaces AASB 139 and supersedes AASB 9 versions previously issued in December 2009 and December 2010. It amends the requirements for classification and measurement of financial assets. AASB 9 requirements regarding hedge accounting represent a substantial overhaul of hedge accounting that enable entities to better reflect their risk management activities in the financial statements. Furthermore, AASB 9 introduces a new impairment model based on expected credit losses. Recognition of credit losses are to no longer be dependent on the Group first identifying a credit loss event. The Group will consider a broader range of information when assessing credit risk and measuring expected credit losses including past experience of historical losses for similar financial instruments.
Periods beginning on or after 1 January 2018.
The Group has carried out an assessment of the impact of the new standard. There will be no significant impact arising on changes to the classification and measurement of financial assets. There will be no significant impact in relation to hedging measurements as existing policies and methodologies will remain unchanged pending further consideration of the IASB. The Provision for doubtful debts is expected to increase by between $2m and $3m with a corresponding reduction in opening retained earnings.
AASB 15 Revenue from Contracts with Customers
Revenue from financial instruments is not covered by this new Standard, but AASB 15 establishes a new revenue recognition model for other types of revenue. AASB 15 is based on the principle that revenue is recognised when control of a good or service transfers to a customer. The standard replaces AASB 118 Revenue, AASB 111 Construction Contracts and related revenue interpretations.
Periods beginning on or after 1 January 2018.
Based upon a preliminary assessment, the Standard is not expected to have a material impact upon the transactions and balances recognised when it is first adopted, as most of the Group’s revenue arises from the provision of financial services which are governed by AASB 9 Financial Instruments. Few revenue transactions of the Group are impacted by the new standard.
AASB 16 Leases Replaces AASB 117
Replaces AASB 117 Leases and some lease-related Interpretations. Requires all leases to be accounted for ‘on-balance sheet’ by lessees, other than short-term and low value asset leases. Provides new guidance on the application of the definition of lease and on sale and lease back accounting. Requires new and different disclosures about leases.
Periods beginning on or after 1 January 2019
The Group is yet to undertake a detailed assessment of the impact of AASB 16. The Group’s preliminary assessment is that the Standard will not have a material impact on transactions and balances recognised when first adopted for the year ending 30 June 2020.
2. Income statement
a. Analysis of interest revenue2018 $’000 2017 $’000
Consolidated Parent Consolidated Parent
INTEREST REVENUE
Cash – deposits at call 2,590 2,591 2,703 2,703
Receivables from financial institution deposits 25,114 25,114 20,516 20,516
Loans and advances to members 244,686 244,686 224,456 224,456
Derivatives interest income 142 142 114 114
Other 35 35 52 52
Total interest revenue 272,567 272,568 247,841 247,841
b. Non-interest revenue2018 $’000 2017 $’000
Consolidated Parent Consolidated ParentFEE AND COMMISSION REVENUE
Loan fee income – other than loan origination fees 2,888 2,888 3,278 3,278
Other fee income 4,366 4,366 4,440 4,440
Insurance commissions 4,857 4,857 4,841 4,841
Other commissions 6,683 6,683 6,682 6,682
Total fee and commission revenue 18,794 18,794 19,241 19,241

37Annual Report and Sustainability Update 2017-2018
2018 $’000 2017 $’000
Consolidated Parent Consolidated Parent
OTHER INCOME
Dividends received on available for sale assets 429 429 695 695
Bad debts recovered 1,076 1,076 1,153 1,153
Gain on disposal of assets:
- Property, plant and equipment 714 714 159 159
- Investments 3 3 77 77
Transfers from provisions:
- Impairment losses on loans and advances - - 23 23
- Sick Leave 22 22 5 5
- Director development 12 12 20 20
- Land tax - - 200 200
Travel income from sales 11,829 - 12,781 -
Miscellaneous revenue 1,618 1,627 1,057 1,189
Total non-interest revenue 34,497 22,677 35,411 22,762
c. Interest expenses2018 $’000 2017 $’000
Consolidated Parent Consolidated Parent
INTEREST EXPENSES
Overdraft 16 16 11 11
Short-term borrowing - - 20 20
Wholesale sector funding 13,103 13,103 11,921 11,921
Wholesale deposits 2,142 2,142 1,593 1,593
Retail deposits 108,073 108,078 95,732 95,759
Derivatives interest expense 2,093 2,093 5,966 5,966
Subordinated debt interest expense 750 750 - -
Total interest expenses 126,177 126,182 115,243 115,270
d. Impairment losses2018 $’000 2017 $’000
Consolidated Parent Consolidated Parent
LOANS AND ADVANCES CARRIED AT AMORTISED COST
Increase in provision for impairment 592 592 - -
Bad debts written off directly against profit 2,105 2,105 2,498 2,498
Total impairment losses 2,697 2,697 2,498 2,498
e. Prescribed expenses2018 $’000 2017 $’000
Consolidated Parent Consolidated Parent
EMPLOYEE COSTS
Personnel costs 59,743 58,765 55,488 54,371
Superannuation contributions 5,207 5,126 4,639 4,548
Net movement in provisions for employee annual leave 380 380 714 714
Net movement in provisions for employee long service leave 354 354 1,327 1,327
Total employee costs 65,684 64,625 62,168 60,960

38 Teachers Mutual Bank Limited
Financial Statements
2018 $’000 2017 $’000
Consolidated Parent Consolidated Parent
DEPRECIATION AND AMORTISATION EXPENSE
Buildings 742 742 673 673
Plant and equipment 3,464 3,462 3,107 3,104
Leasehold improvements (including lease make good provisions) 246 246 136 136
Written down value of assets disposed 695 695 218 218
Intangible assets – computer software 2,139 2,139 2,187 2,187
Total depreciation and amortisation expenses 7,286 7,284 6,321 6,318
AUDITOR’S REMUNERATION (EXCLUDING GST)
Audit and review of financial statements:
- Audit services: Grant Thornton 183 170 186 171
Other services:
- Compliance 2 2 6 6
- Other 5 5 5 5
Total auditor’s remuneration 190 177 197 182
OTHER OPERATING EXPENSES
Transaction expenses 13,056 13,056 12,643 12,643
Information technology 12,486 12,454 11,795 11,763
Office occupancy 3,914 3,914 3,375 3,375
Research, marketing, sponsorships and events 6,593 6,595 5,977 5,982
Professional fees 1,537 1,537 1,701 1,701
Other administration 22,314 11,513 21,757 9,968
Total other operating expenses 59,900 49,069 57,248 45,432
Total general administration 133,060 121,155 125,934 112,892

39Annual Report and Sustainability Update 2017-2018
3. Income tax expense
a. The income tax expense comprises amounts set aside as:2018 $’000 2017 $’000
Consolidated Parent Consolidated Parent
Provision for income tax – current year 13,851 13,851 12,468 12,468
Under (over) provision in prior years (50) (50) 203 203
Decrease (increase) in the deferred tax asset (413) (389) (716) (606)
Income tax expense attributable to profit 13,388 13,412 11,955 12,065
b. The prima facie tax payable on profit is reconciled to the income tax expense in the accounts as follows:
2018 $’000 2017 $’000
Consolidated Parent Consolidated Parent
Profit 45,128 45,210 39,577 39,943
Prima facie tax payable on profit before income tax at 30% 13,539 13,563 11,873 11,983
Add: Tax effect of expenses not deductible 94 94 91 91
Less: Tax effect of income not assessable (2) (2) (3) (3)
Subtotal 13,631 13,655 11,961 12,071
Add: Adjustments to recognise deferred tax assets 349 325 715 605
Less: Franking rebate (129) (129) (208) (208)
Current income tax provision attributable to profit 13,851 13,851 12,468 12,468
c. Franking credits2018 $’000 2017 $’000
Consolidated Parent Consolidated Parent
Franking credits held after adjusting for franking credits that will arise from the payment of income tax payable as at the end of the financial year 194,400 194,024 181,028 180,652
4. Receivables from financial institutions
2018 $’000 2017 $’000
Consolidated Parent Consolidated Parent
Negotiable certificates of deposit 310,323 310,323 489,621 489,621
Term deposits - - 1,000 1,000
Floating rate notes 584,620 584,620 441,839 441,839
Other 38,567 38,567 51,819 51,819
Total receivables from financial institutions 933,510 933,510 984,279 984,279

40 Teachers Mutual Bank Limited
Financial Statements
5. Derivative financial instrumentsThe tables below provide the fair values and notional amounts of derivative financial instruments held by the Group. The notional amount is reported gross at the amount of the underlying asset, reference rate or index, and is the basis upon which changes in the value of derivatives are measured. The notional amounts indicate the value of transactions open at year end and are not indicative of market risk or credit risk. Fair value measurement is classified as Level 2 in the fair value hierarchy and the methodology and basis for valuation is explained in Note 1x.
Derivatives designated as cash flow hedges
2018 $’000 2017 $’000
Parent & Consolidated Parent & Consolidated
Assets Liabilities Assets Liabilities
Interest rate swaps 818 519 1,338 2,645
Net movement on derivatives during the year
2018 $’000 2017 $’000
Parent & Consolidated Parent & Consolidated
Recognised in interest income 246 232
Recognised to other comprehensive income 1,360 8,543
Total 1,606 8,775
Notional principal amounts and period of expiry of interest rate swap contracts
2018 $’000 2017 $’000
Parent & Consolidated Parent & Consolidated
Pay Fixed Receive Fixed Notional Amount
Pay Fixed Receive Fixed Notional Amount
Within 1 year 261,200 - 261,200 262,000 - 262,000
> 1 to 2 years 210,600 - 210,600 261,200 - 261,200
> 2 to 3 years 50,400 - 50,400 210,600 - 210,600
> 3 to 4 years 16,000 - 16,000 50,400 - 50,400
> 4 to 5 years - - - 16,000 - 16,000
> 5 years - - - - - -
Total 538,200 - 538,200 800,200 - 800,200
6. Receivables
2018 $’000 2017 $’000
Consolidated Parent Consolidated Parent
Interest receivable on deposits with other financial institutions
3,751 3,751 4,165 4,165
Sundry debtors and settlement accounts 1,699 1,329 7,920 7,414
Total receivables 5,450 5,080 12,085 11,579

41Annual Report and Sustainability Update 2017-2018
7. Loans and advances
a. Amount due2018 $’000 2017 $’000
Consolidated Parent Consolidated Parent
Overdrafts and credit cards 96,764 96,764 100,284 100,284
Term loans 5,895,813 5,895,813 5,376,365 5,376,365
Overdrawn savings 114 114 122 122
Subtotal 5,992,691 5,992,691 5,476,771 5,476,771
Add: Amortised loan origination transaction costs and broker commission, net of fees
7,748 7,748 5,742 5,742
Subtotal 6,000,439 6,000,439 5,482,513 5,482,513
Less: Provision for impaired loans as detailed in Note 8 (2,608) (2,608) (2,016) (2,016)
Total loans and advances to members 5,997,831 5,997,831 5,480,497 5,480,497
b. Credit quality – security held against loans2018 $’000 2017 $’000
Consolidated Parent Consolidated Parent
Secured by mortgage over real estate 5,779,100 5,779,100 5,243,615 5,243,615
Partly secured by goods mortgage 10,903 10,903 13,545 13,545
Wholly unsecured 202,688 202,688 219,611 219,611
Total 5,992,691 5,992,691 5,476,771 5,476,771
It is not practicable to value all collateral as at the balance date due to the variety and condition of assets. A breakdown of the quality of the residential mortgage security on a portfolio basis is as follows:
SECURITY HELD AS MORTGAGE AGAINST REAL ESTATE IS ON THE BASIS OF:
– Loan to valuation ratio of less than 80% 4,474,829 4,474,829 4,104,464 4,104,464
– Loan to valuation ratio of more than 80% but mortgage insured
1,081,892 1,081,892 873,529 873,529
– Loan to valuation ratio of more than 80% and not mortgage insured
222,379 222,379 265,622 265,622
Total 5,779,100 5,779,100 5,243,615 5,243,615
c. Concentration of loansThe values discussed below include on-statement of financial position values and off-statement of financial position undrawn facilities as described in Note 29.
i) There are no members who individually or collectively have loans, representing 10% or more of members’ equity.
ii) Details of classes of loans, which represent in aggregate, 10% or more of members’ equity, are set out below.
BALANCE OF LOANS HELD BY MEMBERS WHO ARE RECEIVING PAYMENTS FROM:
2018 $’000 2017 $’000
Consolidated Parent Consolidated Parent
NSW Department of Education 1,569,158 1,569,158 1,654,261 1,654,261
State Super Financial Services 180,654 180,654 159,077 159,077
WA Department of Education 114,918 114,918 116,505 116,505
ACT Department of Treasury 110,761 110,761 104,488 104,488
Catholic Education Office 82,102 82,102 78,784 78,784
Teachers Mutual Bank Limited employees 61,935 61,935 60,427 60,427
NSW TAFE 54,596 54,596 57,817 57,817

42 Teachers Mutual Bank Limited
Financial Statements
NUMBER OF MEMBERSHIPS WITH LOANS WHO ARE RECEIVING PAYMENTS FROM:
2018 $’000 2017 $’000
Consolidated Parent Consolidated Parent
NSW Department of Education 11,703 11,703 13,371 13,371
State Super Financial Services 4,533 4,533 4,050 4,050
WA Department of Education 580 580 564 564
ACT Department of Treasury 531 531 553 553
Catholic Education Office 512 512 580 580
Teachers Mutual Bank Limited employees 451 451 474 474
NSW TAFE 357 357 335 335
For the purposes of this note, membership includes both shareholding and non-shareholding.
iii) Geographical concentrations including loan balances and loan financial commitments set out in Notes 29a, 29b and 29c.
2018 $’000 2017 $’000
Parent & Consolidated Parent & Consolidated
Housing Personal Business Total Housing Personal Business Total
New South Wales
4,195,851 803,482 34 4,999,367 4,060,187 818,614 34 4,878,835
Victoria 330,724 20,996 - 351,721 235,337 17,365 - 252,702
Queensland 461,888 37,711 - 499,599 303,598 24,740 - 328,338
South Australia 48,154 4,091 - 52,246 39,955 3,211 - 43,166
Western Australia
564,080 63,250 699 628,028 457,549 65,714 729 523,992
Tasmania 37,390 2,339 - 39,729 21,462 2,220 - 23,682
Northern Territory
20,294 3,391 - 23,685 18,498 3,635 - 22,133
Australian Capital Territory
300,014 31,776 - 331,789 250,163 29,804 - 279,967
Other - 5,332 - 5,332 - 5,454 - 5,454
Total 5,958,395 972,368 733 6,931,496 5,386,749 970,757 763 6,358,269
d. Loans by purpose2018 $’000 2017 $’000
Parent & Consolidated Parent & Consolidated
Housing loans and facilities 5,958,395 5,386,749
Personal loans and facilities 972,368 970,757
Total – households 6,930,763 6,357,506
Business loans and facilities 733 763
Total 6,931,496 6,358,269
e. Securitised loansNon-derecognised securitised loans.
2018 $’000 2017 $’000
EdSec Funding Trust No.1 757,584 663,740

43Annual Report and Sustainability Update 2017-2018
8. Provision on impaired loans
a. Total provision2018 $’000 2017 $’000
Consolidated Parent Consolidated Parent
Collective provision 2,600 2,600 1,982 1,982
Individual specific provision 8 8 34 34
Total provision 2,608 2,608 2,016 2,016
b. Movement in provision for impairment
2018 $’000 2017 $’000
Consolidated Parent Consolidated Parent
Opening balance 2,016 2,016 2,039 2,039
Add (deduct) – Transfers from (to) statement of comprehensive income 592 592 (23) (23)
Closing balance 2,608 2,608 2,016 2,016
c. Impaired loans written off2018 $’000 2017 $’000
Consolidated Parent Consolidated Parent
Amounts written off directly to expense 2,105 2,105 2,498 2,498
Total bad debts 2,105 2,105 2,498 2,498
Bad debts recovered in the period 1,076 1,076 1,153 1,153
d. Analysis of loans that are impaired or potentially impaired by classIn the note below:
• Carrying value is equivalent to that stated in the statement of financial position; and
• Value of impaired loans represents ‘on-statement of financial position’ loan balances and includes non-accrual loans and restructured loans stated in Note 1c.
2018 $’000 2017 $’000
Parent & Consolidated Parent & Consolidated
LOANS TO MEMBERS
Carrying value Value of impaired loans
Provision for impairment
Carrying value Value of impaired loans
Provision for impairment
Housing 5,380,013 16,287 936 4,869,274 14,880 68
Personal 519,065 1,782 711 512,559 3,166 909
Credit card 70,501 1,798 837 71,072 1,872 858
RediCredit 22,686 233 123 23,228 277 180
Total – households 5,992,265 20,100 2,607 5,476,133 20,195 2,015
Business 425 1 1 638 1 1
Total 5,992,690 20,101 2,608 5,476,771 20,196 2,016
It is not practicable to determine fair value of collateral at balance date due to the variety and condition of assets.

44 Teachers Mutual Bank Limited
Financial Statements
e. Analysis of loans that are impaired or potentially impaired based on age of repayments outstanding
2018 $’000 2017 $’000
Parent & Consolidated Parent & Consolidated
Carrying value Provision Carrying value Provision
Less than 30 days 1,817 4 3,014 34
30 to less than 90 days in arrears 2,762 - 3,474 -
90 to less than 182 days in arrears 6,693 489 6,131 347
182 to less than 273 days in arrears 6,403 966 4,415 429
273 to less than 365 days in arrears 521 221 1,142 209
365 days and over in arrears 8 8 - -
Overdrawn savings/overlimit facilities over 14 days 1,897 920 2,020 997
Total 20,101 2,608 20,196 2,016
Impaired loans are generally not secured against residential property. Some impaired loans are secured by mortgage over motor vehicles or other assets of varying value. It is not practicable to determine the fair value of collateral as at balance date due to the variety and condition of assets.
f. Loans with repayments past due but not regarded as impairedLoans balances of $1,644 million are in arrears by at least 30 days and are not considered to be impaired as full recovery of both principal and interest is expected. It is not practicable to determine fair value of collateral at the balance date due to the variety and condition of assets.
Loans with repayments past due and not impaired are in arrears as follows:
2018 $’000 2017 $’000
Parent & Consolidated Parent & Consolidated
< 1 to 2 months
< 2 to 3 months
< 3 to 6 months
> 6 months
Total < 1 to 2 months
< 2 to 3 months
< 3 to 6 months
> 6 months
Total
Housing - - 223 935 1,158 2,041 676 - - 2,717
Personal - - - 486 486 399 334 - - 733
Credit card - - - - - 179 43 - - 222
RediCredit - - - - - 48 3 - - 51
Total - - 223 1,421 1,644 2,667 1,056 - - 3,723
g. Key assumptions in determining the provision for impairmentThe Group has determined the likely impairment loss on loans which have not maintained loan repayments in accordance with loan contracts, or where there is other evidence of potential impairment. The Group estimates potential impairment using the time that the loan is in arrears and historical losses arising in past years while ensuring that impairment estimations remain consistent with prudential guidance provided by APRA.

45Annual Report and Sustainability Update 2017-2018
9. Available for sale investments2018 $’000 2017 $’000
Consolidated Parent Consolidated Parent
SHARES IN UNLISTED COMPANIES, AT COST
Cuscal Limited (Cuscal) 5,145 5,145 5,145 5,145
Total 5,145 5,145 5,145 5,145
Disclosures on shares valued with unobservable inputsCuscal Limited (Cuscal)The shareholding in Cuscal is reported at cost. This company is an APRA Approved Deposit-taking Institution that supplies settlement, transaction processing, card, interchange and other services to organisations including Mutual Banks, Credit Unions and Building Societies. The volume of shares traded is low.
Management have used unobservable inputs to assess the fair value of these shares. Cuscal’s financial reports disclose net tangible assets exceeding the value of shares on issue and the fair value of these shares is likely to exceed their cost. However a market value is not able to be readily determined. Dividend return in 2018 was 5 cents per share. Management has determined that the cost value of $0.60 per share is a reasonable approximation of fair value.
The Group does not intend to dispose of these shares.
10. Investment in controlled entities2018 $’000 2017 $’000
Consolidated Parent Consolidated Parent
SHARES IN SUBSIDIARY
Q.T. Travel Pty Ltd trading as Diploma World Travel Service - 47 - 47
Tertiary Travel Service Pty Ltd - 100 - 100
Total investment in controlled entities - 147 - 147
This note should be read in conjunction with Note 32(d) of the financial statements.
Q.T. Travel Pty Ltd trading as Diploma World Travel ServiceThe shareholding in Diploma World Travel Service (Diploma Travel) is reported at cost. Diploma Travel provides travel services primarily to members of the Group and their families.
Tertiary Travel Service Pty LtdThe shareholding in Tertiary Travel Service is reported at cost. Tertiary Travel provides travel services to corporate and leisure clients.
The consolidated financial statements include the financial statements of the Parent and the subsidiaries listed in the following table:
Equity Interest Equity Interest Investment Investment
2018 2017 2018 $’000 2017 $’000
NAME OF ENTITY
Q.T. Travel Pty Ltd trading as Diploma World Travel Service 100% 100% 47 47
Tertiary Travel Service Pty Ltd 100% 100% 100 100

46 Teachers Mutual Bank Limited
Financial Statements
11. Property, plant and equipment2018 $’000 2017 $’000
Consolidated Parent Consolidated Parent
FIXED ASSETS
Land, at cost 11,616 11,616 11,617 11,617
Buildings, at cost 31,805 31,805 27,543 27,543
Less: Provision for depreciation (15,612) (15,612) (14,871) (14,871)
Net building 16,193 16,193 12,672 12,672
Total land and buildings 27,809 27,809 24,289 24,289
Plant and equipment, at cost 33,814 33,617 32,890 32,693
Less: Provision for depreciation (25,045) (24,849) (23,395) (23,201)
Total plant and equipment 8,769 8,768 9,495 9,492
Capitalised leasehold improvements, at cost 870 870 1,356 1,356
Less: Provision for amortisation (579) (579) (983) (983)
Total capitalised leasehold improvements 291 291 373 373
Total property, plant and equipment 36,869 36,868 34,157 34,154
Movement in asset balance during the year2018 $’000
CONSOLIDATED Land Building Plant & equipment
Leasehold improvement
Total
Opening balance 10,209 12,672 9,495 373 32,749
Additions 1,407 4,270 3,411 165 9,253
Less: Assets disposed - (8) (673) (1) (682)
Less: Depreciation charge - (741) (3,464) (246) (4,451)
Closing balance 11,616 16,193 8,769 291 36,869
2017 $’000
Opening balance 10,209 11,594 8,951 102 30,856
Additions 1,408 1,792 3,520 407 7,127
Transfer of business from merger - - 307 - 307
Less: Assets disposed - (42) (175) - (217)
Less: Depreciation charge - (672) (3,108) (136) (3,916)
Closing balance 11,617 12,672 9,495 373 34,157

47Annual Report and Sustainability Update 2017-2018
2018 $’000
PARENT Land Building Plant & equipment
Leasehold improvement
Total
Opening balance 10,209 12,672 9,492 373 32,746
Additions 1,407 4,270 3,411 165 9,253
Less: Assets disposed - (8) (673) (1) (682)
Less: Depreciation charge - (741) (3,462) (246) (4,449)
Closing balance 11,616 16,193 8,768 291 36,868
2017 $’000
Opening balance 10,209 11,594 8,945 102 30,850
Additions 1,408 1,792 3,520 407 7,127
Transfer of business from merger - - 307 - 307
Less: Assets disposed - (42) (175) - (217)
Less: Depreciation charge - (672) (3,105) (136) (3,913)
Closing balance 11,617 12,672 9,492 373 34,154
12. Taxation assets2018 $’000 2017 $’000
Consolidated Parent Consolidated Parent
DEFERRED INCOME TAX ASSETS
Accrued expenses not deductible until incurred 275 270 217 214
Provisions for impairment on loans 827 827 645 645
Provisions for employee benefits 5,232 5,222 5,008 4,960
Provisions for other liabilities 1,777 1,777 1,807 1,807
Depreciation on fixed assets 236 236 332 331
Tax losses 115 - 113 -
Amortisation of intangible assets 98 98 83 83
Deferred tax assets 8,560 8,430 8,205 8,040
2018 $’000 2017 $’000
Consolidated Parent Consolidated Parent
OTHER TAX ASSETS
GST 308 311 307 306
Land tax 272 272 211 211
Total taxation assets 9,140 9,013 8,723 8,557

48 Teachers Mutual Bank Limited
Financial Statements
13. Intangible assets2018 $’000 2017 $’000
Consolidated Parent Consolidated Parent
Computer software, at cost 20,363 20,315 18,332 18,284
Less: Provision for amortisation (14,912) (14,864) (13,088) (13,040)
Total intangible assets 5,451 5,451 5,244 5,244
Movement in balances during the year
Opening balance 5,244 5,244 5,739 5,739
Additions 2,346 2,346 1,692 1,692
Less: Amortisation charge (2,139) (2,139) (2,187) (2,187)
Closing balance 5,451 5,451 5,244 5,244
14. Wholesale sector funding
2018 $’000 2017 $’000
Consolidated Parent Consolidated Parent
Negotiable certificates of deposit issued 355,947 355,947 328,739 328,739
Floating rate notes issued 200,603 200,603 270,707 270,707
Wholesale deposits 114,329 114,329 80,815 80,815
Total wholesale sector funding 670,879 670,879 680,261 680,261
15. Retail deposits
a. Retail deposits2018 $’000 2017 $’000
Consolidated Parent Consolidated Parent
At call 3,085,368 3,086,167 2,778,961 2,779,775
Term 2,725,496 2,725,496 2,698,185 2,698,185
Member withdrawable shares 1,984 1,984 1,914 1,914
Total retail deposits 5,812,848 5,813,647 5,479,060 5,479,874

49Annual Report and Sustainability Update 2017-2018
b. Concentration of liabilitiesi) There are no depositors who individually or collectively have deposits which represent 10% or more of total liabilities.
ii) Details of classes of deposits which represent in aggregate 10% or more of total liabilities are set out below.
2018 $’000 2017 $’000
BALANCE OF ACCOUNTS HELD BY DEPOSITORS WHO ARE RECEIVING PAYMENTS FROM
State Super Financial Services 1,573,120 1,435,930
NSW Department of Education 582,744 635,516
2018 Number 2017 Number
NUMBER OF DEPOSITORS WHO ARE RECEIVING PAYMENTS FROM
State Super Financial Services 16,208 15,789
NSW Department of Education 25,404 28,771
iii) Geographical concentrations are as follows:
2018 $’000 2017 $’000
GEOGRAPHICAL CONCENTRATIONS
New South Wales 5,055,867 4,782,144
Western Australia 292,467 278,039
Queensland 126,572 112,549
Australian Capital Territory 125,107 112,174
Victoria 87,324 82,684
Other 77,621 70,723
South Australia 19,098 14,781
Tasmania 18,490 15,891
Northern Territory 9,117 8,975
Total 5,811,663 5,477,960
16. Creditors, accruals and settlement accounts2018 $’000 2017 $’000
Consolidated Parent Consolidated Parent
Creditors and accruals 5,207 4,848 5,178 4,733
Unearned income 1,186 1,186 1,064 1,064
Settlement accounts 13,446 13,446 3,552 3,552
Total creditors, accruals and settlement accounts 19,839 19,480 9,794 9,349

50 Teachers Mutual Bank Limited
Financial Statements
17. Taxation liabilities2018 $’000 2017 $’000
Consolidated Parent Consolidated Parent
Current income tax liability 834 834 404 404
Other tax liabilities 600 600 592 592
Total taxation liabilities 1,434 1,434 996 996
CURRENT INCOME TAX LIABILITY COMPRISES:
Balance, previous year 404 404 734 740
Less: Paid (354) (354) (937) (943)
Over (under) statement in prior year 50 50 (203) (203)
2018 $’000 2017 $’000
Consolidated Parent Consolidated Parent
Liability for income tax in current year 13,851 13,851 12,468 12,468
Less: Installments paid in current year (13,017) (13,017) (12,081) (12,064)
Payable (refund) for prior year - - 17 -
Current income tax liability 834 834 404 404
18. Provisions2018 $’000 2017 $’000
Consolidated Parent Consolidated Parent
Employee entitlements 17,055 16,943 16,394 16,231
Lease make good of premises 229 229 235 235
Director development 185 185 196 196
Total provisions 17,469 17,357 16,825 16,662
2018 $’000 2017 $’000
Consolidated Parent Consolidated Parent
MOVEMENT IN EMPLOYEE ENTITLEMENTS PROVISION
Opening balance 16,394 16,231 14,367 14,196
Less: Paid (5,686) (5,624) (5,153) (5,057)
Liability increase (decrease) 6,347 6,336 7,180 7,092
Closing balance 17,055 16,943 16,394 16,231
2018 $’000 2017 $’000
Consolidated Parent Consolidated Parent
MOVEMENT IN LEASE MAKE GOOD OF PREMISES PROVISIONS
Opening balance 235 235 163 163
Liability increase (6) (6) 72 72
Closing balance 229 229 235 235
2018 $’000 2017 $’000
Consolidated Parent Consolidated Parent
MOVEMENT IN DIRECTOR DEVELOPMENT PROVISION
Opening balance 196 196 217 217
Less: Paid (11) (11) (57) (57)
Liability increase - - 36 36
Closing balance 185 185 196 196

51Annual Report and Sustainability Update 2017-2018
2018 $’000 2017 $’000
Consolidated Parent Consolidated Parent
MOVEMENT IN OTHER PROVISIONS
Opening balance - - 200 200
Less: Paid - - 200 200
Closing balance - - - -
Employee entitlements: The rates applied to give effect to the discount of cash flows were 1.910%-2.635% (2017: 1.605%-2.740%). The latest annual CPI rate available was used – March 2018 1.9% (March 2017: 2.1%).Lease make good: The rates applied to give effect to the discount of cash flows were 1.970%-1.985% (2017 1.605%-1.900%).
19. Subordinated debt2018 $’000 2017 $’000
Consolidated Parent Consolidated Parent
Subordinated debt 20,000 20,000 - -
Accrued interest 64 64 - -
Total subordinated debt 20,064 20,064 - -
Teachers Mutual Bank Limited issued $20m of subordinated notes on the 7th September 2017. The notes have a term of 10 years and mature on the 7th September 2027.
20. Capital reserve2018 $’000 2017 $’000
Consolidated Parent Consolidated Parent
Opening balance 698 698 626 626
Transfer from retained earnings on share redemptions 48 48 72 72
Total capital reserve 746 746 698 698
The capital reserve represents the value of redeemable preference shares redeemed since 1 July 1999. This is the value of these shares paid to members and the balance of the account represents the amount of profit appropriated to the account. Share redemptions must be funded from profits.
21. General reserve for credit losses2018 $’000 2017 $’000
Consolidated Parent Consolidated Parent
Opening balance 13,007 13,007 9,894 9,894
Increase (decrease) transfer from retained earnings 761 761 3,113 3,113
Total general reserve for credit losses 13,768 13,768 13,007 13,007
This note should be read in conjunction with Note 1d.
22. Cash flow hedge reserve2018 $’000 2017 $’000
Consolidated Parent Consolidated Parent
Opening balance (1,062) (1,062) (9,605) (9,605)
Increase (decrease) transfer from retained earnings 1,360 1,360 8,543 8,543
Total cash flow hedge reserve 298 298 (1,062) (1,062)
The cash flow hedge reserve represents fair value gains and losses on the effective portion of cash flow hedges. Cumulative deferred gains or losses on hedges are recognised as profits or losses when the hedged transactions meet the requirements described in accounting policy Note 1j.

52 Teachers Mutual Bank Limited
Financial Statements
23. Financial risk management objectives and policies
OverviewThe Group applies an enterprise risk management framework to development and implementation strategies, policies, procedures and controls to manage the Group’s risk. The risks that the Group has exposure to include, but are not limited to:
• Market risk
» Interest Rate Risk
» Equity investments
» Liquidity risk
• Credit risk
» Lending
» Investing
• Operational risk
GovernanceThe Board has overall responsibility for the establishment and oversight of the Group’s enterprise risk management framework. This responsibility includes approval of the framework, setting risk appetite and strategy, driving appropriate risk culture, monitoring and managing within the stated appetite, aligning policies and processes with appetite and ensuring that sufficient resources are dedicated to risk management. The Board has established a governance framework that identifies, manages and reports on risk. This manifests as a three lines of assurance model with business units and management as the first line, risk management and compliance functions as the second line, with internal audit, external audit and the respective Board subcommittees as the third line.
The Board has established an Audit Committee and a Risk and Compliance Committee to oversee financial reporting and the effectiveness of audits and the management of risk and the program of compliance. The Committees are required to devote time and expertise to these areas over and above the time prescribed in scheduled Board meetings.
The Audit Committee assists the Board by:
• Providing reasonable assurance to the Board that core business goals and objectives are being achieved in an effective and efficient manner, within an appropriate framework of governance, risk management and internal control;
• Overseeing the integrity and quality of the Group’s financial reports and statements, including financial information provided to regulators and members;
• Monitoring the adequacy, integrity and effectiveness of the internal control environment and risk management process;
• Monitoring the effectiveness of the internal audit functions;
• Monitoring the effectiveness of the external audit functions; and
• Reviewing the processes established by management to ensure the requirements of APRA’s Prudential Standards and the Corporations Act are being adhered to.
The Risk and Compliance Committee assists the Board by:
• Providing reasonable assurance to the Board that core business goals and objectives are being achieved in an effective and efficient manner, within an appropriate framework of governance, risk management and internal control;
• Monitoring the adequacy, integrity and effectiveness of the internal control environment and risk management process;
• Reviewing the processes established by management to ensure the requirements of APRA’s Prudential Standards and the Corporations Act are being adhered to; and
• Monitoring compliance with all other internal, regulatory, prudential, legal, adopted industry and ethical requirements and standards.
The Board has established a Large Exposures Committee which reviews all proposals that could expose the Group to a significant lending or investing credit risk.
The Group has an Assets and Liability Committee, comprising Management, to manage the financial risk of the Group. This committee makes policy recommendations to the Board, implements strategy and monitors compliance regarding:
• market risk in relation to interest rate risk and liquidity risk;
• credit risk in relation to investment risk;
• profitability;
• capital management; and
• growth.
Market riskInterest rate riskThe Group is not exposed to currency and other price risk. The Group does not trade the financial instruments it holds. The Group is exposed to interest rate risk in the banking book arising from changes in market interest rates.
The Group’s policy objective is to maintain a balanced “on book” hedging strategy by ensuring that product repricing gaps between assets and liabilities are not excessive. As member demand and competition across the product set may not always allow the achievement of a balanced “on book” position, the Board has approved a derivative policy to ensure appropriate use of interest rate swaps. The Group uses a number of techniques to measure and monitor interest rate risk, which include:
Primary:
• Short, medium and long-term forecasts that are regularly updated;
• Monitoring of product totals to targets and the impact on current and future profitability, from likely rate changes; and
• Monthly Earnings at Risk Simulations including projections based on flat rates, yield curve, and upward and downward shock rates.
Secondary:
• Monthly Gap analysis;
• Monthly Sensitivity analysis;
• Monthly Value at Risk analysis; and
• Annual benchmarking against industry.

53Annual Report and Sustainability Update 2017-2018
Earnings at risk (EaR) as a % of capitalThe Bank uses a forecasting model to measure the impact of rate changes on future profitability. A 1% shock up and down to the market yield curve is modelled each month over a rolling 3 year period. The Bank has recently introduced monitoring the exposure to upward movement as well as downward movements. The results are shown in the graph below.
-6%
-5%
-4%
-3%
-2%
-1%
0%
1%
2%
Mar
-13
Jun-
13
Sep
-13
Dec
-13
Mar
-14
Jun-
14
Sep
-14
Dec
-14
Mar
-15
Jun-
15
Sep
-15
Dec
-15
Mar
-16
Jun-
16
Sep
-16
Dec
-16
Mar
-17
Jun-
17
Sep
-17
Dec
-17
Mar
-18
Jun-
18
Risk Appetite Upper ToleranceRolling Year 1 Shock Up Rolling Year 1 Shock DownRolling Year 2 Shock Up Rolling Year 2 Shock DownRolling Year 3 Shock Up Rolling Year 3 Shock Down
1% shock to the market yield curve with corresponding expected changes to product rates.
Value at risk (VaR) as a % of capitalValue at risk (VaR) measures the risk of changes in value of financial assets and liabilities associated with changes in market rates for a given time period of 250 working days, and with a given confidence level of 99%. This measure represents the maximum change as a % of capital of the Bank.
0.0%
0.5%
1.0%
1.5%
2.0%
2.5%
3.0%
3.5%
Apr
-12
Jul-1
2
Oct
-12
Jan-
13
Apr
-13
Jul-1
3
Oct
-13
Jan-
14
Apr
-14
Jul-1
4
Oct
-14
Jan-
15
Apr
-15
Jul-1
5
Oct
-15
Jan-
16
Apr
-16
Jul-1
6
Oct
-16
Jan-
17
Apr
-17
Jul-1
7
Oct
-17
Jan-
18
Apr
-18
VaR - as a % of Capital Tolerance Appetite
99% confidence interval, 20-day holding period, 250-day observation period. Note: Note: A change in methodology was approved effective from April 2015 for sensitivity reporting to treat only rate-locked loans approved not advanced (LANA) as an exposure whereas previously all LANA was treated as an exposure. This change affects Value at Risk and Sensitivity measures.
The Group combines cash flows into buckets based on the expected repricing periods. Consideration is given for both operational and competitive constraints that may differ from the contractual dates as this better reflects the risk in the portfolio.
The level of mismatch on the banking book is set out in Note 25. Note 27 displays the period that each asset and liability will reprice as at the balance date.
Market risk – equity investmentsThe Group invests in entities established to provide services such as treasury, transactions processing and settlement, and travel services where specialisation demands that quality staff and systems are secured from a single entity. Details of these investments are set out in Note 9.

54 Teachers Mutual Bank Limited
Financial Statements
Liquidity riskLiquidity risk is the risk that a financial institution is unable to meet its payment obligations as they fall due, including repaying depositors or maturing wholesale debt, or has insufficient capacity to fund increases in assets. Board policies require the maintenance of adequate cash reserves and committed credit facilities to meet the member withdrawal demands and other creditor commitments when requested, as well as appropriate forecasting and stress testing procedures.
The Group manages liquidity risk by:
• Continuously monitoring actual daily cash flows and longer-term forecasted cash flows;
• Monitoring the maturity profiles of financial assets and liabilities;
• Maintaining adequate reserves, liquidity support facilities and reserve borrowing facilities;
• Monitoring the prudential liquidity ratio daily;
• Holding repo-eligible securities that may be used as collateral when borrowing from the Reserve Bank of Australia; and
• Maintaining a securitisation trust to hold mortgage rights that may be provided as collateral should the Group borrow from the Reserve Bank of Australia.
The Group has set out the maturity profile of the financial liabilities in Note 25, based on the contractual repayment terms.
The Parent is subject to the minimum liquidity holdings approach under Prudential Standard APS 210 and as such is not required to adopt the liquidity coverage ratio or net stable funding ratio measures. The Parent is required to maintain a minimum of 9% of total adjusted liabilities as liquid assets capable of being converted to cash within 48 hours. The Parent’s risk appetite is to maintain at least 11% of funds as liquid assets to maintain adequate funds to meet member withdrawal requests. The ratio is calculated daily. Should the liquidity ratio fall below this level, Management and Board have policies and procedures in place to address the matter and ensure that liquid funds are obtained from new deposits either from Authorised Deposit-taking Institutions (ADIs), retail and wholesale depositors, or borrowing facilities available. Note 30 describes the borrowing facilities available as at the balance date. The Parent also maintains a self-securitisation capability. Note 35 details the balance of loans securitised to create repo-eligible securities.
“Total Adjusted Liabilities” for the purpose of Liquidity measurement is defined as total on-statement of financial position liabilities and irrevocable commitments.
2018 2017
As at 30 June 13.50% 15.94%
Average for the year 16.42% 14.89%
Minimum during the year 13.36% 13.37%
Total adjusted liabilities 7,155,043,337 6,764,288,066
Credit riskThe credit risk of a financial institution is the risk that customers, members, financial institutions or other counterparties will be unable to meet their obligations to the institution resulting in financial loss. Credit risk arises principally from the Group’s loan and investment assets that are managed using the Board-approved credit risk management framework.
Credit risk – lendingCarrying value is the value on the statement of financial position. Maximum exposure is the value on the statement of financial position plus undrawn facilities consisting of loans approved not advanced, redraw facilities, overdraft facilities and credit card limits. The details are shown in Note 28.
The risk of losses on loans is primarily reduced through the nature and quality of security taken. Note 7b describes the nature of the security held against the loans as at the balance date.
All loans and facilities are within Australia. Geographic distribution is detailed in Note 7c.
Concentrations are described in Note 7c. The Group has a concentration in retail lending to members who are predominantly employees in the Australian education sector and their families. This concentration is considered acceptable on the basis that the Group was formed to service these members, the industry is an essential and stable industry and employment concentration is not restricted to one employer. Should members leave the sector the loans continue and other employment opportunities are available to the members to facilitate the repayment of the loans.
Credit risk is managed through a structured framework of systems and controls including:
• Documented credit risk – lending principles that are disseminated to all staff involved in the lending process;
• Documented policies;
• Documented processes for approving and managing lending based on delegations; and
• A series of management reports detailing industry, geographic and Loan to Value Ratio (LVR) concentrations, along with monitoring non-performing lending.
Documented policies have been endorsed by the Board to ensure that loans are only made to members who are capable of meeting loan repayments.

55Annual Report and Sustainability Update 2017-2018
Total provision/total loans and bad debts written off/total loans
0.00%
0.02%
0.04%
0.06%
0.08%
0.10%
0.12%
2014 2015 2016 2017 2018
Total Provision / Total Loans Bad Debts Written-o� / Total loans
Collateral securing loansA sizeable portion of the loan book is secured against residential property in Australia. The Group is therefore exposed to the risk of reduction of the LVR should residential property valuations be subject to a decline.
Performance of the Mortgage Secured portfolio is managed and monitored against the proportion of loan balances in arrears.
Percentage of mortgage portfolio in arrears
0.00%
0.10%
0.20%
0.30%
0.40%
0.50%
0.60%
0.70%
Jun-
14
Jun-
15
Jun-
16
Jun-
17
Jun-
18
Credit risk – investingThe Group maintains a treasury credit risk policy to limit risk associated with the investment of funds. This policy requires that all high-quality liquid investments eligible for inclusion in the regulatory liquidity calculation meet APRA’s investment grade rating criteria. Limits are applied across individual counter party, credit grading class and tenor dimensions. Any individual counterparty credit exposure must not exceed 50% of capital. Internal analysis must be conducted before the Asset and Liability Committee (ALCo) approves individual credit limits.
The exposure values associated with each credit quality step are as follows*:
2018
Investments with: No. of institutions Carrying value Past due value Provision
ADIs-rated A-1+ to A-1 (short-term) 7 185,450,506 - -
ADIs-rated A-2 or P-2 (short-term) 12 270,883,395 - -
ADIs-rated A-3 or P-3 (short-term) 3 36,754,141 - -
ADIs-rated AA+ to AA- (long-term) 4 235,211,973 - -
ADIs-rated A+ to A- (long-term) 5 175,578,215 - -
ADIs-rated BBB+ to BBB or Baa1 (long term) 6 99,205,945 - -
Total 1,003,084,175 - -

56 Teachers Mutual Bank Limited
Financial Statements
2017
Investments with: No. of institutions Carrying value Past due value Provision
ADIs-rated A-1+ to A-1 (short-term) 5 337,760,341 - -
ADIs-rated A-2 or P-2 (short-term) 13 375,754,093 - -
ADIs-rated A-3 or P-3 (short-term) 3 34,578,397 - -
ADIs-rated AA+ to AA- (long term) 4 170,000,000 - -
ADIs-rated A+ to A- (long-term) 5 111,561,697 - -
ADIs-rated BBB+ to BBB (long-term) 6 99,600,444 - -
Total 1,129,254,972 - -
*Table indicates Standard and Poor’s (Australia) Pty Ltd equivalent rating as determined by APRA’s credit rating grade tables. Exposures may be rated by Standard and Poor’s (Australia) Pty Ltd, Moody’s Investors Service Incorporated or Fitch Ratings Ltd.
Operational riskOperational risk is the risk of loss resulting from inadequate or failed processes, personnel, technology and infrastructure, and from external factors other than credit, market and liquidity risks. Operational risk in the Group relates mainly to legal compliance, business continuity, data infrastructure, outsourced services failures, fraud and employee errors.
The Group’s objective is to manage operational risk so as to balance the avoidance of financial loss through the application of controls while avoiding procedures that inhibit innovation and creativity. These controls are managed through the application of polices, processes and systems to minimise the likelihood and impact of risk events. Some of these controls are:
• Segregation of duties;
• Documentation of policies and procedures, employee job descriptions and responsibilities;
• Whistleblowing policies;
• Effective dispute resolution procedures;
• Effective insurance arrangements; and
• Contingency plans for dealing with loss of functionality of systems, premises or data/systems protection.
Operational risk managementThe Group has implemented an Operational Risk Management Framework that includes risk identification, measurement, evaluation, monitoring and reporting processes where the Board and senior management identify key risks in a “top down” approach and business units identify risks in a “bottom up” approach. These risks are then ranked by loss effect and likelihood after considering risk controls including insurances, with key risk indicators being assigned and monitored. A loss register compares experience with the original assessments. Projects are also subject to risk analysis at all stages of the project lifecycle and are actively managed.
The Operational Risk Management Framework is underpinned by a culture of individual accountability and responsibility based on the three lines of assurance model, that is represented at an operational level through business units and management as a first line, through designated Risk management and Compliance functions as a second line, and as a third line through Internal Audit, External Audit and the respective Board subcommittees.
ComplianceThe Group has a compliance program, requiring regular reviews of policies, procedures and reporting to ensure compliance with legal requirements, the code of ethics and Prudential Standards.
FraudThe Group has systems, polices and processes in place that are considered to be robust enough to prevent material fraud.

57Annual Report and Sustainability Update 2017-2018
Outsourcing arrangementsThe Group maintains arrangements with other organisations to facilitate the supply of services to members and customers. All material outsourcing arrangements are subject to a due diligence review and are approved by the Board and are subject to ongoing monitoring.
Cuscal LimitedCuscal Limited (Cuscal) is an ADI that supplies settlement, transaction processing, card, interchange and other services to other organisations including Banks, Credit Unions and Building Societies. In relation to the Group, Cuscal:
i. Supplies to the Parent rights to issue Visa cards;
ii. Supplies Visa cards;
iii. Provides settlement services for member cheques, Electronic Funds Transfer (EFT), EFTPOS, ATM, Direct Entry, BPAY, NPP, Mobile Banking and Visa card transactions and real-time gross settlement system (RTGS) payments;
iv. Operates the switching computer used to link Visa cards operated through RediATMs and other approved ATM providers to the Parent’s computer systems; and
v. Provides RediATM monitoring and replenishment services for the Parent’s RediATMs.
Ultradata Australia Pty LtdUltradata Australia Pty Limited provides and maintains the share registry and core banking software utilised by the Parent.
Capital managementCapital levels are managed to ensure compliance with APRA’s requirements. Those requirements encompass a framework of three pillars:
• Pillar 1 – Minimum capital requirements, including a specific capital charge for operational risk;
• Pillar 2 – Enhanced supervision of capital management including the application of an internal capital adequacy assessment process (ICAAP).
• Pillar 3 – More extensive disclosure requirements.
Pillar 1Capital is measured as prescribed by APRA’s prudential standards. These standards act to deliver capital requirements in respect of credit risk, market risk and operational risk.
Credit riskCredit risk is measured using the Standardised Approach defined in Prudential Standard APS112. The capital charge attached to each asset is based on weightings prescribed in Australian Prudential Standards as detailed in the table below.
2018
ON-STATEMENT OF FINANCIAL POSITION EXPOSURESCarrying
valueRisk weighting/
Credit risk mitigationRisk weighted
amount
Cash 1,310,021 - -
Deposits in highly rated ADIs 458,457,648 20% 91,691,530
Deposits in less highly rated ADIs 544,626,527 50% 272,313,263
Standard loans secured against eligible residential mortgages up to 80% LVR (up to 90% with Lenders Mortgage Insurance)
4,965,426,595 35% 1,737,899,308
Standard loans secured against eligible residential mortgages over 80% LVR
770,092,818 50-75% 388,221,728
Other standard mortgage loans 23,258,810 100% 23,258,810
Non-standard mortgage loans 22,857,297 35-100% 15,001,643
Other loans 208,446,849 0-100% 208,344,235
Other assets 46,466,667 100% 46,466,667
Total 7,040,943,232 2,783,197,184

58 Teachers Mutual Bank Limited
Financial Statements
2018
NON-MARKET RELATED OFF-STATEMENT OF FINANCIAL POSITION EXPOSURES
Notional principal amount
Credit conversion
factor
Credit equivalent
amount
Risk weighting
Risk weighted
amount
Loans approved and not advanced 207,684,905 100% 207,684,905 35%-100% 98,780,443
Redraws available 423,978,513 50% 211,989,256 35%-100% 77,292,900
Guarantees 100 100% 100 100% 100
Unused revolving credit limits 307,142,063 - - - -
Possible contribution to CUFSS Limited
100,000,000 - - - -
Total 1,038,805,581 419,674,261 176,073,443
MARKET RELATED OFF-STATEMENT OF FINANCIAL POSITION EXPOSURES
Notional principal amount
Credit conversion
factor
Potential future
exposure
Current exposure
Credit equivalent
amount
Risk weighted
amount
Residual maturity 1 year or less 261,200,000 0% - 149,209 149,209 29,842
Residual maturity > 1 year to 5 years 277,000,000 1% 1,385,000 772,033 2,157,033 431,406
Residual maturity > 5 years - 1.5% - - - -
Total 538,200,000 1,385,000 921,242 2,306,242 461,248
Total weighted credit risk exposures 2,959,731,875
Market riskThe Group is not required to allocate capital against market risk as no trading activity is undertaken and the Standardised Approach does not result in any allocation against interest rate risk in the banking book.
Operational riskOperational risk is measured using the Standardised Approach defined in Prudential Standard APS114. The capital charge is based upon portfolio balances and revenue streams with scaling and risk factors applied to reflect APRA’s assessment of the particular risk profiles.
OPERATIONAL RISK CAPITAL REQUIREMENT FOR RETAIL BANKING
31-Dec-15 30-Jun-16 31-Dec-16 30-Jun-17 31-Dec-17 30-Jun-18
Total gross outstanding loans and advances for retail banking
4,432,278,852 4,595,067,248 5,056,181,646 5,477,914,787 5,580,317,615 5,993,575,816
- multiplied by 3.5% scaling factor
155,129,760 160,827,354 176,966,358 191,727,018 195,311,117 209,775,154
- multiplied by 12% risk factor
18,615,571 19,299,282 21,235,963 23,007,242 23,437,334 25,173,018
Average of the 6 half-year results = Total operational risk capital requirement for retail banking 21,794,735
OPERATIONAL RISK CAPITAL REQUIREMENT FOR COMMERCIAL BANKING
Total gross outstanding loans and advances for commercial banking
852,017,522 853,625,849 903,383,637 1,078,074,273 1,218,730,671 964,941,406
- multiplied by 3.5% scaling factor
29,820,613 29,876,905 31,618,427 37,732,600 42,655,574 33,772,949
- multiplied by 15% risk factor
4,473,092 4,481,536 4,742,764 5,659,890 6,398,336 5,065,942
Average of the 6 half-year results = Total operational risk capital requirement for commercial banking 5,136,927
OPERATIONAL RISK CAPITAL REQUIREMENT FOR ALL OTHER ACTIVITY
Adjusted gross income 2,835,641 3,939,191 2,694,694 4,352,198 2,997,841 4,559,025
- multiplied by 18% risk factor
510,415 709,054 485,045 783,396 539,611 820,625

59Annual Report and Sustainability Update 2017-2018
OPERATIONAL RISK CAPITAL REQUIREMENT FOR OTHER ACTIVITIES
Average of the 3 annual results = Total operational risk capital requirement for all other activity 1,282,715
Total operational risk capital requirement 28,214,377
Risk weighted asset (RWA) equivalent amount for operational risk capital requirement = Operational risk capital * 12.50 352,679,716
Total credit and operational risk weighted 3,312,411,591
Capital resources• Tier 1 capital
» The majority of Tier 1 capital consists of Common Equity Tier 1 Capital, which is our retained earnings.
• Tier 2 capital
» Tier 2 capital consists of capital instruments that combine the features of debt and equity in that they are structured as debt instruments, but exhibit some of the loss absorption and funding flexibility features of equity. There are a number of criteria that capital instruments must meet for inclusion in Tier 2 capital resources as set down by Australian Prudential Standards. Tier 2 capital generally comprises a reserve for credit losses and subordinated debt.
A minimum capital ratio of 8% is required to be maintained at all times. Our policy requires reporting to the Board if the capital ratio falls below 14%.
The capital ratio can be affected by growth in assets relative to growth in reserves and by changes in the mix of assets. The Group manages capital through reviewing the ratio monthly and monitoring major movements in asset levels. Further, a 3 year capital projection is maintained to assess how strategic decisions or trends may impact on the level of capital. A stress test based on various asset growth and profitability assumptions is conducted annually.
CAPITAL IN THE PARENT IS MADE UP AS FOLLOWS: 2018 2017
Tier 1 Common Equity 503,869,268 473,477,550
Less: Prescribed deductions (19,172,023) (18,575,052)
Tier 1 capital 484,697,245 454,902,498
Tier 2 Reserve for credit losses 13,767,531 13,006,919
Tier 2 Subordinated debt 20,000,000 -
Total Tier 2 capital 33,767,531 13,006,919
Total capital 518,464,776 467,909,417
THE CAPITAL RATIO AS AT THE END OF THE FINANCIAL YEAR OVER THE PAST 5 YEARS IS AS FOLLOWS:
2018 2017 2016 2015 2014
15.65% 15.09% 15.85% 15.74% 15.72%
Pillar 2Pillar 2 of the Prudential Framework relates to any risk factor to which an ADI might be exposed that is not included in Pillar 1.
These risks fall into 3 categories:
• Pillar 1 risks not fully captured by the Pillar 1 process, for example credit concentration risk.
• Inherent risks not covered by Pillar 1, including:
» interest rate risk in the banking book;
» liquidity risk; and
» strategic risk.
• Risks arising from external factors such as business cycles effects and the macroeconomic environment.
The Group documents, analyses and sets its own internal capital requirements to meet Pillar 2 risks. The methodologies used to assess the required capital are a combination of quantitative and qualitative assessments and by their nature are based on a degree of collective subjective judgement of senior management and the Board.
Risks requiring upliftThe following risks were assessed as being of sufficient significance to require additional capital support over and above the Pillar 1 capital requirement (uplift):
• Strategic Risk
» Business environment risk
» Business opportunities
• Credit Risk
» Investing – Counterparty default risk
• Operational Risk
• Market Risk
» Liquidity – Lack of diversification of funding sources
» Interest rate risk in the banking book
An additional 2% capital was determined to be adequate to cover these risks.

60 Teachers Mutual Bank Limited
Financial Statements
Internal capital adequacy managementThe Group manages its internal capital levels for both current and future activities through a combination of committees. The outputs of the individual committees are reviewed by the Board in its capacity as the primary governing body. The capital required for any change in the Group’s forecasts for asset growth or unforeseen circumstances are assessed by the Board. The capital resource model is then produced for further Board consideration. Management then updates the forecast capital resources models produced and the impact upon the overall capital position of the Group is reassessed.
Contingency buffer for business cycle volatilityBased on historical fluctuations in capital the Group incorporates a contingency buffer of 4% when targeting minimum levels of capital and when preparing its Capital Management Plan to cover volatility in the risks identified above.
2018
RWA Minimum capital required
% Equivalent of RWA
Credit risk 2,959,731,875 236,778,550 8.00%
Operational risk 352,679,716 28,214,377 8.00%
Total 3,312,411,591 264,992,927 8.00%
Pillar 2 uplift capital 66,248,232 2.00%
ICAAP capital required 331,241,159 10.00%
Buffer for business cycle volatility 132,496,464 4.00%
Capital available for future growth and product and service development 54,727,153 1.65%
Risk-based capital ratio 518,464,776 15.65%
Common Equity Tier 1 capital ratio 484,697,245 14.63%
Tier 1 capital ratio 484,697,245 14.63%
Tier 2 capital ratio 33,767,531 1.02%
Categorisation of capital
237 28
66
132 55
$- $100 $200 $300 $400 $500 $600
Pillar 1
Pillar 2
Total capital
Millions
Operational risk Pillar 2 uplift capital Management bu�er Capital available for future growth and product and service development
Credit risk

61Annual Report and Sustainability Update 2017-2018
24. Categories of financial instruments
a. The following information classifies the financial instruments into measurement classes
Note(s) 2018 $’000 2017 $’000
FINANCIAL ASSETS – CARRIED AT AMORTISED COST
Consolidated Parent Consolidated Parent
Cash on hand and deposits at call 70,884 70,884 146,758 146,758
Receivables from financial institutions 4 933,510 933,510 984,279 984,279
Receivables 6 5,450 5,080 12,085 11,579
Loans and advances to members 7 & 8 5,997,831 5,997,831 5,480,497 5,480,497
Total carried at amortised cost 7,007,675 7,007,305 6,623,619 6,623,113
Cash flow hedge derivative assets – carried at fair value 5 818 818 1,338 1,338
Available for sale investment – carried at fair value 9 5,145 5,145 5,145 5,145
Investments in controlled entities – carried at fair value 10 - 147 - 147
Total financial assets 7,013,638 7,013,415 6,630,102 6,629,743
FINANCIAL LIABILITIES – CARRIED AT AMORTISED COST
Borrowings - - - -
Wholesale sector funding 14 670,879 670,879 680,261 680,261
Retail deposits 15 5,812,848 5,813,647 5,479,060 5,479,874
Creditors, accruals and settlement accounts 16 19,839 19,480 9,794 9,349
Subordinated Debt 19 20,064 20,064 - -
Total carried at amortised cost 6,523,630 6,524,070 6,169,115 6,169,484
Cash flow hedge derivative liabilities – carried at fair value 5 519 519 2,645 2,645
Total financial liabilities 6,524,149 6,524,589 6,171,760 6,172,129
b. Assets measured at fair valueConsolidated 2018 $’000 Level 1 Level 2 Level 3
Cash flow hedge derivatives 818 - 818 -
Available for sale investments 5,145 - - 5,145
Total 5,963 - 818 5,145
Parent 2018 $’000 Level 1 Level 2 Level 3
Cash flow hedge derivatives 818 - 818 -
Available for sale investments 5,145 - - 5,145
Investments in controlled entities 147 - - 147
Total 6,110 - 818 5,292

62 Teachers Mutual Bank Limited
Financial Statements
Consolidated 2017 $’000 Level 1 Level 2 Level 3
Cash flow hedge derivatives 1,338 - 1,338 -
Available for sale investments 5,145 - - 5,145
Total 6,483 - 1,338 5,145
Parent 2017 $’000 Level 1 Level 2 Level 3
Cash flow hedge derivatives 1,338 - 1,338 -
Available for sale investments 5,145 - - 5,145
Investments in controlled entities 147 - - 147
Total 6,630 - 1,338 5,292
The fair value hierarchy levels are outlined in Note 1x.
Cash flow hedge derivativesThe fair value of derivative financial instruments (interest rate swaps) are calculated using discounted cash flow models using interest rates derived from market interest rates that match the remaining term of the swaps. Thus the basis for determining the fair value of derivative financial instruments is classified as Level 2.
Available for sale investments and investments in controlled entitiesDue to the lack of publicly available data on the transfer of these shares, the Group has measured the shares at cost and is classified as Level 3.
25. Maturity profile of financial assets and liabilitiesMonetary assets and liabilities have differing maturity profiles depending on the contractual term and in the case of loans the repayment amount and frequency. The table below shows the period in which different monetary assets and liabilities held will mature and be eligible for renegotiation or withdrawal. In the case of loans, the table shows the period over which the principal outstanding will be repaid based on the remaining period to the repayment date assuming contractual repayments are maintained and is subject to change in the event that current repayment conditions are varied. Financial assets and liabilities are stated at undiscounted values (including future interest expected to be earned or paid), and will not equate to values in the statement of financial position.
CONSOLIDATED
2018 Assets $’000 Within 1 month
> 1 to 3 months
> 3 to 12 months
> 1 to 5 years
> 5 years
No maturity
Total Statement of financial
position
Cash on hand and deposits at call
18,851 - - 52,033 - - 70,884 70,884
Receivables from financial institutions
143,627 210,130 298,859 280,894 - - 933,510 933,510
Receivables 2,583 1,399 5,507 20,417 - - 29,906 5,450
Loans and advances to members
47,981 92,498 410,189 1,625,302 7,541,406 - 9,717,376 5,997,831
Available for sale investments
- - - - - 5,145 5,145 5,145
Cash flow hedge derivative asset
883 170 709 266 - - 2,028 818
Total financial assets 213,925 304,197 715,264 1,978,912 7,541,406 5,145 10,758,849 7,013,638
2018 Liabilities $’000
Borrowings - - - - - - - -
Wholesale sector funding 140,355 81,436 220,901 240,284 - - 682,976 670,879
Subordinated debt - - - - 24,642 - 24,642 20,064
Retail deposits 2,311,293 464,033 2,110,404 960,975 - 2,274 5,848,979 5,812,848
Creditors, accruals and settlement accounts
19,839 - - - - - 19,839 19,839
Cash flow hedge derivatives liabilities
529 50 191 233 - - 1,003 519
Total financial liabilities 2,472,016 545,519 2,331,496 1,201,492 24,642 2,274 6,577,439 6,524,149

63Annual Report and Sustainability Update 2017-2018
PARENT
2018 Assets $’000 Within 1 month
> 1 to 3 months
> 3 to 12 months
> 1 to 5 years
> 5 years
No maturity
Total Statement of financial
position
Cash on hand and deposits at call
18,851 - - 52,033 - - 70,884 70,884
Receivables from financial institutions
143,627 210,130 298,859 280,894 - - 933,510 933,510
Receivables 2,213 1,399 5,507 20,417 - - 29,536 5,080
Loans and advances to members
47,981 92,498 410,189 1,625,302 7,541,406 - 9,717,376 5,997,831
Available for sale investments
- - - - - 5,145 5,145 5,145
Investments in controlled entities
- - - - - 147 147 147
Cash flow hedge derivatives asset
883 170 709 266 - - 2,028 818
Total financial assets 213,555 304,197 715,264 1,978,912 7,541,406 5,292 10,758,626 7,013,415
2018 Liabilities $’000
Borrowings - - - - - - - -
Wholesale sector funding 140,355 81,436 220,901 240,284 - - 682,976 670,879
Subordinated debt - - - - 24,642 - 24,642 20,064
Retail deposits 2,312,091 464,034 2,110,404 960,975 - 2,274 5,849,778 5,813,647
Creditors, accruals and settlement accounts
19,480 - - - - - 19,480 19,480
Cash flow hedge derivative liabilities
529 50 191 233 - - 1,003 519
Total financial liabilities 2,472,455 545,520 2,331,496 1,201,492 24,642 2,274 6,577,879 6,524,589
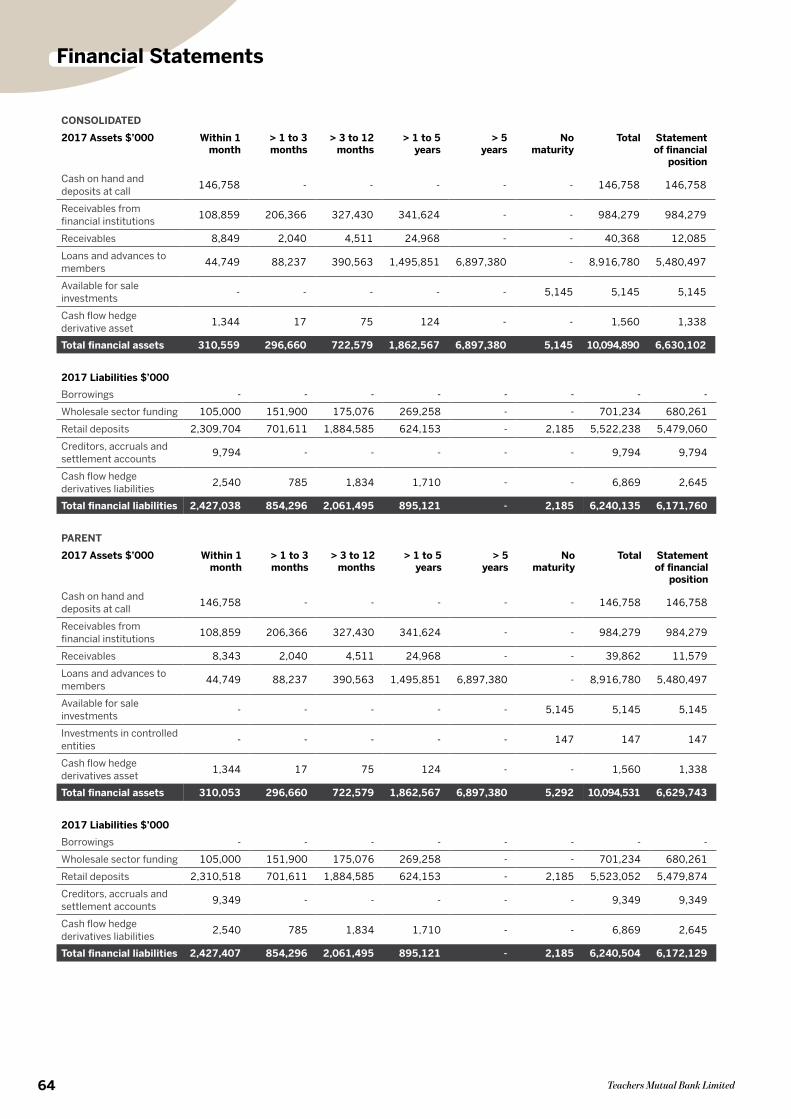
64 Teachers Mutual Bank Limited
Financial Statements
CONSOLIDATED
2017 Assets $’000 Within 1 month
> 1 to 3 months
> 3 to 12 months
> 1 to 5 years
> 5 years
No maturity
Total Statement of financial
position
Cash on hand and deposits at call
146,758 - - - - - 146,758 146,758
Receivables from financial institutions
108,859 206,366 327,430 341,624 - - 984,279 984,279
Receivables 8,849 2,040 4,511 24,968 - - 40,368 12,085
Loans and advances to members
44,749 88,237 390,563 1,495,851 6,897,380 - 8,916,780 5,480,497
Available for sale investments
- - - - - 5,145 5,145 5,145
Cash flow hedge derivative asset
1,344 17 75 124 - - 1,560 1,338
Total financial assets 310,559 296,660 722,579 1,862,567 6,897,380 5,145 10,094,890 6,630,102
2017 Liabilities $’000
Borrowings - - - - - - - -
Wholesale sector funding 105,000 151,900 175,076 269,258 - - 701,234 680,261
Retail deposits 2,309,704 701,611 1,884,585 624,153 - 2,185 5,522,238 5,479,060
Creditors, accruals and settlement accounts
9,794 - - - - - 9,794 9,794
Cash flow hedge derivatives liabilities
2,540 785 1,834 1,710 - - 6,869 2,645
Total financial liabilities 2,427,038 854,296 2,061,495 895,121 - 2,185 6,240,135 6,171,760
PARENT
2017 Assets $’000 Within 1 month
> 1 to 3 months
> 3 to 12 months
> 1 to 5 years
> 5 years
No maturity
Total Statement of financial
position
Cash on hand and deposits at call
146,758 - - - - - 146,758 146,758
Receivables from financial institutions
108,859 206,366 327,430 341,624 - - 984,279 984,279
Receivables 8,343 2,040 4,511 24,968 - - 39,862 11,579
Loans and advances to members
44,749 88,237 390,563 1,495,851 6,897,380 - 8,916,780 5,480,497
Available for sale investments
- - - - - 5,145 5,145 5,145
Investments in controlled entities
- - - - - 147 147 147
Cash flow hedge derivatives asset
1,344 17 75 124 - - 1,560 1,338
Total financial assets 310,053 296,660 722,579 1,862,567 6,897,380 5,292 10,094,531 6,629,743
2017 Liabilities $’000
Borrowings - - - - - - - -
Wholesale sector funding 105,000 151,900 175,076 269,258 - - 701,234 680,261
Retail deposits 2,310,518 701,611 1,884,585 624,153 - 2,185 5,523,052 5,479,874
Creditors, accruals and settlement accounts
9,349 - - - - - 9,349 9,349
Cash flow hedge derivatives liabilities
2,540 785 1,834 1,710 - - 6,869 2,645
Total financial liabilities 2,427,407 854,296 2,061,495 895,121 - 2,185 6,240,504 6,172,129

65Annual Report and Sustainability Update 2017-2018
26. Current and non-current maturity profile of financial assets and liabilitiesThis table provides a summary of the current and non current maturity profile of the Group’s financial assets and liabilities. Contractual arrangements are the best representation of minimum repayment amounts on loans, liquid investments and on the member deposits within 12 months. Liquid investments and member deposits are presented on a contractual basis, however it is expected that a large proportion of these balances will roll over. Loan repayments are generally accelerated with members choosing to repay loans earlier. These advance repayments are at the discretion of the members and are not able to be reliably estimated.
CONSOLIDATED
2018 Assets $’000 Within 12 months
After 12 months
Total
Cash on hand and deposits at call 18,851 52,033 70,884
Receivables from financial institutions 652,616 280,894 933,510
Receivables 5,450 - 5,450
Loans and advances to members 289,333 5,703,358 5,992,691
Available for sale investments - 5,145 5,145
Cash flow hedge derivative asset 818 - 818
Total financial assets 967,068 6,041,430 7,008,498
2018 Liabilities $’000
Borrowings - - -
Wholesale sector funding 440,254 230,625 670,879
Subordinated Debt - 20,064 20,064
Retail deposits 4,860,550 952,298 5,812,848
Creditors, accruals and settlement accounts 19,839 - 19,839
Cash flow hedge derivative liabilities 519 - 519
Total financial liabilities 5,321,162 1,202,987 6,524,149
PARENT
2018 Assets $’000 Within 12 months
After 12 months
Total
Cash on hand and deposits at call 18,851 52,033 70,884
Receivables from financial institutions 652,616 280,894 933,510
Receivables 5,080 - 5,080
Loans and advances to members 289,333 5,703,358 5,992,691
Available for sale investments - 5,145 5,145
Investments in controlled entities - 147 147
Cash flow hedge derivatives asset 818 - 818
Total financial assets 966,698 6,041,577 7,008,275
2018 Liabilities $’000
Borrowings - - -
Wholesale sector funding 440,254 230,625 670,879
Subordinated debt - 20,064 20,064
Retail deposits 4,861,349 952,298 5,813,647
Creditors, accruals and settlement accounts 19,480 - 19,480
Cash flow hedge derivatives liabilities 519 - 519
Total financial liabilities 5,321,602 1,202,987 6,524,589

66 Teachers Mutual Bank Limited
Financial Statements
CONSOLIDATED
2017 Assets $’000 Within 12 months
After 12 months
Total
Cash on hand and deposits at call 146,758 - 146,758
Receivables from financial institutions 642,655 341,624 984,279
Receivables 12,085 - 12,085
Loans and advances to members 278,325 5,198,446 5,476,771
Available for sale investments - 5,145 5,145
Cash flow hedge derivative asset 1,338 - 1,338
Total financial assets 1,081,161 5,545,215 6,626,376
2017 Liabilities $’000
Borrowings - - -
Wholesale sector funding 429,473 250,788 680,261
Retail deposits 4,862,617 616,443 5,479,060
Creditors, accruals and settlement accounts 9,794 - 9,794
Cash flow hedge derivative liabilities 2,645 - 2,645
Total financial liabilities 5,304,529 867,231 6,171,760
PARENT
2017 Assets $’000 Within 12 months
After 12 months
Total
Cash on hand and deposits at call 146,758 - 146,758
Receivables from financial institutions 642,655 341,624 984,279
Receivables 11,579 - 11,579
Loans and advances to members 278,325 5,198,446 5,476,771
Available for sale investments - 5,145 5,145
Investments in controlled entities - 147 147
Cash flow hedge derivatives asset 1,338 - 1,338
Total financial assets 1,080,655 5,545,362 6,626,017
2017 Liabilities $’000
Borrowings - - -
Wholesale sector funding 429,473 250,788 680,261
Retail deposits 4,863,431 616,443 5,479,874
Creditors, accruals and settlement accounts 9,349 - 9,349
Cash flow hedge derivatives liabilities 2,645 - 2,645
Total financial liabilities 5,304,898 867,231 6,172,129

67Annual Report and Sustainability Update 2017-2018
27. Interest rate change profile of financial assets and liabilitiesFinancial asset and liability contracts allow interest rates to be amended on maturity (fixed rate loans, term deposits and term investments), or at predefined points in time (medium term notes) or after proper notice is given (loans and savings). The table below reflects the value of funds where interest rates may be altered within prescribed time bands, being the earlier of the contractual repricing date or the maturity date.
CONSOLIDATED
2018 Assets $’000 Within 1 month
> 1 to 3 months
> 3 to 12 months
> 1 to 5 years
Non-interest bearing
Total
Cash on hand and deposits at call
17,541 52,033 - - 1,310 70,884
Receivables from financial institutions
463,075 384,302 86,133 - - 933,510
Receivables - - - - 5,450 5,450
Loans and advances to members
2,769,704 126,470 719,296 2,376,999 222 5,992,691
Available for sale investments
- - - - 5,145 5,145
Cash flow hedge derivatives asset
818 - - - - 818
Total financial assets 3,251,138 562,805 805,429 2,376,999 12,127 7,008,498
2018 Liabilities $’000
Borrowings - - - - - -
Wholesale sector funding 140,229 81,178 218,847 230,625 - 670,879
Subordinated Debt 20,064 20,064
Retail deposits 2,310,966 463,071 2,086,513 950,024 2,274 5,812,848
Creditors, accruals and settlement accounts
- - - - 19,839 19,839
Cash flow hedge derivative liabilities
519 - - - - 519
On-statement of financial position
2,451,714 564,313 2,305,360 1,180,649 22,113 6,524,149
Undrawn loan commitments (see Note 29a, 29b, 29c)
938,806 - - - - 938,806
Total financial liabilities 3,390,520 564,313 2,305,360 1,180,649 22,113 7,462,955

68 Teachers Mutual Bank Limited
Financial Statements
PARENT
2018 Assets $’000 Within 1 month
> 1 to 3 months
> 3 to 12 months
> 1 to 5 years
Non-interest bearing
Total
Cash on hand and deposits at call
17,541 52,033 - - 1,310 70,884
Receivables from financial institutions
463,075 384,302 86,133 - - 933,510
Receivables - - - - 5,080 5,080
Loans and advances to members
2,769,704 126,470 719,296 2,376,999 222 5,992,691
Available for sale investments
- - - - 5,145 5,145
Investments in controlled entities
- - - - 147 147
Cash flow hedge derivative asset
818 - - - - 818
Total financial assets 3,251,138 562,805 805,429 2,376,999 11,904 7,008,275
2018 Liabilities $’000
Borrowings - - - - - -
Wholesale sector funding 140,229 81,178 218,847 230,625 - 670,879
Subordinated Debt 20,064
Retail deposits 2,311,764 463,072 2,086,513 950,024 2,274 5,813,647
Creditors, accruals and settlement accounts
- - - - 19,480 19,480
Cash flow hedge derivative liabilities
519 - - - - 2,645
On-statement of financial position
2,452,512 564,314 2,305,360 1,180,649 21,754 6,524,589
Undrawn loan commitments (see Note 29a, 29b, 29c)
938,806 - - - - 938,806
Total financial liabilities 3,391,318 564,314 2,305,360 1,180,649 21,754 7,463,395
CONSOLIDATED
2017 Assets $’000 Within 1 month
> 1 to 3 months
> 3 to 12 months
> 1 to 5 years
Non-interest bearing
Total
Cash on hand and deposits at call
144,976 - - - 1,782 146,758
Receivables from financial institutions
350,462 389,624 244,193 - - 984,279
Receivables - - - - 12,085 12,085
Loans and advances to members
2,777,255 85,404 596,675 2,017,370 67 5,476,771
Available for sale investments
- - - - 5,145 5,145
Cash flow hedge derivatives asset
1,338 - - - - 1,338
Total financial assets 3,274,031 475,028 840,868 2,017,370 19,079 6,626,376

69Annual Report and Sustainability Update 2017-2018
2017 Liabilities $’000 Within 1 month
> 1 to 3 months
> 3 to 12 months
> 1 to 5 years
Non-interest bearing
Total
Borrowings - - - - - -
Wholesale sector funding 104,899 151,428 173,146 250,788 - 680,261
Retail deposits 2,309,492 698,852 1,854,273 614,258 2,185 5,479,060
Creditors, accruals and settlement accounts
- - - - 9,794 9,794
Cash flow hedge derivative liabilities
2,391 254 - - - 2,645
On-statement of financial position
2,416,782 850,534 2,027,419 865,046 11,979 6,171,760
Undrawn loan commitments (see Note 29a, 29b, 29c)
881,498 - - - - 881,498
Total financial liabilities 3,298,280 850,534 2,027,419 865,046 11,979 7,053,258
PARENT
2017 Assets $’000 Within 1 month
> 1 to 3 months
> 3 to 12 months
> 1 to 5 years
Non-interest bearing
Total
Cash on hand and deposits at call
144,976 - - - 1,782 146,758
Receivables from financial institutions
350,462 389,624 244,193 - - 984,279
Receivables - - - - 11,579 11,579
Loans and advances to members
2,777,255 85,404 596,675 2,017,370 67 5,476,771
Available for sale investments
- - - - 5,145 5,145
Investments in controlled entities
- - - - 147 147
Cash flow hedge derivative asset
1,338 - - - - 1,338
Total financial assets 3,274,031 475,028 840,868 2,017,370 18,720 6,626,017
2017 Liabilities $’000
Borrowings - - - - - -
Wholesale sector funding 104,899 151,428 173,146 250,788 - 680,261
Retail deposits 2,310,306 698,852 1,854,273 614,258 2,185 5,479,874
Creditors, accruals and settlement accounts
- - - - 9,349 9,349
Cash flow hedge derivative liabilities
2,391 254 - - - 2,645
On-statement of financial position
2,417,596 850,534 2,027,419 865,046 11,534 6,172,129
Undrawn loan commitments (see Note 29a, 29b, 29c)
881,498 - - - - 881,498
Total financial liabilities 3,299,094 850,534 2,027,419 865,046 11,534 7,053,627

70 Teachers Mutual Bank Limited
Financial Statements
28. Fair value of financial assets and liabilitiesFair value is required to be disclosed where financial instruments are not reported at fair value in the Statement of Financial Position unless the carrying amount is a reasonable approximation of fair value. Fair values reported below are measured using Level 2 or Level 3 unobservable inputs described at note 1x.
Fair value has been determined on the basis of the present value of expected future cash flows under the terms and conditions of each financial asset and financial liability. Significant assumptions used in determining the cash flows are that the cash flows will be consistent with the contracted cash flows under the respective contracts. The information is only relevant to circumstances at the balance date and will vary depending on the contractual rates applied to each asset and liability, relative to market rates and conditions at the time. No assets are regularly traded by the Group and there is no active market to assess the value of the financial assets and liabilities. The values reported have not been adjusted for the changes in credit ratings of the assets.
CONSOLIDATED PARENT
2018 Assets $’000 Fair value Book value Variance Fair value Book value Variance
Cash on hand and deposits at call
70,884 70,884 - 70,884 70,884 -
Receivables from financial institutions
934,799 933,510 1,289 934,799 933,510 1,289
Receivables 5,450 5,450 - 5,080 5,080 -
Loans and advances to members
5,999,590 5,997,831 1,759 5,999,590 5,997,831 1,759
Available for sale investments
5,145 5,145 - 5,145 5,145 -
Investments in controlled entities
- - - 147 147 -
Cash flow hedge derivative asset
818 818 - 818 818 -
Total financial assets 7,016,686 7,013,638 3,048 7,016,463 7,013,415 3,048
2018 Liabilities $’000
Borrowings - - - - - -
Wholesale sector funding 669,278 670,879 (1,601) 669,278 670,879 (1,601)
Subordinated Debt 20,064 20,064 - 20,064 20,064 -
Retail deposits 5,815,758 5,812,848 2,910 5,816,557 5,813,647 2,910
Creditors, accruals and settlement accounts
19,839 19,839 - 19,480 19,480 -
Cash flow hedge derivative liabilities
519 519 - 519 519 -
Total financial liabilities 6,525,458 6,524,149 1,309 6,525,898 6,524,589 1,309
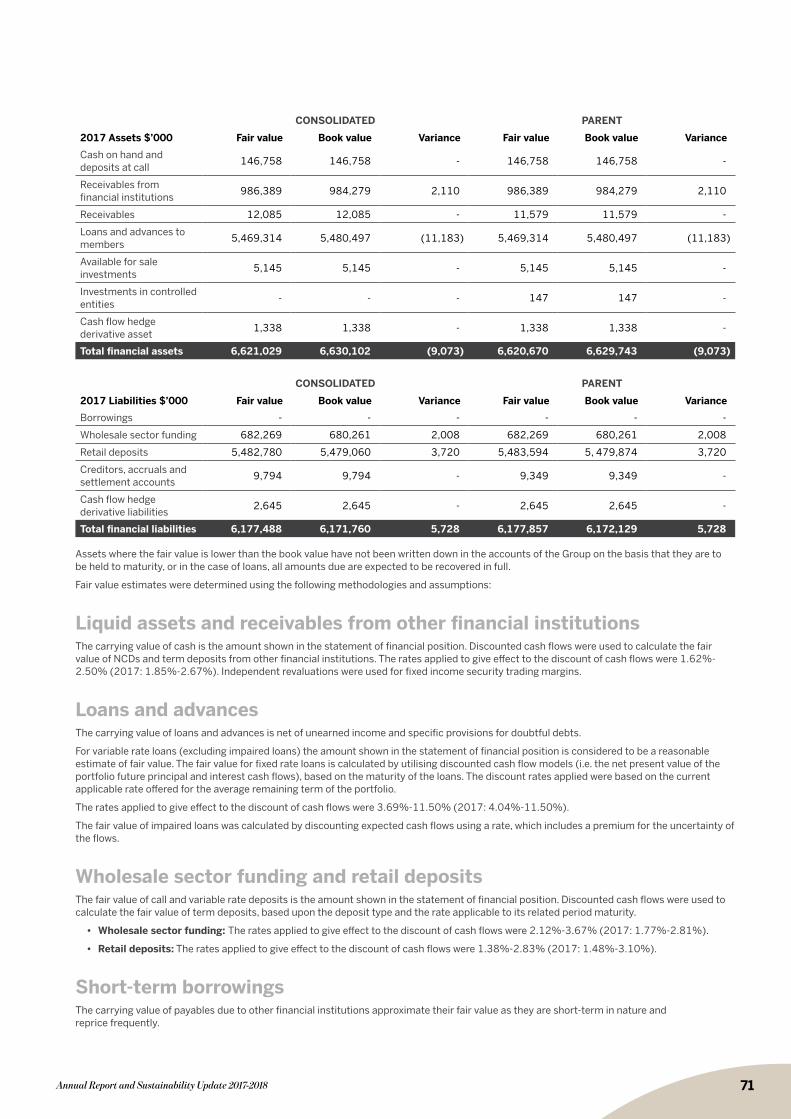
71Annual Report and Sustainability Update 2017-2018
CONSOLIDATED PARENT
2017 Assets $’000 Fair value Book value Variance Fair value Book value Variance
Cash on hand and deposits at call
146,758 146,758 - 146,758 146,758 -
Receivables from financial institutions
986,389 984,279 2,110 986,389 984,279 2,110
Receivables 12,085 12,085 - 11,579 11,579 -
Loans and advances to members
5,469,314 5,480,497 (11,183) 5,469,314 5,480,497 (11,183)
Available for sale investments
5,145 5,145 - 5,145 5,145 -
Investments in controlled entities
- - - 147 147 -
Cash flow hedge derivative asset
1,338 1,338 - 1,338 1,338 -
Total financial assets 6,621,029 6,630,102 (9,073) 6,620,670 6,629,743 (9,073)
CONSOLIDATED PARENT
2017 Liabilities $’000 Fair value Book value Variance Fair value Book value Variance
Borrowings - - - - - -
Wholesale sector funding 682,269 680,261 2,008 682,269 680,261 2,008
Retail deposits 5,482,780 5,479,060 3,720 5,483,594 5, 479,874 3,720
Creditors, accruals and settlement accounts
9,794 9,794 - 9,349 9,349 -
Cash flow hedge derivative liabilities
2,645 2,645 - 2,645 2,645 -
Total financial liabilities 6,177,488 6,171,760 5,728 6,177,857 6,172,129 5,728
Assets where the fair value is lower than the book value have not been written down in the accounts of the Group on the basis that they are to be held to maturity, or in the case of loans, all amounts due are expected to be recovered in full.
Fair value estimates were determined using the following methodologies and assumptions:
Liquid assets and receivables from other financial institutionsThe carrying value of cash is the amount shown in the statement of financial position. Discounted cash flows were used to calculate the fair value of NCDs and term deposits from other financial institutions. The rates applied to give effect to the discount of cash flows were 1.62%-2.50% (2017: 1.85%-2.67%). Independent revaluations were used for fixed income security trading margins.
Loans and advancesThe carrying value of loans and advances is net of unearned income and specific provisions for doubtful debts.
For variable rate loans (excluding impaired loans) the amount shown in the statement of financial position is considered to be a reasonable estimate of fair value. The fair value for fixed rate loans is calculated by utilising discounted cash flow models (i.e. the net present value of the portfolio future principal and interest cash flows), based on the maturity of the loans. The discount rates applied were based on the current applicable rate offered for the average remaining term of the portfolio.
The rates applied to give effect to the discount of cash flows were 3.69%-11.50% (2017: 4.04%-11.50%).
The fair value of impaired loans was calculated by discounting expected cash flows using a rate, which includes a premium for the uncertainty of the flows.
Wholesale sector funding and retail depositsThe fair value of call and variable rate deposits is the amount shown in the statement of financial position. Discounted cash flows were used to calculate the fair value of term deposits, based upon the deposit type and the rate applicable to its related period maturity.
• Wholesale sector funding: The rates applied to give effect to the discount of cash flows were 2.12%-3.67% (2017: 1.77%-2.81%).
• Retail deposits: The rates applied to give effect to the discount of cash flows were 1.38%-2.83% (2017: 1.48%-3.10%).
Short-term borrowingsThe carrying value of payables due to other financial institutions approximate their fair value as they are short-term in nature and reprice frequently.

72 Teachers Mutual Bank Limited
Financial Statements
29. Financial commitments
a. Outstanding loan commitments
2018 $’000 2017 $’000
Consolidated Parent Consolidated Parent
Loans approved but not funded 207,685 207,685 140,336 140,336
b. Loan redraw facilities2018 $’000 2017 $’000
Consolidated Parent Consolidated Parent
Loan redraw facilities available 423,979 423,979 434,165 434,165
c. Undrawn loan facilitiesLoan facilities available to members for overdrafts and credit cards are as follows:
2018 $’000 2017 $’000
Consolidated Parent Consolidated Parent
Total value of facilities approved 403,817 403,817 407,127 407,127
Less: Amount advanced (96,675) (96,675) (100,130) (100,130)
Net undrawn value 307,142 307,142 306,997 306,997
d. Future capital commitmentsThe Group has entered into a contract to purchase plant and property for which the amount is to be paid over the following periods:
2018 $’000 2017 $’000
Consolidated Parent Consolidated Parent
Not later than one year 103 103 275 275
Total 103 103 275 275
e. Computer capital commitments2018 $’000 2017 $’000
Consolidated Parent Consolidated Parent
Not later than one year 194 194 8 8
Total 194 194 8 8
f. Lease expenditure commitmentsOperating leases on property occupied by the group:
2018 $’000 2017 $’000
Consolidated Parent Consolidated Parent
Not later than one year 426 426 860 860
Later than 1 year but not 2 years 204 204 428 428
Later than 2 years but not 5 years - - 204 204
Over 5 years - - - -
Total 630 630 1,492 1,492
Operating leases are in respect of property used to provide office space for staff. There are no contingent rentals applicable to leases taken out. Lease terms are between 2 to 5 years and options for renewal are usually obtained for a further 3 years.
There are no restrictions imposed on the Group to limit the execution of further leases or borrowing of funds.

73Annual Report and Sustainability Update 2017-2018
30. Standby borrowing facilitiesThe Group has borrowing facilities as follows:
2018 $’000
Gross Current borrowings
Net available
CONSOLIDATED
Overdraft facility 5,000 - 5,000
Total standby borrowing facilities 5,000 - 5,000
PARENT
Overdraft facility 5,000 - 5,000
Total standby borrowing facilities 5,000 - 5,000
2017 $’000
CONSOLIDATED
Overdraft facility 5,000 - 5,000
Total standby borrowing facilities 5,000 - 5,000
PARENT
Overdraft facility 5,000 - 5,000
Total standby borrowing facilities 5,000 - 5,000
The Parent has an overdraft facility with Cuscal and maintains a security deposit of $52 million with Cuscal to secure this facility and settlement services. No other form of security is provided by the Parent.
Diploma Travel has bank overdraft facilities amounting to $30,000 with the Parent (eliminated upon consolidation). Tertiary Travel has bank overdraft facilities amounting to $150,000 with the Parent (eliminated upon consolidation). This may be drawn upon at any time, and terminated at any time at the option of the financial institution. At 30 June 2018 none of the facilities were used. Interest rates are variable.
31. Contingent liabilities
Liquidity support schemeThe Parent is a member of CUFSS Limited, a company limited by guarantee, established to provide financial support to member Australian mutual ADIs in the event of a liquidity or capital problem. The Parent is committed to maintaining a balance of deposits in an approved form, as determined below.
Under the terms of the Industry Support Contract (ISC), the maximum call for each participating Australian mutual ADI member is 3.0% of the Parent’s total assets, capped at a maximum $100 million. This amount represents the participating Australian mutual ADI’s irrevocable commitment under the ISC.

74 Teachers Mutual Bank Limited
Financial Statements
32. Disclosures by Directors, other key management personnel and related parties
a. Remuneration of key management personnel (KMP)KMP have direct or indirect authority and responsibility for planning, directing and controlling the activities of the Group, and include any Director of that entity. Control refers to the power to govern the financial and operating policies of an entity so as to obtain benefits from its activities.
A person or a close member of that person’s family is related to a reporting entity if that person:
(i) has control or joint control of the reporting entity;
(ii) has significant influence over the reporting entity; or
(iii) is a member of the key management personnel of the reporting entity or of a parent of the reporting entity.
KMP is deemed to comprise the Directors and the eight members of the executive management of the Parent (2017-2018) who are responsible for the day-to-day financial and operational management of the Group.
The aggregate compensation paid to, payable to or provided for Directors and other KMP during the year was as follows:
2018 $’000
Short-term Post- employment
Motor vehicle
Net increases in long service leave provision
Total
Short-term employee benefits:
J Kouimanos 110 27 - - 137
L Green 86 8 - - 94
T Carlin 71 7 - - 78
M Collopy 78 7 85
J Leete 70 7 77
G Lockwood 57 24 81
W Ford 70 7 77
M O’Neill 70 7 77
M O’Halloran 67 10 77
Short-term employee benefits – other
- - - - 0
Reimbursement to employer - - - - 0
Total 679 104 - - 783
Other KMP 3,273 271 81 162 3,787
2017 $’000
Short-term Post- employment
Motor vehicle
Net increases in long service leave provision
Total
Short-term employee benefits:
J Kouimanos 98 35 - - 133
L Green 83 8 - - 91
T Carlin 69 7 - - 76
M Collopy 76 7 - - 83
J Leete 68 7 - - 75
G Lockwood 45 33 - - 78
W Ford 68 7 - - 75
M O’Neill 68 7 - - 75
M O’Halloran 61 14 - - 75
Short-term employee benefits – other
3 - - - 3
Reimbursement to employer - - - - -
Total 639 125 - - 764
Other KMP 3,436 325 71 218 4,050

75Annual Report and Sustainability Update 2017-2018
Remuneration shown as short-term employee benefits comprises wages, salaries and social security contributions, paid annual leave and paid sick leave, value of fringe benefits received, and excludes out-of-pocket expense reimbursements.
All remuneration to Directors was approved by members at the previous Annual General Meeting.
Post-employment comprises contributions to superannuation, including those made under salary sacrifice arrangements.
b. Loans to Directors and other KMPAll loans approved and deposits accepted are on the same terms and conditions applying to members for each class of loan or deposit. There are no loans impaired relating to Directors or other KMP.
No benefits or concessional terms and conditions are applicable to close family members of KMP. There are no loans impaired relating to close family relatives of Directors and other KMP.
2018 $’000 2017 $’000
Mortgage term loans
Other term loans
Revolving credit facilities
Mortgage term loans
Other term loans
Revolving credit facilities
Funds available to be drawn
630 - 173 984 - 159
Balance 1,938 - 37 2,319 - 61
Amounts disbursed or facilities increased in the year
- - 8 - - 4
Interest and other revenue earned
63 - 6 60 - 7
c. Other transactions between related parties include deposits from Directors and other KMP:
2018 $’000 2017 $’000
Total value term and savings deposits from Directors and other KMPs 7,416 1,139
Total interest paid on deposits to Directors and other KMPs 78 63
All transactions are approved and deposits accepted on the same terms and conditions that apply to members for each type of deposit.
d. Transactions with related entitiesThe following table provides the amount of transactions that were entered into with related parties for the relevant financial year. These transactions were all carried out under normal commercial terms and where possible are benchmarked against industry averages.
2018 $’000Sales to related
partiesPurchases from related parties
Other transactions
Q.T. Travel Pty Ltd trading as Diploma World Travel Service 71 - -
2017 $’000Sales to related
partiesPurchases from related parties
Other transactions
Q.T. Travel Pty Ltd trading as Diploma World Travel Service 96 59 6
2018 $’000Sales to related
partiesPurchases from related parties
Other transactions
Tertiary Travel Service Pty Ltd 316 - -
2017 $’000Sales to related
partiesPurchases from related parties
Other transactions
Tertiary Travel Service Pty Ltd 103 53 4
Other transactions include commission received from the Parent for travel booked through the subsidiary. This note should be read in conjunction with Note 10.
76 Teachers Mutual Bank Limited
Financial Statements
e. Transactions with related partiesOther transactions between related parties include deposits from Director-related entities or close family members of Directors, and other KMP. All transactions are approved and deposits accepted on the same terms and conditions that apply to members for each type of deposit. There are no benefits paid or payable to close family members of the Directors and KMP, except for those noted below. There are no service contracts to which Directors and KMP or their close family members are an interested party.
An attendance fee was paid to Graeme Green as chair of the members committee, amounting to $2,332 (2017: $3,180). Graeme Green is the spouse of Linda Green.
33. Segmental reportingThe Group operates predominately in the retail banking and associated services industry within Australia. There are no material identifiable segments to report.
34. Superannuation liabilitiesThe Group contributes to the NGS Super Plan for the purpose of the Superannuation Guarantee and to the Schedule One Part B sub-groups of the Plan in relation to defined benefit members and has no interest in the Superannuation Plan other than as principal employer and contributor.
The defined benefit Plan sub-group arrangements create the potential for actuarial risk to be shared between participating employers, with the effect that defined benefit obligations may not be reliably measured and that the plan is not accounted for as a defined benefit plan. Teachers Mutual Bank Limited employees represent 2 of the total of 8 employees of the plan and there are four employers in total.
The financing objective of the sub-group is to target defined benefit assets at least equal to 105% of the Discounted Accrued Retirement Benefits. The sub-group is in an Unsatisfactory Financial Position (as defined under SIS Regulations 1994 to mean that the assets are not sufficient to meet the vested benefits) at 31 March 2018 and has not met its financial objective. A restoration plan was put in place on 21 November 2017 and this stated that the ongoing contributions in respect of all members would be 8% of salary in respect of the defined benefit arrangements plus $15,333 per annum expenses. For those members with salary based benefits, their employer would also have to contribute an amount to recover the member’s insurance premium plus a deficit contribution on their exit from the Plan as advised by the Actuary.
Each employer is obliged to contribute for its employee members as determined by the Trustee in accordance with the provisions and benefits to be provided for the relevant membership class for the employee members involved. By implication an employee is not required to contribute in respect of the funding of benefits for employee members of any other participating employer in the Plan.
Each employer has the unilateral right (i.e. a discretionary power exercisable without requiring consent of the trustee) at any time to terminate or reduce their contributions or terminate participation in the Plan, upon which the Trustee must ascertain interests and adjust benefits on appropriate advise, as a result.
If the Plan terminates, employers are liable for any arrears of their (own) contributions only (such contributions being as determined by the trustee as advised and recommended by the Actuary from time to time) and the termination provisions do not require any additional contribution to make up any shortfall in assets that may otherwise exist due to the obligations of other employers not having been met or otherwise. In these circumstances, member’s benefits would be adjusted.
35. Transfers of financial assetsThe Group has established arrangements for the transfer of loan contractual benefits of interest and repayments to support ongoing liquidity facilities. These arrangements are as follows:
Securitised loans retained on-statement of financial positionEdSec Funding Trust No.1 has been established as a mechanism to obtain liquid funds from the Reserve Bank of Australia.
The value of securitised loans that do not qualify for de-recognition are set out below. All loans are variable interest rate loans, with the book value and fair value of the loans being equivalent. During the year the Parent assigned an additional $402 million in loans (2017: $223 million) to the Trust.
2018 $’000 2017 $’000
Total amount of securitised loans under management 757,584 663,740

77Annual Report and Sustainability Update 2017-2018
36. Notes to statement of cash flows
a. Reconciliation of cash2018 $’000 2017 $’000
CASH INCLUDES CASH ON HAND AND DEPOSITS AT CALL WITH OTHER FINANCIAL INSTITUTIONS AND COMPRISES
Consolidated Parent Consolidated Parent
Cash on hand and deposits at call 70,884 70,884 146,758 146,758
b. Reconciliation of cash from operations to accounting profit2018 $’000 2017 $’000
THE NET CASH INCREASE/(DECREASE) FROM OPERATING ACTIVITIES IS RECONCILED TO PROFIT AFTER TAX
Consolidated Parent Consolidated Parent
Profit after income tax 31,742 31,799 27,622 27,878
Add (less):
- Provision for impairment and bad debts written off (net) 2,105 2,105 2,498 2,498
- Depreciation of property, plant and equipment 6,517 6,517 6,103 6,100
- Provision for employee entitlements 712 712 2,036 2,036
- Other provisions 432 481 (637) (629)
- Loss on disposal of plant and equipment (net) (19) (19) 59 59
- Bad debts recovered (1,076) (1,076) (1,153) (1,153)
CHANGES IN ASSETS AND LIABILITIES
- Prepaid expenses and sundry debtors 234 231 (1,300) (1,306)
- Accrued expenses and sundry creditors 123 123 (12) (12)
- Interest receivable 498 499 362 362
- Interest payable 1,509 1,509 3,774 3,774
- Other income receivable 21 21 (192) (192)
- Unearned income 123 123 (194) (194)
- Increase in other assets - - (77) (77)
- Increases in loans and advances to members (518,955) (518,955) (772,056) (772,056)
- Increase in retail deposits 349,206 349,141 633,176 632,842
- Provision for income tax 430 430 (330) (336)
- Deferred tax assets (352) (390) (680) (595)
Net cash flows from operating activities (126,750) (126,749) (101,001) (101,001)
Cash on hand and deposits at call include restricted access accounts that are limited to our security deposit obligations with Cuscal.
37. Events occurring after balance dateOn 2 July 2018, the Bank issued $200 million of senior unsecured notes to 42 investors as part of the Bank’s funding strategy. As the note issuance occurred on 2 July 2018, the financial effect of this has not been recognised in the financial statements for 30 June 2018. No other matters or circumstances have arisen since the end of the financial year which significantly affected or may significantly affect the operations, or state of affairs of the Group in subsequent financial years.
38. Corporate informationTeachers Mutual Bank Limited is a company limited by shares, and is registered under the Corporations Act. The address of the registered office and principal place of business is 28-38 Powell Street, Homebush NSW 2140. The nature of the operations and its principal activities are the provision of deposit taking facilities and loan facilities to its members.

78 Teachers Mutual Bank Limited
Financial Statements
Directors’ declarationFor the year ended 30 June 2018
Directors’ declarationThe Directors of Teachers Mutual Bank Limited declare that:
The financial statements comprising the statement of financial position, statement of comprehensive income, statement of changes in equity and statement of cash flows and accompanying notes, are in accordance with the Corporations Act 2001 and:
(a) comply with Accounting Standards and the Corporations Regulations 2001 (Cth); and
(b) give a true and fair view of the financial position of the Group as at 30 June 2018 and performance for the year ended on that date.
The Group has included in the notes to the financial statements an explicit and unreserved statement of compliance with International Financial Reporting Standards.
In the Board of Directors’ opinion, there are reasonable grounds to believe that the Group will be able to pay its debts as and when they become due and payable.
This declaration is made in accordance with a resolution of the Board of Directors.
Signed on behalf of the Board of Directors by:
John Kouimanos, Chairman
Signed and dated this 27 August 2018

79Annual Report and Sustainability Update 2017-2018
Independent Auditor’s ReportFor the year ended 30 June 2018
Independent auditor’s reportTo the members of Teachers Mutual Bank Limited
We have audited the financial report of Teachers Mutual Bank Limited (the Company) and its subsidiaries (the Group), which comprises the consolidated statement of financial position as at 30 June 2018, the consolidated statement of profit or loss and other comprehensive income, consolidated statement of changes in equity and consolidated statement of cash flows for the year then ended, and notes to the financial statements, including a summary of significant accounting policies, and the directors’ declaration.
In our opinion, the accompanying financial report of the Group is in accordance with the Corporations Act 2001, including:
giving a true and fair view of the Group’s financial position as at 30 June 2018 and of its performance for the year ended on that date; and
complying with Australian Accounting Standards and the Corporations Regulations 2001.
Basis for OpinionWe conducted our audit in accordance with Australian Auditing Standards. Our responsibilities under those standards are further described in the Auditor’s Responsibilities for the Audit of the Financial Report section of our report. We are independent of the Group in accordance with the Corporations Act 2001 and the ethical requirements of the Accounting Professional and Ethical Standards Board’s APES 110 Code of Ethics for Professional Accountants (the Code) that are relevant to our audit of the financial report in Australia. We have also fulfilled our other ethical responsibilities in accordance with the Code.
We believe that the audit evidence we have obtained is sufficient and appropriate to provide a basis for our opinion.
Information Other than the Financial Report and Auditor’s Report ThereonThe Directors are responsible for the other information. The other information comprises the information included in the Group’s annual report for the year ended 30 June 2018, but does not include the financial report and our auditor’s report thereon.
Our opinion on the financial report does not cover the other information and accordingly we do not express any form of assurance conclusion thereon.
In connection with our audit of the financial report, our responsibility is to read the other information and, in doing so, consider whether the other information

80 Teachers Mutual Bank Limited
Financial Statements
is materially inconsistent with the financial report or our knowledge obtained in the audit or otherwise appears to be materially misstated.
If, based on the work we have performed, we conclude that there is a material misstatement of this other information, we are required to report that fact. We have nothing to report in this regard.
Responsibilities of the Directors for the Financial ReportThe Directors of the Company are responsible for the preparation of the financial report that gives a true and fair view in accordance with Australian Accounting Standards and the Corporations Act 2001 and for such internal control as the Directors determine is necessary to enable the preparation of the financial report that gives a true and fair view and is free from material misstatement, whether due to fraud or error.
In preparing the financial report, the Directors are responsible for assessing the Group’s ability to continue as a going concern, disclosing, as applicable, matters related to going concern and using the going concern basis of accounting unless the Directors either intend to liquidate the Group or to cease operations, or have no realistic alternative but to do so.
Auditor’s Responsibilities for the Audit of the Financial ReportOur objectives are to obtain reasonable assurance about whether the financial report as a whole is free from material misstatement, whether due to fraud or error, and to issue an auditor’s report that includes our opinion. Reasonable assurance is a high level of assurance, but is not a guarantee that an audit conducted in accordance with the Australian Auditing Standards will always detect a material misstatement when it exists. Misstatements can arise from fraud or error and are considered material if, individually or in the aggregate, they could reasonably be expected to influence the economic decisions of users taken on the basis of this financial report.
A further description of our responsibilities for the audit of the financial report is located at the Auditing and Assurance Standards Board website at: http://www.auasb.gov.au/auditors_responsibilities/ar3.pdf.
This description forms part of our auditor’s report.
GRANT THORNTON AUDIT PTY LTD Chartered Accountants
M. Mattera Partner – Audit & Assurance Dated 27 August 2018

Cufa Children’s Financial Literacy Program26,454 children educated • 17,410 children actively saving • 220 teachers trained • 1,029 financial literacy lessons held
The CFL program gives
Cambodian children aged 6-12 who are
living in poverty, the opportunity to create a brighter future for
themselves and their families.

Need more information?
We’re here to help.13 12 21 – 8am to 7pm, weekdays – 9am to 3pm, Saturday
Registered office: Teachers Mutual Bank Limited ABN: 30 087 650 459 AFSL/Australian Credit Licence: 238981
Address: 28-38 Powell Street Homebush NSW 2140 or PO Box 7501 Silverwater NSW 2128 Telephone: 13 12 21 Fax: (02) 9704 8205
Email: [email protected]
Auditors: Grant Thornton Audit Pty Ltd Level 19, 2 Market Street Sydney NSW 2000 Affiliates: Customer Owned Banking Association, Asian Confederation of Credit Unions, CUFSS, CUFA,
World Council of Credit Unions, Global Alliance for Banking on Values and the Business Council of Co-Operatives and Mutuals.
Design: www.frescocreative.com.au
fmbank.com.au | tmbank.com.au | unibank.com.au