annual report - amazon web services...level 29, 35 collins street melbourne victoria 3000 telephone:...
TRANSCRIPT

Level 29, 35 Collins Street Melbourne Victoria 3000
Telephone: 03 9651 9600 Facsimile: 03 9651 9623
www.gaa.vic.gov.au
2 0 1 2 - 2 0 1 3
A n n u a l R e p o r t

GROWTH AREAS AUTHORITY ANNUAL REPORT 2010-2011

ANNUAL REPORT2012 - 2013

2 GROWTH AREAS AUTHORITY ANNUAL REPORT 2012-2013
CONTENTS
Minister for Planning 3
Chairman’s Message 3
Chief Executive Officer’s Report 5
The Growth Areas 8
The Growth Areas Authority 9
Members of the Authority 11
Growth Areas Authority Performance 13
Growth Areas Infrastructure Contribution (GAIC) 16
Organisational Structure 21
Additional Information 23
Risk Management 28
Summary of Financial Results 29
Disclosure Index 30
Annual Financial Statements – 30 June 2013 32
Growth Areas Authority Statutory Certification 49
Auditor General’s Report 50
© State of Victoria, Growth Areas Authority 2013. This publication is copyright. No part may be reproduced by any process except in accordance with the provisions of the Copyright Act 1968.

3
MINISTER FOR PLANNING
The Growth Areas Authority (GAA) reports to the Minister for Planning, the Hon Matthew Guy MLC, in the Victorian Government and during the reporting period was a portfolio agency with the Department of Planning and Community Development. The GAA was established under the Planning and Environment (Growth Areas Authority) Act 2006.
The Hon. Matthew Guy MLCMinister for PlanningAugust 2013
CHAIRMAN’S MESSAGE
The 2012/13 financial year has been a watershed period for the Growth Areas Authority (GAA).
Master planning of our new suburbs through the Precinct Structure Planning process continues to progress well following the approval of 59,000 development ready residential lots and 130 hectares of potential employment land during the 2011/12 financial year.
A further 5,400 residential lots were approved by the Minister with a further 6,600 lots in the final stages of the process. A further 1,500 hectares of potential employment land is included in PSPs in process.
Current PSPs include integrated water cycle management opportunities in the Casey growth area and provide for substantial road infrastructure for the Wyndham growth area.
During the 2012/13 financial year, the GAA continued to focus on planning for communities with access to key infrastructure, local jobs and quality services. Additionally, the GAA has engaged in longer range planning for Wyndham through the sub-corridor planning process. This process, headlined by the recently released Wyndham North Developer Contributions Plan, will lead to improved infrastructure delivery.
Jobs close to home
The launch by the Minister of the East Werribee Employment Precinct in the heart of the City of Wyndham, Australia’s fastest growing local government area, will provide for 50,000 jobs in this important growth area of Melbourne.
In May, the Minister launched the 900 hectare Merrifield masterplanned mixed use community in the Hume growth corridor. This will provide for 20,000 jobs in the fast growing north of Melbourne.
Expanded Horizons
Gazettal of the Planning and Environment Amendment (Growth Areas Authority and Miscellaneous) Act 2013 will enable the GAA to work in strategic locations throughout Victoria and ensure that all Victorian Councils have access to the GAA’s experience and expertise when required. This legislation expands the geographic reach of the GAA and becomes effective as of 22 July 2013.

4
More Demonstration Projects
A number of new Demonstration Projects are in the planning phase. These projects will bring together private sector developers, Local Government and the GAA to create projects that point the way to truly 21st century urban developments. Our first project, Selandra Rise in Cranbourne which opened in 2010 has been an outstanding success through its demonstration of creating a happy, healthy and environmentally aware community by incorporating health and wellbeing concepts into its masterplan from the outset.
New Authority Members
Two new Authority members, Leonie Hemingway and Bill Kusznirczuk joined Di Fleming, Ian Munro and myself during the year following the Minister’s appointments in October 2012. I would like to sincerely thank Ann Keddie and Frank King, Authority Members who retired during the course of the year, for their contribution to the GAA during their term of appointment.
The GAA is playing a significant role in maintaining and enhancing Melbourne’s status as Australia’s most liveable city and I want to express my appreciation to the Minister, our staff and my fellow members for their contribution to our important work.
Chris Banks AM Chair August 2013

5
CHIEF EXECUTIVE OFFICER’S REPORT
The past financial year has been one of change and development for the Growth Areas Authority (GAA).
In 2012/13, the GAA expanded its planning activities, facilitating the delivery of infrastructure, assuming responsibility for creating a major new employment and mixed use precinct on government owned land at Werribee, completing land realisation strategies, and starting work in Gippsland with Latrobe and Baw Baw Shires while also continuing to get on with the job of planning new communities across the seven growth areas of Melbourne.
In 2012/13, the Minister for Planning approved two new precinct plans for Botanic Ridge in the City of Casey, and Point Cook West in the City of Wyndham. Master planning work for the Toolern Major Town Centre was also approved.
The GAA has completed 34 precinct plans to date as well as the Toolern Major Town Centre master planning. A further nine precinct plans are on exhibition, 13 under preparation, and 12 at the pre-planning stage.
The GAA will continue to develop additional precinct plans for residential, employment and mixed use precincts to allow the growth areas to satisfy future housing demand while also attracting business investment and providing for jobs and services close to home.
East Werribee Employment Precinct
The GAA released a draft precinct plan for the East Werribee Employment Precinct in November 2012 and has since completed extensive consultation and work on the plan. The redeveloped East Werribee Employment Precinct will ultimately provide for more than 50,000 jobs (up from 2000 jobs at present), 7000 homes and key infrastructure for the Wyndham growth area on the site of the former State Research Farm, which is primarily State owned land.
East Werribee will be a major new centre built around new waterways and offering an exciting range of jobs and business opportunities. The precinct also presented new planning challenges for the GAA in terms of working with the Department of Treasury and Finance to develop a land realisation strategy to enable the land to be put to market.
The recently completed tender process for land within the Point Cook West precinct provided a good example of the GAA’s land realisation work, which resulted in a $103 million sale of land formerly owned by the Victorian Government and will pay for a much needed new freeway interchange at Sneydes Road as well as returning significant funds to the State. There was significant interest in the land, which indicated a strong demand for well planned and well appointed land in the western growth corridor.
Legislative changes
New planning legislation (the Planning and Environment Amendment (Growth Areas Authority and Miscellaneous) Act 2013) was passed in April 2013 that will allow the GAA to assist Councils outside the Cardinia, Casey, Hume, Melton, Mitchell, Whittlesea and Wyndham growth areas.
The new Act allows the Minister for Planning to declare a growth area in any part of Victoria via a notice in the Government Gazette, and also to direct the GAA to provide planning assistance to a Council. This expands the GAA’s role by removing restrictions on where the authority operates, with any Council now able to request access to our team’s skills and experience.
6
GAA working with Baw Baw Shire Council and Latrobe City Council
The GAA’s work in Gippsland’s fastest growing areas, Baw Baw Shire Council and Latrobe City Council, have provided an early example of how the Planning and Environment Amendment (Growth Areas Authority and Miscellaneous) Act 2013 will result in improved planning outcomes.
Working in partnership with Baw Baw and Latrobe, GAA planners have helped prepare and implement plans for key development sites in Warragul, Drouin, Moe/Newborough and Lake Narracan, undertaken master planning and helped to resolve local planning and development issues.
Our work in Baw Baw is in response to increasing demand for homes in Warragul and Drouin. This work includes planning for a residential development on 950 hectares at Warragul and 680 hectares at Drouin to provide approximately 11,000 dwellings.
In Latrobe, the GAA is providing assistance to investigate opportunities for possible long term expansion of the Moe/Newborough urban area north to Lake Narracan.
The area under investigation spans approximately 420 hectares and if feasible, could be developed into a residential community comprising 2750 dwellings. The GAA is also assisting Latrobe City Council with assessment of three recently submitted development plans.
Infrastructure planning
This year, the GAA has increased its focus on planning the delivery of key infrastructure such as transport, schools, open space, attractive town centres and employment hubs and essential services to support our growing population. An example of this has been the GAA’s work with Wyndham City Council and developers to find alternative funding sources to deliver infrastructure.
The GAA’s work with VicRoads and the Department of Treasury and Finance has ensured the delivery of a full diamond interchange at Sneydes Road in Point Cook. This $40 million interchange will provide unprecedented access to the Princes Freeway for Werribee and Point Cook residents and will be a key driver of activity within the East Werribee Employment Precinct. The project will be funded through proceeds of land sales from the Point Cook West precinct.
Our team will continue to work closely with the growth area Councils, state agencies and stakeholders within the planning and development industry to plan the delivery of vital and high quality infrastructure in new centres across the growth areas.
Integrated water cycle management is emerging as a key issue in the planning of new communities. The GAA has worked closely with the Office of Living Victoria, and we are exploring several innovative concepts that will enhance liveability and environmental outcomes for the growth areas.
As from 1 July 2013, the former Department of Transport and the Department of Planning were merged into a new Department of Transport, Planning and Local Infrastructure, along with other Government administrative changes. This will consolidate the growth area planning and infrastructure into one administrative body in the new financial year.
Management
There have been disruptions to the GAA’s management during the past year.
Director of Structure Planning Steve Dunn was seconded to oversee the finalisation of the Metropolitan Planning Strategy, while in February 2013 I accepted the Minister for Planning’s request to fill the role as Chief Executive Officer of State Government developer Places Victoria for six months to oversee the restructure of the organisation.
Since then, I have continued in the role as CEO of the GAA on a reduced basis. In order to accommodate this, Paul Byrne, Director of Economic Planning and Development was appointed as the GAA’s Chief Operating Officer.

7
Paul has done a terrific job in this role. His leadership has ensured minimal disruption to the management of planning activities in the growth areas and the momentum of the GAA has been maintained.
A new Board was installed in October 2012 after the terms of the previous Authority expired. The Minister for Planning reappointed our chairman Chris Banks, along with Di Fleming and Ian Munro. Two new Authority Members, Leonie Hemingway and Bill Kusznirczuk were appointed.
The GAA expressed its thanks to retiring Authority Members Ann Keddie and Frank King who both played a key role in the GAA’s work to facilitate the planning and development of Melbourne’s growth areas.
Conclusion
The 2012/13 financial year has been productive and the GAA has achieved a host of objectives in its planning for Melbourne’s growth areas. The GAA faces a range of challenges during the next 12 months, particularly in relation to the potential for changes associated with the completion of the Metropolitan Planning Strategy, and the announcement of the intention to create an expanded planning authority to be responsible for the planning in areas of growth.
The GAA’s commitment to maintaining a strong supply of land for urban development remains, as does our focus on creating progressive new suburbs that provide attractive and affordable places for people to live, work and play.
Finally, I would like to thank the Minister for Planning for his ongoing support, the GAA’s Authority Members for their support and guidance in our work, and sincerely thank our staff and partners (including the Department of Planning and Community Development) for their help in creating better and more progressive suburbs of the future.
Peter SeamerChief Executive OfficerAugust 2013

8
THE GROWTH AREAS
Under the Planning and Environment Act 1987 as amended, the growth areas have been designated by the Minister for Planning pursuant to clause 46AQ. They include land in the seven municipalities of:
• Cardinia
• Casey
• Hume
• Melton
• Mitchell
• Whittlesea
• Wyndham
The recently gazetted Planning and Environment Amendment (Growth Areas Authority and Miscellaneous) Act 2013 will allow the Minister for Planning to declare a growth area outside the existing growth area municipalities via a notice in the Government Gazette. This will also allow regional Councils and Councils outside the seven declared growth areas to request access to the GAA’s skills and experience.
Melbourne is expecting population growth from 4.00 million in 2011 to 5.41 million in 2031, an increase of over 35% across the 20 year period. This represents growth in Melbourne’s population of in excess of 1,350 people per week.
It is anticipated that the growth areas may accommodate up to approximately 60% of Melbourne’s increasing population over the next 20 years, which will require high level planning for the continued development of new suburbs in greenfield locations.
Population and housing trends that face Melbourne and will impact on the growth areas over the coming years include:
• Projections of an additional 765,000 people with an associated estimated 275,000 new dwellings required in the growth areas over the next 20 years,
• A mix of demographics within projected population growth characterised by planning to accommodate older persons, overseas migrants, younger families and an increasing number of single person households,
• A small decrease in household size over time. Average household size in Melbourne’s growth areas is expected to decrease from 2.91 people per household in 2011 to a forecast average of 2.78 in 2031,
• Continuing decline in average lot sizes and an associated increase in average densities,
• Increased focus on job creation in the growth areas, particularly development of more office based and white collar employment. The first phase of jobs is during construction, the next area is population driven jobs and these jobs tend to come automatically, followed by industrial and commercial jobs. Employment and community focussed town centres have the potential to fill employment gaps in the growth areas by creating white collar jobs. Town centres also provide tertiary and non tertiary employment opportunities both during and after construction.

9
THE GROWTH AREAS AUTHORITY
The GAA was established in 2006.
The organisation was formally established by amendments made to the Planning and Environment Act 1987 on 1 September 2006 through the Planning and Environment (Growth Areas Authority) Act 2006 to achieve the following objectives:
• Ensure that development in growth areas occurs in a coordinated and timely manner;
• Ensure that infrastructure, services and facilities are provided in the growth areas in a coordinated and timely manner;
• Promote sustainable development of land in growth areas;
• Promote housing diversity and affordability in growth areas;
• Promote employment opportunities in growth areas;
• Ensure that land is provided for commercial and industrial purposes in growth areas in a coordinated and timely manner;
• Foster the development of communities in growth areas.
An additional objective was legislated through the Transport Integration Act 2010 effective on 1 July 2011:
• Integrate land use and transport to enable the coordinated provision of a sustainable transport system for the benefit of the community.
Government support for the resources to continue the pursuit of achievement of these objectives is being actively sought.
FUNCTIONS AND POWERS
The GAA advises the Minister for Planning on development and planning issues in Melbourne’s growth areas and monitors, advises and partners with key stakeholders on a range of planning issues.
The GAA’s functions and powers are set out in Sections 46AS and 46AT of the Planning and Environment Act 1987.
The GAA’s key functions are to:
• Make recommendations and report to the Minister on:
- The planning, use, development and protection of land in growth areas;
- The use and expenditure of levies collected in the growth areas under development contribution plans;
- If requested by the Minister, any matter relating to the functions and powers of the Authority;
- The Minister’s functions and powers under the Act in relation to growth areas;
- To carry out any function conferred to the GAA in relation to the Growth Areas Infrastructure Contribution.
• Carry out any other function conferred on the Authority under the Act.
On 22 July 2013, the Planning and Environment Amendment (Growth Areas Authority and Miscellaneous) Act 2013 came into force. This legislation expanded the geographic range of the activities of the GAA when directed to do so by the Minister for Planning and also amended some of the GAA’s objectives and functions.

10
NATURE AND RANGE OF SERVICES PROVIDED
The GAA aims to work in partnership with State and Local Government as well as with the development industry to achieve its objectives and to carry out its functions. The GAA works closely with Cardinia Shire Council, Casey City Council, Hume City Council, City of Melton, Shire of Mitchell, Whittlesea City Council and Wyndham City Council.
A key activity of the GAA is the review and reform of the planning provisions and processes as they relate to the growth areas and growth area development. The GAA also has a major role to play in coordinating the planning for State and Council infrastructure for the growth areas. The GAA has prepared sub-corridor plans and is completing corridor planning for land brought into the Urban Growth Boundary following completion of the logical inclusions process, and has worked with the Department of Transport, Planning and Local Infrastructure in the review of development contributions.
The GAA has continued to work in partnership with the growth area Councils to prepare and implement plans for these key development sites, undertake master planning and help resolve local planning and development issues.
The GAA works closely with State Government departments, including the Departments of State Development, Business and Innovation, Education and Early Childhood Development, Transport, Planning and Local Infrastructure, Human Services, Environment and Primary Industries, Premier and Cabinet, and Treasury and Finance.
The GAA also operates in conjunction with a range of State Government agencies such as Public Transport Victoria, VicRoads, Parks Victoria, the Environment Protection Authority and Melbourne Water.
The GAA works with peak organisations such as the Planning Institute of Australia, the Property Council of Australia, the Municipal Association of Victoria, the Urban Development Institute of Australia, the Victorian Planning and Environmental Law Association and the Victorian Local Governance Association.

11
MEMBERS OF THE AUTHORITY
The GAA is overseen by a highly experienced Board that brings together a broad range of disciplines including planning, development, economics, financial management, local government, education and housing. Five Authority Members were appointed by the Minister on 23 October 2012, and the Authority is chaired by Chris Banks AM. The Authority reports to the Minister for Planning, The Hon. Matthew Guy MLC.
A profile of each board member is below.
CHRIS BANKS AM (CHAIRMAN)
Chris Banks AM brings more than four decades of commitment to the housing and urban development industry culminating as Chief Executive Officer of AV Jennings for 11 years and Managing Director of Delfin for nine years.
LEONIE HEMINGWAY (DEPUTY CHAIR) (FROM 23 OCTOBER 2012)
Leonie Hemingway JP (formerly Leonie Burke) has dedicated her life to working within all three spheres of Australian government, and the people and businesses with which they interact. Recently, she has focussed more on behind the scenes, sharing her skills in legislation, good governance and business relations, as a Director/member of both civic and government boards.
DI FLEMING
Di Fleming brings experience across education, greenfield development and digital design. Di is Director of Accelerated Knowledge Technologies Pty Ltd, Vice President of Africa Australia Business Council (Vic) and former founding director of Digital Harbour Pty Ltd with associate professorships at RMIT and Melbourne Universities. Di is a recipient of the Telstra Business Woman of the Year Award (Vic).
BILL KUSZNIRCZUK (FROM 23 OCTOBER 2012)
Bill Kusznirczuk brings extensive experience and knowledge in urban planning, building and how cities should look in the future. He is Managing Director of Clement-Stone Town Planners. He gives advice on urban planning issues across Australia. He is also a broadcaster on Fairfax radio 3AW. Bill is also Chairman and Chief Commissioner of the Victorian Building Authority, responsible for setting and enforcing Victorian Building Industry regulation.
IAN MUNRO PSM
Ian Munro brings to the Board expertise in aligning government and business to achieve investment and jobs growth. Ian has a detailed understanding of the critical role of land supply and planning in economic development. Ian is a council member of the Victorian Environmental Assessment Council and former Deputy Secretary/CEO of Invest Assist (former Dept of Innovation, Industry and Regional Development). Ian is a consultant to the Department of State Development, Business and Innovation and to Regional Development Victoria.
FRANK KING (DEPUTY CHAIR) (UP TO 22 OCTOBER 2012)
Frank King is a former Deputy Secretary of the Department of Treasury and Finance. He is President of the Emergency Services Superannuation Board and was the Chairman of the Centre for Adult Education until December 2011.

12
ANN KEDDIE (UP TO 22 OCTOBER 2012)
Ann Keddie is an architect and urban designer with extensive experience within the industry, particularly in the area of infrastructure and housing. Ann is a sessional member of both the Victorian Civil and Administrative Tribunal and Planning Panels Victoria, and a former member of the Priority Development Panel and the City Link Authority.
RISK AND AUDIT COMMITTEE
The Risk and Audit Committee ensures that the GAA discharges its responsibilities as prescribed in the Financial Management Act 1994 and Audit Act 1998, other relevant legislation and prescribed requirements.
The Committee comprises all Members of the Authority and is chaired by Leonie Hemingway (Frank King until 22 October 2012).
The Audit and Risk Committee members are all independent from the operations of the Authority.
EXECUTIVE REMUNERATION COMMITTEE
This Committee oversees the development of executive remuneration policy and practices within the GAA, and approves individual executive remuneration packages. This Committee comprises all Members of the Authority and is chaired by Ian Munro (previously chaired by Frank King until October 2012).
MEETING PERFORMANCE
NAME OF MEETING CHAIR MEETING FREQUENCY NUMBER OF MEETINGS
MEMBERSHP
Authority (Board) Chris Banks Bi-Monthly or as required 9 All members
Risk and Audit Committee Frank King (to 22 October 2012)
Leonie Hemingway (from 19 December 2012)
Half yearly or as required 4 All members
Executive Remuneration Committee
Frank King (to 22 October 2012)
Ian Munro (from 19 December 2012)
As required 3 All members
MEETING ATTENDANCE
AUTHORITY MEMBER
AUTHORITY MEETING ATTENDANCE
RISK AND AUDIT COMMITTEE ATTENDANCE
EXECUTIVE REMUNERATION COMMITTEE ATTENDANCE
Chris Banks 9 out of 9 4 out of 4 3 out of 3
Di Fleming 6 out of 9 2 out of 4 1 out of 3
Leonie Hemingway 7 out of 7 3 out of 3 2 out of 2
Frank King 2 out of 2 1 out of 1 1 out of 1
Ann Keddie 1 out of 2 1 out of 1 1 out of 1
Bill Kusznirczuk 7 out of 7 3 out of 3 2 out of 2
Ian Munro 9 out of 9 4 out of 4 3 out of 3

13
GROWTH AREAS AUTHORITY PERFORMANCE
Since the establishment of the GAA in September 2006, significant progress has been made in the GAA progressing its legislative objectives. The table below summarises the progress made against the GAA’s 2012/2013 strategic priorities.
STRATEGIC PRIORITY ACTIVITIES AND PERFORMANCE MEASUREMENT
Ensure that development in growth areas occurs in a coordinated and timely manner
The preparatory work for the planning scheme amendment for the recently announced logical inclusion areas is progressing well to meet its target of being adopted by the end of 2013.
The Minister announced or approved the following Precinct Structure Plans (PSPs) during 2012/13:
• Point Cook West
• Botanic Ridge
and also the outcome of the master planning process for:
• Toolern Major Town Centre.
The GAA is progressing the PSPs required to meet the announced additional zoning for 60,000 residential lots to be completed over the 2012/13 and 2013/14 financial years.
A further 22 PSPs are being progressed for completion over the next two years.
Ensure that infrastructure, services and facilities are provided in growth areas in a coordinated and timely manner
The GAA held further consultation on the proposed draft Guidelines and Model Agreement for the GAIC Work in Kind Agreements with industry representatives. The final documents are being prepared for release in the new financial year.
The Minister announced funding for 6 projects out of the GAIC Building New Communities Fund totalling $6.9 million.
Promote sustainable development of land in growth areas
The GAA has been progressing initiatives in relation to promoting sustainable development of employment in the growth areas, completing the corridor planning for the new areas brought into the growth areas through the recent logical inclusions process, and working closely with the Office of Living Victoria and the water corporations to complete integrated Water Cycle Strategies for the growth corridors.
In addition, the GAA’s new PSPs are now including practical integrated water outcomes utilising existing regulatory and institutional frameworks.
The development of sub-regional strategies and protection targets for species including the Growling Grass Frog, Golden Sun Moth, Spiny Rice-flower and the Matted Flax-lily. A sub-regional strategy is also being developed for the Southern Brown Bandicoot.
The establishment of the 15,000 hectare Western Grasslands Reserve that extends from Mt Cottrell, south east of Melton to north of Little River, west of Werribee.
The establishment of 36 conservation reserves within the Urban Growth Boundary comprising about 5,700 hectares, including:
• Around 3,000 hectares of land along major waterways to protect and restore habitat for the Growling Grass Frog;
• The creation of a 1,200 hectare grassy woodland reserve.
Promote housing diversity and affordability in growth areas
The GAA is continuing to enable smaller dwellings within the growth areas to be constructed without planning permits through incorporation of the Small Lot Housing Code in all new PSPs.
The GAA considers that demonstration projects are a very effective means of illustrating leading urban designs, and explores potential opportunities whenever they can be identified.
Recently prepared PSPs and those under development are structured to encourage a variety of building types and densities.

14
STRATEGIC PRIORITY ACTIVITIES AND PERFORMANCE MEASUREMENT
Promote employment opportunities in growth areas
The GAA has progressed detailed planning work for the provision of in excess of 20 town centres as part of its residential PSP program. Several employment and mixed use precincts are also nearing completion, including East Werribee Employment Precinct.
The GAA has worked with local Councils to develop future job targets which are to be applied to the growth corridors.
Ensure that land is provided for commercial and industrial purposes in growth areas in a co-ordinated and timely manner
Through the Growth Corridor Planning process the GAA identified and proposed the land to be zoned for future industrial areas for Melbourne.
The GAA has now been progressing the strategic planning for the additional land brought within the growth areas through the recent logical inclusions process.
Foster the development of communities in growth areas
The GAA continued to implement the Precinct Structure Planning Guidelines by ensuring essential infrastructure required to support liveable communities in Melbourne’s newest suburbs is identified in PSPs and, where appropriate, incorporated into DCP’s.
Integrate land use and transport to enable the coordinated provision of a sustainable transport system for the benefit of the community
The GAA ensures that the process for PSP preparation clearly links into the co-ordinated transport planning, including where appropriate transport infrastructure being identified in DCP’s.
The strategic transport network indentified in the Growth Corridor Plans is being refined and preserved through the PSP development.
The GAA has worked closely with the Victorian Auditor General’s Office in the review of the planning for and the provision of transport in the growth areas.
The GAA has worked with VicRoads and the Department of Transport, Planning and Local Infrastructure to refine co-operative land use and multi-modal planning processes, including in PSP preparation processes.
To ensure all financial and governance responsibilities of the Authority are appropriately discharged
The Annual Report for 30 June 2012 was adopted and presented to the Minister by 30 September 2012 with no audit qualifications.
GAIC enquiries and requests have been processed in a timely manner in conjunction with the State Revenue Office and the Department of Planning and Community Development.
9 Authority meetings have been held on:
• 15 August 2012
• 10 October 2012
• 21 November 2012
• 19 December 2012
• 6 February 2013
• 28 February 2013
• 20 March 2013
• 8 May 2013
• 19 June 2013
The outcomes of the GAA Environment Strategy actions are reported in the Annual Report.
The Risk Management Attestation for the financial year ended 30 June 2012 was contained in the adopted 2011/12 Annual Report.

15
MAJOR CHANGES OR FACTORS AFFECTING PERFORMANCE
The GAA has continued with its major role in co-ordinating the completion of Precinct Structure Plans (PSPs) for the land which was brought within the growth areas after 2005. To date, 35 PSPs (including the master planning for Toolern Major Town Centre) from the program have been completed and a further 34 PSPs are underway. The remaining 29 PSPs from the existing program (which also excludes the recently announced logical inclusions to the growth areas) have not yet been scheduled for implementation.
With the expansion of the Urban Growth Boundary and Melbourne’s declared growth areas in July 2010, the GAA was allocated an additional $5m (over the GAA’s base funding) in each of the 2010/11 and 2011/12 financial years. The additional funding for the PSP program and the planning for new urban growth areas has now lapsed, and the completion of the remainder of the PSP program, has not been scheduled and is currently unfunded.
The actual funding received by the GAA for the 2012/13 financial year reduced by 40%, when compared with 2011/12. The amounts received in 2011/12 amounted to approximately $13.1 million, whilst the receipts for the 2012/13 financial year were just under $7.8 million. Accordingly, the GAA also reduced the level of its expenditures (and activities) from $11.6 million in 2011/12 to around $9 million for the 2012/13 financial year.
The Government’s Sustainable Government initiative extended to the GAA, and this, and other cost reduction activities, resulted in the GAA’s work force as at the financial year end reducing from 56 in 2011/12 to 45 in 2012/13. In addition, during the course of the 2012/13 financial year the GAA was able to second a number of its senior and other staff to other Government agencies and Departments, which assisted in reducing the GAA’s operating cost for this financial year.
The GAA’s reduced funding required it to reduce the breadth and scope of some of the activities that it had been performing over recent years. These changes will continue to flow through to the GAA’s operations in the 2013/14 and subsequent financial years unless the future funding levels of the GAA are increased. For instance, the continuation of the PSP program in the medium term (beyond the current 34 PSPs underway) is largely dependent upon the GAA being able to source additional funding.
It is anticipated that a request for an allocation of further funding for PSP and other planning purposes will be made in future financial years.

16
GROWTH AREAS INFRASTRUCTURE CONTRIBUTION (GAIC)
The Planning and Environment (Growth Areas Infrastructure Contribution) Act 2010 (the Act) came into effect on 1 July 2010. Information in relation to the GAIC is located on the GAA website www.gaa.vic.gov.au
There have been two additional legislative amendments relating to GAIC. One being the Planning and Environment Amendment (Growth Areas Infrastructure Contribution) Act 2011, and the other the Planning and Environment Amendment (Schools) Act 2012. The GAA’s website www.gaa.vic.gov.au contains Information Sheets outlining details in relation to these two matters.
The GAA is responsible under the Act to notify the State Revenue Office and the Registrar of Titles of the properties that fall within the GAIC Contribution Area.
The State Revenue Office retains a record of those properties that are liable for GAIC, and for determining and collecting any GAIC liability.
The Registrar of Titles is responsible for placing a GAIC notice on each affected property and will not allow any land dealings, in relation to those properties, without receipt of an appropriate GAIC certificate and notice, as issued by the State Revenue Office.
The GAA also investigates any planning and zoning anomalies that may be raised as they relate to GAIC, and in progressing stage payment enquiries and applications from landowners conducting subdivisions in Melbourne’s growth areas.
In addition the GAA provides secretarial support to the GAIC Hardship Relief Board (the Board). The Board meets periodically to consider applications for hardship relief. Information about the Board is found on the GAA website www.gaa.vic.gov.au. During the 2012/13 year the Board made decisions on four hardship applications (2011/12 – 5). As at 30 June 2013 there were no active applications before the Board (as at 30 June 2012 – 4).
Under section 45 of the Financial Management Act 1994 and section 201VC of the Act the GAA and the Department of Planning and Community Development (now the Department of Transport, Planning and Local Infrastructure (DTPLI)) are required to report annually on the operation of the GAIC.
The amount of GAIC triggered and received in the 2012/13 financial year is shown below. The amounts received by the State Revenue Office are paid into the Consolidated Fund in accordance with the Act and then paid equally into two GAIC funds, the Building New Communities Fund and the Growth Areas Public Transport Fund. These Funds are held by, and also financially reported on by, the DTPLI.
GAIC rates per hectare of Contribution Area
LAND TYPE YEAR ENDED 30 JUNE 2013 YEAR ENDED 30 JUNE 2012
Type A $84,960 $82,550
Type B1, B2 & C $100,890 $98,030

17
Summary of GAIC transactions for the year ended 30 June 2013
NUMBER OF TRANSACTIONS FOR THE YEAR
ENDED 30 JUNE 2013
TRANSACTION VALUE FOR THE
YEAR ENDED 30 JUNE 2013
NUMBER OF TRANSACTIONS FOR THE YEAR
ENDED 30 JUNE 2012
TRANSACTION VALUE FOR THE
YEAR ENDED 30 JUNE 2012
NOTES
GAIC Receipts 48 $16,045,887 38 $16,137,697 1
GAIC Refunds 0 0 2 $1,752,171 2
GAIC Deferred 13 $31,401,196 20 $43,660,319 3
Staged Payments Arrangements Agreed
12 $23,179,716 9 $33,270,691 4
Net Staged Payments Outstanding
19 $32,921,212 11 $23,903,196 5
Notes to Summary of GAIC transactions for the year ended 30 June 2012
1. The GAIC receipts by State Revenue Office of $16,045,887 (2011/12 - $16,137,697) includes interest received and refunds made, and has been paid into the Consolidated Fund as per section 201SZJ of the Planning and Environment (Growth Areas Infrastructure Contribution) Act 2010.
2. There were no GAIC refunds for the financial year ended 30 June 2013. The recognition of the two GAIC refunds of payments amounting to $1,752,171 is included in the reported net GAIC receipts of $16,137,697 for the year ended 30 June 2012.
3. Deferrals arise from purchase transactions whereby the liable party elects to defer all, or part of their GAIC liability until the next GAIC event. Should the liable party elect to defer part of the liability, then a payment of the non-deferred portion of the total liability is due and payable. The reported GAIC Deferred for the year is the total amount elected to have been deferred during the financial year. Some of those amounts may have subsequently been paid, or have been converted into Staged Payment arrangements.
4. The Minister for Planning, or the Chief Executive Officer of the GAA under delegated authority, approved staged payment arrangements in relation to twelve (12) GAIC events during the year ended 30 June 2013 (2011/12 - 9). The value of the staged payment arrangements approved for the year ended 30 June 2013 was $23,179,716 (2011/12 - $33,270,691).
5. The outstanding amounts in relation to approved staged payments arrangements are to be progressively reduced in accordance with the agreed payment arrangements. The total outstanding staged payments that had been approved by 30 June 2013, and were due for payment after 30 June 2013, amount to $32,921,212 (2011/12 - $23,903,196). Nineteen (19) staged payment arrangements were in place as at 30 June 2013 (2011/12 – 11).

18
GAIC receipts for each growth area
GROWTH AREA
TOTAL GAIC RECEIPTS FOR YEAR ENDED 1 JULY 2012
$
GAIC RECEIPTS FOR YEAR
ENDED 30 JUNE 2013
$
TOTAL GAIC RECEIPTS FOR
EACH GROWTH AREA AS AT
30 JUNE 2013 $
TOTAL PAID OR ACCRUED
OUT OF CONTRIBUTIONS
RECEIVED FOR EACH GROWTH
AREA AS AT 30 JUNE 2013
$
PROPORTION PAID OUT OF
CONTRIBUTIONS RECEIVED FOR EACH GROWTH
AREA* %
Casey** 9,349,638 $7,665,404 17,015,042 345,401 2.0
Cardinia** - - - - -
Hume 12,921,359 2,161,441 15,082,800 1,879,302 12.5
Melton 9,064,046 5,122,517 14,186,563 322,966 2.3
Mitchell 233,130 0 233,130 9,565 4.1
Whittlesea - - - - -
Wyndham 1,815,359 1,096,527 2,911,886 66,780 2.3
TOTAL $33,383,532 $16,045,889 $49,429,421 $2,624,014 5.3%
*Reported under section 201VC(b) of the Act** The Casey-Cardinia growth area proportion is of funds paid or accrued is 2%.
The amounts paid or accrued out of the Funds until 30 June 2012 amounted to $1,224,014, and a further $1,400,000 was paid out in the year ended 30 June 2013 ($1,400,000 out of the Building New Communities Fund and $0 out the Growth Areas Public Transport Fund.)
GAIC Funds
The reporting under section 201VC of the Act in relation to the two GAIC funds is set out below.
The amounts collected by the State Revenue Office are paid into the Consolidated Fund (in accordance with section 201SZJ of the Act. The amounts collected for the 2012/13 financial year are reported above.
Periodically the GAIC revenue that has been collected and paid into the Consolidated Fund are transferred to the two GAIC Funds, net of any GAIC refunds made. In 2012/13 no refunds were made (2011/12 – two refunds totalling $1,752,171). For the financial year ended 30 June 2013, an amount of $7,000,000 has been transferred to each of the Building New Communities Fund and the Growth Areas Public Transport Fund (a combined total of $14,000,000; 2011/12 - $17,970,536) in accordance with section 201V(2) of the Act.
The amount that has been paid out of the GAIC Funds for the year ending 30 June 2013 is $1,400,000 out of the Building New Communities fund (2011/12 - $0).
It will be noted that when the amounts received are split between the two Funds and reported by growth area municipality, that the quantity available for allocation to each growth area from each Fund is reasonably small.

19
Building New Communities Fund by growth area for the year ended 30 June 2013
GROWTH AREA
OPENING FUND BALANCE AS AT
1 JULY 2012 $
INTEREST EARNED FOR
THE YEAR $
AMOUNT PAID INTO THE FUND FOR THE YEAR
$
AMOUNT PAID OUT OF THE
FUND FOR THE YEAR
$
BALANCE OF THE FUND AS AT
30 JUNE 2013 $
Casey* 4,981,778 125,486 3,232,905 - 8,340,169
Cardinia* - - - - -
Hume 6,639,112 167,234 986,994 1,400,000 6,393,340
Melton 4,623,997 116,475 2,289,920 - 7,030,392
Mitchell 122,684 3,090 - - 125,774
Whittlesea - - - - -
Wyndham 932,385 23,486 490,181 - 1,446,052
TOTAL $17,299,956 **$435,771 $7,000,000 $1,400,000 $23,335,727
*Combined Casey-Cardinia growth area
Casey-Cardinia 4,981,778 125,486 3,232,905 - 8,340,169
**The interest receipt for the year of $433,842 was increased by an amount of $1,929 relating to a 2011/12 interest adjustment, to $435,771.
Allocations and payments made out of Building New Communities Fund for the year ended 30 June 2013
ALLOCATED TO GROWTH AREA
PURPOSE AMOUNT ALLOCATED
$
AMOUNT PAID
$
AMOUNT NOT YET
PAID $
Public Transport Victoria
Casey Berwick Station Park and Ride Upgrade
1,100,000 - 1,100,000
Roads Corporation of Victoria
Casey Upgrade of intersection South Gippsland Highway and Craig Road
1,000,000 - 1,000,000
Hume City Council Hume Upgrade of intersection Mickleham Road, Greenvale Gardens and Dellamore Boulevard
1,400,000 1,400,000 -
Hume City Council Hume Car parking and public open space at Hume Regional Tennis and Community Centre
1,000,000 - 1,000,000
Roads Corporation of Victoria
Melton Traffic signals at Ferris Road interchange intersection
1,500,000 - 1,500,000
Wyndham City Council
Wyndham Upgrade to bus facilities, car parking and public space of Events, Aquatic and Leisure Centre
900,000 - 900,000
TOTAL *$6,900,000 $1,400,000 **$5,500,000
* These payments are made net of GST.
** The net amount of allocations made out of the Building New Communities Fund not yet paid as at 30 June 2013 is $5,500,000. Therefore, the Building New Communities Fund balance on hand at 30 June 2013 amount of $23,335,727 (30 June 2012 - $17,299,956) has a commitment made against it of $5,500,000, reducing any balance available for allocation to $17,835,727.

20
Growth Areas Public Transport Fund by growth area for the year ended 30 June 2013
GROWTH AREA
OPENING FUND BALANCE AS AT
1 JULY 2012 $
INTEREST EARNED FOR
THE YEAR $
AMOUNT PAID INTO THE FUND FOR THE YEAR
$
AMOUNT PAID OUT OF THE FUND FOR THE YEAR
$
BALANCE OF THE FUND AS AT
30 JUNE 2013 $
Casey* 4,635,299 122,472 3,232,905 7,990,676
Cardinia* - - - - -
Hume 6,157,362 162,687 986,993 7,307,042
Melton 4,299,902 113,610 2,289,921 6,703,433
Mitchell 113,036 2,986 - - 116,022
Whittlesea - - - - -
Wyndham 865,289 22,862 490,181 1,378,332
TOTAL **$16,070,888 $424,617 $7,000,000 ***$0 ***$23,495,505
*Combined Casey-Cardinia growth area
Casey-Cardinia 4,635,299 122,472 3,232,905 7,990,676
** The net amount of allocations made out of the Growth Areas Public Transport Fund which were accrued at 30 June 2012 and had still not been transacted by cash as at 30 June 2013 is $657,474. So the Growth Areas Public Transport Fund funds on hand at 30 June 2013 of $23,495,505 (30 June 2012 - $16,070,888) are net of that amount. An amount was paid to the State Revenue Office in July 2013 in relation to the 2011/12 accrual.
*** No payments were made from the fund during the 2012/13 financial year. In addition, no accrual has been made for any amount due to the State Revenue Office (in accordance with section 201VA(c) of the Act) for the 2012/13 financial year. An amount of $1,103,440 (inclusive of GST) is due to the State Revenue Office as at 30 June 2013 for fees payable.
GAIC Works-In-Kind
The GAIC Works-in-Kind legislative amendments were gazetted on 29 June 2011. There were no GAIC Works-in-Kind Agreements in place as at 30 June 2013. The GAIC Works-In-Kind Guidelines and Model Agreement are currently being prepared and are anticipated to be released in the 2013 calendar year to be available for progressing GAIC Works-In-Kind applications.
21
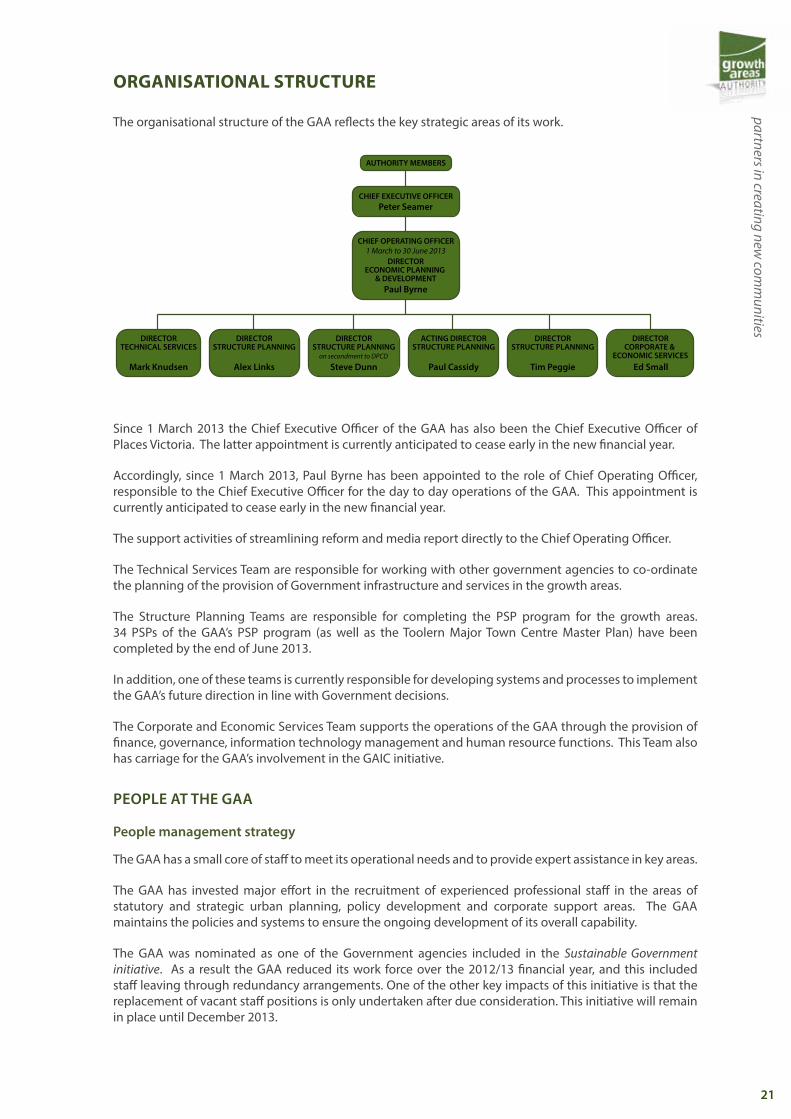
ORGANISATIONAL STRUCTURE
The organisational structure of the GAA reflects the key strategic areas of its work.
CHIEF EXECUTIVE OFFICER
AUTHORITY MEMBERS
DIRECTORSTRUCTURE PLANNING
Tim Peggie
DIRECTORTECHNICAL SERVICES
Mark Knudsen
DIRECTORSTRUCTURE PLANNING
Alex Links
Peter Seamer
CHIEF OPERATING OFFICER
DIRECTORECONOMIC PLANNING
& DEVELOPMENT
1 March to 30 June 2013
DIRECTORSTRUCTURE PLANNING
Steve Dunn
ACTING DIRECTORSTRUCTURE PLANNING
Paul Cassidy
DIRECTORCORPORATE &
ECONOMIC SERVICESEd Small
on secondment to DPCD
Paul Byrne
Since 1 March 2013 the Chief Executive Officer of the GAA has also been the Chief Executive Officer of Places Victoria. The latter appointment is currently anticipated to cease early in the new financial year.
Accordingly, since 1 March 2013, Paul Byrne has been appointed to the role of Chief Operating Officer, responsible to the Chief Executive Officer for the day to day operations of the GAA. This appointment is currently anticipated to cease early in the new financial year.
The support activities of streamlining reform and media report directly to the Chief Operating Officer.
The Technical Services Team are responsible for working with other government agencies to co-ordinate the planning of the provision of Government infrastructure and services in the growth areas.
The Structure Planning Teams are responsible for completing the PSP program for the growth areas. 34 PSPs of the GAA’s PSP program (as well as the Toolern Major Town Centre Master Plan) have been completed by the end of June 2013.
In addition, one of these teams is currently responsible for developing systems and processes to implement the GAA’s future direction in line with Government decisions.
The Corporate and Economic Services Team supports the operations of the GAA through the provision of finance, governance, information technology management and human resource functions. This Team also has carriage for the GAA’s involvement in the GAIC initiative.
PEOPLE AT THE GAA
People management strategy
The GAA has a small core of staff to meet its operational needs and to provide expert assistance in key areas.
The GAA has invested major effort in the recruitment of experienced professional staff in the areas of statutory and strategic urban planning, policy development and corporate support areas. The GAA maintains the policies and systems to ensure the ongoing development of its overall capability.
The GAA was nominated as one of the Government agencies included in the Sustainable Government initiative. As a result the GAA reduced its work force over the 2012/13 financial year, and this included staff leaving through redundancy arrangements. One of the other key impacts of this initiative is that the replacement of vacant staff positions is only undertaken after due consideration. This initiative will remain in place until December 2013.

22
Occupational health and safety
The GAA has a clear commitment to occupational health and safety compliance as well as general staff health and well-being, set out in its “A Healthy, Safe and Supportive Workplace Policy”.
The GAA maintains an Occupational Health and Safety Committee which meets regularly during the year.
During the reporting year the Authority had:
• 28 staff receive influenza vaccinations
• 0 incidents relating to our premises reported to WorkSafe
• 2 comprehensive internally conducted workplace inspections
• Appointed 2 new trained fire wardens
• Appointed 2 new Committee employee representative members (2 retired)
• Provided free WorkHealth checks for 16 staff
• 4 first aiders attended CPR refresher training
Managing and valuing diversity and merit
The GAA promotes equal employment opportunity through diversity in its policies and practices. In light of the small number of employees, a flexible and supportive workplace is provided through flexible working hours and leave arrangements.
GAA policies and programs consider issues relating to women, youth, and people from indigenous, culturally and linguistically diverse backgrounds. Activities relating to diversity included staff holding “A Taste of Harmony” lunch during Harmony Week in March 2013. Staff also participated in raising funds for the Cancer Council with a ‘Australia’s Biggest Morning Tea’ function during May 2013.
The Chief Executive Officer made 2 internal appointments and 4 external appointments based on merit during the period.
Number of Staff at Growth Areas Authority (headcount) as at 30 June 2013
CATEGORY STAFF 2013 STAFF 2012
VPS 1-7 Staff
Male 20 29
Female 20 21
Executive Staff
Male 4 5
Female 1 1
TOTAL STAFF 45 56
CATEGORY STAFF 2013 STAFF 2012
All Staff
Male 24 34
Female 21 22
TOTAL 45 56
The GAA Enterprise Agreement 2012 came into effect on 16 January 2013 and has a nominal expiry date of 31 December 2015. In reaching this outcome, the GAA held various discussions with its staff and their relevant representatives in order to progress the good faith bargaining of a nexus enterprise agreement in line with Victorian Public Services Agreement. The GAA Enterprise Agreement 2012 was voted on, and supported by the staff and approved by FairWork Australia.

23
Upholding public sector conduct
The GAA is responsible for promoting high standards of integrity and conduct in the public sector. Staff observe, and are fully informed about, the Code of Conduct for the Victorian Public Sector and the Public Administration Act 2004 regarding “Upholding public sector conduct”.
The Public Administration Act 2004 provides the following employment and conduct principles:
EMPLOYERS MUST ENSURE: EMPLOYEES MUST:
• Decisions are made on merit • Act with impartiality
• Employees are treated fairly and reasonably • Display integrity, including avoiding real or apparent conflicts of interest
• Equal employment opportunity is provided • Show accountability for actions
• Reasonable avenues of redress exist against unfair and unreasonable treatment
• Provide responsive service
New staff are required to undertake online training in regard to conflicts of interest and ethical behaviour and existing staff also had access to this online training to update their knowledge in these areas. Staff were also provided with an annual refresher training in September 2012 on code of conduct, whistleblower’s protection (now replaced by protected disclosures), probity, conflict of interest, record keeping, privacy, freedom of information, bullying and harassment, equal opportunity and human rights.
ADDITIONAL INFORMATION
Environment Strategy
The GAA is committed to working towards environmental sustainability in both its operations and in the planning of new communities. It will do this by:
1. Striving to be an environmentally responsible organisation in its own operations.
2. Working towards improving the liveability and sustainability of the natural and built environment within new communities.
The 2012/13 Business Plan includes the promotion of sustainable development as one of the GAA’s objectives, and environmental sustainability aspects are included in the strategic priorities of the Business Plan. Results against the Business Plan measures are reported in the Growth Areas Performance segment of the Annual Report.
Office Based Targets and Initiatives
New Initiatives:
The centre management has introduced a new recycling initiative to dispose of redundant electronic equipment. This service is available to the GAA and other occupants at 35 Collins Street. Building management receives a standard mass balance report, and also destruction certificates which ensures that the goods were completely disassembled and recycled.

24
Ongoing Initiatives:
Measures:
INDICATOR 2012/2013 ACTUAL
ESTIMATED CARBON
EQUIVALENT (TONNES)
2011/2012 ACTUAL
ESTIMATED CARBON
EQUIVALENT (TONNES)
NET % CHANGE
NOTES
ELECTRICITY
Greenhouse missions offset 25% 25% No change 1
Total electricity used (kWh) 57,467 64.1 66,960 90.76 -29%
PAPER
Daily paper ream use per employee
0.033 2.04 0.084 4.84 -58% 2
TRANSPORT
Annual total Hybrid Pool Vehicle travel (km)
18,908 2.24 14,404 1.86 20%
New staff taking up public transport options for travel
100% Data N/A 67% Data N/A 49% 3
Other Transport per employee per year (Km)
120 1.41 120 1.64 -14%
Number of flights taken - national
1 0.57 2 0.64 -11%
Number of flights taken - international
0 0.00 0 0.00 No change
WATER
Total water used (kL) Data N/A Data N/A 4
Total emissions 70.36 99.74 -29%
1. Greenhouse Emissions Offset - The GAA participates in the GreenPower program with Origin Energy whereby 25% of the electricity consumption is offset with electricity from GreenPower accredited renewable sources.
2. A reduction in use through a combination of fewer extensive communication activities and a reduction in stock on hand levels.
3. Public Transport - Public transport ticket deduction has shown an acceptance of 100% for new, eligible, GAA staff for the 2012/13 year.
4. Water Consumption - Water consumption is centrally managed by AMP building management. The information was not available on a tenancy basis.
Waste Management
The GAA continues to participate in an enhanced waste management program, which was introduced by the Collins Place Management in 2011/2012. This incorporates:
• Expanded co-mingled recycling, including recycling boxes at all staff desks
• Removal of rubbish bins from all staff desks
• Introduction of separate bin and collection for organic waste

25
Waste Management audits are conducted throughout the year to measure and provide feedback on recycling efforts. The most recent recycling program update shows that the building is now recycling 84% of the average daily waste, which is an increase of 15% from July 2012. While this is a significant improvement, data shows that 25% of the landfill content is made up of potentially recyclable materials. The GAA aims to ensure that it does not contribute to any unfavourable results and assists in reducing the overall landfill component. The 2012/13 waste management results for the building are set out in the table below.
Other waste, 75%
Cardboard, 1%
Commingled Containers, 8%
Organic Waste, 10%
Paper, 6%
2012/13 waste management for 35 Collins Street, Melbourne
Freedom of Information
Victoria’s Freedom of Information Act 1982 (FOI Act) gives members of the public the right to apply for access to documents held by an agency, including the GAA. Documents include, but are not limited to: paper and electronic documents, maps, tapes and graphs. The two main categories of information normally requested under the FOI Act include individuals asking for their personal documents, and requests for documents relating to the activities of government.
The GAA officer responsible for receiving and initially actioning requests made under the FOI Act is Ed Small, who can be contacted on 03 9651 9600 or [email protected]. As from 1 July 2013, there is a fee of $25.70 payable for each FOI application (2012/2013 $25.10).
The Department of Justice also provides general information about making FOI requests on the website, FOI online. A copy of the FOI Act is available at www.foi.vic.gov.au.
During 2012/2013 six new requests were received by the GAA (2011/12- four). All requests related to activities of government.
Other information required to be available in accordance with FRD22D and Freedom of Information Act 1982
The following information, where it relates to the GAA and is relevant to the financial year 2012-2013, is available to the Minister for Planning, Members of Parliament and the public on request:
• A statement that declarations of pecuniary interests have been duly completed by all relevant officers
• Changes in fees, charges, rates or levies charged
• Details of shares held by a senior officer as nominee or held beneficially in a statutory authority or subsidiary

26
• Details of publications produced by the entity, about the entity, and the places where the publications can be obtained
• Details of any major external reviews carried out on the entity
• Details of any major research and development activities undertaken by the entity
• Details of overseas visits undertaken including a summary of the objectives and outcomes of each visit
• Details of major promotional, public relations and marketing activities undertaken by the entity to develop community awareness of the entity and the services it provides
• Details of assessments and measures undertaken to improve the occupational health and safety of employees, not otherwise detailed in the Report of Operations
• A general statement on industrial relations within the entity and details of time lost through industrial action and disputes
• A list of major committees sponsored by the entity, the purposes of each committee, and the extent to which the purposes have been achieved
• Details of all consultancies and contractors including:
- consultants/contractors engaged
- services provided
- expenditure committed to for each engagement
Protected Disclosures Act 2012 (Whistleblowers Protection Act 2001)
The Protected Disclosures Act 2012 (PD Act) replaces the Whistleblowers Protection Act 2001 and commenced in February 2013. It forms part of the new integrity system for Victoria, including the newly formed Independent Broad-based Anti-corruption Commission (IBAC) and other entities. The PD Act aims to provide a system for people to disclose improper conduct by public officers and public bodies as well as protection from detrimental action.
The GAA encourages the reporting of known or suspected incidences of improper conduct or detrimental actions to IBAC. The contact at the GAA is Ed Small, on (03) 9651 9600 or [email protected]. Alternatively, IBAC contacts are via www.ibac.vic.gov.au, or 1300 735 135.
During 2012/2013 there were no disclosures or investigations of improper conduct or detrimental actions made to the GAA or any referred to IBAC (2011/2012 – nil).
The GAA has adopted a Protected Disclosures Policy and is developing a Protected Disclosures Procedure document.
Improving Accessibility
The GAA is committed to providing access to information to all members of the community. In relation to the access to material on the GAA’s website, the GAA provides detailed information on how to access and read GAA documents, and provides a contact facility for resolving any queries, by way of the e-mail address of [email protected].
Extent and compliance with the Building Act 1993
The GAA complies with the building and maintenance provisions of the Building Act 1993 in its capacity as an occupant of leased premises.
Victorian Industry Participation Policy (VIPP) and disclosure of major contracts
During the reporting period, the GAA did not commence or conclude any contracts to which VIPP applied.

27
National Competition Policy
As a portfolio agency, the GAA’s information on compliance is included in the Department of Transport, Planning and Local Infrastructure’s Annual Report.
Competitive neutrality seeks to enable fair competition between government and private sector businesses. Any advantages or disadvantages that government businesses may experience simply as a result of government ownership, should be neutralised. The GAA continues to implement and apply this principle to its business undertakings where applicable.
Contracts and Consultancies
During the financial year, the GAA engaged 43 consultants (2011/2012 - 43) where the total fees per contract payable to the consultant during the financial year was less than $100,000 at a total cost of $1,709,278 (2011/2012 - $2,242,018).
There were six consultancies in place during the 2012/13 financial year where the anticipated total expenditure is over $100,000 (2011/2012 - 6). No consultancies or contracts in excess of $100,000 (excluding GST) were entered into in 2012/13 (2011/12 – 2).
CONTRACTOR AMOUNT OF CONTRACT (EX GST) $
REASON FOR CONTRACT
AMOUNT EXPENDED IN
2012-13 (EX GST)
$
OUTSTANDING COMMITMENTS
AS AT 30 JUNE 2013
(EX GST)
Biosis Research Pty Ltd 789,000 Assessment and Mapping of Native Vegetation and Fauna
18,378 0
Ecology Partners 112,515 Biodiversity Mapping Services 2010/2011
50,389 0
Tract Consultants Pty Ltd 220,000 Major Activity Centre Urban Design Framework
2,450 0
SMEC Australia Pty Ltd 196,598 Assessment and Mapping of Native Vegetation and Fauna
34,227 0
WSP Environment and Energy Pty Ltd
187,000 Biodiversity Mapping Services
119,786 0
Ecology Partners 216,727 Biodiversity Mapping Services (2010 UGB areas)
60,531 0

28
RISK MANAGEMENT
The GAA has a Risk Management Plan and Risk Register in place prepared in accordance with the Australian Standard AS/NZS ISO 31000:2009. The Risk Register was prepared from Risks identified through workshops with GAA staff members and the contribution of Authority Members. The Risk and Audit Committee regularly monitor the risk management and risk mitigation progress. The GAA has ensured that the risk profile has been reviewed regularly, both internally and externally.
These processes have enabled the Risk and Audit Committee at its meeting of 14 August 2013 to endorse the GAA’s Chair as the attester of risk management processes contained in this annual report.
Attestation by Chair in relation to Risk Management at the GAA:
I, Chris Banks, certify that the Growth Areas Authority has risk management processes in place consistent with the Australian Risk Management Standard AS/NZS ISO 31000:2009 and an internal control system in place that enables the executive to understand, manage and satisfactorily control risk exposures. The Risk and Audit Committee of the Growth Areas Authority verifies this assurance and that the risk profile of the Growth Areas Authority has been critically reviewed in the last twelve months.
Chris BanksChairAugust 2013

29
SUMMARY OF THE FINANCIAL RESULTS
Year ended 30 June 2013
Year ended 30 June 2012
Year ended 30 June 2011
Year ended 30 June 2010
Year ended 30 June 2009
$ $ $ $ $
INCOME
Government Contributions 4,630,000 10,958,000 11,760,000 11,988,000 12,352,000
Other revenue 3,159,079 2,176,752 591,450 971,087 1,022,499
TOTAL REVENUE 7,789,079 13,134,752 12,351,450 12,959,087 13,374,499
EXPENSES
Operating Expenditure 2,691,125 2,980,565 *3,245,480 *3,012,748 5,033,469
Project Expenditure 6,303,427 8,676,424 *8,787,242 *8,774,761 2,440,536
TOTAL EXPENDITURE 8,994,552 11,656,989 12,032,722 11,787,509 7,474,005
NET RESULT (1,205,473) 1,477,763 318,728 1,171,578 5,900,494
ASSETS
Current Assets 12,169,291 13,773,125 12,031,830 11,997,234 10,407,723
Non-Current Assets 104,343 201,290 286,407 152,604 75,983
GROSS ASSETS 12,273,634 13,974,415 12,318,237 12,149,838 10,483,706
LIABILITIES
Current Liabilities 1,572,256 1,997,319 1,831,154 2,114,645 1,576,339
Non-Current Liabilities 135,531 205,776 193,527 60,365 104,117
GROSS LIABILITIES 1,707,787 2,203,095 2,024,681 2,175,010 1,680,456
NET EQUITY 10,565,847 11,771,320 10,293,556 9,974,828 8,803,250
*Note: The Operating expenditure and Project expenditure for the periods ending 2011 and 2010 have been restated to reflect correctly the split between the categories of expenditure which is comparable to the reported figures in 2012 and 2013.
Changes in financial position
The additional funding allocation of $5 million per annum from the Victorian Government to undertake the preliminary strategic planning activities for that land brought within the UGB in 2010 lapsed in 2011/12. During the 2012/13 financial year a proportion of the funding received in prior years has continued to be used in the delivery of the GAA’s PSP program for Melbourne’s growth areas. However, with the reduction in the provision of funding to the GAA, and the impact of the Sustainable Government initiative, the level of activity in the GAA has been reduced from earlier years. This is also reflected in the reduced project expenditure.
The GAA also received a greater level of contributions from third parties to assist in funding the background studies required to be undertaken to support the strategic plans. These are not contributions towards the general operations of the GAA, and any over-recovery of contributions will need to be refunded.
The GAA still has good cash reserves at 30 June 2013 due to very close financial management, and reduced activity. These funds on hand at the end of June 2013 have been provided for the agreed purposes of strategic planning and are forecast to be largely expended over the 2013/14 and 2014/15 financial years in order to progress the Precinct Structure Plan program in accordance with the GAA’s announced timetable.

30
DISCLOSURE INDEX
The 2012/13 Annual Report of the Growth Areas Authority is prepared in accordance with all relevant Victorian legislation. This index has been prepared to facilitate identification of the Authorities’ compliance with statutory disclosure requirements.
FRD DISCLOSURE PAGE
22C Manner of establishment and the relevant Ministers 3 & 9
22C Objectives, functions, powers and duties 9
22C Nature and range of services provided 10
22C Organisational structure, names and functional areas of responsibility of senior officers 21
22C Names of board members and major committees 11
22C Statement of workforce data for current and previous financial year 22
22C Merit and equity 22
15B Executive Officer disclosures 44
22C 5 year summary of the financial results 29
22C Significant changes in financial position during the year 29
22C Objectives and performance against objectives 13
22C Major changes or factors affecting performance 15
22C Subsequent events which will affect operations in future years 45
22C Details of consultancies > $100,000 27
22C Details of consultancies - total No. and cost < $100,000 27
12A Disclosure of major contracts 27
22C Application and operation of FOI Act 1982 25
22C Application and operation of the Protected Disclosure Act 2012/Whistleblowers Protection Act 2001 26
22C Compliance with building and maintenance provisions of Building Act 1993 26
22C Statement on NCP 27
22C OHS 22
10 Disclosure index 30
22C Statement of availability of other information 25
29 Workforce data Disclosures in the Report of Operations – Public Service Employees 22
FINANCIAL STATEMENTS REQUIRED UNDER PART 7 OF THE FINANCIAL MANAGEMENT ACT 1994
SD 4.2(f ) Model Financial ReportSD 4.2(b) Operating StatementSD 4.2(b) Balance SheetSD 4.2(a) Statement of Changes in EquitySD 4.2(b) Cash flow Statement SD 4.2(c) Accountable Officer’s declaration SD 4.2(c) Compliance with Australian Accounting Standards and
other authoritative PronouncementsSD 4.2(c) Compliance with Ministerial DirectionsSD 4.2(d) Rounding of amounts PronouncementsSD 4.2(c) Compliance with Ministerial Directions SD 4.2(d) Rounding of amounts
31
OTHER DISCLOSURES IN NOTES TO THE FINANCIAL STATEMENTS
FRD 13 Disclosure of Parliamentary appropriationsFRD 9A Departmental disclosure of administered assets and liabilitiesFRD 11 Disclosure of ex-gratia paymentsFRD 21B Responsible Person and Executive Officer disclosuresFRD 120F Accounting and Reporting Pronouncements applicable to the 2012-13 reporting period
LEGISLATION
Building Act 1993Financial Management Act 1994 Freedom of Information Act1982Multicultural Victoria Act 2004Planning and Environment Act 1987Protected Disclosures Act 2012Public Administration Act 2004Victorian Industry Participation Policy Act 2003Whistleblowers Protection Act 2001 (until February 2013)

32
ANNUAL FINANCIAL STATEMENTS – 30 JUNE 2013
CONTENTS
Comprehensive Operating Statement
For the year ended 30 June 2013
Balance Sheet
As at 30 June 2013
Statement of Changes in Equity
For the year ended 30 June 2013
Cash Flow Statement
For the year ended 30 June 2013
Notes to the financial statements
Note 1 Summary of significant accounting policiesNote 2 Other IncomeNote 3 Expenses from transactionsNote 4 ReceivablesNote 5 Property, plant and equipmentNote 6 PayablesNote 7 ProvisionsNote 8 Financial InstrumentsNote 9 Responsible personsNote 10 Remuneration of AuditorsNote 11 Contingent liabilities and contingent assetsNote 12 Commitments for expenditureNote 13 SuperannuationNote 14 Subsequent eventsNote 15 Cash flow informationNote 16 Glossary of Terms
Accountable Officer’s and Chief Financial Officer’s declaration
Auditor General’s Report

33
Page 35
Comprehensive Operating Statement For the year ended 30 June 2013
Note 2013 2012
Income from Transactions $ $
Grants from State Government 1(b) 4,630,000 9,631,000
Other Grants including Commonwealth Funding 1(b) - 1,327,000
Interest 1(b) 364,901 511,149
Other Income 1(b),2 2,794,178 1,665,603
Total Income from Transactions 7,789,079 13,134,752
Expenses from Transactions
Employee benefits 1(i), 3 5,604,068 6,813,122
Depreciation & amortisation expense 1(e),3 96,947 133,197
Other operating expenses 3 3,316,071 4,635,323
Total Expenses from Transactions 9,017,086 11,581,642
Net result from Transactions for the period (1,228,007) 1,553,110
Other Economic Flows included in Net Result Net gain/(loss)from revaluation of long service leave liability
22,534 (75,346)
Comprehensive Result (1,205,473) 1,477,764
The above comprehensive operating statement should be read in conjunction with the accompanying notes.
Balance Sheet As at 30 June 2013
Assets Note 2013 2012
Financial Assets $ $
Cash and cash equivalents 1(f), 15 11,059,442 13,015,465
Receivables 1(g),4, 8 1,044,305 691,475
Total Financial Assets 12,103,747 13,706,940
Non Financial Assets Prepayments
65,544 66,184
Property, plant & equipment 5 104,343 201,290
Total Non Financial Assets 169,887 267,474
Total Assets 12,273,634 13,974,414
Liabilities
Payables 1(h), 6, 8 698,138 1,289,439
Provisions 1(i), 7 1,009,649 913,655
Total Liabilities 1,707,787 2,203,094
Net Assets 10,565,847 11,771,320
Equity
Accumulated funds 10,565,847 11,771,320
Total Equity 10,565,847 11,771,320
The above balance sheet should be read in conjunction with the accompanying notes.

34
Page 36
Statement of Changes in Equity For the year ended 30 June 2013
Accumulated Surplus Total
$ $ Balance as at 1 July 2011 10,293,556 10,293,556 Total Comprehensive Result 1,477,764 1,477,764 Balance at 30 June 2012 11,771,320 11,771,320 Balance as at 1 July 2012 11,771,320 11,771,320
Total Comprehensive Result (1,205,473) (1,205,473) Balance at 30 June 2013 10,565,847 10,565,847
The above statement of changes in equity should be read in conjunction with the accompanying notes.
Cash Flow Statement For the year ended 30 June 2013
Note 2013 2012
Cash flows from operating activities $ $
Receipts
Receipts from Government 4,630,000 10,708,000
Receipts from other entities 3,259,933 1,619,000
Interest received 372,067 514,428
Total receipts 8,262,000 12,841,428
Payments
Payments to suppliers and employees (10,323,813) (11,737,463) Goods and Services Tax received from the ATO 105,790 216,560
Total Payments (10,218,023) (11,520,903) Net cash provided by / (used in) operating activities 15 (1,956,023) 1,320,525
Cash flows from investing activities Payments for property plant and equipment 5 - (48,080) Net cash provided by / (used in) investing activities - (48,080) Net cash used in/(provided by) operating activities (1,956,023) 1,272,445 Cash and cash equivalents at the beginning of the financial year 13,015,465 11,743,020 Cash and cash equivalents at the end of the financial year 15 11,059,442 13,015,465
The above cash flow statement should be read in conjunction with the accompanying notes.

35
Notes to the financial statements
For the year ended 30 June 2013
Page 37
Notes to the financial statements For the year ended 30 June 2013 Note 1 Summary of significant accounting policies
The financial statements include all controlled activities of the GAA. The Authority was proclaimed on 1 September 2006 and this report is for the year 1 July 2012 to 30 June 2013.
(a) Basis of Accounting
This general purpose financial report has been prepared on an accrual and going concern basis in accordance with the Financial Management Act 1994, Australian Accounting Standards and Urgent Issues Group Interpretations. Accounting standards include Australian equivalents to International Financial Reporting Standards (A-IFRS). These financial statements are presented in Australian dollars, the functional and presentation currency of the Authority. The financial report has been prepared in accordance with the historical convention. Cost is based on the fair values of the consideration given in exchange for assets. In the application of A-IFRS, management is required to make judgements, estimates and assumptions about carrying values for assets and liabilities that are not readily apparent from other sources. The estimates and associated assumptions are based on historical experience and various other factors that are believed to be reasonable under the circumstance, the results of which form the basis of making judgements. Actual results may differ from these estimates. The estimates underlying assumptions are reviewed on an ongoing basis. Revisions to accounting estimates are recognised in the period in which the estimate is revised if the revision affects only that period or in the period of the revision and future periods if the revision affects both current and future periods.
(b) Income recognition Grants from State Government The GAA is funded by Parliamentary process for the provision of outcomes through the Department of Planning and Community Development. Outcomes which the Authority provides to Government, Growth Area Councils, Developers and others are recognised when those outcomes have been delivered. Other Grants including Government funding Other grants are Government (State and Commonwealth) allocations for a specific purpose. Interest This recognises all interest received and accrued interest on cash and other amounts due to the GAA. Other Income Other income received from third parties (including Councils or Developers), including funding received for specific projects or tasks.
(c) Property, plant and equipment All non- financial physical assets, are measured initially at cost and subsequently revalued at fair value less accumulated depreciation and impairment. Where an asset is acquired for no or nominal cost, the cost is its fair value at the date of acquisition. Assets transferred as part of a machinery of government change are transferred at their carrying amount.
(d) Impairment of assets All assets are assessed annually for indication of impairment, except for financial assets (refer note 8(b)). If there is an indication of impairment, the assets concerned are tested as to whether their carrying value exceeds their recoverable amount. Where an asset’s carrying value exceeds its recoverable amount, the difference is written off by a charge to the operating statement except to the extent that the write down can be debited to an asset revaluation reserve amount applicable to that class of asset. The recoverable amount for most assets is measured at their higher of depreciated replacement cost and fair value less costs to sell. Recoverable amount for assets held primarily to generate cash flows is measured at the higher of the present fair value of future cash flows expected

36
Notes to the financial statements
For the year ended 30 June 2013 (cont.)
Page 38
Notes to the financial statements For the year ended 30 June 2013 (cont.)
to be obtained from the asset and fair value less costs to sell. It is deemed that, in the event of the loss of an asset, the future economic benefits arising from the use of the asset will be replaced unless a specific decision to the contrary has been made.
(e) Depreciation of property plant and equipment Depreciation is provided on property, plant and equipment. Depreciation is calculated on a straight line basis to write off the cost of each asset over its expected useful life to its estimated residual value. Estimates of the remaining useful lives are reviewed at least annually for all assets.
The useful lives for the financial period are: Computer software and hardware 3 years
Leasehold improvements 3 years
Furniture and equipment 5 years Where assets have separately identifiable components, those components are assigned useful lives distinct from the item of plant and equipment to which they relate and are depreciated accordingly.
(f) Cash and cash equivalents For the purpose of the cash flow statement, cash and cash equivalents includes cash on hand and short term deposits which are less than 3 months that are readily convertible to cash on hand and are subject to an insignificant risk in changes in value, net of outstanding cheques yet to be presented by the Authority’s suppliers and creditors.
(g) Receivables Trade debtors are recognised at the amount of the receivable, as they are due for settlement at no more than 30 days from the date of recognition. Collectability of debtors is reviewed on an ongoing basis. Debts that are known to be uncollectible are written off. A provision for doubtful debts is raised when some doubt as to collection exists.
(h) Payables These amounts represent liabilities for goods and services provided to the Authority prior to the end of the financial period and are unpaid.
(i) Employee benefits (i) Wages, salaries, on-costs, sick and annual leave
AASB 119 defines short-term benefits as employee benefits that fall due wholly within 12 months after the end of the period in which the employees render the related service. Therefore, liabilities for employee benefits such as wages, salaries and annual leave are required to be measured at nominal value where they are expected to be settled within 12 months of the reporting date. Regardless of the expected timing of settlements, provisions made in respect of employee benefits are classified as a current liability, unless there is an unconditional right to defer the settlement of the liability for at least 12 months after the reporting date, in which case it would be classified as a non-current liability.
(ii) Long Service Leave The requirement for long service leave is recognised in the provision for employee benefits and measured as the present value of expected future payments to be made in respect of services provided by employees up to the reporting date. Consideration is given to expected future wage and salary levels, experience of employee departures and periods of service. Expected future payments are discounted using market yields at the reporting date on national government bonds with terms to maturity and currency that match, as closely as possible, the estimated future cash outflows. Provisions made for unconditional long service leave are classified as a current liability, where the employee has a present entitlement to the benefit. The non-current liability represents long service leave entitlements accrued for employees with less than 7 years of continuous service.

37
Notes to the financial statements
For the year ended 30 June 2013 (cont.)
Page 39
Notes to the financial statements For the year ended 30 June 2013 (cont.)
(iii) Superannuation
The amount charged to the operating statement in respect of superannuation represents the contributions made by the Authority to the relevant superannuation funds in respect to the services of staff on the relevant rules of the plan. No liability is shown for unfunded superannuation in the Balance Sheet as the Department of Treasury and Finance assume the liability where such a liability might arise. The current year employer contribution payments on behalf of the Authority’s employees is disclosed in note 13.
(j) Provisions Provisions are recognised when the Authority has a present obligation, the future sacrifice of economic benefits is payable and the amount of the provision can be measured reliably. The amount recognised as a provision is the best estimate on the consideration required to settle the present obligation at reporting date, taking into account the risks and uncertainties surrounding the obligation. Where a provision is measured using the cashflows estimated to settle the present obligation, its carrying amount is the present value of those cashflows. Where some or all of the economic benefits required to settle a provision are expected to be recognised from a third party, the receivable is recognised as an asset if it is virtually certain that recovery will be received and the amount of the receivable can be measured reliably.
(k) Goods and services tax
Revenue, expenses and assets are recognised net of the amount of goods and services tax (GST), except where the amount of GST incurred is not recoverable from the taxation authority. In these circumstances the GST is recognised as part of the cost of the acquisition of an asset or part an item of expense. Receivables and payables are recognised inclusive of GST. The net amount of GST recoverable from, or payable to, the taxation authority is included as part of receivables or payables. Cash flows arising from operating activities are included in the cash flow statement of a gross basis. The GST component of cash flows arising from investing and financing activities which is recoverable from, or payable to, the taxation authority is classified as operating cash flows.
(l) Financial instruments
The accounting policies applied to financial instruments are detailed in notes 8(a) and 8(b). (m) Rounding of amounts
Amounts in the financial report have been rounded to the nearest dollar.
(n) Prospective Accounting Standards The Authority has reviewed prospective accounting standards and has assessed their impact as immaterial.
Note 2 Other Income For the year ended
30 June 2013 For the year ended
30 June 2012
$ $
Contributions 2,792,745 1,665,151
Other Current Income 1,433 452
Total Other Income 2,794,178 1,665,603
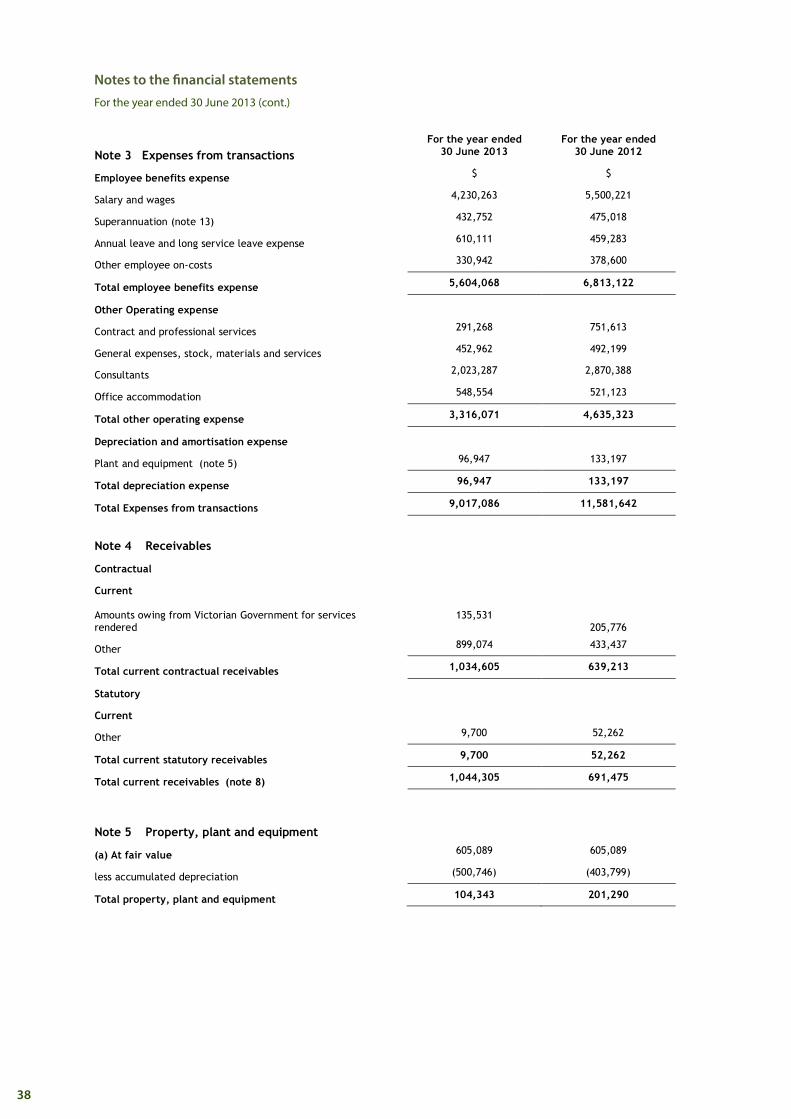
38
Notes to the financial statements
For the year ended 30 June 2013 (cont.)
Page 40
Notes to the financial statements For the year ended 30 June 2013 (cont.)
Note 3 Expenses from transactions
For the year ended 30 June 2013
For the year ended 30 June 2012
Employee benefits expense $ $
Salary and wages 4,230,263 5,500,221
Superannuation (note 13) 432,752 475,018
Annual leave and long service leave expense 610,111 459,283
Other employee on-costs 330,942 378,600
Total employee benefits expense 5,604,068 6,813,122
Other Operating expense
Contract and professional services 291,268 751,613
General expenses, stock, materials and services 452,962 492,199
Consultants 2,023,287 2,870,388
Office accommodation 548,554 521,123
Total other operating expense 3,316,071 4,635,323
Depreciation and amortisation expense
Plant and equipment (note 5) 96,947 133,197
Total depreciation expense 96,947 133,197
Total Expenses from transactions 9,017,086 11,581,642
Note 4 Receivables
Contractual
Current
Amounts owing from Victorian Government for services rendered
135,531
205,776
Other 899,074 433,437
Total current contractual receivables 1,034,605 639,213
Statutory
Current
Other 9,700 52,262
Total current statutory receivables 9,700 52,262
Total current receivables (note 8) 1,044,305 691,475
Note 5 Property, plant and equipment
(a) At fair value 605,089 605,089
less accumulated depreciation (500,746) (403,799)
Total property, plant and equipment 104,343 201,290

39
Notes to the financial statements
For the year ended 30 June 2013 (cont.)
Page 41
Notes to the financial statements For the year ended 30 June 2013 (cont.) (b) Movements during the financial year to June 2013
Opening WDV at 1 July 2012
$
Re-allocations between classes
Additions $
Depreciation $
Closing WDV at 30 June 2013
$
Computer hardware At cost 71,096 - - 41,506 29,590
Computer software At cost 99,043 - - 32,501 66,542
Leasehold Improvements 18,570 - - 18,565 5
Furniture and Equipment 12,581 - - 4,375 8,206
Totals 201,290 - - 96,947 104,343
(c) Movements during the financial year to 30 June 2012
Opening WDV at
1 July 2011 $
Re-allocations between classes
$
Additions $
Depreciation $
Closing WDV at 30 June 2012
$
Computer hardware At cost 116,576 (268) - 45,212 71,096
Computer software At cost 86,810 284 44,450 32,501 99,043
Leasehold Improvements 69,690 (7) - 51,113 18,570
Furniture and Equipment 13,331 (9) 3,630 4,371 12,581
Totals 286,407 - 48,080 133,197 201,290
Note 6 Payables
For the year
ended 30 June 2013
For the year
ended 30 June 2012
Current $ $
Trade creditors (i) - 41,350
Accruals 698,138 1,248,089
Total current payables 698,138 1,289,439
(i) The average trade credit period is 30 days. No interest is charged on the trade creditors or other payables
for the first 30 days from the date of the invoice. Thereafter, interest may be charged at differing rates determined by the individual trade arrangements entered into.
Note 7 Provisions
2013 2012
Current
$ $
Annual leave
385,864 355,276 Long service leave – that falls within 12 months after the end of the period, measured at a nominal value
32,413 34,391
Long service leave – that does not fall within 12 months after the end of the period, measured at present value
298,335 318,520
Total current provisions
716,612 708,187
Non Current
Provisions – Long service leave
293,037 205,468
Total non current provisions
293,037 205,468
Aggregate carrying amount of provisions
Current
716,612 708,187
Non current
293,037 205,468
Total Provisions
1,009,649 913,655

40
Notes to the financial statements
For the year ended 30 June 2013 (cont.)
Page 42
Notes to the financial statements For the year ended 30 June 2013 (cont.) Note 8 Financial instruments (a) Accounting policies, terms and conditions
The GAA’s accounting policies, including the terms and conditions of each class of financial assets, financial liability and equity instrument, both recognised and unrecognised at balance date are as follows:
Recognised Financial
Instruments
Statement of financial position
Notes Accounting Policy Category
Financial Assets
Cash assets 1(f),15
Cash and cash equivalents comprise cash on hand and cash at bank,
deposits at call and liquid investments and are recorded at
nominal amounts
Contractual Financial Assets – Loans and Receivables
Receivables 1(g),4
Trade receivables are carried at nominal amounts due. Instalments
as agreed but normally 30 day terms.
Contractual Financial Assets – Loans and Receivables
Financial Liabilities
Trade and sundry creditors 1(h)6
Liabilities are recognised for amounts to be paid in the future for goods and services received. Trade liabilities are normally settled on 30
day terms.
Contractual Financial Liabilities at amortised cost.
(b) Categorisation of financial instruments
The Authority’s exposure to interest rate risk and the effective weighted average interest rate of financial assets and liabilities by maturity periods is set out in the following table. Exposures arise predominantly from assets and liabilities bearing variable interest rates as the Authority intends to hold fixed rate assets and liabilities to maturity.
Maturity Dates
2013
Notes
Weighted Average Interest
Rate
Carrying Amount
$
Nominal Amount
$
Less than 1 month
$
1 – 3 months
$
Non-interest bearing
$ Total
$
Financial assets Cash and cash equivalents 15
11,059,442 11,059,442 509,442 10,550,000 11,059,442
Receivables 4 2.70% 1,044,305 1,044,305 1,044,305 1,044,305
12,103,747 12,103,747 509,442 10,550,000 1,044,305 12,103,747
2012
Financial assets Cash and cash equivalents 15
13,015,465 13,015,465 1,015,465 12,000,000 - 13,015,465
Receivables 4 4.36% 691,476 691,476 691,476 691,476
13,706,941 13,706,941 1,015,465 12,000,000 691,476 13,706,941

41
Notes to the financial statements
For the year ended 30 June 2013 (cont.)
Page 43
Notes to the financial statements For the year ended 30 June 2013 (cont.) (c) Credit Risk
Credit risk arises from the financial assets of the GAA, which comprises cash and cash equivalents, trade and other receivables. The maximum exposure to credit risk at balance date is represented by the carrying amount of those assets in the balance sheet. Credit risk associated with the GAA’s financial assets is minimal because the main debtor is generally the Victorian Government. Credit risk refers to the risk that a counter party will default on its contractual obligations resulting in financial loss to the Authority. The Authority has adopted a policy of only dealing with creditworthy counterparties and obtaining sufficient collateral where appropriate, as a means of mitigating the risk of financial loss from defaults. The Authority measures credit risk on a fair value basis.
Aging of Trade and Other Receivables 2013
$ 2012
$ The aging of Trade and Other Receivables at reporting date was:
Current (not yet overdue) 992,861 612,118*
Past due between 31 to 60 days 74,631 70,408
Past due between 61 to 90 days 16,267 -
Past due by greater than 90 days 20,167 15,168
Total receivables 1,103,926 697,694*
Total receivables (excluding GST) (note 4) 1,044,305 691,475 *The Receivables for 2012 have been restated to include interest and GST receivable at 30 June 2012. This amendment was necessary to reflect correctly the comparative figures in line with the 2013 reported figures. The Authority does not have any significant credit risk exposure to any single counterparty or any group of counterparties having similar characteristics. The Authority recognises a provision for Bad Debts as soon as they become apparent, the provision for Bad Debts for 2012/13 is nil (2011/12 = nil).
(d) Risks and mitigation The risks associated with our main financial instruments and our policies for minimising these risks are detailed below. Market risk The GAA’s exposures to market risk are primarily through interest rate risk with no exposure to foreign currency and other price risks. Foreign currency risk The Authority has no exposure in foreign currency through its payables relating to purchases of supplies. Interest rate risk Interest rate risk arises from the interest bearing financial assets and liabilities that the GAA use. Minimisation of risk is achieved by undertaking short term interest bearing financial assets with Treasury Corporation Victoria and established financial institutions. There is no exposure to interest rate risk on liabilities.
(e) Liquidity risk
Liquidity risk arises when the GAA is unable to meet its financial obligations as they fall due. The Authority operates under a payment policy of settling obligations within 30 days from receipt of invoice and approval of payment. To minimise the exposure of liquidity risk, the GAA has a short term cash management investment policy and manage actual performance to budget.
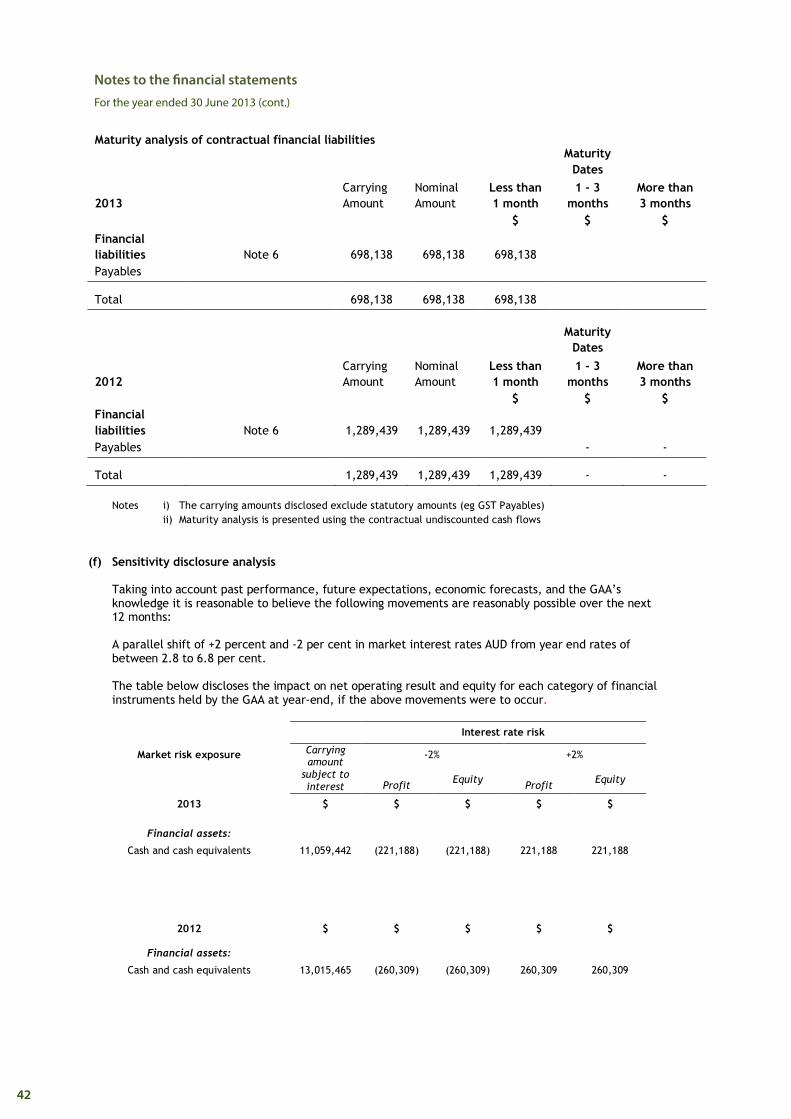
42
Notes to the financial statements
For the year ended 30 June 2013 (cont.)
Page 44
Notes to the financial statements For the year ended 30 June 2013 (cont.)
Maturity analysis of contractual financial liabilities
Maturity Dates
2013
Carrying Amount
Nominal Amount
Less than 1 month
1 - 3 months
More than 3 months
$ $ $
Financial liabilities Note 6 698,138 698,138 698,138
Payables
Total 698,138 698,138 698,138
Maturity
Dates
2012
Carrying Amount
Nominal Amount
Less than 1 month
1 - 3 months
More than 3 months
$ $ $
Financial liabilities Note 6 1,289,439 1,289,439 1,289,439
Payables
- -
Total 1,289,439 1,289,439 1,289,439 - - Notes i) The carrying amounts disclosed exclude statutory amounts (eg GST Payables) ii) Maturity analysis is presented using the contractual undiscounted cash flows
(f) Sensitivity disclosure analysis Taking into account past performance, future expectations, economic forecasts, and the GAA’s knowledge it is reasonable to believe the following movements are reasonably possible over the next 12 months: A parallel shift of +2 percent and -2 per cent in market interest rates AUD from year end rates of between 2.8 to 6.8 per cent. The table below discloses the impact on net operating result and equity for each category of financial instruments held by the GAA at year-end, if the above movements were to occur.
Interest rate risk
Market risk exposure Carrying amount
subject to interest
-2% +2%
Profit Equity
Profit Equity
2013 $ $ $ $ $
Financial assets:
Cash and cash equivalents 11,059,442 (221,188) (221,188) 221,188 221,188
2012
$
$
$
$
$
Financial assets:
Cash and cash equivalents 13,015,465 (260,309) (260,309) 260,309 260,309

43
Notes to the financial statements
For the year ended 30 June 2013 (cont.)
Page 45
Notes to the financial statements For the year ended 30 June 2013 (cont.) (g) Net fair value of financial assets and liabilities
On balance sheet The net fair value of financial assets and financial liabilities of the Authority approximates their carrying amounts. The carrying amounts and net fair values of financial assets and liabilities at reporting date are:
2013 Carrying amount
$
Net fair value $
Financial assets
Cash and cash equivalents 11,059,442 11,059,442
Receivables 1,103,926 1,103,926
Non-traded financial assets 12,163,368 12,163,368
Financial liabilities
Payables 698,138 698,138
Non-traded financial liabilities 698,138 698,138
2012 Carrying amount $
Net fair value $
Financial assets
Cash and cash equivalents 13,015,465 13,015,465
Receivables 697,694 697,694
Non-traded financial assets 13,713,159 13,713,159
Financial liabilities
Payables 1,289,439 1,289,439
Non-traded financial liabilities 1,289,439 1,289,439 Note 9 Responsible persons In accordance with the Ministerial Directions issued by the Minister of Finance under the Financial Management Act 1994, the following disclosures are made regarding responsible persons for the reporting period. Responsible Minister The persons who held the position of Minister and Accountable Officer in the Growth Areas Authority were as follows:
Minister for Planning The Hon. Matthew Guy MLC Amounts relating to the Minister for Planning are reported in the financial statements of the Department of Premier and Cabinet. Governing Board Chairman Christopher Banks AM Board members: Ian Munro PSM Diane Fleming Anne Keddie – 1 July to 22 October 2012 Francis King – 1 July to 22 October 2012 Leonie Hemingway (Deputy chair) – 23 October 2012 to current Bill Kusznirczuk – 23 October 2012 to current

44
Notes to the financial statements
For the year ended 30 June 2013 (cont.)
Page 46
Notes to the financial statements For the year ended 30 June 2013 (cont.) Chief Executive Officer & Accountable Officer Peter Seamer During the financial year Peter Seamer has also been acting CEO at Places Victoria from 1 March 2013 to 30 June 2013.
Remuneration received in connection with the management of the Authority was $422,667 ($506,729– 2011/12) for the period. The numbers of responsible persons whose remuneration from the Authority was within the relevant income bands as follows:
Income band ($) 2013 No.
2012 No.
0 - 10,000 3 1
10,000 - 19,999 3 4
60,000 69,999 1 1
280,000 - 289,999 1 -
340,000 - 349,999 - 1
Executive Officers: Stephen Dunn Mark Knudsen Edward Small Alexandra Links (Commenced 1 April 2013) The numbers of executive officers other than responsible persons whose remuneration falls within the specified bands above $100,000 are as follows:
Total Remuneration Base Remuneration
Income band ($) 2013 No.
2012 No.
2013 No.
2012 No.
0 100,000 1 1
150,000 - 159,999
160,000 - 169,999
170,000 - 179,999 1 1 1 2
180,000 - 189,999 1 1
190,000 - 199,999 - -
200,000 - 209,999 2 2
210,000 219,999 2 2
250,000 259,000 1
Total Number of Executives 4 5 4 5
Total Amount 671,108 1,030,637 671,108 953,233 The reported amounts include the disbursement of any accrued leave benefits for employees who left the organisation during that year. Other related transactions and loans requiring disclosure under the Directions of the Minister for Finance have been considered and there are no matters to report.

45
Notes to the financial statements
For the year ended 30 June 2013 (cont.)
Page 47
Notes to the financial statements For the year ended 30 June 2013 (cont.) Note 10 Remuneration of auditors $14,000 ($13,630 – 2011-2012) is payable to the Auditor General at reporting date. Note 11 Contingent liabilities and contingent assets There are no contingent liabilities or assets at 30 June 2013 ($0 – 2011-2012). Note 12 Commitments for expenditure At 30 June 2013, the Authority had the following operating lease commitments for accommodation until 31 October 2015. The disclosed payments include payments for non lease elements in the arrangement, being for cleaning charges based upon % of total lettable area.
2013 2012 Outstanding lease commitments are to be paid as follows $ $ Lease of Premises:
Not longer than 1 year 471,938 397,944
Longer than I year and not longer than 5 years 715,714 1,187,652
Total 1,187,652 1,585,596
2013 2012
Cleaning of Premises: $ $
Not longer than 1 year 30,110 25,749
Longer than I year and not longer than 5 years 45,306 75,416
Total 75,416 101,165
Note 13 Superannuation
For the year ended 30 June 2013
$
For the year ended 30 June 2012
$
Superannuation contributions for the period are included as part of employee benefits and associated costs in the comprehensive operating statement of the Authority
Fund
Victorian Superannuation Fund 192,872 201,833
Vision Super 169,289 142,206
Various other 70,591 130,979
Total contributions to all funds 432,752 475,018 The rate for contributions for each of the above funds except for the Defined Benefits is 9%. The Defined Benefits rate is dependent on the individual members’ circumstances and contribution details. As at the reporting date there were no outstanding contributions payable to the above funds. As at the reporting date there were no loans to or from the Growth Areas Authority to any of the above funds. Note 14 Subsequent Events There were no subsequent events to report.

46
Notes to the financial statements
For the year ended 30 June 2013 (cont.)
Page 48
Notes to the financial statements For the year ended 30 June 2013 (cont.) Note 15 Cash Flow Information
For the financial year
ended 2013 For the financial year
ended 2012
Reconciliation of cash and cash equivalents $ $
Cash at bank and on hand 11,059,442 13,015,465
Balances per Cash Flow Statement 11,059,442 13,015,065
Reconciliation of net result for the period to net cash flows
from operating activities
Net result for the period (1,205,473) 1,477,764
Non cash movements:
Depreciation expense 96,948 133,197
Movements in assets and liabilities:
Decrease/(increase) in prepayments 640 (5,148)
Decrease/(increase) in receivables (352,830) (463,702)
(Decrease)/increase in employee benefits 95,993 (15,173)
(Decrease)/increase in payables (591,301) 193,587
Net cash flow from operating activities (1,956,023) 1,320,525
Note 16 Glossary of Terms Comprehensive result Total comprehensive result is the change in equity for the period other than changes arising from transactions with owners. It is the aggregate of net result and other non-owner changes in equity. Employee benefits expenses Employee benefits expenses include all costs related to employment including wages and salaries, leave entitlements, redundancy payments, defined benefits superannuation plans, and defined contribution superannuation plans. Financial asset A financial asset is any asset that is: (a) cash; (b) an equity instrument of another entity; (c) a contractual or statutory right:
• to receive cash or another financial asset from another entity; or
• to exchange financial assets or financial liabilities with another entity under conditions that are potentially favourable to the entity; or
(d) a contract that will or may be settled in the entity’s own equity instruments and is:
• a non-derivative for which the entity is or may be obliged to receive a variable number of the entity’s own equity instruments; or
• a derivative that will or may be settled other than by the exchange of a fixed amount of cash or another financial asset for a fixed number of the entity’s own equity instruments.

47
Notes to the financial statements
For the year ended 30 June 2013 (cont.)
Page 49
Notes to the financial statements For the year ended 30 June 2013 (cont.)
Financial liability A financial liability is any liability that is: (a) A contractual or statutory obligation:
(i) To deliver cash or another financial asset to another entity; or (ii) To exchange financial assets or financial liabilities with another entity under conditions that are potentially unfavourable to the entity; or
(b) A contract that will or may be settled in the entity’s own equity instruments and is:
(i) A non-derivative for which the entity is or may be obliged to deliver a variable number of the entity’s own equity instruments; or (ii) A derivative that will or may be settled other than by the exchange of a fixed amount of cash or another financial asset for a fixed number of the entity’s own equity instruments. For this purpose the entity’s own equity instruments do not include instruments that are themselves contracts for the future receipt or delivery of the entity’s own equity instruments.
Grants and other transfers Transactions in which one unit provides goods, services, assets (or extinguishes a liability) or labour to another unit without receiving approximately equal value in return. Grants can either be operating or capital in nature. While grants to governments may result in the provision of some goods or services to the transferor, they do not give the transferor a claim to receive directly benefits of approximately equal value. For this reason, grants are referred to by the AASB as involuntary transfers and are termed non-reciprocal transfers. Receipt and sacrifice of approximately equal value may occur, but only by coincidence. For example, governments are not obliged to provide commensurate benefits, in the form of goods or services, to particular taxpayers in return for their taxes. Grants can be paid as general purpose grants which refer to grants that are not subject to conditions regarding their use. Alternatively, they may be paid as specific purpose grants which are paid for a particular purpose and/or have conditions attached regarding their use. Interest income Interest income includes unwinding over time of discounts on financial assets and interest received on bank term deposits and other investments. Net result Net result is a measure of financial performance of the operations for the period. It is the net result of items of income, gains and expenses (including losses) recognised for the period, excluding those that are classified as ‘other non-owner changes in equity’. Other economic flows are changes in the volume or value of an asset or liability that do not result from transactions. It includes:
• gains and losses from disposals, revaluations and impairments of non-financial physical and intangible assets;
• actuarial gains and losses arising from defined benefit superannuation plans;
• fair value changes of financial instruments and agricultural assets; and
• depletion of natural assets (non-produced) from their use or removal. In simple terms, other economic flows are changes arising from market re-measurements.
Payables Includes short and long term trade debt and accounts payable, grants, taxes and interest payable. Receivables Includes amounts owing from government through appropriation receivable, short and long term trade credit and accounts receivable, accrued investment income, grants, taxes and interest receivable.

48
Notes to the financial statements
For the year ended 30 June 2013 (cont.)
Page 50
Notes to the financial statements For the year ended 30 June 2013 (cont.) Supplies and services Supplies and services generally represent cost of goods sold and the day-to-day running costs, including maintenance costs, incurred in the normal operations of the Department. Transactions Transactions are those economic flows that are considered to arise as a result of policy decisions, usually an interaction between two entities by mutual agreement. They also include flows within an entity such as depreciation where the owner is simultaneously acting as the owner of the depreciating asset and as the consumer of the service provided by the asset. Taxation is regarded as mutually agreed interactions between the government and taxpayers. Transactions can be in kind (e.g. assets provided/given free of charge or for nominal consideration) or where the final consideration is cash. In simple terms, transactions arise from the policy decisions of the government.

49
GROWTH AREAS AUTHORITY STATUTORY CERTIFICATION
We certify that the attached financial statements for the Growth Areas Authority have been prepared in accordance with Standing Direction 4.2 of the Financial Management Act 1994, applicable Financial Reporting Directions, Australian Accounting Standards including Interpretations and other mandatory professional reporting requirements.
We further state that, in our opinion, the information set out in the comprehensive operating statement, balance sheet, statement of changes in equity, cash flow statement and accompanying notes, presents fairly the financial transactions during the year ended 30 June 2013 and financial position of the Authority at 30 June 2013.
At the time of signing we are not aware of any circumstance which would render any particulars included in the financial statements to be misleading or inaccurate.
We authorise the attached financial statements for issue on 14 August 2013.
Peter SeamerChief Executive Officer
MelbourneAugust 2013
Chris Banks AMChair
MelbourneAugust 2013
Edward SmallChief Financial Officer
MelbourneAugust 2013

50

51

52
This report has been printed on Australian Made100% Recycled Paper by an FSC certified printer.

53

Level 29, 35 Collins Street Melbourne Victoria 3000
Telephone: 03 9651 9600 Facsimile: 03 9651 9623
www.gaa.vic.gov.au