annual report & accounts june 2017 - …/media/files/s/savills-charity/reports-and... ·...
TRANSCRIPT

MANAGER’S REPORT
LIST OF PROPERTIES
KEY FUND DATA
FINANCIAL STATEMENTS
ANNUAL REPORT & ACCOUNTS
CHARITIES PROPERTY FUNDSavills Investment Management
June 2017

Savills Investment ManagementSavills Investment Management 32 The Charities Property Fund • Report & Accounts 2017 The Charities Property Fund • Report & Accounts 2017
CONTENTSManager’s Report Manager’s Report 4
Chairman of the Advisory Committee 6
Charities Property Fund Team 7
Investor Categorisation 8
Objectives 9
Strategy 11
Fund Performance 12
Fund Growth 13
Sector Weightings 14
Case Study - Greenwich 15
Portfolio Report - Purchases 16
Case Study - Bath 19
Portfolio Report - Sales 20
Case Study - Bury St Edmunds 22
Map of Properties 23
List of Properties Retail - High Street 24
Supermarkets 24
Retail Warehouses 25
London Offices 26
South East Offices 26
Rest of UK Offices 27
South East Industrials 27
Rest of UK Industrial s 28
Alternatives 29
Portfolio Statement 31
Key Fund Data Expense Ratio 34
Portfolio Turnover Rate 34
Distribution Yield 34
Annualised Performance 34
Investor Analysis 35
Fund History 36
Distribution Table 36
Financial StatementsStatement of the Manager’s Responsibilities in respect of the Financial Statements 37
Statement of the Corporate Trustee’s Responsibilities in respect of the Financial Statements and Corporate Trustee’s Report 38
Independent Auditor’s Report 39
Statement of Total Return and Change in Net Assets Attributable to Unitholders 41
Balance Sheet 42
Cash Flow Statement 43
Notes to the Financial Statements 44
General Information 56
Trustee, Manager and Advisors 60
Kentish Town, London
Liverpool
Chichester
Farringdon, London
Epsom Solihull
BrightonHarrogate
MANAGER’S REPORT
LIST OF PROPERTIES
KEY FUND DATA
FINANCIAL STATEMENTS

4 The Charities Property Fund • Report & Accounts 2017 Savills Investment ManagementSavills Investment Management
MANAGER’S REPORT
LIST OF PROPERTIES
KEY FUND DATA
FINANCIAL STATEMENTS
Manager’s Report Highlights - Five Years
Chairman of the Advisory Committee Charities Property Fund Team Investor Categorisation Objectives Strategy Fund Performance Fund Growth Sector Weightings Case Study - Greenwich Portfolio Report - PurchasesAwards and Achievements Case Study - Bath Portfolio Report - Sales Case Study - Bury St Edmunds Map of Properties
MANAGER’S REPORT
As a result, the demand for secondary or short-term income assets has declined whilst core, long term income and annuity-type investments with fixed rental uplifts have maintained their value.
This continues to play to our strengths - having built a quality portfolio based on real estate fundamentals and no use of debt, we succeeded in outperforming
the market for the tenth year in succession.
Our focus on long leases provides better risk adjusted returns and insulates the Fund in times of uncertainty. The Fund’s average lease length is now almost 13 years (the highest it’s ever been) and our percentage of index linked leases within the portfolio is close to 40%, which is attractive now that RPI inflation
has crept back up to 3.6% (July 2017). Due to the large number of index linked rent reviews and through the completion of several pre-let construction projects (see our case studies on pages 15, 19 & 22) the portfolio is predicted to deliver double digit dividend growth over the next 12-18 months, which is a very attractive prospect in this low growth world.
The leave vote in the referendum on the UK’s continued membership of the EU last June (Brexit) initiated a flash crisis of confidence in UK commercial real estate markets. However, this was quickly replaced by the dawning realisation that the fundamental supply and demand dynamics continued to be compelling and the level of income was difficult to replicate in other asset classes.
In March this year the UK Government triggered Article 50 of the Lisbon Treaty, informing the EU of our intention to withdraw membership in 2019. An election was subsequently called in June this year to strengthen the Prime Minister’s hand and Brexit mandate, however the opposite occurred leaving more uncertainty. This constant desire to hold referendums and elections (or “neverendums” - we have had four in four years) has delegated decision making away from MP’s and has created a very unpredictable political picture, which in turn has elicited caution amongst investors.
5The Charities Property Fund • Report & Accounts 2016
HIGHLIGHTS - FIVE YEARS
80 Purchases
Portfolio NAV
+132%
£182 million Capital growth in existing assets
£204 million Income distributed
36 Sales
Unit price
+25%
10.2% per annum Fund total return
Investor base
+52%
£479 million Net new investment
Kentish Town, NW5

7The Charities Property Fund • Report & Accounts 2017Savills Investment ManagementSavills Investment Management
The Charities Property Fund (The “Fund”) has once again outperformed the AREF/MSCI All Balanced Property Funds Index with a total return of 6.6%, and has delivered a consistent 10.0% per annum over the last three and five year periods. The Fund has now outperformed for ten years in a row. Importantly for the investors, the current income element also remains above average, with the Fund continuing to deliver the top quartile income return it set out to do at inception; on average
providing 5.0% per annum (net of fees and costs) over the last five years.
Savills Investment Management is a dedicated specialist international property investment management business with c.£14.1 billion of assets under management (as at 30 June 2017), with an experienced team of c.300 professionals located in 18 offices across Europe and Asia. It has provided investment services for 30 years, comprising separate accounts and investment mandates on an advisory or discretionary basis, and the establishment and management of pooled property funds. Clients include pension funds, insurance companies, endowments, charities and family offices on whose behalf we invest in office, retail, industrial, residential and alternative sectors in property.
Savills Investment Management is wholly owned by the Savills Group, a FTSE 250 company and international real estate consultancy. Savills Investment Management retains operational independence from the wider Savills Group to enable us to act on a best execution basis on behalf of our clients.
CHARITIES PROPERTY FUND TEAM
PROPERTY
6 The Charities Property Fund • Report & Accounts 2017
CHAIRMAN OF THE ADVISORY COMMITTEE
Savills Investment Management and in particular the Charities Property Fund team have once again ably navigated some rough waters over the last 12 months. In particular I would note that following last year’s Brexit referendum the team raised liquidity levels by selling assets already earmarked for sale and at prices ahead of valuation. This should provide comfort to investors that the portfolio is strong from a both a quality and liquidity perspective.
The CPF team are aided by the Advisory Committee which provides a sounding board to the investment manager and the comfort of an additional check and balance for investors, on top of Savills Investment Management’s own internal processes and procedures. Whilst the Committee is advisory, we have a close working relationship with the management team and review the portfolio and their performance every quarter. We are also invited to comment and advise on all purchases and sales in advance.
The Committee benefits from the considerable knowledge and experience of the eight additional members listed below:
Aidan Kearney, CIO, The Health FoundationAlan Fletcher, Investment committee member, Church of England Pension Board and Chairman of Investment Committee, Leicester Diocesan Board of Finance Andrew Chapman, Trustee of KidneyCare UK Chris Hills, CIO, Investec Wealth Management Nick Downer, Bursar, Selwyn College, Cambridge Paul Taylor, Investment committee member, Latymer Upper School Richard Robinson, Investment Director, Paul Hamlyn Foundation Wilf Stephenson, Bursar, Oriel College, Oxford We will endeavour to assist the continued success and strong governance of the Charities Property Fund.
Malcolm NaishChairman of the Charities Property Fund Advisory Committee
Angy Benitz Fund Manager
Jim Garland Assistant Fund Manager
INVESTOR RELATIONS
FINANCE
Lucy Auden Investor Relations
Amy Joslin Investor Relations Charities Property Fund
Tammy Thomas Fund Finance Manager
Harry de Ferry Foster Fund Director
Shalin Syan Investor Relations
Natalie Chrimes Assistant Fund Finance Manager
MANAGER’S REPORT
LIST OF PROPERTIES
KEY FUND DATA
FINANCIAL STATEMENTS
Manager’s Report Highlights - Five Years
Chairman of the Advisory Committee Charities Property Fund Team
Investor Categorisation Objectives Strategy Fund Performance Fund Growth Sector Weightings Case Study - Greenwich Portfolio Report - PurchasesAwards and Achievements Case Study - Bath Portfolio Report - Sales Case Study - Bury St Edmunds Map of Properties

98 The Charities Property Fund • Report & Accounts 2017 The Charities Property Fund • Report & Accounts 2017Savills Investment ManagementSavills Investment Management
32 OXBRIDGE COLLEGES
25 UNIVERSITIES
* This category includes charities with multiple sector beneficiaries or charities who offer a range of services to a set geographical area.
Source: Savills Investment Management (June 2017)
Arts/Culture
Educational and Universities
Environment/Conservation/ Animal Welfare
General Charitable Purposes*
Medical/Health/ Hospices
Relief of Poverty
Religious Activities
Services (Armed Forces)
INVESTOR CATEGORISATION
51 SCHOOLS
11 CATHEDRALS
47 SERVICES
(ARMED FORCES)
OBJECTIVES
To meet this objective, Savills Investment Management (UK) Limited (the “Manager”) targets a total return of 7% per annum, of which we look to deliver the majority through income. However this is an aspiration and a guideline, not a guarantee, and the level of income and total return may fluctuate.
The Fund invests in the principal commercial property sectors: office (both London and regional), retail (high street, supermarkets and retail warehouses), industrial (manufacturing and distribution) and alternatives (hotels, car showrooms, roadside and leisure) and whilst it will undertake forward fundings of pre-let investments it does not undertake speculative developments.
The Fund’s operating costs (the Total Expense Ratio) are paid from the income account. Whilst this reduces the quarterly distribution payable, we believe that such expenditure should be financed from current income, rather than from capital.
A number of other property funds either charge some or all of operating costs (such as management fees) to capital and thereby artificially inflate their distribution. Investors should be aware of this when making comparisons. The costs charged to capital by the Fund relate to investment in properties, acquisition and disposal costs or refurbishment.
The Charities Property Fund aims to provide a high and secure level of income with the prospect of growth in income and to maintain the capital value of the assets held in the Fund, through investing in a diversified UK commercial property portfolio.
MANAGER’S REPORT
LIST OF PROPERTIES
KEY FUND DATA
FINANCIAL STATEMENTS
Manager’s Report Highlights - Five YearsChairman of the Advisory Committee Charities Property Fund Team
Investor Categorisation Objectives
Strategy Fund Performance Fund Growth Sector Weightings Case Study - Greenwich Portfolio Report - PurchasesAwards and Achievements Case Study - Bath Portfolio Report - Sales Case Study - Bury St Edmunds Map of Properties
Liverpool, TT

Savills Investment ManagementSavills Investment Management 11The Charities Property Fund • Report & Accounts 2017
We also believe the Fund’s sector weightings deliver a small yield benefit through maintaining a higher weighting to retail warehouses, the London office sector (excluding core City and Mayfair areas) and the industrial and alternative sectors, and a lower weighting to the high street retail and core City and Mayfair office markets. We continue to look for interesting growth locations and opportunities, with a bias towards fringe London locations, good quality retail warehousing, alternatives and the industrial/distribution markets. These sectors benefit from providing a relatively high yield in the case of retail warehouses, assets can be acquired close to replacement costs in the case of industrials and alternatives also provide longer than average leases and a high element of rental indexation.
We have acquired 120 buildings in the last eight years, investing almost £900 million in assets that are now valued (or have been sold) for a total consideration of almost £1.1 billion. Of these, we have sold 23 properties totalling only 11% of all properties, illustrating that acquisitions have generally been made for the long term. Our ability to source the right investment stock at the right price continues to be the biggest driver of performance.
We aim to achieve an above average income return by keeping vacancy and associated costs (such as empty rates, service charges, repairs and insurance) to a minimum and by generating income growth through rental increases, refurbishments, active asset management and new lettings. The vacancy rate is currently 5.0% compared to the MSCI average of 7.7%, as at June 2017. However, excluding the planned refurbishment of The Smithson Building in Farringdon, the underlying vacancy rate has fallen to 0.6%, the lowest rate for 10 years.
10 The Charities Property Fund • Report & Accounts 2017
Low vacancy rate:
5.0%
Well diversified:
111 properties
235 tenancies
Long unexpired lease terms:
12.5 years to expiry
Strong covenants:
85.2% rated low or negligible risk by Dun & Bradstreet
No debt
STRATEGY
“Our ability to source the right investment stock at the right price continues to be the biggest driver of performance”
MANAGER’S REPORT
LIST OF PROPERTIES
KEY FUND DATA
FINANCIAL STATEMENTS
Manager’s Report Highlights - Five YearsChairman of the Advisory Committee Charities Property Fund Team Investor Categorisation Objectives
Strategy
Fund Performance Fund Growth Sector Weightings Case Study - Greenwich Portfolio Report - PurchasesAwards and Achievements Case Study - Bath Portfolio Report - Sales Case Study - Bury St Edmunds Map of Properties

13The Charities Property Fund • Report & Accounts 2017Savills Investment ManagementSavills Investment Management
FUND PERFORMANCE
The total return for the Fund during the 12 months to 24 June 2017 was 6.6% against the Fund’s target annual return of 7%. The AREF/MSCI All Balanced Property Funds Index produced a 6.0% total return over the same period. The capital NAV of the Fund has increased by 9.0% during the last 12 months from £1,064 million* in June 2016 to £1,159 million* in June 2017. This included £77.3 million of net cash inflow.The Fund has outperformed the AREF/MSCI All Balanced Property Funds Index for 10 consecutive years from June 2007 to June 2017.
The Fund is the second highest performing fund over this period and this reflects the underlying quality of the portfolio.
12 The Charities Property Fund • Report & Accounts 2017
Source: Savills Investment Management/ AREF/MSCI All Balanced Property Funds Index
* The capital NAV excludes revenue items which are included in the NAV in the Financial Information section
0
2
4
6
8
10
12
FUND LEVEL PERFORMANCE - TOTAL RETURN AS AT 30 JUNE 2017
% p
er a
nnum
3 yearsper annum
4 yearsper annum
5 yearsper annum
10 yearsper annum
10.0%9.5%
10.8%10.2%
9.0%
4.1%
2.2%
6.6%6.0%
1 year
12
10
8
6
4
2
0
9.6%
FUND GROWTH
PERFORMANCE HIGHLIGHTS TO 24 JUNE 2017
The Charities Property Fund has returned
6.6%year to June 2017
The Charities Property Fund has returned
10.2%annualised over a five year period
The Charities Property Fund has returned
10.0%annualised over a three year period
The Charities Property Fund has returned
7.3%annualised since launch
GROWTH IN FUND NAVas at 24 June 2017
2,000
1,500
1,000
500
Fund NAV (left hand axis)
Number of investors (right hand axis)
£m
0
500
1000
1500
2000
2009 2010 2011 2012 2013 2014 2015 2016 2017
ANNUAL DISTRIBUTION OF FUNDJune to June
0
10
20
30
40
50
6060
50
40
30
20
10
£m
2009 2010 2011 2012 2013 2014 2015 2016 2017
1,300
1,100
900
700
500
300
100
Savills Investment Management
Charities Property Fund
AREF/MSCI All Balanced Funds Index
MANAGER’S REPORT
LIST OF PROPERTIES
KEY FUND DATA
FINANCIAL STATEMENTS
Manager’s Report Highlights - Five YearsChairman of the Advisory Committee Charities Property Fund Team Investor Categorisation Objectives Strategy
Fund Performance Fund Growth
Sector Weightings Case Study - Greenwich Portfolio Report - PurchasesAwards and Achievements Case Study - Bath Portfolio Report - Sales Case Study - Bury St Edmunds Map of Properties

1514 The Charities Property Fund • Report & Accounts 2017 The Charities Property Fund • Report & Accounts 2017Savills Investment ManagementSavills Investment Management
SECTOR WEIGHTINGS
The portfolio is well diversified and is not over exposed to any one particular sector. It continues to have a bias towards retail warehouses, London offices, alternatives and the industrial/distribution sectors and it remains underweight (relative to the AREF/MSCI All Balanced Funds Index) to high street retail, shopping centres, regional offices and the core City of London and West End office markets.
We have increased our exposure to the retail warehousing, south east office and alternative sectors over the last 12 months and reduced our exposure to high street retail, supermarkets, London offices, rest of UK offices and industrials. We remain very positive about the industrial and distribution sector, but due to the high prices being paid we have taken advantage of market conditions to execute opportunistic sales.
Source: Savills Investment Management
CPF June 2016 CPF June 2017
RETAILHigh StreetSupermarketsRetail Warehouses
OFFICESLondonSouth EastRest of UK
INDUSTRIAL/DISTRIBUTIONSouth EastRest of UK
ALTERNATIVES Leisure Hotels Automotive Roadside
33.0%2.9%8.3%
21.8%20.8%14.3%
4.0%2.5%
20.9%5.1%
15.8%25.3%
4.4%10.7%
7.8%2.4%
25.3%33.0%
20.8%20.9%
22.5%32.9%
21.3%23.3%
RETAILHigh StreetSupermarketsRetail Warehouses
OFFICESLondonSouth EastRest of UK
INDUSTRIAL/DISTRIBUTIONSouth EastRest of UK
ALTERNATIVES Leisure Hotels Automotive Roadside
32.9%4.0%
11.0%17.9%21.3%15.3%
3.0%3.0%
23.3%5.3%
18.0%22.5%
3.2%8.9%8.0%2.4%
CASE STUDY - GREENWICH
We currently have three very interesting and different ongoing construction projects that have completed, or are very close to completing and these form the three case studies highlighted in this year’s Annual Report. This Autumn, these three projects will all become income producing and will increase the annual rent roll on the portfolio by over £3.4 million per annum (a 6% increase). In addition almost 85% of this income benefits from index linked rent reviews and the average lease length to earliest break is just over 15 years. All three occupy excellent locations.
GreenwichThe first is the development of Brocklebank retail park in Greenwich, which we highlighted in the annual report last year. We are now very pleased to report that practical completion occurred in August 2017 and the four retailers - Primark, Next, Aldi and Mothercare are all currently fitting out their units to be open for trading in November to take advantage of the busy Christmas trading period. This project was a forward funding of a new development, which we agreed to undertake firstly to achieve a discount on the likely price we would have had to pay once it was built and secondly, because it is so rare to be able to have the opportunity to buy a prime retail park in an undersupplied area of London off very low rents (that were agreed several years ago). This is a next generation retail park, benefiting from electric car charging points, over 1,000 solar panels and trading over multiple levels. The location of this prime asset will only improve with the phased construction nearby of over 15,000 apartments and London’s first new Ikea store in 10 years. We are very pleased that this property will become the Fund’s largest individual holding.
MANAGER’S REPORT
LIST OF PROPERTIES
KEY FUND DATA
FINANCIAL STATEMENTS
Manager’s Report Highlights - Five YearsChairman of the Advisory Committee Charities Property Fund Team Investor Categorisation Objectives Strategy Fund Performance Fund Growth
Sector Weightings Case Study - Greenwich
Portfolio Report - PurchasesAwards and Achievements Case Study - Bath Portfolio Report - Sales Case Study - Bury St Edmunds Map of Properties

17The Charities Property Fund • Report & Accounts 2017Savills Investment ManagementSavills Investment Management16 The Charities Property Fund • Report & Accounts 2017
The Fund purchased seven individual property investments during the 12 months to 24 June 2017, investing £83.93 million.
Additional capital investment of approximately £16 million was also made into existing assets (including the three case studies - through the costs of construction) and also through securing planning permissions, combating obsolescence and funding general improvements elsewhere within the portfolio to help deliver future income growth.
The purchased properties are generally of high quality and let to very strong tenants (100% rated as negligible or low risk by Dun & Bradstreet, compared to MSCI at 78.0%). The leases have on average 18.0 years remaining until expiry and 12.8 years on average to earliest break (compared to MSCI at 9.1 and 8.2 years respectively) and 55% of the income benefits from fixed or inflation linked rental increases.
The average yield to the Fund inclusive of acquisition costs is 5.95%. This compares to the MSCI Monthly Index average net initial yield of 4.8% as at June 2017.
The Fund’s purchases include:
1. Amazon, Liverpool – a newly constructed distribution warehouse unit let to Amazon on a 10 year lease, was acquired for £8.6 million reflecting a yield of 6.7%.
2. Whiteladies House, Clifton, Bristol – this property provides office accommodation over four floors with 12 car parking spaces and is fully let to two tenants, Handelsbanken and Films 59. It was acquired for £4.15 million reflecting a yield of 6.4%.
Bristol
PORTFOLIO REPORT - PURCHASES
3. 17-23 Parliament Street, Harrogate – a newly developed block of five retail/leisure units located on an established leisure pitch in Harrogate town centre, let to Five Guys, Mitchells & Butler, Marston’s, Moss Bros and Porco Rosso, was acquired for £8.55 million reflecting a yield of 5.0%. This property benefits from long leases (17 years on average) and from fixed or RPI linked rent reviews.
4. International House, Brighton – a prominent multi-let office and retail building located adjacent to Brighton train station was acquired for a price of £11.2m, reflecting a yield of 6.5%.
5. House of Fraser, Chichester – the property comprises the only department store in Chichester, let for a further 21 years and is situated in a prime trading position in the
city centre. It was acquired for £13.4 million, reflecting a yield of 5.55% and a capital value per sq ft of only £193.
6. Metro Park West, Gateshead – a prime asset situated adjacent to the second busiest shopping destination in the UK, Metrocentre. The property is let to Tesco plc and has been fully underlet to The Range and Sports Direct. The property was acquired for £33.67 million reflecting a yield to the Fund of 5.85% and benefits from five yearly RPI linked rent reviews, the next due in 2018.
7. Matalan, Bury St Edmunds – an open A1 retail warehouse located in Bury St Edmunds. The property is let to Matalan Retail for a further 12 years and was acquired for £4.36 million reflecting a yield of 6.9%.
£ 1 0 0 millioninvested in 12 months
5.9% average yield to Fund
MANAGER’S REPORT
LIST OF PROPERTIES
KEY FUND DATA
FINANCIAL STATEMENTS
Manager’s Report Highlights - Five YearsChairman of the Advisory Committee Charities Property Fund Team Investor Categorisation Objectives Strategy Fund Performance Fund Growth Sector Weightings Case Study - Greenwich
Portfolio Report - Purchases
Awards and Achievements Case Study - Bath Portfolio Report - Sales Case Study - Bury St Edmunds Map of Properties
Gateshead

1918 The Charities Property Fund • Report & Accounts 2017 The Charities Property Fund • Report & Accounts 2017Savills Investment ManagementSavills Investment Management
AWARDS AND ACHIEVEMENTS
WINNER CORE FUND OF THE YEAR - 2017
BEST PERFORMING FUND 2016MEASURED BY AREF/MSCI ALL BALANCED FUND INDEX
SHORTLISTEDFOR THE LAST FOUR YEARS
THE FUND HAS OUTPERFORMED THE INDEX FOR 10 CONSECUTIVE YEARS
WINNER EUROPEAN FUND OF THE YEAR - SPECIALIST PRODUCT 2016
MANAGER’S REPORT
LIST OF PROPERTIES
KEY FUND DATA
FINANCIAL STATEMENTS
Manager’s Report Highlights - Five YearsChairman of the Advisory Committee Charities Property Fund Team Investor Categorisation Objectives Strategy Fund Performance Fund Growth Sector Weightings Case Study - Greenwich Portfolio Report - Purchases
Awards and Achievements Case Study - Bath
Portfolio Report - Sales Case Study - Bury St Edmunds Map of Properties
CASE STUDY - BATH
The second case study project is Westgate Buildings, which comprised five retail units and two floors of secondary offices and was acquired in 2012 for £6.9 million from Threadneedle. The property is an attractive building and at purchase we firmly believed that the upper parts could be put to much better use. The tenant of the two office floors had a short lease and was paying a rent of £245,000 per annum. In March 2015 we surrendered this lease and applied for planning permission for a change of use to a hotel. When this looked likely to be refused on the ground of loss of employment use, we subsequently changed tack and secured planning under Permitted Development to convert the offices to residential use.
Once successful we set about progressing our application for hotel use once again and in Spring 2016 we achieved planning consent. We signed an agreement for lease with Travelodge for a term of 25 years at a rent almost double what had previously been commanded as offices. The current value is £13.2 million (June 2017) and this is likely to increase to £16.0 million on completion in October 2017 – an increase in value of 50% after taking into account the cost of construction and planning. It has been a complicated build in a tightly controlled city centre whilst the ground floor tenants all needed to continue trading and we are delighted with the result.

2120 The Charities Property Fund • Report & Accounts 2017 The Charities Property Fund • Report & Accounts 2017Savills Investment ManagementSavills Investment Management
The Fund’s sales include: 1. Tesco, Nailsea – a supermarket in Nailsea, let to Tesco, was sold back to Tesco for £23.63 million reflecting a net initial yield of 4.85%. The property was acquired for £21.3 million in 2011 and the Fund has received approximately £5.9 million in rent since purchase. The sale price represents a £2.33 million capital uplift since purchase (June 2016 valuation: £24 million, 4.8%).
2. Telford Way, Kettering – an industrial unit in Kettering, let to Designer Contracts Ltd, was sold for £7.37 million reflecting a net initial yield of 6.25%. The property was acquired in 2004 for £6.3 million. We secured a long lease of 15 years prior to the sale and over £5 million in rent has been received since purchase (June 2016: £7.35 million, 6.3%).
3. Oasis, Chichester – a retail unit in Chichester, let to Oasis, was sold for £2.55 million reflecting a net initial yield of 3.69%. The property was acquired in April 2011 as part of an in specie transfer at a price of £1.695 million. The sale price represents a 50% premium to the purchase price. In June 2016 we increased the unexpired term from two years to 10 years prior to the sale (June 2016 valuation: £1.95 million, 4.8%). 4. Worcester – a retail unit in Worcester, let to Costa Limited, was sold for £1.925 million reflecting a net initial yield of 4.1%. The property was acquired in April 2011 as part of an in specie transaction at a price of £1.4 million and the sale price represents
a 40% premium over its purchase price and a 20% premium to the June 2016 valuation (June 2016 valuation: £1.6 million, 5.0%).
5. 31 Market Place, St Neots – a retail unit in St Neots, let to Iceland until December 2021, was sold for £1.825 million, reflecting a net initial yield of 6.75%. The unit had been acquired in March 2015, as part of an in specie transaction at a price of £1.7 million (September 2016 valuation: £1.76 million, 7.0%).
6. Mercedes, Dorchester – a car showroom in Dorchester, let to Sandown Motors was sold for £2.3 million reflecting a net initial yield of 5.65%. The property was acquired as part of a portfolio of three Mercedes car showrooms for £1.92 million only 18 months before. It was let on a relatively long lease to 2030 at an affordable rent to a good quality tenant (June 2016 valuation: £2.25 million, 5.75%).
7. Smith’s Metals, Biggleswade – an industrial unit let to Smith’s Metals, was sold for £5.0 million reflecting a net initial yield of 7.45%. It was acquired by Aberdeen UK Property Fund who own the neighbouring retail park. The property was purchased in November 2002 at a price of £4.57 million and the Fund has received £5.25 million in rent alone over the period of ownership. Prior to sale the lease was extended by seven years to April 2025 and it was disposed at a 9.4% premium to the purchase price (June 2016 valuation: £5.25 million, 7.1%).
The Fund completed twelve sales during the 12 months to 24 June 2017, generating £84.5 million in total sales proceeds.
PORTFOLIO REPORT - SALES
£84.5 milliontotal sales proceeds
TWELVEsales completed
£ 4 . 6 millionincrease over June 2016 v a l u a t i o n s
Total sales proceeds of £84.5 million reflected an increase of £4.6 million (+5.8%), exclusive of sales costs, over the June 2016 valuation of £79.9 million.These properties also contributed over £1.3 million of income during the period from 24 June 2016 to the date of their disposal.
8. 169/175 High Street, Southend – a retail unit let to Muffin Break and The Works, was sold for £1.25 million reflecting a net initial yield of 7.9%. The property was acquired in December 2009 by way of an in specie transfer. The asset management of this property allowed us to sell with the benefit of two new leases, at rebased rents and with the benefit of the potential for residential development of the upper parts (June 2016 valuation: £1.30 million, 7.8%).
9. The Tun, Edinburgh – an office building in Edinburgh located in close proximity to the Scottish Parliament. This was sold for £8.3m, £300,000 ahead of the December 2016 valuation and reflecting a yield of 7.1% (June 2016 valuation: £8.55 million, 7.4%).
10. ADAS UK, Wolverhampton – an office building in Wolverhampton, let to ADAS UK, was sold for £1.375 million to an own occupier, reflecting a 53% premium to the December 2016 valuation. This property was acquired as part of an in specie transaction in 2009 at a price of £1.0 million and a £300,000 surrender premium had been received from the previous tenant, Carillion in 2011. (June 2016 valuation: £1.0 million, 9.4%)
11. iForce, Redditch – a distribution asset let to a third party logistics provider, iForce, was sold to Royal London for £25.15 million, reflecting a yield of 5.35%. The unit was acquired for £15.15 million in 2011 and was let to John Lewis Partnership until July 2017. We subsequently agreed a 10 year
lease extension with iForce, ahead of the sale. Prior to the lease extension the asset was valued at £21.55 million. This property has delivered an annual return of 17.3% pa in the six years of ownership and capital growth of 65%. (June 2016 valuation: 21.55 million, 6.2%).
12. 16 – 17 North Street, Chichester – a retail unit let to WH Smith, was sold for £3.82 million reflecting a net initial yield of 4.0%. The property was acquired as part of portfolio in September 2010 for a net initial yield of 5.75%. The sale price represents a 20% premium to the purchase price and is 16% above the June 2016 valuation. (June 2016 valuation: £3.3 million, 4.6%)
MANAGER’S REPORT
LIST OF PROPERTIES
KEY FUND DATA
FINANCIAL STATEMENTS
Manager’s Report Highlights - Five YearsChairman of the Advisory Committee Charities Property Fund Team Investor Categorisation Objectives Strategy Fund Performance Fund Growth Sector Weightings Case Study - Greenwich Portfolio Report - PurchasesAwards and Achievements Case Study - Bath
Portfolio Report - Sales
Case Study - Bury St Edmunds Map of Properties
Redditch

2322 The Charities Property Fund • Report & Accounts 2017 The Charities Property Fund • Report & Accounts 2017Savills Investment ManagementSavills Investment Management
85
RETAIL - HIGH STREETRETAIL - SUPERMARKETS
RETAIL - WAREHOUSES
LONDON OFFICES
SOUTH EAST OFFICES
REST OF UK OFFICESSOUTH EAST INDUSTRIALS
REST OF UK INDUSTRIALS
ALTERNATIVES
1
105
9
11
13
15
17
19
21
26
27
28
31
42 44
45
47
48
49
58
62
54
55
57
59
60
61
63
64 66
67
70
72
73
74
76
78
79 80
83 90
91
92
97
103
106
109
111
3
10 14
18
29 40
71
75
77
81
82
86
89
98
95
99
101
107
108
6
12
23
50
68
88
94
100
2
22
87102
104
84
69
96
65
46
4
16
20
39
Greater London(27% of portfolio)
MAP OF PROPERTIES
38
25
34 5 36
33
30
51
43
41 52
8
7
53
56
93
110
35
24
32
37
CASE STUDY - BURY ST EDMUNDS
Bury was acquired in March 2015 and was let to Carillion on a short lease. It was primarily used as open storage. The rent was £131,000 per annum and the price paid was £1.320 million, a yield of 9.3%. In October 2016 we agreed a lease surrender with Carillion and a new 15 year agreement for lease with a local tech Company called Vitec Videocom and submitted a planning application. Vitec agreed to pay a rent of £587,000 per annum, subject to the Fund constructing a new 60,000 sq ft headquarters unit for them and refurbishing the existing 6,000 sq ft building
onsite. In December 2016 planning was granted, we surrendered the lease to Carillion and in January 2017 completed the new Lease with Vitec. Construction started in March this year and completion is due in October 2017.
When complete the asset is likely to be valued at circa £10.5 million and whilst construction costs will be circa £4 million in total, this will have delivered a brand new industrial unit in a desirable town, let on a long lease and will show an increase in capital value of almost £4 million after all costs are accounted for.
The third case study project is in Bury St Edmunds. Unlike Greenwich, Bury was an existing asset within the Fund, but differs from Bath as it is the construction of an entirely new building on a predominately empty site.
“When complete the asset is likely to be valued at circa £10.5 million”
MANAGER’S REPORT
LIST OF PROPERTIES
KEY FUND DATA
FINANCIAL STATEMENTS
Manager’s Report Highlights - Five YearsChairman of the Advisory Committee Charities Property Fund Team Investor Categorisation Objectives Strategy Fund Performance Fund Growth Sector Weightings Case Study - Greenwich Portfolio Report - PurchasesAwards and Achievements Case Study - Bath Portfolio Report - Sales
Case Study - Bury St Edmunds Map of Properties

2524 The Charities Property Fund • Report & Accounts 2017 The Charities Property Fund • Report & Accounts 2017Savills Investment ManagementSavills Investment Management
Property Principal TenantsAnnual Rent
As at 24 June 2017 £
Lease Expiry (Break)
1 Bath Dune 146,000 2018
2 Cardiff Burger King 325,000 2023
3 Cheltenham Poundland 128,600 2020
4 Chichester House of Fraser 752,584 2039
5 London N1 (Chapel Market)
JD Sports, Superdrug 194,000 2020
6 Marlborough Superdrug 140,000 2020
7 Walton-on-Thames Benson Beds 121,451 2025 (2020)
Total, High Street 1,807,635
Property Principal TenantsAnnual Rent
As at 24 June 2017 £
Lease Expiry (Break)
8 Barnet Sainsbury’s 1,722,145 2037
9 Mansfield Tesco 2,347,401 2039
10 West Malling Waitrose 180,744 2026
Total, Supermarkets 4,250,290
RETAIL - HIGH STREET
SUPERMARKETS
LIST OF PROPERTIES
West Malling Mansfield
LIST OF PROPERTIES
Property Principal TenantsAnnual Rent
As at 24 June 2017 £
Lease Expiry (Break)
11 Basildon McDonald’s, KFC, Pets at Home, Farmfoods, Poundland 655,181 2020 - 2035
12 Basingstoke Homebase 1,113,000 2026
13 Birmingham Halfords 105,300 2019
14 Bristol Pets at Home, McDonald’s 378,320 2022 - 2027
15 Bury Carpetright, Halfords, KFC, Home Bargains, Farmfoods
657,041 2021 - 2030 (2026)
16 Bury St Edmunds Matalan 305,000 2029
17 Canterbury Dunelm, Poundstretcher 521,000 2026
18 Chesham Wickes 306,400 2026
19 Doncaster Wickes 296,327 2028
20 Gateshead The Range, Sports Direct 1,998,500 2048 (2033)
21 Guildford Magnet 600,000 2024
22 Halewood Aldi, Card Factory, Age UK, Home Bargains, Tesco, Iceland, Big Munch, Ladbrokes, Barnardo’s, Subway, Shop Express, Halewood Fish Bar, Brunch Box Cafe, Marie Curie Cancer Care
610,100 2017 - 2038 (2019-2023)
23 Hereford Pets at Home, Lidl, Poundworld, Poundstretcher 378,609 2023 - 2024 (2019)
24 London SE7 Under construction (pre-let to: Next, Primark, Aldi, Mothercare)
- -
25 London SE15 B&M 263,250 2025
26 Merthyr Tydfil Halfords, Home Bargains, Sports Direct, Dreams, PC World, Poundstretcher, Iceland, Phillip Evans
820,549 2021 - 2027 (2018)
27 Middlesbrough B&M 239,180 2023
28 Redditch Aldi, Pets at Home, Poundstretcher, Iceland, Home Bargains, KFC, Maplin
1,057,118 2019 - 2026
29 Taunton Matalan 175,185 2029
30 Twickenham Currys, Wickes 951,500 2019 - 2032
31 Uttoxeter B&Q, Brantano, Poundland, Pets at Home, Argos, B&M, KFC, Frankie & Benny’s, Poundstretcher, Majestic Wine, Scentarea, PR Bason & J Gathercole, Mumfeys Ices
952,114 2018 - 2032 (2018 - 2023)
Total, Retail Warehouses 12,383,674
RETAIL WAREHOUSES
Basingstoke Bury
LIST OF PROPERTIES
KEY FUND DATA
FINANCIAL STATEMENTS
Retail - High Street Supermarkets Retail Warehouses
London OfficesSouth East OfficesRest of UK OfficesSouth East Industrial Rest of UK IndustrialAlternatives Portfolio Statement
MANAGER’S REPORT

2726 The Charities Property Fund • Report & Accounts 2017 The Charities Property Fund • Report & Accounts 2017Savills Investment ManagementSavills Investment Management
LIST OF PROPERTIES
Property Principal TenantsAnnual Rent
As at 24 June 2017 £
Lease Expiry (Break)
32 London E1 (Whitechapel)
The British Diabetic Association 1,126,173 2026 (2023)
33 London EC1 (Farringdon)
Vacant (under refurbishment) - -
34 London EC2 (Shoreditch)
Michael J Lonsdale 255,000 2024 (2019)
35 London EC2 (Shoreditch)
LK Bennett 808,013 2030 (2025)
36 London N1 (Shoreditch)
VF Northern Europe, Sunshine Partners, Spiers & Major, Odd London, UK Broadband
586,147 2018 - 2023 (2018)
37 London NW5 (Kentish Town)
Marketing VF 750,000 2026 (2021)
38 London WC2 (Chancery Lane)
Church Retail, Guido’s, PCB Litigation, Konica Minolta Business Solutions, EMW Law, Alliance Automotive, Linkdex, The Lord’s Taverners
1,324,451 2018 - 2024 (2017 - 2019)
Total, London Offices 4,849,784
LONDON OFFICES
Property Principal TenantsAnnual Rent
As at 24 June 2017 £
Lease Expiry (Break)
39 Brighton (International House)
Fitness First, Budgens, The Student Group, Hays, Brightwave, Brilliant Noise, Stelfox
744,713 2018-2027 (2021-2022)
40 Brighton (Aspect House)
NHS, Bullhorn International, Michael Page, Dehns 569,549 2019 - 2026 (2021)
41 Feltham The Secretary of State for Communities and Local Government
650,677 2017
42 Maidenhead Regus, Copper Street Capital 587,301 2021 - 2023 (2019)
43 Staines Givaudan UK 103,000 2018
Total, South East Offices 2,655,240
SOUTH EAST OFFICES
London, Rivington Street Bath
LIST OF PROPERTIES
Property Principal TenantsAnnual Rent
As at 24 June 2017 £
Lease Expiry (Break)
49 Basingstoke Debenhams 317,000 2017
50 Bury St Edmunds Under construction (pre-let to Vitec Videocom Limited) - -
51 Epsom Storage King, Screwfix Direct, Euro Car Parts, Heating and Plumbing Supplies, AWE Europe, HSS Hire Services, Photo Me International
713,326 2018 - 2033 (2019)
52 Hayes Tempur UK 497,097 2020
53 London NW9 VW Group 228,544 2031
54 Milton Keynes Ceva 435,085 2020
55 Portsmouth SMR Automotive Mirrors UK 665,000 2019
56 Thames Ditton Sytner 316,754 2056 (2026)
57 Thetford TNT 78,000 2020
Total, South East Industrials 3,250,806
SOUTH EAST INDUSTRIALS
Thames Ditton Hayes
Property Principal TenantsAnnual Rent
As at 24 June 2017 £
Lease Expiry (Break)
44 Bath Abel & Imray, Gradwell Communications, Local World, EIP Partnership, Coral, Wickes, Starbucks
488,710 2018 - 2024 (2018 - 2019)
45 Birmingham Spring Group, Arval UK 584,740 2019 - 2024 (2019)
46 Bristol Films at 59, Handelsbanken 276,765 2021
47 Chester The Secretary of State for Communities and Local Government
437,615 2026 (2021)
48 Taunton Lloyds Bank 185,105 2020
Total, Rest of UK Offices 1,972,935
REST OF UK OFFICES
LIST OF PROPERTIES
KEY FUND DATA
FINANCIAL STATEMENTS
Retail - High Street Supermarkets Retail Warehouses
London OfficesSouth East OfficesRest of UK OfficesSouth East Industrial
Rest of UK IndustrialAlternatives Portfolio Statement
MANAGER’S REPORT

2928 The Charities Property Fund • Report & Accounts 2017 The Charities Property Fund • Report & Accounts 2017Savills Investment ManagementSavills Investment Management
LIST OF PROPERTIES
Property Principal TenantsAnnual Rent
As at 24 June 2017 £
Lease Expiry (Break)
58 Birmingham Sheffield Insulation Group 310,005 2020
59 Boston Fogarty 400,000 2039
60 Bristol Kuehne + Nagel 480,000 2019
61 Burton-upon-Trent Unipart Logistics 869,464 2017
62 Gloucester Severn Glocon 525,000 2021
63 Huddersfield VTL Group 301,498 2021
64 Liverpool Amazon UK 577,500 2026 (2021)
65 Liverpool Toyota Tsusho Assembly Systems 593,450 2023 (2020)
66 Manchester Royal Mail, Wilkinson Star 318,250 2027-2028 (2022)
67 Newcastle-under-Lyme
Vacant – –
68 Normanton Speedy Hire 199,500 2024
69 Normanton Kongsberg Actuation Systems 365,654 2038 (2028)
70 Normanton PNS UK 200,750 2031
71 Normanton Really Useful Products 270,620 2022
72 Nottingham Turbine Surface Technologies 433,843 2026
73 Peterborough Sage Publications 182,900 2020
74 Redditch SP Group 728,265 2021
75 South Normanton Recticel 206,925 2031
76 Swindon Jewson 146,500 2023
77 Tamworth Speedy Hire 852,500 2029 (2024)
78 Telford Johnson Controls 715,000 2019
79 Tewkesbury Sapa Building Systems 879,417 2023
80 Tewkesbury Oberthur Card Systems 270,000 2020
81 Wakefield Verhoek Europe 238,400 2025 (2020)
82 Warrington Eddie Stobart 330,000 2033
83 Wellingborough CCL Label 552,488 2020
Total, Rest of UK Industrials 10,947,929
REST OF UK INDUSTRIALS
Redditch Swindon
Property Principal TenantsAnnual Rent
As at 24 June 2017 £
Lease Expiry (Break)
Leisure84 Bath (1-3 Westgate
Buildings)Stable Bar & Restaurant, Westgate Bath 169,500 2039
(2029)91 Carlisle DW Fitness 420,035 203496 Harrogate Five Guys, Mitchells & Butlers, Marston’s,
Moss Bros, Porco Rosso432,500 2026 - 2041
(2021 - 2031)100 Plymouth Travelodge, Bella Italia, Tasty Plc, Revolution,
The Gym Group, UKPM939,465 2029 - 2039
(2019)
103 Rayleigh Virgin Active 464,000 2028105 Sheffield JD Wetherspoon, ASK, Slug and Lettuce, Caffe Nero,
Meaty Fish, Yorkshire Metropolitan Housing Association416,500 2023 - 2124
(2018)Total, Leisure 2,842,000
Hotels85 Bath (5-10 Westgate
Buildings)Sports Direct, Halfords, Maplin, Sally Salon, Travelodge (under construction)
343,500 2016 - 2020
87 Brighton Jurys Inn 1,568,125 2042
90 Cambridge Travelodge 1,095,000 2048
94 Derby Jurys Inn 1,250,000 2044
99 Manchester Serviced Apartment Company (SACO), CDP, K Parry & J Bowden
629,624 2017 - 2035 (2025)
101 Poole Travelodge, Costa Coffee, Anytime Fitness, Subway, Rental Guarantee
834,590 2031 - 2051 (2026)
Total, Hotels 5,720,839
LIST OF PROPERTIES
ALTERNATIVES
Carlisle Brighton
LIST OF PROPERTIES
KEY FUND DATA
FINANCIAL STATEMENTS
Retail - High Street Supermarkets Retail WarehousesLondon OfficesSouth East OfficesRest of UK OfficesSouth East Industrial
Rest of UK IndustrialAlternatives1 2
Portfolio Statement
MANAGER’S REPORT

3130 The Charities Property Fund • Report & Accounts 2017 The Charities Property Fund • Report & Accounts 2017Savills Investment ManagementSavills Investment Management
LIST OF PROPERTIES
Property Principal TenantsAnnual Rent
As at 24 June 2017 £
Lease Expiry (Break)
Car Showrooms
86 Birmingham VW Group - SEAT 153,872 2027
89 Camberley VW Group - Audi 333,765 2026
92 Chester Rybrook - Volvo 209,724 2036
93 Chigwell Sytner - BMW & Mini 696,858 2056 (2026)
97 Harrogate JCT600 - Mercedes Benz, BP, M&S 423,100 2035 - 2036
98 Harrogate Sytner - Audi 384,020 2025
102 Poole Sandown Motors - Mercedes Benz 395,000 2030
104 Salisbury Sandown Motors - Mercedes Benz 351,600 2030
106 Solihull Rybrook - McLaren & Rolls Royce 275,000 2036
107 Stockton-on-Tees VW Group - Audi 311,137 2027
110 Thames Ditton Sytner - Jaguar Land Rover 342,094 2056 (2026)
111 Worcester Rybrook - BMW & Mini 540,000 2036
Total, Car Showrooms 4,416,170
Roadside
88 Calne Esso, Spar 160,000 2035
95 Glenrothes BP, M&S 233,615 2034
108 Stow on the Wold BP, M&S 185,000 2033
109 Telford Welcome Break - Shell, Waitrose, WH Smith, Burger King, Starbucks, Krispy Kreme, Days Inn
896,060 2027
Total, Roadside 1,474,675
Total, Alternatives 14,453,684
Total, portfolio 56,571,977
ALTERNATIVES continued
Poole Harrogate
PORTFOLIO STATEMENT
Portfolio of Investments
Properties valued at greater than £15m
Tesco, Chesterfield South Road, Mansfield Rivington Street, London EC2
The Smithson, Briset Street, London EC1 Jurys Inn, Derby
Sainsbury’s, East Barnet Road, Barnet Homebase, Winchester Road, Basingstoke
Brocklebank Retail Park (under construction), London SE7 Trafford Retail Park, Redditch
Metro Park West, Gateshead Apex Retail Park, Hampton Road West, Twickenham
90 Chancery Lane, London WC2 8 Shepherdess Walk, London N1
Jurys Inn, Stroudley Road, Brighton Welcome Break, MSA, Junction 4, M54, Telford
Travelodge, Newmarket Road, Cambridge Derry’s Cross, Plymouth
Back Church Lane, London E1
Valuation £m (percentage of total net assets) £455.630 (39.49%)
Properties valued at between £10m to £15m
Imperial Works, Kentish Town, London NW5 International House, Queens Road, Brighton
Dovefields Retail Park, Uttoxeter SP Group, Hedera Road, Ravensbank Business Park, Redditch
BMW & Mini, Langston Road, Loughton, Chigwell Unit 5300, Severn Drive, Tewkesbury
Lifeboat Quay, West Quay Road, Poole Old Market Retail Park, Station Lane, Pitsea, Basildon
Emperor Point, Centurion Park, Tamworth SACO, Minshull Street, Manchester
House of Fraser, West Street, Chichester BMW & Mini, Knightsbridge Park, Worcester
Unipart Logistics Limited, Barberry 157, Burton-upon-Trent One Bell Street, Maidenhead
5-10 Westgate Buildings, Bath Magnet, Ladymead, Guildford
Epsom Trade Park and Units 450A and 450B, Epsom York & Wellington House, Dukes Green, Feltham
Pentrebach Retail Park, Merthyr Tydfil
Valuation £m (percentage of total net assets) £236.025 (20.46%)
Properties valued at between £5m to £10m
Halewood Shopping Centre, Leather’s Lane, Liverpool Mercedes Benz, Holes Bay Road, Poole
The Lanconite Building, Stafford Park 6, Telford Fogarty Ltd, Havenside, Fishtoft Road, Boston
Toyota Tsusho, Hornhouse Lane, Liverpool Units 1-7, Cambridge Street, Barkers Pool, Sheffield
Aspect House, Queens Road, Brighton Jaguar Land Rover, Portsmouth Road, Thames Ditton
Caxton Point, Printing House Lane, Hayes Units 3010 and 3020, Birmingham Business Park, Birmingham
Amazon Unit, Hornhouse Lane, Knowsley 200 Rayleigh Road, Rayleigh
Moorgate Retail Park, Bury Mercedes Benz, Southampton Road, Salisbury
17-23 Parliament Street, Harrogate DW Sports, Currock Road, Carlisle
Wincheap Retail Park, Canterbury Kongsberg, Foxbridge Way, Normanton
Mercedes Benz & BP, Leeds Road, Harrogate Chester Civil Justice Centre, Trident House, Chester
SMR, Castle Trading Estate, Porchester, Portsmouth Pets at Home & McDonald’s, Bath Road, Brislington, Bristol
Westpoint, James Street, Bath Dawson Road, Mount Farm Industrial Estate, Milton Keynes
Severn Glocon Ltd, Olympus Park, Gloucester Audi, London Road, Camberley
Audi, St James Business Park, Harrogate Brook Retail Park, Commercial Road, Hereford
CCL Label, Warth Park, Raunds, Wellingborough Appleton Thorn Trading Estate, Warrington
11 Poplar Way East, Cabot Park, Bristol Audi, Brooklime Avenue, Stockton-on-Tees
TST, Little Oak Drive, Sherwood Park, Nottingham Rolls Royce & McLaren, Stratford Road, Solihull
Cowper Street, London EC2 Knight's Park, Houndmills, Basingstoke
Valuation £m (percentage of total net assets) £265.535 (23.01%)
AT 24 JUNE 2017
LIST OF PROPERTIES
KEY FUND DATA
FINANCIAL STATEMENTS
Retail - High Street Supermarkets Retail WarehousesLondon OfficesSouth East OfficesRest of UK OfficesSouth East Industrial Rest of UK Industrial
Alternatives1 2 Portfolio Statement1 2
MANAGER’S REPORT

3332 The Charities Property Fund • Report & Accounts 2017 The Charities Property Fund • Report & Accounts 2017Savills Investment ManagementSavills Investment Management
PORTFOLIO STATEMENT
AT 24 JUNE 2017
Portfolio of Investments
Properties valued at between £2.5m to £5m
Wickes, Townsend Road, Chesham 1-3 Westgate Buildings, Bath
Units A & B, Wardley Cross Industrial Estate, Manchester Alexandra Way, Ashchurch Business Centre, TewkesburyJaguar Land Rover Service Centre, Portsmouth Road, Thames Ditton Unit 1, Rosevale Business Park, Newcastle-Under-Lyme
593-613 Old Kent Road, London SE15 BP & M&S, Station Road Garage, Stow on the Wold
78 Queen Street, Cardiff Waitrose, Fortune Way, Kings Hill, West Malling
Really Useful Products, Foxbridge Way, Normanton PNS Unit, Trident Park, Normanton
Wickes, Leger Way, Doncaster B&M, Parkway Centre, Coulby Newham, Middlesbrough
Emerald Point, Bell Heath Way, Birmingham Verhoek, Kenmore Road, Wakefield
Matalan, Easlea Road, Bury St Edmunds Speedy Hire, Trident Park, Normanton
BP & M&S, Bankhead Park Service Station, Woodside Way, Glenrothes Clover Nook Industrial Estate, Alfreton, South Normanton
Moreton Hall Industrial Estate, Bury St Edmunds Esso & Spar, Pippen Service Station, Oxford Road, Calne
Whiteladies House, Clifton, Briston Unit 18, Fengate East, Peterborough
54/55 Chapel Market, Islington, London N1 Dune, 4 Union Street, Bath
Jaguar & Volvo, Sealand Road, Chester SEAT, Watson Road, Star City, Birmingham
Units 1 & 2, Bradley Junction Industrial Park, Huddersfield Matalan, Bindon Road, Taunton
Skoda/Volkswagen, 78 Capitol Way, Colindale, London NW9
Valuation £m (percentage of total net assets) £121.500 (10.53%)
Properties valued at between £0m to £2.5m
232-234 High Street, Cheltenham Sedgemoor House, Deane Gate Office Park, Taunton
134/135 High Street, Marlborough Halfords, Watery Lane, Birmingham
Jewson, Kembrey Street, Kembrey Park, Swindon Magna House, 76-80 Church Street, Staines
Hepworth Way, Walton-on-Thames TNT, Fisons Way Industrial Estate, Thetford
Valuation £m (percentage of total net assets) £15.070 (1.31%)
Total value of property holdings £1,093.760 (94.80%)
Valuation £000
Percentage of total net assets
Portfolio of investments £1,093,760 94.80%
Other net assets £60,030 5.20%
Net assets £1,153,790 100.00%
LIST OF PROPERTIES
KEY FUND DATA
FINANCIAL STATEMENTS
Retail - High Street Supermarkets Retail WarehousesLondon OfficesSouth East OfficesRest of UK OfficesSouth East Industrial Rest of UK IndustrialAlternatives
Portfolio Statement1 2
MANAGER’S REPORT
Financial Information

3534 The Charities Property Fund • Report & Accounts 2017 The Charities Property Fund • Report & Accounts 2017Savills Investment ManagementSavills Investment Management
FINANCIAL INFORMATION
Total Expense Ratio
PropertyExpense Ratio
TransactionCost Ratio
24 June 2017 0.56% 0.17% 0.19%
24 June 2016 0.56% 0.14% 0.23%
EXPENSE RATIOS
The total expense ratio (TER) of the Fund is the ratio of the Fund’s total operating costs to its average net assets for the prior 12 months. Operating costs are specifically those costs associated with operating the Fund itself and do not include additional costs associated with the day to day ownership of the assets. The property expense ratio (PER) includes those costs associated with the assets which are not recoverable from tenants. The transaction cost ratio (TCR) of the Fund is the ratio of all professional fees and other costs associated with the purchase and sale of property to the Fund’s average net assets for the prior 12 months.
The TER is in line with the prior year. The PER is higher than the prior year due to a larger number of costs incurred on vacant properties in the current year. The TCR is lower than the prior year due to a lower number of acquisitions taking place during the current year and an increase in the average net assets.
Portfolio Turnover Rate
24 June 2017 7.63%
24 June 2016 4.43%
DistributionYield
24 June 2017 4.57%
24 June 2016 4.63%
1 Year* 3 Years** 5 Years***
24 June 2017 6.6% 10.0% 10.2%
24 June 2016 7.6% 13.3% 10.0%
PORTFOLIO TURNOVER RATE
DISTRIBUTION YIELD
ANNUALISED PERFORMANCE
The portfolio turnover rate gives an indication of how frequently the assets are purchased and sold by the Fund. It is calculated by dividing the total disposal value over the Fund’s average net assets for the prior 12 months. The current year rate is higher than the prior year as there has been a greater number of asset disposals during the current year.
The distribution yield represents the total distribution per unit over the period as a percentage of the net asset value per unit as at the end of the year.
Source: AREF/MSCI All Balanced Property Funds IndexBasis: Capital NAV-to-NAV with gross income reinvested
* total return year to 24 June 2017** total return annualised over a three year period*** total return annualised over a five year period
INVESTOR ANALYSIS
HoldingTotal
percentageholding %
Top 10 largest investors 22.47%
Top 25 largest investors 36.76%
Top 50 largest investors 50.06%
Top 100 largest investors 63.65%
HoldingNumber of beneficial
owners
Totalpercentage
holding %Less than 0.01% 1,050 4.12
0.01% but less than 0.05% 572 12.91
0.05% but less than 0.10% 152 10.76
0.10% but less than 0.50% 124 26.93
0.50% but less than 1.00% 25 18.47
1.00% but less than 2.00% 9 11.90
2.00% but less than 4.00% 4 10.91
Greater than 4.00% 1 4.00
Total number of investors 1,937
Total number of units in issue at the end of the year 955,139,897
Percentage held by the largest investor 4.00
MANAGER’S REPORT
LIST OF PROPERTIES
KEY FUND DATA
FINANCIAL STATEMENTS
Expense Ratio Portfolio Turnover Rate Distribution Yield Annualised Performance Investor Analysis
Fund History Distribution Table

3736 The Charities Property Fund • Report & Accounts 2017 The Charities Property Fund • Report & Accounts 2017Savills Investment ManagementSavills Investment Management
FUND HISTORY AND DISTRIBUTION
Price and Income History Year EndedHighestBuying
Price (p)
LowestSelling
Price (p)
Net Income
Per Unit (p)24 June 2013 97.30 93.56 5.36
24 June 2014 106.81 95.56 5.43
24 June 2015 117.68 105.39 5.76
24 June 2016 121.13 116.24 5.53
24 June 2017 123.20 117.46 5.54
2017 2016
DistributionNumber
DistributionPeriod
DistributionPer Unit (p)
DatePaid
DistributionPer Unit (p)
DatePaid
1 25 June to 24 September 1.48 15/11/16 1.28 13/11/15
2 25 September to 24 December 1.45 15/02/17 1.34 15/02/16
3 25 December to 24 March 1.30 15/05/17 1.41 13/05/16
4 25 March to 24 June 1.31 15/08/17 1.50 15/08/16
Total 5.54 5.53
Net Asset Value/Fund Size DateNet Asset
Value£
Units inIssue
Net Asset Value
Per Unit (p)24 June 2013 541,631,489 566,315,668 95.64
24 June 2014 732,792,627 698,247,010 104.95
24 June 2015 956,046,559 827,270,497 115.57
24 June 2016 1,059,491,941 891,642,752 118.82
24 June 2017 1,153,789,556 955,139,897 120.80
FUND HISTORY
DISTRIBUTION
The Fund distributes all available income for each quarter and therefore does not need to apply an equalisation policy.
STATEMENT OF THE MANAGER’S RESPONSIBILITIES IN RESPECT OF THE FINANCIAL STATEMENTS
The Manager must not approve the financial statements unless they are satisfied that they give a true and fair view of the state of affairs of the Fund and of the total returns of the Fund for the year. In preparing these financial statements, the Manager is required to:
• select suitable accounting policies and then apply them consistently;
• make judgements and estimates that are reasonable and prudent;
• state whether applicable UK Accounting Standards and the principles set out in the Statement of Recommended Practice for Authorised Funds have been followed, subject to any material departures disclosed and explained in the financial statements;
• state whether the financial statements comply with the Scheme Particulars, subject to any material departures disclosed and explained in the financial statements; and
• prepare the financial statements on the going concern basis unless it is inappropriate to presume that the Fund will continue its activities.
The Manager is required to act in accordance with the Scheme Particulars of the Fund, within the framework of trust law. The Manager is responsible for keeping adequate accounting records that are sufficient to show and explain the Fund’s transactions and disclose with reasonable accuracy at any time the financial position of the Fund and to enable them to ensure that, where any statements of accounts are prepared by it under section 132(1) of the Charities Act 2011, regulation 6 of the Charities (Accounts and Reports) Regulations 2008 and the Statement of Recommended Practice for Authorised Funds, those statements of accounts comply with the requirements of regulations under these provisions. The Manager has general responsibility for taking such steps as are reasonably open to them to safeguard the assets of the Fund and to prevent and detect fraud and other irregularities.
The Manager is responsible for the maintenance and integrity of the financial information included on the Fund’s website. Legislation in the UK governing the preparation and dissemination of financial statements may differ from legislation in other jurisdictions.
The Manager is responsible for preparing the Manager’s Report and the financial statements in accordance with applicable law and regulations.
The Charities Act 2011 requires the Manager to prepare financial statements for each financial year. Under that Act they have elected to prepare the financial statements in accordance with UK Accounting Standards and applicable law (UK Generally Accepted Accounting Practice), including FRS 102 The Financial Reporting Standard applicable in the UK and Republic of Ireland.
MANAGER’S REPORT
LIST OF PROPERTIES
KEY FUND DATA
FINANCIAL STATEMENTS
Expense Ratio Portfolio Turnover Rate Distribution Yield Annualised Performance Investor Analysis
Fund History Distribution Table
Statement of the Manager’s Responsibilities in respect of the Financial Statements
Statement of the Corporate Trustee’s Responsibilities in respect of the Financial Statements and Corporate Trustee’s ReportIndependent Auditor’s Report Statement of Total Return and Change in Net Assets Attributable to Unitholders Balance Sheet Cash Flow Statement Notes to the Financial Statements General Information Trustee, Manager and Advisors

3938 The Charities Property Fund • Report & Accounts 2017 The Charities Property Fund • Report & Accounts 2017Savills Investment ManagementSavills Investment Management
STATEMENT OF THE CORPORATE TRUSTEE’S RESPONSIBILITIES IN RESPECT OF THE FINANCIAL STATEMENTS AND CORPORATE TRUSTEE’S REPORT
The Trustee is responsible for the safekeeping of all property of the Fund which is entrusted to it and ensuring proper registration of tangible moveable property, and for the collection of income arising from all such scheme property.
It is the duty of the Trustee to take reasonable care to ensure that the Fund is managed and operated in accordance with the Financial Conduct Authority’ Collective Investment Schemes Sourcebook (“the Sourcebook”), the Financial Services and Markets Act 2000, as amended, and the Scheme Particulars, concerning: the pricing of and dealing into the Fund; the application of income of the Scheme; and the Fund investment portfolio and borrowing activities.
The Corporate Trustee has delegated its duty as registrar for the Fund to Langham Hall UK LLP. The Corporate Trustee has conducted reviews of the delegated registration function to satisfy itself that the register is accurate. Any additional duties and powers of the Corporate Trustee not listed above are contained in the Scheme and Scheme Particulars.
Having carried out procedures and enquiries considered duly necessary to discharge our responsibilities as Trustee of the Scheme, based on information and explanations provided to us, we believe that, in all material respects, the Manager:
(i) has carried out the issue, sale, redemption and cancellation, and calculation of the price of the scheme’s units and the application of the scheme’s income in accordance with the Sourcebook, Scheme and Scheme Particulars;
(ii) has observed the investment and borrowing powers and restrictions imposed by the Scheme and Scheme Particulars; and
(iii) has, otherwise, ensured the proper operation of the Fund.
Citibank Europe plc, UK branch London18 September 2017
THE CORPORATE TRUSTEE
REPORT OF THE CORPORATE TRUSTEE TO THE UNITHOLDERS OF THE CHARITIES PROPERTY FUND FOR THE PERIOD TO 24 JUNE 2017.
INDEPENDENT AUDITOR’S REPORT
We have audited the financial statements of The Charities Property Fund for the year ended 24 June 2017 which comprise the Statement of Total Return and Change in Net Assets Attributable to Unitholders, Balance Sheet, Cash Flow Statement and related Notes to the Financial Statements, including the accounting policies detailed in Note 1. In our opinion the financial statements: • give a true and fair view of the state of the Fund’s
affairs as at 24 June 2017 and of the net revenue and the net capital gains on the property of the Fund for the year then ended;
• have been properly prepared in accordance with UK accounting standards, including FRS 102 The Financial Reporting Standard applicable in the UK and Republic of Ireland; and
• have been properly prepared in accordance with the requirements of the Charities Act 2011.
Basis for opinion We have been appointed as auditor under section 144 of the Charities Act 2011 (or its predecessors) and report in accordance with regulations made under section 154 of that Act.
We conducted our audit in accordance with International Standards on Auditing (UK) (“ISAs (UK)”) and applicable law. Our responsibilities are described below. We have fulfilled our ethical responsibilities under, and are independent of the charity in accordance with, UK ethical requirements including the FRC Ethical Standard. We believe that the audit evidence we have obtained is a sufficient and appropriate basis for our opinion.
Going concern We are required to report to you if we have concluded that the use of the going concern basis of accounting is inappropriate or there is an undisclosed material uncertainty that may cast
significant doubt over the use of that basis for a period of at least twelve months from the date of approval of the financial statements. We have nothing to report in these respects.
Other information The Manger is responsible for the other information, which comprises the Manager’s Report, List of Properties and Key Fund Data. Our opinion on the financial statements does not cover the other information and, accordingly, we do not express an audit opinion or, except as explicitly stated below, any form of assurance conclusion thereon.
Our responsibility is to read the other information and, in doing so, consider whether, based on our financial statements audit work, the information therein is materially misstated or inconsistent with the financial statements or our audit knowledge. We are required to report to you if: • based solely on that work, we have identified
material misstatements in the other information; or
• in our opinion, the information given in the Manager’s Annual Report, List of properties and Key fund data is inconsistent in any material respect with the financial statements.
We have nothing to report in these respects.
Matters on which we are required to report by exception Under the Charities Act 2011 we are required to report to you if, in our opinion: • the Fund has not kept sufficient accounting
records; or • the financial statements are not in agreement
with the accounting records; or • we have not received all the information and
explanations we require for our audit. We have nothing to report in these respects.
INDEPENDENT AUDITOR’S REPORT TO THE UNITHOLDERS OF THE CHARITIES PROPERTY FUND (‘THE FUND’).
MANAGER’S REPORT
LIST OF PROPERTIES
KEY FUND DATA
FINANCIAL STATEMENTS
Statement of the Manager’s Responsibilities in respect of the Financial Statements
Statement of the Corporate Trustee’s Responsibilities in respect of the Financial Statements and Corporate Trustee’s ReportIndependent Auditor’s Report 1 2 Statement of Total Return and Change in Net Assets Attributable to Unitholders Balance Sheet Cash Flow Statement Notes to the Financial Statements General Information Trustee, Manager and Advisors

4140 The Charities Property Fund • Report & Accounts 2017 The Charities Property Fund • Report & Accounts 2017Savills Investment ManagementSavills Investment Management
Manager’s (Savills Investment Management (UK) Limited) responsibilities As explained more fully in their statement set out on page 37, the Manager is responsible for: the preparation of financial statements which give a true and fair view; such internal control as they determine is necessary to enable the preparation of financial statements that are free from material misstatement, whether due to fraud or error; assessing the Fund’s ability to continue as a going concern, disclosing, as applicable, matters related to going concern; and using the going concern basis of accounting unless they either intend to liquidate the Fund or to cease operations, or have no realistic alternative but to do so.
Auditor’s responsibilities Our objectives are to obtain reasonable assurance about whether the financial statements as a whole are free from material misstatement, whether due to fraud or error, and to issue our opinion in an auditor’s report. Reasonable assurance is a high level of assurance, but does not guarantee that an audit conducted in accordance with ISAs (UK) will always detect a material misstatement when it exists. Misstatements can arise from fraud or error and are considered material if, individually or in aggregate, they could reasonably be expected to influence the economic decisions of users taken on the basis of the financial statements.
A fuller description of our responsibilities is provided on the FRC’s website at www.frc.org.uk/auditorsresponsibilities.
The purpose of our audit work and to whom we owe our responsibilities This report is made solely to the Fund’s unitholders, as a body, in accordance with section 144 of the Charities Act 2011 (or its predecessors) and regulations made under section 154 of that Act. Our audit work has been undertaken so that we might state to the Fund’s unitholders those matters we are required to state to them in an auditor’s report and for no other purpose. To the fullest extent permitted by law, we do not accept or assume responsibility to anyone other than the Fund and its unitholders as a body as a body, for our audit work, for this report, or for the opinions we have formed.
Bill Hollandfor and on behalf of KPMG LLP, Statutory Auditor Chartered Accountants 15 Canada Square, London, E14 5GL19 September 2017
KPMG LLP is eligible to act as an auditor in terms of section 1212 of the Companies Act 2006
INDEPENDENT AUDITOR’S REPORT CONTINUED STATEMENT OF TOTAL RETURN AND CHANGE IN
NET ASSETS ATTRIBUTABLE TO UNITHOLDERS
Year ended 24 June 2017
Year ended 24 June 2016
Note £ £
Net capital gains 3 16,914,095 28,691,761
Income 4 57,973,450 54,089,193
Expenses 5 (7,947,930) (7,079,633)
Net income before finance costs 50,025,520 47,009,560
Finance costs – interest and other 6 (175,034) (237,772)
Net income 49,850,486 46,771,788
Total return before distributions 66,764,581 75,463,549
Finance costs – distributions 7 (49,727,411) (48,956,446)
Change in net assets attributable to unitholders from investment activities 17,037,170 26,507,103
Statement of change in net assets attributable to unitholders
Opening net assets attributable to unitholders 1,059,491,941 956,046,559
Net amounts receivable on creation of units 77,260,445 76,938,279
Change in net assets attributable to unitholders from investing activities 17,037,170 26,507,103
Closing net assets attributable to unitholders 1,153,789,556 1,059,491,941
MANAGER’S REPORT
LIST OF PROPERTIES
KEY FUND DATA
FINANCIAL STATEMENTS
Statement of the Manager’s Responsibilities in respect of the Financial Statements Statement of the Corporate Trustee’s Responsibilities in respect of the Financial Statements and Corporate Trustee’s Report
Independent Auditor’s Report 1 2 Statement of Total Return and Change in Net Assets Attributable to Unitholders
Balance Sheet Cash Flow Statement Notes to the Financial Statements General Information Trustee, Manager and Advisors

4342 The Charities Property Fund • Report & Accounts 2017 The Charities Property Fund • Report & Accounts 2017Savills Investment ManagementSavills Investment Management
BALANCE SHEET
As at 24 June 2017
As at 24 June 2016
Note £ £
Assets
Fixed assets
Investment properties 8 1,093,760,000 1,055,460,000
Current assets
Debtors 9 42,324,044 11,864,569
Cash and bank balances 44,780,570 23,646,095
87,104,614 35,510,664
Total assets 1,180,864,614 1,090,970,664
Less: current liabilities
Creditors 10 14,817,666 17,272,291
Distribution payable 12,257,392 14,206,432
27,075,058 31,478,723
Total liabilities 27,075,058 31,478,723
Net assets attributable to unitholders 1,153,789,556 1,059,491,941
The financial statements were approved by the Board of Directors of the Manager on 12 September 2017 and were signed on its behalf by
Richard James Chief Financial Officer12 September 2017
Year ended 24 June 2017
Year ended 24 June 2016
£ £
Cash flow from operating activities
Reconciliation from net operating income to net cash flows from operating activities
Net income before finance costs 50,025,520 47,009,560
Bank interest received (69,246) (87,149)
(Increase)/decrease in trade and other receivables (5,691,025) 993,697
Increase/(decrease) in trade and other payables 359,682 (1,724,365)
Net cash inflow from operating activities 44,624,931 46,191,743
Cash flows from investment activities
Purchase of properties and development expenditure (100,217,838) (137,964,360)
Sale of properties 80,710,993 43,258,823
Bank interest received 69,246 87,149
Net cash outflow from investment activities (19,437,599) (94,618,388)
Cash flows before financing activities 25,187,332 (48,426,645)
Net amounts received on creation of units 47,798,628 79,556,919
Borrowing costs and interest (175,034) (237,772)
Distributions paid (51,676,451) (45,374,899)
Net cash (outflow)/inflow from financing activities (4,052,857) 33,944,248
Net increase/(decrease) in cash and cash equivalents for the year 21,134,475 (14,482,397)
Cash and cash equivalents at the start of the year 23,646,095 38,128,492
Cash and cash equivalents at the end of the year 44,780,570 23,646,095
The net amounts received on creation of units do not include movements relating to in-specie transfers which do not impact the cash position of the Fund.
CASH FLOW STATEMENTMANAGER’S REPORT
LIST OF PROPERTIES
KEY FUND DATA
FINANCIAL STATEMENTS
Statement of the Manager’s Responsibilities in respect of the Financial Statements Statement of the Corporate Trustee’s Responsibilities in respect of the Financial Statements and Corporate Trustee’s ReportIndependent Auditor’s Report Statement of Total Return and Change in Net Assets Attributable to Unitholders
Balance Sheet Cash Flow Statement
Notes to the Financial Statements General Information Trustee, Manager and Advisors

4544 The Charities Property Fund • Report & Accounts 2017 The Charities Property Fund • Report & Accounts 2017Savills Investment ManagementSavills Investment Management
NOTES TO THE FINANCIAL STATEMENTS AS AT 24 JUNE
1 ACCOUNTING POLICIES a) Basis of accounting These financial statements have been prepared
in accordance with Financial Reporting Standard 102 The Financial Reporting Standard applicable in the UK and Republic of Ireland (“FRS 102”) as issued in August 2014. The presentation currency of these financial statements is sterling.
The accounting policies set out below have, unless otherwise stated, been applied consistently to all periods presented in these financial statements.
The financial statements have been prepared under the historical cost convention, as modified by the revaluation of investment properties, and in accordance with the requirement of the Charities Act 2011 and the Statement of Recommended Practice for Financial Statements of Authorised Funds issued by the IMA in May 2014 (the “SORP”), other than as set out in (d) below.
The Fund is exempt from complying with the Charities Statement of Recommended Practice as per the guidance under paragraph 22.4 of that document.
b) Investment properties The direct property investments, which
comprise properties held for rental, are recognised at fair value, being market value as defined in the Appraisal and Valuation Manual prepared by the Royal Institution of Chartered Surveyors, and in accordance with the Scheme Particulars. The interests in property are valued on a quarterly basis and were last valued by Cushman and Wakefield on 24 June 2017. The aggregate surplus or deficit on revaluation is taken to the Statement of Total Return.
Costs capitalised in respect of properties under development include acquisition costs of land and buildings, costs incurred in bringing the property to its present location and condition in accordance with FRS 102. Investment properties in the course of development are also held at valuation.
Properties, for which unconditional exchange of contracts occurs during the period, are accounted for as acquisitions or disposals within that period. Conditional exchanges are accounted for as acquisitions or disposals only when all substantive conditions have been met and are disclosed in the Manager’s Report for information.
c) Basic financial instruments Debtors and Creditors
Debtors are recognised initially at transaction price less attributable transaction costs. Creditors are recognised initially at transaction price plus attributable transaction costs. Subsequent to initial recognition they are measured at amortised cost using the effective interest method, less any impairment losses in the case of trade debtors. These assets/liabilities are discounted where the time value of money is material.
Cash at bank Cash at bank comprises cash balances. Bank overdrafts that are repayable on demand and form an integral part of the Fund’s cash management are included as a component of cash for the purpose only of the cash flow statement. No bank overdrafts were utilised during the period.
NOTES TO THE FINANCIAL STATEMENTS CONTINUED
d) Transaction costs The Fund aggregates properties in the portfolio
statement on pages 31 and 32 in bands greater than 5% and does not disclose transaction costs separately in order to avoid disclosure of sensitive commercial information and does not therefore comply fully with the SORP.
e) Depreciation No depreciation is provided in respect of freehold
and long leasehold investment properties or in respect of assets in the course of construction.
f) Income and expenses Investment income, rental income, service
charges and other expenses are recognised on an accruals basis. The periodic charge of the Manager is deducted from income.
Rents received in advance are accounted as prepaid rent within creditors.
Lease rental income is recognised over the lease term on a straight-line basis.
Rental income from fixed and minimum guaranteed rent reviews is recognised on a straight-line basis over the lease term. As this income is not realised, it is not included in the distributions to the investors.
All expenses other than transaction charges relating to the purchase and sale of investments and certain borrowing costs (see point h) are included in ‘Expenses’ in the Statement of Total Return. Transaction charges are treated as a capital expense and are therefore capitalised.
g) Lease incentives Benefits to lessees in the form of rent
free periods, cash incentives and capital contributions are treated as a reduction in the overall return on the leases and, in accordance with FRS 102 are recognised on a straight line basis over the lease term. The total of the unamortised capital contributions
and any lease incentives in place at the period end are included within the carrying value of investment properties rather than held as a separate debtor. Any remaining lease incentive balances in respect of properties disposed of are included in the calculation of profit or loss arising on disposal. See also Note 3.
h) Borrowing costs Loan arrangement fees payable and legal costs
associated with the establishment of the facility are deemed to be costs which are incurred to give the Fund the opportunity to enter into the credit facility agreement. On this basis they are deemed to be capital in nature and excluded from distribution calculations.
Loan interest expense is recognised on an effective interest rate basis. This interest and the loan non-utilisation fee are deemed to be revenue in nature and are included within the distribution calculations. Further detail of these costs is included in Note 6.
i) Interest on development drawdowns Interest charged to developers on forward
funded developments is capitalised and treated as a deduction to costs of the development.
j) Distributions payable and distribution policy Distributions payable are classified as finance
costs and are recognised on an accruals basis. Further details of these distributions are included in Note 7.
Distributions are calculated in accordance with the Scheme Particulars.
k) Taxation As a charity the Fund is not currently liable
to UK tax on gains arising on disposals of investments, nor on income from investments, and is not liable to Stamp Duty Land Tax on purchases of property.
MANAGER’S REPORT
LIST OF PROPERTIES
KEY FUND DATA
FINANCIAL STATEMENTS
Statement of the Manager’s Responsibilities in respect of the Financial Statements Statement of the Corporate Trustee’s Responsibilities in respect of the Financial Statements and Corporate Trustee’s ReportIndependent Auditor’s Report Statement of Total Return and Change in Net Assets Attributable to Unitholders Balance Sheet Cash Flow Statement
Notes to the Financial Statements 1 2 3 4 5 6 7 8 9 10 11 12 13 14 General Information Trustee, Manager and Advisors

4746 The Charities Property Fund • Report & Accounts 2017 The Charities Property Fund • Report & Accounts 2017Savills Investment ManagementSavills Investment Management
2 RISK MANAGEMENTIn pursuing its investment objective, the Fund holds a number of properties and financial instruments. The properties comprise of direct property holdings. The following are held in accordance with the Fund’s investment policy: • Cash, liquid resources and short-term debtors
and creditors that arise directly from its operations;
• Short-term borrowings used to finance investment activity and cash flows associated with the application and redemption process; and;
• Operating leases on freehold and leasehold properties.
The Manager has responsibility for monitoring the portfolio in accordance with the investment objective and seeks to ensure that investments in direct properties and individual securities also meet a risk reward profile that is acceptable.
The typical risks applicable to the Fund are market risks, liquidity risk, credit risk and sector exposure risk.
Market risksMarket risk is the risk that the fair value or future cash flows of a financial instrument will fluctuate because of changes in market prices. The Fund’s market risks arise from (a) interest rate movements and (b) market price movements.
a) Interest rate risk The Fund’s exposure to interest rate risk
mainly arises from any variation in interest income earned on bank balances and interest payable on credit facilities due to volatility in interest rates. The Manager does not consider interest income earned on bank balances to be a significant risk to the Fund as it is not the intention of the Fund to maintain cash balances for the purpose of generating income, but to invest in investment properties when suitable investments become available.
In respect of interest payable on credit facilities, if a credit facility is utilised, the Manager will consider the life of the borrowing and will take appropriate action to mitigate the impact of interest rate fluctuations on a case by case basis.
b) Market price movements Direct property is independently valued on a
quarterly basis. However, such valuations are a matter of the valuer’s professional judgement and opinion. Such values may or may not be achieved on a sale of a property.
To mitigate against market price movements, the Manager of the Fund performs a number of controls, including the following:
Criteria Risk ControlRental income Monitors the proportion of secure or
rental income
Term of rental Verified in advance of an acquisition or lease event (e.g. tenant change) and compared with equivalent fund types or data of the Investment Property Databank (IPD)
Quality of tenants
Verified in advance of an acquisition or lease event (e.g. tenant change) by means of the credit rating from Experian and Dun & Bradstreet and benchmarking against the IPD’s Rental Information Services (IRIS)
Diversification of sectors
Monitored and constantly reviewed in advance of each property acquisition or disposal
Geographic diversification
Monitored and constantly reviewed in advance of each property acquisition or disposal
When proposing and considering a disposal, the Property Adviser and Manager will assess each property and consider factors such as current and estimated future prices, Fund liquidity, upcoming redemptions, cash held by the Fund and the portfolio profile before concluding on whether a property should be disposed of and when.
NOTES TO THE FINANCIAL STATEMENTS CONTINUED
Liquidity riskThe key liquidity risk is the holding of direct property assets. Property by its nature is an illiquid investment and the Fund’s investment properties may not be readily realisable for cash. Sales may take a number of months depending on the nature and location of the asset.
A further liquidity risk of the Fund is the redemption of units. The Manager monitors the level of redemptions, and other cash flows, on a regular basis to ensure sufficient funding is available. If insufficient cash is available to fund redemptions, the Fund can dispose of direct property holdings, utilise short term credit facilities, and defer redemptions.
Credit riskCredit risk is the risk that one party to a financial arrangement will cause a financial loss for the other party by failing to discharge an obligation.
The Fund assesses the credit risk of third parties before entering into business with third parties. Debtor balances are monitored on a regular basis to mitigate the Fund’s exposure to bad debts and in addition the ongoing credit strength of third parties is monitored.
Sector exposure risk The Fund’s assets are invested in direct properties. As such the Fund is exposed to sector specific risk as a result of its concentration in the property sector. The underlying risk is the ability to obtain tenants for these properties and tenants being able to fulfil lease commitments.
The Manager mitigates these risks by investing in a diversified portfolio of direct properties in different geographical areas and sectors. In addition, before purchasing a direct property or entering into a new lease, the Manager will examine the covenant strength offered and will aim to let only to tenants with good credit ratings.
NOTES TO THE FINANCIAL STATEMENTS CONTINUED
3 NET CAPITAL GAINSThe net gains on investments during the year comprise:
Year to 24 June 2017
Year to 24 June 2016
£ £
Net proceeds from disposal of properties 80,710,993 43,246,273
Carrying value of properties disposed during the year (79,859,999) (41,565,000)
Gains realised on properties disposed 850,994 1,681,273
Net unrealised gains on revaluation for the year 16,063,101 27,010,488
Net capital gains 16,914,095 28,691,761
MANAGER’S REPORT
LIST OF PROPERTIES
KEY FUND DATA
FINANCIAL STATEMENTS
Statement of the Manager’s Responsibilities in respect of the Financial Statements Statement of the Corporate Trustee’s Responsibilities in respect of the Financial Statements and Corporate Trustee’s ReportIndependent Auditor’s Report Statement of Total Return and Change in Net Assets Attributable to Unitholders Balance Sheet Cash Flow Statement
Notes to the Financial Statements 1 2 3 4 5 6 7 8 9 10 11 12 13 14 General Information Trustee, Manager and Advisors

4948 The Charities Property Fund • Report & Accounts 2017 The Charities Property Fund • Report & Accounts 2017Savills Investment ManagementSavills Investment Management
NOTES TO THE FINANCIAL STATEMENTS CONTINUED
4 INCOME
Year to 24 June 2017
Year to 24 June 2016
£ £
Rental income 57,310,076 53,462,149
Sundry income 594,128 539,895
Bank interest 69,246 87,149
57,973,450 54,089,193
The estimated future aggregate minimum rentals receivable under non-cancellable operating leases are as follows:
Year to 24 June 2017
Year to 24 June 2016
Within 1 year 54,480,200 52,374,108
Later than 1 year and no later than 5 years 194,069,843 180,453,139
Later than 5 years 472,803,158 411,831,350
721,353,201 644,658,597
5 EXPENSES
Year to 24 June 2017
Year to 24 June 2016
£ £
Manager and Property Management Company fees 5,518,484 5,215,726
Corporate Trustee’s fees 171,415 167,860
5,689,899 5,383,586
Other expenses:
Registration fees - 100
Insurance 156,547 30,263
Audit fee 27,844 34,331
Review fee 12,672 12,863
Valuation fee 183,579 177,973
Legal and professional fees 928,286 840,768
Marketing and communication costs 89,857 120,113
Vacant property and property maintenance costs 859,246 479,636
2,258,031 1,696,047
7,947,930 7,079,633
NOTES TO THE FINANCIAL STATEMENTS CONTINUED
6 FINANCE COSTS – INTEREST AND OTHERFinance cost during the year (excluding distributions) comprise:
Year to 24 June 2017
Year to 24 June 2016
£ £
Capital expenses
Credit Facility Arrangement Fee 49,189 56,405
Legal and professional fees 25,845 30,408
75,034 86,813
Revenue expenses
Non-Utilisation fee 100,000 150,959
100,000 150,959
Finance costs: interest and other 175,034 237,772
On 5 April 2016, the Fund renewed its fixed revolving credit facility (the “Facility”) with the Royal Bank of Scotland International (“RBSI”) for a further two years to 5 April 2018.
The Facility can be utilised as follows:• a maximum drawdown of £20,000,000 for the purchase of investment properties• a maximum drawdown of £10,000,000 for redemptions and distributions
At the year end, the Facility was unutilised and the Fund has not entered into any derivative contracts in respect of interest rates.
Legal costs associated with the establishment of the Facility are deemed to be costs which are incurred in entering into the credit facility agreement. On this basis they are deemed to be capital in nature and excluded from distribution calculations.
MANAGER’S REPORT
LIST OF PROPERTIES
KEY FUND DATA
FINANCIAL STATEMENTS
Statement of the Manager’s Responsibilities in respect of the Financial Statements Statement of the Corporate Trustee’s Responsibilities in respect of the Financial Statements and Corporate Trustee’s ReportIndependent Auditor’s Report Statement of Total Return and Change in Net Assets Attributable to Unitholders Balance Sheet Cash Flow Statement
Notes to the Financial Statements 1 2 3 4 5 6 7 8 9 10 11 12 13 14 General Information Trustee, Manager and Advisors
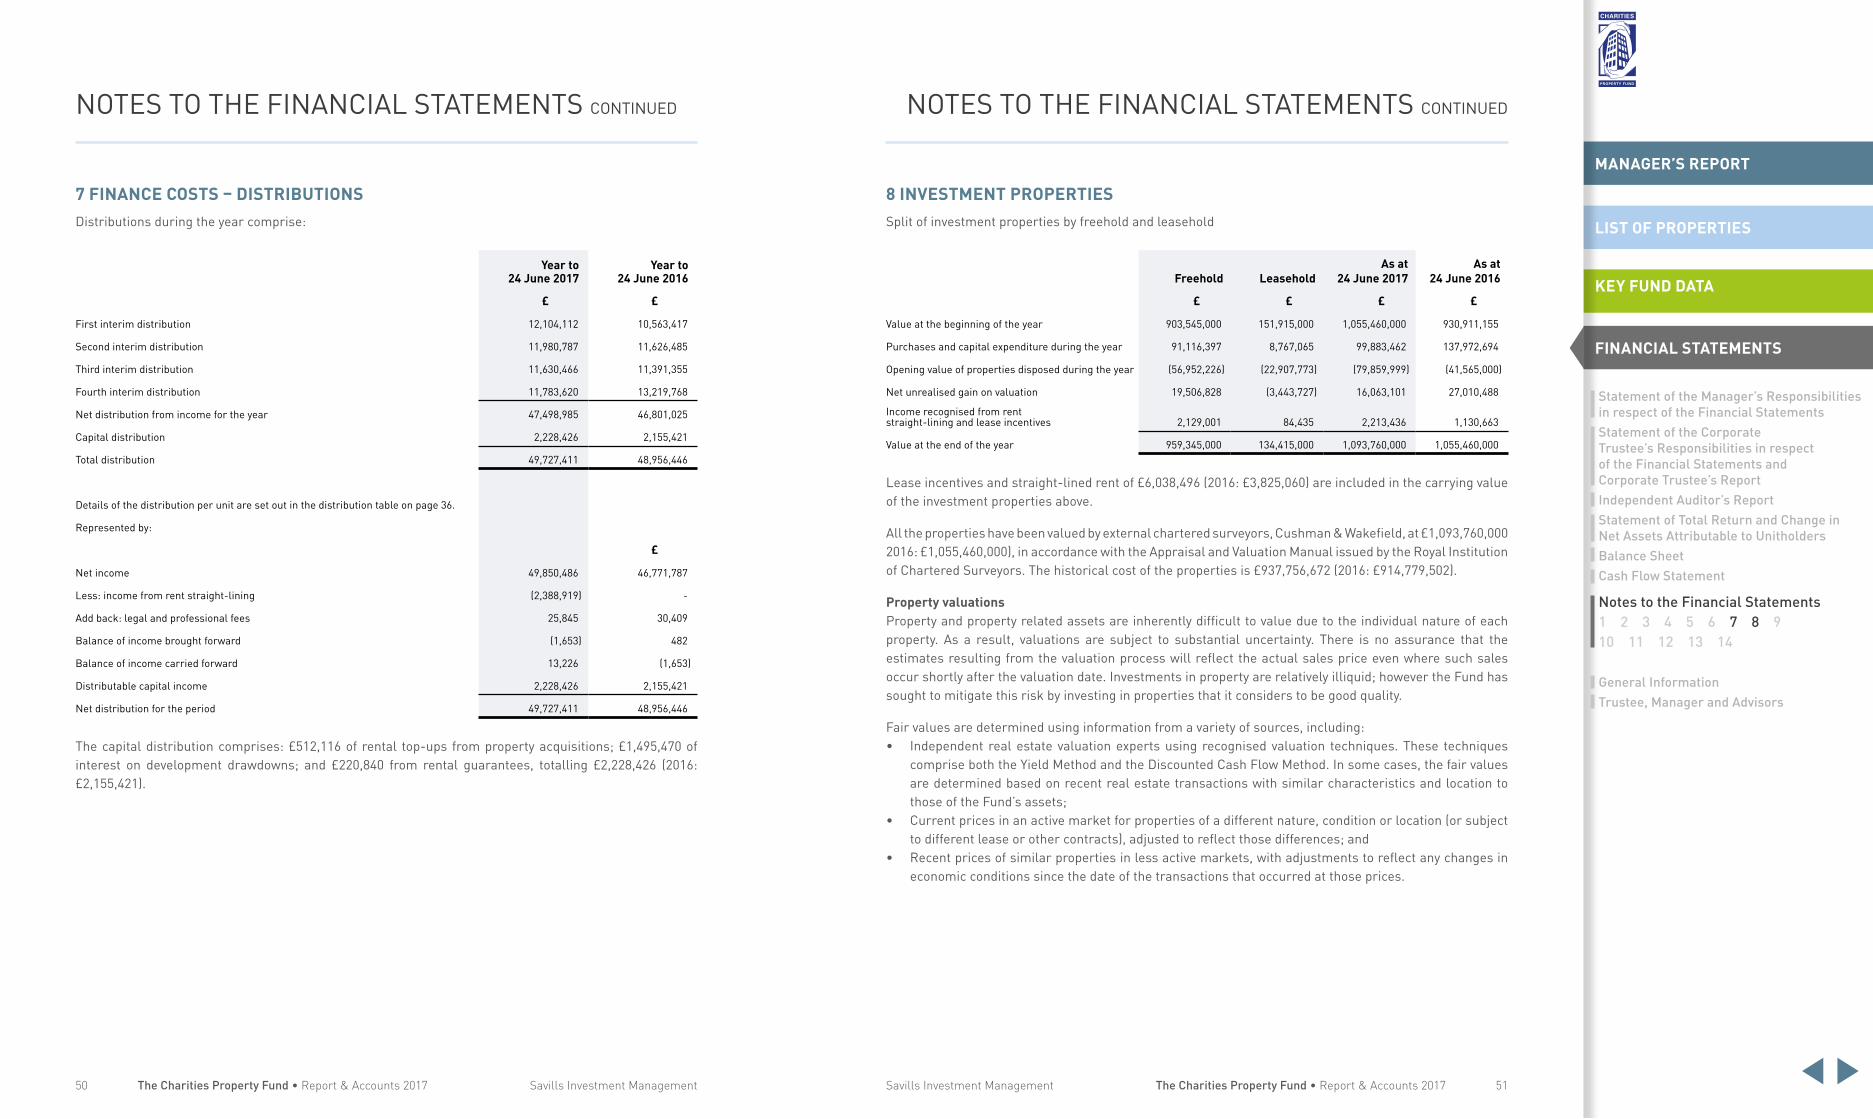
5150 The Charities Property Fund • Report & Accounts 2017 The Charities Property Fund • Report & Accounts 2017Savills Investment ManagementSavills Investment Management
NOTES TO THE FINANCIAL STATEMENTS CONTINUED
7 FINANCE COSTS – DISTRIBUTIONSDistributions during the year comprise:
Year to 24 June 2017
Year to 24 June 2016
£ £
First interim distribution 12,104,112 10,563,417
Second interim distribution 11,980,787 11,626,485
Third interim distribution 11,630,466 11,391,355
Fourth interim distribution 11,783,620 13,219,768
Net distribution from income for the year 47,498,985 46,801,025
Capital distribution 2,228,426 2,155,421
Total distribution 49,727,411 48,956,446
Details of the distribution per unit are set out in the distribution table on page 36.
Represented by:
£
Net income 49,850,486 46,771,787
Less: income from rent straight-lining (2,388,919) -
Add back: legal and professional fees 25,845 30,409
Balance of income brought forward (1,653) 482
Balance of income carried forward 13,226 (1,653)
Distributable capital income 2,228,426 2,155,421
Net distribution for the period 49,727,411 48,956,446
The capital distribution comprises: £512,116 of rental top-ups from property acquisitions; £1,495,470 of interest on development drawdowns; and £220,840 from rental guarantees, totalling £2,228,426 (2016: £2,155,421).
NOTES TO THE FINANCIAL STATEMENTS CONTINUED
8 INVESTMENT PROPERTIESSplit of investment properties by freehold and leasehold
Freehold LeaseholdAs at
24 June 2017As at
24 June 2016
£ £ £ £
Value at the beginning of the year 903,545,000 151,915,000 1,055,460,000 930,911,155
Purchases and capital expenditure during the year 91,116,397 8,767,065 99,883,462 137,972,694
Opening value of properties disposed during the year (56,952,226) (22,907,773) (79,859,999) (41,565,000)
Net unrealised gain on valuation 19,506,828 (3,443,727) 16,063,101 27,010,488
Income recognised from rent straight-lining and lease incentives 2,129,001 84,435 2,213,436 1,130,663
Value at the end of the year 959,345,000 134,415,000 1,093,760,000 1,055,460,000
Lease incentives and straight-lined rent of £6,038,496 (2016: £3,825,060) are included in the carrying value of the investment properties above.
All the properties have been valued by external chartered surveyors, Cushman & Wakefield, at £1,093,760,000 2016: £1,055,460,000), in accordance with the Appraisal and Valuation Manual issued by the Royal Institution of Chartered Surveyors. The historical cost of the properties is £937,756,672 (2016: £914,779,502).
Property valuations Property and property related assets are inherently difficult to value due to the individual nature of each property. As a result, valuations are subject to substantial uncertainty. There is no assurance that the estimates resulting from the valuation process will reflect the actual sales price even where such sales occur shortly after the valuation date. Investments in property are relatively illiquid; however the Fund has sought to mitigate this risk by investing in properties that it considers to be good quality.
Fair values are determined using information from a variety of sources, including: • Independent real estate valuation experts using recognised valuation techniques. These techniques
comprise both the Yield Method and the Discounted Cash Flow Method. In some cases, the fair values are determined based on recent real estate transactions with similar characteristics and location to those of the Fund’s assets;
• Current prices in an active market for properties of a different nature, condition or location (or subject to different lease or other contracts), adjusted to reflect those differences; and
• Recent prices of similar properties in less active markets, with adjustments to reflect any changes in economic conditions since the date of the transactions that occurred at those prices.
MANAGER’S REPORT
LIST OF PROPERTIES
KEY FUND DATA
FINANCIAL STATEMENTS
Statement of the Manager’s Responsibilities in respect of the Financial Statements Statement of the Corporate Trustee’s Responsibilities in respect of the Financial Statements and Corporate Trustee’s ReportIndependent Auditor’s Report Statement of Total Return and Change in Net Assets Attributable to Unitholders Balance Sheet Cash Flow Statement
Notes to the Financial Statements 1 2 3 4 5 6 7 8 9 10 11 12 13 14 General Information Trustee, Manager and Advisors

5352 The Charities Property Fund • Report & Accounts 2017 The Charities Property Fund • Report & Accounts 2017Savills Investment ManagementSavills Investment Management
NOTES TO THE FINANCIAL STATEMENTS CONTINUED
The determination of the fair value of investment property requires the use of estimates such as future cash flows from assets (such as lettings, tenants’ profiles, future revenue streams, capital values of fixtures and fittings, any environmental matters and the overall repair and condition of the property) and discount rates applicable to those assets. In addition, development risks (such as construction and letting risks) are also taken into consideration when determining the fair value of investment properties under construction. These estimates are based on local market conditions existing at reporting date.
Level 1: The best evidence of fair value is a quoted price for an identical asset in an active market. Quoted in an active market in this context means quoted prices are readily and regularly available and those prices represent actual and regularly occurring market transactions on an arm’s length basis. The quoted price is usually the current bid price.
Level 2: When quoted prices are unavailable, the price of a recent transaction for an identical asset provides evidence of fair value as long as there has not been a significant change in economic circumstances or a significant lapse of time since the transaction took place. If the entity can demonstrate that the last transaction price is not a good estimate of fair value (e.g. because it reflects the amount that an entity would receive or pay in a forced transaction, involuntary liquidation or distress sale), that price is adjusted.
Level 3: If the market for the asset is not active and recent transactions of an identical asset on their own are not a good estimate of fair value, an entity estimates the fair value by using a valuation technique. The objective of using a valuation technique is to estimate what the transaction price would have been on the measurement date in an arm’s length exchange motivated by normal business considerations.
All properties within the portfolio are categorised as Level 3.
Key unobservable inputs Range Relationship between key unobservable inputs and fair value
measurement. The estimated fair value would increase (decrease) if:
ERV
Generally 75% to 125% of passing rent *assuming not concessionary
Fair value would decrease if ERV as a percentage of passing rent decreased and increase if ERV as a percentage of passing rent increased.
Void periodsGenerally 9 to 18 months after the end of each lease
Fair Value would decrease if the void periods were longer and increase if the void periods were shorter.
Occupancy rates
80-100% excluding fully vacant properties undergoing refurbishment and pre-let developments
Fair Value would decrease if the occupancy rate were lower and increase if the occupancy rate was higher.
Yields Generally in the range 4% -10%
Fair Value would decrease if the yield was increased and increase if the yield was reduced.
NOTES TO THE FINANCIAL STATEMENTS CONTINUED
9 DEBTORS
As at 24 June 2017
As at 24 June 2016
£ £
Amounts receivable for creation of units 26,981,886 -
Rent receivable 10,690,653 5,572,106
Interest on development 1,878,780 542,900
Amounts due from managing agents 1,444,094 4,545,241
Insurance prepayments 846,710 -
Sundry debtors 449,203 1,122,134
Loan arrangement fee 32,718 82,188
42,324,044 11,864,569
10 CREDITORS
As at 24 June 2017
As at 24 June 2016
£ £
Redemption amount due to redeeming units - 2,479,931
Purchases awaiting settlement 430,629 765,005
Prepaid rent 12,005,324 12,485,611
Manager and Property Manager fees 1,420,264 60,000
Corporate Trustee fees 44,242 42,394
Audit fees 25,729 26,101
Valuation fees 47,852 46,176
Credit facility non utilisation fee and debt arrangement fee - 22,192
VAT payable 80,440 1,024,347
Vacant property costs 13,384 –
Other creditors 569,714 15,105
Interest payable - 2,881
Retentions 180,088 302,548
14,817,666 17,272,291
MANAGER’S REPORT
LIST OF PROPERTIES
KEY FUND DATA
FINANCIAL STATEMENTS
Statement of the Manager’s Responsibilities in respect of the Financial Statements Statement of the Corporate Trustee’s Responsibilities in respect of the Financial Statements and Corporate Trustee’s ReportIndependent Auditor’s Report Statement of Total Return and Change in Net Assets Attributable to Unitholders Balance Sheet Cash Flow Statement
Notes to the Financial Statements 1 2 3 4 5 6 7 8 9 10 11 12 13 14 General Information Trustee, Manager and Advisors

5554 The Charities Property Fund • Report & Accounts 2017 The Charities Property Fund • Report & Accounts 2017Savills Investment ManagementSavills Investment Management
NOTES TO THE FINANCIAL STATEMENTS CONTINUED
11 RELATED PARTY TRANSACTIONSAmounts payable to the Manager, Property Manager or associates of both are shown in note 5. Amounts due are shown in note 10.
During the year the Manager has received management fees of £5,394,268 (2016: £5,074,320) and the Property Management Company fees of £124,216 (2016: £141,406) thereby totalling £5,518,484 (2016: £5,215,726).
The amount outstanding at the year end in respect of those fees was £1,420,264 (2016: £60,000).
During the year the Property Manager has received transactional fees of £387,802 (2016: £247,725) and fees relating to asset management and dealing activity of £714,542 (2016: £861,249). The majority of these fees sit within the legal and profession expenses line in note 5.
During the year the Corporate Trustee received £171,415 (2016: £167,860).
Amounts payable to the Corporate Trustee or associates of the Corporate Trustee are shown in note 5. Amounts due are shown in note 10.
The amount outstanding at the year end in respect of those fees was £44,242 (2016: £42,394).
Details of the Manager, Property Manager and Corporate Trustee can be found on pages 57 through to 60.
The aggregate monies received through creations and paid through cancellations are disclosed in the Statement of Change in Net Assets Attributable to Unitholders. Subscription money awaiting investment into The Charities Property Fund is held in an account in the name of Savills Investment Management (UK) Limited, the Manager. The money will be dealt with in accordance with the FCA’s Client Money Rules.
12 UNIT RECONCILIATIONThe below table details the movement in application and redemption units over the past 12 months. Please also see the table on page 36 ‘Fund History’.
GROSS
Trading Quarter No. Units Applications Redemptions Net Movement
24 Sep 2016 904,527,832.296 20,152,211.341 7,267,131.399 12,885,079.942
24 Dec 2016 920,362,073.881 22,492,932.870 6,658,691.285 15,834,241.585
24 Mar 2017 933,185,555.022 19,364,388.368 6,540,907.227 12,823,481.141
24 Jun 2017 955,139,896.790 27,189,042.513 5,234,700.745 21,954,341.768
TOTAL 89,198,575.092 25,701,430.656 63,497,144.436
13 POST BALANCE SHEET EVENTSThere were no post balance sheet events requiring disclosure.
14 CONTINGENT LIABILITIESThere were no contingent liabilities at the year end (2016: none).
NOTES TO THE FINANCIAL STATEMENTS CONTINUED
MANAGER’S REPORT
LIST OF PROPERTIES
KEY FUND DATA
FINANCIAL STATEMENTS
Statement of the Manager’s Responsibilities in respect of the Financial Statements Statement of the Corporate Trustee’s Responsibilities in respect of the Financial Statements and Corporate Trustee’s ReportIndependent Auditor’s Report Statement of Total Return and Change in Net Assets Attributable to Unitholders Balance Sheet Cash Flow Statement
Notes to the Financial Statements 1 2 3 4 5 6 7 8 9 10 11 12 13 14 General Information Trustee, Manager and Advisors

5756 The Charities Property Fund • Report & Accounts 2017 The Charities Property Fund • Report & Accounts 2017Savills Investment ManagementSavills Investment Management
GENERAL INFORMATION
FUND STRUCTUREThe Charities Property Fund is a Common Investment Fund which is an open ended investment vehicle, similar to a unit trust, but designed specifically for charities and established under Section 96 of the Charities Act 2011. Common Investment Funds are themselves charities with schemes approved and regulated by the Charity Commission. As a charity, the Fund is currently exempt not only from Stamp Duty Land Tax (currently 5% on all property transactions over £250,000) but also Capital Gains Tax and Income Tax.
INVESTMENT OBJECTIVESThe Fund aims to provide a high and secure level of income with the prospect of growth in income and to maintain the capital value of assets held in the Fund, through investing in a diversified UK commercial property portfolio. The Fund invests in the principal commercial property sectors: office, retail, industrial and other (alternative uses such as hotels, leisure, car showrooms, and roadside). It does not undertake speculative investments.
The Manager does not intend to hold more than 10% in value of the property of the Fund in cash or Near Cash (as defined in FSA Handbook of Rules and Guidance).
UNIT DEALINGAs the Fund is valued quarterly, units can be purchased at the end of March, June, September and December. Normally units will be redeemed with effect from a quarter day though this is subject to cash being available for redemptions. In addition, where there are both subscriptions and redemptions at a quarter day, the Manager may apply a matching process. The Manager may, at its sole discretion, defer the acceptance of applications on a pro rata basis when the value of unit applications exceeds the value of units the Manager believes is prudent to issue. These applications for units which have been scaled back will remain valid in respect of the unallocated element for a further three months, i.e. until the next Dealing Date and will be dealt with in priority to those applications first made at this dealing date.
Further details of the process for buying and selling units is set out in the Scheme Particulars which are available on the Fund’s website (www.cpfund.co.uk). To protect the overall position of unitholders, there are clearly defined restrictions on the right to redeem as set out in the Scheme Particulars.
MINIMUM INVESTMENTThe minimum investment in the Fund for new investors is £25,000, although smaller amounts may be accepted at the Manager’s discretion. There is no minimum investment for existing unitholders.
DISTRIBUTIONThe income is paid gross on a quarterly basis, six weeks after each valuation point (on or before 15 February, 15 May, 15 August and 15 November).
CORPORATE TRUSTEECitibank Europe plc, UK Branch is the corporate trustee and depository of the Fund, as set out in the Scheme Particulars. The Fund acts by and through the Corporate Trustee. When the Fund acquires property, it does so by way of the Corporate Trustee appointing Citiclient (CPF) Nominees Limited and Citiclient (CPF) Nominees No 2 Limited to hold the relevant property of the Fund as nominees and bare trustees for the Corporate Trustee
The Corporate Trustee will be entitled to receive fees (payable quarterly in arrears) based on the Net Asset Value at the start of the accrual period, on each Valuation Date. The fees (excluding value added tax) are subject to a minimum fee of £15,000 p.a. and will be based on the following annual rates:
• £0 to £200 million – 0.02%;• above £200 million – 0.015%.
The Corporate Trustee may increase the current rates of fees if:
(i) the Corporate Trustee has given notice in writing to the Manager and to the unitholders of its intention to increase these rates of fees;
(ii) the Scheme Particulars have been revised (subject to the prior written approval of the Commission) to reflect the proposed increase in the rates; and
(iii) 90 days have elapsed since the revised Scheme Particulars became available.
ALTERNATIVE INVESTMENT FUND MANAGER (AIFM) Under an AIFM Agreement, the Fund appointed the existing manager of the Fund, Savills Investment Management (UK) Limited as its Alternative Investment Fund Manager (AIFM) for the purposes of the AIFM Directive in 2014. The AIFM is admitted and regulated in the United Kingdom by the Financial Conduct Authority (the “FCA”).
The AIFM is subject to the requirements set out in the AIFM Directive, the Scheme and the Scheme Particulars. In its capacity as AIFM, it carries out the following tasks under the AIFM agreement:
(i) Asset management of the Fund, including, without limitation, portfolio and risk management; and
(ii) Marketing and distribution of units in the Fund.
In accordance with the provisions of the AIFM Directive and with the approval of the FCA, the AIFM may delegate, at its own responsibility and cost and under its own supervision, tasks to other entities suitable for the relevant purpose and having the necessary qualification, experience and resources. Any such delegation will be disclosed to the investors. The portfolio management of the Fund was delegated to Savills Investment Management LLP by the AIFM. Citibank Europe plc, UK branch was appointed as the depositary of the Fund. To cover potential professional liability risks resulting from negligence in its business activities, the AIFM has appropriate and sufficient professional indemnity insurance, as stipulated by the relevant provisions of the AIFM Directive.
GENERAL INFORMATION CONTINUED
MANAGER’S REPORT
LIST OF PROPERTIES
KEY FUND DATA
FINANCIAL STATEMENTS
Statement of the Manager’s Responsibilities in respect of the Financial Statements Statement of the Corporate Trustee’s Responsibilities in respect of the Financial Statements and Corporate Trustee’s ReportIndependent Auditor’s Report Statement of Total Return and Change in Net Assets Attributable to Unitholders Balance Sheet Cash Flow Statement Notes to the Financial Statements
General Information1 2
Trustee, Manager and Advisors

5958 The Charities Property Fund • Report & Accounts 2017 The Charities Property Fund • Report & Accounts 2017Savills Investment ManagementSavills Investment Management
GENERAL INFORMATION CONTINUED
REMUNERATION CODE DISCLOSURE FOR SAVILLS INVESTMENT MANAGEMENT (UK) LTD
October 2016The Financial Conduct Authority’s (FCA) AIFM remuneration Code applies to Savills Investment Management (UK) Ltd (the firm). The Firm has considered the FCA’s proportionality guidelines and taking account of size, the lack of complexity and the low risk of the firm a number of the remuneration rules have been disapplied.
The disclosure covers the remuneration paid in respect of the financial period from 1 January 2016 to 31 December 2016.
Decision Making ProcessSavills IM Group has a Remuneration Committee that meets regularly to consider issues relating to the remuneration policy and the structures for all employees of the Group including those of the firm. The Savills IM Remuneration Policy Statement is reviewed and agreed annually by the Savills IM Remuneration Committee. The Remuneration Committee is comprised of two shareholder representatives and the Savills IM Chief Executive Officer and is delegated from the Savills IM Board.
Remuneration is reviewed annually, in conjunction with the Group appraisal process. A recommendation regarding salary and bonus levels is made by an individual’s line manager, and assessed against the Group as a whole by the Savills IM Global Executive Committee. Salaries are also benchmarked against market averages. The Savills IM Global Executive Committee will recommend salary changes and discretionary bonus payments to the Remuneration Committee for approval and adoption. Interim reviews are undertaken on an exceptions basis only.
Link between Pay and Performance Remuneration is dependent on both the performance of the firm and the Individual. The bonus pool is calculated as a fixed percentage of pre-tax Group profits. The fixed and variable elements of remuneration have been developed to attract and retain high calibre staff to ensure the firm is in a position to deliver the business plans and maximise return to shareholders. The remuneration policy and incentive structures apply to all code staff, rewarding them only when their goals are achieved.
Employees of the firm received; salary, car allowance, discretionary bonus and incentive shares in the ultimate parent, Savills Plc. Share awards are made in line with the Savills Group policy, in the form of retention or bonus awards, details of which can be found within the Savills plc Report and Accounts.
Staff RemunerationThe total aggregate remuneration for staff was £32,282,412 of which there were 257 beneficiaries. £21,093,157 of this remuneration was fixed and £11,189,255 was variable.
21 of the beneficiaries were identified as remuneration code staff, as defined by AIFM remuneration code, and their total aggregated remuneration was £9,614,089. £4,064,579 of this remuneration was earned by Senior Managers and £5,549,510 was earned by other code staff.
THE MANAGER AND PROPERTY MANAGERThe Manager’s fees and the Property Manager’s fees are combined into one management charge. This periodic management charge shall accrue on a quarterly basis and will be determined by the Net Asset Value of the Fund at the start of the accrual period. It will be deducted and paid at the end of each quarter out of the Fund’s assets. The fees (excluding value added tax) will be based on the following annual rates: • £0 to £100 million – 0.70%; • £100 to £500 million – 0.525%; • above £500 million – 0.45%.
The Manager may increase the current annual management fees and the current preliminary charge (or introduce a redemption charge) if:
(i) the Manager has given notice in writing to the Corporate Trustee and to the unitholders of its intention to increase the rates of annual management fees, or to increase the preliminary charge, or to introduce a redemption charge (as the case may be);
(ii) the Scheme Particulars have been revised subject to the prior written approval of the Charity Commission to reflect the proposed increase in these rates of annual management fees, or to increase the current preliminary charge, or to introduce a redemption charge; and
(iii) 90 days have elapsed since the revised Scheme Particulars became available.
PRELIMINARY CHARGEThe Manager also applies a preliminary charge of 0.25% of the initial price of the units and this is included in the price at which units may be purchased.
This charge may be reduced at the Manager’s sole discretion.
BORROWING POWERSUnder the Scheme, the Manager is allowed to borrow money for the use of the Fund in certain circumstances. The Manager intends to use this power when it considers this to be in the best interests of the unitholders, principally either to obtain bridging finance to purchase real property for the Fund in anticipation of the receipt of committed subscriptions from existing or new unitholders or to finance the redemption of units pending the receipt of sales proceeds. Borrowing will not exceed 10% of the Net Asset Value of the Fund on any Business Day.
GENERAL INFORMATION CONTINUED
MANAGER’S REPORT
LIST OF PROPERTIES
KEY FUND DATA
FINANCIAL STATEMENTS
Statement of the Manager’s Responsibilities in respect of the Financial Statements Statement of the Corporate Trustee’s Responsibilities in respect of the Financial Statements and Corporate Trustee’s ReportIndependent Auditor’s Report Statement of Total Return and Change in Net Assets Attributable to Unitholders Balance Sheet Cash Flow Statement Notes to the Financial Statements
General Information1 2
Trustee, Manager and Advisors

60 The Charities Property Fund • Report & Accounts 2017 Savills Investment ManagementSavills Investment Management
TRUSTEE, MANAGER AND ADVISERS
DETAILSCorporate Trustee and DepositoryCitibank Europe plc, UK branchCitigroup CentreCanada SquareCanary WharfLondonE14 5LB
Investment AdviserSavills Investment Management (UK) Limited33 Margaret StreetLondonW1G 0JD
Standing Independent ValuerCushman & Wakefield LLP43-45 Portman SquareLondonW1A 3BG
Legal AdviserFarrer & Co66 Lincoln’s Inn FieldsLondonWC2A 3LH
Performance MeasurementMSCI (formerly IPD)9th Floor 10 Bishops SquareLondonE1 6EG
Manager / AIFMSavills Investment Management (UK) Limited33 Margaret StreetLondonW1G 0JD
Property ManagerSavills Investment Management LLP33 Margaret StreetLondonW1G 0JD
AuditorKPMG LLP15 Canada SquareLondonE14 5GL
Property Management CompanySavills (UK) Limited33 Margaret StreetLondonW1G 0JD
This Report is issued by Savills Investment Management (UK) Limited, registered in England Number 03680998, which is authorised and regulated by the Financial Conduct Authority Number 193863 and is a subsidiary of Savills Investment Management LLP, a limited liability partnership registered in England Number OC306423. Savills Investment Management LLP is authorised and regulated by the Financial Conduct Authority Number 615368. The registered office of both entities is at 33 Margaret Street, London W1G 0JD. A list of members of Savills Investment Management LLP is available from the registered office. The Charities Property Fund is a registered charity, Number 1080290.
This document is provided for information purposes only and may not be reproduced in any form without the express permission of Savills Investment Management (UK) Limited. The opinions expressed here represent the views of the fund managers at the time of preparation and should not be interpreted as investment advice. This report is aimed at existing investors in the Fund but it may also be distributed to prospective investors. This report is not an offer to invest in the Fund. Independent financial advice should be sought before investment in the Fund.
The value of property is generally a matter of a valuer’s opinion rather than fact. Please remember that past performance is not necessarily a guide to future performance. The value of an investment and the income from it can fall as well as rise and investors may not get back the amount originally invested. Taxation levels, bases and (if relevant) reliefs can change. Property can be difficult to sell and it may be difficult to realise your investment when you want to.
Handstand Creativewww.handstandcreative.com
MANAGER’S REPORT
LIST OF PROPERTIES
KEY FUND DATA
FINANCIAL STATEMENTS
Statement of the Manager’s Responsibilities in respect of the Financial Statements Statement of the Corporate Trustee’s Responsibilities in respect of the Financial Statements and Corporate Trustee’s ReportIndependent Auditor’s Report Statement of Total Return and Change in Net Assets Attributable to Unitholders Balance Sheet Cash Flow Statement Notes to the Financial Statements General Information
Trustee, Manager and Advisors

33 Margaret Street, London W1G 0JD
Telephone: 0203 107 5439 Fax: 0845 409 1281
[email protected] www.cpfund.co.uk
MANAGER’S REPORT
LIST OF PROPERTIES
KEY FUND DATA
FINANCIAL STATEMENTS