annual report 2020 - financial statements
TRANSCRIPT

An employee who has been with the Iron Ore Company of Canada (IOC) for more than 53 years! IOC’s high-grade iron ore is used in a wide variety of everyday applications.
Financial Statements
196 Annual Report 2020 | riotinto.com

Strengtheningcom
munities and social
performance
$23.9bn
Underlying EBITDA
197Annual Report 2020 | riotinto.com
Financial Statements

Financial Statements
198 Annual Report 2020 | riotinto.com

2020 Financial Statements
Primary financial statements Capital and reservesGroup Income Statement 200 Note 26 Share capital – Rio Tinto plc 246Group Statement of Comprehensive Income 201 Note 27 Share capital – Rio Tinto Limited 246Group Cash Flow Statement 202 Note 28 Other reserves and retained earnings 247Group Balance Sheet 203Group Statement of Changes in Equity 204
Additional disclosuresReconciliation with Australian
205Note 29 Financial instruments
249Accounting Standards and risk managementOutline of dual listed companies
205Note 30 Contingencies and commitments 259
structure and basis of financial statements Note 31 Average number of employees 262Note 32 Principal subsidiaries 263
Notes to the 2020 Financial Statements Note 33 Principal joint operations 265Group income statement and Note 34 Principal joint ventures 266cash flow statement Note 35 Principal associates 267Note 1 Principal accounting policies 206 Note 36 Purchases and sales of
268Note 2 Operating segments 223 subsidiaries, joint ventures, associatesNote 3 Operating segments –
227and other interests in businesses
additional information Note 37 Directors’ and key269Note 4 Net operating costs
228management remuneration
(excluding items shown separately) Note 38 Auditors’ remuneration 270Note 5 Employment costs 229 Note 39 Related-party transactions 270Note 6 Impairment charges 229 Note 40 Exchange rates in US$ 271Note 7 Share of profit after tax of
231
Note 41 Share-based payments 271equity accounted units Note 42 Post-retirement benefits 274
Note 8 Finance income and finance costs 231 Note 43 Rio Tinto Limited parent280Note 9 Taxation 232 company disclosures
Note 10 Earnings per ordinary share 233 Note 44 Related undertakings 281Note 11 Dividends 233 Note 45 Events after the balance sheet date 300
Rio Tinto plc Company Information 301Group balance sheet Rio Tinto Financial Information 306Note 12 Goodwill 234 by Business UnitNote 13 Intangible assets 235 Australian Corporations Act – 310Note 14 Property, plant and equipment 236 Summary of ASIC ReliefNote 15 Investments in equity
238Directors’ Declaration 311
accounted units Independent Auditors’ Reports of KPMG to the Members of Rio Tinto plc and of KPMG to the Members of Rio Tinto Limited 312
Note 16 Inventories 239Note 17 Deferred taxation 239Note 18 Receivables and other assets 241 Auditors’ Independence Declaration 328Note 19 Other financial assets 241 Alternative Performance Measures 329Note 20 Cash and cash equivalents 241 Financial Summary 2011-2020 334Note 21 Borrowings and other
242Summary of Financial Data in Australian 335
financial liabilities Dollars, Sterling and US DollarsNote 22 Leases 242
Note 23 Consolidated net (debt)/cash 243
Note 24 Trade and other payables 244
Note 25 Provisions (including post-244retirement benefits)
199Annual Report 2020 | riotinto.com
Financial Statements

Note2020
US$m2019US$m
2018US$m
Consolidated operationsConsolidated sales revenue 2,3 44,611 43,165 40,522 Net operating costs (excluding items shown separately) 4 (26,254) (27,307) (27,115) Impairment charges 6 (904) (3,487) (132) Net (losses)/gains on consolidation and disposal of interests in businesses 2,36 — (291) 4,622 Exploration and evaluation costs 13 (625) (624) (488) Profit relating to interests in undeveloped projects 13 1 10 278 Operating profit 16,829 11,466 17,687 Share of profit after tax of equity accounted units 7 652 301 513 Impairment of investments in equity accounted units 6 (339) — — Profit before finance items and taxation 17,142 11,767 18,200 Finance itemsNet exchange (losses)/gains on net external and intragroup debt balances (1,124) 58 704 Net losses on derivatives not qualifying for hedge accounting (123) (68) (57) Finance income 8 141 300 249 Finance costs 8 (268) (554) (552) Amortisation of discount (377) (384) (377)
(1,751) (648) (33) Profit before taxation 15,391 11,119 18,167 Taxation 9 (4,991) (4,147) (4,242) Profit after tax for the year 10,400 6,972 13,925 – attributable to owners of Rio Tinto (net earnings) 9,769 8,010 13,638 – attributable to non-controlling interests 631 (1,038) 287
Basic earnings per share 10 604.0 c 491.4 c 793.2 cDiluted earnings per share 10 599.8 c 487.8 c 787.6 c
The notes on pages 206-300 are an integral part of these consolidated financial statements.
Financial Statements
Group Income StatementYears ended 31 December
200 Annual Report 2020 | riotinto.com200 Annual Report 2020 | riotinto.com
Financial Statements
Group Income StatementYears ended 31 December

Note2020
US$m2019US$m
2018US$m
Profit after tax for the year 10,400 6,972 13,925
Other comprehensive (loss)/incomeItems that will not be reclassified to profit or loss:Actuarial (losses)/gains on post-retirement benefit plans 42 (474) (262) 907 Changes in the fair value of equity investments held at fair value through other comprehensive income (FVOCI) 10 (5) (13) Tax relating to these components of other comprehensive income 9 112 83 (271) Share of other comprehensive losses of equity accounted units, net of tax (6) (6) (1)
(358) (190) 622
Items that have been/may be subsequently reclassified to profit or loss:Currency translation adjustment(a) 2,967 343 (3,830) Currency translation on companies disposed of, transferred to the income statement — 215 14 Fair value movements:– Cash flow hedge gains 24 12 156 – Cash flow hedge (gains)/losses transferred to the income statement (63) (41) 40 Net change in costs of hedging(b) 28 7 3 (39) Tax relating to these components of other comprehensive loss/(income) 9 3 (6) (54) Share of other comprehensive income/(loss) of equity accounted units, net of tax 4 10 (48) Other comprehensive income/(loss) for the year, net of tax 2,584 346 (3,139) Total comprehensive income for the year 12,984 7,318 10,786 – attributable to owners of Rio Tinto 12,201 8,351 10,663 – attributable to non-controlling interests 783 (1,033) 123
(a) Excludes a currency translation gain of US$333 million (2019: charge of US$29 million; 2018: charge of US$382 million) arising on Rio Tinto Limited’s share capital for the year ended 31 December 2020, which is recognised in the Group statement of changes in equity. Refer to Group statement of changes in equity on page 204.
(b) As part of the 2018 bond buy-back programme, cross currency interest rate swaps hedging the bonds repurchased were closed out. This resulted in the reclassification of US$3 million from the cost of hedging reserve to finance costs in the income statement in 2018. There was no bond buy-back programme in 2019 or 2020.
The notes on pages 206-300 are an integral part of these consolidated financial statements.
Group Statement of Comprehensive IncomeYears ended 31 December
Annual Report 2020 | riotinto.com 201201Annual Report 2020 | riotinto.com
Financial Statements
Group Statement of Comprehensive IncomeYears ended 31 December
Primary Financial Statements

Note2020
US$m2019US$m
2018US$m
Cash flows from consolidated operations(a) 21,822 19,705 15,655 Dividends from equity accounted units 594 669 800 Cash flows from operations 22,416 20,374 16,455
Net interest paid (569) (537) (612) Dividends paid to holders of non-controlling interests in subsidiaries (683) (376) (420) Tax paid (5,289) (4,549) (3,602) Net cash generated from operating activities 15,875 14,912 11,821
Cash flows from investing activitiesPurchases of property, plant and equipment and intangible assets 2 (6,189) (5,488) (5,430) Disposals of subsidiaries, joint ventures, unincorporated joint operations and associates 36 10 (80) 7,733 Purchases of financial assets(b) (5) (43) (1,572) Sales of financial assets(b) 63 83 19 Sales of property, plant and equipment and intangible assets 45 49 586 Net funding of equity accounted units (43) (33) (9) Acquisitions of subsidiaries, joint ventures and associates 36 — — (5) Other investing cash flows 18 (437) 11 (1) Net cash (used)/generated in investing activities (6,556) (5,501) 1,321
Cash flows before financing activities 9,319 9,411 13,142
Cash flows from financing activitiesEquity dividends paid to owners of Rio Tinto 11 (6,132) (10,334) (5,356) Proceeds from additional borrowings 125 80 54 Repayment of borrowings and associated derivatives(c) 21 (721) (203) (2,300) Lease principal payments 22 (324) (315) — Proceeds from issue of equity to non-controlling interests 129 101 85 Own shares purchased from owners of Rio Tinto (208) (1,552) (5,386) Other financing cash flows 1 4 (48) Net cash flows used in financing activities (7,130) (12,219) (12,951) Effects of exchange rates on cash and cash equivalents 165 (54) 151 Net increase/(decrease) in cash and cash equivalents 2,354 (2,862) 342 Opening cash and cash equivalents less overdrafts 8,027 10,889 10,547 Closing cash and cash equivalents less overdrafts 20 10,381 8,027 10,889
(a) Cash flows from consolidated operationsProfit after tax for the year 10,400 6,972 13,925 Adjustments for:– Taxation 4,991 4,147 4,242 – Finance items 1,751 648 33 – Share of profit after tax of equity accounted units (652) (301) (513) – Net losses/(gains) on consolidation and disposal of interests in businesses 36 — 291 (4,622) – Impairment charges of investments in equity accounted units after tax 6 339 — — – Impairment charges 6 904 3,487 132 – Depreciation and amortisation 4,279 4,384 4,015 – Provisions (including exchange differences on provisions) 894 753 1,011 Utilisation of provisions (582) (539) (620) Utilisation of provision for post-retirement benefits 25 (192) (205) (219) Change in inventories (281) 28 (587) Change in receivables and other assets (562) 163 (421) Change in trade and other payables 558 (191) 476 Other items(d) (25) 68 (1,197)
21,822 19,705 15,655
(b) In 2020, the Group received net proceeds of US$58 million (2019 and 2018 net purchase of US$28 million and US$1.6 billion respectively) from its sales and purchases of investments within a separately managed portfolio of fixed income instruments. Purchases and sales of these securities are reported on a net cash flow basis within “Sales of financial assets” or “Purchases of financial assets” depending on the overall net position at each reporting date.
(c) On 11 May 2020, we repaid our €402 million (nominal value) Rio Tinto Finance plc Euro Bonds on their maturity. The cash outflow relating to the repayment of the bonds and the realised loss on the derivatives have been recognised within "Repayment of borrowings and associated derivatives" in the Group cash flow statement and totalled US$526 million.
(d) In 2018 other items included adjustments to add back mark-to-market gains of US$288 million relating to derivative contracts transacted for operational purposes and not designated in a hedge relationship, a gain of US$549 million on the sale of surplus land at Kitimat and a gain of US$167 million on the revaluation of a financial asset arising from the disposal of the Mount Pleasant coal project in 2016.
The notes on pages 206-300 are an integral part of these consolidated financial statements.
Financial Statements
Group Cash Flow StatementYears ended 31 December
202 Annual Report 2020 | riotinto.com202 Annual Report 2020 | riotinto.com
Financial Statements
Group Cash Flow StatementYears ended 31 December

Note2020
US$m2019US$m
Non-current assetsGoodwill 12 946 922 Intangible assets 13 2,755 2,637 Property, plant and equipment 14 62,882 57,372 Investments in equity accounted units 15 3,764 3,971 Inventories 16 174 139 Deferred tax assets 17 3,385 3,102 Receivables and other assets 18 1,796 1,716 Tax recoverable 4 5 Other financial assets 19 829 635
76,535 70,499 Current assetsInventories 16 3,917 3,463 Receivables and other assets 18 3,644 3,027 Tax recoverable 62 116 Other financial assets 19 2,851 2,670 Cash and cash equivalents 20 10,381 8,027
20,855 17,303 Total assets 97,390 87,802
Current liabilitiesBorrowings and other financial liabilities 21 (607) (1,372) Trade and other payables 24 (7,421) (6,480) Tax payable (1,850) (1,874) Provisions including post-retirement benefits 25 (1,729) (1,399)
(11,607) (11,125) Non-current liabilitiesBorrowings and other financial liabilities 21 (13,408) (13,341) Trade and other payables 24 (820) (794) Tax payable (477) (376) Deferred tax liabilities 17 (3,239) (3,220) Provisions including post-retirement benefits 25 (15,936) (13,704)
(33,880) (31,435) Total liabilities (45,487) (42,560) Net assets 51,903 45,242
Capital and reservesShare capital– Rio Tinto plc 26 207 207 – Rio Tinto Limited 27 3,781 3,448 Share premium account 4,314 4,313 Other reserves 28 11,960 9,177 Retained earnings 28 26,792 23,387 Equity attributable to owners of Rio Tinto 47,054 40,532 Attributable to non-controlling interests 4,849 4,710 Total equity 51,903 45,242
The notes on pages 206-300 are an integral part of these consolidated financial statements.
The financial statements on pages 200-300 were approved by the directors on 22 February 2021 and signed on their behalf by
Simon Thompson Chairman
Jakob StausholmChief Executive
Peter CunninghamInterim Chief Financial Officer
Group Balance SheetAt 31 December
Annual Report 2020 | riotinto.com 203203Annual Report 2020 | riotinto.com
Financial Statements
Group Balance SheetAt 31 December
Primary Financial Statements

Year ended 31 December 2020
Attributable to owners of Rio Tinto
Share capital(notes 26
and 27)US$m
Share premium
accountUS$m
Other reserves
(note 28)US$m
Retained earnings
(note 28) US$m
TotalUS$m
Non-controlling
interestsUS$m
TotalequityUS$m
Opening balance 3,655 4,313 9,177 23,387 40,532 4,710 45,242 Total comprehensive income for the year(a) — — 2,798 9,403 12,201 783 12,984 Currency translation arising on Rio Tinto Limited's share capital(b) 333 — — — 333 — 333 Dividends (note 11) — — — (6,132) (6,132) (689) (6,821) Share buy-back(c) — — — (1) (1) — (1) Own shares purchased from Rio Tinto shareholders to satisfy share
awards to employees(d) — — (76) (31) (107) — (107)
Change in equity interest held by Rio Tinto — — — 84 84 (84) — Treasury shares reissued and other movements — 1 — — 1 — 1 Equity issued to holders of non-controlling interests — — — — — 129 129 Employee share options and other IFRS 2 charges to the income
statement — — 61 82 143 — 143
Closing balance 3,988 4,314 11,960 26,792 47,054 4,849 51,903
Year ended 31 December 2019
Attributable to owners of Rio Tinto
Share capital(notes 26
and 27)US$m
Share premiumaccount
US$m
Other reserves
(note 28)US$m
Retained earnings
(note 28) US$m
TotalUS$m
Non-controlling
interestsUS$m
TotalequityUS$m
Opening balance 3,688 4,312 8,661 27,025 43,686 6,137 49,823 Adjustment for transition to new accounting pronouncements(e) — — — (113) (113) (2) (115) Restated opening balance 3,688 4,312 8,661 26,912 43,573 6,135 49,708 Total comprehensive income for the year(a) — — 519 7,832 8,351 (1,033) 7,318 Currency translation arising on Rio Tinto Limited's share capital(b) (29) — — — (29) — (29) Dividends (note 11) — — — (10,334) (10,334) (376) (10,710) Share buy-back(c) (4) — 4 (1,135) (1,135) — (1,135) Companies no longer consolidated — — — — — (32) (32) Own shares purchased from Rio Tinto shareholders to satisfy share
options(d) — — (63) (43) (106) — (106)
Change in equity interest held by Rio Tinto — — — 85 85 (85) — Treasury shares reissued and other movements — 1 — — 1 — 1 Equity issued to holders of non-controlling interests — — — — — 101 101 Employee share options and other IFRS 2 charges to the income
statement — — 56 70 126 — 126
Closing balance 3,655 4,313 9,177 23,387 40,532 4,710 45,242
Year ended 31 December 2018
Attributable to owners of Rio Tinto
Share capital(notes 26
and 27)US$m
Share premiumaccount
US$m
Other reserves
(note 28)US$m
Retained earnings
(note 28) US$m
TotalUS$m
Non-controlling
interestsUS$m
TotalequityUS$m
Opening balance 4,360 4,306 12,284 23,761 44,711 6,404 51,115 Adjustment for transition to new accounting pronouncements(f) — — 10 (179) (169) — (169) Restated opening balance 4,360 4,306 12,294 23,582 44,542 6,404 50,946 Total comprehensive income for the year(a) — — (3,600) 14,263 10,663 123 10,786 Currency translation arising on Rio Tinto Limited's share capital(b) (382) — — — (382) — (382) Dividends (note 11) — — — (5,356) (5,356) (415) (5,771) Share buy-back(c) (290) — 9 (5,423) (5,704) — (5,704) Own shares purchased from Rio Tinto shareholders to satisfy share
options(d) — — (114) (140) (254) — (254)
Change in equity interest held by Rio Tinto — — — 60 60 (60) — Treasury shares reissued and other movements — 6 — — 6 — 6 Equity issued to holders of non-controlling interests — — — — — 85 85 Employee share options and other IFRS 2 charges to the income
statement — — 50 61 111 — 111
Transfers and other movements — — 22 (22) — — — Closing balance 3,688 4,312 8,661 27,025 43,686 6,137 49,823
The notes on pages 206-300 are an integral part of these consolidated financial statements.
(a) Refer to Group statement of comprehensive income for further details. Adjustments to other reserves include currency translation attributable to owners of Rio Tinto, other than that arising on Rio Tinto Limited’s share capital.
(b) Refer to note 1(d). (c) In 2020, the amount of US$1 million together with the amounts paid during the year in respect of an irrevocable contract in place at the beginning of the year to cover the share buy-back programme
totalled US$208 million as reported in the cash flow statement. In 2019, the total amount of US$1,135 million (2018: US$5,704 million) included own shares purchased from the owners of Rio Tinto as per the cash flow statement of US$1,552 million (2018: US$5,386 million) and a financial liability recognised in respect of an irrevocable contract in place as at the reporting date to cover the share buy-back programme, less amounts paid during the year in respect of a similar irrevocable contract in place at the beginning of the year.
(d) Net of contributions received from employees for share awards and share options.(e) Impact of the transition to new accounting pronouncements; IFRS 16 “Leases” and IFRIC 23 "Uncertainty over income tax treatments" on 1 January 2019.(f) impact of the transition to new accounting pronouncements; IFRS 9 “Financial Instruments” and IFRS 15 "Revenue from Contracts with Customers" on 1 January 2018.
Financial Statements
Group Statement of Changes in Equity
204 Annual Report 2020 | riotinto.com204 Annual Report 2020 | riotinto.com
Financial Statements
Group Statement of Changes in Equity

Reconciliation with Australian Accounting Standards The Group’s financial statements have been prepared in accordance with IFRS, as defined in note 1, which differs in certain respects from the version of International Financial Reporting Standards that is applicable in Australia, referred to as Australian Accounting Standards (AAS).
Prior to 1 January 2004, the Group’s financial statements were prepared in accordance with UK GAAP. Under IFRS, as defined in note 1, goodwill on acquisitions prior to 1998, which was eliminated directly against equity in the Group’s UK GAAP financial statements, has not been reinstated. This was permitted under the rules governing the transition to IFRS set out in IFRS 1. The equivalent Australian Standard, AASB 1, does not provide for the netting of goodwill against equity. As a consequence, shareholders’ funds under AAS include the residue of such goodwill, which amounted to US$374 million at 31 December 2020 (2019: US$379 million).
Save for the exception described above, the Group’s financial statements drawn up in accordance with IFRS are consistent with the requirements of AAS.
Outline of dual listed companies structure and basis of financial statements The Rio Tinto Group These are the financial statements of the Group formed through the merger of economic interests of Rio Tinto plc and Rio Tinto Limited (“Merger”), and presented by both Rio Tinto plc and Rio Tinto Limited as their consolidated financial statements in accordance with both UK and Australian legislation and regulations.
Merger terms On 21 December 1995, Rio Tinto plc and Rio Tinto Limited entered into a dual listed companies (DLC) merger. Rio Tinto plc is incorporated in the UK and listed on the London and New York Stock Exchanges and Rio Tinto Limited is incorporated in Australia and listed on the Australian Securities Exchange. The Merger was effected by contractual arrangements between the companies and amendments to Rio Tinto plc’s Memorandum and Articles of Association and Rio Tinto Limited’s Constitution.
As a result, Rio Tinto plc and Rio Tinto Limited and their respective groups operate together as a single economic enterprise, with neither assuming a dominant role. In particular, the arrangements:
– confer upon the shareholders of Rio Tinto plc and Rio Tinto Limited a common economic interest in both groups;
– provide for common boards of directors and a unified management structure;
– provide for equalised dividends and capital distributions; and
– provide for the shareholders of Rio Tinto plc and Rio Tinto Limited to take key decisions, including the election of directors, through an electoral procedure in which the public shareholders of the two companies in effect vote on a joint basis.
The Merger involved no change in the legal ownership of any assets of Rio Tinto plc or Rio Tinto Limited, nor any change in the ownership of any existing shares or securities of Rio Tinto plc or Rio Tinto Limited, nor the issue of any shares, securities or payment by way of consideration, save for the issue by each company of one special voting share to a trustee company which facilitates the joint electoral procedure for public shareholders. During 2002, each of the parent companies issued a DLC Dividend Share to facilitate the efficient management of funds within the DLC structure.
Accounting standards The financial statements have been drawn up in accordance with IFRS as defined in note 1. The Merger was accounted for as a merger under UK GAAP. As permitted under the rules governing the transition to IFRS, which are set out in IFRS 1, the Group did not restate business combinations that occurred before the transition date of 1 January 2004. As a result, the DLC Merger of economic interests described above continues to be accounted for as a merger under IFRS as defined in note 1.
The main consequence of adopting merger rather than acquisition accounting is that the balance sheet of the merged Group includes the assets and liabilities of Rio Tinto plc and Rio Tinto Limited at their carrying values prior to the Merger, subject to adjustments to achieve uniformity of accounting policies, rather than at their fair values at the date of the Merger. For accounting purposes Rio Tinto plc and Rio Tinto Limited are viewed as a single public parent company (with their respective public shareholders being the shareholders in that single company). As a result, the amounts attributable to both Rio Tinto plc and Rio Tinto Limited public shareholders are included in the amounts attributed to owners of Rio Tinto on the balance sheet, income statement and statement of comprehensive income.
Australian Corporations Act The financial statements are drawn up in accordance with an order, under section 340 of the Australian Corporations Act 2001, issued by the Australian Securities and Investments Commission (ASIC) on 24 July 2020. The main effect of the order is that the financial statements are prepared on the basis that Rio Tinto Limited, Rio Tinto plc and their respective controlled entities are treated as a single economic entity, and in accordance with the principles and requirements of International Financial Reporting Standards as adopted by the European Union (EU IFRS) and include a reconciliation from EU IFRS to the Australian equivalent of IFRS (see above).
For further details of the ASIC Class Order relief see page 310.
Annual Report 2020 | riotinto.com 205205Annual Report 2020 | riotinto.com
Financial Statements
Primary Financial Statements

1 Principal accounting policies Corporate information Rio Tinto’s business is finding, mining and processing mineral resources. Major products are aluminium, copper, diamonds, gold, industrial minerals (borates, titanium dioxide and salt), iron ore and uranium. Activities span the world and are strongly represented in Australia and North America, with significant businesses also in Asia, Europe, Africa and South America.
Rio Tinto plc is incorporated in the UK and listed on the London and New York Stock Exchanges and Rio Tinto Limited is incorporated in Australia and listed on the Australian Stock Exchange. Rio Tinto plc’s registered office is at 6 St James’s Square, London SW1Y 4AD, UK. Rio Tinto Limited’s registered office is at Level 7, 360 Collins Street, Melbourne, Victoria 3000, Australia.
As described in the “Outline of dual listed companies structure and basis of financial statements” on page 205, for the purposes of preparing the IFRS compliant consolidated financial statements of the Rio Tinto Group, both the DLC companies, Rio Tinto plc and Rio Tinto Limited, are viewed as a single economic entity, and the interests of shareholders of both companies are presented as the equity interests of shareholders in the Rio Tinto Group.
These financial statements consolidate the accounts of Rio Tinto plc and Rio Tinto Limited (together “the Companies”) and their respective subsidiaries (together “the Group”) and include the Group’s share of joint arrangements and associates as explained in note 1(b) below. The Group’s financial statements for the year ended 31 December 2020 were authorised for issue in accordance with a directors’ resolution on 22 February 2021.
Notes 32 to 35 provide more information on the Group’s subsidiaries, joint arrangements and associates and note 39 provides information on the Group’s transactions with other related parties.
The 2020 Annual Report satisfies the obligations of Rio Tinto Limited to prepare consolidated accounts under Australian company law, as amended by an order issued by the Australian Securities and Investments Commission on 24 July 2020. The 2020 financial statements disclose on page 205 the effect of the adjustments to the Group’s consolidated profit/(loss), consolidated total comprehensive income/(loss) and consolidated shareholders’ funds as prepared under IFRS as defined below that would be required under the version of IFRS that is applicable in Australia, referred to as Australian Accounting Standards (AAS).
The US dollar is the presentation currency used in these financial statements, as it most reliably reflects the Group’s global business performance.
Basis of preparation of the financial statementsThe basis of preparation and the accounting policies used in preparing the Group’s 2020 financial statements are set out below.
The financial statements have been prepared on a going concern basis in accordance with international accounting standards in conformity with the requirements of the Companies Act 2006 applicable to companies reporting under IFRS and in accordance with applicable UK law, applicable Australian law as amended by the Australian Securities and Investments Commission Order dated 24 July 2020, Article 4 of the European Union IAS regulation and also with:– International Financial Reporting Standards as issued by the
International Accounting Standards Board (IASB) and interpretations issued from time to time by the IFRS Interpretations Committee (IFRS IC) both as adopted pursuant to Regulation (EC) No 1606/2002 as it applies in the European Union (IFRSs as adopted by the EU), and which are mandatory for EU reporting as at 31 December 2020; (EU IFRS) and
– International Financial Reporting Standards as issued by the IASB and interpretations issued from time to time by the IFRS IC which are mandatory as at 31 December 2020.
The above accounting standards and interpretations are collectively referred to as “IFRS” in this report. The Group has not early adopted any amendments, standards or interpretations that have been issued but are not yet mandatory.
The UK's transition period for leaving the EU ended on 31 December 2020. In accordance with consequent changes to applicable UK law, the Group will include the following in the basis of preparation for its 2021 financial statements:
– International Financial Reporting standards as issued by the IASB and interpretations issued from time to time as adopted by the United Kingdom (UK).
COVID-19 impactDespite various COVID-19 related challenges, the Group's assets have continued to operate, with our first priority being the protection of the health and safety of all our employees and communities. During the COVID-19 pandemic, the Group has implemented strict protocols globally across the business. These range from physical distancing, travel restrictions, roster changes and team splits, to flexible working arrangements, rapid screening and personal hygiene controls. The Group has delivered a good operational performance across most of our assets, catching up on planned maintenance activity in the second half of the year, particularly in iron ore, and continuing to adapt to new operating conditions as we learn to live with COVID-19. Recognising the broad and complex impacts of the pandemic on our markets, operations and financial performance, we have chosen not to segregate COVID-19 related costs from our underlying performance metrics.
Going concernManagement has prepared cash flow forecast scenarios that represent plausible downside scenarios to the business and global economy including the effects arising from the COVID-19 pandemic for a period of at least 12 months from the date of approval of the financial statements, which have been reviewed by the directors. These forecasts demonstrate that the Group has sufficient cash, other liquid resources and undrawn credit facilities to enable it to meet its obligations as they fall due. As such the directors considered it appropriate to adopt the going concern basis of accounting in preparing the full year financial information.Further detail on the going concern basis of accounting is included on page 190.
Climate change The Group continues to develop its assessment of the potential impacts of climate change, the transition to a low-carbon future and our ambition to achieve net zero emissions across our operations by 2050.
We framed the strategic context for the Group and our internal price setting process, including carbon price assumptions, through the lens of three plausible scenarios structured around the interplay of three global forces: Realpolitik, Society and Technology.
– In Realpolitik, a fragmented world order, defined by strong nationalistic tendencies including structural tensions between the United States and China, holds back trade and global action on climate. Despite a low growth environment, global warming is on a path to reach or even exceed 3°C by 2100. Carbon prices remain low – in the range US$0-30/tCO2e.
– In Society, strong global co-ordination of climate policies, supported by high and rising carbon prices (reaching US$130/tCO2e in developed countries by 2040), accelerates the energy transition. Despite stronger economic growth in low-income countries, global emissions peak and start to decline early, turning net-negative during the second half of the century, to meet the Paris goal of keeping temperature increases below 2°C.
Financial statements
206 Annual Report 2020 | riotinto.com206 Annual Report 2020 | riotinto.com
Financial Statements
Notes to the 2020 Financial Statements

– In Technology, the fast roll-out of innovation provides both a strong boost to global economic productivity and decarbonisation efforts. But, without adequate policy support and with carbon prices remaining modest (US$15 to US$30/tCO2e by 2030) the decline in global emissions is insufficient to keep temperature increases below 2°C by 2100.
Through our strategy process we test the resilience of our portfolio against each of these three scenarios. Overall, our portfolio is expected to perform more strongly in scenarios with proactive climate action, however we have not yet assessed the complete financial reporting consequences of a single Paris aligned scenario (more details on our portfolio scenario analysis can be found in our 2020 Climate Change report).
The scenarios also inform the internal price setting process led by our Economics team. Those prices (including carbon) are used pervasively in our financial processes from budgeting, forecasting, capital allocation and project evaluation to the determination of Ore Reserves. In turn these prices are used to derive critical accounting estimates including as inputs to impairment testing (note 6), estimation of remaining economic life for units of production depreciation (note 1(i)) and discounting closure and rehabilitation provisions (note 25).
As only one of the scenarios is aligned with the goals of the Paris Agreement, our internal carbon prices are not consistent with the expectation of climate policies required to accelerate the global transition to meet those goals.
New standards issuedThe Group’s financial statements have been prepared on the basis of accounting policies consistent with those applied in the financial statements for the year ended 31 December 2019, except for the accounting requirements set out below, all of which were effective as at 1 January 2020 without restatement of prior years.
The Group's accounting policies and critical accounting judgments have been updated to include the Group's approach to materiality upon implementation of "Definition of Material, Amendments to IAS 1 and IAS 8" (refer to "Materiality" below). The amendments do not affect the Group's approach to identifying and evaluating material transactions, or result in any change to policies and procedures for reviewing whether a disclosure or presentation is material.
The IASB revised its Conceptual Framework which is mandatory in 2020. It is not a standard and does not override any standard, but its principles apply to arrangements not covered by IFRS standards. No arrangements have been identified which require a change in accounting treatment under the revised Conceptual Framework.
The Group has adopted the definition of a business as required by "Definition of a business - amendments to IFRS 3" (refer to note 1b), Basis of consolidation, Acquisitions). Changes might result in future investment in new operations being accounted for as asset acquisitions rather than as business combinations, however no evaluation of a transaction under the amended IFRS 3 has been required in 2020.
Standards issued, but not yet effectiveInterest Rate Benchmark Reform – Phase 2 (Amendments to IFRS 9, IAS 39, IFRS 7, IFRS 4 and IFRS 16, endorsed by the UK and mandatory in 2021) The amendments address the financial reporting impact from reform of the London Interbank Offered Rate (LIBOR) and other benchmark interest rates (collectively “IBOR reform”). Financial authorities have asked market participants to complete the transition to alternative Risk Free Rates (RFR) by the end of 2021. As part of the Group’s transition plan, a multidisciplinary working group continues to assess the impact of IBOR reform on systems, processes and financial reporting.
The Group will take relevant Phase 2 practical reliefs from certain requirements in IFRS 9, IFRS 7, IFRS 4 and IFRS 16 relating to changes in the basis for determining contractual cash flows of financial assets, financial liabilities and hedge accounting.
Based on the Group’s assessment we expect that the most significant practical impact from IBOR reform will be on our hedging arrangements and that this will arise from reform of US LIBOR. At 31 December 2020, the Group has interest rate risk exposure including US$7.3 billion nominal values of fixed-rate borrowings swapped to US dollar rates in fair value hedge relationships, described further in note 29 A (b) (v). It is anticipated that the Secured Overnight Financing Rate (SOFR) benchmark rate, recommended by the Alternative Reference Rates Committee, will be widely adopted by market participants and in practice will replace US LIBOR by the end of 2021. We expect application of the Phase 2 reliefs to result in continuation of the Group’s pre-existing hedge accounting upon amendment of designated arrangements in response to the replacement of IBOR with new benchmarks. The Group early adopted, in the financial statements for the year ended 31 December 2019, “Phase 1 - Amendments to IFRS 9, IAS 39, and IFRS 7- Interest rate benchmark reform”, which allowed temporary relief from applying specific hedge accounting requirements to hedging arrangements directly impacted by IBOR reform (refer to note 1 q (iv)). This temporary relief is expected to cease, on a hedge-by-hedge basis, when the designated hedge relationship is amended and application of Phase 2 reliefs begins.
In addition, the Group has a number of arrangements which reference IBOR benchmarks and extend beyond 2021. These include third-party borrowings relating to the Oyu Tolgoi LLC project finance facility and other secured loans (refer to note 21), a number of intragroup balances and certain commercial contracts. Other arrangements which currently reference IBOR benchmarks include accessible revolving lines of credit (refer to note 29 A (b)), and shareholder loan facilities. Phase 2 amendments will require the Group to account for a change in the basis for determining the cash flows of a financial asset or a financial liability measured at amortised cost, by updating their respective effective interest rates as required by IBOR reform. As a result of the relief the Group expects that no significant gain or loss will arise from these updates.
Property, Plant and Equipment: Proceeds before Intended Use (Amendments to IAS 16, mandatory in 2022 and not yet endorsed by the UK)Under the amendments the proceeds from selling items before the related item of property, plant and equipment is available for use should be recognised in profit or loss, together with the costs of producing those items. The impact from adoption is not currently expected to be material for the Group.
Onerous Contracts – Cost of Fulfilling a Contract (Amendments to IAS 37, mandatory in 2022 and not yet endorsed by the UK)The amendments specify which costs an entity includes in determining the cost of fulfilling a contract for the purpose of assessing whether the contract is onerous. The Group is currently evaluating the impacts of this amendment.
IFRS 17 Insurance Contracts and amendments to IFRS 17 Insurance Contracts (mandatory in 2023 and not yet endorsed by the UK)The standard provides consistent principles for all aspects of accounting for insurance contracts. The Group is currently evaluating the impact of this pronouncement.
Amendments to IAS 1 "Presentation of financial statements" on classification of liabilities (mandatory in 2023 and not yet endorsed by the UK)Narrow-scope amendments to IAS 1 clarify that liabilities are classified as either current or non-current, depending on the rights that exist at the end of the reporting period. Classification is unaffected by the expectations of the entity or events after the reporting date. The Group is currently evaluating the impacts of this amendment.
Annual Report 2020 | riotinto.com 207207Annual Report 2020 | riotinto.com
Financial Statements
Notes to the 2020 Financial Statements

1 Principal accounting policies continuedOther standards The following new and amended standards are not expected to have a significant impact on the Group’s consolidated financial statements: COVID-19-Related Rent Concessions (Amendment to IFRS 16, effective in 2021), Reference to Conceptual Framework (Amendments to IFRS 3, effective in 2022) and Annual Improvements to IFRS Standards, (effective 2023).
Judgments in applying accounting policies and key sources of estimation uncertainty The preparation of the financial statements requires management to use judgment in applying accounting policies and in making critical accounting estimates.
These judgments and estimates are based on management’s best knowledge of the relevant facts and circumstances, having regard to previous experience, but actual results may differ materially from the amounts included in the financial statements. Areas of judgment in the application of accounting policies that have the most significant effect on the amounts recognised in the financial statements and key sources of estimation uncertainty that have a significant risk of causing a material adjustment to the carrying amounts of assets and liabilities within the next financial year are noted below and further information is contained in the accounting policies and/or the notes to the financial statements.
These areas of judgment and estimation are discussed further in critical accounting policies and estimates on pages 219-222. The quantum of ore reserves and mineral resources impacts many of these areas and the basis of calculation is explained below. Information on less material judgments and sources of estimation uncertainty has been incorporated into the relevant accounting policy notes.
Areas of judgment in the application of accounting policies that have the most significant effect on the amounts recognised in the financial statements in the current year are:
– Impairment of non-current assets – determination of cash-generating units (CGUs) and assessment of indicators of impairment – note 1(e) and (i), critical policy (i), note 6, note 12 and note 13.
– Estimation of asset lives – determination of the life of the orebody and mine reserves, including grade cut-off assumptions consistent with the internal prices described in the Climate Change section – note 1(i) and critical policy (ii).
– Close-down, restoration and environmental obligations – determining when a closure study plan and cost estimate is sufficiently advanced and reliable to form the basis for an update – note 1(l) and critical policy (iii).
– Deferral of stripping costs – judgment on components/strip ratios and separate or integrated multiple pit mines – note 1(h) and critical policy (iv).
– Uncertain tax positions – technical interpretation of tax law and evaluation of outcomes in the determination of whether multiple or binary scenarios are the appropriate basis for provision measurement – note 1(n), critical policy (v), note 9 and note 30.
– Recoverability of potential deferred tax assets – recognition of deferred tax assets for loss making operations – critical policy (vi) and note 17.
Other areas of judgment impacting the financial statements are:
– Provision for onerous contracts – determination of assets dedicated to a contract – note 1(i) and critical policy (vii).
– Identification of functional currencies – different companies may make different judgments based on similar facts – note 1(d) and critical policy (viii).
– Basis of consolidation – judgment as to when the Group has control, joint control or significant influence – critical policy (ix) and notes 32-35.
– Contingencies – assessing the probability of any loss and whether it is possible to quantify any loss – critical policy (x) and note 30.
– Exclusions from underlying earnings – judgment on items to be excluded on grounds of nature or size – critical policy (xi) and note 2.
– Accounting for the Pilbara Iron Arrangements – treatment of payments made over a contractually specified period for network infrastructure capacity – critical policy (xiii) and note 33(c).
Key sources of estimation uncertainty that have a significant risk of causing a material adjustment to the carrying amounts of assets and liabilities within the next financial year are:
– Impairment of non-current assets – review of asset carrying values, impairment charges and reversals and the recoverability of goodwill – determination of discounted cash flows – note1(e) and (i), critical estimates (i), note 6, note 12 and note 13.
– Close-down, restoration and environmental cost obligations – estimation of costs and the timing of expenditure – note 1(l), critical estimates (iii) and note 25.
– Uncertain tax positions – estimating the potential exposures for each possible scenario – note 1(n), critical estimates (v), note 9 and note 30.
– Recoverability of potential deferred tax assets – determination of cash flows – note 1(n), critical estimates (vi) and note 17.
– Estimation of obligations for post-employment costs – note 1(o), critical estimates (xiv) and note 42.
MaterialityThe Group considers information to be material if correcting a misstatement, omission or obscuring could, in the light of surrounding circumstances, reasonably be expected to change the judgment of a reasonable person relying on the financial statements. The Group considers both quantitative and qualitative factors in determining whether information is material; the concept of materiality is therefore not driven purely by numerical values.
When considering the potential materiality of information, management makes an initial quantitative assessment using thresholds based on estimates of profit before taxation; for the year ended 31 December 2020 the quantitative threshold was US$550 million (year ended 31 December 2019: US$350 million based on underlying earnings). However, other considerations can result in a determination that lower values are material or, occasionally, that higher values are immaterial. These considerations include whether a misstatement, omission or obscuring: masks a change or trend in key performance indicators; causes reported key metrics to change from a positive to negative values or vice-versa; affects compliance with regulatory requirements or other contractual requirements; could result in an increase to management’s compensation; or might conceal an unlawful transaction.
In assessing materiality, management also applies judgment based on its understanding of the business and its internal and external financial statement users. The assessment will consider user expectations of numerical and narrative reporting. Sources used in making this assessment would include, for example: published analyst consensus measures, experience gained in formal and informal dialogue with users (including regulatory correspondence), and peer group benchmarking.
Ore reserves and mineral resources Estimates of ore reserves and, in some cases, mineral resources can impact: depreciation and amortisation rates; the carrying values of intangible assets and property, plant and equipment; deferred stripping costs; provisions for close-down and restoration costs; and the recovery of deferred tax assets.
The Group estimates its ore reserves and mineral resources based on information compiled by Competent Persons as defined in accordance with the Joint Ore Reserves Committee (JORC) code (see note 1(j)).
208 Annual Report 2020 | riotinto.com208 Annual Report 2020 | riotinto.com
Financial Statements
Notes to the 2020 Financial Statements

The estimation of ore reserves and mineral resources requires judgment to interpret available geological data and subsequently to select an appropriate mining method and then to establish an extraction schedule. Estimation requires assumptions about future commodity prices and demand, exchange rates, production costs, transport costs, close-down and restoration costs, recovery rates and discount rates and, in some instances, the renewal of mining licences.
There are many uncertainties in the estimation process and assumptions that are valid at the time of estimation may change significantly when new information becomes available. New geological or economic data, or unforeseen operational issues, may change estimates of ore reserves and mineral resources.
The Group uses judgment as to when to include mineral resources in accounting estimates, for example, the use of mineral resources in the Group’s depreciation policy is described in note 1(i) below and in the determination of the date of closure as described in note 1(l). The unaudited statement of ore reserves is included on page 325 and of mineral resources on page 329.
(a) Accounting convention The financial information included in the financial statements for the year ended 31 December 2020, and for the related comparative periods, has been prepared under the historical cost convention, as modified by the revaluation of certain derivative contracts and financial assets, the impact of fair value hedge accounting on the hedged item and the accounting for post-employment assets and obligations. The Group’s policy in respect of these items is set out in the notes below.
All financial statement values are rounded to the nearest million (US$m) unless otherwise stated.
Where applicable, comparatives have been adjusted to measure or present them on the same basis as current period figures.
(b) Basis of consolidation (notes 32-35) All intragroup transactions and balances have been eliminated on consolidation.
Where necessary, adjustments are made to the locally reported assets, liabilities, and results of subsidiaries, joint arrangements and associates to bring their accounting policies in line with those used by the Group.
Subsidiaries Subsidiaries are entities controlled by either of the companies. Control exists where either of the companies has: power over the entities, that is, existing rights that give it the current ability to direct the relevant activities of the entities (those that significantly affect the companies’ returns); exposure, or rights, to variable returns from its involvement with the entities; and the ability to use its power to affect those returns. Subsidiaries are fully consolidated from the date on which the Group obtains control. They are de-consolidated from the date that control ceases.
Joint arrangements A joint arrangement is an arrangement in which two or more parties have joint control. Joint control is the contractually agreed sharing of control such that decisions about the relevant activities of the arrangement (those that significantly affect the companies’ returns) require the unanimous consent of the parties sharing control. The Group has two types of joint arrangements:
Joint operations (JO)A JO is a joint arrangement in which the parties that share joint control have rights to the assets, and obligations for the liabilities, relating to the arrangement. This includes situations where the parties benefit from the joint activity through a share of the output, rather than by receiving a share of the results of trading. In relation to its interest in a JO, the Group recognises: its share of assets and liabilities; revenue from the sale of its share of the output and its share of any revenue generated from the sale of the output by the JO; and its share of expenses. All such amounts are measured in accordance with the terms of the arrangement, which is usually in proportion to the Group’s interest in the JO. These amounts are recorded in the Group’s financial statements on the appropriate lines.
Joint ventures (JV)A JV is a joint arrangement in which the parties that share joint control have rights to the net assets of the arrangement. JVs are accounted for using the equity accounting method.
Other unincorporated arrangementsIn some cases, the Group participates in unincorporated arrangements and has rights to its share of the assets and obligations for its share of the liabilities of the arrangement rather than a right to a net return, but does not share joint control. In such cases, the Group recognises: its share of assets and liabilities; revenue from the sale of its share of the output and its share of any revenue generated from the sale of the output by the unincorporated arrangement; and its share of expenses. All such amounts are measured in accordance with the terms of the arrangement, which is usually in proportion to the Group’s interest in the arrangement. These amounts are recorded in the Group’s financial statements on the appropriate lines.
AssociatesAn associate is an entity that is neither a subsidiary nor a joint arrangement, over which the Group has significant influence. Significant influence is presumed to exist where there is neither control nor joint control and the Group has over 20% of the voting rights, unless it can be clearly demonstrated that this is not the case. Significant influence can arise where the Group holds less than 20% of the voting rights if it has the power to participate in the financial and operating policy decisions affecting the entity. Investments in associates are accounted for using the equity accounting method.
The Group uses the term “equity accounted units” (EAUs) to refer to associates and JVs collectively. Under the equity accounting method the investment is recorded initially at cost to the Group, including any goodwill on acquisition. In subsequent periods the carrying amount of the investment is adjusted to reflect the Group’s share of the EAUs’ retained post-acquisition profit or loss and other comprehensive income. Long-term loans to EAUs that in substance form part of the Group’s net investment (quasi equity loans) are financial assets but are included in the line “Investments in equity accounted units” on the face of the balance sheet. When the Group’s share of losses in an EAU equals or exceeds its interest in the EAU, including such long-term loans and any other unsecured receivables, the Group does not recognise further losses, unless it has incurred legal or constructive obligations to continue to make payments on behalf of the EAU.
Acquisitions (note 36)Under the “acquisition” method of accounting for business combinations, the purchase consideration is allocated to the identifiable assets acquired and liabilities and contingent liabilities assumed (the identifiable net assets) on the basis of their fair value at the date of acquisition, which is the date on which control is obtained.
In determining whether a particular set of activities is a business, an acquired arrangement has to have an input and substantive process which together significantly contribute to the ability to create outputs.
Annual Report 2020 | riotinto.com 209209Annual Report 2020 | riotinto.com
Financial Statements
Notes to the 2020 Financial Statements

1 Principal accounting policies continuedThe consideration transferred for the acquisition of a subsidiary comprises the fair values of the assets transferred, the liabilities incurred to the former owners of the acquiree, the fair value of any asset or liability resulting from a contingent consideration arrangement and any equity interests issued by the Group. Costs related to the acquisition of a subsidiary are expensed as incurred.
The excess of the consideration transferred, the amount of any non- controlling interest in the acquiree and the acquisition-date fair value of any previous equity interest in the acquiree over the fair value of the identifiable net assets acquired is recorded as goodwill. Any shortfall is immediately recognised in the income statement.
Non-controlling interests in the acquiree, that are present ownership interests and entitle their holders to a proportionate share of the entity’s net assets in the event of liquidation, are recognised by the Group in one of two ways with the choice being available on an acquisition-by-acquisition basis. They can be measured at either the non-controlling interest’s proportionate share of the acquiree’s identifiable net assets or at fair value. In some cases, non-controlling interests may be treated as equity options and valued on that basis. Goodwill (see note 1(e)) and amounts attributable to non-controlling interests will differ depending on the basis used.
Where the Group previously held a non-controlling interest in the acquiree, this is remeasured to fair value at the date control is obtained with any gain or loss recognised in the income statement. The cash cost of the share purchase that gives rise to control is included within “investing activities” in the cash flow statement.
Where the Group increases its ownership interest in a subsidiary, the difference between the purchase price and the carrying value of the share of net assets acquired is recorded in equity. The cash cost of such purchases is included within “financing activities” in the cash flow statement.
Provisional fair values allocated at a reporting date are finalised within 12 months of the acquisition date.
The results of businesses acquired during the year are included in the consolidated financial statements from the date on which control, joint control or significant influence is obtained.
Disposals (note 36) Individual non-current assets or “disposal groups” (that is, groups of assets and liabilities) to be disposed of by sale or otherwise in a single transaction are classified as “held for sale” if the following criteria are met at the period end:
– The carrying amount will be recovered principally through a sale transaction rather than through continuing use; and
– The disposal group is available for immediate sale in its present condition subject only to terms that are usual and customary for such sales; and
– The sale is highly probable.
Disposal groups held for sale are carried at the lower of their carrying amount and fair value less costs to sell. The comparative balance sheet is not restated. Disposal groups acquired with a view to resale are held at the fair value determined at the acquisition date. For these assets acquired for resale no profits or losses are recognised between the acquisition date and the disposal date, unless there is a subsequent impairment.
On classification as held for sale, the assets are no longer depreciated and, if applicable, equity accounting ceases.
If control is lost, any interest in the entity retained by the Group is remeasured to its fair value and the change in carrying amount is recognised in the income statement. The retained interest may be subsequently accounted for as a joint venture, joint operation, associate or financial asset depending on the facts. Certain amounts previously recognised in other comprehensive income in respect of the entity disposed of, or for which control, joint control or significant influence has ceased, may be recycled to the income statement. The cash proceeds of disposals are included within “Investing activities” in the cash flow statement.
Changes in the Group’s interest in a subsidiary that do not result in a loss of control are accounted for in equity. The cash proceeds of such disposals are included within “Financing activities” in the cash flow statement.
(c) Sales revenue Recognition and measurement The Group recognises sales revenue related to the transfer of promised goods or services when control of the goods or services passes to the customer. The amount of revenue recognised reflects the consideration to which the Group is or expects to be entitled in exchange for those goods or services.
Sales revenue is recognised on individual sales when control transfers to the customer. In most instances, control passes and sales revenue is recognised when the product is delivered to the vessel or vehicle on which it will be transported once loaded, the destination port or the customer’s premises. There may be circumstances when judgment is required based on the five indicators of control below.
– The customer has the significant risks and rewards of ownership and has the ability to direct the use of, and obtain substantially all of the remaining benefits from, the good or service.
– The customer has a present obligation to pay in accordance with the terms of the sales contract. For shipments under the Incoterms Cost, Insurance and Freight (CIF)/Carriage Paid to (CPT)/Cost and Freight (CFR) this is generally when the ship is loaded, at which time the obligation for payment is for both product and freight.
– The customer has accepted the asset. Sales revenue may be subject to adjustment if the product specification does not conform to the terms specified in the sales contract but this does not impact the passing of control. Assay and specification adjustments have been immaterial historically.
– The customer has legal title to the asset. The Group usually retains legal title until payment is received for credit risk purposes only.
– The customer has physical possession of the asset. This indicator may be less important as the customer may obtain control of an asset prior to obtaining physical possession, which may be the case for goods in transit.
The Group sells a significant proportion of its products on CFR or CIF Incoterms. This means that the Group is responsible (acts as principal) for providing shipping services and, in some instances, insurance after the date at which control of goods passes to the customer at the loading port.
The Group therefore has separate performance obligations for freight and insurance services that are provided solely to facilitate sale of the commodities it produces. Other Incoterms commonly used by the Group are Free on Board (FOB), where the Group has no responsibility for freight or insurance once control of the goods has passed at the loading port, and Delivered at Place (DAP), where control of the goods passes when the product is delivered to the agreed destination. For these Incoterms there is only one performance obligation, being for provision of product at the point where control passes.
210 Annual Report 2020 | riotinto.com210 Annual Report 2020 | riotinto.com
Financial Statements
Notes to the 2020 Financial Statements

The Group’s products are sold to customers under contracts which vary in tenure and pricing mechanisms, including some volumes sold in the spot market. Pricing for iron ore is on a range of terms, the majority being either monthly or quarterly average pricing mechanisms, with a smaller proportion of iron ore volumes being sold on the spot market.
Within each sales contract, each unit of product shipped is a separate performance obligation. Revenue is generally recognised at the contracted price as this reflects the stand-alone selling price. Sales revenue excludes any applicable sales taxes. Mining royalties payable are presented as an operating cost or, where they are in substance a profit-based tax, within taxation.
Sales of copper concentrate are stated net of the treatment and refining charges which will be required to convert it to an end product.
Certain of the Group’s products may be provisionally priced at the date revenue is recognised; however, substantially all iron ore and aluminium sales are reflected at final prices in the results for the period. The final selling price for all provisionally priced products is based on the price for the quotational period stipulated in the contract. Final prices for copper concentrate are normally determined between 30-120 days after delivery to the customer. The change in value of the provisionally priced receivable is based on relevant forward market prices and is included in sales revenue.
Rio Tinto has a number of long-term contracts to supply product to customers in future periods. Generally, revenues are recognised on an as invoiced basis; hence, the right to consideration from a customer corresponds directly with the entity’s performance completed to date.
A number of the Group’s businesses provide volume discounts in certain circumstances. The impact of constraining such variable consideration under IFRS 15 was immaterial at both 31 December 2020 and 31 December 2019.
The Group applies the practical expedient in paragraph 121 of IFRS 15 and does not disclose information on the transaction price allocated to performance obligations that are unsatisfied.
Presentation and disclosures Consolidated sales revenue as reported in the income statement comprises sales to third parties. Certain of the Group’s products may be provisionally priced at the date revenue is recognised. Sales revenue includes revenue from contracts with customers, which is accounted for under IFRS 15 “Revenue from Contracts with Customers” and subsequent movements in provisionally priced receivables which are accounted for under IFRS 9 “Financial Instruments”. A breakdown of sales revenue between these two amounts is disclosed in the product analysis in note 3 and further detail on provisional pricing in note 3. Sales revenue includes revenue from movements in provisionally priced receivables, consistent with the treatment in prior periods.
The Group considers that the impact of economic factors on its sales revenue, particularly pricing and volumes, is best understood by reference to the disclosure of sales revenue by product group and sales destination in note 3. The analysis of provisional pricing adjustments by commodity in the product analysis in note 3 shows which products are subject to price volatility post the transfer of control. With the exception of Oyu Tolgoi, which sells copper concentrate to China, this price uncertainty is largely resolved at the period end.
Typically, the Group has a right to payment before or at the point that control of the goods passes including a right, where applicable, to payment for provisionally priced products and unperformed freight and insurance services. Cash received before control passes is recognised as a contract liability. The amount of consideration does not contain a significant financing component as payment terms are less than one year.
Revenues from the sale of significant by-products, such as gold, are included in sales revenue. Sundry revenue (eg sales of surplus power) incidental to the main revenue-generating activities of the operations is treated as a credit to operating costs.
The Group does not disclose sales revenue from freight and insurance services separately as it does not consider that this is necessary in order to understand the impact of economic factors on the Group; the Group’s Chief Executive, the chief operating decision maker, as defined under IFRS 8, “Operating Segments”, does not review information specifically relating to these sources of revenue in order to evaluate the performance of business segments and Group information on these sources of revenue is not provided externally.
The Group does provide information on freight revenue for the iron ore and bauxite businesses on pages 45 and 49 to help stakeholders understand FOB operating margins for those products.
Third-party commodity swap arrangements principally for delivery and receipt of smelter-grade alumina are offset within operating costs.
(d) Currency translation The functional currency for each entity in the Group, and for joint arrangements and associates, is the currency of the primary economic environment in which that entity operates. For many of these entities, this is the currency of the country in which they are located. Transactions denominated in other currencies are converted to the functional currency at the exchange rate ruling at the date of the transaction. Monetary assets and liabilities denominated in foreign currencies are retranslated at period-end exchange rates.
The Group’s financial statements are presented in US dollars, as that presentation currency most reliably reflects the global business performance of the Group as a whole. On consolidation, income statement items for each entity are translated from the functional currency into US dollars at average rates of exchange, except for material one-off transactions, which are translated at the rate prevailing on the transaction date. Balance sheet items are translated into US dollars at period-end exchange rates.
Exchange differences arising on the translation of the net assets of entities with functional currencies other than the US dollar are recognised directly in the currency translation reserve. These translation differences are shown in the statement of comprehensive income, with the exception of translation adjustments relating to Rio Tinto Limited’s share capital which are shown in the statement of changes in equity.
Where an intragroup balance is, in substance, part of the Group’s net investment in an entity, exchange gains and losses on that balance are taken to the currency translation reserve.
Except as noted above, or in note 1(q) relating to derivative contracts, all other exchange differences are charged or credited to the income statement in the year in which they arise.
(e) Goodwill and intangible assets (excluding exploration and evaluation expenditure) (notes 12 and 13) Goodwill is not amortised; it is tested annually for impairment or more frequently if events or changes in circumstances indicate a potential impairment. Investments in EAUs, including any goodwill, are tested for impairment as a single asset when a trigger for impairment has been identified. The Group’s impairment policy is explained in note 1(i).
Annual Report 2020 | riotinto.com 211211Annual Report 2020 | riotinto.com
Financial Statements
Notes to the 2020 Financial Statements

1 Principal accounting policies continuedPurchased intangible assets are initially recorded at cost. Finite-life intangible assets are amortised over their useful economic lives on a straight line or units of production basis, as appropriate. Intangible assets that are deemed to have indefinite lives and intangible assets that are not yet ready for use are not amortised; they are reviewed annually for impairment or more frequently if events or changes in circumstances indicate a potential impairment in accordance with accounting policy note 1(i).
The Group considers that intangible assets have indefinite lives when, based on an analysis of all of the relevant factors, there is no foreseeable limit to the period over which the asset is expected to generate cash flows for the Group. The factors considered in making this judgment include the existence of contractual rights for unlimited terms or evidence that renewal of the contractual rights without significant incremental cost can be expected for indefinite future periods in view of the Group’s investment intentions. The life cycles of the products and processes that depend on the asset are also considered.
(f) Exploration and evaluation (note 13) Exploration and evaluation expenditure comprises costs that are directly attributable to:
– Researching and analysing existing exploration data;
– Conducting geological studies, exploratory drilling and sampling;
– Examining and testing extraction and treatment methods; and/or
– Compiling various studies (order of magnitude, pre-feasibility and feasibility).
Exploration expenditure relates to the initial search for deposits with economic potential. Expenditure on exploration activity undertaken by the Group is not capitalised.
Evaluation expenditure relates to a detailed assessment of deposits or other projects (including smelter and refinery projects) that have been identified as having economic potential. Capitalisation of evaluation expenditure commences when there is a high degree of confidence that the Group will determine that a project is commercially viable, that is the project will provide a satisfactory return relative to its perceived risks, and therefore it is considered probable that future economic benefits will flow to the Group. The Group’s view is that a high degree of confidence is greater than “more likely than not” (that is, greater than 50% certainty) and less than “virtually certain” (that is, less than 90% certainty).
Assessing whether there is a high degree of confidence that the Group will ultimately determine that an evaluation project is commercially viable requires judgment and consideration of all relevant factors such as the nature and objective of the project; the project’s current stage; project timeline; current estimates of the project’s net present value, including sensitivity analyses for the key assumptions; and the main risks of the project. Development expenditure incurred prior to the decision to proceed is subject to the same criteria for capitalisation, being a high degree of confidence that the Group will ultimately determine that a project is commercially viable.
In some cases, undeveloped projects are regarded as successors to orebodies, smelters or refineries currently in production. Where this is the case, it is intended that these will be developed and go into production when the current source of ore is exhausted or when existing smelters or refineries are closed.
Ore reserves may be declared for an undeveloped mining project before its commercial viability has been fully determined. Evaluation costs may continue to be capitalised during the period between declaration of ore reserves and approval to mine as further work is undertaken in order to refine the development case to maximise the project’s returns.
In accordance with IFRS 6 “Exploration for and Evaluation of Mineral Resources”, the criteria for the capitalisation of evaluation costs are applied consistently from period to period.
In the case of undeveloped mining projects which have arisen through acquisition, the allocation of the purchase price consideration may result in undeveloped properties being recognised at an earlier stage of project evaluation compared with projects arising from the Group’s exploration and evaluation programme. Subsequent expenditure on acquired undeveloped projects is only capitalised if it meets the high degree of confidence threshold discussed above.
The carrying values of capitalised evaluation expenditure for undeveloped mining projects (projects for which the decision to mine has not yet been approved at the appropriate authorisation level within the Group) are reviewed at each reporting date for indicators of impairment in accordance with IFRS 6, and when indicators are identified are tested in accordance with IAS 36. Evaluation expenditure for non-mining projects is reviewed and tested under IAS 36.
The impairment review is based on a status report summarising the Group’s intentions to recover value through development, sale or other partnering arrangements. If a project does not prove viable and is cancelled, all irrecoverable costs associated with the project net of any previously recorded impairment provisions are charged to the income statement.
(g) Property, plant and equipment (note 14) Once an undeveloped mining project has been determined as commercially viable and approval to mine has been given, expenditure other than that on land, buildings, plant, equipment and capital work in progress is capitalised under “Mining properties and leases” together with any amount transferred from “Exploration and evaluation”.
Costs which are necessarily incurred whilst commissioning new assets, in the period before they are capable of operating in the manner intended by management, are capitalised. Development costs incurred after the commencement of production are capitalised to the extent they are expected to give rise to a future economic benefit. Interest on borrowings related to construction or development projects is capitalised, at the rate payable on project-specific debt if applicable or at the Group or subsidiary’s cost of borrowing if not, until the point when substantially all the activities that are necessary to make the asset ready for its intended use are complete. It may be appropriate to use a subsidiary’s cost of borrowing when the debt was negotiated based on the financing requirements of that subsidiary.
Property, plant and equipment is stated at cost, as defined in IAS 16, less accumulated depreciation and accumulated impairment losses. The cost of property, plant and equipment includes, where applicable, the estimated close-down and restoration costs associated with the asset.
Property, plant and equipment includes right of use assets (note 14) arising from leasing arrangements, shown separately from owned and leasehold assets.
(h) Deferred stripping (note 14) In open pit mining operations, overburden and other waste materials must be removed to access ore from which minerals can be extracted economically. The process of removing overburden and waste materials is referred to as stripping. During the development of a mine (or, in some instances, pit; see below), before production commences, stripping costs related to a component of an orebody are capitalised as part of the cost of construction of the mine (or pit) and are subsequently amortised over the life of the mine (or pit) on a units of production basis.
212 Annual Report 2020 | riotinto.com212 Annual Report 2020 | riotinto.com
Financial Statements
Notes to the 2020 Financial Statements

Where a mine operates several open pits that are regarded as separate operations for the purpose of mine planning, initial stripping costs are accounted for separately by reference to the ore from each separate pit. If, however, the pits are highly integrated for the purpose of mine planning, the second and subsequent pits are regarded as extensions of the first pit in accounting for stripping costs. In such cases, the initial stripping (ie overburden and other waste removal) of the second and subsequent pits is considered to be production phase stripping (see below).
The Group’s judgment as to whether multiple pit mines are considered separate or integrated operations depends on each mine’s specific circumstances.
The following factors would point towards the initial stripping costs for the individual pits being accounted for separately:
– If mining of the second and subsequent pits is conducted consecutively following that of the first pit, rather than concurrently;
– If separate investment decisions are made to develop each pit, rather than a single investment decision being made at the outset;
– If the pits are operated as separate units in terms of mine planning and the sequencing of overburden removal and ore mining, rather than as an integrated unit;
– If expenditures for additional infrastructure to support the second and subsequent pits are relatively large; and
– If the pits extract ore from separate and distinct orebodies, rather than from a single orebody.
If the designs of the second and subsequent pits are significantly influenced by opportunities to optimise output from several pits combined, including the co-treatment or blending of the output from the pits, then this would point to treatment as an integrated operation for the purposes of accounting for initial stripping costs. The relative importance of each of the above factors is considered in each case.
In order for production phase stripping costs to qualify for capitalisation as a stripping activity asset, three criteria must be met:
– It must be probable that there will be an economic benefit in a future accounting period because the stripping activity has improved access to the orebody;
– It must be possible to identify the “component” of the orebody for which access has been improved; and
– It must be possible to reliably measure the costs that relate to the stripping activity.
A “component” is a specific section of the orebody that is made more accessible by the stripping activity. It will typically be a subset of the larger orebody that is distinguished by a separate useful economic life (for example, a pushback).
Production phase stripping can give rise to two benefits: the extraction of ore in the current period and improved access to ore which will be extracted in future periods. When the cost of stripping which has a future benefit is not distinguishable from the cost of producing current inventories, the stripping cost is allocated to each of these activities based on a relevant production measure using a life-of-component strip ratio. The ratio divides the tonnage of waste mined for the component for the period either by the quantity of ore mined for the component or by the quantity of minerals contained in the ore mined for the component. In some operations, the quantity of ore is a more appropriate basis for allocating costs, particularly where there are significant by-products. Stripping costs for the component are deferred to the extent that the current period ratio exceeds the life of component ratio. The stripping activity asset is depreciated on a “units of production” basis based on expected production of either ore or minerals contained in the ore over the life of the component unless another method is more appropriate.
The life-of-component ratios are based on the ore reserves of the mine (and for some mines, other mineral resources) and the annual mine plan; they are a function of the mine design and, therefore, changes to that design will generally result in changes to the ratios. Changes in other technical or economic parameters that impact the ore reserves (and for some mines, other mineral resources) may also have an impact on the life-of-component ratios even if they do not affect the mine design. Changes to the ratios are accounted for prospectively.
It may be the case that subsequent phases of stripping will access additional ore and that these subsequent phases are only possible after the first phase has taken place. Where applicable, the Group considers this on a mine-by-mine basis. Generally, the only ore attributed to the stripping activity asset for the purposes of calculating a life-of-component ratio, and for the purposes of amortisation, is the ore to be extracted from the originally identified component.
Deferred stripping costs are included in “Mining properties and leases” within “Property, plant and equipment” or within “Investments in equity accounted units”, as appropriate. Amortisation of deferred stripping costs is included in “Depreciation of property, plant and equipment” within “Net operating costs” or in “Share of profit after tax of equity accounted units”, as appropriate.
(i) Depreciation and impairment (notes 13 and 14) Depreciation of non-current assets Property, plant and equipment is depreciated over its useful life, or over the remaining life of the mine or smelter or refinery if that is shorter and there is no reasonable alternative use for the asset by the Group.
The useful lives of the major assets of a cash-generating unit are often dependent on the life of the orebody to which they relate. Where this is the case, the lives of mining properties, and their associated refineries, concentrators and other long-lived processing equipment are generally limited to the expected life of the orebody. The life of the orebody, in turn, is estimated on the basis of the life-of-mine plan. Where the major assets of a cash-generating unit are not dependent on the life of a related orebody, management applies judgment in estimating the remaining service potential of long-lived assets. Factors affecting the remaining service potential of smelters include, for example, smelter technology and electricity purchase contracts when power is not sourced from the companies, or in some cases from local governments permitting electricity generation from hydro-power stations.
The useful lives and residual values for material assets and categories of assets are reviewed annually and changes are reflected prospectively.
Depreciation commences when an asset is available for use. The major categories of property, plant and equipment are depreciated on a units of production and/or straight line basis as follows:
Units of production basis For mining properties and leases and certain mining equipment, consumption of the economic benefits of the asset is linked to production. Except as noted below, these assets are depreciated on the units of production basis.
Annual Report 2020 | riotinto.com 213213Annual Report 2020 | riotinto.com
Financial Statements
Notes to the 2020 Financial Statements
1 Principal accounting policies continuedIn applying the units of production method, depreciation is normally calculated based on production in the period as a percentage of total expected production in current and future periods based on ore reserves and, for some mines, other mineral resources. Other mineral resources may be included in the calculations of total expected production in limited circumstances where there are very large areas of contiguous mineralisation, for which the economic viability is not sensitive to likely variations in grade, as may be the case for certain iron ore, bauxite and industrial mineral deposits, and where there is a high degree of confidence that the other mineral resources can be extracted economically. This would be the case when the other mineral resources do not yet have the status of ore reserves merely because the necessary detailed evaluation work has not yet been performed and the responsible technical personnel agree that inclusion of a proportion of measured and indicated resources in the calculation of total expected production is appropriate based on historical reserve conversion rates.
The required level of confidence is unlikely to exist for minerals that are typically found in low-grade ore (as compared with the above), such as copper or gold. In these cases, specific areas of mineralisation have to be evaluated in detail before their economic status can be predicted with confidence.
Where measured and indicated resources are used in the calculation of depreciation for infrastructure, primarily rail and port, which will benefit current and future mines, then the measured and indicated resources may relate to mines which are currently in production or to mines where there is a high degree of confidence that they will be brought into production in the future. The quantum of mineral resources is determined taking into account future capital costs as required by the JORC code. The depreciation calculation, however, applies to current mines only and does not take into account future development costs for mines which are not yet in production. Measured and indicated resources are currently incorporated into depreciation calculations in the Group’s Australian iron ore business.
Straight line basis Assets within operations for which production is not expected to fluctuate significantly from one year to another or which have a physical life shorter than the related mine are depreciated on a straight line basis.
Impairment charges/reversals of non-current assets Impairment charges and reversals are assessed at the level of cash- generating units which, in accordance with IAS 36 “Impairment of Assets”, are identified as the smallest identifiable asset or group of assets that generate cash inflows which are largely independent of the cash inflows from other assets. Separate cash-generating units are identified where an active market exists for intermediate products, even if the majority of those products are further processed internally. Impairment of financial assets is evaluated in accordance with IFRS 9.
In some cases, individual business units consist of several operations with independent cash-generating streams which constitute separate cash- generating units.
Goodwill acquired through business combinations is allocated to the cash-generating unit or groups of cash-generating units that are expected to benefit from the related business combination, and tested for impairment at the lowest level within the Group at which goodwill is monitored for internal management purposes. All goodwill, intangible assets that have an indefinite life and intangible assets that are not ready for use are tested annually for impairment as at 30 September, regardless of whether there has been an impairment trigger, or more frequently if events or changes in circumstances indicate a potential impairment.
Property, plant and equipment and intangible assets with finite lives are reviewed for impairment if there is an indication that the carrying amount may not be recoverable. Right of use assets recognised under IFRS 16 "Leases" are included in the review. The Group conducts an internal review of the asset values annually as at 30 September which is used as a source of information to assess for indications of impairment or reversal of previously recognised impairment losses. External factors, such as changes in forecasted commodity prices, costs and other market factors as well as internal factors such as cancellation of a project or reduced project scope, are also monitored to assess for indications of impairment or reversal of previously recognised impairment losses. If any such indication exists then an impairment review is undertaken; the recoverable amount is assessed by reference to the higher of value in use (being the net present value of expected future cash flows of the relevant cash-generating unit in its current condition) and fair value less costs of disposal (FVLCD).
When the recoverable amount of the cash-generating unit is measured by reference to FVLCD, this amount is further classified in accordance with the fair value hierarchy for observable market data that is consistent with the unit of account for the cash-generating unit being tested. The Group considers that the best evidence of FVLCD is the value obtained from an active market or binding sale agreement and, in this case, the recoverable amount is classified in the fair value hierarchy as level 1. When FVLCD is based on quoted prices for equity instruments but adjusted to reflect factors such as a lack of liquidity in the market, the recoverable amount is classified as level 2 in the fair value hierarchy. No cash-generating units are currently assessed for impairment by reference to a recoverable amount based on FVLCD classified as level 1 or level 2.
Where unobservable inputs are material to the measurement of the recoverable amount, FVLCD is based on the best information available to reflect the amount the Group could receive for the cash-generating unit in an orderly transaction between market participants at the measurement date. This is often estimated using discounted cash flow techniques and is classified as level 3 in the fair value hierarchy.
Where the recoverable amount is assessed using FVLCD based on discounted cash flow techniques, the resulting estimates are based on detailed life-of-mine and/or long-term production plans. These may include anticipated expansions which are at the evaluation stage of study.
The cash flow forecasts for FVLCD purposes are based on management’s best estimates of expected future revenues and costs, including the future cash costs of production, capital expenditure, and closure, restoration and environmental costs. For the purposes of determining FVLCD from a market participant’s perspective, the cash flows incorporate management’s price and cost assumptions in the short and medium term. In the longer term, operating margins are assumed to remain constant where appropriate, as it is considered unlikely that a market participant would prepare detailed forecasts over a longer term. The cash flow forecasts may include net cash flows expected to be realised from the extraction, processing and sale of material that does not currently qualify for inclusion in ore reserves. Such non-reserve material is only included when there is a high degree of confidence in its economic extraction. This expectation is usually based on preliminary drilling and sampling of areas of mineralisation that are contiguous with existing ore reserves. Typically, the additional evaluation required to achieve reserves status for such material has not yet been done because this would involve incurring evaluation costs earlier than is required for the efficient planning and operation of the mine.
As noted above, cost levels incorporated in the cash flow forecasts for FVLCD purposes are based on the current life-of-mine plan or long-term production plan for the cash-generating unit. This differs from value in use which requires future cash flows to be estimated for the asset in its current condition and therefore does not include future cash flows associated with improving or enhancing an asset’s performance. Anticipated enhancements to assets may be included in FVLCD calculations and, therefore, generally result in a higher value.
214 Annual Report 2020 | riotinto.com214 Annual Report 2020 | riotinto.com
Financial Statements
Notes to the 2020 Financial Statements

Where the recoverable amount of a cash-generating unit is dependent on the life of its associated orebody, expected future cash flows reflect the current life of mine and/or long-term production plans, which are based on detailed research, analysis and iterative modelling to optimise the level of return from investment, output and sequence of extraction. The mine plan takes account of all relevant characteristics of the orebody, including waste-to-ore ratios, ore grades, haul distances, chemical and metallurgical properties of the ore impacting process recoveries and capacities of processing equipment that can be used. The life-of-mine plan and/or long-term production plans are, therefore, the basis for forecasting production output and production costs in each future year.
Forecast cash flows for ore reserve estimation for JORC purposes are generally based on Rio Tinto’s commodity price forecasts, which assume short-term market prices will revert to the Group’s assessment of the long-term price, generally over a period of three to five years. For most commodities, these forecast commodity prices are derived from a combination of analyses of the marginal costs of the producers and of the incentive price of these commodities. These assessments often differ from current price levels and are updated periodically. The Group does not believe that published medium- and long-term forward prices necessarily provide a good indication of future levels because they tend to be strongly influenced by spot prices. The price forecasts used for ore reserve estimation are generally consistent with those used for impairment testing unless management deems that in certain economic environments, a market participant would not assume Rio Tinto’s view on prices, in which case in preparing FVLCD impairment calculations management estimates the assumptions that a market participant would be expected to use.
Forecast future cash flows of a cash-generating unit take into account the sales prices under existing sales contracts.
The discount rates applied to the future cash flow forecasts represent an estimate of the rate the market would apply having regard to the time value of money and the risks specific to the asset for which the future cash flow estimates have not been adjusted. The Group’s weighted average cost of capital is generally used as a starting point for determining the discount rates, with appropriate adjustments for the risk profile of the countries in which the individual cash-generating units operate. For final feasibility studies and ore reserve estimation, internal hurdle rates, which are generally higher than the Group’s weighted average cost of capital, are used. For developments funded with project finance, the debt component of the weighted average cost of capital may be calculated by reference to the specific interest rate of the project finance and anticipated leverage of the project.
For operations with a functional currency other than the US dollar, the impairment review is undertaken in the relevant functional currency. In estimating FVLCD, internal forecasts of exchange rates take into account spot exchange rates, historical data and external forecasts, and are kept constant in real terms after five years. The great majority of the Group’s sales are based on prices denominated in US dollars. To the extent that the currencies of countries in which the Group produces commodities strengthen against the US dollar without an increase in commodity prices, cash flows and, therefore, net present values are reduced. Management considers that over the long term, there is a tendency for movements in commodity prices to compensate to some extent for movements in the value of the US dollar, particularly against the Australian dollar and Canadian dollar, and vice versa. However, such compensating changes are not synchronised and do not fully offset each other. In estimating value in use, the present value of future cash flows in foreign currencies is translated at the spot exchange rate on the testing date.
Non-current assets (excluding goodwill) that have suffered impairment are reviewed using the same basis for valuation as explained above whenever events or changes in circumstances indicate that the impairment loss may no longer exist, or may have decreased. If appropriate, an impairment reversal will be recognised. The carrying amount of the cash-generating unit after reversal must be the lower of (a) the recoverable amount, as calculated above, and (b) the carrying amount that would have been determined (net of amortisation or depreciation) had no impairment loss been recognised for the cash-generating unit in prior periods.
An onerous contract is defined under IAS 37 “Provisions, Contingent Liabilities and Contingent Assets” as a contract under which the unavoidable costs of meeting the obligations under the contract exceed the economic benefits expected to be received under it. Provision is made when the assets dedicated to the contract are fully impaired or the contract becomes stranded as a result of a business decision.
(j) Determination of ore reserve and mineral resource estimates The Group estimates its ore reserves and mineral resources based on information compiled by Competent Persons as defined in accordance with the JORC code.
Ore reserves and, for certain mines, other mineral resources, determined in this way are used in the calculation of depreciation, amortisation and impairment charges and for forecasting the timing of the payment of close-down and restoration costs and the recovery of deferred tax assets. The depreciation and impairment policy above notes instances in which mineral resources are taken into account for accounting purposes. In addition, value may be attributed to mineral resources in purchase price allocations undertaken for the purposes of business combination accounting.
(k) Leases (notes 14, 21, 22) IFRS 16 “Leases” applies to the recognition, measurement, presentation and disclosure of leases. Certain leases are exempt from the standard, including leases to explore for or use minerals, oil, natural gas and similar non-regenerative resources. The Group does not apply IFRS 16 to arrangements which fall within the scope of IAS 38 “Intangible Assets”.
A significant proportion by value of the Group’s lease arrangements relate to dry bulk vessels and offices. Other leases include land and non-mining rights, warehouses, ports, equipment and vehicles. The majority of lease terms are negotiated through the Group’s procurement function, although agreements contain a wide range of different terms and conditions.
The Group recognises all lease liabilities and corresponding right of use assets, with the exception of short-term (12 months or fewer) and low value leases, on the balance sheet. Lease liabilities are recorded at the present value of: fixed payments; variable lease payments that depend on an index or rate; amounts payable under residual value guarantees; and extension options expected to be exercised. Where a lease contains an extension option which the Group can exercise without negotiation, lease payments for the extension period are included in the liability if the Group is reasonably certain that it will exercise the option. Variable lease payments not dependent on an index or rate are excluded from the calculation of lease liabilities. Payments are discounted at the incremental borrowing rate of the lessee, unless the interest rate implicit in the lease can be readily determined. For lease agreements relating to vessels, ports and properties, non-lease components are excluded from the projection of future lease payments and recorded separately within operating costs on a straight line basis. The lease liability is measured at amortised cost using the effective interest method. The right of use asset arising from a lease arrangement at initial recognition reflects the lease liability, initial direct costs, lease payments made before the commencement date of the lease, and capitalised provision for dismantling and restoration, less any lease incentives.
Annual Report 2020 | riotinto.com 215215Annual Report 2020 | riotinto.com
Financial Statements
Notes to the 2020 Financial Statements

1 Principal accounting policies continuedThe Group recognises depreciation of right of use assets and interest on lease liabilities in the income statement over the lease term. Repayments of lease liabilities are separated into a principal portion (presented within financing activities) and interest portion (which the Group presents in operating activities) in the cash flow statement. Payments made before the commencement date are included within financing activities unless they in substance represent investing cash flows, for example where pre-commencement cash flows are significant relative to aggregate cash flows of the leasing arrangement.
(l) Close-down, restoration and environmental obligations (note 25) The Group has provisions for close-down and restoration costs which include the dismantling and demolition of infrastructure, the removal of residual materials and the remediation of disturbed areas for mines and certain refineries and smelters. These provisions are based on all regulatory requirements and any other commitments made to stakeholders.
Closure provisions are not made for those operations that have no known restrictions on their lives as the closure dates cannot be reliably estimated. This applies primarily to certain Canadian smelters which have indefinite- lived water rights from local governments permitting electricity generation from hydro-power stations.
Close-down and restoration costs are a normal consequence of mining or production, and the majority of close-down and restoration expenditure is incurred in the years following closure of the mine, refinery or smelter. Although the ultimate cost to be incurred is uncertain, the Group’s businesses estimate their costs using current restoration standards and techniques.
Close-down and restoration costs are provided for in the accounting period when the obligation arising from the related disturbance occurs, based on the net present value of the estimated future costs of restoration to be incurred during the life of the operation and post closure. Where appropriate, the provision is estimated using probability weighting of the different remediation and closure scenarios. The obligation may occur during development or during the production phase of a facility.
Provisions for close-down and restoration costs do not include any additional obligations which are expected to arise from future disturbance.
The costs are estimated on the basis of a closure plan, and are reviewed at each reporting period during the life of the operation to reflect known developments. The estimates are also subject to formal review, with appropriate external support, at regular intervals.
The initial close-down and restoration provision is capitalised within “Property, plant and equipment”. Subsequent movements in the close- down and restoration provisions for ongoing operations, including those resulting from new disturbance related to expansions or other activities qualifying for capitalisation, updated cost estimates, changes to the estimated lives of operations, changes to the timing of closure activities and revisions to discount rates are also capitalised within “Property, plant and equipment”. These costs are then depreciated over the lives of the assets to which they relate.
Changes in closure provisions relating to closed operations are charged/credited to “Net operating costs” in the income statement.
Where rehabilitation is conducted systematically over the life of the operation, rather than at the time of closure, provision is made for the estimated outstanding continuous rehabilitation work at each balance sheet date and the cost is charged to the income statement.
In the context of current market volatility and uncertainty, the Group has taken a long-term view of interest rates into account in determining the appropriate discount rate for discounting of future costs for close-down, restoration and environmental obligations. The amortisation or “unwinding” of the discount applied in establishing the provisions is charged to the income statement in each accounting period. The amortisation of the discount is shown within “Finance items” in the income statement.
In some cases, Group companies make a contribution to trust funds in order to meet or reimburse future environmental and decommissioning costs. Amounts due for reimbursement from trust funds are not offset against the corresponding closure provision unless payments into the fund have the effect of passing the closure obligation to the trust.
Environmental costs result from environmental damage that was not a necessary consequence of operations, and may include remediation, compensation and penalties. Provision is made for the estimated present value of such costs at the balance sheet date. These costs are charged to “Net operating costs”, except for the unwinding of the discount which is shown within “Finance items”.
Remediation procedures may commence soon after the time the disturbance, remediation process and estimated remediation costs become known, but can continue for many years depending on the nature of the disturbance and the remediation techniques used.
(m) Inventories (note 16) Inventories are valued at the lower of cost and net realisable value, primarily on a weighted average cost basis. Average costs are calculated by reference to the cost levels experienced in the relevant month together with those in opening inventory. The cost of raw materials and consumable stores is the purchase price. The cost of partly-processed and saleable products is generally the cost of production, including:
– Labour costs, materials and contractor expenses which are directly attributable to the extraction and processing of ore or the production of alumina and aluminium;
– The depreciation of mining properties and leases and of property, plant and equipment used in the extraction and processing of ore or the production of alumina and aluminium, copper and other refined products; and
– Production overheads.
Work in progress includes ore stockpiles and other partly processed material. Stockpiles represent ore that has been extracted and is available for further processing. If there is significant uncertainty as to if and/or when the stockpiled ore will be processed, the ore is expensed as mined. If the ore will not be processed within 12 months after the balance sheet date, it is included within non-current assets and net realisable value is calculated on a discounted cash flow basis. Quantities of stockpiled ore are assessed primarily through surveys and assays. Certain estimates, including expected metal recoveries, are calculated using available industry, engineering and scientific data, and are periodically reassessed taking into account technical analysis and historical performance.
(n) Taxation (note 9 and note 17) Current tax is the tax expected to be payable on the taxable income for the year calculated using rates that have been enacted or substantively enacted at the balance sheet date. It includes adjustments for tax expected to be payable or recoverable in respect of previous periods. Where the amount of tax payable or recoverable is uncertain, Rio Tinto establishes provisions based on either: the Group’s judgment of the most likely amount of the liability or recovery; or, when there is a wide range of possible outcomes, a probability weighted average approach.
216 Annual Report 2020 | riotinto.com216 Annual Report 2020 | riotinto.com
Financial Statements
Notes to the 2020 Financial Statements
Deferred tax is calculated in accordance with IAS 12. The Group provides for deferred tax in respect of fair value adjustments on acquisitions including mining rights that, in general, are not eligible for income tax allowances. Provision for deferred tax is based on the difference between the carrying value of the asset and its income tax base (which may be nil). Even when there is no income tax base, the existence of a tax base for capital gains tax purposes is not usually taken into account in determining the deferred tax provision for the assets, unless they are classified as held for sale or it is determined for other reasons that the carrying amount is expected to be recovered primarily through disposal and not through use of the assets. Where the recognition of an asset and liability from a single transaction gives rise to equal and off-setting temporary differences, Rio Tinto applies the Initial Recognition Exemption allowed by IAS 12, and consequently recognises neither a deferred tax asset nor a deferred tax liability in respect of these temporary differences. Primarily this occurs with new lease arrangements and changes in closure cost estimates for assets in operation.
(o) Post-employment benefits (note 42) The Group operates a number of defined benefit plans which provide lump sums, pensions, medical benefits and life insurance to retirees. In accordance with IAS 19, for post-employment defined benefit plans, the difference between the fair value of any plan assets and the present value of the plan obligations is recognised as an asset or liability in the balance sheet.
Where appropriate, the recognition of assets may be restricted to the present value of any amounts the Group expects to recover by way of refunds from the plan or reductions in future contributions. In determining the extent to which a refund will be available the Group considers whether any third party, such as a trustee or pension committee, has the power to enhance benefits or to wind up a pension plan without the Group’s consent.
The most significant assumptions used in accounting for pension plans are the discount rate, the inflation rate and mortality rates. The discount rate is used to determine the net present value of the obligations, the interest cost on the obligations and the interest income on plan assets. The discount rate used is the yield on high-quality corporate bonds with maturities and terms that match those of the post-employment obligations as closely as possible. Where there is no developed corporate bond market in a currency, the rate on government bonds is used. The inflation rate is used to project increases in future benefit payments for those plans that have benefits linked to inflation. The mortality rates are used to project the period over which benefits will be paid, which is then discounted to arrive at the net present value of the obligations.
The current service cost, any past service cost and the effect of any curtailment or settlements are recognised in the income statement. The interest cost less interest income on assets held in the plans is also charged to the income statement. All amounts charged to the income statement in respect of these plans are included within “Net operating costs” or in “Share of profit after tax of equity accounted units”, as appropriate.
The Group’s contributions to defined contribution plans are charged to the income statement in the period to which the contributions relate. These are included within “Net operating costs” or in “Share of profit after tax of equity accounted units”, as appropriate.
(p) Cash and cash equivalents (note 20) For the purpose of the balance sheet, cash and cash equivalents comprise: cash on hand, deposits held with banks, and short-term, highly liquid investments (mainly money market funds) that are readily convertible into known amounts of cash and which are subject to insignificant risk of changes in value. Bank overdrafts are shown as current liabilities in the balance sheet.
Further detail on cash and cash equivalents, including restricted cash, is shown in note 20.
For the purposes of the cash flow statement, cash and cash equivalents are net of bank overdrafts that are repayable on demand.
(q) Financial instruments (note 29) (i) Financial assets Classification and measurement The Group classifies its financial assets into the following categories: those to be measured subsequently at fair value (either through other comprehensive income (FVOCI) or through the income statement (FVPL)) and those to be held at amortised cost.
Classification depends on the business model for managing the financial assets and the contractual terms of the cash flows.
Management determines the classification of financial assets at initial recognition. The Group’s policy with regard to financial risk management is set out in note 29. Generally, the Group does not acquire financial assets for the purpose of selling in the short term.
The Group’s business model is primarily that of “hold to collect” (where assets are held in order to collect contractual cash flows). When the Group enters into derivative contracts, these transactions are designed to reduce exposures relating to assets and liabilities, firm commitments or anticipated transactions.
(a) Financial assets held at amortised cost This classification applies to debt instruments which are held under a hold to collect business model and which have cash flows that meet the “solely payments of principal and interest” (SPPI) criteria.
At initial recognition, trade receivables that do not have a significant financing component are recognised at their transaction price. Other financial assets are initially recognised at fair value plus related transaction costs; they are subsequently measured at amortised cost using the effective interest method. Any gain or loss on de-recognition or modification of a financial asset held at amortised cost is recognised in the income statement.
(b) Financial assets held at fair value through other comprehensive income (FVOCI)
This classification applies to the following financial assets:
– Debt instruments that are held under a business model where they are held for the collection of contractual cash flows and also for sale (“collect and sell”) and which have cash flows that meet the SPPI criteria. An example would be where trade receivable invoices for certain customers were factored from time to time.
All movements in the fair value of these financial assets are taken through other comprehensive income, except for the recognition of impairment gains or losses, interest revenue (including transaction costs by applying the effective interest method), gains or losses arising on de-recognition and foreign exchange gains and losses which are recognised in the income statement. When the financial asset is derecognised, the cumulative fair value gain or loss previously recognised in other comprehensive income is reclassified to the income statement.
– Equity investments where the Group has irrevocably elected to present fair value gains and losses on revaluation in other comprehensive income. The election can be made for each individual investment; however it is not applicable to equity investments held for trading.
Fair value gains or losses on revaluation of such equity investments, including any foreign exchange component, are recognised in other comprehensive income. When the equity investment is derecognised, there is no reclassification of fair value gains or losses previously recognised in other comprehensive income to the income statement. Dividends are recognised in the income statement when the right to receive payment is established.
Annual Report 2020 | riotinto.com 217217Annual Report 2020 | riotinto.com
Financial Statements
Notes to the 2020 Financial Statements

1 Principal accounting policies continued(c) Financial assets held at fair value through profit or loss (FVPL) This classification applies to the following financial assets. In all cases, transaction costs are immediately expensed to the income statement.
– Debt instruments that do not meet the criteria of amortised cost or fair value through other comprehensive income. The Group has a significant proportion of trade receivables with embedded derivatives for provisional pricing. These receivables are generally held to collect but do not meet the SPPI criteria and as a result must be held at FVPL. Subsequent fair value gains or losses are taken to the income statement. In addition, trade receivable invoices for certain customers which are routinely factored, in order to address credit risk and support value delivery through timelier realisation, are held at FVPL.
– Equity investments which are held for trading or where the FVOCI election has not been applied. All fair value gains or losses and related dividend income are recognised in the income statement.
– Derivatives which are not designated as a hedging instrument. All subsequent fair value gains or losses are recognised in the income statement.
(ii) Financial liabilities Borrowings and other financial liabilities (including trade payables but excluding derivative liabilities) are recognised initially at fair value, net of transaction costs incurred, and are subsequently measured at amortised cost.
The Group participates in supply chain finance arrangements whereby vendors may elect to receive early payment of their invoice from a third-party bank by factoring their receivable from Rio Tinto. These arrangements do not modify the terms of the original liability with respect to either counterparty terms, settlement date or amount due. Utilisation of the early settlement facility is voluntary and at the vendors' discretion on an invoice-by-invoice basis. Financial liabilities subject to supply chain finance therefore continue to be classified as trade payables. At 31 December 2020, trade payables included US$551 million (2019: US$573 million) subject to early settlement election by vendors.
(iii) Impairment of financial assets A forward-looking expected credit loss (ECL) review is required for: debt instruments measured at amortised cost or held at fair value through other comprehensive income; loan commitments and financial guarantees not measured at fair value through profit or loss; lease receivables; and trade receivables that give rise to an unconditional right to consideration.
As permitted by IFRS 9, the Group applies the “simplified approach” to trade receivable balances and receivables relating to net investment in finance leases and the “general approach” to all other financial assets. The general approach incorporates a review for any significant increase in counterparty credit risk since inception. The ECL reviews include assumptions about the risk of default and expected loss rates. For trade receivables and receivables relating to net investment in finance leases, the assessment takes into account the use of credit enhancements, for example, letters of credit. Impairments for undrawn loan commitments are reflected as a provision.
(iv) Derivatives and hedge accounting The Group applies the hedge accounting requirements under IFRS 9 and its hedging activities are discussed in note 29 with movements on hedging reserves disclosed in note 28. Where applicable, the Group may defer the costs of hedging including currency basis spreads, forward points and the time value of options.
Phase 1 amendments related to IBOR reform adopted in the comparative period allowed temporary relief from applying specific hedge accounting requirements to hedging arrangements directly impacted by the reform. Application of the temporary reliefs mean that IBOR reform does not result in termination of hedging relationships referencing an IBOR during the anticipated period of IBOR-related uncertainty. The principal relief which the Group has applied to its hedging portfolio is in the assumption that US LIBOR remains a separately identifiable component for the duration of the hedge; and the US LIBOR rates referenced by fixed-to-floating rate swaps in fair value hedge relationships do not change as the result of IBOR reform, preserving the economic relationship and allowing the related hedges to remain effective (refer to note 29 A (b) (v)).
(r) Share-based payments (note 41) The fair value of the Group’s share plans is recognised as an expense over the expected vesting period with an offset to retained earnings for Rio Tinto plc plans and to other reserves for Rio Tinto Limited plans.
The Group uses fair values provided by independent actuaries calculated using either a lattice-based option valuation model or a Monte Carlo simulation model.
The terms of each plan are considered at the balance sheet date to determine whether the plan should be accounted for as equity-settled or cash-settled. The Group does not operate any plans as cash-settled. However, the Performance Share Plan can, at the discretion of the directors, offer employees an equivalent amount in cash. This is not standard practice. In some jurisdictions, employees are granted cash- settled awards where equity-settled awards are prohibited by local laws and regulations. The value of these awards is immaterial.
The Group’s equity-settled share plans are settled either by: the issuance of shares by the relevant parent company; the purchase of shares on market; or the use of shares held in treasury which were previously acquired as part of a share buy-back. If the cost of shares acquired to satisfy the plans differs from the expense charged, the difference is taken to retained earnings or other reserves, as appropriate.
(s) Share capital (notes 26 and 27) Ordinary shares are classified as equity. Incremental costs directly attributable to the issuance of new shares are shown in equity as a deduction, net of tax, from the proceeds.
Where any Group company purchases the Group’s equity share capital (treasury shares), the consideration paid, including any directly attributable incremental costs (net of income taxes) is deducted from equity attributable to owners of Rio Tinto. Where such shares are subsequently reissued, any consideration received, net of any directly attributable incremental costs and the related income tax effects, is included in equity attributable to owners of Rio Tinto. If purchased Rio Tinto plc shares are cancelled, an amount equal to the nominal value of the cancelled share is credited to the capital redemption reserve.
(t) Segment reporting (notes 2 and 3) Operating segments are reported in a manner consistent with the internal reporting provided to the chief operating decision maker (CODM). The Group considers that Rio Tinto’s Chief Executive is the CODM, who is responsible for allocating resources and assessing performance of the operating segments.
218 Annual Report 2020 | riotinto.com218 Annual Report 2020 | riotinto.com
Financial Statements
Notes to the 2020 Financial Statements

Critical accounting policies and estimates (i) Determination of CGUs, assessment of indicators of impairment, review of asset carrying values, impairment charges and reversals and the recoverability of goodwill (notes 6, 12 and 13) Impairment is assessed at the cash-generating unit (CGU) level. A CGU is the smallest identifiable asset or group of assets that generates independent cash inflows. Judgment is applied to identify the Group’s CGUs, particularly when assets belong to integrated operations, and changes in CGUs could impact impairment charges and reversals. The most significant examples of this judgment are: in 2020, the continued grouping of Rio Tinto Fer et Titane in Quebec, Canada and QIT Madagascar Minerals (QMM) into a single CGU on the basis that they are vertically integrated operations with no active market for ilmenite; and in 2019, disaggregation of the Weipa bauxite mine and the downstream Gladstone alumina refineries (Yarwun and QAL) in Queensland, Australia into three separate CGUs on the basis of the ramp-up of the Amrun expansion at Weipa which increased bauxite exports such that the mine is now considered to generate largely independent cash inflows. Prior to 2019, the Weipa mine and Gladstone refineries were grouped into a single CGU. Management reviews these judgments on an annual basis as part of the annual internal review of asset values as described in note (i) above.
External and internal factors are monitored for indicators of impairment and include an annual internal review of asset values as described in note (i) above. Judgment is required to determine whether the impact of adverse spot commodity price movements is significant and structural in nature. There were no material instances of this judgment resulting in an indicator of impairment as at 31 December 2020.
Generally, discounted cash flow models are used to determine the recoverable amount of CGUs. In this case, significant judgment is required to determine the appropriate estimates and assumptions used and there is significant estimation uncertainty. In particular, for fair value less costs of disposal valuations, judgment is required to determine the estimates a market participant would use. The discounted cash flow model is most sensitive to the following estimates: the timing of project expansions; the cost to complete assets under construction; long-term commodity prices; production timing and recovery rates; exchange rates; operating costs; reserve and resource estimates; closure costs; discount rates; allocation of long-term contract revenues between CGUs; and, in some instances, the renewal of mining licences. Some of these variables are unique to an individual CGU. Future changes in these variables may differ from management’s expectations and may materially alter the recoverable amounts of the CGUs.
Note (i) above also describes the Group’s methodology for estimating long-term commodity prices, exchange rates and discount rates for impairment testing purposes. Note 6 outlines the significant judgments, assumptions and sensitivities made for both measuring the impairments recorded and for determining whether reversal of part or all of a previous impairment was appropriate. Judgments, assumptions and sensitivities in relation to the testing of CGUs containing goodwill and indefinite-lived intangible assets are outlined in notes 12 and 13 respectively.
(ii) Estimation of asset lives Intangible assets are considered to have indefinite lives (and therefore no related depreciation or amortisation charge) if, in the Group’s judgment, there is no foreseeable limit to the period over which the asset is expected to generate cash flows. Factors that are considered in making this judgment include the existence of contractual rights for unlimited terms or evidence that renewal of the contractual rights without significant incremental costs can be expected for indefinite periods into the future in view of the Group’s investment intentions. The most significant assessment of indefinite life applicable to intangible assets relates to contract based water rights in Canada acquired with Alcan, described further in note 13.
The useful lives of the major assets of a CGU are often dependent on the life of the orebody to which they relate. The life of the orebody will be determined on the basis of the life-of-mine plan which is based on the estimates of ore reserves as described on page 325.
(iii) Close-down, restoration and environmental obligations (note 25) Provision is made for close-down, restoration and environmental costs when the obligation occurs, based on the net present value of estimated future costs required to satisfy the obligation. Management uses its judgment and experience to determine the potential scope of closure rehabilitation work required to meet the Group’s legal, statutory and constructive obligations, and any other commitments made to stakeholders, and the options and techniques available to meet those obligations and estimate the associated costs and the likely timing of those costs. Significant judgment is also required to determine both the costs associated with that work and the other assumptions used to calculate the provision. External experts support the cost estimation process where appropriate but there remains significant estimation uncertainty.
The key judgment in applying this accounting policy is determining when an estimate is sufficiently reliable to make or adjust a closure provision.
Closure provisions are not made for those operations that have no known restrictions on their lives as the closure dates cannot be reliably estimated. This applies primarily to certain Canadian smelters which have indefinite- lived water rights or power agreements for renewably sourced power with local governments.
Cost estimates are updated throughout the life of the operation; generally cost estimates must comply with the Group’s Capital Project Framework once the operation is ten years from expected closure. This means, for example, that where an Order of Magnitude (OoM) study is required for closure it must be of the same standard as an OoM study for a new mine, smelter or refinery. As at 31 December 2020, there are 10 operations with remaining lives of under ten years before taking into account unapproved extensions. The largest recent closure study is at Rio Tinto Kennecott, which was completed during 2020; information available from this study at 31 December 2020 resulted in an increase to closure and environmental liabilities of US$74 million (2019: US$444 million).
Adjustments are made to provisions when the range of possible outcomes becomes sufficiently narrow to permit reliable estimation. Depending on the materiality of the change, adjustments may require review and endorsement by the Group’s Closure Steering Committee before the provision is updated.
In some cases, the closure study may indicate that monitoring and, potentially, remediation will be required indefinitely - for example ground water treatment. In these cases the underlying cash flows for the provision may be restricted to a period for which the costs can be reliably estimated, which on average is around 30 years. Where an alternative commercial arrangement to meet our obligations can be predicted with confidence, this period may be shorter.
Annual Report 2020 | riotinto.com 219219Annual Report 2020 | riotinto.com
Financial Statements
Notes to the 2020 Financial Statements

1 Principal accounting policies continuedThe most significant assumptions and estimates used in calculating the provision are:
– Closure timeframes. The weighted average remaining lives of operations is shown in note 25. Some expenditure may be incurred before closure whilst the operation as a whole is in production.
– The length of any post-closure monitoring period. This will depend on the specific site requirements and the availability of alternative commercial arrangements; some expenditure can continue into perpetuity. The Rio Tinto Kennecott closure and environmental remediation provision includes an allowance for ongoing monitoring and remediation costs, including ground water treatment, of approximately US$0.6 billion.
– The probability weighting of possible closure scenarios. The most significant impact of probability weighting is at the Pilbara operations (Iron Ore) relating to infrastructure and incorporates the expectation that some infrastructure will be retained by the relevant State authorities post closure. The assignment of probabilities to this scenario reduces the closure provision by US$1.2 billion.
– Appropriate sources on which to base the calculation of the discount rate. On 30 September 2020, management reviewed the rate used for discounting provisions and reduced the discount rate by 0.5%. The discount rate by nature is subjective and therefore sensitivities are shown in note 25 for how the provision balance, which at 31 December 2020 was US$13.3 billion, would change if discounted at alternative discount rates were applied.
There is significant estimation uncertainty in the calculation of the provision and cost estimates can vary in response to many factors including:
– Changes to the relevant legal or local/national government requirements and any other commitments made to stakeholders;
– Review of remediation and relinquishment options;
– Additional remediation requirements identified during the rehabilitation;
– The emergence of new restoration techniques;
– Precipitation rates and climate change;
– Change in the expected closure date;
– Change in the discount rate; and
– The effects of inflation.
Experience gained at other mine or production sites may also change expected methods or costs of closure, although elements of the restoration and rehabilitation of each site are relatively unique to a site. Generally, there is relatively limited restoration and rehabilitation activity and historical precedent elsewhere in the Group, or in the industry as a whole, against which to benchmark cost estimates.
The expected timing of expenditure can also change for other reasons, for example because of changes to expectations around ore reserves and mineral resources, production rates, renewal of operating licences or economic conditions.
As noted in note (l) above, changes in closure and restoration provisions for ongoing operations are usually capitalised and therefore will impact assets and liabilities but have no impact on profit or loss at the time the change is made. However, these changes will impact depreciation and the unwind of discount in future years. Changes in closure estimates at the Group’s ongoing operations could result in a material adjustment to assets and liabilities in the next 12 months.
Changes to closure cost estimates for closed operations, and changes to environmental cost estimates at any operation, would impact profit or loss; however, the Group does not consider that there is significant risk of a change in estimates for these liabilities causing a material adjustment to profit or loss in the next 12 months. Any new environmental incidents may require a material provision but cannot be predicted.
Project specific risks are embedded within the cash flows which are based on a central case estimate of closure activities assuming that the obligation is fulfilled by the Group. These cash flows are then discounted using a discount rate specific to the class of obligations. The selection of appropriate sources on which to base the calculation of the discount rate requires judgment. The 1.5% real rate currently used by the Group is based on a number of inputs including observable historical yields on 30 year US Treasury Inflation Protected Securities (TIPS), and consideration of findings by independent valuation experts.
(iv) Deferral of stripping costs (note 14) Stripping of waste materials takes place throughout the production phase of a surface mine or pit. The identification of components within a mine and of the life of component strip ratios requires judgment and is dependent on an individual mine’s design and the estimates inherent within that. Changes to that design may introduce new components and/or change the life of component strip ratios. Changes in other technical or economic parameters that impact ore reserves may also have an impact on the life of component strip ratios, even if they do not affect the mine’s design. Changes to the life of component strip ratios are accounted for prospectively.
The Group’s judgment as to whether multiple pit mines are considered separate or integrated operations determines whether initial stripping of a pit is deemed to be pre-production or production phase stripping and, therefore, the amortisation base for those costs. The analysis depends on each mine’s specific circumstances and requires judgment: another mining company could make a different judgment even when the fact pattern appears to be similar.
(v) Uncertain tax positions The Group operates across a large number of jurisdictions and is subject to periodic challenges by local tax authorities on a range of tax matters during the normal course of business, including transfer pricing, indirect taxes and transaction related issues.
Uncertain tax provisions include the related interest and penalties for all matters worldwide based on the Group’s judgment of the most likely amount of the liability or recovery; or, when there is a wide range of possible outcomes, a probability weighted average approach. The most significant judgments are in relation to transfer pricing matters. Whilst the potential outcomes are highly variable our current expectation is that there will be no material change to the amounts provided in the 12 months from 31 December 2020.
(vi) Recoverability of potential deferred tax assets (note 17) The Group has tax losses and other deductible temporary differences, mainly in Australian, Canadian, US and Mongolian taxable entities, that have the potential to reduce tax payments in future years. Deferred tax assets have been recognised to the extent that their recovery is probable, having regard to the availability of sufficient taxable temporary differences relating to the same taxation authority and the same taxable entity, the estimates of projected future taxable income of these taxable entities and after taking account of specific risk factors that are expected to affect the recovery of these assets including the risk of expiry of losses. Further information on deferred tax assets is given in note 17.
In addition to the risk of expiry of losses, the projections on which recovery of tax losses are based are subject to the same estimation uncertainty as noted in (i) above in relation to impairment. The key judgment in the application of this accounting policy is the recognition of deferred tax assets for losses where the operation is not currently profitable for tax purposes.
220 Annual Report 2020 | riotinto.com220 Annual Report 2020 | riotinto.com
Financial Statements
Notes to the 2020 Financial Statements

(vii) Provision for onerous contractsProvision for an onerous contract is made only when the assets dedicated to that contract are fully impaired or the contract becomes stranded as a result of a business decision. Judgment is required in determining which assets are considered dedicated to a contract when there is optionality as to how the contract obligations can be settled. Key estimates are the cash flows associated with the contract and the discount rate assumption. The Group completed the disposal of its remaining coking coal assets in 2018 and has retained the onerous provisions made in past periods for rail infrastructure “take or pay” contracts which were considered stranded. Refer to note 36. As at 31 December 2020, the balance of the provision was US$219 million (2019: US$284 million). In 2019, the Group's investment in the Escondida Joint Venture reduced by US$138 million relating to contractual payments under a power purchase agreement which became stranded and was judged to be onerous upon early cancellation in favour of renewable energy sources.
(viii) Identification of functional currencies The functional currency for each subsidiary, unincorporated arrangement, joint operation and equity accounted unit, is the currency of the primary economic environment in which it operates. Determination of functional currency involves significant judgment and other companies may make different judgments based on similar facts. For many of Rio Tinto’s businesses, their functional currency is the currency of the country in which they operate. The Group reconsiders the functional currency of its businesses if there is a change in the underlying transactions, events or conditions which determine their primary economic environment.
The determination of functional currency is a key judgment which affects the measurement of non-current assets included in the balance sheet and, as a consequence, the depreciation and amortisation of those assets included in the income statement. It also impacts exchange gains and losses included in the income statement and in equity. The Group applies judgment in determining whether settlement of certain intragroup loans is neither planned nor likely in the foreseeable future and therefore whether the associated exchange gains and losses can be taken to equity. During 2020, A$14 billion of intragroup loans continued to meet these criteria; associated exchange gains and losses are taken to equity.
(ix) Basis of consolidation (notes 32-35) Judgment is sometimes required to determine whether after considering all relevant factors, the Group has control, joint control or significant influence over an entity or arrangement. Significant influence includes situations of collective control (see note 35 (a)). Other companies may make different judgments regarding the same entity or arrangement. The most significant instance of such a judgment by the Group is in the determination that Escondida is a joint venture, based on the nature of significant commercial decisions, including capital expenditure, which require approval by both Rio Tinto and its partner BHP.
(x) Contingencies (note 30) Disclosure is made of material contingent liabilities unless the possibility of any loss arising is considered remote based on the Group’s judgment and legal advice. Contingent liabilities are quantified unless, in the Group’s judgment, the amount cannot be reliably estimated.
The unit of account for claims is the matter taken as a whole and therefore when a provision has been recorded for the best estimate of the cost to settle the obligation there is no further contingent liability component. This means that when a provision is recognised for the best estimate of the expenditure required to settle the present obligation from a single past event, a further contingent liability is not reported for the maximum potential exposure in excess of that already provided. We also consider the requirements of IAS 1 and provide disclosure when there is a significant risk the value of assets or liabilities could materially change within the next 12 months.
(xi) Exclusions from underlying earnings (note 2) As set out in note 2, certain items are excluded from net earnings/(loss) in arriving at underlying earnings in each period irrespective of materiality. In addition, there is a final judgmental category which includes, where applicable, other credits and charges that, individually or in aggregate if of a similar type, are of a nature or size to require exclusion in order to provide additional insight into underlying business performance.
The exclusion of provisions for obligations, including impact of change in discount rate in respect of legacy operations was the only application of the judgmental category in 2020.
(xii) Funding of Oyu TolgoiAs described in note 32(l), Turquoise Hill, a 50.8% subsidiary of Rio Tinto, has funded common share investments in Oyu Tolgoi on behalf of Erdenes Oyu Tolgoi LLC ("Erdenes"), a company controlled by the Mongolian government, which owns the 34% non-controlling interest in Oyu Tolgoi not owned by Turquoise Hill. Funded amounts earn interest at an annual effective rate of LIBOR plus 6.5% and are repayable via a pledge over Erdenes' share of future Oyu Tolgoi common share dividends; Erdenes also has the right to reduce the outstanding balance by making payments directly to Turquoise Hill.
Since these funding balances, including accrued interest, are expected to be recovered principally through dividends from Oyu Tolgoi or sale by Erdenes of its interests in Oyu Tolgoi, related amounts are recorded as a reduction to the net carrying value of non-controlling interests.
(xiii) Pilbara Iron Arrangements The arrangements described in note 33 (c) to the accounts permit each of the partners to the joint operation to request the other to construct assets on their tenure to increase the capacity of the rail and port infrastructure network. The requesting partner’s (Asset User’s) share of the capacity of the network will increase by the capacity of the newly constructed asset but, generally, that capacity may be provided from any of the network assets. The Asset User will pay an annual charge (Committed Use Charge – “CUC”) over a contractually specified period irrespective of usage of the network. The constructing partner (Asset Owner) has an ongoing obligation to make available capacity from those assets and to maintain the assets in good working order as required under relevant State Agreements and associated tenure.
The Group considered whether the CUC arrangements give rise to a lease between the Asset Owner and the Asset User. The conclusion that they do not is because there is no specified asset; rather the Asset User has a first priority right to the capacity in the CUC asset. This treatment was grandfathered on adoption of IFRS 16 "Leases" on 1 January 2019, following assessment under the preceding standards IAS 17 "Leases" and IFRIC 4 "Determining whether an arrangement contains a lease", with no change to the conclusion under IFRS 16 for subsequent expenditure subject to the existing CUC arrangements. Management considers that these arrangements are unique and has used judgment to apply the principles of IFRS to the accounting for the arrangements as described above. The obligation of the Asset Owner to make capacity available is fulfilled over time and not at a point in time. The CUC arrangement is therefore an executory contract as defined under IAS 37 “Provisions, contingent liabilities and contingent assets” whereby neither party has performed any of its obligations, or both parties have partially performed their obligations to an equal extent, and so the CUC payments are expensed as incurred. An alternative interpretation of the fact pattern could have resulted in a gross presentation in the Group’s balance sheet with an asset and a corresponding liability to reflect the present value of the CUC payments. The Asset User is a wholly owned subsidiary of Rio Tinto, whereas the Asset Owner is a joint operation. This impact would be some US$2 billion (calculated on the basis of grossing up the tax written down value of the CUC assets). Other methods of calculating the gross up might give rise to different numbers.
Annual Report 2020 | riotinto.com 221221Annual Report 2020 | riotinto.com
Financial Statements
Notes to the 2020 Financial Statements

1 Principal accounting policies continued
(xiv) Estimation of obligations for post-employment costs (note 42) The value of the Group’s obligations for post-employment benefits is dependent on the amount of benefits that are expected to be paid out, discounted to the balance sheet date. The discount rate is a key assumption and is based upon the yields on high quality corporate bonds in the relevant currency which have durations consistent with the term of the obligations. The discount rate will vary from one period to another in line with movements in corporate bond yields, but at any given measurement date there is relatively little estimation uncertainty. This rate is also used to calculate the interest cost on obligations and interest income on plan assets.
The following key assumptions are used to calculate the estimated benefit: future pay increases to be received by members of final pay plans, the level of inflation (for those benefits that are subject to some form of inflation protection), current mortality rates and future improvements in mortality rates. The assumption regarding future inflation is based on market yields on inflation linked instruments, where possible, combined with consensus views. The Group reviews the actual mortality rates of retirees in its major pension plans on a regular basis and uses these rates to set its current mortality assumptions. It also uses its judgment with respect to allowances for future improvements in longevity having regard to standard improvement scales in each relevant country and after taking external actuarial advice.
Most of the Group’s defined benefit pension plans are closed to new entrants and the majority of the obligations relate to former employees. The carrying value of the Group’s post-employment obligations is therefore less sensitive to assumptions about future salary increases than it is to assumptions regarding future inflation.
Details of the key assumptions, how they have moved since the previous balance sheet date and the sensitivity of the carrying value to changes in the assumptions are set out in note 42.
222 Annual Report 2020 | riotinto.com222 Annual Report 2020 | riotinto.com
Financial Statements
Notes to the 2020 Financial Statements

2 Operating segments Rio Tinto’s management structure is based on the principal product groups (PG) together with global support functions whose leaders make up the Executive Committee. The Executive Committee members each report directly to the Chief Executive of Rio Tinto who is the chief operating decision maker (CODM) and is responsible for allocating resources and assessing performance of the operating segments. The CODM monitors the performance of each product group based on a number of measures, including underlying earnings, underlying EBITDA, capital expenditure, net cash generated from operating activities and free cash flow. Finance costs and net debt are managed on a group-wide basis.
The Group's reportable segments are based on principal product groups and are consistent with the internal reporting structure as at 31 December 2020. Business units (BUs) are allocated to PGs based on management structure. The reportable segments are described as follows:
Reportable segment Principal activitiesIron Ore Iron ore mining and salt and gypsum production in Western Australia.Aluminium Bauxite mining; alumina refining; aluminium smelting.
Copper & Diamonds Mining and refining of copper, gold, silver, molybdenum and other by-products; exploration activities. Also includes diamond mining, sorting and marketing.
Energy & Minerals Includes businesses with products such as uranium, borates, titanium dioxide feedstock together with the Iron Ore Company of Canada (iron ore mining and iron concentrate/pellet production) and the Simandou iron ore project, which are the responsibility of the Energy & Minerals product group chief executive. The Group’s coal operations were included in Energy & Minerals until the divestment of these assets, which was completed during 2018.
Following a reassessment in 2020 of the Group's reportable segments, Other Operations, which included our 100% interest in the Gove alumina refinery (in closure), Rio Tinto Marine, and the remaining legacy liabilities of Rio Tinto Coal Australia are separately shown from the above reportable segments as none of these operations met the quantitative thresholds to be reportable segments. The Underlying earnings and Underlying EBITDA of Rio Tinto Marine are attributed back to the product groups. Legacy operations are not an operating segment as they do not earn revenue and are not expected to do so in the future. Comparatives have been adjusted to ensure comparability with the current year disclosures.
Other items includes amounts in relation to Group functions, unallocated corporate costs and central items.
The financial information by business unit provided on pages 306-309 of these financial statements provides additional voluntary disclosure which the Group considers useful to the users of the financial statements.
Gross product sales2020
US$m2019US$m
2018US$m
Iron Ore 27,508 24,075 18,731 Aluminium 9,314 10,340 12,191 Copper & Diamonds 5,428 5,815 6,468 Energy & Minerals 5,014 5,150 5,451 Reportable segments total 47,264 45,380 42,841 Other Operations 18 18 9 Inter-segment transactions (264) (31) (15) Product group total 47,018 45,367 42,835 Share of equity accounted unit sales and adjustments for intra-subsidiary/equity accounted units sales (2,407) (2,202) (2,313) Consolidated sales revenue per income statement 44,611 43,165 40,522
Gross product sales includes the Group’s proportionate share of product sales by equity accounted units (after adjusting for sales to subsidiaries) of US$2,441 million (2019: US$2,234 million; 2018: US$2,354 million) which are not included in consolidated sales revenue. Consolidated sales revenue includes subsidiary sales of US$34 million (2019: US$32 million; 2018: US$41 million) to equity accounted units which are not included in gross product sales.
Capital expenditure2020
US$m2019US$m
2018US$m
Iron Ore 2,941 1,741 1,302 Aluminium 1,085 1,456 1,373 Copper & Diamonds 1,864 2,087 2,150 Energy & Minerals 428 551 442 Reportable segments total 6,318 5,835 5,267 Other Operations 2 (4) 12 Product group total 6,320 5,831 5,279 Other items 79 64 65 Less: capital expenditure of equity accounted units (255) (456) (500) Capital expenditure per financial information by business unit 6,144 5,439 4,844 Add back: proceeds from disposal of property, plant and equipment(a) 45 49 586 Capital expenditure per cash flow statement 6,189 5,488 5,430
(a) In 2018, proceeds from disposal of property, plant and equipment included US$508 million received on the sale of surplus land at Kitimat.
Capital expenditure for reportable segments comprises the net cash outflow on purchases less disposals of property, plant and equipment, capitalised evaluation costs and purchases less disposals of other intangible assets. The details provided include 100% of subsidiaries’ capital expenditure and Rio Tinto’s share of the capital expenditure of joint operations and equity accounted units.
Annual Report 2020 | riotinto.com 223223Annual Report 2020 | riotinto.com
Financial Statements
Notes to the 2020 Financial Statements

Depreciation and amortisation2020
US$m2019US$m
2018US$m
Iron Ore 1,838 1,723 1,702 Aluminium 1,191 1,312 1,122 Copper & Diamonds 1,153 1,320 1,317 Energy & Minerals 392 428 455 Reportable segments total 4,574 4,783 4,596 Other Operations 199 177 26 Product group total 4,773 4,960 4,622 Other items 82 77 43 Less: depreciation and amortisation of equity accounted units (576) (653) (650) Depreciation and amortisation per note 4 4,279 4,384 4,015
Product group depreciation and amortisation for reportable segments include 100% of subsidiaries’ depreciation and amortisation and Rio Tinto’s share of the depreciation and amortisation of equity accounted units. Rio Tinto’s share of the depreciation and amortisation charge of equity accounted units is deducted to arrive at depreciation and amortisation as shown in note 4. These figures do not include impairment charges and reversals, which are excluded from underlying earnings.
Tax charge/(credit)2020
US$m2019US$m
2018US$m
Iron Ore 5,035 4,198 2,830 Aluminium 320 211 532 Copper & Diamonds (238) 65 118 Energy & Minerals 360 411 500 Reportable segments total 5,477 4,885 3,980 Other Operations (7) (51) (51) Inter-segment transactions (24) (2) — Product group total 5,446 4,832 3,929 Other items (179) (67) (276) Exploration and evaluation not attributed to product groups (34) (83) (38) Net finance costs (38) (144) (174)
5,195 4,538 3,441 Tax (credit)/charge excluded from underlying earnings (204) (391) 801 Taxation per income statement 4,991 4,147 4,242
Tax charge/(credit) excludes amounts relating to equity accounted units. Further information on the tax charge/(credit) excluded from underlying earnings is provided in the section “Underlying earnings”, below.
Underlying EBITDA2020
US$m2019US$m
2018US$m
Iron Ore 18,837 16,098 11,378 Aluminium 2,152 2,285 3,095 Copper & Diamonds 2,172 2,073 2,776 Energy & Minerals 1,646 1,762 2,140 Reportable segments total 24,807 22,218 19,389 Other Operations — (77) (70) Inter-segment transactions (94) (9) — Product group total 24,713 22,132 19,319 Central pension costs, share-based payments and insurance 72 59 (128) Restructuring, project and one-off costs (133) (183) (272) Central costs (500) (496) (552) Exploration and evaluation not attributed to product groups (250) (315) (231) Underlying EBITDA 23,902 21,197 18,136 Impairment charges (1,272) (3,487) (132) Gains/(losses) on embedded commodity derivatives not qualifying for hedge accounting (including exchange) 6 (260) 279 Net (losses)/gains on consolidation and disposal of interests in businesses — (291) 4,622 Change in closure estimates (non-operating and fully impaired sites) (401) — (376) Gain on sale of wharf and land in Kitimat, Canada — — 602 Change in other exclusions — (171) — Items excluded from underlying EBITDA (1,667) (4,209) 4,995 Depreciation and amortisation in subsidiaries and equity accounted units (4,650) (4,925) (4,559) Taxation and finance items in equity accounted units (443) (296) (372) Finance items (1,751) (648) (33) Profit before taxation 15,391 11,119 18,167
224 Annual Report 2020 | riotinto.com224 Annual Report 2020 | riotinto.com
Financial Statements
Notes to the 2020 Financial Statements

2 Operating segments continued
Underlying earnings2020
US$m2019US$m
2018US$m
Iron Ore 11,398 9,638 6,531 Aluminium 471 599 1,347 Copper & Diamonds 763 554 1,054 Energy & Minerals 577 611 995 Reportable segments total 13,209 11,402 9,927 Other Operations (54) (89) (102) Inter-segment transactions (32) (3) — Product group total 13,123 11,310 9,825 Central pension costs, share-based payments and insurance 81 60 (90) Restructuring, project and one-off costs (108) (94) (190) Central costs (418) (550) (410) Exploration and evaluation not attributed to product groups (216) (231) (193) Net finance costs (14) (122) (134) Underlying earnings 12,448 10,373 8,808 Items excluded from underlying earnings (2,679) (2,363) 4,830 Net earnings attributable to owners of Rio Tinto per income statement 9,769 8,010 13,638
Underlying EBITDA and underlying earnings are reported by Rio Tinto to provide greater understanding of the underlying business performance of its operations and to enhance comparability of reporting periods.
The measures of underlying EBITDA and underlying earnings, in conjunction with net cash generated from operating activities and capital expenditure (net of proceeds on disposals), are used by the Chief Executive of Rio Tinto to assess the performance of the product groups. Underlying earnings and net earnings both represent amounts net of tax attributable to owners of Rio Tinto.
The following items are excluded from net earnings in arriving at underlying earnings in each period irrespective of materiality:
– Net gains/(losses) on disposal of interests in businesses.
– Impairment charges and reversals.
– Profit/(loss) after tax from discontinued operations.
– Exchange and derivative gains and losses. This exclusion includes exchange gains/(losses) on external net debt and intragroup balances, unrealised gains/(losses) on currency and interest rate derivatives not qualifying for hedge accounting, unrealised gains/(losses) on certain commodity derivatives not qualifying for hedge accounting, and unrealised gains/(losses) on embedded derivatives not qualifying for hedge accounting.
In addition, there is a final judgmental category which includes, where applicable, other credits and charges that, individually or in aggregate with similar items, are of a nature or size to require exclusion in order to provide additional insight into underlying business performance.
Underlying EBITDA excludes the EBITDA impact of the same items that are excluded from underlying earnings.
Product group underlying earnings include the Group's share of the underlying earnings of subsidiaries and equity accounted units stated before finance items but after the amortisation of discount on provisions.
Rio Tinto’s share of the underlying earnings of equity accounted units amounted to US$656 million in 2020 (2019: US$302 million; 2018: US$513 million). This amount is attributable as follows: US$640 million profit to the Copper & Diamonds product group and US$16 million profit to other product groups (2019: US$292 million profit to the Copper & Diamonds product group and US$10 million profit to other product groups; 2018: US$476 million profit to the Copper & Diamonds product group and US$37 million profit to other product groups). These amounts are included in underlying earnings and include the underlying earnings of the Group’s tolling entities which process alumina. Tolling entities recharge the majority of their costs and generally have minimal earnings.
Annual Report 2020 | riotinto.com 225225Annual Report 2020 | riotinto.com
Financial Statements
Notes to the 2020 Financial Statements

Reconciliation of underlying earnings to net earnings
Pre-tax(h)
2020US$m
Taxation2020
US$m
Non-controlling
interests2020
US$m
Net amount2020
US$m
Net amount2019
US$m
Net amount2018
US$m
Underlying earnings 18,282 (5,195) (639) 12,448 10,373 8,808
Items excluded from underlying earningsImpairment charges (note 6) (1,243) 128 — (1,115) (1,658) (104) Net (losses)/gains on consolidation and disposal of interests in businesses(a) — — — — (291) 3,996 Exchange and derivative gains/(losses): – Exchange (losses)/gains on external net debt, intragroup balances and
derivatives(b) (1,138) 5 8 (1,125) 51 550
– Losses on currency and interest rate derivatives not qualifying for hedge accounting(c) (142) (19) 4 (157) (59) (48)
– Gains/(losses) on embedded commodity derivatives not qualifying for hedge accounting(d) 33 (10) (5) 18 (192) 202
Net losses from movements to closure estimates (non-operating and fully impaired sites)(e) (401) 100 1 (300) — (335)
Gain relating to surplus land at Kitimat(f) — — — — — 569 Other exclusions(g) — — — — (214) — Total excluded from underlying earnings (2,891) 204 8 (2,679) (2,363) 4,830 Net earnings 15,391 (4,991) (631) 9,769 8,010 13,638
(a) In 2019, the net loss mainly related to the disposal of our entire 68.62% stake in Rössing Uranium on 16 July 2019 for which we recorded a pre-tax loss of US$289 million (US$289 million net of tax). In 2018, the net gain related mainly to the sales of the Hail Creek coal mine and the Kestrel underground coal mine, which both completed on 1 August 2018, the sale of the Dunkerque aluminium smelter on 14 December 2018 and the sale of Grasberg on 21 December 2018. The net gain in 2018 also includes a gain on consolidation recognised on the formation on 10 May 2018 of ELYSIS, a new joint venture to develop a carbon-free smelting process. Refer to note 36 for further details in respect of these transactions.
(b) Exchange losses on external net debt and intragroup balances comprise post-tax foreign exchange losses on intragroup balances of US$1,330 million partially offset by post-tax gains of US$205 million on external net debt, primarily as a result of strengthening of the Australian dollar against the US dollar. In 2019, exchange gains on external net debt and intragroup balances comprise post-tax foreign exchange gains on net debt of US$60 million and post-tax losses of US$9 million on intragroup balances, primarily as a result of the Canadian dollar strengthening against the US dollar. From 1 January 2019, all foreign exchange gains and losses relating to net debt are excluded from underlying earnings. In 2018 and previous years, foreign exchange gains and losses on non-US dollar cash held in US dollar functional currency entities was included within underlying earnings. The impact of this change on the reported 2018 comparatives is insignificant, and therefore the comparatives have not been restated. In 2018 the net exchange gains comprise post-tax foreign exchange losses of US$386 million on US dollar denominated net debt and US$936 million gains on intragroup balances.
(c) Valuation changes on currency and interest rate derivatives, which are ineligible for hedge accounting, other than those embedded in commercial contracts, and the currency revaluation of embedded US dollar derivatives contained in contracts held by entities whose functional currency is not the US dollar.
(d) Valuation changes on derivatives, embedded in commercial contracts, that are ineligible for hedge accounting, but for which there will be an offsetting change in future Group earnings. Mark-to-market movements on commodity derivatives entered into with the commercial objective of achieving spot pricing for the underlying transaction at the date of settlement are included in underlying earnings.
(e) In 2020 the pre-feasibility study for the Gove refinery closure was completed, resulting in an increase to the closure provision. As a non-operating asset, this increase was recognised through the income statement. Also in 2020, the feasibility study for the Argyle mine closure was completed, resulting in a decrease to the closure provision. As the assets at Argyle had previously been fully impaired this decrease was recognised through the income statement, in line with previous movements to the closure provision. This amount also includes an increase in Diavik's closure provision to reflect the latest findings from the ongoing Pre-Feasibility Study, recognised through the incomes statement as Diavik was fully impaired during the year. It also includes the net earnings impact (US$138 million loss) in respect of increases to these closure provisions following a reduction to the closure discount rate to 1.5%. In 2018, the pre-feasibility study for the Argyle mine closure was completed, resulting in an increase to the closure provision. As the assets at Argyle had previously been fully impaired, this increase was not capitalised and was instead recognised in the income statement. Also in 2018, the feasibility study for the closure of the Ranger Project Area at Energy Resources of Australia (ERA) was finalised, resulting in an increase to the closure provision. As the assets of ERA had been fully impaired, this increase was recognised in the income statement. The charge was excluded from underlying earnings.
(f) In November 2018, Rio Tinto completed the lease and sale of a wharf and land in Kitimat. The resulting gain on disposal of property, plant and equipment and other income were both excluded from underlying earnings on the grounds of materiality.
(g) In 2019, other exclusions included provisions for obligations in respect of legacy operations of US$246 million (loss of US$233 million after tax), partially offset by the write-back of a net realisable value provision in respect of low grade stockpile inventories at Oyu Tolgoi of US$75 million (gain of US$19 million after tax and non-controlling interests). As a result of increased uncertainty over timing of production from the Oyu Tolgoi underground project (refer to note 6), we expected to utilise low grade stockpiles sooner than previously forecast. This was excluded from underlying earnings, consistent with the related impairment charge recognised in 2019.
(h) Exclusions from underlying earnings relating to equity accounted units are stated after tax and are included in the column “Pre-tax”.
226 Annual Report 2020 | riotinto.com226 Annual Report 2020 | riotinto.com
Financial Statements
Notes to the 2020 Financial Statements

3 Operating segments – additional information Consolidated sales revenue by destination(a)
2020%
2019%
2018%
2020US$m
2019US$m
2018US$m
China 58.1 51.3 44.6 25,940 22,135 18,061 Asia (excluding China and Japan) 10.2 10.6 11.5 4,536 4,558 4,665 United States of America 10.9 14.2 15.6 4,867 6,125 6,337 Japan 7.5 8.9 9.6 3,354 3,855 3,873 Europe (excluding UK) 5.9 6.0 9.3 2,623 2,610 3,788 Canada 2.9 3.3 3.3 1,289 1,478 1,330 Australia 1.7 1.7 1.8 745 737 720 UK 0.5 0.6 0.7 242 248 264 Other countries 2.3 3.4 3.6 1,015 1,419 1,484 Consolidated sales revenue 100 100 100 44,611 43,165 40,522
(a) Consolidated sales revenue by geographical destination is based on the ultimate country of destination of the product, if known. If the eventual destination of the product sold through traders is not known then revenue is allocated to the location of the product at the time when control is transferred. Rio Tinto is domiciled in both the UK and Australia.
Consolidated sales revenue by product Consolidated sales revenues of the Group are derived from the following products sold to external customers:
Revenue fromcontracts
withcustomers
2020US$m
Other revenue(a)
2020US$m
Consolidatedsales revenue
2020US$m
Iron ore 28,202 1,000 29,202 Aluminium, Alumina and Bauxite 9,092 54 9,146 Copper 1,721 64 1,785 Industrial minerals 2,054 (3) 2,051 Gold 471 6 477 Diamonds 459 — 459 Uranium(b) 299 — 299 Other(b) 1,194 (2) 1,192 Consolidated sales revenue 43,492 1,119 44,611 Share of equity accounted unit sales and intra-subsidiary/equity accounted unit sales 2,407 Gross product sales 47,018
Revenue from contracts
with customers
2019US$m
Other revenue(a)
2019US$m
Consolidated sales revenue
2019US$m
Revenue from contracts
with customers
2018US$m
Other revenue(a)
2018US$m
Consolidated sales revenue
2018US$m
Iron ore 25,516 229 25,745 19,888 (21) 19,867 Aluminium, Alumina and Bauxite 10,207 (32) 10,175 12,041 (22) 12,019 Copper 2,030 (7) 2,023 2,420 (32) 2,388 Coal — — — 986 3 989 Industrial minerals 2,251 (12) 2,239 2,168 — 2,168 Gold 667 2 669 869 — 869 Diamonds 619 — 619 695 — 695 Uranium(b) 375 — 375 415 — 415 Other(b) 1,322 (2) 1,320 1,112 — 1,112 Consolidated sales revenue 42,987 178 43,165 40,594 (72) 40,522 Share of equity accounted unit sales and intra-subsidiary/equity accounted unit
sales 2,202 2,313
Gross product sales 45,367 42,835
(a) Certain of the Group's products may be provisionally priced at the date revenue is recognised. The change in value of the provisionally priced receivables is based on relevant forward market prices and is included in “Other revenue” above.
(b) Uranium sales revenues were previously included within "Other". These sales revenues are now presented separately and the 2018 and 2019 comparatives have been adjusted to ensure comparability.
Annual Report 2020 | riotinto.com 227227Annual Report 2020 | riotinto.com
Financial Statements
Notes to the 2020 Financial Statements

Non-current assets other than excluded items(a)
The total of non-current assets other than excluded items is shown by location below.
2020 US$m
2019US$m
Australia 32,290 27,944 Canada 14,666 14,644 Mongolia 10,285 9,187 United States of America 6,090 5,459 Africa 3,294 3,583 South America 2,718 2,652 Europe (excluding France and the UK) 157 193 UK 117 158 France 55 64 Other countries 1,008 1,314 Total non-current assets other than excluded items 70,680 65,198
Non-current assets excluded from analysis above:Deferred tax assets 3,385 3,102 Other financial assets(b) 829 635 Quasi equity loans to equity accounted units(b) 112 113 Tax recoverable 4 5 Receivables and other assets 1,525 1,446 Total non-current assets per balance sheet 76,535 70,499
(a) Allocation of non-current assets by country is based on the location of the business units holding the assets. It includes investments in equity accounted units totalling US$3,652 million (2019: US$3,858 million) which represents the Group’s share of net assets excluding quasi equity loans shown separately above.
(b) Loans to equity accounted units comprise quasi equity loans of US$112 million (2019: US$113 million) included in “Investments in equity accounted units” on the face of the balance sheet and non-current non-quasi equity loans of US$1 million (2019: US$39 million) shown within “Other financial assets”.
4 Net operating costs (excluding items shown separately)
Note2020
US$m2019US$m
2018US$m
Raw materials, consumables, repairs and maintenance 8,490 9,485 10,613 Amortisation of intangible assets 13 161 133 133 Depreciation of property, plant and equipment 14 4,118 4,251 3,882 Employment costs 5 4,770 4,522 4,728 Shipping and other freight costs(a) 2,088 2,257 2,580 (Increase)/decrease in finished goods and work in progress (47) 42 (186) Royalties 2,763 2,501 2,117 Amounts charged by equity accounted units(b) 958 1,136 1,200 Net foreign exchange losses/(gains) 300 (52) (56) Other external costs(a) 3,083 3,627 3,184 Loss/(gain) on sale of property, plant and equipment(c) 50 31 (506) Provisions (including exchange differences on provisions) 25 894 753 1,011 Research and development 45 45 45 Costs included above capitalised or shown separately as exploration and evaluation costs(d) (708) (651) (589) Other operating income (711) (773) (1,041) Net operating costs (excluding items shown separately) 26,254 27,307 27,115
(a) In 2020, other external costs include US$314 million (2019: US$327 million) of short-term lease costs and US$30 million (2019: US$15 million) of variable lease costs recognised in the income statement in accordance with IFRS 16 “Leases”. Refer to note 22. In 2018, net operating costs included US$787 million of operating lease expenses under IAS 17 “Leases”. Costs for leases of dry bulk vessels (which included costs for crewing services) were included within “Shipping and other freight costs” and other lease costs were included within “Other external costs”.
(b) Amounts charged by equity accounted units relate to toll processing and also include purchases from equity accounted units of bauxite and aluminium which are then processed by the product group or sold to third parties. Generally, purchases are in proportion to the Group’s share of the equity accounted unit but in 2020, US$129 million (2019: US$291 million; 2018: US$332 million) related to purchases of the other investors’ share of production.
(c) In 2018, includes a US$549 million pre-tax gain on the sale of property, plant and equipment at Kitimat. Refer to note 2.(d) In 2020, US$537 million (2019: US$469 million; 2018: US$400 million) of operating costs were capitalised and US$171 million (2019: US$182 million; 2018: US$189 million) of costs were shown
separately within "Exploration and evaluation costs" in the Group income statement.
228 Annual Report 2020 | riotinto.com228 Annual Report 2020 | riotinto.com
Financial Statements
Notes to the 2020 Financial Statements

5 Employment costs
Note2020
US$m2019US$m
2018US$m
Total employment costs – Wages and salaries 4,141 3,923 4,154 – Social security costs 330 328 336 – Net post-retirement charge 42 469 384 532 – Share-based payment charge 41 138 123 122
5,078 4,758 5,144 Less: charged within provisions(a) 25 (308) (236) (416) Total employment costs 4 4,770 4,522 4,728
(a) Amounts included above relate to provisions for pensions, post-retirement healthcare, long service leave and other employee entitlements. These are included in “Provisions (including exchange differences on provisions)” in note 4.
6 Impairment charges
Note
Pre-taxamount
2020US$m
Taxation2020
US$m
Non-controlling
interest2020
US$m
Net amount
2020US$m
Pre-taxamount2019US$m
Pre-taxamount2018US$m
Aluminium – Pacific Aluminium (489) 17 — (472) — Aluminium – Sohar (220) — — (220) — — Aluminium – ISAL (93) (38) — (131) (109) (123) Copper & Diamonds – Diavik (441) 149 — (292) — Copper & Diamonds – Oyu Tolgoi — — — — (2,240) — Aluminium - Yarwun alumina refinery — — — — (1,138) — Energy & Minerals – Rössing — — — — — (9) Total impairment charge (1,243) 128 — (1,115) (3,487) (132)
Allocated as:Intangible assets 13 (4) (1) (2) Property, plant and equipment 14 (900) (3,486) (130) Investment in equity accounted units ("EAUs") (339) — — Total impairment charge (1,243) (3,487) (132) Comprising:Impairment charges of consolidated balances (904) (3,487) (132) Impairment charges related to EAUs (pre-tax) (368) — — Total impairment charges in the financial information by
business unit (page 306) (1,272) (3,487) (132)
Taxation (including related to EAUs) 157 323 25 Non-controlling interests — 1,506 3 Total impairment in the income statement (1,115) (1,658) (104)
Aluminium – Pacific Aluminium, Australia and New ZealandOn 9 July 2020, we announced the conclusion of the NZAS strategic review and gave Meridian Energy 14 months' notice for the termination of the power contract. As a result of the decision to wind-down operations an impairment trigger was identified. The net present value of post-tax cash flows over the remaining life for this cash-generating unit (CGU) was negative and therefore the non-current assets of the smelter were fully impaired. On 14 January 2021 a new agreement was reached with Meridian Energy in relation to power prices, allowing NZAS to continue operating the Tiwai Point aluminium smelter until December 2024. The extension allows time for detailed closure studies to be completed and for NZAS to support the government and Southland community in planning for the future. We have evaluated and concluded that these updated circumstances are not a trigger for impairment reversal.
The high operating costs and challenging outlook for the aluminium industry have also resulted in impairment triggers being identified at the Bell Bay aluminium smelter in Tasmania, Australia and at Boyne Smelter in Queensland, Australia at 30 June 2020. Bell Bay has a power contract to 2025 with Hydro Tasmania and with the current market context the forecast net present value of cash flows over that period was negative. The property, plant and equipment of the Bell Bay smelter was therefore fully impaired. We determined the recoverable amount for our share of the Boyne Smelter CGU which also includes the Gladstone Power Station as US$273 million based on post-tax cash flows expressed in real terms and discounted at 6.6%. Accordingly our share of impairment after tax in the equity accounted unit was US$119 million (US$148 million pre-tax) related to the smelter and US$26 million (US$36 million pre-tax) related to the power station.
Aluminium – SoharIn 2020, the challenging outlook for the Middle Eastern aluminium industry was identified as an impairment trigger at the Sohar aluminium smelter in Oman, an equity accounted unit of the Group.
At 30 September 2020 we determined the recoverable amount for our share of the Sohar CGU to be US$258 million based on post-tax cash flows expressed in real terms and discounted at 7.6%. Accordingly our share of impairment after tax in the equity accounted unit was US$220 million.
Annual Report 2020 | riotinto.com 229229Annual Report 2020 | riotinto.com
Financial Statements
Notes to the 2020 Financial Statements

6 Impairment charges continuedAluminium – ISAL smelter, IcelandIn 2018, we reached agreement with Hydro to sell the ISAL smelter in Iceland, our 53.3% interest in the Aluchemie anode plant in the Netherlands and our 50% share in the Aluminium fluoride plant in Sweden (ISAL). The anticipated headline sales price of US$345 million was lower than the carrying value of these assets, leading us to recognise an impairment charge of US$123 million. This was based on a fair value less cost of disposal (FVLCD) model, against property, plant and equipment and acquired software. Subsequently, Hydro withdrew its offer.
In 2019, these assets no longer met the accounting criteria to be classified as assets held for sale. Accordingly these non-current assets were tested for impairment. We calculated the recoverable amount for the CGUs based on the IAS 36 value-in-use methodology by reference to the net present value of post-tax cash flows expressed in real terms and discounted at 6.9%. These were US$302 million for the CGU comprising ISAL and Aluchemie and US$46 million for Alufluor. This resulted in a pre-tax impairment charge of US$109 million allocated to property, plant and equipment and intangibles in the ISAL and Aluchemie CGU.
In February 2020 we announced a strategic review of the ISAL smelter in Iceland and the challenging market conditions were identified as an impairment trigger. The net present value of cash flows projected over the remaining life for this CGU did not support retaining any carrying value for the non-current assets of the CGU, which were fully impaired following a pre-tax impairment charge of US$204 million in the first half of 2020.
During subsequent negotiations Landsvirkjun tabled an improved offer for power delivery, restoring the competitiveness of the smelter over its remaining life. We have concluded these updated circumstances, represent an indicator of partial impairment reversal. When combined with improved pricing since the half year we have calculated a recoverable amount of US$139 million based on the IAS 36 fair value less cost of disposal (FVLCD) methodology, discounted using a post-tax discount rate of 6.6% expressed in real terms. As a result we have reversed previously recorded pre-tax impairment of US$111 million reflected as an adjustment to the impairment charge recognised in the first half of 2020.
Copper & Diamonds – Diavik, CanadaThe COVID-19 pandemic has significantly disrupted the global demand for diamonds with many countries restricting the movement of citizens and closing retail outlets. Our 40% joint venture partner at the Diavik diamond mine filed for creditor protection in April 2020 and has since defaulted on its cash calls. Together these circumstances were identified as an impairment trigger. The net present value of post-tax cash flows projected over the remaining life of the Diavik diamond mine to 2025 did not support retaining any carrying value for the property, plant and equipment and intangible assets of the CGU, which have therefore been fully impaired.
Copper & Diamonds – Oyu Tolgoi, Mongolia On 16 July 2019 we announced that the first sustainable production from the Oyu Tolgoi underground project could be delayed by 16 to 30 months compared with the original feasibility study guidance in 2016. We also announced that development capital spend for the project may increase by between US$1.2 billion and US$1.9 billion in excess of the US$5.3 billion previously disclosed.
We identified these matters as an impairment trigger and prepared an assessment of the recoverable amount for the CGU at 30 June 2019 using a FVLCD model, as prescribed by IAS 36 “Impairment of Assets”.
In arriving at a recoverable amount, as at 30 June 2019, we estimated post-tax cash flows expressed in real terms over the current life of mine plus anticipated future expansions, utilising mineral resources. The mineral resources incorporate almost two billion tonnes of ore, which contributes approximately 20% to the total recoverable amount. We discounted the cash flows using a post-tax discount rate of 8.3% expressed in real terms. Due to the inputs used, the recoverable amount of the Oyu Tolgoi CGU was classified as level 3 under the fair value hierarchy.
At 30 June 2019 we determined the recoverable amount to be US$8.3 billion on a post-tax basis which resulted in a pre-tax impairment charge of US$2.2 billion (100% basis). This was allocated to mining properties and the underground development assets under construction. The net adjustment to tax represented an increase to deferred tax assets of US$320 million for the temporary difference corresponding to the impairment and a decrease in deferred tax assets of US$359 million for tax losses that were expected to expire without utilisation.
Since June 2019, the carrying value of Oyu Tolgoi on the same basis has increased to US$10.1 billion (100% basis), mainly due to capital expenditure completed in the interim. The execution of this capital expenditure also results in a corresponding increase in the value of the asset over this period. Prior to completion of the underground project, the net present value of cash flows also increases by approximately US$1.1 billion per annum due to unwinding of the discount for the time value of money. Such valuation increases are not indicative of impairment reversal.
On 16 December 2020 we confirmed the completion of the Definitive Estimate and selection of a preferred development option for the Oyu Tolgoi underground project. Development capital assumptions of US$6.75 billion and forecast sustainable production by October 2022 incorporate the impacts of COVID-19. The latest information is within the range of assumptions used to calculate the CGU's recoverable amount in the most recent impairment test, described above, and is not indicative of an impairment loss. The next major milestone for the project development is the undercut, scheduled for mid-2021, which initiates the caving process. Study work also continues on the Panel 1 and Panel 2 sections of the underground, with initial recommendations expected mid-2021. These studies will also consider options and associated costs to recover the copper and gold contained within the pillars added to the mine design of Panel 0.
230 Annual Report 2020 | riotinto.com230 Annual Report 2020 | riotinto.com
Financial Statements
Notes to the 2020 Financial Statements

On 4 January 2021, the Government of Mongolia advised Rio Tinto that they were dissatisfied with the results of the Definitive Estimate and the funding implications for the sharing of economic benefits between the shareholders of Oyu Tolgoi LLC. The Government has also stressed the importance of achieving a comprehensive solution which addresses the social issues of importance to Mongolia, such as water usage and the tax matters which have been referred to International Arbitration. We are engaging with the Government in relation to the definitive estimate and are in active discussions with them to address and close all outstanding issues and increase the project's benefit to all stakeholders. Should future negotiations with the Government of Mongolia result in changes to the operating cash profile of the assets, an impairment test may be necessary.
The funding of equity contributions to the project have been accounted for in accordance with the accounting policy in note 1 (xii) and additional information regarding the lending certificates and non-controlling interests are provided in note 32.
Aluminium – Yarwun alumina refinery In 2019, our annual impairment assessment of the Yarwun CGU resulted in a pre-tax impairment charge of US$1,138 million to property, plant and equipment as a result of this CGU being assessed on a stand-alone basis for the first time and a 30% year-on-year reduction in the spot price of alumina to US$275/t at 31 December 2019.
In 2020, we continued to monitor the Yarwun CGU closely for additional indicators of impairment given the limited headroom as a consequence of previous impairment, together with the sensitivity of the valuation to movements in the alumina price and headwinds faced by the aluminium sector since the onset of the COVID-19 pandemic.
We have considered the impact of recent volatility in the alumina spot price through 2020, noting its recovery from a low of US$226/t in June 2020 to over US$300/t by the end of the year, as well as valuation upside attributable to a reduction in input costs over the period under review. No impairment triggers have been identified in 2020 and the carrying value remains supportable.
7 Share of profit after tax of equity accounted units 2020
US$m2019US$m
2018US$m
Sales revenue: Rio Tinto share(a) 2,490 2,358 2,497 Operating costs (1,439) (1,812) (1,656) Profit before finance items and taxation 1,051 546 841 Finance items (59) (65) (69) Share of profit after tax of equity accounted units 23 10 14 Profit before taxation 1,015 491 786 Taxation (363) (190) (273) Profit for the year (Rio Tinto share) 652 301 513
(a) Sales revenue of equity accounted units includes sales by equity accounted units to Group subsidiaries.
Further information relating to the Group’s interests in joint ventures and associates is given in notes 34 and 35.
8 Finance income and finance costs
Note2020
US$m2019US$m
2018US$m
Finance income from equity accounted units 4 4 7 Other finance income (including bank deposits, net investment in leases, and other financial assets) 137 296 242 Total finance income 141 300 249
Interest on:– Financial liabilities at amortised cost (excluding lease liabilities) and associated derivatives (561) (816) (775) – Lease liabilities (50) (55) (2) Fair value movements:– Bonds designated as hedged items in fair value hedges (284) (185) 96 – Derivatives designated as hedging instruments in fair value hedges 287 181 (73) Loss on early redemption of bonds(a) — — (94) Amounts capitalised 14 340 321 296 Total finance costs (268) (554) (552)
(a) In 2018 we completed a bond buy-back programme of US$1.9 billion (nominal value). Loss on early redemption of bonds included a premium charge of US$72 million, unamortised debt issuance costs and fees of US$9 million, the write-off of the fair value hedge adjustment of US$16 million and the reclassification of a gain out of the cost of hedging reserve of US$3 million. Net interest paid in the Group cash flow statement included the payment of the premiums and the accelerated interest associated with the bond redemptions (US$80 million). There was no bond buy-back programme in 2020 or 2019.
Annual Report 2020 | riotinto.com 231231Annual Report 2020 | riotinto.com
Financial Statements
Notes to the 2020 Financial Statements

9 Taxation Taxation charge
Note2020
US$m2019US$m
2018US$m
– Current 5,169 4,436 3,726 – Deferred 17 (178) (289) 516 Total taxation charge 4,991 4,147 4,242
Prima facie tax reconciliation 2020
US$m2019US$m
2018US$m
Profit before taxation 15,391 11,119 18,167 Deduct: share of profit after tax of equity accounted units(a) (652) (301) (513) Add: impairment after tax of investments in equity accounted units (a) 339 — — Parent companies' and subsidiaries' profit before tax 15,078 10,818 17,654
Prima facie tax payable at UK rate of 19% (2019: 19%; 2018: 19%) 2,865 2,055 3,354 Higher rate of taxation on Australian underlying earnings 1,779 1,495 1,106 Impact of items excluded in arriving at underlying earnings(b):– Impairment charges(c) 44 340 — – Net gains and losses on consolidation and disposal of interests in businesses — 55 (251) – Exchange and gains/losses on derivatives 260 (22) 32 – Losses from increases to closure estimates (non-operating and fully impaired sites) (24) — 30 – Gain relating to surplus land at Kitimat — — (81) – Other exclusions — 38 — Impact of changes in tax rates and laws — 1 47 Other tax rates applicable outside the UK and Australia on underlying earnings (80) (110) (47) Resource depletion and other depreciation allowances (34) (57) (46) Recognition of previously unrecognised deferred tax assets(d) (182) — — Write-down of previously recognised deferred tax assets(e) 173 42 13 Amounts under/(over) provided in prior years 9 83 (108) Other items(f) 181 227 193 Total taxation charge(a) 4,991 4,147 4,242
(a) This tax reconciliation relates to the Group's parent companies, subsidiaries and joint operations, and excludes equity accounted units. The Group's share of profit of equity accounted units is net of tax charges of US$363 million (2019: US$190 million; 2018: US$273 million). Impairment after tax of investments in equity accounted units is net of tax credits of US$29 million (2019: US$nil; 2018: US$nil).
(b) The impact for each item includes the effect of tax rates applicable outside the UK. (c) The tax impact of impairments includes the write-down of deferred tax assets at ISAL and NZAS and non-recognition of deferred tax on those impairments. The tax impact also includes recognition at
local tax rates of deferred tax assets arising on the impairments of Bell Bay, Gladstone Power Station and Diavik. In the comparative period to 31 December 2019, the tax impact of impairment includes the write down of deferred tax assets in respect of prior year tax losses in Mongolia and recognition of deferred tax on impaired assets. Refer to note 6.
(d) The recognition of previously unrecognised deferred tax assets relates to the recognition of prior year deferred tax assets on losses and on impaired assets at Oyu Tolgoi due to improved deferred tax asset recovery expectations.
(e) Write down of previously recognised deferred tax assets relates primarily to the partial de-recognition of deferred tax assets in our Australian Aluminium business. (f) Other items include non-deductible costs and withholding taxes, and various adjustments to provisions for taxation, the most significant of which relate to transfer pricing matters, including issues
under discussion with the Australian Tax Office.
2020 US$m
2019US$m
2018US$m
Tax on fair value movements:– Cash flow hedge fair value gains 3 (6) (54) Tax credit/(charge) on actuarial gains and losses on post-retirement benefit plans 112 83 (271)
Tax relating to components of other comprehensive income/(loss) for the year(a) 115 77 (325)
(a) This comprises a deferred tax credit of US$115 million (2019: credit of US$77 million; 2018: charge of US$325 million) and a current tax charge of US$nil (2019: US$nil; 2018: US$nil), see note 17.
232 Annual Report 2020 | riotinto.com232 Annual Report 2020 | riotinto.com
Financial Statements
Notes to the 2020 Financial Statements

10 Earnings per ordinary share
2020Earnings
US$m
2020Weighted
averagenumber of
shares(millions)
2020Per share
amount(cents)
2019Earnings
US$m
2019Weighted
averagenumber of
shares(millions)
2019Per share
amount(cents)
Basic earnings per share attributable to ordinary shareholders of Rio Tinto(a) 9,769 1,617.4 604.0 8,010 1,630.1 491.4 Diluted earnings per share attributable to ordinary shareholders of Rio Tinto(b) 9,769 1,628.6 599.8 8,010 1,642.1 487.8
2018Earnings
US$m
2018Weighted
averagenumber of
shares(millions)
2018Per share
amount(cents)
Basic earnings per share attributable to ordinary shareholders of Rio Tinto(a) 13,638 1,719.3 793.2 Diluted earnings per share attributable to ordinary shareholders of Rio Tinto(b) 13,638 1,731.7 787.6
(a) The weighted average number of shares is calculated as the average number of Rio Tinto plc shares outstanding not held as treasury shares of 1,246.5 million (2019: 1,259.4 million; 2018: 1,312.7 million) plus the average number of Rio Tinto Limited shares outstanding of 370.9 million (2019: 370.7 million; 2018: 406.6 million) over the relevant period. There were no cross holdings of shares between Rio Tinto Limited and Rio Tinto plc at 31 December 2020 (31 December 2019: nil).
(b) For the purposes of calculating diluted earnings per share, the effect of dilutive securities of 11.2 million shares in 2020 (2019: 12.0 million; 2018: 12.4 million) is added to the weighted average number of shares described in (a) above. This effect is calculated under the treasury stock method, in accordance with IAS 33 “Earnings per Share”. The Group’s only potential dilutive ordinary shares are share options for which terms and conditions are described in note 41.
11 Dividends 2020
US$m2019
US$m2018
US$m
Rio Tinto plc previous year final dividend paid 2,783 2,245 2,446 Rio Tinto plc previous year special dividend paid — 3,032 — Rio Tinto plc interim dividend paid 1,937 1,930 1,666 Rio Tinto plc interim special dividend paid — 780 — Rio Tinto Limited previous year final dividend paid 857 666 731 Rio Tinto Limited previous year special dividend paid — 900 — Rio Tinto Limited interim dividend paid 555 556 513 Rio Tinto Limited interim special dividend paid — 225 — Dividends paid during the year 6,132 10,334 5,356
Dividends per share: paid during the year 386.0 c 635.0 c 307.0 cFinal dividends per share: proposed in the announcement of the results for the year 309.0 c 231.0 c 180.0 cSpecial dividends per share: proposed in the announcement of the results for the year 93.0 c — 243.0 c
Dividends per share
2020
Dividends per share
2019
Dividends per share
2018
Rio Tinto plc previous year final (pence) 177.47 p 135.96 p 129.43 pRio Tinto plc previous year special (pence) — 183.55 p — Rio Tinto plc interim (pence) 119.74 p 123.32 p 96.82 pRio Tinto plc interim special (pence) — 49.82 p — Rio Tinto Limited previous year final – fully franked at 30% (Australian cents) 349.74 c 250.89 c 228.53 cRio Tinto Limited previous year special – fully franked at 30% (Australian cents) — 338.70 c — Rio Tinto Limited interim – fully franked at 30% (Australian cents) 216.47 c 219.08 c 170.84 cRio Tinto Limited interim special – fully franked at 30% (Australian cents) — 88.50 c —
Number ofshares
2020(millions)
Number ofshares
2019(millions)
Number ofshares
2018(millions)
Rio Tinto plc previous year final 1,246.4 1,265.0 1,334.8 Rio Tinto plc previous year special N/A 1,265.0 N/ARio Tinto plc interim 1,246.5 1,256.4 1,308.4 Rio Tinto plc interim special N/A 1,256.4 N/ARio Tinto Limited previous year final 371.2 371.2 412.4 Rio Tinto Limited previous year special N/A 371.2 N/ARio Tinto Limited interim 371.2 371.2 412.4 Rio Tinto Limited interim special N/A 371.2 N/A
Annual Report 2020 | riotinto.com 233233Annual Report 2020 | riotinto.com
Financial Statements
Notes to the 2020 Financial Statements

11 Dividends continuedThe dividends paid in 2020 are based on the following US cents per share amounts: 2019 final – 231.0 cents, 2020 interim – 155.0 cents (2019 dividends paid: 2018 final – 180.0 cents, 2018 final special – 243.0 cents, 2019 interim – 151.0 cents; 2019 interim special – 61.0 cents, 2018 dividends paid: 2017 final – 180.0 cents, 2018 interim – 127.0 cents).
The number of shares on which Rio Tinto plc dividends are based excludes those held as treasury shares and those held by employee share trusts which waived the right to dividends. Employee share trusts waived dividends on 258,779 Rio Tinto plc ordinary shares and 28,743 American Depository Receipts (ADRs) for the 2019 final dividend and on 171,213 Rio Tinto plc ordinary shares and 29,634 ADRs for the 2020 interim dividend (2019: on 852,283 Rio Tinto plc ordinary shares and 37,678 ADRs for the 2018 final dividend and on 564,099 Rio Tinto plc ordinary shares and 47,674 ADRs for the 2019 interim dividend; 2018: on 132,294 Rio Tinto plc ordinary shares and 22,824 ADRs for the 2017 final dividend and on 314,529 Rio Tinto plc ordinary shares and 36,321 ADRs for the 2018 interim dividend). In 2020, 2019 and 2018, no Rio Tinto Limited shares were held by Rio Tinto plc.
The number of shares on which Rio Tinto Limited dividends are based excludes those held by shareholders who have waived the rights to dividends. Employee share trusts waived dividends on 98,065 Rio Tinto Limited ordinary shares for the 2019 final dividend and on 84,377 shares for the 2020 interim dividend (2019: on 628,566 shares for the 2018 final dividend and 342,062 shares for the 2019 interim dividend; 2018: on 130,129 shares for the 2017 final dividend and 251,394 shares for the 2018 interim dividend).
In addition, the directors of Rio Tinto announced a final dividend of 309.0 cents per share and a special dividend of 93.0 cents per share on 17 February 2021. This is expected to result in payments of US$6.5 billion. The dividend will be paid on 15 April 2021 to Rio Tinto plc and Rio Tinto Limited shareholders on the register at the close of business on 5 March 2021.
The proposed Rio Tinto Limited dividends will be franked out of existing franking credits or out of franking credits arising from the payment of income tax during 2021.
The approximate amount of the Rio Tinto Limited consolidated tax group’s retained profits and reserves that could be distributed as dividends and franked out of available credits that arose from net payments of income tax in respect of periods up to 31 December 2020 (after deducting franking credits expected to be utilised on the 2020 final and special dividends declared) is US$11,014 million (2019: US$8,599 million; 2018: US$6,178 million).
12 Goodwill
2020 US$m
2019US$m
Net book valueAt 1 January 922 912 Adjustment on currency translation 24 10 At 31 December 946 922 – cost 17,341 16,926 – accumulated impairment (16,395) (16,004)
At 1 January– cost 16,926 15,861 – accumulated impairment (16,004) (14,949)
At 31 December, goodwill has been allocated as follows:
2020 US$m
2019US$m
Net book valueRichards Bay Minerals 468 487 Pilbara 383 349 Dampier Salt 95 86
946 922
234 Annual Report 2020 | riotinto.com234 Annual Report 2020 | riotinto.com
Financial Statements
Notes to the 2020 Financial Statements

12 Goodwill continued Impairment tests for goodwill Richards Bay Minerals Richards Bay Minerals’ annual impairment review resulted in no impairment charge for 2020 (2019: no impairment charge). The recoverable amount has been assessed by reference to fair value less cost of disposal (FVLCD), in line with the policy set out in note 1(i) and classified as level 3 under the fair value hierarchy. FVLCD was determined by estimating cash flows until the end of the life-of-mine plan including anticipated expansions. In arriving at FVLCD, a post-tax discount rate of 8.6% (2019: 8.6%) has been applied to the post-tax cash flows expressed in real terms.
The key assumptions to which the calculation of FVLCD for Richards Bay Minerals is most sensitive and the corresponding decrease in FVLCD are set out below:
US$m
5% decrease in the titanium slag price 182 1% increase in the discount rate applied to post-tax cash flows 213 10% strengthening of the South African rand 393
Other assumptions include the long-term pig iron and zircon prices and operating costs. Future selling prices and operating costs have been estimated in line with the policy set out in note 1(i). The recoverable amount of the cash-generating unit (CGU) exceeds the carrying value when each of these sensitivities are applied whilst keeping all other assumptions constant.
Pilbara The annual impairment review of the Pilbara CGU has been assessed by reference to FVLCD using discounted cash flows, which is in line with the policy set out in note 1(i) and is classified as level 3 under the fair value hierarchy. In arriving at FVLCD, a post-tax discount rate of 6.6% (2019: 6.6%) has been applied to the post-tax cash flows expressed in real terms. The recoverable amount was determined to be significantly in excess of carrying value, and there are no reasonably possible changes in key assumptions that would cause the remaining goodwill to be impaired.
13 Intangible assets
Year ended 31 December 2020
Explorationand
evaluation(a)
US$m
Trademarks, patented and non-patented
technologyUS$m
Contract based
intangibleassets(b)
US$m
Other intangible
assetsUS$m
TotalUS$m
Net book valueAt 1 January 2020 173 44 1,947 473 2,637 Adjustment on currency translation 17 3 56 35 111 Expenditure during the year 87 — — 69 156 Amortisation for the year(c) — (14) (8) (139) (161) Impairment charges(d) — — — (4) (4) Disposals, transfers and other movements (6) — (1) 23 16 At 31 December 2020 271 33 1,994 457 2,755 – cost 2,415 232 3,070 1,710 7,427 – accumulated amortisation and impairment (2,144) (199) (1,076) (1,253) (4,672)
Year ended 31 December 2019
Explorationand
evaluation(a)
US$m
Trademarks, patented and non-patented
technologyUS$m
Contract based
intangibleassets(b)
US$m
Otherintangible
assetsUS$m
TotalUS$m
Net book valueAt 1 January 2019 233 59 1,982 505 2,779 Adjustment on currency translation (1) (1) 74 (1) 71 Expenditure during the year 57 — — 34 91 Amortisation for the year(c) — (14) (8) (111) (133) Impairment charges(d) — — — (1) (1) Disposals, transfers and other movements(e) (116) — (101) 47 (170) At 31 December 2019 173 44 1,947 473 2,637 – cost 2,306 214 3,002 1,516 7,038 – accumulated amortisation and impairment (2,133) (170) (1,055) (1,043) (4,401)
Annual Report 2020 | riotinto.com 235235Annual Report 2020 | riotinto.com
Financial Statements
Group balance sheet

13 Intangible assets continued
(a) Exploration and evaluation assets’ useful lives are not determined until transferred to property, plant and equipment. (b) The Group benefits from certain intangible assets acquired with Alcan, including power supply contracts, customer contracts and water rights. The water rights are expected to contribute to the
efficiency and cost effectiveness of operations for the foreseeable future; accordingly, these rights are considered to have indefinite lives and are not subject to amortisation but are tested annually for impairment. These water rights constitute the majority of the amounts in “Contract based intangible assets”. The remaining carrying value of the water rights of US$1,798 million as at 31 December 2020 (31 December 2019: US$1,759 million) relates wholly to the Quebec smelters cash-generating unit (CGU). The Quebec smelters CGU was tested for impairment by reference to fair value less cost of disposal (FVLCD) using discounted cash flows, which is in line with the policy set out in note 1(i). The recoverable amount of the Quebec smelters is classified as level 3 under the fair value hierarchy. In arriving at FVLCD, post-tax cash flows expressed in real terms have been estimated over the expected useful economic lives of the underlying smelting assets and discounted using a real post-tax discount rate of 6.6% (2019: 6.6%). The recoverable amounts were determined to be significantly in excess of carrying value, and there are no reasonably possible changes in key assumptions that would cause the remaining water rights to be impaired.
(c) Finite life intangible assets are amortised over their useful economic lives on a straight line or units of production basis, as appropriate. Where amortisation is calculated on a straight line basis, the following useful lives have been determined: Trademarks, patented and non-patented technology:
Trademarks: 14 to 20 years Patented and non-patented technology: ten to 20 years
Contract-based intangible assets: Power contracts/water rights: two to 45 years Other purchase and customer contracts: five to 15 years
Other intangible assets: Internally generated intangible assets and computer software: two to five years Other intangible assets: two to 20 years
(d) Impairment charges in 2020 relate to the Diavik diamond mine. Impairment charges in 2019 relate to the ISAL smelter. See note 6. (e) In 2019, disposals, transfers and other movements included the transfer from exploration and evaluation of the Zulti South project at Richards Bay Minerals to construction in progress following
approval in April 2019 and reclassification of certain mineral rights from contract based intangibles to property, plant and equipment.
Exploration and evaluation expenditure The charge for the year and the net amount of intangible assets capitalised during the year are as follows:
2020 US$m
2019US$m
2018US$m
Net expenditure in the year (net of cash proceeds of US$1 million (2019: US$10 million; 2018: US$233 million) on disposal of undeveloped projects) (711) (671) (345)
Non-cash movements and non-cash proceeds on disposal of undeveloped projects — — 45 Amount capitalised during the year 87 57 90 Net charge for the year (624) (614) (210) Reconciliation to income statement:Exploration and evaluation costs (625) (624) (488) Profit relating to interests in undeveloped projects(a) 1 10 278 Net charge for the year (624) (614) (210)
(a) During 2018, profit relating to interests in undeveloped properties related to the gains on the sales of Valeria (US$83 million) and Winchester South (US$195 million) undeveloped properties which were included within underlying earnings.
At 31 December 2020, a total of US$271 million has been capitalised related to projects which have not yet been approved to proceed (31 December 2019: US$173 million).
14 Property, plant and equipment Property, plant and equipment comprises owned and leased assets.
2020 US$m
2019US$m
Property, plant and equipment – owned 62,007 56,307 Right of use assets – leased 875 1,065 Net book value 62,882 57,372
236 Annual Report 2020 | riotinto.com236 Annual Report 2020 | riotinto.com
Financial Statements
Notes to the 2020 Financial Statements

14 Property, plant and equipment continuedProperty, plant and equipment – Owned
Year ended 31 December 2020 Note
Miningproperties
and leases(a)
US$m
Landand
buildingsUS$m
Plantand
equipmentUS$m
Capitalworks inprogress
US$mTotal
US$m
Net book valueAt 1 January 2020 10,402 6,403 31,491 8,011 56,307 Adjustment on currency translation(b) 457 307 1,758 366 2,888 Adjustments to capitalised closure costs 25 946 — — — 946 Interest capitalised(c) 8 — — — 340 340 Additions 329 45 726 5,211 6,311 Depreciation for the year(a)(d) (666) (354) (2,776) — (3,796) Impairment charges(e) (327) (85) (369) (82) (863) Disposals (2) (13) (64) (16) (95) Transfers and other movements(f) 34 66 1,988 (2,119) (31) At 31 December 2020 11,173 6,369 32,754 11,711 62,007 – cost 25,052 12,178 71,603 12,906 121,739 – accumulated depreciation and impairment (13,879) (5,809) (38,849) (1,195) (59,732) Non-current assets pledged as security(g) 1,712 494 5,065 6,974 14,245
Year ended 31 December 2019 Note
Mining properties
and leases(a)
US$m
Land and
buildingsUS$m
Plant and
equipmentUS$m
Capital works inprogress
US$mTotal
US$m
Net book valueAt 1 January 2019 11,063 6,263 32,019 7,016 56,361 Adjustment for transition to new accounting standard(h) — — (31) — (31) Restated opening balance 11,063 6,263 31,988 7,016 56,330 Adjustment on currency translation(b) 27 72 286 41 426 Adjustments to capitalised closure costs 25 840 — — — 840 Interest capitalised(c) 8 — — — 321 321 Additions 433 46 616 4,435 5,530 Depreciation for the year(a)(d) (729) (381) (2,869) — (3,979) Impairment charges(e) (1,339) (96) (1,115) (926) (3,476) Disposals — (9) (44) (19) (72) Transfers and other movements(f) 107 508 2,629 (2,857) 387 At 31 December 2019 10,402 6,403 31,491 8,011 56,307 – cost 24,875 11,517 66,705 9,188 112,285 – accumulated depreciation and impairment (14,473) (5,114) (35,214) (1,177) (55,978) Non-current assets pledged as security(g) 1,805 571 5,111 5,271 12,758
(a) At 31 December 2020, the net book value of capitalised production phase stripping costs totalled US$2,398 million, with US$2,019 million within "Property, plant and equipment" and a further US$379 million within "Investments in equity accounted units" (2019: total of US$2,276 million, with US$1,833 million in "Property, plant and equipment" and a further US$443 million within "Investments in equity accounted units"). During the year, capitalisation of US$380 million was partly offset by depreciation of US$267 million (including amounts recorded within equity accounted units). Depreciation of deferred stripping costs in respect of subsidiaries of US$145 million (2019: US$139 million; 2018: US$134 million) is included within “Depreciation for the year”.
(b) Adjustment on currency translation represents the impact of exchange differences arising on the translation of the assets of entities with functional currencies other than the US dollar, recognised directly in the currency translation reserve. The adjustment in 2020 arose from the strengthening of the Australian dollar and Canadian dollar against the US dollar.
(c) Interest is capitalised at a rate based on the Group or relevant subsidiary’s cost of borrowing or at the rate on project specific debt, where applicable. The Group’s average borrowing rate used for capitalisation of interest is 4.20% (2019: 5.30%).
(d) Assets within operations for which production is not expected to fluctuate significantly from one year to another or which have a physical life shorter than the related mine are depreciated on a straight line basis as follows: Land and buildings: Land: not depreciated Buildings: five to 50 years
Plant and equipment: Other plant and equipment: three to 50 years Power assets: 25 to 50 years
Capital work in progress: not depreciated (e) During 2020, impairment charges relate to Pacific Aluminium smelters, the ISAL smelter in Iceland and our interest in the Diavik diamond mine (see note 6). During 2019, impairment charges
primarily related to the Oyu Tolgoi underground project, Yarwun alumina refinery and the ISAL smelter (see note 6). (f) “Transfers and other movements” includes reclassifications between categories. In 2019, "Transfers and other movements" included ISAL assets held for sale as these assets no longer met the
criteria to be classified as assets held for sale.(g) Excludes assets held under capitalised lease arrangements. Non-current assets pledged as security represent amounts pledged as collateral against US$4,518 million (2019: US$4,540 million) of
loans, which are included in note 21. (h) The impact of the transition to new accounting standard IFRS 16 “Leases” on 1 January 2019.
Annual Report 2020 | riotinto.com 237237Annual Report 2020 | riotinto.com
Financial Statements
Group balance sheet

Right-of-use assets – Leased Land
andbuildings
US$m
Plantand
equipmentUS$m
TotalUS$m
Net book value31 December 2020 475 400 875 31 December 2019 507 558 1,065
Additions for the year31 December 2020 30 75 105 31 December 2019 89 212 301
Depreciation for the year (included within operating costs)31 December 2020 (93) (229) (322) 31 December 2019 (69) (203) (272)
Impairment charges(a)
31 December 2020 (6) (31) (37) 31 December 2019 (6) (4) (10)
(a) Impairment charges in 2020 relate to Pacific Aluminium smelters, the ISAL smelter in Iceland and our interest in the Diavik diamond mine (see note 6). Impairment charges in 2019 related to the ISAL smelter (see note 6).
The leased assets of the Group comprise land and buildings (mainly office buildings) and plant and equipment, the majority of which are marine vessels. Lease terms are negotiated on an individual basis and contain a wide range of terms and conditions. Right of use assets are depreciated on a straight line basis over the life of the lease, taking into account any extensions that are likely to be enacted.
15 Investments in equity accounted units Summary balance sheet (Rio Tinto share)
2020 US$m
2019US$m
Rio Tinto's share of assets– Non-current assets 5,307 5,820 – Current assets 1,077 831
6,384 6,651 Rio Tinto's share of liabilities– Current liabilities (785) (675) – Non-current liabilities (1,835) (2,005)
(2,620) (2,680) Rio Tinto's share of net assets 3,764 3,971
Further details of investments in equity accounted units are set out in notes 34 and 35.
At 31 December 2020 and 2019, the Group had no investments in equity accounted units with shares listed on recognised stock exchanges.
At 31 December 2020, net debt of equity accounted units, excluding amounts due to Rio Tinto, was US$931 million (2019: US$1,248 million).
238 Annual Report 2020 | riotinto.com238 Annual Report 2020 | riotinto.com
Financial Statements
Notes to the 2020 Financial Statements

16 Inventories 2020
US$m2019US$m
Raw materials and purchased components 640 675 Consumable stores 1,050 925 Work in progress 1,288 1,066 Finished goods and goods for resale 1,113 936 Total inventories 4,091 3,602 Comprising:Expected to be used within one year 3,917 3,463 Expected to be used after more than one year 174 139 Total inventories 4,091 3,602
During 2020, the Group recognised a net inventory write back of US$15 million (2019: net inventory write down of US$42 million). This comprised inventory write-offs of US$35 million (2019: US$134 million) partly offset by write-back of previously written down inventory due to an increase in realisable values amounting to US$50 million (2019: US$92 million).
At 31 December 2020, US$621 million (2019: US$611 million) of inventories were pledged as security for liabilities.
17 Deferred taxation 2020
US$m2019US$m
At 1 January – deferred tax liability (118) (532) Adjustment on currency translation (43) (77) Credited to the income statement 178 289 Credited to statement of comprehensive income(a) 115 77 Other movements(b) 14 125 At 31 December – deferred tax asset/(liability) 146 (118)
Comprising:– deferred tax assets(c)(d) 3,385 3,102 – deferred tax liabilities(e) (3,239) (3,220)
Annual Report 2020 | riotinto.com 239239Annual Report 2020 | riotinto.com
Financial Statements
Group balance sheet

17 Deferred taxation continuedDeferred tax balances for which there is a right of offset within the same tax jurisdiction are presented net on the face of the balance sheet as permitted by IAS 12. The closing deferred tax assets and liabilities, prior to this offsetting of balances, are shown below.
Analysis of deferred tax Total2020
US$m
Total2019US$m
Deferred tax assets arising from:Tax losses(c) 1,867 1,847 Provisions 2,121 1,810 Capital allowances 529 604 Post-retirement benefits 698 599 Unrealised exchange losses 204 176 Other temporary differences 1,046 931 Total 6,465 5,967 Deferred tax liabilities arising from:Capital allowances (4,966) (4,742) Unremitted earnings(e) (402) (411) Capitalised interest (351) (387) Post-retirement benefits (224) (253) Unrealised exchange gains (7) (3) Other temporary differences (369) (289) Total (6,319) (6,085)
Credited /(charged) to the income statementUnrealised exchange losses 25 (21) Tax losses 12 (164) Provisions 188 175 Capital allowances (82) 181 Tax on unremitted earnings 1 (5) Post-retirement benefits 9 (18) Other temporary differences 25 141 Total 178 289
(a) The amounts credited directly to the statement of comprehensive income include provisions for tax on exchange differences on intragroup loans qualifying for reporting as part of the net investment in subsidiaries, on cash flow hedges and on actuarial gains and losses on pension schemes and on post-retirement healthcare plans.
(b) “Other movements” include deferred tax relating to tax payable recognised by subsidiary holding companies on the profits of the equity accounted units to which it relates. (c) There is a limited time period, the shortest of which is one year, for the recovery of US$1,617 million (2019: US$1,186 million; six years) of tax losses and other tax assets which have been recognised
as deferred tax assets in the financial statements. (d) Recognised and unrecognised deferred tax assets are shown in the table below and totalled US$7,226 million at 31 December 2020 (2019: US$6,264 million). Of this total, US$3,385 million has been
recognised as deferred tax assets (2019: US$3,102 million), leaving US$3,841 million (2019: US$3,162 million) unrecognised, as recovery is not considered probable. (e) Deferred tax liabilities are not recognised on the unremitted earnings of subsidiaries and joint ventures totalling US$2,895 million (2019: US$3,861 million) where the Group is able to control the
timing of the remittance and it is probable that there will be no remittance in the foreseeable future. If these earnings were remitted, tax of US$112 million (2019: US$164 million) would be payable.
The recognised amounts in the table below do not include deferred tax assets that have been netted off against deferred tax liabilities.
Analysis of deferred tax assets Recognised Unrecognised
At 31 December2020
US$m2019US$m
2020 US$m
2019US$m
France — — 1,284 1,111 Canada 617 492 574 566 US 938 920 84 51 Australia 649 698 528 316 Mongolia(a) 974 704 540 721 Other 207 288 831 397 Total(b) 3,385 3,102 3,841 3,162
(a) Deferred tax assets in Mongolia include US$292 million (2019: US$130 million) from tax losses that expire if not recovered against taxable profits within eight years. Tax losses have been calculated in accordance with the tax stability provisions of the Oyu Tolgoi Investment Agreement and Mongolian laws. Recovery of the recognised deferred tax assets is expected to commence from 2021 based on projected cash flows, consistent with the latest life of mine plan described in note 6. The interpretation of the stabilised tax laws by the Mongolian Tax Authority has been, and is expected to continue to be, subject to dispute. Changes to agreements or their interpretation could have a material impact on the amount and period of recovery of deferred tax assets.
(b) US$720 million (2019: US$695 million) of the unrecognised assets relate to realised or unrealised capital losses, the recovery of which depends on the existence of capital gains in future years. There are time limits, the shortest of which is one year, for the recovery of US$551 million of the unrecognised assets (2019: US$491 million).
240 Annual Report 2020 | riotinto.com240 Annual Report 2020 | riotinto.com
Financial Statements
Notes to the 2020 Financial Statements

18 Receivables and other assets Non-current
2020 US$m
Current2020
US$m
Total2020
US$m
Non-current2019US$m
Current2019US$m
Total2019US$m
Trade receivables(a) 1 2,543 2,544 1 2,097 2,098 Other financial receivables(a) 339 332 671 286 453 739 Receivables relating to net investment in finance leases(a) 29 9 38 52 11 63 Amounts due from equity accounted units(a) — 33 33 — 38 38 Other receivables(b) 369 422 791 123 209 332 Prepayment of tolling charges to jointly controlled entities(c) 218 — 218 221 — 221 Pension surpluses (note 42) 782 — 782 984 — 984 Other prepayments 58 305 363 49 219 268 Total 1,796 3,644 5,440 1,716 3,027 4,743
(a) At 31 December 2020, trade and other financial receivables, receivables relating to net investment in finance leases and amounts due from equity accounted units are stated net of allowances for expected credit losses of US$59 million (2019: US$54 million).
(b) At 31 December 2020, other non-current receivables included US$315 million (2019: US$53 million) and other current receivables US$95 million (2019: US$nil) related to Energy Resources of Australia Ltd (ERA's) deposit held in a trust fund which is controlled by the Government of Australia. During 2020, ERA deposited US$299 million into the trust fund which is recorded in "Other investing cash flows" in the Group cash flow statement. ERA are entitled to reimbursement from the fund once specific phases of rehabilitation relating to the Ranger Project are completed. The fund is outside of the scope of IFRS 9 - "Financial Instruments" and therefore classified as an "other receivable" within "Receivables and other assets".
(c) These prepayments will be charged to Group operating costs as tolling services are rendered and product processing occurs.
There is no material element of receivables and other assets that is interest-bearing or financing in nature.
The fair value of current trade and other receivables and the majority of amounts classified as non-current trade and other receivables approximates to their carrying value.
19 Other financial assetsNon-current
2020 US$m
Current2020
US$m
Total2020
US$m
Non-current2019US$m
Current2019US$m
Total2019US$m
Derivative financial instruments 531 134 665 308 58 366 Equity shares and quoted funds 66 9 75 52 9 61 Other investments, including loans(a) 231 2,668 2,899 236 2,603 2,839 Loans to equity accounted units 1 40 41 39 — 39 Total 829 2,851 3,680 635 2,670 3,305
(a) Current “Other investments, including loans” includes US$2,538 million (2019: US$2,584 million) of highly liquid financial assets held in managed investment funds classified as held for trading.
Detailed information relating to other financial assets is given in note 29.
20 Cash and cash equivalents 2020
US$m2019US$m
Cash at bank and in hand 1,150 978 Money market funds, reverse repurchase agreements and other cash equivalents(a) 9,231 7,049 Balance per Group balance sheet and Group cash flow statement 10,381 8,027
(a) We continue to diversify the financial products we invest our surplus cash in. During the year, we purchased securities under resale agreements ("reverse repurchase agreements”). At 31 December 2020 we held US$1,200 million of reverse repurchase agreements, measured at amortised cost and reported within cash and cash equivalents as they are highly liquid products maturing within three months. We accepted collateral of investment grade quality in respect of these reverse repurchase agreements, with a fair value of US$1,260 million as at 31 December 2020. Collateral is not recognised on our balance sheet and in the event of counterparty's default we would be able to sell it.
Restricted cash and cash equivalent analysis Cash and cash equivalents of US$295 million (2019: US$315 million) are held in countries where there are restrictions on remittances. Of this balance, US$238 million (2019: US$245 million) could be used to repay subsidiaries’ third-party borrowings.
There are also restrictions on a further US$1,422 million (2019: US$1,644 million) of cash and cash equivalents, the majority of which is held by partially owned subsidiaries and is not available for use in the wider Group due to legal and contractual restrictions currently in place. Of this balance US$1,215 million (2019: US$1,442 million) could be used to repay subsidiaries’ third-party borrowings.
Annual Report 2020 | riotinto.com 241241Annual Report 2020 | riotinto.com
Financial Statements
Group balance sheet

21 Borrowings and other financial liabilities Borrowings at 31 December
Note
Non-current2020
US$m
Current2020
US$m
Total2020
US$m
Non-current2019
US$m
Current2019
US$m
Total2019
US$m
Rio Tinto Finance plc Euro Bonds 2.0% due 2020(a)(b)(c) — — — — 455 455 Rio Tinto Finance plc Euro Bonds 2.875% due 2024(a)(b) 555 — 555 508 — 508 Rio Tinto Finance (USA) Limited Bonds 3.75% 2025(a) 1,299 — 1,299 1,229 — 1,229 Rio Tinto Finance (USA) Limited Bonds 7.125% 2028(a) 1,005 — 1,005 958 — 958 Alcan Inc. Debentures 7.25% due 2028(a) 109 — 109 104 — 104 Rio Tinto Finance plc Sterling Bonds 4.0% due 2029(a)(b) 717 — 717 647 — 647 Alcan Inc. Debentures 7.25% due 2031(d) 438 — 438 419 — 419 Alcan Inc. Global Notes 6.125% due 2033(d) 744 — 744 742 — 742 Alcan Inc. Global Notes 5.75% due 2035(d) 292 — 292 289 — 289 Rio Tinto Finance (USA) Limited Bonds 5.2% 2040(a) 1,173 — 1,173 1,137 — 1,137 Rio Tinto Finance (USA) plc Bonds 4.75% 2042(a) 501 — 501 483 — 483 Rio Tinto Finance (USA) plc Bonds 4.125% 2042(a) 743 — 743 716 — 716 Oyu Tolgoi LLC MIGA Insured Loan LIBOR plus 2.65% due 2027(e) 674 4 678 676 3 679 Oyu Tolgoi LLC Commercial Banks "B Loan" LIBOR plus 3.4% due 2027(e) 1,571 10 1,581 1,581 8 1,589 Oyu Tolgoi LLC Export Credit Agencies Loan 2.3% due 2028(e) 275 2 277 273 3 276 Oyu Tolgoi LLC Export Credit Agencies Loan LIBOR plus 3.65% due 2029(e) 867 5 872 869 5 874 Oyu Tolgoi LLC International Financial Institutions "A Loan" LIBOR plus
3.78% due 2030(e) 771 6 777 771 4 775
Other secured loans 246 68 314 302 45 347 Other unsecured loans 322 256 578 382 197 579 Lease liabilities 22 945 233 1,178 1,007 302 1,309 Total borrowings including overdrafts(f) 13,247 584 13,831 13,093 1,022 14,115
(a) These borrowings are subject to hedging arrangements and are summarised in the interest rate risk section of note 29. (b) Rio Tinto has a US$10 billion (2019: US$10 billion) European Debt Issuance Programme against which the cumulative amount utilised was US$1.2 billion equivalent at 31 December 2020 (2019:
US$1.6 billion). The carrying value of these bonds after hedge accounting adjustments amounted to US$1.3 billion (2019: US$1.6 billion) in aggregate. (c) On 11 May 2020, we repaid our €402 million (nominal value) Rio Tinto Finance plc Euro Bonds on their maturity. The cash outflow relating to the repayment of the bonds and the realised loss on the
derivatives have been recognised within "Repayment of borrowings and associated derivatives" in the Group cash flow statement and totalled US$526 million. (d) In 2020 we entered into new swaps to convert the interest payable in relation to these bonds from fixed to floating rates. Refer to Note 29 for more details.(e) These borrowings relate to the Oyu Tolgoi LLC project finance facility. The project finance facility provides for interest-only payments for the first five years from 2016 followed by minimum
repayments according to a stepped amortisation schedule for the remaining life of the facility. The due dates stated represent the final repayment date. The interest rates stated are pre-completion and will increase by 1% post-completion.
(f) The Group’s borrowings of US$13.8 billion (2019: US$14.1 billion) include US$4.5 billion (2019: US$4.5 billion) of subsidiary entity borrowings that are subject to various financial and general covenants with which the respective borrowers were in compliance as at 31 December 2020.
Other financial liabilities Non-current
2020 US$m
Current2020
US$m
Total2020
US$m
Non-current2019
US$m
Current2019
US$m
Total2019
US$m
Derivative financial instruments 161 23 184 248 103 351 Other financial liabilities(a) — — — — 247 247 Total other financial liabilities 161 23 184 248 350 598 Total borrowings including overdrafts (as above) 13,247 584 13,831 13,093 1,022 14,115 Total borrowings and other financial liabilities 13,408 607 14,015 13,341 1,372 14,713
(a) At 31 December 2019, other financial liabilities included US$207 million in relation to the share buy-back programme, which was completed in February 2020.
22 Leases Lessee arrangements We have made the following payments associated with leases:
Description of payment2020
US$m2019
US$m Included within
Principal lease payments 324 315 Cash flows from financing activitiesInterest payments on leases 50 53 Cash flows from operating activitiesPayments for short-term leases 314 327 Net operating costsPayments for variable lease components 30 15 Net operating costsPayments for low value leases (>12 months in duration) 1 1 Net operating costsTotal lease payments 719 711
242 Annual Report 2020 | riotinto.com242 Annual Report 2020 | riotinto.com
Financial Statements
Notes to the 2020 Financial Statements

22 Leases continuedLease liabilities The maturity profile of lease liabilities recognised at the balance sheet date is:
Note2020
US$m2019
US$m
Lease liabilitiesDue within 1 year 271 349 Between 1 and 3 years 386 424 Between 3 and 5 years 185 226 More than 5 years 724 671 Total undiscounted cash payments expected to be made 1,566 1,670 Effect of discounting (388) (361) Present value of minimum lease payments 21 1,178 1,309
At 31 December 2020, commitments for leases not yet commenced were US$125 million (2019: US$119 million); commitments relating to short-term leases which had already commenced at 31 December 2020 were US$155 million (2019: US$108 million). Short-term and low value leases are not recognised on the balance sheet as a lease liability and are expensed as incurred.
23 Consolidated net (debt)/cashFinancing liabilities Other assets
Year ended 31 December 2020
Borrowingsexcluding
overdrafts(a)
US$m
Lease liabilities(b)
US$m
Debt-related derivatives
(included in Other financial
assets/liabilities)(c)
US$m
Cash and cash equivalents(d)
US$m
Other investments(e)
US$m
Net debt
US$m
Analysis of changes in consolidated net debtOpening balance (12,806) (1,309) (147) 8,027 2,584 (3,651) Foreign exchange adjustment (83) (47) 39 165 — 74 Cash movements excluding exchange movements 505 324 91 2,189 (58) 3,051 Other non-cash movements (269) (146) 265 — 12 (138) Closing balance (12,653) (1,178) 248 10,381 2,538 (664)
Year ended 31 December 2019
Financing liabilities Other assets
Borrowings excluding
overdrafts(a)
US$m
Lease liabilities(b)
US$m
Debt-related derivatives
(included in Other financial
assets/ liabilities)(c)
US$m
Cash and cash equivalents(d)
US$m
Other investments(e)
US$m
Net (debt)/cash
US$m
Analysis of changes in consolidated net (debt)/cashOpening balance (12,707) (44) (288) 10,772 2,522 255 Adjustment for transition to new accounting standard(f) — (1,248) — — — (1,248) Foreign exchange adjustment (5) (9) 3 (54) — (65) Cash movements excluding exchange movements 123 315 — (2,808) 28 (2,342) Other non-cash movements (217) (323) 138 117 34 (251) Closing balance (12,806) (1,309) (147) 8,027 2,584 (3,651)
(a) Borrowings excluding overdrafts and including lease liabilities at 31 December 2020 of US$13,831 million (2019: US$14,115 million) differ from total borrowings and other financial liabilities of US$14,015 million (2019: US$14,713 million) on the balance sheet as they exclude other current financial liabilities of US$23 million (2019: US$350 million) and other non-current financial liabilities of US$161 million (2019: US$248 million).
(b) Other movements in lease liabilities include the net impact of additions, modifications and terminations during the year.(c) Included within "Debt-related derivatives" are interest rate and cross currency interest rate swaps that are in hedge relationships with the Group's debt. (d) Other non-cash movements in the year ended 31 December 2019 of US$117 million represents the elimination of cash movements during the year in respect of assets held for sale which are
included in the cash flow statement.(e) Other investments comprise US$2,538 million (2019: US$2,584 million) of highly liquid financial assets held in managed investment funds classified as held for trading. (f) The impact of the transition to new accounting pronouncement IFRS 16 “Leases” on 1 January 2019. Further information relating to the currency and interest rate exposures arising from net debt and related derivatives is given in note 29.
Annual Report 2020 | riotinto.com 243243Annual Report 2020 | riotinto.com
Financial Statements
Group balance sheet

24 Trade and other payables Non-current
2020 US$m
Current2020
US$m
Total2020
US$m
Non-current2019US$m
Current2019US$m
Total2019US$m
Trade payables 1 3,124 3,125 — 2,855 2,855 Other financial payables 298 862 1,160 272 668 940 Other payables 97 115 212 110 97 207 Deferred income(a) 133 344 477 143 200 343 Accruals 27 1,294 1,321 27 1,305 1,332 Employee entitlements — 762 762 — 650 650 Royalties and mining taxes 3 863 866 4 596 600 Amounts owed to equity accounted units 190 51 241 167 104 271 Government grants deferred 71 6 77 71 5 76 Total 820 7,421 8,241 794 6,480 7,274
(a) Deferred income includes contract liabilities of US$338 million (2019: US$158 million).
The fair value of trade payables and financial instruments within other payables approximates their carrying value.
25 Provisions (including post-retirement benefits)
Note
Pensionsand
post-retirement
healthcare(a)
US$m
Other employee
entitlements(b)
US$m
Close-downand
restoration/environmental
(c)
US$mOther US$m
Total2020
US$m
Total2019US$m
At 1 January 2,714 354 11,090 945 15,103 13,608 Adjustment to opening balance on transition to new accounting
standard(d) — — — — — (66)
Restated opening balance 2,714 354 11,090 945 15,103 13,542 Adjustment on currency translation 83 34 736 37 890 65 Adjustments to mining properties/right of use assets: 14 – increases to existing and new provisions — — 130 11 141 840 – change in discount rate — — 816 — 816 —
Charged/(credited) to profit:– increases to existing and new provisions 200 127 562 185 1,074 850 – change in discount rate — — 138 2 140 — – unused amounts reversed — (19) (123) (157) (299) (100) – exchange losses on provisions — — (21) (1) (22) 3 – amortisation of discount — — 373 4 377 387
Utilised in year (192) (77) (366) (139) (774) (744) Actuarial losses recognised in equity 250 — — — 250 235 Transfers and other movements — — — (31) (31) 25 At 31 December 3,055 419 13,335 856 17,665 15,103 Balance sheet analysis:Current 70 327 777 555 1,729 1,399 Non-current 2,985 92 12,558 301 15,936 13,704 Total 3,055 419 13,335 856 17,665 15,103
Projected cash spend for the undiscounted close-down and restoration/environmental clean up provision
Undiscounted close-down and environmental restoration cash flows<1yr
US$m1-3 yrs
US$m3-5 yrs
US$m> 5 yrsUS$m
TotalUS$m
At 31 December 2020 776 1,203 1,433 13,988 17,400 At 31 December 2019 541 955 1,100 13,470 16,066
(a) The main assumptions used to determine the provision for pensions and post-retirement healthcare, and other information, including the expected level of future funding payments in respect of those arrangements, are given in note 42.
(b) The provision for other employee entitlements includes a provision for long service leave of US$283 million (2019: US$248 million), based on the relevant entitlements in certain Group operations and includes US$62 million (2019: US$30 million) of provision for redundancy and severance payments.
(c) The Group’s policy on close-down and restoration costs is described in note 1(l) and in paragraph (iii) under “Critical accounting policies and estimates” on page 219. Close-down and restoration costs are a normal consequence of mining, and the majority of close-down and restoration expenditure is incurred in the years following closure of the mine, refinery or smelter. Non-current provisions for close-down and restoration/environmental expenditure include amounts relating to environmental clean-up of US$468 million (2019: US$382 million) expected to take place between one and five years from the balance sheet date, and US$937 million (2019: US$883 million) expected to take place later than five years after the balance sheet date. Close-down and restoration/environmental liabilities at 31 December 2020 have not been adjusted for closure related receivables amounting to US$574 million (31 December 2019: US$166 million) due from the ERA trust fund, the co-owners of the Diavik Joint Venture and other financial assets held for the purposes of meeting closure obligations.
(d) Impact of the transition to new accounting pronouncement IFRS 16 “Leases” on 1 January 2019.
244 Annual Report 2020 | riotinto.com244 Annual Report 2020 | riotinto.com
Financial Statements
Notes to the 2020 Financial Statements

25 Provisions (including post-retirement benefits) continuedAnalysis of close-down and restoration/environmental clean up provisions
As at 31 December2020
US$m2019US$m
Undiscounted close-down and environmental restoration obligations 17,400 16,066 Impact of discounting (4,065) (4,976) Present closure obligation 13,335 11,090 Attributable to:Operating sites 10,736 9,255 Non-operating sites 2,599 1,835 Total 13,335 11,090
Remaining lives of operations and infrastructure range from one to over 50 years with an average for all sites, weighted by present closure obligation, of around 17 years (2019: 18 years). Although the ultimate cost to be incurred is uncertain, the Group’s businesses estimate their respective costs based on current restoration standards, techniques and expected climate conditions.
Provisions of US$13,335 million (2019: US$11,090 million) for close-down and restoration costs and environmental clean-up obligations are based on risk-adjusted cash flows. The Group completed a review of the discount rate used to present value the obligations on 30 September 2020 and updated it to a real-rate of 1.5%, applied prospectively from that date. Prior to 30 September 2020 and in recent years, the close-down and restoration costs and environmental clean-up obligations were discounted at a real-rate of 2.0%. To illustrate the sensitivity of the provision to discounting, if the discount rate at 31 December 2020 was decreased to 1.0% then the provision would be US$1.3 billion higher, of which approximately US$1.2 billion would be capitalised within "Property, plant and equipment" at operating sites and US$0.1 billion would be charged to the income statement for non-operating and fully impaired sites. If the discount rate was increased to 3.0% then the provision would be US$2.6 billion lower, of which approximately US$2.4 billion would result in a decrease within "Property, plant and equipment" at operating sites and US$0.2 billion would be credited to the income statement for non-operating and fully impaired sites.
Closure cost composition as at 31 December2020
US$m2019US$m
Decommissioning, decontamination and demolition 3,131 2,066 Closure and rehabilitation earthworks (a) 4,223 3,889 Long-term water management costs (b) 966 920 Post closure monitoring and maintenance 1,318 855 Indirect costs, owners' costs and contingency (c) 3,697 3,360 Total 13,335 11,090
The underlying costs for closure have been estimated with varying degrees of accuracy based on a function of the age of the underlying asset and proximity to closure. For assets within ten years of closure, closure plans and cost estimates are supported by detailed studies which are refined as the closure date approaches. These closure studies consider climate change and plan for resilience to expected climate conditions with a particular focus on precipitation rates. For new developments, consideration of climate change and ultimate closure conditions are an important part of the approval process. For longer-lived assets, closure provisions are typically based on conceptual level studies that are refreshed at least every five years; these are evolving to incorporate greater consideration of forecast climate conditions at closure.
(a) A key component of earthworks rehabilitation involves re-landscaping the area disturbed by mining activities utilising the largely diesel powered heavy mobile equipment. In developing low-carbon solutions for our mobile fleet, this may include electrification of the vehicles during the mine life. The forecast cash flows for the heavy mobile equipment in the closure cost estimate are based on existing fuel sources; these could reduce if this power is sourced from renewable energy.
(b) Long-term water management relates to the post-closure treatment of water due to acid rock drainage and other environmental commitments and is an area of research and development focus for our Closure team. The cost of this water processing can continue for many years after the bulk earthworks and demolition activities have completed and are therefore exposed to long-term climate change. This could materially affect rates of precipitation and therefore change the volume of water requiring processing. It is not currently possible to forecast accurately the impact this could have on the closure provision as some of our locations could experience drier conditions whereas others could experience greater rainfall. A further consideration relates to the alternative commercial use for the processed water which could support ultimate transfer of these costs to a third party.
(c) Indirect costs, owners' costs and contingency include adjustments to the underlying cash flows to align the closure provision with a central-case estimate. This excludes allowances for quantitative estimation uncertainties which are allocated to the underlying cost driver and presented within the respective cost categories above.
Geographic composition as at 31 December2020
US$m2019US$m
Australia 7,076 5,610 USA 3,819 3,377 Canada 1,482 1,267 Rest of World 958 836 Total 13,335 11,090
The geographic composition of the closure provision shows that our closure obligations are largely in countries with established levels of regulation in respect of mine and site closure.
Annual Report 2020 | riotinto.com 245245Annual Report 2020 | riotinto.com
Financial Statements
Group balance sheet
26 Share capital – Rio Tinto plc 2020
Number(million)
2019Number(million)
2018Number(million)
2020 US$m
2019US$m
2018US$m
Issued and fully paid up share capital of 10p eachAt 1 January 1,259.345 1,287.660 1,351.609 207 211 220 Ordinary shares issued(a)(c) 0.039 0.041 0.035 — — — Shares purchased and cancelled(b) (3.628) (28.356) (63.984) — (4) (9) At 31 December 1,255.756 1,259.345 1,287.660 207 207 211 Shares held by publicAt 1 January 1,249.924 1,278.215 1,342.058 Shares reissued from treasury(a) 0.569 0.024 0.106 Ordinary shares issued(a)(c) 0.039 0.041 0.035 Shares purchased and cancelled(b) (3.628) (28.356) (63.984) At 31 December 1,246.904 1,249.924 1,278.215 Shares held in treasury 8.852 9.421 9.445 Shares held by public 1,246.904 1,249.924 1,278.215 Total share capital 1,255.756 1,259.345 1,287.660 Other share classesSpecial Voting Share of 10p each(d) 1 only 1 only 1 onlyDLC Dividend Share of 10p each(d) 1 only 1 only 1 onlyEqualisation Share of 10p each(d) 1 only 1 only 1 only
(a) 39,273 ordinary shares were issued in 2020 under the Global Employee Share Plan (GESP). 568,863 ordinary shares were reissued from treasury during the year resulting from the vesting of awards under Rio Tinto plc employee share-based payment plans, with market values between £32.74 and £56.32 per share (2019: 40,974 ordinary shares were issued under the GESP and 23,659 ordinary shares were reissued from treasury with exercise prices and market values between £36.33 and £49.74 per share; 2018: 35,380 ordinary shares were issued under the GESP and 106,045 ordinary shares reissued from treasury with exercise prices and market values between £16.53 and £43.79 per share).
(b) The authority for the company to buy back its ordinary shares was renewed at the 2020 annual general meeting. 3,627,568 shares were bought back and cancelled in 2020 under the on-market buy-back programme. 28,356,034 shares were bought back and cancelled in 2019 under the on-market buy-back programme. 63,984,287 shares were bought back in 2018 under the on-market buy-back programme.
(c) The aggregate consideration for new shares issued under the GESP was US$1.3 million (2019: US$1.1 million; 2018: US$1.0 million). The difference between the nominal value and the issue price of the shares issued was credited to the share premium account. The aggregate consideration received for treasury shares reissued was US$1 million (2019: US$1 million; 2018: US$6 million). No new shares were issued as a result of the exercise of options under Rio Tinto plc employee share-based payment plans in 2020, 2019 and 2018.
(d) The “Special Voting Share” was issued to facilitate the joint voting by shareholders of Rio Tinto plc and Rio Tinto Limited on Joint Decisions, following the DLC Merger. The “DLC Dividend Share” was issued to facilitate the efficient management of funds within the DLC structure. Directors have the ability to issue an Equalisation Share if that is required under the terms of the DLC Merger Sharing Agreement.
During 2020, US$31 million of shares and ADRs (2019: US$43 million; 2018: US$140 million) were purchased by employee share ownership trusts on behalf of Rio Tinto plc to satisfy employee share awards on vesting. At 31 December 2020, 273,902 shares and 41,240 ADRs were held in the employee share ownership trusts on behalf of Rio Tinto plc.
Information relating to share-based incentive schemes is given in note 41.
27 Share capital – Rio Tinto Limited 2020
Number(million)
2019Number(million)
2018Number(million)
2020 US$m
2019US$m
2018US$m
Issued and fully paid up share capitalAt 1 January 371.21 371.21 412.41 3,448 3,477 4,140 Adjustment on currency translation 333 (29) (382) Ordinary shares purchased and cancelled(a) — — (41.20) — — (281) At 31 December 371.21 371.21 371.21 3,781 3,448 3,477 – Special Voting Share(b) 1 only 1 only 1 only– DLC Dividend Share(c) 1 only 1 only 1 onlyTotal share capital 371.21 371.21 371.21
(a) In November 2018, 41,198,134 Rio Tinto Limited ordinary shares were purchased at A$69.69 per share and cancelled under an off-market share buy-back programme carried out pursuant to the shareholder approval granted at Rio Tinto Limited’s 2018 annual general meeting for off-market and on-market buy-backs of up to 41.2 million Rio Tinto Limited ordinary shares.
(b) The “Special Voting Share” was issued to facilitate the joint voting by shareholders of Rio Tinto Limited and Rio Tinto plc on Joint Decisions following the DLC Merger. The “DLC Dividend Share” was issued to facilitate the efficient management of funds within the DLC structure. Directors have the ability to issue an Equalisation Share if that is required under the terms of the DLC Merger Sharing Agreement.
During 2020, US$76 million of shares (2019: US$63 million; 2018: US$114 million) were purchased by employee share ownership trusts on behalf of Rio Tinto Limited to satisfy employee share awards on vesting. At 31 December 2020, 828,338 shares were held in the employee share ownership trusts on behalf of Rio Tinto Limited.
Information relating to share-based incentive schemes is given in note 41.
246 Annual Report 2020 | riotinto.com246 Annual Report 2020 | riotinto.com
Financial Statements
Notes to the 2020 Financial Statements

28 Other reserves and retained earnings 2020
US$m2019US$m
2018US$m
Capital redemption reserve(a)
At 1 January 51 47 38 Own shares purchased and cancelled — 4 9 At 31 December 51 51 47 Cash flow hedge reserveAt 1 January 160 195 32 Adjustment for transition to new accounting pronouncements(b) — — (4) Cash flow hedge gains 24 12 156 Cash flow hedge (gains)/losses transferred to the income statement (63) (41) 40 Tax on the above 3 (6) (54) Transfers and other movements — — 25 At 31 December 124 160 195 Available for sale revaluation reservesAt 1 January — — 20 Adjustment for transition to new accounting pronouncements(b) — — (20) Gains on available for sale securities — — — Losses on available for sale securities transferred to the income statement — — — Tax on the above — — — Transfers and other movements — — — At 31 December — — — Fair value through other comprehensive income reserveAt 1 January (11) (6) — Adjustment for transition to new accounting pronouncements(b) — — 8 Losses on equity investments 9 (5) (11) Transfers to retained earnings — — (3) At 31 December (2) (11) (6) Cost of hedging reserveAt 1 January (10) (13) — Adjustment for transition to new accounting pronouncements(b) — — 26 Cost of hedging deferred to reserves during the year 7 3 (36) Transfer of cost of hedging to the income statement — — (3) At 31 December (3) (10) (13) Other reserves(c)
At 1 January 11,643 11,650 11,714 Own shares purchased from Rio Tinto Limited shareholders to satisfy share options (76) (63) (114) Employee share options: value of services 60 52 52 Deferred tax on share options 1 4 (2) At 31 December 11,628 11,643 11,650 Foreign currency translation reserve(d)
At 1 January (2,656) (3,212) 480 Parent and subsidiaries' currency translation and exchange adjustments 2,814 331 (3,658) Equity accounted units currency translation adjustments 4 10 (48) Currency translation reclassified on disposal — 215 14 At 31 December 162 (2,656) (3,212)
Total other reserves per balance sheet 11,960 9,177 8,661
Annual Report 2020 | riotinto.com 247247Annual Report 2020 | riotinto.com
Financial Statements
Capital and reserves

28 Other reserves and retained earnings continued
2020 US$m
2019US$m
2018US$m
Retained earnings(e)
At 1 January 23,387 27,025 23,761 Adjustment for transition to new accounting pronouncements(b) — (113) (179) Parent and subsidiaries' profit for the year 9,456 7,709 13,125 Equity accounted units' profit after tax for the year 313 301 513 Actuarial (losses)/gains(f) (482) (259) 894 Tax relating to components of other comprehensive income 116 81 (269) Total comprehensive income for the year 9,403 7,832 14,263 Share buy-back programme (1) (1,135) (5,423) Dividends paid (6,132) (10,334) (5,356) Change in equity interest held by Rio Tinto 84 85 60 Own shares purchased/treasury shares reissued for share options and other movements (31) (43) (140) Employee share options and other IFRS 2 charges taken to the income statement 82 70 61 Transfer from FVOCI reserve — — 3 Transfers and other movements — — (25) At 31 December 26,792 23,387 27,025
(a) The capital redemption reserve was set up to comply with section 733 of the UK Companies Act 2006 (previously section 170 of the UK Companies Act 1985) when shares of a company are redeemed or purchased wholly out of the company’s profits. Balances reflect the amount by which the company’s issued share capital is diminished in accordance with this section.
(b) The impact of the transition to new accounting pronouncements; IFRS 16 “Leases” and IFRIC 23 "Uncertainty over income tax treatments" on 1 January 2019 and IFRS 9 “Financial Instruments” and IFRS 15 "Revenue from Contracts with Customers" on 1 January 2018.
(c) Other reserves includes US$11,936 million which represents the difference between the nominal value and issue price of the shares issued arising from Rio Tinto plc’s rights issue completed in July 2009. No share premium was recorded in the Rio Tinto plc financial statements through the operation of the merger relief provisions of the UK Companies Act 1985. Other reserves also include the cumulative amount recognised under IFRS 2 in respect of options granted but not exercised to acquire shares in Rio Tinto Limited, less, where applicable, the cost of shares purchased to satisfy share options exercised. The cumulative amount recognised under IFRS 2 in respect of options granted but not exercised to acquire shares in Rio Tinto plc is recorded in retained earnings.
(d) Exchange differences arising on the translation of the Group’s net investment in foreign controlled companies are taken to the foreign currency translation reserve, as described in note 1(d). The cumulative differences relating to an investment are transferred to the income statement when the investment is disposed of.
(e) Retained earnings and movements in reserves of subsidiaries include those arising from the Group’s share of joint operations. (f) There were US$11 million actuarial losses relating to equity accounted units in 2020 (31 December 2019: US$7 million; 31 December 2018: US$nil).
248 Annual Report 2020 | riotinto.com248 Annual Report 2020 | riotinto.com
Financial Statements
Notes to the 2020 Financial Statements

29 Financial instruments and risk management In this note, except where stated, the information relates to the financial instruments of the parent companies and their subsidiaries and joint operations, and excludes those of equity accounted units. We have grouped the information in the following sections:
A – Financial assets and liabilities by categories B – Derivative financial instruments C – Fair values
A (a) Financial assets and liabilities by categories
At 31 December 2020 NoteTotal
US$m
Amortisedcost
US$m
Fair value through other
comprehensiveincome
US$m
Fair valuethrough
profit andloss
US$m
Financial assetsCash and cash equivalents 20 10,381 3,970 — 6,411 Trade and other financial receivables(a)(b) 18 3,286 1,479 — 1,807 Equity shares and quoted funds 19 75 — 64 11 Other investments, including loans(c) 19 2,899 138 — 2,761 Derivatives related to net debt: designated as hedges(d) 19, 23 388 — — 388 Derivatives and embedded derivatives not related to net debt: not designated as hedges(d) 19 204 — — 204 Embedded derivatives not related to net debt: designated as hedges(d) 19 73 — — 73 Loans to equity accounted units including quasi equity loans 153 153 — — Total financial assets 17,459 5,740 64 11,655
Financial liabilitiesTrade and other financial payables(e) 24 (5,847) (5,817) (30) Short-term borrowings and bank overdrafts 21 (584) (584) — Medium-term and long-term borrowings 21 (13,247) (13,247) — Derivatives related to net debt: designated as hedges(d) 21, 23 (140) — (140) Derivatives and embedded derivatives not related to net debt: not designated as hedges(d) 21 (24) — (24) Embedded derivatives not related to net debt: designated as hedges(d) 21 (20) — (20) Other financial liabilities 21 — — — Total financial liabilities (19,862) (19,648) (214)
At 31 December 2019 NoteTotal
US$m
Amortisedcost
US$m
Fair valuethrough other
comprehensiveincome
US$m
Fair valuethrough
profit andloss
US$m
Financial assetsCash and cash equivalents 20 8,027 2,707 — 5,320 Trade and other financial receivables(a)(b) 18 2,938 1,801 — 1,137 Equity shares and quoted funds 19 61 — 50 11 Other investments, including loans(c) 19 2,839 21 — 2,818 Derivatives related to net debt: designated as hedges(d) 19, 23 151 — — 151 Derivatives and embedded derivatives not related to net debt: not designated as hedges(d) 19 149 — — 149 Embedded derivatives not related to net debt: designated as hedges(d) 19 66 — — 66 Loans to equity accounted units including quasi equity loans 152 152 — — Total financial assets 14,383 4,681 50 9,652
Financial liabilitiesTrade and other financial payables(e) 24 (5,398) (5,341) (57) Short-term borrowings and bank overdrafts 21 (1,022) (1,022) — Medium-term and long-term borrowings 21 (13,093) (13,093) — Derivatives related to net debt: designated as hedges(d) 21, 23 (298) — (298) Derivatives and embedded derivatives not related to net debt: not designated as hedges(d) 21 (29) — (29) Embedded derivatives not related to net debt: designated as hedges(d) 21 (24) — (24) Other financial liabilities 21 (247) (247) — Total financial liabilities (20,111) (19,703) (408)
(a) Trade and other financial receivables comprise trade receivables, other financial receivables, receivables relating to net investments in finance leases and amounts due from equity accounted units within note 18.
(b) Provisionally priced receivables are fair valued. (c) Other investments, including loans, include US$2,538 million (2019: US$2,584 million) of highly liquid financial assets in managed investment funds classified as held for trading. (d) These financial assets and liabilities in aggregate agree to the total derivative financial instruments disclosed in notes 19 and 21. (e) Trade and other financial payables comprise trade payables, other financial payables, accruals and amounts due to equity accounted units within note 24. The trade and other payables held at fair
value are valued using Level 2 inputs.
Annual Report 2020 | riotinto.com 249249Annual Report 2020 | riotinto.com
Financial Statements
Additional disclosures

29 Financial instruments and risk management continuedA (b) Financial risk management Objectives and policy Our financial risk management objectives are:
– to have in place a robust capital structure to manage the organisation through the commodity cycle; and
– to allow our financial exposures to float with the market.
Any exceptions to these require formal approval by the Board.
The Group operates a floating prices and rates policy for the management of our key economic exposure to commodity price, foreign exchange and interest rates risks. We do not seek to hedge this floating exposure and will re-float, where possible, any material price or rates that are fixed. Where this is impossible (or sub-optimal) any non-floating price risks are managed within defined market risk tolerances. Derivatives are used as and when required in order to manage our exposure in accordance with this underlying financial risk management principle.
In the paragraphs below, we summarise the risks that we are exposed to, and outline how our Treasury and Commercial teams manage these risks in accordance with agreed policies. These teams operate under a strong control environment, within approved limits. Our Board reviews and approves limits at least annually.
(i) Capital and liquidity risk Our overriding objective when managing capital and liquidity is to safeguard the business as a going concern. Capital is allocated in a consistent and disciplined manner, prioritising sustaining capital expenditure, followed by the ordinary dividend and then an iterative allocation between investing in compelling growth opportunities, maintaining balance sheet strength and delivering further returns to shareholders.
Our Board and senior management regularly review the capital structure and liquidity of the Group. They take into account our strategic priorities, the economic and business conditions, and any identified investment opportunities, along with the expected returns to shareholders. We expect total cash returns to shareholders over the longer term to be in a range of 40–60% of underlying earnings in aggregate through the commodity cycle.
We consider various financial metrics when managing our risk, including net debt, gearing, the overall level of borrowings and their maturity profile, liquidity levels, total capital, future cash flows, underlying EBITDA and interest cover ratios.
Our total capital as at 31 December was:
Total capital Note2020
US$m2019
US$m
Equity attributable to owners of Rio Tinto (see Group balance sheet) 47,054 40,532 Equity attributable to non-controlling interests (see Group balance sheet) 4,849 4,710 Net debt 23 664 3,651 Total capital 52,567 48,893
Our net debt decreased to US$0.7 billion at 31 December 2020 from US$3.7 billion at 31 December 2019. This was driven by operating cash inflows, partially offset by capital expenditure and cash returns to shareholders during the year. At 31 December 2020 net gearing was 1% (2019: 7%) and interest cover was 39 times (2019: 28 times).
We have access to various forms of financing including our US Shelf Programme, European Debt Issuance Programme, Commercial Paper and credit facilities. We did not issue any debt in 2020 or 2019 under these programmes.
We have US$7.5 billion fully committed Revolving Credit Facilities, which were extended in 2020 to November 2023 and remained undrawn throughout the year. The funds available can be used for general corporate purposes. Advances under these revolving facilities bear an interest rate per annum based on LIBOR (or EURIBOR, CDOR or BBSW in relation to any euro, Canadian dollar or Australian dollar loans respectively) plus a margin (which is dependent on our long-term credit rating as determined by Moody’s and Standard & Poor’s and the level of drawdown). The facility agreements contain no financial covenants.
Our credit ratings, as provided by Standard & Poor’s and Moody’s investor services, as at 31 December were:
2020 2019
Long-term rating A/A2 A/A2Short-term rating A-1/P-1 A-1/P-1Outlook Stable/Stable Stable/Stable
Our unified credit status is maintained through cross guarantees, which mean the contractual obligations of Rio Tinto plc and Rio Tinto Limited are automatically guaranteed by the other.
250 Annual Report 2020 | riotinto.com250 Annual Report 2020 | riotinto.com
Financial Statements
Notes to the 2020 Financial Statements

In the table below, we summarise the maturity profile of our financial liabilities based on contractual undiscounted payments, which will therefore not necessarily agree with the amounts disclosed in the balance sheet.
Financial liability analysis
At 31 December 2020(Outflows)/Inflows
Within 1year or on
demandUS$m
Between1 and 2
yearsUS$m
Between2 and 3
yearsUS$m
Between3 and 4
yearsUS$m
Between4 and 5
yearsUS$m
After5 years
US$mTotal
US$m
Non-derivative financial liabilitiesTrade and other financial payables(a) (5,251) (53) (15) (34) (19) (394) (5,766) Expected lease liability payments (271) (231) (155) (101) (84) (724) (1,566) Borrowings before swaps (351) (667) (743) (1,256) (1,892) (7,477) (12,386) Expected future interest payments(a) (525) (522) (495) (469) (427) (2,999) (5,437)
Derivative financial liabilities(b)
Derivatives related to net debt – net settled — — — — — — — Derivatives related to net debt – gross settled(a):
– gross inflows 27 27 27 27 27 790 925 – gross outflows (34) (34) (34) (34) (34) (943) (1,113)
Derivatives not related to net debt – net settled (20) (7) (2) (2) (2) (9) (42) Derivatives not related to net debt – gross settled:
– gross inflows 290 — — — — — 290 – gross outflows (291) — — — — — (291)
Total (6,426) (1,487) (1,417) (1,869) (2,431) (11,756) (25,386)
At 31 December 2019(Outflows)/Inflows
Within 1year or on
demandUS$m
Between1 and 2
yearsUS$m
Between2 and 3
yearsUS$m
Between3 and 4
yearsUS$m
Between4 and 5
yearsUS$m
After5 years
US$mTotal
US$m
Non-derivative financial liabilitiesTrade and other financial payables(a) (4,841) (45) (12) (14) (15) (380) (5,307) Expected lease liability payments (349) (267) (157) (133) (93) (671) (1,670)
Borrowings before swaps (723) (171) (665) (741) (1,209) (9,320) (12,829) Expected future interest payments(a) (607) (594) (590) (551) (514) (3,518) (6,374) Other financial liabilities (247) — — — — — (247) Derivative financial liabilities(b)
Derivatives related to net debt – net settled (16) (16) (16) 9 (3) 3 (39) Derivatives related to net debt – gross settled(a):– gross inflows 495 40 40 40 507 788 1,910 – gross outflows (588) (53) (53) (53) (599) (977) (2,323)
Derivatives not related to net debt – net settled (31) — — (2) (4) (23) (60) Derivatives not related to net debt – gross settled:– gross inflows 699 — — — — — 699 – gross outflows (703) — — — — — (703)
Total (6,911) (1,106) (1,453) (1,445) (1,930) (14,098) (26,943)
(a) The interest payable at year end was removed from trade and other financial payables and is shown within expected future interest payments. Interest payments have been projected using interest rates applicable at the end of the applicable financial year. Where debt is subject to variable interest rates, future interest payments are subject to change in line with market rates.
(b) The maturity grouping is based on the earliest payment date.
Offsetting and enforceable master netting agreements When we have a legally enforceable right to offset our financial assets and liabilities and an intention to settle on a net basis, or realise the asset and settle the liability simultaneously, we report the net amount in the consolidated balance sheet. Agreements with derivative counterparties are based on the International Swaps and Derivatives Association master netting agreements that do not meet the criteria for offsetting, but allow for the related amounts to be set-off in certain circumstances. During the year, there were no material amounts offset in the balance sheet.
(ii) Commodity price risk Our broad commodity base means our exposure to commodity prices is diversified. Our normal policy is to sell our products at prevailing market prices. Exceptions to this rule are subject to strict limits laid down by the Board, and to defined market risk tolerances and internal controls.
We sell our products to customers under contracts which vary in tenure and pricing mechanisms, including some volumes sold in the spot market. Sales revenue may be subject to adjustment if product specifications do not conform to the terms specified in a sales contract.
Pricing for iron ore is on a range of terms, the majority being either monthly or quarterly average pricing mechanisms. We sell a smaller proportion of iron ore volumes on the spot market.
Annual Report 2020 | riotinto.com 251251Annual Report 2020 | riotinto.com
Financial Statements
Additional disclosures

29 Financial instruments and risk management continued(ii) Commodity price risk (continued) We generally sell copper and aluminium under contracts which vary in tenure and pricing mechanisms, with some volumes sold in the spot market. The prices are determined by reference to prevailing market prices on terminal markets, such as the London Metal Exchange (LME) and the Commodities Exchange (COMEX) in New York. Prices fluctuate widely in response to changing levels of supply and demand but, in the long run, prices are related to the marginal cost of supply. Gold is also priced in an active market in which prices respond to daily changes in quantities offered and sought. Newly mined gold is only one source of supply; investment and disinvestment can be important elements of supply and demand.
At the date revenue is recognised, certain of our products are provisionally priced, based on the amount we expect to receive in the future. After initial recognition of revenue, we record any change in revenue relating to market prices separately in "Other revenue" (refer to note 3). Substantially all iron ore and aluminium sales are reflected at final prices at each reporting period. Final prices for copper concentrate, however, are normally determined between 30 and 180 days after delivery to our customer.
At 31 December 2020, we had 261 million pounds of copper sales, including share of equity accounted unit (31 December 2019: 220 million pounds), that were provisionally priced at US 336 cents per pound (2019: US 271 cents per pound). The final price of these sales will be determined during the first half of 2021. A 10% change in the price of copper realised on the provisionally priced sales, all other factors held constant, would increase or reduce net earnings by US$58 million (2019: US$38 million).
For some products, particularly aluminium, we are also exposed to fluctuations in power prices.
Hedging strategy We do not generally consider that using derivatives to fix commodity prices would provide a long-term benefit to our shareholders. However, for certain physical commodity transactions for which the price was fixed at the contract date, we enter into derivatives to achieve the prevailing market prices at the point of revenue recognition.
To mitigate our exposure to changes in the relationship between aluminium prices and power prices, we have a number of electricity purchase contracts which are directly linked to the daily official LME cash ask price for high grade aluminium (“LME price”) and to the US Midwest Transaction Premium (“Midwest premium”).
In accordance with IFRS 9, we apply hedge accounting to two embedded derivatives within our power contracts. The embedded derivatives (notional aluminium forward sales) have been designated as the hedging instrument. The forecasted aluminium sales, priced using the LME price and the Midwest premium, represent the hedged item.
The hedging ratio is 1:1, as the quantity of sales designated as being hedged matches the notional amount of the hedging instrument. The hedging instrument’s notional amount, expressed in equivalent metric tonnes of aluminium, is derived from our expected electricity consumption under the power contracts as well as other relevant contract parameters.
When we designate such embedded derivatives as the hedging instrument in a cash flow hedge, we recognise the effective portion of the change in the fair value of the hedging instrument in other comprehensive income, and it is accumulated in the cash flow hedge reserve. The amount that is recognised in other comprehensive income is limited to the lesser of the cumulative change in the fair value of the hedging instrument and the cumulative change in the fair value of the hedged item, in absolute terms.
We recognise any ineffectiveness relating to the hedging relationship immediately in the income statement.
Sources of ineffectiveness include: differences in the timing of the cash flows between the hedged item and the hedging instrument, non-zero initial fair value of the hedging instrument, the existence of a cap on the Midwest premium in the hedging instrument and counterparty credit risk.
We held the following notional aluminium forward sales contracts embedded in the power contracts:
At 31 December 2020 Total Within 1 yearBetween 1
and 5 yearsBetween 5
and 10 years After 10 years
Notional amount (in tonnes) 640,963 72,548 287,587 280,828 — Notional amount (in US$ millions) 1,522 159 663 701 — Average hedged rate (in US$ per tonne) 2,375 2,189 2,305 2,495 —
At 31 December 2019 Total Within 1 yearBetween 1
and 5 yearsBetween 5
and 10 years After 10 years
Notional amount (in tonnes) 704,370 65,226 286,617 352,527 — Notional amount (in US$ millions) 1,656 138 647 871 — Average hedged rate (in US$ per tonne) 2,351 2,114 2,257 2,471 —
252 Annual Report 2020 | riotinto.com252 Annual Report 2020 | riotinto.com
Financial Statements
Notes to the 2020 Financial Statements

The impact on our financial statements of these hedging instruments and hedging items are:
Aluminium embedded derivatives separated from the power contract(Hedging instrument)(a) Highly probable forecast aluminium sales (Hedged item)
NominalUS$m
Carrying amount
US$m
Change in fair value in the
periodUS$m
Cash flow hedge
reserve(b)
US$m
Change in fair value in
the periodUS$m
Total hedginggain/(loss) recognisedin reserves
US$m
Hedge ineffective-ness in the
period(c)
US$m
Amount reclassified
from reserves to income
statement(d)
US$m
2020 1,522 46 23 184 (49) 27 (4) 40 2019 1,656 42 29 196 (50) 36 (7) 19
(a) Aluminium embedded derivatives (forward contracts and options) are contained within certain aluminium smelter electricity purchase contracts. US$66 million (2019: US$66 million) of the carrying value is shown within "Other financial assets" and US$20 million (2019: US$24 million) shown within "Other financial liabilities".
(b) The difference between this amount and the total cash flow hedge reserve of the Group (shown in note 28) relates to our cash flow hedge on the sterling bond (refer to interest rate risk section). (c) Hedge ineffectiveness is included in net operating costs (raw materials, consumables, repairs and maintenance) in the income statement. (d) On realisation of the hedge, realised amounts are reclassified from reserves to consolidated sales revenue in the income statement.
There was no cost of hedging recognised in 2020 or 2019 relating to this hedge relationship.
We set out details of our commodity derivatives that are not designated as hedges in section B.
Sensitivities Our commodity derivatives are impacted by changes in market prices. The table below summarises the impact that changes in aluminium market prices have on aluminium forward and option contracts embedded in power supply agreements outstanding at 31 December 2020. Any change in price will result in an offsetting change in our future earnings.
Change inmarket prices
2020 US$m
2019US$m
Effect on net earnings +10 % (19) (28) (10) % 19 27
Effect on equity +10 % (98) (97) (10) % 100 101
We exclude our “own use contracts” from this sensitivity analysis as they are outside the scope of IFRS 9. Our business units continue to hold these types of contracts to satisfy their expected purchase, sale or usage requirements.
(iii) Credit risk We are exposed to credit risk in our operating activities (primarily from customer trade receivables); and from our investing activities (primarily investments in separately managed funds). We are also exposed to credit risk arising from our deposits in treasury and liquidity funds, deposits with banks and financial institutions and from our interest rate and currency derivative contracts.
Credit risks related to receivables Our Commercial team manages customer credit risk subject to our established policy, procedures and controls. The team establishes credit limits for all of our customers. Where customers are rated by an independent credit rating agency, these ratings are used as a guide to set credit limits. Where there are no independent credit ratings available, we assess the credit quality of the customer through a credit rating model and assign appropriate credit limit. The Commercial team monitors outstanding customer receivables regularly and highlights any credit concerns to senior management. Receivables to high risk customers are often secured by letters of credit or other forms of credit enhancement.
The expected credit loss on our trade receivable portfolio is insignificant (see note 18).
Credit risk related to financial instruments and cash deposits Our Treasury team manages credit risk from investments in government securities (primarily US Government), corporate and asset-backed securities, reverse re-purchase agreements, money market funds, and balances with banks and financial institutions in accordance with a Board-approved credit risk framework which sets the risk appetite. Our Board reviews this annually. We make investments of surplus funds only with approved investment grade (BBB- and above) counterparties who have been assigned specific credit limits. The limits are set to minimise the concentration of credit risk and therefore mitigate the potential for financial loss through counterparty failure.
Annual Report 2020 | riotinto.com 253253Annual Report 2020 | riotinto.com
Financial Statements
Additional disclosures

29 Financial instruments and risk management continuedThe maximum credit risk exposure arising on our financial assets at the balance sheet date is as follows:
Note2020
US$m2019
US$m
Cash and cash equivalents 20 10,381 8,027 Trade and other financial receivables 18 3,286 2,938 Investments 19 2,899 2,839 Derivative assets 19 665 366 Loans to equity accounted units 41 39 Total 17,272 14,209
(iv) Foreign exchange risk The broad geographic spread of our sales and operations means that our earnings, cash flows and shareholders’ equity are influenced by a wide variety of currencies.
The majority of our sales are denominated in the US dollar.
Our operating costs are influenced by the currencies of those countries where our mines and processing plants are located, and by those currencies in which we buy imported equipment and services. The US dollar, the Australian dollar and the Canadian dollar are the most important currencies influencing our costs. In any particular year, currency fluctuations may have a significant impact on our financial results. A strengthening of the US dollar against the currencies in which our costs are partly denominated has a positive effect on our underlying earnings. However, a strengthening of the US dollar reduces the value of non-US dollar denominated net assets, and therefore total equity.
Our external borrowings and cash are mainly denominated in US dollars, either directly or through the use of derivatives, as we consider the US dollar the most appropriate currency for financing our operations.
In most cases our debt and other financial assets and liabilities, including intragroup balances, is held in the functional currency of the relevant subsidiary. There are instances where these balances are held in currencies other than the functional currency of the relevant subsidiary. This means we recognise exchange gains and losses in our income statement (except where they can be taken to equity) as these balances are translated into the functional currency of the relevant subsidiary. Our income statement also includes exchange gains and losses arising on US dollar net debt and intragroup balances. On consolidation, these balances are retranslated to our US dollar presentation currency and there is a corresponding and offsetting exchange difference recognised directly in the currency translation reserve. There is no impact on total equity.
The table below summarises, by currency, our net debt, after taking into account relevant cross currency interest rate swaps and foreign exchange contracts:
Net debt by currency
Totalborrowings
excludingoverdrafts
US$m
Lease liabilities
US$m
Derivativesrelated to net
debtUS$m
Cash andcash
equivalentsUS$m
Otherinvestments
US$m
Net debt2020
US$m
Net debt2019
US$m
US dollar (12,102) (342) 248 9,517 2,538 (141) (2,843) Australian dollar (375) (350) — 439 — (286) (561) Euro (4) (25) — 43 — 14 10 South African rand — (1) — 141 — 140 171 Canadian dollar (170) (199) — 36 — (333) (322) Other (2) (261) — 205 — (58) (106) Total (12,653) (1,178) 248 10,381 2,538 (664) (3,651)
Hedging strategy Under normal market conditions, we do not consider that active currency hedging of transactions would provide long-term benefits to shareholders. We review our exposure on a regular basis and will undertake hedging if deemed appropriate. We may deem currency protection measures appropriate in specific commercial circumstances. Capital expenditures and other significant financial items such as acquisitions, disposals, tax and dividend cash flows may be economically hedged subject to strict limits laid down by the Board. Details of the cross-currency interest rate swaps and the currency forward contracts used to manage our currency risk exposures at 31 December 2020 are in section B.
254 Annual Report 2020 | riotinto.com254 Annual Report 2020 | riotinto.com
Financial Statements
Notes to the 2020 Financial Statements

Sensitivities The table below shows the estimated retranslation effect on financial assets and financial liabilities, including intragroup balances, of a 10% strengthening in the closing exchange rate of the US dollar against significant currencies. We deem 10% to be the annual exchange rate movement that is reasonably probable (on an annual basis over the long run) for any of our significant currencies and therefore an appropriate representation.
We calculate sensitivities in relation to the functional currencies of our individual entities. We translate the impact of these on net earnings and underlying earnings into US dollars at the exchange rates on which the sensitivities are based. The impact to net earnings associated with a 10% weakening of a particular currency, shown below, is broadly offset within equity through movements in the currency translation reserve and therefore generally has no impact on our net assets. The impact is expressed in terms of the effect on net earnings, underlying earnings, and equity, assuming that each exchange rate moves in isolation. The sensitivities are based on financial assets and financial liabilities held at 31 December 2020, where balances are not denominated in the functional currency of the subsidiary or joint operation, and exclude financial assets and liabilities held by equity accounted units. These balances will not remain constant throughout 2021, and therefore the following information should be used with care.
At 31 December 2020 Gains/(losses) associated with 10% strengthening of the US dollar
Currency exposure
Closingexchange
rateUS cents
Effect onnet
earningsUS$m
Of whichamount
impactingunderlying
earningsUS$m
Impact directly
on equityUS$m
Australian dollar 77 625 (11) (1,105) Canadian dollar 78 (167) 6 — Euro 123 139 3 —
At 31 December 2019 Gains/(losses) associated with 10% strengthening of the US dollar
Currency exposure
Closingexchange
rateUS cents
Effect onnet
earningsUS$m
Of whichamount
impactingunderlying
earningsUS$m
Impactdirectly
on equityUS$m
Australian dollar 70 453 (4) (1,002) Canadian dollar 77 (143) 7 — Euro 112 178 4 —
(v) Interest rate risk Our interest rate management policy is generally to borrow and invest at floating interest rates. This approach is based on the historically lower cost of borrowing at floating rates, and the historical correlation between interest rates and commodity prices. It does mean, however, that movements in market interest rates impact our earnings. In certain circumstances, we may elect to maintain a higher proportion of fixed-rate funding.
Hedging strategy Because we aim to borrow and invest at floating interest rates, we enter into interest rate swaps and review these positions on a regular basis. During 2020, we entered into US$1.5 billion of interest rate swaps to convert the remaining fixed Alcan debt to floating interest rates. This is in accordance with our floating interest rate policy. We have put these swaps into fair value hedge relationships with the respective tranches of debt.
At 31 December 2020, US$5.9 billion (2019: US$4.5 billion) US dollar notional fixed-rate US dollar borrowings continue to be swapped to floating US dollar rates and €417 million (2019: €818 million) euro notional fixed-rate borrowings continue to be fully swapped to floating US dollar interest rates at an effective exchange rate of 1.3105. These swaps are in fair value hedge relationships.
Since 2012, we have also held cross-currency interest rate swaps to convert the principal and annual interest coupons of the Rio Tinto Finance plc £500m Sterling Bond to a US dollar notional with fixed US dollar annual interest coupons. We applied cash flow hedge accounting to this relationship to limit our US dollar cash flow exposure on the principal and interest payments. The hedge was fully effective in the 2020 and 2019 financial years as the notional amount, maturity, payment and reset dates match.
2020 2019
Nominal amount of the bond
Nominal amount of the hedging
instrument MaturityEffective
exchange rate
Gain in fair value of the interest
component of the hedged item
US$m
Loss in fair value of the interest
component of the hedging instrument
US$m
Loss in fair value of the interest
component of the hedged item
US$m
Gain in fair value of the interest
component of the hedging instrument
US$m
£500 million US$807 million November 2029 1.6132 7 (7) (24) 24
In 2019, we swapped the resulting fixed US dollar annual interest coupon payments to floating rates. Fair value hedge accounting has been applied to this relationship in addition to the pre-existing cash flow hedge.
Annual Report 2020 | riotinto.com 255255Annual Report 2020 | riotinto.com
Financial Statements
Additional disclosures

29 Financial instruments and risk management continuedThe effective interest rates of our borrowings, impacted by swaps, are summarised below. All nominal values are fully hedged unless otherwise stated:
Borrowings in a hedge relationship
Nominal value
US$m
Weighted average interest rate after swaps
Swap maturity
Carrying value2020
US$m
Carrying value2019
US$m
Rio Tinto Finance plc Euro Bonds 2.0% due 2020(a) 526 3 month LIBOR +1.35% 2020 — 455 Rio Tinto Finance plc Euro Bonds 2.875% due 2024 546 3 month LIBOR +1.64% 2024 555 508 Rio Tinto Finance (USA) Limited Bonds 3.75% 2025 1,200 3 month LIBOR +1.39% 2025 1,299 1,229 Rio Tinto Finance (USA) Limited Bonds 7.125% 2028 750 3 month LIBOR +3.27% 2028 1,005 958 Alcan Inc. Debentures 7.25% due 2028 100 3 month LIBOR +5.43% 2024 109 104 Rio Tinto Finance plc Sterling Bonds 4.0% due 2029 807 3 month LIBOR +2.65% 2024 717 647 Alcan Inc. US$400m Debentures 7.25% due 2031(b) 400 3 month LIBOR +5.72% 2025 438 — Alcan Inc. US$750m Global Notes 6.125% due 2033(b) 750 3 month LIBOR +5.67% 2025 744 — Alcan Inc. US$300m Global Notes 5.75% due 2035(b) 300 3 month LIBOR +5.18% 2025 292 — Rio Tinto Finance (USA) Limited Bonds 5.2% 2040 1,150 3 month LIBOR +3.79% 2022 1,173 1,137 Rio Tinto Finance (USA) plc Bonds 4.75% 2042 500 3 month LIBOR +3.42% 2023 501 483 Rio Tinto Finance (USA) plc Bonds 4.125% 2042 750 3 month LIBOR +2.83% 2023 743 716
(a) On 11 May 2020 we repaid, in full, the nominal amount of the Rio Tinto Finance plc Euro Bonds 2% due 2020.(b) In 2020 we entered into new swaps to convert the interest payable in relation to these bonds from fixed to floating rates.
The fair value of interest rate and cross currency interest rate swaps at 31 December 2020 was US$388 million (2019: US$151 million) asset and US$140 million (2019: US$298 million) liability, respectively. These are included within “Other financial assets” and “Other financial liabilities” in the balance sheet.
The main sources of ineffectiveness of the fair value hedges include changes in the timing of the cash flows of the hedging instrument compared to the underlying hedged item, and changes in the credit risk of parties to the hedging relationships. Refer to Note 8 for the changes in fair value of the bonds and the swaps as well as the ineffectiveness recognised in the period. Refer to Note 1 "New standards Issued not yet effective" for the impacts of IBOR reform.
Taking into account the interest and currency interest rate swaps, at 31 December 2020, US$11.7 billion (2019: US$10.8 billion) of our adjusted gross borrowings were at floating rates. This has resulted in a floating to fixed debt ratio of 86% floating to 14% fixed (2019: 76% floating to 24% fixed). Our weighted average debt maturity was approximately 9 years (2019: 10 years) based on current interest rates and the carrying value of gross borrowings at the year end.
Sensitivities Based on our floating rate financial instruments outstanding at 31 December 2020, the effect on our net earnings of a 100 basis point increase in US dollar LIBOR interest rates, with all other variables held constant, would be an expense of US$7 million (2019: expense of US$20 million), reflecting the lower net debt position in 2020 compared to 2019. We have an exposure to interest rate volatility within shareholders’ equity arising from fair value movements on derivatives in the cash flow hedge reserve. These derivatives have an underlying exposure to sterling and US dollars. With all factors remaining constant, and based on the composition of derivatives impacting the cash flow reserve at 31 December 2020, the sensitivity of a 100 basis point increase in interest rates in each of the currencies in isolation would impact equity, before tax, by a charge of US$68 million (2019: US$68 million charge) for sterling and a credit of US$78 million (2019: US$78 million credit) for US dollars. A 100 basis point decrease would have broadly the same impact in the opposite direction.
256 Annual Report 2020 | riotinto.com256 Annual Report 2020 | riotinto.com
Financial Statements
Notes to the 2020 Financial Statements

257Annual Report 2020 | riotinto.com
Financial Statements
Additional disclosures

29 Financial instruments and risk management continuedOur remaining borrowings have a fair value measured by discounting estimated cash flows with an applicable market quoted yield, and are categorised as level 2 in the fair value hierarchy.
C (a) Valuation hierarchy The tables below show the financial instruments by valuation method in accordance with IFRS 9 at 31 December 2020 and 31 December 2019.
Held at fair value
At 31 December 2020 NoteTotal
US$mLevel 1(a)
US$mLevel 2(b)
US$mLevel 3(c)
US$m
Held at amortised
costUS$m
AssetsCash and cash equivalents(d) 10,381 6,411 — — 3,970 Investments in equity shares and funds 75 35 — 40 — Other investments, including loans(e) 19 2,899 2,563 — 198 138 Trade and other financial receivables(f) 18 3,286 5 1,802 — 1,479
Derivatives (net)Forward contracts and option contracts: designated as hedges(g) (Section B) 53 — 7 46 — Forward contracts and option contracts, not designated as hedges(g) (Section B) 180 — 69 111 — Derivatives related to net debt(h) (Section B) 248 — 248 — —
LiabilitiesTrade and other financial payables 24 (5,847) — (30) — (5,817) Total 11,275 9,014 2,096 395 (230)
Held at fair value
At 31 December 2019 NoteTotal
US$mLevel 1(a)
US$mLevel 2(b)
US$mLevel 3(c)
US$m
Held at amortised
costsUS$m
AssetsCash and cash equivalents(d) 8,027 5,320 — — 2,707 Investments in equity shares and funds 61 26 — 35 — Other investments, including loans(e) 19 2,839 2,607 — 211 21 Trade and other financial receivables(f) 18 2,938 15 1,122 — 1,801
Derivatives (net)Forward contracts and option contracts: designated as hedges(g) (Section B) 42 — — 42 — Forward contracts and option contracts, not designated as hedges(g) (Section B) 120 — 25 95 — Derivatives related to net debt(h) (Section B) (147) — (147) — —
LiabilitiesTrade and other financial payables 24 (5,398) — (57) — (5,341) Total 8,482 7,968 943 383 (812)
(a) Valuation is based on unadjusted quoted prices in active markets for identical financial instruments. This category includes listed equity shares and other quoted funds. (b) Valuation is based on inputs that are observable for the financial instruments; which include quoted prices for similar instruments or identical instruments in markets which are not considered to be
active, or inputs, either directly or indirectly based on observable market data. (c) Valuation is based on inputs that are not based on observable market data (unobservable inputs). (d) Cash and cash equivalents include money market funds which are treated as fair value through profit or loss (FVPL) under IFRS 9 with the fair value movements going into finance income. (e) Other investments, including loans, comprise: cash deposits in rehabilitation funds, government bonds, managed investment funds and royalty receivables. The royalty receivables are valued based
on future expected output as well as forward commodity prices. (f) Trade receivables include provisionally priced invoices. The related revenue is initially based on forward market selling prices for the quotation periods stipulated in the contracts with changes
between the provisional price and the final price recorded separately within "Other revenue". The selling price can be measured reliably for the Group's products, as it operates in active and freely traded commodity markets. At 31 December 2020, US$1,671 million (31 December 2019: US$1,040 million) of provisionally priced receivables were recognised.
(g) Level 3 derivatives consist of derivatives embedded in electricity purchase contracts linked to the LME with terms expiring between 2025 and 2029 (2019: 2025 and 2030). The embedded derivatives are measured using discounted cash flows and option model valuation techniques.
(h) Interest rate and currency interest rate swaps are valued using applicable market quoted swap yield curves adjusted for relevant basis and credit default spreads. Currency interest rate swap valuations also use market quoted foreign exchange rates. A discounted cash flow approach is used to derive fair value from these inputs to the underlying cash flows.
There were no material transfers between level 1 and level 2, or between level 2 and level 3 in the year ended 31 December 2020 or in the year ended 31 December 2019.
258 Annual Report 2020 | riotinto.com258 Annual Report 2020 | riotinto.com
Financial Statements
Notes to the 2020 Financial Statements

C (b) Level 3 financial assets and financial liabilities The table below shows the summary of changes in the fair value of the Group's level 3 financial assets and financial liabilities.
2020 Level 3
financial assetsand financial
liabilitiesUS$m
2019Level 3
financial assetsand financial
liabilitiesUS$m
Opening balance 383 637 Currency translation adjustments 16 (1) Total realised gains/(losses) included in:– consolidated sales revenue 11 — – net operating costs (39) (7)
Total unrealised (losses)/gains included in:– net operating costs 24 (254)
Total unrealised gains transferred into other comprehensive income through cash flow hedges 26 28 Additions 1 1 Disposals/maturity of financial instruments (27) (21) Closing balance 395 383 Net losses for the year included in the income statement for assets and liabilities held at year end(a) — (263)
(a) In 2020 gains and losses included in the income statement offset each other to the extent that the net result is less than US$1 million.
Sensitivity analysis in respect of level 3 derivatives Forward contracts and options whose fair value is determined using unobservable inputs are calculated using appropriate discounted cash flow and option model valuation techniques.
To value the long-term aluminium embedded derivatives, we use unobservable inputs when the term of the derivative extends beyond observable market prices. In 2020 and 2019, changing the level 3 inputs to reasonably possible alternative assumptions does not change the fair value significantly, taking into account the expected remaining term of contracts. The fair value of the long-term aluminium embedded derivatives is US$126 million at 31 December 2020 (2019: US$120 million).
We also have royalty receivables, with a carrying value of US$113 million (2019: US$124 million), arising from the sale of our coal assets in prior periods. These are classified as "Other investments", including loans within "Other financial assets". The fair values are determined using level 3 unobservable inputs.
The main unobservable input is the long-term coal price used over the life of the royalty receivable. A 15% increase in the coal spot price would result in a US$198 million increase (2019: US$214 million increase) in the carrying value. A 15% decrease in the coal spot price would result in a US$46 million decrease (2019: US$57 million decrease) in the carrying value. We have used a 15% assumption to calculate our exposure as it represents the annual coal price movement that we deem to be reasonably probable (on an annual basis over the long run).
30 Contingencies and commitments
2020 US$m
2019US$m
Capital commitments excluding the Group's share of joint venture capital commitmentsWithin 1 year 3,021 3,069 Between 1 and 3 years 97 851 Between 3 and 5 years — 133 After 5 years 34 — Total 3,152 4,053
Group's share of joint venture capital commitmentsWithin 1 year 9 92 Between 1 and 3 years — 1 Total 9 93
Our capital commitments include open purchase orders for managed operations and expenditure on major projects already authorised by our Investment Committee for non-managed operations. On a legally enforceable basis, capital commitments would be approximately US$1.5 billion (2019: US$0.9 billion) as many of the contracts relating to the Group’s projects have various cancellation clauses.
Annual Report 2020 | riotinto.com 259259Annual Report 2020 | riotinto.com
Financial Statements
Additional disclosures

30 Contingencies and commitments continued Unrecognised commitments to contribute funding or resources to joint ventures We have a commitment to purchase and market a portion (in excess of the Group’s ownership interest) of the output of Sohar Aluminium Company L.L.C., an aluminium smelter in which the Group is a joint venture partner. The Group immediately sells the purchased products to third parties.
Along with the other joint venture partners, we have commitments to provide emergency funding (ie funding required to preserve the life or assets of the company or to comply with applicable laws) if required by Sohar Aluminium Company L.L.C., subject to approved thresholds.
At 31 December 2020, Minera Escondida Ltda held an undrawn shareholder line of credit for US$225 million (Rio Tinto share) (31 December 2019: US$225 million). The current facility will mature in September 2022.
Purchase obligations The aggregate amount of future payment commitments under purchase obligations outstanding at 31 December was:
2020 US$m
2019US$m
Within 1 year 3,100 2,920 Between 1 and 2 years 1,715 1,705 Between 2 and 3 years 1,291 1,431 Between 3 and 4 years 1,242 1,084 Between 4 and 5 years 848 1,082 After 5 years 8,437 8,697 Total 16,633 16,919
Purchase obligations are enforceable and legally binding agreements to buy goods or services. They specify all significant terms, including: fixed or minimum quantities to be purchased or consumed; fixed, minimum or variable price provisions; and the approximate timing of the transactions.
Purchase obligations for goods mainly relate to purchases of raw materials and consumables and purchase obligations for services mainly relate to charges for the use of infrastructure, commitments to purchase power and freight contracts. These goods and services are expected to be used in the business. To the extent that this changes, a provision for onerous obligations may be made as described in note 1- critical policy (vii).
Purchases from joint arrangements or associates are included if the quantity purchased is in excess of our ownership interest in the entity. However, purchase obligations exclude contracted purchases of bauxite, alumina and aluminium from joint arrangements and associates and contracted purchases of alumina from third parties. This is because these purchases are made for commercial reasons and the Group is, overall, a net seller of these commodities.
As described above, we also have a commitment to buy and market a portion (in excess of our ownership interest) of the output of Sohar Aluminium Company L.L.C.
Contingent liabilities (subsidiaries and joint operations) 2020
US$m2019US$m
Indemnities and other performance guarantees(a)(b) 146 204
(a) Indemnities and other performance guarantees represent the potential outflow of funds from the Group for the satisfaction of obligations including those under contractual arrangements (for example undertakings related to supplier agreements) not provided for in the balance sheet, where the likelihood of the guarantees or indemnities being called is assessed as possible rather than probable or remote.
(b) There were no material contingent liabilities arising in relation to the Group’s joint ventures and associates.
260 Annual Report 2020 | riotinto.com260 Annual Report 2020 | riotinto.com
Financial Statements
Notes to the 2020 Financial Statements
Contingent liabilities In October 2017, Rio Tinto announced that it had been notified by the U.S. Securities and Exchange Commission (SEC) that the SEC had filed a complaint in relation to Rio Tinto’s disclosures and timing of the impairment of Rio Tinto Coal Mozambique (RTCM). The impairment was reflected in Rio Tinto’s 2012 year-end accounts. The SEC alleges that Rio Tinto, a former chief executive, Tom Albanese, and a former chief financial officer, Guy Elliott, committed violations of the antifraud, reporting, books and records and internal control provisions of the federal securities law by not accurately disclosing the value of RTCM and not impairing it when Rio Tinto published its 2011 year-end accounts in February 2012 or its 2012 interim results in August 2012. In June 2019, the trial court dismissed an associated US class action on behalf of securities holders. In August 2020, the appeals court partially overturned the court’s dismissal and the case is with the trial court for further consideration.
In March 2018, the Australian Securities and Investments Commission (ASIC) filed civil proceedings in the NSW District Registry of the Federal Court of Australia against Rio Tinto Limited, Albanese, and Elliott. On 1 May 2018, ASIC expanded its proceedings. ASIC alleges that Rio Tinto committed violations of the disclosure, accounting, and misleading or deceptive conduct provisions of the Corporations Act by making misleading or deceptive statements related to RTCM in its 2011 Annual Report and its 2012 interim financial statements, not complying with accounting standards in respect of its 2012 interim financial statements, and not disclosing an impairment of RTCM in its 2012 interim financial statements. ASIC further alleges Albanese and Elliott breached their duties as directors or officers, and failed to take all reasonable steps to comply with relevant accounting requirements.
Rio Tinto believes that the SEC case and the ASIC proceedings are unwarranted and will defend the allegations vigorously. Hence, no provisions have been recognised for these cases.
Rio Tinto continues to co-operate fully with relevant authorities in connection with their investigations in relation to contractual payments totalling US$10.5 million made to a consultant who had provided advisory services in 2011 on the Simandou project in Guinea. In August 2018, the court dismissed a related US class action commenced on behalf of securities holders. No provision has been recognised for this case.
The outcomes of these matters remain uncertain, but they could ultimately expose the Group to material financial cost. The Board is giving these matters its full and proper attention and a dedicated Board committee continues to monitor the progress of these matters, as appropriate.
The Group has not established provisions for certain additional legal claims in cases where we have assessed that a payment is either not probable or cannot be reliably estimated. A number of Group companies are, and will likely continue to be, subject to various legal proceedings and investigations that arise from time to time. As a result, the Group may become subject to substantial liabilities that could affect our business, financial position and reputation. Litigation is inherently unpredictable and large judgments may at times occur. The Group may incur, in the future, judgments or enter into settlements of claims that could lead to material cash outflows. We do not believe that any of these proceedings will have a materially adverse effect on our financial position.
Guarantees by parent companies Rio Tinto plc and Rio Tinto Limited have, jointly and severally, fully and unconditionally guaranteed the following securities issued by the following 100% owned finance subsidiaries: US$4.4 billion (31 December 2019: US$4.4 billion) Rio Tinto Finance (USA) Limited and Rio Tinto Finance (USA) plc bonds with maturity dates up to 2042; and US$1.2 billion (31 December 2019: US$1.6 billion) on the European Debt Issuance Programme. In addition, Rio Tinto Finance plc and Rio Tinto Finance Limited have entered into facility arrangements for an aggregate amount of US$7.5 billion (31 December 2019: US$7.5 billion). The facilities are guaranteed by Rio Tinto plc and Rio Tinto Limited.
Rio Tinto plc has provided a guarantee, known as the completion support undertaking (CSU), in favour of the Oyu Tolgoi LLC project finance lenders. At 31 December 2020, US$4.3 billion of project finance debt was outstanding under this facility (2019: US$4.3 billion). Oyu Tolgoi LLC is jointly owned by Erdenes Oyu Tolgoi LLC (34%), which is controlled by the Government of Mongolia, and Turquoise Hill Resources Ltd (66%, of which Rio Tinto owns 51%). The project finance has been raised for development of the underground mine and the CSU will terminate on the completion of the underground mine according to a set of completion tests set out in the project finance facility.
The Rio Tinto guarantee applies to the extent that Turquoise Hill Resources Ltd cannot satisfy Oyu Tolgoi LLC’s project finance debt servicing obligations under its own guarantee to the lenders, called the sponsor debt service undertaking (DSU). Both the CSU and DSU contain a carve-out for certain political risk events.
Contingent assets The Group has, from time to time, various insurance claims outstanding with reinsurers.
Annual Report 2020 | riotinto.com 261261Annual Report 2020 | riotinto.com
Financial Statements
Additional disclosures

31 Average number of employees
Subsidiaries and joint operationsEquity accounted units
(Rio Tinto share) Group total
2020 2019 2018 2020 2019 2018 2020 2019 2018
Principal locations of employment:Australia and New Zealand 20,482 19,195 19,017 634 619 578 21,116 19,814 19,595Canada 11,814 11,576 10,620 — — — 11,814 11,576 10,620UK 172 190 287 — — — 172 190 287Europe 1,020 959 1,418 — — — 1,020 959 1,418Africa 2,559 3,121 3,496 1,214 1,250 1,262 3,773 4,371 4,758US 3,543 3,400 3,792 — — — 3,543 3,400 3,792Mongolia 3,465 3,215 2,886 — — — 3,465 3,215 2,886Indonesia — — 1,615 — — — — — 1,615South America 220 243 210 1,293 1,270 1,289 1,513 1,513 1,499India 324 272 288 — — — 324 272 288Singapore 456 430 422 — — — 456 430 422Other countries(a) 278 267 278 — — — 278 267 278Total 44,333 42,868 44,329 3,141 3,139 3,129 47,474 46,007 47,458
(a) “Other countries” primarily includes employees in the Middle East (excluding Oman which is included in Africa), and other countries in Asia which are not shown separately in the table above.
Employee numbers, which represent the average for the year, include 100% of employees of subsidiary companies. Employee numbers for joint operations and equity accounted units are proportional to the Group’s interest under contractual agreements. Average employee numbers include a part-year effect for companies acquired or disposed of during the year.
Part-time employees are included on a full-time-equivalent basis. Temporary employees are included in employee numbers.
People employed by contractors are not included.
262 Annual Report 2020 | riotinto.com262 Annual Report 2020 | riotinto.com
Financial Statements
Notes to the 2020 Financial Statements

263Annual Report 2020 | riotinto.com
Financial Statements
Additional disclosures

32 Principal subsidiaries continuedThe Group’s principal subsidiaries are mostly held by intermediate holding companies and not directly by Rio Tinto plc or Rio Tinto Limited.
(a) In February 2020, Rio Tinto's interest in Energy Resources of Australia (ERA) increased from 68.4% to 86.3% as a result of new ERA shares issued to Rio Tinto under the Entitlement Offer and Underwriting Agreement to raise funds for the rehabilitation of the Ranger Project Area.
(b) Robe River Mining Co Pty Ltd (which is 60% owned by the Group) holds a 30% interest in Robe River Iron Associates (Robe River). North Mining Ltd (which is wholly owned by the Group) holds a 35% interest in Robe River. Through these companies the Group recognises a 65% share of the assets, liabilities, revenues and expenses of Robe River, with a 12% non-controlling interest. The Group therefore has a 53% beneficial interest in Robe River.
(c) Alcan Alumina Ltda holds the Group’s 10% interest in Consórcio De Alumínio Do Maranhão, a joint operation in which the Group participates but is not a joint operator. The Group recognises its share of assets, liabilities, revenues and expenses relating to this arrangement.
(d) Iron Ore Company of Canada is incorporated in the US, but operates in Canada.(e) Diavik Diamond Mines (2012) Inc. (DDMI) is the legal entity that owns the Group’s 60% interest in the Diavik Joint Venture, an unincorporated arrangement. The Group recognises its share of assets,
revenue and expenses relating to this arrangement. Liabilities are recognised according to DDMI’s contractual obligations, with a corresponding 40% receivable or contingent asset representing the co-owner’s share where applicable.
(f) Simfer Jersey Limited, a company incorporated in Jersey in which the Group has a 53% interest, has an 85% interest in Simfer S.A., the company that operates the Simandou mining project in Guinea. The Group therefore has a 45.05% indirect interest in Simfer S.A. These entities are consolidated as subsidiaries and together referred to as the Simandou iron ore project.
(g) The Group’s shareholding in QIT Madagascar Minerals SA carries an 80% economic interest and 80% of the total voting rights; a further 5% economic interest is held through non-voting investment certificates to give an economic interest of 85%. The non-controlling interests have a 15% economic interest and 20% of the total voting rights.
(h) The Group has a 50.79% interest in Turquoise Hill Resources Ltd, which holds a 66% interest in Oyu Tolgoi LLC (OT) which is a subsidiary of Turquoise Hill Resources Ltd. The Group therefore has a 33.5% indirect interest in OT. Turquoise Hill Resources Ltd is incorporated in Canada but operates principally in Mongolia.
(i) Additional classes of shares issued by Richards Bay Titanium (Proprietary) Limited and Richards Bay Mining (Proprietary) Limited representing non-controlling interests are not shown. The Group’s total legal and beneficial interest in Richards Bay Titanium (Proprietary) Limited and Richards Bay Mining (Proprietary) Limited is 74%.
Summary financial information for subsidiaries that have non-controlling interests that are material to the Group This summarised financial information is shown on a 100% basis. It represents the amounts shown in the subsidiaries’ financial statements prepared in accordance with IFRS under Group accounting policies, including fair value adjustments, and before intercompany eliminations.
Income statement summary for the year ended 31 December
Iron OreCompany of
Canada2020
US$m
Iron OreCompany of
Canada2019
US$m
EnergyResources of
Australia2020
US$m
EnergyResources of
Australia2019
US$m
Turquoise Hill(j)(k)(l)
2020US$m
Turquoise Hill(j)(k)(l)
2019US$m
Revenue 2,269 2,014 162 145 1,078 1,166 Profit/(loss) after tax 611 543 9 5 357 (2,137) – attributable to non-controlling interests 252 224 3 2 130 (1,490) – attributable to Rio Tinto 359 319 5 3 227 (647) Other comprehensive income 56 57 20 2 2 — Total comprehensive income/(loss) 667 600 29 7 359 (2,137)
Balance sheet summary as at 31 December2020
US$m2019
US$m2020
US$m2019
US$m2020
US$m2019
US$m
Non-current assets 2,733 2,585 329 76 10,930 9,589 Current assets 670 610 371 258 1,496 2,449 Current liabilities (462) (532) (176) (127) (540) (493) Non-current liabilities (993) (927) (427) (462) (4,404) (4,405) Net assets/(liabilities) 1,948 1,736 97 (255) 7,482 7,140 – attributable to non-controlling interests 804 718 18 — 2,424 2,369 – attributable to Rio Tinto 1,144 1,018 79 (255) 5,058 4,771
Cash flow statement summary for the year ended 31 December2020
US$m2019
US$m2020
US$m2019
US$m2020
US$m2019
US$m
Cash flow from operations 1,027 1,039 (15) (73) 380 298 Dividends paid to non-controlling interests (180) (228) — — — —
(j) Turquoise Hill Resources Ltd holds a controlling interest in Oyu Tolgoi LLC (OT). (k) Under the terms of the project finance facility held by OT, there are certain restrictions on the ability of OT to make shareholder distributions. (l) Since 2011, Turquoise Hill has funded common share investments in OT on behalf of Erdenes Oyu Tolgoi LLC (“Erdenes”). In accordance with the Amended and Restated Shareholders Agreement
dated 8 June 2011, such funded amounts earn interest at an effective annual rate of LIBOR plus 6.5% and are repayable to them via a pledge over Erdenes’ share of future OT common share dividends. Erdenes also has the right to reduce the outstanding balance by making payments directly to Turquoise Hill. Common share investments funded on behalf of Erdenes, including accrued interest, are recorded as a reduction to the net carrying value of their component of non-controlling interests. As at 31 December 2020, the cumulative amount of such funding was US$1,378 million (31 December 2019: US$1,241 million), excluding accrued interest of US$804 million (31 December 2019: US$655 million) relating to this funding.
264 Annual Report 2020 | riotinto.com264 Annual Report 2020 | riotinto.com
Financial Statements
Notes to the 2020 Financial Statements

Income statement summary for the year ended 31 December
Robe River Mining Co Pty
2020US$m
Robe River Mining Co Pty
2019US$m
Other companies
and eliminations(m)
2020US$m
Other companies and eliminations(m)
2019US$m
Robe River2020
US$m
Robe River2019
US$m
Revenue 1,738 1,493 2,028 1,743 3,766 3,236 Profit after tax 939 808 1,019 825 1,958 1,633 – attributable to non-controlling interests 376 312 — — 376 312 – attributable to Rio Tinto 563 496 1,019 825 1,582 1,321 Other comprehensive income/(loss) 294 (13) 136 (12) 430 (25) Total comprehensive income 1,233 795 1,155 813 2,388 1,608
Balance sheet summary as at 31 December2020
US$m2019
US$m2020
US$m2019
US$m2020
US$m2019
US$m
Non-current assets 3,452 2,622 4,247 3,687 7,699 6,309 Current assets 865 1,161 2,239 1,873 3,104 3,034 Current liabilities (380) (173) (414) (303) (794) (476) Non-current liabilities (255) (84) (4,752) (3,392) (5,007) (3,476) Net assets 3,682 3,526 1,320 1,865 5,002 5,391 – attributable to non-controlling interests 1,397 1,404 — — 1,397 1,404 – attributable to Rio Tinto 2,285 2,122 1,320 1,865 3,605 3,987
Cash flow statement summary for the year ended 31 December2020
US$m2019
US$m2020
US$m2019
US$m2020
US$m2019
US$m
Cash flow from operations 1,491 1,255 1,771 1,447 3,262 2,702 Dividends paid to non-controlling interests (332) (139) (165) — (497) (139)
(m) "Other companies and eliminations” includes North Mining Limited (a wholly owned subsidiary of the Group which accounts for its interest in Robe River) and goodwill of US$383 million (2019: US$349 million) that arose on the Group’s acquisition of its interest in Robe River.
33 Principal joint operations At 31 December 2020Company and country of incorporation/operation Principal activities Group interest (%)
AustraliaTomago Aluminium Joint Venture Aluminium smelting 51.6Gladstone Power Station Power generation 42.1Hope Downs Joint Venture Iron ore mining 50Queensland Alumina Limited(a) (b) Alumina production 80Pilbara Iron Arrangements Infrastructure, corporate and mining services (c)New ZealandNew Zealand Aluminium Smelters Limited(a) (b) Aluminium smelting 79.4CanadaAluminerie Alouette Inc. Aluminium production 40USPechiney Reynolds Quebec Inc(b) (d) Aluminium smelting 50.2
This list includes only those joint operations that have a more significant impact on the profit or operating assets of the Group. Refer to note 44 for a list of related undertakings.
The Group’s joint operations are held by intermediate holding companies and not directly by Rio Tinto plc or Rio Tinto Limited.
(a) Although the Group has a 79.4% interest in New Zealand Aluminium Smelters Limited and an 80% interest in Queensland Alumina Limited, decisions about activities that significantly affect the returns that are generated require agreement of both parties to the arrangements, giving rise to joint control.
(b) Queensland Alumina Limited, New Zealand Aluminium Smelters Limited and Pechiney Reynolds Quebec Inc. are joint arrangements that are primarily designed for the provision of output to the parties sharing joint control; this indicates that the parties have rights to substantially all the economic benefits of the assets. The liabilities of the arrangements are in substance satisfied by cash flows received from the parties; this dependence indicates that the parties in effect have obligations for the liabilities. It is these facts and circumstances that give rise to the classification of these entities as joint operations.
(c) A number of arrangements are in place between the Australian Iron Ore operations managed by Rio Tinto which allow their respective assets to be operated as a single integrated network across the Pilbara region. The arrangements are managed through two wholly owned subsidiaries: Pilbara Iron (Company) Services Pty Ltd and Pilbara Iron Pty Ltd. In assessing the Pilbara Iron Arrangements, it has been concluded that they collectively constitute a joint operation on the basis that decisions about relevant activities require unanimous consent. The resulting efficiencies are shared between Rio Tinto and Robe River Iron Associates (Robe River), and the parties fund all of the cash flow requirements of Pilbara Iron (Company) Services Pty Ltd and Pilbara Iron Pty Ltd.
(d) Pechiney Reynolds Quebec Inc. has a 50.1% interest in the Aluminerie de Bécancour, Inc. aluminium smelter, which is located in Canada.
Annual Report 2020 | riotinto.com 265265Annual Report 2020 | riotinto.com
Financial Statements
Additional disclosures

34 Principal joint ventures At 31 December 2020
Company and country of incorporation/operation Principal activitiesNumber of
shares held
Class of shares
held
Proportion of class
held (%)
Group interest
(%)
ChileMinera Escondida Ltda(a) Copper mining and refining — — — 30 OmanSohar Aluminium Co. L.L.C.(b) Aluminium smelting; power generation 37,500 Ordinary 20 20
This list includes only those joint ventures that have a more significant impact on the profit or operating assets of the Group. Refer to note 44 for a list of related undertakings.
The Group’s principal joint ventures are held by intermediate holding companies and not directly by Rio Tinto plc or Rio Tinto Limited.
(a) Although the Group has a 30% interest in Minera Escondida Ltda, participant and management agreements provide for an Owners’ Council whereby significant commercial and operational decisions about the relevant activities that significantly affect the returns that are generated in effect require the joint approval of both Rio Tinto and BHP Billiton (holders of a 57.5% interest). It is therefore determined that Rio Tinto has joint control.The year end of Minera Escondida Ltda is 30 June. The amounts included in the consolidated financial statements of Rio Tinto are, however, based on accounts of Minera Escondida Limitada that are coterminous with those of the Group.
(b) Although the Group holds a 20% interest in Sohar Aluminium Co. L.L.C, decisions about relevant activities that significantly affect the returns that are generated require agreement of all parties to the arrangement. It is therefore determined that Rio Tinto has joint control.
Summary information for joint ventures that are material to the Group This summarised financial information is shown on a 100% basis. It represents the amounts shown in the joint ventures’ financial statements prepared in accordance with IFRS under Group accounting policies, including fair value adjustments and amounts due to and from Rio Tinto.
Minera Escondida
Ltda(c)
2020US$m
Minera Escondida
Ltda(c)
2019US$m
Sohar Aluminum Co.L.L.C.(d)
2020US$m
Sohar Aluminum Co.L.L.C.(d)
2019US$m
Revenue 7,650 7,120 640 715 Depreciation and amortisation (1,427) (1,693) (115) (115) Impairment charges (note 6) — — (1,100) — Other operating costs (2,756) (3,670) (430) (505) Operating profit/(loss) 3,467 1,757 (1,005) 95 Finance expense (137) (157) (20) (35) Income tax (1,197) (627) (15) (10) Profit/(loss) after tax 2,133 973 (1,040) 50 Other comprehensive loss (40) (17) — — Total comprehensive income/(loss) 2,093 956 (1,040) 50 Non-current assets 11,833 12,450 1,850 3,045 Current assets 3,107 2,250 270 290 Current liabilities (1,813) (1,827) (675) (205) Non-current liabilities (4,560) (4,670) (200) (845) Net assets 8,567 8,203 1,245 2,285 Assets and liabilities above include:– cash and cash equivalents 1,103 603 30 20 – current financial liabilities (790) (807) (565) (110) – non-current financial liabilities (2,560) (2,380) (30) (675) Dividends received from joint venture (Rio Tinto share) 585 666 — —
Reconciliation of the above amounts to the investment recognised in the Group balance sheet Group interest 30% 30% 20% 20%
Net assets 8,567 8,203 1,245 2,285 Group’s ownership interest 2,570 2,461 249 457 Carrying value of Group’s interest 2,570 2,461 249 457
(c) In addition to its “Investment in equity accounted units”, the Group recognises deferred tax liabilities of US$358 million (2019: US$362 million) relating to tax on unremitted earnings of equity accounted units.
(d) Under covenants stipulated in the agreement to Sohar Aluminium Co. L.L.C.’s secured loan facilities, Sohar Aluminium Co. L.L.C. is currently restricted from making any shareholder distributions until 2021 unless a specified amount of the loan facilities is funded.
266 Annual Report 2020 | riotinto.com266 Annual Report 2020 | riotinto.com
Financial Statements
Notes to the 2020 Financial Statements

35 Principal associates At 31 December 2020
Company and country of incorporation/operation Principal activitiesNumber of
shares heldClass of
shares held
Proportion of class
held (%)
Group interest
(%)
AustraliaBoyne Smelters Limited(a) Aluminium smelting 153,679,560 Ordinary 59.4 59.4 Brazil
Mineração Rio do Norte S.A.(b) Bauxite mining 25,000,000,000 Ordinary 12.5
12 47,000,000,000 Preferred 11.75
USHalco (Mining) Inc.(c) Bauxite mining 4,500 Common 45 45
This list includes only those associates that have a more significant impact on the profit or operating assets of the Group. Refer to note 44 for a list of related undertakings.
The Group’s principal associates are held by intermediate holding companies and not directly by Rio Tinto plc or Rio Tinto Limited.
(a) The parties that collectively control Boyne Smelters Limited do so through decisions that are determined on an aggregate voting interest that can be achieved by several combinations of the parties. Although each combination requires Rio Tinto’s approval, this is not joint control as defined under IFRS 11. Rio Tinto is therefore determined to have significant influence over this company.
(b) Although the Group holds only 12% of Mineração Rio do Norte S.A., it has representation on its board of directors and a consequent ability to participate in the financial and operating policy decisions. It is therefore determined that Rio Tinto has significant influence.
(c) Halco (Mining) Inc. has a 51% indirect interest in Compagnie des Bauxites de Guinée, a bauxite mine, the core assets of which are located in Guinea.
Summary information for associates that are material to the GroupThis summarised financial information is shown on a 100% basis. It represents the amounts shown in the associate’s financial statements prepared in accordance with IFRS under Group accounting policies, including fair value adjustments and amounts due to and from Rio Tinto.
Boyne Smelters Limited(a)
2020US$m
Boyne Smelters Limited(a)
2019US$m
Revenue — — Loss after tax(b) (198) (7) Other comprehensive income/(loss)(c) 30 (3) Total comprehensive loss (168) (10) Non-current assets 1,037 1,229 Current assets 98 96 Current liabilities (146) (114) Non-current liabilities (779) (814) Net assets 210 397
Reconciliation of the above amount to the investment recognised in the Group balance sheet Group interest 59.4% 59.4%
Net assets 210 397 Group's ownership interest 125 236 Loans to equity accounted units 112 113 Carrying value of Group's interest 237 349
(a) Boyne Smelters Limited is a tolling operation; as such it is dependent on its participants for funding which is provided through cash calls. Rio Tinto has made certain prepayments to Boyne for toll processing of alumina. These are charged to Group operating costs as processing takes place.
(b) In 2020, includes US$200 million of impairment changes. Refer to note 6. (c) "Other comprehensive income/(loss)” is net of amounts recognised by subsidiaries in relation to quasi equity loans.
Annual Report 2020 | riotinto.com 267267Annual Report 2020 | riotinto.com
Financial Statements
Additional disclosures

35 Principal associates continuedSummary information for joint ventures and associates that are not individually material to the Group
Associates2020
US$m
Associates2019US$m
Carrying value of Group's interest 708 704
Profit after tax — 3 Other comprehensive income (5) 10 Total comprehensive income (5) 13
There were no individually material joint ventures in 2019 or 2020.
36 Purchases and sales of subsidiaries, joint ventures, associates and other interests in businesses Acquisitions We have made no material acquisitions over the last three years.
In 2018, we created a joint venture, ELYSIS, with Alcoa and other partners to develop a carbon-free aluminium smelting process. We treated this as an acquisition and accounted for our interest in ELYSIS using the equity method. We invested cash of US$5 million and contributed patents and licensed intellectual property (IP) to the venture. The patents and IP had no carrying value; however, on formation of the arrangement, they were recorded at fair value to reflect the contributions of the other parties in the joint venture. This value was US$171 million (US$141 million after tax).
DisposalsWe have made no material disposals in 2020.
On 16 July 2019 we disposed of our entire 68.62% interest in Rössing Uranium to China National Uranium Corporation Limited for gross cash proceeds of US$6.5 million. After adjusting for cash held on Rössing's balance sheet at the date of disposal and included in the sale, we reported a net cash outflow of US$118 million and recognised a loss on disposal of US$289 million. This includes cumulative currency translation losses of US$212 million recycled from the currency translation reserve on sale of the business.
On 1 June 2018 we disposed of our entire 75% interest in the Winchester South coal development project in Queensland, Australia to Whitehaven Coal Limited for US$200 million. This comprised US$150 million cash which was received during 2018 and an unconditional cash payment of US$50 million which was subsequently received in June 2019. Both receipts were recognised within “net cash generated from operating activities” within the cash flow statement. We recognised a gain on disposal of US$195 million within “profit relating to interests in undeveloped projects” in the income statement.
On 1 August 2018 we completed the sale of our entire interest in the Hail Creek coal mine (82.0%) and the Valeria coal development project (71.2%) in Queensland, Australia to Glencore for a total consideration of US$1.7 billion.
We received net proceeds of US$1,545 million after completion adjustments in respect of the Hail Creek component of this transaction, resulting in a pre-tax gain of US$1,141 million. During 2019 we received a further US$26 million relating to working capital adjustments in respect of this sale. We also received cash proceeds in 2018 of US$170 million in respect of Valeria. Of this amount, US$87 million, relating to the sale of land and investments in associates, was included in investing cash flow, resulting in a pre-tax gain of US$18 million. The remaining US$83 million proceeds were recognised in operating cash flow, resulting in a pre-tax gain of US$83 million in “profit relating to interests in undeveloped projects”.
Also on 1 August 2018, we completed the sale of our entire interest in the Kestrel underground coal mine (80.0%) for US$2.25 billion to a consortium comprising EMR Capital (EMR) and PT Adaro Energy Tbk (Adaro). We received net cash proceeds of US$2,270 million, resulting in a pre-tax gain of US$1,010 million.
On 14 December 2018 we completed the sale of the Dunkerque aluminium smelter in northern France to Liberty House for US$500 million, subject to final adjustments. In 2018 we received net cash proceeds of US$385 million. We recognised a pre-tax gain on disposal of US$128 million.
On 21 December 2018 we sold our interest in the Grasberg mine for US$3.5 billion as part of a series of transactions involving Inalum (PT Indonesia Asahan Aluminium (Persero)) and Freeport-McMoRan Inc. Of the US$3.5 billion received, US$107 million related to our attributable share of copper and gold revenues for 2018, net of our capital contribution for the year. The remaining net proceeds of US$3,392 million were included in investing cash flows and gave rise to a gain on disposal of US$2,146 million.
On 1 September 2017, we disposed of our 100% shareholding in Coal & Allied Industries Limited to Yancoal Australia Limited for a total consideration of US$2.69 billion (before working capital adjustments). This comprised US$2.45 billion in cash paid on the closing date and a further US$240 million of unconditional guaranteed royalty payments. Total net cash proceeds received in 2017, net of working capital adjustments, transaction costs and cash transferred, were US$2.54 billion. This included receipt of US$110 million of the unconditional royalty payments. In 2018 we received a further US$90 million of unconditional royalty payments and in 2019 an additional US$20 million. We received US$10 million in 2020 and the final US$10 million was received in early 2021.
268 Annual Report 2020 | riotinto.com268 Annual Report 2020 | riotinto.com
Financial Statements
Notes to the 2020 Financial Statements

269Annual Report 2020 | riotinto.com
Financial Statements
Additional disclosures

38 Auditors’ remuneration Group auditors’ remuneration(a)
2020 US$m
2019US$m
2018US$m
Audit of the Group 11.0 9.6 9.2 Audit of subsidiaries 6.3 6.8 7.5 Total audit 17.3 16.4 16.7
Audit-related assurance service 0.8 0.8 0.9 Other assurance services(b) 1.4 1.9 3.3 Total assurance services 2.2 2.7 4.2 Tax compliance — 0.1 — Other non-audit services not covered above 0.1 — 0.2 Total non-audit services 2.3 2.8 4.4
Total Group auditors’ remuneration 19.6 19.2 21.1
Audit fees payable to other accounting firmsAudit of the financial statements of the Group’s subsidiaries(c) 0.6 1.4 1.4 Fees in respect of pension scheme audits 0.1 0.1 0.1 Total audit fees payable to other accounting firms 0.7 1.5 1.5
(a) In 2020, all amounts were paid to member firms of KPMG. In 2019 and 2018, all amounts were paid to member firms of PwC, being the Group's auditors for these financial years. The remuneration payable to KPMG, the Group auditors, is approved by the Audit Committee. The Committee sets the policy for the award of non-audit work to the auditors and approves the nature and extent of such work, and the amount of the related fees, to ensure that independence is maintained. The fees disclosed above consolidate all payments made to member firms of KPMG by the companies and their subsidiaries, along with fees in respect of joint operations paid for by the Group and includes an estimate of the costs to complete the 2020 audit. Non-audit services arise largely from assurance and/or regulation related work.
(b) Other assurance services relates to the review of non-statutory financial information including sustainability reporting.(c) In 2019 and 2018 these amounts include fees payable to KPMG in respect of subsidiaries who's statutory auditor was KPMG prior to their appointment as the Group's auditor.
39 Related-party transactions Information about material related-party transactions of the Rio Tinto Group is set out below.
Subsidiary companies and joint operations Details of investments in principal subsidiary companies are disclosed in note 32. Information relating to joint operations can be found in note 33.
Equity accounted units Transactions and balances with equity accounted units are summarised below. Purchases, trade and other receivables, and trade and other payables relate largely to amounts charged by equity accounted units for toll processing of alumina and purchasing of bauxite and aluminium. Sales relate largely to sales of alumina to equity accounted units for smelting into aluminium.
Note2020
US$m2019
US$m2018
US$m
Income statement itemsPurchases from equity accounted units (960) (1,155) (1,209) Sales to equity accounted units 271 268 493
Cash flow statement itemsDividends from equity accounted units 594 669 800 Net funding of equity accounted units (43) (33) (9)
Balance sheet itemsInvestments in equity accounted units(a) 15 3,764 3,971 4,299 Loans to equity accounted units 19 41 39 38 Trade and other receivables: amounts due from equity accounted units(b) 18 251 259 278 Trade and other payables: amounts due to equity accounted units 24 (241) (271) (223)
(a) Investments in equity accounted units include quasi equity loans. Further information about investments in equity accounted units is set out in notes 34 and 35. (b) This includes prepayments of tolling charges.
Pension funds Information relating to pension fund arrangements is set out in note 42.
Directors and key management Details of directors’ and key management’s remuneration are set out in note 37 and in the Remuneration Report on pages 176-184.
270 Annual Report 2020 | riotinto.com270 Annual Report 2020 | riotinto.com
Financial Statements
Notes to the 2020 Financial Statements

40 Exchange rates in US$ The principal exchange rates used in the preparation of the 2020 financial statements were:
Full-year average Year-end
2020 2019 2018 2020 2019 2018
Sterling 1.28 1.28 1.34 1.36 1.31 1.27 Australian dollar 0.69 0.70 0.75 0.77 0.70 0.70 Canadian dollar 0.75 0.75 0.77 0.78 0.77 0.73 Euro 1.14 1.12 1.18 1.23 1.12 1.14 South African rand 0.061 0.069 0.076 0.068 0.071 0.069
41 Share-based payments Rio Tinto plc and Rio Tinto Limited have a number of share-based incentive plans, which are described in detail in the Remuneration Report. These plans have been accounted for in accordance with the fair value recognition provisions of IFRS 2 “Share-based Payment”.
The charge that has been recognised in the income statement for Rio Tinto’s share-based incentive plans, and the related liability (for cash-settled awards), is set out in the table below.
Charge recognised for the year Liability at the end of the year
2020 US$m
2019US$m
2018US$m
2020 US$m
2019US$m
Equity-settled awards 131 118 118 — — Cash-settled awards 7 5 4 7 19 Total 138 123 122 7 19
The main Rio Tinto plc and Rio Tinto Limited plans are as follows:
UK Share Plan (formerly the Share Ownership Plan) The fair values of Matching and Free Shares made by Rio Tinto plc are taken to be the market value of the shares on the date of purchase. These awards are settled in equity.
Equity Incentive Plan In 2018, shareholders approved the introduction of the Rio Tinto 2018 Equity Incentive Plan (the “EIP”). From 2018, all long-term incentive awards have been granted under this umbrella plan which allows for awards in the form of Performance Share Awards (PSA), Management Share Awards (MSA) and Bonus Deferral Awards (BDA) to be granted.
Performance Share Awards (Performance Share Plans prior to 2018)Participants are generally assigned shares in settlement of their PSA on vesting and therefore the awards are accounted for in accordance with the requirements applying to equity-settled share-based payment transactions, including the dividends accumulated from date of award to vesting.
For the parts of awards with Total Shareholder Return (TSR) performance conditions, the fair value of the awards is calculated using a Monte Carlo simulation model taking into account the TSR performance conditions. One third of the awards granted up to 2017 (inclusive) are subject to an earnings margin performance target relative to ten global mining comparators. As this is a non-market related performance condition, under IFRS 2, the fair value recognised is reviewed at each accounting date based on the directors’ expectations for the proportion vesting. Forfeitures prior to vesting are assumed at 5% per annum of outstanding awards (2019: 5% per annum).
For grants made from 2018, the earnings margin performance target applying to the PSA was removed and instead all of the awards are subject to the TSR performance conditions set out in the Remuneration Report.
Management Share Awards (Management Share Plans prior to 2018)The vesting of these awards is dependent on service conditions being met; no performance conditions apply. In general, the awards will be settled in equity, including the dividends accumulated from date of award to vesting and therefore the awards are accounted for in accordance with the requirements applying to equity-settled share-based payment transactions.
The fair value of each award on the day of grant is equal to the share price on the day of grant. Forfeitures prior to vesting are assumed at 7% per annum of outstanding awards (2019: 7% per annum).
Annual Report 2020 | riotinto.com 271271Annual Report 2020 | riotinto.com
Financial Statements
Additional disclosures

41 Share-based payments continuedBonus Deferral Awards (Bonus Deferral Plans prior to 2018) Bonus Deferral Awards (BDA) provide for the mandatory deferral of 50% of the bonuses for executive directors and Executive Committee members and 25% of the bonuses for other executives.
The vesting of these awards is dependent only on service conditions being met. In general, the awards will be settled in equity including the dividends accumulated from date of award to vesting and therefore the awards are accounted for in accordance with the requirements applying to equity-settled share-based payment transactions. The fair value of each award on the day of grant is equal to the share price on the day of grant. Forfeitures prior to vesting are assumed at 3% per annum of outstanding awards (2019: 3% per annum).
Global Employee Share Plans The Global Employee Share Plans were introduced in 2012. Under these Plans, the companies provide a matching share award for each investment share purchased by a participant. The vesting of these matching awards is dependent on service conditions being met and the continued holding of investment shares by the participant until vesting. These awards are settled in equity including the dividends accumulated from date of award to vesting. The fair value of each matching share on the day of grant is equal to the share price on the date of purchase less a deduction of 15% for cancellations (caused by employees electing to withdraw their investment shares before vesting of their matching shares). Forfeitures prior to vesting are assumed at 5% per annum of outstanding awards (2019: 5% per annum).
The Management Share Awards, Performance Share Awards, Bonus Deferral Awards, Equity Incentive Plan, Global Employee Share Plans and UK Share Plan together represent 100% (2019: 100%) of the total IFRS 2 charge for Rio Tinto plc and Rio Tinto Limited plans in 2020.
Performance Share Awards (granted under either the Performance Share Plans or the Equity Incentive Plans) Rio Tinto plc awards Rio Tinto Limited awards
2020number
Weightedaverage fair
value at grantdate
2020£
2019number
Weightedaverage fair
value at grantdate
2019£
2020number
Weightedaverage fair
value at grantdate
2020A$
2019number
Weightedaverage fair
value at grantdate
2019A$
Unvested awards at 1 January 3,803,394 22.20 3,845,082 21.86 1,636,517 45.11 1,797,279 43.34 Awarded 716,111 13.55 755,735 24.68 198,863 33.56 297,189 54.55 Forfeited (136,030) 21.13 (122,961) 23.95 (178,921) 46.37 (126,775) 44.02 Failed performance conditions (145,661) 16.64 (384,130) 23.79 (63,852) 33.38 (188,956) 46.42 Vested (459,773) 20.55 (290,332) 21.36 (201,234) 41.21 (142,220) 41.72 Unvested awards at 31 December 3,778,041 21.01 3,803,394 22.20 1,391,373 44.40 1,636,517 45.11
Rio Tinto plc awards Rio Tinto Limited awards
2020number
Weightedaverage fair
value at grantdate
2020£
2019number
Weightedaverage fair
value at grantdate
2019£
2020number
Weightedaverage fair
value at grantdate
2020A$
2019number
Weightedaverage fair
value at grantdate
2019A$
Vested awards settled in shares during the year (including dividend shares applied on vesting) 476,602 43.13 339,821 45.52 217,287 93.48 151,607 100.30
Vested awards settled in cash during the year (including dividend shares applied on vesting) 108,887 43.13 1,279 43.65 28,208 93.82 1,347 92.97
In addition to the equity-settled awards shown above, there were 48,191 Rio Tinto plc and 15,164 Rio Tinto Limited cash-settled awards outstanding at 31 December 2020 (2019: 49,019 Rio Tinto plc and 276,722 Rio Tinto Limited cash-settled awards outstanding). The total liability for these awards at 31 December 2020 was US$3 million (2019: US$13 million).
272 Annual Report 2020 | riotinto.com272 Annual Report 2020 | riotinto.com
Financial Statements
Notes to the 2020 Financial Statements

Management Share Awards, Bonus Deferral Awards (granted under the Management Share Plans, Bonus Deferral Plans or Equity Incentive Plans), Global Employee Share Plans and UK Share Plan (combined)
Rio Tinto plc awards(a) Rio Tinto Limited awards
2020number
Weightedaverage fair
value at grantdate
2020£
2019number
Weightedaverage fair
value at grantdate
2019£
2020number
Weightedaverage fair
value at grantdate
2020A$
2019number
Weightedaverage fair
value at grantdate
2019A$
Unvested awards at 1 January(b) 2,613,013 37.14 3,042,020 31.43 2,273,669 75.46 2,613,930 61.71 Awarded 1,190,528 36.27 1,043,817 40.41 921,070 83.20 846,008 86.56 Forfeited (99,038) 44.42 (224,402) 39.46 (60,935) 85.01 (174,025) 72.18 Cancelled (33,955) 37.72 (24,043) 32.87 (50,354) 71.45 (35,481) 60.91 Vested (1,019,687) 34.46 (1,224,379) 25.40 (866,716) 65.19 (976,763) 49.39 Unvested awards at 31 December(b) 2,650,861 37.50 2,613,013 37.14 2,216,734 82.52 2,273,669 75.46 Comprising:– Management Share Awards 1,352,759 38.73 1,398,039 38.68 1,291,203 85.80 1,363,601 78.67 – Bonus Deferral Awards 211,905 36.14 192,878 41.95 53,324 85.53 87,930 87.81 – Global Employee Share Plan 1,050,608 36.06 982,932 33.98 872,207 77.47 822,138 68.82 – UK Share Plan 35,589 41.54 39,164 37.86 — — — —
2020number
Weightedaverage fair
value at grantdate
2020£
2019number
Weightedaverage fair
value at grantdate
2019£
2020number
Weightedaverage fair
value at grantdate
2020A$
2019number
Weightedaverage fair
value at grantdate
2019A$
Vested awards settled in shares during the year (including dividend shares applied on vesting):
– Management Share Awards 707,133 42.26 681,242 43.68 640,948 97.74 582,948 93.05 – Bonus Deferral Awards 111,233 49.71 163,076 42.53 63,404 101.96 85,142 97.30 – Global Employee Share Plan 401,169 43.82 543,426 43.04 299,381 98.60 421,614 91.50 – UK Share Plan 2,392 45.73 34,196 42.21 — — — —
Vested awards settled in cash during the year (including dividend shares applied on vesting):
– Bonus Deferral Awards 19,617 48.34 — — — — — —
(a) Awards of Rio Tinto American Depository Receipts (ADRs) under the Global Employee Share Plan are included within the totals for Rio Tinto plc awards for the purpose of these tables. (b) These numbers are presented and calculated in accordance with IFRS 2 and represent awards for which an IFRS 2 charge continues to be accrued for.
In addition to the equity-settled awards shown above, there were 89,253 Rio Tinto plc and 14,878 Rio Tinto Limited cash-settled awards outstanding at 31 December 2020 (2019: 52,881 Rio Tinto plc and 81,050 Rio Tinto Limited cash-settled awards outstanding). The total liability for these awards at 31 December 2020 was US$4 million (2019: US$6 million).
Annual Report 2020 | riotinto.com 273273Annual Report 2020 | riotinto.com
Financial Statements
Additional disclosures

42 Post-retirement benefits Description of plans The Group operates a number of pension and post-retirement healthcare plans around the world. Some of these plans are defined contribution and some are defined benefit, with assets held in separate trusts, foundations and similar entities.
Defined benefit pension and post-retirement healthcare plans expose the Group to a number of risks:
Uncertainty in benefit payments The value of the Group’s liabilities for post-retirement benefits will ultimately depend on the amount of benefits paid out.This in turn will depend on the level of future pay increases, the level of inflation (for those benefits that are subject to some form of inflation protection) and how long individuals live.
Volatility in asset values The Group is exposed to future movements in the values of assets held in pension plans to meet future benefit payments.
Uncertainty in cash funding Movements in the values of the obligations or assets may result in the Group being required to provide higher levels of cash funding, although changes in the level of cash required can often be spread over a number of years. In some countries control over the rate of cash funding or over the investment policy for pension assets might rest to some extent with a trustee body or other body that is not under the Group’s direct control. In addition the Group is also exposed to adverse changes in pension regulation.
For these reasons the Group has a policy of moving away from defined benefit pension provisions and towards defined contribution arrangements instead. The defined benefit pension plans for salaried employees are closed to new entrants in almost all countries. For unionised employees, some plans remain open.
The Group does not usually participate in multi-employer plans in which the risks are shared with other companies using those plans. The Group’s participation in such plans is immaterial and consequently no detailed disclosures are provided in this note.
Pension plans The majority of the Group’s defined benefit pension obligations are in Canada, the UK, the US and Switzerland.
In Canada the benefits for salaried staff are generally linked to final average pay and the plans are generally closed to new entrants. Benefits for bargaining employees are reviewed in negotiation with unions and are typically linked either to final average pay or to a flat monetary amount per year of service. New employees join arrangements which are defined contribution from the Group’s perspective, with any required additional funding being provided by employees. The plans are subject to the regulatory requirements that apply to Canadian pension plans in the relevant provinces and territories (predominantly Quebec). Pension Committees are responsible for ensuring that the plans operate in a manner that is compliant with the relevant regulations. The Pension Committees generally have a number of members appointed by the sponsor and a number appointed by the plan participants. In some cases there is also an independent Committee member.
The defined benefit sections of the UK arrangements are linked to final pay. New employees are admitted to defined contribution sections. The plans are subject to the regulatory requirements that apply to UK pension plans. Trustees are responsible for ensuring that the plans operate in a manner that is compliant with UK regulations. The trustee board governing the main UK plans has a number of directors appointed by the sponsor, a number appointed by the plan participants and an independent trustee director.
A number of defined benefit pension plans are sponsored by the US entities. Benefits for salaried staff are generally linked to final average pay. Benefits for bargaining employees are reviewed in negotiation with unions and are typically a flat monetary amount per year of service. New employees are admitted to defined contribution plans. A Benefits Governance Committee is responsible for ensuring that the plans are compliant with US regulations. Members of that Committee are appointed by the sponsor.
In Europe, there are defined benefit plans in Switzerland, Germany and France. The largest single plan is in Switzerland, which provides benefits linked to final average pay. The Swiss plan is overseen by a foundation board which is responsible for ensuring that the plan complies with Swiss regulations. Foundation board members are appointed by the plan sponsor, by employees and by retirees.
In Australia, the main arrangements are principally defined contribution in nature but there are sections providing defined benefits linked to final pay, typically paid in lump sum form. These arrangements are managed by an independent financial institution. Rio Tinto may nominate candidates to be considered for appointment to the governing board, as may other employers. One third of the board positions are nominated by employers, with the remaining positions being filled by independent directors and directors nominated by participants.
The Group also operates a number of unfunded defined benefit plans, which are included in the figures below.
Post-retirement healthcare plans Certain subsidiaries of the Group, mainly in the US and Canada, provide health and life insurance benefits to retired employees and in some cases to their beneficiaries and covered dependants. Eligibility for cover is dependent upon certain age and service criteria. These arrangements are generally unfunded, and are included in the figures below.
Plan assets The assets of the pension plans are invested predominantly in a diversified range of equities, bonds and property. Consequently, the funding level of the pension plans is affected by movements in the level of equity markets and also by movements in interest rates. The Group monitors its exposure to changes in interest rates and equity markets and also measures its balance sheet pension risk using a value at risk approach. These measures are considered when deciding whether significant changes in investment strategy are required. Investment strategy reviews are conducted on a periodic basis for the main pension plans to determine the optimal investment mix bearing in mind the Group’s tolerance for risk, the risk tolerance of the local sponsor companies and the views of the Pension Committees and trustee boards who are legally responsible for the investments of the plans. The assets of the pension plans may also be invested in Qualifying Insurance Policies which provide a stream of payments to match the benefits being paid out by the plans, thereby removing investment, inflation and longevity risks. In Canada, the UK and Switzerland, the Group works with the governing bodies to ensure that the investment policy adopted is consistent with the Group’s tolerance for risk. In the US the Group has direct control over the investment policy, subject to local investment regulations.
274 Annual Report 2020 | riotinto.com274 Annual Report 2020 | riotinto.com
Financial Statements
Notes to the 2020 Financial Statements

The proportions of the total fair value of assets in the pension plans for each asset class at the balance sheet date were:
2020 2019
Equities 21.1% 20.4% – Quoted 17.9% 17.0% – Private 3.2% 3.4% Bonds 55.8% 63.4% – Government fixed income 17.7% 18.4% – Government inflation-linked 9.6% 16.2% – Corporate and other publicly quoted 22.6% 24.1% – Private 5.9% 4.7% Property 7.5% 8.8% – Quoted property funds 3.1% 3.4% – Unquoted property funds 4.4% 5.4% Qualifying insurance policies 11.3% 3.1% Cash & other 4.3% 4.3% Total 100.0% 100.0%
The assets of the plans are managed on a day-to-day basis by external specialist fund managers. These managers may invest in the Group’s securities subject to limits imposed by the relevant fiduciary committees and local legislation. The approximate total holding of Group securities within the plans is US$4 million (2019: US$3 million).
The holdings of quoted equities are invested either in pooled funds or segregated accounts held in the name of the relevant pension funds. These equity portfolios are well diversified in terms of the geographic distribution and market sectors.
The holdings of government bonds are generally invested in the debt of the country in which a pension plan is situated. Corporate and other quoted bonds are usually of investment grade. Private debt is mainly held in the North American and UK pension funds and is invested in North American and European companies.
The property funds are invested in a diversified range of properties.
The holdings of cash & other are predominantly cash and short-term money market instruments.
Investments in private equity, private debt and property are less liquid than the other investment classes listed above and therefore the Group’s investment in those asset classes is restricted to a level that does not endanger the liquidity of the pension plans.
Qualifying insurance policies are held with insurance companies that are regulated by the relevant local authorities. The value of those policies is calculated by the local actuaries using assumptions consistent with those adopted for valuing the insured obligations. The significant increase in the allocation to Qualifying insurance policies during 2020 results from an insurance transaction completed by one of the UK pension plans. The purchase price was financed predominantly from that plan’s inflation-linked government bonds.
The Group makes limited use of futures, repurchase agreements and other instruments to manage the interest rate risk in some of its plans. Fund managers may also use derivatives to hedge currency movements within their portfolios and, in the case of bond managers, to take positions that could be taken using direct holdings of bonds but more efficiently.
Maturity of defined benefit obligations An approximate analysis of the maturity of the obligations is given in the table below:
Pensionbenefits
Otherbenefits
2020Total
2019Total
2018Total
Proportion relating to current employees 21 % 19 % 21 % 20 % 19 %Proportion relating to former employees not yet retired 12 % 0 % 11 % 12 % 11 %Proportion relating to retirees 67 % 81 % 68 % 68 % 70 %Total 100 % 100 % 100 % 100 % 100 %Average duration of obligations (years) 14.4 13.5 14.3 14.4 13.4
Geographical distribution of defined benefit obligations An approximate analysis of the geographic distribution of the obligations is given in the table below:
Pensionbenefits
Otherbenefits
2020Total
2019Total
2018Total
Canada 54 % 46 % 53 % 53 % 48 %UK 30 % 2 % 28 % 28 % 28 %US 7 % 50 % 10 % 10 % 14 %Switzerland 5 % 0 % 5 % 5 % 5 %Other 4 % 2 % 4 % 4 % 5 %Total 100 % 100 % 100 % 100 % 100 %
Annual Report 2020 | riotinto.com 275275Annual Report 2020 | riotinto.com
Financial Statements
Additional disclosures

42 Post-retirement benefits continuedTotal expense recognised in the income statement
PensionbenefitsUS$m
OtherbenefitsUS$m
2020Total
US$m
2019TotalUS$m
2018TotalUS$m
Current employer service cost for defined benefit plans (131) (6) (137) (125) (165) Past service cost (2) — (2) — (36) Curtailment gains — — — — 2 Settlement (losses)/gains (1) — (1) 51 5 Net interest on net defined benefit liability (22) (27) (49) (58) (79) Non-investment expenses paid from the plans (16) — (16) (14) (15) Total defined benefit expense (172) (33) (205) (146) (288) Current employer service cost for defined contribution and industry-wide plans (262) (2) (264) (238) (244) Total expense recognised in the income statement (434) (35) (469) (384) (532)
The above expense amounts are included as an employee cost within net operating costs. No amounts have been excluded from underlying earnings in 2020, 2019 or 2018.
The settlement gains in 2019 and 2018 were the result of certain US obligations being transferred to external insurance companies and of certain US obligations being settled through a lump sum window exercise being offered to members with a deferred pension. The past service cost in 2018 related primarily to benefit amendments in the US and also included US$9 million to reflect the estimated cost of equalising benefits in the Group's UK schemes, in line with the requirements of the court judgment on 26 October 2018 in the case involving Lloyds Banking Group and relating to Guaranteed Minimum Pensions. A past service cost of US$1 million was recognised in 2020 in relation to the subsequent court judgment addressing the need to equalise historical transfer values.
Total amount recognised in other comprehensive income before tax 2020
US$m2019US$m
2018US$m
Actuarial (losses)/gains (1,242) (1,295) 1,382 Return on assets, net of interest on assets 768 1,033 (527) Gain on application of asset ceiling — — 52 Total (loss)/gain recognised in other comprehensive income (474) (262) 907
Amounts recognised in the balance sheet The following amounts were measured in accordance with IAS 19 at 31 December:
PensionbenefitsUS$m
OtherbenefitsUS$m
2020Total
US$m
2019TotalUS$m
Total fair value of plan assets 14,905 — 14,905 13,923 Present value of obligations – funded (15,731) — (15,731) (14,311) Present value of obligations – unfunded (479) (968) (1,447) (1,342) Present value of obligations – total (16,210) (968) (17,178) (15,653) Net deficit to be shown in the balance sheet (1,305) (968) (2,273) (1,730) Comprising:– Deficits (2,087) (968) (3,055) (2,714) – Surpluses 782 — 782 984 Net deficits on pension plans (1,305) — (1,305) (831) Unfunded post-retirement healthcare obligation — (968) (968) (899)
The surplus amounts shown above are included in the balance sheet as "Receivables and other assets". See note 18.
Deficits are shown in the balance sheet within "Provisions (including post-retirement benefits)". See note 25.
276 Annual Report 2020 | riotinto.com276 Annual Report 2020 | riotinto.com
Financial Statements
Notes to the 2020 Financial Statements

Funding policy and contributions to plans The Group reviews the funding position of its major pension plans on a regular basis and considers whether to provide funding above the minimum level required in each country. In Canada and the US the minimum level is prescribed by legislation. In the UK and Switzerland the minimum level is negotiated with the local trustee or foundation in accordance with the funding guidance issued by the local regulators. In deciding whether to provide funding above the minimum level the Group takes into account other possible uses of cash within the Group, the tax situation of the local sponsoring entity and any strategic advantage that the Group might obtain by accelerating contributions. The Group does not generally pre-fund post-retirement healthcare arrangements.
PensionbenefitsUS$m
OtherbenefitsUS$m
2020Total
US$m
2019TotalUS$m
2018TotalUS$m
Contributions to defined benefit plans 169 32 201 257 248 Contributions to defined contribution plans 259 2 261 235 244 Total 428 34 462 492 492
The level of surplus in the Rio Tinto Pension Fund in the UK is such that it may be used to pay for the employer contributions to the defined contribution section of that Fund, in accordance with the funding arrangements agreed with the Trustee of that Fund. Consequently, the cash paid to defined contribution plans is lower than the defined contribution service cost by US$3 million. Contributions to defined benefit pension plans are kept under regular review and actual contributions will be determined in line with the Group’s wider financing strategy, taking into account relevant minimum funding requirements. As contributions to many plans are reviewed on at least an annual basis, the contributions for 2021 and subsequent years cannot be determined precisely in advance. Most of the Group’s largest pension funds are fully funded on their local funding basis and do not require long-term funding commitments at present. Contributions to defined benefit pension plans for 2021 are estimated to be around US$150 million but may be higher or lower than this depending on the evolution of financial markets and voluntary funding decisions taken by the Group. Contributions for subsequent years are expected to be at similar levels. Healthcare plans are generally unfunded and contributions for future years will be equal to benefit payments net of participant contributions. The Group’s contributions in 2021 are expected to be similar to the amounts paid in 2020.
Movements in the net defined benefit liability A summary of the movement in the net defined benefit liability is shown in the first table below. The subsequent tables provide a more detailed analysis of the movements in the present value of the obligations and the fair value of assets.
PensionbenefitsUS$m
OtherbenefitsUS$m
2020Total
US$m
2019TotalUS$m
Change in the net defined benefit liabilityNet defined benefit liability at the start of the year (831) (899) (1,730) (1,551) Amounts recognised in income statement (172) (33) (205) (146) Amounts recognised in other comprehensive income (416) (58) (474) (262) Employer contributions 169 32 201 257 Arrangements added/divested — — — (5) Assets transferred to defined contribution section (3) — (3) (3) Currency exchange rate (loss) (52) (10) (62) (20) Net defined benefit liability at the end of the year (1,305) (968) (2,273) (1,730)
PensionbenefitsUS$m
OtherbenefitsUS$m
2020Total
US$m
2019TotalUS$m
Change in present value of obligationPresent value of obligation at the start of the year (14,754) (899) (15,653) (14,754) Current employer service costs (131) (6) (137) (125) Past service cost (2) — (2) — Settlements 6 — 6 638 Interest on obligation (357) (27) (384) (476) Contributions by plan participants (22) — (22) (23) Benefits paid 746 32 778 862 Experience gains 46 15 61 111 Changes in financial assumptions (loss) (1,357) (85) (1,442) (1,447) Changes in demographic assumptions gain 127 12 139 41 Arrangements (added) — — — (5) Currency exchange rate (loss) (512) (10) (522) (475) Present value of obligation at the end of the year (16,210) (968) (17,178) (15,653)
Annual Report 2020 | riotinto.com 277277Annual Report 2020 | riotinto.com
Financial Statements
Additional disclosures

42 Post-retirement benefits continuedPensionbenefitsUS$m
OtherbenefitsUS$m
2020Total
US$m
2019TotalUS$m
Change in plan assetsFair value of plan assets at the start of the year 13,923 — 13,923 13,203 Settlements (7) — (7) (587) Interest on assets 335 — 335 418 Contributions by plan participants 22 — 22 23 Contributions by employer 169 32 201 257 Benefits paid (746) (32) (778) (862) Non-investment expenses (16) — (16) (14) Return on plan assets, net of interest on assets 768 — 768 1,033 Assets transferred to defined contribution section (3) — (3) (3) Currency exchange rate gain 460 — 460 455 Fair value of plan assets at the end of the year 14,905 — 14,905 13,923
Most of the settlement amounts shown above relate to the US, where assets and obligations for some pensions in payment were transferred to insurance companies. Obligations were also settled through a lump sum window exercise being offered to members with a deferred pension in the US.
The asset ceiling had no effect during the year. In determining the extent to which the asset ceiling has an effect, the Group considers the funding legislation in each country and the rules specific to each pension plan. The calculation takes into account any minimum funding requirements that may be applicable to the plan, whether any reduction in future Group contributions is available, and whether a refund of surplus may be available. In considering whether any refund of surplus is available the Group considers the powers of trustee boards and similar bodies to augment benefits or wind up a plan. Where such powers are unilateral, the Group does not consider a refund to be available at the end of the life of a plan. Where the plan rules and legislation both permit the employer to take a refund of surplus, the asset ceiling may have no effect, although it may be the case that a refund will only be available many years in the future.
Main assumptions (rates per annum) The main assumptions for the valuations of the plans under IAS 19 are set out below. Where there are multiple plans in a country the rates below are weighted-average figures.
Canada UK US Switzerland
At 31 December 2020Discount rate 2.5% 1.2% 2.2% 0.1% Inflation(a) 1.6% 2.9% 2.1% 0.9% Rate of increase in pensions 0.1% 2.5% —% 0.5% Rate of increase in salaries 2.8% 3.6% 3.6% 1.9% At 31 December 2019Discount rate 3.1% 2.0% 3.1% 0.2% Inflation(a) 1.6% 2.9% 2.0% 1.1% Rate of increase in pensions 0.1% 2.5% —% 0.2% Rate of increase in salaries 2.8% 3.5% 3.5% 2.1%
(a) The inflation assumption shown for the UK is for the Retail Price Index. The assumption for the Consumer Price Index at 31 December 2020 was 2.1% (2019: 2.0%).
The main financial assumptions used for the healthcare plans, which are predominantly in the US and Canada, were: discount rate: 2.5% (2019: 3.3%); medical trend rate: 6.3% reducing to 4.6% by the year 2031 broadly on a straight line basis (2019: 6.1%, reducing to 4.6% by the year 2029); claims costs based on individual company experience.
For both the pension and healthcare arrangements the post-retirement mortality assumptions allow for future improvements in longevity. The mortality tables used imply that a man aged 60 at the balance sheet date has a weighted average expected future lifetime of 27 years (2019: 27 years) and that a man aged 60 in 2040 would have a weighted average expected future lifetime of 28 years (2019: 28 years).The mortality tables are generally based upon the latest standard tables published in each country, adjusted appropriately to reflect the actual mortality experience of the plan participants where credible data is available..
278 Annual Report 2020 | riotinto.com278 Annual Report 2020 | riotinto.com
Financial Statements
Notes to the 2020 Financial Statements

Sensitivity The values reported for the defined benefit obligations are sensitive to the actuarial assumptions used for projecting future benefit payments and discounting those payments. In order to estimate the sensitivity of the obligations to changes in assumptions, we calculate what the obligations would be if we were to make changes to each of the key assumptions in isolation. The difference between this figure and the figure calculated using our stated assumptions is an indication of the sensitivity to changes in each assumption. The results of this sensitivity analysis are summarised in the table below. Note that this approach is valid for small changes in the assumptions but will be less accurate for larger changes in the assumptions. The sensitivity to inflation includes the impact on pension increases, which are generally linked to inflation where they are granted.
2020 2019
Approximate(increase)/
decrease in obligations
Approximate(increase)/
decrease in obligations
Assumption Change in assumptionPensions
US$mOtherUS$m
PensionsUS$m
OtherUS$m
Discount rate Increase of 0.5 percentage points 988 62 894 56 Decrease of 0.5 percentage points (1,186) (66) (1,057) (60)
Inflation Increase of 0.5 percentage points (484) (19) (447) (17) Decrease of 0.5 percentage points 450 17 422 15
Salary increases Increase of 0.5 percentage points (81) (1) (55) (1) Decrease of 0.5 percentage points 72 1 54 1
Demographic – allowance for future improvements in longevity
Participants assumed to have the mortality rates of individuals who are one year older 520 19 443 18
Participants assumed to have the mortality rates of individuals who are one year younger (562) (19) (465) (18)
Annual Report 2020 | riotinto.com 279279Annual Report 2020 | riotinto.com
Financial Statements
Additional disclosures

43 Rio Tinto Limited parent company disclosuresAs at 31 December
2020A$m
2019A$m
AssetsCurrent assets 12,024 8,338 Non-current assets 3,167 7,332 Total assets 15,191 15,670
LiabilitiesCurrent liabilities (2,665) (2,541) Non-current liabilities (541) (411) Total liabilities (3,206) (2,952) Net assets 11,985 12,718
Shareholders’ equityShare capital 3,504 3,504 Other reserves 345 370 Retained earnings 8,136 8,844 Total equity 11,985 12,718
Profit of the parent company 11,890 11,026
Total comprehensive income of the parent company 11,890 11,026
Prepared under Australian Accounting Standards (AAS) and in accordance with Australian Corporations Act (see page 310). In relation to Rio Tinto Limited there are no significant measurement differences between AAS and IFRS as defined in note 1.
Rio Tinto Limited guaranteesRio Tinto Limited provides a number of guarantees in respect of Group companies.
Rio Tinto plc and Rio Tinto Limited have jointly guaranteed the Group’s external listed debt under the US Shelf Programme, European Debt Issuance Programme and Commercial Paper Programme which totalled A$7.2 billion at 31 December 2020 (31 December 2019: A$8.5 billion); in addition these entities also jointly guarantee the Group’s undrawn credit facility which was A$9.8 billion at 31 December 2020 (31 December 2019: A$10.7 billion).
Rio Tinto Limited has guaranteed other external debt held by Rio Tinto Group entities which totalled A$0.1 billion at 31 December 2020 (31 December 2019: A$0.1 billion).
In addition, Rio Tinto Limited has provided a guarantee of all third-party obligations, including contingent obligations, of Rio Tinto Finance Limited, a wholly owned subsidiary.
Pursuant to the DLC Merger, both Rio Tinto plc and Rio Tinto Limited issued deed poll guarantees by which each company guaranteed contractual obligations incurred by the other or guaranteed by the other.
280 Annual Report 2020 | riotinto.com280 Annual Report 2020 | riotinto.com
Financial Statements
Notes to the 2020 Financial Statements

44 Related undertakings In accordance with section 409 of the UK Companies Act 2006, disclosed below is a full list of related undertakings of the Group. Related undertakings include “subsidiaries”, “associated undertakings”, and “significant holdings in undertakings other than subsidiary companies”. The registered office address, country of incorporation, classes of shares and the effective percentage of equity owned by the Group calculated by reference to voting rights, is disclosed as at 31 December 2020.
The definition of a subsidiary undertaking in accordance with the UK Companies Act 2006 is different from the definition under IFRS. As a result, the related undertakings included within this list may not be the same as the related undertakings consolidated in the Group IFRS financial statements. Unless otherwise disclosed, all undertakings with an effective equity holding of greater than 50% are considered subsidiary undertakings for the purpose of this note.
Refer to notes 32-35 for further information on accounting policies, basis of consolidation, principal subsidiaries, joint operations, joint ventures and associates.
An explanation of the dual listed companies structure of Rio Tinto plc and Rio Tinto Limited can be found on pages 375-376. For completeness, the effective ownership by the Group relates to effective holdings by both entities either together or individually.
Wholly owned subsidiary undertakings
Name of undertaking and countryof incorporation Share class
% of shareclass heldby Groupcompanies
EffectiveGroup %ownership Registered office address
1043802 Ontario Ltd.; Canada CADOrdinary shares
100 100 5300-66 Wellington Street West, Toronto ON M5K 1E6, Canada
10676276 Canada Inc.; Canada CADCommon shares
100 100400-1190 Avenue des Canadiens-de-Montréal, MontréalQC H3B 0E3, Canada
10676284 Canada Inc.; Canada CADCommon shares
100 100400-1190 Avenue des Canadiens-de-Montréal, Montréal QC H3B 0E3, Canada
1109723 B.C. Ltd.; Canada CADCommon shares
100 1001800-510 West Georgia Street, Vancouver BC V6B 0M3,Canada
46106 Yukon Inc.; Canada CADCommon shares
100 100 200-204 Lambert Street, Whitehorse YT Y1A 3T2, Canada
46117 Yukon Inc.; Canada CADCommon shares
100 100200-204 Lambert Street, Whitehorse YT Y1A 3T2, Canada
CADPreferred shares
100 100
535630 Yukon Inc.; Canada CADCommon shares
100 100200-204 Lambert Street, Whitehorse YT Y1A 3T2, Canada
CADPreferred shares
100 100
7999674 Canada Inc.; Canada CADCommon shares
100 100400-1190 Avenue des Canadiens-de-Montréal, MontréalQC H3B 0E3, Canada
Alcan Alumina Ltda.; Brazil BRL1.00Quota shares
100 100Avenida Engenheiro Emiliano Macieira, 1–km 18,Pedrinhas, São Luis, MA, 65095-603, Brazil
Alcan Asia Limited; Hong Kong HKDOrdinary shares
100 100 6/F, Luk Kwok Centre, 72 Gloucester Road, Wan Chai, Hong Kong
Alcan Betriebs- und Verwaltungsgesellschaft GmbH; Germany
€51.13Ordinary shares
100 100 Alusingenplatz 1, D-78221, Singen, Germany
Alcan Chemicals Limited; United Kingdom £1.00Ordinary shares
100 100 6 St James’s Square, London, SW1Y 4AD, United Kingdom
Alcan Composites Brasil Ltda; Brazil BRL0.01 Ordinary shares
100 100Avenida das Nações Unidas, 10.989, 14th floor, Suite 141, São Paulo, 04578-000, Brazil
Alcan Corporation; United States US$0.01 Ordinary shares
100 100CSC, 211 East 7th Street, Suite 620, Austin TX 78701-3218,United States
Annual Report 2020 | riotinto.com 281281Annual Report 2020 | riotinto.com
Financial Statements
Additional disclosures

44 Related undertakings continued Wholly owned subsidiary undertakings continued
Name of undertaking and countryof incorporation Share class
% of shareclass heldby Groupcompanies
EffectiveGroup %ownership Registered office address
Alcan Farms Limited; United Kingdom £1.00Ordinary shares
100 100 6 St James's Square, London, SW1Y 4AD, United Kingdom
Alcan Finances USA LLC; United States US$1,000.00Ordinary shares
100 100CSC, 251 Little Falls Drive, Wilmington DE 19808, UnitedStates
Alcan Gove Development Pty Limited; Australia
AUDOrdinary shares
100 100 123 Albert Street, Brisbane QLD 4000, Australia
Alcan Holdings Australia Pty Limited; Australia AUDClass A shares
100 100123 Albert Street, Brisbane QLD 4000, Australia
AUDOrdinary shares
100 100
Alcan Holdings Europe B.V.; Netherlands €4,570,000,000.00Common shares
100 100 Welplaatweg 104, 3197 KS, Botlek-Rotterdam, Netherlands
Alcan Holdings Nederland B.V.; Netherlands €4,555.00Ordinary shares
100 100 Welplaatweg 104, 3197 KS, Botlek-Rotterdam, Netherlands
Alcan Holdings Switzerland AG (SA/Ltd.); Switzerland
CHF0.01Registered shares
100 100 Badenerstrasse 549, CH-8048 , Zürich, Switzerland
Alcan International Network U.S.A. Inc.; United States
US$Ordinary shares
100 100 CSC, 80 State Street, Albany NY 12207-2543, United States
Alcan Lebensmittelverpackungen GmbH; Germany
€51.13Ordinary shares
100 100 Alusingenplatz 1, D-78221, Singen, Germany
Alcan Management Services (Shanghai) Co., Ltd.; China
US$1.00Ordinary shares
100 100Unit E, 40F Wheelock Square, No. 1717 West Nanjing Road, Jing'an District, Shanghai, 200040, China
Alcan Management Services Canada Limited; Canada
CADOrdinary shares
100 100400-1190 Avenue des Canadiens-de-Montréal, MontréalQC H3B 0E3, Canada
Alcan Northern Territory Alumina Pty Limited; Australia
AUDOrdinary shares
100 100 123 Albert Street, Brisbane QLD 4000, Australia
Alcan Packaging Mühltal GmbH & Co. KG; Germany
€51.13Ordinary shares
100 100 Alusingenplatz 1, D-78221, Singen, Germany
Alcan Primary Metal Australia Pty Ltd; Australia
AUDOrdinary shares
100 100 123 Albert Street, Brisbane QLD 4000, Australia
Alcan Primary Products Company LLC; United States
US$Shares
100 100 CSC, 251 Little Falls Drive, Wilmington DE 19808, United States
Alcan Primary Products Corporation; United States
US$0.01Ordinary shares
100 100 CSC, 211 East 7th Street, Suite 620, Austin TX 78701-3218, United States
Alcan Realty Limited; Canada CADOrdinary shares
100 100 400-1190 Avenue des Canadiens-de-Montréal, Montréal QC H3B 0E3, Canada
Alcan South Pacific Pty Ltd; Australia AUDOrdinary shares
100 100 123 Albert Street, Brisbane QLD 4000, Australia
Alcan Trading AG (SA/Ltd.); Switzerland CHF1000.00Registered shares
100 100 Herostrasse 9, P.O. Box 1954, CH-8048 Zurich, Switzerland
Aluminium Company of Canada Limited; Canada
CADOrdinary shares
100 100 400-1190 Avenue des Canadiens-de-Montréal, Montréal QC H3B 0E3, Canada
AML Properties Pty Ltd; Australia AUDOrdinary shares
100 100 Level 18 Central Park, 152-158 St. Georges Terrace, Perth WA 6000, Australia
Anglesey Aluminium Metal Limited; United Kingdom
£1.00Ordinary shares
100 100 6 St James's Square, London, SW1Y 4AD, United Kingdom
AP Service; France €15.00Ordinary shares
100 100 725 rue Aristide Bergès, 38340, Voreppe, France
Argyle Diamond Mines Pty Limited; Australia AUDOrdinary shares
100 100 Level 18 Central Park, 152-158 St. Georges Terrace, Perth WA 6000, Australia
Argyle Diamonds Limited; Australia(a) AUDClass A shares
100 100Level 18 Central Park, 152-158 St. Georges Terrace, Perth WA 6000, Australia
AUDClass B shares
100 100
282 Annual Report 2020 | riotinto.com282 Annual Report 2020 | riotinto.com
Financial Statements
Notes to the 2020 Financial Statements

Name of undertaking and countryof incorporation Share class
% of shareclass heldby Groupcompanies
EffectiveGroup %ownership Registered office address
Ashton Mining Pty Ltd; Australia AUDOrdinary shares
100 100 Level 18 Central Park, 152-158 St. Georges Terrace, Perth WA 6000, Australia
Ashton Nominees Pty Limited; Australia AUDOrdinary shares
100 100 Level 18 Central Park, 152-158 St. Georges Terrace, Perth WA 6000, Australia
Australian Coal Holdings Pty. Limited; Australia(a)
AUDClass A shares
100 100123 Albert Street, Brisbane QLD 4000, Australia
AUDOrdinary shares
100 100
Australian Mining & Smelting Pty Ltd; Australia(a)
AUDOrdinary shares
100 100 Level 7, 360 Collins Street, Melbourne VIC 3000, Australia
Beasley River Management Pty Limited; Australia
AUDOrdinary shares
100 100 Level 18 Central Park, 152-158 St. Georges Terrace, Perth WA 6000, Australia
Beasley River Mining Pty Limited; Australia AUDOrdinary shares
100 100 Level 18 Central Park, 152-158 St. Georges Terrace, Perth WA 6000, Australia
Borax España, S.A.; Spain €150.00Ordinary shares
100 100 CN 340, Km 954, Apartado 197, 12520 NULES, Castellón, Spain
Borax Europe Limited; United Kingdom £0.25Ordinary shares
100 100 6 St James's Square, London, SW1Y 4AD, United Kingdom
Borax Français; France €2.75Ordinary shares
100 100 89 Route de Bourbourg, 59210, Coudekerque-Branche, France
Borax Malaysia Sdn Bhd; Malaysia MYR1.00Ordinary shares
100 100Level 7, Menara Milenium, Jalan Damanlela, Pusat Bandar Damansara, Damansara Heights 50490 Kuala Lumpur, Malaysia
Borax Rotterdam N.V.; Netherlands €453.78Ordinary shares
100 100 Welplaatweg 104, 3197 KS, Botlek-Rotterdam, Netherlands
British Alcan Aluminium Limited; United Kingdom
£1.00Ordinary shares
100 100 6 St James's Square, London, SW1Y 4AD, United Kingdom
Canning Resources Pty Limited; Australia(a) AUDOrdinary shares
100 100 Level 7, 360 Collins Street, Melbourne VIC 3000, Australia
Capricorn Diamonds Investments Pty Limited; Australia
AUDOrdinary shares
100 100 Level 18 Central Park, 152-158 St. Georges Terrace, Perth WA 6000, Australia
Cathjoh Holdings Pty Limited; Australia AUDOrdinary shares
100 100 123 Albert Street, Brisbane QLD 4000, Australia
Champlain Reinsurance Company Ltd.; Switzerland
CHF1.23Registered shares
100 100 Badenerstrasse 549, CH-8048 , Zürich, Switzerland
Channar Management Services Pty Limited; Australia
AUDOrdinary shares
100 100 Level 18 Central Park, 152-158 St. Georges Terrace, Perth WA 6000, Australia
Channar Mining Pty Ltd; Australia AUDOrdinary shares
100 100 Level 18 Central Park, 152-158 St. Georges Terrace, Perth WA 6000, Australia
CIA. Inmobiliaria e Inversiones Cosmos S.A.C.; Peru
PEN1,000.00Ordinary shares
100 100 Calle Santa Maria No. 110 Urb. Miraflores - Miraflores-Lima, Peru
Compania de Transmision Sierraoriente S.A.C.; Peru
PEN1,000.00Ordinary shares
100 100 Calle Santa Maria No. 110 Urb. Miraflores - Miraflores-Lima, Peru
CRA Investments Pty. Limited; Australia(a) AUDOrdinary shares
100 100 Level 7, 360 Collins Street, Melbourne VIC 3000, Australia
CRA Pty Ltd; Australia(a) AUDOrdinary shares
100 100 Level 7, 360 Collins Street, Melbourne VIC 3000, Australia
Daybreak Development LLC; United States US$0.01Common shares
100 100 CSC, 251 Little Falls Drive, Wilmington DE 19808, United States
Daybreak Property Holdings LLC; United States(c) — — 100
CSC, 15 West South Temple, Suite 1701, Salt Lake City UT 84101, United States
Daybreak Secondary Water Distribution Company; United States
US$0.01Common shares
100 100 CSC, 251 Little Falls Drive, Wilmington DE 19808, United States
Daybreak Water Holding LLC; United States US$0.01Common shares
100 100 CSC, 251 Little Falls Drive, Wilmington DE 19808, United States
DB Medical I LLC; United States US$Shares
100 100 CSC, 15 West South Temple, Suite 600, Salt Lake City UT 84101, United States
Annual Report 2020 | riotinto.com 283283Annual Report 2020 | riotinto.com
Financial Statements
Additional disclosures
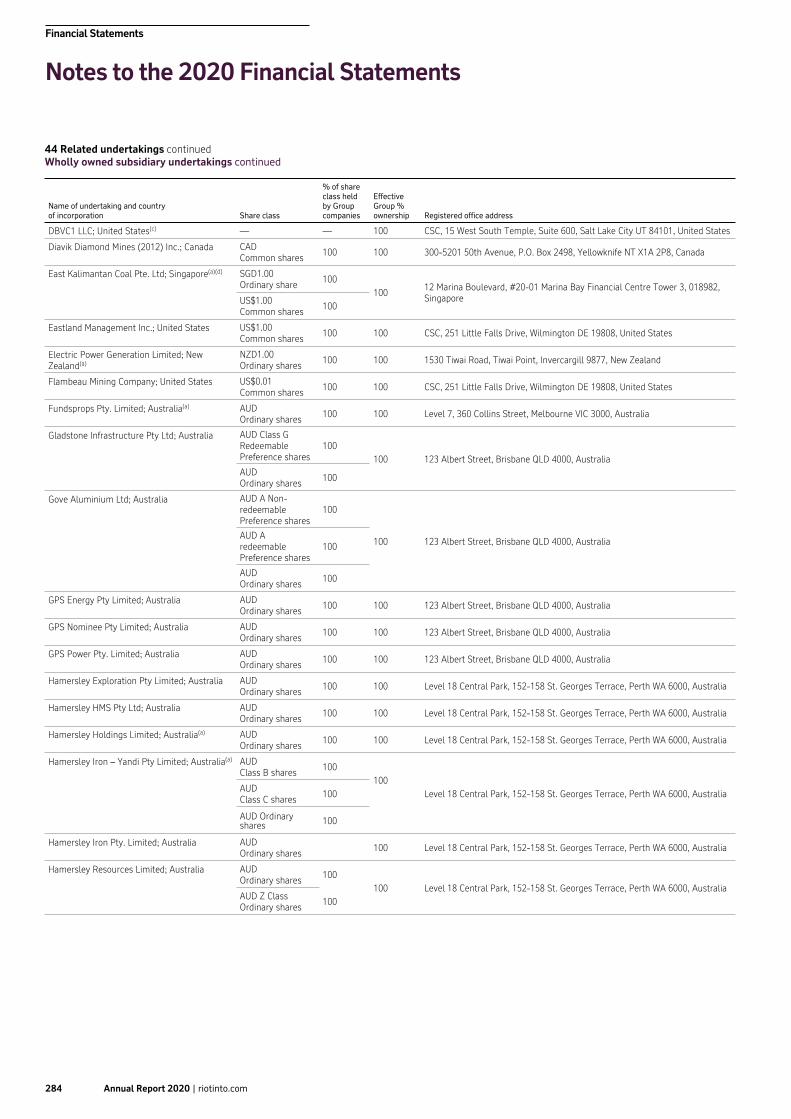
44 Related undertakings continuedWholly owned subsidiary undertakings continued
Name of undertaking and countryof incorporation Share class
% of shareclass heldby Groupcompanies
EffectiveGroup %ownership Registered office address
DBVC1 LLC; United States(c) — — 100 CSC, 15 West South Temple, Suite 600, Salt Lake City UT 84101, United States
Diavik Diamond Mines (2012) Inc.; Canada CADCommon shares
100 100 300-5201 50th Avenue, P.O. Box 2498, Yellowknife NT X1A 2P8, Canada
East Kalimantan Coal Pte. Ltd; Singapore(a)(d) SGD1.00Ordinary share
100100
12 Marina Boulevard, #20-01 Marina Bay Financial Centre Tower 3, 018982, SingaporeUS$1.00
Common shares100
Eastland Management Inc.; United States US$1.00Common shares
100 100 CSC, 251 Little Falls Drive, Wilmington DE 19808, United States
Electric Power Generation Limited; New Zealand(a)
NZD1.00Ordinary shares
100 100 1530 Tiwai Road, Tiwai Point, Invercargill 9877, New Zealand
Flambeau Mining Company; United States US$0.01Common shares
100 100 CSC, 251 Little Falls Drive, Wilmington DE 19808, United States
Fundsprops Pty. Limited; Australia(a) AUDOrdinary shares
100 100 Level 7, 360 Collins Street, Melbourne VIC 3000, Australia
Gladstone Infrastructure Pty Ltd; Australia AUD Class GRedeemable Preference shares
100100 123 Albert Street, Brisbane QLD 4000, Australia
AUDOrdinary shares
100
Gove Aluminium Ltd; Australia AUD A Non- redeemable Preference shares
100
100 123 Albert Street, Brisbane QLD 4000, AustraliaAUD A redeemable Preference shares
100
AUDOrdinary shares
100
GPS Energy Pty Limited; Australia AUDOrdinary shares
100 100 123 Albert Street, Brisbane QLD 4000, Australia
GPS Nominee Pty Limited; Australia AUDOrdinary shares
100 100 123 Albert Street, Brisbane QLD 4000, Australia
GPS Power Pty. Limited; Australia AUDOrdinary shares
100 100 123 Albert Street, Brisbane QLD 4000, Australia
Hamersley Exploration Pty Limited; Australia AUDOrdinary shares
100 100 Level 18 Central Park, 152-158 St. Georges Terrace, Perth WA 6000, Australia
Hamersley HMS Pty Ltd; Australia AUDOrdinary shares
100 100 Level 18 Central Park, 152-158 St. Georges Terrace, Perth WA 6000, Australia
Hamersley Holdings Limited; Australia(a) AUDOrdinary shares
100 100 Level 18 Central Park, 152-158 St. Georges Terrace, Perth WA 6000, Australia
Hamersley Iron – Yandi Pty Limited; Australia(a) AUDClass B shares
100100
Level 18 Central Park, 152-158 St. Georges Terrace, Perth WA 6000, AustraliaAUDClass C shares
100
AUD Ordinary shares 100
Hamersley Iron Pty. Limited; Australia AUDOrdinary shares
100 Level 18 Central Park, 152-158 St. Georges Terrace, Perth WA 6000, Australia
Hamersley Resources Limited; Australia AUDOrdinary shares
100100 Level 18 Central Park, 152-158 St. Georges Terrace, Perth WA 6000, Australia
AUD Z ClassOrdinary shares
100
284 Annual Report 2020 | riotinto.com284 Annual Report 2020 | riotinto.com
Financial Statements
Notes to the 2020 Financial Statements

Name of undertaking and countryof incorporation Share class
% of shareclass heldby Group companies
Effective Group % ownership Registered office address
Hamersley WA Pty Ltd; Australia AUDOrdinary shares
100 100 Level 18 Central Park, 152-158 St. Georges Terrace, Perth WA 6000, Australia
Henlopen Manufacturing Co., Inc.; United States
US$100.00Ordinary shares
100 100 CSC, 80 State Street, Albany NY 12207-2543, United States
High Purity Iron Inc.; United States US$1.00Common shares
100 100 CSC, 251 Little Falls Drive, Wilmington DE 19808, United States
HIsmelt Corporation Pty Limited; Australia(a)(d) AUDClass A shares
100 100 Level 18 Central Park, 152-158 St. Georges Terrace, Perth WA 6000, Australia
Hunter Valley Resources Pty Ltd; Australia AUDA Class shares
100100 123 Albert Street, Brisbane QLD 4000, Australia
AUDB Class shares
100
IEA Coal Research Limited; United Kingdom £1.00Ordinary shares
100 100Apsley House, Third Floor, 176 Upper Richmond Road, London, SW15 2SH, United Kingdom
IEA Environmental Projects Limited; United Kingdom
£1.00Ordinary shares
100 100IEAGHG, Pure Offices Cheltenham Office Park, Hatherley Lane, Cheltenham, GL51 6SH, United Kingdom
Industrias Metalicas Castello S.A.; Spain €6.01Ordinary shares
100 100 Calle Tuset 10, 08006, Barcelona, Catalonia, Spain
Integrity Land and Cattle LLC; United States US$Shares
100 100 CSC, 8825 N. 23rd Avenue, Suite 100, Phoenix AZ 85021, United States
IOC Sales Limited; United Kingdom £1.00Ordinary shares
100 100 6 St James's Square, London, SW1Y 4AD, United Kingdom
Itallumina Srl; Italy(d) €1.00Quotas shares
100 100 Viale Castro Pretorio 122, 00185, Roma, Italy
Johcath Holdings Pty Limited; Australia AUDOrdinary shares
100 100 123 Albert Street, Brisbane QLD 4000, Australia
Juna Station Pty Ltd; Australia AUDOrdinary shares
100 100 Level 18 Central Park, 152-158 St. Georges Terrace, Perth WA 6000, Australia
Kalimantan Gold Pty Limited; Australia AUDOrdinary shares
100 100 Level 7, 360 Collins Street, Melbourne VIC 3000, Australia
Kelian Pty. Limited; Australia(a) AUDOrdinary shares
100 100 Level 7, 360 Collins Street, Melbourne VIC 3000, Australia
Kembla Coal & Coke Pty. Limited; Australia AUDOrdinary shares
100 100 123 Albert Street, Brisbane QLD 4000, Australia
Kennecott Barneys Canyon Mining Company; United States
US$0.01Common shares
100 100 CSC, 251 Little Falls Drive, Wilmington DE 19808, United States
Kennecott Exploration Company; United States US$0.01Common shares
100 100 251 Little Falls Drive, Wilmington DE 19808, United States
Kennecott Exploration Mexico, S.A. de C.V.; Mexico
MXN1,000.00 Ordinary shares
100 100 Felix Berenguer 125 - 4 Col. Lomas Virreyes, Distrito Federal, 11000, Mexico
Kennecott Holdings Corporation; United States US$0.01Common shares
100 100 CSC, 251 Little Falls Drive, Wilmington DE 19808, United States
Kennecott Land Company; United States US$0.01Common shares
100 100 CSC, 251 Little Falls Drive, Wilmington DE 19808, United States
Kennecott Land Investment Company LLC; United States(c) — — 100 CSC, 251 Little Falls Drive, Wilmington DE 19808, United States
Kennecott Molybdenum Company; United States
US$0.01Common shares
100 100 CSC, 251 Little Falls Drive, Wilmington DE 19808, United States
Kennecott Nevada Copper Company; United States
US$0.01Common shares
100 100 CSC, 251 Little Falls Drive, Wilmington DE 19808, United States
Kennecott Ridgeway Mining Company; United States
US$1.00Common shares
100 100 CSC, 251 Little Falls Drive, Wilmington DE 19808, United States
Annual Report 2020 | riotinto.com 285285Annual Report 2020 | riotinto.com
Financial Statements
Additional disclosures
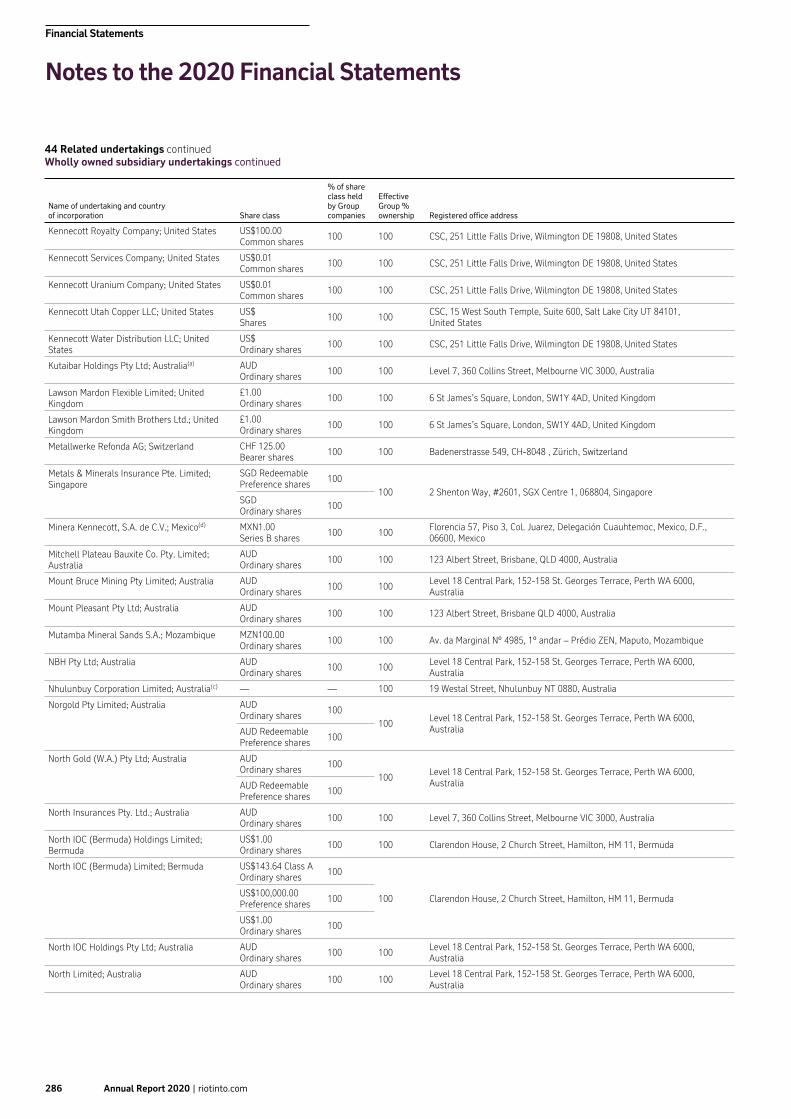
44 Related undertakings continuedWholly owned subsidiary undertakings continued
Name of undertaking and countryof incorporation Share class
% of shareclass heldby Groupcompanies
EffectiveGroup %ownership Registered office address
Kennecott Royalty Company; United States US$100.00Common shares
100 100 CSC, 251 Little Falls Drive, Wilmington DE 19808, United States
Kennecott Services Company; United States US$0.01Common shares
100 100 CSC, 251 Little Falls Drive, Wilmington DE 19808, United States
Kennecott Uranium Company; United States US$0.01Common shares
100 100 CSC, 251 Little Falls Drive, Wilmington DE 19808, United States
Kennecott Utah Copper LLC; United States US$Shares
100 100CSC, 15 West South Temple, Suite 600, Salt Lake City UT 84101, United States
Kennecott Water Distribution LLC; United States
US$Ordinary shares
100 100 CSC, 251 Little Falls Drive, Wilmington DE 19808, United States
Kutaibar Holdings Pty Ltd; Australia(a) AUDOrdinary shares
100 100 Level 7, 360 Collins Street, Melbourne VIC 3000, Australia
Lawson Mardon Flexible Limited; United Kingdom
£1.00Ordinary shares
100 100 6 St James’s Square, London, SW1Y 4AD, United Kingdom
Lawson Mardon Smith Brothers Ltd.; United Kingdom
£1.00Ordinary shares
100 100 6 St James’s Square, London, SW1Y 4AD, United Kingdom
Metallwerke Refonda AG; Switzerland CHF 125.00Bearer shares
100 100 Badenerstrasse 549, CH-8048 , Zürich, Switzerland
Metals & Minerals Insurance Pte. Limited; Singapore
SGD RedeemablePreference shares
100100 2 Shenton Way, #2601, SGX Centre 1, 068804, Singapore
SGDOrdinary shares
100
Minera Kennecott, S.A. de C.V.; Mexico(d) MXN1.00Series B shares
100 100Florencia 57, Piso 3, Col. Juarez, Delegación Cuauhtemoc, Mexico, D.F., 06600, Mexico
Mitchell Plateau Bauxite Co. Pty. Limited; Australia
AUDOrdinary shares
100 100 123 Albert Street, Brisbane, QLD 4000, Australia
Mount Bruce Mining Pty Limited; Australia AUDOrdinary shares
100 100Level 18 Central Park, 152-158 St. Georges Terrace, Perth WA 6000, Australia
Mount Pleasant Pty Ltd; Australia AUDOrdinary shares
100 100 123 Albert Street, Brisbane QLD 4000, Australia
Mutamba Mineral Sands S.A.; Mozambique MZN100.00Ordinary shares
100 100 Av. da Marginal Nº 4985, 1º andar – Prédio ZEN, Maputo, Mozambique
NBH Pty Ltd; Australia AUDOrdinary shares
100 100Level 18 Central Park, 152-158 St. Georges Terrace, Perth WA 6000, Australia
Nhulunbuy Corporation Limited; Australia(c) — — 100 19 Westal Street, Nhulunbuy NT 0880, Australia
Norgold Pty Limited; Australia AUDOrdinary shares
100100
Level 18 Central Park, 152-158 St. Georges Terrace, Perth WA 6000, AustraliaAUD Redeemable
Preference shares100
North Gold (W.A.) Pty Ltd; Australia AUDOrdinary shares
100100
Level 18 Central Park, 152-158 St. Georges Terrace, Perth WA 6000, AustraliaAUD Redeemable
Preference shares100
North Insurances Pty. Ltd.; Australia AUDOrdinary shares
100 100 Level 7, 360 Collins Street, Melbourne VIC 3000, Australia
North IOC (Bermuda) Holdings Limited; Bermuda
US$1.00Ordinary shares
100 100 Clarendon House, 2 Church Street, Hamilton, HM 11, Bermuda
North IOC (Bermuda) Limited; Bermuda US$143.64 Class AOrdinary shares
100
100 Clarendon House, 2 Church Street, Hamilton, HM 11, BermudaUS$100,000.00Preference shares
100
US$1.00Ordinary shares
100
North IOC Holdings Pty Ltd; Australia AUDOrdinary shares
100 100Level 18 Central Park, 152-158 St. Georges Terrace, Perth WA 6000, Australia
North Limited; Australia AUDOrdinary shares
100 100Level 18 Central Park, 152-158 St. Georges Terrace, Perth WA 6000, Australia
286 Annual Report 2020 | riotinto.com286 Annual Report 2020 | riotinto.com
Financial Statements
Notes to the 2020 Financial Statements

Name of undertaking and countryof incorporation Share class
% of shareclass heldby Groupcompanies
EffectiveGroup %ownership Registered office address
North Mining Limited; Australia AUDOrdinary shares
100100 Level 18 Central Park, 152-158 St. Georges Terrace, Perth WA 6000, Australia
AUD RedeemablePreference shares
100
Pacific Aluminium (New Zealand) Limited; New Zealand
NZD1.00Ordinary shares
100 1001530 Tiwai Road, Tiwai Point, Invercargill 9877, New Zealand
NZD2.00Ordinary shares 100 100
Pacific Aluminium Pty. Limited; Australia(a) AUDOrdinary shares
100 100 Level 7, 360 Collins Street, Melbourne VIC 3000, Australia
Pacific Coast Mines, Inc.; United States US$1.00Common shares
100 100 CSC, 251 Little Falls Drive, Wilmington DE 19808, United States
Pechiney Aviatube Limited; United Kingdom £1.00Ordinary shares
100 100 6 St James’s Square, London, SW1Y 4AD, United Kingdom
Pechiney Bâtiment; France €15.00Ordinary shares
100 100 60 Avenue Charles de Gaulle, 92200, Neuilly-Sur-Seine, France
Pechiney Bécancour, Inc.; United States US$1.00Ordinary shares
100 100 CSC, 251 Little Falls Drive, Wilmington DE 19808, United States
Pechiney Cast Plate, Inc.; United States US$1.00Ordinary shares
100 100 CSC, 251 Little Falls Drive, Wilmington DE 19808, United States
Pechiney Consolidated Australia Pty Limited; Australia
US$1.00Ordinary shares
100100 123 Albert Street, Brisbane QLD 4000, Australia
US$1.00preference shares
100
Pechiney Holdings, Inc.; United States US$1.00Ordinary shares
100 100 CSC, 251 Little Falls Drive, Wilmington DE 19808, United States
Pechiney Metals LLC; United States(c) — — — CSC, 251 Little Falls Drive, Wilmington DE 19808, United States
Pechiney Plastic Packaging, Inc.; United States US$Ordinary shares
100 100 CSC, 251 Little Falls Drive, Wilmington DE 19808, United States
Pechiney Sales Corporation; United States US$1.00 Ordinary shares
100 100 CSC, 251 Little Falls Drive, Wilmington DE 19808, United States
Peko Exploration Pty Ltd.; Australia AUDOrdinary shares
100 100 37 Belmont Avenue, Belmont WA 6104, Australia
Peko-Wallsend Pty Ltd; Australia AUDOrdinary shares
100 100 Level 18 Central Park, 152-158 St. Georges Terrace, Perth WA 6000, Australia
Pilbara Iron Company (Services) Pty Ltd; Australia
AUDOrdinary shares
100 100 Level 18 Central Park, 152-158 St. Georges Terrace, Perth WA 6000, Australia
Pilbara Iron Pty Ltd; Australia AUDOrdinary shares
100 100 Level 18 Central Park, 152-158 St. Georges Terrace, Perth WA 6000, Australia
Project Generation Group Pty Ltd; Australia(a) AUDOrdinary shares
100 100 Level 7, 360 Collins Street, Melbourne VIC 3000, Australia
PT Rio Tinto Consultants; Indonesia(d) US$1.00Ordinary shares
100 10031st Floor, Menara BTPN, Jl. Dr. Ide Anak Agung Gde Agung Lot 5.5-5.6, Mega Kuningan, Jakarta, 12950, Indonesia
QIT Madagascar Minerals Ltd; Bermuda US$1.00Ordinary shares
100 100 Victoria Place, 5th Floor, 31 Victoria Street, , Hamilton HM 10, Bermuda
Queensland Coal Pty. Limited; Australia AUDOrdinary shares
100 100 123 Albert Street, Brisbane QLD 4000, Australia
Química e Metalúrgica Mequital Ltda.; Brazil BRLOrdinary shares
100 100Av. das Nações Unidas, 12551 19o, andar, CJ 1911, 04578-000, São Paulo, SP, Brazil
Ranges Management Company Pty Ltd; Australia
AUDOrdinary shares
100 100 Level 18 Central Park, 152-158 St. Georges Terrace, Perth WA 6000, Australia
Ranges Mining Pty Ltd; Australia AUDOrdinary shares
100 100 Level 18 Central Park, 152-158 St. Georges Terrace, Perth WA 6000, Australia
Resolution Copper Company; United States US$0.01Common shares
100 100 CSC, 251 Little Falls Drive, Wilmington DE 19808, United States
Richards Bay Mining Holdings (Proprietary) Limited; South Africa
ZAR1.00 AOrdinary shares
100100 The Farm RBM, Number 16317, KwaZulu-Natal, South Africa
ZAR1.00 BOrdinary shares
100
Annual Report 2020 | riotinto.com 287287Annual Report 2020 | riotinto.com
Financial Statements
Additional disclosures

44 Related undertakings continuedWholly owned subsidiary undertakings continued
Name of undertaking and countryof incorporation Share class
% of shareclass heldby Groupcompanies
EffectiveGroup %ownership Registered office address
Richards Bay Titanium Holdings (Proprietary) Limited; South Africa
ZAR1.00 A Ordinary shares
100100 The Farm RBM, Number 16317, KwaZulu-Natal, South Africa
ZAR1.00 BOrdinary shares
100
Rio de Contas Desenvolvimentos Minerais Ltda; Brazil
BRLQuota shares
100 100Rua Coronel Durval Matos, S/N. Centro, Municipio de Jaguaquara, Estado da Bahia, CEP45345-000, Brazil
Rio Santa Rita Empreenimentos e-Participações Ltda; Brazil
BRLQuota shares
100 100SIG, QUADRA 04, Lote 75, Sala 109 Parte E, Edifício Capital Financial Center, Brasília DF, CEP 71.610-440, Brazil
Rio Sava Exploration DOO; Serbia(c) — — — Resavska 23, 11000 Beograd, 11000, Serbia
Rio Tinto (Commercial Paper) Limited; Australia(a)
AUDOrdinary shares
100 100 Level 7, 360 Collins Street, Melbourne VIC 3000, Australia
Rio Tinto (Hong Kong) Ltd; Hong Kong HKDOrdinary shares
100 100 Level 54, Hopewell Centre, 183 Queen's Road East, Hong Kong
Rio Tinto Advisory Services Pty Limited; Australia
AUDOrdinary shares
100 100 Level 7, 360 Collins Street, Melbourne VIC 3000, Australia
Rio Tinto Alcan Fund Inc.; Canada CADOrdinary shares
100 100400-1190 Avenue des Canadiens-de-Montréal, Montréal QC H3B 0E3, Canada
Rio Tinto Alcan Inc.; Canada CADCommon shares
100 100400-1190 Avenue des Canadiens-de-Montréal, Montréal QC H3B 0E3, Canada
Rio Tinto Alcan International Ltd.; Canada CADCommon shares
100 100400-1190 Avenue des Canadiens-de-Montréal, Montréal QC H3B 0E3, Canada
Rio Tinto Alcan Technology Pty Ltd; Australia AUDOrdinary shares
100 100 123 Albert Street, Brisbane QLD 4000, Australia
Rio Tinto Aluminium (Bell Bay) Limited; Australia
AUDOrdinary shares
100 100 123 Albert Street, Brisbane QLD 4000, Australia
Rio Tinto Aluminium (Holdings) Limited; Australia
AUDOrdinary shares
100 100 123 Albert Street, Brisbane QLD 4000, Australia
Rio Tinto Aluminium Bell Bay Sales Pty Limited; Australia
AUDOrdinary shares
100 100 123 Albert Street, Brisbane QLD 4000, Australia
Rio Tinto Aluminium Limited; Australia AUDOrdinary shares
100 100 123 Albert Street, Brisbane QLD 4000, Australia
Rio Tinto Aluminium Pechiney €10.00Ordinary shares
100 100 725 rue Aristide Bergès, 38340, Voreppe, France
Rio Tinto Aluminium Services Pty Limited; Australia
AUDOrdinary shares
100 100 123 Albert Street, Brisbane QLD 4000, Australia
Rio Tinto America Holdings Inc.; United States US$0.01 Class ACommon shares
100100 CSC, 251 Little Falls Drive, Wilmington DE 19808, United States
US$100.00 Series A Preferred stock
100
Rio Tinto America Inc.; United States US$100.00 Common shares
100 100 CSC, 251 Little Falls Drive, Wilmington DE 19808, United States
Rio Tinto Asia Ltd; Hong Kong HKDOrdinary shares
100 100 6/F, Luk Kwok Centre, 72 Gloucester Road, Wan Chai, Hong Kong
Rio Tinto Asia Pty. Limited; Australia(a) AUDClass A shares
100 100Level 7, 360 Collins Street, Melbourne VIC 3000, Australia
AUD Ordinary shares 100 100
Rio Tinto AuM Company; United States US$0.01Common shares
100 100 CSC, 251 Little Falls Drive, Wilmington DE 19808, United States
Rio Tinto Australian Holdings Limited; United Kingdom
£1.00Ordinary shares
100 100
6 St James’s Square, London, SW1Y 4AD, United KingdomAUD 0.10 Preference shares
100 100
US$0.32Ordinary shares
100 100
Rio Tinto Bahia Holdings Limited; United Kingdom
US$1.00Ordinary shares
100 100 6 St James’s Square, London, SW1Y 4AD, United Kingdom
Rio Tinto Base Metals Pty. Limited; Australia(a) AUDOrdinary shares
100 100 Level 7, 360 Collins Street, Melbourne VIC 3000, Australia
288 Annual Report 2020 | riotinto.com288 Annual Report 2020 | riotinto.com
Financial Statements
Notes to the 2020 Financial Statements
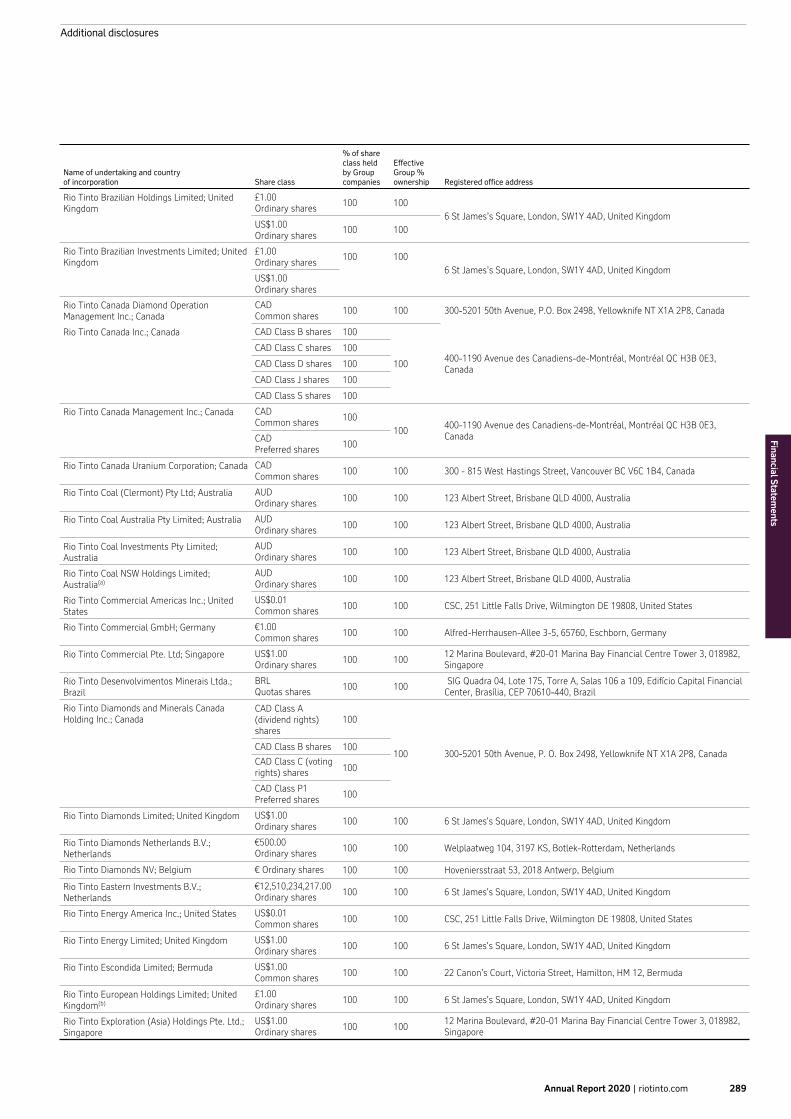
Name of undertaking and countryof incorporation Share class
% of shareclass heldby Groupcompanies
EffectiveGroup %ownership Registered office address
Rio Tinto Brazilian Holdings Limited; United Kingdom
£1.00Ordinary shares
100 1006 St James’s Square, London, SW1Y 4AD, United Kingdom
US$1.00Ordinary shares
100 100
Rio Tinto Brazilian Investments Limited; United Kingdom
£1.00Ordinary shares
100 1006 St James’s Square, London, SW1Y 4AD, United Kingdom
US$1.00Ordinary shares
Rio Tinto Canada Diamond Operation Management Inc.; Canada
CADCommon shares
100 100 300-5201 50th Avenue, P.O. Box 2498, Yellowknife NT X1A 2P8, Canada
Rio Tinto Canada Inc.; Canada CAD Class B shares 100
100400-1190 Avenue des Canadiens-de-Montréal, Montréal QC H3B 0E3, Canada
CAD Class C shares 100
CAD Class D shares 100
CAD Class J shares 100
CAD Class S shares 100
Rio Tinto Canada Management Inc.; Canada CADCommon shares 100
100400-1190 Avenue des Canadiens-de-Montréal, Montréal QC H3B 0E3, CanadaCAD
Preferred shares 100
Rio Tinto Canada Uranium Corporation; Canada CADCommon shares 100 100 300 - 815 West Hastings Street, Vancouver BC V6C 1B4, Canada
Rio Tinto Coal (Clermont) Pty Ltd; Australia AUDOrdinary shares 100 100 123 Albert Street, Brisbane QLD 4000, Australia
Rio Tinto Coal Australia Pty Limited; Australia AUDOrdinary shares 100 100 123 Albert Street, Brisbane QLD 4000, Australia
Rio Tinto Coal Investments Pty Limited; Australia
AUDOrdinary shares 100 100 123 Albert Street, Brisbane QLD 4000, Australia
Rio Tinto Coal NSW Holdings Limited;Australia(a)
AUDOrdinary shares 100 100 123 Albert Street, Brisbane QLD 4000, Australia
Rio Tinto Commercial Americas Inc.; United States
US$0.01Common shares 100 100 CSC, 251 Little Falls Drive, Wilmington DE 19808, United States
Rio Tinto Commercial GmbH; Germany €1.00Common shares 100 100 Alfred-Herrhausen-Allee 3-5, 65760, Eschborn, Germany
Rio Tinto Commercial Pte. Ltd; Singapore US$1.00Ordinary shares 100 100
12 Marina Boulevard, #20-01 Marina Bay Financial Centre Tower 3, 018982, Singapore
Rio Tinto Desenvolvimentos Minerais Ltda.; Brazil
BRLQuotas shares 100 100
SIG Quadra 04, Lote 175, Torre A, Salas 106 a 109, Edifício Capital Financial Center, Brasília, CEP 70610-440, Brazil
Rio Tinto Diamonds and Minerals Canada Holding Inc.; Canada
CAD Class A(dividend rights) shares
100
100 300-5201 50th Avenue, P. O. Box 2498, Yellowknife NT X1A 2P8, CanadaCAD Class B shares 100
CAD Class C (votingrights) shares 100
CAD Class P1Preferred shares 100
Rio Tinto Diamonds Limited; United Kingdom US$1.00Ordinary shares 100 100 6 St James's Square, London, SW1Y 4AD, United Kingdom
Rio Tinto Diamonds Netherlands B.V.; Netherlands
€500.00Ordinary shares 100 100 Welplaatweg 104, 3197 KS, Botlek-Rotterdam, Netherlands
Rio Tinto Diamonds NV; Belgium € Ordinary shares 100 100 Hoveniersstraat 53, 2018 Antwerp, Belgium
Rio Tinto Eastern Investments B.V.; Netherlands
€12,510,234,217.00 Ordinary shares 100 100 6 St James's Square, London, SW1Y 4AD, United Kingdom
Rio Tinto Energy America Inc.; United States US$0.01Common shares 100 100 CSC, 251 Little Falls Drive, Wilmington DE 19808, United States
Rio Tinto Energy Limited; United Kingdom US$1.00Ordinary shares 100 100 6 St James's Square, London, SW1Y 4AD, United Kingdom
Rio Tinto Escondida Limited; Bermuda US$1.00Common shares 100 100 22 Canon's Court, Victoria Street, Hamilton, HM 12, Bermuda
Rio Tinto European Holdings Limited; United Kingdom(b)
£1.00Ordinary shares 100 100 6 St James's Square, London, SW1Y 4AD, United Kingdom
Rio Tinto Exploration (Asia) Holdings Pte. Ltd.; Singapore
US$1.00Ordinary shares 100 100
12 Marina Boulevard, #20-01 Marina Bay Financial Centre Tower 3, 018982, Singapore
Annual Report 2020 | riotinto.com 289289Annual Report 2020 | riotinto.com
Financial Statements
Additional disclosures

44 Related undertakings continuedWholly owned subsidiary undertakings continued
Name of undertaking and countryof incorporation Share class
% of shareclass heldby Groupcompanies
EffectiveGroup %ownership Registered office address
Rio Tinto Exploration (PNG) Limited; Papua New Guinea(a)
PGK1.00Ordinary shares
100 100 c/- BDO Accountants, Section 15, Lot 15, Bernal Street, National Capital District, Port Moresby, Papua New Guinea
Rio Tinto Exploration and Mining (India) Private Limited; India(d)
INR10.00Ordinary shares 100 100
21st Floor, DLF Building No.5, Tower A, DLF Cyber City, Phase -III, Gurgaon, Haryana, 122002, India
Rio Tinto Exploration Canada Inc.; Canada CAD Class A shares 100
100 300 - 815 West Hastings Street, Vancouver BC V6C 1B4, CanadaCAD Class B shares 100
CAD Class C shares 100
CAD Class D shares 100
Rio Tinto Exploration Dunav d.o.o. Beograd-Vracar; Serbia(c) — — 100 Resavska 23, 11000 Beograd, 11000, Serbia
Rio Tinto Exploration Finland OY; Finland €Ordinary shares 100 100 c/o Revico Grant Thornton Oy, PL 18, Helsinki, 00271, Finland
Rio Tinto Exploration India Private Limited; India
INR10.00Ordinary shares
100 10021st Floor, DLF Building No. 5, Tower A DLF Cyber City, Phase III, Gurgaon, HR, 122002, India
Rio Tinto Exploration Kazakhstan LLP; Kazakhstan(c) — — 100 Dostyk 310/G, Almaty, 050020, Kazakhstan
Rio Tinto Exploration Pty Limited; Australia(a) AUD Class B shares 100
100 37 Belmont Avenue, Belmont WA 6104, AustraliaAUD Class C shares 100
AUDOrdinary shares
100
Rio Tinto Exploration Zambia Limited; Zambia ZMW1.00Ordinary shares
100 100 Suit FF08, No.4 Bishops Road, Kabulonga, Lusaka, Zambia
Rio Tinto FalCon Diamonds Inc.; Canada CAD1,000.00Common shares
100 100 300 - 815 West Hastings Street, Vancouver BC V6C 1B4, Canada
Rio Tinto Fer et Titane Inc.; Canada CAD Class BPreference shares
100
100 1625 Route Marie-Victorin, Sorel-Tracy QC J3R 1M6, CanadaCADCommon shares
100
CAD$0.01Preference shares
100
Rio Tinto Finance (USA) Limited; Australia(a) AUDOrdinary shares
100 100 Level 7, 360 Collins Street, Melbourne VIC 3000, Australia
Rio Tinto Finance (USA) Inc; United States US$1.00Common shares 100 100 CSC, 251 Little Falls Drive, Wilmington DE 19808, United States
Rio Tinto Finance (USA) plc; United Kingdom £1.00Ordinary shares 100 100 6 St James’s Square, London, SW1Y 4AD, United Kingdom
Rio Tinto Finance Limited; Australia(a) AUDOrdinary shares
100 100 Level 7, 360 Collins Street, Melbourne VIC 3000, Australia
Rio Tinto Finance plc; United Kingdom £1.00Ordinary shares
100100 6 St James’s Square, London, SW1Y 4AD, United Kingdom
US$1.00Ordinary shares
100
Rio Tinto France S.A.S.; France €10.00Ordinary shares
100 100 60 Avenue Charles de Gaulle, 92200, Neuilly-Sur-Seine, France
Rio Tinto Global Employment Company Pte. Ltd.; Singapore
US$1.00Ordinary shares 100 100
12 Marina Boulevard, #20-01 Marina Bay Financial Centre Tower 3, 018982, Singapore
Rio Tinto Guinée S.A.; Guinea GNF100,000.00Ordinary shares 100 100 Manquépas-Commune de Kaloum, République de Guinée, Guinea
Rio Tinto Holdings LLC; Mongolia MNT20,000.00Ordinary shares
100 100Floor 17, Shangri-La Center, Olympic Street-19, Khoroo 1, Sukhbaatar District, Ulaanbaatar, 14241, Mongolia
Rio Tinto Hydrogen Energy LLC; United States(c) — — 100 CSC, 251 Little Falls Drive, Wilmington DE 19808, United States
Rio Tinto Iceland Ltd.; Iceland ISK1.00Registered shares 100 100 P.O. Box 244, IS-222, Hafnarfjördur, Iceland
Rio Tinto India Private Limited; India INR10.00Ordinary shares 100 100
21st Floor, DLF Building No.5, Tower A, DLF Cyber City, Phase–III, Gurgaon, Haryana, 122022, India
290 Annual Report 2020 | riotinto.com290 Annual Report 2020 | riotinto.com
Financial Statements
Notes to the 2020 Financial Statements

Name of undertaking and countryof incorporation Share class
% of shareclass heldby Groupcompanies
EffectiveGroup %ownership Registered office address
Rio Tinto Indonesian Holdings Limited; United Kingdom
£1.00Ordinary shares 100
100 6 St James’s Square, London, SW1Y 4AD, United KingdomUS$1.00Ordinary shares 100
Rio Tinto International Holdings Limited; United Kingdom(b)
£1.00Ordinary shares 100 100 6 St James’s Square, London, SW1Y 4AD, United Kingdom
Rio Tinto Investments One Pty Limited; Australia
AUDOrdinary shares 100 100 Level 18 Central Park, 152-158 St. Georges Terrace, Perth WA 6000, Australia
Rio Tinto Investments Two Pty Limited; Australia
AUDOrdinary shares
100 100 Level 18 Central Park, 152-158 St. Georges Terrace, Perth WA 6000, Australia
Rio Tinto Iron & Titanium (Suzhou) Co., Ltd; China
US$1.00Ordinary shares
100 100 418 Nanshi Street, Suzhou Industrial Park, Suzhou, 215021, China
Rio Tinto Iron & Titanium GmbH; Germany(c) — — 100 Alfred-Herrhausen-Allee 3-5, 65760, Eschborn, Germany
Rio Tinto Iron & Titanium Holdings GmbH;Germany(c) — — 100 Alfred-Herrhausen-Allee 3-5, 65760, Eschborn, Germany
Rio Tinto Iron & Titanium Limited; United Kingdom
£1.00Ordinary shares
100 100 6 St James's Square, London, SW1Y 4AD, United Kingdom
Rio Tinto Iron and Titanium Canada Inc.; Canada
CADCommon shares
100 100 1625 Route Marie - Victorin, Sorel - Tracy QC J3R 1M6, Canada
Rio Tinto Iron Ore Atlantic Limited; United Kingdom
US$1.00 Ordinary shares
100 100 6 St James's Square, London, SW1Y 4AD, United Kingdom
Rio Tinto Iron Ore Europe S.A.S.; France €100.00Ordinary shares
100 100 60 Avenue Charles de Gaulle, 92200, Neuilly-Sur-Seine, France
Rio Tinto Iron Ore Trading China Limited; United Kingdom
US$1.00Ordinary shares
100 100 6 St James's Square, London, SW1Y 4AD, United Kingdom
Rio Tinto Japan Ltd; Japan JPY500.00Ordinary shares
100 1008th Floor, Kojimachi Diamond Building, 1 Kojimachi 4-chome, Chiyoda-ku, Tokyo 102-0083, Japan
Rio Tinto Jersey Holdings 2010 Limited; Jersey US$Ordinary shares
100 100 22 Grenville Street, St Helier, JE4 8PX, Jersey
Rio Tinto Korea Ltd; Republic of Korea KRW10,000.00Ordinary shares
100 1002nd Floor, JS Tower, 6 Teheran-ro 79-gil, Gangnam-Gu, Seoul, 135-877, Republic of Korea
Rio Tinto London Limited; United Kingdom £1.00Ordinary share
100 100 6 St James's Square, London, SW1Y 4AD, United Kingdom
Rio Tinto Management Services South Africa (Proprietary) Ltd: South Africa
ZAR2.00Ordinary share
100 100 1 Harries Road, Illovo, Sandton, 2196, South Africa
Rio Tinto Marketing Pte. Ltd.; Singapore SGD$1.00Ordinary share
100100
12 Marina Boulevard, #20-01 Marina Bay Financial Center Tower 3,018982, SingaporeUS$1.00
Ordinary share100
Rio Tinto Marketing Services Limited; United Kingdom
£1.00Ordinary share
100 100 6 St James's Square, London, SW1Y 4AD, United Kingdom
Rio Tinto Medical Plan Trustees Limited; United Kingdom
£1.00Ordinary share
100 100 6 St James's Square, London, SW1Y 4AD, United Kingdom
Rio Tinto Metals Limited; United Kingdom £1.00Ordinary share
100 1006 St James's Square, London, SW1Y 4AD, United Kingdom
US$1.00Ordinary share
100 100
Rio Tinto Minera Peru Limitada SAC; Peru PEN100.00Ordinary share
100 100 Av. La Paz 1049, Oficina 503, Miraflores, Lima 18 Peru
Rio Tinto Mineração do Brasil Ltda; Brazil BRL1.00Quotas shares
100 100 SIG Quadra 04, Lote 75, Torre A, Sala 109 Parte B, Edíficio Capital Financial Center, Brasília, CEP 70610-440, Brazil
Rio Tinto Minerals Asia Pte Ltd; Singapore SGD$1.00Ordinary shares
100100
12 Marina Boulevard, #20-01 Marina Bay Financial Centre Tower 3, 018982, SingaporeUS$1.00
Ordinary shares100
Rio Tinto Minerals Development Limited;United Kingdom
£0.25Ordinary shares
100 1006 St James’s Square, London, SW1Y 4AD, United Kingdom
US$1.00Ordinary shares
100 100
Rio Tinto Minerals Exploration (Beijing) Co., Ltd;
US$1.00Ordinary shares
100 100Units 15-16, 18/F, China World Office Building 2, No. 1 Jianguomenwai Dajie, Chaoyang District, Beijing, China
Rio Tinto Minerals Inc.; United States US$0.01Common shares
100 100CSC, 15 West South Temple, Suite 6000, Salt Lake City UT 84101, United States
Annual Report 2020 | riotinto.com 291291Annual Report 2020 | riotinto.com
Financial Statements
Additional disclosures

44 Related undertakings continuedWholly owned subsidiary undertakings continued
Name of undertaking and countryof incorporation Share class
% of shareclass heldby Groupcompanies
EffectiveGroup %ownership Registered office address
Rio Tinto Mining and Exploration Inc.; United States
US$1.00Common shares
100 100 251 Little Falls Drive, Wilmington DE 19808, United States
Rio Tinto Mining and Exploration Limited; United Kingdom
£1.00Ordinary shares
100100 6 St James’s Square, London, SW1Y 4AD, United Kingdom
US$1.00Ordinary shares
100
Rio Tinto Mining and Exploration S.A.C.; Peru PEN0.50Ordinary shares 100 100 Av, La Paz 1049, Oficina 503, Miraflores, Lima 18, Peru
Rio Tinto Mining Commercial (Shanghai) Co., Ltd.; China
CNY 1.00 Ordinaryshares 100 100
Room 328, 3rd Floor, Unit 2, 231 Shibocun Road, China (Shanghai) Pilot FreeTrade Zone, Shanghai, 200125, China
Rio Tinto Mongolia LLC; Mongolia MNT1,240.00Common shares 100 100
Level 17, Shangri-La Centre, Olympic Street 19A, Sukhbaatar District, Ulaanbaatar, 14241, Mongolia
Rio Tinto Nominees Limited; United Kingdom £1.00Ordinary shares 100 100 6 St James's Square, London, SW1Y 4AD, United Kingdom
Rio Tinto OT Management Limited; United Kingdom
US$1.00Ordinary shares 100 100 6 St James's Square, London, SW1Y 4AD, United Kingdom
Rio Tinto Overseas Holdings Limited; United Kingdom
£1.00Ordinary shares 100
100 6 St James's Square, London, SW1Y 4AD, United KingdomUS$1.00Ordinary shares 100
Rio Tinto PACE Australia Pty Limited; Australia(a)
AUDOrdinary shares 100 100 Level 18 152-158 St. Georges Terrace, Perth WA 6000, Australia
Rio Tinto PACE Canada Inc.; Canada CADOrdinary shares 100 100 400-1190 Avenue des Canadiens-de-Montréal, Montréal QC H3B 0E3, Canada
Rio Tinto Peru Limited; United Kingdom US$1.00Ordinary shares 100 100 6 St James's Square, London, SW1Y 4AD, United Kingdom
Rio Tinto Potash Management Inc.; Canada CADCommon shares 100 100 354-200 Granville Street, Vancouver BC V6C 1S4, Canada
Rio Tinto Procurement (Singapore) Pte Ltd; Singapore
US$1.00Ordinary shares 100 100
12 Marina Boulevard, #20-01 Marina Bay Financial Centre Tower 3, 018982, Singapore
Rio Tinto Pte Ltd; Singapore SGD$1.00Ordinary shares 100
10012 Marina Boulevard, #20-01 Marina Bay Financial Centre Tower 3, 018982, SingaporeSGD$1.00
Preference shares 100
Rio Tinto Saskatchewan Management Inc.; Canada
CADCommon shares 100 100 354-200 Granville Street, Vancouver BC V6C 1S4, Canada
Rio Tinto Saskatchewan Potash Holdings General Partner Inc.; Canada
CADCommon shares 100 100 5300-66 Wellington Street West, Toronto ON M5K 1E6, Canada
Rio Tinto Saskatchewan Potash Holdings Limited Partnership; Canada(c) — — 100 5300,-66 Wellington Street West, Toronto ON M5K 1E6, Canada
Rio Tinto Secretariat Limited; United Kingdom £1.00Ordinary shares 100 100 6 St James's Square, London, SW1Y 4AD, United Kingdom
Rio Tinto Services Inc.; United States US$0.01Common shares 100 100 CSC, 251 Little Falls Drive, Wilmington DE 19808, United States
Rio Tinto Services Limited; Australia(a) AUDClass Z shares 100
100 Level 7, 360 Collins Street, Melbourne VIC 3000, AustraliaAUDOrdinary shares 100
Rio Tinto Shared Services Pty Limited; Australia
AUDOrdinary shares 100 100 Level 7, 360 Collins Street, Melbourne VIC 3000, Australia
Rio Tinto Shipping (Asia) Pte. Ltd.; Singapore US$1.00Ordinary shares 100 100
12 Marina Boulevard, #20-01 Marina Bay Financial Centre Tower 3, 018982, Singapore
Rio Tinto Shipping Pty. Limited; Australia(a) AUDOrdinary shares 100 100 Level 7, 360 Collins Street, Melbourne VIC 3000, Australia
Rio Tinto Simfer UK Limited; United Kingdom US$1.00Ordinary shares 100 100 6 St James's Square, London, SW1Y 4AD, United Kingdom
Rio Tinto Singapore Holdings Pte Ltd; Singapore
SGD$1.00Ordinary shares 100
10012 Marina Boulevard, #20-01 Marina Bay Financial Centre Tower 3, 018982, SingaporeUS$
Ordinary shares 100
292 Annual Report 2020 | riotinto.com292 Annual Report 2020 | riotinto.com
Financial Statements
Notes to the 2020 Financial Statements

Name of undertaking and countryof incorporation Share class
% of shareclass heldby Groupcompanies
EffectiveGroup %ownership Registered office address
Rio Tinto South East Asia Limited; United Kingdom
£1.00Ordinary shares 100
100 6 St James's Square, London, SW1Y 4AD, United KingdomUS$1.00Ordinary shares 100
Rio Tinto Staff Fund (Retired) Pty Limited; Australia(a)
AUDOrdinary shares 100 100 Level 7, 360 Collins Street, Melbourne VIC 3000, Australia
Rio Tinto Sulawesi Holdings Limited; United Kingdom
US$1.00Ordinary shares
100 100 6 St James's Square, London, SW1Y 4AD, United Kingdom
Rio Tinto Technological Resources Inc.; United States
USD$0.01Common shares 100 100 CSC, 251 Little Falls Drive, Wilmington DE 19808, United States
Rio Tinto Technological Resources UK Limited; United Kingdom
US$1.00Ordinary shares 100 100 6 St James's Square, London, SW1Y 4AD, United Kingdom
Rio Tinto Trading (Shanghai) Co., Ltd.; China US$1.00Ordinary shares
100 10041/F Wheelock Square, No. 1717 West Nanjing Road, Jing'an District, Shanghai, 200040, China
Rio Tinto Uranium Limited; United Kingdom US$1.00Ordinary shares 100 100 6 St James's Square, London, SW1Y 4AD, United Kingdom
Rio Tinto Western Holdings Limited; United Kingdom
£1.00Ordinary shares 100
100 6 St James's Square, London, SW1Y 4AD, United KingdomUS$1.00Ordinary shares 100
Rio Tinto Winu Pty Limited; Australia(a) AUDOrdinary shares 100 100 Level 18, Central Park, 152-158 St Georges Terrace, Perth WA 6000, Australia
Riversdale Connections (Proprietary) Ltd; South Africa
ZAR1.00Ordinary shares
100 100Ground Floor - Cypress Place North, Woodmead Business Park 140/142 Western Service Road, Woodmead, 2191, South Africa
Robe River Limited; Australia AUDOrdinary shares
100 100 Level 18 Central Park, 152-158 St. Georges Terrace, Perth WA 6000, Australia
Rocklea Station Pty Ltd; Australia AUDOrdinary shares 100 100 Level 18 Central Park, 152-158 St. Georges Terrace, Perth WA 6000, Australia
RTA AAL Australia Limited; Australia AUDOrdinary shares 100 100 123 Albert Street, Brisbane QLD 4000, Australia
RTA Boyne Limited; Australia AUDOrdinary shares 100 100 123 Albert Street, Brisbane QLD 4000, Australia
RTA Gove Pty Limited; Australia AUD Class A shares 100
100 123 Albert Street, Brisbane QLD 4000, AustraliaAUD Class B shares 100
RTA Holdco 1 Limited; United Kingdom US$0.0001Ordinary shares 100 100 6 St James's Square, London, SW1Y 4AD, United Kingdom
RTA Holdco 4 Limited; United Kingdom US$1.00Ordinary shares 100
100 6 St James's Square, London, SW1Y 4AD, United KingdomUS$0.73Ordinary shares 100
RTA Holdco 7 Limited; United Kingdom US$1.00Ordinary shares
100100 6 St James's Square, London, SW1Y 4AD, United Kingdom
US$0.001 Class A Preference shares 100
RTA Holdco 8 Limited; United Kingdom US$1.00Ordinary shares
100100 6 St James's Square, London, SW1Y 4AD, United Kingdom
US$0.001 Class A Preference shares 100
RTA Holdco Australia 1 Pty Ltd; Australia AUDOrdinary shares 100 100 123 Albert Street, Brisbane QLD 4000, Australia
RTA Holdco Australia 3 Pty Ltd; Australia AUDOrdinary shares 100 100 123 Albert Street, Brisbane QLD 4000, Australia
RTA Holdco Australia 5 Pty Ltd; Australia AUDOrdinary shares 100 100 123 Albert Street, Brisbane QLD 4000, Australia
RTA Holdco Australia 6 Pty Ltd; Australia AUDOrdinary shares 100 100 123 Albert Street, Brisbane QLD 4000, Australia
RTA Holdco France 1 S.A.S; France €10.00 Ordinary Shares 100 100 60 Avenue Charles de Gaulle, 92200, Neuilly-Sur-Seine, France
RTA Holdco France 2 S.A.S; France €10.00 Ordinary Shares 100 100 60 Avenue Charles de Gaulle, 92200, Neuilly-Sur-Seine, France
Annual Report 2020 | riotinto.com 293293Annual Report 2020 | riotinto.com
Financial Statements
Additional disclosures

44 Related undertakings continuedWholly owned subsidiary undertakings continued
Name of undertaking and countryof incorporation Share class
% of shareclass heldby Groupcompanies
EffectiveGroup %ownership Registered office address
RTA Pacific Pty Limited; Australia AUDOrdinary shares 100 100 123 Albert Street, Brisbane QLD 4000, Australia
RTA Sales Pty Ltd; Australia AUDClass A shares 100
100 123 Albert Street, Brisbane QLD 4000, AustraliaAUDClass B shares 100
RTA Smelter Development Pty Limited; Australia
AUDOrdinary shares 100 100 123 Albert Street, Brisbane QLD 4000, Australia
RTA Weipa Pty Ltd; Australia AUDOrdinary shares
100 100 123 Albert Street, Brisbane QLD 4000, Australia
RTA Yarwun Pty Ltd; Australia AUDOrdinary shares
100 100 123 Albert Street, Brisbane QLD 4000, Australia
RTAlcan 1 LLC; United States US$Common shares
100
100 CSC, 251 Little Falls Drive, Wilmington DE 19808, United StatesUS$Class APreferred shares
100
RTAlcan 2 LLC; United States US$Common shares
100 100 CSC, 251 Little Falls Drive, Wilmington DE 19808, United States
RTAlcan 3 LLC; United States US$Common shares
100 100 CSC, 251 Little Falls Drive, Wilmington DE 19808, United States
RTLDS Aus Pty. Ltd; Australia(a) AUDOrdinary shares
100 100 Level 7, 360 Collins Street, Melbourne VIC 3000, Australia
RTLDS UK Limited; United Kingdom £1.00Ordinary shares
100 100 6 St James's Square, London, SW1Y 4AD, United Kingdom
RTPDS Aus Pty Ltd; Australia AUDOrdinary shares
100 100 Level 7, 360 Collins Street, Melbourne VIC 3000, Australia
Scheuch Unterstuetzungskasse GmbH; Germany
€51.13Ordinary shares
100 100 Alusingenplatz 1, D-78221, Singen, Germany
Skymont Corporation; United States US$Common shares
100 100 CSC, 251 Little Falls Drive, Wilmington DE 19808, United States
Société De Financement Des Risques Industriels; Luxembourg
€Ordinary shares
100 100 534, rue de Neudorf, B.P. 593, L-2015, Luxembourg
Sohio Western Mining Company; United States US$100.00Common shares
100 100 CSC, 251 Little Falls Drive, Wilmington DE 19808, United States
Southern Copper Pty. Limited; Australia AUDA shares
100
100 Level 7, 360 Collins Street, Melbourne VIC 3000, Australia
AUDB shares
100
AUDNon-cumulative Redeemable Preference shares
100
AUDOrdinary shares
100
Swift Current Land & Cattle LLC; United States(c) — — 100 CSC, 8825 N. 23rd Avenue, Suite 100, Phoenix AZ 85021
Swiss Aluminium Australia Limited; Australia AUDOrdinary shares
100
100 123 Albert Street, Brisbane QLD 4000, Australia
AUDStock Unit A shares
100
AUDStock Unit B shares
100
AUDStock Unit C shares
100
TBAC Limited; United Kingdom £1.00Ordinary shares
100 100 6 St James's Square, London, SW1Y 4AD, United Kingdom
Technological Resources Pty. Limited; Australia(a)
AUDA Ordinary shares
100100 Level 7, 360 Collins Street, Melbourne VIC 3000, Australia
AUDB Ordinary shares
100
294 Annual Report 2020 | riotinto.com294 Annual Report 2020 | riotinto.com
Financial Statements
Notes to the 2020 Financial Statements

Name of undertaking and countryof incorporation Share class
% of shareclass heldby Group companies
EffectiveGroup %ownership Registered office address
The Barrier Corporation (Vic.) Pty. Limited; Australia(a)
AUDOrdinary shares
100 100 Level 7, 360 Collins Street, Melbourne VIC 3000, Australia
The Kelian Community and Forest Protection Trust; Singapore(c) — — 100 10 Collyer Quay, #10-01 Ocean Financial Centre, 049315, Singapore
The Pyrites Company, Inc.; United States US$1.00Common shares
100 100 CSC, 251 Little Falls Drive, Wilmington DE 19808, United States
The Roberval and Saguenay Railway Company; Canada
CAD$100.00Ordinary shares
100
100400-1190 Avenue des Canadiens-de-Montréal, Montréal QC H3B 0E3, CanadaCAD$100.00
Preference shares 6% non-cumulative
100
The Zinc Corporation Pty Ltd; Australia AUDOrdinary shares
100
100 Level 7, 360 Collins Street, Melbourne VIC 3000, AustraliaAUDZ ClassOrdinary shares
100
Thos. W. Ward Limited; United Kingdom £0.25Ordinary shares
100 100 6 St James's Square, London, SW1Y 4AD, United Kingdom
Three Crowns Insurance Company Limited; United States
US$2.00Common shares
100 100CT Corporation, 1108 E. South Union Avenue, Midvale UT 84047, United States
Tinto Holdings Australia Pty. Limited; Australia AUDA shares
100100 Level 7, 360 Collins Street, Melbourne VIC 3000, Australia
AUDOrdinary shares
100
Trans Territory Pipeline Pty Limited; Australia AUDOrdinary shares
100 100 123 Albert Street, Brisbane QLD 4000, Australia
U.S. Borax Inc.; United States US$0.10Common shares
100 100 CSC, 251 Little Falls Drive, Wilmington DE 19808, United States
Victoria Technology Inc.; United States(a) US$1.00Ordinary shares
100 100 CSC, 251 Little Falls Drive, Wilmington DE 19808, United States
Waste Solutions and Recycling LLC; United States
US$ shares 100 100 CSC, 251 Little Falls Drive, Wilmington DE 19808, United States
West Kutai Foundation Limited; Singapore(c) — — 100 10 Collyer Quay, #10-01 Ocean Financial Centre, 049315, Singapore
Wimmera Industrial Minerals Pty. Limited; Australia(a)
AUDOrdinary shares
100 100 Level 7, 360 Collins Street, Melbourne VIC 3000, Australia
Winchester South Development Company Proprietary Limited; Australia
AUDOrdinary shares
100 100 123 Albert Street, Brisbane QLD 4000, Australia
Wyoming Coal Resources Company; United States
US$0.01Common shares
100 100 CSC, 251 Little Falls Drive, Wilmington DE 19808, United States
Annual Report 2020 | riotinto.com 295295Annual Report 2020 | riotinto.com
Financial Statements
Additional disclosures

44 Related undertakings continuedOther Group entities including subsidiaries where the effective ownership is less than 100%, associated undertakings and significant holdings in undertakings other than subsidiary companies
Name of undertaking and countryof incorporation Share class
% of shareclass heldby Groupcompanies
EffectiveGroup %ownership Registered office address
201 Logistics Center, LLC; United States(c)— — 50
Corporation Trust Center, 1209 Orange Street, Wilmington DE19801, United States
AGM Holding Company Pte Ltd; Singapore US$ Ordinary shares
100 50.8 77 Robinson Road, #13-00, Robinson 77, 068896, Singapore
Alufluor AB; Sweden SEK1,000.00Ordinary shares
50 50 Industrigatan 70, Box 902, S-25109, Helsingborg, Sweden
Aluminerie Alouette Inc.; Canada CADOrdinary shares
40 40 400, Chemin de la Pointe-Noire, C.P. 1650, Sept-Îles QC G4R 5M9, Canada
Aluminerie De Bécancour, Inc.; Canada CAD1.00Ordinary shares
50.1 25.2 5555 Pierre Thibault Street, PO 30, Bécancour, Québec G0X 1B, Canada
Aluminium & Chemie Rotterdam B.V.; Netherlands
€4,555.00Ordinary shares
65.8 65.8 Oude Maasweg 80, 3197 KJ, Botlek, Rotterdam, Netherlands
Asia Gold Mongolia LLC; Mongolia MNT1,250.00 Common shares
100 50.7Level 17, Shangri-La Centre, Olympic Street 19A, Sukhbaatar District, Ulaanbaatar, 14241 Mongolia
Asia Naran Bulag LLC; Mongolia MNT1,000.00 Common shares
100 50.7Level 17, Shangri-La Centre, Olympic Street 19A, Sukhbaatar District, Ulaanbaatar, 14241 Mongolia
Balkhash Saryshagan LLP; Kazakhstan(c) — — 75 Dostyk 310/G, Almaty, 050020, Kazakhstan
Beasley River Marketing Pty Ltd; Australia AUDA class shares
100 53Level 18 Central Park, 152-158 St. Georges Terrace, Perth WA6000, Australia
Bektau B.V.; Netherlands €200.00Ordinary shares
75 75 Welplaatweg 104, 3197 KS, Botlek-Rotterdam, Netherlands
Boyne Smelters Limited; Australia AUD A1Class shares
100
59.4 123 Albert Street, Brisbane QLD 4000, AustraliaAUD A2Class shares
100
AUD B1Class shares
100
CanPacific Potash Inc.; Canada(c) — — 32 374 Third Avenue South, Saskatoon SK S7K 1M5, Canada
Carol Lake Company Ltd.; Canada CAD$100.00Ordinary shares
100 58.7 400-1190 Avenue des Canadiens-de-Montréal, Montréal QC H3B 0E3, Canada
Chinalco Rio Tinto Exploration Co. Ltd; China(d) CNY1.00 CapitalContribution(Ordinary shares)
49 49Unit 402, China Resources Building, No. 8 Jianguomenbei Avenue, Dong Cheng District, Beijing, 100005 P.R., China
Chlor Alkali Unit Pte Ltd; Singapore SGD$1.00 Ordinary(SGD) shares
100
68.412 Marina Boulevard, #20-01 Marina Bay Financial Centre Tower 3, 018982, SingaporeUS$1.00
Ordinary (USD) shares
68.4
Dampier Salt Limited; Australia AUD Ordinary ($1.00257) shares
68.4
68.4 Level 18 Central Park, 152-158 St. Georges Terrace, Perth WA 6000, AustraliaAUD Ordinary ($1.88 on 31/01/2013) shares
68.4
ELYSIS Limited Partnership/ELYSIS Société en Commandite; Canada
US$1,000.00Class B shares
100 48.2 2323-1 Place Ville Marie, Montréal QC H3B 5M5, Canada
Empresa de Mineração Finesa Ltda.; Brazil BRLQuotas shares
100 49SIG, QUADRA 04, Lote 75, Sala 109 Parte C, Edifício Capital Financial Center, Brasília DF, CEP 71.610-440, Brazil
Enarotali Gold Project Limited; Jersey £0.001Ordinary shares
25 25 IFC 5, St Helier, JE1 1ST, Jersey
Energy Resources of Australia Ltd; Australia AUD A Class Ordinary shares
86.3 86.3 c/o Mallesons Stephen Jacques, Level 5 NICTA Building, B 7 London Circuit, Canberra City ACT 2601, Australia
Fabrica De Plasticos Mycsa, S.A.; Bolivarian Republic of Venezuela(d)
VEF1.00Common shares
49 49Urbanización Industrial San Ignacio, parcela 2-A, víaSan Pedro, Los Teques, Estado Miranda, Bolivarian Republic of Venezuela
Global Hubco B.V.; Netherlands €1.00 Ordinary shares
33.3 33.3c/o TMF Netherlands B.V., Luna Arena, Herikerbergweg 238, 1101, CM Amsterdam Zuidoost, Netherlands
Gulf Power Company; Canada CAD$100.00 Ordinary shares
100 58.7 400-1190 Avenue des Canadiens-de-Montréal, Montréal QC H3B 0E3, Canada
Halco (Mining) Inc.; United States US$100.00 Ordinary shares
45 45 30 Isabella Street, 3rd Floor, Pittsburgh, Pennsylvania, 15212, United States
296 Annual Report 2020 | riotinto.com296 Annual Report 2020 | riotinto.com
Financial Statements
Notes to the 2020 Financial Statements

Name of undertaking and countryof incorporation Share class
% of shareclass heldby Groupcompanies
EffectiveGroup %ownership Registered office address
Heruga Exploration LLC; Mongolia MNT12,500.00 Common Shares
100 50.8Level 17, Shangri-La Centre, Olympic Street 19A, Sukhbaatar District, Ulaanbaatar, 14241 Mongolia
Hope Downs Marketing Company Pty Ltd; Australia
AUDA Class shares
100 50Level 18 Central Park, 152-158 St. Georges Terrace, Perth WA 6000, Australia
IAL Holdings Singapore Pte Ltd; Singapore US$ Ordinary shares 100 50.8 77 Robinson Road, #13-00, Robinson 77, 068896, Singapore
Iron Ore Company of Canada; United States US$1,000.00Series A shares
91.4
58.7 1209 Orange Street, Wilmington, Delaware 19801, United StatesUS$1,000.00Series E shares
100
US$1,000.00Series F shares
100
Korgantas LLP; Kazakhstan(c) — — 75 Dostyk 310/G, Almaty, 050020, Kazakhstan
Lao Sanxai Minerals Company Limited; Lao People’s Democratic Republic
US$1.00Ordinary shares
70 705th Floor, ANZ Bank Building, 33 Lane Xang Avenue, Hatsady Village, Chanthaboury District, Vientiane Capital, Lao People’s Democratic Republic
Magma Arizona Railroad Company; United States
US$100.00Common shares
99.9 54.9 CSC, 8825 N. 23rd Avenue, Suite 100, Phoenix AZ 85021
Mineração Tabuleiro Ltda; Brazil BRLQuotas shares
100 48SIG, QUADRA 04, Lote 75, Sala 109 Parte D, Edifício Capital Financial Center, Brasília DF, CEP 71.610-440, Brazil
Minera Escondida Ltda; Chile(c) — — 30 Av. Cerro Plomo, Piso 18, Las Condes, Santiago, 7580154, Chile
Minmetals Rio Tinto Exploration Company Limited; China
CNY1.00 Ordinary shares 50.0 50.0 Section C239, Level 3, Phase II, Standard Workshop, Innovative Industrial
Park, Sanya City, Hainan Province, China
New Zealand Aluminium Smelters Ltd; New Zealand
NZD1.00 Class AOrdinary shares
100 79.4 1530 Tiwai Road, Tiwai Point Invercargill, 9877 New Zealand
Northern Land Company Ltd; Canada CAD$1.00Ordinary shares
100 58.7 2 Avalon Drive, Labrador City NL A2V 2V6, Canada
Nozalela Mineral Sands (Pty) Ltd; South Africa ZAR1.00Ordinary shares
100 74 The Farm RBM, Number 16317, KwaZulu-Natal, South Africa
NZAS Retirement Fund Trustee Limited; New Zealand
NZDOrdinary shares
100 79.4Mercer (N.Z.) Limited, Level 2, 20 Customhouse Quay, Wellington, 6011, New Zealand
Oyu Tolgoi LLC; Mongolia(e) MNT10,000.00Common shares
66 33.5Level 12 Monnis Tower, Chinggis Avenue-15, 1st khoroo, Sukhbaatar District, Ulaanbaatar, 14240, Mongolia
Oyu Tolgoi Netherlands B.V.; Netherlands €100.00 Ordinary shares
100 50.8 Prins Bernhardplein 200, 1097 JB, Amsterdam, Netherlands
Pechiney Philippines Inc.; Philippines PHP10.00 Ordinary shares
99.9 99.9Room 306, ITC Building, 337 Sen Gil Puyat Avenue, Makati,Metro Manila, Philippines
Pechiney Reynolds Quebec, Inc.; United States US$10.00Common shares
5050.2 CSC, 233 South 13th Street, Suite 1900, Lincoln NE 68508, United States
US$100.00Preferred shares
100
Port d’Ehoala S.A.; Madagascar US$100.00Ordinary shares
100 80Immeuble ASSIST, Ivandry, Lot N°35, 5ème étage, 101 Antananarivo, Madagascar
Procivis Savoie; France €19.00Ordinary shares
22.1 22.1 116 Quai Charles Roissard, 73000, Chambéry, France
PT Hutan Lindung Kelian Lestari; Indonesia IDR9,803.00Ordinary shares
99 99 Kelian Mine Site, West Kutai, East Kalimantan, Indonesia
PT Kelian Equatorial Mining; Indonesia IDR1,080.00 Ordinary shares
90 90Sampoerna Strategic Square, South Tower, Level 30, Jl. Jenderal Sudirman Kav. 45-46, Jakarta, 12930, Indonesia
QIT Madagascar Minerals SA; Madagascar US$10.00 Certificatsd’investissement
10080
Immeuble ASSIST, Ivandry, Lot N°35, 5ème étage, 101 Antananarivo, MadagascarUS$10.00
Common shares85
Quebec North Shore and Labrador Railway Company; Canada
CAD$27.59 Ordinary shares
100 58.7400-1190 Avenue des Canadiens-de-Montréal, Montréal QC H3B 0E3, Canada
Queensland Alumina Limited; Australia AUD Class B shares 100
80 Plant Operations Building, Parsons Point, Gladstone QLD 4680, AustraliaAUD Class C shares 100
AUD Class D shares 100
Resolution Copper Mining LLC; United States(c) — — 55 CSC, 251 Little Falls Drive, Wilmington DE 19808, United States
Richards Bay Mining (Proprietary) Limited; South Africa
ZAR0.01 BOrdinary shares
100
73.9 The Farm RBM, Number 16317, KwaZulu-Natal, South AfricaZAR0.01 B Preference shares
100
ZAR 0.01 BHP Billiton
100
Richards Bay Prefco (Pty) Ltd; South Africa ZAR0.01Preference shares
100 99.9 The Farm RBM, Number 16317, KwaZulu-Natal, South Africa
Annual Report 2020 | riotinto.com 297297Annual Report 2020 | riotinto.com
Financial Statements
Additional disclosures

44 Related undertakings continuedOther Group entities including subsidiaries where the effective ownership is less than 100%, associated undertakings and significant holdings in undertakings other than subsidiary companies continued
Name of undertaking and countryof incorporation Share class
% of shareclass heldby Groupcompanies
EffectiveGroup %ownership Registered office address
Richards Bay Titanium (Proprietary) Limited; South Africa
ZAR0.01 BPreference shares
100
73.9 The Farm RBM, Number 16317, KwaZulu-Natal, South AfricaZAR0.01 BHPBilliton Preference
100
ZAR0.01 BOrdinary shares
100
Rightship Pty Ltd; Australia AUDOrdinary shares
33.3 33.3 Level 20, 500 Collins Street, Melbourne VIC 3000, Australia
Rio Tinto Orissa Mining Private Ltd; India INR100.00Ordinary shares
51 51220, 2nd Floor, DLF, Cyber City, Chandaka Industrial Area, Patia, Bhubneshwar, Odisha, 751024, India
Rio Tinto Sohar Logistics LLC; Oman OMR1.00Ordinary shares
70 70 P.O. Box 686, Ruwi, 112, Sultanate of Oman
Robe River Mining Co. Pty. Ltd.; Australia AUDA shares
4073.6
Level 18 Central Park, 152-158 St. Georges Terrace, Perth WA 6000, AustraliaAUD
B shares76.4
Robe River Ore Sales Pty. Ltd.; Australia AUDOrdinary shares
65 57.1Level 18 Central Park, 152-158 St. Georges Terrace, Perth WA 6000, Australia
Saryarka B.V.; Netherlands €200.00Ordinary shares
75 75 Welplaatweg 104, 3197 KS, Botlek-Rotterdam, Netherlands
SGLS LLC; Mongolia MNT10,000.00Common shares
100 50.8Level 17, Shangri-La Centre, Olympic Street 19A, Sukhbaatar District, Ulaanbaatar, 14241 Mongolia
Sharp Strategic Funding Pte. Ltd.; Singapore US$Common shares
100 50.8 77 Robinson Road, #13-00, Robinson 77, 068896, Singapore
Simfer Jersey Finance 1 Ltd; Jersey(d) US$Ordinary shares
100 53 PO Box 536, 13-14 Esplanade, St Helier, JE4 5UR, Jersey
Simfer Jersey Finance 2 Ltd; Jersey(d) US$Ordinary shares
53 53 PO Box 536, 13-14 Esplanade, St Helier, JE4 5UR, Jersey
Simfer Jersey Limited; Jersey US$Ordinary shares
53 53 PO Box 536, 13-14 Esplanade, St Helier, JE4 5UR, Jersey
Simfer Jersey Nominee Limited; United Kingdom
£1.00Ordinary shares
100 53 6 St James’s Square, London, SW1Y 4AD, United Kingdom
SIMFER S.A.; Guinea(e) GNF100,000.00Ordinary shares
85 45 Résidence Dolphine1 Coléah Corniche Sud, Commune de Matam, Conakry, BP 848, Guinea
Singapore Metals Pte. Ltd.; Singapore US$Ordinary shares
100 50.8 77 Robinson Road, #13-00, Robinson 77, 068896, Singapore
Société Minière Et De Participations GuinéeAlusuisse; Guinea(c) — — 50.0 Tougue, Guinea
Sohar Aluminium Co. L.L.C.; Oman OMR1.00Ordinary shares
20 20.0 Sohar Industrial Estate, P.O. Box 80, PC 327, Sohar, Sultanate of Oman
THR Aruba Holdings LLC A.V.V.; Aruba US$1.00Common shares
100 50.8IMC International Management Trust Company N.V., L.G. Smith Blvd. 62, Miramar Building, Oranjestad, Aruba
THR Delaware Holdings, LLC; United States(c)— — 50.8
National Corporate Research, Ltd., 850 New Burton Road, Suite 201, Dover DE 19904, United States
THR Kharmagtai Pte Ltd.; Singapore US$ Ordinary shares
100 50.8 77 Robinson Road, #13-00, Robinson 77, 068896, Singapore
THR MINES (BC) LTD.; Canada CADCommon shares
10050.8 1800 - 510 West Georgia Street, Vancouver BC V6B 0M3, Canada
US$Common shares
100
THR Mines Services Co. Ltd.; Canada CADCommon shares
100 50.8Lackowicz Shier & Hoffman Barristers & Solicitors, 300-204 Black Street, Whitehorse YT Y1A 2M9, Canada
THR OYU TOLGOI LTD.; British Virgin Islands US$1.00Ordinary shares
100 50.8 Craigmuir Chambers, Road Town, Tortola, VG1110 British Virgin Islands
THR Ulaan Pte. Ltd.; Singapore US$ Ordinary shares
100 50.8 77 Robinson Road, #13-00, Robinson 77, 068896, Singapore
298 Annual Report 2020 | riotinto.com298 Annual Report 2020 | riotinto.com
Financial Statements
Notes to the 2020 Financial Statements

Name of undertaking and countryof incorporation Share class
% of shareclass heldby Group companies
EffectiveGroup % ownership Registered office address
Tisand (Proprietary) Limited; South Africa ZAR1.00 AOrdinary shares
100
74 The Farm RBM, Number 16317, KwaZulu-Natal, South AfricaZAR1.00 BOrdinary shares
100
ZAR1,000.00 Cumulative Preference shares
100
Tomago Aluminium Company Pty Limited; Australia
AUDOrdinary shares
100 51.6 638 Tomago Road, Tomago, NSW 2322, Australia
TRQ Australia Pty. Ltd.; Australia AUD Ordinary shares
100 50.8 c/o Intertrust Australia Pty. Ltd., Level 25, Suite 2, 100 Miller Street, North Sydney NSW 2060, Australia
Turquoise Hill (Beijing) Services Company Ltd; China(c) — — 50.8
07-119 Inner Room 101, 7th Floor, No.219 Wangfujing Street, Dongcheng District, Beijing, China
Turquoise Hill Netherlands Cooperatief U.A.; Netherlands
US$COOP shares
100 50.8 Prins Bernhardplein 200, 1097 JB, Amsterdam, Netherlands
Turquoise Hill Resources Ltd.; Canada CAD Common Shares
50.8 50.8 300-204 Black Street, Whitehorse YT Y1A 2M9, Canada
Turquoise Hill Resources Philippines Inc.; Philippines(d)
PHP100.00Common shares
99.9 50.8Romulo Mabanta Buenaventura Sayoc & De Los Angeles, 21st Floor, Philamlife Tower, 8767 Paseo Roxas, Makati City, 1226, Philippines
Turquoise Hill Resources Singapore Pte Ltd.; Singapore
SGD1.00Common shares
100 50.8 2 Venture Drive, #24-01 Vision Exchange, Singapore 608526
Twin Falls Power Corporation Ltd; Canada CADClass B shares
74.4 14.6 Hydro Place, P.O. Box 12500, St-John's NL A1B 3T5, Canada
Wright Mgmt Services Pte. Ltd.; Singapore US$ Common shares
100 50.8 77 Robinson Road, #13-00, Robinson 77, 068896, Singapore
Yalleen Pastoral Co. Pty Ltd: Australia AUDOrdinary shares
65.7 57.4 Level 18 Central Park, 152-158 St.Georges Terrace, Perth WA 6000, Australia
Zululand Titanium (Pty) Ltd; South Africa ZAR1.00Ordinary shares
100 74 The Farm RBM, Number 16317, KwaZulu-Natal, South Africa
In addition, the Group participates in the following unincorporated arrangements:
Name of undertaking and country of incorporation Address or principal place of businessInterest % ownedby the Group
Bao-HI Ranges Joint Venture; Australia Level 18 Central Park, 152-158 St. Georges Terrace, Perth WA 6000, Australia 54Beasley River Joint Venture; Australia Level 18 Central Park, 152-158 St. Georges Terrace, Perth WA 6000, Australia 53Cape Bougainville Joint Venture; Australia 123 Albert Street, Brisbane QLD 4000, Australia 67.5Channar Mining Joint Venture; Australia Level 18 Central Park, 152-158 St. Georges Terrace, Perth WA 6000, Australia 60Diavik Joint Venture; Canada 300-5201 50th Avenue, Yellowknife NT X1A 2P9, Canada 60
Gladstone Power Station Joint Venture; Australia NRG Gladstone Operating Service, Gladstone Power Station, Gladstone QLD 4680, Australia
42.1
Green Mountain Mining Venture; United States CSC 251 Little Falls Drive, Wilmington DE 19808, United States 100Hope Downs Joint Venture; Australia Level 18 Central Park, 152-158 St. Georges Terrace, Perth WA 6000, Australia 50Mitchell Plateau Joint Venture; Australia 123 Albert Street, Brisbane QLD 4000, Australia 65.6Rhodes Ridge Joint Venture; Australia Level 18 Central Park, 152-158 St. Georges Terrace, Perth WA 6000, Australia 50Robe River Iron Associates Joint Venture; Australia Level 18, Central Park, 152-158 St. Georges Terrace, Perth WA 6000, Australia 57.1Tomago Aluminium Joint Venture; Australia 638 Tomago Road, NSW 2322, Tomago, Australia 51.6Winter Road Joint Venture; Canada 300-5201 50th Avenue, Yellowknife NT X1A 2P9, Canada 33.3Yarraloola Pastoral Co.; Australia Level 18 Central Park, 152-158 St. Georges Terrace, Perth WA 6000, Australia 57.1
(a) Directly held by Rio Tinto Limited.(b) Directly held by Rio Tinto plc.(c) Group ownership is held through an interest in capital. The entity has no classes of shares.(d) In liquidation or application for dissolution filed.(e) Classed as a subsidiary in accordance with section 1162 (4)(a) of the UK Companies Act 2006 on the grounds of dominant influence.
Annual Report 2020 | riotinto.com 299299Annual Report 2020 | riotinto.com
Financial Statements
Additional disclosures

45 Events after the balance sheet date There were no significant events after the balance sheet date requiring disclosure.
300 Annual Report 2020 | riotinto.com300 Annual Report 2020 | riotinto.com
Financial Statements
Notes to the 2020 Financial Statements

As at 31 December Note2020
US$m2019US$m
Non-current assetsInvestments B 36,320 36,250 Trade and other receivables 206 263
36,526 36,513 Current assetsTrade and other receivables C 5,710 6,439 Cash at bank and in hand 11 5
5,721 6,444 Total assets 42,247 42,957
Current liabilitiesTrade and other payables D (13,205) (13,018) Dividends payable (24) (18) Other financial liabilities G (67) (278)
(13,296) (13,314) Non-current liabilitiesOther financial liabilities G (156) (223) Total liabilities (13,452) (13,537)
Net assets 28,795 29,420
Capital and reservesShare capital E 207 207 Share premium account 4,313 4,312 Other reserves F 12,005 12,005 Retained earnings 12,270 12,896 Total equity 28,795 29,420
The Rio Tinto plc company balance sheet has been prepared in accordance with Financial Reporting Standard 101 “Reduced Disclosure Framework” (FRS 101). Note A explains the principal accounting policies.
Profit after tax and total comprehensive income for the year amounted to US$4,027 million (2019: US$4,959 million). As permitted by section 408 of the UK Companies Act 2006, no statement of comprehensive income for the Rio Tinto plc parent company is shown.
The Rio Tinto plc company balance sheet, statement of comprehensive income and the related notes were approved by the directors on 22 February 2021 and the balance sheet is signed on their behalf by
Simon Thompson Jakob Stausholm Peter CunninghamChairman Chief Executive Interim Chief Financial Officer
Rio Tinto plc
Registered number: 719885
Rio Tinto plc (the “Company”) is incorporated in the United Kingdom, registered in England and Wales, and domiciled in the United Kingdom.
Financial statements
Rio Tinto plc
Company Balance Sheet
Annual Report 2020 | riotinto.com 301301Annual Report 2020 | riotinto.com
Financial Statements
Rio Tinto plcCompany balance sheet
Financial Statements

Year ended 31 December 2020
SharecapitalUS$m
Sharepremium
accountUS$m
Otherreserves
US$m
Retainedearnings
US$m
TotalequityUS$m
Opening balance 207 4,312 12,005 12,896 29,420 Profit for the financial year (comprehensive income) — — — 4,027 4,027 Dividends — — — (4,720) (4,720) Proceeds from issue of shares — 1 — — 1 Share-based payments — — — 67 67 Total 207 4,313 12,005 12,270 28,795
Year ended 31 December 2019
SharecapitalUS$m
Sharepremiumaccount
US$m
Otherreserves
US$m
Retainedearnings
US$m
TotalequityUS$m
Opening balance 211 4,311 12,001 16,995 33,518 Profit for the financial year (comprehensive income) — — — 4,959 4,959 Dividends — — — (7,987) (7,987) Proceeds from issue of shares — 1 — — 1 Share buy-back (4) — 4 (1,135) (1,135) Share-based payments — — — 64 64 Total 207 4,312 12,005 12,896 29,420
Financial statements continued
Rio Tinto plc
Company Statement of Changes in Equity
302 Annual Report 2020 | riotinto.com302 Annual Report 2020 | riotinto.com
Financial Statements
Rio Tinto plcCompany statement of changes in equity

A Principal accounting policiesa. Basis of preparationThe Rio Tinto plc company financial statements have been prepared using the historical cost convention, as modified by the revaluation of certain financial liabilities and in accordance with the UK Companies Act 2006 and FRS 101. The financial statements have been prepared on a going concern basis.
The accounting policies set out below have been applied consistently to all periods presented in these financial statements. The following exemptions available under FRS 101 have been applied:
– Paragraphs 45(b) and 46 to 52 of IFRS 2, “Share-based payment” (details of the number and weighted average exercise prices of share options and how the fair value of goods and services received was determined).
– Paragraphs 91-99 of IFRS 13 “Fair value measurement” (disclosure of valuation techniques and inputs used for fair value measurement of assets and liabilities).
– IFRS 7 “Financial Instruments: Disclosures”.
– Paragraph 38 of IAS 1 “Presentation of financial statements”, comparative information requirements in respect of Paragraph 79(a)(iv) of IAS 1.
– The following paragraphs of IAS 1 “Presentation of financial statements”:
– 10 (d) (statement of cash flows);– 16 (statement of compliance with all IFRS);– 38A (requirement for minimum of two primary statements,
including cash flow statements);– 38B-D (additional comparative information);– 111 (cash flow statement information); and– 134-136 (capital management disclosures).
– IAS 7 “Statement of cash flows”.
– Paragraph 30 and 31 of IAS 8 “Accounting policies, changes in accounting estimates and errors” (requirement for the disclosure of information when an entity has not applied a new IFRS that has been issued and is not yet effective).
– Paragraph 17 of IAS 24 “Related party disclosures” (key management compensation).
– The requirements of IAS 24, “Related party disclosures” to disclose related party transactions entered into between two or more members of a group.
b. Judgments in applying accounting policies and key sources of estimation uncertainty
The preparation of the financial statements requires management to make assumptions, judgments and estimates and to use judgment in applying accounting policies and making critical accounting estimates. These judgments, estimates and assumptions are based on management’s best knowledge of the relevant facts and circumstances, having regard to previous experience, but actual results may differ materially from the amounts included in the financial statements.
The key area of judgment that has the most significant effect on the amounts recognised in the financial statements is the review for impairment of investment carrying values.
Investments in subsidiaries are reviewed for impairment where events or changes in circumstances indicate that the carrying amount of the investment may not be recoverable. The unit of account being the equity of the subsidiary taken as a whole, which may comprise interests in multiple cash-generating units.
If any such indication exists, Rio Tinto plc makes an assessment of the recoverable amount. If the asset is determined to be impaired, an impairment loss will be recorded and the asset written down based on the amount by which the asset carrying amount exceeds the higher of
fair value less cost of disposal and value in use. An impairment loss is recognised immediately in the income statement.
c. Currency translationItems included in the financial statements are measured using the currency of the primary economic environment in which the Company operates (the functional currency). The financial statements are presented in US dollars, which is the Company’s functional and presentation currency. Transactions denominated in other currencies, including the issue of shares, are translated into the functional currency using the exchange rates prevailing at the date of the transaction.
Foreign exchange gains and losses resulting from the settlement of such transactions, and from the translation at year-end exchange rates of monetary assets and liabilities denominated in foreign currencies, are recognised in the profit and loss account.
Exchange rates used are consistent with the rates used by the Group as disclosed in the consolidated financial statements (note 40).
d. InvestmentsInvestments in Group companies are valued at cost less accumulated impairment losses. Investments are reviewed for impairment if events or changes in circumstances indicate that the carrying amount may not be recoverable.
e. Financial guaranteesFinancial guarantees are recognised initially at fair value. Subsequently, the liability is measured at the higher of the best estimate of the expenditure required to settle the present obligation and the amount initially recognised less cumulative amortisation.
f. Share-based paymentsThe Company operates a number of share-based payment plans for Group employees, the details of which are included in the consolidated financial statements (note 41). The fair value of the Company’s share plans is recognised as an addition to the cost of the investment in the subsidiary in which the relevant employees work over the expected vesting period, with a corresponding entry to retained earnings. Payments received from the Company’s subsidiaries in respect of these share-based payments are recognised as a reduction in the cost of the investment. The Company uses fair values provided by independent actuaries calculated using either a lattice-based option valuation model or a Monte Carlo simulation model. The fair value of the share plans is determined at the date of grant, taking into account any market-based vesting conditions attached to the award.
Non-market based vesting conditions (eg relative EBIT margin performance targets) are taken into account in estimating the number of awards likely to vest. The estimate of the number of awards likely to vest is reviewed at each balance sheet date up to the vesting date, at which point the estimate is adjusted to reflect the actual awards issued. No adjustment is made after the vesting date even if the awards are forfeited or not exercised.
g. Dividend incomeDividend income is recognised when the right to receive payment is established.
h. Treasury sharesThe consideration paid for shares repurchased by the Company and held as treasury shares is recognised as a reduction in shareholders’ funds through retained earnings.
Financial statements
Notes to the Rio Tinto plc Financial Statements
Annual Report 2020 | riotinto.com 303303Annual Report 2020 | riotinto.com
Financial Statements
Notes to the Rio Tinto plc Financial Statements
Financial Statements

B Investments2020
US$m2019
US$m
Investments in Group companies:At 1 January 36,250 36,159 Additions 70 91 At 31 December 36,320 36,250
At 31 December 2020, the Company had the following principal subsidiaries:
Company Principal activityCountry of
incorporationPercentage
shareholding
Rio Tinto International Holdings Limited Holding company UK 100 %Rio Tinto European Holdings Limited Holding company UK 100 %
In accordance with section 409 of the UK Companies Act 2006, a full list of related undertakings is disclosed in the consolidated financial statements (note 44).
C Trade and other receivablesTrade and other receivables includes US$5,656 million (31 December 2019: US$6,256 million), which is subject to interest based on LIBOR, is unsecured and repayable on demand.
D Trade and other payablesTrade and other payables include US$13,042 million (31 December 2019: US$12,968 million) which is subject to interest rates based on LIBOR, is unsecured and repayable on demand.
E Share capital2020
US$m2019
US$m
Issued and fully paid up share capital of 10p each(a)
At 1 January 207 211 Ordinary shares purchased and cancelled(b) — (4) At 31 December 207 207
(a) 39,273 new shares (2019: 40,974 new shares) were issued during the year and 568,863 shares (2019: 23,659 shares) were reissued from Treasury during the year resulting from the vesting of awards and the exercise of options under Rio Tinto plc employee share-based payment plans, with exercise prices and market values between £32.74 and £56.32 per share.
(b) The authority for the Company to buy back its ordinary shares was renewed at the 2020 annual general meeting. 3,627,568 shares (2019: 28,356,034 shares) were bought back and cancelled in 2020 under the on-market buy-back programme.
F Other reservesOther reserves include US$11,936 million (2019: US$11,936 million) which represents the difference between the nominal value and issue price of the shares issued arising from Rio Tinto plc’s rights issue completed in July 2009.
G Rio Tinto plc guaranteesRio Tinto plc provides a number of guarantees in respect of Group companies.
Rio Tinto plc and Rio Tinto Limited have jointly guaranteed the Group’s external listed debt under the US Shelf Programme, European Debt Issuance Programme and Commercial Paper Programme which totalled US$5.5 billion at 31 December 2020 (31 December 2019: US$5.9 billion). In addition, these entities also jointly guarantee the Group’s undrawn credit facility which was US$7.5 billion at 31 December 2020 (31 December 2019: US$7.5 billion). Rio Tinto plc has provided guarantees in respect of certain derivative contracts that are in a liability position of US$141 million at 31 December 2020 (31 December 2019: US$290 million).
Rio Tinto plc has provided a guarantee, known as the completion support undertaking (CSU), in favour of the Oyu Tolgoi LLC project finance lenders. At 31 December 2020, US$4.3 billion of project finance debt was outstanding under this facility (31 December 2019: US$4.3 billion). Oyu Tolgoi LLC is owned by Erdenes Oyu Tolgoi LLC (34%), which is controlled by the Government of Mongolia, and Turquoise Hill Resources Ltd (66%, of which Rio Tinto owns 51%). The project finance has been raised for development of the underground mine and the CSU will terminate on the completion of the underground mine according to a set of completion tests set out in the project finance facility.
The Rio Tinto guarantee applies to the extent that Turquoise Hill Resources Ltd cannot satisfy Oyu Tolgoi LLC’s project finance debt servicing obligations under its own guarantee to the lenders, called the sponsor debt service undertaking (DSU). Both the CSU and DSU contain a carve-out for certain political risk events.
During 2020, fees of US$108 million (2019: US$157 million) were received from Oyu Tolgoi LLC and Turquoise Hill Resources Ltd as consideration for the provision of the CSU.
Financial statements
Notes to the Rio Tinto plc Financial Statementscontinued
304 Annual Report 2020 | riotinto.com304 Annual Report 2020 | riotinto.com
Financial Statements
Notes to the Rio Tinto plc Financial Statements

G Rio Tinto plc guarantees continued
Rio Tinto plc has provided a number of guarantees in relation to various pension funds. Subject to certain conditions, Rio Tinto plc would pay any contributions due from Group companies participating in these funds in the event that the companies fail to meet their contribution requirements. The guarantees were not called upon in 2020. The aggregate of company contributions to these plans in 2020 was US$10 million (2019: US$37 million).
Other guarantees issued by Rio Tinto plc in relation to Rio Tinto Group entities as at 31 December 2020 amount to US$388 million (31 December 2019: US$353 million). Included within this balance is US$35 million (31 December 2019: US$32 million) in relation to non-wholly owned subsidiaries.
Pursuant to the DLC Merger, both Rio Tinto plc and Rio Tinto Limited issued deed poll guarantees by which each company guaranteed contractual obligations incurred by the other or guaranteed by the other.
The liability recognised for financial guarantees is US$223 million (31 December 2019: US$294 million) presented in "Other financial liabilities" in the balance sheet.
H Contingent liabilitiesDetails of contingent liabilities are included in note 30 to the Group financial statements.
I Events after the balance sheet dateThere were no significant events after the balance sheet date requiring disclosure.
Financial statements continued
Annual Report 2020 | riotinto.com 305305Annual Report 2020 | riotinto.com
Financial Statements
Financial Statements

Gross product sales(a)
for the year ended31 December
Underlying EBITDA(b)
for the year ended31 December
Net earnings(c)
for the year ended31 December
Rio Tinto interest
%2020
US$m2019
US$m2018
US$m2020
US$m2019
US$m2018
US$m2020
US$m2019
US$m2018
US$m
Iron OrePilbara (d) 27,027 23,681 18,359 18,896 15,936 11,267 11,551 9,619 6,460 Dampier Salt 68.4 252 271 246 43 75 56 12 27 18 Evaluation projects/other (e) 657 123 126 (32) 87 55 (112) (8) 53 Intra-segment (e) (428) — — (70) — — (53) — — Total Iron Ore 27,508 24,075 18,731 18,837 16,098 11,378 11,398 9,638 6,531
Aluminium (f)Bauxite 2,302 2,490 2,364 943 1,045 852 434 498 466 Alumina 2,233 2,720 3,423 262 567 808 92 247 390 Primary Metal 4,489 4,940 6,468 904 755 1,418 169 40 595 Pacific Aluminium 1,944 2,204 2,541 112 (22) 148 (6) (137) — Intra-segment and other (2,510) (3,079) (4,084) 6 30 (92) (159) 21 (69) Integrated operations 8,458 9,275 10,712 2,227 2,375 3,134 530 669 1,382 Other product group items 856 1,065 1,479 7 16 17 (5) 10 11 Product group operations 9,314 10,340 12,191 2,234 2,391 3,151 525 679 1,393 Evaluation projects/other — — — (82) (106) (56) (54) (80) (46) Total Aluminium 9,314 10,340 12,191 2,152 2,285 3,095 471 599 1,347
Copper & DiamondsRio Tinto Kennecott 100.0 1,529 1,879 1,862 588 843 785 149 397 293 Escondida 30.0 2,296 2,136 2,274 1,462 1,034 1,301 650 325 506 Grasberg joint venture (h) — — 457 — — 281 — — 217 Oyu Tolgoi and Turquoise Hill (i) 1,078 1,166 1,180 390 357 375 160 25 69 Diamonds (j) 459 619 695 83 151 301 9 (21) 118 Product group operations 5,362 5,800 6,468 2,523 2,385 3,043 968 726 1,203 Evaluation projects/other 66 15 — (351) (312) (267) (205) (172) (149) Total Copper & Diamonds 5,428 5,815 6,468 2,172 2,073 2,776 763 554 1,054
Energy & MineralsRio Tinto Coal Australia (k) — — 989 — — 893 — — 591 Iron Ore Company of Canada 58.7 2,444 2,189 1,583 1,130 1,024 586 383 332 166 Rio Tinto Iron & Titanium (l) 1,651 1,938 1,782 476 611 510 216 254 174 Rio Tinto Borates 100.0 564 593 622 126 180 197 65 96 111 Uranium (m) 303 375 415 24 55 18 6 25 (4) Product group operations 4,962 5,095 5,391 1,756 1,870 2,204 670 707 1,038 Simandou iron ore project (n) — — — (14) (12) (15) (6) (5) (7) Evaluation projects/other 52 55 60 (96) (96) (49) (87) (91) (36) Total Energy & Minerals 5,014 5,150 5,451 1,646 1,762 2,140 577 611 995
Other operations (o) 18 18 9 — (77) (70) (54) (89) (102)
Inter-segment transactions (264) (31) (15) (94) (9) — (32) (3) —
Product group total 47,018 45,367 42,835 24,713 22,132 19,319 13,123 11,310 9,825
Central pension costs, share-based payments and insurance 72 59 (128) 81 60 (90) Restructuring, project and one-off costs (133) (183) (272) (108) (94) (190) Central costs (500) (496) (552) (418) (550) (410) Exploration and evaluation (250) (315) (231) (216) (231) (193) Net interest (14) (122) (134) Underlying EBITDA/earnings 23,902 21,197 18,136 12,448 10,373 8,808 Items excluded from underlying EBITDA/earnings (395) (722) 5,127 (2,679) (2,363) 4,830 Reconciliation to Group income statementShare of equity accounted unit sales andintra-subsidiary/equity accounted unit sales (2,407) (2,202) (2,313) Impairment charges (1,272) (3,487) (132) Depreciation and amortisation in subsidiariesexcluding capitalised depreciation (4,074) (4,272) (3,909) Depreciation and amortisation in equity accounted units (576) (653) (650) Taxation and finance items in equity accounted units (443) (296) (372)
Finance items (1,751) (648) (33)
Consolidated sales revenue/profit before taxation/net earnings 44,611 43,165 40,522 15,391 11,119 18,167 9,769 8,010 13,638
Financial statements continued
Rio Tinto Financial Information by Business Unit
306 Annual Report 2020 | riotinto.com306 Annual Report 2020 | riotinto.com
Financial Statements
Rio Tinto Financial Information by Business Unit

Capital expenditure(p)
for the yearended 31 December
Depreciation and amortisation for the year
ended 31 DecemberOperating assets(q)
as at 31 DecemberEmployees for the year
ended 31 December
Rio Tintointerest
%2020
US$m2019
US$m2018
US$m2020
US$m2019
US$m2018
US$m2020
US$m2019
US$m2018
US$m2020 2019 2018
Iron OrePilbara (d) 2,919 1,720 1,288 1,819 1,704 1,682 16,253 13,865 14,486 11,522 10,634 10,422 Dampier Salt 68.4 22 21 14 19 19 20 163 152 165 351 347 239 Evaluation projects/other (e) — — — — — — 338 2 2 10 — — Intra-segment (e) — — — — — — (104) — — — — — Total Iron Ore 2,941 1,741 1,302 1,838 1,723 1,702 16,650 14,019 14,653 11,883 10,981 10,661
Aluminium (f)Bauxite 142 387 953 290 286 165 2,593 2,597 2,494 2,853 2,940 2,676 Alumina 228 282 218 138 187 194 2,294 2,009 2,721 2,383 2,269 2,009 Primary Metal 602 658 595 643 682 615 9,361 9,674 9,306 6,282 6,357 6,497 Pacific Aluminium 114 129 115 119 154 149 455 970 1,156 2,469 2,356 2,278 Intra-segment and other (1) — — 1 — (1) 662 780 769 141 127 180 Integrated operations 1,085 1,456 1,881 1,191 1,309 1,122 15,365 16,030 16,446 14,128 14,049 13,640 Other product group items (g) — — (508) — — — — — — — — — Product group operations 1,085 1,456 1,373 1,191 1,309 1,122 15,365 16,030 16,446 14,128 14,049 13,640 Evaluation projects/other — — — — 3 — — — — — — — Total Aluminium 1,085 1,456 1,373 1,191 1,312 1,122 15,365 16,030 16,446 14,128 14,049 13,640
Copper & DiamondsRio Tinto Kennecott 100.0 618 444 318 472 457 427 2,317 2,012 1,864 2,171 2,066 1,993 Escondida 30.0 178 315 302 428 508 518 2,726 2,871 3,057 1,124 1,068 1,087 Grasberg joint venture (h) — — 171 — — 30 — — — — — 1,615 Oyu Tolgoi and Turquoise Hill (i) 1,038 1,289 1,284 189 208 219 8,111 6,780 6,072 3,450 3,152 2,863 Diamonds (j) 25 38 64 60 144 118 (7) 195 267 885 940 967 Product group operations 1,859 2,086 2,139 1,149 1,317 1,312 13,147 11,858 11,260 7,630 7,226 8,525 Evaluation projects/other 5 1 11 4 3 5 192 152 129 159 150 146 Total Copper & Diamonds 1,864 2,087 2,150 1,153 1,320 1,317 13,339 12,010 11,389 7,789 7,376 8,671
Energy & MineralsRio Tinto Coal Australia (k) — — 32 — — 34 — — (837) — — 1,005 Iron Ore Company of Canada 58.7 243 255 189 170 172 154 1,009 803 975 2,716 2,617 2,397 Rio Tinto Iron & Titanium (l) 144 249 169 173 193 201 3,390 3,507 3,390 4,151 4,115 4,058 Rio Tinto Borates 100.0 42 43 44 49 60 62 502 525 518 966 924 980 Uranium (m) — 5 8 — 3 4 (71) (363) (406) 364 857 1,324 Product group operations 429 552 442 392 428 455 4,830 4,472 3,640 8,197 8,513 9,764 Simandou iron ore project (n) (2) (1) — — — — 16 20 15 69 74 70 Evaluation projects/other 1 — — — — — 33 37 41 77 53 33 Total Energy & Minerals 428 551 442 392 428 455 4,879 4,529 3,696 8,343 8,640 9,867
Other operations (o) 2 (4) 12 199 177 26 (479) (83) (442) 124 159 187 Inter-segment transactions 129 127 129 Product group total 6,320 5,831 5,279 4,773 4,960 4,622 49,883 46,632 45,871 42,267 41,205 43,026
Net assets of disposal groups held for sale (r) — — 440
Other items 79 64 65 82 77 43 (2,165) (2,449) (2,880) 5,207 4,802 4,432 Less: equity accounted units (255) (456) (500) (576) (653) (650) — — — — — — Total 6,144 5,439 4,844 4,279 4,384 4,015 47,718 44,183 43,431 47,474 46,007 47,458 Add back: Proceeds from disposal of
property, plant and equipment 45 49 586
Total capital expenditure per cash flow statement 6,189 5,488 5,430
Less: Net (debt)/cash (664) (3,651) 255 Equity attributable to owners of Rio Tinto 47,054 40,532 43,686
Financial statements
Rio Tinto Financial Information by Business Unit continued
Annual Report 2020 | riotinto.com 307307Annual Report 2020 | riotinto.com
Financial Statements
Financial Statements
Rio Tinto Financial Information by Business Unit
Business units are classified according to the Group’s management structure.
The disclosures in this note include certain Alternative performance measures (APMs). For more information on the APMs used by the Group, including definitions and calculations, please refer to pages 329-333.
(a) Gross product sales includes the sales revenue of equity accounted units on a proportionately consolidated basis (after adjusting for sales to subsidiaries) in addition to consolidated sales. Consolidated sales revenue includes subsidiary sales to equity accounted units which are not included in gross product sales.
(b) Underlying EBITDA of subsidiaries and the Group’s share relating to equity accounted units represents earnings attributable to owners of Rio Tinto before: tax, net finance items, depreciation and amortisation charged to the income statement in the period and excludes the EBITDA impact of the same items that are excluded from underlying earnings as defined in note 2.
(c) Represents profit after tax for the period attributable to the owners of the Rio Tinto Group. Business unit earnings are stated before finance items but after the amortisation of discount related to provisions. Earnings attributed to business units do not include amounts that are excluded in arriving at underlying earnings.
(d) Pilbara represents the Group’s 100% holding in Hamersley, 50% holding in Hope Downs Joint Venture and 65% holding in Robe River Iron Associates. The Group’s net beneficial interest in Robe River Iron Associates is 53%, as 30% is held through a 60% owned subsidiary and 35% is held through a 100% owned subsidiary.
(e) Gross product sales, Underlying EBITDA, Net Earnings and Operating assets within Evaluation projects/other include activities relating to the shipment and blending of Pilbara and Iron Ore Company of Canada (IOC) iron ore inventories held at portside in China and sold to domestic customers. Transactions between the Pilbara and our portside trading business are eliminated through the Iron Ore "intra-segment" line and transactions between IOC and the portside trading business are eliminated through "inter-segment transactions".
(f) In order to reflect the evolution of the Aluminium business, the following changes have been implemented:
– The consolidation line for Bauxite & Alumina has been removed to reflect the less integrated nature of the business and the evolution of the Bauxite business towards a primarily export oriented operation. As a result of this change, the intra-group segment elimination for Gross product sales, Underlying EBITDA, Net Earnings and Operating assets between bauxite and alumina are now reported on line "Intra-segment and other". The intra-segment eliminations for the year ended 31 December 2020 would have been US$722 million, US$31 million, US$21 million and US$7 million respectively. For the year ended 31 December 2019 the eliminations were US$825 million, US$10 million, US$7 million and US$27 million. For the year ended 31 December 2018 the eliminations were US$861 million, US$7 million, US$5 million and US$20 million.
– The Underlying EBITDA and Net Earnings have been restated to include the impact of the legacy alumina contracts (2019: US$218 million and US$171 million, respectively; 2018: US$457 million and US$355 million, respectively) in the Alumina business instead of being included in the Other product group items line, in order to provide a comprehensive view of the performance of the Alumina business.
– The Gross product sales, Underlying EBITDA and Net Earnings have been restated to reallocate the margin generated by internal shipping activities to Bauxite (2019: US$31 million, US$76 million and US$57 million, respectively; 2018: US$40 million, US$62 million and US$54 million, respectively) and Alumina businesses (2019: US$63 million, US$157 million and US$117 million, respectively; 2018: US$83 million, US$128 million and US$111 million, respectively), instead of being included in the Evaluation project/other line in order to provide a comprehensive view of the performance of the Bauxite and Alumina businesses.
Gross product sales, Underlying EBITDA, Net Earnings and Operating assets of the overall Rio Tinto Aluminium business were not impacted by these changes.
(g) In 2018, Aluminium capital expenditure was reported net of US$508 million proceeds received from the sale of surplus land at Kitimat. These proceeds were not included in Aluminium’s free cash flow and the associated gain was excluded from business unit earnings and Underlying EBITDA.
(h) Through a joint venture agreement with Freeport-McMoRan Inc. (Freeport), we were entitled to 40% of material mined above an agreed threshold as a consequence of expansions and developments of the Grasberg facilities since 1998 (until 21 December 2018). On 21 December 2018, we sold our entire interest in the Grasberg mine to PT Indonesia Asahan Aluminium (Persero) (Inalum).
(i) Our interest in Oyu Tolgoi is held indirectly through our 50.8% investment in Turquoise Hill Resources Ltd (TRQ), where TRQ’s principal asset is its 66% investment in Oyu Tolgoi LLC, which owns the Oyu Tolgoi copper-gold mine.
(j) Includes our interests in Argyle (100%) and Diavik (60%).
(k) Includes our 82% interest in the Hail Creek coal mine (until 1 August 2018), our 80% interest in the Kestrel underground coal mine (until 1 August 2018) and interests in the Winchester South (until 1 June 2018) and Valeria development projects (until 1 August 2018).
On 1 June 2018, we sold our entire 75% interest in the Winchester South coal development project in Queensland, Australia, to Whitehaven Coal Limited for US$200 million.
On 1 August 2018, we sold our entire 82% interest in the Hail Creek coal mine and 71.2% interest in the Valeria coal development project in Queensland, Australia, to Glencore for US$1.7 billion.
On 1 August 2018, we sold our entire 80% interest in the Kestrel underground coal mine in Queensland, Australia, to a consortium comprising private equity manager EMR Capital (EMR) and PT Adaro Energy Tbk (Adaro), an Indonesian listed coal company, for US$2.25 billion.
Rio Tinto Coal Australia’s operating assets of US$(837) million at 31 December 2018 included provisions for onerous contracts in relation to rail infrastructure capacity and capital gains tax payable on the divestments announced in the year, partly offset by financial assets and receivables relating to contingent royalties and disposal proceeds. Following a change in management responsibility in 2019, these amounts are reported within "Other operations" at 31 December 2020 and 31 December 2019, with no restatement of the 31 December 2018 comparative amount.
(l) Includes our interests in Rio Tinto Fer et Titane (100%), QIT Madagascar Minerals (QMM, 80%) and Richards Bay Minerals (attributable interest of 74%).
Financial statements continued
Notes to Financial Information by Business Unit
308 Annual Report 2020 | riotinto.com308 Annual Report 2020 | riotinto.com
Financial Statements
Notes to Financial Information by Business Unit

(m) Includes our interests in Energy Resources of Australia (ERA) and in Rössing Uranium Limited (Rössing) (68.6%), up until the sale of Rössing on 16 July 2019. In February 2020, our interest in ERA increased from 68.4% to 86.3% as a result of new ERA shares issued to Rio Tinto under the Entitlement Offer and Underwriting Agreement to raise funds for the rehabilitation of the Ranger Project Area.
(n) Simfer Jersey Limited, in which the Group has a 53% interest, has an 85% interest in Simfer S.A., the company that manages the Simandou project in Guinea. The Group therefore has a 45.05% indirect interest in Simfer S.A. These entities are consolidated as subsidiaries and together referred to as the Simandou iron ore project.
(o) Other operations include our 100% interest in the Gove alumina refinery, Rio Tinto Marine and, with effect from the first half of 2019, the remaining operating assets of Rio Tinto Coal Australia. As at 31 December 2020, these include provisions for onerous contracts in relation to rail infrastructure capacity, partly offset by deferred tax assets and financial assets and receivables relating to contingent royalties and disposal proceeds. Refer to note (k).
(p) Capital expenditure is the net cash outflow on purchases less sales of property, plant and equipment, capitalised evaluation costs and purchases less sales of other intangible assets. The details provided include 100% of subsidiaries’ capital expenditure and Rio Tinto’s share of the capital expenditure of joint operations and equity accounted units.
(q) Operating assets of subsidiaries is comprised of net assets excluding post-retirement assets and liabilities, net of tax, and before deducting net debt. Operating assets are stated after the deduction of non- controlling interests – these are calculated by reference to the net assets of the relevant companies (ie inclusive of such companies’ debt and amounts due to or from Rio Tinto Group companies).
(r) Assets and liabilities held for sale at 31 December 2018 included our interest in Rössing Uranium Limited, the ISAL smelter, the Aluchemie anode plant, and the Alufluor aluminium fluoride plant.
Financial statements
Notes to Financial Information by Business Unit continued
Annual Report 2020 | riotinto.com 309309Annual Report 2020 | riotinto.com
Financial Statements
Financial Statements

Pursuant to section 340 of the Australian Corporations Act 2001 (Corporations Act), the Australian Securities and Investments Commission issued an order dated 24 July 2020 that granted relief to Rio Tinto Limited from certain requirements of the Corporations Act in relation to its financial statements and associated reports. The order essentially continues the relief that has applied to Rio Tinto Limited since the formation of the Group’s dual listed companies (DLC) structure in 1995. The order applies to Rio Tinto Limited’s financial reporting obligations for the financial years and half-years ending between 30 June 2020 and 30 June 2023 inclusive.
In essence, instead of being required under the Corporations Act to prepare consolidated financial statements covering only itself and its controlled entities, the order allows Rio Tinto Limited to prepare consolidated financial statements in which it, Rio Tinto plc and their respective controlled entities are treated as a single economic entity. In addition, those consolidated financial statements are to be prepared:
– in accordance with the principles and requirements of International Financial Reporting Standards as adopted by the European Union (EU IFRS) rather than the Australian Accounting Standards (AAS) (except for one limited instance in the case of any concise report), and in accordance with UK financial reporting obligations generally;
– on the basis that the transitional provisions of International Financial Reporting Standard 1, First-time Adoption of International Financial Reporting Standards, should be applied using the combined financial statements previously prepared for Rio Tinto Limited, Rio Tinto plc and their respective controlled entities under Generally Accepted Accounting Principles in the United Kingdom, under which the DLC Merger between Rio Tinto Limited and Rio Tinto plc was accounted for using “merger”, rather than “acquisition”, accounting (reflecting that neither Rio Tinto Limited nor Rio Tinto plc was acquired by, or is controlled by, the other; and meaning that the existing carrying amounts, rather than fair values, of assets and liabilities at the time of the DLC Merger were used to measure those assets and liabilities at formation);
– on the basis that Rio Tinto Limited and Rio Tinto plc are a single company (with their respective shareholders being the shareholders in that single company); and
– with a reconciliation, from EU IFRS to AAS, of the following amounts: consolidated loss/profit for the financial year, total consolidated comprehensive loss/income for the financial year and total consolidated equity at the end of the financial year (see page 205).
Those consolidated financial statements must also be audited in relation to their compliance with relevant Australian and UK requirements. Rio Tinto Limited must also prepare a Directors’ Report which satisfies the content requirements of the Corporations Act (applied on the basis that for these purposes the consolidated entity is the Group, and the consolidated financial statements cover the Group). This includes a Remuneration Report (see pages 140-185) prepared in accordance with the requirements of the Corporations Act.
Rio Tinto Limited is also required to comply generally with the lodgement and distribution requirements of the Corporations Act (including timing requirements) in relation to those consolidated financial statements (including any concise financial statements), the Auditors’ report and the Directors’ Report. The Corporations Act also requires that a non-binding resolution to adopt the Remuneration Report be voted on by shareholders at Rio Tinto Limited’s annual general meeting.
Rio Tinto Limited is not required to prepare separate consolidated financial statements solely for it and its controlled entities. Rio Tinto Limited is also not required to prepare and lodge parent entity financial statements for itself in respect of each relevant financial year.
Rio Tinto Limited must, however, in accordance with the Corporations Act include in the consolidated financial statements for the Group, as a note, various parent entity information regarding Rio Tinto Limited (including in relation to assets, liabilities, shareholders’ equity, profit and loss, income, guarantees, contingent liabilities, and contractual commitments) prepared in accordance with AAS (see page 280).
Financial statements continued
Australian Corporations Act – Summary of ASIC Relief
310 Annual Report 2020 | riotinto.com310 Annual Report 2020 | riotinto.com
Financial Statements
Australian Corporations Act – summary of ASIC relief

The directors are responsible for preparing the Annual Report, the Remuneration Report and the financial statements in accordance with applicable law and regulations.
UK and Australian company law requires the directors to prepare financial statements for each financial year. Under UK law the directors have elected to prepare the Group financial statements in accordance with international accounting standards in conformity with the requirements of the Companies Act 2006 and International Financial Reporting Standards (IFRSs) as adopted pursuant to Regulation (EC) No 1606/2002 as it applies in the European Union (IFRSs as adopted by the EU), and the Rio Tinto plc financial statements in accordance with United Kingdom Generally Accepted Accounting Practice (United Kingdom Accounting Standards and applicable law), including FRS 101 “Reduced disclosure framework”.Under Australian law, the directors are also required to prepare certain Rio Tinto Limited parent company financial statements in accordance with Australian Accounting Standards (AAS). In preparing the Group financial statements, the directors have also elected to comply with IFRSs, issued by the International Accounting Standards Board (IASB).
Under UK and Australian company law the directors must not approve the financial statements unless they are satisfied that they give a true and fair view of the state of affairs of the Group and the companies as at the end of the financial year, and of the profit or loss of the companies and Group for the period (as applicable).
In preparing these financial statements, the directors are required to:
– select suitable accounting policies and apply them consistently;
– make judgments and estimates that are reasonable and prudent;
– state whether IFRSs as adopted by the EU, applicable UK Accounting Standards and AAS have been followed, subject to any material departures disclosed and explained in the Group and parent company financial statements respectively; and
– prepare the financial statements on the going concern basis unless it is inappropriate to presume that the Group and the companies will continue in business.
The directors are responsible for keeping adequate accounting records that are sufficient to show and explain the transactions of the companies and the Group and disclose with reasonable accuracy at any time the financial position of the companies and the Group and enable them to ensure that:
– the Group financial statements comply with the UK Companies Act 2006, the Australian Corporations Act 2001 as amended by the Australian Securities and Investments Commission Order dated 24 July 2020 and Article 4 of the IAS Regulation;
– the Rio Tinto plc financial statements comply with the UK Companies Act 2006;
– the Rio Tinto Limited parent company disclosures comply with the Corporations Act as amended by the Australian Securities and Investments Commission Order dated 24 July 2020; and
– the Remuneration Report complies with the UK Companies Act 2006 and the Australian Corporations Act 2001 as amended by the Australian Securities and Investments Commission Order dated 24 July 2020 .
The directors are also responsible for safeguarding the assets of the companies and the Group and hence for taking reasonable steps for the prevention and detection of fraud and other irregularities.
The directors are responsible for the maintenance and integrity of the Group’s website. Legislation governing the preparation and dissemination of financial statements may differ between jurisdictions in which the Group reports.
Each of the current directors, whose names and function are listed on pages 116-117 in the Governance section, confirm that, to the best of their knowledge:
– the Rio Tinto Group financial statements and notes, which have been prepared in accordance with international accounting standards in conformity with the requirements of the Companies Act 2006, IFRS as adopted by the EU, the Australian Corporations Act 2001 as amended by the Australian Securities and Investments Commission Order dated 24 July 2020, the UK Companies Act 2006 and Article 4 of the IAS Regulation, give a true and fair view of the assets, liabilities, financial position and profit of the Group;
– the Rio Tinto plc financial statements and notes, which have been prepared in accordance with United Kingdom Generally Accepted Accounting Practice, give a true and fair view of the assets, liabilities, financial position and profit of the company;
– the Rio Tinto Limited parent company disclosures, which have been prepared in accordance with the AAS and Australian Corporations Act 2001 as amended by the Australian Securities and Investments Commission Order dated 24 July 2020, give a true and fair view of the assets, liabilities, financial position and profit of the company;
– the Strategic Report section of the Annual Report includes a fair review of the development and performance of the business and the position of the Group, together with a description of the principal risks and uncertainties that it faces; and
– there are reasonable grounds to believe that each of the Rio Tinto Group, Rio Tinto plc and Rio Tinto Limited will be able to pay its debts as and when they become due and payable.
The directors have been given the declarations by the Chief Executive and Chief Financial Officer required by section 295A of the Australian Corporations Act 2001 as amended by the Australian Securities and Investments Commission Order dated 24 July 2020.
Disclosure of information to auditorsThe directors in office at the date of this report have each confirmed that:
– so far as they are aware, there is no relevant audit information of which the Group’s auditors are unaware; and
– they have taken all the steps that they ought to have taken as a director to make themselves aware of any relevant audit information and to establish that the Group’s auditors are aware of that information.
This declaration is made in accordance with a resolution of the Board.
Simon Thompson
ChairmanJakob Stausholm
Chief Executive
Financial statements
Directors’ DeclarationDirectors' statement of responsibilities in relation to the Group financial statements,Rio Tinto plc financial statements and Rio Tinto Limited financial statements
Annual Report 2020 | riotinto.com 311311Annual Report 2020 | riotinto.com
Financial Statements
Financial Statements
Directors’ declarationDirectors’ statement of responsibilities in relation to the Group financial statements, Rio Tinto plc financial statements and Rio Tinto Limited financial statements

Independent auditors’ reports of KPMG LLP to the members of Rio Tinto plc
and of KPMG to the members of Rio Tinto Limited
1. OUR OPINIONS ARE UNMODIFIED In KPMG UK’s opinion:
the financial statements give a true and fair view of the state of the Group’s and of the UK Parent Company’s, Rio Tinto plc, affairs as at 31 December 2020, and of the Group’s profit for the year then ended;
the Group financial statements have been properly prepared in accordance with international accounting standards in conformity with the requirements of the Companies Act 2006, and International Financial Reporting Standards (IFRSs) adopted pursuant to Regulation (EC) No. 1606/2002 as it applies in the European Union (“IFRSs as adopted by the EU”);
the Group financial statements have been properly prepared in accordance with IFRSs as issued by the International Accounting Standards Board (IASB). As explained in note 1 to the financial statements, the Group, in addition to complying with its legal obligation to apply international accounting standards in conformity with the requirements of the Companies Act, the Group has also applied IFRSs as issued by the IASB;
the Rio Tinto plc financial statements have been properly prepared in accordance with UK accounting standards, including FRS101 Reduced Disclosure Framework; and
the financial statements have been prepared in accordance with the requirements of the Companies Act 2006 and, as regards to the Group financial statements, Article 4 of the IAS Regulation to the extent applicable.
In KPMG Australia’s opinion:
the consolidated financial statements are in accordance with the Australian Corporations Act 2001, as amended by the Australian Securities and Investments Commission Order dated 24 July 2020 (the “ASIC Order”) including:
- giving a true and fair view of the Group’s financial position as at 31 December 2020 and of its financial performance for the year then ended; and
- comply with IFRSs as adopted by the EU and the Australian Corporations Regulations 2001
For the purpose of these reports, the terms ‘we’ and ‘our’ denote KPMG UK (KPMG LLP) in relation to UK responsibilities and reporting obligations to the members of Rio Tinto plc, and KPMG Australia (KPMG) in relation to Australian responsibilities and reporting obligations to the members of Rio Tinto Limited. Rio Tinto (‘the Group’) consists of Rio Tinto plc, Rio Tinto Limited and the entities they controlled, including the Group’s share of joint arrangements and associates, during the financial year ended 31 December 2020.
What our opinions cover
We have audited the Group financial statements for the year ended 31 December 2020 (FY20) included in the Annual Report and Accounts, which comprise:
Rio Tinto Group
Group Balance Sheet
Group Income Statement
Group Statement of Comprehensive Income
Group Statement of Changes in Equity
Group Statement of Cash Flows
Notes (a) to the Group Financial Statements, including the summary of significant accounting policies, the outline of dual listed companies structure and basis of financial statements; and the Rio Tinto financial information by business unit
KPMG UK has audited the Rio Tinto plc company financial statements for the year ended 31 December 2020, which comprise the parent company balance sheet; the parent company statement of changes in equity; and related notes, which include a description of the significant accounting policies and other explanatory information.
KPMG Australia has considered the Directors’ declaration to be part of the Group financial statements when forming its opinion under the requirements of the Corporations Act 2001, as amended by the ASIC Order. Included within the Group financial statements KPMG Australia has audited is the Reconciliation with Australian Accounting Standards. KPMG Australia has also audited the Remuneration Report included in the Directors’ report for the year ended 31 December 2020.
Basis for opinions
We conducted our audits in accordance with International Standards on Auditing (UK) (“ISAs (UK)”), Australian Auditing Standards (“ASAs”) and applicable laws. Our responsibilities under those standards are further described in the Auditor’s responsibilities for the audit of the Financial Statements section of our report. We believe that the audit evidence we have obtained is a sufficient and appropriate basis for our opinions.
(a) KPMG UK has audited notes 1 – 42 and notes 44 – 45. KPMG Australia has audited notes 1 – 45.
312 Annual Report 2020 | riotinto.com
Financial Statements

Independent auditors’ reports of KPMG LLP to the members of Rio Tinto plc
and of KPMG to the members of Rio Tinto Limited
2. OVERVIEW OF OUR AUDITS
Key audit matters
Item
Evaluation of indicators of impairment or impairment reversal of intangible assets and property plant and equipment in specific cash generating units
3.1
Evaluation of provisions for close-down, restoration and environmental obligations 3.2
Evaluation of provisions for uncertain tax positions 3.3
Recoverability of Rio Tinto Plc’s investments in its subsidiaries 3.4
Audit Committee interaction
During the year, the Audit Committee (AC) met six times. KPMG is invited to attend all Audit Committee meetings and is invited to meet with the AC in private sessions without Executive Directors being present. For each Key Audit Matter, we have set out communications with the Audit Committee in Section 3, including matters that required particular judgment.
The matters included in the Audit Committee Chair’s report on page 133 are consistent with our observations of those meetings. Our audit opinions and matters included in this report are consistent with those discussed and included in our reports to the Rio Tinto Audit Committee.
Our Independence We have fulfilled our ethical responsibilities under, and we remain independent of the Group in accordance with, UK ethical requirements including the FRC Ethical Standard as applied to listed public interest entities; the Australian Corporations Act 2001 as amended by the ASIC Order; and the relevant ethical requirements of the Australian Accounting Professional and Ethical Standards Board’s APES 110 Code of Ethics for Professional Accountants (including Independence Standards).
We have not provided any services which are prohibited by the standards noted above to the Group during the year ended 31 December 2020 (FY20) or subsequently.
We were first appointed as auditor in May 2020 by the shareholders following votes at the Rio Tinto plc and Rio Tinto Limited annual general meetings, this being our first year of engagement.
Total audit fee $17.3m
Total non-audit fees $2.3m
Non-audit fee as a % of audit fee %
13.3%
Next financial period which requires a tender
31 December
2030
Tenure of Group signing and component partners
1 year
Materiality
(Section 6 below) The scope of our work is influenced by our view of materiality and our assessed risk of material misstatement.
We have determined overall materiality for the Group at $550m.
A key judgment in determining materiality (and performance materiality) was the appropriate benchmark to select, based on our perception of the needs of shareholders. We considered which benchmarks and Key Performance Indicators have the greatest bearing on shareholder decisions.
We determined that Profit Before Tax for continuing operations, is the key measure for performance of the Group. As such, we based our materiality on Profit Before Tax for continuing operations excluding certain identified items which could significantly distort results in any one particular year, of which $550m represents 3.3%.
Materiality levels used in our audit
Group Group Materiality
PCM Parent Company Materiality
GPM Group Performance Materiality
HCM Highest Component Materiality
LCM Lowest Component Materiality
RDT Reporting Differences Threshold
$550m
$340m$358m
$250m
$32m $25m
0
200
400
600
Grou
p
PCM
GPM
HCM
LCM
RDT
313Annual Report 2020 | riotinto.com
Financial Statements
Independent auditors’ reports

Independent auditors’ reports of KPMG LLP to the members of Rio Tinto plc
and of KPMG to the members of Rio Tinto Limited
Group scope
(section 7 below) Top-down, we performed our risk assessment and planning to determine the Group’s components that required involvement from component auditors around the world. We scoped:
2 components, the Pilbara and Oyu Tolgoi as individually financially significant components which were subject to fullscope audits by component auditors;
12 further components subject to full scope audits bycomponent auditors;
8 components subject to audit of account balances associatedto significant or elevated risks on either provision for close-down, restoration and environmental obligations or assetvaluations; and
15 further components subject to audit of account balances toensure sufficient audit coverage.
We also considered the extent to which Rio Tinto operates shared service centres for its transaction processing. In particular, across sales and purchase processes, transactions that originate in one country may be processed in Singapore and Delhi. As a result, we established teams in Singapore and Delhi. The extent of testing of controls in these locations is specific to the nature of transactions processed. We performed audit procedures centrally across the Group, set out in more detail in Section 7 below.
In addition, we performed Group level analysis on the remaining components to determine whether further risks of material misstatement exist in those components.
We consider the scope of our audits, as agreed with the Audit Committee, to be an appropriate basis for our audit opinions.
Coverage of Group financial statements
Full scope audit
Audit of account balance
Out of scope
The impact of climate change on our audit
In planning our audit, we considered the potential impacts of climate change on the Group’s business and its financial statements. Unlike other major resources companies, the Group does not mine or extract hydrocarbons such as coal, natural gas or oil but it does emit greenhouse gases directly from energy used in its mining operations, the processing of metals and minerals, and the transportation of its products. The Group’s products are used in energy and carbon intensive industries including steel or aluminium production. The Group has set out its targets under the Paris Agreement to reduce carbon intensity by 30% and absolute emissions by 15% by 2030, and to be net carbon neutral by 2050 for Scope 1 and Scope 2 emissions. Further information is provided in the Strategic Report on pages 79 to 85 and the Group’s Climate Change report.
Climate change initiatives and commitments impact the preparation of the Group’s financial statements in a variety of ways, all with inherent uncertainties. As explained in note 1 of the financial statements, the Group has considered certain commodity and carbon pricing scenarios in assessing the impact of climate change in preparing its financial statements. For the Group, other judgments and estimates are also expected to include the setting of useful economic lives for carbon intensive property and equipment (such as aluminium smelting or coal fired power plants), the valuation of assets or the determination of impairment charges taking into account future pricing assumptions and estimates of mine life and closure and rehabilitation costs. Climate change also impacts the long-term viability of aspects of the mining industry especially given greenhouse gas intensity in the use of certain of the industry’s products (measured under Scope 3 emissions).
However, whilst the Group has set targets to be carbon neutral by 2050, the consequences, in terms of investment, its cost base and impact on cash flows are still being assessed as the Group considers how it will work towards meeting these targets. To the extent there are known implications these have been reflected in the financial statements in accordance with IFRS requirements and have been considered in our audit as set out in our key audit matters. It is therefore likely that the future carrying amounts of assets or liabilities will change for these other judgments and estimates as the Group responds to its climate change targets.
Our Key Audit Matters explain how we have assessed the Group’s climate related assumptions and relevant disclosures in arriving at our audit conclusions. This includes the use of our own climate change and sustainability specialists. We have also read the Group’s disclosure of climate related information in the front half of the annual report and compared this to our knowledge gained from our financial statement audit work.
The Group’s disclosures in the financial statements of the potential impacts of climate change and the assumptions used in setting key estimates and judgments has increased significantly this year. We have discussed with the Group ways in which climate change disclosures should continue to evolve as the Group continues to evaluate pathways to being net carbon neutral.
59%27%
14%
Profitbefore
Tax
57%
32%
11%
TotalAssets
68%
23%
9%
Revenue
314 Annual Report 2020 | riotinto.com
Financial Statements

Independent auditors’ reports of KPMG LLP to the members of Rio Tinto plc
and of KPMG to the members of Rio Tinto Limited
3. KEY AUDIT MATTERS
What we mean
Key audit matters are those matters that, in our professional judgment, were of most significance in the audit of the financial statements and include the most significant assessed risks of material misstatement (whether or not due to fraud) identified by us, including those which had the greatest effect on:
the overall audit strategy;
the allocation of resources in the audit; and
directing the efforts of the engagement team.
We include below the key audit matters in decreasing order of audit significance, together with our principal audit procedures to address those matters and, as required for EU public interest entities, our results from those procedures. These matters were addressed in the context of, and our results are based on, procedures undertaken for the purpose of our audit of the financial statements as a whole and in forming our opinions thereon. We do not provide a separate opinion on these matters.
3.1 Evaluation of indicators of impairment or impairment reversal of intangible assets and property plant and equipment in specific cash generating units
Financial Statement Elements Our results
Cash Generating Units FY20: Acceptable
Oyu Tolgoi copper-gold mine Yarwun alumina refinery
Kitimat aluminium smelter
Description of the Key Audit Matter Our response to the risk
The recoverable amounts of the Group’s assets are affected by forward-looking assumptions and estimation uncertainties. Specific to this year, these include the effects of macroeconomic disruption caused by the COVID-19 pandemic which has impacted pricing of some of the Group’s products, and, longer term, the impacts of climate change which affect forward looking assumptions such as commodity pricing.
Assessment of impairment indicators
The Group’s determination of whether an indicator of impairment or impairment reversal exists is judgmental and includes consideration of external factors such as changes in commodity prices as well as internal factors such as changes to estimated future operating or capital costs.
The Oyu Tolgoi copper-gold mine, Yarwun alumina refinery and Kitimat aluminium smelter cash generating units (CGUs), have previously been impaired. We assessed these CGUs as most at risk of additional impairment or impairment reversal and as the subject of this key audit matter. For Oyu Tolgoi this included an assessment of the finalisation of the Definitive Estimate in December 2020. The Group did not identify indicators of impairment or impairment reversal in respect of these CGUs.
Our procedures to address the risk included:
Control operation
Testing the effectiveness of the Group’s internal controls over assessment of impairment indicators.
Tests of detail
In respect of the CGUs noted, we challenged the Group’s assessment of potential indicators of impairment or impairment reversal, through;
comparing operational and financial performance in the period to approved budgets;
assessing changes in external market conditions that could impact operating costs; and
comparing forecast commodity prices used in the Group’s assessment to market consensus forecasts.
In addition to the above, our work in relation to the Oyu Tolgoi CGU included:
understanding the impact of the Definitive Estimate on mine plan assumptions, including remaining capital expenditure costs and date of first production, to assess if the Definitive Estimate represented an indicator of impairment or impairment reversal; and
understanding the status of discussions, with the Government of Mongolia, to assess the basis for management’s conclusion that this is not an impairment indicator.
315Annual Report 2020 | riotinto.com
Financial Statements
Independent auditors’ reports

Independent auditors’ reports of KPMG LLP to the members of Rio Tinto plc
and of KPMG to the members of Rio Tinto Limited
Description of the Key Audit Matter Our response to the risk
The net impairment charge recorded in FY20 of $1,115 million relates largely to now fully impaired assets. As part of our risk assessment we satisfied ourselves that events or conditions had caused these assets to have negligible value and therefore limited estimation uncertainty.
>> Refer to notes 1(i) and 6, and the Audit Committee’s views set out on page 133.
Impact of climate change
We used our sustainability specialists to assist in understanding the Group’s approach to incorporating the impacts of climate change into its pricing process. We used this information to challenge how the Group’s analysis of indicators of impairment took factors such as the impact of climate change on commodity pricing into account.
Assessing disclosures
We assessed the appropriateness of the related disclosures in notes 1 and 6 of the financial statements against the accounting requirements.
Communications with Rio Tinto’s Audit Committee
We discussed with and reported to the Audit Committee:
How the outcome of the Definitive Estimate for Oyu Tolgoi compared to the scenarios considered as part of the 2019 impairment test.
How the current status of discussions with the Government of Mongolia compare to the risks anticipated at the time of the 2019 impairment test.
How the Group considered the impacts of climate change within its assessment of potential indicators of impairment or impairment reversal, and, as explained in note 1 to the financial statements, that the financial statements do not yet reflect the financial reporting consequences of how the Group will meet its target to be carbon net neutral by 2050.
Based on the risk identified and our procedures performed, we found the Group’s conclusion that there are no indicators of impairment or impairment reversal in respect of the Oyu Tolgoi copper-gold mine, Yarwun alumina refinery and Kitimat aluminium smelter cash generating units (CGUs) and related disclosures to be acceptable.
3.2 Evaluation of provisions for close-down, restoration and environmental obligations
Financial Statement Elements Our results
Closure Provision carrying value
$13,335m at 31 December 2020
FY20: Acceptable
Description of the Key Audit Matter Our response to the risk
The Group incurs legal and constructive obligations for close-down and restoration activities which include the dismantling and demolition of infrastructure, the removal of residual materials and the remediation of disturbed areas for mines and certain refineries and smelters. Generally, there is relatively limited activity within the Group or broader industry of completing large scale restoration and rehabilitation projects, and elements of restoration and rehabilitation of each site are relatively unique to the site. As such, there are limited comparable historical precedents against which to benchmark estimates of future costs, which increases estimation uncertainty.
A significant proportion of the Group’s assets have long remaining lives, which also increases the estimation uncertainty relating to the rehabilitation activities required, including considering the impact of future environmental requirements and climate change, and the timing and amount of the associated future cash flows. Because of this, the effect of the time value of money is material.
Our procedures to address the risk included:
Control operation
Testing internal controls over the Group’s process to estimate provisions for close-down, restoration and environmental obligations, including controls over the Groups selection of the assumptions, data, methods and models to be used. This included controls over the determination of key inputs such as future rehabilitation costs, the timing of these costs, the life of the operation or site, the discount rate and the preparation of the underlying closure plan scenarios.
Tests of detail
For Pilbara, Kennecott and Gove refinery closure provisions as at 31 December 2020, we performed the following procedures:
we performed a retrospective review of the key cost assumptions to evaluate the accuracy of the Group’s forecasting;
we examined the most recent closure studies and other technical material prepared by the Group relating to changes in the closure provision to assess the nature and scope of work undertaken. We compared estimated closure costs included in the studies with those used in the calculation of the provision;
for operations that the Group determined did not require a change in key assumptions during the year, we considered the consistency of the Group’s conclusion with our understanding of the obligations associated with that operation and its closure remediation plan;
316 Annual Report 2020 | riotinto.com
Financial Statements

Independent auditors’ reports of KPMG LLP to the members of Rio Tinto plc
and of KPMG to the members of Rio Tinto Limited
Description of the Key Audit Matter Our response to the risk
Close-down, restoration and environmental remediation activities are governed by a combination of legislative requirements, the Group’s policies, and commitments made to stakeholders. These vary across location, product and operation.
The Group has disclosed that the determination of when an estimate associated with close-down, restoration and environmental obligations is sufficiently reliable to update is an area of judgment that may have a significant effect on the amounts recognised in the financial statements.
The evaluation of provisions for close-down, restoration and environmental obligations is a key audit matter due to the amount of the provision and the judgment and specialised skills involved in auditing the key inputs used by the Group to determine the provision including:
the nature and timing of future close-down and restoration activities including post-closure monitoring and associated costs;
the life of the operation and timing of commencement of rehabilitation activities;
the interpretation of legislative requirements; and
the discount rate.
In 2020 the Group reduced the discount rate used to value future closure obligations which resulted in an increase to the close-down, restoration and environmental provisions of $954 million.
We focussed on the locations most material and sensitive to changes in key inputs being:
Rio Tinto Iron Ore (Pilbara) Rio Tinto Kennecott Gove refinery
>> Refer to notes 1(l) and 25, and the Audit Committee’s views set out on page 133.
we assessed the sensitivity of closure provision calculations to changes in key assumptions, and considered the reasonableness of the assumptions with the greatest impact on the assessment for each site by comparing them to independent sources of data or considering the approach undertaken by the Group to determine them where external comparable data was not available; and
We assessed an immaterial audit misstatement identified in the context of the overall balance and the financial statements as a whole.
Our closure and valuation expertise
For Pilbara and the Gove refinery we used our closure specialists to assist us in assessing:
the scope, competency and objectivity of the Group’s experts, both internal and external to the Group, who produce the cost estimates;
the reasonableness of key assumptions made by the Group for closure activities included in the closure scenarios by comparing them against our understanding of the legislative requirements, the Group’s closure commitments, industry practice and our understanding of the business;
the Group’s assumptions regarding the timing and costs of such activities based on their experience and familiarity with applicable regulations and the forecast life of the operation; and
the consistency of closure activities reflected in the Group’s models used to determine the provision with the relevant closure plan.
We used our valuations specialists to assist us in evaluating the discount rate applied by the Group to calculate the net present value of these provisions by evaluating it against external data including yields on long-term government bonds and external market research, using our specialist knowledge. .
Assessing disclosures
We assessed the appropriateness of the related disclosures in notes 1 and 25 of the financial statements against the accounting requirements.
Communications with Rio Tinto’s Audit Committee
We discussed with and reported to the Audit Committee:
Our support for additional disclosures provided by management in addition to those in FY19, given the size of the company’s closure obligations and the degree of estimation uncertainty and judgment in applying the relevant accounting principles to such long-lived commitments.
Areas of particular auditor judgment
Having found the discount rate (1.5%) to be toward the upper end of the range we considered to be acceptable, we exercised judgment to determine the acceptability of the closure provision balance given the discount rate used, taking into account our assessment of the associated cash flows and the clarity of the associated disclosure of the sensitivity and impact of the closure provision to changes in the discount rate.
Based on the risk identified and our procedures performed, we consider that the level of provisions for close-down, restoration and environmental obligations and related disclosures to be acceptable.
317Annual Report 2020 | riotinto.com
Financial Statements
Independent auditors’ reports

Independent auditors’ reports of KPMG LLP to the members of Rio Tinto plc
and of KPMG to the members of Rio Tinto Limited
3.3 Evaluation of provisions for uncertain tax positions
Financial Statement Elements Our results
Provisions for uncertain tax positions FY20: Acceptable
Description of the Key Audit Matter Our response to the risk
The Group operates across multiple tax jurisdictions and is subject to periodic challenge by local tax authorities on a range of tax matters including transfer pricing, royalties, other resource and production-based taxes, and indirect taxes.
Where the amount of tax payable is uncertain, the Group establishes provisions based on judgment and estimates relating to tax law, settlement negotiations or changes in legislation. The Group maintain material provisions for uncertain tax positions.
We focused our work on a number of uncertain tax positions, including disputes with the Australian Taxation Office (ATO) and outstanding assessments received from the Mongolian Tax Authority.
As part of our risk assessment, we determined that these uncertain tax positions have a high degree of estimation uncertainty with a wide range of potential outcomes. The evaluation of these provisions for uncertain tax positions is a key audit matter due to the judgment, estimation uncertainty and specialised skills involved in auditing these provisions for uncertain tax positions.
>> Refer to notes 1(n) and 9, and the Audit Committee’s views set out on page 133.
Our procedures to address the risk included:
Control operation
We tested the effectiveness of certain internal controls over the Group’s assessment of uncertain tax positions, including controls relating to the interpretation of the relevant tax regulations in assessing transfer pricing positions.
Our taxation expertise
Our tax and transfer pricing specialists used their knowledge and experience of the application of legislation by the relevant tax authorities to assist us in challenging the Group’s assessment of uncertain tax positions. This included assessing:
the implications of results of historical tax audits, and outcomes from comparable situations for the positions taken by the Group;
correspondence with tax authorities;
transfer pricing documentation and methodology for compliance with tax law;
third party tax advice received by the Group; and
changes in tax legislation.
Assessing disclosures
We assessed the appropriateness of the Group’s tax disclosures in notes 1 and 9 of the financial statements against the accounting requirements.
Communications with Rio Tinto’s Audit Committee
We discussed with and reported to the Audit Committee:
How we considered specific external advice obtained by the Group in respect of these disputes when forming our conclusions regarding the appropriateness of provisioning.
How we considered the merits of the technical tax positions adopted by the Group, having regard to relevant tax legislation and case law, in determining the Group’s tax provisions.
The Group’s history of resolving disputes with tax authorities.
Based on the risk identified and our procedures performed, we consider that the level of tax provisioning and related disclosures to be acceptable.
318 Annual Report 2020 | riotinto.com
Financial Statements

Independent auditors’ reports of KPMG LLP to the members of Rio Tinto plc
and of KPMG to the members of Rio Tinto Limited
3.4 Recoverability of Rio Tinto plc’s investments in its subsidiaries (KPMG UK Only)
Financial Statement Elements Our results
Carrying value of Rio Tinto plc’s investments in its subsidiaries
FY20
$36,320m
FY20: Acceptable
Description of the Key Audit Matter Our response to the risk
In respect of KPMG UK’s audit of the parent company, Rio Tinto plc, the sole key audit matter relates to the recoverability of its investment in its subsidiaries of the group.
Their recoverability is not at a high risk of significant misstatement or subject to significant judgment. However, due to the value of these investments in the context of the parent company financial statements, this is the area that had the greatest effect overall on our parent company audit.
We performed the tests below rather than seeking to rely on any of the company’s controls because the nature of the balance is such that we would expect to obtain audit evidence primarily through the detailed procedures described.
Our procedures to address the risk included:
Tests of detail
Comparing the carrying amount of its investments with the relevant subsidiaries’ draft balance sheet to identify whether their net assets, being an approximation of their minimum recoverable amount, were in excess of their carrying amount and assessing whether those subsidiaries have historically been profit-making.
Communications with Rio Tinto’s Audit Committee
We reported to the Audit Committee that based on the risk identified and our procedures performed, we found the company’s conclusion that there is no impairment of its investments in subsidiaries to be acceptable.
319Annual Report 2020 | riotinto.com
Financial Statements
Independent auditors’ reports

Independent auditors’ reports of KPMG LLP to the members of Rio Tinto plc
and of KPMG to the members of Rio Tinto Limited
4. GOING CONCERN, VIABILITY AND PRINCIPAL RISKS AND UNCERTAINTIES (KPMG UK ONLY)
The Directors have prepared the financial statements on the going concern basis as they do not intend to liquidate the Company or the Group or to cease their operations, and they have concluded that the Company’s and the Group’s financial position means that this is realistic. They have also concluded that there are no material uncertainties that could have cast significant doubt over their ability to continue as a going concern for at least a year from the date of approval of the financial statements (“the going concern period”).
Going Concern
We used our knowledge of the Group, its industry, and the general economic environment to identify the inherent risks to its business model and analysed how those risks might affect the Group’s financial resources or ability to continue operations over the going concern period. The risks we consider as most relevant to the level of the Group’s financial resources over this period relate to levels of demand and commodity pricing.
We critically assessed the assumptions in the Directors’ downside scenarios relevant to liquidity and covenant metrics, in particular in relation to revenue growth by comparing to historical trends and assessing whether downside scenarios applied take into account reasonably possible downsides. The extent of our work was influenced by the level of liquidity.
We assessed the completeness of the going concern disclosure.
Our conclusions
We consider that the Directors’ use of the going concern basis of accounting in the preparation of the Group’s and Company’s financial statements is appropriate.
We have not identified, and concur with the Directors’ assessment that there is not, a material uncertainty related to events or conditions that, individually or collectively, may cast significant doubt on the Group’s or Company's ability to continue as a going concern for the going concern period.
We have nothing material to add or draw attention to in relation to the Directors’ statement in Note 1 to the financial statements on the use of the going concern basis of accounting with no material uncertainties that may cast significant doubt over the Group and Company’s use of that basis for the going concern period, and we found the going concern disclosure in Note 1 to be acceptable.
The related statement under the UK Listing Rules set out on page 190 is materially consistent with the financial statements and our audit knowledge.
However, as we cannot predict all future events or conditions and as subsequent events may result in outcomes that are inconsistent with judgments that were reasonable at the time they were made, the above conclusions are not a guarantee that the Group or the Company will continue in operation.
Disclosures of emerging and principal risks and longer-term viability
Our responsibility
We are required to perform procedures to identify whether there is a material inconsistency between the Directors’ disclosures in respect of emerging and principal risks and the viability statement, and the financial statements and our audit knowledge.
Our reporting
Based on the knowledge we acquired during our financial statement audit, we have nothing further to add or draw attention to in relation to:
the Directors’ confirmation within the viability statement that they have carried out a robust assessment of the emerging and principal risks facing the Group, including those that would threaten its business model, future performance, solvency and liquidity;
the Principal Risks and Uncertainties disclosures describing these risks and explaining how they are being managed and mitigated; and
the Directors’ explanation in the viability statement of how they have assessed the prospects of the Group, over what period they have done so and why they considered that period to be appropriate, and their statement as to whether they have a reasonable expectation that the Group will be able to continue in operation and meet its liabilities as they fall due over the period of their assessment, including any related disclosures drawing attention to any necessary qualifications or assumptions.
Under the UK Listing Rules we are also required to review the Viability Statement. Based on the above procedures, we have concluded that the above disclosures are materially consistent with the financial statements and our audit knowledge.
Our work is limited to assessing these matters in the context of only the knowledge acquired during our financial statement audit. As we cannot predict all future events or conditions and as subsequent events may result in outcomes that are inconsistent with judgments that were reasonable at the time they were made, the absence of anything to report on these statements is not a guarantee as to the Group’s and Company’s longer-term viability.
320 Annual Report 2020 | riotinto.com
Financial Statements

Independent auditors’ reports of KPMG LLP to the members of Rio Tinto plc
and of KPMG to the members of Rio Tinto Limited
5. KPMG UK’S REPORTING ON OUR ABILITY TO DETECT IRREGULARITIES, AND OUR RESPONSE
Fraud – Identifying and responding to risks of material misstatement due to fraud
Fraud risk assessment
To identify risks of material misstatement due to fraud (“fraud risks”) we assessed events or conditions that could indicate an incentive or pressure by management to commit, or provide an opportunity to commit, fraud. Our risk assessment procedures included:
Enquiries of management, internal audit and the Audit Committee, including obtaining and reviewing supporting documentation, concerning the Group’s policies and procedures relating to:
- detecting and responding to the risks of fraud; and
- internal controls established to mitigate risks related to fraud;
Enquiries of management, internal audit and the Audit Committee as to whether they had knowledge of any actual, suspected or alleged fraud;
Reading Board and Audit Committee minutes;
Considering remuneration incentive schemes and performance targets for management and Directors, including the flexed and unflexed underlying earnings and STIP free cash flow target ranges for executive remuneration; and
Discussions among the engagement team regarding how and where fraud might occur in the financial statements and any potential indicators of fraud. The engagement team includes audit partners and staff who have extensive experience of working with companies in the mining sector, and this experience was relevant to the discussion about where fraud risks may arise. The discussions also involved our own forensic specialists to assist us in identifying fraud risks based on discussions of the circumstances of the Group, who advised the engagement team of fraud schemes that had arisen in similar sectors and industries and participated in the initial fraud risk assessment discussions.
Risk communications
We communicated identified fraud risks throughout the audit team and remained alert to any indications of fraud throughout the audit. This included communication from the group to component audit teams of relevant fraud risks identified at the group level and requests to component audit teams to report to the group audit team any instances of fraud that could give rise to a material misstatement of the Group financial statements.
Fraud risks As required by auditing standards we addressed the risk of management override of controls and the risk of fraudulent revenue recognition. In particular we considered the risk that revenue is recorded in the wrong period and the risk that Group and component management may be in a position to make inappropriate accounting entries, and the risk of bias in accounting estimates and judgments
Procedures to address fraud risks
Our audit procedures included evaluating the design and implementation, and operating effectiveness of internal controls relevant to mitigate these risks.
We also performed substantive audit procedures including:
Comparing journal entries to supporting documentation for a selection based on risk including, for example, those posted by senior finance management, those posted to unusual accounts or those containing unusual journal descriptions;
Assessing significant accounting estimates for bias;
Obtaining third party confirmations for all material cash balances; and
Assessing when revenue was recognised, particularly focusing on revenue recognised in the days before and after the year end date, and whether it was recognised in the correct year.
Work on the fraud risks was performed by a combination of component auditors and the group audit team.
321Annual Report 2020 | riotinto.com
Financial Statements
Independent auditors’ reports

Independent auditors’ reports of KPMG LLP to the members of Rio Tinto plc
and of KPMG to the members of Rio Tinto Limited
Laws and regulations – Identifying and responding to risks of material misstatement due to non-compliance with laws and regulations
Risk assessment We identified areas of laws and regulations that could reasonably be expected to have a material effect on the financial statements. For this risk assessment, matters considered included the following:
our general commercial and mining sector experience;
through discussion with the Directors and other management (as required by auditing standards);
from inspection of the Group’s regulatory and legal correspondence; and
discussions with the Directors and other management about the policies and procedures regarding compliance with laws and regulations.
As the Group operates in a regulated environment, our assessment of risks of material misstatement also involved gaining an understanding of control environment including the Group’s higher-level procedures for complying with regulatory requirements. Our work included understanding the facts and circumstances associated with the destruction of rockshelters at Juukan Gorge and the Group’s assessment of its compliance with relevant laws and regulations in relation to this matter.
Risk communication Our communication of identified laws and regulations risks was made throughout our team and we remained alert to any indications of non-compliance throughout the audit. This included communication from the group to all component audit teams of relevant laws and regulations identified at group level, and a request for component auditors to report to the group team any instances of non-compliance with laws and regulations that could give rise to a material misstatement of the Group financial statements.
Direct laws context and link to audit
The potential effect of these laws and regulations on the financial statements varies considerably.
Firstly, the Group is subject to laws and regulations that directly affect the financial statements including:
financial reporting legislation (including related companies’ legislation)
distributable profits legislation
taxation legislation (direct and indirect)
pensions legislation
We assessed the extent of compliance with these laws and regulations as part of our procedures on the related financial statement items.
Most significant indirect law/ regulation areas
Secondly, the Group is subject to many other laws and regulations where the consequences of non-compliance could have a material effect on amounts or disclosures in the financial statements, for instance through the imposition of fines or litigation or harm to the Group’s license to operate.
We identified the following areas as those most likely to have such an effect:
anti-bribery fraud and corruption
health and safety legislation
employment and social security legislation
environmental protection legislation
competition legislation
Auditing standards limit the required audit procedures to identify non-compliance with these laws and regulations to enquiry of the Directors and other management and inspection of regulatory and legal correspondence, if any. Therefore, if a breach of law or regulations is not disclosed to us or evident from relevant correspondence, our audit will not detect that breach.
For the contingent liabilities disclosed in Note 30 we assessed disclosures against our understanding from legal confirmations received from external counsel. For the uncertain tax positions referred to in Note 1 we performed procedures as detailed in our key audit matter (page 318).
.
.
322 Annual Report 2020 | riotinto.com
Financial Statements

Independent auditors’ reports of KPMG LLP to the members of Rio Tinto plc
and of KPMG to the members of Rio Tinto Limited
Context of the ability of the audit to detect fraud or breaches of law or regulation
Owing to the inherent limitations of an audit, there is an unavoidable risk that we may not have detected some material misstatements in the financial statements, even though we have properly planned and performed our audit in accordance with auditing standards. For example, the further removed non-compliance with laws and regulations is from the events and transactions reflected in the financial statements, the less likely the inherently limited procedures required by auditing standards would identify it.
In addition, as with any audit, there remained a higher risk of non-detection of fraud, as these may involve collusion, forgery, intentional omissions, misrepresentations, or the override of internal controls. Our audit procedures are designed to detect material misstatement. We are not responsible for preventing non-compliance or fraud and cannot be expected to detect non-compliance with all laws and regulations.
6. OUR DETERMINATION OF MATERIALITY The scope of our audit was influenced by our application of materiality. We set quantitative thresholds and overlay qualitative considerations to help us determine the scope of our audit and the nature, timing and extent of our procedures, and in evaluating the effect of misstatements, both individually and in the aggregate, on the financial statements as a whole.
$550m Materiality for the financial statements as a whole
What we mean by materiality
This is the amount representing the total magnitude of misstatements that we expect to influence the economic decisions of the primary users of these financial statements.
Basis for determining materiality and judgments applied
Our assessment of overall group materiality was $550m. This was derived from the level of profit before tax for continuing operations, excluding items which are outside of the normal course of business.
Profit before tax excluding certain identified items, removes the effects of items which could significantly distort results in any one particular year. Furthermore, analyst forecasts predominately feature profit before tax, excluding identified items, as the basis for earnings. Analyst consensus data supports our judgment that profit before tax, excluding identified items, is a key indicator of performance from a reasonable investor perspective.
The identified items excluded in FY20 were:
net pre-tax impairments ($1,243m charge),
Materiality of $550m was determined by applying a percentage to the calculated adjusted profit before tax ($16,634 million). When using a profit-related measure to determine overall materiality, KPMG’s approach is to ordinarily apply a percentage between 3 – 5% to the pre-tax measure. In setting overall materiality, we applied a rate of 3.3%, which is at the low end of the allowable percentage range recognising that this was our first audit of the Group since appointment in May 2020.
Materiality for the parent company financial statements as a whole was set at $340 million, determined with reference to a benchmark of the parent company’s total assets of which it represents 0.8%.
$358m Performance materiality
What we mean
Our procedures on individual account balances and disclosures were performed to performance materiality, to reduce to an acceptable level the risk that individually immaterial misstatements in individual account balances might add up to a material amount across the financial statements as a whole.
Basis for determining performance materiality and judgments applied
We have considered performance materiality at a level of 65% of materiality for Rio Tinto Group’s financial statements as a whole, and for the Parent Company financial statements to be appropriate, having taken account of:
The level of audit differences (adjusted and unadjusted) identified during previous audits by PwC; and Our view of the strength and robustness of the control environment, including the tone at the top and culture of
Rio Tinto’s organisation as well as control deficiencies identified in previous audits.
Parent Company (Rio Tinto Plc) performance materiality is set at $221 million.
$25m Audit misstatement posting threshold
What we mean
This is the amount below which identified misstatements are clearly trivial from a quantitative point of view. We may become aware of misstatements below this threshold which could alter the nature, timing and extent of our audit procedures, for example if we identify smaller misstatements which are indicators of fraud.
This is also the amount above which all misstatements identified are communicated to Rio Tinto’s Audit Committee.
Basis for determining the audit misstatement reporting threshold and judgments applied
We set our audit misstatement posting at 5% of our materiality, rounded down to $25m. We will also report to the Audit Committee any items that warrant reporting on qualitative grounds.
323Annual Report 2020 | riotinto.com
Financial Statements
Independent auditors’ reports

Independent auditors’ reports of KPMG LLP to the members of Rio Tinto plc
and of KPMG to the members of Rio Tinto Limited
Group materiality of $550m compares to the main Financial Statement captions amounts as follows:
Total Revenue 2020
Total Assets 2020
Profit Before Taxation 2020
Financial Statement Caption $44,611m $97,390m $15,391m
Group Materiality as % of caption 1.2% 0.6% 3.6%
7. THE SCOPE OF OUR AUDIT
Group Scope What we mean
How the Group audit team determined the procedures to be performed across the Group by component audit teams.
Top-down, we performed our risk assessment and planning to determine the Group’s components that required involvement from component auditors around the world. We have scoped:
Two components, the Pilbara and Oyu Tolgoi as individually financially significant components which were subjected to full scope audits by component auditors;
Twelve further components subjected to full scope audits by component auditors;
Eight components subjected to audit of account balances associated with significant or elevated risks on either provision for close-down, restoration and environmental obligations or asset valuations; and
Fifteen futher components subjected to audit of account balances to ensure sufficient audit coverage.
Scope Number of components Range of materiality applied
Full scope audit 14 $32m – $250m
Audit of account balance 23 $32m – $125m
We have also performed audit procedures centrally across the Group, beyond the component scope set out above, in the following areas:
Testing of IT systems and configurations;
Consolidation of the financial information;
Journal entry analytics, to identify journal entries with higher risk such as those posted by Group management into component books, and manual entries into accounts where these are not expected (e.g. revenue);
Uncertain tax positions; and
Pensions.
In addition, we have performed group level analysis on the remaining components to determine whether further risks of material misstatement exist in those components.
Work on the key audit matters (detailed in section 3) was performed by a combination of component auditors and the group audit team.
Group audit team oversight
What we mean
The extent of the Group audit team’s involvement in component audits.
As part of determining the scope and preparing our audit plan and strategy, the Group audit team held a global planning conference in London to discuss key audit risks and obtain input from component teams.
The Group team instructed component auditors as to the significant areas to be covered, including the relevant risks detailed above and the information to be reported back. The Group team approved the component materialities, which ranged from $32m to $250m, having regard to the mix of size and risk profile of the components.
324 Annual Report 2020 | riotinto.com
Financial Statements

Independent auditors’ reports of KPMG LLP to the members of Rio Tinto plc
and of KPMG to the members of Rio Tinto Limited
2020 2019 (Planning)
Sites visited Pilbara
Oyu Tolgoi (Virtual)
Perth (Southern Hemisphere Hub)
Oyu Tolgoi (Mongolia)
Montreal (Northern Hemisphere Hub)
Perth (Southern Hemisphere Hub)
Delhi (Group Services)
Brisbane (Controls and IT)
Richards Bay Minerals (South Africa)
Singapore commercial centre
The Group audit team shadowed PwC during its 2019 audit and during this time visited 7 component sites as part of planning the 2020 audit. As a result of the coronavirus pandemic, site visits in 2020 were limited to the Pilbara, Perth and a virtual visit to Oyu Tolgoi. The Group team met with the local audit teams and with local Rio Tinto management to understand the performance of these business and the risks faced.
Aside from the site visits, frequent video conference calls were held throughout the audit with the component auditors. The Group audit team inspected the component team’s key work papers related to the significant risks and assessed the appropriateness of conclusions and the consistency between reported findings and work performed. At these meetings, the findings reported to the Group team were discussed in more detail, and any further work required by the Group team was then performed by the component auditor
8. KPMG AUSTRALIA’S AUDIT OF THE DIRECTORS’ REMUNERATION REPORT
Our responsibilities KPMG Australia is required to express an opinion on the Remuneration Report, included in pages 159 to 185 of the Annual Report, based on its audit conducted in accordance with Australian Auditing Standards.
Directors’ responsibilities
The Directors of Rio Tinto Limited are responsible for the preparation and presentation of the Remuneration Report in accordance with Section 300A of the Corporations Act 2001.
Opinion In our opinion, the Remuneration Report of Rio Tinto Limited for the year ended 31 December 2020 complies with Section 300A of the Australian Corporations Act 2001.
9. OTHER INFORMATION IN THE ANNUAL REPORT The Directors are responsible for the other information presented in the Annual Report together with the financial statements. Other Information is financial and non-financial information in Rio Tinto’s annual reporting which is provided in addition to the consolidated financial statements and the Auditor’s Report. Our opinion on the financial statements does not cover the other information and, accordingly, we do not express an audit opinion or, except as explicitly stated below, any form of assurance conclusion thereon.
All other information
Our responsibility
Our responsibility is to read the other information and, in doing so, consider whether, based on our financial statements audit work, the information is materially misstated or inconsistent with the financial statements or our audit knowledge and report such misstatements or inconsistencies.
Our results
Based solely on that work we have not identified material misstatements or inconsistencies in the other information.
325Annual Report 2020 | riotinto.com
Financial Statements
Independent auditors’ reports

Independent auditors’ reports of KPMG LLP to the members of Rio Tinto plc
and of KPMG to the members of Rio Tinto Limited
Strategic report and directors’ report (KPMG UK only)
Our responsibility
Based solely on our work on the other information described above we are required to report to you as follows:
Our reporting
we have not identified material misstatements in the strategic report and the Directors’ report; We have not identified material misstatements in the strategic report and the Directors’ report.
in our opinion the information given in those reports for FY20 is consistent with the financial statements; and
In our opinion the information given in those reports for the year is consistent with the financial statements.
in our opinion those reports have been prepared in accordance with the Companies Act 2006. In our opinion those reports have been prepared in accordance with the Companies Act 2006.
Directors’ Remuneration Report
Our responsibility
KPMG UK is required to form an opinion as to whether the part of the Directors’ Remuneration Report to be audited has been properly prepared in accordance with the Companies Act 2006.
Our reporting
In our opinion the part of the Directors’ Remuneration Report to be audited has been properly prepared in accordance with the Companies Act 2006.
Corporate governance disclosures (KPMG UK ONLY)
Our responsibility
We are required to perform procedures to identify whether there is a material inconsistency between the financial statements and our audit knowledge, and:
the Directors’ statement that they consider that the annual report and financial statements taken as a whole is fair, balanced and understandable, and provides the information necessary for shareholders to assess the Group’s position and performance, business model and strategy;
the section of the annual report describing the work of the Audit Committee, including the significant issues that the Audit Committee considered in relation to the financial statements, and how these issues were addressed; and
the section of the annual report that describes the review of the effectiveness of the Group’s risk management and internal control systems.
Our reporting
Based on those procedures, we have concluded that each of these disclosures is materially consistent with the financial statements and our audit knowledge.
We are also required to review the part of Corporate Governance Statement relating to the Group’s compliance with the provisions of the UK Corporate Governance Code specified by the Listing Rules for our review, and to report if a corporate governance statement has not been prepared by the company.
We have nothing to report in this regard.
326 Annual Report 2020 | riotinto.com
Financial Statements

Independent auditors’ reports of KPMG LLP to the members of Rio Tinto plc
and of KPMG to the members of Rio Tinto Limited
Other matters on which we are required to report by exception (KPMG UK ONLY)
Our responsibility
Under the Companies Act 2006, we are required to report to you if, in our opinion:
adequate accounting records have not been kept by the parent Company, or returns adequate for our audit have not been received from branches not visited by us; or
the parent Company financial statements and the part of the Directors’ Remuneration Report to be audited are not in agreement with the accounting records and returns; or
certain disclosures of Directors’ remuneration specified by law are not made; or
we have not received all the information and explanations we require for our audit.
Our reporting
We have nothing to report in these regards.
10. RESPECTIVE RESPONSIBILITIES
Directors’ responsibilities for the financial statements
As explained more fully in their statement set out on page 99, the Directors are responsible for: the preparation of the financial statements, including being satisfied that they give a true and fair view in accordance with the relevant financial reporting frameworks; implementing such internal control as they determine is necessary to enable the preparation of financial statements that give a true and fair view and are free from material misstatement, whether due to fraud or error; assessing the Group, Rio Tinto plc’s and Rio Tinto Limited’s ability to continue as a going concern and whether the use of the going concern basis of accounting is appropriate, disclosing, as applicable, matters related to going concern; and using the going concern basis of accounting unless they either intend to liquidate the Group, Rio Tinto plc and Rio Tinto Limited or to cease operations, or have no realistic alternative but to do so.
Auditors’ responsibilities for the audit of the financial statements
Our objectives are to obtain reasonable assurance about whether the financial statements as a whole are free from material misstatement, whether due to fraud or other irregularities, or error, and to issue our opinions in an auditor’s report. Reasonable assurance is a high level of assurance but does not guarantee that an audit conducted in accordance with ISAs (UK) and ASAs will always detect a material misstatement when it exists. Misstatements can arise from fraud, other irregularities or error and are considered material if, individually or in aggregate, they could reasonably be expected to influence the economic decisions of the primary users taken on the basis of the financial statements.
A fuller description of KPMG UK’s responsibilities is provided on the FRC’s website at www.frc.org.uk/auditorsresponsibilities. A further description of KPMG Australia’s responsibilities for the audit of the Financial Statements is located at the Auditing and Assurance Standards Board website at: https://www.auasb.gov.au/admin/file/content102/c3/ar1_2020.pdf. This description forms part of our Australian auditor’s report.
11. THE PURPOSE OF OUR AUDIT WORK AND TO WHOM WE OWE OUR RESPONSIBILITIES KPMG UK’s report is made solely to Rio Tinto Plc’s members, as a body, in accordance with Chapter 3 of Part 16 of the Companies Act 2006 and the terms of our engagement by the Company. KPMG Australia’s report is made solely to Rio Tinto Limited’s members, as a body, in accordance with the Australian Corporations Act 2001. Our audit work has been undertaken so that we might state to the members of each company those matters we are required to state to them in an auditor’s report, and the further matters we are required to state to them in accordance with the terms agreed with the company, and for no other purpose. Accordingly, each of KPMG UK and KPMG Australia makes the following statement: to the fullest extent permitted by law, we do not accept or assume responsibility to anyone other than the Company and the Company’s members, as a body, for our audit work, for this report, or for the opinions we have formed.
Stephen Oxley (Senior Statutory Auditor)
for and on behalf of KPMG LLP, Statutory Auditor Chartered Accountants
London, United Kingdom
22 February 2021
Trevor Hart
Partner KPMG
Perth, Australia
22 February 2021
327Annual Report 2020 | riotinto.com
Financial Statements
Independent auditors’ reports
To the Directors of Rio Tinto Limited
I declare that, to the best of my knowledge and belief, in relation to the audit of Rio Tinto Limited for the year ended 31 December 2020 there have been:
(a) no contraventions of the auditor independence requirements as set out in the Australian Corporations Act 2001 in relation to the audit; and
(b) no contraventions of any applicable code of professional conduct in relation to the audit.
This declaration is in respect of Rio Tinto Limited and the entities it controlled during the period.
KPMG
Trevor HartPartnerPerth22 February 2021
Liability limited by a scheme approved under Professional Standards Legislation
Financial statements continued
Lead Auditor's Independence Declaration under Section 307C of the Australian Corporations Act 2001
328 Annual Report 2020 | riotinto.com328 Annual Report 2020 | riotinto.com
Financial Statements
Lead Auditor’s Independence Declaration under Section 307C of the Australian Corporations Act 2001

The Group presents certain alternative performance measures ("APMs") which are reconciled to directly comparable IFRS financial measures below. These APMs are used by management to assess the performance of the business and provide additional information which investors may find useful. APMs are presented in order to give further insight into the underlying business performance of the Group's operations.
APMs are not consistently defined and calculated by all companies, including those in the Group’s industry. Accordingly, these measures used by the Group may not be comparable with similarly titled measures and disclosures made by other companies. Consequently, these APMs should not be regarded as a substitute for the IFRS measures and should be considered supplementary to those measures.
The following tables present the Group's key financial measures not defined according to IFRS and a reconciliation between those APMs and their nearest respective IFRS measure.
APMs derived from the income statementThe following income statement measures are used by the Group to provide greater understanding of the underlying business performance of its operations and to enhance comparability of reporting periods. They indicate the underlying commercial and operating performance of our assets including revenue generation, productivity and cost management.
Gross product sales Gross product sales includes the sales revenue of equity accounted units on a proportionately consolidated basis (after adjusting for sales to subsidiaries) in addition to consolidated sales. Consolidated sales revenue includes subsidiary sales to equity accounted units which are not included in gross product sales.
Gross product sales measures revenue on a basis that is comparable to our Underlying EBITDA metric.
2020US$m
2019 US$m
2018US$m
Consolidated sales revenue 44,611 43,165 40,522 Share of equity accounted unit sales and inter-subsidiary/equity accounted unit sales 2,407 2,202 2,313 Gross product sales(a) 47,018 45,367 42,835
(a) Gross product sales was previously referred to as Gross sales revenue in the 2019 Annual Report.
Underlying EBITDAUnderlying EBITDA represents earnings attributable to owners of Rio Tinto before tax, net finance items, depreciation and amortisation excluding the EBITDA impact of the same items that are excluded in arriving at underlying earnings (as defined on page 331).
2020US$m
2019 US$m
2018US$m
Profit after tax 10,400 6,972 13,925 Less (profits)/losses attributable to non-controlling interests (631) 1,038 (287) Profit after tax attributable to owners of Rio Tinto (net earnings) 9,769 8,010 13,638 Depreciation and amortisation in subsidiaries excluding capitalised depreciation 4,074 4,272 3,909 Depreciation and amortisation in equity accounted units 576 653 650 Finance items in subsidiaries 1,751 648 33 Taxation in subsidiaries 4,991 4,147 4,242 Taxation and finance items in equity accounted units 443 296 372 Add back profits/(losses) attributable to non-controlling interests 631 (1,038) 287 Impairment charges 1,272 3,487 132 (Gains)/losses on embedded commodity derivatives not qualifying for hedge accounting (including exchange) (6) 260 (279) Net losses/(gains) on consolidation and disposal of interests in businesses — 291 (4,622) Change in closure estimates (non-operating and fully impaired sites) 401 — 376 Gain on sale of wharf and land in Kitimat, Canada — — (602) Change in other exclusions — 171 — Underlying EBITDA 23,902 21,197 18,136
Alternative Performance Measures
Annual Report 2020 | riotinto.com 329
Alternative Performance Measures
329Annual Report 2020 | riotinto.com
Financial Statements
Alternative Performance Measures

Underlying EBITDA marginUnderlying EBITDA margin is defined as Group underlying EBITDA divided by gross product sales.
2020US$m
2019 US$m
2018 US$m
Underlying EBITDA 23,902 21,197 18,136Gross product sales 47,018 45,367 42,835Underlying EBITDA margin 51 % 47 % 42 %
Pilbara underlying FOB EBITDA marginThe Pilbara underlying free on board (FOB) EBITDA margin is defined as Pilbara underlying EBITDA divided by Pilbara revenues, excluding freight revenue.
2020US$m
2019 US$m
2018 US$m
PilbaraUnderlying EBITDA 18,896 15,936 11,267Pilbara gross product sales 27,027 23,681 18,359Freight revenue 1,487 1,671 1,688Gross product sales 25,540 22,010 16,671Pilbara underlying FOB EBITDA margin 74 % 72 % 68 %
Underlying EBITDA margin from Aluminium integrated operationsUnderlying EBITDA margin from integrated operations is defined as underlying EBITDA divided by gross product sales.
2020US$m
2019 US$m
2018 US$m
AluminiumUnderlying EBITDA - integrated operations 2,227 2,375 3,134Gross product sales - integrated operations 8,458 9,275 10,712Underlying EBITDA margin from integrated operations 26 % 26 % 29 %
Underlying EBITDA margin (product group operations)Underlying EBITDA margin (product group operations) is defined as underlying EBITDA divided by gross product sales.
2020US$m
2019 US$m
2018 US$m
Copper & DiamondsUnderlying EBITDA - product group operations 2,523 2,385 3,043Gross product sales - product group operations 5,362 5,800 6,468Underlying EBITDA margin - product group operations 47 % 41 % 47 %
2020US$m
2019 US$m
2018 US$m
Energy & MineralsUnderlying EBITDA - product group operations 1,756 1,870 2,204Gross product sales - product group operations 4,962 5,095 5,391Underlying EBITDA margin - product group operations 35 % 37 % 41 %
Alternative Performance Measures continued
330 Annual Report 2020 | riotinto.com330 Annual Report 2020 | riotinto.com
Alternative Performance Measures
Alternative Performance Measures

Underlying earningsUnderlying earnings represent net earnings attributable to the owners of Rio Tinto, adjusted to exclude items which do not reflect the underlying performance of the Group’s operations.
Exclusions from underlying earnings are those gains and losses, that individually, or in aggregate with similar items, are of a nature and size to require exclusion in order to provide additional insight into underlying business performance.
The following items are excluded from net earnings in arriving at underlying earnings in each period irrespective of the magnitude:
– Net gains/(losses) on disposal and consolidation of interests in businesses.
– Impairment charges and reversals.
– Profit/(loss) after tax from discontinued operations.
– Certain exchange and derivative gains and losses (as defined in note 2).
The reconciliation of underlying earnings to net earnings can be found in note 2.
Basic underlying earnings per shareBasic underlying earnings per share is calculated as underlying earnings divided by the weighted average number of shares outstanding during the year.
On a per share basis, this allows the comparability of underlying financial performance adjusted to exclude items which do not reflect the underlying performance of the Group's operations.
2020(cents)
2019 (cents)
Basic earnings per ordinary share 604.0 491.4Items excluded from underlying earnings per share 165.6 144.9Basic underlying earnings per ordinary share 769.6 636.3
Annual Report 2020 | riotinto.com 331331Annual Report 2020 | riotinto.com
Financial Statements
Alternative Performance Measures

APMs derived from cash flow statementCapital expenditureCapital expenditure comprises sustaining and development expenditure on property, plant and equipment, and on intangible assets. This is equivalent to "Purchases of property, plant and equipment and intangible assets" in the cash flow statement, hence, presented gross, before taking into account any cash received from disposals of property, plant and equipment and intangible assets.
This measure is used to support management's objective of effective and efficient capital allocation as we need to invest in existing assets in order to maintain and improve productive capacity, and in new assets to grow the business.
Free cash flowFree cash flow is defined as net cash generated from operating activities minus purchases of property, plant and equipment and intangibles and payments of lease principal, plus proceeds from the sale of property, plant and equipment and intangible assets.
This measures the net cash returned by the business after the expenditure of sustaining and development capital. This cash can be used for shareholder returns, reducing debt and other investing/financing activities.
2020US$m
2019 US$m
2018 US$m
Net cash generated from operating activities 15,875 14,912 11,821 Less: Purchase of property, plant and equipment and intangible assets (6,189) (5,488) (5,430) Less: Lease principal payments (324) (315) — Add: Sales of property, plant and equipment and intangible assets 45 49 586 Free cash flow 9,407 9,158 6,977
APMs derived from the balance sheetNet debtNet debt is total borrowings plus lease liabilities less cash and cash equivalents and other liquid investments, adjusted for derivatives related to net debt.
Net debt measures how we are managing our balance sheet and capital structure. Refer to Consolidated net debt note for the reconciliation on page 243.
Net gearing ratioNet gearing ratio is defined as net debt divided by the sum of net debt and total equity at the end of each period. It demonstrates the degree to which the Group's operations are funded by debt versus equity.
2020US$m
2019 US$m
Net debt 664 3,651
Net debt 664 3,651Total equity 51,903 45,242Net debt plus total equity 52,567 48,893Net gearing ratio 1% 7%
Operating assetsThe Group's operating assets comprise our share of net assets before deducting net debt.
This measure shows the net value of assets and liabilities used to generate profits.
2020US$m
2019 US$m
Equity attributable to owners of Rio Tinto 47,054 40,532Add: Net debt 664 3,651Operating assets 47,718 44,183
Alternative Performance Measures continued
332 Annual Report 2020 | riotinto.com332 Annual Report 2020 | riotinto.com
Alternative Performance Measures
Alternative Performance Measures
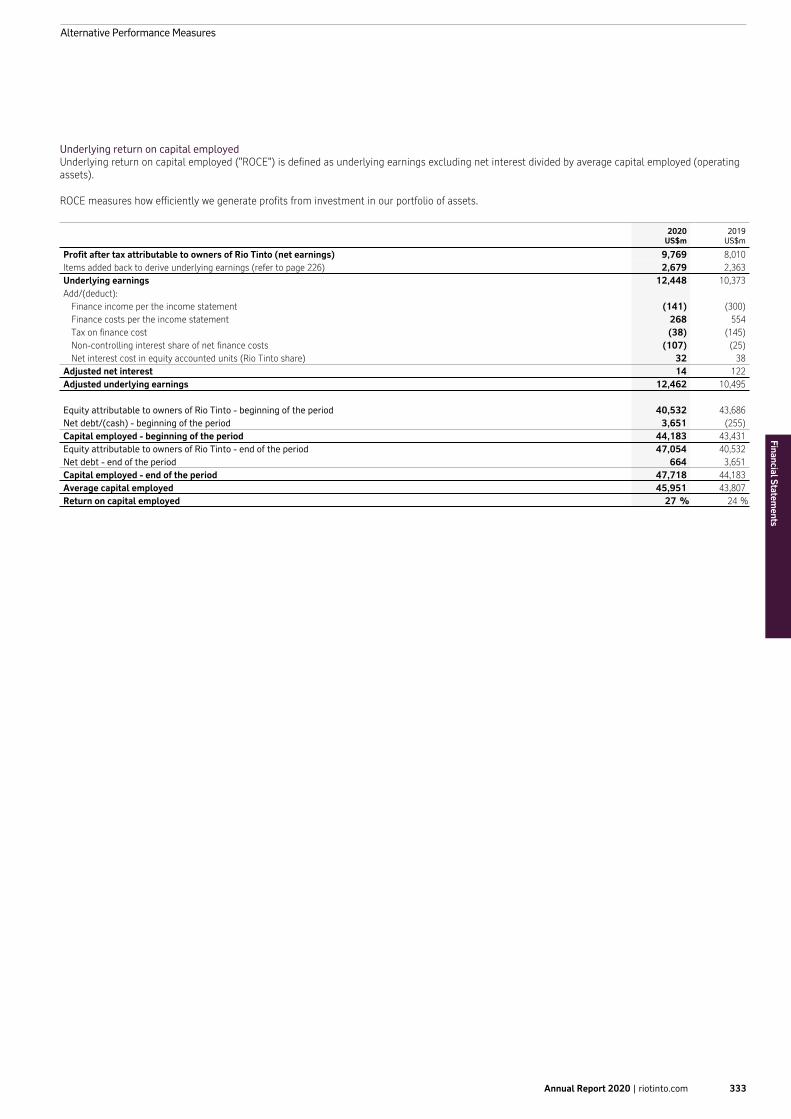
Underlying return on capital employedUnderlying return on capital employed ("ROCE") is defined as underlying earnings excluding net interest divided by average capital employed (operating assets).
ROCE measures how efficiently we generate profits from investment in our portfolio of assets.
2020US$m
2019 US$m
Profit after tax attributable to owners of Rio Tinto (net earnings) 9,769 8,010Items added back to derive underlying earnings (refer to page 226) 2,679 2,363Underlying earnings 12,448 10,373Add/(deduct):
Finance income per the income statement (141) (300)Finance costs per the income statement 268 554Tax on finance cost (38) (145)Non-controlling interest share of net finance costs (107) (25)Net interest cost in equity accounted units (Rio Tinto share) 32 38
Adjusted net interest 14 122Adjusted underlying earnings 12,462 10,495
Equity attributable to owners of Rio Tinto - beginning of the period 40,532 43,686Net debt/(cash) - beginning of the period 3,651 (255)Capital employed - beginning of the period 44,183 43,431Equity attributable to owners of Rio Tinto - end of the period 47,054 40,532Net debt - end of the period 664 3,651Capital employed - end of the period 47,718 44,183Average capital employed 45,951 43,807Return on capital employed 27 % 24 %
Annual Report 2020 | riotinto.com 333333Annual Report 2020 | riotinto.com
Financial Statements
Alternative Performance Measures

US$m 2011 2012 2013 2014 2015 2016 2017 2018 2019 2020
Gross product sales(a) 65,298 55,597 54,575 50,041 36,784 35,336 41,867 42,835 45,367 47,018 Share of equity accounted units' sales revenue and items excluded from underlying earnings (4,769) (4,655) (3,404) (2,377) (1,955) (1,555) (1,837) (2,313) (2,202) (2,407)
Consolidated sales revenue 60,529 50,942 51,171 47,664 34,829 33,781 40,030 40,522 43,165 44,611 Underlying profit before interest and tax (PBIT) 23,662 13,467 16,039 13,851 7,310 8,053 13,363 13,208 15,979 18,786 Finance costs(b) (759) (616) (794) (967) (1,076) (1,360) (1,090) (680) (638) (504) Exchange differences and derivatives(c) 2 695 (3,362) (2,021) (3,458) 622 (1,078) 923 (273) (1,247) Other exclusions from underlying earnings (9,633) (15,977) (8,378) (1,311) (3,502) (972) 1,621 4,716 (3,949) (1,644) Profit/(loss) before tax (PBT) 13,272 (2,431) 3,505 9,552 (726) 6,343 12,816 18,167 11,119 15,391 Tax on exclusions 135 2,896 2,642 423 567 (155) (596) (801) 391 204 Tax on underlying PBT (6,607) (3,485) (5,068) (3,476) (1,560) (1,412) (3,369) (3,441) (4,538) (5,195) Loss after tax from discontinued operations (10) (7) — — — — — — — — Attributable to non-controlling interests (955) (1) 2,586 28 853 (159) (89) (287) 1,038 (631) Net earnings/(loss)(d) 5,835 (3,028) 3,665 6,527 (866) 4,617 8,762 13,638 8,010 9,769 Underlying EBITDA 28,640 19,245 21,509 19,665 12,621 13,510 18,580 18,136 21,197 23,902 Underlying earnings 15,572 9,269 10,217 9,305 4,540 5,100 8,627 8,808 10,373 12,448 Earnings/(loss) per share (basic) – continuing operations 303.9c (163.4)c 198.4c 353.1c (47.5)c 256.9c 490.4c 793.2c 491.4c 604.0c
Underlying earnings per share (basic) – continuing operations 809.7c 501.3c 553.1c 503.4c 248.8c 283.8c 482.8c 512.3c 636.3c 769.6c
Dividends per share: declared for year(e)
Rio Tinto shareholders (US cents) 145.00c 167.00c 192.00c 215.00c 215.00c 170.00c 290.00c 307.00c 231.00c 309.00cRio Tinto plc (pence) 90.47p 106.77p 120.10p 134.88p 143.13p 134.36p 212.56p 232.78p 177.47p 221.86pRio Tinto Limited (Aus. cents) 134.01c 160.18c 213.14c 256.07c 296.80c 222.75c 366.25c 421.73c 349.74c 397.48cNet assetsFixed assets(f) 91,529 90,580 81,554 80,669 70,226 68,104 70,735 64,351 64,902 70,347 Other assets less liabilities 1,632 8,478 8,224 4,596 4,037 4,128 2,495 2,498 2,314 3,124 Provisions (including deferred tax liabilities) (25,935) (22,126) (18,221) (18,176) (16,352) (16,915) (18,270) (17,281) (18,323) (20,904) Net (debt)/cash (8,342) (19,192) (18,055) (12,495) (13,783) (9,587) (3,845) 255 (3,651) (664) Non-controlling interests (6,685) (11,187) (7,616) (8,309) (6,779) (6,440) (6,404) (6,137) (4,710) (4,849) Equity attributable to owners of Rio Tinto 52,199 46,553 45,886 46,285 37,349 39,290 44,711 43,686 40,532 47,054
Capital expenditure(g) (12,573) (17,615) (13,001) (8,162) (4,685) (3,012) (4,482) (5,430) (5,488) (6,189) Acquisitions (4,156) (1,335) 4 — (3) — — (5) — — Disposals 386 251 1,896 887 (38) 761 2,675 7,733 (80) 10 Net cash generated from operating activities(h) 20,235 9,430 15,078 14,286 9,383 8,465 13,884 11,821 14,912 15,875 Cash flows before financing activities(i) 3,245 (8,813) 4,132 7,783 4,783 6,361 11,511 13,142 9,411 9,319 RatiosOperating margin(j) 37% 25% 30% 28% 20% 23% 32% 31% 36% 39%Net (debt)/cash to total capital(k) -12% -25% -25% -19% -24% -17% -7% 1% 7% 1%Underlying earnings: owners' equity(l) 28% 19% 22% 20% 11% 13% 21% 20% 25% 28%Interest cover(m) 27 13 13 13 7 7 14 22 28 39
(a) Gross product sales includes 100% of subsidiaries’ sales revenue and the Group’s share of the sales revenue of equity accounted units (after adjusting for sales to subsidiaries).(b) Finance costs include net interest and amortisation of discount. From 1 January 2019, it also included the impact of adopting IFRS 16 “Leases”.(c) Under IFRS, as defined in note 1, certain gains and losses on currency exchange and on revaluation of derivatives are included in the Group’s net earnings/(loss). These items are excluded from
underlying earnings.(d) Underlying earnings is an additional measure of earnings, which is reported by Rio Tinto with its IFRS (as defined in note 1) results to provide greater understanding of the underlying business
performance of its operations. It is defined in note 2 to the financial statements. Underlying profit before interest and tax (PBIT) is similar to underlying earnings except that it is stated before interest and tax.
(e) Dividends per share are the amounts declared in respect of each financial year. These usually include an interim dividend paid in the year, and a final dividend paid after the end of the year. The special dividend of 93 US cents per share paid out based on the 2020 results is not included above.
(f) Fixed assets include: property, plant and equipment, intangible assets, goodwill, and investments in, and long-term loans to, equity accounted units. From 1 January 2019, it also included the impact of adopting IFRS 16 “Leases”.
(g) Capital expenditure is presented gross, before taking into account any disposals of property, plant and equipment or intangible assets.(h) Net cash generated from operating activities represents the cash generated by the Group’s consolidated operations, after payment of interest, taxes, and dividends to non-controlling interests in
subsidiaries.(i) Cash flow before financing activities is stated before deducting dividends payable to owners of Rio Tinto.(j) Operating margin is the percentage of underlying PBIT, after excluding tax on equity accounted units, to gross product sales.(k) Total capital comprises equity attributable to owners of Rio Tinto plus net debt and non-controlling interests.(l) Underlying earnings: owners’ equity represents underlying earnings expressed as a percentage of the mean of opening and closing equity attributable to owners of Rio Tinto.(m) Interest cover represents the number of times interest payable less receivable (excluding the amortisation of discount but including capitalised interest) is covered by underlying operating profit, less
amortisation of discount, plus dividends from equity accounted units. Underlying operating profit is similar to underlying earnings but is stated before tax, interest and share of profit after tax of equity accounted units.
Financial Summary 2011-2020
334 Annual Report 2020 | riotinto.com334 Annual Report 2020 | riotinto.com
Financial Statements
Financial Summary 2011-2020

2020A$m
2019A$m
2020£m
2019£m
2020 US$m
2019US$m
68,061 64,810 36,624 35,443 Gross product sales 47,018 45,367 64,577 61,664 34,749 33,723 Consolidated sales revenue 44,611 43,165 22,279 15,884 11,989 8,687 Profit before tax from continuing operations 15,391 11,119 15,055 9,960 8,101 5,447 Profit for the year from continuing operations 10,400 6,972 14,141 11,443 7,609 6,258 Net earnings attributable to Rio Tinto shareholders 9,769 8,010 34,599 30,281 18,618 16,560 Underlying EBITDA 23,902 21,197 18,019 14,819 9,696 8,104 Underlying earnings(a) 12,448 10,373
874.3c 702.0c 470.5p 383.9p Basic earnings per ordinary share(b) 604.0p 491.4p1114.1c 909.1c 599.5p 497.1p Basic underlying earnings per ordinary share(a)(b) 769.6p 636.3p
Dividends per share to Rio Tinto shareholders(c)
566.21c 469.97c 297.21p 259.28p - paid – ordinary dividend 386.0c 331.0c— 427.20c — 233.37p - paid – special dividend — 304.0c
397.48c 349.74c 221.86p 177.47p - proposed – ordinary dividend 309.0c 231.0c119.63c — 66.77p — - proposed – special dividend 93.0c —
13,490 13,444 7,259 7,352 Cash flow before financing activities 9,319 9,411 (864) (5,216) (488) (2,787) Net debt (664) (3,651) 61,252 57,903 34,592 30,940 Equity attributable to Rio Tinto shareholders 47,054 40,532
(a) Underlying earnings exclude impairments and other charges of US$2,679 million (2019: US$2,363 million), which are analysed on page 226. (b) Basic earnings per ordinary share and basic underlying earnings per ordinary share do not recognise the dilution resulting from share options on issue. (c) The Australian dollar and sterling amounts are based on the US dollar amounts, retranslated at average or closing rates as appropriate, except for the dividends which are the actual amounts.
The financial data above has been extracted from the financial information set out on pages 200-300.
Summary Financial Data in AustralianDollars, Sterling and US Dollars
Annual Report 2020 | riotinto.com 335335Annual Report 2020 | riotinto.com
Financial Statements
Financial Statements
Summary Financial Data in Australian Dollars, Sterling and US Dollars